
Exhibit (c)(9) Shareholder Analysis February 2024 PRELIMINARY DRAFT / HIGHLY CONFIDENTIAL
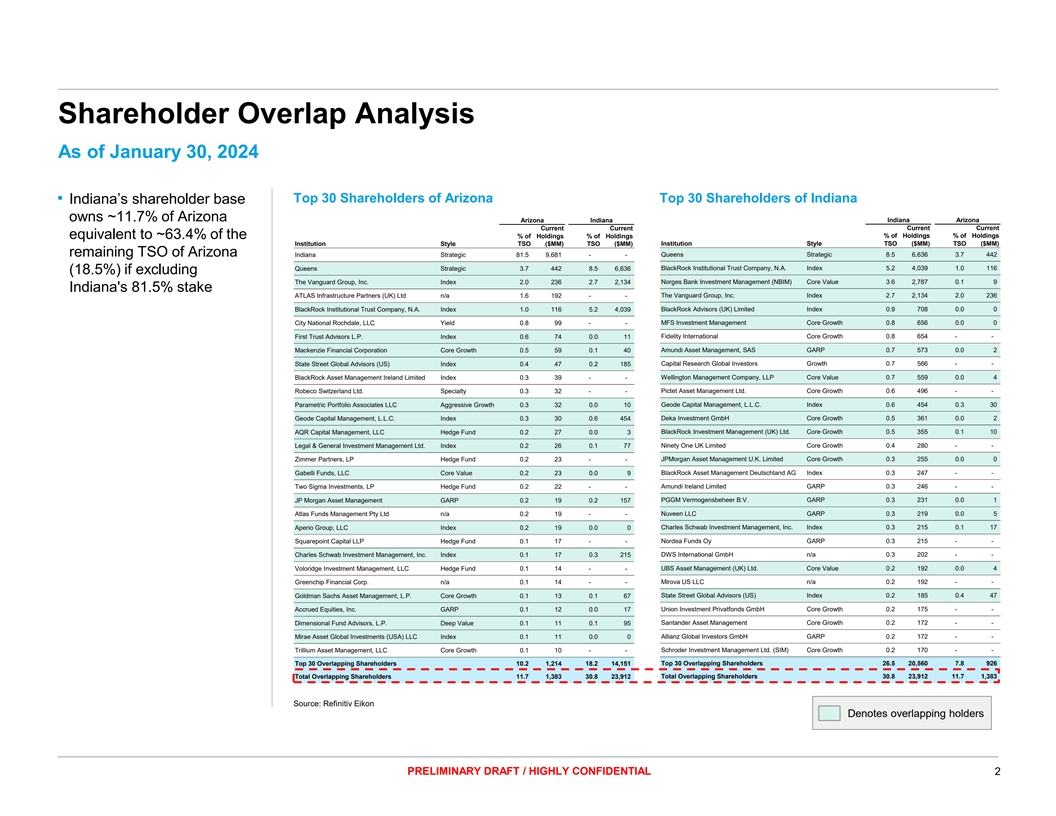
Shareholder Overlap Analysis As of January 30, 2024 Top 30 Shareholders of Arizona Top 30 Shareholders of Indiana • Indiana’s shareholder base owns ~11.7% of Arizona Arizona Indiana Indiana Arizona Current Current Current Current equivalent to ~63.4% of the % of Holdings % of Holdings % of Holdings % of Holdings Institution Style TSO ($MM) TSO ($MM) Institution Style TSO ($MM) TSO ($MM) remaining TSO of Arizona Indiana Strategic 81.5 9,681 - - Queens Strategic 8.5 6,636 3.7 442 Queens Strategic 3.7 442 8.5 6,636 BlackRock Institutional Trust Company, N.A. Index 5.2 4,039 1.0 116 (18.5%) if excluding The Vanguard Group, Inc. Index 2.0 236 2.7 2,134 Norges Bank Investment Management (NBIM) Core Value 3.6 2,787 0.1 9 Indiana's 81.5% stake The Vanguard Group, Inc. Index 2.7 2,134 2.0 236 ATLAS Infrastructure Partners (UK) Ltd n/a 1.6 192 - - BlackRock Institutional Trust Company, N.A. Index 1.0 116 5.2 4,039 BlackRock Advisors (UK) Limited Index 0.9 708 0.0 0 City National Rochdale, LLC Yield 0.8 99 - - MFS Investment Management Core Growth 0.8 656 0.0 0 First Trust Advisors L.P. Index 0.6 74 0.0 11 Fidelity International Core Growth 0.8 654 - - Amundi Asset Management, SAS GARP 0.7 573 0.0 2 Mackenzie Financial Corporation Core Growth 0.5 59 0.1 40 State Street Global Advisors (US) Index 0.4 47 0.2 185 Capital Research Global Investors Growth 0.7 566 - - BlackRock Asset Management Ireland Limited Index 0.3 39 - - Wellington Management Company, LLP Core Value 0.7 559 0.0 4 Robeco Switzerland Ltd. Specialty 0.3 32 - - Pictet Asset Management Ltd. Core Growth 0.6 496 - - Geode Capital Management, L.L.C. Index 0.6 454 0.3 30 Parametric Portfolio Associates LLC Aggressive Growth 0.3 32 0.0 10 Deka Investment GmbH Core Growth 0.5 361 0.0 2 Geode Capital Management, L.L.C. Index 0.3 30 0.6 454 AQR Capital Management, LLC Hedge Fund 0.2 27 0.0 3 BlackRock Investment Management (UK) Ltd. Core Growth 0.5 355 0.1 10 Legal & General Investment Management Ltd. Index 0.2 26 0.1 77 Ninety One UK Limited Core Growth 0.4 280 - - Zimmer Partners, LP Hedge Fund 0.2 23 - - JPMorgan Asset Management U.K. Limited Core Growth 0.3 255 0.0 0 BlackRock Asset Management Deutschland AG Index 0.3 247 - - Gabelli Funds, LLC Core Value 0.2 23 0.0 9 Two Sigma Investments, LP Hedge Fund 0.2 22 - - Amundi Ireland Limited GARP 0.3 246 - - JP Morgan Asset Management GARP 0.2 19 0.2 157 PGGM Vermogensbeheer B.V. GARP 0.3 231 0.0 1 Atlas Funds Management Pty Ltd n/a 0.2 19 - - Nuveen LLC GARP 0.3 219 0.0 5 Charles Schwab Investment Management, Inc. Index 0.3 215 0.1 17 Aperio Group, LLC Index 0.2 19 0.0 0 Squarepoint Capital LLP Hedge Fund 0.1 17 - - Nordea Funds Oy GARP 0.3 215 - - Charles Schwab Investment Management, Inc. Index 0.1 17 0.3 215 DWS International GmbH n/a 0.3 202 - - Voloridge Investment Management, LLC Hedge Fund 0.1 14 - - UBS Asset Management (UK) Ltd. Core Value 0.2 192 0.0 4 Greenchip Financial Corp. n/a 0.1 14 - - Mirova US LLC n/a 0.2 192 - - State Street Global Advisors (US) Index 0.2 185 0.4 47 Goldman Sachs Asset Management, L.P. Core Growth 0.1 13 0.1 67 Accrued Equities, Inc. GARP 0.1 12 0.0 17 Union Investment Privatfonds GmbH Core Growth 0.2 175 - - Dimensional Fund Advisors, L.P. Deep Value 0.1 11 0.1 95 Santander Asset Management Core Growth 0.2 172 - - Mirae Asset Global Investments (USA) LLC Index 0.1 11 0.0 0 Allianz Global Investors GmbH GARP 0.2 172 - - Schroder Investment Management Ltd. (SIM) Core Growth 0.2 170 - - Trillium Asset Management, LLC Core Growth 0.1 10 - - Top 30 Overlapping Shareholders 10.2 1,214 18.2 14,151 Top 30 Overlapping Shareholders 26 .5 20 ,560 7.8 926 Total Overlapping Shareholders 11 .7 1,383 30 .8 23,912 Total Overlapping Shareholders 30 .8 23 ,912 11.7 1,383 Source: Refinitiv Eikon Denotes overlapping holders PRELIMINARY DRAFT / HIGHLY CONFIDENTIAL 2
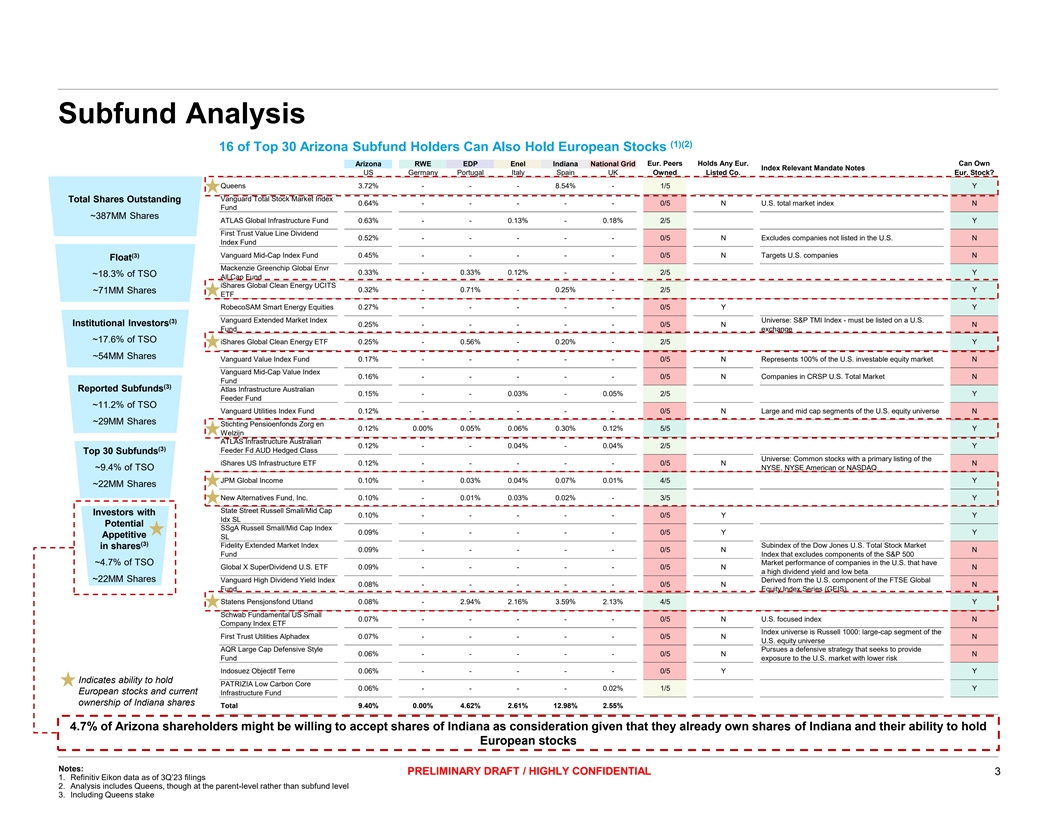
Subfund Analysis (1)(2) 16 of Top 30 Arizona Subfund Holders Can Also Hold European Stocks Arizona RWE EDP Enel Indiana National Grid Eur. Peers Holds Any Eur. Can Own Index Relevant Mandate Notes US Germany Portugal Italy Spain UK Owned Listed Co. Eur. Stock? Queens 3.72% - - - 8.54% - 1/5 Y Vanguard Total Stock Market Index Total Shares Outstanding 0.64% - - - - - 0/5 N U.S. total market index N Fund ~387MM Shares ATLAS Global Infrastructure Fund 0.63% - - 0.13% - 0.18% 2/5 Y First Trust Value Line Dividend 0.52% - - - - - 0/5 N Excludes companies not listed in the U.S. N Index Fund (3) Vanguard Mid-Cap Index Fund 0.45% - - - - - 0/5 N Targets U.S. companies N Float Mackenzie Greenchip Global Envr 0.33% - 0.33% 0.12% - - 2/5 Y ~18.3% of TSO All Cap Fund iShares Global Clean Energy UCITS 0.32% - 0.71% - 0.25% - 2/5 Y ~71MM Shares ETF RobecoSAM Smart Energy Equities 0.27% - - - - - 0/5 Y Y Vanguard Extended Market Index Universe: S&P TMI Index - must be listed on a U.S. (3) Institutional Investors 0.25% - - - - - 0/5 N N Fund exchange ~17.6% of TSO iShares Global Clean Energy ETF 0.25% - 0.56% - 0.20% - 2/5 Y ~54MM Shares Vanguard Value Index Fund 0.17% - - - - - 0/5 N Represents 100% of the U.S. investable equity market N Vanguard Mid-Cap Value Index 0.16% - - - - - 0/5 N Companies in CRSP U.S. Total Market N Fund (3) Reported Subfunds Atlas Infrastructure Australian 0.15% - - 0.03% - 0.05% 2/5 Y Feeder Fund ~11.2% of TSO Vanguard Utilities Index Fund 0.12% - - - - - 0/5 N Large and mid cap segments of the U.S. equity universe N ~29MM Shares Stichting Pensioenfonds Zorg en 0.12% 0.00% 0.05% 0.06% 0.30% 0.12% 5/5 Y Welzijn ATLAS Infrastructure Australian 0.12% - - 0.04% - 0.04% 2/5 Y (3) Feeder Fd AUD Hedged Class Top 30 Subfunds Universe: Common stocks with a primary listing of the iShares US Infrastructure ETF 0.12% - - - - - 0/5 N N ~9.4% of TSO NYSE, NYSE American or NASDAQ JPM Global Income 0.10% - 0.03% 0.04% 0.07% 0.01% 4/5 Y ~22MM Shares New Alternatives Fund, Inc. 0.10% - 0.01% 0.03% 0.02% - 3/5 Y State Street Russell Small/Mid Cap Investors with 0.10% - - - - - 0/5 Y Y Idx SL Potential SSgA Russell Small/Mid Cap Index 0.09% - - - - - 0/5 Y Y Appetitive SL (3) Fidelity Extended Market Index Subindex of the Dow Jones U.S. Total Stock Market in shares 0.09% - - - - - 0/5 N N Fund Index that excludes components of the S&P 500 ~4.7% of TSO Market performance of companies in the U.S. that have Global X SuperDividend U.S. ETF 0.09% - - - - - 0/5 N N a high dividend yield and low beta ~22MM Shares Vanguard High Dividend Yield Index Derived from the U.S. component of the FTSE Global 0.08% - - - - - 0/5 N N Fund Equity Index Series (GEIS) Statens Pensjonsfond Utland 0.08% - 2.94% 2.16% 3.59% 2.13% 4/5 Y Schwab Fundamental US Small 0.07% - - - - - 0/5 N U.S. focused index N Company Index ETF Index universe is Russell 1000: large-cap segment of the First Trust Utilities Alphadex 0.07% - - - - - 0/5 N N U.S. equity universe AQR Large Cap Defensive Style Pursues a defensive strategy that seeks to provide 0.06% - - - - - 0/5 N N Fund exposure to the U.S. market with lower risk Indosuez Objectif Terre 0.06% - - - - - 0/5 Y Y Indicates ability to hold PATRIZIA Low Carbon Core 0.06% - - - - 0.02% 1/5 Y European stocks and current Infrastructure Fund ownership of Indiana shares Total 9.40% 0.00% 4.62% 2.61% 12.98% 2.55% 4.7% of Arizona shareholders might be willing to accept shares of Indiana as consideration given that they already own shares of Indiana and their ability to hold European stocks Notes: PRELIMINARY DRAFT / HIGHLY CONFIDENTIAL 3 1. Refinitiv Eikon data as of 3Q’23 filings 2. Analysis includes Queens, though at the parent-level rather than subfund level 3. Including Queens stake

(1) Accretion / (Dilution) Analysis at Different Prices Assuming 4.7% of TSO, Equivalent to 25.4% of the Free Float is Paid in Shares Financing Impact Accretion / (Dilution) Paid in % Indiana (2) Deal Size o.w. Equity o.w. Debt 2024PF 2025 2026 (3) Cash / Equity Market Cap $38.0p.s. $2.7Bn $2.0Bn $0.7Bn 0.9% (0.2%) (0.6%) 0.2% Offer Price 75% / 25% $40.0p.s. $2.9Bn $0.7Bn $2.1Bn 1.0% (0.3%) (0.7%) 0.1% Offer Price Impact if Indiana issues new shares for the transaction $38.0p.s. $2.7Bn $2.7Bn n.a. n.a. 0.2% (0.2%) 0.6% Offer Price 100% / 0% $40.0p.s. $2.9Bn $2.9Bn n.a. n.a. 0.1% (0.3%) 0.5% Offer Price Alternatively Indiana Could Buy Stock in the Market for the Deal – Equivalent to 100% Cash Transaction from Accretion / Dilution Perspective Source: Company information and Capital IQ as of January 4, 2024 Notes: 1. Assuming no synergies and no transaction costs; additional debt assumed at 4.81% interest rate cost and 26.5% corporate tax rate per Indiana management. Indiana TSO of 6,239MM based on public company numbers as of January 4, 2024. Exchange rate of $1.096 per euro 2. Assuming 388MM FDSO (Fully Diluted Shares Outstanding) for Arizona based on Q3 TSO of 387MM and including 1.1MM in PSUs (Phantom Shared Units) and RSUs (Restricted Stock Units) nonvested as of December 2022 and 0.4MM in PSUs and RSUs granted and settled between January and July 2023, in each case, based on public company numbers 3. Equivalent to the financing impact paid in equity over Indiana market cap; Assuming 6,239MM shares and new shares issued at €12.0 p.s., closing price as of January 4, 2024 PRELIMINARY DRAFT / HIGHLY CONFIDENTIAL 4

Legal Disclaimer We have prepared this document solely for informational purposes. You should not definitively rely upon it or use it to form the definitive basis for any decision, contract, commitment or action whatsoever, with respect to any proposed transaction or otherwise. You and your directors, officers, employees, agents and affiliates must hold this document and any oral information provided in connection with this document in strict confidence and may not communicate, reproduce, distribute or disclose it to any other person, or refer to it publicly, in whole or in part at any time except with our prior written consent. If you are not the intended recipient of this document, please delete and destroy all copies immediately. We have prepared this document and the analyses contained in it based, in part, on certain assumptions and information obtained by us from the recipient, its directors, officers, employees, agents, affiliates and/or from other sources. Our use of such assumptions and information does not imply that we have independently verified or necessarily agree with any of such assumptions or information, and we have assumed and relied upon the accuracy and completeness of such assumptions and information for purposes of this document. Neither we nor any of our affiliates, or our or their respective officers, employees or agents, make any representation or warranty, express or implied, in relation to the accuracy or completeness of the information contained in this document or any oral information provided in connection herewith, or any data it generates and accept no responsibility, obligation or liability (whether direct or indirect, in contract, tort or otherwise) in relation to any of such information. We and our affiliates and our and their respective officers, employees and agents expressly disclaim any and all liability which may be based on this document and any errors therein or omissions therefrom. Neither we nor any of our affiliates, or our or their respective officers, employees or agents, make any representation or warranty, express or implied, that any transaction has been or may be effected on the terms or in the manner stated in this document, or as to the achievement or reasonableness of future projections, management targets, estimates, prospects or returns, if any. Any views or terms contained herein are preliminary only, and are based on financial, economic, market and other conditions prevailing as of the date of this document and are therefore subject to change. We undertake no obligation or responsibility to update any of the information contained in this document. Past performance does not guarantee or predict future performance. This document and the information contained herein do not constitute an offer to sell or the solicitation of an offer to buy any security, commodity or instrument or related derivative, nor do they constitute an offer or commitment to lend, syndicate or arrange a financing, underwrite or purchase or act as an agent or advisor or in any other capacity with respect to any transaction, or commit capital, or to participate in any trading strategies, and do not constitute legal, regulatory, accounting or tax advice to the recipient. We recommend that the recipient seek independent third party legal, regulatory, accounting and tax advice regarding the contents of this document. This document does not constitute and should not be considered as any form of financial opinion or recommendation by us or any of our affiliates. This document is not a research report and was not prepared by the research department of Morgan Stanley or any of its affiliates. Notwithstanding anything herein to the contrary, each recipient hereof (and their employees, representatives, and other agents) may disclose to any and all persons, without limitation of any kind from the commencement of discussions, the U.S. federal and state income tax treatment and tax structure of the proposed transaction and all materials of any kind (including opinions or other tax analyses) that are provided relating to the tax treatment and tax structure. For this purpose, tax structure is limited to facts relevant to the U.S. federal and state income tax treatment of the proposed transaction and does not include information relating to the identity of the parties, their affiliates, agents or advisors. This document is provided by Morgan Stanley & Co. LLC and/or certain of its affiliates or other applicable entities, which may include Morgan Stanley Realty Incorporated, Morgan Stanley Senior Funding, Inc., Morgan Stanley Bank, N.A., Morgan Stanley & Co. International plc, Morgan Stanley Securities Limited, Morgan Stanley Bank AG, Morgan Stanley MUFG Securities Co., Ltd., Mitsubishi UFJ Morgan Stanley Securities Co., Ltd., Morgan Stanley Asia Limited, Morgan Stanley Australia Securities Limited, Morgan Stanley Australia Limited, Morgan Stanley Asia (Singapore) Pte., Morgan Stanley Services Limited, Morgan Stanley & Co. International plc Seoul Branch and/or Morgan Stanley Canada Limited Unless governing law permits otherwise, you must contact an authorized Morgan Stanley entity in your jurisdiction regarding this document or any of the information contained herein. © Morgan Stanley and/or certain of its affiliates. All rights reserved. PRELIMINARY DRAFT / HIGHLY CONFIDENTIAL 5