UNITED STATES
SECURITIES AND EXCHANGE COMMISSION
Washington, D.C. 20549
FORM N-CSR
CERTIFIED SHAREHOLDER REPORT OF REGISTERED MANAGEMENT
INVESTMENT COMPANIES
Investment Company Act file number 811-23161
NuShares ETF Trust
(Exact name of registrant as specified in charter)
Nuveen Investments
333 West Wacker Drive, Chicago, IL 60606
(Address of principal executive offices) (Zip code)
Christopher M. Rohrbacher
Nuveen Investments
333 West Wacker Drive
Chicago, IL 60606
(Name and address of agent for service)
Registrant’s telephone number, including area code: (312) 917-7700
Date of fiscal year end: July 31
Date of reporting period: July 31, 2017
Form N-CSR is to be used by management investment companies to file reports with the Commission not later than 10 days after the transmission to stockholders of any report that is required to be transmitted to stockholders under Rule 30e-1 under the Investment Company Act of 1940 (17 CFR 270.30e-1). The Commission may use the information provided on Form N-CSR in its regulatory, disclosure review, inspection, and policy making roles.
A registrant is required to disclose the information specified by Form N-CSR, and the Commission will make this information public. A registrant is not required to respond to the collection of information contained in Form N-CSR unless the Form displays a currently valid Office of Management and Budget (“OMB”) control number. Please direct comments concerning the accuracy of the information collection burden estimate and any suggestions for reducing the burden to Secretary, Securities and Exchange Commission, 450 Fifth Street, NW, Washington, DC 20549-0609. The OMB has reviewed this collection of information under the clearance requirements of 44 U.S.C. ss.3507.
ITEM 1. REPORTS TO STOCKHOLDERS.
| | | | | | | | | | |
| | | | | | | Listing Exchange | | Ticker Symbol |
| | | Fund Name | | | | | | | | |
|
| | NuShares Enhanced Yield U.S. Aggregate Bond ETF | | | | NYSE Arca | | NUAG | | |
| | NuShares Enhanced Yield 1-5 Year U.S. Aggregate Bond ETF | | | | NYSE Arca | | NUSA | | |
| | | | | | | | | | | | |
| | | | | | |
| | | | |
| | | | | | | | |
| |
| | Life is Complex |
| |
| | Nuveen makes things e-simple. It only takes a minute to sign up for e-Reports. Once enrolled, you’ll receive an e-mail as soon as your Nuveen Fund information is ready—no more waiting for delivery by regular mail. Just click on the link within the e-mail to see the report and save it on your computer if you wish. |
| | |
| | Free e-Reports right to your e-mail! |
| |
| | www.investordelivery.com If you receive your Nuveen Fund distributions and statements from your financial advisor or brokerage account. |
| |
| or | | www.nuveen.com/accountaccess If you receive your Nuveen Fund distributions and statements directly from Nuveen. Must be preceded by or accompanied by a prospectus. NOT FDIC INSURED MAY LOSE VALUE
NO BANK GUARANTEE |

Table
of Contents
Chairman’s Letter
to Shareholders

Dear Shareholders,
Some of the key assumptions driving the markets higher at the beginning of 2017 have recently come into question. Following the collapse of the health care reform bill in the Senate, investors are concerned about President Trump’s ability to accomplish the remainder of his pro-growth fiscal agenda, including tax reform and large infrastructure projects. Economic growth projections, in turn, have been lowered and with inflation recently waning, the markets are expecting fewer rate hikes from the Federal Reserve (Fed) than the Fed itself had predicted. Yet, asset prices continued to rise.
Investors have largely looked beyond policy disappointments and focused instead on the healthy profits reported by U.S. companies during the first two quarters of 2017. U.S. growth has remained slow and steady, European growth has surprised to the upside and concern that China would decelerate too rapidly has eased, further contributing to an optimistic tone in the markets. Additionally, political risk in Europe has moderated, with the election of mainstream candidates in the Dutch and French elections earlier this year.
The remainder of the year could bring challenges to this benign macro environment. The U.S. government voted to temporarily increase the nation’s debt limit, but the debate will resume again in December when the current extension of the debt limit expires. In addition, the need for disaster relief and recovery following Hurricanes Harvey and Irma has further muddied the outlook on the White House’s promised agenda. Markets will be watching the “Brexit” negotiations and the North American Free Trade Agreement (NAFTA) talks while assessing the implications for key trade and political partnerships. A tightening of financial conditions in China or a more aggressive-than-expected policy action from the Fed, European Central Bank or Bank of Japan could also turn into headwinds. On the geopolitical front, tensions with North Korea may continue to flare.
Market volatility readings have been remarkably low lately, but conditions can change quickly. As market conditions evolve, Nuveen remains committed to rigorously assessing opportunities and risks. If you’re concerned about how resilient your investment portfolio might be, we encourage you to talk to your financial advisor. On behalf of the other members of the Nuveen Fund Board, we look forward to continuing to earn your trust in the months and years ahead.
Sincerely,

William J. Schneider
Chairman of the Board
September 20, 2017
Portfolio Managers’
Comments
NuShares Enhanced Yield U.S. Aggregate Bond ETF (NUAG)
NuShares Enhanced Yield 1-5 Year U.S. Aggregate Bond ETF (NUSA)
These Funds feature portfolio management by Teachers Advisors, LLC, an affiliate of Nuveen Fund Advisors, LLC. Portfolio managers Lijun (Kevin) Chen, CFA, and Jayesh D. Bhansali, CFA.
Here they discuss U.S. economic and market conditions, key investment strategies and the performance of NUAG during the abbreviated reporting period from NUAG’s commencement of operations on September 14, 2016 through July 31, 2017, and the performance of NUSA during the abbreviated reporting period from the NUSA’s commencement of operations on March 31, 2017 through July 31, 2017.
What factors affected the U.S. economy and the U.S. bond market during the abbreviated annual reporting period ended July 31, 2017?
During the abbreviated reporting period, the U.S. economy continued to grow moderately, now ranking the current expansion as the third-longest since World War II, according to the National Bureau of Economic Research. The second half of 2016 saw a short-term boost in economic activity, driven by a one-time jump in exports during the third quarter, but the economy resumed a below-trend pace in the fourth quarter of 2016 and first quarter of 2017. The Bureau of Economic Analysis reported an annual growth rate of 3.0% for the U.S. economy in the second quarter of 2017, as measured by the “second” estimate of real gross domestic product (GDP), which is the value of goods and services produced by the nation’s economy less the value of the goods and services used up in production, adjusted for price changes. Growth in the second quarter was boosted by stronger consumer spending and business investment, which helped offset weaker government spending. By comparison, the annual GDP growth rate in the first quarter of 2017 was 1.2%.
Despite the slowdown in early 2017, other data pointed to positive momentum. The labor market continued to tighten, inflation ticked higher, and consumer and business confidence surveys reflected optimism about the economy’s prospects. As reported by the Bureau of Labor Statistics, the unemployment rate fell to 4.3% in July 2017 from 4.9% in July 2016 and job gains averaged around 181,000 per month for the past twelve months. Higher oil prices helped drive a steady increase in inflation over this reporting period. The Consumer Price Index (CPI) increased 1.7% over the twelve-month reporting period ended July 31, 2017 on a seasonally adjusted basis, as reported by the Bureau of Labor Statistics. The core CPI (which excludes food and energy) increased 1.7% during the same period, slightly below the Federal Reserve’s (Fed) unofficial longer term inflation objective of 2.0%. The housing market also continued to improve, with historically low mortgage rates and low inventory driving home prices higher. The S&P CoreLogic Case-Shiller U.S. National Home Price Index, which covers all nine U.S. census divisions, recorded a 5.8% annual gain in June 2017 (most recent data available at the time this report was prepared). The 10-City and 20-City Composites reported year-over-year increases of 4.9% and 5.7%, respectively.
This material is not intended to be a recommendation or investment advice, does not constitute a solicitation to buy or sell securities, and is not provided in a fiduciary capacity. The information provided does not take into account the specific objectives or circumstances of any particular investor, or suggest any specific course of action. Investment decisions should be made based on an investor’s objectives and circumstances and in consultation with his or her advisors.
Certain statements in this report are forward-looking statements. Discussions of specific investments are for illustration only and are not intended as recommendations of individual investments. The forward-looking statements and other views expressed herein are those of the portfolio managers as of the date of this report. Actual future results or occurrences may differ significantly from those anticipated in any forward-looking statements and the views expressed herein are subject to change at any time, due to numerous market and other factors. The Fund disclaims any obligation to update publicly or revise any forward-looking statements or views expressed herein.
The ratings disclosed reflects net exposure to credit ratings by one or more of the following national rating agencies: Standard & Poor’s (S&P), Moody’s Investors Service, Inc. (Moody’s) or Fitch, Inc. (Fitch). If there are multiple ratings for a security, the average rating is used, with evenly split ratings being rounded down to the lower rating, which is the method used by the Index. Credit ratings are subject to change. AAA, AA, A and BBB are investment grade ratings; BB, B, CCC, CC, C and D are below investment grade ratings. Certain bonds backed by U.S. Government or agency securities are regarded as having an implied rating equal to the rating of such securities. Holdings designated N/R are not rated by these national rating agencies.
Refer to the Glossary of Terms Used in this report for further definition of the terms used within this section.
Portfolio Managers’ Comments (continued)
The U.S. economic outlook struck a more optimistic tone, prompting the Fed’s policy making committee to raise its main benchmark interest rate in December 2016, March 2017 and June 2017. These moves were widely expected by the markets and, while the Fed acknowledged in its June 2017 statement that inflation has remained unexpectedly low, an additional increase is anticipated later in 2017 as the Fed seeks to gradually “normalize” interest rates. Also after the June 2017 meeting, the Fed revealed its plan to begin shrinking its balance sheets by allowing a small amount of maturing Treasury and mortgage securities to roll off without reinvestment. The timing of this is less certain, however, as it depends on whether the economy performs in line with the Fed’s expectations. As expected, the Fed left rates unchanged at its July 2017 meeting.
Politics also dominated the headlines in this reporting period with two major electoral surprises: the U.K.’s vote to leave the European Union and Donald Trump’s win in the U.S. presidential race. Market volatility increased as markets digested the initial shocks, but generally recovered and, in the case of the “Trump rally,” U.S. equities saw significant gains. Investors also closely watched elections across Europe. To the markets’ relief, more mainstream candidates were elected in the Dutch and French elections in the spring of 2017. However, Britain’s June 2017 snap election unexpectedly overturned the Conservative Party’s majority in Parliament, which increased uncertainties about the Brexit negotiation process. Additionally, in the U.S., legislative delays with health care reform dimmed the prospects for President Trump’s tax cuts and other fiscal stimulus, while investors braced for a showdown in Congress over increasing the nation’s debt limit. Toward the end of the reporting period, escalating tensions between the U.S. and North Korea led to some near-term volatility in global equity shares to the benefit of perceived safe-haven assets such as gold, U.S. Treasury bonds and Japanese yen.
The broad U.S. bond market had a small gain during the abbreviated reporting period. A period of heightened volatility after the U.S. presidential election drove bond prices sharply lower in the fourth quarter of 2016. However, bonds largely recovered their losses by the end of the reporting period. The Fed’s rate hikes lifted interest rates on the short end of the spectrum, but intermediate- and longer-term rates remained relatively stable as investors have been satisfied with the Fed’s gradual pace of tightening. Muted inflation, moderate economic growth and strong corporate and real estate fundamentals helped non-government bond sectors outperform Treasuries during the abbreviated reporting period.
NuShares Enhanced Yield U.S. Aggregate Bond ETF (NUAG)
What key strategies were used to manage the Fund during the abbreviated reporting period and how did these strategies influence performance?
The Fund employs a passive management (or “indexing”) approach, seeking to track the investment results, before fees and expenses, of the BofA/Merrill Lynch Enhanced Yield U.S. Broad Bond Index (the “Enhanced Index”). The Enhanced Index is designed to broadly capture the U.S. investment grade fixed income market and uses a rules-based weighting methodology that seeks to enhance yield while maintaining comparable risk. The Enhanced Index is primarily comprised of U.S. government securities, debt securities issued by U.S. corporations, residential and commercial mortgage-backed securities, asset-backed securities and U.S. dollar-denominated debt securities issued by non-U.S. governments and corporations that are publicly offered for sale in the United States. The Fund generally invests in a sample of the securities in the Enhanced Index whose risk, return and other characteristics resemble the risk, return and other characteristics of the Enhanced Index. Under normal market conditions, the Fund invests at least 80% of its assets, exclusive of collateral held from securities lending, in component securities of the Enhanced Index. The Fund rebalances its holdings monthly in response to the monthly Enhanced Index rebalances.
During the abbreviated reporting period, the Fund has remained fully invested within its allocation targets to track the Enhanced Index. As of July 31, 2017, the Fund’s net assets were invested in 40.0% securitized debt, 35.5% corporate debt, 20.2% U.S. Treasuries and 3.4% government-related debt. Despite heightened volatility surrounding the U.S. elections in early November 2016, the Fund delivered index-like performance results and minimized tracking error (i.e. the divergence in performance from that of the Enhanced Index), in this abbreviated reporting period.
How did the Fund perform during this abbreviated reporting period ended July 31, 2017?
The table in the Fund’s Performance Overview and Expense Ratios section of this report provides the Fund’s total return performance for the abbreviated reporting period from the Fund’s commencement of operation on September 14, 2016 through
July 31, 2017. The Fund’s total returns at net asset value (NAV) are compared with the performance of the Enhanced Index, which the Fund is designed to track.
The Fund’s total return underperformed the Enhanced Index over this abbreviated reporting period. As expected, the relative underperformance is mainly attributable to the transaction costs related to the Fund’s acquisition of structured securities, as well as fees and expenses incurred by the Fund that are not incurred by the Enhanced Index. The Enhanced Index is unmanaged and therefore its returns do not reflect any fees or expenses, which would detract from its performance. You cannot invest directly in an index.
NuShares Enhanced Yield 1-5 Year U.S. Aggregate Bond ETF (NUSA)
What key strategies were used to manage the Fund during the abbreviated reporting period and how did these strategies influence performance?
The Fund employs a passive management (or “indexing”) approach, seeking to track the investment results, before fees and expenses, of the BofA/Merrill Lynch Enhanced Yield 1-5 Year U.S. Broad Bond Index (the “Enhanced Index”). The Enhanced Index is designed to broadly capture the 1-5 year U.S. investment grade fixed income market and uses a rules-based weighting methodology that seeks to enhance yield while maintaining comparable risk. The Enhanced Index is primarily comprised of U.S. government securities, debt securities issued by U.S. corporations, residential and commercial mortgage-backed securities, asset-backed securities and U.S. dollar-denominated debt securities issued by non-U.S. governments and corporations that are publicly offered for sale in the United States. The Fund generally invests in a sample of the securities in the Enhanced Index whose risk, return and other characteristics resemble the risk, return and other characteristics of the Enhanced Index. Under normal market conditions, the Fund invests at least 80% of its assets and the amount of any borrowings for investment purposes in component securities of the Enhanced Index. The Fund rebalances its holdings monthly in response to the monthly Enhanced Index rebalances.
During the abbreviated reporting period, the Fund has remained fully invested within its allocation targets to track the Enhanced Index. As of July 31, 2017, the Fund’s net assets were invested in 51.1% corporate debt, 25.1% securitized debt, 22.3% U.S. Treasuries and 0.8% government-related debt. The Fund delivered index-like performance results and minimized tracking error (i.e. the divergence in performance from that of the Enhanced Index), in this abbreviated reporting period.
How did the Fund perform during this abbreviated reporting period ended July 31, 2017?
The table in the Fund’s Performance Overview and Expense Ratios section of this report provides the Fund’s total return performance for the abbreviated reporting period from the Fund’s commencement of operation on March 31, 2017 through July 31, 2017. The Fund’s total returns at net asset value (NAV) are compared with the performance of the Enhanced Index, which the Fund is designed to track.
The Fund’s total return underperformed the Enhanced Index over this abbreviated reporting period. As expected, the relative underperformance is mainly attributable to the transaction costs related to the Fund’s acquisition of structured securities, as well as fees and expenses incurred by the Fund that are not incurred by the Enhanced Index. The Enhanced Index is unmanaged and therefore its returns do not reflect any fees or expenses, which would detract from its performance. You cannot invest directly in an index.
Risk Considerations
and Dividend Information
NuShares Enhanced Yield U.S. Aggregate Bond ETF
Investing involves risk; principal loss is possible. There is no guarantee the Fund’s investment objectives will be achieved. An exchange-traded fund seeks to generally track the investment results of an index; however the Fund may underperform, outperform or be more volatile than the referenced index. Interest rate risk occurs when interest rates rise causing bond prices to fall. Credit risk arises from an issuer’s ability to make interest and principal payments when due, as well as the prices of bonds declining when an issuer’s credit quality is expected to deteriorate. These and other risk considerations are described in detail in the Fund’s prospectus.
NuShares Enhanced Yield 1-5 Year U.S. Aggregate Bond ETF
Investing involves risk; principal loss is possible. There is no guarantee the Fund’s investment objectives will be achieved. This ETF seeks to generally track the investment results of an index; however the Fund may underperform, outperform or be more volatile than the referenced index. Interest rate risk is the risk that the value of the Fund’s portfolio will decline because of rising interest rates. Credit risk is the risk that an issuer of a debt security may be unable or unwilling to make interest and principal payments when due and the related risk that the value of a debt security may decline because of concerns about the issuer’s ability or willingness to make such payments. This ETF is concentrated in the financial sector. Performance of companies in the financial sector may be adversely impacted by many factors, including, among others, government regulations, economic conditions, changes in interest rates and decreased liquidity in credit markets. These and other risk considerations are described in detail in the Fund’s prospectus.
Dividend Information
Each Fund seeks to pay monthly dividends out of its net investment income. Monthly distributions are not expected to be a level amount from period-to-period. Each Fund will, over time, pay all its net investment income as dividends to shareholders.
As of July 31, 2017, the Funds had positive UNII balances for tax purposes and positive UNII balances for financial reporting purposes.
All monthly dividends paid by each Fund during the current reporting period were paid from net investment income. If a portion of the Fund’s monthly distributions was sourced from or comprised of elements other than net investment income, including capital gains and/or a return of capital, shareholders would have received a notice to that effect. For financial reporting purposes, the composition and per share amounts of each Fund’s dividends for the reporting period are presented in this report’s Statement of Changes in Net Assets and Financial Highlights, respectively. For income tax purposes, distribution information for each Fund as of its July 31, 2017 tax year end will be presented in Note 6 – Income Tax Information within the Notes to Financial Statements of this report.
Fund Performance
and Expense Ratios
The Fund Performance and Expense Ratio for each Fund are shown within this section of the report.
Returns quoted represent past performance, which is no guarantee of future results. Investment returns and principal value will fluctuate so that when shares are sold, they may be worth more or less than their original cost. Current performance may be higher or lower than the performance shown. Total returns for a period of less than one year are not annualized. Returns assume reinvestment of dividends and capital gains. Market price returns are based on the closing market price as of the end of the reporting period. For performance current to the most recent month-end visit nuveen.com or call (800) 257-8787.
Returns do not reflect the deduction of taxes that a shareholder would pay on Fund distributions or the sale of Fund shares.
The expense ratios represents each Fund’s total operating expenses as reflected in the most recent prospectus. The expense ratios shown include the management fees and other applicable fees and expenses paid by the Fund.
Fund Performance and Expense Ratios (continued)
NuShares Enhanced Yield U.S. Aggregate Bond ETF (NUAG)
Refer to the first page of this Fund Performance and Expense Ratios section for further explanation of the information included within this section. Refer to the Glossary of Terms Used in this Report for definitions of terms used within this section.
Fund Performance
Total Returns as of July 31, 2017
| | | | |
| | | Cumulative | |
| | | Since
Inception | |
NUAG at NAV | | | 0.74% | |
NUAG at Market Price | | | 1.00% | |
BofA Merrill Lynch Enhanced Yield U.S. Broad Bond Index | | | 1.08% | |
Bloomberg Barclays U.S. Aggregate Bond Index | | | 0.21% | |
Total Returns as of June 30, 2017 (Most Recent Calendar Quarter)
| | | | |
| | | Cumulative | |
| | | Since
Inception | |
NUAG at NAV | | | 0.17% | |
NUAG at Market Price | | | 0.57% | |
Since inception returns are from 9/14/16. Indexes are not available for direct investment.
Expense Ratio as of Most Recent Prospectus
Growth of an Assumed $10,000 Investment as of July 31, 2017
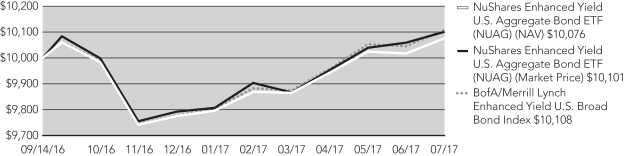
The graph does not reflect the deduction of taxes that a shareholder may pay on Fund distributions or the redemption of Fund shares.
Fund Performance and Expense Ratios (continued)
NuShares Enhanced Yield 1-5 Year U.S. Aggregate Bond ETF (NUSA)
Refer to the first page of this Fund Performance and Expense Ratios section for further explanation of the information included within this section. Refer to the Glossary of Terms Used in this Report for definitions of terms used within this section.
Fund Performance
Total Returns as of July 31, 2017
| | | | |
| | | Cumulative | |
| | | Since
Inception | |
NUSA at NAV | | | 1.10% | |
NUSA at Market Price | | | 1.26% | |
BofA Merrill Lynch Enhanced Yield 1-5 Year U.S. Broad Bond Index | | | 1.29% | |
Bloomberg Barclays 1-5 Year Government/Credit Index | | | 0.92% | |
Total Returns as of June 30, 2017 (Most Recent Calendar Quarter)
| | | | |
| | | Cumulative | |
| | | Since
Inception | |
NUSA at NAV | | | 0.69% | |
NUSA at Market Price | | | 0.80% | |
Since inception returns are from 3/31/17. Indexes are not available for direct investment.
Expense Ratio as of Most Recent Prospectus
Growth of an Assumed $10,000 Investment as of July 31, 2017
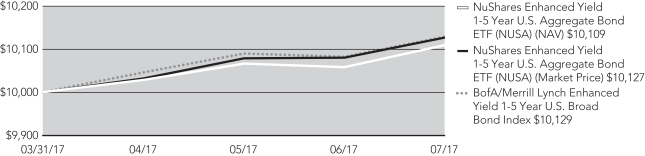
The graph does not reflect the deduction of taxes that a shareholder may pay on Fund distributions or the redemption of Fund shares.
Yields as of July 31, 2017
Dividend Yield is the most recent dividend per share (annualized) divided by the market price per share.
The SEC 30-Day Yield is a standardized measure of a fund’s yield that accounts for the future amortization of premiums or discounts of bonds held in the fund’s portfolio. The SEC 30-Day Yield is computed under an SEC standardized formula and is based on the maximum market price per share. Dividend Yield may differ from the SEC 30-Day Yield because the fund may be paying out more or less than it is earning and it may not include the effect of amortization of bond premium.
NuShares Enhanced Yield U.S. Aggregate Bond ETF (NUAG)
| | | | |
Dividend Yield | | | 3.12% | |
SEC 30-Day Yield | | | 2.64% | |
NuShares Enhanced Yield 1-5 Year U.S. Aggregate Bond ETF (NUSA)
| | | | |
Dividend Yield | | | 2.85% | |
SEC 30-Day Yield | | | 1.99% | |
Holding
Summaries as of July 31, 2017
This data relates to the securities held in the Fund’s portfolio of investments as of the end of the reporting period. It should not be construed as a measure of performance for the Fund itself. Holdings are subject to change.
The ratings disclosed reflects net exposure to credit ratings by one or more of the following national rating agencies: Standard & Poor’s (S&P), Moody’s Investors Service, Inc. (Moody’s) or Fitch, Inc. (Fitch). If there are multiple ratings for a security, the average rating is used, with evenly split ratings being rounded down to the lower rating, which is the method used by the Index. Credit ratings are subject to change. AAA, AA, A and BBB are investment grade ratings; BB, B, CCC, CC, C and D are below investment grade ratings. Certain bonds backed by U.S. Government or agency securities are regarded as having an implied rating equal to the rating of such securities. Holdings designated N/R are not rated by these national rating agencies.
NuShares Enhanced Yield U.S. Aggregate Bond ETF (NUAG)
Fund Allocation
(% of net assets)
| | | | |
Corporate Debt | | | 35.5% | |
Government Related | | | 3.4% | |
U.S. Treasury | | | 20.2% | |
Securitized | | | 40.0% | |
Short-Term Investments | | | 1.0% | |
Other Assets Less Liabilities | | | (0.1)% | |
Net Assets | | | 100% | |
Corporate Debt: Industries
(% of total corporate debt holdings)
| | | | |
Industrial | | | 49.9% | |
Financials | | | 28.0% | |
Utility | | | 22.1% | |
Total | | | 100% | |
Portfolio Credit Quality
(% of total investments)
| | | | |
AAA | | | 58.7% | |
AA | | | 3.0% | |
A | | | 4.8% | |
BBB | | | 32.4% | |
BB or Lower | | | 0.1% | |
N/R (Not Rated) | | | 1.0% | |
Total | | | 100% | |
Holding Summaries as of July 31, 2017 (continued)
NuShares Enhanced Yield 1-5 Year U.S. Aggregate Bond ETF (NUSA)
Fund Allocation
(% of net assets)
| | | | |
Corporate Debt | | | 51.1% | |
U.S. Treasury | | | 22.3% | |
Securitized | | | 25.1% | |
Short-Term Investments | | | 0.8% | |
Other Assets Less Liabilities | | | 0.7% | |
Net Assets | | | 100% | |
Corporate Debt: Industries
(% of total corporate debt holdings)
| | | | |
Financials | | | 62.4% | |
Industrial | | | 23.5% | |
Utility | | | 14.1% | |
Total | | | 100% | |
Portfolio Credit Quality
(% of total investments)
| | | | |
AAA | | | 47.8% | |
AA | | | 2.0% | |
A | | | 18.8% | |
BBB | | | 30.6% | |
N/R (Not Rated) | | | 0.8% | |
Total | | | 100% | |
Expense
Examples
As a shareholder of one or more of the funds, you incur two types of costs: (1) transaction costs, including brokerage commissions on purchases and sales of Fund shares, and (2) ongoing costs, including management fees and other applicable Fund expenses. The Examples below are intended to help you understand your ongoing costs (in dollars) of investing in the Funds and to compare these costs with the ongoing costs of investing in other funds. Since NUSA’s expense example below reflects only the first 123 days of the Fund’s operations, it may not provide a meaningful understanding of the Fund’s ongoing expenses.
The Examples below are based on an investment of $1,000 invested at the beginning of the period and held through July 31, 2017.
The beginning of the period of NUAG is February 1, 2017 and the beginning of the period for NUSA is March 31, 2017 (commencement of operations).
The information under “Actual Performance,” together with the amount you invested, allows you to estimate actual expenses incurred over the reporting period. Simply divide your account value by $1,000 (for example, an $8,600 account value divided by $1,000 = 8.60) and multiply the result by the cost shown for your Fund in the row entitled “Expenses Incurred During Period” to estimate the expenses incurred on your account during this period.
The information under “Hypothetical Performance” provides information about hypothetical account values and hypothetical expenses based on each Fund’s actual expense ratio and an assumed rate of return of 5% per year before expenses, which is not the Fund’s actual return. The hypothetical account values and expenses may not be used to estimate the actual ending account balance or expense you incurred for the period. You may use this information to compare the ongoing costs of investing in the Fund and other funds. To do so, compare this 5% hypothetical example with the 5% hypothetical examples that appear in the shareholder reports of the other funds.
Please note that the expenses shown in the tables are meant to highlight your ongoing costs only and do not reflect any transaction costs. Therefore, the hypothetical information is useful in comparing ongoing costs only, and will not help you determine the relative total costs of owning different funds. In addition, if these transaction costs were included, your costs would have been higher.
NuShares Enhanced Yield U.S. Aggregate Bond ETF (NUAG)
| | | | |
Actual Performance | | | | |
Beginning Account Value | | $ | 1,000.00 | |
Ending Account Value | | $ | 1,028.50 | |
Expenses Incurred During Period | | $ | 1.01 | |
Hypothetical Performance (5% annualized return before expenses) | | | | |
Beginning Account Value | | $ | 1,000.00 | |
Ending Account Value | | $ | 1,023.80 | |
Expenses Incurred During Period | | $ | 1.00 | |
Expenses are equal to the Fund’s annualized net expense ratio of 0.20% multiplied by the average account value over the period, multiplied by 181/365 (to reflect the one-half year period).
Expense Examples (continued)
NuShares Enhanced Yield 1-5 year U.S. Aggregate Bond ETF (NUSA)
| | | | |
Actual Performance | | | | |
Beginning Account Value | | $ | 1,000.00 | |
Ending Account Value | | $ | 1,011.00 | |
Expenses Incurred During Period | | $ | 0.68 | |
Hypothetical Performance (5% annualized return before expenses) | | | | |
Beginning Account Value | | $ | 1,000.00 | |
Ending Account Value | | $ | 1,016.18 | |
Expenses Incurred During Period | | $ | 0.68 | |
Expenses are equal to the Fund’s annualized net expense ratio of 0.20% multiplied by the average account value over the period, multiplied by 123/365 (to reflect the 123 days in the period since commencement of operations).
Report of
Independent Registered Public Accounting Firm
To the Board of Trustees and Shareholders of
NuShares ETF Trust:
We have audited the accompanying statements of assets and liabilities, including the portfolios of investments, of NuShares Enhanced Yield U.S. Aggregate Bond ETF and NuShares Enhanced Yield 1-5 Year U.S. Aggregate Bond ETF (two of the funds comprising NuShares ETF Trust) (the “Funds”) as of July 31, 2017, and the related statements of operations and changes in net assets, and the financial highlights for the periods September 14, 2016 (commencement of operations) through July 31, 2017 for NuShares Enhanced Yield U.S. Aggregate Bond ETF and March 31, 2017 (commencement of operations) through July 31, 2017 for NuShares Enhanced Yield 1-5 Year U.S. Aggregate Bond ETF. These financial statements and financial highlights are the responsibility of the Funds’ management. Our responsibility is to express an opinion on these financial statements and financial highlights based on our audits.
We conducted our audits in accordance with the standards of the Public Company Accounting Oversight Board (United States). Those standards require that we plan and perform the audit to obtain reasonable assurance about whether the financial statements and financial highlights are free of material misstatement. An audit includes examining, on a test basis, evidence supporting the amounts and disclosures in the financial statements. Our procedures included confirmation of securities owned as of July 31, 2017, by correspondence with the custodian and brokers or other appropriate auditing procedures. An audit also includes assessing the accounting principles used and significant estimates made by management, as well as evaluating the overall financial statement presentation. We believe that our audits provide a reasonable basis for our opinion.
In our opinion, the financial statements and financial highlights referred to above present fairly, in all material respects, the financial position of the Funds as of July 31, 2017, the results of their operations, the changes in their net assets, and the financial highlights for the periods specified in the first paragraph, in conformity with U.S. generally accepted accounting principles.
/s/ KPMG LLP
Chicago, Illinois
September 29, 2017
NuShares Enhanced Yield U.S. Aggregate Bond ETF (NUAG)
| | |
| Portfolio of Investments | | July 31, 2017 |
| | | | | | | | | | | | | | | | | | | | |
Principal
Amount (000) | | | Description (1) | | Coupon | | | Maturity | | | Ratings (2) | | | Value | |
| | | | | |
| | | | LONG-TERM INVESTMENTS – 99.1% | | | | | | | | | | | | | | | | |
| | | | | |
| | | | CORPORATE DEBT – 35.5% | | | | | | | | | | | | | | | | |
| | | | | |
| | | | Financials – 9.9% | | | | | | | | | | | | |
| | | | | |
| $ | 80 | | | AerCap Ireland Capital Limited / AerCap Global Aviation Trust | | | 4.250% | | | | 7/01/20 | | | | BBB– | | | $ | 84,097 | |
| | | | | |
| | 70 | | | American International Group, Inc. | | | 4.125% | | | | 2/15/24 | | | | BBB+ | | | | 74,414 | |
| | | | | |
| | 46 | | | Anthem, Inc. | | | 3.500% | | | | 8/15/24 | | | | BBB+ | | | | 47,601 | |
| | | | | |
| | 88 | | | Bank of America Corporation | | | 4.200% | | | | 8/26/24 | | | | BBB | | | | 92,044 | |
| | | | | |
| | 146 | | | Bank of America Corporation | | | 3.950% | | | | 4/21/25 | | | | BBB | | | | 149,539 | |
| | | | | |
| | 115 | | | Bank of America Corporation | | | 4.183% | | | | 11/25/27 | | | | BBB | | | | 118,760 | |
| | | | | |
| | 200 | | | Bank of New York Mellon | | | 2.600% | | | | 2/07/22 | | | | A+ | | | | 201,841 | |
| | | | | |
| | 40 | | | Barclays Bank PLC | | | 3.750% | | | | 5/15/24 | | | | A | | | | 41,594 | |
| | | | | |
| | 86 | | | BGC Partners Inc. | | | 5.375% | | | | 12/09/19 | | | | BBB– | | | | 90,930 | |
| | | | | |
| | 350 | | | Capital One Bank | | | 3.375% | | | | 2/15/23 | | | | BBB+ | | | | 355,212 | |
| | | | | |
| | 120 | | | Citigroup Inc. | | | 3.500% | | | | 5/15/23 | | | | BBB | | | | 122,502 | |
| | | | | |
| | 120 | | | Citigroup Inc. | | | 3.700% | | | | 1/12/26 | | | | A– | | | | 122,130 | |
| | | | | |
| | 227 | | | Citigroup Inc. | | | 4.750% | | | | 5/18/46 | | | | BBB | | | | 240,938 | |
| | | | | |
| | 40 | | | Credit Suisse Group Funding Guernsey Limited | | | 3.800% | | | | 9/15/22 | | | | BBB+ | | | | 41,851 | |
| | | | | |
| | 162 | | | Credit Suisse New York | | | 5.400% | | | | 1/14/20 | | | | BBB | | | | 174,077 | |
| | | | | |
| | 72 | | | Delphi Financial Group | | | 7.875% | | | | 1/31/20 | | | | BBB | | | | 80,783 | |
| | | | | |
| | 100 | | | Deutsche Bank AG | | | 2.850% | | | | 5/10/19 | | | | BBB | | | | 101,150 | |
| | | | | |
| | 145 | | | Deutsche Bank AG | | | 2.950% | | | | 8/20/20 | | | | BBB | | | | 146,559 | |
| | | | | |
| | 70 | | | Deutsche Bank AG | | | 3.375% | | | | 5/12/21 | | | | BBB | | | | 71,194 | |
| | | | | |
| | 86 | | | E Trade Financial Corporation | | | 4.625% | | | | 9/15/23 | | | | BBB– | | | | 90,057 | |
| | | | | |
| | 94 | | | Fifth Third Bancorp. | | | 4.300% | | | | 1/16/24 | | | | BBB+ | | | | 99,920 | |
| | | | | |
| | 40 | | | First Niagara Financial Group, Inc. | | | 6.750% | | | | 3/19/20 | | | | BBB+ | | | | 44,640 | |
| | | | | |
| | 127 | | | FS Investment Corporation | | | 4.000% | | | | 7/15/19 | | | | BBB– | | | | 128,651 | |
| | | | | |
| | 94 | | | Goldman Sachs Group Inc., Series EMC | | | 3.750% | | | | 2/25/26 | | | | A– | | | | 96,121 | |
| | | | | |
| | 253 | | | Goldman Sachs Group, Inc. | | | 3.000% | | | | 4/26/22 | | | | A– | | | | 256,345 | |
| | | | | |
| | 115 | | | Goldman Sachs Group, Inc. | | | 3.500% | | | | 11/16/26 | | | | A– | | | | 114,727 | |
| | | | | |
| | 40 | | | Government Properties Income Trust | | | 3.750% | | | | 8/15/19 | | | | BBB– | | | | 40,487 | |
| | | | | |
| | 44 | | | Host Hotel & Resorts Inc. | | | 6.000% | | | | 10/01/21 | | | | BBB | | | | 49,133 | |
| | | | | |
| | 200 | | | HSBC Holdings PLC | | | 4.250% | | | | 3/14/24 | | | | A | | | | 208,975 | |
| | | | | |
| | 46 | | | Humana, Inc. | | | 3.850% | | | | 10/01/24 | | | | BBB | | | | 48,363 | |
| | | | | |
| | 60 | | | Huntington BancShares Inc. | | | 7.000% | | | | 12/15/20 | | | | BBB | | | | 68,551 | |
| | | | | |
| | 88 | | | Jefferies Group Inc. | | | 8.500% | | | | 7/15/19 | | | | BBB– | | | | 98,246 | |
| | | | | |
| | 100 | | | JPMorgan Chase & Company | | | 2.972% | | | | 1/15/23 | | | | A | | | | 101,377 | |
| | | | | |
| | 80 | | | JPMorgan Chase & Company | | | 3.375% | | | | 5/01/23 | | | | A– | | | | 81,690 | |
| | | | | | | | | | | | | | | | | | | | |
Principal
Amount (000) | | | Description (1) | | Coupon | | | Maturity | | | Ratings (2) | | | Value | |
| | | | | |
| | | | Financials (continued) | | | | | | | | | | | | |
| | | | | |
| $ | 100 | | | JPMorgan Chase & Company | | | 3.200% | | | | 6/15/26 | | | | A | | | $ | 99,368 | |
| | | | | |
| | 40 | | | Key Bank NA | | | 3.400% | | | | 5/20/26 | | | | BBB+ | | | | 39,659 | |
| | | | | |
| | 94 | | | Lincoln National Corporation | | | 4.200% | | | | 3/15/22 | | | | BBB+ | | | | 100,235 | |
| | | | | |
| | 40 | | | Mitsubishi UFJ Financial Group, Inc. | | | 3.850% | | | | 3/01/26 | | | | A | | | | 41,929 | |
| | | | | |
| | 88 | | | Morgan Stanley Dean Witter & Company | | | 4.875% | | | | 11/01/22 | | | | BBB | | | | 95,773 | |
| | | | | |
| | 94 | | | Morgan Stanley | | | 3.875% | | | | 1/27/26 | | | | A– | | | | 97,190 | |
| | | | | |
| | 62 | | | Pennantpark Investment Corporation | | | 4.500% | | | | 10/01/19 | | | | BBB– | | | | 63,210 | |
| | | | | |
| | 38 | | | Primerica Inc. | | | 4.750% | | | | 7/15/22 | | | | BBB+ | | | | 41,194 | |
| | | | | |
| | 84 | | | Principal Financial Inc. | | | 3.125% | | | | 5/15/23 | | | | BBB+ | | | | 85,804 | |
| | | | | |
| | 70 | | | Prospect Capital Corporation | | | 5.000% | | | | 7/15/19 | | | | BBB– | | | | 71,893 | |
| | | | | |
| | 48 | | | Prudential Financial Inc. | | | 3.500% | | | | 5/15/24 | | | | A– | | | | 50,219 | |
| | | | | |
| | 46 | | | Prudential Financial Inc. | | | 5.875% | | | | 9/15/42 | | | | BBB | | | | 51,232 | |
| | | | | |
| | 40 | | | Rabobank Nederland | | | 3.950% | | | | 11/09/22 | | | | A– | | | | 42,103 | |
| | | | | |
| | 41 | | | Reinsurance Group of America Inc. | | | 4.700% | | | | 9/15/23 | | | | BBB+ | | | | 44,544 | |
| | | | | |
| | 44 | | | Select Income REIT | | | 3.600% | | | | 2/01/20 | | | | BBB– | | | | 44,668 | |
| | | | | |
| | 40 | | | Senior Housing Properties Trust | | | 3.250% | | | | 5/01/19 | | | | BBB– | | | | 40,525 | |
| | | | | |
| | 77 | | | Stifel Financial Corporation | | | 3.500% | | | | 12/01/20 | | | | BBB– | | | | 79,184 | |
| | | | | |
| | 42 | | | Sumitomo Mitsui Financial Group, Inc. | | | 3.784% | | | | 3/09/26 | | | | A | | | | 43,885 | |
| | | | | |
| | 40 | | | Suntrust Bank, Subordinate Note | | | 3.300% | | | | 5/15/26 | | | | BBB+ | | | | 39,539 | |
| | | | | |
| | 40 | | | SVB Financial Group | | | 5.375% | | | | 9/15/20 | | | | BBB+ | | | | 43,585 | |
| | | | | |
| | 60 | | | Synovus Financial Corp. | | | 7.875% | | | | 2/15/19 | | | | BBB– | | | | 64,968 | |
| | | | | |
| | 41 | | | Torchmark Corporation | | | 3.800% | | | | 9/15/22 | | | | A– | | | | 42,466 | |
| | | | | |
| | 48 | | | UnumProvident Corporation | | | 5.625% | | | | 9/15/20 | | | | BBB | | | | 52,707 | |
| | | | | |
| | 38 | | | Voya Financial Inc. | | | 5.500% | | | | 7/15/22 | | | | BBB | | | | 42,546 | |
| | | | | |
| | 86 | | | Wells Fargo & Company | | | 3.000% | | | | 4/22/26 | | | | A+ | | | | 84,641 | |
| | 5,185 | | | Total Financials | | | | | | | | | | | | | | | 5,387,566 | |
| | | | | |
| | | | Industrial – 17.7% | | | | | | | | | | | | |
| | | | | |
| | 46 | | | AbbVie Inc. | | | 3.600% | | | | 5/14/25 | | | | BBB+ | | | | 47,408 | |
| | | | | |
| | 32 | | | AGCO Corporation | | | 5.875% | | | | 12/01/21 | | | | BBB– | | | | 35,055 | |
| | | | | |
| | 138 | | | Allergan | | | 3.850% | | | | 6/15/24 | | | | BBB– | | | | 144,995 | |
| | | | | |
| | 35 | | | AT&T, Inc. | | | 4.500% | | | | 5/15/35 | | | | BBB+ | | | | 34,085 | |
| | | | | |
| | 228 | | | AT&T, Inc. | | | 4.300% | | | | 12/15/42 | | | | BBB+ | | | | 209,341 | |
| | | | | |
| | 187 | | | AT&T, Inc. | | | 4.350% | | | | 6/15/45 | | | | BBB+ | | | | 169,419 | |
| | | | | |
| | 44 | | | AutoNation Inc. | | | 4.500% | | | | 10/01/25 | | | | BBB– | | | | 46,603 | |
| | | | | |
| | 66 | | | Baxalta, Inc. | | | 2.875% | | | | 6/23/20 | | | | BBB– | | | | 67,409 | |
| | | | | |
| | 46 | | | Baxalta, Inc. | | | 3.600% | | | | 6/23/22 | | | | BBB– | | | | 47,383 | |
| | | | | |
| | 80 | | | Baxter International Inc. | | | 3.500% | | | | 8/15/46 | | | | BBB+ | | | | 72,102 | |
| | | | | |
| | 128 | | | Becton Dickinson & Company | | | 4.685% | | | | 12/15/44 | | | | BBB | | | | 135,096 | |
NuShares Enhanced Yield U.S. Aggregate Bond ETF (NUAG) (continued)
| | |
| Portfolio of Investments | | July 31, 2017 |
| | | | | | | | | | | | | | | | | | | | |
Principal
Amount (000) | | | Description (1) | | Coupon | | | Maturity | | | Ratings (2) | | | Value | |
| | | | | |
| | | | Industrial (continued) | | | | | | | | | | | | |
| | | | | |
| $ | 143 | | | Boardwalk Pipelines LP | | | 3.375% | | | | 2/01/23 | | | | BBB– | | | $ | 142,947 | |
| | | | | |
| | 40 | | | BorgWarner Inc. | | | 3.375% | | | | 3/15/25 | | | | BBB+ | | | | 40,513 | |
| | | | | |
| | 46 | | | BorgWarner Inc. | | | 4.375% | | | | 3/15/45 | | | | BBB+ | | | | 45,994 | |
| | | | | |
| | 64 | | | Buckeye Partners LP | | | 4.150% | | | | 7/01/23 | | | | BBB– | | | | 66,611 | |
| | | | | |
| | 137 | | | Canadian Natural Resources Limited | | | 3.900% | | | | 2/01/25 | | | | BBB | | | | 139,843 | |
| | | | | |
| | 46 | | | Canadian Pacific Railway Company | | | 4.800% | | | | 9/15/35 | | | | BBB+ | | | | 51,472 | |
| | | | | |
| | 120 | | | Cardinal Health Inc. | | | 4.500% | | | | 11/15/44 | | | | BBB+ | | | | 124,947 | |
| | | | | |
| | 54 | | | Celanese US Holdings LLC | | | 5.875% | | | | 6/15/21 | | | | BBB– | | | | 60,518 | |
| | | | | |
| | 46 | | | Celgene Corporation | | | 3.625% | | | | 5/15/24 | | | | BBB | | | | 48,074 | |
| | | | | |
| | 46 | | | Charter Communications Operating Capital Corporation | | | 4.908% | | | | 7/23/25 | | | | BBB– | | | | 49,432 | |
| | | | | |
| | 100 | | | Cimarex Energy Company | | | 4.375% | | | | 6/01/24 | | | | BBB– | | | | 105,867 | |
| | | | | |
| | 42 | | | Coach, Inc. | | | 4.250% | | | | 4/01/25 | | | | BBB– | | | | 43,427 | |
| | | | | |
| | 40 | | | Columbia Pipeline Group, Inc. | | | 5.800% | | | | 6/01/45 | | | | BBB | | | | 47,643 | |
| | | | | |
| | 40 | | | CVS Health Corporation | | | 4.875% | | | | 7/20/35 | | | | BBB+ | | | | 44,453 | |
| | | | | |
| | 46 | | | CVS Health Corporation | | | 5.125% | | | | 7/20/45 | | | | BBB+ | | | | 52,788 | |
| | | | | |
| | 84 | | | Delphi Corporation | | | 4.150% | | | | 3/15/24 | | | | BBB | | | | 88,807 | |
| | | | | |
| | 80 | | | Discovery Communications Inc. | | | 3.250% | | | | 4/01/23 | | | | BBB– | | | | 80,067 | |
| | | | | |
| | 42 | | | Discovery Communications Inc. | | | 4.900% | | | | 3/11/26 | | | | BBB– | | | | 44,862 | |
| | | | | |
| | 40 | | | Eaton Corporation | | | 4.000% | | | | 11/02/32 | | | | BBB+ | | | | 42,116 | |
| | | | | |
| | 46 | | | Eaton Corporation | | | 4.150% | | | | 11/01/42 | | | | BBB+ | | | | 47,413 | |
| | | | | |
| | 160 | | | EcoPetrol SA | | | 4.250% | | | | 9/18/18 | | | | BBB | | | | 163,229 | |
| | | | | |
| | 46 | | | Electronic Arts, Inc. | | | 4.800% | | | | 3/01/26 | | | | BBB | | | | 50,697 | |
| | | | | |
| | 80 | | | Enable Midstream Partners LP | | | 2.400% | | | | 5/15/19 | | | | BBB– | | | | 79,797 | |
| | | | | |
| | 70 | | | Enable Midstream Partners LP | | | 3.900% | | | | 5/15/24 | | | | BBB– | | | | 69,842 | |
| | | | | |
| | 94 | | | Enterprise Products Operating LP | | | 5.750% | | | | 3/01/35 | | | | BBB+ | | | | 106,282 | |
| | | | | |
| | 60 | | | EQT Corporation | | | 6.500% | | | | 4/01/18 | | | | BBB– | | | | 61,765 | |
| | | | | |
| | 60 | | | EQT Corporation | | | 4.875% | | | | 11/15/21 | | | | BBB– | | | | 64,878 | |
| | | | | |
| | 94 | | | FedEx Corporation | | | 3.900% | | | | 2/01/35 | | | | BBB | | | | 94,802 | |
| | | | | |
| | 110 | | | Flowers Foods, Inc. | | | 3.500% | | | | 10/01/26 | | | | BBB | | | | 109,277 | |
| | | | | |
| | 40 | | | Flowserve Corporation | | | 4.000% | | | | 11/15/23 | | | | BBB | | | | 41,527 | |
| | | | | |
| | 60 | | | FMC Corporation | | | 5.200% | | | | 12/15/19 | | | | BBB | | | | 63,812 | |
| | | | | |
| | 44 | | | Ford Motor Company | | | 6.375% | | | | 2/01/29 | | | | BBB | | | | 50,931 | |
| | | | | |
| | 46 | | | Ford Motor Company | | | 4.750% | | | | 1/15/43 | | | | BBB | | | | 44,563 | |
| | | | | |
| | 160 | | | Ford Motor Credit Company | | | 3.664% | | | | 9/08/24 | | | | BBB | | | | 160,518 | |
| | | | | |
| | 42 | | | Fortive Corporation | | | 4.300% | | | | 6/15/46 | | | | BBB | | | | 43,743 | |
| | | | | |
| | 93 | | | General Motors Corporation | | | 6.600% | | | | 4/01/36 | | | | BBB | | | | 109,309 | |
| | | | | |
| | 160 | | | General Motors Financial Company Inc. | | | 5.250% | | | | 3/01/26 | | | | BBB | | | | 173,448 | |
| | | | | |
| | 80 | | | Grupo Televisa SAB | | | 5.000% | | | | 5/13/45 | | | | BBB+ | | | | 79,487 | |
| | | | | |
| | 196 | | | Halliburton Company | | | 3.800% | | | | 11/15/25 | | | | BBB+ | | | | 202,260 | |
| | | | | | | | | | | | | | | | | | | | |
Principal
Amount (000) | | | Description (1) | | Coupon | | | Maturity | | | Ratings (2) | | | Value | |
| | | | | |
| | | | Industrial (continued) | | | | | | | | | | | | |
| | | | | |
| $ | 70 | | | Harman International Industries, Inc. | | | 4.150% | | | | 5/15/25 | | | | BBB | | | $ | 72,741 | |
| | | | | |
| | 99 | | | Helmerich and Payne International Drilling Company | | | 4.650% | | | | 3/15/25 | | | | BBB+ | | | | 105,145 | |
| | | | | |
| | 80 | | | Interpublic Group of Companies Inc. | | | 3.750% | | | | 2/15/23 | | | | BBB | | | | 83,232 | |
| | | | | |
| | 40 | | | Johnson Controls International PLC | | | 4.625% | | | | 7/02/44 | | | | BBB+ | | | | 42,683 | |
| | | | | |
| | 40 | | | Johnson Controls International PLC | | | 5.125% | | | | 9/14/45 | | | | BBB+ | | | | 46,290 | |
| | | | | |
| | 60 | | | Kennametal Inc. | | | 2.650% | | | | 11/01/19 | | | | BBB– | | | | 60,613 | |
| | | | | |
| | 39 | | | Kennametal Inc. | | | 3.875% | | | | 2/15/22 | | | | BBB– | | | | 40,058 | |
| | | | | |
| | 40 | | | Kohl’s Corporation | | | 4.250% | | | | 7/17/25 | | | | BBB | | | | 39,989 | |
| | | | | |
| | 46 | | | Kraft Heinz Foods Company | | | 5.000% | | | | 7/15/35 | | | | BBB– | | | | 49,790 | |
| | | | | |
| | 94 | | | Lockheed Martin Corporation | | | 3.600% | | | | 3/01/35 | | | | BBB+ | | | | 92,557 | |
| | | | | |
| | 42 | | | Macy’s Retail Holdings Inc. | | | 6.650% | | | | 7/15/24 | | | | BBB– | | | | 46,167 | |
| | | | | |
| | 39 | | | Magellan Midstream Partners LP | | | 4.200% | | | | 3/15/45 | | | | BBB+ | | | | 36,849 | |
| | | | | |
| | 167 | | | Marathon Oil Corporation | | | 2.700% | | | | 6/01/20 | | | | BBB– | | | | 166,392 | |
| | | | | |
| | 94 | | | Marathon Petroleum Corporation | | | 3.625% | | | | 9/15/24 | | | | BBB | | | | 95,642 | |
| | | | | |
| | 46 | | | Marriott International, Inc. | | | 4.500% | | | | 10/01/34 | | | | BBB | | | | 48,359 | |
| | | | | |
| | 20 | | | Martin Marietta Materials | | | 6.600% | | | | 4/15/18 | | | | BBB | | | | 20,655 | |
| | | | | |
| | 48 | | | McDonald’s Corporation | | | 4.700% | | | | 12/09/35 | | | | BBB+ | | | | 53,230 | |
| | | | | |
| | 88 | | | McDonald’s Corporation | | | 4.875% | | | | 7/15/40 | | | | BBB+ | | | | 96,972 | |
| | | | | |
| | 44 | | | McKesson Corporation | | | 4.883% | | | | 3/15/44 | | | | BBB+ | | | | 49,505 | |
| | | | | |
| | 200 | | | MPLX LP | | | 4.500% | | | | 7/15/23 | | | | BBB– | | | | 213,313 | |
| | | | | |
| | 74 | | | Mylan Inc. | | | 3.150% | | | | 6/15/21 | | | | BBB– | | | | 75,566 | |
| | | | | |
| | 80 | | | National Fuel Gas Company | | | 8.750% | | | | 5/01/19 | | | | BBB | | | | 88,356 | |
| | | | | |
| | 88 | | | National Oilwell Varco inc. | | | 2.600% | | | | 12/01/22 | | | | BBB+ | | | | 85,864 | |
| | | | | |
| | 40 | | | Newell Brands Inc. | | | 5.000% | | | | 11/15/23 | | | | BBB– | | | | 42,893 | |
| | | | | |
| | 46 | | | Newell Brands Inc. | | | 5.375% | | | | 4/01/36 | | | | BBB– | | | | 53,683 | |
| | | | | |
| | 64 | | | Newmont Mining Corporation | | | 3.500% | | | | 3/15/22 | | | | BBB | | | | 66,514 | |
| | | | | |
| | 64 | | | Noble Energy Inc. | | | 3.900% | | | | 11/15/24 | | | | BBB– | | | | 65,802 | |
| | | | | |
| | 35 | | | Nordstrom, Inc. | | | 6.950% | | | | 3/15/28 | | | | BBB+ | | | | 39,020 | |
| | | | | |
| | 57 | | | Northern Border Pipeline Company | | | 7.500% | | | | 9/15/21 | | | | BBB+ | | | | 65,801 | |
| | | | | |
| | 100 | | | Nucor Corporation | | | 4.125% | | | | 9/15/22 | | | | BBB+ | | | | 107,244 | |
| | | | | |
| | 60 | | | Oceaneering International, Inc. | | | 4.650% | | | | 11/15/24 | | | | BBB– | | | | 59,329 | |
| | | | | |
| | 46 | | | Orange SA | | | 5.375% | | | | 1/13/42 | | | | BBB+ | | | | 53,815 | |
| | | | | |
| | 42 | | | Owens and Minor, Inc. | | | 4.375% | | | | 12/15/24 | | | | BBB– | | | | 42,765 | |
| | | | | |
| | 80 | | | Perrigo Finance Unlimited Company | | | 3.500% | | | | 3/15/21 | | | | BBB– | | | | 82,520 | |
| | | | | |
| | 315 | | | Petroleos Mexicanos | | | 6.000% | | | | 3/05/20 | | | | BBB | | | | 339,772 | |
| | | | | |
| | 70 | | | Phillips 66 | | | 4.650% | | | | 11/15/34 | | | | BBB+ | | | | 74,176 | |
| | | | | |
| | 60 | | | Pioneer Natural Resources Company | | | 3.950% | | | | 7/15/22 | | | | BBB | | | | 63,203 | |
| | | | | |
| | 70 | | | Pioneer Natural Resources Company | | | 4.450% | | | | 1/15/26 | | | | BBB | | | | 75,156 | |
| | | | | |
| | 80 | | | Qwest Corp. | | | 6.875% | | | | 9/15/33 | | | | BBB– | | | | 79,168 | |
NuShares Enhanced Yield U.S. Aggregate Bond ETF (NUAG) (continued)
| | |
| Portfolio of Investments | | July 31, 2017 |
| | | | | | | | | | | | | | | | | | | | |
Principal
Amount (000) | | | Description (1) | | Coupon | | | Maturity | | | Ratings (2) | | | Value | |
| | | | | |
| | | | Industrial (continued) | | | | | | | | | | | | |
| | | | | |
| $ | 59 | | | Qwest Corporation | | | 7.125% | | | | 11/15/43 | | | | BBB– | | | $ | 58,484 | |
| | | | | |
| | 52 | | | Rayonier, Inc. | | | 3.750% | | | | 4/01/22 | | | | BBB– | | | | 52,570 | |
| | | | | |
| | 70 | | | Reliance Steel and Aluminum Co | | | 4.500% | | | | 4/15/23 | | | | BBB | | | | 74,435 | |
| | | | | |
| | 46 | | | Reynolds American Inc. | | | 5.700% | | | | 8/15/35 | | | | BBB | | | | 54,802 | |
| | | | | |
| | 126 | | | Rogers Communications Inc. | | | 5.000% | | | | 3/15/44 | | | | BBB+ | | | | 143,134 | |
| | | | | |
| | 88 | | | RPM International, Inc. | | | 6.125% | | | | 10/15/19 | | | | BBB | | | | 95,329 | |
| | | | | |
| | 79 | | | Scripps Networks Interactive Inc. | | | 3.900% | | | | 11/15/24 | | | | BBB | | | | 81,089 | |
| | | | | |
| | 40 | | | Signet UK Finance PLC | | | 4.700% | | | | 6/15/24 | | | | BB+ | | | | 39,351 | |
| | | | | |
| | 80 | | | Spectra Energy Partners LP | | | 4.500% | | | | 3/15/45 | | | | BBB | | | | 78,787 | |
| | | | | |
| | 100 | | | Stanley Black & Decker Inc. | | | 5.750% | | | | 12/15/53 | | | | BBB | | | | 105,066 | |
| | | | | |
| | 44 | | | Sysco Corporation | | | 5.375% | | | | 9/21/35 | | | | BBB+ | | | | 51,358 | |
| | | | | |
| | 110 | | | Talisman Energy Inc. | | | 7.750% | | | | 6/01/19 | | | | BBB | | | | 120,031 | |
| | | | | |
| | 96 | | | TC Pipelines LP | | | 4.650% | | | | 6/15/21 | | | | BBB– | | | | 101,855 | |
| | | | | |
| | 119 | | | TechnipFMC PLC, 144A | | | 3.450% | | | | 10/01/22 | | | | BBB | | | | 118,765 | |
| | | | | |
| | 44 | | | The JM Smucker Company | | | 4.250% | | | | 3/15/35 | | | | BBB | | | | 46,129 | |
| | | | | |
| | 46 | | | Thermo Fischer Scientific Inc. | | | 5.300% | | | | 2/01/44 | | | | BBB | | | | 54,085 | |
| | | | | |
| | 44 | | | Tyson Foods | | | 4.875% | | | | 8/15/34 | | | | BBB | | | | 48,161 | |
| | | | | |
| | 161 | | | Valero Energy Corporation | | | 3.650% | | | | 3/15/25 | | | | BBB | | | | 165,389 | |
| | | | | |
| | 88 | | | Valmont Industries, Inc. | | | 6.625% | | | | 4/20/20 | | | | BBB | | | | 97,209 | |
| | | | | |
| | 160 | | | Verizon Communications | | | 4.400% | | | | 11/01/34 | | | | BBB+ | | | | 157,140 | |
| | | | | |
| | 94 | | | Verizon Communications | | | 4.750% | | | | 11/01/41 | | | | BBB+ | | | | 92,171 | |
| | | | | |
| | 139 | | | Verizon Communications | | | 4.125% | | | | 8/15/46 | | | | BBB+ | | | | 122,906 | |
| | | | | |
| | 127 | | | Viacom Inc. | | | 4.250% | | | | 9/01/23 | | | | BBB- | | | | 132,009 | |
| | | | | |
| | 41 | | | Walgreen Company | | | 4.400% | | | | 9/15/42 | | | | BBB | | | | 41,385 | |
| | | | | |
| | 40 | | | Walgreens Boots Alliance, Inc. | | | 4.500% | | | | 11/18/34 | | | | BBB | | | | 41,633 | |
| | | | | |
| | 41 | | | Waste Management Inc. | | | 3.900% | | | | 3/01/35 | | | | BBB+ | | | | 42,223 | |
| | | | | |
| | 79 | | | Western Gas Partners LP | | | 4.000% | | | | 7/01/22 | | | | BBB– | | | | 81,499 | |
| | | | | |
| | 40 | | | Worthington Industries, Inc. | | | 4.550% | | | | 4/15/26 | | | | BBB– | | | | 41,384 | |
| | | | | |
| | 40 | | | Zimmer Biomet Holdings, Inc. | | | 4.250% | | | | 8/15/35 | | | | BBB– | | | | 39,422 | |
| | | | | |
| | 40 | | | Zimmer Biomet Holdings, Inc. | | | 5.750% | | | | 11/30/39 | | | | BBB– | | | | 46,978 | |
| | 9,227 | | | Total Industrial | | | | | | | | | | | | | | | 9,592,465 | |
| | | | | |
| | | | Utility - 7.9% | | | | | | | | | | | | |
| | | | | |
| | 84 | | | Appalachian Power Company | | | 5.800% | | | | 10/01/35 | | | | BBB+ | | | | 100,922 | |
| | | | | |
| | 46 | | | Appalachian Power Company | | | 4.400% | | | | 5/15/44 | | | | BBB+ | | | | 48,953 | |
| | | | | |
| | 80 | | | Black Hills Corporation | | | 3.150% | | | | 1/15/27 | | | | BBB | | | | 77,870 | |
| | | | | |
| | 40 | | | Black Hills Corporation | | | 4.200% | | | | 9/15/46 | | | | BBB | | | | 39,125 | |
| | | | | |
| | 64 | | | Cleco Corporate Holdings LLC | | | 3.743% | | | | 5/01/26 | | | | BBB– | | | | 64,932 | |
| | | | | |
| | 80 | | | CMS Energy Corporation | | | 4.700% | | | | 3/31/43 | | | | BBB | | | | 86,791 | |
| | | | | |
| | 72 | | | Dominion Resources Inc. | | | 5.250% | | | | 8/01/33 | | | | BBB | | | | 82,095 | |
| | | | | | | | | | | | | | | | | | | | |
Principal
Amount (000) | | | Description (1) | | Coupon | | | Maturity | | | Ratings (2) | | | Value | |
| | | | | |
| | | | Utility (continued) | | | | | | | | | | | | |
| | | | | |
| $ | 147 | | | Dominion Resources Inc. | | | 4.700% | | | | 12/01/44 | | | | BBB | | | $ | 159,481 | |
| | | | | |
| | 400 | | | DTE Electric, (WI/DD) | | | 3.750% | | | | 8/15/47 | | | | A+ | | | | 399,784 | |
| | | | | |
| | 197 | | | Duke Energy Corporation | | | 2.650% | | | | 9/01/26 | | | | BBB+ | | | | 190,610 | |
| | | | | |
| | 115 | | | Duke Energy Corporation | | | 3.750% | | | | 9/01/46 | | | | BBB+ | | | | 111,605 | |
| | | | | |
| | 88 | | | Edison International | | | 2.950% | | | | 3/15/23 | | | | BBB+ | | | | 88,798 | |
| | | | | |
| | 80 | | | El Paso Electric Company | | | 5.000% | | | | 12/01/44 | | | | BBB | | | | 86,878 | |
| | | | | |
| | 44 | | | Emera US Finance LP | | | 3.550% | | | | 6/15/26 | | | | BBB– | | | | 44,623 | |
| | | | | |
| | 46 | | | Emera US Finance LP | | | 4.750% | | | | 6/15/46 | | | | BBB– | | | | 49,272 | |
| | | | | |
| | 88 | | | Entergy Corporation | | | 2.950% | | | | 9/01/26 | | | | BBB | | | | 85,478 | |
| | | | | |
| | 139 | | | Exelon Corporation | | | 4.950% | | | | 6/15/35 | | | | BBB | | | | 151,870 | |
| | | | | |
| | 94 | | | Exelon Corporation | | | 4.450% | | | | 4/15/46 | | | | BBB | | | | 97,468 | |
| | | | | |
| | 80 | | | Indiana Michigan Power Company | | | 3.200% | | | | 3/15/23 | | | | BBB+ | | | | 81,830 | |
| | | | | |
| | 100 | | | Indiana Michigan Power Company | | | 3.750% | | | | 7/01/47 | | | | BBB+ | | | | 98,756 | |
| | | | | |
| | 46 | | | Interstate Power And Light Company | | | 4.700% | | | | 10/15/43 | | | | BBB+ | | | | 50,507 | |
| | | | | |
| | 120 | | | ITC Holdings Corp. | | | 3.250% | | | | 6/30/26 | | | | BBB | | | | 119,370 | |
| | | | | |
| | 40 | | | ITC Holdings Corp. | | | 5.300% | | | | 7/01/43 | | | | BBB | | | | 46,195 | |
| | | | | |
| | 55 | | | John Sevier Combined Cycle Generation LLC | | | 4.626% | | | | 1/15/42 | | | | AA | | | | 60,417 | |
| | | | | |
| | 46 | | | Kansas City Power and Light Co | | | 5.300% | | | | 10/01/41 | | | | BBB+ | | | | 53,519 | |
| | | | | |
| | 107 | | | Kansas City Power and Light Co | | | 4.200% | | | | 6/15/47 | | | | BBB+ | | | | 109,629 | |
| | | | | |
| | 64 | | | KeySpan Corporation | | | 5.803% | | | | 4/01/35 | | | | BBB+ | | | | 77,594 | |
| | | | | |
| | 140 | | | National Rural Utilities Cooperative Finance Corporation | | | 2.850% | | | | 1/27/25 | | | | A+ | | | | 139,598 | |
| | | | | |
| | 72 | | | NiSource Finance Corporation | | | 5.250% | | | | 2/15/43 | | | | BBB | | | | 82,996 | |
| | | | | |
| | 72 | | | NiSource Finance Corporation | | | 4.800% | | | | 2/15/44 | | | | BBB | | | | 79,091 | |
| | | | | |
| | 94 | | | PPL Capital Funding Inc. | | | 4.700% | | | | 6/01/43 | | | | BBB | | | | 100,469 | |
| | | | | |
| | 62 | | | PSE&G Power LLC | | | 4.300% | | | | 11/15/23 | | | | BBB+ | | | | 65,593 | |
| | | | | |
| | 250 | | | Public Service of Colorado | | | 3.800% | | | | 6/15/47 | | | | A+ | | | | 252,090 | |
| | | | | |
| | 60 | | | Public Service Company of New Mexico | | | 3.850% | | | | 8/01/25 | | | | BBB | | | | 61,909 | |
| | | | | |
| | 66 | | | Puget Energy, Inc. | | | 3.650% | | | | 5/15/25 | | | | BBB– | | | | 66,073 | |
| | | | | |
| | 66 | | | SCANA Corporation | | | 4.125% | | | | 2/01/22 | | | | BBB– | | | | 68,634 | |
| | | | | |
| | 77 | | | Southaven Combined Cycle Generation LLC | | | 3.846% | | | | 8/15/33 | | | | AA | | | | 78,002 | |
| | | | | |
| | 188 | | | Southern Company Gas Capital Corporation | | | 4.400% | | | | 6/01/43 | | | | BBB+ | | | | 193,443 | |
| | | | | |
| | 60 | | | Spire, Inc. | | | 4.700% | | | | 8/15/44 | | | | BBB | | | | 61,098 | |
| | | | | |
| | 130 | | | The Southern Company | | | 4.250% | | | | 7/01/36 | | | | BBB+ | | | | 134,577 | |
| | | | | |
| | 46 | | | The Southern Company | | | 4.400% | | | | 7/01/46 | | | | BBB+ | | | | 47,963 | |
| | | | | |
| | 70 | | | TransAlta Corporation | | | 4.500% | | | | 11/15/22 | | | | BBB– | | | | 70,525 | |
| | | | | |
| | 44 | | | Tucson Electric Power Company | | | 3.050% | | | | 3/15/25 | | | | A– | | | | 43,163 | |
| | | | | |
| | 46 | | | Xcel Energy Inc. | | | 4.800% | | | | 9/15/41 | | | | BBB+ | | | | 50,831 | |
| | 4,105 | | | Total Utility | | | | | | | | | | | | | | | 4,260,427 | |
| $ | 18,517 | | | Total Corporate Debt (cost $19,330,971) | | | | | | | | | | | | | | | 19,240,458 | |
NuShares Enhanced Yield U.S. Aggregate Bond ETF (NUAG) (continued)
| | |
| Portfolio of Investments | | July 31, 2017 |
| | | | | | | | | | | | | | | | | | | | |
Principal
Amount (000) | | | Description (1) | | Coupon | | | Maturity | | | Ratings (2) | | | Value | |
| | | | | |
| | | | GOVERNMENT RELATED – 3.4% | | | | | | | | | | | | | | | | |
| | | | | |
| | | | Sovereign Debt – 1.7% | | | | | | | | | | | | |
| | | | | |
| $ | 60 | | | Republic of Chile | | | 3.625% | | | | 10/30/42 | | | | A+ | | | $ | 59,634 | |
| | | | | |
| | 120 | | | Republic of Colombia | | | 6.125% | | | | 1/18/41 | | | | BBB | | | | 138,960 | |
| | | | | |
| | 40 | | | Republic of Italy | | | 5.375% | | | | 6/15/33 | | | | BBB | | | | 45,588 | |
| | | | | |
| | 60 | | | Republic of Panama | | | 4.300% | | | | 4/29/53 | | | | BBB | | | | 59,850 | |
| | | | | |
| | 139 | | | Republic of Peru | | | 4.125% | | | | 8/25/27 | | | | BBB+ | | | | 151,927 | |
| | | | | |
| | 100 | | | Republic of Uruguay | | | 5.100% | | | | 6/18/50 | | | | BBB | | | | 103,250 | |
| | | | | |
| | 192 | | | United Mexican States | | | 4.750% | | | | 3/08/44 | | | | BBB+ | | | | 194,304 | |
| | | | | |
| | 160 | | | United Mexican States | | | 4.350% | | | | 1/15/47 | | | | BBB+ | | | | 152,960 | |
| | 871 | | | Total Sovereign Debt | | | | | | | | | | | | | | | 906,473 | |
| | | | | |
| | | | Municipal Bonds – 1.2% (3) | | | | | | | | | | | | |
| | | | | |
| | 60 | | | Board of Regents of the University of Texas System, Revenue Financing System Bonds, Green Series 2016A (No Optional Call) | | | 3.852% | | | | 8/15/46 | | | | AAA | | | | 63,944 | |
| | | | | |
| | 88 | | | California State, General Obligation Bonds, Various Purpose Build America Taxable Bond Series 2010 (Optional Call: 3/20 at 100.00) | | | 7.950% | | | | 3/01/36 | | | | AA– | | | | 100,747 | |
| | | | | |
| | 60 | | | Missouri Health and Educational Facilities Authority, Revenue Bonds, Washington University, Series 2016B (No Optional Call) | | | 3.086% | | | | 9/15/51 | | | | AA+ | | | | 52,998 | |
| | | | | |
| | 80 | | | New Jersey Transportation Trust Fund Authority, Transportation System Bonds, Build America Bonds Issuer Subsidy Program, Series 2009B (Optional Call: 6/19 at 100.00) | | | 6.875% | | | | 12/15/39 | | | | BBB+ | | | | 83,994 | |
| | | | | |
| | 96 | | | New Jersey Transportation Trust Fund Authority, Transportation System Bonds, Build America Bonds Issuer Subsidy Program, Series 2010C (Optional Call: 12/20 at 100.00) | | | 6.104% | | | | 12/15/28 | | | | BBB+ | | | | 101,346 | |
| | | | | |
| | 40 | | | Ohio State University, General Receipts Bonds, Multiyear Debt Issuance Program, Refunding Series 2016A (No Optional Call) | | | 3.798% | | | | 12/01/46 | | | | AA | | | | 41,059 | |
| | | | | |
| | 110 | | | Phoenix, Arizona, Various Purpose General Obligation Bonds, Build America Taxable Bonds, Series 2009A (No Optional Call) | | | 5.269% | | | | 7/01/34 | | | | AA+ | | | | 131,517 | |
| | | | | |
| | 71 | | | Texas State, General Obligation Bonds, Transportation Commission, Build America Taxable Bonds, Series 2010A (No Optional Call) | | | 4.631% | | | | 4/01/33 | | | | AAA | | | | 80,808 | |
| | 605 | | | Total Municipal Bonds | | | | | | | | | | | | | | | 656,413 | |
| | | | | |
| | | | Government Agency – 0.5% | | | | | | | | | | | | |
| | | | | |
| | 127 | | | Inter-American Development Bank | | | 3.200% | | | | 8/07/42 | | | | AAA | | | | 125,135 | |
| | | | | |
| | 120 | | | Tennessee Valley Authority | | | 3.500% | | | | 12/15/42 | | | | AAA | | | | 124,101 | |
| | 247 | | | Total Government Agency | | | | | | | | | | | | | | | 249,236 | |
| $ | 1,723 | | | Total Government Related (cost $1,869,499) | | | | | | | | | | | | | | | 1,812,122 | |
| | | | | |
Principal
Amount (000) | | | Description (1) | | Coupon | | | Maturity | | | Ratings (2) | | | Value | |
| | | | | |
| | | | U.S. TREASURY – 20.2% | | | | | | | | | | | | |
| | | | | |
| $ | 2,724 | | | U.S. Treasury Notes | | | 0.750% | | | | 8/15/19 | | | | AAA | | | $ | 2,690,269 | |
| | | | | |
| | 707 | | | U.S. Treasury Notes | | | 0.875% | | | | 9/15/19 | | | | AAA | | | | 699,709 | |
| | | | | |
| | 300 | | | U.S. Treasury Notes | | | 2.000% | | | | 12/31/21 | | | | AAA | | | | 302,836 | |
| | | | | | | | | | | | | | | | | | | | |
Principal
Amount (000) | | | Description (1) | | Coupon | | | Maturity | | | Ratings (2) | | | Value | |
| | | | | |
| | | | U.S. TREASURY (continued) | | | | | | | | | | | | |
| | | | | |
| $ | 1,060 | | | U.S. Treasury Notes | | | 2.750% | | | | 11/15/23 | | | | AAA | | | $ | 1,105,919 | |
| | | | | |
| | 945 | | | U.S. Treasury Notes | | | 2.250% | | | | 11/15/24 | | | | AAA | | | | 952,309 | |
| | | | | |
| | 1,688 | | | U.S. Treasury Notes | | | 2.000% | | | | 8/15/25 | | | | AAA | | | | 1,662,943 | |
| | | | | |
| | 1,948 | | | U.S. Treasury Notes | | | 2.250% | | | | 2/15/27 | | | | AAA | | | | 1,941,685 | |
| | | | | |
| | 1,550 | | | U.S. Treasury Notes | | | 2.375% | | | | 5/15/27 | | | | AAA | | | | 1,561,079 | |
| $ | 10,922 | | | Total U.S. Treasury (cost $11,081,208) | | | | | | | | | | | | | | | 10,916,749 | |
| | | | | |
Principal
Amount (000) | | | Description (1) | | Coupon | | | Maturity | | | Ratings (2) | | | Value | |
| | | | | |
| | | | SECURITIZED – 40.0% | | | | | | | | | | | | |
| | | | | |
| $ | 600 | | | Commercial Mortgage Pass-Through Certificates, Series 2015-LC19 | | | 3.527% | | | | 2/10/48 | | | | AA+ | | | $ | 614,190 | |
| | | | | |
| | 500 | | | CSAIL Commercial Mortgage Trust, Commercial Mortgage Pass-Through Certificates, Series 2015-C2 | | | 3.849% | | | | 6/15/57 | | | | Aa2 | | | | 520,565 | |
| | | | | |
| | 1,151 | | | Fannie Mae Mortgage Pool AL9125 | | | 4.000% | | | | 10/01/43 | | | | AAA | | | | 1,215,807 | |
| | | | | |
| | 2,117 | | | Fannie Mae Mortgage Pool AS6302 | | | 3.500% | | | | 12/01/45 | | | | AAA | | | | 2,180,943 | |
| | | | | |
| | 1,160 | | | Fannie Mae Mortgage Pool AX4887 | | | 4.000% | | | | 12/01/44 | | | | AAA | | | | 1,222,046 | |
| | | | | |
| | 2,100 | | | Fannie Mae Mortgage Pool MA1489 | | | 3.000% | | | | 7/01/43 | | | | AAA | | | | 2,114,003 | |
| | | | | |
| | 1,309 | | | Fannie Mae Mortgage Pool MA2671 | | | 3.500% | | | | 7/01/46 | | | | AAA | | | | 1,348,172 | |
| | | | | |
| | 3,602 | | | Fannie Mae Mortgage Pool MA2929 | | | 3.500% | | | | 3/01/47 | | | | AAA | | | | 3,711,230 | |
| | | | | |
| | 2,439 | | | Ginnie Mae Mortgage Pool MA2149 | | | 4.000% | | | | 8/20/44 | | | | AAA | | | | 2,580,227 | |
| | | | | |
| | 1,549 | | | Ginnie Mae Mortgage Pool MA3311 | | | 4.000% | | | | 12/20/45 | | | | AAA | | | | 1,631,063 | |
| | | | | |
| | 1,003 | | | Ginnie Mae Mortgage Pool MA3310 | | | 3.500% | | | | 12/20/45 | | | | AAA | | | | 1,043,983 | |
| | | | | |
| | 360 | | | Ginnie Mae Mortgage Pool MA3874 | | | 3.500% | | | | 8/20/46 | | | | AAA | | | | 373,940 | |
| | | | | |
| | 1,977 | | | Ginnie Mae Mortgage Pool MA3937 | | | 3.500% | | | | 9/20/46 | | | | AAA | | | | 2,056,916 | |
| | | | | |
| | 500 | | | Wells Fargo Commercial Mortgage Trust, Commercial Mortgage-Pass-Through Certificates, Series 2014-LC16 | | | 4.020% | | | | 8/15/50 | | | | Aaa | | | | 527,310 | |
| | | | | |
| | 500 | | | World Financial Network Credit Card Master Trust, Series 2012-A | | | 3.140% | | | | 1/15/23 | | | | AAA | | | | 510,684 | |
| $ | 20,867 | | | Total Securitized (cost $21,952,966) | | | | | | | | | | | | | | | 21,651,079 | |
| | | | Total Long-Term Investments (cost $54,234,644) | | | | | | | | | | | | | | | 53,620,408 | |
| | | | | |
Principal
Amount (000) | | | Description (1) | | Coupon | | | Maturity | | | Ratings (2) | | | Value | |
| | | | | |
| | | | SHORT-TERM INVESTMENTS – 1.0% | | | | | | | | | | | | | | | | |
| | | | | |
| | | | GOVERNMENT RELATED – 1.0% | | | | | | | | | | | | |
| | | | | |
| $ | 550 | | | Federal Farm Credit Bank, Discount Notes | | | 0.000% | | | | 8/01/17 | | | | N/R | | | $ | 550,000 | |
| $ | 550 | | | Total Short-Term Investments (cost $550,000) | | | | | | | | | | | | | | | 550,000 | |
| | | | Total Investments (cost $54,784,644) – 100.1% | | | | | | | | | | | | | | | 54,170,408 | |
| | | | Other Assets Less Liabilities – (0.1)% | | | | | | | | | | | | | | | (35,695) | |
| | | | Net Assets – 100% | | | | | | | | | | | | | | $ | 54,134,713 | |
NuShares Enhanced Yield U.S. Aggregate Bond ETF (NUAG) (continued)
| | |
| Portfolio of Investments | | July 31, 2017 |
For Fund portfolio compliance purposes, the Fund’s industry classifications refer to any one or more of the industry sub-classifications used by one or more widely recognized market indexes or ratings group indexes, and/or as defined by Fund management. This definition may not apply for purposes of this report, which may combine industry sub-classifications into sectors for reporting ease.
| (1) | All percentages shown in the Portfolio of Investments are based on net assets. |
| (2) | The ratings disclosed reflects net exposure to credit ratings by one or more of the following national rating agencies: Standard & Poor’s (S&P), Moody’s Investors Service, Inc. (Moody’s) or Fitch, Inc. (Fitch). If there are multiple ratings for a security, the average rating is used, with evenly split ratings being rounded down to the lower rating, which is the method used by the Index. Credit ratings are subject to change. AAA, AA, A and BBB are investment grade ratings; BB, B, CCC, CC, C and D are below investment grade ratings. Holdings designated N/R are not rated by these national rating agencies. Ratings are not covered by the report of independent registered public accounting firm. |
| (3) | Optional Call Provisions: Dates (month and year) and prices of the earliest optional call or redemption. There may be other call provisions at varying prices at later dates. Certain mortgage-backed securities may be subject to periodic principal paydowns. Optional Call Provisions are not covered by the report of independent registered public accounting firm. |
| 144A | Investment is exempt from registration under Rule 144A of the Securities Act of 1933, as amended. These investments may only be resold in transactions exempt from registration, which are normally those transactions with qualified institutional buyers. |
| REIT | Real Estate Investment Trust |
| (WI/DD) | Investment, or portion of investment, purchased on a when-issued or delayed delivery basis. |
See accompanying notes to financial statements.
NuShares Enhanced Yield 1-5 Year U.S. Aggregate Bond ETF (NUSA)
| | |
| Portfolio of Investments | | July 31, 2017 |
| | | | | | | | | | | | | | | | | | | | |
Principal
Amount (000) | | | Description (1) | | Coupon | | | Maturity | | | Ratings (2) | | | Value | |
| | | | | |
| | | | LONG-TERM INVESTMENTS – 98.5% | | | | | | | | | | | | | | | | |
| | | | | |
| | | | CORPORATE DEBT – 51.1% | | | | | | | | | | | | | | | | |
| | | | | |
| | | | Financials – 31.9% | | | | | | | | | | | | |
| | | | | |
| $ | 168 | | | Air Lease Corporation | | | 4.750% | | | | 3/01/20 | | | | BBB | | | $ | 178,597 | |
| | | | | |
| | 72 | | | Allied World Assurance Holdings Limited | | | 5.500% | | | | 11/15/20 | | | | BBB | | | | 78,266 | |
| | | | | |
| | 240 | | | American Express Credit Corporation | | | 2.250% | | | | 5/05/21 | | | | A | | | | 240,396 | |
| | | | | |
| | 348 | | | American International Group, Inc. | | | 3.375% | | | | 8/15/20 | | | | BBB+ | | | | 360,370 | |
| | | | | |
| | 84 | | | Ameriprise Financial, Inc. | | | 5.300% | | | | 3/15/20 | | | | A– | | | | 90,953 | |
| | | | | |
| | 120 | | | Ares Capital Corporation | | | 4.875% | | | | 11/30/18 | | | | BBB | | | | 124,297 | |
| | | | | |
| | 204 | | | Associates Corporation of North America | | | 6.950% | | | | 11/01/18 | | | | A– | | | | 216,598 | |
| | | | | |
| | 324 | | | Bank of America Corporation | | | 2.250% | | | | 4/21/20 | | | | A– | | | | 325,412 | |
| | | | | |
| | 204 | | | Bank of America Corporation | | | 5.000% | | | | 5/13/21 | | | | A– | | | | 223,104 | |
| | | | | |
| | 84 | | | Bank of New York Mellon | | | 2.600% | | | | 2/07/22 | | | | A+ | | | | 84,773 | |
| | | | | |
| | 180 | | | BB&T Corporation | | | 2.050% | | | | 5/10/21 | | | | A | | | | 179,310 | |
| | | | | |
| | 84 | | | BlackRock Inc. | | | 4.250% | | | | 5/24/21 | | | | A+ | | | | 90,488 | |
| | | | | |
| | 72 | | | BNP Paribas | | | 5.000% | | | | 1/15/21 | | | | A+ | | | | 78,710 | |
| | | | | |
| | 204 | | | Capital One Financial Corporation | | | 2.450% | | | | 4/24/19 | | | | BBB+ | | | | 205,504 | |
| | | | | |
| | 72 | | | Capital One Financial Corporation | | | 4.750% | | | | 7/15/21 | | | | BBB+ | | | | 78,032 | |
| | | | | |
| | 204 | | | Citigroup Inc. | | | 2.700% | | | | 3/30/21 | | | | A– | | | | 206,084 | |
| | | | | |
| | 120 | | | Citizens Financial Group Inc. | | | 2.375% | | | | 7/28/21 | | | | BBB+ | | | | 119,569 | |
| | | | | |
| | 192 | | | Credit Suisse New York | | | 5.400% | | | | 1/14/20 | | | | BBB | | | | 206,313 | |
| | | | | |
| | 204 | | | Deutsche Bank AG | | | 2.500% | | | | 2/13/19 | | | | BBB | | | | 205,283 | |
| | | | | |
| | 96 | | | Fifth Third Bancorp. | | | 2.875% | | | | 7/27/20 | | | | A– | | | | 98,238 | |
| | | | | |
| | 200 | | | Fifth Third Bancorp. | | | 2.600% | | | | 6/15/22 | | | | A– | | | | 199,669 | |
| | | | | |
| | 72 | | | First Horizon National Corporation | | | 3.500% | | | | 12/15/20 | | | | BBB– | | | | 73,948 | |
| | | | | |
| | 72 | | | Franklin Resources, Inc. | | | 4.625% | | | | 5/20/20 | | | | A+ | | | | 76,904 | |
| | | | | |
| | 504 | | | Goldman Sachs Group, Inc. | | | 5.375% | | | | 3/15/20 | | | | A– | | | | 545,157 | |
| | | | | |
| | 84 | | | Hartford Financial Services Group Inc. | | | 8.125% | | | | 6/15/68 | | | | BBB– | | | | 87,990 | |
| | | | | |
| | 192 | | | HSBC Holdings PLC | | | 5.100% | | | | 4/05/21 | | | | A+ | | | | 209,781 | |
| | | | | |
| | 72 | | | Huntington BancShares Inc. | | | 3.150% | | | | 3/14/21 | | | | BBB+ | | | | 73,782 | |
| | | | | |
| | 96 | | | Intercontinental Exchange, Inc. | | | 2.750% | | | | 12/01/20 | | | | A | | | | 97,177 | |
| | | | | |
| | 348 | | | International Lease Finance Corporation | | | 6.250% | | | | 5/15/19 | | | | BBB– | | | | 373,153 | |
| | | | | |
| | 96 | | | Jefferies Group Inc. | | | 8.500% | | | | 7/15/19 | | | | BBB– | | | | 107,177 | |
| | | | | |
| | 480 | | | JPMorgan Chase & Company | | | 4.500% | | | | 1/24/22 | | | | A | | | | 522,190 | |
| | | | | |
| | 204 | | | KeyCorp. | | | 2.900% | | | | 9/15/20 | | | | BBB+ | | | | 208,393 | |
| | | | | |
| | 84 | | | Lazard Group LLC | | | 4.250% | | | | 11/14/20 | | | | BBB+ | | | | 89,189 | |
| | | | | |
| | 72 | | | Lincoln National Corporation | | | 6.250% | | | | 2/15/20 | | | | BBB+ | | | | 79,049 | |
NuShares Enhanced Yield 1-5 Year U.S. Aggregate Bond ETF (NUSA) (continued)
| | |
| Portfolio of Investments | | July 31, 2017 |
| | | | | | | | | | | | | | | | | | | | |
Principal
Amount (000) | | | Description (1) | | Coupon | | | Maturity | | | Ratings (2) | | | Value | |
| | | | | |
| | | | Financials (continued) | | | | | | | | | | | | |
| | | | | |
| $ | 72 | | | Lloyds Bank PLC | | | 6.375% | | | | 1/21/21 | | | | A+ | | | $ | 81,559 | |
| | | | | |
| | 252 | | | Morgan Stanley | | | 2.650% | | | | 1/27/20 | | | | A– | | | | 255,312 | |
| | | | | |
| | 252 | | | Morgan Stanley | | | 2.625% | | | | 11/17/21 | | | | A– | | | | 252,903 | |
| | | | | |
| | 96 | | | MUFG Americas Holdings Corporation | | | 2.250% | | | | 2/10/20 | | | | A | | | | 96,408 | |
| | | | | |
| | 84 | | | NASDAQ Stock Market Inc. | | | 5.550% | | | | 1/15/20 | | | | BBB | | | | 90,923 | |
| | | | | |
| | 144 | | | Nomura Holdings Incorporated | | | 6.700% | | | | 3/04/20 | | | | BBB+ | | | | 159,800 | |
| | | | | |
| | 84 | | | Northern Trust Company | | | 3.375% | | | | 8/23/21 | | | | A+ | | | | 87,578 | |
| | | | | |
| | 180 | | | PNC Funding Corporation | | | 3.300% | | | | 3/08/22 | | | | A | | | | 187,739 | |
| | | | | |
| | 108 | | | Prudential Financial Inc. | | | 8.875% | | | | 6/15/68 | | | | BBB | | | | 114,102 | |
| | | | | |
| | 168 | | | Rabobank Nederland | | | 4.500% | | | | 1/11/21 | | | | AA– | | | | 181,048 | |
| | | | | |
| | 72 | | | Raymond James Financial Inc. | | | 8.600% | | | | 8/15/19 | | | | BBB+ | | | | 81,277 | |
| | | | | |
| | 72 | | | Regions Financial Corporation | | | 3.200% | | | | 2/08/21 | | | | BBB | | | | 73,792 | |
| | | | | |
| | 84 | | | Reinsurance Group of America Inc. | | | 6.450% | | | | 11/15/19 | | | | BBB+ | | | | 92,233 | |
| | | | | |
| | 96 | | | Santander Holdings USA, Inc. | | | 2.700% | | | | 5/24/19 | | | | BBB | | | | 96,855 | |
| | | | | |
| | 216 | | | Santander UK PLC | | | 2.375% | | | | 3/16/20 | | | | A+ | | | | 218,230 | |
| | | | | |
| | 108 | | | State Street Bank & Trust | | | 5.250% | | | | 10/15/18 | | | | A+ | | | | 112,552 | |
| | | | | |
| | 72 | | | Stifel Financial Corporation | | | 3.500% | | | | 12/01/20 | | | | BBB- | | | | 74,042 | |
| | | | | |
| | 144 | | | Sumitomo Mitsui Financial Group, Inc. | | | 2.934% | | | | 3/09/21 | | | | A | | | | 146,582 | |
| | | | | |
| | 156 | | | SunTrust Banks Inc. | | | 2.900% | | | | 3/03/21 | | | | BBB+ | | | | 158,915 | |
| | | | | |
| | 60 | | | SVB Financial Group | | | 5.375% | | | | 9/15/20 | | | | BBB+ | | | | 65,377 | |
| | | | | |
| | 180 | | | Synchrony Financial | | | 3.000% | | | | 8/15/19 | | | | BBB– | | | | 182,898 | |
| | | | | |
| | 72 | | | Synovus Financial Corp. | | | 7.875% | | | | 2/15/19 | | | | BBB– | | | | 77,962 | |
| | | | | |
| | 180 | | | US Bancorp | | | 2.625% | | | | 1/24/22 | | | | AA– | | | | 182,589 | |
| | | | | |
| | 156 | | | Wells Fargo & Company | | | 3.500% | | | | 3/08/22 | | | | A+ | | | | 162,562 | |
| | | | | |
| | 252 | | | Westpac Banking Corporation | | | 2.000% | | | | 8/19/21 | | | | AA– | | | | 249,039 | |
| | 9,212 | | | Total Financials | | | | | | | | | | | | | | | 9,616,133 | |
| | | | | |
| | | | Industrial – 12.0% | | | | | | | | | | | | |
| | | | | |
| | 72 | | | Agilent Technologies Inc. | | | 5.000% | | | | 7/15/20 | | | | BBB+ | | | | 77,398 | |
| | | | | |
| | 144 | | | Anheuser Busch InBev | | | 7.750% | | | | 1/15/19 | | | | BBB+ | | | | 156,411 | |
| | | | | |
| | 168 | | | AT&T, Inc. | | | 3.800% | | | | 3/15/22 | | | | BBB+ | | | | 175,647 | |
| | | | | |
| | 84 | | | Becton Dickinson & Company | | | 3.125% | | | | 11/08/21 | | | | BBB | | | | 85,885 | |
| | | | | |
| | 72 | | | Boston Scientific Corporation | | | 6.000% | | | | 1/15/20 | | | | BBB | | | | 78,583 | |
| | | | | |
| | 84 | | | Buckeye Partners LP | | | 2.650% | | | | 11/15/18 | | | | BBB– | | | | 84,482 | |
| | | | | |
| | 84 | | | Celulosa Arauco Y Constitucion | | | 5.000% | | | | 1/21/21 | | | | BBB– | | | | 89,101 | |
| | | | | |
| | 84 | | | Columbia Pipeline Group, Inc. | | | 3.300% | | | | 6/01/20 | | | | BBB | | | | 86,286 | |
| | | | | |
| | 72 | | | CSX Corporation | | | 4.250% | | | | 6/01/21 | | | | BBB+ | | | | 76,992 | |
| | | | | |
| | 120 | | | CVS Health Corporation | | | 4.125% | | | | 5/15/21 | | | | BBB+ | | | | 127,354 | |
| | | | | |
| | 72 | | | D.R. Horton, Inc. | | | 4.000% | | | | 2/15/20 | | | | BBB– | | | | 74,880 | |
| | | | | | | | | | | | | | | | | | | | |
Principal
Amount (000) | | | Description (1) | | Coupon | | | Maturity | | | Ratings (2) | | | Value | |
| | | | | |
| | | | Industrial (continued) | | | | | | | | | | | | |
| | | | | |
| $ | 84 | | | Delphi Automotive PLC | | | 3.150% | | | | 11/19/20 | | | | BBB | | | $ | 86,071 | |
| | | | | |
| | 84 | | | eBay Inc. | | | 2.875% | | | | 8/01/21 | | | | BBB+ | | | | 85,289 | |
| | | | | |
| | 72 | | | EcoPetrol SA | | | 7.625% | | | | 7/23/19 | | | | BBB | | | | 79,056 | |
| | | | | |
| | 72 | | | Enable Midstream Partners LP | | | 2.400% | | | | 5/15/19 | | | | BBB– | | | | 71,818 | |
| | | | | |
| | 180 | | | Ford Motor Company | | | 6.500% | | | | 8/01/18 | | | | BBB | | | | 188,160 | |
| | | | | |
| | 84 | | | Fortive Corporation | | | 2.350% | | | | 6/15/21 | | | | BBB | | | | 83,721 | |
| | | | | |
| | 84 | | | General Motors Financial Company Inc. | | | 4.375% | | | | 9/25/21 | | | | BBB | | | | 88,873 | |
| | | | | |
| | 84 | | | Laboratory Corporation of America Holdings | | | 4.625% | | | | 11/15/20 | | | | BBB | | | | 89,748 | |
| | | | | |
| | 72 | | | Life Technologies Corporation | | | 6.000% | | | | 3/01/20 | | | | BBB | | | | 78,461 | |
| | | | | |
| | 84 | | | Magellan Midstream Partners LP | | | 4.250% | | | | 2/01/21 | | | | BBB+ | | | | 88,952 | |
| | | | | |
| | 84 | | | McDonald’s Corporation | | | 2.625% | | | | 1/15/22 | | | | BBB+ | | | | 85,101 | |
| | | | | |
| | 72 | | | National Fuel Gas Company | | | 6.500% | | | | 4/15/18 | | | | BBB | | | | 74,377 | |
| | | | | |
| | 84 | | | Norfolk Southern Corporation | | | 3.250% | | | | 12/01/21 | | | | BBB+ | | | | 86,892 | |
| | | | | |
| | 72 | | | Petro Canada | | | 6.050% | | | | 5/15/18 | | | | BBB+ | | | | 74,342 | |
| | | | | |
| | 156 | | | Petroleos Mexicanos | | | 3.500% | | | | 7/23/20 | | | | BBB | | | | 159,432 | |
| | | | | |
| | 72 | | | Phillips 66 Partners LP | | | 2.646% | | | | 2/15/20 | | | | BBB– | | | | 72,361 | |
| | | | | |
| | 72 | | | Pioneer Natural Resources Company | | | 7.500% | | | | 1/15/20 | | | | BBB | | | | 80,861 | |
| | | | | |
| | 72 | | | Quest Diagnostics Inc. | | | 4.700% | | | | 4/01/21 | | | | BBB | | | | 77,636 | |
| | | | | |
| | 72 | | | RELX Capital, Inc. | | | 8.625% | | | | 1/15/19 | | | | BBB+ | | | | 78,493 | |
| | | | | |
| | 72 | | | Roper Technologies, Inc. | | | 2.800% | | | | 12/15/21 | | | | BBB– | | | | 72,798 | |
| | | | | |
| | 72 | | | Southern Natural Gas Company LLC and Southern Natural Issuing Corporation | | | 4.400% | | | | 6/15/21 | | | | BBB+ | | | | 76,450 | |
| | | | | |
| | 72 | | | Spirit AeroSystems Inc. | | | 5.250% | | | | 3/15/22 | | | | BBB– | | | | 74,797 | |
| | | | | |
| | 84 | | | The Western Union Company | | | 5.253% | | | | 4/01/20 | | | | BBB | | | | 89,526 | |
| | | | | |
| | 72 | | | Valero Energy Corporation | | | 6.125% | | | | 2/01/20 | | | | BBB | | | | 78,912 | |
| | | | | |
| | 216 | | | Verizon Communications | | | 2.946% | | | | 3/15/22 | | | | BBB+ | | | | 218,211 | |
| | | | | |
| | 84 | | | Western Gas Partners LP | | | 2.600% | | | | 8/15/18 | | | | BBB– | | | | 84,282 | |
| | | | | |
| | 72 | | | Xylem Inc. | | | 4.875% | | | | 10/01/21 | | | | BBB | | | | 78,471 | |
| | 3,456 | | | Total Industrial | | | | | | | | | | | | | | | 3,616,110 | |
| | | | | |
| | | | Utility – 7.2% | | | | | | | | | | | | |
| | | | | |
| | 96 | | | Ameren Corporation | | | 2.700% | | | | 11/15/20 | | | | BBB+ | | | | 97,515 | |
| | | | | |
| | 132 | | | Appalachian Power Company | | | 4.600% | | | | 3/30/21 | | | | BBB+ | | | | 142,176 | |
| | | | | |
| | 96 | | | CenterPoint Energy Resources Corporation | | | 4.500% | | | | 1/15/21 | | | | BBB+ | | �� | | 101,451 | |
| | | | | |
| | 108 | | | Consolidated Edison, Inc. | | | 2.000% | | | | 5/15/21 | | | | BBB+ | | | | 107,116 | |
| | | | | |
| | 180 | | | Duke Energy Corporation | | | 3.550% | | | | 9/15/21 | | | | BBB+ | | | | 187,882 | |
| | | | | |
| | 120 | | | Entergy Corporation | | | 5.125% | | | | 9/15/20 | | | | BBB | | | | 129,630 | |
| | | | | |
| | 96 | | | Eversource Energy | | | 2.750% | | | | 3/15/22 | | | | BBB+ | | | | 96,991 | |
| | | | | |
| | 96 | | | LG&E and KU Energy LLC | | | 3.750% | | | | 11/15/20 | | | | BBB+ | | | | 100,166 | |
| | | | | |
| | 96 | | | National Rural Utilities Cooperative Finance Corporation | | | 3.050% | | | | 2/15/22 | | | | A+ | | | | 99,168 | |
NuShares Enhanced Yield 1-5 Year U.S. Aggregate Bond ETF (NUSA) (continued)
| | |
| Portfolio of Investments | | July 31, 2017 |
| | | | | | | | | | | | | | | | | | | | |
Principal
Amount (000) | | | Description (1) | | Coupon | | | Maturity | | | Ratings (2) | | | Value | |
| | | | | |
| | | | Utility (continued) | | | | | | | | | | | | |
| | | | | |
| $ | 84 | | | NextEra Energy Capital Holding Inc. | | | 4.500% | | | | 6/01/21 | | | | BBB+ | | | $ | 90,050 | |
| | | | | |
| | 96 | | | Pacific Gas and Electric Company | | | 4.250% | | | | 5/15/21 | | | | A | | | | 102,055 | |
| | | | | |
| | 132 | | | PacifiCorp. | | | 2.950% | | | | 2/01/22 | | | | A+ | | | | 135,566 | |
| | | | | |
| | 96 | | | PSE&G Power LLC | | | 5.125% | | | | 4/15/20 | | | | BBB+ | | | | 102,727 | |
| | | | | |
| | 84 | | | Sempra Energy | | | 2.850% | | | | 11/15/20 | | | | BBB+ | | | | 85,538 | |
| | | | | |
| | 103 | | | Southern California Edison Company | | | 1.845% | | | | 2/01/22 | | | | A+ | | | | 101,857 | |
| | | | | |
| | 204 | | | The Southern Company | | | 2.350% | | | | 7/01/21 | | | | BBB+ | | | | 203,432 | |
| | | | | |
| | 108 | | | Virginia Electric and Power Co | | | 2.950% | | | | 1/15/22 | | | | A– | | | | 110,687 | |
| | | | | |
| | 180 | | | Xcel Energy Inc. | | | 2.400% | | | | 3/15/21 | | | | BBB+ | | | | 181,046 | |
| | 2,107 | | | Total Utility | | | | | | | | | | | | | | | 2,175,053 | |
| $ | 14,775 | | | Total Corporate Debt (cost $15,358,870) | | | | | | | | | | | | | | | 15,407,296 | |
| | | | | |
Principal
Amount (000) | | | Description (1) | | Coupon | | | Maturity | | | Ratings (2) | | | Value | |
| | | | | |
| | | | U.S. TREASURY – 22.3% | | | | | | | | | | | | | | | | |
| | | | | |
| $ | 1,352 | | | U.S. Treasury Notes | | | 1.125% | | | | 2/28/19 | | | | AAA | | | $ | 1,348,144 | |
| | | | | |
| | 500 | | | U.S. Treasury Notes | | | 1.250% | | | | 4/30/19 | | | | AAA | | | | 499,219 | |
| | | | | |
| | 1,716 | | | U.S. Treasury Notes | | | 1.375% | | | | 2/15/20 | | | | AAA | | | | 1,713,387 | |
| | | | | |
| | 1,608 | | | U.S. Treasury Notes | | | 1.625% | | | | 3/15/20 | | | | AAA | | | | 1,615,538 | |
| | | | | |
| | 540 | | | U.S. Treasury Notes | | | 1.875% | | | | 2/28/22 | | | | AAA | | | | 542,004 | |
| | | | | |
| | 1,000 | | | U.S. Treasury Notes | | | 1.750% | | | | 6/30/22 | | | | AAA | | | | 996,094 | |
| $ | 6,716 | | | Total U.S. Treasury (cost $6,706,987) | | | | | | | | | | | | | | | 6,714,386 | |
| | | | | |
Principal
Amount (000) | | | Description (1) | | Coupon | | | Maturity | | | Ratings (2) | | | Value | |
| | | | | |
| | | | SECURITIZED – 25.1% | | | | | | | | | | | | | | | | |
| | | | | |
| $ | 1,000 | | | AmeriCredit Automobile Receivables Trust, Series 2015-2 | | | 1.820% | | | | 7/08/20 | | | | AAA | | | $ | 1,000,533 | |
| | | | | |
| | 1,325 | | | Commercial Mortgage Pass-Through Certificates 2015-CR22 | | | 2.856% | | | | 3/10/48 | | | | AAA | | | | 1,350,837 | |
| | | | | |
| | 3,364 | | | Freddie Mac Gold Mortgage Pool G18642 | | | 3.500% | | | | 4/01/32 | | | | AAA | | | | 3,515,590 | |
| | | | | |
| | 675 | | | JPMorgan Chase Commercial Mortgage Securities Corporation, Commercial Mortgage Pass-Through Certificates, Series 2015-C28 | | | 2.773% | | | | 10/15/48 | | | | Aaa | | | | 687,540 | |
| | | | | |
| | 500 | | | Santander Drive Auto Receivables Trust, Series 2014-2 | | | 2.760% | | | | 2/18/20 | | | | AAA | | | | 504,695 | |
| | | | | |
| | 500 | | | Santander Drive Auto Receivables Trust, Series 2016-3 | | | 1.500% | | | | 8/17/20 | | | | AAA | | | | 499,301 | |
| $ | 7,364 | | | Total Securitized (cost $7,561,226) | | | | | | | | | | | | | | | 7,558,496 | |
| | | | Total Long-Term Investments (cost $29,627,083) | | | | | | | | | | | | | | | 29,680,178 | |
| | | | | | | | | | | | | | | | | | | | |
Principal
Amount (000) | | | Description (1) | | Coupon | | | Maturity | | | Ratings (2) | | | Value | |
| | | | | |
| | | | SHORT-TERM INVESTMENTS – 0.8% | | | | | | | | | | | | | | | | |
| | | | | |
| | | | GOVERNMENT RELATED – 0.8% | | | | | | | | | | | | | | | | |
| | | | | |
| $ | 250 | | | Federal Farm Credit Bank, Discount Notes | | | 0.000% | | | | 8/01/17 | | | | N/R | | | $ | 250,000 | |
| $ | 250 | | | Total Short-Term Investments (cost $250,000) | | | | | | | | | | | | | | | 250,000 | |
| | | | Total Investments (cost $29,877,083) – 99.3% | | | | | | | | | | | | | | | 29,930,178 | |
| | | | Other Assets Less Liabilities – 0.7% | | | | | | | | | | | | | | | 202,266 | |
| | | | Net Assets – 100% | | | | | | | | | | | | | | $ | 30,132,444 | |
For Fund portfolio compliance purposes, the Fund’s industry classifications refer to any one or more of the industry sub-classifications used by one or more widely recognized market indexes or ratings group indexes, and/or as defined by Fund management. This definition may not apply for purposes of this report, which may combine industry sub-classifications into sectors for reporting ease.
| (1) | All percentages shown in the Portfolio of Investments are based on net assets. |
| (2) | The ratings disclosed reflects net exposure to credit ratings by one or more of the following national rating agencies: Standard & Poor’s (S&P), Moody’s Investors Service, Inc. (Moody’s) or Fitch, Inc. (Fitch). If there are multiple ratings for a security, the average rating is used, with evenly split ratings being rounded down to the lower rating, which is the method used by the Index. Credit ratings are subject to change. AAA, AA, A and BBB are investment grade ratings; BB, B, CCC, CC, C and D are below investment grade ratings. Holdings designated N/R are not rated by these national rating agencies. Ratings are not covered by the report of independent registered public accounting firm. |
See accompanying notes to financial statements.
Statement of
| | | | |
| | Assets and Liabilities | | July 31, 2017 |
| | | | | | | | |
| | | NUAG | | | NUSA | |
Assets | | | | | | | | |
Long-term investments, at value (cost $54,234,644 and $29,627,083, respectively) | | $ | 53,620,408 | | | $ | 29,680,178 | |
Short-term investments, at value (cost approximates value) | | | 550,000 | | | | 250,000 | |
Cash | | | 20,565 | | |
| 4,419
|
|
Receivable for interest | | | 352,994 | | | | 203,045 | |
Total assets | | | 54,543,967 | | |
| 30,137,642
|
|
Liabilities | | | | | | | | |
Payable for investments purchased | | | 399,784 | | |
| —
|
|
Accrued expenses: | | | | | | | | |
Management fees | | | 8,463 | | |
| 4,778
|
|
Professional fees | | | 301 | | |
| 178
|
|
Trustees fees | | | 706 | | |
| 242
|
|
Total liabilities | | | 409,254 | | |
| 5,198
|
|
Net assets | | $ | 54,134,713 | | | $ | 30,132,444 | |
Shares outstanding | | | 2,200,000 | | | | 1,200,000 | |
Net asset value (“NAV”) per share | | $ | 24.61 | | | $ | 25.11 | |
Net assets consist of: | | | | | | | | |
Capital paid-in | | $ | 54,845,369 | | | $ | 30,000,000 | |
Undistributed (Over-distribution of) net investment income | | | 37,258 | | | | 81,089 | |
Accumulated net realized gain (loss) | | | (133,678 | ) | | | (1,740 | ) |
Net unrealized appreciation (depreciation) | | | (614,236 | ) | | | 53,095 | |
Net assets | | $ | 54,134,713 | | | $ | 30,132,444 | |
Authorized shares | | | Unlimited | | | | Unlimited | |
Par value per share | | $ | 0.01 | | | $ | 0.01 | |
See accompanying notes to financial statements.
| | | | | | | | |
| | | NUAG* | | | NUSA** | |
Investment Income (net of tax witheld of $95 and $—, respectively) | | $ | 1,257,763 | | | $ | 298,213 | |
Expenses | | | | | | | | |
Management fees | | | 87,326 | | | | 19,784 | |
Professional fees | | | 465 | | | | 178 | |
Trustees fees | | | 1,286 | | | | 241 | |
Total expenses | | | 89,077 | | | | 20,203 | |
Net investment income (loss) | | | 1,168,686 | | | | 278,010 | |
Realized and Unrealized Gain (Loss) | | | | | | | | |
Net realized gain (loss) from: | | | | | | | | |
Investments | | | (123,476 | ) | | | (1,381 | ) |
In-kind redemptions | | | (22,001 | ) | | | — | |
Change in net unrealized appreciation (depreciation) of investments | | | (614,236 | ) | | | 53,095 | |
Net realized and unrealized gain (loss) | | | (759,713 | ) | | | 51,714 | |
Net increase (decrease) in net assets from operations | | $ | 408,973 | | | $ | 329,724 | |
| * | For the period September 14, 2016 (commencement of operations) through July 31, 2017. |
| ** | For the period March 31, 2017 (commencement of operations) through July 31, 2017. |
See accompanying notes to financial statements.
Statement of
| | | | | | | | |
| | | NUAG* | | | NUSA** | |
Operations | | | | | | | | |
Net investment income (loss) | | $ | 1,168,686 | | | $ | 278,010 | |
Net realized gain (loss) from: | | | | | | | | |
Investments | | | (123,476 | ) | | | (1,381 | ) |
In-kind redemptions | | | (22,001 | ) | | | — | |
Change in net unrealized appreciation (depreciation) of investments | | | (614,236 | ) | |
| 53,095
|
|
Net increase (decrease) in net assets from operations | | | 408,973 | | | | 329,724 | |
Distributions to Shareholders | | | | | | | | |
From net investment income | | | (1,132,030 | ) | | | (197,280 | ) |
From accumulated net realized gains | | | (9,600 | ) | | | — | |
Decrease in net assets from distributions to shareholders | | | (1,141,630 | ) | | | (197,280 | ) |
Fund Share Transactions | | | | | | | | |
Proceeds from shares sold | | | 59,751,450 | | |
| 30,000,000
|
|
Cost of shares redeemed | |
| (4,884,080
| )
| |
| —
|
|
Net increase (decrease) in net assets from Fund share transactions | | | 54,867,370 | | | | 30,000,000 | |
Net increase (decrease) in net assets | | | 54,134,713 | | | | 30,132,444 | |
Net assets at the beginning of period | | | — | | |
| —
|
|
Net assets at the end of period | | $ | 54,134,713 | | | $ | 30,132,444 | |
Undistributed (Over-distribution of) net investment income at the end of period | | $ | 37,258 | | | $ | 81,089 | |
| * | For the period September 14, 2016 (commencement of operations) through July 31, 2017. |
| ** | For the period March 31, 2017 (commencement of operations) through July 31, 2017. |
See accompanying notes to financial statements.
THIS PAGE INTENTIONALLY LEFT BLANK
Financial
Highlights
Selected data for a share outstanding throughout the period:
| | | | | | | | | | | | | | | | | | | | | | | | | | | | | | | | | | | | | | | | |
| | | | | | |
| | | | | | Investment Operations | | | | | | Less Distributions | | | | | | | |
| | | | | | | | | | |
Year Ended
July 31, | | Beginning
NAV | | | Net
Investment
Income
(Loss)(a) | | | Net
Realized/
Unrealized
Gain (Loss) | | | Total | | | | | | From
Net
Investment
Income | | | From
Accumulated
Net Realized
Gains | | | Total | | | Ending
NAV | | | Ending
Market
Price | |
NUAG | | | | | | | | | | | | | | | | | | | | | | | | | | | | | | | | | | | | | | | | |
2017(c) | | $ | 25.00 | | | $ | 0.57 | | | $ | (0.40 | ) | | $ | 0.17 | | | | | | | $ | (0.56 | ) | | $ | — | ** | | $ | (0.56 | ) | | $ | 24.61 | | | $ | 24.67 | |
NUSA | | | | | | | | | | | | | | | | | | | | | | | | | | | | | | | | | | | | | | | | |
2017(d) | | | 25.00 | | | | 0.23 | | | | 0.04 | | | | 0.27 | | | | | | | | (0.16 | ) | | | — | | | | (0.16 | ) | | | 25.11 | | | | 25.15 | |
| | | | | | | | | | | | | | | | | | | | | | | | | | | | | | | | | | | | | | |
| | | | | | | | | | | | | Ratios/Supplemental Data | |
| | | | Total Return | | | | | | | | | | | | Ratios to Average Net Assets | | | | | | | |
| | | | | | | | | |
| | | | Based on NAV(b) | | | Based on Market
Price(b) | | | | | | Ending
Net
Assets
(000) | | | | | | Expenses | | | Net
Investment
Income
(Loss) | | | | | | Portfolio
Turnover
Rate(e) | |
| | | | | | | | | | | | | | | | | | | | | | | | | | | | | | | | | | | | | | |
| | | | | | 0.74 | % | | | 1.00 | % | | | | | | $ | 54,135 | | | | | | | | 0.20 | %* | | | 2.67 | %* | | | | | | | 84 | % |
| | | | | | | | | | | | | | | | | | | | | | | | | | | | | | | | | | | | | | |
| | | | | | 1.10 | | | | 1.26 | | | | | | | | 30,132 | | | | | | | | 0.20 | * | | | 2.74 | * | | | | | | | 4 | |
| (a) | Per share Net Investment Income (Loss) is calculated using the average daily shares method. | |
| (b) | Total Return Based on NAV reflects the change in NAV over the period, including the assumed reinvestment of distributions, if any, at NAV on each ex-dividend payment date during the period. Total Return Based on Market Price reflects the change in the market price per share over the period, including the assumed reinvestment of distributions, if any, at the ending market price per share on each ex-dividend payment date during the period. Total returns are not annualized. | |
| (c) | For the period September 14, 2016 (commencement of operations) through July 31, 2017. | |
| (d) | For the period March 31, 2017 (commencement of operations) through July 31, 2017. | |
| (e) | Portfolio Turnover Rate is calculated based on the lesser of long-term purchases or sales (as disclosed in Note 5 – Investment Transactions) divided by the average long-term market value during the period. Portfolio Turnover Rate excludes securities received or delivered as a result of processing in-kind creations or redemptions of Fund shares (as disclosed in Note 4 – Fund Shares). | |
| ** | Rounds to less than $0.01 per share. | |
See accompanying notes to financial statements.
Notes to
Financial Statements
1. General Information and Significant Accounting Policies
General Information
Trust and Fund Information
NuShares ETF Trust (the “Trust”) is an open-end management investment company registered under the Investment Company Act of 1940, as amended (the “1940 Act”). The Trust is comprised of NuShares Enhanced Yield U.S. Aggregate Bond ETF (NUAG) and NuShares Enhanced Yield 1-5 Year U.S. Aggregate Bond ETF (NUSA) (each a “Fund” and collectively, the “Funds”), as non-diversified funds, among others. The Trust was organized as a Massachusetts business trust on February 20, 2015. Shares of the Funds are listed and traded on the NYSE Arca (the “Exchange”).
The end of the reporting period for the Funds is July 31, 2017, and the period covered by these Notes to Financial Statements is September 14, 2016 (commencement of operations) through July 31, 2017 and March 31,2017 (commencement of operations) through July 31, 2017 for NUAG and NUSA, respectively (“the current fiscal period”).
Investment Adviser
The Funds’ investment adviser is Nuveen Fund Advisors, LLC (the “Adviser”), a subsidiary of Nuveen, LLC. (“Nuveen”). Nuveen is the investment management arm of Teachers Insurance and Annuity Association of America (TIAA). The Adviser has overall responsibility for management of the Funds, oversees the management of the Funds’ portfolios, manages the Funds’ business affairs and provides certain clerical, bookkeeping and other administrative services. The Adviser has entered into sub-advisory agreements with Teachers Advisors, LLC (the “Sub-Adviser”), an affiliate of the Adviser, under which the Sub-Adviser manages the investment portfolios of the Funds.
Investment Objectives
NUAG seeks to track the investment results, before fees and expenses, of the BofA Merrill Lynch Enhanced Yield U.S. Broad Bond Index. NUSA seeks to track the investment results before fees and expenses, of the BofA Merrill Lynch Enhanced Yield 1-5 year U.S. Broad Bond Index.
The Funds’ most recent prospectus provides further description of the Fund’s investment objective, principal investment strategies and principal risks.
Significant Accounting Policies
Each Fund is an investment company and follows accounting and reporting guidance under Financial Accounting Standards Board (FASB) Accounting Standards Codification (ASC) Topic 946 “Financial Services – Investment Companies.” The following is a summary of significant accounting policies followed by the Funds in the preparation of their financial statements in accordance with U.S. generally accepted accounting principles (“U.S. GAAP”).
Investment Transactions
Investment transactions are recorded on a trade date basis. Realized gains and losses from investment transactions are determined on the specific identification method, which is the same basis used for federal income tax purposes. Investments purchased on a when-issued/delayed delivery basis may have extended settlement periods. Any investments so purchased are subject to market fluctuation during this period. The Funds have earmarked securities in their portfolios with a current value at least equal to the amount of the when-issued/delayed delivery purchase commitments.
As of the end of the reporting period, the following Fund’s outstanding when-issued/delayed delivery purchase commitments were as follows:
| | | | |
| | | NUAG | |
| Outstanding when-issued/delayed delivery purchase commitments | | $ | 399,784 | |
Investment Income
Investment income, which reflects the amortization of premiums and includes accretion of discounts for financial reporting purposes, is recorded on an accrual basis. Interest income also reflects paydown gains and losses, if any.
Professional Fees
Professional fees presented on the Statement of Operations consist of fees and expenses of legal counsel to the Funds’ Board of Trustees (the “Board”).
Dividends and Distributions to Shareholders
Dividends from net investment income, if any, are declared and distributed to shareholders monthly.
Net realized capital gains from investment transactions, if any, are declared and distributed to shareholders at least annually. Furthermore, capital gains are distributed only to the extent they exceed available capital loss carryforwards.
Distributions to shareholders are recorded on the ex-dividend date. The amount and timing of distributions are determined in accordance with federal income tax regulations, which may differ from U.S. GAAP.
Compensation
The Trust pays no compensation directly to those of its trustees who are affiliated with the Adviser or to its officers, all of whom receive remuneration for their services to the Trust from the Adviser or its affiliates. The Board has adopted a deferred compensation plan for independent trustees that enables trustees to elect to defer receipt of all or a portion of the annual compensation they are entitled to receive from certain Nuveen-advised funds. Under the plan, deferred amounts are treated as though equal dollar amounts had been invested in shares of select Nuveen-advised funds.
Indemnifications
Under the Trust’s organizational documents, its officers and trustees are indemnified against certain liabilities arising out of the performance of their duties to the Trust. In addition, in the normal course of business, the Trust enters into contracts that provide general indemnifications to other parties. The Trust’s maximum exposure under these arrangements is unknown as this would involve future claims that may be made against the Trust that have not yet occurred. However, the Trust has not had prior claims or losses pursuant to these contracts and expects the risk of loss to be remote.
Use of Estimates
The preparation of financial statements in conformity with U.S. GAAP requires management to make estimates and assumptions that affect the reported amounts of assets and liabilities at the date of the financial statements and the reported amounts of increases and decreases in net assets from operations during the reporting period. Actual results may differ from those estimates.
2. Investment Valuation and Fair Value Measurements
The fair valuation input levels as described below are for fair value measurement purposes.
Fair value is defined as the price that would be received upon selling an investment or transferring a liability in an orderly transaction to an independent buyer in the principal or most advantageous market for the investment. A three-tier hierarchy is used to maximize the use of observable market data and minimize the use of unobservable inputs and to establish classification of fair value measurements for disclosure purposes. Observable inputs reflect the assumptions market participants would use in pricing the asset or liability. Observable inputs are based on market data obtained from sources independent of the reporting entity. Unobservable inputs reflect the reporting entity’s own assumptions about the assumptions market participants would use in pricing the asset or liability. Unobservable inputs are based on the best information available in the circumstances. The following is a summary of the three-tiered hierarchy of valuation input levels.
| | |
| Level 1 – | | Inputs are unadjusted and prices are determined using quoted prices in active markets for identical securities. |
| Level 2 – | | Prices are determined using other significant observable inputs (including quoted prices for similar securities, interest rates, prepayment speeds, credit risk, etc.). |
| Level 3 – | | Prices are determined using significant unobservable inputs (including management’s assumptions in determining the fair value of investments). |
Prices of fixed-income securities are provided by an independent pricing service (“pricing service”) approved by the Board. The pricing service establishes a security’s fair value using methods that may include consideration of the following: yields or prices of investments of comparable quality, type of issue, coupon, maturity and rating, market quotes or indications of value from security dealers, evaluations of anticipated cash flows or collateral, general market conditions and other information and analysis, including the obligor’s credit characteristics considered relevant. These securities are generally classified as Level 2. In pricing certain securities, particularly less liquid and lower quality securities, the pricing service may consider information about a security, its issuer or market activity, provided by the Adviser. These securities are generally classified as Level 2 or Level 3 depending on the observability of the significant inputs.
Certain securities may not be able to be priced by the pre-established pricing methods as described above. Such securities may be valued by the Board and/or its appointee at fair value. These securities generally include, but are not limited to, restricted securities (securities which may not be publicly sold without registration under the Securities Act of 1933, as amended) for which a pricing service is unable to provide a market price; securities whose trading has been formally suspended; debt securities that have gone into default and for which there is no current market quotation; a security whose market price is not available from a pre-established pricing source; a security with respect to which an event has occurred that is likely to materially affect the value of the security after the market has closed but before the calculation of a Fund’s net asset value (“NAV”) (as may be the case in non-U.S. markets on which the security is primarily traded) or make it difficult or impossible to obtain a reliable market quotation; and a security whose price, as provided by the pricing service, is not deemed to reflect the security’s fair value. As a general principle, the fair value of a security would appear to be the amount that the owner might reasonably expect to receive for it in a current sale. A variety of factors may be considered in determining the fair value of such securities, which may include consideration of the following: yields or prices of investments of comparable quality, type of issue, coupon, maturity and rating, market quotes or indications of value from security dealers, evaluations of anticipated cash flows or collateral, general market conditions and other information and analysis, including the obligor’s credit characteristics considered relevant. These securities are generally classified as Level 2 or Level 3 depending on the observability of the significant inputs. Regardless of the method employed to value a particular security, all valuations are subject to review by the Board and/or its appointee.
Notes to Financial Statements (continued)
The inputs or methodologies used for valuing securities are not an indication of the risks associated with investing in those securities. The following is a summary of each Fund’s fair value measurements as of the end of the reporting period:
| | | | | | | | | | | | | | | | |
| NUAG | | Level 1 | | | Level 2 | | | Level 3 | | | Total | |
| Long-Term Investments* | | | | | | | | | | | | | | | | |
Corporate Debt | | $ | — | | | $ | 19,240,458 | | | $ | — | | | $ | 19,240,458 | |
Government Related | | | — | | | | 1,812,122 | | | | — | | | | 1,812,122 | |
U.S. Treasury | | | — | | | | 10,916,749 | | | | — | | | | 10,916,749 | |
Securitized | | | — | | | | 21,651,079 | | | | — | | | | 21,651,079 | |
| Short-Term Investments: | | | | | | | | | | | | | | | | |
Government Related | | | — | | | | 550,000 | | | | — | | | | 550,000 | |
| Total | | $ | — | | | $ | 54,170,408 | | | $ | — | | | $ | 54,170,408 | |
| | | | |
| NUSA | | | | | | | | | | | | |
| Long-Term Investments* | | | | | | | | | | | | | | | | |
Corporate Debt | | $ | — | | | $ | 15,407,296 | | | $ | — | | | $ | 15,407,296 | |
U.S. Treasury | | | — | | | | 6,714,386 | | | | — | | | | 6,714,386 | |
Securitized | | | — | | | | 7,558,496 | | | | — | | | | 7,558,496 | |
| Short-Term Investments: | | | | | | | | | | | | | | | | |
Government Related | | | — | | | | 250,000 | | | | — | | | | 250,000 | |
| Total | | $ | — | | | $ | 29,930,178 | | | $ | — | | | $ | 29,930,178 | |
| * | Refer to the Fund’s Portfolio of Investments for industry classifications, where applicable. |
The Board is responsible for the valuation process and has appointed the oversight of the daily valuation process to the Adviser’s Valuation Committee. The Valuation Committee, pursuant to the valuation policies and procedures adopted by the Board, is responsible for making fair value determinations, evaluating the effectiveness of the Funds’ pricing policies and reporting to the Board. The Valuation Committee is aided in its efforts by the Adviser’s dedicated Securities Valuation Team, which is responsible for administering the daily valuation process and applying fair value methodologies as approved by the Valuation Committee. When determining the reliability of independent pricing services for investments owned by the Funds, the Valuation Committee, among other things, conducts due diligence reviews of the pricing services and monitors the quality of security prices received through various testing reports conducted by the Securities Valuation Team.
The Valuation Committee will consider pricing methodologies it deems relevant and appropriate when making a fair value determination, based on the facts and circumstances specific to the portfolio instrument. Fair value determinations generally will be derived as follows, using public or private market information:
| | (i) | If available, fair value determinations shall be derived by extrapolating from recent transactions or quoted prices for identical or comparable securities. |
| | (ii) | If such information is not available, an analytical valuation methodology may be used based on other available information including, but not limited to: analyst appraisals, research reports, corporate action information, issuer financial statements and shelf registration statements. Such analytical valuation methodologies may include, but are not limited to: multiple of earnings, discount from market value of a similar freely traded security, discounted cash flow analysis, book value or a multiple thereof, risk premium/yield analysis, yield to maturity and/or fundamental investment analysis. |
The purchase price of a portfolio instrument will be used to fair value the instrument only if no other valuation methodology is available or deemed appropriate, and it is determined that the purchase price fairly reflects the instrument’s current value.
For each portfolio security that has been fair valued pursuant to the policies adopted by the Board, the fair value price is compared against the last available and next available market quotations. The Valuation Committee reviews the results of such testing and fair valuation occurrences are reported to the Board.
3. Portfolio Securities and Investments in Derivatives
Portfolio Securities
Zero Coupon Securities
A zero coupon security does not pay a regular interest coupon to its holders during the life of the security. Income to the holder of the security comes from accretion of the difference between the original purchase price of the security at issuance and the par value of the security at maturity and is effectively paid at maturity. The market prices of zero coupon securities generally are more volatile than the market prices of securities that pay interest periodically.
Investments in Derivatives
Each Fund is authorized to invest in certain derivative instruments. The Funds record derivative instruments at fair value, with changes in fair value recognized on the Statement of Operations, when applicable. Even though the Funds’ investments in derivatives may represent economic hedges, they are not considered to be hedge transactions for financial reporting purposes.
Although each Fund is authorized to invest in derivative instruments, and may do so in the future, they did not make any such investments during the current fiscal period.
Market and Counterparty Credit Risk
In the normal course of business each Fund may invest in financial instruments and enter into financial transactions where risk of potential loss exists due to changes in the market (market risk) or failure of the other party to the transaction to perform (counterparty credit risk). The potential loss could exceed the value of the financial assets recorded on the financial statements. Financial assets, which potentially expose each Fund to counterparty credit risk, consist principally of cash due from counterparties on forward, option and swap transactions, when applicable. The extent of each Fund’s exposure to counterparty credit risk in respect to these financial assets approximates their carrying value as recorded on the Statement of Assets and Liabilities.
Each Fund helps manage counterparty credit risk by entering into agreements only with counterparties the Adviser believes have the financial resources to honor their obligations and by having the Adviser monitor the financial stability of the counterparties. Additionally, counterparties may be required to pledge collateral daily (based on the daily valuation of the financial asset) on behalf of each Fund with a value approximately equal to the amount of any unrealized gain above a pre-determined threshold. Reciprocally, when each Fund has an unrealized loss, the Funds have instructed the custodian to pledge assets of the Funds as collateral with a value approximately equal to the amount of the unrealized loss above a pre-determined threshold. Collateral pledges are monitored and subsequently adjusted if and when the valuations fluctuate, either up or down, by at least the pre-determined threshold amount.
4. Fund Shares
Each Fund issues and redeems its shares on a continuous basis. Only certain institutional investors who have entered into agreements with Nuveen Securities, LLC, the Funds’ Distributor, may purchase and redeem shares directly from each Fund at NAV and in block-size of 100,000 shares (“Creation Units”) or multiples thereof. Creation Units are typically purchased and redeemed in-kind for securities included in each Fund’s respective index, but they may also be purchased and redeemed, in whole or in part, for the cash value of such securities at the Adviser’s discretion. Once created, the shares of the Funds will trade on the Exchange at market prices and are only available to individual investors through their brokers.
Transactions in Fund shares during the current fiscal period were as follows:
| | | | | | | | | | | | | | | | |
| | | NUAG | | | NUSA | |
| | | For the period 9/14/16
(commencement of operations)
through 7/31/17 | | | For the period 3/31/17
(commencement of operations)
through 7/31/17 | |
| | | Shares | | | Amount | | | Shares | | | Amount | |
| Shares sold | | | 2,400,000 | | | $ | 59,751,450 | | | | 1,200,000 | | | $ | 30,000,000 | |
| Shares redeemed | | | (200,000 | ) | | | (4,884,080 | ) | | | — | | | | — | |
| Net increase | | | 2,200,000 | | | $ | 54,867,370 | | | | 1,200,000 | | | $ | 30,000,000 | |
5. Investment Transactions
Long-term purchases and sales (including maturities, but excluding in-kind transactions) during the current fiscal period were as follows:
| | | | | | | | |
| | | NUAG | | | NUSA | |
| Purchases: | | | | | | | | |
Investment securities | | $ | 28,044,573 | | | $ | 7,885,670 | |
U.S. Government and agency obligations | | | 36,219,963 | | | | 1,493,496 | |
| Sales and maturities: | | | | | | | | |
Investment securities | | | 3,787,205 | | | | 274,466 | |
U.S. Government and agency obligations | | | 37,746,032 | | | | 996,328 | |
In-kind transactions during the current fiscal period were as follows:
| | | | | | | | |
| | | NUAG | | | NUSA | |
| In-kind purchases | | $ | 34,439,323 | | | $ | 21,522,027 | |
| In-kind sales | | | 2,669,477 | | | | — | |
Notes to Financial Statements (continued)
6. Income Tax Information
Each Fund is a separate taxpayer for federal income tax purposes. Each Fund intends to distribute substantially all of its net investment income and net capital gains to shareholders and to otherwise comply with the requirements of Subchapter M of the Internal Revenue Code applicable to regulated investment companies. Therefore, no federal income tax provision is required.
For all open tax years and all major taxing jurisdictions, management of the Funds has concluded that there are no significant uncertain tax positions that would require recognition in the financial statements. Open tax years are those that are open for examination by taxing authorities (i.e., generally the last four tax year ends and the interim tax period since then). Furthermore, management of the Funds is also not aware of any tax positions for which it is reasonably possible that the total amounts of unrecognized tax benefits will significantly change in the next twelve months.
The following information is presented on an income tax basis. Differences between amounts for financial statement and federal income tax purposes are primarily due to timing differences in recognizing certain gains and losses on investment transactions. To the extent that differences arise that are permanent in nature, such amounts are reclassified within the capital accounts as detailed below. Temporary differences do not require reclassification. Temporary and permanent differences do not impact the NAVs of the Funds.
As of July 31, 2017, the cost and unrealized appreciation (depreciation) of investments, as determined on a federal income tax basis, were as follows:
| | | | | | | | |
| | | NUAG | | | NUSA | |
| Cost of investments | | $ | 54,784,644 | | | $ | 29,877,083 | |
| Gross unrealized: | | | | | | | | |
Appreciation | | $ | 129,247 | | | $ | 87,181 | |
Depreciation | | | (743,483 | ) | | | (34,086 | ) |
| Net unrealized appreciation (depreciation) of investments | | $ | (614,236 | ) | | $ | 53,095 | |
Permanent differences, primarily due to foreign currency transactions, redemption in-kind and distribution reallocations, resulted in reclassifications among the Funds’ components of net assets as of July 31, 2017, the Funds’ tax year end, as follows:
| | | | | | | | |
| | | NUAG | | | NUSA | |
| Capital paid-in | | $ | (22,001 | ) | | $ | — | |
| Undistributed (Over-distribution of) net investment income | | | 602 | | | | 359 | |
| Accumulated net realized gain (loss) | | | 21,399 | | | | (359 | ) |
The tax components of undistributed net ordinary income and net long-term capital gains as of July 31, 2017, the Funds’ tax year end, were as follows:
| | | | | | | | |
| | | NUAG | | | NUSA | |
| Undistributed net ordinary income1 | | $ | 37,258 | | | $ | 81,089 | |
| Undistributed net long-term capital gains | | | — | | | | — | |
| 1 | Net ordinary income consists of net taxable income derived from dividends, interest, and net short-term capital gains, if any. |
The tax character of distributions paid during the Funds’ tax year ended July 31, 2017, was designated for purposes of the dividends paid deduction as follows:
| | | | | | | | |
| | | NUAG2 | | | NUSA3 | |
| Distributions from net ordinary income1 | | $ | 1,141,630 | | | $ | 197,280 | |
| Distributions from net long-term capital gains | | | — | | | | — | |
| 1 | Net ordinary income consists of net taxable income derived from dividends, interest, and net short-term capital gains, if any. |
| 2 | For the period September 14, 2016 (commencement of operations) through July 31, 2017. |
| 3 | For the period March 31, 2017 (commencement of operations) through July 31, 2017. |
As of July 31, 2017, the Funds’ tax year end, the following Fund had unused capital losses carrying forward available for federal income tax purposes to be applied against future capital gains, if any. The capital losses are not subject to expiration.
| | | | |
| | | NUSA | |
| Capital losses to be carried forward – not subject to expiration | | $ | 1,740 | |
The Funds have elected to defer late-year losses in accordance with federal income tax rules. These losses are treated as having arisen on the first day of the following fiscal year. The following Fund has elected to defer losses as follows:
| | | | |
| | | NUAG | |
| Post-October capital losses4 | | $ | 133,678 | |
| Late-year ordinary losses5 | | | — | |
| 4 | Capital losses incurred from November 1, 2016 through July 31, 2017 the Funds’ tax year end. |
| 5 | Ordinary losses incurred from January 1, 2017 through July 31, 2017 and/or specified losses incurred from November 1, 2016 through July 31, 2017. |
7. Management Fees
The annual management fee for each Fund, payable monthly, is 0.20% of the average daily net assets of each Fund. Each Fund’s management fee compensates the Adviser for investment advisory services to the Funds. The Sub-Adviser is compensated for its services to the Funds from the management fees paid to the Adviser. The Adviser is responsible for substantially all other expenses of the Funds, except any future distribution and/or service fees, interest expenses, taxes, acquired fund fees and expenses, fees incurred in acquiring and disposing of portfolio securities, fees and expenses of the independent trustees (including any trustees’ counsel fees), certain compensation expenses of the Funds’ chief compliance officer, litigation expenses and extraordinary expenses.
8. New Accounting Pronouncements
Amendments to Regulation S-X
In October 2016, the Securities and Exchange Commission (SEC) adopted new rules and amended existing rules (together, the “final rules”) intended to modernize the reporting and disclosure of information by registered investment companies. In part, the final rules amend Regulation S-X and require standardized, enhanced disclosure about derivatives in investment company financial statements, as well as other amendments. The compliance date of the amendments to Regulation S-X is August 1, 2017. Management is still evaluating the impact of the final rules, if any.
Accounting Standards Update (“ASU”) 2017-08 (“ASU 2017-08”) Premium Amortization on Purchased Callable Debt Securities
During March 2017, the Financial Accounting Standards Board (FASB) issued ASU 2017-08, which shortens the premium amortization period for purchased non-contingently callable debt securities. ASU 2017-08 specifies that the premium amortization period ends at the earliest call date, for purchased non-contingently callable debt securities. ASU 2017-08 is effective for fiscal years, and interim periods within those fiscal years, beginning after December 15, 2018. Management is currently evaluating the implications of ASU 2017-08, if any.
Additional
Fund Information (Unaudited)
| | | | | | | | | | |
| | | | | |
| | Adviser Nuveen Fund Advisors, LLC 333 West Wacker Drive Chicago, IL 60606 Sub-Adviser Teachers Advisors, LLC 730 Third Avenue New York, NY 10017-3206 | | Independent Registered
Public Accounting Firm KPMG LLP 200 East Randolph Drive Chicago, IL 60601 Administrator, Custodian and
Transfer Agent Brown Brothers Harriman 50 Post Office Square Boston, MA 02110 | | Legal Counsel Chapman and Cutler LLP Chicago, IL 60603 Morgan, Lewis & Bockius LLP 1111 Pennsylvania Avenue, NW Washington, D.C. 20004 | | | | |
| | | | | | | | | | | | | | |
| | | | | |
| | | | | | | | | | |
| | |
| | Distribution Information: Both NUAG and NUSA hereby designates 100.0% (or the maximum amount eligible) of ordinary income distributions as Interest-Related Dividends as defined in Internal Revenue Code Section 871(k)(1)(C) for the taxable year ended July 31, 2017. | | |
| | | |
| | | | | | |
| | |
| | The tables below show the number and percentage of days during the current fiscal period that each Fund’s market price was greater than its NAV per share (i.e., at a premium) and less than its NAV per share (i.e., at a discount). The market price is determined using the midpoint between the highest bid and the lowest offer on the applicable Fund’s listing exchange, as of the time that the Fund’s NAV is calculated (normally 4:00 p.m. Eastern Time). | | |
| | | | | | |
| | | | | | | | | | | NUAG | | |
| | | September 14, 2016 (commencement of operations) through July 31, 2017 | | Number of Days | | % of Total Days | | |
| | Premium/Discount Range: | | | | | | |
| | 0.26% to 0.50% | | 21 | | 9.5% | | |
| | 0.00% to 0.25% | | 172 | | 78.2% | | |
| | (0.01)% to (0.25)% | | 27 | | 12.3% | | |
| | (0.26)% to (0.50)% | | — | | 0.0% | | |
| | | | |
| | | | | | | | | | 220 | | 100% | | |
| | | | | | |
| | | | | | | | | | | NUSA | | |
| | | March 31, 2017 (commencement of operations) through July 31, 2017 | | Number of Days | | % of Total Days | | |
| | Premium/Discount Range: | | | | | | |
| | 0.26% to 0.50% | | — | | 0.0% | | |
| | 0.00% to 0.25% | | 58 | | 69.9% | | |
| | (0.01)% to (0.25)% | | 23 | | 27.7% | | |
| | (0.26)% to (0.50)% | | 2 | | 2.4% | | |
| | | | |
| | | | | | | | | | 83 | | 100% | | |
| | | | | |
| | | | | | | | | | |
| | |
| | Quarterly Form N-Q Portfolio of Investments Information: The Fund is required to file its complete schedule of portfolio holdings with the Securities and Exchange Commission (SEC) for the first and third quarters of each fiscal year on Form N-Q. You may obtain this information directly from the SEC. Visit the SEC on-line at http://www.sec.gov or in person at the SEC’s Public Reference Room in Washington, D.C. Call the SEC toll-free at (800) SEC-0330 for room hours and operation. | | |
| | | |
| | | | | | |
| | |
| | Nuveen Funds’ Proxy Voting Information: You may obtain (i) information regarding how each fund voted proxies relating to portfolio securities held during the most recent twelve-month period ended June 30, without charge, upon request, by calling Nuveen toll-free at (800) 257-8787 or on Nuveen’s website at www.nuveen.com and (ii) a description of the policies and procedures that each fund used to determine how to vote proxies relating to portfolio securities without charge, upon request, by calling Nuveen toll-free at (800) 257-8787. You may also obtain this information directly from the SEC. Visit the SEC on-line at http://www.sec.gov. | | |
| | | | | |
| | | | | | | | | | |
| | |
| | FINRA BrokerCheck: The Financial Industry Regulatory Authority (FINRA) provides information regarding the disciplinary history of FINRA member firms and associated investment professionals. This information as well as an investor brochure describing FINRA BrokerCheck is available to the public by calling the FINRA BrokerCheck Hotline number at (800) 289-9999 or by visiting www.FlNRA.org. | | |
Glossary of Terms
Used in this Report
Average Annual Total Return: This is a commonly used method to express an investment’s performance over a particular, usually multi-year time period. It expresses the return that would have been necessary each year to equal the investment’s actual cumulative performance (including change in NAV or market price and reinvested dividends and capital gains distributions, if any) over the time period being considered.
BofA/Merrill Lynch Enhanced Yield Broad Bond Index: This index provides exposure to the broad U.S. investment grade bond market. This included U.S. government and Treasury debt as well corporate bonds. The index uses a fundamental weighting scheme to generate higher yield while maintaining comparable risk. Index returns assume reinvestment of distributions, but do not include the effects of any applicable sales charges or management fees.
BofA/Merrill Lynch 1-5 Year U.S. Broad Market Index: This index consists of U.S. dollar-denominated, investment grade taxable debt securities with fixed rate coupons that have a remaining term to final maturity, or an average life, of less than five years. Index returns assume reinvestment of distributions, but do not include the effects of any applicable sales charges or management fees.
Bloomberg Barclays U.S. Aggregate Bond Index: The index covers the U.S. investment grade fixed rate bond market, with index components for government and corporate securities, mortgage pass through securities and asset-backed securities. These major sectors are subdivided into more specific indexes that are calculated and reported on a regular basis. Index returns assume reinvestment of distributions, but do not include the effects of any applicable sales charges or management fees.
Bloomberg Barclays U.S. Government/Credit 1-5 Year Bond Index: An index that measures the performance of U.S. dollar-denominated U.S. Treasury bonds, government related bonds and investment grade U.S. corporate bonds that have a remaining maturity of greater than or equal to one year and less than five years. Index returns assume reinvestment of distributions, but do not include the effects of any applicable sales charges or management fees.
Gross Domestic Product (GDP): The total market value of all final goods and services produced in a country/region in a given year, equal to total consumer, investment and government spending, plus the value of exports, minus the value of imports.
Net Asset Value (NAV) Per Share: A fund’s Net Assets is equal to its total assets (securities, cash, accrued earnings and receivables) less its total liabilities. NAV per share is equal to the fund’s Net Assets divided by its number of shares outstanding.
Annual Investment Management Agreement
Approval Process (Unaudited)
The Board of Trustees (the “Board,” and each Trustee, a “Board Member”) of NuShares ETF Trust (the “Trust”), including the Board Members who are not parties to the Funds’ advisory or sub-advisory agreements or “interested persons” of any such parties (the “Independent Board Members”), is responsible for approving each Fund’s advisory arrangements. A discussion of the initial approval of the advisory arrangements for NuShares Enhanced Yield U.S. Aggregate Bond ETF is set forth in Part I below, and a discussion of the initial approval of the advisory arrangements for NuShares Enhanced Yield 1-5 Year U.S. Aggregate Bond ETF is set forth in Part II below.
I.
NuShares Enhanced Yield U.S. Aggregate Bond ETF
At a meeting held on August 2-4, 2016 (for purposes of this Part I, the “Meeting”), the Board of the Trust, including the Independent Board Members, considered and approved the investment management agreement (for purposes of this Part I, the “Investment Management Agreement”) between the Trust and Nuveen Fund Advisors, LLC (for purposes of this Part I, the “Adviser”) on behalf of the NuShares Enhanced Yield U.S. Aggregate Bond ETF (for purposes of this Part I, the “Fund”), a series of the Trust, and the investment sub-advisory agreement (for purposes of this Part I, the “Sub-Advisory Agreement”) between the Adviser and Teachers Advisors, LLC (formerly known as Teachers Advisors, Inc.) (for purposes of this Part I, the “Sub-Adviser”). For purposes of this Part I, the Adviser and the Sub-Adviser are each hereafter a “Fund Adviser.” For purposes of this Part I, the Investment Management Agreement and the Sub-Advisory Agreement are each hereafter an “Advisory Agreement.”
To assist the Board in its evaluation of an Advisory Agreement with a Fund Adviser at the Meeting, the Independent Board Members had received, in adequate time in advance of the Meeting or at prior meetings, materials which outlined, among other things:
| | • | | the nature, extent and quality of the services expected to be provided by the Fund Adviser; |
| | • | | the organization of the Fund Adviser, including the responsibilities of various departments and key personnel; |
| | • | | the expertise and background of the Fund Adviser with respect to the Fund’s investment strategy; |
| | • | | certain performance-related information (as described below); |
| | • | | certain profitability-related information (as described below); |
| | • | | the Fund’s proposed unitary fee structure, including comparisons of the Fund’s proposed expense ratio with the expense ratios of comparable funds; and |
| | • | | the soft dollar practices of the Fund Adviser, if any. |
At the Meeting and at prior meetings, the Adviser made a presentation to and responded to questions from the Board. During the Meeting, the Independent Board Members also met privately with their legal counsel to, among other things, review the Board’s duties under the Investment Company Act of 1940 (the “1940 Act”), the general principles of state law in reviewing and approving advisory contracts, the standards used by courts in determining whether investment company boards of directors have fulfilled their duties, factors to be considered in voting on advisory contracts and an adviser’s fiduciary duty with respect to advisory agreements and compensation. It is with this background that the Independent Board Members considered the Advisory Agreements. As outlined in more detail below, the Independent Board Members considered all factors they believed relevant with respect to the Fund. Each Board Member may have accorded different weight to the various factors and information discussed below in reaching his or her conclusions with respect to the Fund’s Advisory Agreements. The Board Members also drew on information they had received in their capacity as trustees and directors, as applicable, of other registered investment companies advised by the Adviser.
A. Nature, Extent and Quality of Services
The Independent Board Members considered the nature, extent and quality of the respective Fund Adviser’s services, including portfolio management services and administrative services. In this regard, the Independent Board Members recognized that the Fund would be the first open-end exchange-traded fund (“ETF”) to be managed by the Adviser and offered by the Nuveen fund family; however, they considered the Adviser’s extensive experience in operating other types of investment companies. The Independent Board Members considered information about the structure, investment objective, strategies and other characteristics of the Fund. Additionally, they observed that the Fund was expected to seek to track the investment results of an index developed by an unaffiliated index provider.
At the Meeting and/or at prior meetings, the Independent Board Members were provided with materials pertaining to, among other things, the Adviser’s organization and business and the types of services that the Adviser or its affiliates are expected to provide to the Fund. As the Adviser already serves as adviser to the other Nuveen funds overseen by the Board Members, the Board has a good understanding of the Adviser’s
organization, operations, personnel and services. As the Independent Board Members meet regularly throughout the year to oversee the Nuveen funds, the Independent Board Members, in part, relied upon their knowledge from their meetings and any other interactions throughout the year with the Adviser in evaluating the Investment Management Agreement although, as noted above, they recognized that the Fund would be the first ETF in the Nuveen fund family.
The Board noted that the Fund would be a registered investment company that would operate in a regulated industry. In considering the services that were expected to be provided by the Fund Advisers, the Board recognized that the Adviser provides a comprehensive set of services to manage and operate the Nuveen funds, including: (a) product management (such as setting dividends; positioning the product in the marketplace; maintaining and enhancing shareholder communications; and reporting to the Board); (b) investment services (such as overseeing sub-advisers and other service providers; analyzing investment performance and risks; overseeing risk management and disclosure; developing and interpreting investment policies; assisting in the development of products; helping to prepare financial statements and marketing disclosures; and overseeing trade execution); (c) fund administration (such as helping to prepare fund tax returns and complete other tax compliance matters; and helping to prepare regulatory filings and shareholder reports); (d) fund Board administration (such as preparing Board materials and organizing and providing assistance for Board meetings); (e) compliance (such as helping to devise and maintain the Nuveen funds’ compliance program and related testing); and (f) legal support (such as helping to prepare registration statements and proxy statements; interpreting regulations and policies; and overseeing fund activities). The Board was aware, however, that services provided to ETFs may in some respects differ from those provided to other Nuveen funds. In addition, the Independent Board Members noted that the Adviser would oversee the Sub-Adviser, which was generally expected to provide the portfolio advisory services to the Fund.
With respect to the Sub-Adviser, the Independent Board Members were provided with materials pertaining to, among other things, the Sub-Adviser’s organization and business, and considered that the Sub-Adviser is an affiliate of the Adviser. More specifically, they noted that the Adviser is a wholly-owned subsidiary of Nuveen which, in turn, is an operating division of TIAA Global Asset Management (“TGAM”), the investment management arm of Teachers Insurance and Annuity Association of America (“TIAA-CREF”), and the Sub-Adviser is a subsidiary of TGAM. The Independent Board Members considered the experience of the Sub-Adviser and noted that it manages certain index products, including certain funds in the TIAA-CREF fund family and, in addition, manages an account that utilizes a strategy similar to that contemplated for the Fund. The Independent Board Members noted the Sub-Adviser’s expertise in managing fixed income strategies and evaluated the background and experience of certain key investment personnel that were expected to serve as portfolio managers to the Fund.
Based on their review, the Independent Board Members found that, overall, the nature, extent and quality of services expected to be provided to the Fund under each Advisory Agreement were satisfactory.
B. Investment Performance
The Fund was new and, therefore, did not have its own performance history. The Independent Board Members, however, were familiar with the performance records of other Nuveen funds advised by the Adviser and noted that the Fund’s expected strategy has been implemented by the Sub-Adviser’s portfolio managers in connection with an account that they manage. In this regard, the Independent Board Members reviewed cumulative total return data pertaining to such strategy for the period from January 29, 2016 to June 30, 2016.
C. Fees, Expenses and Profitability
1. Fees and Expenses
In evaluating the management fees and expenses that the Fund was expected to bear, the Independent Board Members considered, among other things, the Fund’s proposed unitary fee structure, the rationale for its proposed fee structure, and its proposed expense ratio in absolute terms as well as compared with the expense ratios of comparable ETFs.
In considering the Fund’s proposed unitary fee structure, the Independent Board Members took into account the Adviser’s representation that unitary fee structures were generally common for ETFs. They noted that under this structure, the Fund would pay a fee to the Adviser and, in turn, the Adviser would be generally responsible for the fees incurred by the Fund (such as custody fees, transfer agency fees, index licensing fees, and stock exchange listing fees, as well as the fee paid to the Sub-Adviser), subject to certain exceptions (which included the management fee, any payments under the Trust’s distribution and service plan, interest expenses, taxes, acquired fund fees and expenses, expenses incurred in acquiring and disposing of portfolio securities, certain expenses of the Fund’s chief compliance officer, fees and expenses of the Independent Board Members and their counsel, litigation expenses and extraordinary expenses). In this regard the Independent Board Members were provided with estimates of the Fund’s anticipated expenses, including those that would be paid by the Adviser from the unitary fee and those that would be excluded from the unitary fee, to the extent available.
In considering the proposed unitary fee structure, the Independent Board Members took into account that the Adviser would bear the risk that certain of the Fund’s operating expenses would increase (but would also benefit if such expenses decrease) and the degree of expense stability that would be afforded to the Fund’s shareholders. Additionally, the Independent Board Members reviewed, among other things, the Fund’s proposed expense ratio as well as comparative data pertaining to expense ratios of the Fund’s peers in the Lipper category and Morningstar category in which the Fund is expected to be classified. The proposed unitary fee charged to the Fund was equal to the median of the total expense ratio of the peers
Annual Investment Management Agreement Approval Process (Unaudited) (continued)
in the Morningstar category and above the median in the Lipper category. Further, the Independent Board Members considered the proposed sub-advisory fee, which, as noted above, will be paid by the Adviser out of its unitary fee.
Based on their review of the fee and expense information provided, the Independent Board Members determined that the Fund’s unitary fee was reasonable in light of the nature, extent and quality of services to be provided to the Fund.
2. Comparisons with the Fees of Other Clients
The Board considered that the Fund was the first ETF advised by the Adviser, and the Fund will pay a unitary fee which will differ from most other investment companies advised by the Adviser which pay a variety of fees, such as the investment advisory fee; Rule 12b-1 fees, if any; transfer agency fees; custody fees; and other expenses. The Board believed the unitary fee structure is a benefit to shareholders as it clearly discloses the cost of owning Fund shares, shifts the risk of the costs of operating the Fund covered by the unitary fee to the Adviser, and provides an incentive to the Adviser to maximize administrative efficiencies. As noted, the Board considered the unitary fee paid by the Fund compared to the expense ratios of its peers in the Lipper category and Morningstar category in which the Fund expected to be classified. The Board also noted that the Adviser and/or its affiliated sub-advisers provide services to other types of clients, including, among other things, separately managed accounts, other investment companies that are not offered by Nuveen but are sub-advised by one of Nuveen’s affiliated sub-advisers, foreign investment companies offered by Nuveen, and collective investment trusts. The Board has observed that the varying types of clients require different services and involve different regulatory risks and entrepreneurial risks than managing the Fund, a registered investment company. At prior meetings, the Board has reviewed information regarding the different types of services that are provided to the Nuveen funds compared to those provided to the other types of clients described above, which typically do not require the same breadth of day-to-day services required for registered funds advised by the Adviser. The Board noted that many of the administrative services that the Adviser provides to support the Nuveen funds may not be required to the same extent or at all for the institutional clients or other clients. The Independent Board Members have recognized that the foregoing variations result in different economics among the product structures and culminate in varying management fees among the types of clients and funds. Given the inherent differences in the various products, the Independent Board Members have concluded such facts justify the different levels of fees.
The Independent Board Members noted that although the Sub-Adviser does not serve as sub-adviser to other Nuveen funds, it does serve as investment adviser to funds in the TIAA-CREF family of funds and, in addition, provides management services to other types of clients, including certain accounts.
3. Profitability of Fund Advisers
The Independent Board Members noted that historical information regarding the costs of services provided by the Adviser to the Fund or the profitability of the Fund to the Adviser was not available as the Fund had not commenced operations and it was not possible to predict the effect on profitability of the Fund (or the ETF line of business generally). The Board, however, recognized the significant time and resources the Adviser committed to develop the ETF product line, including organizing the Trust and Fund, obtaining the necessary exemptive relief from the Securities and Exchange Commission, hiring additional personnel and arranging for the service providers to the Fund. The Independent Board Members also considered the estimated operating expenses to be paid by the Adviser pursuant to the unitary fee. Further, at prior meetings, the Independent Board Members have reviewed the profitability of Nuveen for its advisory activities on an absolute basis and in comparison to other investment advisers. In this regard, at prior meetings, the Independent Board Members have reviewed, among other things, Nuveen’s adjusted operating margins, the gross and net revenue margins (pre-tax and after-tax) for advisory activities for the other Nuveen funds, and the revenues, expenses, and net income (pre-tax and after-tax) of Nuveen for 2015 and 2014. The Independent Board Members have also reviewed an analysis of the key drivers behind the changes in revenues and expenses that impacted profitability and have considered Nuveen’s adjusted operating margins compared to that of other comparable investment advisers (based on asset size and composition) with publicly available data. Further, as the Adviser is a wholly-owned subsidiary of Nuveen which in turn is an operating division of TGAM, and the Sub-Adviser is a subsidiary of TGAM, the Board has reviewed a balance sheet for TIAA-CREF reflecting its assets, liabilities and capital and contingency reserves to have a better understanding of the financial stability and strength of the TIAA-CREF complex, together with Nuveen. Based on the information provided, the Independent Board Members have previously noted that the Adviser appeared to be sufficiently profitable to operate as a viable investment management firm and to honor its obligations as a sponsor of the Nuveen funds. The Board recognized that it will be reviewing profitability further as the Fund commences operations and gathers assets.
D. Economies of Scale and Whether Fee Levels Reflect These Economies of Scale
With respect to economies of scale, the Independent Board Members have recognized that, in general, as the assets of a particular fund or the Nuveen complex in the aggregate increase over time, economies of scale may be realized with respect to the management of the funds. In this regard, the Independent Board Members considered whether the Fund could be expected to benefit from any economies of scale. Although the Independent Board Members have recognized that economies of scale are difficult to measure with precision, they have noted that there are several acceptable means to share economies of scale, including through breakpoints in the management fee schedule reducing the fee rates as asset levels grow, fee waiver and expense limitation agreements, and the Adviser’s investment in its business which can enhance the services provided to the Nuveen funds.
Most of the funds in the Nuveen complex pay a management fee to the Adviser which is generally comprised of a fund-level component and a complex-level component. Generally, the fund level fee component declines as the assets of a particular fund grow. Pursuant to the complex-wide fee arrangement, generally, the complex-level fee component declines when eligible assets of the funds in the Nuveen complex combined grow.
Notwithstanding the foregoing, the Independent Board Members recognized that the unitary fee structure does not have breakpoints and that the Fund would not participate in the complex-level fee program. The Independent Board Members recognized that it was difficult to assess when economies of scale, if any, might be realized before the commencement of investment operations. They further recognized that although a unitary fee affords a certain degree of certainty in the expenses of the Fund, the Adviser will benefit from any reductions in certain fixed costs that arise in connection with managing the Fund although the Adviser also has the risk if such fixed costs rise. Additionally, they acknowledged that as ETFs were new to the Nuveen fund family, there would be ongoing review of the fee structure employed for these types of funds.
In addition, at the Meeting and/or prior meetings, the Independent Board Members have recognized the Adviser’s ongoing investment in its business to expand or enhance the services provided to the Nuveen funds. In this regard, the Independent Board Members have noted, among other things, the additions to groups who play a key role in supporting the funds including in fund administration, operations, fund governance, investment services, compliance, product management, retail distribution and technology. The Independent Board Members have also recognized the investments in systems necessary to manage the funds including in areas of risk oversight, information technology and compliance.
Based on their review, the Independent Board Members concluded that the proposed unitary fee structure (which would not include breakpoints or participation in the complex-level fee program) was acceptable.
E. Indirect Benefits
In evaluating fees, the Independent Board Members considered information received at the Meeting and/or at prior meetings regarding other additional benefits that a Fund Adviser or its affiliates may receive as a result of their relationship with the Fund, including compensation paid to affiliates and research received in connection with brokerage transactions (i.e., soft dollar arrangements). In this regard, the Independent Board Members considered that the Fund’s portfolio transactions will be allocated by the Sub-Adviser and that the Sub-Adviser may benefit from research received through soft dollar arrangements with respect to transactions in equity securities. However, they recognized that the Sub-Adviser does not use soft dollars in connection with transactions in fixed income securities.
Based on their review, the Independent Board Members concluded that any indirect benefits expected to be received by a Fund Adviser as a result of its relationship with the Fund were reasonable and within acceptable parameters.
F. Approval
The Independent Board Members did not identify any single factor discussed previously as all-important or controlling. The Board Members, including a majority of the Independent Board Members, concluded that the terms of the Investment Management Agreement and the Sub-Advisory Agreement were fair and reasonable, that the respective Fund Adviser’s fees were reasonable in light of the services to be provided to the Fund and that the Investment Management Agreement and Sub-Advisory Agreement should be and were approved on behalf of the Fund.
II.
NuShares Enhanced Yield 1-5 Year U.S. Aggregate Bond ETF
At a meeting held on February 21-23, 2017 (for purposes of this Part II, the “Meeting”), the Board of the Trust, including the Independent Board Members, considered and approved the investment management agreement (for purposes of this Part II, the “Investment Management Agreement”) between the Trust and Nuveen Fund Advisors, LLC (for purposes of this Part II, the “Adviser”) on behalf of the NuShares Enhanced Yield 1-5 Year U.S. Aggregate Bond ETF (for purposes of this Part II, the “Fund”), a series of the Trust, and the investment sub-advisory agreement (for purposes of this Part II, the “Sub-Advisory Agreement”) between the Adviser and Teachers Advisors, LLC (for purposes of this Part II, the “Sub-Adviser”). For purposes of this Part II, the Adviser and the Sub-Adviser are each hereafter a “Fund Adviser.” For purposes of this Part II, the Investment Management Agreement and the Sub-Advisory Agreement are each hereafter an “Advisory Agreement.”
To assist the Board in its evaluation of an Advisory Agreement with a Fund Adviser at the Meeting, the Independent Board Members had received, in adequate time in advance of the Meeting or at prior meetings, materials which outlined, among other things:
| | • | | the nature, extent and quality of the services expected to be provided by the Fund Adviser; |
| | • | | the organization of the Fund Adviser, including the responsibilities of various departments and key personnel; |
| | • | | the expertise and background of the Fund Adviser with respect to the Fund’s investment strategy; |
| | • | | certain performance-related information (as described below); |
| | • | | certain profitability-related information (as described below); |
Annual Investment Management Agreement Approval Process (Unaudited) (continued)
| | • | | the Fund’s proposed unitary fee structure, including comparisons of the Fund’s proposed expense ratio with the expense ratios of comparable funds; and |
| | • | | the soft dollar practices of the Fund Adviser, if any. |
At the Meeting and/or at prior meetings, the Adviser made a presentation to and responded to questions from the Board. During the Meeting, the Independent Board Members also met privately with their legal counsel to, among other things, review the Board’s duties under the Investment Company Act of 1940 (the “1940 Act”), the general principles of state law in reviewing and approving advisory contracts, the standards used by courts in determining whether investment company boards of directors have fulfilled their duties, factors to be considered in voting on advisory contracts and an adviser’s fiduciary duty with respect to advisory agreements and compensation. It is with this background that the Independent Board Members considered the Advisory Agreements. As outlined in more detail below, the Independent Board Members considered all factors they believed relevant with respect to the Fund. Each Board Member may have accorded different weight to the various factors and information discussed below in reaching his or her conclusions with respect to the Fund’s Advisory Agreements. The Board Members also drew on information they had received in their capacity as trustees and directors, as applicable, of other registered investment companies advised by the Fund Advisers.
A. Nature, Extent and Quality of Services
The Independent Board Members considered the nature, extent and quality of the respective Fund Adviser’s services, including portfolio management services and administrative services. In this regard, the Independent Board Members recognized that open-end exchange-traded funds (“ETFs”) were recently added to the Nuveen fund product line; however, they considered the Adviser’s extensive experience in operating other types of investment companies. The Independent Board Members considered information about the structure, investment objective, strategies and other characteristics of the Fund. Additionally, they observed that the Fund was expected to seek to track the investment results of an index (for purposes of this Part II, the “Index”) developed by an unaffiliated index provider.
At the Meeting and/or at prior meetings, the Independent Board Members were provided with materials pertaining to, among other things, the Adviser’s organization and business and the types of services that the Adviser or its affiliates are expected to provide to the Fund. As the Adviser already serves as adviser to the other Nuveen funds overseen by the Board Members, the Board has a good understanding of the Adviser’s organization, operations, personnel and services. As the Independent Board Members meet regularly throughout the year to oversee the Nuveen funds, the Independent Board Members, in part, relied upon their knowledge from their meetings and any other interactions throughout the year with the Adviser in evaluating the Investment Management Agreement although, as noted above, they recognized that ETFs were recently added to the Nuveen fund product line.
The Board noted that the Fund would be a registered investment company that would operate in a regulated industry. In considering the services that were expected to be provided by the Fund Advisers, the Board recognized that the Adviser provides a comprehensive set of services to manage and operate the Nuveen funds, including: (a) product management (such as setting dividends; positioning the product in the marketplace; maintaining and enhancing shareholder communications; and reporting to the Board); (b) investment services (such as overseeing sub-advisers and other service providers; analyzing investment performance and risks; overseeing risk management and disclosure; developing and interpreting investment policies; assisting in the development of products; helping to prepare financial statements and marketing disclosures; and overseeing trade execution); (c) fund administration (such as helping to prepare fund tax returns and complete other tax compliance matters; and helping to prepare regulatory filings and shareholder reports); (d) fund Board administration (such as preparing Board materials and organizing and providing assistance for Board meetings); (e) compliance (such as helping to devise and maintain the Nuveen funds’ compliance program and related testing); and (f) legal support (such as helping to prepare registration statements and proxy statements; interpreting regulations and policies; and overseeing fund activities). The Board was aware, however, that services provided to ETFs may in some respects differ from those provided to other Nuveen funds. In addition, the Independent Board Members noted that the Adviser would oversee the Sub-Adviser, which was generally expected to provide the portfolio advisory services to the Fund.
With respect to the Sub-Adviser, at the Meeting or at prior meetings, the Independent Board Members were provided with materials pertaining to, among other things, the Sub-Adviser’s organization and business, and considered that the Sub-Adviser is an affiliate of the Adviser. The Independent Board Members considered the experience of the Sub-Adviser and noted that it manages, in addition to other Nuveen ETFs, certain index products, including certain funds in the TIAA-CREF fund family. The Independent Board Members evaluated the background and experience of certain key investment personnel that were expected to serve as portfolio managers to the Fund. In this regard, they noted that the portfolio management team that was expected to serve the Fund also serves as the portfolio management team to another Nuveen ETF that utilizes a similar strategy.
Based on their review, the Independent Board Members found that, overall, the nature, extent and quality of services expected to be provided to the Fund under each Advisory Agreement were satisfactory.
B. Investment Performance
The Fund was new and, therefore, did not have its own performance history. The Independent Board Members, however, were familiar with the performance records of other Nuveen funds advised by the Adviser. Further, they noted that the Sub-Adviser manages other ETFs, but does not currently manage any fund or account that focuses on the methodology of the Index. However, the Independent Board Members reviewed certain
performance information pertaining to the Index as well as the Fund’s contemplated secondary index (including total returns and volatility for the 1-year, 3-year, 5-year, and since inception periods as of October 31, 2016 and cumulative total returns for the period from December 2006 through October 2016).
C. Fees, Expenses and Profitability
1. Fees and Expenses
In evaluating the management fees and expenses that the Fund was expected to bear, the Independent Board Members considered, among other things, the Fund’s proposed unitary fee structure, the rationale for its proposed fee structure, and its proposed expense ratio in absolute terms as well as compared with the expense ratios of comparable ETFs.
In considering the Fund’s proposed unitary fee structure, the Independent Board Members took into account the Adviser’s representation that unitary fee structures were generally common for ETFs. They noted that under this structure, the Fund would pay a fee to the Adviser and, in turn, the Adviser would be generally responsible for the fees incurred by the Fund (such as custody fees, transfer agency fees, index licensing fees, and stock exchange listing fees, as well as the fee paid to the Sub-Adviser), subject to certain exceptions (which included the management fee, any payments under the Trust’s distribution and service plan, interest expenses, taxes, acquired fund fees and expenses, expenses incurred in acquiring and disposing of portfolio securities, certain expenses of the Fund’s chief compliance officer, fees and expenses of the Independent Board Members and their counsel, litigation expenses and extraordinary expenses). In this regard, the Independent Board Members were provided with estimates of the Fund’s anticipated expenses, including those that would be paid by the Adviser from the unitary fee and those that would be excluded from the unitary fee, to the extent available.
In considering the proposed unitary fee structure, the Independent Board Members took into account that the Adviser would bear the risk that certain of the Fund’s operating expenses would increase (but would also benefit if such expenses decrease) and the degree of expense stability that would be afforded to the Fund’s shareholders. Additionally, the Independent Board Members reviewed, among other things, the Fund’s proposed expense ratio as well as comparative data pertaining to expense ratios of the Fund’s peers in the Lipper and Morningstar categories in which the Fund is expected to be classified. Although the proposed unitary fee to be charged to the Fund was above the weighted average fees in the expected Morningstar and Lipper categories, the Independent Board Members noted some differences with the peers, and the Adviser indicated that there were currently no strategic beta ETFs focusing on a 1-5 year U.S. aggregate bond universe. Further, the Independent Board Members considered the proposed sub-advisory fee, which, as noted above, will be paid by the Adviser out of its unitary fee.
Based on their review of the fee and expense information provided, the Independent Board Members determined that the Fund’s unitary fee was reasonable in light of the nature, extent and quality of services to be provided to the Fund.
2. Comparisons with the Fees of Other Clients
The Board considered that ETFs were a recent addition to the Nuveen fund product line and the Fund will pay a unitary fee which will differ from most other investment companies advised by the Adviser which pay a variety of fees, such as the investment advisory fee; Rule 12b-1 fees, if any; transfer agency fees; custody fees; and other expenses. The Board believed the unitary fee structure is a benefit to shareholders as it clearly discloses the cost of owning Fund shares, shifts the risk of the costs of operating the Fund covered by the unitary fee to the Adviser, and provides an incentive to the Adviser to maximize administrative efficiencies. As noted, the Board considered the unitary fee paid by the Fund compared to the expense ratios of its peers in the Lipper and Morningstar categories in which the Fund is expected to be classified. The Board also noted that the Adviser and/or its affiliated sub-advisers provide services to other types of clients, including, among other things, separately managed accounts, other investment companies that are not offered by Nuveen but are sub-advised by one of Nuveen’s affiliated sub-advisers, foreign investment companies offered by Nuveen, and collective investment trusts. The Board has observed that the varying types of clients require different services and involve different regulatory risks and entrepreneurial risks than managing the Fund, a registered investment company. At prior meetings, the Board has reviewed information regarding the different types of services that are provided to the Nuveen funds compared to those provided to the other types of clients described above, which typically do not require the same breadth of day-to-day services required for registered funds advised by the Adviser. The Board noted that many of the administrative services that the Adviser provides to support the Nuveen funds may not be required to the same extent or at all for the institutional clients or other clients. The Independent Board Members have recognized that the foregoing variations result in different economics among the product structures and culminate in varying management fees among the types of clients and funds. Given the inherent differences in the various products, the Independent Board Members have concluded such facts justify the different levels of fees.
At the Meeting or at prior meetings, the Independent Board Members noted that although, except for other Nuveen ETFs, the Sub-Adviser does not serve as sub-adviser to other Nuveen funds, it does serve as investment adviser to funds in the TIAA-CREF family of funds and, in addition, provides management services to other types of clients, including certain accounts.
3. Profitability of Fund Advisers
At the time of the Meeting, historical information regarding the costs of services provided by the Adviser to the Fund and the profitability of the Fund to the Adviser was not available as the Fund had not commenced operations and it was not possible to predict the effect on profitability of the Fund (or the recently added ETF line of business generally). At the Meeting or at prior meetings, however, the Board has recognized the
Annual Investment Management Agreement Approval Process (Unaudited) (continued)
significant time and resources the Adviser committed to develop the ETF product line, including organizing the Trust and Fund (in addition to other Nuveen ETFs), obtaining the necessary exemptive relief from the Securities and Exchange Commission, hiring additional personnel and arranging for the service providers to the Fund (and other Nuveen ETFs). The Independent Board Members also considered the estimated operating expenses to be paid by the Adviser pursuant to the unitary fee. Further, at prior meetings, the Independent Board Members have reviewed the profitability of Nuveen for its advisory activities on an absolute basis and in comparison to other investment advisers. In this regard, at prior meetings, the Independent Board Members have reviewed, among other things, Nuveen’s adjusted operating margins, the gross and net revenue margins (pre-tax and after-tax) for advisory activities for the other Nuveen funds, and the revenues, expenses, and net income (pre-tax and after-tax) of Nuveen for 2015 and 2014. The Independent Board Members have also reviewed an analysis of the key drivers behind the changes in revenues and expenses that impacted profitability and have considered Nuveen’s adjusted operating margins compared to that of other comparable investment advisers (based on asset size and composition) with publicly available data. Further, as the Adviser is a subsidiary of Nuveen, LLC, the investment management arm of Teachers Insurance and Annuity Association of America (“TIAA”), the Board has reviewed a balance sheet for TIAA reflecting its assets, liabilities and capital and contingency reserves to have a fuller understanding of the financial condition and strength of the TIAA-CREF complex, together with Nuveen. Based on the information provided, the Independent Board Members have previously noted that the Adviser appeared to be sufficiently profitable to operate as a viable investment management firm and to honor its obligations as a sponsor of the Nuveen funds. The Board recognized that it will be reviewing profitability further as the Fund commences operations and gathers assets and as relevant information becomes available regarding Nuveen’s recently-added ETF business line as a whole.
D. Economies of Scale and Whether Fee Levels Reflect These Economies of Scale
With respect to economies of scale, the Independent Board Members have recognized that, in general, as the assets of a particular fund or the Nuveen complex in the aggregate increase over time, economies of scale may be realized with respect to the management of the funds. In this regard, the Independent Board Members considered whether the Fund could be expected to benefit from any economies of scale. Although the Independent Board Members have recognized that economies of scale are difficult to measure with precision, they have noted that there are several acceptable means to share economies of scale, including through breakpoints in the management fee schedule reducing the fee rates as asset levels grow, fee waiver and expense limitation agreements, and the Adviser’s investment in its business which can enhance the services provided to the Nuveen funds. Most of the funds in the Nuveen complex pay a management fee to the Adviser which is generally comprised of a fund-level component and a complex-level component. Generally, the fund level fee component declines as the assets of a particular fund grow. Pursuant to the complex-wide fee arrangement, generally, the complex-level fee component declines when eligible assets of the funds in the Nuveen complex combined grow.
Notwithstanding the foregoing, the Independent Board Members recognized that the unitary fee structure does not have breakpoints and that the Fund (like other Nuveen ETFs) would not participate in the complex-level fee program. The Independent Board Members recognized that it was difficult to assess when economies of scale, if any, might be realized before the commencement of investment operations and in light of Nuveen’s recent entry to the ETF market. They further recognized that although a unitary fee affords a certain degree of certainty in the expenses of the Fund, the Adviser will benefit from any reductions in certain fixed costs that arise in connection with managing the Fund although the Adviser also has the risk if such fixed costs rise. Additionally, they acknowledged that as ETFs were new to the Nuveen fund family, there would be ongoing review of the fee structure employed for these types of funds.
In addition, at the Meeting and/or prior meetings, the Independent Board Members have recognized the Adviser’s ongoing investment in its business to expand or enhance the services provided to the Nuveen funds. In this regard, the Independent Board Members have noted, among other things, the additions to groups who play a key role in supporting the funds including in fund administration, operations, fund governance, investment services, compliance, product management, retail distribution and technology. The Independent Board Members have also recognized the investments in systems necessary to manage the funds including in areas of risk oversight, information technology and compliance.
Based on their review, the Independent Board Members concluded that the proposed unitary fee structure (which would not include breakpoints or participation in the complex-level fee program) was acceptable.
E. Indirect Benefits
In evaluating fees, the Independent Board Members considered information received at the Meeting and/or at prior meetings regarding other additional benefits that a Fund Adviser or its affiliates may receive as a result of their relationship with the Fund, including compensation paid to affiliates and research received in connection with brokerage transactions (i.e., soft dollar arrangements). In this regard, the Independent Board Members considered that the Fund’s portfolio transactions will be allocated by the Sub-Adviser and that the Sub-Adviser may benefit from research received through soft dollar arrangements with respect to transactions in equity securities. However, they recognized that the Sub-Adviser does not use soft dollars in connection with transactions in fixed income securities.
Based on their review, the Independent Board Members concluded that any indirect benefits expected to be received by a Fund Adviser as a result of its relationship with the Fund were reasonable and within acceptable parameters.
F. Approval
The Independent Board Members did not identify any single factor discussed previously as all-important or controlling. The Board Members, including a majority of the Independent Board Members, concluded that the terms of the Investment Management Agreement and the Sub-Advisory Agreement were fair and reasonable, that the respective Fund Adviser’s fees were reasonable in light of the services to be provided to the Fund and that the Investment Management Agreement and Sub-Advisory Agreement should be and were approved on behalf of the Fund.
Trustees
and Officers (Unaudited)
The management of the Funds, including general supervision of the duties performed for the Funds by the Adviser, is the responsibility of the Board of Trustees of the Funds. The number of directors of the Funds is currently set at twelve. None of the trustees who are not “interested” persons of the Funds (referred to herein as “independent trustees”) has ever been a director or employee of, or consultant to, Nuveen or its affiliates. The names and business addresses of the trustees and officers of the Funds, their principal occupations and other affiliations during the past five years, the number of portfolios each oversees and other directorships they hold are set forth below.
The Funds’ Statement of Additional Information (“SAI”) includes more information about the trustees. To request a free copy, call Nuveen Investments at (800) 257-8787 or visit the Funds’ website at www.nuveen.com.
| | | | | | | | |
Name, Year of Birth & Address | | Position(s) Held with the Funds | | Year First
Elected or
Appointed (1) | | Principal Occupation(s) Including other Directorships During Past 5 Years | | Number of
Portfolios in
Fund Complex
Overseen by
Trustee |
| | | | | |
| Independent Trustees: | | | | | | | | |
William J. Schneider 1944 333 W. Wacker Drive Chicago, IL 60606 | | Chairman and Trustee | | 1996 | | Chairman of Miller-Valentine Partners, a real estate investment company; Board Member of WDPR Public Radio station; formerly, Senior Partner and Chief Operating Officer (retired (2004) of Miller-Valentine Group; formerly, Board member, Business Advisory Council of the Cleveland Federal Reserve Bank and University of Dayton Business School Advisory Council; past Chair and Director, Dayton Development Coalition. | | 176 |
Jack B. Evans 1948 333 W. Wacker Drive Chicago, IL 60606 | | Trustee | | 1999 | | President, The Hall-Perrine Foundation, a private philanthropic corporation (since 1996); Director and Chairman, United Fire Group, a publicly held company; Director, Public member, American Board of Orthopaedic Surgery (since 2015); Life Trustee of Coe College and the Iowa College Foundation; formerly, President Pro-Tem of the Board of Regents for the State of Iowa University System; formerly, Director, Alliant Energy; formerly, Director, Federal Reserve Bank of Chicago; formerly, President and Chief Operating Officer, SCI Financial Group, Inc., a regional financial services firm. | | 176 |
William C. Hunter 1948 333 W. Wacker Drive Chicago, IL 60606 | | Trustee | | 2003 | | Dean Emeritus, formerly, Dean, Tippie College of Business, University of Iowa (2006-2012); Director (since 2004) of Xerox Corporation; past Director (2005-2015), and past President (2010-2014) Beta Gamma Sigma, Inc., The International Business Honor Society; Director of Wellmark, Inc. (since 2009); formerly, Dean and Distinguished Professor of Finance, School of Business at the University of Connecticut (2003-2006); previously, Senior Vice President and Director of Research at the Federal Reserve Bank of Chicago (1995-2003); formerly, Director (1997-2007), Credit Research Center at Georgetown University. | | 176 |
David J. Kundert 1942 333 W. Wacker Drive Chicago, IL 60606 | | Trustee | | 2005 | | Formerly, Director, Northwestern Mutual Wealth Management Company (2006-2013); retired (since 2004) as Chairman, JPMorgan Fleming Asset Management, President and CEO, Banc One Investment Advisors Corporation, and President, One Group Mutual Funds; prior thereto, Executive Vice President, Banc One Corporation and Chairman and CEO, Banc One Investment Management Group; Regent Emeritus, Member of Investment Committee, Luther College; member of the Wisconsin Bar Association; member of Board of Directors and Chair of Investment Committee, Greater Milwaukee Foundation; member of the Board of Directors (Milwaukee), College Possible; Board member of Milwaukee Repertory Theatre (since 2016). | | 176 |
Trustees and Officers (Unaudited) (continued)
| | | | | | | | |
Name, Year of Birth & Address | | Position(s) Held with the Funds | | Year First
Elected or
Appointed (1) | | Principal Occupation(s) Including other Directorships During Past 5 Years | | Number of
Portfolios in
Fund Complex
Overseen by
Trustee |
Albin F. Moschner(2) 1952 333 W. Wacker Drive Chicago, IL 60606 | | Trustee | | 2016 | | Founder and Chief Executive Officer, Northcroft Partners, LLC, a management consulting firm (since 2012); previously, held positions at Leap Wireless International, Inc., including Consultant (2011-2012), Chief Operating Officer (2008-2011), and Chief Marketing Officer (2004-2008); formerly, President, Verizon Card Services division of Verizon Communications, Inc. (2000-2003); formerly, President, One Point Services at One Point Communications (1999-2000); formerly, Vice Chairman of the Board, Diba, Incorporated (1996-1997); formerly, various executive positions with Zenith Electronics Corporation (1991-1996). Director, USA Technologies, Inc., a provider of solutions and services to facilitate electronic payment transactions (since 2012); formerly, Director, Wintrust Financial Corporation (1996-2016). | | 176 |
John K. Nelson 1962 333 W. Wacker Drive Chicago, IL 60606 | | Trustee | | 2013 | | Member of Board of Directors of Core12 LLC (since 2008), a private firm which develops branding, marketing and communications strategies for clients; Director of The Curran Center for Catholic American Studies (since 2009) and The President’s Council, Fordham University (since 2010); formerly senior external advisor to the financial services practice of Deloitte Consulting LLP (2012-2014); formerly, Chairman of the Board of Trustees of Marian University (2010 as trustee, 2011- 2014 as Chairman); formerly, Chief Executive Officer of ABN AMRO N.V. North America, and Global Head of its Financial Markets Division (2007-2008); prior senior positions held at ABN AMRO include Corporate Executive Vice President and Head of Global Markets-the Americas (2006-2007), CEO of Wholesale Banking-North America and Global Head of Foreign Exchange and Futures Markets (2001-2006), and Regional Commercial Treasurer and Senior Vice President Trading-North America (1996-2001); formerly, Trustee at St. Edmund Preparatory School in New York City. | | 176 |
Judith M. Stockdale 1947 333 W. Wacker Drive Chicago, IL 60606 | | Trustee | | 1997 | | Board Member, Land Trust Alliance (since 2013) and U.S. Endowment for Forestry and Communities (since 2013); formerly, Executive Director (1994-2012), Gaylord and Dorothy Donnelley Foundation; prior thereto, Executive Director, Great Lakes Protection Fund (1990-1994). | | 176 |
Carole E. Stone 1947 333 W. Wacker Drive Chicago, IL 60606 | | Trustee | | 2007 | | Director, Chicago Board Options Exchange (since 2006), C2 Options Exchange, Incorporated (since 2009); Director, CBOE Holdings, Inc. (since 2010); formerly, Commissioner, New York State Commission on Public Authority Reform (2005-2010). | | 176 |
Terence J. Toth 1959 333 W. Wacker Drive Chicago, IL 60606 | | Trustee | | 2008 | | Co-Founding Partner, Promus Capital (since 2008); Director, Fulcrum IT Service LLC (since 2010) and Quality Control Corporation (since 2012); member: Catalyst Schools of Chicago Board (since 2008) and Mather Foundation Board (since 2012), and chair of its investment committee; formerly, Director, Legal & General Investment Management America, Inc. (2008-2013); formerly, CEO and President, Northern Trust Global Investments (2004-2007); Executive Vice President, Quantitative Management & Securities Lending (2000-2004); prior thereto, various positions with Northern Trust Company (since 1994); formerly, Member, Northern Trust Mutual Funds Board (2005-2007), Northern Trust Global Investments Board (2004-2007), Northern Trust Japan Board (2004-2007), Northern Trust Securities Inc. Board (2003- 2007) and Northern Trust Hong Kong Board (1997-2004). | | 176 |
| | | | | | | | |
Name, Year of Birth & Address | | Position(s) Held with the Funds | | Year First
Elected or
Appointed (1) | | Principal Occupation(s) Including other Directorships During Past 5 Years | | Number of
Portfolios in
Fund Complex
Overseen by
Trustee |
Margaret L. Wolff 1955 333 W. Wacker Drive Chicago, IL 60606 | | Trustee | | 2016 | | Member of the Board of Directors (since 2013) of Travelers Insurance Company of Canada and The Dominion of Canada General Insurance Company (each, a part of Travelers Canada, the Canadian operation of The Travelers Companies, Inc.); formerly, Of Counsel, Skadden, Arps, Slate, Meagher & Flom LLP (Mergers & Acquisitions Group) (2005-2014); Member of the Board of Trustees of New York-Presbyterian Hospital (since 2005); Member (since 2004) and Chair (since 2015) of the Board of Trustees of The John A. Hartford Foundation (a philanthropy dedicated to improving the care of older adults); formerly, Member (2005-2015) and Vice Chair (2011-2015) of the Board of Trustees of Mt. Holyoke College. | | 176 |
Robert L. Young(3) 1963 333 W. Wacker Drive Chicago, IL 60606 | | Trustee | | 2017 | | Formerly, Chief Operating Officer and Director, J.P. Morgan Investment Management Inc. (2010-2016); formerly, President and Principal Executive Officer (2013-2016), and Senior Vice President and Chief Operating Officer (2005-2010), of J.P. Morgan Funds; formerly, Director and various officer positions for J.P. Morgan Investment Management Inc. (formerly, JPMorgan Funds Management, Inc. and formerly, One Group Administrative Services) and JPMorgan Distribution Services, Inc. (formerly, One Group Dealer Services, Inc.) (1999-2017). | | 174 |
| | | | | |
| Interested Trustee: | | | | | | | | |
Margo L. Cook(2)(4) 1964 333 W. Wacker Drive Chicago, IL 60606 | | Trustee | | 2016 | | President (since April 2017), formerly, Co-Chief Executive Officer and Co-President (2016-2017), formerly, Senior Executive Vice President of Nuveen Investments, Inc; Executive Vice President (since February 2017) of Nuveen, LLC; President, Global Products and Solutions (since July 2017), and Co-Chief Executive Officer, formerly, Executive Vice President (2013-2015) of Nuveen Securities, LLC; President (since August 2017), formerly, Co-President (since October 2016), formerly Senior Executive Vice President (2015-2016) of Nuveen Fund Advisors, LLC (Executive Vice President 2011-2015); formerly, Managing Director of Nuveen Commodities Asset Management, LLC (2011-2016); Chartered Financial Analyst. | | 176 |
| | | | | | | | |
Name, Year of Birth & Address | | Position(s) Held with the Funds | | Year First
Elected or
Appointed (5) | | Principal Occupation(s) During Past 5 Years | | Number of
Portfolios in
Fund Complex
Overseen by
Officer |
| | | | |
| Officers of the Funds: | | | | | | |
Martin Y.G. Kremenstein 1976 100 Park Avenue New York, NY 10017 | | Chief Administrative Officer | | 2017 | | Vice President (since April 2016) of Nuveen Commodities Asset Management, LLC; Senior (since February 2017) Managing Director (since October 2016) of Nuveen Fund Advisors, LLC; formerly, Managing Director (2013-2015); formerly, Director (2009- 2013) Deutsche Bank; CEO (2012-2015) DB Commodity Services LLC; CEO (2012-2014) DBX Advisors LLC and DBX Strategic Advisors LLC. | | 10 |
Lorna C. Ferguson 1945 333 W. Wacker Drive Chicago, IL 60606 | | Vice President | | 1998 | | Senior Managing Director (since February 2017), formerly, Managing Director (2004-2017) of Nuveen. | | 177 |
Stephen D. Foy 1954 333 W. Wacker Drive Chicago, IL 60606 | | Vice President and Controller | | 1998 | | Managing Director (since 2014), formerly, Senior Vice President (2013-2014) and Vice President (2005-2013) of Nuveen Fund Advisors, LLC; Chief Financial Officer of Nuveen Commodities Asset Management, LLC (since 2010); Managing Director (since 2016) of Nuveen Securities, LLC; Certified Public Accountant. | | 177 |
Trustees and Officers (Unaudited) (continued)
| | | | | | | | |
Name, Year of Birth & Address | | Position(s) Held with the Funds | | Year First
Elected or
Appointed (5) | | Principal Occupation(s) During Past 5 Years | | Number of
Portfolios in
Fund Complex
Overseen by
Officer |
Nathaniel T. Jones 1979 333 W. Wacker Drive Chicago, IL 60606 | | Vice President and Treasurer | | 2016 | | Managing Director (since January 2017), formerly, Senior Vice President (2016-2017), formerly, Vice President (2011- 2016) of Nuveen; Chartered Financial Analyst. | | 177 |
Walter M. Kelly 1970 333 W. Wacker Drive Chicago, IL 60606 | | Chief Compliance Officer and Vice President | | 2003 | | Managing Director (since January 2017), formerly, Senior Vice President (2008-2017) of Nuveen Investments Holdings, Inc. | | 177 |
Tina M. Lazar 1961 333 W. Wacker Drive Chicago, IL 60606 | | Vice President | | 2002 | | Managing Director (since January 2017), formerly, Senior Vice President (2014-2017) of Nuveen Securities, LLC. | | 177 |
Kevin J. McCarthy 1966 333 W. Wacker Drive Chicago, IL 60606 | | Vice President and Assistant Secretary | | 2007 | | Senior Managing Director (since February 2017) and Secretary and General Counsel (since 2016) of Nuveen Investments, Inc., formerly, Executive Vice President (2016-2017) and Managing Director and Assistant Secretary (2008-2016); Senior Managing Director (since January 2017) and Assistant Secretary (since 2008) of Nuveen Securities, LLC, formerly Executive Vice President (2016-2017) and Managing Director (2008-2016); Senior Managing Director (since February 2017), Secretary (since 2016) and Co-General Counsel (since 2011) of Nuveen Fund Advisors, LLC, formerly, Executive Vice President (2016-2017), Managing Director (2008-2016) and Assistant Secretary (2007-2016); Senior Managing Director (since February 2017), Secretary (since 2016) and Associate General Counsel (since 2011 of Nuveen Asset Management, LLC, formerly Executive Vice President (2016-2017) and Managing Director and Assistant Secretary (2011-2016); Senior Managing Director (since February 2017) and Secretary (since 2016) of Nuveen Investments Advisers, LLC, formerly Executive Vice President (2016-2017); Vice President (since 2007) and Secretary (since 2016), formerly, Assistant Secretary, of NWQ Investment Management Company, LLC, Symphony Asset Management LLC Santa Barbara Asset Management, LLC and Winslow Capital Management, LLC (since 2010); Vice President (since 2010) and Secretary (since 2016) of Nuveen Commodities Asset Management, LLC, formerly Assistant Secretary (2010-2016). | | 177 |
Kathleen L. Prudhomme 1953 901 Marquette Avenue Minneapolis, MN 55402 | | Vice President and Assistant Secretary | | 2011 | | Managing Director, Assistant Secretary and Co-General Counsel (since 2011) of Nuveen Fund Advisors, LLC; Managing Director, Assistant Secretary and Associate General Counsel (since 2011) of Nuveen Asset Management, LLC; Managing Director and Assistant Secretary (since 2011) of Nuveen Securities, LLC; formerly, Deputy General Counsel, FAF Advisors, Inc. (2004- 2010). | | 177 |
Christopher M. Rohrbacher 1971 333 W. Wacker Drive Chicago, IL 60606 | | Vice President and Secretary | | 2008 | | Managing Director (since January 2017) of Nuveen Securities, LLC; Managing Director (Since January 2017), formerly, Senior Vice President (2016-2017) and Assistant Secretary (since October 2016) of Nuveen Fund Advisors, LLC; Vice President and Assistant Secretary (since 2010) of Nuveen Commodities Asset Management, LLC. | | 177 |
William A. Siffermann 1975 333 W. Wacker Drive Chicago, IL 60606 | | Vice President | | 2017 | | Managing Director (Since February 2017), formerly Senior Vice President (2016-2017) and Vice President (2011-2016) of Nuveen. | | 177 |
| | | | | | | | |
Name, Year of Birth & Address | | Position(s) Held with the Funds | | Year First
Elected or
Appointed (5) | | Principal Occupation(s) During Past 5 Years | | Number of
Portfolios in
Fund Complex
Overseen by
Officer |
Joel T. Slager 1978 333 W. Wacker Drive Chicago, IL 60606 | | Vice President and Assistant Secretary | | 2013 | | Fund Tax Director for Nuveen Funds (since 2013); previously, Vice President of Morgan Stanley Investment Management, Inc., Assistant Treasurer of the Morgan Stanley Funds (from 2010 to 2013). | | 177 |
Gifford R. Zimmerman 1956 333 W. Wacker Drive Chicago, IL 60606 | | Vice President and Assistant Secretary | | 1988 | | Managing Director (since 2002), and Assistant Secretary of Nuveen Securities, LLC; Managing Director (since 2004) and Assistant Secretary (since 1994) of Nuveen Investments, Inc.; Managing Director (since 2002), Assistant Secretary (since 1997) and Co-General Counsel (since 2011) of Nuveen Fund Advisors, LLC; Managing Director, Assistant Secretary and Associate General Counsel of Nuveen Asset Management, LLC (since 2011); Vice President (since February 2017), formerly, Managing Director (2003-2017) and Assistant Secretary (since 2003) of Symphony Asset Management LLC ; Managing Director and Assistant Secretary (since 2002) of Nuveen Investments Advisers, LLC; Vice President and Assistant Secretary of NWQ Investment Management Company, LLC (since 2002), Santa Barbara Asset Management, LLC (since 2006) and of Winslow Capital Management, LLC, (since 2010); Chartered Financial Analyst. | | 177 |
| (1) | Trustees serve an indefinite term until his/her successor is elected or appointed. The year first elected or appointed represents the year in which the director was first elected or appointed to any fund in the Nuveen Fund Complex. |
| (2) | On June 22, 2016, Ms. Cook and Mr. Moschner were appointed as Board Members, effective July 1, 2016. |
| (3) | On May 25, 2017, Mr. Young was appointed as a Board Member, effective July 1, 2017. He is a Board Member of each of the Nuveen Funds, except Nuveen Diversified Dividend and Income Fund and Nuveen Real Estate Income Fund. |
| (4) | “Interested person” of the Trust, as defined in the 1940 Act, by reason of her position with Nuveen, LLC. and certain of its subsidiaries. |
| (5) | Officers serve one year terms through August of each year. The year first elected or appointed represents the year in which the officer was first elected or appointed to any fund in the Nuveen Fund Complex. |
| | | | | | | | | | | | | | |
| | | | | | | | |
| | | | |
| | | | | | | | |
| | |
| | Nuveen: | | |
| | | | Serving Investors for Generations | | |
| | |
| | | | |
| | | |
| | | | Since 1898, financial advisors and their clients have relied on Nuveen to provide dependable investment solutions through continued adherence to proven, long-term investing principles. Today, we offer a range of high quality solutions designed to be integral components of a well-diversified core portfolio. | | |
| | | |
| | | | | | |
| | | | |
| | | | | | Focused on meeting investor needs. Nuveen is the investment management arm of TIAA. We have grown into one of the world’s premier global asset managers, with specialist knowledge across all major asset classes and particular strength in solutions that provide income for investors and that draw on our expertise in alternatives and responsible investing. Nuveen is driven not only by the independent investment processes across the firm, but also the insights, risk management, analytics and other tools and resources that a truly world-class platform provides. As a global asset manager, our mission is to work in partnership with our clients to create solutions which help them secure their financial future. | | |
| | | | | |
| | | | | | | | | | |
| | | | | | Find out how we can help you.
To learn more about how the products and services of Nuveen
may be able to help you meet your financial goals, talk to your
financial advisor, or call us at (800) 257-8787. Please read the information
provided carefully before you invest. Investors should consider the
investment objective and policies, risk considerations, charges and
expenses of any investment carefully. Where applicable, be sure to obtain a
prospectus, which contains this and other relevant information. To obtain
a prospectus, please contact your securities representative or Nuveen,
333 W. Wacker Dr., Chicago, IL 60606. Please read the
prospectus carefully before you invest or send money.
Learn more about Nuveen Funds at: www.nuveen.com/etf
| | |
| | | | | | |
| | | | | | | | | | | | |
| | Securities offered through Nuveen Securities, LLC, member FINRA and SIPC | 333 West Wacker Drive Chicago, IL 60606 | www.nuveen.com | | |
NAN-ENHUS-0717P 258844-INV-Y-09/18
ITEM 2. CODE OF ETHICS.
As of the end of the period covered by this report, the registrant has adopted a code of ethics that applies to the registrant’s principal executive officer, principal financial officer, principal accounting officer or controller, or persons performing similar functions. There were no amendments to or waivers from the code during the period covered by this report. The registrant has posted the code of ethics on its website at www.nuveen.com/MutualFunds/ShareholderResources/FundGovernance.aspx. (To view the code, click on Code of Conduct.)
ITEM 3. AUDIT COMMITTEE FINANCIAL EXPERT.
The registrant’s Board of Directors or Trustees (“Board”) determined that the registrant has at least one “audit committee financial expert” (as defined in Item 3 of Form N-CSR) serving on its Audit Committee. The registrant’s audit committee financial experts are Carole E. Stone and Jack B. Evans, who are “independent” for purposes of Item 3 of Form N-CSR.
Ms. Stone served for five years as Director of the New York State Division of the Budget. As part of her role as Director, Ms. Stone was actively involved in overseeing the development of the State’s operating, local assistance and capital budgets, its financial plan and related documents; overseeing the development of the State’s bond-related disclosure documents and certifying that they fairly presented the State’s financial position; reviewing audits of various State and local agencies and programs; and coordinating the State’s system of internal audit and control. Prior to serving as Director, Ms. Stone worked as a budget analyst/examiner with increasing levels of responsibility over a 30 year period, including approximately five years as Deputy Budget Director. Ms. Stone has also served as Chair of the New York State Racing Association Oversight Board, as Chair of the Public Authorities Control Board, as a Commissioner on the New York State Commission on Public Authority Reform and as a member of the Boards of Directors of several New York State public authorities. These positions have involved overseeing operations and finances of certain entities and assessing the adequacy of project/entity financing and financial reporting. Currently, Ms. Stone is on the Board of Directors of CBOE Holdings, Inc., of the Chicago Board Options Exchange, and of C2 Options Exchange. Ms. Stone’s position on the boards of these entities and as a member of both CBOE Holdings’ Audit Committee and its Finance Committee has involved, among other things, the oversight of audits, audit plans and preparation of financial statements.
Mr. Evans was formerly President and Chief Operating Officer of SCI Financial Group, Inc., a full service registered broker-dealer and registered investment adviser (“SCI”). As part of his role as President and Chief Operating Officer, Mr. Evans actively supervised the Chief Financial Officer (the “CFO”) and actively supervised the CFO’s preparation of financial statements and other filings with various regulatory authorities. In such capacity, Mr. Evans was actively involved in the preparation of SCI’s financial statements and the resolution of issues raised in connection therewith. Mr. Evans has also served on the audit committee of various reporting companies. At such companies, Mr. Evans was involved in the oversight of audits, audit plans, and the preparation of financial statements. Mr. Evans also formerly chaired the audit committee of the Federal Reserve Bank of Chicago.
ITEM 4. PRINCIPAL ACCOUNTANT FEES AND SERVICES.
The following tables show the amount of fees that KPMG LLP, the Funds’ auditor, billed for services provided to the Funds during the Funds’ last two full fiscal years. The Audit Committee approved in advance all audit services and non-audit services that KPMG LLP provided to the Funds, except for those non-audit services that were subject to the pre-approval exception under Rule 2-01 of Regulation S-X (the “pre-approval exception”). The preapproval exception for services provided directly to the Funds waives the pre-approval requirement for services other than audit, review or attest services if: (A) the aggregate amount of all such services provided constitutes no more than 5% of the total amount of revenues paid during the fiscal year in which the services are provided; (B) the Funds did not recognize the services as non-audit services at the time of the engagement; and (C) the services are promptly brought to the Audit Committee’s attention, and the Committee (or its delegate) approves the services before the audit is completed.
The Audit Committee has delegated certain pre-approval responsibilities to its Chairman (or, in his absence, any other member of the Audit Committee).
| | | | | | | | | | | | | | | | |
Fiscal Year Ended July 31, 2017 | | Audit Fees 1 | | | Audit-Related Fees 2 | | | Tax Fees 3 | | | All Other Fees 4 | |
Fund Name | | | | | | | | | | | | | | | | |
NuShares Enhanced Yield U.S. Aggregate Bond ETF 5 | | | 17,500 | | | | 714 | | | | 0 | | | | 0 | |
NuShares Enhanced Yield 1-5 Year U.S. Aggregate Bond ETF 6 | | | 17,500 | | | | 0 | | | | 0 | | | | 0 | |
| | | | | | | | | | | | | | | | |
Total | | $ | 35,000 | | | $ | 714 | | | $ | 0 | | | $ | 0 | |
| 1 | | “Audit Fees” are the aggregate fees billed for professional services for the audit of the Fund’s annual financial statements and services provided in connection with statutory and regulatory filings or engagements. |
| 2 | | “Audit-Related Fees” are the aggregate fees billed for assurance and related services reasonably related to the performance of the audit or review of financial statements that are not reported under “Audit Fees”. |
| 3 | | “Tax Fees” are the aggregate fees billed for professional services for tax advice, tax compliance, and tax planning. These fees include: all global withholding tax services; excise and state tax reviews; capital gain, tax equalization and taxable basis calculations performed by the principal accountant. |
| 4 | | “All Other Fees” are the aggregate fees billed for products and services other than “Audit Fees”, “Audit-Related Fees” and “Tax Fees”. These fees represent all “Agreed-Upon Procedures” engagements pertaining to the Fund’s use of leverage. |
| 5 | | Fund commenced operations on 09/15/2016. |
| 6 | | Fund commenced operations on 04/03/2017. |
| | | | | | | | | | | | | | | | |
| | | Percentage Approved Pursuant to Pre-approval Exception | |
| | | Audit Fees | | | Audit-Related Fees | | | Tax Fees | | | All Other Fees | |
Fund Name | | | | | | | | | | | | | | | | |
NuShares Enhanced Yield U.S. Aggregate Bond ETF | | | 0 | % | | | 0 | % | | | 0 | % | | | 0 | % |
NuShares Enhanced Yield 1-5 Year U.S. Aggregate Bond ETF | | | 0 | % | | | 0 | % | | | 0 | % | | | 0 | % |
| | | | |
Fiscal Year Ended July 31, 2016 | | Audit Fees 1 | | | Audit-Related Fees 2 | | | Tax Fees 3 | | | All Other Fees 4 | |
Fund Name | | | | | | | | | | | | | | | | |
NuShares Enhanced Yield U.S. Aggregate Bond ETF 5 | | | N/A | | | | N/A | | | | N/A | | | | N/A | |
NuShares Enhanced Yield 1-5 Year U.S. Aggregate Bond ETF 6 | | | N/A | | | | N/A | | | | N/A | | | | N/A | |
| | | | | | | | | | | | | | | | |
Total | | | N/A | | | | N/A | | | | N/A | | | | N/A | |
| 1 | | “Audit Fees” are the aggregate fees billed for professional services for the audit of the Fund’s annual financial statements and services provided in connection with statutory and regulatory filings or engagements. |
| 2 | | “Audit-Related Fees” are the aggregate fees billed for assurance and related services reasonably related to the performance of the audit or review of financial statements that are not reported under “Audit Fees”. |
| 3 | | “Tax Fees” are the aggregate fees billed for professional services for tax advice, tax compliance, and tax planning. These fees include: all global withholding tax services; excise and state tax reviews; capital gain, tax equalization and taxable basis calculations performed by the principal accountant. |
| 4 | | “All Other Fees” are the aggregate fees billed for products and services other than “Audit Fees”, “Audit-Related Fees” and “Tax Fees”. These fees represent all “Agreed-Upon Procedures” engagements pertaining to the Fund’s use of leverage. |
| 5 | | Fund commenced operations on 09/15/2016. |
| 6 | | Fund commenced operations on 04/03/2017. |
| | | | | | | | | | | | | | | | |
| |
| | | Percentage Approved Pursuant to Pre-approval Exception | |
| | | Audit Fees | | | Audit-Related Fees | | | Tax Fees | | | All Other Fees | |
Fund Name | | | | | | | | | | | | | | | | |
NuShares Enhanced Yield U.S. Aggregate Bond ETF | | | N/A | | | | N/A | | | | N/A | | | | N/A | |
NuShares Enhanced Yield 1-5 Year U.S. Aggregate Bond ETF | | | N/A | | | | N/A | | | | N/A | | | | N/A | |
| | | | | | | | | | | | | | | | |
Fiscal Year Ended July 31, 2017 | | Total Non-Audit Fees
Billed to Trust | | | Total Non-Audit Fees
billed to Adviser and
Affiliated Fund Service
Providers (engagements
related directly to the
operations and financial
reporting of the Trust) | | | Total Non-Audit Fees
billed to Adviser and
Affiliated Fund Service
Providers (all other
engagements) | | | Total | |
Fund Name | | | | | | | | | | | | | | | | |
NuShares Enhanced Yield U.S. Aggregate Bond ETF | | | 0 | | | | 0 | | | | 0 | | | | 0 | |
NuShares Enhanced Yield 1-5 Year U.S. Aggregate Bond ETF | | | 0 | | | | 0 | | | | 0 | | | | 0 | |
| | | | | | | | | | | | | | | | |
Total | | $ | 0 | | | $ | 0 | | | $ | 0 | | | $ | 0 | |
“Non-Audit Fees” for both fiscal year ends represent “Tax Fees” and “All Other Fees” in their respective amounts from the previous table.
Less than 50 percent of the hours expended on the principal accountant’s engagement to audit the registrant’s financial statements for the most recent fiscal year were attributed to work performed by persons other than the principal accountant’s full-time, permanent employees.
| | | | | | | | | | | | | | | | |
Fiscal Year Ended July 31, 2016 | | Total Non-Audit Fees
Billed to Trust | | | Total Non-Audit Fees
billed to Adviser and
Affiliated Fund Service
Providers (engagements
related directly to the
operations and financial
reporting of the Trust) | | | Total Non-Audit Fees
billed to Adviser and
Affiliated Fund Service
Providers (all other
engagements) | | | Total | |
Fund Name | | | | | | | | | | | | | | | | |
NuShares Enhanced Yield U.S. Aggregate Bond ETF | | | N/A | | | | N/A | | | | N/A | | | | N/A | |
NuShares Enhanced Yield 1-5 Year U.S. Aggregate Bond ETF | | | N/A | | | | N/A | | | | N/A | | | | N/A | |
| | | | | | | | | | | | | | | | |
Total | | | N/A | | | | N/A | | | | N/A | | | | N/A | |
“Non-Audit Fees” for both fiscal year ends represent “Tax Fees” and “All Other Fees” in their respective amounts from the previous table.
Audit Committee Pre-Approval Policies and Procedures. Generally, the Audit Committee must approve (i) all non-audit services to be performed for the Funds by the Funds’ independent accountant and (ii) all audit and non-audit services to be performed by the Funds’ independent accountant for the Affiliated Fund Service Providers with respect to the operations and financial reporting of the Funds. Regarding tax and research projects conducted by the independent accountant for the Funds and Affiliated Fund Service Providers (with respect to operations and financial reports of the Trust), such engagements will be (i) pre-approved by the Audit Committee if they are expected to be for amounts greater than $10,000; (ii) reported to the Audit Committee Chairman for his verbal approval prior to engagement if they are expected to be for amounts under $10,000 but greater than $5,000; and (iii) reported to the Audit Committee at the next Audit Committee meeting if they are expected to be for an amount under $5,000.
ITEM 5. AUDIT COMMITTEE OF LISTED REGISTRANTS.
The registrant is an issuer as defined in Rule 10A-3 under the Securities Exchange Act of 1934 (the “Exchange Act”). The registrant’s Board has a separately designated Audit Committee established in accordance with Section 3(a)(58)A of the Exchange Act. The members of the Audit Committee are Jack B. Evans, David J. Kundert, John K. Nelson, Carole E. Stone and Terence J. Toth.
ITEM 6. SCHEDULE OF INVESTMENTS.
| a) | | See Portfolio of Investments in Item 1. |
ITEM 7. DISCLOSURE OF PROXY VOTING POLICIES AND PROCEDURES FOR CLOSED-END
MANAGEMENT INVESTMENT COMPANIES.
Not applicable to this registrant.
ITEM 8. PORTFOLIO MANAGERS OF CLOSED-END MANAGEMENT INVESTMENT COMPANIES.
Not applicable to this registrant.
ITEM 9. PURCHASES OF EQUITY SECURITIES BY CLOSED-END MANAGEMENT INVESTMENT COMPANY AND AFFILIATED PURCHASERS.
Not applicable to this registrant.
ITEM 10. SUBMISSION OF MATTERS TO A VOTE OF SECURITY HOLDERS.
There have been no material changes to the procedures by which shareholders may recommend nominees to the registrant’s Board of Trustees implemented after the registrant last provided disclosure in response to this Item.
ITEM 11. CONTROLS AND PROCEDURES.
| | (a) | | The registrant’s principal executive and principal financial officers, or persons performing similar functions, have concluded that the registrant’s disclosure controls and procedures (as defined in Rule 30a-3(c) under the Investment Company Act of 1940, as amended (the “1940 Act”) (17 CFR 270.30a-3(c))) are effective, as of a date within 90 days of the filing date of this report that includes the disclosure required by this paragraph, based on their evaluation of the controls and procedures required by Rule 30a-3(b) under the 1940 Act (17 CFR 270.30a-3(b)) and Rules 13a-15(b) or 15d-15(b) under the Securities Exchange Act of 1934, as amended (the “Exchange Act”) (17 CFR 240.13a-15(b) or 240.15d-15(b)). |
| | (b) | | There were no changes in the registrant’s internal control over financial reporting (as defined in Rule 30a-3(d) under the 1940 Act (17 CFR 270.30a-3(d)) that occurred during the second fiscal quarter of the period covered by this report that has materially affected, or is reasonably likely to materially affect, the registrant’s internal control over financial reporting. |
ITEM 12. EXHIBITS.
File the exhibits listed below as part of this Form.
| | |
| (a)(1) | | Any code of ethics, or amendment thereto, that is the subject of the disclosure required by Item 2, to the extent that the registrant intends to satisfy the Item 2 requirements through filing of an exhibit: Not applicable because the code is posted on registrant’s website at www.nuveen.com/MutualFunds/ShareholderResources/FundGovernance.aspx and there were no amendments during the period covered by this report. (To view the code, click on Code of Conduct.) |
| |
| (a)(2) | | A separate certification for each principal executive officer and principal financial officer of the registrant as required by Rule 30a-2(a) under the 1940 Act (17 CFR 270.30a-2(a)) in the exact form set forth below: See EX-99.CERT attached hereto. |
| |
| (a)(3) | | Any written solicitation to purchase securities under Rule 23c-1 under the 1940 Act (17 CFR 270.23c-1) sent or given during the period covered by the report by or on behalf of the registrant to 10 or more persons: Not applicable to this registrant. |
| |
| (b) | | If the report is filed under Section 13(a) or 15(d) of the Exchange Act, provide the certifications required by Rule 30a-2(b) under the 1940 Act (17 CFR 270.30a-2(b)), Rule 13a-14(b) or Rule 15d-14(b) under the Exchange Act (17 CFR 240.13a-14(b) or 240.15d-14(b)), and Section 1350 of Chapter 63 of Title 18 of the United States Code (18 U.S.C. 1350) as an Exhibit. A certification furnished pursuant to this paragraph will not be deemed “filed” for purposes of Section 18 of the Exchange Act (15 U.S.C. 78r), or otherwise subject to the liability of that section. Such certification will not be deemed to be incorporated by reference into any filing under the Securities Act of 1933 or the Exchange Act, except to the extent that the registration specifically incorporates it by reference: See EX-99.906 CERT attached hereto. |
SIGNATURES
Pursuant to the requirements of the Securities Exchange Act of 1934 and the Investment Company Act of 1940, the registrant has duly caused this report to be signed on its behalf by the undersigned, thereunto duly authorized.
(Registrant) NuShares ETF Trust
| | |
| |
| By (Signature and Title) | | /s/ Christopher M. Rohrbacher |
| | Christopher M. Rohrbacher |
| | Vice President and Secretary |
Date: October 6, 2017
Pursuant to the requirements of the Securities Exchange Act of 1934 and the Investment Company Act of 1940, this report has been signed below by the following persons on behalf of the registrant and in the capacities and on the dates indicated.
| | |
| |
| By (Signature and Title) | | /s/ Martin Kremenstein |
| | Martin Kremenstein |
| | Chief Administrative Officer |
| | (principal executive officer) |
Date: October 6, 2017
| | |
| |
| By (Signature and Title) | | /s/ Stephen D. Foy |
| | Stephen D. Foy |
| | Vice President and Controller |
| | (principal financial officer) |
Date: October 6, 2017