UNITED STATES
SECURITIES AND EXCHANGE COMMISSION
Washington, D.C. 20549
FORM N-CSR
CERTIFIED SHAREHOLDER REPORT OF REGISTERED MANAGEMENT
INVESTMENT COMPANIES
Investment Company Act file number 811-23161
NuShares ETF Trust
(Exact name of registrant as specified in charter)
Nuveen Investments
333 West Wacker Drive, Chicago, IL 60606
(Address of principal executive offices) (Zip code)
Christopher M. Rohrbacher
Nuveen Investments
333 West Wacker Drive
Chicago, IL 60606
(Name and address of agent for service)
Registrant’s telephone number, including area code: (312) 917-7700
Date of fiscal year end: October 31
Date of reporting period: October 31, 2017
Form N-CSR is to be used by management investment companies to file reports with the Commission not later than 10 days after the transmission to stockholders of any report that is required to be transmitted to stockholders under Rule 30e-1 under the Investment Company Act of 1940 (17 CFR 270.30e-1). The Commission may use the information provided on Form N-CSR in its regulatory, disclosure review, inspection, and policy making roles.
A registrant is required to disclose the information specified by Form N-CSR, and the Commission will make this information public. A registrant is not required to respond to the collection of information contained in Form N-CSR unless the Form displays a currently valid Office of Management and Budget (“OMB”) control number. Please direct comments concerning the accuracy of the information collection burden estimate and any suggestions for reducing the burden to Secretary, Securities and Exchange Commission, 450 Fifth Street, NW, Washington, DC 20549-0609. The OMB has reviewed this collection of information under the clearance requirements of 44 U.S.C. ss.3507.
ITEM 1. REPORTS TO STOCKHOLDERS.
| | | | | | | | | | |
| | | | | | | Listing Exchange | | Ticker Symbol |
| | | Fund Name | | | | | | | | |
|
| | Nushares ESG Emerging Markets Equity ETF | | | | Cboe BZX Exchange, Inc. | | NUEM | | |
| | Nushares ESG International Developed Markets Equity ETF | | | | Cboe BZX Exchange, Inc. | | NUDM | | |
| | Nushares ESG Large-Cap Growth ETF | | | | Cboe BZX Exchange, Inc. | | NULG | | |
| | Nushares ESG Large-Cap Value ETF | | | | Cboe BZX Exchange, Inc. | | NULV | | |
| | Nushares ESG Mid-Cap Growth ETF | | | | Cboe BZX Exchange, Inc. | | NUMG | | |
| | Nushares ESG Mid-Cap Value ETF | | | | Cboe BZX Exchange, Inc. | | NUMV | | |
| | Nushares ESG Small-Cap ETF | | | | Cboe BZX Exchange, Inc. | | NUSC | | |
| | | | | | | | | | | | |
| | | | | | |
| | | | |
| | | | | | | | |
| | |
| | Life is Complex. | | |
| | |
| | Nuveen makes things e-simple. | | |
| | |
| | It only takes a minute to sign up for e-Reports. Once enrolled, you’ll receive an e-mail as soon as your Nuveen Fund information is ready—no more waiting for delivery by regular mail. Just click on the link within the e-mail to see the report and save it on your computer if you wish. | | |
| | | | |
| | | | | | Free e-Reports right to your e-mail! | | |
| | | |
| | | | | | www.investordelivery.com If you receive your Nuveen Fund distributions and statements from your
financial advisor or brokerage account. |
| | | | |
| | | | or | | www.nuveen.com/accountaccess If you receive your Nuveen Fund distributions and statements directly from Nuveen. Must be preceded by or accompanied by a prospectus. NOT FDIC INSURED MAY LOSE VALUE
NO BANK GUARANTEE | | |
| | | | | | | | | | |
| | | | | | | | | | | | | |

Table
of Contents
Chairman’s Letter
to Shareholders

Dear Shareholders,
Asset prices have steadily climbed this year, propelled by a “Goldilocks” economic scenario that enabled markets to sidestep geopolitical tensions, natural disasters, terrorism events and political noise. The U.S. economy continued to run not too hot, not too cold, with steady growth and low levels of unemployment, inflation and interest rates. Corporate earnings have been healthy and recession risk appeared low. At the same time, growth across the rest of the world has improved as well, leading to upward revisions in global growth projections.
Yet, a global synchronized recovery also brings the prospect of higher inflation. Central banks have to manage the delicate balance between too-loose financial conditions, which risks economies overheating, and too-tight conditions, which could trigger recession. The nomination of Jerome Powell for Chairman of the U.S. Federal Reserve (Fed) is largely expected to maintain the course set by Chair Janet Yellen after her term expires in February 2018, and the much anticipated tax overhaul, passed at the end of December, may likely boost economic growth but could complicate the Fed’s job of managing interest rates in the years ahead.
Meanwhile, politics will remain in the forefront. A budget showdown is expected in 2018, as Congress sets to debate the U.S. debt ceiling limit and spending related to the military, disaster relief, the Children’s Health Insurance Program and immigration policy. In addition, the ongoing “Brexit” negotiations and the North American Free Trade Agreement (NAFTA) talks may impact key trade and political partnerships. Tensions with North Korea may continue to flare.
The magnitude of the market’s bullishness this year has been somewhat surprising, but gains may not be so easy in the coming years. Nobody can predict market shifts, and that is why Nuveen encourages you to talk to your financial advisor to ensure your investment portfolio is appropriately diversified for your objectives, time horizon and risk tolerance. On behalf of the other members of the Nuveen Fund Board, we look forward to continuing to earn your trust in the months and years ahead.
Sincerely,

William J. Schneider
Chairman of the Board
December 22, 2017
Portfolio Managers’
Comments
Nushares ESG Emerging Markets Equity ETF (NUEM)
Nushares ESG International Developed Markets Equity ETF (NUDM)
Nushares ESG Large-Cap Growth ETF (NULG)
Nushares ESG Large-Cap Value ETF (NULV)
Nushares ESG Mid-Cap Growth ETF (NUMG)
Nushares ESG Mid-Cap Value ETF (NUMV)
Nushares ESG Small-Cap ETF (NUSC)
These Funds features portfolio management by Teachers Advisors, LLC, an affiliate of Nuveen, LLC. Portfolio managers Philip James (Jim) Campagna, CFA, and Lei Liao, CFA, discuss U.S. economic and market conditions, key investment strategies and the performance of the Funds during the abbreviated annual reporting period. Jim and Lei have managed the Funds since their commencement of operations on December 13, 2016. For the Nushares ESG International Developed Markets Equity ETF (NUDM) and Nushares ESG Emerging Markets Equity ETF (NUEM), portfolio managers Philip James (Jim) Campagna, CFA, and Lei Liao, CFA, have managed these Funds during the abbreviated reporting period from the Funds’ commencement of operations on June 6, 2017 through October 31, 2017. Please refer to the Funds’ prospectuses for more information, available at https://www.nuveen.com/ETF/Default.aspx.
What factors affected the U.S. economy and the U.S. stock market during the abbreviated annual reporting period ended October 31, 2017?
The U.S. economy continued to expand at a below-trend pace in the reporting period overall but did mark two consecutive quarters of above 3% growth in the second and third quarters of 2017. The Bureau of Economic Analysis reported its “second” estimate of third-quarter gross domestic product (GDP) at an annualized rate of 3.3%, an increase from 3.1% in the second quarter, alleviating concerns that Hurricanes Harvey, Irma and Maria depressed the nation’s output. GDP is the value of goods and services produced by the nation’s economy less the value of the goods and services used up in production, adjusted for price changes. Despite some softening in shopping and dining out activity due to the hurricanes, consumer spending remained the main driver of demand in the economy. Business investment had been muted for most of the recovery but has accelerated in 2017, with the “hard” data now falling more in line with the highly optimistic business sentiment levels, or “soft” data, seen after President Trump won the election.
Elsewhere in the economy, the labor market continued to tighten, with unemployment staying below 5% over the course of the reporting period. As reported by the Bureau of Labor Statistics, the unemployment rate fell to 4.1% in October 2017 from 4.8% in October 2016 and job gains averaged around 167,000 per month for the past twelve months. Higher energy prices, especially gasoline, helped drive a steady increase in inflation over this reporting period. The Consumer Price Index (CPI) increased 2.0% over the twelve-month reporting period ended October 31, 2017 on a seasonally adjusted basis, as reported by the Bureau of Labor Statistics. The core CPI (which excludes food and energy) increased 1.8% during the same period, slightly below the Federal Reserve’s (Fed) unofficial longer term inflation objective of 2.0%. The housing market also continued to improve, with historically low mortgage rates and low inventory driving home prices higher. The S&P CoreLogic Case-Shiller U.S. National Home Price Index, which covers all
This material is not intended to be a recommendation or investment advice, does not constitute a solicitation to buy or sell securities, and is not provided in a fiduciary capacity. The information provided does not take into account the specific objectives or circumstances of any particular investor, or suggest any specific course of action. Investment decisions should be made based on an investor’s objectives and circumstances and in consultation with his or her advisors.
Certain statements in this report are forward-looking statements. Discussions of specific investments are for illustration only and are not intended as recommendations of individual investments. The forward-looking statements and other views expressed herein are those of the portfolio managers as of the date of this report. Actual future results or occurrences may differ significantly from those anticipated in any forward-looking statements and the views expressed herein are subject to change at any time, due to numerous market and other factors. Each Fund disclaims any obligation to update publicly or revise any forward-looking statements or views expressed herein.
Refer to the Glossary of Terms Used in this report for further definition of the terms used within this section.
Portfolio Managers’ Comments (continued)
nine U.S. census divisions, recorded a 6.2% annual gain in September 2017 (most recent data available at the time this report was prepared). The 10-City and 20-City Composites reported year-over-year increases of 5.7% and 6.2%, respectively.
With the U.S. economy delivering a sustainable, albeit muted, growth rate, the Fed’s policy making committee raised its main benchmark interest rate in December 2016, March 2017 and June 2017. These moves were widely expected by the markets, as were the Fed’s decisions to leave rates unchanged at the July, September and October/November 2017 meetings. (There was no August meeting.) The Fed also announced it would begin reducing its balance sheet in October 2017 by allowing a small amount of maturing Treasury and mortgage securities to roll off without reinvestment. The market expects the pace to remain moderate and predictable, with minimal market disruption. The Fed also signaled its intention to raise its target interest rate one more time in 2017.
While the markets remained comfortable with the course of monetary policy during this reporting period, the political environment was frequently a source of uncertainty. Markets were initially highly optimistic about pricing in the new administration’s “pro-growth” fiscal agenda after Donald Trump won the election. However, several attempts at health care reform were unable to pass in Congress, which weakened the outlook for the remainder of President Trump’s agenda. The hurricanes caused enormous devastation in Texas, Florida and Puerto Rico, which will require federal aid. The debt ceiling vote, expected to be a protracted showdown in Congress, turned out to be a non-event after the Republican president and Congressional Democrats reached a compromise in early September (although the debate will resume when the current extension expires in December 2017). As the reporting period ended, legislators were refocusing their efforts on tax reform and President Trump nominated Jerome Powell to replace Fed Chair Janet Yellen when her term ends in February 2018. Although both events were initially considered market friendly, the specifics of a tax reform bill, its implications for the economic and corporate landscapes and whether it passes remain to be seen and could pose challenges to the Fed’s ability to manage interest rates in the future (subsequent to the close of the reporting period, the tax bill was signed into law). Geopolitical risks also remained prominent throughout the reporting period, with the ongoing renegotiation of the North American Free Trade Agreement (NAFTA); the start of “Brexit” talks between the U.K. and European Union; closely watched elections in the Netherlands, France and Germany; and escalating tensions between the U.S. and North Korea.
The environment was strongly supportive to U.S. stock prices in the abbreviated reporting period. Stocks extended their gains on decent economic growth data and strong corporate profitability, especially in the information technology sector. Additionally, for the first time since the global financial crisis, economic growth outside the U.S. was showing evidence of improvement, particularly in Europe and Japan, or stabilization, in the case of emerging markets. Upgraded global growth forecasts further helped stocks shrug off geopolitical flare-ups, terrorist attacks, concerns about low global inflation and political uncertainties both at home and abroad.
What key strategies were used to manage the Funds during the abbreviated reporting period and how did these strategies influence performance?
These Funds employ a passive management (or “indexing”) approach, seeking to track the investment results, before fees and expenses, of their respective indexes that meet certain environment, social and governance (“ESG”) criteria. You cannot invest directly in an index. Each Fund seeks to track its index by investing all, or substantially all, of its assets in the securities represented in its index in approximately the same proportions as the index. Each Fund rebalances its holdings quarterly in response to the quarterly rebalance of its index, which occurs in February, May, August and November.
NUEM seeks to track the investment results, before fees and expenses, of the TIAA ESG Emerging Markets Equity Index (the “NUEM Index”), which is comprised solely of listed equity securities issued by companies (and depositary receipts representing such securities) located in countries with emerging markets that meet certain ESG criteria. The NUEM Index selects from the securities included in the MSCI Emerging Markets Index (the “NUEM Base Index”), which currently consists of large- and mid-capitalization companies located in one of the following 24 emerging market countries: Brazil, Chile, China, Colombia, Czech Republic, Egypt, Greece, Hungary, India, Indonesia, Korea, Malaysia, Mexico, Pakistan, Peru, Philippines, Poland, Qatar, Russia, South Africa, Taiwan, Thailand, Turkey and the United Arab Emirates.
NUDM seeks to track the investment results, before fees and expenses, of the TIAA ESG International Developed Markets Equity Index (the “NUDM Index”), which is comprised solely of listed equity securities issued by companies (and depositary receipts representing such securities) located in countries with developed markets, excluding the United States and Canada, that meet certain ESG criteria. The NUDM Index selects from the securities included in the MSCI EAFE Index (the “NUDM Base Index”), which currently
consists of large- and mid-capitalization companies located in one of the following 21 developed market countries: Australia, Austria, Belgium, Denmark, Finland, France, Germany, Hong Kong, Ireland, Israel, Italy, Japan, the Netherlands, New Zealand, Norway, Portugal, Singapore, Spain, Sweden, Switzerland and the United Kingdom.
NULG seeks to track the investment results, before fees and expenses, of the TIAA ESG USA Large-Cap Growth Index (the “NULG Index”), which is comprised of equity securities issued by large-capitalization companies listed on U.S. exchanges that meet certain ESG criteria. The NULG Index selects from the securities included in the MSCI USA Growth Index (the “NULG Base Index”), which generally consists of large- and mid-capitalization U.S. equity securities that exhibit overall growth style characteristics based on five variables: long-term forward earnings per share (“EPS”) growth rate, short-term forward EPS growth rate, current internal growth rate, long-term historical EPS growth trend, and long-term historical sales per share growth trend.
NULV seeks to track the investment results, before fees and expenses, of the TIAA ESG USA Large-Cap Value Index (the “NULV Index”), which is comprised of equity securities issued by large-capitalization companies listed on U.S. exchanges that meet certain ESG criteria. The NULV Index selects from the securities included in the MSCI USA Value Index (the “NULV Base Index”), which generally consists of large- and mid-capitalization U.S. equity securities that exhibit overall value style characteristics based on three variables: book value to price, 12-month forward earnings to price and dividend yield.
NUMG seeks to track the investment results, before fees and expenses, of the TIAA ESG USA Mid-Cap Growth Index (the “NUMG Index”), which is comprised of equity securities issued by mid-capitalization companies listed on U.S. exchanges that meet certain ESG criteria. The NUMG Index selects from the securities included in the MSCI USA Mid-Cap Growth Index (the “NUMG Base Index”), which generally consists of mid-capitalization U.S. equity securities that exhibit overall growth style characteristics based on five variables: long-term forward EPS growth rate, short-term forward EPS growth rate, current internal growth rate, long-term historical EPS growth trend and long-term historical sales per share growth trend.
NUMV seeks to track the investment results, before fees and expenses, of the TIAA ESG USA Mid-Cap Value Index (the “NUMV Index”), which is comprised of equity securities issued by mid-capitalization companies listed on U.S. exchanges that meet certain ESG criteria. The NUMV Index selects from the securities included in the MSCI USA Mid-Cap Value Index (the “NUMV Base Index”), which generally consists of mid-capitalization U.S. equity securities that exhibit overall value style characteristics based on three variables: book value to price, 12-month forward earnings to price and dividend yield.
NUSC seeks to track the investment results, before fees and expenses, of the TIAA ESG USA Small-Cap Index (the “NUSC Index”), which is comprised of equity securities issued by small-capitalization companies listed on U.S. exchanges that meet certain ESG criteria. The NUSC Index selects from the securities included in the MSCI USA Small Cap Index (the “NUSC Base Index”), which generally consists of equity securities that comprise the small-cap segment of the U.S. market.
MSCI Inc. (“MSCI”) is the index provider for each Index and Base Index. Each Index and Base Index are owned, calculated and controlled by MSCI, in its sole discretion. Neither the sub-adviser nor its affiliates has any discretion to select Index components or change the Index methodology. Each Index identifies equity securities from its Base Index that satisfy certain ESG criteria, based on ESG performance data collected by MSCI ESG Research, Inc. ESG performance is measured on an industry-specific basis, with assessment categories varying by industry.
For the five U.S. Funds, performance was driven by style and market cap trends. For the period from the Funds’ inception on December 13, 2016 through October 31, 2017, growth-style stocks decisively outperformed value-style stocks. On a market capitalization basis, large-cap growth stocks led, followed by mid-cap growth stocks and small-cap stocks. The gains of large-cap value and mid-cap value stocks trailed those of their growth-stock counterparts. Accordingly, among the five Funds, NULG was the top performing Fund and NUMV posted the smallest gain in this abbreviated reporting period. The outperformance of the information technology sector helped drive the strong returns in NULG, NUMG and NUSC, as it was the largest sector weighting in the three Funds. In contrast, the largest sector exposure in the value-style funds, NULV and NUMV, was financials. The financials sector performed well in the abbreviated reporting period but lagged the rally in information technology shares.
The two international Funds, NUDM and NUEM, were measured over a shorter timeframe than the five U.S. Funds. From NUDM and NUEM’s inception on June 6, 2017 to October 31, 2017, international stocks delivered positive returns overall, with NUEM leading
Portfolio Managers’ Comments (continued)
performance over NUDM due to the outperformance of emerging market stocks over developed market stocks. The two Funds benefited from the strong performance of economically sensitive sectors, such as information technology, financials, consumer discretionary and industrials, where the Funds held larger exposures.
How did the Funds perform in the abbreviated reporting period ended October 31, 2017?
The tables in each Fund’s Performance Overview and Expense Ratios section of this report provides the Funds’ total return performance for the abbreviated reporting period from the Funds’ commencement of operation on December 13, 2016 through October 31, 2017 or June 6, 2017 through October 31, 2017. Each Fund’s total returns at net asset value (NAV) are compared with the performance of the Index, which each Fund is designed to track.
The total return for each Fund slightly trailed that of its respective Index over this abbreviated reporting period. The trailing performance is primarily attributable to fees and expenses. The Indexes are unmanaged and therefore their returns do not reflect any fees or expenses, which would detract from their performance. You cannot invest directly in an index.
Risk Considerations
Nushares ESG Emerging Markets Equity ETF (NUEM)
Investing involves risk; principal loss is possible. There is no guarantee the Fund’s investment objectives will be achieved. This ETF seeks to generally track the investment results of an index; however the Fund may underperform, outperform or be more volatile than the referenced index. Non-U.S. investments involve risks such as currency fluctuation, political and economic instability, lack of liquidity and differing legal and accounting standards. These risks are magnified in emerging markets. In addition, because the Index selects securities for inclusion based on environmental, social, and governance (ESG) criteria, the Fund may forgo some market opportunities available to funds that don’t use these criteria. A portfolio concentrated in a single industry sector or country may present more risk than a portfolio broadly diversified over several industries or countries. These and other risks, such as mid-cap stock risk, are described in the Fund’s prospectus.
Nushares ESG International Developed Markets Equity ETF (NUDM)
Investing involves risk; principal loss is possible. There is no guarantee the Fund’s investment objectives will be achieved. An exchange-traded fund seeks to generally track the investment results of an index; however the Fund may underperform, outperform or be more volatile than the referenced index. Non-U.S. investments involve risks such as currency fluctuation, political and economic instability, lack of liquidity and differing legal and accounting standards. In addition, because the Index selects securities for inclusion based on environmental, social, and governance (ESG) criteria, the Fund may forgo some market opportunities available to funds that don’t use these criteria. A portfolio concentrated in a single industry sector or country may present more risk than a portfolio broadly diversified over several industries or countries. These and other risks, such as mid-cap stock risk, are described in the Fund’s prospectus.
Nushares ESG Large-Cap Growth ETF (NULG)
Investing involves risk; principal loss is possible. There is no guarantee the Fund’s investment objectives will be achieved. This ETF seeks to generally track the investment results of an index; however the Fund may underperform, outperform or be more volatile than the referenced index. In addition, because the Index selects securities for inclusion based on environmental, social, and governance (ESG) criteria, the Fund may forgo some market opportunities available to funds that don’t use these criteria. The value of equity securities may decline significantly over short or extended periods of time. Growth stocks tend to be more volatile and can experience sharp price declines. Because it invests primarily in large-capitalization stocks, the Fund may underperform funds that invest primarily in stocks of smaller capitalization companies during periods when the stocks of such companies are in favor. These and other risk considerations are described in detail in the Fund’s prospectus.
Nushares ESG Large-Cap Value ETF (NULV)
Investing involves risk; principal loss is possible. There is no guarantee the Fund’s investment objectives will be achieved. This ETF seeks to generally track the investment results of an index; however the Fund may underperform, outperform or be more volatile than the referenced index. In addition, because the Index selects securities for inclusion based on environmental, social, and governance (ESG) criteria, the Fund may forgo some market opportunities available to funds that don’t use these criteria. The value of equity securities may decline significantly over short or extended periods of time. Value stocks may not be fully recognized by the market and be undervalued. Because it invests primarily in large-capitalization stocks, the Fund may underperform funds that invest primarily in stocks of smaller capitalization companies during periods when the stocks of such companies are in favor. These and other risk considerations are described in detail in the Fund’s prospectus.
Risk Considerations (continued)
Nushares ESG Mid-Cap Growth ETF (NUMG)
Investing involves risk; principal loss is possible. There is no guarantee the Fund’s investment objectives will be achieved. This ETF seeks to generally track the investment results of an index; however the Fund may underperform, outperform or be more volatile than the referenced index. In addition, because the Index selects securities for inclusion based on environmental, social, and governance (ESG) criteria, the Fund may forgo some market opportunities available to funds that don’t use these criteria. The value of equity securities may decline significantly over short or extended periods of time. Because it invests primarily in mid-capitalization stocks, the Fund may be subject to greater volatility than those that invest in larger companies, but may be less volatile than investments in smaller companies. Growth stocks tend to be more volatile and can experience sharp price declines. These and other risk considerations are described in detail in the Fund’s prospectus.
Nushares ESG Mid-Cap Value ETF (NUMV)
Investing involves risk; principal loss is possible. There is no guarantee the Fund’s investment objectives will be achieved. This ETF seeks to generally track the investment results of an index; however the Fund may underperform, outperform or be more volatile than the referenced index. In addition, because the Index selects securities for inclusion based on environmental, social, and governance (ESG) criteria, the Fund may forgo some market opportunities available to funds that don’t use these criteria. The value of equity securities may decline significantly over short or extended periods of time. Value stocks may not be fully recognized by the market and be undervalued. Because it invests primarily in mid-capitalization stocks, the Fund may be subject to greater volatility than those that invest in larger companies, but may be less volatile than investments in smaller companies. These and other risk considerations are described in detail in the Fund’s prospectus.
Nushares ESG Small-Cap ETF (NUSC)
Investing involves risk; principal loss is possible. There is no guarantee the Fund’s investment objectives will be achieved. This ETF seeks to generally track the investment results of an index; however the Fund may underperform, outperform or be more volatile than the referenced index. In addition, because the Index selects securities for inclusion based on environmental, social, and governance (ESG) criteria, the Fund may forgo some market opportunities available to funds that don’t use these criteria. The value of equity securities may decline significantly over short or extended periods of time. Investments in smaller companies are subject to greater volatility than those of larger companies. These and other risk considerations are described in detail in the Fund’s prospectus.
Fund Performance
and Expense Ratios
The Fund Performance and Expense Ratio for each Fund are shown within this section of the report.
Returns quoted represent past performance, which is no guarantee of future results. Investment returns and principal value will fluctuate so that when shares are sold, they may be worth more or less than their original cost. Current performance may be higher or lower than the performance shown. Total returns for a period of less than one year are not annualized. Returns assume reinvestment of dividends and capital gains. Market price returns are based on the closing market price as of the end of the reporting period. For performance current to the most recent month-end visit nuveen.com or call (800) 257-8787.
Returns do not reflect the deduction of taxes that a shareholder would pay on Fund distributions or the sale of Fund shares.
The expense ratios represents each Fund’s total operating expenses as reflected in the most recent prospectus. The expense ratios shown include management fees and other applicable fees and expenses paid by the Fund.
Fund Performance and Expense Ratios (continued)
Nushares ESG Emerging Markets Equity ETF (NUEM)
Refer to the first page of this Fund Performance and Expense Ratios section for further explanation of the information included within this section. Refer to the Glossary of Terms Used in this Report for definitions of terms used within this section.
Fund Performance
Total Returns as of October 31, 2017
| | | | |
| | | Cumulative | |
| | | Since
Inception | |
NUEM at NAV | | | 11.03% | |
NUEM at Market Price | | | 12.42% | |
TIAA ESG Emerging Markets Equity Index | | | 11.57% | |
MSCI Emerging Markets Index | | | 11.56% | |
Total Returns as of September 30, 2017 (Most Recent Calendar Quarter)
| | | | |
| | | Cumulative | |
| | | Since
Inception | |
NUEM at NAV | | | 7.28% | |
NUEM at Market Price | | | 8.69% | |
Since inception returns are from 6/6/17. Indexes are not available for direct investment.
Expense Ratio as of Most Recent Prospectus
Growth of an Assumed $10,000 Investment as of October 31, 2017
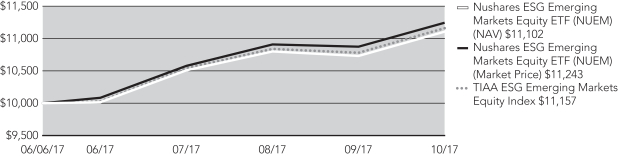
The graph does not reflect the deduction of taxes that a shareholder may pay on Fund distributions or the redemption of Fund shares.
Fund Performance and Expense Ratios (continued)
Nushares ESG International Developed Markets Equity ETF (NUDM)
Refer to the first page of this Fund Performance and Expense Ratios section for further explanation of the information included within this section. Refer to the Glossary of Terms Used in this Report for definitions of terms used within this section.
Fund Performance
Total Returns as of October 31, 2017
| | | | |
| | | Cumulative | |
| | | Since
Inception | |
NUDM at NAV | | | 6.07% | |
NUDM at Market Price | | | 6.78% | |
TIAA ESG International Developed Markets Equity Index | | | 6.34% | |
MSCI EAFE Index | | | 5.95% | |
Total Returns as of September 30, 2017 (Most Recent Calendar Quarter)
| | | | |
| | | Cumulative | |
| | | Since
Inception | |
NUDM at NAV | | | 4.16% | |
NUDM at Market Price | | | 4.13% | |
Since inception returns are from 6/6/17. Indexes are not available for direct investment.
Expense Ratio as of Most Recent Prospectus
Growth of an Assumed $10,000 Investment as of October 31, 2017
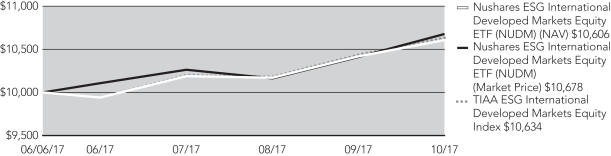
The graph does not reflect the deduction of taxes that a shareholder may pay on Fund distributions or the redemption of Fund shares.
Fund Performance and Expense Ratios (continued)
Nushares ESG Large-Cap Growth ETF (NULG)
Refer to the first page of this Fund Performance and Expense Ratios section for further explanation of the information included within this section. Refer to the Glossary of Terms Used in this Report for definitions of terms used within this section.
Fund Performance
Total Returns as of October 31, 2017
| | | | |
| | | Cumulative | |
| | | Since
Inception | |
NULG at NAV | | | 20.88% | |
NULG at Market Price | | | 21.10% | |
TIAA ESG USA Large-Cap Growth Index | | | 21.29% | |
MSCI USA Growth Index | | | 21.83% | |
Total Returns as of September 30, 2017 (Most Recent Calendar Quarter)
| | | | |
| | | Cumulative | |
| | | Since
Inception | |
NULG at NAV | | | 17.33% | |
NULG at Market Price | | | 17.17% | |
Since inception returns are from 12/13/16. Indexes are not available for direct investment.
Expense Ratio as of Most Recent Prospectus
Growth of an Assumed $10,000 Investment as of October 31, 2017
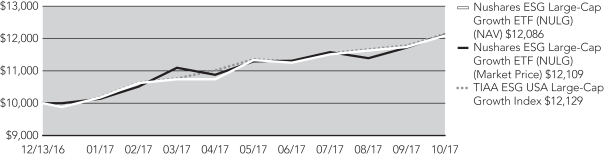
The graph does not reflect the deduction of taxes that a shareholder may pay on Fund distributions or the redemption of Fund shares.
Fund Performance and Expense Ratios (continued)
Nushares ESG Large-Cap Value ETF (NULV)
Refer to the first page of this Fund Performance and Expense Ratios section for further explanation of the information included within this section. Refer to the Glossary of Terms Used in this Report for definitions of terms used within this section.
Fund Performance
Total Returns as of October 31, 2017
| | | | |
| | | Cumulative | |
| | | Since
Inception | |
NULV at NAV | | | 10.90% | |
NULV at Market Price | | | 11.11% | |
TIAA ESG USA Large-Cap Value Index | | | 11.24% | |
MSCI USA Value Index | | | 9.31% | |
Total Returns as of September 30, 2017 (Most Recent Calendar Quarter)
| | | | |
| | | Cumulative | |
| | | Since
Inception | |
NULV at NAV | | | 8.75% | |
NULV at Market Price | | | 8.80% | |
Since inception returns are from 12/13/16. Indexes are not available for direct investment.
Expense Ratio as of Most Recent Prospectus
Growth of an Assumed $10,000 Investment as of October 31, 2017
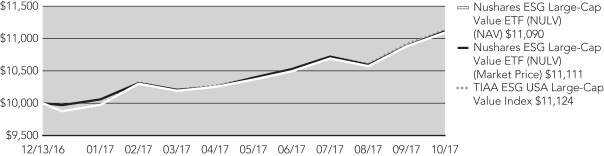
The graph does not reflect the deduction of taxes that a shareholder may pay on Fund distributions or the redemption of Fund shares.
Fund Performance and Expense Ratios (continued)
Nushares ESG Mid-Cap Growth ETF (NUMG)
Refer to the first page of this Fund Performance and Expense Ratios section for further explanation of the information included within this section. Refer to the Glossary of Terms Used in this Report for definitions of terms used within this section.
Fund Performance
Total Returns as of October 31, 2017
| | | | |
| | | Cumulative | |
| | | Since
Inception | |
NUMG at NAV | | | 13.30% | |
NUMG at Market Price | | | 13.38% | |
TIAA ESG USA Mid-Cap Growth Index | | | 13.74% | |
MSCI USA Mid-Cap Growth Index | | | 13.75% | |
Total Returns as of September 30, 2017 (Most Recent Calendar Quarter)
| | | | |
| | | Cumulative | |
| | | Since
Inception | |
NUMG at NAV | | | 10.68% | |
NUMG at Market Price | | | 10.39% | |
Since inception returns are from 12/13/16. Indexes are not available for direct investment.
Expense Ratio as of Most Recent Prospectus
Growth of an Assumed $10,000 Investment as of October 31, 2017
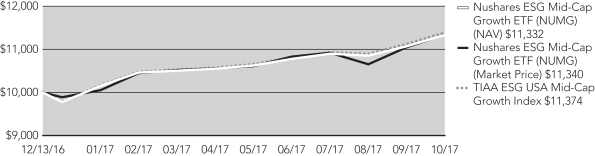
The graph does not reflect the deduction of taxes that a shareholder may pay on Fund distributions or the redemption of Fund shares.
Fund Performance and Expense Ratios (continued)
Nushares ESG Mid-Cap Value ETF (NUMV)
Refer to the first page of this Fund Performance and Expense Ratios section for further explanation of the information included within this section. Refer to the Glossary of Terms Used in this Report for definitions of terms used within this section.
Fund Performance
Total Returns as of October 31, 2017
| | | | |
| | | Cumulative | |
| | | Since
Inception | |
NUMV at NAV | | | 7.82% | |
NUMV at Market Price | | | 7.86% | |
TIAA ESG USA Mid-Cap Value Index | | | 8.21% | |
MSCI USA Mid-Cap Value Index | | | 9.25% | |
Total Returns as of September 30, 2017 (Most Recent Calendar Quarter)
| | | | |
| | | Cumulative | |
| | | Since
Inception | |
NUMV at NAV | | | 6.80% | |
NUMV at Market Price | | | 5.90% | |
Since inception returns are from 12/13/16. Indexes are not available for direct investment.
Expense Ratio as of Most Recent Prospectus
Growth of an Assumed $10,000 Investment as of October 31, 2017
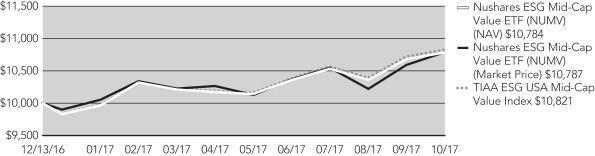
The graph does not reflect the deduction of taxes that a shareholder may pay on Fund distributions or the redemption of Fund shares.
Fund Performance and Expense Ratios (continued)
Nushares ESG Small-Cap ETF (NUSC)
Refer to the first page of this Fund Performance and Expense Ratios section for further explanation of the information included within this section. Refer to the Glossary of Terms Used in this Report for definitions of terms used within this section.
Fund Performance
Total Returns as of October 31, 2017
| | | | |
| | | Cumulative | |
| | | Since
Inception | |
NUSC at NAV | | | 11.34% | |
NUSC at Market Price | | | 11.54% | |
TIAA ESG USA Small-Cap Index | | | 11.78% | |
MSCI USA Small-Cap Index | | | 12.12% | |
Total Returns as of September 30, 2017 (Most Recent Calendar Quarter)
| | | | |
| | | Cumulative | |
| | | Since
Inception | |
NUSC at NAV | | | 9.68% | |
NUSC at Market Price | | | 10.20% | |
Since inception returns are from 12/13/16. Indexes are not available for direct investment.
Expense Ratio as of Most Recent Prospectus
Growth of an Assumed $10,000 Investment as of October 31, 2017
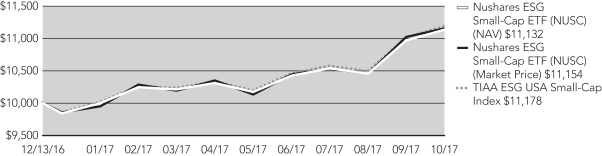
The graph does not reflect the deduction of taxes that a shareholder may pay on Fund distributions or the redemption of Fund shares.
Holding
Summaries as of October 31, 2017
This data relates to the securities held in each Fund’s portfolio of investments as of the end of this reporting period. It should not be construed as a measure of performance for the Fund itself. Holdings are subject to change.
Nushares ESG Emerging Markets Equity ETF (NUEM)
Fund Allocation
(% of net assets)
| | | | |
Common Stocks | | | 100.1% | |
Common Stock Rights | | | 0.0% | |
Other Assets Less Liabilities | | | (0.1)% | |
Net Assets | | | 100% | |
Top Five Common Stock Holdings
(% of net assets)
| | | | |
Tencent Holdings Limited | | | 6.2% | |
Taiwan Semiconductor Manufacturing Company Limited | | | 4.7% | |
Naspers Limited | | | 2.4% | |
Geely Automobile Holdings Limited | | | 1.8% | |
NHN Corporation | | | 1.8% | |
Portfolio Composition
(% of net assets)
| | | | |
Financials | | | 24.6% | |
Information Technology | | | 24.3% | |
Consumer Discretionary | | | 13.2% | |
Materials | | | 7.9% | |
Industrials | | | 7.2% | |
Consumer Staples | | | 5.6% | |
Other | | | 17.3% | |
Other Assets Less Liabilities | | | (0.1)% | |
Net Assets | | | 100% | |
Country Allocation
(% of net assets)
| | | | |
China | | | 28.9% | |
Korea, Republic Of | | | 14.9% | |
Taiwan | | | 12.2% | |
India | | | 8.5% | |
Brazil | | | 7.4% | |
South Africa | | | 6.9% | |
Mexico | | | 3.1% | |
Malaysia | | | 2.6% | |
Thailand | | | 2.2% | |
Chile | | | 1.9% | |
Other | | | 11.5% | |
Other Assets Less Liabilities | | | (0.1)% | |
Net Assets | | | 100% | |
Nushares ESG International Developed Markets Equity ETF (NUDM)
Fund Allocation
(% of net assets)
| | | | |
Common Stocks | | | 98.6% | |
Common Stock Rights | | | 0.0% | |
Other Assets Less Liabilities | | | 1.4% | |
Net Assets | | | 100% | |
Top Five Common Stocks Holdings
(% of net assets)
| | | | |
Nestle SA | | | 3.0% | |
Roche Holdings AG, Sponsored ADR | | | 2.1% | |
Siemens AG, Sponsored ADR | | | 2.0% | |
Banco Santander S.A. | | | 1.9% | |
Astrazeneca PLC | | | 1.7% | |
Portfolio Composition
(% of net assets)
| | | | |
Financials | | | 20.2% | |
Industrials | | | 15.9% | |
Consumer Discretionary | | | 11.8% | |
Consumer Staples | | | 11.2% | |
Health Care | | | 10.6% | |
Materials | | | 8.2% | |
Information Technology | | | 6.2% | |
Other | | | 14.5% | |
Other Assets Less Liabilities | | | 1.4% | |
Net Assets | | | 100% | |
Country Allocation
(% of net assets)
| | | | |
Japan | | | 23.9% | |
United Kingdom | | | 16.9% | |
France | | | 10.6% | |
Germany | | | 9.8% | |
Switzerland | | | 7.9% | |
Australia | | | 6.6% | |
Netherlands | | | 3.5% | |
Spain | | | 3.5% | |
Sweden | | | 3.0% | |
Italy | | | 2.4% | |
Other | | | 10.5% | |
Other Assets Less Liabilities | | | 1.4% | |
Net Assets | | | 100% | |
Holding Summaries as of October 31, 2017 (continued)
Nushares ESG Large-Cap Growth ETF (NULG)
Fund Allocation
(% of net assets)
| | | | |
Common Stocks | | | 99.7% | |
Other Assets Less Liabilities | | | 0.3% | |
Net Assets | | | 100% | |
Portfolio Composition
(% of net assets)
| | | | |
Information Technology | | | 36.6% | |
Consumer Discretionary | | | 19.7% | |
Health Care | | | 13.5% | |
Industrials | | | 11.6% | |
Consumer Staples | | | 5.5% | |
Financials | | | 5.5% | |
Other | | | 7.3% | |
Other Assets Less Liabilities | | | 0.3% | |
Net Assets | | | 100% | |
Top Five Common Stock Holdings
(% of net assets)
| | | | |
Apple, Inc. | | | 8.4% | |
Microsoft Corporation | | | 3.9% | |
Alphabet Inc., Class C Shares | | | 3.4% | |
Alphabet Inc., Class A Shares | | | 3.2% | |
Oracle Corporation | | | 2.5% | |
Nushares ESG Large-Cap Value ETF (NULV)
Fund Allocation
(% of net assets)
| | | | |
Common Stocks | | | 99.8% | |
Other Assets Less Liabilities | | | 0.2% | |
Net Assets | | | 100% | |
Portfolio Composition
(% of net assets)
| | | | |
Financials | | | 26.2% | |
Health Care | | | 12.7% | |
Information Technology | | | 12.3% | |
Consumer Staples | | | 10.2% | |
Industrials | | | 9.5% | |
Utilities | | | 6.6% | |
Energy | | | 6.5% | |
Other | | | 15.8% | |
Other Assets Less Liabilities | | | 0.2% | |
Net Assets | | | 100% | |
Top Five Common Stocks Holdings
(% of net assets)
| | | | |
Johnson & Johnson | | | 4.6% | |
Microsoft Corporation | | | 4.1% | |
Bank of America Corporation | | | 3.8% | |
Intel Corporation | | | 3.5% | |
Proctor & Gamble Company | | | 3.1% | |
Holding Summaries as of October 31, 2017 (continued)
Nushares ESG Mid-Cap Growth ETF (NUMG)
Fund Allocation
(% of net assets)
| | | | |
Common Stocks | | | 99.9% | |
Other Assets Less Liabilities | | | 0.1% | |
Net Assets | | | 100% | |
Portfolio Composition
(% of net assets)
| | | | |
Information Technology | | | 25.5% | |
Industrials | | | 22.0% | |
Consumer Discretionary | | | 15.0% | |
Health Care | | | 14.7% | |
Real Estate | | | 6.1% | |
Financials | | | 5.9% | |
Other | | | 10.7% | |
Other Assets Less Liabilities | | | 0.1% | |
Net Assets | | | 100% | |
Top Five Common Stock Holdings
(% of net assets)
| | | | |
ServiceNow Inc. | | | 2.5% | |
SBA Communications Corporation | | | 2.3% | |
Workday Inc., Class A | | | 2.1% | |
CarMax, Inc. | | | 2.0% | |
Idexx Labs Inc. | | | 2.0% | |
Nushares ESG Mid-Cap Value ETF (NUMV)
Fund Allocation
(% of net assets)
| | | | |
Common Stocks | | | 99.8% | |
Other Assets Less Liabilities | | | 0.2% | |
Net Assets | | | 100% | |
Portfolio Composition
(% of net assets)
| | | | |
Financials | | | 26.1% | |
Consumer Discretionary | | | 15.5% | |
Real Estate | | | 13.3% | |
Materials | | | 13.3% | |
Industrials | | | 7.9% | |
Information Technology | | | 7.3% | |
Health Care | | | 5.1% | |
Other | | | 11.3% | |
Other Assets Less Liabilities | | | 0.2% | |
Net Assets | | | 100% | |
Top Five Common Stock Holdings
(% of net assets)
| | | | |
Microchip Technology Incorporated | | | 2.9% | |
Principal Financial Group, Inc. | | | 2.5% | |
Citizens Financial Group Inc. | | | 2.5% | |
Eversource Energy | | | 2.5% | |
WestRock Company | | | 2.4% | |
Holding Summaries as of October 31, 2017 (continued)
Nushares ESG Small-Cap ETF (NUSC)
Fund Allocation
(% of net assets)
| | | | |
Common Stocks | | | 99.9% | |
Other Assets Less Liabilities | | | 0.1% | |
Net Assets | | | 100% | |
Portfolio Composition
(% of net assets)
| | | | |
Information Technology | | | 17.2% | |
Industrials | | | 16.1% | |
Financials | | | 15.8% | |
Health Care | | | 12.0% | |
Consumer Discretionary | | | 11.2% | |
Real Estate | | | 9.8% | |
Materials | | | 5.9% | |
Other | | | 11.9% | |
Other Assets Less Liabilities | | | 0.1% | |
Net Assets | | | 100% | |
Top Five Common Stock Holdings
(% of net assets)
| | | | |
First American Corporation | | | 0.9% | |
Take-Two Interactive Software, Inc. | | | 0.8% | |
Aqua America Inc. | | | 0.7% | |
ON Semiconductor Corporation | | | 0.6% | |
White Mountain Insurance Group | | | 0.6% | |
Expense
Examples
As a shareholder of one or more of the Funds, you incur two types of costs: (1) transaction costs, including brokerage commissions on purchases and sales of Fund shares, and (2) ongoing costs, including management fees and other applicable Fund expenses. The Examples below are intended to help you understand your ongoing costs (in dollars) of investing in the Funds and to compare these costs with the ongoing costs of investing in other funds. Since NUEM’s and NUDM’s expense examples below reflect only the first 148 days of the Fund’s operations, they may not provide a meaningful understanding of each Fund’s ongoing expenses.
The Examples below are based on an investment of $1,000 invested at the beginning of the period and held through October 31, 2017.
The beginning of the period of NUEM and NUDM is June 6, 2017 (commencement of operations). The beginning of the period for NULG, NULV, NUMG, NUMV and NUSC is May 1, 2017.
The information under “Actual Performance,” together with the amount you invested, allows you to estimate actual expenses incurred over the reporting period. Simply divide your account value by $1,000 (for example, an $8,600 account value divided by $1,000 = 8.60) and multiply the result by the cost shown for your Fund in the row entitled “Expenses Incurred During Period” to estimate the expenses incurred on your account during this period.
The information under “Hypothetical Performance” provides information about hypothetical account values and hypothetical expenses based on each Fund’s actual expense ratio and an assumed rate of return of 5% per year before expenses, which is not the Fund’s actual return. The hypothetical account values and expenses may not be used to estimate the actual ending account balance or expense you incurred for the period. You may use this information to compare the ongoing costs of investing in the Fund and other funds. To do so, compare this 5% hypothetical example with the 5% hypothetical examples that appear in the shareholder reports of the other funds.
Please note that the expenses shown in the tables are meant to highlight your ongoing costs only and do not reflect any transaction costs. Therefore, the hypothetical information is useful in comparing ongoing costs only, and will not help you determine the relative total costs of owning different funds. In addition, if these transaction costs were included, your costs would have been higher.
Nushares ESG Emerging Markets Equity ETF (NUEM)
| | | | |
Actual Performance | | | | |
Beginning Account Value | | $ | 1,000.00 | |
Ending Account Value | | $ | 1,110.30 | |
Expenses Incurred During Period | | $ | 1.93 | |
Hypothetical Performance (5% annualized return before expenses) | | | | |
Beginning Account Value | | $ | 1,000.00 | |
Ending Account Value | | $ | 1,018.45 | |
Expenses Incurred During Period | | $ | 1.84 | |
Expenses are equal to the Fund’s annualized net expense ratio of 0.45% multiplied by the average account value over the period, multiplied by 148/365 (to reflect the 148 days in the period since commencement of operations).
Expense Examples (continued)
Nushares ESG International Developed Markets Equity ETF (NUDM)
| | | | |
Actual Performance | | | | |
Beginning Account Value | | $ | 1,000.00 | |
Ending Account Value | | $ | 1,060.70 | |
Expenses Incurred During Period | | $ | 1.67 | |
Hypothetical Performance (5% annualized return before expenses) | | | | |
Beginning Account Value | | $ | 1,000.00 | |
Ending Account Value | | $ | 1,018.65 | |
Expenses Incurred During Period | | $ | 1.64 | |
Expenses are equal to the Fund’s annualized net expense ratio of 0.40% multiplied by the average account value over the period, multiplied by 148/365 (to reflect the 148 days in the period since commencement of operations).
Nushares ESG Large-Cap Growth ETF (NULG)
| | | | |
Actual Performance | | | | |
Beginning Account Value | | $ | 1,000.00 | |
Ending Account Value | | $ | 1,100.40 | |
Expenses Incurred During Period | | $ | 1.85 | |
Hypothetical Performance (5% annualized return before expenses) | | | | |
Beginning Account Value | | $ | 1,000.00 | |
Ending Account Value | | $ | 1,023.44 | |
Expenses Incurred During Period | | $ | 1.79 | |
Expenses are equal to the Fund’s annualized net expense ratio of 0.35% multiplied by the average account value over the period, multiplied by 184/365 (to reflect the one-half year period).
Nushares ESG Large-Cap Value ETF (NULV)
| | | | |
Actual Performance | | | | |
Beginning Account Value | | $ | 1,000.00 | |
Ending Account Value | | $ | 1,081.90 | |
Expenses Incurred During Period | | $ | 1.84 | |
Hypothetical Performance (5% annualized return before expenses) | | | | |
Beginning Account Value | | $ | 1,000.00 | |
Ending Account Value | | $ | 1,023.44 | |
Expenses Incurred During Period | | $ | 1.79 | |
Expenses are equal to the Fund’s annualized net expense ratio of 0.35% multiplied by the average account value over the period, multiplied by 184/365 (to reflect the one-half year period).
Nushares ESG Mid-Cap Growth ETF (NUMG)
| | | | |
Actual Performance | | | | |
Beginning Account Value | | $ | 1,000.00 | |
Ending Account Value | | $ | 1,074.50 | |
Expenses Incurred During Period | | $ | 2.09 | |
Hypothetical Performance (5% annualized return before expenses) | | | | |
Beginning Account Value | | $ | 1,000.00 | |
Ending Account Value | | $ | 1,023.19 | |
Expenses Incurred During Period | | $ | 2.04 | |
Expenses are equal to the Fund’s annualized net expense ratio of 0.40% multiplied by the average account value over the period, multiplied by 184/365 (to reflect the one-half year period).
Nushares ESG Mid-Cap Value ETF (NUMV)
| | | | |
Actual Performance | | | | |
Beginning Account Value | | $ | 1,000.00 | |
Ending Account Value | | $ | 1,060.50 | |
Expenses Incurred During Period | | $ | 2.08 | |
Hypothetical Performance (5% annualized return before expenses) | | | | |
Beginning Account Value | | $ | 1,000.00 | |
Ending Account Value | | $ | 1,023.19 | |
Expenses Incurred During Period | | $ | 2.04 | |
Expenses are equal to the Fund’s annualized net expense ratio of 0.40% multiplied by the average account value over the period, multiplied by 184/365 (to reflect the one-half year period).
Nushares ESG Small-Cap ETF (NUSC)
| | | | |
Actual Performance | | | | |
Beginning Account Value | | $ | 1,000.00 | |
Ending Account Value | | $ | 1,079.90 | |
Expenses Incurred During Period | | $ | 2.10 | |
Hypothetical Performance (5% annualized return before expenses) | | | | |
Beginning Account Value | | $ | 1,000.00 | |
Ending Account Value | | $ | 1,023.19 | |
Expenses Incurred During Period | | $ | 2.04 | |
Expenses are equal to the Fund’s annualized net expense ratio of 0.40% multiplied by the average account value over the period, multiplied by 184/365 (to reflect the one-half year period).
Report of
Independent Registered Public Accounting Firm
To the Board of Trustees and Shareholders of
Nushares ETF Trust:
We have audited the accompanying statements of assets and liabilities, including the portfolios of investments, of Nushares ESG Emerging Markets Equity ETF, Nushares ESG International Developed Markets Equity ETF, Nushares ESG Large-Cap Growth ETF, Nushares ESG Large-Cap Value ETF, Nushares ESG Mid-Cap Growth ETF, Nushares ESG Mid-Cap Value ETF, and Nushares ESG Small-Cap ETF (seven of the funds comprising Nushares ETF Trust) (the “Funds”) as of October 31, 2017, and the related statements of operations and changes in net assets and the financial highlights for the periods June 6, 2017 (commencement of operations) through October 31, 2017 for Nushares ESG Emerging Markets Equity ETF and Nushares ESG International Developed Markets Equity ETF and December 13, 2016 (commencement of operations) through October 31, 2017 for Nushares ESG Large-Cap Growth ETF, Nushares ESG Large-Cap Value ETF, Nushares ESG Mid-Cap Growth ETF, Nushares ESG Mid-Cap Value ETF, and Nushares ESG Small-Cap ETF. These financial statements and financial highlights are the responsibility of the Funds’ management. Our responsibility is to express an opinion on these financial statements and financial highlights based on our audits.
We conducted our audits in accordance with the standards of the Public Company Accounting Oversight Board (United States). Those standards require that we plan and perform the audit to obtain reasonable assurance about whether the financial statements and financial highlights are free of material misstatement. An audit includes examining, on a test basis, evidence supporting the amounts and disclosures in the financial statements. Our procedures included confirmation of securities owned as of October 31, 2017, by correspondence with the custodian and brokers or other appropriate auditing procedures. An audit also includes assessing the accounting principles used and significant estimates made by management, as well as evaluating the overall financial statement presentation. We believe that our audits provide a reasonable basis for our opinion.
In our opinion, the financial statements and financial highlights referred to above present fairly, in all material respects, the financial position of the Funds as of October 31, 2017, the results of their operations, the changes in their net assets, and the financial highlights for the periods specified in the first paragraph, in conformity with U.S. generally accepted accounting principles.
/s/ KPMG LLP
Chicago, Illinois
December 27, 2017
Nushares ESG Emerging Markets Equity ETF (NUEM)
| | |
| Portfolio of Investments | | October 31, 2017 |
| | | | | | | | |
| Shares | | | Description (1) | | Value | |
| | |
| | | | LONG-TERM INVESTMENTS – 100.1% | | | | |
| | |
| | | | COMMON STOCKS – 100.1% | | | | |
| | |
| | | | Consumer Discretionary – 13.2% | | | |
| | |
| | 609,609 | | | Alibaba Pictures Group Ltd, (2) | | $ | 99,234 | |
| | |
| | 51,599 | | | Anta Sports Products Ltd | | | 230,819 | |
| | |
| | 345 | | | Arcelik A.S | | | 1,883 | |
| | |
| | 3,946 | | | Astro Malaysia Holdings Bhd | | | 2,619 | |
| | |
| | 63 | | | Bajaj Auto Limited | | | 3,171 | |
| | |
| | 5,787 | | | BEC World PLC, (2) | | | 3,031 | |
| | |
| | 216 | | | Bharat Forge Ltd | | | 2,355 | |
| | |
| | 4 | | | Bosch Ltd | | | 1,297 | |
| | |
| | 130,743 | | | Brilliance China Automotive Holdings Limited | | | 330,469 | |
| | |
| | 30,844 | | | BYD Co Ltd | | | 270,218 | |
| | |
| | 30 | | | CCC SA | | | 2,250 | |
| | |
| | 135 | | | Cheil Worldwide Inc. | | | 2,506 | |
| | |
| | 40,968 | | | Chongqing Changan Automobile Co Ltd, (2) | | | 53,614 | |
| | |
| | 243 | | | Cyfrowy Polsat SA | | | 1,694 | |
| | |
| | 131,069 | | | Dongfeng Motor Group Co Ltd | | | 179,758 | |
| | |
| | 10,782 | | | DXB Entertainments PJSC, (2) | | | 2,172 | |
| | |
| | 193 | | | Eclat Textile Company Limited | | | 2,307 | |
| | |
| | 462 | | | Feng Tay Enterprise Co Ltd | | | 2,083 | |
| | |
| | 552 | | | FF Group, (2) | | | 11,562 | |
| | |
| | 154 | | | Ford Otomotiv Sanayi AS | | | 2,172 | |
| | |
| | 2,647 | | | Formosa Taffeta Co Ltd | | | 2,716 | |
| | |
| | 148,141 | | | Geely Automobile Holdings Limited | | | 458,562 | |
| | |
| | 438,732 | | | Gome Retail Holdings Ltd, (2) | | | 56,235 | |
| | |
| | 101,569 | | | Guangzhou Automobile Group Company Limited | | | 252,562 | |
| | |
| | 60,726 | | | Haier Electronics Group Co., Ltd | | | 159,953 | |
| | |
| | 39 | | | Hankook Tire Company Limited | | | 1,880 | |
| | |
| | 216 | | | Hanon Systems | | | 2,506 | |
| | |
| | 28 | | | Hero MotoCorp Limited | | | 1,666 | |
| | |
| | 6,804 | | | Home Product Center PCL | | | 2,622 | |
| | |
| | 220 | | | Hotai Motor Co Ltd | | | 2,553 | |
| | |
| | 39 | | | Hotel Shilla Company Limited | | | 2,726 | |
| | |
| | 163 | | | Imperial Holdings Limited | | | 2,336 | |
| | |
| | 27 | | | LG Electronics Inc. | | | 2,193 | |
| | |
| | 181 | | | Lojas Renner S.A, (WI/DD) | | | 1,908 | |
| | |
| | 1 | | | LPP SA | | | 2,356 | |
Nushares ESG Emerging Markets Equity ETF (NUEM) (continued)
| | |
| Portfolio of Investments | | October 31, 2017 |
| | | | | | | | |
| Shares | | | Description (1) | | Value | |
| | |
| | | | Consumer Discretionary (continued) | | | |
| | |
| | 81 | | | Mahindra & Mahindra Ltd | | $ | 1,683 | |
| | |
| | 23,060 | | | Media Nusantara Citra TBK PT | | | 2,652 | |
| | |
| | 1,919 | | | Minor International PCL, (2) | | | 2,498 | |
| | |
| | 173 | | | Mr Price Group Ltd | | | 2,144 | |
| | |
| | 2,414 | | | Naspers Limited | | | 588,083 | |
| | |
| | 180 | | | Nien Made Enterprise Co Ltd | | | 1,874 | |
| | |
| | 1,782 | | | PT Matahari Department Store Tbk | | | 1,130 | |
| | |
| | 1,144 | | | Robinson PCL, (2) | | | 2,557 | |
| | |
| | 28,820 | | | SACI Falabella | | | 276,481 | |
| | |
| | 27,684 | | | Shenzhou International Group Holdings Ltd | | | 236,324 | |
| | |
| | 15,339 | | | Surya Citra Media Pt Tbk | | | 2,432 | |
| | |
| | 180 | | | The Foschini Group Ltd | | | 1,725 | |
| | |
| | 244 | | | Titan Co Ltd | | | 2,409 | |
| | |
| | 396 | | | Truworths International Limited | | | 2,110 | |
| | |
| | 1,605 | | | UMW Holdings BHD, (2) | | | 1,987 | |
| | |
| | 334 | | | Woolworths Holdings Limited | | | 1,331 | |
| | |
| | 3,054 | | | Yulon Motor Company | | | 2,552 | |
| | | | Total Consumer Discretionary | | | 3,287,960 | |
| | |
| | | | Consumer Staples – 5.6% | | | |
| | |
| | 11 | | | Amorepacific Corporation | | | 3,083 | |
| | |
| | 18 | | | Amorepacific Corporation | | | 2,868 | |
| | |
| | 27 | | | Amorepacific Group | | | 3,458 | |
| | |
| | 199 | | | Arca Continental SAB de CV | | | 1,269 | |
| | |
| | 90 | | | Bid Corporation Limited | | | 1,979 | |
| | |
| | 109 | | | BIM Birlesik Magazalar AS | | | 2,221 | |
| | |
| | 2,892 | | | Cia Brasileira de Distribuicao, (2), (WI/DD) | | | 67,364 | |
| | |
| | 3 | | | CJ CheilJedang Corporation | | | 980 | |
| | |
| | 14,967 | | | Coca-Cola Femsa SAB de CV | | | 101,396 | |
| | |
| | 200 | | | Coca-Cola Icecek AS | | | 2,033 | |
| | |
| | 97,445 | | | CP ALL PCL | | | 205,333 | |
| | |
| | 389 | | | Dabur India Ltd | | | 2,002 | |
| | |
| | 171 | | | Dongsuh Companies Inc. | | | 4,197 | |
| | |
| | 441 | | | Embotelladora Andina SA | | | 2,230 | |
| | |
| | 477 | | | Eurocash SA | | | 4,825 | |
| | |
| | 38,028 | | | Fomento Economico Mexicano S.A | | | 331,990 | |
| | |
| | 175 | | | Godrej Consumer Products Ltd | | | 2,522 | |
| | |
| | 166 | | | Gruma S.A.B de C.V | | | 2,183 | |
| | |
| | 79,273 | | | Grupo Bimbo SAB de CV | | | 183,946 | |
| | |
| | 117 | | | Hindustan Unilever Ltd | | | 2,238 | |
| | | | | | | | |
| Shares | | | Description (1) | | Value | |
| | |
| | | | Consumer Staples (continued) | | | |
| | |
| | 4,378 | | | Indfood CBP Sukses Makmur Tbk PT | | $ | 2,841 | |
| | |
| | 777 | | | Kimberly-Clark de Mexico SAB de CV, Class A Shares | | | 1,340 | |
| | |
| | 2 | | | LG Household & Health Care | | | 2,101 | |
| | |
| | 2 | | | LG Household & Health Care | | | 1,169 | |
| | |
| | 25 | | | Lotte Confectionery Co Ltd | | | 1,662 | |
| | |
| | 3 | | | Lotte Confectionery Co Ltd, (2) | | | 498 | |
| | |
| | 155 | | | M Dias Branco SA, (2), (WI/DD) | | | 2,281 | |
| | |
| | 372 | | | Marico Limited | | | 1,811 | |
| | |
| | 208 | | | Massmart Holdings Limited | | | 1,575 | |
| | |
| | 261 | | | Natura Cosmeticos SA, (WI/DD) | | | 2,471 | |
| | |
| | 18 | | | Nestle India Ltd | | | 2,003 | |
| | |
| | 2 | | | Ottogi Corporation | | | 1,355 | |
| | |
| | 488 | | | Pick n Pay Stores Ltd | | | 2,046 | |
| | |
| | 146 | | | Pioneer Foods Group Ltd | | | 1,229 | |
| | |
| | 713 | | | PPB Group Berhad Bhd | | | 2,826 | |
| | |
| | 300 | | | President Chain Store Corp. | | | 2,696 | |
| | |
| | 118 | | | ShopRite Holdings Limited | | | 1,689 | |
| | |
| | 570 | | | Standard Foods Corporation | | | 1,412 | |
| | |
| | 115,183 | | | Sun Art Retail Group Ltd | | | 116,338 | |
| | |
| | 126 | | | The Spar Group Limited | | | 1,482 | |
| | |
| | 54 | | | Tiger Brands Limited | | | 1,474 | |
| | |
| | 379 | | | Ulker Biskuvi Sanayi AS | | | 2,021 | |
| | |
| | 471 | | | Unilever Indonesia Tbk PT | | | 1,723 | |
| | |
| | 147,692 | | | Uni-President Enterprises Corporation | | | 308,513 | |
| | | | Total Consumer Staples | | | 1,392,673 | |
| | |
| | | | Energy – 4.9% | | | |
| | |
| | 7,879 | | | Cosan SA Industria e Comercio, (WI/DD) | | | 90,077 | |
| | |
| | 52,975 | | | Energy Absolute PCL, (2) | | | 68,970 | |
| | |
| | 483,418 | | | IRPC PCL, (2) | | | 93,861 | |
| | |
| | 13,006 | | | Qatar Gas Transport Co Ltd, (WI/DD) | | | 54,121 | |
| | |
| | 2,173 | | | S-Oil Corporation | | | 249,235 | |
| | |
| | 39,350 | | | Thai Oil PCL, (2) | | | 120,822 | |
| | |
| | 6,030 | | | Tupras Turkiye Petrol Rafinerileri IS | | | 216,801 | |
| | |
| | 13,288 | | | Ultrapar Participacoes S.A, (WI/DD) | | | 317,237 | |
| | | | Total Energy | | | 1,211,124 | |
| | |
| | | | Financials – 24.6% | | | |
| | |
| | 804 | | | Abu Dhabi Commercial Bank | | | 1,618 | |
| | |
| | 45,857 | | | Axis Bank Limited | | | 371,869 | |
| | |
| | 90 | | | Bajaj Finance Limited | | | 2,501 | |
Nushares ESG Emerging Markets Equity ETF (NUEM) (continued)
| | |
| Portfolio of Investments | | October 31, 2017 |
| | | | | | | | |
| Shares | | | Description (1) | | Value | |
| | |
| | | | Financials (continued) | | | |
| | |
| | 7,816 | | | Banco Bradesco SA, (2), (WI/DD) | | $ | 78,319 | |
| | |
| | 35,646 | | | Banco Bradesco SA, (2), (WI/DD) | | | 377,888 | |
| | |
| | 47 | | | Banco De Credito E Inversion | | | 3,164 | |
| | |
| | 29,639 | | | Banco do Brasil S.A, (2), (WI/DD) | | | 312,032 | |
| | |
| | 6,052 | | | Banco Santander Brasil SA, (WI/DD) | | | 52,929 | |
| | |
| | 44,560 | | | Banco Santander Chile | | | 3,504 | |
| | |
| | 271 | | | Bancolombia SA, (2) | | | 2,511 | |
| | |
| | 1,314 | | | Bancolombia SA, (2) | | | 12,522 | |
| | |
| | 2,604 | | | Bank Central Asia TBK PT | | | 4,013 | |
| | |
| | 6,337 | | | Bank Danamon Indonesia TBK PT | | | 2,383 | |
| | |
| | 100 | | | Bank Handlowy w Warszawie SA | | | 2,045 | |
| | |
| | 28,946 | | | Bank Millennium SA, (2) | | | 63,479 | |
| | |
| | 3,628 | | | Bank Negara Indonesia Persero TBK PT | | | 2,033 | |
| | |
| | 1,332 | | | Bank of the Philippine Islands | | | 2,529 | |
| | |
| | 21 | | | Bank Zachodni WBK SA | | | 2,108 | |
| | |
| | 5,979 | | | Barclays Africa Group Limited | | | 59,252 | |
| | |
| | 335 | | | BM&FBovespa SA, (WI/DD) | | | 2,447 | |
| | |
| | 227 | | | BNK Financial Group Inc. | | | 2,014 | |
| | |
| | 1,650 | | | Cathay Financial Holding Company Limited | | | 2,725 | |
| | |
| | 597 | | | Chailease Holding Co Ltd | | | 1,540 | |
| | |
| | 133,148 | | | China Everbright Bank Co Limited | | | 62,804 | |
| | |
| | 171,022 | | | CIMB Group Holdings BHD | | | 248,039 | |
| | |
| | 570 | | | Commercial International Bank Egypt SAE | | | 2,553 | |
| | |
| | 891 | | | Coronation Fund Managers Limited | | | 4,496 | |
| | |
| | 1,090 | | | CrediCorp Limited | | | 228,290 | |
| | |
| | 279 | | | DGB Financial Group Inc. | | | 2,602 | |
| | |
| | 1,568 | | | Dubai Islamic Bank PJSC | | | 2,613 | |
| | |
| | 5,197 | | | E.Sun Financial Holding Co Ltd | | | 3,162 | |
| | |
| | 86,851 | | | Firstrand Limited | | | 314,761 | |
| | |
| | 189,877 | | | Fubon Financial Holding Co Ltd | | | 302,511 | |
| | |
| | 47,406 | | | Gentera SAB de CV | | | 48,074 | |
| | |
| | 11,171 | | | Grupo de Inversiones Suramericana SA, (2) | | | 141,776 | |
| | |
| | 3,737 | | | Grupo de Inversiones Suramericana SA, (2) | | | 46,126 | |
| | |
| | 353 | | | Grupo Financiero Banorte SAB de CV | | | 2,096 | |
| | |
| | 13,149 | | | Grupo Financiero Santander Mexico SAB de CV | | | 22,146 | |
| | |
| | 8,199 | | | Hana Financial Group Inc. | | | 350,910 | |
| | |
| | 81 | | | Hyundai Marine & Fire Insurance Co Ltd | | | 3,279 | |
| | |
| | 57,996 | | | ICICI Bank Limited | | | 268,619 | |
| | |
| | 2,008 | | | IDFC Bank Ltd | | | 1,755 | |
| | | | | | | | |
| Shares | | | Description (1) | | Value | |
| | |
| | | | Financials (continued) | | | |
| | |
| | 111 | | | Indiabulls Housing Finance Ltd | | $ | 2,131 | |
| | |
| | 155 | | | Industrial Bank of Korea | | | 2,124 | |
| | |
| | 308 | | | Investec PLC | | | 2,100 | |
| | |
| | 34,143 | | | Itau Unibanco Holding SA, (WI/DD) | | | 438,875 | |
| | |
| | 711 | | | Itausa-Investimentos Itau S.A, (WI/DD) | | | 2,278 | |
| | |
| | 426 | | | Kasikornbank PCL | | | 2,924 | |
| | |
| | 549 | | | Kasikornbank PCL | | | 3,636 | |
| | |
| | 7,713 | | | KB Financial Group Inc. | | | 402,052 | |
| | |
| | 5,115 | | | Krung Thai Bank Public Company Limited | | | 2,802 | |
| | |
| | 1,125 | | | Malayan Banking BHD | | | 2,458 | |
| | |
| | 712 | | | mBank SA, (2) | | | 90,095 | |
| | |
| | 1,125 | | | MCB Bank Ltd, (2) | | | 2,136 | |
| | |
| | 11,934 | | | Mega Financial Holding Co Ltd | | | 9,378 | |
| | |
| | 1,189 | | | National Bank of Abu Dhabi PJSC | | | 3,351 | |
| | |
| | 101 | | | Nedbank Group Limited | | | 1,481 | |
| | |
| | 5,626 | | | OTP Bank PLC | | | 226,838 | |
| | |
| | 153 | | | PSG Group Limited | | | 2,840 | |
| | |
| | 3,862 | | | PT Bank Mandiri | | | 2,008 | |
| | |
| | 95,691 | | | PT Bank Rakyat Indonesia | | | 110,067 | |
| | |
| | 32,401 | | | Public Bank Bhd | | | 156,590 | |
| | |
| | 3,672 | | | Qatar National Bank, (WI/DD) | | | 122,543 | |
| | |
| | 34,355 | | | RHB Bank BHD | | | 41,224 | |
| | |
| | 334 | | | RMB Holdings Limited | | | 1,476 | |
| | |
| | 48 | | | Samsung Card Co | | | 1,570 | |
| | |
| | 1,107 | | | Samsung Fire & Marine Insurance Co Ltd | | | 269,747 | |
| | |
| | 59,346 | | | Sanlam Limited | | | 296,704 | |
| | |
| | 1,306 | | | Shinhan Financial Group Company Limited | | | 58,518 | |
| | |
| | 522 | | | Siam Commercial Bank PCL, (2) | | | 2,302 | |
| | |
| | 30,143 | | | Standard Bank Group Limited | | | 349,577 | |
| | |
| | 7,084 | | | Taishin Financial Holding Co Ltd | | | 3,100 | |
| | |
| | 2,955 | | | Taiwan Business Bank | | | 816 | |
| | |
| | 209 | | | The Commercial Bank QSC, (2), (WI/DD) | | | 1,516 | |
| | |
| | 42,618 | | | TMB Bank PCL, (2) | | | 3,310 | |
| | |
| | 829 | | | Turkiye Garanti Bankasi A.S | | | 2,277 | |
| | |
| | 18,432 | | | Yes Bank Ltd | | | 89,526 | |
| | |
| | 5,940 | | | Yuanta Financial Holding Co Ltd | | | 2,639 | |
| | | | Total Financials | | | 6,135,046 | |
| | |
| | | | Health Care – 4.1% | | | |
| | |
| | 1,813 | | | 3SBio, Inc., (2) | | | 3,244 | |
Nushares ESG Emerging Markets Equity ETF (NUEM) (continued)
| | |
| Portfolio of Investments | | October 31, 2017 |
| | | | | | | | |
| Shares | | | Description (1) | | Value | |
| | |
| | | | Health Care (continued) | | | |
| | |
| | 148 | | | Apollo Hospitals Enterprise Limited | | $ | 2,367 | |
| | |
| | 4,140 | | | Bangkok Dusit Medical Services PCL, (2) | | | 2,642 | |
| | |
| | 299 | | | Bumrungrad Hospital PCL, (2) | | | 1,980 | |
| | |
| | 59,824 | | | China Medical Systems Holdings, Limited | | | 110,572 | |
| | |
| | 202,442 | | | CSPC Pharmaceuticals Group Limited | | | 351,856 | |
| | |
| | 76 | | | Dr Reddys Laboratories Limited | | | 2,849 | |
| | |
| | 254 | | | Glenmark Pharmaceuticals Ltd | | | 2,427 | |
| | |
| | 4 | | | Hanmi Pharm Co Ltd, (2) | | | 1,655 | |
| | |
| | 1,398 | | | Hartalega Holdings Bhd | | | 2,516 | |
| | |
| | 1,180 | | | Life Healthcare Group Holdings Ltd | | | 2,186 | |
| | |
| | 165 | | | Lupin Ltd | | | 2,614 | |
| | |
| | 891 | | | Netcare Limited | | | 1,568 | |
| | |
| | 498 | | | Odontoprev SA, (WI/DD) | | | 2,396 | |
| | |
| | 57 | | | Piramal Enterprises Ltd | | | 2,410 | |
| | |
| | 20,181 | | | PT Kalbe Farma Tbl | | | 2,381 | |
| | |
| | 93 | | | Richter Gedoen NYRT | | | 2,313 | |
| | |
| | 93,294 | | | Shandong Weigao Group Medical Polymer Company Limited | | | 66,965 | |
| | |
| | 23,349 | | | Shanghai Fosun Pharmaceutical Group Company Limited | | | 116,568 | |
| | |
| | 33,219 | | | Shanghai Pharmaceuticals Holding Company, Limited | | | 85,796 | |
| | |
| | 57,620 | | | Sinopharm Group Co Ltd | | | 257,753 | |
| | |
| | 10 | | | Yuhan Corporation | | | 1,821 | |
| | | | Total Health Care | | | 1,026,879 | |
| | |
| | | | Industrials – 7.2% | | | |
| | |
| | 2,203 | | | Aboitiz Equity Ventures Equity, Inc. | | | 3,196 | |
| | |
| | 1,476 | | | Airports of Thailand PCL, (2) | | | 2,633 | |
| | |
| | 310 | | | Aselsan Elektronik Sanayi Ve Ticaret AS | | | 2,771 | |
| | |
| | 1,611 | | | Ashok Leyland Ltd | | | 3,263 | |
| | |
| | 2,197 | | | Berli Jucker Public Co, (2) | | | 3,538 | |
| | |
| | 184 | | | Bidvest Group Limited | | | 2,231 | |
| | |
| | 6,688 | | | BTS Group Holdings PCL, (2) | | | 1,711 | |
| | |
| | 10,307 | | | CCR SA, (WI/DD) | | | 57,342 | |
| | |
| | 78,402 | | | China Conch Venture Holdings Ltd | | | 159,783 | |
| | |
| | 200,693 | | | China South Locomotive and Rolling Stock Corporation Limited | | | 197,817 | |
| | |
| | 10 | | | CJ Corp. | | | 1,665 | |
| | |
| | 27 | | | Daelim Industrial Co Ltd | | | 2,010 | |
| | |
| | 144 | | | Doosan Heavy Industries & Construction Co Ltd | | | 2,249 | |
| | |
| | 6,815 | | | DP World Ltd, (2) | | | 161,856 | |
| | |
| | 5,067 | | | Eva Airways | | | 2,495 | |
| | |
| | 3,493 | | | Evergreen Marine Corp Taiwan Ltd, (2) | | | 2,091 | |
| | | | | | | | |
| Shares | | | Description (1) | | Value | |
| | |
| | | | Industrials (continued) | | | |
| | |
| | 142,479 | | | Far Eastern New Century Corp. | | $ | 122,120 | |
| | |
| | 180 | | | Grupo Aeroportuario del Pacifico S.A.B. de CV | | | 1,715 | |
| | |
| | 93 | | | Grupo Aeroportuario del Sureste SA de CV | | | 1,666 | |
| | |
| | 82 | | | GS Engineering & Construction Corp., (2) | | | 1,903 | |
| | |
| | 1,271 | | | HAP Seng Consolidated BHD | | | 2,786 | |
| | |
| | 355 | | | Havells India Limited | | | 2,658 | |
| | |
| | 282 | | | Hiwin Technologies Corporation | | | 2,824 | |
| | |
| | 2,359 | | | Hyundai Engineering & Construction Co Ltd | | | 79,697 | |
| | |
| | 1,498 | | | Hyundai Heavy Industries | | | 209,253 | |
| | |
| | 5,259 | | | Jasa Marga Persero Tbk PT | | | 2,520 | |
| | |
| | 168,776 | | | JG Summit Holdings, Inc. | | | 251,407 | |
| | |
| | 54 | | | KEPCO Plant Service & Engineering Co Ltd | | | 1,991 | |
| | |
| | 81 | | | Korean Air Lines Co Ltd, (2) | | | 2,288 | |
| | |
| | 207 | | | Latam Airlines Group S.A | | | 2,862 | |
| | |
| | 38 | | | LG Corp. | | | 2,917 | |
| | |
| | 120 | | | Localize Rent A Car SA, (WI/DD) | | | 2,123 | |
| | |
| | 1,172 | | | Malaysia Airport Holdings BHD | | | 2,292 | |
| | |
| | 2,863 | | | Samsung C&T Corporation | | | 378,207 | |
| | |
| | 135 | | | Siemens AG, Sponsored ADR | | | 2,647 | |
| | |
| | 672 | | | SM Investments Corporation | | | 12,431 | |
| | |
| | 398 | | | TAV Havalimanlari Holding AS | | | 1,978 | |
| | |
| | 900 | | | Turk Hava Yollari AO, (2) | | | 2,461 | |
| | |
| | 1,866 | | | Turk Sise ve Cam Fabrikalari SA | | | 2,187 | |
| | |
| | 291 | | | WEG SA, (WI/DD) | | | 1,893 | |
| | |
| | 69,321 | | | Zhejiang Expressway Company Limited | | | 85,743 | |
| | | | Total Industrials | | | 1,787,220 | |
| | |
| | | | Information Technology – 24.3% | | | |
| | |
| | 22,981 | | | AAC Technologies Holdings Inc. | | | 420,632 | |
| | |
| | 5,112 | | | Acer Inc. | | | 2,644 | |
| | |
| | 2,281 | | | Advanced Semiconductor Engineering | | | 2,749 | |
| | |
| | 308 | | | Advantech Co Ltd | | | 2,104 | |
| | |
| | 360 | | | Asustek Computer, Inc. | | | 3,115 | |
| | |
| | 148,564 | | | Au Optronic Corporation | | | 60,835 | |
| | |
| | 3,439 | | | Catcher Technology Co Limited | | | 36,489 | |
| | |
| | 1,089 | | | Chicony Electronics Co Ltd | | | 2,726 | |
| | |
| | 307 | | | Cielo SA, (WI/DD) | | | 2,100 | |
| | |
| | 3,935 | | | Compal Electronics Inc. | | | 2,897 | |
| | |
| | 57,629 | | | Delta Electronics Inc. | | | 277,067 | |
| | |
| | 849 | | | Delta Electronics Thailand PCL, (2) | | | 2,198 | |
Nushares ESG Emerging Markets Equity ETF (NUEM) (continued)
| | |
| Portfolio of Investments | | October 31, 2017 |
| | | | | | | | |
| Shares | | | Description (1) | | Value | |
| | |
| | | | Information Technology (continued) | | | |
| | |
| | 632,260 | | | GCL-Poly Energy Holdings Limited, (2) | | $ | 108,594 | |
| | |
| | 193 | | | HCL Technologies Inc. | | | 2,549 | |
| | |
| | 46 | | | Hynix Semiconductor Inc. | | | 3,375 | |
| | |
| | 4 | | | Hyundai Robotics Co Ltd, (2) | | | 1,612 | |
| | |
| | 26,028 | | | Infosys Ltd | | | 370,501 | |
| | |
| | 347,590 | | | Innolux Corporation | | | 152,131 | |
| | |
| | 3,208 | | | Inventec Corp. | | | 2,489 | |
| | |
| | 893 | | | KCE Electronics Public Company Limited, (2) | | | 2,688 | |
| | |
| | 349,075 | | | Legend Holdings Limited | | | 202,238 | |
| | |
| | 11,197 | | | LG Display Company Limited | | | 292,830 | |
| | |
| | 13 | | | LG Innotek Company Limited | | | 1,996 | |
| | |
| | 1,822 | | | Lite-On Technology Corp. | | | 2,571 | |
| | |
| | 16,671 | | | MediaTek | | | 189,321 | |
| | |
| | 2,016 | | | Micro-Star International Co Ltd | | | 4,913 | |
| | |
| | 4 | | | NCsoft Corporation | | | 1,523 | |
| | |
| | 568 | | | NHN Corporation | | | 453,244 | |
| | |
| | 38 | | | Samsung Electronics | | | 3,527 | |
| | |
| | 1,080 | | | Samsung SDI Co, Ltd | | | 198,581 | |
| | |
| | 101 | | | Samsung SDS Co. Ltd | | | 18,661 | |
| | |
| | 839 | | | Siliconware Precision Industries Co Ltd | | | 1,330 | |
| | |
| | 145,695 | | | Taiwan Semiconductor Manufacturing Company Limited | | | 1,173,888 | |
| | |
| | 9,181 | | | Tata Consultancy Services | | | 371,195 | |
| | |
| | 272 | | | Tech Mahindra Limited | | | 2,028 | |
| | |
| | 34,390 | | | Tencent Holdings Limited | | | 1,541,903 | |
| | |
| | 3,421 | | | United Microelectronics Corp. | | | 1,758 | |
| | |
| | 946 | | | Vanguard International Semiconductor Corporation, (2) | | | 1,794 | |
| | |
| | 28,030 | | | Wipro Limited | | | 127,554 | |
| | |
| | 2,838 | | | Wistron Corp. | | | 2,367 | |
| | |
| | 2,198 | | | WPG Holdings Ltd | | | 3,010 | |
| | | | Total Information Technology | | | 6,055,727 | |
| | |
| | | | Materials – 7.9% | | | |
| | |
| | 82 | | | Anglo American Platinum Ltd, (2) | | | 2,282 | |
| | |
| | 84 | | | Asian Paints Limited | | | 1,533 | |
| | |
| | 947 | | | Duratex SA, (WI/DD) | | | 2,767 | |
| | |
| | 60,346 | | | Empresas CMPC SA | | | 193,512 | |
| | |
| | 67,707 | | | Eregli Demir ve Celik Fabrikalari TAS | | | 158,721 | |
| | |
| | 219 | | | Fibria Celulose S.A, (WI/DD) | | | 3,504 | |
| | |
| | 83 | | | Hanwha Chemical Corp. | | | 2,256 | |
| | |
| | 13 | | | Hyosung Corporation | | | 1,561 | |
| | | | | | | | |
| Shares | | | Description (1) | | Value | |
| | |
| | | | Materials (continued) | | | |
| | |
| | 1,089 | | | Impala Platinum Holdings Limited | | $ | 3,020 | |
| | |
| | 2,837 | | | Indorama Ventures PCL, (2) | | | 3,928 | |
| | |
| | 3,258 | | | Industrias Penoles, S.A.B. de C.V. | | | 76,127 | |
| | |
| | 6,762 | | | KGHM Polska Miedz Spolka Akcyjna | | | 228,475 | |
| | |
| | 387 | | | Klabin SA, (WI/DD) | | | 2,236 | |
| | |
| | 28 | | | Kumho Petrochemical Co Ltd | | | 1,734 | |
| | |
| | 1,094 | | | LG Chem Limited | | | 394,010 | |
| | |
| | 156 | | | LG Chem Limited | | | 36,133 | |
| | |
| | 742 | | | Lotte Chemical Corp. | | | 244,717 | |
| | |
| | 65 | | | Mondi Ltd | | | 1,559 | |
| | |
| | 110,412 | | | Nan Ya Plastics Corp. | | | 272,374 | |
| | |
| | 79,021 | | | Nine Dragons Paper Holdings Limited | | | 145,041 | |
| | |
| | 28 | | | OCI Company Limited | | | 2,824 | |
| | |
| | 5,652 | | | PhosAgro PJSC, GDR | | | 77,715 | |
| | |
| | 1,164 | | | PTT Global Chemical PCL, (2) | | | 2,803 | |
| | |
| | 168,786 | | | Sinopec Shanghai Petrochemical Co., Ltd | | | 100,599 | |
| | |
| | 505 | | | Suzano Papel e Celulose S.A, (WI/DD) | | | 3,138 | |
| | |
| | 1,414 | | | Synthos SA | | | 1,916 | |
| | |
| | 855 | | | Taiwan Fertilizer Co Ltd | | | 1,117 | |
| | |
| | 209 | | | UPL Limited | | | 2,578 | |
| | | | Total Materials | | | 1,968,180 | |
| | |
| | | | Real Estate – 1.8% | | | |
| | |
| | 2,928 | | | Ayala Land Inc. | | | 2,450 | |
| | |
| | 255 | | | Barwa Real Estate Company, (WI/DD) | | | 2,102 | |
| | |
| | 585 | | | BR Malls Participacoes, (WI/DD) | | | 2,268 | |
| | |
| | 14,976 | | | Bumi Serpong Damai PT | | | 1,899 | |
| | |
| | 1,216 | | | Central Pattana PCL, (2) | | | 2,910 | |
| | |
| | 56,997 | | | China Vanke Co Ltd | | | 202,731 | |
| | |
| | 2,243 | | | DAMAC Properties Dubai Co PJSC | | | 2,412 | |
| | |
| | 27,607 | | | Emaar Malls PJSC | | | 17,364 | |
| | |
| | 786 | | | Emaar Properties PJSC | | | 1,774 | |
| | |
| | 2,855 | | | Emlak Konut Gayrimenkul Yatirim Ortakligi AS, (2) | | | 1,985 | |
| | |
| | 2,043 | | | Fortress REIT Ltd | | | 2,446 | |
| | |
| | 668 | | | Fortress REIT Ltd | | | 1,897 | |
| | |
| | 768 | | | Growthpoint Properties Ltd | | | 1,331 | |
| | |
| | 189 | | | Hyprop Investments Ltd | | | 1,421 | |
| | |
| | 5,260 | | | IOI Properties Group Bhd | | | 2,473 | |
| | |
| | 36,830 | | | Lippo Karawaci Tbk PT | | | 1,874 | |
| | |
| | 30,206 | | | Megaworld Corporation | | | 3,119 | |
Nushares ESG Emerging Markets Equity ETF (NUEM) (continued)
| | |
| Portfolio of Investments | | October 31, 2017 |
| | | | | | | | |
| Shares | | | Description (1) | | Value | |
| | |
| | | | Real Estate (continued) | | | |
| | |
| | 72 | | | Multiplan Empreendimentos Imobiliarios SA, (WI/DD) | | $ | 1,574 | |
| | |
| | 147 | | | NEPI Rockcastle plc | | | 2,055 | |
| | |
| | 46,326 | | | PT Pakuwon Jati Tbk | | | 2,152 | |
| | |
| | 1,927 | | | Redefine Properties Ltd | | | 1,446 | |
| | |
| | 174 | | | Resilient REIT Ltd | | | 1,733 | |
| | |
| | 2,658 | | | Ruentex Development Co Ltd, (2) | | | 2,728 | |
| | |
| | 145,216 | | | Sino-Ocean Group Holding Ltd | | | 94,741 | |
| | |
| | 45,903 | | | SM Prime Holdings Inc. | | | 32,899 | |
| | |
| | 99,955 | | | SOHO China Ltd, (2) | | | 57,909 | |
| | | | Total Real Estate | | | 449,693 | |
| | |
| | | | Telecommunication Services – 4.9% | | | |
| | |
| | 327 | | | Advanced Info Service PCL, (2) | | | 1,915 | |
| | |
| | 7,437 | | | Asia Pacific Telecom Co Ltd, (2) | | | 2,461 | |
| | |
| | 129,721 | | | Axiata Group Berhad | | | 165,158 | |
| | |
| | 47,910 | | | Bharti AirTel Limited | | | 368,361 | |
| | |
| | 434 | | | Bharti Infratel Limited | | | 2,961 | |
| | |
| | 15,311 | | | Chunghwa Telecom Co., Ltd | | | 52,290 | |
| | |
| | 849 | | | DiGi.com BHD | | | 1,003 | |
| | |
| | 8,543 | | | Emirates Telecommunications Group Co PJSC | | | 41,521 | |
| | |
| | 262 | | | Empresa Nacional De Telecomunicaciones SA | | | 3,033 | |
| | |
| | 937 | | | Far EasTone Telecommunications Co Ltd | | | 2,200 | |
| | |
| | 56 | | | Globe Telecom, Inc. | | | 2,215 | |
| | |
| | 5,319 | | | Hellenic Telecommunications Organization | | | 63,203 | |
| | |
| | 69,750 | | | Idea Cellular Ltd, (2) | | | 99,879 | |
| | |
| | 1,549 | | | Maxis Bhd | | | 2,177 | |
| | |
| | 4,079 | | | MTN Group Limited | | | 35,413 | |
| | |
| | 166 | | | O2 Czech Republic AS | | | 2,022 | |
| | |
| | 63 | | | Ooredoo QSC, (WI/DD) | | | 1,486 | |
| | |
| | 1,300 | | | Orange Polska SA, (2) | | | 2,004 | |
| | |
| | 98,841 | | | Orascom Telecom Holding SAE, (2) | | | 37,605 | |
| | |
| | 1,058,753 | | | PT Telekomunikasi Indonesia Persero Tbk | | | 314,601 | |
| | |
| | 10 | | | SK Telecom Company Limited | | | 2,356 | |
| | |
| | 912 | | | Taiwan Mobile Co Ltd | | | 3,251 | |
| | |
| | 147 | | | Telefonica Brasil SA, (WI/DD) | | | 2,269 | |
| | |
| | 1,606 | | | Telekom Malaysia BHD | | | 2,409 | |
| | |
| | 828 | | | Telkom SA Limited | | | 3,101 | |
| | |
| | 15,184 | | | True Corp PCL, (2) | | | 2,811 | |
| | |
| | 649 | | | Turkcell Iletism Hizmetleri SA | | | 2,422 | |
| | |
| | 192 | | | Vodacom Group Limited | | | 2,085 | |
| | | | | | | | |
| Shares | | | Description (1) | | Value | |
| | |
| | | | Telecommunication Services (continued) | | | |
| | |
| | 8,796 | | | XL Axiata Tbk Pt, (2) | | $ | 2,192 | |
| | | | Total Telecommunication Services | | | 1,224,404 | |
| | |
| | | | Utilities – 1.6% | | | |
| | |
| | 3,942 | | | Aboitiz Power Corp. | | | 3,245 | |
| | |
| | 232,580 | | | Beijing Enterprises Water Group | | | 195,262 | |
| | |
| | 153,264 | | | China Longyuan Power Group Corporation | | | 113,546 | |
| | |
| | 1,404 | | | Companhia Energetica de Minas Gerais, (WI/DD) | | | 3,318 | |
| | |
| | 252 | | | Companhia Paranaense de Energia-Copel, (WI/DD) | | | 1,925 | |
| | |
| | 288 | | | CPFL Energia SA, (WI/DD) | | | 2,421 | |
| | |
| | 523 | | | EDP Energias do Brasil S.A, (WI/DD) | | | 2,302 | |
| | |
| | 136 | | | Engie Brasil Energia SA, (WI/DD) | | | 1,488 | |
| | |
| | 128 | | | Equatorial Energia SA, (WI/DD) | | | 2,387 | |
| | |
| | 232,452 | | | Huaneng Renewables Corp Ltd | | | 79,850 | |
| | |
| | 30 | | | Qatar Electricity and Water Company, (WI/DD) | | | 1,508 | |
| | |
| | 335 | | | Transmissora Alianca de Energia Eletrica SA, (WI/DD) | | | 2,099 | |
| | |
| | 8,113 | | | YTL Power International Berhad | | | 2,491 | |
| | | | Total Utilities | | | 411,842 | |
| | | | Total Common Stocks (cost $23,794,707) | | | 24,950,748 | |
| | |
| Shares | | | Description (1) | | Value | |
| | |
| | | | COMMON STOCK RIGHTS – 0.0% | | | | |
| | |
| | 21 | | | 1China Literature Ltd | | $ | — | |
| | |
| | 173 | | | Companhia Energetica de Minas Gerais | | | 62 | |
| | | | Total Common Stock Rights (cost $–) | | | 62 | |
| | | | Total Long-Term Investments (cost $23,794,707) | | | 24,950,810 | |
| | | | Other Assets Less Liabilities – (0.1)% | | | (33,833 | ) |
| | | | Net Assets – 100% | | $ | 24,916,977 | |
For Fund portfolio compliance purposes, the Fund’s industry classifications refer to any one or more of the industry sub-classifications used by one or more widely recognized market indexes or ratings group indexes, and/or as defined by Fund management. This definition may not apply for purposes of this report, which may combine industry sub-classifications into sectors for reporting ease.
| (1) | All percentages shown in the Portfolio of Investments are based on net assets. |
| (2) | Non-income producing; issuer has not declared a dividend within the past twelve months. |
| ADR | American Depositary Receipt. |
| GDR | Global Depositary Receipt. |
| REIT | Real Estate Investment Trust. |
| WI/DD | Investment, or portion of investment, purchased on a when-issued or delayed delivery basis. |
See accompanying notes to financial statements.
Nushares ESG International Developed Markets Equity ETF (NUDM)
| | |
| Portfolio of Investments | | October 31, 2017 |
| | | | | | | | |
| Shares | | | Description (1) | | Value | |
| | |
| | | | LONG-TERM INVESTMENTS – 98.6% | | | | |
| | |
| | | | COMMON STOCKS – 98.6% | | | | |
| | |
| | | | Consumer Discretionary – 11.8% | | | |
| | |
| | 63 | | | Accor SA | | $ | 3,144 | |
| | |
| | 263 | | | Adidas-Salomon AG | | | 58,534 | |
| | |
| | 73 | | | Aisin Seiki Company Limited | | | 3,752 | |
| | |
| | 4,872 | | | Barratt Developments PLC | | | 42,345 | |
| | |
| | 1,782 | | | Bayerische Motoren Werke AG | | | 181,645 | |
| | |
| | 884 | | | Bayerische Motoren Werke AG | | | 77,154 | |
| | |
| | 588 | | | Benesse Holdings Inc. | | | 19,845 | |
| | |
| | 75 | | | Berkely Group Holdings | | | 3,726 | |
| | |
| | 207 | | | British Sky Broadcasting PLC, (2) | | | 2,592 | |
| | |
| | 570 | | | Burberry Group PLC | | | 14,397 | |
| | |
| | 1,325 | | | Cie Financierre Richemont | | | 122,291 | |
| | |
| | 2,250 | | | Compass Group PLC | | | 49,390 | |
| | |
| | 4,070 | | | Daimler AG | | | 338,011 | |
| | |
| | 3,169 | | | Denso Corporation | | | 172,687 | |
| | |
| | 432 | | | Eutelsat Communications | | | 10,825 | |
| | |
| | 235 | | | Fast Retailing Company Limited | | | 77,782 | |
| | |
| | 2,043 | | | Hennes & Mauritz AB | | | 51,296 | |
| | |
| | 12,783 | | | Honda Motor Company Limited | | | 396,326 | |
| | |
| | 1,704 | | | Industria de Diseno Textil SA | | | 63,711 | |
| | |
| | 1,737 | | | ITV PLC | | | 3,794 | |
| | |
| | 279 | | | Kering | | | 127,896 | |
| | |
| | 13,241 | | | Kingfisher plc | | | 54,966 | |
| | |
| | 9,316 | | | Marks and Spencer Group PLC | | | 42,569 | |
| | |
| | 12,089 | | | Matsushita Electric Industrial Co., Ltd | | | 180,915 | |
| | |
| | 415 | | | Next PLC | | | 27,120 | |
| | |
| | 362 | | | Oriental Land Company Limited | | | 28,844 | |
| | |
| | 11,152 | | | Pearson PLC | | | 104,183 | |
| | |
| | 45 | | | Renault SA | | | 4,463 | |
| | |
| | 199 | | | Schibsted ASA, Class B Shares | | | 4,658 | |
| | |
| | 1,647 | | | Sekisui House, Ltd. | | | 30,598 | |
| | |
| | 1,721 | | | SES SA | | | 27,988 | |
| | |
| | 13,591 | | | Shangri-La Asia Ltd | | | 27,036 | |
| | |
| | 3,808 | | | Sony Corporation | | | 147,890 | |
| | |
| | 4,321 | | | Taylor Wimpey PLC | | | 11,447 | |
| | |
| | 5,986 | | | TUI AG | | | 108,108 | |
| | | | | | | | |
| Shares | | | Description (1) | | Value | |
| | |
| | | | Consumer Discretionary (continued) | | | |
| | |
| | 3,430 | | | Vivendi Universal S.A | | $ | 85,210 | |
| | |
| | 1,360 | | | Whitbread PLC | | | 66,696 | |
| | |
| | 2,269 | | | WPP Group PLC | | | 40,195 | |
| | | | Total Consumer Discretionary | | | 2,814,029 | |
| | |
| | | | Consumer Staples – 11.2% | | | |
| | |
| | 7,392 | | | Aeon Corporation, Limited | | | 113,876 | |
| | |
| | 5,841 | | | Ajinomoto Co Inc. | | | 117,020 | |
| | |
| | 5,601 | | | Associated British Foods PLC | | | 247,829 | |
| | |
| | 876 | | | Casino Guichard-Perrachon S.A | | | 50,040 | |
| | |
| | 3,583 | | | Coca-Cola Amatil Limited | | | 22,390 | |
| | |
| | 3,510 | | | Coca-Cola European Partners PLC | | | 143,993 | |
| | |
| | 2,206 | | | Coca-Cola HBC AG | | | 74,555 | |
| | |
| | 3,916 | | | Groupe Danone | | | 319,975 | |
| | |
| | 973 | | | Henkel AG and CO KGaA | | | 122,644 | |
| | |
| | 15,588 | | | J. Sainsbury PLC | | | 50,198 | |
| | |
| | 1,026 | | | Jeronimo Martins SGPS | | | 18,646 | |
| | |
| | 1,227 | | | KAO Corporation | | | 73,817 | |
| | |
| | 288 | | | Koninklijke Ahold Delhaize NV | | | 5,420 | |
| | |
| | 324 | | | L’Oreal | | | 72,111 | |
| | |
| | 8,382 | | | Nestle SA | | | 705,507 | |
| | |
| | 1,488 | | | Essitty Aktiebolag | | | 44,488 | |
| | |
| | 3,531 | | | Orkla ASA | | | 34,503 | |
| | |
| | 495 | | | Tate and Lyle PLC | | | 4,250 | |
| | |
| | 40,032 | | | Tesco PLC | | | 96,433 | |
| | |
| | 6,039 | | | Unilever NV | | | 342,392 | |
| | |
| | 111 | | | Unilever NV | | | 6,453 | |
| | | | Total Consumer Staples | | | 2,666,540 | |
| | |
| | | | Energy – 3.0% | | | |
| | |
| | 4,204 | | | Caltex Australia Limited | | | 110,434 | |
| | |
| | 3,692 | | | Enagas | | | 106,364 | |
| | |
| | 1,128 | | | Koninklijke Vopak NV | | | 48,850 | |
| | |
| | 2,081 | | | Neste Oil OYJ | | | 115,952 | |
| | |
| | 3,018 | | | Showa Shell Sekiyu K.K | | | 35,378 | |
| | |
| | 36,985 | | | Snam Rete Gas S.p.A | | | 188,974 | |
| | |
| | 7,678 | | | Tenaris SA | | | 105,098 | |
| | | | Total Energy | | | 711,050 | |
| | |
| | | | Financials – 20.2% | | | |
| | |
| | 8,274 | | | 3I Group PLC | | | 105,589 | |
| | |
| | 23,913 | | | Aegon N.V. | | | 141,182 | |
Nushares ESG International Developed Markets Equity ETF (NUDM) (continued)
| | |
| Portfolio of Investments | | October 31, 2017 |
| | | | | | | | |
| Shares | | | Description (1) | | Value | |
| | |
| | | | Financials (continued) | | | |
| | |
| | 1,001 | | | Aeon Financial Service Co Ltd | | $ | 21,380 | |
| | |
| | 1,489 | | | Allianz AG ORD Shares | | | 345,795 | |
| | |
| | 792 | | | Amp Limited | | | 3,018 | |
| | |
| | 11,387 | | | Australia and New Zealand Banking Group Limited | | | 261,231 | |
| | |
| | 6,545 | | | Aviva PLC | | | 43,892 | |
| | |
| | 7,013 | | | AXA | | | 211,843 | |
| | |
| | 18,533 | | | Banco Bilbao Vizcaya Argentaria S.A | | | 162,206 | |
| | |
| | 9,525 | | | Bank Hapoalim BM | | | 67,423 | |
| | |
| | 1,263 | | | Bank Leumi le-Israel B.M | | | 6,985 | |
| | |
| | 22,813 | | | BOC Hong Kong Holdings Limited | | | 108,629 | |
| | |
| | 1,173 | | | CNP Assurances | | | 27,296 | |
| | |
| | 10,532 | | | Commerzbank AG, (2) | | | 144,348 | |
| | |
| | 2,453 | | | Commonwealth Bank of Australia | | | 146,009 | |
| | |
| | 2,000 | | | DBS Group Holdings Limited | | | 33,441 | |
| | |
| | 8,830 | | | DnB NOR ASA | | | 169,976 | |
| | |
| | 362 | | | Hang Seng Bank | | | 8,570 | |
| | |
| | 7,338 | | | Hong Kong Exchanges and Clearing Limited | | | 204,288 | |
| | |
| | 6,526 | | | Intesa Sanpaolo, (2) | | | 20,587 | |
| | |
| | 31,781 | | | IntesaSanpaolo SpA | | | 106,849 | |
| | |
| | 4,168 | | | Investec PLC | | | 28,532 | |
| | |
| | 2,468 | | | KBC Group NV | | | 205,023 | |
| | |
| | 120 | | | Kinnevik AB | | | 3,938 | |
| | |
| | 82 | | | London Stock Exchange Group | | | 4,095 | |
| | |
| | 7,040 | | | Mitsubishi UFJ Lease & Finance Company Limited | | | 36,802 | |
| | |
| | 4,437 | | | Mitsui Sumitomo Insurance Company Limited | | | 149,748 | |
| | |
| | 18 | | | Muenchenener Rueckver AG | | | 4,027 | |
| | |
| | 8,884 | | | National Australia Bank Limited | | | 222,474 | |
| | |
| | 12,844 | | | Natixis SA | | | 100,728 | |
| | |
| | 126 | | | NN Group NV | | | 5,278 | |
| | |
| | 66,727 | | | Banco Santander S.A. | | | 452,643 | |
| | |
| | 2,745 | | | Old Mutual PLC | | | 6,962 | |
| | |
| | 4,917 | | | Prudential Corporation PLC | | | 120,927 | |
| | |
| | 7,896 | | | Resona Holdings, Inc. | | | 42,263 | |
| | |
| | 372 | | | Skandinaviska Enskilda Banken | | | 4,586 | |
| | |
| | 264 | | | Sompo Japan Nipponkoa Holdings Inc. | | | 10,546 | |
| | |
| | 21,394 | | | Standard Chartered PLC | | | 213,190 | |
| | |
| | 3,177 | | | Sumitomo Mitsui Trust Holdings | | | 124,278 | |
| | |
| | 518 | | | Swiss Re AG | | | 48,770 | |
| | |
| | 2,826 | | | T&D Holdings Inc. | | | 43,486 | |
| | | | | | | | |
| Shares | | | Description (1) | | Value | |
| | |
| | | | Financials (continued) | | | |
| | |
| | 3,952 | | | Tokio Marine Holdings Inc. | | $ | 168,855 | |
| | |
| | 12,378 | | | UBS Group AG | | | 210,853 | |
| | |
| | 18 | | | Wendel SA | | | 3,036 | |
| | |
| | 9,552 | | | Westpac Banking Corporation | | | 241,619 | |
| | |
| | 9 | | | Zurich Financial Services AG | | | 2,749 | |
| | | | Total Financials | | | 4,795,945 | |
| | |
| | | | Health Care – 10.6% | | | |
| | |
| | 6,005 | | | Al Noor Hospitals Group PLC | | | 46,411 | |
| | |
| | 8,164 | | | Astellas Pharma Inc. | | | 108,382 | |
| | |
| | 6,192 | | | Astrazeneca PLC | | | 413,765 | |
| | |
| | 1,982 | | | Chugai Pharmaceuticals Company | | | 94,190 | |
| | |
| | 46 | | | Coloplast A/S | | | 4,047 | |
| | |
| | 10,002 | | | Convatec Group PLC | | | 26,020 | |
| | |
| | 504 | | | Dainippon Pharmaceutical Company Limited | | | 7,172 | |
| | |
| | 855 | | | Eisai Company, Limited | | | 47,381 | |
| | |
| | 804 | | | Essilor International SA | | | 101,811 | |
| | |
| | 154 | | | H. Lundbeck A/S | | | 9,152 | |
| | |
| | 5,718 | | | Healthscope Limited | | | 8,593 | |
| | |
| | 2,974 | | | Koninklijke Philips Electronics NV | | | 121,104 | |
| | |
| | 3,962 | | | Kyowa Hakko Kirin Company Limited | | | 72,803 | |
| | |
| | 18 | | | Lonza AG | | | 4,785 | |
| | |
| | 100 | | | Merck KGaA | | | 10,705 | |
| | |
| | 5,913 | | | Novo Nordisk AS, Class B | | | 294,187 | |
| | |
| | 1,918 | | | Ramsay Health Care Limited | | | 98,400 | |
| | |
| | 2,178 | | | Roche Holdings AG, Sponsored ADR | | | 503,641 | |
| | |
| | 4,052 | | | Sanofi-Synthelabo, SA | | | 383,719 | |
| | |
| | 254 | | | Shionogi & Company Limited | | | 13,606 | |
| | |
| | 209 | | | Sonic Healthcare Limited | | | 3,489 | |
| | |
| | 937 | | | Suzuken Co Limited | | | 33,603 | |
| | |
| | 1,081 | | | Sysmex Corporation | | | 73,538 | |
| | |
| | 442 | | | UCB SA | | | 32,177 | |
| | | | Total Health Care | | | 2,512,681 | |
| | |
| | | | Industrials – 15.9% | | | |
| | |
| | 9,597 | | | ABB Limited | | | 251,093 | |
| | |
| | 363 | | | Abertis Infraestructuras S.A | | | 7,853 | |
| | |
| | 387 | | | Adecco Group | | | 30,729 | |
| | |
| | 21 | | | Aeroports de Paris | | | 3,537 | |
| | |
| | 165 | | | Alfa Laval AB | | | 4,180 | |
| | |
| | 243 | | | Assa Abloy AB B | | | 5,129 | |
Nushares ESG International Developed Markets Equity ETF (NUDM) (continued)
| | |
| Portfolio of Investments | | October 31, 2017 |
| | | | | | | | |
| Shares | | | Description (1) | | Value | |
| | |
| | | | Industrials (continued) | | | |
| | |
| | 435 | | | Atlas Copco AB, Class A Shares | | $ | 19,080 | |
| | |
| | 3,249 | | | Atlas Copco AB, Class B Shares | | | 129,039 | |
| | |
| | 110 | | | Bouygues SA | | | 5,281 | |
| | |
| | 6,706 | | | Brambles Limited | | | 48,642 | |
| | |
| | 129 | | | Bunzl PLC | | | 4,017 | |
| | |
| | 10,704 | | | Capita PLC | | | 74,483 | |
| | |
| | 4,460 | | | Compagnie de Saint-Gobain | | | 261,654 | |
| | |
| | 2,226 | | | Daikin Industries Limited | | | 244,286 | |
| | |
| | 81 | | | Deutsche Post AG | | | 3,710 | |
| | |
| | 91 | | | DCC PLC | | | 8,628 | |
| | |
| | 3,236 | | | East Japan Railway Company | | | 312,408 | |
| | |
| | 1,019 | | | Edenred SA | | | 29,380 | |
| | |
| | 192 | | | Eiffage SA | | | 20,061 | |
| | |
| | 1,487 | | | Ferrovial SA | | | 32,307 | |
| | |
| | 138 | | | Fraport AG | | | 13,096 | |
| | |
| | 74 | | | GEA Group AG | | | 3,569 | |
| | |
| | 496 | | | Hino Motors, Ltd | | | 6,334 | |
| | |
| | 19 | | | Hochteif AG | | | 3,353 | |
| | |
| | 290 | | | IMI PLC | | | 4,706 | |
| | |
| | 135 | | | Intertek Group PLC | | | 9,726 | |
| | |
| | 1,189 | | | Kawasaki Heavy Industries Limited | | | 41,123 | |
| | |
| | 11,430 | | | Komatsu, Ltd | | | 371,880 | |
| | |
| | 641 | | | Meggitt PLC | | | 4,414 | |
| | |
| | 16,030 | | | MTR Corporation | | | 92,870 | |
| | |
| | 243 | | | NGK Insulators Ltd | | | 4,758 | |
| | |
| | 48 | | | Nippon Express Company Limited | | | 3,029 | |
| | |
| | 9,975 | | | CNH Industrial NV | | | 127,476 | |
| | |
| | 425 | | | Obayashi Corporation | | | 5,536 | |
| | |
| | 56 | | | Osram Licht AG | | | 4,285 | |
| | |
| | 1,188 | | | Randstad Holding NV | | | 73,101 | |
| | |
| | 4,448 | | | Reed Elsevier PLC | | | 102,363 | |
| | |
| | 4,024 | | | Rexel SA | | | 71,840 | |
| | |
| | 739 | | | Sandvik AB | | | 13,497 | |
| | |
| | 3,821 | | | Schneider Electric SE | | | 335,849 | |
| | |
| | 3,278 | | | Siemens AG, Sponsored ADR | | | 467,791 | |
| | |
| | 174 | | | SKF, AB | | | 4,047 | |
| | |
| | 8,649 | | | Sydney Airport | | | 47,151 | |
| | |
| | 182 | | | Tokyu Corporation | | | 2,739 | |
| | |
| | 14,157 | | | Transurban Group | | | 131,670 | |
| | | | | | | | |
| Shares | | | Description (1) | | Value | |
| | |
| | | | Industrials (continued) | | | |
| | |
| | 2,621 | | | Travis Perkins PLC | | $ | 52,904 | |
| | |
| | 273 | | | Vesta Wind Systems A/S | | | 24,083 | |
| | |
| | 10,872 | | | Volvo AB, Class B Shares | | | 215,445 | |
| | |
| | 469 | | | West Japan Railway Company | | | 32,908 | |
| | |
| | 117 | | | Wolseley PLC | | | 8,180 | |
| | | | Total Industrials | | | 3,775,220 | |
| | |
| | | | Information Technology – 6.2% | | | |
| | |
| | 1,163 | | | ASML Lithography Holding NV | | | 209,729 | |
| | |
| | 262 | | | Computershare Ltd | | | 3,130 | |
| | |
| | 9,288 | | | Ericsson LM, Class B Shares | | | 58,467 | |
| | |
| | 13,224 | | | Fujitsu Limited | | | 102,226 | |
| | |
| | 3,566 | | | Kyocera Corporation | | | 236,719 | |
| | |
| | 812 | | | Murata Manufacturing Company, Limited | | | 126,413 | |
| | |
| | 353 | | | Nintendo Co., Ltd. | | | 136,068 | |
| | |
| | 7,400 | | | Nokia Oyj | | | 36,345 | |
| | |
| | 72 | | | Nomura Research Institute, Ltd | | | 3,032 | |
| | |
| | 533 | | | Omron Corporation | | | 29,645 | |
| | |
| | 2,947 | | | SAP SE | | | 335,277 | |
| | |
| | 6,168 | | | STMicroelectronics NV | | | 145,145 | |
| | |
| | 1,308 | | | Yaskawa Electric Corporation | | | 46,505 | |
| | | | Total Information Technology | | | 1,468,701 | |
| | |
| | | | Materials – 8.2% | | | |
| | |
| | 766 | | | AKZO Nobel NV | | | 69,371 | |
| | |
| | 6,419 | | | Antofagasta PLC | | | 81,363 | |
| | |
| | 20,262 | | | Asahi Kasei Corporation | | | 244,114 | |
| | |
| | 4,413 | | | Boliden AB | | | 154,448 | |
| | |
| | 10,712 | | | Boral Limited | | | 58,726 | |
| | |
| | 45 | | | Christian Hansen Holding A/S | | | 3,938 | |
| | |
| | 1,874 | | | CRH PLC | | | 70,667 | |
| | |
| | 306 | | | Daicel Corporation | | | 3,786 | |
| | |
| | 2,613 | | | Evonik Industries AG | | | 95,217 | |
| | |
| | 1,638 | | | Fletcher Building Ltd | | | 8,259 | |
| | |
| | 1 | | | Givaudan SA | | | 2,235 | |
| | |
| | 569 | | | Hitachi Chemical Company, Ltd | | | 16,099 | |
| | |
| | 3,449 | | | Hitachi Metals Limited | | | 44,376 | |
| | |
| | 127 | | | Johnson Matthey PLC | | | 5,702 | |
| | |
| | 3,106 | | | K+S AG | | | 75,334 | |
| | |
| | 433 | | | Kaneka Corporation | | | 3,551 | |
| | |
| | 5,015 | | | Kobe Steel, Ltd | | | 41,928 | |
Nushares ESG International Developed Markets Equity ETF (NUDM) (continued)
| | |
| Portfolio of Investments | | October 31, 2017 |
| | | | | | | | |
| Shares | | | Description (1) | | Value | |
| | |
| | | | Materials (continued) | | | |
| | |
| | 82 | | | Koninklijke DSM NV | | $ | 6,996 | |
| | |
| | 3,304 | | | Kuraray Company Limited | | | 64,638 | |
| | |
| | 738 | | | Mondi PLC | | | 17,846 | |
| | |
| | 957 | | | Nitto Denko Corporation | | | 88,474 | |
| | |
| | 3,387 | | | Stora Enso Oyj, Class R Shares | | | 52,991 | |
| | |
| | 25,257 | | | Sumitomo Chemical Company, Limited | | | 176,486 | |
| | |
| | 3,988 | | | Sumitomo Metal Mining Company, Limited | | | 156,389 | |
| | |
| | 12,155 | | | Toray Industries Inc. | | | 122,320 | |
| | |
| | 2,306 | | | Umicore | | | 103,076 | |
| | |
| | 2,253 | | | UPM-Kymmene Corporation | | | 67,716 | |
| | |
| | 1,848 | | | Voestalpine AG | | | 101,689 | |
| | | | Total Materials | | | 1,937,735 | |
| | |
| | | | Real Estate – 3.4% | | | |
| | |
| | 262 | | | Azrieli Group Ltd | | | 14,788 | |
| | |
| | 13,107 | | | British Land and Company PLC | | | 104,607 | |
| | |
| | 37,341 | | | Capitaland Limited | | | 100,588 | |
| | |
| | 1,944 | | | City Developments Limited | | | 18,464 | |
| | |
| | 101 | | | Daiwa House Industry Company Limited | | | 3,680 | |
| | |
| | 1,020 | | | Deutsche Wohnen Ag | | | 43,448 | |
| | |
| | 2,990 | | | Hammerson PLC | | | 20,806 | |
| | |
| | 6,750 | | | Hysan Development Company | | | 32,617 | |
| | |
| | 14,401 | | | Intu Properties PLC | | | 41,307 | |
| | |
| | 8,806 | | | Land Securities Group PLC | | | 112,963 | |
| | |
| | 6,671 | | | Mitsubishi Estate Company Limited | | | 120,087 | |
| | |
| | 5,645 | | | Mitsui Fudosan Co., Ltd | | | 130,456 | |
| | |
| | 272 | | | Nomura Real Estate Holdings, Inc. | | | 5,951 | |
| | |
| | 630 | | | SEGRO PLC | | | 4,543 | |
| | |
| | 12,552 | | | Swire Properties Limited | | | 42,393 | |
| | | | Total Real Estate | | | 796,698 | |
| | |
| | | | Telecommunication Services – 4.5% | | | |
| | |
| | 28,981 | | | BT Group PLC | | | 100,177 | |
| | |
| | 6,372 | | | KDDI Corporation | | | 169,576 | |
| | |
| | 5,590 | | | NTT Mobile Communications | | | 134,843 | |
| | |
| | 983 | | | Orange S.A | | | 16,129 | |
| | |
| | 71,541 | | | Singapore Telecommunications Limited | | | 196,916 | |
| | |
| | 180 | | | Telenor ASA | | | 3,817 | |
| | |
| | 13,446 | | | Telstra Corporation Limited | | | 36,496 | |
| | |
| | 142,614 | | | Vodafone Group PLC | | | 408,312 | |
| | | | Total Telecommunication Services | | | 1,066,266 | |
| | | | | | | | |
| Shares | | | Description (1) | | Value | |
| | |
| | | | Utilities – 3.6% | | | |
| | |
| | 17,875 | | | APA Group | | $ | 117,320 | |
| | |
| | 2,227 | | | Dong Energy A/S | | | 124,815 | |
| | |
| | 1,362 | | | Mercury NZ Ltd | | | 3,070 | |
| | |
| | 20,657 | | | Meridian Energy Limited | | | 40,331 | |
| | |
| | 28,325 | | | National Grid PLC | | | 340,785 | |
| | |
| | 5,878 | | | Suez Environment Company | | | 103,398 | |
| | |
| | 2,414 | | | Terna-Rete Elettrica Nazionale SpA | | | 14,567 | |
| | |
| | 10,956 | | | United Utilities PLC | | | 121,193 | |
| | | | Total Utilities | | | 865,479 | |
| | | | Total Common Stocks (cost $22,822,837) | | | 23,410,344 | |
| | |
| Shares | | | Description (1) | | Value | |
| | |
| | | | COMMON STOCK RIGHTS – 0.0% | | | | |
| | |
| | 44,485 | | | Banco Santander SA | | $ | 2,125 | |
| | |
| | 992 | | | Ferrovial SA | | | 477 | |
| | | | Total Common Stock Rights (cost $2,561) | | | 2,602 | |
| | | | Total Long-Term Investments (cost $22,825,398) | | | 23,412,946 | |
| | | | Other Assets Less Liabilities – 1.4% | | | 342,240 | |
| | | | Net Assets – 100% | | $ | 23,755,186 | |
For Fund portfolio compliance purposes, the Fund’s industry classifications refer to any one or more of the industry sub-classifications used by one or more widely recognized market indexes or ratings group indexes, and/or as defined by Fund management. This definition may not apply for purposes of this report, which may combine industry sub-classifications into sectors for reporting ease.
| (1) | All percentages shown in the Portfolio of Investments are based on net assets. |
| (2) | Non-income producing; issuer has not declared a dividend within the past twelve months. |
| ADR | American Depositary Receipt. |
See accompanying notes to financial statements.
Nushares ESG Large-Cap Growth ETF (NULG)
| | |
| Portfolio of Investments | | October 31, 2017 |
| | | | | | | | |
| Shares | | | Description (1) | | Value | |
| | |
| | | | LONG-TERM INVESTMENTS – 99.7% | | | | |
| | |
| | | | COMMON STOCKS – 99.7% | | | | |
| | |
| | | | Consumer Discretionary – 19.7% | | | |
| | |
| | 64 | | | Aramark Holdings Corporation | | $ | 2,796 | |
| | |
| | 353 | | | CarMax, Inc., (2) | | | 26,510 | |
| | |
| | 1,137 | | | Expedia, Inc. | | | 141,738 | |
| | |
| | 338 | | | Liberty Broadband Corporation, Class C Shares, (2) | | | 29,504 | |
| | |
| | 127 | | | Liberty Global PLC Class A, (2) | | | 3,918 | |
| | |
| | 3,663 | | | Liberty Global PLC Class C, (2) | | | 109,487 | |
| | |
| | 78 | | | Liberty Sirius Group, Class A Shares, (2) | | | 3,253 | |
| | |
| | 2,274 | | | Liberty Sirius Group, Class C Shares, (2) | | | 94,712 | |
| | |
| | 4,494 | | | LKQ Corporation, (2) | | | 169,379 | |
| | |
| | 5,615 | | | Lowe’s Companies, Inc. | | | 448,919 | |
| | |
| | 62 | | | Michael Kors Holdings Limited, (2) | | | 3,026 | |
| | |
| | 2,603 | | | NetFlix.com Inc., (2) | | | 511,307 | |
| | |
| | 5,730 | | | Nike, Inc., Class B | | | 315,093 | |
| | |
| | 78 | | | Nordstrom, Inc. | | | 3,093 | |
| | |
| | 259 | | | Priceline Group Incorporated, (2) | | | 495,198 | |
| | |
| | 1,409 | | | Ross Stores, Inc. | | | 89,457 | |
| | |
| | 21,744 | | | Sirius XM Holdings Inc. | | | 118,287 | |
| | |
| | 8,351 | | | Starbucks Corporation | | | 457,969 | |
| | |
| | 609 | | | Tesla Motors Inc., (2) | | | 201,902 | |
| | |
| | 4,401 | | | Time Warner Inc. | | | 432,574 | |
| | |
| | 4,545 | | | TJX Companies, Inc. | | | 317,241 | |
| | |
| | 512 | | | Ulta Beauty, Inc., (2) | | | 103,316 | |
| | |
| | 258 | | | Vail Resorts, Inc. | | | 59,087 | |
| | |
| | 6,044 | | | Walt Disney Company | | | 591,164 | |
| | |
| | 688 | | | Wyndham Worldwide Corporation | | | 73,513 | |
| | | | Total Consumer Discretionary | | | 4,802,443 | |
| | |
| | | | Consumer Staples – 5.5% | | | |
| | |
| | 3,808 | | | Colgate-Palmolive Company | | | 268,274 | |
| | |
| | 4,353 | | | Kraft Heinz Company | | | 336,617 | |
| | |
| | 7,538 | | | Mondelez International Inc. | | | 312,299 | |
| | |
| | 3,890 | | | PepsiCo, Inc. | | | 428,795 | |
| | | | Total Consumer Staples | | | 1,345,985 | |
| | |
| | | | Energy – 1.6% | | | |
| | |
| | 1,040 | | | Baker Hughes a GE Co | | | 32,687 | |
| | |
| | 8,224 | | | Halliburton Company | | | 351,494 | |
| | | | | | | | |
| Shares | | | Description (1) | | Value | |
| | |
| | | | Energy (continued) | | | |
| | |
| | 914 | | | Weatherford International PLC, (2) | | $ | 3,172 | |
| | | | Total Energy | | | 387,353 | |
| | |
| | | | Financials – 5.5% | | | |
| | |
| | 34 | | | AON PLC | | | 4,877 | |
| | |
| | 9,727 | | | Charles Schwab Corporation | | | 436,159 | |
| | |
| | 1,088 | | | First Republic Bank of San Francisco | | | 105,971 | |
| | |
| | 1,792 | | | Marsh & McLennan Companies, Inc. | | | 145,027 | |
| | |
| | 338 | | | Moody’s Corporation | | | 48,135 | |
| | |
| | 175 | | | Progressive Corporation | | | 8,514 | |
| | |
| | 2,354 | | | S&P Global, Inc. | | | 368,330 | |
| | |
| | 2,146 | | | TD Ameritrade Holding Corporation | | | 107,279 | |
| | |
| | 1,074 | | | Voya Financial Inc. | | | 43,132 | |
| | |
| | 1,888 | | | XL Group Limited | | | 76,407 | |
| | | | Total Financials | | | 1,343,831 | |
| | |
| | | | Health Care – 13.5% | | | |
| | |
| | 2,751 | | | AbbVie Inc. | | | 248,278 | |
| | |
| | 528 | | | Align Technology, Inc., (2) | | | 126,181 | |
| | |
| | 608 | | | AmerisourceBergen Corporation | | | 46,786 | |
| | |
| | 1,665 | | | Becton, Dickinson and Company | | | 347,436 | |
| | |
| | 7,680 | | | Bristol-Myers Squibb Company | | | 473,549 | |
| | |
| | 3,634 | | | Celgene Corporation, (2) | | | 366,925 | |
| | |
| | 1,312 | | | Centene Corporation, (2) | | | 122,895 | |
| | |
| | 1,648 | | | CIGNA Corporation | | | 325,019 | |
| | |
| | 15 | | | Cooper Companies, Inc. | | | 3,604 | |
| | |
| | 1,874 | | | Edwards Lifesciences Corporation, (2) | | | 191,579 | |
| | |
| | 943 | | | Eli Lilly and Company | | | 77,269 | |
| | |
| | 2,545 | | | HCA Holdings Inc., (2) | | | 192,529 | |
| | |
| | 1,182 | | | Humana Inc. | | | 301,824 | |
| | |
| | 1,313 | | | Idexx Labs Inc., (2) | | | 218,181 | |
| | |
| | 64 | | | Patterson Companies, Inc. | | | 2,368 | |
| | |
| | 703 | | | Veeva Systems Inc., Class A Shares, (2) | | | 42,841 | |
| | |
| | 832 | | | Vertex Pharmaceuticals Inc., (2) | | | 121,663 | |
| | |
| | 1,408 | | | Zoetis Incorporated | | | 89,859 | |
| | | | Total Health Care | | | 3,298,786 | |
| | |
| | | | Industrials – 11.6% | | | |
| | |
| | 228 | | | Acuity Brands Inc. | | | 38,122 | |
| | |
| | 143 | | | AMERCO | | | 56,147 | |
| | |
| | 2,882 | | | C.H. Robinson Worldwide, Inc. | | | 226,323 | |
| | |
| | 3,710 | | | Expeditors International of Washington, Inc. | | | 216,590 | |
Nushares ESG Large-Cap Growth ETF (NULG) (continued)
| | |
| Portfolio of Investments | | October 31, 2017 |
| | | | | | | | |
| Shares | | | Description (1) | | Value | |
| | |
| | | | Industrials (continued) | | | |
| | |
| | 446 | | | Fastenal Company | | $ | 20,949 | |
| | |
| | 48 | | | Flowserve Corporation | | | 2,115 | |
| | |
| | 1,326 | | | Fortive Corporation | | | 95,817 | |
| | |
| | 48 | | | Fortune Brands Home & Security | | | 3,171 | |
| | |
| | 6,542 | | | IHS Markit Limited, (2) | | | 278,755 | |
| | |
| | 2,748 | | | Illinois Tool Works, Inc. | | | 430,117 | |
| | |
| | 3,616 | | | Ingersoll Rand Company Limited, Class A | | | 320,378 | |
| | |
| | 17 | | | Lennox International Inc. | | | 3,249 | |
| | |
| | 5,135 | | | Masco Corporation | | | 204,476 | |
| | |
| | 31 | | | Middleby Corporation, (2) | | | 3,593 | |
| | |
| | 834 | | | Rockwell Automation, Inc. | | | 167,484 | |
| | |
| | 606 | | | Rockwell Collins, Inc. | | | 82,174 | |
| | |
| | 1,471 | | | Roper Technologies, Inc. | | | 379,768 | |
| | |
| | 78 | | | Sensata Technologies, (2) | | | 3,815 | |
| | |
| | 208 | | | Smith AO Corporation | | | 12,314 | |
| | |
| | 31 | | | Snap-on Incorporated | | | 4,891 | |
| | |
| | 32 | | | Stanley Black & Decker Inc. | | | 5,170 | |
| | |
| | 721 | | | TransDigm Group Inc., (2) | | | 200,078 | |
| | |
| | 287 | | | United Rentals Inc., (2) | | | 40,605 | |
| | |
| | 16 | | | W.W. Grainger, Inc. | | | 3,163 | |
| | |
| | 464 | | | Xylem Inc. | | | 30,870 | |
| | | | Total Industrials | | | 2,830,134 | |
| | |
| | | | Information Technology – 36.6% | | | |
| | |
| | 3,502 | | | Accenture Limited | | | 498,545 | |
| | |
| | 2,929 | | | Adobe Systems Incorporated, (2) | | | 513,044 | |
| | |
| | 751 | | | Alphabet Inc., Class A, (2) | | | 775,813 | |
| | |
| | 817 | | | Alphabet Inc., Class C Shares, (2) | | | 830,595 | |
| | |
| | 12,125 | | | Apple, Inc. | | | 2,049,610 | |
| | |
| | 2,943 | | | Applied Materials, Inc. | | | 166,073 | |
| | |
| | 1,694 | | | Autodesk, Inc., (2) | | | 211,682 | |
| | |
| | 1,360 | | | Cognizant Technology Solutions Corporation, Class A | | | 102,911 | |
| | |
| | 2,672 | | | Dell Technologies Incorporated – VMware Incorporated, (2) | | | 221,161 | |
| | |
| | 1,646 | | | Intuit, Inc. | | | 248,579 | |
| | |
| | 18 | | | Lam Research Corporation | | | 3,754 | |
| | |
| | 11,504 | | | Microsoft Corporation | | | 956,903 | |
| | |
| | 2,815 | | | NVIDIA Corporation | | | 582,170 | |
| | |
| | 12,207 | | | Oracle Corporation | | | 621,336 | |
| | |
| | 4,510 | | | Salesforce.com, Inc., (2) | | | 461,553 | |
| | |
| | 2,352 | | | Symantec Corporation | | | 76,440 | |
| | | | | | | | |
| Shares | | | Description (1) | | Value | |
| | |
| | | | Information Technology (continued) | | | |
| | |
| | 3,074 | | | Texas Instruments Incorporated | | $ | 297,225 | |
| | |
| | 2,674 | | | Workday Inc., Class A, (2) | | | 296,787 | |
| | | | Total Information Technology | | | 8,914,181 | |
| | |
| | | | Materials – 1.8% | | | |
| | |
| | 1,807 | | | Ball Corporation | | | 77,574 | |
| | |
| | 2,559 | | | Ecolab Inc. | | | 334,359 | |
| | |
| | 128 | | | PPG Industries, Inc. | | | 14,879 | |
| | |
| | 79 | | | Sealed Air Corporation | | | 3,494 | |
| | | | Total Materials | | | 430,306 | |
| | |
| | | | Real Estate – 2.5% | | | |
| | |
| | 2,910 | | | American Tower Corporation, REIT | | | 418,080 | |
| | |
| | 2,623 | | | Prologis Inc. | | | 169,393 | |
| | |
| | 641 | | | UDR Inc. | | | 24,864 | |
| | | | Total Real Estate | | | 612,337 | |
| | |
| | | | Telecommunication Services – 0.9% | | | |
| | |
| | 3,737 | | | Level 3 Communications Inc., (2) | | | 200,415 | |
| | |
| | 641 | | | Zayo Group Holdings, Inc., (2) | | | 23,114 | |
| | | | Total Telecommunication Services | | | 223,529 | |
| | |
| | | | Utilities – 0.5% | | | |
| | |
| | 1,248 | | | American Water Works Company | | | 109,524 | |
| | | | Total Long-Term Investments (cost $23,128,599) | | | 24,298,409 | |
| | | | Other Assets Less Liabilities – 0.3% | | | 81,373 | |
| | | | Net Assets – 100% | | $ | 24,379,782 | |
For Fund portfolio compliance purposes, the Fund’s industry classifications refer to any one or more of the industry sub-classifications used by one or more widely recognized market indexes or ratings group indexes, and/or as defined by Fund management. This definition may not apply for purposes of this report, which may combine industry sub-classifications into sectors for reporting ease.
| (1) | All percentages shown in the Portfolio of Investments are based on net assets. |
| (2) | Non-income producing; issuer has not declared a dividend within the past twelve months. |
| REIT | Real Estate Investment Trust |
See accompanying notes to financial statements.
Nushares ESG Large-Cap Value ETF (NULV)
| | |
| Portfolio of Investments | | October 31, 2017 |
| | | | | | | | |
| Shares | | | Description (1) | | Value | |
| | |
| | | | LONG-TERM INVESTMENTS – 99.8% | | | | |
| | |
| | | | COMMON STOCKS – 99.8% | | | | |
| | |
| | | | Consumer Discretionary – 4.6% | | | |
| | |
| | 1,294 | | | Autoliv Inc. | | $ | 161,569 | |
| | |
| | 61 | | | BorgWarner Inc. | | | 3,216 | |
| | |
| | 77 | | | D.R. Horton, Inc. | | | 3,404 | |
| | |
| | 22 | | | Darden Restaurants, Inc. | | | 1,810 | |
| | |
| | 1,002 | | | Delphi Automotive PLC | | | 99,579 | |
| | |
| | 102 | | | Gap, Inc. | | | 2,651 | |
| | |
| | 56 | | | Garmin Limited | | | 3,170 | |
| | |
| | 22 | | | Genuine Parts Company | | | 1,941 | |
| | |
| | 80 | | | Goodyear Tire & Rubber Company | | | 2,447 | |
| | |
| | 76 | | | Kohl’s Corporation | | | 3,174 | |
| | |
| | 55 | | | Lennar Corporation, Class A | | | 3,062 | |
| | |
| | 23 | | | Liberty Broadband Corporation, Class C Shares, (2) | | | 2,008 | |
| | |
| | 7,383 | | | Macy’s, Inc. | | | 138,505 | |
| | |
| | 2,300 | | | Newell Brands Inc. | | | 93,794 | |
| | |
| | 102 | | | PulteGroup Inc. | | | 3,083 | |
| | |
| | 2,143 | | | Royal Caribbean Cruises Limited | | | 265,239 | |
| | |
| | 55 | | | Signet Jewelers Limited | | | 3,606 | |
| | |
| | 14,023 | | | Sirius XM Holdings Inc. | | | 76,285 | |
| | |
| | 59 | | | Tapestry Inc. | | | 2,416 | |
| | |
| | 6,657 | | | Target Corporation | | | 393,029 | |
| | |
| | 22 | | | Tiffany & Co. | | | 2,060 | |
| | |
| | 75 | | | Toll Brothers Inc. | | | 3,453 | |
| | |
| | 18 | | | Whirlpool Corporation | | | 2,951 | |
| | | | Total Consumer Discretionary | | | 1,272,452 | |
| | |
| | | | Consumer Staples – 10.2% | | | |
| | |
| | 38 | | | Bunge Limited | | | 2,614 | |
| | |
| | 17,296 | | | Coca-Cola Company | | | 795,270 | |
| | |
| | 7,158 | | | General Mills, Inc. | | | 371,643 | |
| | |
| | 4,879 | | | Kellogg Company | | | 305,084 | |
| | |
| | 21 | | | Kimberly-Clark Corporation | | | 2,363 | |
| | |
| | 4,563 | | | PepsiCo, Inc. | | | 502,979 | |
| | |
| | 9,897 | | | Procter & Gamble Company | | | 854,507 | |
| | | | Total Consumer Staples | | | 2,834,460 | |
| | |
| | | | Energy – 6.5% | | | |
| | |
| | 81 | | | Baker Hughes a GE Co | | | 2,546 | |
| | |
| | 61 | | | Helmerich & Payne Inc. | | | 3,313 | |
| | | | | | | | |
| Shares | | | Description (1) | | Value | |
| | |
| | | | Energy (continued) | | | |
| | |
| | 7,016 | | | National-Oilwell Varco Inc. | | $ | 239,877 | |
| | |
| | 7,395 | | | ONEOK, Inc. | | | 401,327 | |
| | |
| | 8,679 | | | Schlumberger Limited | | | 555,456 | |
| | |
| | 1,858 | | | Targa Resources Corporation | | | 77,107 | |
| | |
| | 6,216 | | | Valero Energy Corporation | | | 490,380 | |
| | |
| | 11,518 | | | Weatherford International PLC, (2) | | | 39,967 | |
| | | | Total Energy | | | 1,809,973 | |
| | |
| | | | Financials – 26.2% | | | |
| | |
| | 676 | | | Ace Limited | | | 101,954 | |
| | |
| | 11,164 | | | Ally Financial Inc. | | | 291,715 | |
| | |
| | 5,758 | | | American Express Company | | | 550,004 | |
| | |
| | 7,624 | | | American International Group, Inc. | | | 492,587 | |
| | |
| | 20 | | | Ameriprise Financial, Inc. | | | 3,131 | |
| | |
| | 22 | | | Arch Capital Group Limited, (2) | | | 2,192 | |
| | |
| | 40 | | | Arthur J. Gallagher & Co. | | | 2,533 | |
| | |
| | 40 | | | Axis Capital Holdings Limited | | | 2,176 | |
| | |
| | 8,902 | | | Bank New York Mellon | | | 458,008 | |
| | |
| | 38,821 | | | Bank of America Corporation | | | 1,063,307 | |
| | |
| | 7,136 | | | BB&T Corporation | | | 351,377 | |
| | |
| | 1,096 | | | BlackRock Inc. | | | 516,030 | |
| | |
| | 159 | | | CIT Group Inc. | | | 7,413 | |
| | |
| | 11,239 | | | Citizens Financial Group Inc. | | | 427,194 | |
| | |
| | 1,720 | | | CME Group, Inc. | | | 235,932 | |
| | |
| | 9,001 | | | Fifth Third Bancorp. | | | 260,129 | |
| | |
| | 20,836 | | | KeyCorp. | | | 380,257 | |
| | |
| | 40 | | | Lincoln National Corporation | | | 3,031 | |
| | |
| | 200 | | | Loews Corporation | | | 9,902 | |
| | |
| | 2,383 | | | M&T Bank Corporation | | | 397,413 | |
| | |
| | 9,318 | | | MetLife, Inc. | | | 499,258 | |
| | |
| | 8,841 | | | New York Community Bancorp Inc. | | | 111,043 | |
| | |
| | 160 | | | People’s United Financial, Inc. | | | 2,986 | |
| | |
| | 3,814 | | | PNC Financial Services Group, Inc. | | | 521,717 | |
| | |
| | 40 | | | Principal Financial Group, Inc. | | | 2,634 | |
| | |
| | 4,175 | | | Prudential Financial, Inc. | | | 461,171 | |
| | |
| | 7,518 | | | Regions Financial Corporation | | | 116,379 | |
| | |
| | 40 | | | State Street Corporation | | | 3,680 | |
| | |
| | 20 | | | Travelers Companies, Inc. | | | 2,649 | |
| | |
| | 100 | | | Voya Financial Inc. | | | 4,016 | |
| | |
| | 60 | | | XL Group Limited | | | 2,428 | |
| | | | Total Financials | | | 7,284,246 | |
Nushares ESG Large-Cap Value ETF (NULV) (continued)
| | |
| Portfolio of Investments | | October 31, 2017 |
| | | | | | | | |
| Shares | | | Description (1) | | Value | |
| | |
| | | | Health Care – 12.7% | | | |
| | |
| | 42 | | | Agilent Technologies, Inc. | | $ | 2,857 | |
| | |
| | 1,935 | | | Becton, Dickinson and Company | | | 403,776 | |
| | |
| | 4,719 | | | Cardinal Health, Inc. | | | 292,106 | |
| | |
| | 3,023 | | | Eli Lilly and Company | | | 247,705 | |
| | |
| | 1,597 | | | Envision Healthcare Corporation, (2) | | | 68,032 | |
| | |
| | 7,798 | | | Gilead Sciences, Inc. | | | 584,538 | |
| | |
| | 9,176 | | | Johnson & Johnson | | | 1,279,226 | |
| | |
| | 12,115 | | | Merck & Company Inc. | | | 667,415 | |
| | |
| | 23 | | | Quest Diagnostics Incorporated | | | 2,157 | |
| | | | Total Health Care | | | 3,547,812 | |
| | |
| | | | Industrials – 9.5% | | | |
| | |
| | 40 | | | AGCO Corporation | | | 2,743 | |
| | |
| | 4,374 | | | Caterpillar Inc. | | | 593,989 | |
| | |
| | 3,035 | | | Deere & Company | | | 403,291 | |
| | |
| | 5,722 | | | Eaton PLC | | | 457,874 | |
| | |
| | 58 | | | Fastenal Company | | | 2,724 | |
| | |
| | 58 | | | Flowserve Corporation | | | 2,556 | |
| | |
| | 10,955 | | | Johnson Controls International PLC | | | 453,427 | |
| | |
| | 40 | | | Macquarie Infrastructure Corporation | | | 2,782 | |
| | |
| | 3,523 | | | Norfolk Southern Corporation | | | 462,993 | |
| | |
| | 40 | | | PACCAR Inc. | | | 2,869 | |
| | |
| | 19 | | | Parker Hannifin Corporation | | | 3,470 | |
| | |
| | 3,256 | | | Waste Management, Inc. | | | 267,546 | |
| | | | Total Industrials | | | 2,656,264 | |
| | |
| | | | Information Technology – 12.3% | | | |
| | |
| | 23,037 | | | Hewlett Packard Enterprise Co | | | 320,675 | |
| | |
| | 17,402 | | | HP Inc. | | | 375,013 | |
| | |
| | 21,138 | | | Intel Corporation | | | 961,568 | |
| | |
| | 4,163 | | | International Business Machines Corporation (IBM) | | | 641,352 | |
| | |
| | 13,679 | | | Microsoft Corporation | | | 1,137,819 | |
| | | | Total Information Technology | | | 3,436,427 | |
| | |
| | | | Materials – 4.6% | | | |
| | |
| | 2,701 | | | Air Products & Chemicals Inc. | | | 430,620 | |
| | |
| | 38 | | | Avery Dennison Corporation | | | 4,034 | |
| | |
| | 64 | | | Ball Corporation | | | 2,748 | |
| | |
| | 36 | | | FMC Corporation | | | 3,343 | |
| | |
| | 1,980 | | | International Paper Company | | | 113,395 | |
| | |
| | 8,296 | | | Mosaic Company | | | 185,333 | |
| | |
| | 621 | | | PPG Industries, Inc. | | | 72,185 | |
| | | | | | | | |
| Shares | | | Description (1) | | Value | |
| | |
| | | | Materials (continued) | | | |
| | |
| | 3,215 | | | Praxair, Inc. | | $ | 469,776 | |
| | | | Total Materials | | | 1,281,434 | |
| | |
| | | | Real Estate – 2.7% | | | |
| | |
| | 20 | | | Boston Properties, Inc. | | | 2,424 | |
| | |
| | 40 | | | Camden Property Trust | | �� | 3,650 | |
| | |
| | 100 | | | Duke Realty Corporation | | | 2,848 | |
| | |
| | 15 | | | Essex Property Trust Inc. | | | 3,936 | |
| | |
| | 20 | | | Federal Realty Investment Trust | | | 2,410 | |
| | |
| | 1,678 | | | Health Care Property Investors Inc. | | | 43,360 | |
| | |
| | 75 | | | Iron Mountain Inc. | | | 3,000 | |
| | |
| | 21 | | | Jones Lang LaSalle Inc. | | | 2,719 | |
| | |
| | 10,415 | | | Kimco Realty Corporation | | | 189,136 | |
| | |
| | 62 | | | Liberty Property Trust | | | 2,659 | |
| | |
| | 41 | | | Regency Centers Corporation | | | 2,524 | |
| | |
| | 64 | | | UDR Inc. | | | 2,483 | |
| | |
| | 1,440 | | | Vornado Realty Trust | | | 107,798 | |
| | |
| | 5,318 | | | Welltower Inc. | | | 356,093 | |
| | |
| | 840 | | | Weyerhaeuser Company | | | 30,164 | |
| | | | Total Real Estate | | | 755,204 | |
| | |
| | | | Telecommunication Services – 3.9% | | | |
| | |
| | 13,635 | | | CenturyLink Inc. | | | 258,929 | |
| | |
| | 16,979 | | | Verizon Communications Inc. | | | 812,785 | |
| | | | Total Telecommunication Services | | | 1,071,714 | |
| | |
| | | | Utilities – 6.6% | | | |
| | |
| | 119 | | | American Water Works Company | | | 10,443 | |
| | |
| | 2,222 | | | CMS Energy Corporation | | | 107,478 | |
| | |
| | 4,679 | | | Consolidated Edison, Inc. | | | 402,628 | |
| | |
| | 4,919 | | | Edison International | | | 393,274 | |
| | |
| | 5,999 | | | Eversource Energy | | | 375,777 | |
| | |
| | 3,302 | | | Scana Corporation | | | 142,448 | |
| | |
| | 3,379 | | | Sempra Energy | | | 397,033 | |
| | | | Total Utilities | | | 1,829,081 | |
| | | | Total Long-Term Investments (cost $26,930,146) | | | 27,779,067 | |
| | | | Other Assets Less Liabilities – 0.2% | | | 48,641 | |
| | | | Net Assets – 100% | | $ | 27,827,708 | |
For Fund portfolio compliance purposes, the Fund’s industry classifications refer to any one or more of the industry sub-classifications used by one or more widely recognized market indexes or ratings group indexes, and/or as defined by Fund management. This definition may not apply for purposes of this report, which may combine industry sub-classifications into sectors for reporting ease.
| (1) | All percentages shown in the Portfolio of Investments are based on net assets. |
| (2) | Non-income producing; issuer has not declared a dividend within the past twelve months. |
See accompanying notes to financial statements.
Nushares ESG Mid-Cap Growth ETF (NUMG)
| | |
| Portfolio of Investments | | October 31, 2017 |
| | | | | | | | |
| Shares | | | Description (1) | | Value | |
| | |
| | | | LONG-TERM INVESTMENTS – 99.9% | | | | |
| | |
| | | | COMMON STOCKS – 99.9% | | | | |
| | |
| | | | Consumer Discretionary – 15.0% | | | |
| | |
| | 227 | | | Advance Auto Parts, Inc. | | $ | 18,555 | |
| | |
| | 9,210 | | | Aramark Holdings Corporation | | | 402,385 | |
| | |
| | 5,804 | | | CarMax, Inc., (2) | | | 435,880 | |
| | |
| | 1,260 | | | Discovery Communications Inc., Class A Shares, (2) | | | 23,789 | |
| | |
| | 14,233 | | | Discovery Communications Inc., Class C Shares, (2) | | | 253,490 | |
| | |
| | 2,089 | | | Foot Locker, Inc. | | | 62,837 | |
| | |
| | 1,635 | | | Hasbro, Inc. | | | 151,385 | |
| | |
| | 3,254 | | | Liberty Broadband Corporation, Class C Shares, (2) | | | 284,042 | |
| | |
| | 10,875 | | | LKQ Corporation, (2) | | | 409,879 | |
| | |
| | 2,368 | | | Lululemon Athletica Inc., (2) | | | 145,656 | |
| | |
| | 2,581 | | | Nordstrom, Inc. | | | 102,337 | |
| | |
| | 1,118 | | | Polaris Industries Inc. | | | 132,405 | |
| | |
| | 914 | | | Scripps Networks Interactive, Class A Shares | | | 76,118 | |
| | |
| | 133 | | | Tiffany & Co. | | | 12,451 | |
| | |
| | 4,154 | | | Tractor Supply Company | | | 250,320 | |
| | |
| | 3,297 | | | Under Armour Inc., Class C Shares, (2) | | | 38,014 | |
| | |
| | 3,014 | | | Under Armour, Inc., (2) | | | 37,735 | |
| | |
| | 1,581 | | | Vail Resorts, Inc. | | | 362,081 | |
| | | | Total Consumer Discretionary | | | 3,199,359 | |
| | |
| | | | Consumer Staples – 3.4% | | | |
| | |
| | 3,794 | | | Dr. Pepper Snapple Group | | | 324,994 | |
| | |
| | 3,899 | | | McCormick & Company, Incorporated | | | 388,067 | |
| | | | Total Consumer Staples | | | 713,061 | |
| | |
| | | | Energy – 2.4% | | | |
| | |
| | 3,312 | | | Core Laboratories NV | | | 330,869 | |
| | |
| | 54,660 | | | Weatherford International PLC, (2) | | | 189,670 | |
| | | | Total Energy | | | 520,539 | |
| | |
| | | | Financials – 5.9% | | | |
| | |
| | 6,766 | | | E*Trade Group Inc., (2) | | | 294,930 | |
| | |
| | 4,168 | | | First Republic Bank of San Francisco | | | 405,963 | |
| | |
| | 16 | | | Signature Bank, (2) | | | 2,080 | |
| | |
| | 7,079 | | | Voya Financial Inc. | | | 284,293 | |
| | |
| | 6,556 | | | XL Group Limited | | | 265,321 | |
| | | | Total Financials | | | 1,252,587 | |
| | | | | | | | |
| Shares | | | Description (1) | | Value | |
| | |
| | | | Health Care – 14.7% | | | |
| | |
| | 1,161 | | | Align Technology, Inc., (2) | | $ | 277,456 | |
| | |
| | 1,574 | | | Cooper Companies, Inc. | | | 378,169 | |
| | |
| | 4,712 | | | Henry Schein Inc., (2) | | | 370,363 | |
| | |
| | 2,593 | | | Idexx Labs Inc., (2) | | | 430,879 | |
| | |
| | 299 | | | Jazz Pharmaceuticals, Inc., (2) | | | 42,317 | |
| | |
| | 2,549 | | | Medax Inc., (2) | | | 111,621 | |
| | |
| | 603 | | | Mettler-Toledo International Inc., (2) | | | 411,626 | |
| | |
| | 5,038 | | | ResMed Inc. | | | 424,099 | |
| | |
| | 2,114 | | | Tesaro Inc., (2) | | | 244,738 | |
| | |
| | 3,495 | | | Varian Medical Systems, Inc., (2) | | | 364,144 | |
| | |
| | 450 | | | Waters Corporation, (2) | | | 88,222 | |
| | | | Total Health Care | | | 3,143,634 | |
| | |
| | | | Industrials – 22.0% | | | |
| | |
| | 1,620 | | | Acuity Brands Inc. | | | 270,864 | |
| | |
| | 600 | | | AMERCO | | | 235,584 | |
| | |
| | 4,592 | | | C.H. Robinson Worldwide, Inc. | | | 360,610 | |
| | |
| | 5,610 | | | Expeditors International of Washington, Inc. | | | 327,512 | |
| | |
| | 4,789 | | | Fastenal Company | | | 224,939 | |
| | |
| | 89 | | | Flowserve Corporation | | | 3,922 | |
| | |
| | 239 | | | HD Supply Holdings Inc., (2) | | | 8,458 | |
| | |
| | 659 | | | Lennox International Inc. | | | 125,955 | |
| | |
| | 10,517 | | | Masco Corporation | | | 418,787 | |
| | |
| | 793 | | | Middleby Corporation, (2) | | | 91,909 | |
| | |
| | 7,183 | | | Robert Half International Inc. | | | 371,864 | |
| | |
| | 2,354 | | | Rockwell Collins, Inc. | | | 319,202 | |
| | |
| | 7,738 | | | Sensata Technologies, (2) | | | 378,466 | |
| | |
| | 2,424 | | | Snap-on Incorporated | | | 382,459 | |
| | |
| | 2,894 | | | United Rentals Inc., (2) | | | 409,443 | |
| | |
| | 1,192 | | | W.W. Grainger, Inc. | | | 235,658 | |
| | |
| | 2,408 | | | WABCO Holdings Inc. | | | 355,348 | |
| | |
| | 2,655 | | | Xylem Inc. | | | 176,637 | |
| | | | Total Industrials | | | 4,697,617 | |
| | |
| | | | Information Technology – 25.5% | | | |
| | |
| | 30,057 | | | Advanced Micro Devices, Inc., (2) | | | 330,176 | |
| | |
| | 7,545 | | | Akamai Technologies, Inc., (2) | | | 394,226 | |
| | |
| | 2,669 | | | Ansys Inc., (2) | | | 364,879 | |
| | |
| | 913 | | | Arista Networks Inc., (2) | | | 182,500 | |
| | |
| | 4,619 | | | Broadridge Financial Solutions, Inc. | | | 396,864 | |
| | |
| | 9,928 | | | Cadence Design Systems, Inc., (2) | | | 428,492 | |
Nushares ESG Mid-Cap Growth ETF (NUMG) (continued)
| | |
| Portfolio of Investments | | October 31, 2017 |
| | | | | | | | |
| Shares | | | Description (1) | | Value | |
| | |
| | | | Information Technology (continued) | | | |
| | |
| | 4,336 | | | Citrix Systems, (2) | | $ | 358,197 | |
| | |
| | 6,374 | | | CommScope Holding Company Inc., (2) | | | 204,860 | |
| | |
| | 1,440 | | | F5 Networks, Inc., (2) | | | 174,629 | |
| | |
| | 8,219 | | | FLIR Systems Inc. | | | 384,814 | |
| | |
| | 4,395 | | | Fortinet Inc., (2) | | | 173,207 | |
| | |
| | 2,218 | | | Gartner Inc., (2) | | | 277,938 | |
| | |
| | 596 | | | Red Hat, Inc., (2) | | | 72,015 | |
| | |
| | 10,228 | | | Sabre Corporation | | | 200,060 | |
| | |
| | 4,269 | | | ServiceNow Inc., (2) | | | 539,473 | |
| | |
| | 1,843 | | | Splunk Inc., (2) | | | 124,034 | |
| | |
| | 9,570 | | | Trimble Navigation Limited, (2) | | | 391,222 | |
| | |
| | 3,986 | | | Workday Inc., Class A, (2) | | | 442,406 | |
| | | | Total Information Technology | | | 5,439,992 | |
| | |
| | | | Materials – 3.4% | | | |
| | |
| | 10,802 | | | Axalta Coating Systems Limited, (2) | | | 359,166 | |
| | |
| | 2,428 | | | International Flavors & Fragrances Inc. | | | 357,936 | |
| | | | Total Materials | | | 717,102 | |
| | |
| | | | Real Estate – 6.1% | | | |
| | |
| | 1,330 | | | Alexandria Real Estate Equities Inc. | | | 164,867 | |
| | |
| | 2,557 | | | CBRE Group Inc., (2) | | | 100,541 | |
| | |
| | 12,407 | | | Host Hotels & Resorts Inc. | | | 242,681 | |
| | |
| | 3,143 | | | SBA Communications Corporation, (2) | | | 494,017 | |
| | |
| | 7,845 | | | UDR Inc. | | | 304,307 | |
| | | | Total Real Estate | | | 1,306,413 | |
| | |
| | | | Telecommunication Services – 1.5% | | | |
| | |
| | 8,878 | | | Zayo Group Holdings, Inc., (2) | | | 320,141 | |
| | | | Total Long-Term Investments (cost $20,535,422) | | | 21,310,445 | |
| | | | Other Assets Less Liabilities – 0.1% | | | 19,565 | |
| | | | Net Assets – 100% | | $ | 21,330,010 | |
For Fund portfolio compliance purposes, the Fund’s industry classifications refer to any one or more of the industry sub-classifications used by one or more widely recognized market indexes or ratings group indexes, and/or as defined by Fund management. This definition may not apply for purposes of this report, which may combine industry sub-classifications into sectors for reporting ease.
| (1) | All percentages shown in the Portfolio of Investments are based on net assets. |
| (2) | Non-income producing; issuer has not declared a dividend within the past twelve months. |
See accompanying notes to financial statements.
Nushares ESG Mid-Cap Value ETF (NUMV)
| | |
| Portfolio of Investments | | October 31, 2017 |
| | | | | | | | |
| Shares | | | Description (1) | | Value | |
| | |
| | | | LONG-TERM INVESTMENTS – 99.8% | | | | |
| | |
| | | | COMMON STOCKS – 99.8% | | | | |
| | |
| | | | Consumer Discretionary – 15.5% | | | |
| | |
| | 2,886 | | | Autoliv Inc. | | $ | 360,346 | |
| | |
| | 84 | | | AutoNation Inc., (2) | | | 3,982 | |
| | |
| | 8,181 | | | Best Buy Co., Inc. | | | 457,972 | |
| | |
| | 4,347 | | | Darden Restaurants, Inc. | | | 357,628 | |
| | |
| | 11,557 | | | Gap, Inc. | | | 300,366 | |
| | |
| | 6,851 | | | Garmin Limited | | | 387,835 | |
| | |
| | 14,282 | | | Hanesbrands Inc. | | | 321,345 | |
| | |
| | 1,479 | | | Hasbro, Inc. | | | 136,941 | |
| | |
| | 3,327 | | | Liberty Broadband Corporation, Class C Shares, (2) | | | 290,414 | |
| | |
| | 16,304 | | | Mattel, Inc. | | | 230,213 | |
| | |
| | 203 | | | PVH Corporation | | | 25,742 | |
| | |
| | 3,706 | | | Signet Jewelers Limited | | | 243,002 | |
| | |
| | 4,961 | | | Tapestry Inc. | | | 203,153 | |
| | |
| | 50 | | | Tiffany & Co. | | | 4,681 | |
| | |
| | 1,479 | | | Whirlpool Corporation | | | 242,452 | |
| | | | Total Consumer Discretionary | | | 3,566,072 | |
| | |
| | | | Consumer Staples – 3.6% | | | |
| | |
| | 5,877 | | | Bunge Limited | | | 404,220 | |
| | |
| | 4,080 | | | JM Smucker Company | | | 432,684 | |
| | | | Total Consumer Staples | | | 836,904 | |
| | |
| | | | Energy – 3.0% | | | |
| | |
| | 5,352 | | | Helmerich & Payne Inc. | | | 290,667 | |
| | |
| | 7,585 | | | Targa Resources Corporation | | | 314,778 | |
| | |
| | 25,128 | | | Weatherford International PLC, (2) | | | 87,194 | |
| | | | Total Energy | | | 692,639 | |
| | |
| | | | Financials – 26.1% | | | |
| | |
| | 19,772 | | | Ally Financial Inc. | | | 516,642 | |
| | |
| | 4,894 | | | Arch Capital Group Limited, (2) | | | 487,638 | |
| | |
| | 7,563 | | | Arthur J. Gallagher & Co. | | | 478,965 | |
| | |
| | 5,716 | | | Axis Capital Holdings Limited | | | 310,893 | |
| | |
| | 15,349 | | | Citizens Financial Group Inc. | | | 583,415 | |
| | |
| | 6,254 | | | Comerica Incorporated | | | 491,377 | |
| | |
| | 13,278 | | | Fifth Third Bancorp. | | | 383,734 | |
| | |
| | 5,577 | | | Invesco LTD | | | 199,601 | |
| | |
| | 5,899 | | | Lincoln National Corporation | | | 447,026 | |
Nushares ESG Mid-Cap Value ETF (NUMV) (continued)
| | |
| Portfolio of Investments | | October 31, 2017 |
| | | | | | | | |
| Shares | | | Description (1) | | Value | |
| | |
| | | | Financials (continued) | | | |
| | |
| | 28,987 | | | New York Community Bancorp Inc. | | $ | 364,077 | |
| | |
| | 21,642 | | | People’s United Financial, Inc. | | | 403,840 | |
| | |
| | 8,876 | | | Principal Financial Group, Inc. | | | 584,485 | |
| | |
| | 318 | | | Raymond James Financial Inc. | | | 26,960 | |
| | |
| | 8,937 | | | Voya Financial Inc. | | | 358,910 | |
| | |
| | 8,977 | | | XL Group Limited | | | 363,299 | |
| | | | Total Financials | | | 6,000,862 | |
| | |
| | | | Health Care – 5.1% | | | |
| | |
| | 7,105 | | | DENTSPLY SIRONA Inc. | | | 433,902 | |
| | |
| | 6,766 | | | Envision Healthcare Corporation, (2) | | | 288,232 | |
| | |
| | 4,760 | | | Quest Diagnostics Incorporated | | | 446,393 | |
| | | | Total Health Care | | | 1,168,527 | |
| | |
| | | | Industrials – 7.9% | | | |
| | |
| | 1,631 | | | AGCO Corporation | | | 111,838 | |
| | |
| | 8,738 | | | Fastenal Company | | | 410,424 | |
| | |
| | 2,752 | | | L-3 Communications Holdings, Inc. | | | 515,119 | |
| | |
| | 2,565 | | | Manpower Inc. | | | 316,213 | |
| | |
| | 2,263 | | | W.W. Grainger, Inc. | | | 447,395 | |
| | | | Total Industrials | | | 1,800,989 | |
| | |
| | | | Information Technology – 7.3% | | | |
| | |
| | 9,469 | | | Avnet Inc. | | | 376,866 | |
| | |
| | 103 | | | Juniper Networks Inc. | | | 2,557 | |
| | |
| | 6,900 | | | Microchip Technology Incorporated | | | 654,120 | |
| | |
| | 13,193 | | | Western Union Company | | | 262,013 | |
| | |
| | 12,242 | | | Xerox Corporation | | | 371,055 | |
| | | | Total Information Technology | | | 1,666,611 | |
| | |
| | | | Materials – 13.3% | | | |
| | |
| | 3,313 | | | Albemarle Corporation | | | 466,769 | |
| | |
| | 4,367 | | | Avery Dennison Corporation | | | 463,644 | |
| | |
| | 1,087 | | | Ball Corporation | | | 46,665 | |
| | |
| | 5,031 | | | Celanese Corporation, Series A | | | 524,784 | |
| | |
| | 2,925 | | | FMC Corporation | | | 271,616 | |
| | |
| | 2,494 | | | International Flavors & Fragrances Inc. | | | 367,665 | |
| | |
| | 5,934 | | | Mosaic Company | | | 132,566 | |
| | |
| | 6,184 | | | Steel Dynamics Inc. | | | 230,107 | |
| | |
| | 8,994 | | | WestRock Company | | | 551,602 | |
| | | | Total Materials | | | 3,055,418 | |
| | |
| | | | Real Estate – 13.3% | | | |
| | |
| | 13,245 | | | Brixmor Property Group Inc. | | | 231,390 | |
| | | | | | | | |
| Shares | | | Description (1) | | Value | |
| | |
| | | | Real Estate (continued) | | | |
| | |
| | 4,500 | | | Camden Property Trust | | $ | 410,580 | |
| | |
| | 12,205 | | | Duke Realty Corporation | | | 347,598 | |
| | |
| | 1,525 | | | Federal Realty Investment Trust | | | 183,793 | |
| | |
| | 19,670 | | | Host Hotels & Resorts Inc. | | | 384,745 | |
| | |
| | 11,171 | | | Iron Mountain Inc. | | | 446,840 | |
| | |
| | 8,946 | | | Liberty Property Trust | | | 383,604 | |
| | |
| | 70 | | | Macerich Company | | | 3,822 | |
| | |
| | 5,426 | | | Regency Centers Corporation | | | 333,970 | |
| | |
| | 8,521 | | | UDR Inc. | | | 330,530 | |
| | | | Total Real Estate | | | 3,056,872 | |
| | |
| | | | Utilities – 4.7% | | | |
| | |
| | 10,096 | | | CMS Energy Corporation | | | 488,344 | |
| | |
| | 9,301 | | | Eversource Energy | | | 582,615 | |
| | | | Total Utilities | | | 1,070,959 | |
| | | | Total Long Term Investments (cost $22,555,796) | | | 22,915,853 | |
| | | | Other Assets Less Liabilities – 0.2% | | | 35,487 | |
| | | | Net Assets – 100% | | $ | 22,951,340 | |
For Fund portfolio compliance purposes, the Fund’s industry classifications refer to any one or more of the industry sub-classifications used by one or more widely recognized market indexes or ratings group indexes, and/or as defined by Fund management. This definition may not apply for purposes of this report, which may combine industry sub-classifications into sectors for reporting ease.
| (1) | All percentages shown in the Portfolio of Investments are based on net assets. |
| (2) | Non-income producing; issuer has not declared a dividend within the past twelve months. |
See accompanying notes to financial statements.
Nushares ESG Small-Cap ETF (NUSC)
| | |
| Portfolio of Investments | | October 31, 2017 |
| | | | | | | | |
| Shares | | | Description (1) | | Value | |
| | |
| | | | LONG-TERM INVESTMENTS – 99.9% | | | | |
| | |
| | | | COMMON STOCKS – 99.9% | | | | |
| | |
| | | | Consumer Discretionary – 11.2% | | | |
| | |
| | 769 | | | Aaron Rents Inc. | | $ | 28,299 | |
| | |
| | 3,117 | | | American Axle and Manufacturing Holdings Inc. | | | 55,451 | |
| | |
| | 2,705 | | | American Eagle Outfitters, Inc. | | | 35,219 | |
| | |
| | 268 | | | American Public Education Inc., (2) | | | 5,360 | |
| | |
| | 333 | | | Asbury Automotive Group, Inc., (2) | | | 20,446 | |
| | |
| | 270 | | | At Home Group, Inc., (2) | | | 5,535 | |
| | |
| | 512 | | | Big Lots, Inc. | | | 26,271 | |
| | |
| | 303 | | | Bright Horizons Family Solutions Inc., (2) | | | 26,149 | |
| | |
| | 1,161 | | | Brinker International Inc. | | | 35,666 | |
| | |
| | 510 | | | Buckle Inc. | | | 8,390 | |
| | |
| | 424 | | | Burlington Store Inc., (2) | | | 39,809 | |
| | |
| | 130 | | | Cable One, Inc. | | | 92,275 | |
| | |
| | 949 | | | CalAtlantic Group Inc. | | | 46,824 | |
| | |
| | 484 | | | Caleres Inc. | | | 13,228 | |
| | |
| | 1,166 | | | Callaway Golf Company | | | 16,825 | |
| | |
| | 138 | | | Camping World Holdings, Inc. | | | 5,799 | |
| | |
| | 202 | | | Capella Education Company | | | 16,453 | |
| | |
| | 264 | | | Century Communities, Inc., (2) | | | 7,537 | |
| | |
| | 1,986 | | | Cinemark Holdings Inc. | | | 72,171 | |
| | |
| | 1,324 | | | Clear Channel Outdoor Holdings Inc., Class A, (2) | | | 5,031 | |
| | |
| | 551 | | | Columbia Sportswear Company | | | 34,371 | |
| | |
| | 612 | | | Cooper-Standard Holdings Inc., (2) | | | 68,226 | |
| | |
| | 530 | | | Core-Mark Holding Company, Inc. | | | 18,052 | |
| | |
| | 1,737 | | | Crocs, Inc., (2) | | | 17,717 | |
| | |
| | 685 | | | Dave & Buster’s Entertainment Inc., (2) | | | 33,017 | |
| | |
| | 531 | | | Deckers Outdoor Corporation, (2) | | | 36,235 | |
| | |
| | 349 | | | Del Taco Restaurants, Inc., (2) | | | 4,429 | |
| | |
| | 593 | | | DineEquity Inc. | | | 28,233 | |
| | |
| | 1,269 | | | DSW Inc. | | | 24,301 | |
| | |
| | 1,850 | | | Dunkin Brands Group Inc. | | | 109,280 | |
| | |
| | 1,910 | | | Entravision Communications Corporation | | | 9,932 | |
| | |
| | 240 | | | Ethan Allen Interiors Inc. | | | 7,140 | |
| | |
| | 525 | | | Finish Line, Inc. | | | 4,867 | |
| | |
| | 963 | | | Five Below, Incorporated, (2) | | | 53,206 | |
| | |
| | 1,777 | | | Fossil Group Inc., (2) | | | 14,003 | |
| | | | | | | | |
| Shares | | | Description (1) | | Value | |
| | |
| | | | Consumer Discretionary (continued) | | | |
| | |
| | 841 | | | Francescas Holdings Corporation, (2) | | $ | 5,441 | |
| | |
| | 963 | | | GameStop Corporation | | | 17,998 | |
| | |
| | 309 | | | Genesco Inc., (2) | | | 7,571 | |
| | |
| | 1,226 | | | Gentex Corporation | | | 23,797 | |
| | |
| | 192 | | | Gentherm Inc., (2) | | | 6,432 | |
| | |
| | 1,985 | | | GNC Holdings Inc. | | | 13,577 | |
| | |
| | 59 | | | Graham Holdings Company | | | 32,831 | |
| | |
| | 459 | | | Green Brick Partners, Inc., (2) | | | 4,980 | |
| | |
| | 435 | | | Group 1 Automotive Inc. | | | 34,178 | |
| | |
| | 314 | | | Habit Restaurants Inc., Class A Shares, (2) | | | 3,862 | |
| | |
| | 369 | | | Helen of Troy Limited, (2) | | | 34,280 | |
| | |
| | 349 | | | Hibbett Sporting Goods, Inc., (2) | | | 4,467 | |
| | |
| | 148 | | | Hooker Furniture Corporation | | | 7,015 | |
| | |
| | 589 | | | Hosting Site Network, Inc. | | | 22,205 | |
| | |
| | 3,053 | | | Houghton Mifflin Harcourt Company, (2) | | | 30,225 | |
| | |
| | 4,773 | | | Hovnanian Enterprises Inc., (2) | | | 11,551 | |
| | |
| | 1,975 | | | ILG, Inc. | | | 58,598 | |
| | |
| | 2,197 | | | Imax Corporation, (2) | | | 53,277 | |
| | |
| | 126 | | | Intl Speedway Corporation | | | 4,895 | |
| | |
| | 683 | | | Irobot Corporation, (2) | | | 45,891 | |
| | |
| | 590 | | | Jack in the Box Inc. | | | 61,071 | |
| | |
| | 707 | | | John Wiley and Sons Inc., Class A | | | 38,638 | |
| | |
| | 3,034 | | | KB Home | | | 83,223 | |
| | |
| | 807 | | | La Z Boy Inc. | | | 21,749 | |
| | |
| | 487 | | | Lands’ End Inc., (2) | | | 5,308 | |
| | |
| | 812 | | | Laureate Education, Inc., (2) | | | 10,856 | |
| | |
| | 345 | | | LGI Homes Inc., (2) | | | 20,814 | |
| | |
| | 620 | | | Libbey Inc. | | | 4,241 | |
| | |
| | 1,449 | | | Liberty LiLAC Group, Class A Shares, (2) | | | 31,472 | |
| | |
| | 2,042 | | | Liberty LiLAC Group, Class C Shares, (2) | | | 44,924 | |
| | |
| | 810 | | | Lions Gate Entertainment Corporation, Equity, (2) | | | 23,506 | |
| | |
| | 1,402 | | | Lions Gate Entertainment Corporation, Equity, (2) | | | 38,779 | |
| | |
| | 403 | | | Lithia Motors Inc. | | | 45,612 | |
| | |
| | 160 | | | Loral Space & Communications, Inc., (2) | | | 7,544 | |
| | |
| | 390 | | | Marriott Vacations World | | | 51,332 | |
| | |
| | 2,534 | | | Michaels Cos Inc., (2) | | | 49,210 | |
| | |
| | 1,629 | | | Modine Manufacturing Company | | | 34,290 | |
| | |
| | 614 | | | Monro Muffler Brake, Inc. | | | 30,301 | |
| | |
| | 268 | | | Movado Group Inc. | | | 7,424 | |
Nushares ESG Small-Cap ETF (NUSC) (continued)
| | |
| Portfolio of Investments | | October 31, 2017 |
| | | | | | | | |
| Shares | | | Description (1) | | Value | |
| | |
| | | | Consumer Discretionary (continued) | | | |
| | |
| | 457 | | | Murphy USA Inc., (2) | | $ | 33,983 | |
| | |
| | 2,703 | | | National CineMedia, Inc. | | | 18,191 | |
| | |
| | 2,206 | | | New York Times, Class A | | | 42,135 | |
| | |
| | 572 | | | Nutri System Inc. | | | 28,571 | |
| | |
| | 6,052 | | | Office Depot, Inc. | | | 18,761 | |
| | |
| | 753 | | | PICO Holdings, Inc., (2) | | | 14,232 | |
| | |
| | 2,094 | | | Planet Fitness Inc., (2) | | | 55,784 | |
| | |
| | 308 | | | Pool Corporation | | | 37,200 | |
| | |
| | 258 | | | Red Robin Gourmet Burgers, Inc., (2) | | | 17,647 | |
| | |
| | 3,953 | | | Regal Entertainment Group, Class A | | | 64,632 | |
| | |
| | 1,542 | | | Rent-A-Center Inc. | | | 15,327 | |
| | |
| | 2,526 | | | Sally Beauty Holdings Inc., (2) | | | 43,725 | |
| | |
| | 525 | | | Scholastic Corporation | | | 19,394 | |
| | |
| | 1,534 | | | Service Corporation International | | | 54,396 | |
| | |
| | 1,896 | | | ServiceMaster Global Holdings Inc., (2) | | | 89,321 | |
| | |
| | 370 | | | Shake Shack Inc., Class A Shares, (2) | | | 14,045 | |
| | |
| | 355 | | | Shutterfly, Inc., (2) | | | 15,159 | |
| | |
| | 1,365 | | | Six Flags Entertainment Corporation | | | 85,708 | |
| | |
| | 525 | | | Sleep Number Corporation, (2) | | | 17,063 | |
| | |
| | 524 | | | Sothebys Holdings Inc. | | | 27,154 | |
| | |
| | 1,168 | | | Tailored Brands, Inc. | | | 18,046 | |
| | |
| | 2,660 | | | TEGNA, Inc. | | | 23,142 | |
| | |
| | 881 | | | Tempur Sealy International, Inc., (2) | | | 57,591 | |
| | |
| | 1,480 | | | Tenneco Inc. | | | 86,003 | |
| | |
| | 6,336 | | | The Wendy’s Company | | | 96,371 | |
| | |
| | 436 | | | Tile Shop Holdings Inc. | | | 3,728 | |
| | |
| | 1,781 | | | Tribune Media Company | | | 72,896 | |
| | |
| | 172 | | | Unifi Inc., (2) | | | 6,545 | |
| | |
| | 751 | | | Vera Bradley Inc., (2) | | | 5,407 | |
| | |
| | 1,105 | | | Visteon Corporation, (2) | | | 139,274 | |
| | |
| | 684 | | | Wayfair Inc., Class A Shares, (2) | | | 47,812 | |
| | |
| | 919 | | | Williams-Sonoma Inc. | | | 47,420 | |
| | |
| | 1,756 | | | Wolverine World Wide Inc. | | | 47,939 | |
| | |
| | 346 | | | Zumiez, Inc., (2) | | | 6,107 | |
| | | | Total Consumer Discretionary | | | 3,429,821 | |
| | |
| | | | Consumer Staples – 3.7% | | | |
| | |
| | 1,518 | | | Amplify Snack Brands, Inc., (2) | | | 9,700 | |
| | |
| | 218 | | | Andersons, Inc. | | | 8,164 | |
| | |
| | 13,970 | | | Avon Products, Inc. | | | 31,852 | |
| | | | | | | | |
| Shares | | | Description (1) | | Value | |
| | |
| | | | Consumer Staples (continued) | | | |
| | |
| | 483 | | | Casey’s General Stores, Inc. | | $ | 55,337 | |
| | |
| | 5,099 | | | Darling International Inc., (2) | | | 93,057 | |
| | |
| | 3,723 | | | Dean Foods Company | | | 36,299 | |
| | |
| | 879 | | | Edgewell Personal Care Co | | | 57,073 | |
| | |
| | 378 | | | Farmer Brothers Company | | | 12,833 | |
| | |
| | 1,339 | | | Fresh Del Monte Produce Inc. | | | 59,599 | |
| | |
| | 884 | | | Freshpet, Inc., (2) | | | 13,746 | |
| | |
| | 2,290 | | | Hain Celestial Group Inc., (2) | | | 82,486 | |
| | |
| | 1,491 | | | Herbalife, Limited | | | 108,276 | |
| | |
| | 287 | | | Ingles Markets, Inc. | | | 6,687 | |
| | |
| | 2,791 | | | Lamb Weston Holding, Inc. | | | 142,313 | |
| | |
| | 181 | | | Medifast, Inc. | | | 11,294 | |
| | |
| | 260 | | | Natural Health Trends Corporation | | | 5,008 | |
| | |
| | 633 | | | Omega Protein Corporation | | | 13,863 | |
| | |
| | 1,303 | | | Performance Food Group Company, (2) | | | 36,875 | |
| | |
| | 1,628 | | | Pinnacle Foods Inc. | | | 88,596 | |
| | |
| | 284 | | | PriceSmart, Inc. | | | 23,799 | |
| | |
| | 259 | | | Seneca Foods Corporation, (2) | | | 9,324 | |
| | |
| | 944 | | | Smart & Final Stores, Inc., (2) | | | 5,664 | |
| | |
| | 350 | | | SpartanNash Co | | | 8,593 | |
| | |
| | 2,073 | | | Sprouts Farmers Market Inc., (2) | | | 38,330 | |
| | |
| | 423 | | | The Chef’s Warehouse Inc., (2) | | | 8,439 | |
| | |
| | 1,691 | | | Treehouse Foods Inc., (2) | | | 112,249 | |
| | |
| | 897 | | | United Natural Foods Inc., (2) | | | 34,777 | |
| | |
| | 993 | | | US Foods Holding Corporation, (2) | | | 27,089 | |
| | |
| | 199 | | | Weis Markets Inc. | | | 7,727 | |
| | | | Total Consumer Staples | | | 1,149,049 | |
| | |
| | | | Energy – 3.4% | | | |
| | |
| | 2,730 | | | Archrock Inc. | | | 32,760 | |
| | |
| | 5,651 | | | Clean Energy Fuels Corporation, (2) | | | 13,280 | |
| | |
| | 3,297 | | | Delek US Holdings Inc. | | | 85,887 | |
| | |
| | 1,587 | | | Dril Quip Inc., (2) | | | 66,813 | |
| | |
| | 2,857 | | | Enlink Midstream LLC | | | 44,284 | |
| | |
| | 1,388 | | | Exterran Corp., (2) | | | 44,791 | |
| | |
| | 6,731 | | | Fairmount Santrol Holdings Inc., (2) | | | 29,011 | |
| | |
| | 2,901 | | | Forum Energy Technologies Incorporated, (2) | | | 41,774 | |
| | |
| | 2,445 | | | Franks International NV | | | 16,161 | |
| | |
| | 1,718 | | | Green Plains Renewable Energy, Inc. | | | 31,611 | |
| | |
| | 6,045 | | | Helix Energy Solutions Group, (2) | | | 41,227 | |
Nushares ESG Small-Cap ETF (NUSC) (continued)
| | |
| Portfolio of Investments | | October 31, 2017 |
| | | | | | | | |
| Shares | | | Description (1) | | Value | |
| | |
| | | | Energy (continued) | | | |
| | |
| | 1,212 | | | Keane Group Inc., (2) | | $ | 18,713 | |
| | |
| | 926 | | | Matrix Service Company, (2) | | | 13,057 | |
| | |
| | 10,541 | | | McDermott International Inc., (2) | | | 69,781 | |
| | |
| | 468 | | | Natural Gas Services Group, (2) | | | 13,010 | |
| | |
| | 3,697 | | | Newpark Resources Inc., (2) | | | 32,349 | |
| | |
| | 4,033 | | | Oceaneering International Inc. | | | 81,547 | |
| | |
| | 2,215 | | | Oil States International Inc., (2) | | | 51,056 | |
| | |
| | 5,657 | | | Parker Drilling Company, (2) | | | 5,940 | |
| | |
| | 4,907 | | | PBF Energy Inc. | | | 142,156 | |
| | |
| | 1,541 | | | Renewable Energy Group Inc., (2) | | | 18,646 | |
| | |
| | 594 | | | RigNet, Inc., (2) | | | 10,365 | |
| | |
| | 1,996 | | | RPC Inc. | | | 48,523 | |
| | |
| | 2,731 | | | Tellurian Inc., (2) | | | 29,413 | |
| | |
| | 4,949 | | | TETRA Technologies, (2) | | | 14,055 | |
| | |
| | 1,324 | | | US Silica Holdings Inc. | | | 40,395 | |
| | | | Total Energy | | | 1,036,605 | |
| | |
| | | | Financials – 15.8% | | | |
| | |
| | 840 | | | Ameris Bancorp. | | | 40,236 | |
| | |
| | 4,401 | | | Apollo Commercial Real Estate Finance, Inc. | | | 79,526 | |
| | |
| | 2,678 | | | Aspen Insurance Holdings Limited | | | 114,886 | |
| | |
| | 3,081 | | | Associated Banc-Corp. | | | 77,949 | |
| | |
| | 159 | | | BancFirst Corporation | | | 8,689 | |
| | |
| | 918 | | | Bancorp, Inc., (2) | | | 7,720 | |
| | |
| | 1,317 | | | BancorpSouth Inc. | | | 41,617 | |
| | |
| | 456 | | | Bank of Hawaii Corporation | | | 37,214 | |
| | |
| | 1,740 | | | Bank of the Ozarks, Inc. | | | 81,119 | |
| | |
| | 2,181 | | | BankUnited Inc. | | | 76,008 | |
| | |
| | 370 | | | Banner Corporation | | | 21,208 | |
| | |
| | 546 | | | Beneficial Bancorp, Inc. | | | 9,009 | |
| | |
| | 132 | | | Berkshire Hills Bancorp, Inc. | | | 5,056 | |
| | |
| | 347 | | | BOK Financial Corporation | | | 30,005 | |
| | |
| | 3,778 | | | Capstead Mortgage Corporation | | | 33,322 | |
| | |
| | 170 | | | Cathay General Bancorp. | | | 7,106 | |
| | |
| | 1,011 | | | Chemical Financial Corporation | | | 53,270 | |
| | |
| | 5,767 | | | Chimera Investments Corporation | | | 105,536 | |
| | |
| | 87 | | | City Holding Company | | | 6,133 | |
| | |
| | 720 | | | Cohen & Steers Inc. | | | 31,313 | |
| | |
| | 795 | | | Columbia Banking Systems Inc. | | | 34,590 | |
| | |
| | 763 | | | Commerce Bancshares Inc. | | | 44,376 | |
| | | | | | | | |
| Shares | | | Description (1) | | Value | |
| | |
| | | | Financials (continued) | | | |
| | |
| | 637 | | | Community Bank System Inc. | | $ | 35,220 | |
| | |
| | 768 | | | Crawford & Co | | | 7,265 | |
| | |
| | 946 | | | Cullen/Frost Bankers, Inc. | | | 93,181 | |
| | |
| | 491 | | | Customers Bancorp Inc., (2) | | | 13,424 | |
| | |
| | 793 | | | CVB Financial | | | 18,921 | |
| | |
| | 1,172 | | | Donnelley Financial Solutions, Inc., (2) | | | 25,198 | |
| | |
| | 1,427 | | | Employers Holdings, Inc. | | | 68,068 | |
| | |
| | 5,078 | | | F.N.B. Corporation PA | | | 68,502 | |
| | |
| | 851 | | | FactSet Research Systems Inc. | | | 161,579 | |
| | |
| | 424 | | | FCB Financial Holdings, Inc., Class A Shares, (2) | | | 19,801 | |
| | |
| | 172 | | | Federal Agricultural Mortgage Corporation | | | 12,769 | |
| | |
| | 4,867 | | | First American Corporation | | | 264,862 | |
| | |
| | 1,148 | | | First Financial Bancorp. | | | 31,340 | |
| | |
| | 1,051 | | | First Financial Bankshares, Inc. | | | 47,978 | |
| | |
| | 437 | | | First Hawaiian, Inc. | | | 12,778 | |
| | |
| | 395 | | | First Merchants Corporation | | | 16,985 | |
| | |
| | 158 | | | First of Long Island Corporation | | | 4,985 | |
| | |
| | 335 | | | Flagstar Bancorp Inc., (2) | | | 12,519 | |
| | |
| | 2,857 | | | Fulton Financial Corporation | | | 51,997 | |
| | |
| | 21,321 | | | Genworth Financial Inc., Class A, (2) | | | 70,572 | |
| | |
| | 972 | | | Glacier Bancorp, Inc. | | | 36,897 | |
| | |
| | 1,097 | | | Great Western Bancorp Inc. | | | 44,527 | |
| | |
| | 1,313 | | | Green Dot Corporation, Class A Shares, (2) | | | 74,342 | |
| | |
| | 1,942 | | | Hancock Holding Company | | | 94,673 | |
| | |
| | 466 | | | Hanmi Financial Corporation | | | 14,330 | |
| | |
| | 158 | | | Heartland Financial USA, Inc. | | | 7,782 | |
| | |
| | 617 | | | HomeStreet Inc. | | | 17,924 | |
| | |
| | 1,603 | | | Horace Mann Educators Corporation | | | 70,211 | |
| | |
| | 375 | | | Independent Bank Corporation | | | 27,038 | |
| | |
| | 1,140 | | | International Bancshares Corporation | | | 46,284 | |
| | |
| | 653 | | | INTL FCStone Inc., (2) | | | 27,106 | |
| | |
| | 2,709 | | | Invesco Mortgage Capital Inc. | | | 46,649 | |
| | |
| | 819 | | | Investment Technology Group | | | 19,222 | |
| | |
| | 6,359 | | | Investors Bancorp, Inc. | | | 87,436 | |
| | |
| | 637 | | | Kearny Financial Corporation | | | 9,587 | |
| | |
| | 4,600 | | | Ladenburg Thalmann Financial Services Inc., (2) | | | 14,076 | |
| | |
| | 108 | | | Lakeland Financial Corporation | | | 5,214 | |
| | |
| | 1,032 | | | LegacyTexas Financial Group Inc. | | | 41,166 | |
| | |
| | 3,293 | | | Legg Mason, Inc. | | | 125,727 | |
Nushares ESG Small-Cap ETF (NUSC) (continued)
| | |
| Portfolio of Investments | | October 31, 2017 |
| | | | | | | | |
| Shares | | | Description (1) | | Value | |
| | |
| | | | Financials (continued) | | | |
| | |
| | 526 | | | Live Oak Bancshares Inc. | | $ | 12,466 | |
| | |
| | 2,008 | | | LPL Investments Holdings Inc. | | | 99,617 | |
| | |
| | 812 | | | MB Financial, Inc. | | | 37,303 | |
| | |
| | 324 | | | Meta Financial Group, Inc. | | | 28,269 | |
| | |
| | 5,151 | | | MGIC Investment Corporation, (2) | | | 73,659 | |
| | |
| | 842 | | | Morningstar, Inc. | | | 71,747 | |
| | |
| | 172 | | | National Bank Holdings Corporation | | | 5,645 | |
| | |
| | 175 | | | NBT Bancorp, Inc. | | | 6,675 | |
| | |
| | 813 | | | Newstar Financial, Inc. | | | 9,984 | |
| | |
| | 1,467 | | | NMI Holdings Inc., Class A Shares, (2) | | | 21,345 | |
| | |
| | 1,027 | | | OceanFirst Financial Corporation | | | 28,499 | |
| | |
| | 1,520 | | | Old National Bancorp. | | | 27,664 | |
| | |
| | 1,712 | | | On Deck Capital, Inc., (2) | | | 8,440 | |
| | |
| | 223 | | | Opus Bank | | | 5,776 | |
| | |
| | 1,869 | | | Pacwest Bancorp. | | | 90,310 | |
| | |
| | 149 | | | Park National Corporation | | | 16,359 | |
| | |
| | 367 | | | Park Sterling Bank Inc. | | | 4,613 | |
| | |
| | 1,195 | | | Pinnacle Financial Partners, Inc. | | | 79,109 | |
| | |
| | 1,669 | | | PRA Group Inc., (2) | | | 46,565 | |
| | |
| | 2,286 | | | Redwood Trust Inc. | | | 35,913 | |
| | |
| | 215 | | | S&T Bancorp, Inc. | | | 8,791 | |
| | |
| | 134 | | | Sandy Spring Bancorp, Inc. | | | 5,415 | |
| | |
| | 969 | | | ServisFirst Bancshares Inc. | | | 39,739 | |
| | |
| | 393 | | | Simmons First National Corporation | | | 22,676 | |
| | |
| | 223 | | | South State Corporation | | | 20,081 | |
| | |
| | 5,859 | | | Starwood Property Trust Inc. | | | 126,027 | |
| | |
| | 862 | | | Sterling Bancorp. | | | 21,593 | |
| | |
| | 126 | | | SY Bancorp, Inc. | | | 4,757 | |
| | |
| | 1,516 | | | Synovus Financial Corp. | | | 71,025 | |
| | |
| | 984 | | | Texas Capital BancShares, Inc., (2) | | | 84,673 | |
| | |
| | 401 | | | TFS Financial Corporation | | | 6,183 | |
| | |
| | 375 | | | Tristate Capital Holdings Inc., (2) | | | 8,494 | |
| | |
| | 1,456 | | | Trustmark Corporation | | | 47,961 | |
| | |
| | 746 | | | UMB Financial Corporation | | | 54,853 | |
| | |
| | 3,539 | | | Umpqua Holdings Corporation | | | 72,408 | |
| | |
| | 269 | | | Union Bankshares Corporation | | | 9,283 | |
| | |
| | 1,652 | | | United Bankshares, Inc. | | | 59,389 | |
| | |
| | 841 | | | United Community Banks, Inc. | | | 23,060 | |
| | |
| | 1,476 | | | Universal Insurance Holdings Inc. | | | 35,203 | |
| | | | | | | | |
| Shares | | | Description (1) | | Value | |
| | |
| | | | Financials (continued) | | | |
| | |
| | 5,757 | | | Valley National Bancorp. | | $ | 66,206 | |
| | |
| | 1,468 | | | Washington Federal Inc. | | | 51,086 | |
| | |
| | 2,007 | | | Webster Financial Corporation | | | 110,365 | |
| | |
| | 621 | | | WesBanco, Inc. | | | 25,088 | |
| | |
| | 259 | | | Westamerica Bancorp. | | | 15,082 | |
| | |
| | 1,339 | | | Western Alliance Bancorporation, (2) | | | 74,716 | |
| | |
| | 205 | | | White Mountains Insurance Group | | | 182,276 | |
| | |
| | 811 | | | Wintrust Financial Corporation | | | 65,926 | |
| | |
| | 216 | | | WSFS Financial Corporation | | | 10,735 | |
| | | | Total Financials | | | 4,827,072 | |
| | |
| | | | Health Care – 12.0% | | | |
| | |
| | 416 | | | Abaxis, Inc. | | | 20,134 | |
| | |
| | 661 | | | Abiomed, Inc., (2) | | | 127,520 | |
| | |
| | 1,633 | | | Acadia Healthcare Company Inc., (2) | | | 51,211 | |
| | |
| | 1,960 | | | Acadia Pharmaceuticals, Inc., (2) | | | 68,267 | |
| | |
| | 946 | | | Acceleron Pharma Inc., (2) | | | 36,894 | |
| | |
| | 3,427 | | | Accuray, Inc., (2) | | | 16,278 | |
| | |
| | 698 | | | Achaogen Inc., (2) | | | 8,879 | |
| | |
| | 752 | | | Aclaris Therapeutics Inc., (2) | | | 18,958 | |
| | |
| | 1,252 | | | Aduro Biotech, Inc., (2) | | | 9,953 | |
| | |
| | 1,367 | | | Advaxis Inc., (2) | | | 4,648 | |
| | |
| | 412 | | | Aerie Pharmaceuticals Inc., (2) | | | 25,441 | |
| | |
| | 792 | | | Agios Pharmaceutical Inc., (2) | | | 50,902 | |
| | |
| | 2,110 | | | Alder Biopharmaceuticals Inc., (2) | | | 23,738 | |
| | |
| | 3,849 | | | Allscripts Healthcare Solutions Inc., (2) | | | 51,884 | |
| | |
| | 634 | | | Amedisys, Inc., (2) | | | 30,502 | |
| | |
| | 503 | | | American Renal Associates Holdings, Inc. , (2) | | | 6,101 | |
| | |
| | 3,368 | | | Amicus Therapeutics, Inc., (2) | | | 47,960 | |
| | |
| | 969 | | | AMN Healthcare Services Inc., (2) | | | 42,539 | |
| | |
| | 215 | | | AnaptysBio Inc., (2) | | | 14,196 | |
| | |
| | 219 | | | AngioDynamics, Inc., (2) | | | 3,716 | |
| | |
| | 698 | | | Atara Biotherapeutics Inc., (2) | | | 9,912 | |
| | |
| | 635 | | | AthenaHealth Inc., (2) | | | 81,204 | |
| | |
| | 441 | | | AtriCure, Inc., (2) | | | 9,455 | |
| | |
| | 393 | | | AveXis, Incorporated, (2) | | | 41,072 | |
| | |
| | 1,076 | | | Bellicum Pharmaceuticals, Inc., (2) | | | 10,136 | |
| | |
| | 2,755 | | | BioCryst Pharmaceuticals, Inc., (2) | | | 12,398 | |
| | |
| | 744 | | | BioTelemetry Inc., (2) | | | 21,613 | |
| | |
| | 1,558 | | | Bioverativ, Inc., (2) | | | 88,027 | |
Nushares ESG Small-Cap ETF (NUSC) (continued)
| | |
| Portfolio of Investments | | October 31, 2017 |
| | | | | | | | |
| Shares | | | Description (1) | | Value | |
| | |
| | | | Health Care (continued) | | | |
| | |
| | 723 | | | Bluebird Bio Inc., (2) | | $ | 100,569 | |
| | |
| | 3,275 | | | Brookdale Senior Living Inc., (2) | | | 32,848 | |
| | |
| | 1,755 | | | Bruker Biosciences Corporation | | | 55,107 | |
| | |
| | 590 | | | Cambrex Corporation, (2) | | | 25,518 | |
| | |
| | 587 | | | Capital Senior Living Corporation, (2) | | | 7,807 | |
| | |
| | 860 | | | Cardiovascular Systems, Inc., (2) | | | 20,700 | |
| | |
| | 1,732 | | | Catalent, Inc., (2) | | | 73,766 | |
| | |
| | 3,898 | | | Celldex Therapeutics, Inc., (2) | | | 9,511 | |
| | |
| | 4,491 | | | Cerus Corporation, (2) | | | 12,889 | |
| | |
| | 139 | | | Chemed Corporation | | | 31,057 | |
| | |
| | 1,432 | | | Chimerix Inc., (2) | | | 7,045 | |
| | |
| | 482 | | | Civitas Solutions Inc., (2) | | | 8,989 | |
| | |
| | 1,234 | | | Coherus Biosciences Inc., (2) | | | 13,883 | |
| | |
| | 833 | | | Collegium Pharmaceutical Inc., (2) | | | 8,605 | |
| | |
| | 136 | | | Computer Programs and Systems, Inc. | | | 4,100 | |
| | |
| | 93 | | | Corvel Corporation, (2) | | | 5,580 | |
| | |
| | 466 | | | Cross Country Healthcare, Inc., (2) | | | 6,361 | |
| | |
| | 218 | | | CryoLife Inc. | | | 4,240 | |
| | |
| | 2,369 | | | DepoMed, Inc., (2) | | | 11,466 | |
| | |
| | 1,338 | | | Diplomat Pharmacy, Inc., (2) | | | 28,165 | |
| | |
| | 304 | | | Eagle Pharmaceuticals Inc., (2) | | | 16,340 | |
| | |
| | 2,707 | | | Endologix, Inc., (2) | | | 14,347 | |
| | |
| | 332 | | | Ensign Group Inc. | | | 7,663 | |
| | |
| | 460 | | | Esperion Therapeutics Inc., (2) | | | 21,040 | |
| | |
| | 1,577 | | | FibroGen, Inc., (2) | | | 88,075 | |
| | |
| | 633 | | | Flexion Therapeutics Inc., (2) | | | 13,932 | |
| | |
| | 1,403 | | | Genmark Diagnostics Inc., (2) | | | 10,452 | |
| | |
| | 921 | | | Global Blood Therapeutics Inc., (2) | | | 36,656 | |
| | |
| | 1,556 | | | Globus Medical Inc., Class A, (2) | | | 49,590 | |
| | |
| | 790 | | | Greatbatch, Inc., (2) | | | 38,394 | |
| | |
| | 787 | | | Haemonetics Corporation, (2) | | | 37,430 | |
| | |
| | 3,186 | | | Halozyme Therapeutics, Inc., (2) | | | 56,488 | |
| | |
| | 1,291 | | | HealthSouth Corporation | | | 59,567 | |
| | |
| | 111 | | | Heska Corporation, (2) | | | 10,823 | |
| | |
| | 1,537 | | | HMS Holdings Corporation, (2) | | | 29,572 | |
| | |
| | 2,095 | | | Horizon Pharma Inc., (2) | | | 28,408 | |
| | |
| | 1,979 | | | Insmed Incorporated, (2) | | | 53,453 | |
| | |
| | 528 | | | Intellia Therapeutics, Inc., (2) | | | 16,431 | |
| | |
| | 767 | | | Intersect ENT, Inc., (2) | | | 22,742 | |
| | | | | | | | |
| Shares | | | Description (1) | | Value | |
| | |
| | | | Health Care (continued) | | | |
| | |
| | 1,162 | | | Intra-Cellular Therapies Inc., (2) | | $ | 18,116 | |
| | |
| | 1,756 | | | Iovance Biotherapeutics, Inc., (2) | | | 13,653 | |
| | |
| | 200 | | | K2M Group Holdings Inc., (2) | | | 3,938 | |
| | |
| | 1,119 | | | Karyopharm Therapeutics Inc., (2) | | | 11,425 | |
| | |
| | 2,221 | | | Kindred Healthcare Inc. | | | 13,437 | |
| | |
| | 158 | | | LeMaitre Vascular, Inc. | | | 5,058 | |
| | |
| | 307 | | | LHC Group, Inc., (2) | | | 20,511 | |
| | |
| | 930 | | | Lifepoint Health Inc., (2) | | | 44,780 | |
| | |
| | 378 | | | Ligand Pharmaceuticals, Inc., (2) | | | 54,942 | |
| | |
| | 377 | | | Livanova PLC, (2) | | | 27,860 | |
| | |
| | 523 | | | Loxo Oncology Inc., (2) | | | 45,062 | |
| | |
| | 198 | | | Luminex Corporation | | | 4,227 | |
| | |
| | 238 | | | Magellan Health Services, Inc., (2) | | | 20,301 | |
| | |
| | 939 | | | Medicines Company, (2) | | | 26,987 | |
| | |
| | 763 | | | Medidata Solutions, Inc., (2) | | | 57,400 | |
| | |
| | 1,623 | | | Melinta Therapeutics Inc., (2) | | | 3,733 | |
| | |
| | 313 | | | Meridian Bioscience, Inc. | | | 4,679 | |
| | |
| | 961 | | | Merit Medical Systems, Inc., (2) | | | 36,566 | |
| | |
| | 552 | | | Merrimack Pharmaceuticals, Incorporated, (2) | | | 6,480 | |
| | |
| | 2,620 | | | MiMedx Group Inc., (2) | | | 33,222 | |
| | |
| | 1,230 | | | Minerva Neurosciences, Inc., (2) | | | 7,749 | |
| | |
| | 617 | | | MyoKardia Inc., (2) | | | 23,724 | |
| | |
| | 555 | | | Myovant Sciences, (2) | | | 7,620 | |
| | |
| | 699 | | | Natera, Inc., (2) | | | 7,682 | |
| | |
| | 238 | | | National Research Corporation | | | 8,937 | |
| | |
| | 3,077 | | | Nektar Therapeutics, (2) | | | 74,125 | |
| | |
| | 764 | | | NeoGenomics Inc., (2) | | | 6,624 | |
| | |
| | 7,596 | | | Opko Health Inc., (2) | | | 51,121 | |
| | |
| | 1,207 | | | OraSure Technologies, Inc., (2) | | | 23,838 | |
| | |
| | 3,328 | | | Organovo Holdings Inc., (2) | | | 5,292 | |
| | |
| | 478 | | | Owens and Minor Inc. | | | 11,744 | |
| | |
| | 727 | | | Paratek Pharmaceuticals, Inc., (2) | | | 15,558 | |
| | |
| | 567 | | | Penumbra Inc., (2) | | | 57,012 | |
| | |
| | 904 | | | Perkinelmer Inc. | | | 65,377 | |
| | |
| | 389 | | | Pharmerica Corporation, (2) | | | 11,398 | |
| | |
| | 876 | | | Premier Inc., Class A, (2) | | | 28,619 | |
| | |
| | 2,700 | | | Progenics Pharmaceuticals, Inc., (2) | | | 16,713 | |
| | |
| | 771 | | | Prothena Corporation PLC, (2) | | | 44,757 | |
| | |
| | 596 | | | Quidel Corporation, (2) | | | 24,406 | |
Nushares ESG Small-Cap ETF (NUSC) (continued)
| | |
| Portfolio of Investments | | October 31, 2017 |
| | | | | | | | |
| Shares | | | Description (1) | | Value | |
| | |
| | | | Health Care (continued) | | | |
| | |
| | 247 | | | Reata Pharmaceuticals, Inc., (2) | | $ | 7,479 | |
| | |
| | 675 | | | Repligen Corporation, (2) | | | 25,110 | |
| | |
| | 726 | | | Revance Therapeutics Inc., (2) | | | 18,876 | |
| | |
| | 552 | | | Sage Therapeutics, Inc., (2) | | | 34,931 | |
| | |
| | 1,073 | | | Sarepta Therapeutics Inc., (2) | | | 52,910 | |
| | |
| | 2,221 | | | Select Medical Corporation | | | 42,532 | |
| | |
| | 597 | | | Spark Therapeutics, Inc., (2) | | | 48,297 | |
| | |
| | 328 | | | STAAR Surgical Company, (2) | | | 4,346 | |
| | |
| | 592 | | | Steris PLC | | | 55,251 | |
| | |
| | 944 | | | Sucampo Pharmaceuticals, Inc., (2) | | | 9,440 | |
| | |
| | 1,427 | | | Supernus Pharmaceuticals Incorporated, (2) | | | 59,363 | |
| | |
| | 816 | | | Surgery Partners Inc., (2) | | | 7,548 | |
| | |
| | 1,225 | | | Teladoc, Inc., (2) | | | 40,486 | |
| | |
| | 1,403 | | | Teligent, Inc., (2) | | | 7,969 | |
| | |
| | 1,364 | | | Theravance Biopharma Inc., (2) | | | 39,365 | |
| | |
| | 631 | | | Tivity Health Inc., (2) | | | 29,184 | |
| | |
| | 860 | | | Ultragenyx Pharmaceutical Inc., (2) | | | 39,637 | |
| | |
| | 133 | | | US Physical Therapy, Inc. | | | 9,037 | |
| | |
| | 879 | | | Varex Imaging Corporation, (2) | | | 30,211 | |
| | |
| | 883 | | | Versartis Inc., (2) | | | 1,589 | |
| | |
| | 1,008 | | | Vocera Communications Incorporated, (2) | | | 28,446 | |
| | |
| | 1,160 | | | VWR Corporation, (2) | | | 38,396 | |
| | |
| | 721 | | | West Pharmaceutical Services Inc. | | | 73,109 | |
| | |
| | 4,776 | | | ZIOPHARM Oncology, Inc., (2) | | | 22,256 | |
| | | | Total Health Care | | | 3,683,588 | |
| | |
| | | | Industrials – 16.1% | | | |
| | |
| | 1,187 | | | Aaon, Inc. | | | 41,545 | |
| | |
| | 1,009 | | | ABM Industries Inc. | | | 42,348 | |
| | |
| | 1,322 | | | Acco Brands Corporation, (2) | | | 17,252 | |
| | |
| | 1,384 | | | Actuant Corporation | | | 35,292 | |
| | |
| | 1,469 | | | Advanced Drainage Systems, Inc. | | | 28,719 | |
| | |
| | 457 | | | Aegion Corporation, (2) | | | 10,644 | |
| | |
| | 3,187 | | | Allison Transmission Holdings Inc. | | | 135,416 | |
| | |
| | 799 | | | ArcBest Corporation | | | 26,047 | |
| | |
| | 552 | | | Argan, Inc. | | | 37,950 | |
| | |
| | 1,013 | | | Armstrong World Industries Inc., (2) | | | 51,764 | |
| | |
| | 658 | | | Astronics Corporation, (2) | | | 22,635 | |
| | |
| | 2,317 | | | Avis Budget Group Inc., (2) | | | 95,576 | |
| | |
| | 1,254 | | | Axon Enterprise, Inc., (2) | | | 28,804 | |
| | | | | | | | |
| Shares | | | Description (1) | | Value | |
| | |
| | | | Industrials (continued) | | | |
| | |
| | 1,450 | | | Barnes Group Inc. | | $ | 94,381 | |
| | |
| | 1,098 | | | Beacon Roofing Supply Company, (2) | | | 60,840 | |
| | |
| | 662 | | | Brady Corporation | | | 25,189 | |
| | |
| | 572 | | | Briggs & Stratton Corporation | | | 14,414 | |
| | |
| | 3,150 | | | Builders FirstSource, Inc., (2) | | | 56,763 | |
| | |
| | 964 | | | Carlisle Companies Inc. | | | 105,876 | |
| | |
| | 881 | | | Chart Industries, Inc., (2) | | | 38,324 | |
| | |
| | 2,755 | | | Chicago Bridge & Iron Company N.V. | | | 38,405 | |
| | |
| | 904 | | | Clean Harbors, Inc., (2) | | | 48,373 | |
| | |
| | 637 | | | Comfort Systems USA Inc. | | | 28,219 | |
| | |
| | 2,324 | | | Copart Inc., (2) | | | 84,338 | |
| | |
| | 400 | | | Cubic Corporation | | | 21,820 | |
| | |
| | 995 | | | Curtiss Wright Corporation | | | 117,659 | |
| | |
| | 2,303 | | | Donaldson Company, Inc. | | | 108,725 | |
| | |
| | 639 | | | Douglas Dynamics Inc. | | | 26,806 | |
| | |
| | 1,029 | | | Echo Global Logistics, Inc., (2) | | | 24,747 | |
| | |
| | 1,248 | | | Emcor Group Inc. | | | 100,476 | |
| | |
| | 788 | | | EnerSys | | | 54,664 | |
| | |
| | 658 | | | ESCO Technologies Inc. | | | 38,131 | |
| | |
| | 507 | | | Essendant Inc. | | | 4,908 | |
| | |
| | 577 | | | Esterline Technologies Corporation, (2) | | | 54,728 | |
| | |
| | 89 | | | Exponent, Inc. | | | 6,573 | |
| | |
| | 1,269 | | | Franklin Electric Company, Inc. | | | 57,740 | |
| | |
| | 222 | | | GATX Corporation | | | 13,189 | |
| | |
| | 1,269 | | | Generac Holdings Inc., (2) | | | 66,102 | |
| | |
| | 1,894 | | | Genesee & Wyoming Inc., (2) | | | 135,951 | |
| | |
| | 945 | | | Granite Construction Inc. | | | 60,187 | |
| | |
| | 814 | | | Healthcare Services Group, Inc. | | | 43,052 | |
| | |
| | 1,914 | | | Hertz Global Holdings, Inc., (2) | | | 47,601 | |
| | |
| | 1,469 | | | Hexcel Corporation | | | 89,154 | |
| | |
| | 1,363 | | | Hillenbrand Inc. | | | 53,907 | |
| | |
| | 1,072 | | | HNI Corporation | | | 36,684 | |
| | |
| | 1,116 | | | Hub Group, Inc., (2) | | | 48,323 | |
| | |
| | 703 | | | Hubbell Inc. | | | 88,451 | |
| | |
| | 115 | | | Huron Consulting Group, Inc., (2) | | | 4,209 | |
| | |
| | 147 | | | Hyster-Yale Materials Handling Inc. | | | 11,538 | |
| | |
| | 133 | | | ICF International, Inc., (2) | | | 7,142 | |
| | |
| | 463 | | | Insperity Inc. | | | 43,939 | |
| | |
| | 810 | | | Interface, Inc. | | | 18,468 | |
Nushares ESG Small-Cap ETF (NUSC) (continued)
| | |
| Portfolio of Investments | | October 31, 2017 |
| | | | | | | | |
| Shares | | | Description (1) | | Value | |
| | |
| | | | Industrials (continued) | | | |
| | |
| | 1,056 | | | ITT, Inc. | | $ | 49,252 | |
| | |
| | 88 | | | Kaman Corporation | | | 4,923 | |
| | |
| | 1,646 | | | KAR Auction Services Inc. | | | 77,905 | |
| | |
| | 158 | | | Kelly Services, Inc. | | | 4,157 | |
| | |
| | 2,507 | | | Kennametal Inc. | | | 109,431 | |
| | |
| | 1,057 | | | Keyw Holding Corporation, (2) | | | 7,980 | |
| | |
| | 245 | | | KForce Inc. | | | 5,133 | |
| | |
| | 681 | | | Knoll Inc. | | | 14,451 | |
| | |
| | 634 | | | Matthews International Corporation | | | 39,847 | |
| | |
| | 159 | | | McGrath Rentcorp. | | | 7,107 | |
| | |
| | 1,239 | | | Mercury Computer Systems Inc., (2) | | | 62,532 | |
| | |
| | 2,736 | | | Meritor Inc., (2) | | | 71,163 | |
| | |
| | 851 | | | Miller (Herman) Inc. | | | 28,594 | |
| | |
| | 787 | | | Mobile Mini, Inc. | | | 26,050 | |
| | |
| | 282 | | | MYR Group Inc., (2) | | | 8,993 | |
| | |
| | 222 | | | Navigant Consulting Inc., (2) | | | 3,843 | |
| | |
| | 1,753 | | | Navistar International Corporation, (2) | | | 74,169 | |
| | |
| | 859 | | | On Assignment, Inc., (2) | | | 52,588 | |
| | |
| | 1,499 | | | Oshkosh Truck Corporation | | | 137,248 | |
| | |
| | 2,439 | | | Pitney Bowes Inc. | | | 33,512 | |
| | |
| | 8,383 | | | Plug Power Inc., (2) | | | 23,892 | |
| | |
| | 534 | | | Proto Labs Incorporated, (2) | | | 46,592 | |
| | |
| | 3,982 | | | Quanta Services Incorporated, (2) | | | 150,241 | |
| | |
| | 2,734 | | | R.R. Donnelley & Sons Company | | | 25,153 | |
| | |
| | 789 | | | Raven Industries, Inc. | | | 26,550 | |
| | |
| | 923 | | | Regal-Beloit Corporation | | | 74,901 | |
| | |
| | 1,832 | | | Ryder System, Inc. | | | 148,539 | |
| | |
| | 245 | | | SP Plus Corporation, (2) | | | 9,494 | |
| | |
| | 1,779 | | | Spirit AeroSystems Holdings Inc. | | | 142,498 | |
| | |
| | 1,495 | | | Steelcase Inc. | | | 21,752 | |
| | |
| | 554 | | | Team, Inc., (2) | | | 6,814 | |
| | |
| | 725 | | | Teledyne Technologies Inc., (2) | | | 123,221 | |
| | |
| | 433 | | | Tennant Company | | | 30,029 | |
| | |
| | 1,192 | | | Tetra Tech, Inc. | | | 58,706 | |
| | |
| | 727 | | | The Advisory Board Company, (2) | | | 39,203 | |
| | |
| | 1,940 | | | Toro Company | | | 121,929 | |
| | |
| | 993 | | | TriMas Corporation, (2) | | | 26,364 | |
| | |
| | 1,074 | | | TriNet Group Inc., (2) | | | 37,289 | |
| | |
| | 503 | | | TrueBlue Inc., (2) | | | 13,631 | |
| | | | | | | | |
| Shares | | | Description (1) | | Value | |
| | |
| | | | Industrials (continued) | | | |
| | |
| | 481 | | | Valmont Industries, Inc. | | $ | 76,431 | |
| | |
| | 394 | | | Veritiv Corporation, (2) | | | 12,667 | |
| | |
| | 152 | | | Viad Corporation | | | 8,824 | |
| | |
| | 1,253 | | | Wabash National Corporation | | | 28,193 | |
| | |
| | 707 | | | WageWorks, Incorporated, (2) | | | 45,071 | |
| | |
| | 2,484 | | | Welbilt Incorporation, (2) | | | 54,797 | |
| | |
| | 1,714 | | | Wesco Aircraft Holdings Inc., (2) | | | 15,512 | |
| | |
| | 1,095 | | | WESCO International Inc., (2) | | | 69,149 | |
| | |
| | 1,249 | | | Woodward Governor Company | | | 96,585 | |
| | |
| | 1,403 | | | YRC Worldwide Inc., (2) | | | 18,898 | |
| | | | Total Industrials | | | 4,925,791 | |
| | |
| | | | Information Technology – 17.2% | | | |
| | |
| | 1,275 | | | 2U Inc., (2) | | | 81,128 | |
| | |
| | 1,889 | | | ACI Worldwide, Inc., (2) | | | 45,487 | |
| | |
| | 263 | | | Actua Corporation, (2) | | | 4,063 | |
| | |
| | 1,375 | | | ANGI Homeservices, Inc., (2) | | | 17,188 | |
| | |
| | 1,951 | | | Arris International PLC, (2) | | | 55,604 | |
| | |
| | 131 | | | Badger Meter Inc. | | | 5,738 | |
| | |
| | 479 | | | Belden Inc. | | | 38,277 | |
| | |
| | 666 | | | Benchmark Electronics Inc., (2) | | | 20,613 | |
| | |
| | 658 | | | BenefitFocus Inc., (2) | | | 18,029 | |
| | |
| | 1,279 | | | Black Knight, Inc., (2) | | | 58,003 | |
| | |
| | 1,161 | | | Blackbaud, Inc. | | | 117,609 | |
| | |
| | 307 | | | BlackLine, Inc., (2) | | | 10,905 | |
| | |
| | 3,214 | | | Booz Allen Hamilton Holding | | | 121,457 | |
| | |
| | 968 | | | Brightcove Inc., (2) | | | 7,744 | |
| | |
| | 2,618 | | | Brooks Automation Inc. | | | 90,033 | |
| | |
| | 61 | | | Cabot Microelectronics Corporation | | | 5,897 | |
| | |
| | 246 | | | CalAmp Corporation, (2) | | | 5,592 | |
| | |
| | 706 | | | Calix Inc., (2) | | | 3,883 | |
| | |
| | 1,866 | | | Callidus Software, Inc., (2) | | | 47,303 | |
| | |
| | 201 | | | Cass Information Systems, Inc. | | | 12,965 | |
| | |
| | 463 | | | ChannelAdvisor Corporation, (2) | | | 5,209 | |
| | |
| | 1,805 | | | Ciena Corporation, (2) | | | 38,392 | |
| | |
| | 545 | | | Cimpress NV, (2) | | | 59,481 | |
| | |
| | 1,344 | | | Cirrus Logic Inc., (2) | | | 75,264 | |
| | |
| | 1,140 | | | Cognex Corporation | | | 140,391 | |
| | |
| | 358 | | | Coherent Inc., (2) | | | 94,050 | |
| | |
| | 3,277 | | | Conduent, Inc., (2) | | | 50,728 | |
Nushares ESG Small-Cap ETF (NUSC) (continued)
| | |
| Portfolio of Investments | | October 31, 2017 |
| | | | | | | | |
| Shares | | | Description (1) | | Value | |
| | |
| | | | Information Technology (continued) | | | |
| | |
| | 575 | | | Cray, Inc., (2) | | $ | 11,874 | |
| | |
| | 1,474 | | | Cree, Inc., (2) | | | 52,622 | |
| | |
| | 531 | | | CSG Systems International Inc. | | | 22,483 | |
| | |
| | 1,674 | | | Diebold Inc. | | | 32,308 | |
| | |
| | 288 | | | Dolby Laboratories, Inc. | | | 16,687 | |
| | |
| | 4,205 | | | Entegris Inc. | | | 137,714 | |
| | |
| | 87 | | | ePlus, Inc., (2) | | | 8,317 | |
| | |
| | 1,165 | | | Etsy, Inc., (2) | | | 19,456 | |
| | |
| | 149 | | | Exlservice Holdings, Inc., (2) | | | 9,301 | |
| | |
| | 744 | | | Fabrinet, (2) | | | 27,662 | |
| | |
| | 389 | | | Fair Isaac Corporation | | | 56,467 | |
| | |
| | 2,065 | | | Finisar Corporation, (2) | | | 48,610 | |
| | |
| | 1,302 | | | First Solar Inc., (2) | | | 71,376 | |
| | |
| | 1,644 | | | Five9, Inc., (2) | | | 41,478 | |
| | |
| | 480 | | | Gigamon Inc., (2) | | | 18,480 | |
| | |
| | 1,743 | | | GoDaddy, Inc., Class A Shares, (2) | | | 81,398 | |
| | |
| | 2,151 | | | Gogo Inc., (2) | | | 21,381 | |
| | |
| | 3,363 | | | Infinera Corporation, (2) | | | 28,148 | |
| | |
| | 328 | | | Insight Enterprises Inc., (2) | | | 14,776 | |
| | |
| | 727 | | | Interdigital Inc. | | | 53,325 | |
| | |
| | 923 | | | Kemet Corporation, (2) | | | 23,712 | |
| | |
| | 1,869 | | | Keysight Technologies, Inc., (2) | | | 83,488 | |
| | |
| | 1,478 | | | Knowles Corporation, (2) | | | 24,476 | |
| | |
| | 445 | | | Littelfuse Inc. | | | 93,005 | |
| | |
| | 483 | | | Liveperson, Inc., (2) | | | 6,786 | |
| | |
| | 970 | | | LogMeIn Inc. | | | 117,419 | |
| | |
| | 1,082 | | | Lumentum Holdings Inc., (2) | | | 68,328 | |
| | |
| | 1,338 | | | Manhattan Associates Inc., (2) | | | 56,009 | |
| | |
| | 875 | | | Mellanox Technologies, Limited, (2) | | | 40,906 | |
| | |
| | 468 | | | Methode Electronics, Inc. | | | 21,949 | |
| | |
| | 1,166 | | | MINDBODY, Inc., Class A Shares, (2) | | | 37,604 | |
| | |
| | 88 | | | MTS Systems Corporation | | | 4,580 | |
| | |
| | 925 | | | Nanometrics Inc., (2) | | | 26,150 | |
| | |
| | 534 | | | National Instruments Corporation | | | 24,030 | |
| | |
| | 528 | | | Netgear, Inc., (2) | | | 24,631 | |
| | |
| | 1,188 | | | NetScout Systems, Inc., (2) | | | 33,739 | |
| | |
| | 1,146 | | | New Relic, Inc., (2) | | | 58,824 | |
| | |
| | 415 | | | Novanta, Inc., (2) | | | 19,630 | |
| | |
| | 1,033 | | | Nutanix, Inc., (2) | | | 29,441 | |
| | | | | | | | |
| Shares | | | Description (1) | | Value | |
| | |
| | | | Information Technology (continued) | | | |
| | |
| | 113 | | | NVE Corporation | | $ | 9,614 | |
| | |
| | 3,414 | | | Oclaro Inc., (2) | | | 28,234 | |
| | |
| | 8,687 | | | ON Semiconductor Corporation, (2) | | | 185,207 | |
| | |
| | 244 | | | OSI Systems Inc., (2) | | | 21,565 | |
| | |
| | 5,034 | | | Pandora Media, Inc., (2) | | | 36,799 | |
| | |
| | 2,392 | | | Parametric Technology Corporation, (2) | | | 158,948 | |
| | |
| | 808 | | | Paylocity Holding Corporation, (2) | | | 43,155 | |
| | |
| | 235 | | | Plantronics Inc. | | | 10,660 | |
| | |
| | 216 | | | Plexus Corporation, (2) | | | 13,269 | |
| | |
| | 1,005 | | | Power Integrations Inc. | | | 80,752 | |
| | |
| | 1,873 | | | Quotient Technology Inc., (2) | | | 29,312 | |
| | |
| | 879 | | | Qualys Incorporated, (2) | | | 46,499 | |
| | |
| | 2,766 | | | Rambus Inc., (2) | | | 40,688 | |
| | |
| | 567 | | | Rapid7 Inc., (2) | | | 10,251 | |
| | |
| | 1,674 | | | RingCentral Inc., Class A, (2) | | | 70,559 | |
| | |
| | 262 | | | Rogers Corporation, (2) | | | 39,845 | |
| | |
| | 1,324 | | | Sanmina-SCI Corporation, (2) | | | 43,328 | |
| | |
| | 1,193 | | | Science Applications International Corporation | | | 87,495 | |
| | |
| | 1,963 | | | ServiceSource International Inc., (2) | | | 6,831 | |
| | |
| | 1,360 | | | Silicon Laboratories Inc., (2) | | | 129,064 | |
| | |
| | 635 | | | Silver Springs Networks Inc., (2) | | | 10,236 | |
| | |
| | 768 | | | SolarEdge Technologies, Inc., (2) | | | 25,229 | |
| | |
| | 523 | | | Sonus Networks, Inc., (2) | | | 4,079 | |
| | |
| | 3,585 | | | Square Inc., (2) | | | 133,326 | |
| | |
| | 196 | | | Sykes Enterprises Inc., (2) | | | 5,672 | |
| | |
| | 415 | | | SYNNEX Corporation | | | 55,975 | |
| | |
| | 1,159 | | | Tableau Software Inc., Class A, (2) | | | 93,983 | |
| | |
| | 2,089 | | | Take-Two Interactive Software, Inc., (2) | | | 231,148 | |
| | |
| | 352 | | | Tech Data Corporation, (2) | | | 32,655 | |
| | |
| | 417 | | | TeleTech Holdings, Inc. | | | 17,368 | |
| | |
| | 2,135 | | | Teradata Corporation, (2) | | | 71,416 | |
| | |
| | 2,067 | | | TiVo, Inc. | | | 37,516 | |
| | |
| | 2,308 | | | Travelport Worldwide Limited | | | 36,213 | |
| | |
| | 2,043 | | | TTM Technologies, Inc., (2) | | | 32,239 | |
| | |
| | 94 | | | Tucows Inc., (2) | | | 5,494 | |
| | |
| | 1,304 | | | Twilio, Inc., (2) | | | 41,663 | |
| | |
| | 638 | | | Universal Display Corporation | | | 93,467 | |
| | |
| | 480 | | | Vasco Data Security International, Inc., (2) | | | 6,528 | |
| | |
| | 1,062 | | | VeriFone Holdings Inc., (2) | | | 20,263 | |
Nushares ESG Small-Cap ETF (NUSC) (continued)
| | |
| Portfolio of Investments | | October 31, 2017 |
| | | | | | | | |
| Shares | | | Description (1) | | Value | |
| | |
| | | | Information Technology (continued) | | | |
| | |
| | 2,327 | | | Versum Materials, Inc. | | $ | 97,920 | |
| | |
| | 811 | | | Virtusa Corporation, (2) | | | 30,948 | |
| | |
| | 1,649 | | | Vishay Intertechnology Inc. | | | 36,690 | |
| | |
| | 833 | | | WEX, Inc., (2) | | | 102,950 | |
| | |
| | 786 | | | Zebra Technologies Corporation, Class A, (2) | | | 91,168 | |
| | |
| | 2,250 | | | Zendesk Inc., (2) | | | 69,750 | |
| | | | Total Information Technology | | | 5,275,574 | |
| | |
| | | | Materials – 5.9% | | | |
| | |
| | 566 | | | AptarGroup Inc. | | | 49,282 | |
| | |
| | 1,014 | | | Balchem Corporation | | | 85,470 | |
| | |
| | 1,008 | | | Bemis Company, Inc. | | | 45,380 | |
| | |
| | 2,152 | | | Berry Plastics Corporation, (2) | | | 127,936 | |
| | |
| | 753 | | | Boise Cascade Company | | | 26,694 | |
| | |
| | 116 | | | Clearwater Paper Corporation, (2) | | | 5,353 | |
| | |
| | 1,169 | | | Compass Minerals International, Inc. | | | 76,686 | |
| | |
| | 110 | | | Domtar Corporation | | | 5,205 | |
| | |
| | 2,719 | | | Ferro Corporation | | | 64,767 | |
| | |
| | 2,028 | | | Flotek Industries Inc., (2) | | | 9,978 | |
| | |
| | 2,092 | | | GCP Applied Technologies, Inc., (2) | | | 61,191 | |
| | |
| | 704 | | | Glatfelter | | | 14,756 | |
| | |
| | 133 | | | Greif , Inc., Class B Shares | | | 8,359 | |
| | |
| | 943 | | | Greif Inc. | | | 52,365 | |
| | |
| | 1,735 | | | H.B. Fuller Company | | | 98,669 | |
| | |
| | 203 | | | Hawkins Inc. | | | 7,734 | |
| | |
| | 2,244 | | | KapStone Paper and Packaging Corp. | | | 50,400 | |
| | |
| | 1,782 | | | Louisiana-Pacific Corporation, (2) | | | 48,435 | |
| | |
| | 864 | | | Materion Corporation | | | 44,366 | |
| | |
| | 546 | | | Mercer International Inc. | | | 8,026 | |
| | |
| | 1,211 | | | Minerals Technologies Inc. | | | 87,071 | |
| | |
| | 314 | | | Myers Industries, Inc. | | | 6,782 | |
| | |
| | 86 | | | Neenah Paper, Inc. | | | 7,465 | |
| | |
| | 1,853 | | | OMNOVA Solutions Inc., (2) | | | 20,476 | |
| | |
| | 1,972 | | | Reliance Steel & Aluminum Company | | | 151,528 | |
| | |
| | 1,161 | | | Royal Gold, Inc. | | | 97,652 | |
| | |
| | 685 | | | Ryerson Holding Corporation, (2) | | | 6,028 | |
| | |
| | 1,143 | | | Schnitzer Steel Industries, Inc. | | | 33,661 | |
| | |
| | 1,621 | | | Scotts Miracle Gro Company | | | 161,484 | |
| | |
| | 1,189 | | | Sensient Technologies Corporation | | | 90,423 | |
| | |
| | 1,230 | | | Sonoco Products Company | | | 63,702 | |
| | | | | | | | |
| Shares | | | Description (1) | | Value | |
| | |
| | | | Materials (continued) | | | |
| | |
| | 856 | | | Stepan Company | | $ | 68,360 | |
| | |
| | 1,429 | | | Trinseo S.A. | | | 101,459 | |
| | |
| | 127 | | | US Concrete, Inc., (2) | | | 9,931 | |
| | | | Total Materials | | | 1,797,074 | |
| | |
| | | | Real Estate – 9.8% | | | |
| | |
| | 419 | | | Alexander & Baldwin Inc. | | | 18,956 | |
| | |
| | 555 | | | Altisource Portfolio Solutions SA, (2) | | | 14,341 | |
| | |
| | 2,508 | | | American Campus Communities Inc. | | | 104,283 | |
| | |
| | 2,435 | | | Apartment Investment & Management Company, Class A | | | 107,091 | |
| | |
| | 881 | | | Apple Hospitality REIT, Inc. | | | 16,686 | |
| | |
| | 4,176 | | | Brandywine Realty Trust | | | 73,038 | |
| | |
| | 6,777 | | | CBL & Associates Properties Inc. | | | 53,132 | |
| | |
| | 368 | | | Chesapeake Lodging Trust | | | 10,267 | |
| | |
| | 953 | | | Coresite Realty Corporation | | | 105,545 | |
| | |
| | 2,293 | | | Corporate Office Properties | | | 73,215 | |
| | |
| | 2,178 | | | Cousins Properties, Inc. | | | 19,646 | |
| | |
| | 2,153 | | | CyrusOne Inc. | | | 132,173 | |
| | |
| | 1,012 | | | DCT Industrial Trust Inc. | | | 58,716 | |
| | |
| | 3,347 | | | DiamondRock Hospitality Company | | | 36,348 | |
| | |
| | 2,658 | | | Douglas Emmett Inc. | | | 105,762 | |
| | |
| | 266 | | | Easterly Government Properties, Inc. | | | 5,352 | |
| | |
| | 2,063 | | | Education Realty Trust Inc. | | | 71,999 | |
| | |
| | 2,265 | | | Empire State Realty Trust Inc. | | | 45,413 | |
| | |
| | 922 | | | Entertainment Properties Trust | | | 63,784 | |
| | |
| | 2,523 | | | First Industrial Realty Trust, Inc. | | | 77,910 | |
| | |
| | 3,125 | | | Forest City Realty Trust Inc. | | | 76,969 | |
| | |
| | 1,281 | | | Four Corners Property Trust, Inc. | | | 31,615 | |
| | |
| | 3,320 | | | Franklin Street Properties Corporation | | | 33,200 | |
| | |
| | 2,555 | | | Gaming and Leisure Properties Inc. | | | 93,360 | |
| | |
| | 197 | | | Getty Realty Corporation | | | 5,597 | |
| | |
| | 785 | | | Government Properties Income Trust | | | 14,263 | |
| | |
| | 3,412 | | | Gramercy Property Trust | | | 101,336 | |
| | |
| | 698 | | | HFF Inc., Class A Shares, (2) | | | 30,614 | |
| | |
| | 2,528 | | | Hospitality Properties Trust | | | 72,250 | |
| | |
| | 678 | | | Howard Hughes Corporation, (2) | | | 86,533 | |
| | |
| | 766 | | | iStar Inc., (2) | | | 8,962 | |
| | |
| | 3,546 | | | Kennedy-Wilson Holdings Inc. | | | 68,970 | |
| | |
| | 1,215 | | | Kilroy Realty Corporation | | | 86,544 | |
| | |
| | 461 | | | Marcus & Millichap Inc., (2) | | | 13,102 | |
Nushares ESG Small-Cap ETF (NUSC) (continued)
| | |
| Portfolio of Investments | | October 31, 2017 |
| | | | | | | | |
| Shares | | | Description (1) | | Value | |
| | |
| | | | Real Estate (continued) | | | |
| | |
| | 1,137 | | | MGM Growth Properties LLC | | $ | 33,553 | |
| | |
| | 591 | | | Northstar Realty Europe Corporation | | | 7,961 | |
| | |
| | 2,597 | | | Paramount Group Inc. | | | 41,344 | |
| | |
| | 1,454 | | | Park Hotels & Resorts, Inc. | | | 41,861 | |
| | |
| | 1,626 | | | Piedmont Office Realty Trust | | | 31,447 | |
| | |
| | 1,380 | | | Potlatch Corporation | | | 71,484 | |
| | |
| | 1,209 | | | QTS Realty Trust Inc., Class A Shares | | | 69,941 | |
| | |
| | 681 | | | Rayonier Inc. | | | 20,416 | |
| | |
| | 2,427 | | | Realogy Holdings Corporation | | | 78,465 | |
| | |
| | 2,063 | | | Rexford Industrial Realty Inc. | | | 61,250 | |
| | |
| | 4,928 | | | RLJ Lodging Trust | | | 106,740 | |
| | |
| | 3,653 | | | Sabra Health Care Real Estate Investment Trust Inc. | | | 72,768 | |
| | |
| | 521 | | | Saul Centers Inc. | | | 31,844 | |
| | |
| | 2,289 | | | Select Income REIT | | | 55,302 | |
| | |
| | 5,211 | | | Senior Housing Properties Trust | | | 95,882 | |
| | |
| | 855 | | | St Joe Company, (2) | | | 15,219 | |
| | |
| | 1,514 | | | Summit Hotel Properties Inc. | | | 23,936 | |
| | |
| | 3,673 | | | Sunstone Hotel Investors Inc. | | | 59,943 | |
| | |
| | 308 | | | Tejon Ranch Company, (2) | | | 5,806 | |
| | |
| | 267 | | | The RMR Group Inc. | | | 14,004 | |
| | |
| | 1,117 | | | Tier REIT, Inc. | | | 21,860 | |
| | |
| | 3,670 | | | Uniti Group, Inc. | | | 64,225 | |
| | |
| | 930 | | | Washington Real Estate Investment Trust | | | 29,937 | |
| | |
| | 1,634 | | | Xenia Hotels & Resorts Inc. | | | 35,556 | |
| | | | Total Real Estate | | | 3,007,716 | |
| | |
| | | | Telecommunication Services – 0.9% | | | |
| | |
| | 1,012 | | | Boingo Wireless Inc., (2) | | | 23,661 | |
| | |
| | 1,563 | | | Cincinnati Bell Inc., (2) | | | 29,853 | |
| | |
| | 1,452 | | | Cogent Communications Group, Inc. | | | 78,263 | |
| | |
| | 2,504 | | | Consolidated Communications Holdings, Inc. | | | 48,002 | |
| | |
| | 12,300 | | | Globalstar, Inc., (2) | | | 19,803 | |
| | |
| | 371 | | | IDT Corporation | | | 4,890 | |
| | |
| | 2,772 | | | Iridium Communications Inc., (2) | | | 33,264 | |
| | |
| | 590 | | | Orbcomm, Inc., (2) | | | 6,673 | |
| | |
| | 2,987 | | | Vonage Holdings Corporation, (2) | | | 24,284 | |
| | | | Total Telecommunication Services | | | 268,693 | |
| | |
| | | | Utilities – 3.9% | | | |
| | |
| | 1,100 | | | 8point3 Energy Partners LP | | | 16,654 | |
| | |
| | 5,770 | | | Aqua America Inc. | | | 204,720 | |
| | | | | | | | |
| Shares | | | Description (1) | | Value | |
| | |
| | | | Utilities (continued) | | | |
| | |
| | 477 | | | Chesapeake Utilities Corporation | | $ | 38,422 | |
| | |
| | 3,302 | | | New Jersey Resources Corporation | | | 146,774 | |
| | |
| | 1,565 | | | NextEra Energy Partners LP | | | 61,567 | |
| | |
| | 1,761 | | | One Gas Inc. | | | 135,562 | |
| | |
| | 1,579 | | | Ormat Technologies Inc. | | | 102,524 | |
| | |
| | 2,413 | | | Pattern Energy Group Inc. | | | 55,668 | |
| | |
| | 1,189 | | | Southwest Gas Holdings, Inc. | | | 97,962 | |
| | |
| | 1,939 | | | Spire, Inc. | | | 153,084 | |
| | |
| | 1,998 | | | TerraForm Global Inc., Class A Shares | | | 9,740 | |
| | |
| | 2,082 | | | TerraForm Power, Inc., (2) | | | 27,961 | |
| | |
| | 1,577 | | | WGL Holdings Inc. | | | 135,149 | |
| | | | Total Utilities | | | 1,185,787 | |
| | | | Total Long-Term Investments (cost $28,993,128) | | | 30,586,770 | |
| | | | Other Assets Less Liabilities – 0.1% | | | 42,189 | |
| | | | Net Assets – 100% | | $ | 30,628,959 | |
For Fund portfolio compliance purposes, the Fund’s industry classifications refer to any one or more of the industry sub-classifications used by one or more widely recognized market indexes or ratings group indexes, and/or as defined by Fund management. This definition may not apply for purposes of this report, which may combine industry sub-classifications into sectors for reporting ease.
| (1) | All percentages shown in the Portfolio of Investments are based on net assets. |
| (2) | Non-income producing; issuer has not declared a dividend within the past twelve months. |
| REIT | Real Estate Investment Trust. |
See accompanying notes to financial statements.
Statement of
| | | | |
| | Assets and Liabilities | | October 31, 2017 |
| | | | | | | | | | | | | | | | | | | | | | | | | | | | |
| | | NUEM | | | NUDM | | | NULG | | | NULV | | | NUMG | | | NUMV | | | NUSC | |
Assets | | | | | | | | | | | | | | | | | | | | | | | | | | | | |
Long-term investments, at value (cost $23,794,707, $22,825,398, $23,128,599, $26,930,146, $20,535,422, $22,555,796 and $28,993,128, respectively) | | $ | 24,950,810 | | | $ | 23,412,946 | | | $ | 24,298,409 | | | $ | 27,779,067 | | | $ | 21,310,445 | | | $ | 22,915,853 | | | $ | 30,586,770 | |
Cash | | | 12,001 | | | | 20,755 | | | | 37,897 | | | | 22,483 | | | | 42,002 | | | | 13,929 | | | | 40,249 | |
Cash denominated in foreign currencies (cost $3,995, $—,
$—, $—, $—, $—, and $—, respectively) | | | 3,996 | | | | — | | | | — | | | | — | | | | — | | | | — | | | | — | |
Receivable for: | | | | | | | | | | | | | | | | | | | | | | | | | | | | |
Dividends | | | 13,090 | | | | 31,537 | | | | 11,333 | | | | 27,853 | | | | 4,966 | | | | 20,499 | | | | 10,000 | |
Reclaims | | | 387 | | | | 1,758 | | | | 713 | | | | 1 | | | | 10 | | | | — | | | | 20 | |
Shares sold | | | 4,338,321 | | | | 293,758 | | | | 35,776 | | | | 3,737 | | | | — | | | | 5,437 | | | | — | |
Total assets | | | 29,318,605 | | | | 23,760,754 | | | | 24,384,128 | | | | 27,833,141 | | | | 21,357,423 | | | | 22,955,718 | | | | 30,637,039 | |
Liabilities | | | | | | | | | | | | | | | | | | | | | | | | | | | | |
Cash overdraft denominated in foreign currencies (cost $—, $356, $—, $—, $—, $— and $—, respectively) | | | — | | | | 359 | | | | — | | | | — | | | | — | | | | — | | | | — | |
Payable for investments purchased | | | 4,394,930 | | | | — | | | | — | | | | — | | | | 22,753 | | | | — | | | | — | |
Accrued expenses: | | | | | | | | | | | | | | | | | | | | | | | | | | | | |
Management fees | | | 6,568 | | | | 5,079 | | | | 4,327 | | | | 5,408 | | | | 4,638 | | | | 4,352 | | | | 8,025 | |
Professional fees | | | 72 | | | | 72 | | | | — | | | | — | | | | — | | | | — | | | | — | |
Trustees fees | | | 58 | | | | 58 | | | | 19 | | | | 25 | | | | 22 | | | | 26 | | | | 55 | |
Total liabilities | | | 4,401,628 | | | | 5,568 | | | | 4,346 | | | | 5,433 | | | | 27,413 | | | | 4,378 | | | | 8,080 | |
Net assets | | $ | 24,916,977 | | | $ | 23,755,186 | | | $ | 24,379,782 | | | $ | 27,827,708 | | | $ | 21,330,010 | | | $ | 22,951,340 | | | $ | 30,628,959 | |
Shares outstanding | | | 900,000 | | | | 900,000 | | | | 800,000 | | | | 1,000,000 | | | | 750,000 | | | | 850,000 | | | | 1,100,000 | |
Net asset value (“NAV”) per share | | $ | 27.69 | | | $ | 26.39 | | | $ | 30.47 | | | $ | 27.83 | | | $ | 28.44 | | | $ | 27.00 | | | $ | 27.84 | |
Net assets consist of: | | | | | | | | | | | | | | | | | | | | | | | | | | | | |
Capital paid-in | | $ | 23,666,666 | | | $ | 23,075,135 | | | $ | 23,020,149 | | | $ | 26,675,490 | | | $ | 20,364,755 | | | $ | 22,411,960 | | | $ | 28,774,785 | |
Undistributed (Over-distribution of) net investment income | | | 88,285 | | | | 81,396 | | | | 65,029 | | | | 191,262 | | | | 23,741 | | | | 128,674 | | | | 150,056 | |
Accumulated net realized gain (loss) | | | 6,580 | | | | 11,275 | | | | 124,794 | | | | 112,035 | | | | 166,491 | | | | 50,649 | | | | 110,476 | |
Net unrealized appreciation (depreciation) | | | 1,155,446 | | | | 587,380 | | | | 1,169,810 | | | | 848,921 | | | | 775,023 | | | | 360,057 | | | | 1,593,642 | |
Net assets | | $ | 24,916,977 | | | $ | 23,755,186 | | | $ | 24,379,782 | | | $ | 27,827,708 | | | $ | 21,330,010 | | | $ | 22,951,340 | | | $ | 30,628,959 | |
Authorized shares | | | Unlimited | | | | Unlimited | | | | Unlimited | | | | Unlimited | | | | Unlimited | | | | Unlimited | | | | Unlimited | |
Par value per share | | $ | 0.01 | | | $ | 0.01 | | | $ | 0.01 | | | $ | 0.01 | | | $ | 0.01 | | | $ | 0.01 | | | $ | 0.01 | |
See accompanying notes to financial statements.
| | | | | | | | | | | | | | | | | | | | | | | | | | | | |
| | | NUEM* | | | NUDM* | | | NULG** | | | NULV** | | | NUMG** | | | NUMV** | | | NUSC** | |
Investment Income (net of dividend tax withheld of $15,964, $6,939, $1, $—, $418, $—, and $236, respectively) | | $ | 121,221 | | | $ | 94,614 | | | $ | 88,286 | | | $ | 220,472 | | | $ | 48,966 | | | $ | 153,118 | | | $ | 201,662 | |
Expenses | | | | | | | | | | | | | | | | | | | | | | | | | | | | |
Management fees | | | 23,434 | | | | 18,297 | | | | 23,113 | | | | 29,064 | | | | 25,084 | | | | 24,295 | | | | 51,320 | |
Professional fees | | | 72 | | | | 72 | | | | 54 | | | | 54 | | | | 54 | | | | 54 | | | | 105 | |
Trustees fees | | | 97 | | | | 97 | | | | 134 | | | | 134 | | | | 134 | | | | 134 | | | | 267 | |
Total expenses | | | 23,603 | | | | 18,466 | | | | 23,301 | | | | 29,252 | | | | 25,272 | | | | 24,483 | | | | 51,692 | |
Net investment income (loss) | | | 97,618 | | | | 76,148 | | | | 64,985 | | | | 191,220 | | | | 23,694 | | | | 128,635 | | | | 149,970 | |
Realized and Unrealized Gain (Loss) | | | | | | | | | | | | | | | | | | | | | | | | | | | | |
Net realized gain (loss) from: | | | | | | | | | | | | | | | | | | | | | | | | | | | | |
Investments and foreign currency | | | (2,753 | ) | | | 16,523 | | | | 124,838 | | | | 112,077 | | | | 166,411 | | | | 50,688 | | | | 110,562 | |
In-kind redemptions | | | — | | | | — | | | | 137,401 | | | | 7,653 | | | | 66,315 | | | | — | | | | 26,959 | |
Change in net unrealized appreciation (depreciation) of investments and foreign currency | | | 1,155,446 | | | | 587,380 | | | | 1,169,810 | | | | 848,921 | | | | 775,023 | | | | 360,057 | | | | 1,593,642 | |
Net realized and unrealized gain (loss) | | | 1,152,693 | | | | 603,903 | | | | 1,432,049 | | | | 968,651 | | | | 1,007,749 | | | | 410,745 | | | | 1,731,163 | |
Net increase (decrease) in net assets from operations | | $ | 1,250,311 | | | $ | 680,051 | | | $ | 1,497,034 | | | $ | 1,159,871 | | | $ | 1,031,443 | | | $ | 539,380 | | | $ | 1,881,133 | |
| * | For the period June 6, 2017 (commencement of operations) through October 31, 2017. |
| ** | For the period December 13, 2016 (commencement of operations) through October 31, 2017. |
See accompanying notes to financial statements.
| | | | |
Statement of Changes in Net Assets | | |
| | | | | | | | | | | | | | | | | | | | | | | | | | | | |
| | | NUEM* | | | NUDM* | | | NULG** | | | NULV** | | | NUMG** | | | NUMV** | | | NUSC** | |
Operations | | | | | | | | | | | | | | | | | | | | | | | | | | | | |
Net investment income (loss) | | $ | 97,618 | | | $ | 76,148 | | | $ | 64,985 | | | $ | 191,220 | | | $ | 23,694 | | | $ | 128,635 | | | $ | 149,970 | |
Net realized gain (loss) from: | | | | | | | | | | | | | | | | | | | | | | | | | | | | |
Investments and foreign currency | | | (2,753 | ) | | | 16,523 | | | | 124,838 | | | | 112,077 | | | | 166,411 | | | | 50,688 | | | | 110,562 | |
In-kind redemptions | | | — | | | | — | | | | 137,401 | | | | 7,653 | | | | 66,315 | | | | — | | | | 26,959 | |
Change in net unrealized appreciation (depreciation) of investments and foreign currency | | | 1,155,446 | | | | 587,380 | | | | 1,169,810 | | | | 848,921 | | | | 775,023 | | | | 360,057 | | | | 1,593,642 | |
Net increase (decrease) in net assets from operations | | | 1,250,311 | | | | 680,051 | | | | 1,497,034 | | | | 1,159,871 | | | | 1,031,443 | | | | 539,380 | | | | 1,881,133 | |
Fund Share Transactions | | | | | | | | | | | | | | | | | | | | | | | | | | | | |
Proceeds from shares sold | | | 23,666,666 | | | | 23,075,135 | | | | 25,501,848 | | | | 27,911,667 | | | | 21,610,997 | | | | 22,411,960 | | | | 29,992,821 | |
Cost of shares redeemed | | | — | | | | — | | | | (2,619,100 | ) | | | (1,243,830 | ) | | | (1,312,430 | ) | | | — | | | | (1,244,995 | ) |
Net increase (decrease) in net assets from Fund share transactions | | | 23,666,666 | | | | 23,075,135 | | | | 22,882,748 | | | | 26,667,837 | | | | 20,298,567 | | | | 22,411,960 | | | | 28,747,826 | |
Net increase (decrease) in net assets | | | 24,916,977 | | | | 23,755,186 | | | | 24,379,782 | | | | 27,827,708 | | | | 21,330,010 | | | | 22,951,340 | | | | 30,628,959 | |
Net assets at the beginning of period | | | — | | | | — | | | | — | | | | — | | | | — | | | | — | | | | — | |
Net assets at the end of period | | $ | 24,916,977 | | | $ | 23,755,186 | | | $ | 24,379,782 | | | $ | 27,827,708 | | | $ | 21,330,010 | | | $ | 22,951,340 | | | $ | 30,628,959 | |
Undistributed (Over-distribution of) net investment income at the end of period | | $ | 88,285 | | | $ | 81,396 | | | $ | 65,029 | | | $ | 191,262 | | | $ | 23,741 | | | $ | 128,674 | | | $ | 150,056 | |
| * | For the period June 6, 2017 (commencement of operations) through October 31, 2017. |
| ** | For the period December 13, 2016 (commencement of operations) through October 31, 2017. |
See accompanying notes to financial statements.
THIS PAGE INTENTIONALLY LEFT BLANK
Financial
Highlights
Selected data for a share outstanding throughout the period:
| | | | | | | | | | | | | | | | | | | | | | | | |
| | | | |
| | | | | | Investment Operations | | | | | | | |
| | | | | | |
Year Ended
October 31, | | Beginning
NAV | | | Net
Investment
Income
(Loss)(a) | | | Net
Realized/
Unrealized
Gain (Loss) | | | Total | | | Ending
NAV | | | Ending
Market
Price | |
NUEM | | | | | | | | | | | | | | | | | | | | | | | | |
2017(c) | | $ | 24.95 | | | $ | 0.20 | | | $ | 2.54 | | | $ | 2.74 | | | $ | 27.69 | | | $ | 28.05 | |
NUDM | | | | | | | | | | | | | | | | | | | | | | | | |
2017(c) | | | 24.88 | | | | 0.17 | | | | 1.34 | | | | 1.51 | | | | 26.39 | | | | 26.57 | |
NULG | | | | | | | | | | | | | | | | | | | | | | | | |
2017(d) | | | 25.21 | | | | 0.24 | | | | 5.02 | | | | 5.26 | | | | 30.47 | | | | 30.53 | |
NULV | | | | | | | | | | | | | | | | | | | | | | | | |
2017(d) | | | 25.09 | | | | 0.53 | | | | 2.21 | | | | 2.74 | | | | 27.83 | | | | 27.88 | |
NUMG | | | | | | | | | | | | | | | | | | | | | | | | |
2017(d) | | | 25.10 | | | | 0.09 | | | | 3.25 | | | | 3.34 | | | | 28.44 | | | | 28.46 | |
NUMV | | | | | | | | | | | | | | | | | | | | | | | | |
2017(d) | | | 25.04 | | | | 0.48 | | | | 1.48 | | | | 1.96 | | | | 27.00 | | | | 27.01 | |
NUSC | | | | | | | | | | | | | | | | | | | | | | | | |
2017(d) | | | 25.01 | | | | 0.27 | | | | 2.56 | | | | 2.83 | | | | 27.84 | | | | 27.89 | |
| | | | | | | | | | | | | | | | | | | | | | | | | | | | | | | | | | | | | | |
| | | | | | | | | | | | | Ratios/Supplemental Data | |
| | | | | | | |
| | | | Total Return | | | | | | | | | | | | Ratios to Average Net Assets | | | | | | | |
| | | | | | | | | |
| | | | Based on NAV(b) | | | Based
on
Market
Price(b) | | | | | | Ending
Net
Assets
(000) | | | | | | Expenses | | | Net
Investment
Income
(Loss) | | | | | | Portfolio
Turnover
Rate(e) | |
| | | | | | | | | | | | | | | | | | | | | | | | | | | | | | | | | | | | | | |
| | | | | | 11.03 | % | | | 12.42 | % | | | | | | $ | 24,917 | | | | | | | | 0.45 | %* | | | 1.86 | %* | | | | | | | 13 | % |
| | | | | | | | | | | | | | | | | | | | | | | | | | | | | | | | | | | | | | |
| | | | | | 6.07 | | | | 6.78 | | | | | | | | 23,755 | | | | | | | | 0.40 | * | | | 1.65 | * | | | | | | | 9 | |
| | | | | | | | | | | | | | | | | | | | | | | | | | | | | | | | | | | | | | |
| | | | | | 20.88 | | | | 21.10 | | | | | | | | 24,380 | | | | | | | | 0.35 | * | | | 0.98 | * | | | | | | | 30 | |
| | | | | | | | | | | | | | | | | | | | | | | | | | | | | | | | | | | | | | |
| | | | | | 10.90 | | | | 11.11 | | | | | | | | 27,828 | | | | | | | | 0.35 | * | | | 2.30 | * | | | | | | | 33 | |
| | | | | | | | | | | | | | | | | | | | | | | | | | | | | | | | | | | | | | |
| | | | | | 13.30 | | | | 13.38 | | | | | | | | 21,330 | | | | | | | | 0.40 | * | | | 0.38 | * | | | | | | | 53 | |
| | | | | | | | | | | | | | | | | | | | | | | | | | | | | | | | | | | | | | |
| | | | | | 7.82 | | | | 7.86 | | | | | | | | 22,951 | | | | | | | | 0.40 | * | | | 2.12 | * | | | | | | | 46 | |
| | | | | | | | | | | | | | | | | | | | | | | | | | | | | | | | | | | | | | |
| | | | | | 11.34 | | | | 11.54 | | | | | | | | 30,629 | | | | | | | | 0.40 | * | | | 1.17 | * | | | | | | | 36 | |
| (a) | Per share Net Investment Income (Loss) is calculated using the average daily shares method. | |
| (b) | Total Return Based on NAV reflects the change in NAV over the period, including the assumed reinvestment of distributions, if any, at NAV on each ex-dividend payment date during the period. Total Return Based on Market Price reflects the change in the market price per share over the period, including the assumed reinvestment of distributions, if any, at the ending market price per share on each ex-dividend payment date during the period. Total returns are not annualized. | |
| (c) | For the period June 6, 2017 (commencement of operations) through October 31, 2017. | |
| (d) | For the period December 13, 2016 (commencement of operations) through October 31, 2017. | |
| (e) | Portfolio Turnover Rate is calculated based on the lesser of long-term purchases or sales (as disclosed in Note 5 – Investment Transactions) divided by the average long-term market value during the period. Portfolio Turnover Rate excludes securities received or delivered as a result of processing in-kind creations or redemptions of Fund shares (as disclosed in Note 4 – Fund Shares). | |
See accompanying notes to financial statements.
Notes to
Financial Statements
1. General Information and Significant Accounting Policies
General Information
Trust and Fund Information
The Nushares ETF Trust (the “Trust”) is an open-end management investment company registered under the Investment Company Act of 1940, as amended (the “1940 Act”). The Trust is comprised of Nushares ESG Emerging Markets Equity ETF (NUEM), Nushares ESG International Developed Markets Equity ETF (NUDM), Nushares ESG Large-Cap Growth ETF (NULG), Nushares ESG Large-Cap Value ETF (NULV), Nushares ESG Mid-Cap Growth ETF (NUMG), Nushares ESG Mid-Cap Value ETF (NUMV) and Nushares ESG Small-Cap ETF (NUSC) (each a “Fund” and collectively, the “Funds”), as non-diversified funds, among others. The Trust was organized as a Massachusetts business trust on February 20, 2015. Shares of the Funds are listed and traded on the Cboe BZX Exchange, Inc. (formerly, BATS BZX Exchange, Inc.) (the “Exchange”).
The end of the reporting period for the Funds is October 31, 2017, and the period covered by these Notes to Financial Statements for NULG, NULV, NUMG, NUMV, and NUSC is December 13, 2016 (commencement of operations) through October 31, 2017 and for NUEM and NUDM is June 6, 2017 (commencement of operations) through October 31, 2017 (the “current fiscal period”).
Investment Adviser
The Funds’ investment adviser is Nuveen Fund Advisors, LLC (the “Adviser”), a subsidiary of Nuveen, LLC (“Nuveen”). Nuveen is the investment management arm of Teachers Insurance and Annuity Association of America (“TIAA”). The Adviser has overall responsibility for management of the Funds, oversees the management of the Funds’ portfolios, manages the Funds’ business affairs and provides certain clerical, bookkeeping and other administrative services. The Adviser has entered into a sub-advisory agreement with Teachers Advisors, LLC (the “Sub-Adviser”), an affiliate of the Adviser, under which the Sub-Adviser manages the investment portfolios of the Funds.
Investment Objectives
NUEM seeks to track the investment results, before fees and expenses, of the TIAA ESG Emerging Markets Equity Index. NUDM seeks to track the investment results, before fees and expenses, of the TIAA ESG International Developed Markets Equity Index. NULG seeks to track the investments results, before fees and expenses, of the TIAA ESG USA Large-Cap Growth Index. NULV seeks to track the investments results, before fees and expenses, of the TIAA ESG USA Large-Cap Value Index. NUMG seeks to track the investments results, before fees and expenses, of the TIAA ESG USA Mid-Cap Growth Index. NUMV seeks to track the investments results, before fees and expenses, of the TIAA ESG USA Mid-Cap Value Index. NUSC seeks to track the investments results, before fees and expenses, of the TIAA ESG USA Small-Cap Index.
The Funds’ most recent prospectus provides further description of the Funds’ investment objective, principal investment strategies and principal risks.
Significant Accounting Policies
Each Fund is an investment company and follows accounting and reporting guidance under Financial Accounting Standards Board (FASB) Accounting Standards Codification (ASC) Topic 946 “Financial Services – Investment Companies.” The following is a summary of significant accounting policies followed by the Funds in the preparation of their financial statements in accordance with U.S. generally accepted accounting principles (“U.S. GAAP”).
Investment Transactions
Investment transactions are recorded on a trade date basis. Realized gains and losses from investment transactions are determined on the specific identification method, which is the same basis used for federal income tax purposes. Investments purchased on a when-issued/delayed delivery basis may have extended settlement periods. Any investments so purchased are subject to market fluctuation during this period. The Funds have earmarked securities in their portfolios with a current value at least equal to the amount of the when-issued/delayed delivery purchase commitments.
As of the end of the reporting period, the following Fund’s outstanding when-issued/delayed delivery purchase commitments were as follows:
| | | | |
| | | NUEM | |
| Outstanding when-issued/delayed delivery purchase commitments | | $ | 452,928 | |
Investment Income
Dividend income is recorded on the ex-dividend date or, for foreign securities, when information is available.
Professional Fees
Professional fees presented on the Statement of Operations consist of fees and expenses of legal counsel to the Funds’ Board of Trustees (the “Board”).
Dividends and Distributions to Shareholders
Dividends from net investment income, if any, are declared and distributed to shareholders annually. Net realized capital gains from investment transactions, if any, are declared and distributed to shareholders at least annually. Furthermore, capital gains are distributed only to the extent they exceed available capital loss carryforwards.
Distributions to shareholders are recorded on the ex-dividend date. The amount and timing of distributions are determined in accordance with federal income tax regulations, which may differ from U.S. GAAP.
Compensation
The Trust pays no compensation directly to those of its trustees who are affiliated with the Adviser or to its officers, all of whom receive remuneration for their services to the Trust from the Adviser or its affiliates. The Board has adopted a deferred compensation plan for independent trustees that enables trustees to elect to defer receipt of all or a portion of the annual compensation they are entitled to receive from certain Nuveen-advised funds. Under the plan, deferred amounts are treated as though equal dollar amounts had been invested in shares of select Nuveen-advised funds.
Indemnifications
Under the Trust’s organizational documents, its officers and trustees are indemnified against certain liabilities arising out of the performance of their duties to the Trust. In addition, in the normal course of business, the Trust enters into contracts that provide general indemnifications to other parties. The Trust’s maximum exposure under these arrangements is unknown as this would involve future claims that may be made against the Trust that have not yet occurred. However, the Trust has not had prior claims or losses pursuant to these contracts and expects the risk of loss to be remote.
Use of Estimates
The preparation of financial statements in conformity with U.S. GAAP requires management to make estimates and assumptions that affect the reported amounts of assets and liabilities at the date of the financial statements and the reported amounts of increases and decreases in net assets from operations during the reporting period. Actual results may differ from those estimates.
2. Investment Valuation and Fair Value Measurements
The fair valuation input levels as described below are for fair value measurement purposes.
Fair value is defined as the price that would be received upon selling an investment or transferring a liability in an orderly transaction to an independent buyer in the principal or most advantageous market for the investment. A three-tier hierarchy is used to maximize the use of observable market data and minimize the use of unobservable inputs and to establish classification of fair value measurements for disclosure purposes. Observable inputs reflect the assumptions market participants would use in pricing the asset or liability. Observable inputs are based on market data obtained from sources independent of the reporting entity. Unobservable inputs reflect the reporting entity’s own assumptions about the assumptions market participants would use in pricing the asset or liability. Unobservable inputs are based on the best information available in the circumstances. The following is a summary of the three-tiered hierarchy of valuation input levels.
| | |
| Level 1 – | | Inputs are unadjusted and prices are determined using quoted prices in active markets for identical securities. |
| Level 2 – | | Prices are determined using other significant observable inputs (including quoted prices for similar securities, interest rates, prepayment speeds, credit risk, etc.). |
| Level 3 – | | Prices are determined using significant unobservable inputs (including management’s assumptions in determining the fair value of investments). |
Common stocks and other equity-type securities are valued at the last sales price on the securities exchange on which such securities are primarily traded and are generally classified as Level 1. Securities primarily traded on the NASDAQ National Market (“NASDAQ”) are valued at the NASDAQ Official Closing Price and are generally classified as Level 1. However, securities traded on a securities exchange or NASDAQ for which there were no transactions on a given day or securities not listed on a securities exchange or NASDAQ are valued at the quoted bid price and are generally classified as Level 2. Prices of certain American Depositary Receipts (“ADR”) held by the Funds that trade in the United States are valued based on the last traded price, official closing price or the most recent bid price of the underlying non-U.S.-traded stock, adjusted as appropriate for the underlying-to-ADR conversion ratio and foreign exchange rate, and from time-to-time may also be adjusted further to take into account material events that may take place after the close of the local non-U.S. market but before the close of the New York Stock Exchange (“NYSE”), which may represent a transfer from a Level 1 to a Level 2 security.
Investments initially valued in currencies other than the U.S. dollar are converted to the U.S. dollar using exchange rates obtained from independent pricing services (“pricing services”). As a result, the net asset value (“NAV”) of a Fund’s shares may be affected by changes in the value of currencies in relation to the U.S. dollar. The value of securities traded in markets outside the United States or denominated in currencies other than the U.S. dollar may be affected significantly on a day that the NYSE is closed and an investor is not able to purchase, redeem or exchange shares. If significant market events occur between the time of determination of the closing price of a foreign security on an exchange and the time that the Funds’ NAV is determined, or if under the Funds’ procedures, the closing price of a foreign security is not deemed to be reliable, the security would be valued at fair value as determined in accordance with procedures established in good faith by the Board. These securities are generally classified as Level 2 or Level 3 depending on the observability of the significant inputs.
Notes to Financial Statements (continued)
Certain securities may not be able to be priced by the pre-established pricing methods as described above. Such securities may be valued by the Board and/or its appointee at fair value. These securities generally include, but are not limited to, restricted securities (securities which may not be publicly sold without registration under the Securities Act of 1933, as amended) for which a pricing service is unable to provide a market price; securities whose trading has been formally suspended; debt securities that have gone into default and for which there is no current market quotation; a security whose market price is not available from a pre-established pricing source; a security with respect to which an event has occurred that is likely to materially affect the value of the security after the market has closed but before the calculation of the Fund’s NAV (as may be the case in non-U.S. markets on which the security is primarily traded) or make it difficult or impossible to obtain a reliable market quotation; and a security whose price, as provided by the pricing service, is not deemed to reflect the security’s fair value. As a general principle, the fair value of a security would appear to be the amount that the owner might reasonably expect to receive for it in a current sale. A variety of factors may be considered in determining the fair value of such securities, which may include consideration of the following: yields or prices of investments of comparable quality, type of issue, coupon, maturity and rating, market quotes or indications of value from security dealers, evaluations of anticipated cash flows or collateral, general market conditions and other information and analysis, including the obligor’s credit characteristics considered relevant. These securities are generally classified as Level 2 or Level 3 depending on the observability of the significant inputs. Regardless of the method employed to value a particular security, all valuations are subject to review by the Board and/or its appointee.
The inputs or methodologies used for valuing securities are not an indication of the risks associated with investing in those securities. The following is a summary of each Fund’s fair value measurements as of the end of the reporting period:
| | | | | | | | | | | | | | | | |
NUEM | | Level 1 | | | Level 2 | | | Level 3 | | | Total | |
| Long-Term Investments* | | | | | | | | | | | | | | | | |
Common Stocks | | $ | 24,950,748 | | | $ | — | | | $ | — | | | $ | 24,950,748 | |
Common Stock Rights | | | 62 | | | | — | | | | — | | | | 62 | |
| Total | | $ | 24,950,810 | | | $ | — | | | $ | — | | | $ | 24,950,810 | |
| | | | |
| NUDM | | | | | | | | | | | | |
| Long-Term Investments* | | | | | | | | | | | | | | | | |
Common Stocks | | $ | 23,410,344 | | | $ | — | | | $ | — | | | $ | 23,410,344 | |
Common Stock Rights | | | 2,602 | | | | — | | | | — | | | | 2,602 | |
| Total | | $ | 23,412,946 | | | $ | — | | | $ | — | | | $ | 23,412,946 | |
| | | | |
| NULG | | | | | | | | | | | | |
| Long-Term Investments*: | | | | | | | | | | | | | | | | |
Common Stocks | | $ | 24,298,409 | | | $ | — | | | $ | — | | | $ | 24,298,409 | |
| | | | |
| NULV | | | | | | | | | | | | |
| Long-Term Investments*: | | | | | | | | | | | | | | | | |
Common Stocks | | $ | 27,779,067 | | | $ | — | | | $ | — | | | $ | 27,779,067 | |
| | | | |
| NUMG | | | | | | | | | | | | |
| Long-Term Investments*: | | | | | | | | | | | | | | | | |
Common Stocks | | $ | 21,310,445 | | | $ | — | | | $ | — | | | $ | 21,310,445 | |
| | | | |
| NUMV | | | | | | | | | | | | |
| Long-Term Investments*: | | | | | | | | | | | | | | | | |
Common Stocks | | $ | 22,915,853 | | | $ | — | | | $ | — | | | $ | 22,915,853 | |
| | | | |
| NUSC | | | | | | | | | | | | |
| Long-Term Investments*: | | | | | | | | | | | | | | | | |
Common Stocks | | $ | 30,586,770 | | | $ | — | | | $ | — | | | $ | 30,586,770 | |
| * | Refer to the Fund’s Portfolio of Investments for industry classifications. |
The Board is responsible for the valuation process and has appointed the oversight of the daily valuation process to the Adviser’s Valuation Committee. The Valuation Committee, pursuant to the valuation policies and procedures adopted by the Board, is responsible for making fair value determinations, evaluating the effectiveness of the Funds’ pricing policies and reporting to the Board. The Valuation Committee is aided in its efforts by the Adviser’s dedicated Securities Valuation Team, which is responsible for administering the daily valuation process and applying fair value methodologies as approved by the Valuation Committee. When determining the reliability of independent pricing services for investments owned by the Fund, the Valuation Committee, among other things, conducts due diligence reviews of the pricing services and monitors the quality of security prices received through various testing reports conducted by the Securities Valuation Team.
The Valuation Committee will consider pricing methodologies it deems relevant and appropriate when making a fair value determination, based on the facts and circumstances specific to the portfolio instrument. Fair value determinations generally will be derived as follows, using public or private market information:
| | (i) | If available, fair value determinations shall be derived by extrapolating from recent transactions or quoted prices for identical or comparable securities. |
| | (ii) | If such information is not available, an analytical valuation methodology may be used based on other available information including, but not limited to: analyst appraisals, research reports, corporate action information, issuer financial statements and shelf registration statements. Such analytical valuation methodologies may include, but are not limited to: multiple of earnings, discount from market value of a similar freely traded security, discounted cash flow analysis, book value or a multiple thereof, risk premium/yield analysis, yield to maturity and/or fundamental investment analysis. |
The purchase price of a portfolio instrument will be used to fair value the instrument only if no other valuation methodology is available or deemed appropriate, and it is determined that the purchase price fairly reflects the instrument’s current value.
For each portfolio security that has been fair valued pursuant to the policies adopted by the Board, the fair value price is compared against the last available and next available market quotations. The Valuation Committee reviews the results of such testing and fair valuation occurrences are reported to the Board.
3. Portfolio Securities and Investments in Derivatives
Portfolio Securities
Foreign Currency Transactions
To the extent that the Funds invest in securities and/or contracts that are denominated in a currency other than U.S. dollars, the Funds will be subject to currency risk, which is the risk that an increase in the U.S. dollar relative to the foreign currency will reduce returns or portfolio value. Generally, when the U.S. dollar rises in value against a foreign currency, the Funds’ investments denominated in that currency will lose value because its currency is worth fewer U.S. dollars; the opposite effect occurs if the U.S. dollar falls in relative value. Investments and other assets and liabilities denominated in foreign currencies are converted into U.S. dollars on a spot (i.e. cash) basis at the spot rate prevailing in the foreign currency exchange market at the time of valuation. Purchases and sales of investments and income denominated in foreign currencies are translated into U.S. dollars on the respective dates of such transactions.
As of the end of the reporting period, the following Funds’ investments in non-U.S. securities were as follows:
| | | | | | | | |
| NUEM | | Value | | | % of
Net Assets | |
| Country: | | | | | | | | |
China | | $ | 7,206,033 | | | | 28.9 | % |
Korea, Republic of | | | 3,721,832 | | | | 14.9 | |
Taiwan | | | 3,044,724 | | | | 12.2 | |
India | | | 2,129,932 | | | | 8.5 | |
Brazil | | | 1,845,718 | | | | 7.4 | |
South Africa | | | 1,707,664 | | | | 6.9 | |
Mexico | | | 773,949 | | | | 3.1 | |
Malaysia | | | 639,049 | | | | 2.6 | |
Thailand | | | 546,424 | | | | 2.2 | |
Chile | | | 484,785 | | | | 1.9 | |
Other | | | 2,850,700 | | | | 11.5 | |
| Total non-U.S. securities | | $ | 24,950,810 | | | | 100.1 | % |
| | | | | | | | |
| NUDM | | Value | | | % of
Net Assets | |
| Country: | | | | | | | | |
Japan | | $ | 5,679,123 | | | | 23.9 | % |
United Kingdom | | | 4,025,594 | | | | 16.9 | |
France | | | 2,522,361 | | | | 10.6 | |
Germany | | | 2,327,942 | | | | 9.8 | |
Switzerland | | | 1,882,655 | | | | 7.9 | |
Australia | | | 1,560,792 | | | | 6.6 | |
Netherlands | | | 831,478 | | | | 3.5 | |
Spain | | | 827,685 | | | | 3.5 | |
Sweden | | | 707,640 | | | | 3.0 | |
Italy | | | 563,551 | | | | 2.4 | |
Other | | | 2,484,125 | | | | 10.5 | |
| Total non-U.S. securities | | $ | 23,412,946 | | | | 98.6 | % |
Notes to Financial Statements (continued)
The books and records of the Funds are maintained in U.S. dollars. Foreign currencies, assets and liabilities are translated into U.S. dollars at 4:00 p.m. London Time. Investment transactions, income and expenses are translated on the respective dates of such transactions. Net realized foreign currency gains and losses resulting from changes in exchange rates include foreign currency gains and losses between trade date and settlement date of the transactions, foreign currency transactions, and the difference between the amounts of interest and dividends recorded on the books of the Funds and the amounts actually received.
The realized gains and losses resulting from changes in foreign currency exchange rates and changes in foreign exchange rates associated with (i) foreign currency, (ii) investments, (iii) investments in derivatives and (iv) other assets and liabilities are recognized as a component of “Net realized gain (loss) from investments and foreign currency” on the Statement of Operations, when applicable.
The unrealized gains and losses resulting from changes in foreign currency exchange rates and changes in foreign exchange rates associated with (i) investments and (ii) other assets and liabilities are recognized as a component of “Change in net unrealized appreciation (depreciation) of investments and foreign currency” on the Statement of Operations, when applicable. The unrealized gains and losses resulting from changes in foreign exchange rates associated with investments in derivatives are recognized as a component of the respective derivative’s related “Change in net unrealized appreciation (depreciation)” on the Statement of Operations, when applicable.
Investments in Derivatives
Each Fund is authorized to invest in certain derivative instruments. The Funds record derivative instruments at fair value, with changes in fair value recognized on the Statement of Operations, when applicable. Even though the Funds’ investments in derivatives may represent economic hedges, they are not considered to be hedge transactions for financial reporting purposes.
Although each Fund is authorized to invest in derivative instruments, and may do so in the future, they did not make any such investments during the current fiscal period.
Market and Counterparty Credit Risk
In the normal course of business each Fund may invest in financial instruments and enter into financial transactions where risk of potential loss exists due to changes in the market (market risk) or failure of the other party to the transaction to perform (counterparty credit risk). The potential loss could exceed the value of the financial assets recorded on the financial statements. Financial assets, which potentially expose each Fund to counterparty credit risk, consist principally of cash due from counterparties on forward, option and swap transactions, when applicable. The extent of each Fund’s exposure to counterparty credit risk in respect to these financial assets approximates their carrying value as recorded on the Statement of Assets and Liabilities.
Each Fund helps manage counterparty credit risk by entering into agreements only with counterparties the Adviser believes have the financial resources to honor their obligations and by having the Adviser monitor the financial stability of the counterparties. Additionally, counterparties may be required to pledge collateral daily (based on the daily valuation of the financial asset) on behalf of each Fund with a value approximately equal to the amount of any unrealized gain above a pre-determined threshold. Reciprocally, when each Fund has an unrealized loss, the Funds have instructed the custodian to pledge assets of the Funds as collateral with a value approximately equal to the amount of the unrealized loss above a pre-determined threshold. Collateral pledges are monitored and subsequently adjusted if and when the valuations fluctuate, either up or down, by at least the pre-determined threshold amount.
4. Fund Shares
Each Fund issues and redeems its shares on a continuous basis at NAV only in aggregations of a specified number of shares or multiples thereof (“Creation Units”). Only certain institutional investors (referred to as “Authorized Participants”) who have entered into agreements with Nuveen Securities, LLC, the Funds’ distributor, may purchase and redeem Creation Units. Once created, shares of the Funds trade on the Exchange at market prices and are only available to individual investors through their brokers.
Creation Units are purchased and redeemed in-kind for a designated portfolio of securities included in each Fund’s respective Index and/or a specified amount of cash. Authorized Participants are charged fixed transaction fees in connection with purchasing and redeeming Creation Units. Authorized Participants transacting in Creation Units for cash may also pay an additional variable charge to compensate the relevant Fund for certain transaction costs (i.e., taxes on currency or other financial transactions, and brokerage costs) and market impact expenses it incurs in purchasing or selling portfolio securities. Such variable charges, if any, are included in “Proceeds from shares sold” on the Statements of Changes in Net Assets.
Transactions in Fund shares during the current fiscal period were as follows:
| | | | | | | | | | | | | | | | | | | | | | | | | | | | | | | | |
| | | NUEM | | | NUDM | | | NULG | | | NULV | |
| | | For the period 6/6/17
(commencement of operations)
through 10/31/17 | | | For the period 6/6/17
(commencement of operations)
through 10/31/17 | | | For the period 12/13/16
(commencement of operations)
through 10/31/17 | | | For the period 12/13/16
(commencement of operations)
through 10/31/17 | |
| | | Shares | | | Amount | | | Shares | | | Amount | | | Shares | | | Amount | | | Shares | | | Amount | |
| Shares sold | | | 900,000 | | | $ | 23,666,666 | | | | 900,000 | | | $ | 23,075,135 | | | | 900,000 | | | $ | 25,501,848 | | | | 1,050,000 | | | $ | 27,911,667 | |
| Shares redeemed | | | — | | | | — | | | | — | | | | — | | | | (100,000 | ) | | | (2,619,100 | ) | | | (50,000 | ) | | | (1,243,830 | ) |
| Net increase | | | 900,000 | | | $ | 23,666,666 | | | | 900,000 | | | $ | 23,075,135 | | | | 800,000 | | | $ | 22,882,748 | | | | 1,000,000 | | | $ | 26,667,837 | |
| | | | | | NUMG | | | NUMV | | | NUSC | |
| | | | | | For the period 12/13/16
(commencement of operations)
through 10/31/17 | | | For the period 12/13/16
(commencement of operations)
through 10/31/17 | | | For the period 12/13/16
(commencement of operations)
through 10/31/17 | |
| | | | | | | | | Shares | | | Amount | | | Shares | | | Amount | | | Shares | | | Amount | |
| Shares sold | | | | | | | | | | | 800,000 | | | $ | 21,610,997 | | | | 850,000 | | | $ | 22,411,960 | | | | 1,150,000 | | | $ | 29,992,821 | |
| Shares redeemed | | | | | | | | | | | (50,000 | ) | | | (1,312,430 | ) | | | — | | | | — | | | | (50,000 | ) | | | (1,244,995 | ) |
| Net increase | | | | | | | | | | | 750,000 | | | $ | 20,298,567 | | | | 850,000 | | | $ | 22,411,960 | | | | 1,100,000 | | | $ | 28,747,826 | |
5. Investment Transactions
Long-term purchases and sales (excluding in-kind transactions) during the current fiscal period were as follows:
| | | | | | | | | | | | | | | | | | | | | | | | | | | | |
| | | NUEM | | | NUDM | | | NULG | | | NULV | | | NUMG | | | NUMV | | | NUSC | |
| Purchases | | $ | 19,925,396 | | | $ | 1,822,321 | | | $ | 2,591,219 | | | $ | 3,714,787 | | | $ | 4,167,493 | | | $ | 3,784,797 | | | $ | 5,818,530 | |
| Sales | | | 1,886,423 | | | | 1,134,922 | | | | 2,519,967 | | | | 3,520,622 | | | | 4,136,922 | | | | 3,571,538 | | | | 5,647,040 | |
In-kind transactions during the current fiscal period were as follows:
| | | | | | | | | | | | | | | | | | | | | | | | | | | | |
| | | NUEM | | | NUDM | | | NULG | | | NULV | | | NUMG | | | NUMV | | | NUSC | |
| In-kind purchases | | $ | 5,749,153 | | | $ | 22,122,234 | | | $ | 25,410,642 | | | $ | 27,857,907 | | | $ | 21,580,893 | | | $ | 22,292,647 | | | $ | 29,938,658 | |
| In-kind sales | | | — | | | | — | | | | 2,615,457 | | | | 1,241,584 | | | | 1,308,721 | | | | — | | | | 1,244,983 | |
6. Income Tax Information
Each Fund is a separate taxpayer for federal income tax purposes. Each Fund intends to distribute substantially all of its net investment income and net capital gains to shareholders and to otherwise comply with the requirements of Subchapter M of the Internal Revenue Code applicable to regulated investment companies. Therefore, no federal income tax provision is required.
For all open tax years and all major taxing jurisdictions, management of the Funds has concluded that there are no significant uncertain tax positions that would require recognition in the financial statements. Open tax years are those that are open for examination by taxing authorities (i.e., generally the last four tax year ends and the interim tax period since then). Furthermore, management of the Funds is also not aware of any tax positions for which it is reasonably possible that the total amounts of unrecognized tax benefits will significantly change in the next twelve months.
The following information is presented on an income tax basis. Differences between amounts for financial statement and federal income tax purposes are primarily due to timing differences in recognizing certain gains and losses on investment transactions. To the extent that differences arise that are permanent in nature, such amounts are reclassified within the capital accounts as detailed below. Temporary differences do not require reclassification. Temporary and permanent differences do not impact the NAVs of the Funds.
The table below presents the cost and unrealized appreciation (depreciation) of each Fund’s investment portfolio, as determined on a federal income
tax basis, as of October 31, 2017.
| | | | | | | | | | | | | | | | | | | | | | | | | | | | |
| | | NUEM | | | NUDM | | | NULG | | | NULV | | | NUMG | | | NUMV | | | NUSC | |
| Tax cost of investments | | $ | 23,820,001 | | | $ | 22,842,617 | | | $ | 23,129,431 | | | $ | 26,931,439 | | | $ | 20,536,331 | | | $ | 22,559,000 | | | $ | 29,002,621 | |
| Gross unrealized: | | | | | | | | | | | | | | | | | | | | | | | | | | | | |
Appreciation | | $ | 1,520,661 | | | $ | 840,050 | | | $ | 1,461,377 | | | $ | 1,326,465 | | | $ | 1,197,530 | | | $ | 730,469 | | | $ | 2,507,193 | |
Depreciation | | | (389,852 | ) | | | (269,721 | ) | | | (292,399 | ) | | | (478,837 | ) | | | (423,416 | ) | | | (373,616 | ) | | | (923,044 | ) |
| Net unrealized appreciation (depreciation) of investments | | $ | 1,130,809 | | | $ | 570,329 | | | $ | 1,168,978 | | | $ | 847,628 | | | $ | 774,114 | | | $ | 356,853 | | | $ | 1,584,149 | |
Permanent differences, primarily due to foreign currency transactions, redemption in-kind, capital gain tax expense, dividend reclassification and investments in passive foreign investment companies, resulted in reclassifications among the Funds’ components of net assets as of October 31, 2017, the Funds’ tax year end, as follows:
| | | | | | | | | | | | | | | | | | | | | | | | | | | | |
| | | NUEM | | | NUDM | | | NULG | | | NULV | | | NUMG | | | NUMV | | | NUSC | |
| Capital paid-in | | $ | — | | | $ | — | | | $ | 137,401 | | | $ | 7,653 | | | $ | 66,188 | | | $ | — | | | $ | 26,959 | |
| Undistributed (Over-distribution of) net investment income | | | (9,333 | ) | | | 5,248 | | | | 44 | | | | 42 | | | | 47 | | | | 39 | | | | 86 | |
| Accumulated net realized gain (loss) | | | 9,333 | | | | (5,248 | ) | | | (137,445 | ) | | | (7,695 | ) | | | (66,235 | ) | | | (39 | ) | | | (27,045 | ) |
Notes to Financial Statements (continued)
The tax components of undistributed net ordinary income and net long-term capital gains as of October 31, 2017, the Funds’ tax year end, were as follows:
| | | | | | | | | | | | | | | | | | | | | | | | | | | | |
| | | NUEM | | | NUDM | | | NULG | | | NULV | | | NUMG | | | NUMV | | | NUSC | |
| Undistributed net ordinary income1 | | $ | 120,159 | | | $ | 109,890 | | | $ | 190,655 | | | $ | 304,587 | | | $ | 191,141 | | | $ | 181,768 | | | $ | 268,908 | |
| Undistributed net long-term capital gains | | | — | | | | — | | | | — | | | | 3 | | | | — | | | | 759 | | | | 1,117 | |
| 1 | Net ordinary income consists of net taxable income derived from dividends, interest, and net short-term capital gains, if any. |
The tax character of distributions paid during the Funds’ tax year ended October 31, 2017, was designated for purposes of the dividends paid deduction as follows:
| | | | | | | | |
| For the period June 6, 2017 (commencement of operations) through October 31, 2017 | | NUEM | | | NUDM | |
| Distributions from net ordinary income1 | | $ | — | | | $ | — | |
| Distributions from net long-term capital gains | | | — | | | | — | |
| | | | | | | | | | | | | | | | | | | | |
| For the period December 13, 2016 (commencement of operations) through October 31, 2017 | | NULG | | | NULV | | | NUMG | | | NUMV | | | NUSC | |
| Distributions from net ordinary income1 | | $ | — | | | $ | — | | | $ | — | | | $ | — | | | $ | — | |
| Distributions from net long-term capital gains | | | — | | | | — | | | | — | | | | — | | | | — | |
| 1 | Net ordinary income consists of net taxable income derived from dividends, interest, and net short-term capital gains, if any. |
7. Management Fees and Other Transactions with Affiliates
Management Fees
Each Fund’s management fee compensates the Adviser for its investment advisory services to the Funds. The Sub-Adviser is compensated for its services to the Funds from the management fees paid to the Adviser. The Adviser is responsible for substantially all other expenses of the Funds, except any future distribution and/or service fees, interest expenses, taxes, acquired fund fees and expenses, fees incurred in acquiring and disposing of portfolio securities, fees and expenses of the independent trustees (including any trustees’ counsel fees), certain compensation expenses of the Funds’ chief compliance officer, litigation expenses and extraordinary expenses.
The annual management fee, payable monthly, for each Fund is based on a percentage of average daily net assets according to the following rates:
| | | | |
| Fund | | Management Fee | |
| NUEM | | | 0.45 | % |
| NUDM | | | 0.40 | |
| NULG | | | 0.35 | |
| NULV | | | 0.35 | |
| NUMG | | | 0.40 | |
| NUMV | | | 0.40 | |
| NUSC | | | 0.40 | |
Other Transactions with Affiliates
Each Fund is permitted to purchase or sell securities from or to certain other funds or other accounts managed by the Sub-Adviser (“inter-fund trade”) under specified conditions outlined in procedures adopted by the Board. These procedures have been designed to ensure that any inter-fund trade of securities by the Fund from or to another fund or an account that is, or could be, considered an affiliate of the Fund under certain limited circumstances by virtue of having a common investment adviser (or affiliated investment adviser), common officer and/or common trustee complies with Rule 17a-7 under the 1940 Act. Each inter-fund trade is effected at the current market price, determined in accordance with the procedures. Unsettled inter-fund trades as of the end of the reporting period are recognized as a component of “Receivable for investments sold” and/or “Payable for investments purchased” on the Statement of Assets and Liabilities, when applicable.
During the current fiscal period, the following Funds engaged in inter-fund trades pursuant to these procedures as follows:
| | | | | | | | | | | | | | |
| Inter-Fund Trades | | NULG | | | NULV | | NUMG | | | NUMV | | NUSC |
| Purchases | | $ | 415,098 | | | $791,321 | | $ | 543,382 | | | $491,278 | | $132,709 |
| Sales | | | 621,360 | | | 980,826 | | | 911,858 | | | 478,004 | | 420,070 |
As of the end of the reporting period, TIAA owned shares of the Funds as follows:
| | | | | | | | | | | | | | | | | | | | | | |
| Fund | | NUEM | | | NUDM | | | NULG | | | NULV | | NUMG | | | NUMV | | NUSC |
TIAA owned shares | | | 759,000 | | | | 843,000 | | | | 692,700 | | | 649,200 | | | 734,600 | | | 735,600 | | 749,300 |
Additional
Fund Information (Unaudited)
| | | | | | | | | | |
| | | | | |
| | Adviser Nuveen Fund Advisors, LLC 333 West Wacker Drive Chicago, IL 60606 Sub-Adviser Teachers Advisors, LLC 730 Third Avenue New York, NY 10017-3206 | | Independent Registered
Public Accounting Firm KPMG LLP 200 East Randolph Drive Chicago, IL 60601 Administrator, Custodian and
Transfer Agent Brown Brothers Harriman 50 Post Office Square Boston, MA 02110 | | Legal Counsel Chapman and Cutler LLP Chicago, IL 60603 Morgan, Lewis & Bockius LLP 1111 Pennsylvania Avenue, NW Washington, D.C. 20004 | | | | |
| | | | | | | | | | | | | | |
| | | | | |
| | | | | | | | | | |
| | The tables below show the number and percentage of days during the current fiscal period that each Fund’s market price was greater than its NAV per share (i.e., at a premium) and less than its NAV per share (i.e., at a discount). The market price is determined using the midpoint between the highest bid and the lowest offer on the applicable Fund’s listing exchange, as of the time that the Fund’s NAV is calculated (normally 4:00 p.m. Eastern Time). | | |
| | | | |
| | | | | NUEM | | NUDM | | |
| | | June 6, 2017 (commencement of operations) through October 31, 2017 | | Number of Days | | % of Total Days | | Number of Days | | % of Total Days | | |
| | Premium/Discount Range: | | | | | | | | | | |
| | Greater than 3.00% | | — | | 0.0% | | — | | 0.0% | | |
| | 1.01% to 3.00% | | 39 | | 37.4% | | 2 | | 1.9% | | |
| | 0.51% to 1.00% | | 53 | | 51.0% | | 61 | | 58.7% | | |
| | 0.26% to 0.50% | | 6 | | 5.8% | | 31 | | 29.8% | | |
| | 0.00% to 0.25% | | 3 | | 2.9% | | 8 | | 7.7% | | |
| | (0.01)% to (0.25)% | | 2 | | 1.9% | | — | | 0.0% | | |
| | (0.26)% to (0.50)% | | — | | 0.0% | | 2 | | 1.9% | | |
| | Less than (0.50)% | | 1 | | 1.0% | | — | | 0.0% | | |
| | | | |
| | | | 104 | | 100% | | 104 | | 100% | | |
| | | | |
| | | | | NULG | | NULV | | |
| | | December 13, 2016 (commencement of operations) through October 31, 2017 | | Number of Days | | % Total Days | | Number of Days | | % Total Days | | |
| | Premium/Discount Range: | | | | | | | | | | |
| | Greater than 3.00% | | — | | 0.0% | | — | | 0.0% | | |
| | 1.01% to 3.00% | | 1 | | 0.5% | | — | | 0.0% | | |
| | 0.51% to 1.00% | | 1 | | 0.5% | | — | | 0.0% | | |
| | 0.26% to 0.50% | | 2 | | 0.9% | | 1 | | 0.5% | | |
| | 0.00% to 0.25% | | 129 | | 58.0% | | 122 | | 54.9% | | |
| | (0.01)% to (0.25)% | | 89 | | 40.1% | | 99 | | 44.6% | | |
| | (0.26)% to (0.50)% | | — | | 0.0% | | — | | 0.0% | | |
| | Less than (0.50)% | | — | | 0.0% | | — | | 0.0% | | |
| | | | |
| | | | | | 222 | | 100% | | 222 | | 100% | | |
| | | | |
| | | | | NUMG | | NUMV | | |
| | | December 13, 2016 (commencement of operations) through October 31, 2017 | | Number of Days | | % Total Days | | Number of Days | | % Total Days | | |
| | Premium/Discount Range: | | | | | | | | | | |
| | Greater than 3.00% | | — | | 0.0% | | 1 | | 0.5% | | |
| | 1.01% to 3.00% | | 2 | | 0.9% | | — | | 0.0% | | |
| | 0.51% to 1.00% | | 2 | | 0.9% | | — | | 0.0% | | |
| | 0.26% to 0.50% | | — | | 0.0% | | 2 | | 0.9% | | |
| | 0.00% to 0.25% | | 114 | | 51.4% | | 114 | | 51.3% | | |
| | (0.01)% to (0.25)% | | 104 | | 46.8% | | 105 | | 47.3% | | |
| | (0.26)% to (0.50)% | | — | | 0.0% | | — | | 0.0% | | |
| | Less than (0.50)% | | — | | 0.0% | | — | | 0.0% | | |
| | | | |
| | | | | | 222 | | 100% | | 222 | | 100% | | |
Additional
Fund Information (Unaudited) (continued)
| | | | | | | | | | | | | | |
| | | | | | | | | | | NUSC | | |
| | | December 13, 2016 (commencement of operations) through October 31, 2017 | | | | | | Number of Days | | % Total Days | | |
| | Premium/Discount Range: | | | | | | | | | | |
| | Greater than 3.00% | | | | | | — | | 0.0% | | |
| | 1.01% to 3.00% | | | | | | 1 | | 0.5% | | |
| | 0.51% to 1.00% | | | | | | 1 | | 0.5% | | |
| | 0.26% to 0.50% | | | | | | 8 | | 3.6% | | |
| | 0.00% to 0.25% | | | | | | 149 | | 67.0% | | |
| | (0.01)% to (0.25)% | | | | | | 62 | | 27.9% | | |
| | (0.26)% to (0.50)% | | | | | | — | | 0.0% | | |
| | Less than (0.50)% | | | | | | 1 | | 0.5% | | |
| | | | |
| | | | | | | | | | 222 | | 100% | | |
| | | | | | | | | | | | | | |
| | | |
| | | | | | |
| | |
| | Quarterly Form N-Q Portfolio of Investments Information: Each Fund is required to file its complete schedule of portfolio holdings with the Securities and Exchange Commission (SEC) for the first and third quarters of each fiscal year on Form N-Q. You may obtain this information directly from the SEC. Visit the SEC on-line at http://www.sec.gov or in person at the SEC’s Public Reference Room in Washington, D.C. Call the SEC toll-free at (800) SEC-0330 for room hours and operation. | | |
| | | | | |
| | | | | | | | | | |
| | |
| | Nuveen Funds’ Proxy Voting Information: You may obtain (i) information regarding how each fund voted proxies relating to portfolio securities held during the most recent twelve-month period ended June 30, without charge, upon request, by calling Nuveen toll-free at (800) 257-8787 or on Nuveen’s website at www.nuveen.com and (ii) a description of the policies and procedures that each fund used to determine how to vote proxies relating to portfolio securities without charge, upon request, by calling Nuveen toll-free at (800) 257-8787. You may also obtain this information directly from the SEC. Visit the SEC on-line at http://www.sec.gov. | | |
| | | |
| | | | | | |
| | |
| | FINRA BrokerCheck: The Financial Industry Regulatory Authority (FINRA) provides information regarding the disciplinary history of FINRA member firms and associated investment professionals. This information as well as an investor brochure describing FINRA BrokerCheck is available to the public by calling the FINRA BrokerCheck Hotline number at (800) 289-9999 or by visiting www.FlNRA.org. | | |
Glossary of Terms
Used in this Report
Average Annual Total Return: This is a commonly used method to express an investment’s performance over a particular, usually multi-year time period. It expresses the return that would have been necessary each year to equal the investment’s actual cumulative performance (including change in NAV or market price and reinvested dividends and capital gains distributions, if any) over the time period being considered.
Gross Domestic Product (GDP): The total market value of all final goods and services produced in a country/region in a given year, equal to total consumer, investment and government spending, plus the value of exports, minus the value of imports.
MSCI EAFE Index: The MSCI (Morgan Stanley Capital International) EAFE (Europe, Australasia, Far East) Index is a free float-adjusted market capitalization weighted index designed to measure developed market equity performance, excluding the U.S. and Canada. The MSCI EAFE Index consists of the following 21 developed market country indexes: Australia, Austria, Belgium, Denmark, Finland, France, Germany, Hong Kong, Ireland, Israel, Italy, Japan, the Netherlands, New Zealand, Norway, Portugal, Singapore, Spain, Sweden, Switzerland, and the United Kingdom. The index returns assume reinvestment of distributions, but do not reflect any applicable sales charges or management fees.
MSCI USA Growth Index: An index designed to capture large and mid cap securities exhibiting overall growth style characteristics in the U.S. The index returns assume reinvestment of distributions, but do not reflect any applicable sales charges or management fees.
MSCI USA Mid Cap Growth Index: An index designed to capture mid cap securities exhibiting overall growth style characteristics in the U.S. The index returns assume reinvestment of distributions, but do not reflect any applicable sales charges or management fees.
MSCI USA Mid Cap Value Index: An index designed to capture mid cap U.S. securities exhibiting overall value style characteristics. The index returns assume reinvestment of distributions, but do not reflect any applicable sales charges or management fees.
MSCI USA Small Cap Index: An index designed to measure the performance of the small cap segment of the U.S. equity market. The index returns assume reinvestment of distributions, but do not reflect any applicable sales charges or management fees.
MSCI USA Value Index: An index designed to capture large and mid cap U.S. securities exhibiting overall value style characteristics. The index returns assume reinvestment of distributions, but do not reflect any applicable sales charges or management fees.
Net Asset Value (NAV) Per Share: A fund’s Net Assets is equal to its total assets (securities, cash, accrued earnings and receivables) less its total liabilities. NAV per share is equal to the fund’s Net Assets divided by its number of shares outstanding.
TIAA ESG Emerging Markets Equity Index: A custom index that is owned and calculated by MSCI Inc., based on the MSCI Emerging Markets Index, and aims to increase exposure to positive environmental, social and governance (ESG) factors and exhibit lower carbon exposure as compared to the MSCI Emerging Markets Index. The NuShares ESG Emerging Markets Equity ETF (“Fund”) is not sponsored, endorsed, issued, sold or promoted by or affiliated with MSCI Inc. MSCI Inc. does not make any representation regarding the advisability of investing in the Fund. Index returns assume reinvestment of distributions, but do not include the effects of any applicable sales charges or management fees.
Glossary of Terms Used in this Report (Unaudited) (continued)
TIAA ESG International Developed Markets Equity Index: A custom index that is owned and calculated by MSCI Inc., based on the MSCI EAFE Index, and aims to increase exposure to positive environmental, social and governance (ESG) factors and exhibit lower carbon exposure as compared to the MSCI EAFE Index. The NuShares ESG International Developed Markets Equity ETF (“Fund”) is not sponsored, endorsed, issued, sold or promoted by or affiliated with MSCI Inc. MSCI Inc. does not make any representation regarding the advisability of investing in the Fund. Index returns assume reinvestment of distributions, but do not include the effects of any applicable sales charges or management fees.
TIAA ESG USA Large-Cap Growth Index: Based on the MSCI USA Growth index, its parent index, which captures large-cap securities exhibiting overall growth style characteristics in the U.S. The TIAA ESG USA Large-Cap Growth Index is designed to represent the performance of a TIAA strategy that aims to increase the Index’s exposure to positive environmental, social and governance (ESG) factors as well as exhibit lower carbon exposure than the Parent Index. The index also aims to minimize the tracking error relative to the Parent Index through an optimization process. The index returns assume reinvestment of distributions, but do not reflect any applicable sales charges or management fees.
TIAA ESG USA Large-Cap Value Index: Based on the MSCI USA Value index, its parent index, which captures large-cap U.S. securities exhibiting overall value style characteristics. The TIAA ESG Large-Cap Value is designed to represent the performance of a TIAA strategy that aims to increase the Index’s exposure to positive environmental, social and governance (ESG) factors as well as exhibit lower carbon exposure than the Parent Index. The index also aims to minimize the tracking error relative to the Parent Index through an optimization process. The index returns assume reinvestment of distributions, but do not reflect any applicable sales charges or management fees.
TIAA ESG USA Mid-Cap Growth Index: Based on the MSCI USA Mid-Cap Growth Index, its parent index, which captures mid cap securities exhibiting overall growth style characteristics in the US. The TIAA ESG USA Mid-Cap Growth is designed to represent the performance of a TIAA strategy that aims to increase the Index’s exposure to positive environmental, social and governance (ESG) factors as well as exhibit lower carbon exposure than the Parent Index. The index also aims to minimize the tracking error relative to the Parent Index through an optimization process. The index returns assume reinvestment of distributions, but do not reflect any applicable sales charges or management fees.
Annual Investment Management Agreement
Approval Process (Unaudited)
Set forth in Part I below is a discussion of the initial approval of the Board of Trustees of NuShares ETF Trust (the “Trust”) of the advisory arrangements for the following funds: NuShares ESG Emerging Markets Equity ETF; and NuShares ESG International Developed Markets Equity ETF. Set forth in Part II below is a discussion of the initial approval of the Board of Trustees of the Trust of the advisory arrangements for the following funds: NuShares ESG Large-Cap Growth ETF; NuShares ESG Large-Cap Value ETF; NuShares ESG Mid-Cap Growth ETF; NuShares ESG Mid-Cap Value ETF; and NuShares ESG Small-Cap ETF.
I.
NuShares ESG Emerging Markets Equity ETF
NuShares ESG International Developed Markets Equity ETF
At a meeting held on April 11-12, 2017 (for purposes of this Part I, the “Meeting”), the Board of Trustees (the “Board” and each Trustee, a “Board Member”) of the Trust, including the Independent Board Members (as defined below), considered and approved the investment management agreement (for purposes of this Part I, the “Investment Management Agreement”) between the Trust and Nuveen Fund Advisors, LLC (the “Adviser”) on behalf of NuShares ESG International Developed Markets Equity ETF (the “Developed Markets ETF”) and NuShares ESG Emerging Markets Equity ETF (for purposes of this Part I, the “Emerging Markets ETF”; the Developed Markets ETF and the Emerging Markets ETF are each a “Fund” and collectively, the “Funds”), each a series of the Trust, and the investment sub-advisory agreement for purposes of this Part I (the “Sub-Advisory Agreement”) between the Adviser and Teachers Advisors, LLC (the “Sub-Adviser”). For purposes of this Part I, the Adviser and the Sub-Adviser are each hereafter a “Fund Adviser.” For purposes of this Part I, the Investment Management Agreement and the Sub-Advisory Agreement are each hereafter an “Advisory Agreement.” The Board Members who are not parties to the Funds’ Investment Management Agreement or Sub-Advisory Agreement or “interested persons” of any such parties are hereafter the “Independent Board Members.”
To assist the Board in its evaluation of an Advisory Agreement with a Fund Adviser at the Meeting, the Independent Board Members had received, in adequate time in advance of the Meeting or at prior meetings, materials which outlined, among other things:
| | • | | the nature, extent and quality of the services expected to be provided by the Fund Adviser; |
| | • | | the organization of the Fund Adviser, including the responsibilities of various departments and key personnel; |
| | • | | the relevant expertise and background of the Fund Adviser with respect to each Fund’s investment strategy; |
| | • | | certain performance-related information (as described below); |
| | • | | certain profitability-related information (as described below); |
| | • | | the Funds’ proposed unitary fee structure, including comparisons of each Fund’s proposed net expense ratio with the net expense ratios of comparable funds; and |
| | • | | the soft dollar practices of the Fund Adviser, if any. |
At the Meeting and/or at prior meetings, the Adviser made a presentation to and responded to questions from the Board. During the Meeting, the Independent Board Members also met privately with their legal counsel to, among other things, review the Board’s duties under the Investment Company Act of 1940 (the “1940 Act”), the general principles of state law in reviewing and approving advisory contracts, the standards used by courts in determining whether investment company boards of directors have fulfilled their duties, factors to be considered in voting on advisory contracts and an adviser’s fiduciary duty with respect to advisory agreements and compensation. It is with this background that the Independent Board Members considered the Advisory Agreements. As outlined in more detail below, the Independent Board Members considered all factors they believed relevant with respect to each Fund. Each Board Member may have accorded different weight to the various factors and information discussed below in reaching his or her conclusions with respect to the Funds’ Advisory Agreements. The Board Members also drew on information they had received in their capacity as trustees and directors, as applicable, of other registered investment companies advised by the Fund Advisers.
A. Nature, Extent and Quality of Services
The Independent Board Members considered the nature, extent and quality of the respective Fund Adviser’s services, including portfolio management services and administrative services. In this regard, the Independent Board Members recognized that open-end exchange-traded funds (“ETFs”) were recently added to the Nuveen fund product line (i.e., added in 2016); however, they considered the Adviser’s extensive experience in operating other types of investment companies. The Independent Board Members considered information about the structure, investment objective, strategies and other characteristics of each Fund. Additionally, they observed that each Fund was expected to seek to track the investment results of a specified underlying index (for purposes of this Part I, each, an “Index”).
Annual Investment Management Agreement Approval Process (Unaudited) (continued)
At the Meeting and/or at prior meetings, the Independent Board Members were provided with materials pertaining to, among other things, the Adviser’s organization and business and the types of services that the Adviser or its affiliates are expected to provide to the Funds. As the Adviser already serves as adviser to the other Nuveen funds overseen by the Board Members, the Board has a good understanding of the Adviser’s organization, operations, personnel and services. As the Independent Board Members meet regularly throughout the year to oversee the Nuveen funds, the Independent Board Members, in part, relied upon their knowledge from their meetings and any other interactions throughout the year with the Adviser in evaluating the Investment Management Agreement although, as noted above, they recognized that ETFs were recently added to the Nuveen fund product line.
The Board noted that the Funds would be registered investment companies that would operate in a regulated industry. In considering the services that were expected to be provided by the Fund Advisers, the Board recognized that the Adviser provides a comprehensive set of services to manage and operate the Nuveen funds, including: (a) product management (such as setting dividends; positioning the product in the marketplace; maintaining and enhancing shareholder communications; and reporting to the Board); (b) investment services (such as overseeing sub-advisers and other service providers; analyzing investment performance and risks; overseeing risk management and disclosure; developing and interpreting investment policies; assisting in the development of products; helping to prepare financial statements and marketing disclosures; and overseeing trade execution); (c) fund administration (such as helping to prepare fund tax returns and complete other tax compliance matters; and helping to prepare regulatory filings and shareholder reports); (d) fund Board administration (such as preparing Board materials and organizing and providing assistance for Board meetings); (e) compliance (such as helping to devise and maintain the Nuveen funds’ compliance program and related testing); and (f) legal support (such as helping to prepare registration statements and proxy statements; interpreting regulations and policies; and overseeing fund activities). The Board was aware, however, that services provided to ETFs may in some respects differ from those provided to other Nuveen funds. In addition, the Independent Board Members noted that the Adviser would oversee the Sub-Adviser, which was generally expected to provide the portfolio advisory services to the Funds.
With respect to the Sub-Adviser, at the Meeting and/or at prior meetings, the Independent Board Members were provided with materials pertaining to, among other things, the Sub-Adviser’s organization and business, and considered that the Sub-Adviser is an affiliate of the Adviser. The Independent Board Members considered the experience of the Sub-Adviser and noted that it manages, in addition to other Nuveen ETFs, certain index products, including certain funds in the TIAA-CREF fund family. The Independent Board Members have noted the expertise and experience within the TIAA-CREF organization with investment products that focus on “ESG” (i.e., environmental, social and governance) criteria. Further, they evaluated the background and experience of certain key investment personnel that were expected to serve as portfolio managers to the Funds.
Based on their review, the Independent Board Members found that, overall, the nature, extent and quality of services expected to be provided to the Funds under each Advisory Agreement were satisfactory.
B. Investment Performance
Each Fund was new and, therefore, did not have its own performance history. The Independent Board Members, however, were familiar with the performance records of other Nuveen funds advised by the Adviser. In addition, the Independent Board Members reviewed certain performance-related data pertaining to each Index (including, among other things, total return, price-to-earnings and dividend yield data pertaining to such Index and the applicable secondary benchmark index) for, in the case of the Developed Markets ETF, the period from May 31, 2012 through October 31, 2016, and in the case of the Emerging Markets ETF, the period from November 30, 2012 through October 31, 2016.
C. Fees, Expenses and Profitability
1. Fees and Expenses
In evaluating the management fees and expenses that each Fund was expected to bear, the Independent Board Members considered, among other things, its proposed unitary fee structure, the rationale for its proposed fee structure, and its proposed net expense ratio in absolute terms as well as compared with the net expense ratios of comparable ETFs.
In considering each Fund’s proposed unitary fee structure, the Independent Board Members took into account the Adviser’s representation that unitary fee structures were generally common for ETFs. They noted that under this structure, each Fund would pay a fee to the Adviser and, in turn, the Adviser would be generally responsible for the fees incurred by such Fund (such as custody fees, transfer agency fees, index licensing fees, and stock exchange listing fees, as well as the fee paid to the Sub-Adviser), subject to certain exceptions (which included the management fee, any payments under the Trust’s distribution and service plan, interest expenses, taxes, acquired fund fees and expenses, expenses incurred in acquiring and disposing of portfolio securities, certain expenses of the Fund’s chief compliance officer, fees and expenses of the Independent Board Members and their counsel, litigation expenses and extraordinary expenses). In this regard, the Independent Board Members were provided with estimates of the Funds’ anticipated expenses, including those that would be paid by the Adviser from the unitary fee and those that would be excluded from the unitary fee, to the extent available.
In considering the proposed unitary fee structure, the Independent Board Members took into account that the Adviser would bear the risk that certain of a Fund’s operating expenses would increase (but would also benefit if such expenses decrease) and the degree of expense stability that would be afforded to such Fund’s shareholders. Additionally, the Independent Board Members reviewed, among other things, each Fund’s proposed unitary fee as well as comparative data pertaining to net expense ratios of existing ETFs with a broad ESG focus. The Independent Board
Members took into account that most, although not all, of such existing ETFs also had a unitary fee structure. Further, they noted that the proposed unitary fee for each Fund was lower than the weighted average net expense ratio for the broad-based ESG ETF category. Further, the Independent Board Members considered the proposed sub-advisory fee for each Fund, which, as noted above, will be paid by the Adviser out of its unitary fee.
Based on their review of the fee and expense information provided, the Independent Board Members determined that each Fund’s unitary fee was reasonable in light of the nature, extent and quality of services to be provided to such Fund.
2. Comparisons with the Fees of Other Clients
The Board considered that ETFs were a recent addition to the Nuveen fund product line and that each Fund will pay a unitary fee which will differ from most other investment companies advised by the Adviser which pay a variety of fees, such as the investment advisory fee; Rule 12b-1 fees, if any; transfer agency fees; custody fees; and other expenses. The Board believed the unitary fee structure is a benefit to shareholders as it clearly discloses the cost of owning Fund shares, shifts the risk of the costs of operating a Fund covered by the unitary fee to the Adviser, and provides an incentive to the Adviser to maximize administrative efficiencies. As noted, the Board considered the unitary fee paid by the Funds compared to net expense ratios of existing ETFs with a broad ESG focus. The Board has also noted at prior meetings that the Adviser and/or its affiliated sub-advisers provide services to other types of clients, including, among other things, separately managed accounts, other investment companies that are not offered by Nuveen but are sub-advised by one of Nuveen’s affiliated sub-advisers, foreign investment companies offered by Nuveen, and collective investment trusts. The Board has observed that the varying types of clients require different services and involve different regulatory risks and entrepreneurial risks than managing a Fund, a registered investment company. At prior meetings, the Board has reviewed information regarding the different types of services that are provided to the Nuveen funds compared to those provided to the other types of clients described above, which typically do not require the same breadth of day-to-day services required for registered funds advised by the Adviser. The Board has noted that many of the administrative services that the Adviser provides to support the Nuveen funds may not be required to the same extent or at all for the institutional clients or other clients. The Independent Board Members have recognized that the foregoing variations result in different economics among the product structures and culminate in varying management fees among the types of clients and funds. Given the inherent differences in the various products, the Independent Board Members have concluded such facts justify the different levels of fees.
At the Meeting or at prior meetings, the Independent Board Members have noted that although, except for other Nuveen ETFs, the Sub-Adviser does not serve as sub-adviser to other Nuveen funds, it does serve as investment adviser to funds in the TIAA-CREF family of funds and, in addition, provides management services to other types of clients, including certain accounts.
3. Profitability of Fund Advisers
At the time of the Meeting, historical information regarding the costs of services provided by the Adviser to the Funds and the profitability of the Funds to the Adviser was not available as the Funds had not commenced operations and it was not possible to predict the effect on profitability of the Funds (or the recently added ETF line of business generally). At the Meeting or at prior meetings, however, the Board has recognized the significant time and resources the Adviser committed to develop the ETF product line, including organizing the Trust and Funds (in addition to other Nuveen ETFs), obtaining the necessary exemptive relief from the Securities and Exchange Commission, hiring additional personnel and arranging for the service providers to the Funds (and other Nuveen ETFs). The Independent Board Members also considered the estimated operating expenses to be paid by the Adviser pursuant to the unitary fee. Further, at prior meetings, the Independent Board Members have reviewed the profitability of Nuveen for its advisory activities on an absolute basis and in comparison to other investment advisers. In this regard, at prior meetings, the Independent Board Members have reviewed, among other things, Nuveen’s adjusted operating margins, the gross and net revenue margins (pre-tax and after-tax) for advisory activities for the other Nuveen funds, and the revenues, expenses, and net income (pre-tax and after-tax) of Nuveen for 2015 and 2014. The Independent Board Members have also reviewed an analysis of the key drivers behind the changes in revenues and expenses that impacted profitability and have considered Nuveen’s adjusted operating margins compared to that of other comparable investment advisers (based on asset size and composition) with publicly available data. Further, as the Adviser is a subsidiary of Nuveen, LLC, the investment management arm of Teachers Insurance and Annuity Association of America (“TIAA”), the Board has reviewed a balance sheet for TIAA reflecting its assets, liabilities and capital and contingency reserves to have a fuller understanding of the financial condition and strength of the TIAA complex, together with Nuveen. Based on the information provided, the Independent Board Members have previously noted that the Adviser appeared to be sufficiently profitable to operate as a viable investment management firm and to honor its obligations as a sponsor of the Nuveen funds. The Board recognized that it will be reviewing profitability further as the Funds commence operations and gather assets and as relevant information becomes available regarding Nuveen’s recently added ETF business line as a whole.
D. Economies of Scale and Whether Fee Levels Reflect These Economies of Scale
With respect to economies of scale, the Independent Board Members have recognized that, in general, as the assets of a particular fund or the Nuveen complex in the aggregate increase over time, economies of scale may be realized with respect to the management of the funds. In this regard, the Independent Board Members considered whether the Funds could be expected to benefit from any economies of scale. Although the Independent Board Members have recognized that economies of scale are difficult to measure with precision, they have noted that there are several acceptable means to share economies of scale, including through breakpoints in the management fee schedule reducing the fee rates as asset levels grow, fee
Annual Investment Management Agreement Approval Process (Unaudited) (continued)
waiver and expense limitation agreements, and the Adviser’s investment in its business which can enhance the services provided to the Nuveen funds. Most of the funds in the Nuveen complex pay a management fee to the Adviser which is generally comprised of a fund-level component and a complex-level component. Generally, the fund level fee component declines as the assets of a particular fund grow. Pursuant to the complex-wide fee arrangement, generally, the complex-level fee component declines when eligible assets of the funds in the Nuveen complex combined grow.
Notwithstanding the foregoing, the Independent Board Members recognized that the unitary fee structure does not have breakpoints and that the Funds (like other Nuveen ETFs) would not participate in the complex-level fee program. The Independent Board Members recognized that it was difficult to assess when economies of scale, if any, might be realized before the commencement of investment operations and in light of Nuveen’s recent entry to the ETF market. They further recognized that although a unitary fee affords a certain degree of certainty in the expenses of the Funds, the Adviser will benefit from any reductions in certain fixed costs that arise in connection with managing a Fund although the Adviser also has the risk if such fixed costs rise. Additionally, they acknowledged that as ETFs were new to the Nuveen fund family, there would be ongoing review of the fee structure employed for these types of funds.
In addition, at the Meeting and/or prior meetings, the Independent Board Members have recognized the Adviser’s ongoing investment in its business to expand or enhance the services provided to the Nuveen funds. In this regard, the Independent Board Members have noted, among other things, the additions to groups who play a key role in supporting the funds including in fund administration, operations, fund governance, investment services, compliance, product management, retail distribution and technology. The Independent Board Members have also recognized the investments in systems necessary to manage the funds including in areas of risk oversight, information technology and compliance.
Based on their review, the Independent Board Members concluded that the proposed unitary fee structure (which would not include breakpoints or participation in the complex-level fee program) was acceptable.
E. Indirect Benefits
In evaluating fees, the Independent Board Members considered information received at the Meeting and/or at prior meetings regarding other additional benefits that a Fund Adviser or its affiliates may receive as a result of their relationship with a Fund, including compensation paid to affiliates and research received in connection with brokerage transactions (i.e., soft dollar arrangements). In this regard, the Independent Board Members considered that each Fund’s portfolio transactions will be allocated by the Sub-Adviser and that the Sub-Adviser may benefit from research received through soft dollar arrangements with respect to transactions in equity securities. However, they recognized that the Sub-Adviser does not use soft dollars in connection with transactions in fixed income securities.
Based on their review, the Independent Board Members concluded that any indirect benefits expected to be received by a Fund Adviser as a result of its relationship with a Fund were reasonable and within acceptable parameters.
F. Approval
The Independent Board Members did not identify any single factor discussed previously as all-important or controlling. The Board Members, including a majority of the Independent Board Members, concluded that the terms of the Investment Management Agreement and the Sub-Advisory Agreement were fair and reasonable, that the respective Fund Adviser’s fees were reasonable in light of the services to be provided to the Funds and that the Investment Management Agreement and Sub-Advisory Agreement should be and were approved on behalf of the Funds.
II.
NuShares ESG Large-Cap Growth ETF
NuShares ESG Large-Cap Value ETF
NuShares ESG Mid-Cap Growth ETF
NuShares ESG Mid-Cap Value ETF
NuShares ESG Small-Cap ETF
At a meeting held on November 14-16, 2016 (for purposes of this Part II, the “Meeting”), the Board of Trustees (the “Board” and each Trustee, a “Board Member”) of the Trust, including the Independent Board Members (as defined below), considered and approved the investment management agreement (for purposes of this Part II, the “Investment Management Agreement”) between the Trust and Nuveen Fund Advisors, LLC (the “Adviser”) on behalf of NuShares ESG Large-Cap Growth ETF, NuShares ESG Large-Cap Value ETF, NuShares ESG Mid-Cap Growth ETF, NuShares ESG Mid-Cap Value ETF and NuShares ESG Small-Cap ETF (for purposes of this Part II, each, a “Fund” and collectively, the “Funds”), each a series of the Trust, and the investment sub-advisory agreement (for purposes of this Part II, the “Sub-Advisory Agreement”) between the Adviser and Teachers Advisors, LLC (the “Sub-Adviser”). For purposes of this Part II, the Adviser and the Sub-Adviser are each hereafter a “Fund Adviser.” For purposes of this Part II, the Investment Management Agreement and the Sub-Advisory Agreement are each hereafter an “Advisory Agreement.” The Board Members who are not parties to the Funds’ Investment Management Agreement or Sub-Advisory Agreement or “interested persons” of any such parties are hereafter the “Independent Board Members.”
To assist the Board in its evaluation of an Advisory Agreement with a Fund Adviser at the Meeting, the Independent Board Members had received, in adequate time in advance of the Meeting or at prior meetings, materials which outlined, among other things:
| | • | | the nature, extent and quality of the services expected to be provided by the Fund Adviser; |
| | • | | the organization of the Fund Adviser, including the responsibilities of various departments and key personnel; |
| | • | | the relevant expertise and background of the Fund Adviser with respect to each Fund’s investment strategy; |
| | • | | certain performance-related information (as described below); |
| | • | | certain profitability-related information (as described below); |
| | • | | the Funds’ proposed unitary fee structure, including comparisons of each Fund’s proposed expense ratio with the expense ratios of comparable funds; and |
| | • | | the soft dollar practices of the Fund Adviser, if any. |
At the Meeting and at prior meetings, the Adviser made a presentation to and responded to questions from the Board. During the Meeting, the Independent Board Members also met privately with their legal counsel to, among other things, review the Board’s duties under the Investment Company Act of 1940 (the “1940 Act”), the general principles of state law in reviewing and approving advisory contracts, the standards used by courts in determining whether investment company boards of directors have fulfilled their duties, factors to be considered in voting on advisory contracts and an adviser’s fiduciary duty with respect to advisory agreements and compensation. It is with this background that the Independent Board Members considered the Advisory Agreements. As outlined in more detail below, the Independent Board Members considered all factors they believed relevant with respect to each Fund. Each Board Member may have accorded different weight to the various factors and information discussed below in reaching his or her conclusions with respect to the Funds’ Advisory Agreements. The Board Members also drew on information they had received in their capacity as trustees and directors, as applicable, of other registered investment companies advised by the Fund Advisers.
A. Nature, Extent and Quality of Services
The Independent Board Members considered the nature, extent and quality of the respective Fund Adviser’s services, including portfolio management services and administrative services. In this regard, the Independent Board Members recognized that open-end exchange-traded funds (“ETFs”) were recently added to the Nuveen fund product line; however, they considered the Adviser’s extensive experience in operating other types of investment companies. The Independent Board Members considered information about the structure, investment objective, strategies and other characteristics of each Fund. Additionally, they observed that each Fund was expected to seek to track the investment results of a specified index (for purposes of this Part II, each, an “Index”).
At the Meeting and/or at prior meetings, the Independent Board Members were provided with materials pertaining to, among other things, the Adviser’s organization and business and the types of services that the Adviser or its affiliates are expected to provide to the Funds. As the Adviser already serves as adviser to the other Nuveen funds overseen by the Board Members, the Board has a good understanding of the Adviser’s organization, operations, personnel and services. As the Independent Board Members meet regularly throughout the year to oversee the Nuveen funds, the Independent Board Members, in part, relied upon their knowledge from their meetings and any other interactions throughout the year with the Adviser in evaluating the Investment Management Agreement although, as noted above, they recognized that ETFs were recently added to the Nuveen fund product line.
The Board noted that the Funds would be registered investment companies that would operate in a regulated industry. In considering the services that were expected to be provided by the Fund Advisers, the Board recognized that the Adviser provides a comprehensive set of services to manage and operate the Nuveen funds, including: (a) product management (such as setting dividends; positioning the product in the marketplace; maintaining and enhancing shareholder communications; and reporting to the Board); (b) investment services (such as overseeing sub-advisers and other service providers; analyzing investment performance and risks; overseeing risk management and disclosure; developing and interpreting investment policies; assisting in the development of products; helping to prepare financial statements and marketing disclosures; and overseeing trade execution); (c) fund administration (such as helping to prepare fund tax returns and complete other tax compliance matters; and helping to prepare regulatory filings and shareholder reports); (d) fund Board administration (such as preparing Board materials and organizing and providing assistance for Board meetings); (e) compliance (such as helping to devise and maintain the Nuveen funds’ compliance program and related testing); and (f) legal support (such as helping to prepare registration statements and proxy statements; interpreting regulations and policies; and overseeing fund activities). The Board was aware, however, that services provided to ETFs may in some respects differ from those provided to other Nuveen funds. In addition, the Independent Board Members noted that the Adviser would oversee the Sub-Adviser, which was generally expected to provide the portfolio advisory services to the Funds.
With respect to the Sub-Adviser, at the Meeting or at prior meetings, the Independent Board Members were provided with materials pertaining to, among other things, the Sub-Adviser’s organization and business, and considered that the Sub-Adviser is an affiliate of the Adviser. The Independent Board Members considered the experience of the Sub-Adviser and noted that it manages, in addition to another recent Nuveen ETF, certain index
Annual Investment Management Agreement Approval Process (Unaudited) (continued)
products, including certain funds in the TIAA-CREF fund family. The Independent Board Members have noted the expertise and experience within the TIAA-CREF organization with investment products that focus on “ESG” (i.e., environmental, social and governance) criteria. Further, they evaluated the background and experience of certain key investment personnel that were expected to serve as portfolio managers to the Funds.
Based on their review, the Independent Board Members found that, overall, the nature, extent and quality of services expected to be provided to the Funds under each Advisory Agreement were satisfactory.
B. Investment Performance
Each Fund was new and, therefore, did not have its own performance history. The Independent Board Members, however, were familiar with the performance records of other Nuveen funds advised by the Adviser. In addition, the Independent Board Members reviewed total return data pertaining to each Index for, as of September 30, 2016, the year-to-date, one-year, three-year and since inception periods.
C. Fees, Expenses and Profitability
1. Fees and Expenses
In evaluating the management fees and expenses that each Fund was expected to bear, the Independent Board Members considered, among other things, its proposed unitary fee structure, the rationale for its proposed fee structure, and its proposed expense ratio in absolute terms as well as compared with the expense ratios of comparable ETFs.
In considering each Fund’s proposed unitary fee structure, the Independent Board Members took into account the Adviser’s representation that unitary fee structures were generally common for ETFs. They noted that under this structure, each Fund would pay a fee to the Adviser and, in turn, the Adviser would be generally responsible for the fees incurred by such Fund (such as custody fees, transfer agency fees, index licensing fees, and stock exchange listing fees, as well as the fee paid to the Sub-Adviser), subject to certain exceptions (which included the management fee, any payments under the Trust’s distribution and service plan, interest expenses, taxes, acquired fund fees and expenses, expenses incurred in acquiring and disposing of portfolio securities, certain expenses of the Fund’s chief compliance officer, fees and expenses of the Independent Board Members and their counsel, litigation expenses and extraordinary expenses). In this regard the Independent Board Members were provided with estimates of the Funds’ anticipated expenses, including those that would be paid by the Adviser from the unitary fee and those that would be excluded from the unitary fee, to the extent available.
In considering the proposed unitary fee structure, the Independent Board Members took into account that the Adviser would bear the risk that certain of a Fund’s operating expenses would increase (but would also benefit if such expenses decrease) and the degree of expense stability that would be afforded to such Fund’s shareholders. Additionally, the Independent Board Members reviewed, among other things, each Fund’s proposed expense ratio as well as comparative data pertaining to expense ratios of existing ETFs with a broad ESG focus. The Independent Board Members took into account that most, although not all, of such existing ETFs also had a unitary fee structure and that there was some variation in the expenses that were excluded from the unitary fee. Additionally, they noted that the proposed unitary fee for each Fund was lower than the median of the expense ratios for the broad-based ESG ETF category. Further, the Independent Board Members considered the proposed sub-advisory fee for the Funds, which, as noted above, will be paid by the Adviser out of its unitary fee.
Based on their review of the fee and expense information provided, the Independent Board Members determined that each Fund’s unitary fee was reasonable in light of the nature, extent and quality of services to be provided to such Fund.
2. Comparisons with the Fees of Other Clients
The Board considered that ETFs were a recent addition to the Nuveen fund product line and that each Fund will pay a unitary fee which will differ from most other investment companies advised by the Adviser which pay a variety of fees, such as the investment advisory fee; Rule 12b-1 fees, if any; transfer agency fees; custody fees; and other expenses. The Board believed the unitary fee structure is a benefit to shareholders as it clearly discloses the cost of owning Fund shares, shifts the risk of the costs of operating a Fund covered by the unitary fee to the Adviser, and provides an incentive to the Adviser to maximize administrative efficiencies. As noted, the Board considered the unitary fee paid by the Funds compared to the expense ratios of existing ETFs with a broad ESG focus. The Board also noted that the Adviser and/or its affiliated sub-advisers provide services to other types of clients, including, among other things, separately managed accounts, other investment companies that are not offered by Nuveen but are sub-advised by one of Nuveen’s affiliated sub-advisers, foreign investment companies offered by Nuveen, and collective investment trusts. The Board has observed that the varying types of clients require different services and involve different regulatory risks and entrepreneurial risks than managing a Fund, a registered investment company. At prior meetings, the Board has reviewed information regarding the different types of services that are provided to the Nuveen funds compared to those provided to the other types of clients described above, which typically do not require the same breadth of day-to-day services required for registered funds advised by the Adviser. The Board noted that many of the administrative services that the Adviser provides to support the Nuveen funds may not be required to the same extent or at all for the institutional clients or other clients. The Independent Board Members have recognized that the foregoing variations result in different economics among the product structures and culminate in varying management fees among the types of clients and funds. Given the inherent differences in the various products, the Independent Board Members have concluded such facts justify the different levels of fees.
At the Meeting or at prior meetings, the Independent Board Members noted that although, except for another recent Nuveen ETF, the Sub-Adviser does not serve as sub-adviser to other Nuveen funds, it does serve as investment adviser to funds in the TIAA-CREF family of funds and, in addition, provides management services to other types of clients, including certain accounts.
3. Profitability of Fund Advisers
At the time of the Meeting, historical information regarding the costs of services provided by the Adviser to the Funds and the profitability of the Funds to the Adviser was not available as the Funds had not commenced operations and it was not possible to predict the effect on profitability of the Funds (or the recently added ETF line of business generally). At the Meeting or at prior meetings, however, the Board has recognized the significant time and resources the Adviser committed to develop the ETF product line, including organizing the Trust and Funds (in addition to other Nuveen ETFs), obtaining the necessary exemptive relief from the Securities and Exchange Commission, hiring additional personnel and arranging for the service providers to the Funds (and other Nuveen ETFs). The Independent Board Members also considered the estimated operating expenses to be paid by the Adviser pursuant to the unitary fee. Further, at prior meetings, the Independent Board Members have reviewed the profitability of Nuveen for its advisory activities on an absolute basis and in comparison to other investment advisers. In this regard, at prior meetings, the Independent Board Members have reviewed, among other things, Nuveen’s adjusted operating margins, the gross and net revenue margins (pre-tax and after-tax) for advisory activities for the other Nuveen funds, and the revenues, expenses, and net income (pre-tax and after-tax) of Nuveen for 2015 and 2014. The Independent Board Members have also reviewed an analysis of the key drivers behind the changes in revenues and expenses that impacted profitability and have considered Nuveen’s adjusted operating margins compared to that of other comparable investment advisers (based on asset size and composition) with publicly available data. Further, the Board has reviewed a balance sheet for Teachers Insurance and Annuity Association of America reflecting its assets, liabilities and capital and contingency reserves to have a better understanding of the financial stability and strength of the TIAA-CREF complex, together with Nuveen. Based on the information provided, the Independent Board Members have previously noted that the Adviser appeared to be sufficiently profitable to operate as a viable investment management firm and to honor its obligations as a sponsor of the Nuveen funds. The Board recognized that it will be reviewing profitability further as the Funds commence operations and gather assets and as relevant information becomes available regarding Nuveen’s recently added ETF business line as a whole.
D. Economies of Scale and Whether Fee Levels Reflect These Economies of Scale
With respect to economies of scale, the Independent Board Members have recognized that, in general, as the assets of a particular fund or the Nuveen complex in the aggregate increase over time, economies of scale may be realized with respect to the management of the funds. In this regard, the Independent Board Members considered whether the Funds could be expected to benefit from any economies of scale. Although the Independent Board Members have recognized that economies of scale are difficult to measure with precision, they have noted that there are several acceptable means to share economies of scale, including through breakpoints in the management fee schedule reducing the fee rates as asset levels grow, fee waiver and expense limitation agreements, and the Adviser’s investment in its business which can enhance the services provided to the Nuveen funds. Most of the funds in the Nuveen complex pay a management fee to the Adviser which is generally comprised of a fund-level component and a complex-level component. Generally, the fund level fee component declines as the assets of a particular fund grow. Pursuant to the complex-wide fee arrangement, generally, the complex-level fee component declines when eligible assets of the funds in the Nuveen complex combined grow.
Notwithstanding the foregoing, the Independent Board Members recognized that the unitary fee structure does not have breakpoints and that the Funds (like other Nuveen ETFs) would not participate in the complex-level fee program. The Independent Board Members recognized that it was difficult to assess when economies of scale, if any, might be realized before the commencement of investment operations and in light of Nuveen’s recent entry to the ETF market. They further recognized that although a unitary fee affords a certain degree of certainty in the expenses of the Funds, the Adviser will benefit from any reductions in certain fixed costs that arise in connection with managing a Fund although the Adviser also has the risk if such fixed costs rise. Additionally, they acknowledged that as ETFs were new to the Nuveen fund family, there would be ongoing review of the fee structure employed for these types of funds.
In addition, at the Meeting and/or prior meetings, the Independent Board Members have recognized the Adviser’s ongoing investment in its business to expand or enhance the services provided to the Nuveen funds. In this regard, the Independent Board Members have noted, among other things, the additions to groups who play a key role in supporting the funds including in fund administration, operations, fund governance, investment services, compliance, product management, retail distribution and technology. The Independent Board Members have also recognized the investments in systems necessary to manage the funds including in areas of risk oversight, information technology and compliance.
Based on their review, the Independent Board Members concluded that the proposed unitary fee structure (which would not include breakpoints or participation in the complex-level fee program) was acceptable.
E. Indirect Benefits
In evaluating fees, the Independent Board Members considered information received at the Meeting and/or at prior meetings regarding other additional benefits that a Fund Adviser or its affiliates may receive as a result of their relationship with a Fund, including compensation paid to affiliates and research received in connection with brokerage transactions (i.e., soft dollar arrangements). In this regard, the Independent Board Members
Annual Investment Management Agreement Approval Process (Unaudited) (continued)
considered that each Fund’s portfolio transactions will be allocated by the Sub-Adviser and that the Sub-Adviser may benefit from research received through soft dollar arrangements with respect to transactions in equity securities. However, they recognized that the Sub-Adviser does not use soft dollars in connection with transactions in fixed income securities.
Based on their review, the Independent Board Members concluded that any indirect benefits expected to be received by a Fund Adviser as a result of its relationship with a Fund were reasonable and within acceptable parameters.
F. Approval
The Independent Board Members did not identify any single factor discussed previously as all-important or controlling. The Board Members, including a majority of the Independent Board Members, concluded that the terms of the Investment Management Agreement and the Sub-Advisory Agreement were fair and reasonable, that the respective Fund Adviser’s fees were reasonable in light of the services to be provided to the Funds and that the Investment Management Agreement and Sub-Advisory Agreement should be and were approved on behalf of the Funds.
Trustees
and Officers (Unaudited)
The management of the Funds, including general supervision of the duties performed for the Funds by the Adviser, is the responsibility of the Board of Trustees of the Funds. The number of trustees of the Funds is currently set at twelve. None of the trustees who are not “interested” persons of the Funds (referred to herein as “independent trustees”) has ever been a director or employee of, or consultant to, Nuveen or its affiliates. The names and business addresses of the trustees and officers of the Funds, their principal occupations and other affiliations during the past five years, the number of portfolios each oversees and other directorships they hold are set forth below.
The Funds’ Statement of Additional Information (“SAI”) includes more information about the trustees. To request a free copy, call Nuveen Investments at (800) 257-8787 or visit the Funds’ website at www.nuveen.com.
| | | | | | | | |
Name, Year of Birth & Address | | Position(s) Held with the Funds | | Year First Elected or Appointed (1) | | Principal Occupation(s) Including other Directorships During Past 5 Years | | Number of Portfolios in Fund Complex Overseen by Trustee |
| | | |
| Independent Trustees: | | | | |
William J. Schneider 1944 333 W. Wacker Drive Chicago, IL 60606 | | Chairman and Trustee | | 1996 | | Chairman of Miller-Valentine Partners, a real estate investment company; Board Member of WDPR Public Radio station; formerly, Senior Partner and Chief Operating Officer (retired (2004) of Miller-Valentine Group; formerly, Board member, Business Advisory Council of the Cleveland Federal Reserve Bank and University of Dayton Business School Advisory Council; past Chair and Director, Dayton Development Coalition. | | 176 |
Jack B. Evans 1948 333 W. Wacker Drive Chicago, IL 60606 | | Trustee | | 1999 | | President, The Hall-Perrine Foundation, a private philanthropic corporation (since 1996); Director and Chairman, United Fire Group, a publicly held company; Director, Public member, American Board of Orthopaedic Surgery (since 2015); Life Trustee of Coe College and the Iowa College Foundation; formerly, President Pro-Tem of the Board of Regents for the State of Iowa University System; formerly, Director, Alliant Energy; formerly, Director, Federal Reserve Bank of Chicago; formerly, President and Chief Operating Officer, SCI Financial Group, Inc., a regional financial services firm. | | 176 |
William C. Hunter 1948 333 W. Wacker Drive Chicago, IL 60606 | | Trustee | | 2003 | | Dean Emeritus, formerly, Dean, Tippie College of Business, University of Iowa (2006-2012); Director (since 2004) of Xerox Corporation; past Director (2005-2015), and past President (2010- 2014) Beta Gamma Sigma, Inc., The International Business Honor Society; Director of Wellmark, Inc. (since 2009); formerly, Dean and Distinguished Professor of Finance, School of Business at the University of Connecticut (2003-2006); previously, Senior Vice President and Director of Research at the Federal Reserve Bank of Chicago (1995-2003); formerly, Director (1997-2007), Credit Research Center at Georgetown University. | | 176 |
David J. Kundert(1) 1942 333 W. Wacker Drive Chicago, IL 60606 | | Trustee | | 2005 | | Formerly, Director, Northwestern Mutual Wealth Management Company (2006-2013); retired (since 2004) as Chairman, JPMorgan Fleming Asset Management, President and CEO, Banc One Investment Advisors Corporation, and President, One Group Mutual Funds; prior thereto, Executive Vice President, Banc One Corporation and Chairman and CEO, Banc One Investment Management Group; Regent Emeritus, Member of Investment Committee, Luther College; member of the Wisconsin Bar Association; member of Board of Directors and Chair of Investment Committee, Greater Milwaukee Foundation; member of the Board of Directors (Milwaukee), College Possible; Board member of Milwaukee Repertory Theatre (since 2016). | | 176 |
Trustees and Officers (Unaudited) (continued)
| | | | | | | | |
Name, Year of Birth & Address | | Position(s) Held with the Funds | | Year First Elected or Appointed (1) | | Principal Occupation(s) Including other Directorships During Past 5 Years | | Number of Portfolios in Fund Complex Overseen by Trustee |
Albin F. Moschner 1952 333 W. Wacker Drive Chicago, IL 60606 | | Trustee | | 2016 | | Founder and Chief Executive Officer, Northcroft Partners, LLC, a management consulting firm (since 2012); previously, held positions at Leap Wireless International, Inc., including Consultant (2011-2012), Chief Operating Officer (2008-2011), and Chief Marketing Officer (2004-2008); formerly, President, Verizon Card Services division of Verizon Communications, Inc. (2000-2003); formerly, President, One Point Services at One Point Communications (1999-2000); formerly, Vice Chairman of the Board, Diba, Incorporated (1996-1997); formerly, various executive positions with Zenith Electronics Corporation (1991-1996). Director, USA Technologies, Inc., a provider of solutions and services to facilitate electronic payment transactions (since 2012); formerly, Director, Wintrust Financial Corporation (1996-2016). | | 176 |
John K. Nelson 1962 333 W. Wacker Drive Chicago, IL 60606 | | Trustee | | 2013 | | Member of Board of Directors of Core12 LLC (since 2008), a private firm which develops branding, marketing and communications strategies for clients; Director of The Curran Center for Catholic American Studies (since 2009) and The President’s Council, Fordham University (since 2010); formerly senior external advisor to the financial services practice of Deloitte Consulting LLP (2012-2014); formerly, Chairman of the Board of Trustees of Marian University (2010 as trustee, 2011- 2014 as Chairman); formerly, Chief Executive Officer of ABN AMRO N.V. North America, and Global Head of its Financial Markets Division (2007-2008); prior senior positions held at ABN AMRO include Corporate Executive Vice President and Head of Global Markets—the Americas (2006-2007), CEO of Wholesale Banking—North America and Global Head of Foreign Exchange and Futures Markets (2001-2006), and Regional Commercial Treasurer and Senior Vice President Trading—North America (1996-2001); formerly, Trustee at St. Edmund Preparatory School in New York City. | | 176 |
Judith M. Stockdale 1947 333 W. Wacker Drive Chicago, IL 60606 | | Trustee | | 1997 | | Board Member, Land Trust Alliance (since 2013) and U.S. Endowment for Forestry and Communities (since 2013); formerly, Executive Director (1994-2012), Gaylord and Dorothy Donnelley Foundation; prior thereto, Executive Director, Great Lakes Protection Fund (1990-1994). | | 176 |
Carole E. Stone 1947 333 W. Wacker Drive Chicago, IL 60606 | | Trustee | | 2007 | | Director, Chicago Board Options Exchange (since 2006), C2 Options Exchange, Incorporated (since 2009); Director, CBOE Holdings, Inc. (since 2010); formerly, Commissioner, New York State Commission on Public Authority Reform (2005-2010). | | 176 |
Terence J. Toth 1959 333 W. Wacker Drive Chicago, IL 60606 | | Trustee | | 2008 | | Co-Founding Partner, Promus Capital (since 2008); Director, Fulcrum IT Service LLC (since 2010) and Quality Control Corporation (since 2012); member: Catalyst Schools of Chicago Board (since 2008) and Mather Foundation Board (since 2012), and chair of its investment committee; formerly, Director, Legal & General Investment Management America, Inc. (2008-2013); formerly, CEO and President, Northern Trust Global Investments (2004-2007); Executive Vice President, Quantitative Management & Securities Lending (2000-2004); prior thereto, various positions with Northern Trust Company (since 1994); formerly, Member, Northern Trust Mutual Funds Board (2005-2007), Northern Trust Global Investments Board (2004-2007), Northern Trust Japan Board (2004-2007), Northern Trust Securities Inc. Board (2003- 2007) and Northern Trust Hong Kong Board (1997-2004). | | 176 |
| | | | | | | | |
Name, Year of Birth & Address | | Position(s) Held with the Funds | | Year First Elected or Appointed (1) | | Principal Occupation(s) Including other Directorships During Past 5 Years | | Number of Portfolios in Fund Complex Overseen by Trustee |
Margaret L. Wolff 1955 333 W. Wacker Drive Chicago, IL 60606 | | Trustee | | 2016 | | Formerly, member of the Board of Directors (2013-2017) of Travelers Insurance Company of Canada and The Dominion of Canada General Insurance Company (each, a part of Travelers Canada, the Canadian operation of The Travelers Companies, Inc.); formerly, Of Counsel, Skadden, Arps, Slate, Meagher & Flom LLP (Mergers & Acquisitions Group) (2005-2014); Member of the Board of Trustees of New York-Presbyterian Hospital (since 2005); Member (since 2004) and Chair (since 2015) of the Board of Trustees of The John A. Hartford Foundation (a philanthropy dedicated to improving the care of older adults); formerly, Member (2005-2015) and Vice Chair (2011-2015) of the Board of Trustees of Mt. Holyoke College. | | 176 |
Robert L. Young(2) 1963 333 W. Wacker Drive Chicago, IL 60606 | | Trustee | | 2017 | | Formerly, Chief Operating Officer and Director, J.P. Morgan Investment Management Inc. (2010-2016); formerly, President and Principal Executive Officer (2013-2016), and Senior Vice President and Chief Operating Officer (2005-2010), of J.P. Morgan Funds; formerly, Director and various officer positions for J.P. Morgan Investment Management Inc. (formerly, JPMorgan Funds Management, Inc. and formerly, One Group Administrative Services) and JPMorgan Distribution Services, Inc. (formerly, One Group Dealer Services, Inc.) (1999-2017). | | 174 |
| | | |
| Interested Trustee: | | | | |
Margo L. Cook(3) 1964 333 W. Wacker Drive Chicago, IL 60606 | | Trustee | | 2016 | | President (since April 2017), formerly, Co-Chief Executive Officer and Co-President (2016-2017), formerly, Senior Executive Vice President of Nuveen Investments, Inc; Executive Vice President (since February 2017) of Nuveen, LLC; President, Global Products and Solutions (since July 2017), and Co-Chief Executive Officer (since 2015), formerly, Executive Vice President (2013-2015) of Nuveen Securities, LLC; President (since August 2017), formerly, Co-President (October 2016-August 2017), formerly Senior Executive Vice President (2015-2016) of Nuveen Fund Advisors, LLC (Executive Vice President 2011-2015); President (since 2017), Nuveen Alternative Investments, LLC; Chartered Financial Analyst. | | 176 |
| | | | | | | | |
Name, Year of Birth & Address | | Position(s) Held with the Funds | | Year First Elected or Appointed (4) | | Principal Occupation(s) During Past 5 Years | | Number of Portfolios in Fund Complex Overseen by Officers |
| |
| Officers of the Funds: |
Martin Y.G. Kremenstein 1976 100 Park Avenue New York, NY 10017 | | Chief Administrative Officer | | 2017 | | Senior (since February 2017) Managing Director (since October 2016) of Nuveen Fund Advisors, LLC; formerly, Managing Director (2013-2015); formerly, Director (2009-2013) Deutsche Bank; CEO (2012-2015) DB Commodity Services LLC; CEO (2012-2014) DBX Advisors LLC and DBX Strategic Advisors LLC. | | 11 |
Lorna C. Ferguson 1945 333 W. Wacker Drive Chicago, IL 60606 | | Vice President | | 1998 | | Senior Managing Director (since February 2017), formerly, Managing Director (2004-2017) of Nuveen. | | 176 |
Stephen D. Foy 1954 333 W. Wacker Drive Chicago, IL 60606 | | Vice President and Controller | | 1998 | | Managing Director (since 2014), formerly, Senior Vice President (2013-2014) and Vice President (2005-2013) of Nuveen Fund Advisors, LLC; Managing Director (since 2016) of Nuveen Securities, LLC; Certified Public Accountant. | | 176 |
Trustees and Officers (Unaudited) (continued)
| | | | | | | | |
Name, Year of Birth & Address | | Position(s) Held with the Funds | | Year First Elected or Appointed (4) | | Principal Occupation(s) During Past 5 Years | | Number of Portfolios in Fund Complex Overseen by Officers |
Nathaniel T. Jones 1979 333 W. Wacker Drive Chicago, IL 60606 | | Vice President and Treasurer | | 2016 | | Managing Director (since January 2017), formerly, Senior Vice President (2016-2017), formerly, Vice President (2011- 2016) of Nuveen; Chartered Financial Analyst. | | 176 |
Walter M. Kelly 1970 333 W. Wacker Drive Chicago, IL 60606 | | Chief Compliance Officer and Vice President | | 2003 | | Managing Director (since January 2017), formerly, Senior Vice President (2008-2017) of Nuveen Investments Holdings, Inc. | | 176 |
Tina M. Lazar 1961 333 W. Wacker Drive Chicago, IL 60606 | | Vice President | | 2002 | | Managing Director (since January 2017), formerly, Senior Vice President (2014-2017) of Nuveen Securities, LLC. | | 176 |
Kevin J. McCarthy 1966 333 W. Wacker Drive Chicago, IL 60606 | | Vice President and Secretary | | 2007 | | Senior Managing Director (since February 2017) and Secretary and General Counsel (since 2016) of Nuveen Investments, Inc., formerly, Executive Vice President (2016-2017) and Managing Director and Assistant Secretary (2008-2016); Senior Managing Director (since January 2017) and Assistant Secretary (since 2008) of Nuveen Securities, LLC, formerly Executive Vice President (2016-2017) and Managing Director (2008-2016); Senior Managing Director (since February 2017), Secretary (since 2016) and Co-General Counsel (since 2011) of Nuveen Fund Advisors, LLC, formerly, Executive Vice President (2016-2017), Managing Director (2008-2016) and Assistant Secretary (2007-2016); Senior Managing Director (since February 2017), Secretary (since 2016) and Associate General Counsel (since 2011 of Nuveen Asset Management, LLC, formerly Executive Vice President (2016-2017) and Managing Director and Assistant Secretary (2011-2016); Senior Managing Director (since February 2017) and Secretary (since 2016) of Nuveen Investments Advisers, LLC, formerly Executive Vice President (2016-2017); Vice President (since 2007) and Secretary (since 2016), formerly, Assistant Secretary, of NWQ Investment Management Company, LLC, Symphony Asset Management LLC Santa Barbara Asset Management, LLC and Winslow Capital Management, LLC (since 2010). | | 176 |
Kathleen L. Prudhomme 1953 901 Marquette Avenue Minneapolis, MN 55402 | | Vice President and Assistant Secretary | | 2011 | | Managing Director, Assistant Secretary and Co-General Counsel (since 2011) of Nuveen Fund Advisors, LLC; Managing Director, Assistant Secretary and Associate General Counsel (since 2011) of Nuveen Asset Management, LLC; Managing Director and Assistant Secretary (since 2011) of Nuveen Securities, LLC; formerly, Deputy General Counsel, FAF Advisors, Inc. (2004- 2010). | | 176 |
Christopher M. Rohrbacher 1971 333 W. Wacker Drive Chicago, IL 60606 | | Vice President and Assistant Secretary | | 2008 | | Managing Director (since January 2017) of Nuveen Securities, LLC; Managing Director (Since January 2017), formerly, Senior Vice President (2016-2017) and Assistant Secretary (since October 2016) of Nuveen Fund Advisors, LLC. | | 176 |
William A. Siffermann 1975 333 W. Wacker Drive Chicago, IL 60606 | | Vice President | | 2017 | | Managing Director (Since February 2017), formerly Senior Vice President (2016-2017) and Vice President (2011-2016) of Nuveen. | | 176 |
Joel T. Slager 1978 333 W. Wacker Drive Chicago, IL 60606 | | Vice President and Assistant Secretary | | 2013 | | Fund Tax Director for Nuveen Funds (since 2013); previously, Vice President of Morgan Stanley Investment Management, Inc., Assistant Treasurer of the Morgan Stanley Funds (from 2010 to 2013). | | 176 |
| | | | | | | | |
Name, Year of Birth & Address | | Position(s) Held with the Funds | | Year First Elected or Appointed (4) | | Principal Occupation(s) During Past 5 Years | | Number of Portfolios in Fund Complex Overseen by Officers |
Gifford R. Zimmerman 1956 333 W. Wacker Drive Chicago, IL 60606 | | Vice President and Assistant Secretary | | 1988 | | Managing Director (since 2002), and Assistant Secretary of Nuveen Securities, LLC; Managing Director (since 2004) and Assistant Secretary (since 1994) of Nuveen Investments, Inc.; Managing Director (since 2002), Assistant Secretary (since 1997) and Co-General Counsel (since 2011) of Nuveen Fund Advisors, LLC; Managing Director, Assistant Secretary and Associate General Counsel of Nuveen Asset Management, LLC (since 2011); Vice President (since February 2017), formerly, Managing Director (2003-2017) and Assistant Secretary (since 2003) of Symphony Asset Management LLC ; Managing Director and Assistant Secretary (since 2002) of Nuveen Investments Advisers, LLC; Vice President and Assistant Secretary of NWQ Investment Management Company, LLC (since 2002), Santa Barbara Asset Management, LLC (since 2006) and of Winslow Capital Management, LLC, (since 2010); Chartered Financial Analyst. | | 176 |
| (1) | Trustees serve an indefinite term until his/her successor is elected or appointed. The year first elected or appointed represents the year in which the director was first elected or appointed to any fund in the Nuveen Fund Complex. Mr. Kundert will retire from the Board as of December 31, 2017. |
| (2) | On May 25, 2017, Mr. Young was appointed as a Board Member, effective July 1, 2017. He is a Board Member of each of the Nuveen Funds, except Nuveen Diversified Dividend and Income Fund and Nuveen Real Estate Income Fund. |
| (3) | “Interested person” of the Trust, as defined in the 1940 Act, by reason of her position with Nuveen, LLC. and certain of its subsidiaries. |
| (4) | Officers serve one year terms through August of each year. The year first elected or appointed represents the year in which the officer was first elected or appointed to any fund in the Nuveen Fund Complex. |
| | | | | | | | | | | | | | |
| | | | | | | | |
| | | | |
| | | | | | | | |
| | |
| | Nuveen: | | |
| | | | Serving Investors for Generations | | | | |
| | |
| | | | |
| | | |
| | | | Since 1898, financial advisors and their clients have relied on Nuveen to provide
dependable investment solutions through continued adherence to proven, long-term investing
principles. Today, we offer a range of high quality solutions designed to
be integral components of a well-diversified core portfolio.
| | |
| | | |
| | | | | | |
| | | | |
| | | | | | Focused on meeting investor needs. Nuveen is the investment management arm of TIAA. We have grown into one of the world’s premier global asset managers, with specialist knowledge across all major asset classes and particular strength in solutions that provide income for investors and that draw on our expertise in alternatives and responsible investing. Nuveen is driven not only by the independent investment processes across the firm, but also the insights, risk management, analytics and other tools and resources that a truly world-class platform provides. As a global asset manager, our mission is to work in partnership with our clients to create solutions which help them secure their financial future. | | |
| | | | | |
| | | | | | | | | | |
| | | | | | Find out how we can help you.
To learn more about how the products and services of Nuveen
may be able to help you meet your financial goals, talk to your
financial advisor, or call us at (800) 257-8787. Please read the information
provided carefully before you invest. Investors should consider the
investment objective and policies, risk considerations, charges and
expenses of any investment carefully. Where applicable, be sure to obtain a
prospectus, which contains this and other relevant information. To obtain
a prospectus, please contact your securities representative or Nuveen
, 333 W. Wacker Dr., Chicago, IL 60606. Please read the
prospectus carefully before you invest or send money.
Learn more about Nushares ETFs at: www.nuveen.com/etf
| | |
| | | | | | |
| | | | | | | | | | | | |
| | Securities offered through Nuveen Securities, LLC, member FINRA and SIPC | 333 West Wacker Drive Chicago, IL 60606 | www.nuveen.com | | |
NAN-NSESG-1017D 323287-INV-Y-12/18
ITEM 2. CODE OF ETHICS.
As of the end of the period covered by this report, the registrant has adopted a code of ethics that applies to the registrant’s principal executive officer, principal financial officer, principal accounting officer or controller, or persons performing similar functions. There were no amendments to or waivers from the code during the period covered by this report. The registrant has posted the code of ethics on its website at www.nuveen.com/MutualFunds/ShareholderResources/FundGovernance.aspx. (To view the code, click on Code of Conduct.)
ITEM 3. AUDIT COMMITTEE FINANCIAL EXPERT.
As of the end of the period covered by this report, the registrant’s Board of Directors or Trustees (“Board”) determined that the registrant has at least one “audit committee financial expert” (as defined in Item 3 of Form N-CSR) serving on its Audit Committee. The registrant’s audit committee financial experts are Carole E. Stone and Jack B. Evans, who are “independent” for purposes of Item 3 of Form N-CSR.
Ms. Stone served for five years as Director of the New York State Division of the Budget. As part of her role as Director, Ms. Stone was actively involved in overseeing the development of the State’s operating, local assistance and capital budgets, its financial plan and related documents; overseeing the development of the State’s bond-related disclosure documents and certifying that they fairly presented the State’s financial position; reviewing audits of various State and local agencies and programs; and coordinating the State’s system of internal audit and control. Prior to serving as Director, Ms. Stone worked as a budget analyst/examiner with increasing levels of responsibility over a 30 year period, including approximately five years as Deputy Budget Director. Ms. Stone has also served as Chair of the New York State Racing Association Oversight Board, as Chair of the Public Authorities Control Board, as a Commissioner on the New York State Commission on Public Authority Reform and as a member of the Boards of Directors of several New York State public authorities. These positions have involved overseeing operations and finances of certain entities and assessing the adequacy of project/entity financing and financial reporting. Currently, Ms. Stone is on the Board of Directors of CBOE Holdings, Inc., of the Chicago Board Options Exchange, and of C2 Options Exchange. Ms. Stone’s position on the boards of these entities and as a member of both CBOE Holdings’ Audit Committee and its Finance Committee has involved, among other things, the oversight of audits, audit plans and preparation of financial statements.
Mr. Evans was formerly President and Chief Operating Officer of SCI Financial Group, Inc., a full service registered broker-dealer and registered investment adviser (“SCI”). As part of his role as President and Chief Operating Officer, Mr. Evans actively supervised the Chief Financial Officer (the “CFO”) and actively supervised the CFO’s preparation of financial statements and other filings with various regulatory authorities. In such capacity, Mr. Evans was actively involved in the preparation of SCI’s financial statements and the resolution of issues raised in connection therewith. Mr. Evans has also served on the audit committee of various reporting companies. At such companies, Mr. Evans was involved in the oversight of audits, audit plans, and the preparation of financial statements. Mr. Evans also formerly chaired the audit committee of the Federal Reserve Bank of Chicago.
ITEM 4. PRINCIPAL ACCOUNTANT FEES AND SERVICES.
The following tables show the amount of fees that KPMG LLP, the Funds’ auditor, billed for services provided to the Funds during the Funds’ last two full fiscal years. The Audit Committee approved in advance all audit services and non-audit services that KPMG LLP provided to the Funds, except for those non-audit services that were subject to the pre-approval exception under Rule 2-01 of Regulation S-X (the “pre-approval exception”). The preapproval exception for services provided directly to the Funds waives the pre-approval requirement for services other than audit, review or attest services if: (A) the aggregate amount of all such services provided constitutes no more than 5% of the total amount of revenues paid during the fiscal year in which the services are provided; (B) the Funds did not recognize the services as non-audit services at the time of the engagement; and (C) the services are promptly brought to the Audit Committee’s attention, and the Committee (or its delegate) approves the services before the audit is completed.
The Audit Committee has delegated certain pre-approval responsibilities to its Chairman (or, in his absence, any other member of the Audit Committee).
| | | | | | | | | | | | | | | | |
Fiscal Year Ended October 31, 2017 | | Audit Fees Billed
to Funds 1 | | | Audit-Related Fees
Billed to Funds 2 | | | Tax Fees
Billed to Funds 3 | | | All Other Fees
Billed to Funds 4 | |
Fund Name | | | | | | | | | | | | | | | | |
NuShares ESG International Developed Markets Equity ETF5 | | | 17,500 | | | | 0 | | | | 0 | | | | 0 | |
NuShares ESG Emerging Markets Equity ETF5 | | | 17,500 | | | | 0 | | | | 0 | | | | 0 | |
NuShares ESG Large-Cap Growth ETF6 | | | 15,500 | | | | 0 | | | | 0 | | | | 0 | |
NuShares ESG Large-Cap Value ETF6 | | | 15,500 | | | | 0 | | | | 0 | | | | 0 | |
NuShares ESG Mid-Cap Growth ETF6 | | | 15,500 | | | | 0 | | | | 0 | | | | 0 | |
NuShares ESG Mid-Cap Value ETF6 | | | 15,500 | | | | 0 | | | | 0 | | | | 0 | |
NuShares ESG Small-Cap ETF6 | | | 15,500 | | | | 0 | | | | 0 | | | | 0 | |
| | | | | | | | | | | | | | | | |
Total | | $ | 112,500 | | | $ | 0 | | | $ | 0 | | | $ | 0 | |
| 1 | | “Audit Fees” are the aggregate fees billed for professional services for the audit of the Fund’s annual financial statements and services provided in connection with statutory and regulatory filings or engagements. |
| 2 | | “Audit-Related Fees” are the aggregate fees billed for assurance and related services reasonably related to the performance of the audit or review of financial statements that are not reported under “Audit Fees”. These fees include offerings related to the Fund’s common shares and leverage. |
| 3 | | “Tax Fees” are the aggregate fees billed for professional services for tax advice, tax compliance, and tax planning. These fees include: all global withholding tax services; excise and state tax reviews; capital gain, tax equalization and taxable basis calculations performed by the principal accountant. |
| 4 | | “All Other Fees” are the aggregate fees billed for products and services other than “Audit Fees”, “Audit-Related Fees” and “Tax Fees”. These fees represent all “Agreed-Upon Procedures” engagements pertaining to the Fund’s use of leverage. |
| 5 | | Fund commenced operations on 06/06/2017. |
| 6 | | Fund commenced operations on 12/14/2016. |
| | | | | | | | | | | | | | | | |
| | | Percentage Approved Pursuant to Pre-approval Exception | |
| | | Audit Fees Billed
to Funds | | | Audit-Related Fees
Billed to Funds | | | Tax Fees
Billed to Funds | | | All Other Fees
Billed to Funds | |
Fund Name | | | | | | | | | | | | | | | | |
NuShares ESG International Developed Markets Equity ETF | | | 0 | % | | | 0 | % | | | 0 | % | | | 0 | % |
NuShares ESG Emerging Markets Equity ETF | | | 0 | % | | | 0 | % | | | 0 | % | | | 0 | % |
NuShares ESG Large-Cap Growth ETF | | | 0 | % | | | 0 | % | | | 0 | % | | | 0 | % |
NuShares ESG Large-Cap Value ETF | | | 0 | % | | | 0 | % | | | 0 | % | | | 0 | % |
NuShares ESG Mid-Cap Growth ETF | | | 0 | % | | | 0 | % | | | 0 | % | | | 0 | % |
NuShares ESG Mid-Cap Value ETF | | | 0 | % | | | 0 | % | | | 0 | % | | | 0 | % |
NuShares ESG Small-Cap ETF | | | 0 | % | | | 0 | % | | | 0 | % | | | 0 | % |
| | | | |
Fiscal Year Ended
October 31, 2016 | | Audit Fees Billed
to Funds 1 | | | Audit-Related Fees
Billed to Funds 2 | | | Tax Fees
Billed to Funds 3 | | | All Other Fees
Billed to Funds 4 | |
Fund Name | | | | | | | | | | | | | | | | |
NuShares ESG International Developed Markets Equity ETF5 | | | 0 | | | | 0 | | | | 0 | | | | 0 | |
NuShares ESG Emerging Markets Equity ETF5 | | | 0 | | | | 0 | | | | 0 | | | | 0 | |
NuShares ESG Large-Cap Growth ETF6 | | | 0 | | | | 0 | | | | 0 | | | | 0 | |
NuShares ESG Large-Cap Value ETF6 | | | 0 | | | | 0 | | | | 0 | | | | 0 | |
NuShares ESG Mid-Cap Growth ETF6 | | | 0 | | | | 0 | | | | 0 | | | | 0 | |
NuShares ESG Mid-Cap Value ETF6 | | | 0 | | | | 0 | | | | 0 | | | | 0 | |
NuShares ESG Small-Cap ETF6 | | | 0 | | | | 0 | | | | 0 | | | | 0 | |
| | | | | | | | | | | | | | | | |
Total | | $ | 0 | | | $ | 0 | | | $ | 0 | | | $ | 0 | |
| 1 | | “Audit Fees” are the aggregate fees billed for professional services for the audit of the Fund’s annual financial statements and services provided in connection with statutory and regulatory filings or engagements. |
| 2 | | “Audit-Related Fees” are the aggregate fees billed for assurance and related services reasonably related to the performance of the audit or review of financial statements that are not reported under “Audit Fees”. These fees include offerings related to the Fund’s common shares and leverage. |
| 3 | | “Tax Fees” are the aggregate fees billed for professional services for tax advice, tax compliance, and tax planning. These fees include: all global withholding tax services; excise and state tax reviews; capital gain, tax equalization and taxable basis calculations performed by the principal accountant. |
| 4 | | “All Other Fees” are the aggregate fees billed for products and services other than “Audit Fees”, “Audit-Related Fees” and “Tax Fees”. These fees represent all “Agreed-Upon Procedures” engagements pertaining to the Fund’s use of leverage. |
| 5 | | Fund commenced operations on 06/06/2017. |
| 6 | | Fund commenced operations on 12/14/2016. |
| | | | | | | | | | | | | | | | |
| | | Percentage Approved Pursuant to Pre-approval Exception | |
| | | Audit Fees Billed
to Funds | | | Audit-Related Fees
Billed to Funds | | | Tax Fees Billed
to Funds | | | All Other Fees
Billed to Funds | |
Fund Name | | | | | | | | | | | | | | | | |
NuShares ESG International Developed Markets Equity ETF | | | 0 | % | | | 0 | % | | | 0 | % | | | 0 | % |
NuShares ESG Emerging Markets Equity ETF | | | 0 | % | | | 0 | % | | | 0 | % | | | 0 | % |
NuShares ESG Large-Cap Growth ETF | | | 0 | % | | | 0 | % | | | 0 | % | | | 0 | % |
NuShares ESG Large-Cap Value ETF | | | 0 | % | | | 0 | % | | | 0 | % | | | 0 | % |
NuShares ESG Mid-Cap Growth ETF | | | 0 | % | | | 0 | % | | | 0 | % | | | 0 | % |
NuShares ESG Mid-Cap Value ETF | | | 0 | % | | | 0 | % | | | 0 | % | | | 0 | % |
NuShares ESG Small-Cap ETF | | | 0 | % | | | 0 | % | | | 0 | % | | | 0 | % |
| | | | | | | | | | | | |
Fiscal Year Ended October 31, 2017 | | Audit-Related Fees
Billed to Adviser and
Affiliated Fund
Service Providers | | | Tax Fees Billed to
Adviser and
Affiliated Fund
Service Providers | | | All Other Fees
Billed to Adviser
and Affiliated Fund
Service Providers | |
NuShares ETF Trust | | $ | 0 | | | $ | 0 | | | $ | 0 | |
| |
| | | Percentage Approved Pursuant to Pre-approval Exception | |
| | | Audit-Related Fees
Billed to Adviser and
Affiliated Fund
Service Providers | | | Tax Fees Billed to
Adviser and
Affiliated Fund
Service Providers | | | All Other Fees
Billed to Adviser
and Affiliated Fund
Service Providers | |
| | | 0% | | | 0% | | | 0% | |
| | | |
Fiscal Year Ended October 31, 2016 | | Audit-Related Fees
Billed to Adviser and
Affiliated Fund
Service Providers | | | Tax Fees Billed to
Adviser and
Affiliated Fund
Service Providers | | | All Other Fees
Billed to Adviser
and Affiliated Fund
Service Providers | |
NuShares ETF Trust | | $ | 0 | | | $ | 0 | | | $ | 0 | |
| |
| | | Percentage Approved Pursuant to Pre-approval Exception | |
| | | Audit-Related Fees
Billed to Adviser and
Affiliated Fund
Service Providers | | | Tax Fees Billed to
Adviser and
Affiliated Fund
Service Providers | | | All Other Fees
Billed to Adviser
and Affiliated Fund
Service Providers | |
| | | 0% | | | 0% | | | 0% | |
| | | | | | | | | | | | | | | | |
Fiscal Year Ended October 31, 2017 | | Total Non-Audit Fees
Billed to Trust | | | Total Non-Audit Fees
billed to Adviser and
Affiliated Fund Service
Providers (engagements
related directly to the
operations and financial
reporting of the Trust) | | | Total Non-Audit Fees
billed to Adviser and
Affiliated Fund Service
Providers (all other
engagements) | | | Total | |
Fund Name | | | | | | | | | | | | | | | | |
NuShares ESG International Developed Markets Equity ETF | | | 0 | | | | 0 | | | | 0 | | | | 0 | |
NuShares ESG Emerging Markets Equity ETF | | | 0 | | | | 0 | | | | 0 | | | | 0 | |
NuShares ESG Large-Cap Growth ETF | | | 0 | | | | 0 | | | | 0 | | | | 0 | |
NuShares ESG Large-Cap Value ETF | | | 0 | | | | 0 | | | | 0 | | | | 0 | |
NuShares ESG Mid-Cap Growth ETF | | | 0 | | | | 0 | | | | 0 | | | | 0 | |
NuShares ESG Mid-Cap Value ETF | | | 0 | | | | 0 | | | | 0 | | | | 0 | |
NuShares ESG Small-Cap ETF | | | 0 | | | | 0 | | | | 0 | | | | 0 | |
| | | | | | | | | | | | | | | | |
Total | | $ | 0 | | | $ | 0 | | | $ | 0 | | | $ | 0 | |
“Non-Audit Fees billed to Fund” for both fiscal year ends represent “Tax Fees” and “All Other Fees” billed to Fund in their respective amounts from the previous table.
Less than 50 percent of the hours expended on the principal accountant’s engagement to audit the registrant’s financial statements for the most recent fiscal year were attributed to work performed by persons other than the principal accountant’s full-time, permanent employees.
| | | | | | | | | | | | | | | | |
Fiscal Year Ended October 31, 2016 | | Total Non-Audit Fees
Billed to Trust | | | Total Non-Audit Fees
billed to Adviser and
Affiliated Fund Service
Providers (engagements
related directly to the
operations and financial
reporting of the Trust) | | | Total Non-Audit Fees
billed to Adviser and
Affiliated Fund
Service Providers (all
other engagements) | | | Total | |
Fund Name | | | | | | | | | | | | | | | | |
NuShares ESG International Developed Markets Equity ETF | | | 0 | | | | 0 | | | | 0 | | | | 0 | |
NuShares ESG Emerging Markets Equity ETF | | | 0 | | | | 0 | | | | 0 | | | | 0 | |
NuShares ESG Large-Cap Growth ETF | | | 0 | | | | 0 | | | | 0 | | | | 0 | |
NuShares ESG Large-Cap Value ETF | | | 0 | | | | 0 | | | | 0 | | | | 0 | |
NuShares ESG Mid-Cap Growth ETF | | | 0 | | | | 0 | | | | 0 | | | | 0 | |
NuShares ESG Mid-Cap Value ETF | | | 0 | | | | 0 | | | | 0 | | | | 0 | |
NuShares ESG Small-Cap ETF | | | 0 | | | | 0 | | | | 0 | | | | 0 | |
| | | | | | | | | | | | | | | | |
Total | | $ | 0 | | | $ | 0 | | | $ | 0 | | | $ | 0 | |
“Non-Audit Fees billed to Fund” for both fiscal year ends represent “Tax Fees” and “All Other Fees” billed to Fund in their respective amounts from the previous table.
Audit Committee Pre-Approval Policies and Procedures. Generally, the Audit Committee must approve (i) all non-audit services to be performed for the Funds by the Funds’ independent accountant and (ii) all audit and non-audit services to be performed by the Funds’ independent accountant for the Affiliated Fund Service Providers with respect to the operations and financial reporting of the Funds. Regarding tax and research projects conducted by the independent accountant for the Funds and Affiliated Fund Service Providers (with respect to operations and financial reports of the Trust), such engagements will be (i) pre-approved by the Audit Committee if they are expected to be for amounts greater than $10,000; (ii) reported to the Audit Committee Chairman for his verbal approval prior to engagement if they are expected to be for amounts under $10,000 but greater than $5,000; and (iii) reported to the Audit Committee at the next Audit Committee meeting if they are expected to be for an amount under $5,000.
ITEM 5. AUDIT COMMITTEE OF LISTED REGISTRANTS.
The registrant is an issuer as defined in Rule 10A-3 under the Securities Exchange Act of 1934 (the “Exchange Act”). The registrant’s Board has a separately designated Audit Committee established in accordance with Section 3(a)(58)A of the Exchange Act. As of the end of the period covered by this report the members of the Audit Committee are Jack B. Evans, David J. Kundert, John K. Nelson, Carole E. Stone and Terence J. Toth.
ITEM 6. SCHEDULE OF INVESTMENTS.
| a) | | See Portfolio of Investments in Item 1. |
ITEM 7. DISCLOSURE OF PROXY VOTING POLICIES AND PROCEDURES FOR CLOSED-END
MANAGEMENT INVESTMENT COMPANIES.
Not applicable to this registrant.
ITEM 8. PORTFOLIO MANAGERS OF CLOSED-END MANAGEMENT INVESTMENT COMPANIES.
Not applicable to this registrant.
ITEM 9. PURCHASES OF EQUITY SECURITIES BY CLOSED-END MANAGEMENT INVESTMENT COMPANY AND AFFILIATED PURCHASERS.
Not applicable to this registrant.
ITEM 10. SUBMISSION OF MATTERS TO A VOTE OF SECURITY HOLDERS.
There have been no material changes to the procedures by which shareholders may recommend nominees to the registrant’s Board of Trustees implemented after the registrant last provided disclosure in response to this Item.
ITEM 11. CONTROLS AND PROCEDURES.
| | (a) | | The registrant’s principal executive and principal financial officers, or persons performing similar functions, have concluded that the registrant’s disclosure controls and procedures (as defined in Rule 30a-3(c) under the Investment Company Act of 1940, as amended (the “1940 Act”) (17 CFR 270.30a-3(c))) are effective, as of a date within 90 days of the filing date of this report that includes the disclosure required by this paragraph, based on their evaluation of the controls and procedures required by Rule 30a-3(b) under the 1940 Act (17 CFR 270.30a-3(b)) and Rules 13a-15(b) or 15d-15(b) under the Securities Exchange Act of 1934, as amended (the “Exchange Act”) (17 CFR 240.13a-15(b) or 240.15d-15(b)). |
| | (b) | | There were no changes in the registrant’s internal control over financial reporting (as defined in Rule 30a-3(d) under the 1940 Act (17 CFR 270.30a-3(d)) that occurred during the second fiscal quarter of the period covered by this report that has materially affected, or is reasonably likely to materially affect, the registrant’s internal control over financial reporting. |
ITEM 12. EXHIBITS.
File the exhibits listed below as part of this Form.
| | |
| (a)(1) | | Any code of ethics, or amendment thereto, that is the subject of the disclosure required by Item 2, to the extent that the registrant intends to satisfy the Item 2 requirements through filing of an exhibit: Not applicable because the code is posted on registrant’s website at www.nuveen.com/MutualFunds/ShareholderResources/FundGovernance.aspx and there were no amendments during the period covered by this report. (To view the code, click on Code of Conduct.) |
| |
| (a)(2) | | A separate certification for each principal executive officer and principal financial officer of the registrant as required by Rule 30a-2(a) under the 1940 Act (17 CFR 270.30a-2(a)) in the exact form set forth below: See EX-99.CERT attached hereto. |
| |
| (a)(3) | | Any written solicitation to purchase securities under Rule 23c-1 under the 1940 Act (17 CFR 270.23c-1) sent or given during the period covered by the report by or on behalf of the registrant to 10 or more persons: Not applicable to this registrant. |
| |
| (b) | | If the report is filed under Section 13(a) or 15(d) of the Exchange Act, provide the certifications required by Rule 30a-2(b) under the 1940 Act (17 CFR 270.30a-2(b)), Rule 13a-14(b) or Rule 15d-14(b) under the Exchange Act (17 CFR 240.13a-14(b) or 240.15d-14(b)), and Section 1350 of Chapter 63 of Title 18 of the United States Code (18 U.S.C. 1350) as an Exhibit. A certification furnished pursuant to this paragraph will not be deemed “filed” for purposes of Section 18 of the Exchange Act (15 U.S.C. 78r), or otherwise subject to the liability of that section. Such certification will not be deemed to be incorporated by reference into any filing under the Securities Act of 1933 or the Exchange Act, except to the extent that the registration specifically incorporates it by reference: See EX-99.906 CERT attached hereto. |
SIGNATURES
Pursuant to the requirements of the Securities Exchange Act of 1934 and the Investment Company Act of 1940, the registrant has duly caused this report to be signed on its behalf by the undersigned, thereunto duly authorized.
(Registrant) NuShares ETF Trust
| | |
| |
| By (Signature and Title) | | /s/ Christopher M. Rohrbacher |
| | Christopher M. Rohrbacher |
| | Vice President and Secretary |
Date: January 8, 2018
Pursuant to the requirements of the Securities Exchange Act of 1934 and the Investment Company Act of 1940, this report has been signed below by the following persons on behalf of the registrant and in the capacities and on the dates indicated.
| | |
| |
| By (Signature and Title) | | /s/ Martin Kremenstein |
| | Martin Kremenstein |
| | Chief Administrative Officer |
| | (principal executive officer) |
Date: January 8, 2018
| | |
| |
| By (Signature and Title) | | /s/ Stephen D. Foy |
| | Stephen D. Foy |
| | Vice President and Controller |
| | (principal financial officer) |
Date: January 8, 2018