UNITED STATES
SECURITIES AND EXCHANGE COMMISSION
Washington, D.C. 20549
FORM N-CSR
CERTIFIED SHAREHOLDER REPORT OF REGISTERED MANAGEMENT
INVESTMENT COMPANIES
Investment Company Act file number 811-23161
NuShares ETF Trust
(Exact name of registrant as specified in charter)
Nuveen Investments
333 West Wacker Drive, Chicago, IL 60606
(Address of principal executive offices) (Zip code)
Christopher M. Rohrbacher
Nuveen Investments
333 West Wacker Drive
Chicago, IL 60606
(Name and address of agent for service)
Registrant’s telephone number, including area code: (312) 917-7700
Date of fiscal year end: October 31
Date of reporting period: October 31, 2018
Form N-CSR is to be used by management investment companies to file reports with the Commission not later than 10 days after the transmission to stockholders of any report that is required to be transmitted to stockholders under Rule 30e-1 under the Investment Company Act of 1940 (17 CFR 270.30e-1). The Commission may use the information provided on Form N-CSR in its regulatory, disclosure review, inspection, and policy making roles.
A registrant is required to disclose the information specified by Form N-CSR, and the Commission will make this information public. A registrant is not required to respond to the collection of information contained in Form N-CSR unless the Form displays a currently valid Office of Management and Budget (“OMB”) control number. Please direct comments concerning the accuracy of the information collection burden estimate and any suggestions for reducing the burden to Secretary, Securities and Exchange Commission, 450 Fifth Street, NW, Washington, DC 20549-0609. The OMB has reviewed this collection of information under the clearance requirements of 44 U.S.C. ss.3507.
ITEM 1. REPORTS TO STOCKHOLDERS.

| | | | |
| Fund Name | | Listing Exchange | | Ticker Symbol |
| Nushares ESG Emerging Markets Equity ETF | | Cboe BZX Exchange, Inc. | | NUEM |
| Nushares ESG International Developed Markets Equity ETF | | Cboe BZX Exchange, Inc. | | NUDM |
| Nushares ESG Large-Cap Growth ETF | | Cboe BZX Exchange, Inc. | | NULG |
| Nushares ESG Large-Cap Value ETF | | Cboe BZX Exchange, Inc. | | NULV |
| Nushares ESG Mid-Cap Growth ETF | | Cboe BZX Exchange, Inc. | | NUMG |
| Nushares ESG Mid-Cap Value ETF | | Cboe BZX Exchange, Inc. | | NUMV |
| Nushares ESG Small-Cap ETF | | Cboe BZX Exchange, Inc. | | NUSC |
Annual Report
Life is Complex.
Nuveen makes things e-simple.
It only takes a minute to sign up for e-Reports. Once enrolled, you’ll receive an e-mail as soon as your Nuveen Fund information is ready. No more waiting for delivery by regular mail. Just click on the link within the e-mail to see the report and save it on your computer if you wish.
Free e-Reports right to your email!
www.investordelivery.com
If you receive your Nuveen Fund distributions and statements from your financial advisor or brokerage account.
or
www.nuveen.com/client-access
If you receive your Nuveen Fund distributions and statements directly from Nuveen.
Must be preceded by or accompanied by a prospectus.
NOT FDIC INSURED MAY LOSE VALUE NO BANK GUARANTEE

Table
of Contents
3
Chairman’s Letter to Shareholders

Dear Shareholders,
I am honored to serve as the new independent chairman of the Nuveen Fund Board, effective July 1, 2018. I’d like to gratefully acknowledge the stewardship of my predecessor William J. Schneider and, on behalf of my fellow Board members, reinforce our commitment to the legacy of strong, independent oversight of your Funds.
If stock markets are forward-looking, then the recently elevated volatility suggests the consensus view is changing. Rising interest rates, moderating corporate earnings growth prospects and unpredictable geopolitical events including trade wars and Brexit have clouded the horizon. With economic growth in China and Europe already slowing this year, and U.S. growth possibly peaking, investors are watching for clues as to the global economy’s resilience amid these headwinds.
However, it’s important to remember that interim market swings may not reflect longer-term economic conditions. Global growth is indeed slowing, but it’s still positive. The U.S. economy remains strong, even in the face of late-cycle pressures. Low unemployment and firming wages should continue to support consumer spending, and the November mid-term elections resulted in no major surprises. In China, the government remains committed to using fiscal stimulus to offset softening exports. Europe also remains vulnerable to trade policy, but European corporate earnings have remained healthy and their central bank has reaffirmed its commitment to a gradual stimulus withdrawal. In a slower growth environment, there are opportunities for investors who seek them more selectively.
A more challenging landscape can distract you from your investment goals. But you can maintain long-term perspective by setting realistic expectations about short-term volatility and working with your financial advisor to evaluate your goals, timeline and risk tolerance. On behalf of the other members of the Nuveen Fund Board, we look forward to continuing to earn your trust in the months and years ahead.
Sincerely,

Terence J. Toth
Chairman of the Board
December 21, 2018
4
Portfolio Managers’ Comments
Nushares ESG Emerging Markets Equity ETF (NUEM)
Nushares ESG International Developed Markets Equity ETF (NUDM)
Nushares ESG Large-Cap Growth ETF (NULG)
Nushares ESG Large-Cap Value ETF (NULV)
Nushares ESG Mid-Cap Growth ETF (NUMG)
Nushares ESG Mid-Cap Value ETF (NUMV)
Nushares ESG Small-Cap ETF (NUSC)
These Funds features portfolio management by Teachers Advisors, LLC, an affiliate of Nuveen, LLC. Portfolio managers Philip James (Jim) Campagna, CFA, and Lei Liao, CFA, discuss U.S. economic and market conditions, key investment strategies and the performance of the Funds during the twelve-month reporting period. Jim and Lei have managed the Funds since their commencement of operations on December 13, 2016. For the Nushares ESG International Developed Markets Equity ETF (NUDM) and Nushares ESG Emerging Markets Equity ETF (NUEM), portfolio managers Philip James (Jim) Campagna, CFA, and Lei Liao, CFA, have managed these Funds since the Funds’ commencement of operations on June 6, 2017.
What factors affected the U.S. economy and the U.S. stock market during the twelve-month annual reporting period ended October 31, 2018?
The U.S. economy accelerated in this reporting period, with gross domestic product (GDP) growth reaching 4.2% (annualized) in the second quarter of 2018, the fastest pace since 2014, then receding to a still relatively robust 3.5% annualized rate in the third quarter of 2018, according to the Bureau of Economic Analysis “second” estimate. GDP is the value of goods and services produced by the nation’s economy less the value of the goods and services used up in production, adjusted for price changes. The boost in economic activity during the second quarter of 2018 was attributed to robust spending by consumers, businesses and the government, as well as a temporary increase in exports, as farmers rushed soybean shipments ahead of China’s retaliatory tariffs. While consumer and government spending continued to drive economic growth in the third quarter, the export contribution declined as expected and both business spending and housing investment weakened.
Consumer spending, the largest driver of the economy, remained well supported by low unemployment, wage gains and tax cuts. As reported by the Bureau of Labor Statistics, the unemployment rate fell to 3.7% in October 2018 from 4.1% in October 2017 and job gains averaged around 210,000 per month for the past twelve months. The jobs market has continued to tighten, while average hourly earnings grew at an annualized rate of 3.1% in October 2018. The Consumer Price Index (CPI) increased 2.5% over the twelve-month reporting period ended October 31, 2018 on a seasonally adjusted basis, as reported by the Bureau of Labor Statistics.
Low mortgage rates and low inventory drove home prices higher during this recovery cycle. But the price momentum slowed in recent months as mortgage rates began to drift higher and homes have become less affordable. The S&P CoreLogic Case-Shiller U.S. National Home Price Index, which covers all nine U.S. census divisions, was up 5.5% in September 2018 (most recent data available at the time this report was prepared). The 10-City and 20-City Composites reported year-over-year increases of 4.8% and 5.1%, respectively.
This material is not intended to be a recommendation or investment advice, does not constitute a solicitation to buy or sell securities, and is not provided in a fiduciary capacity. The information provided does not take into account the specific objectives or circumstances of any particular investor, or suggest any specific course of action. Investment decisions should be made based on an investor’s objectives and circumstances and in consultation with his or her advisors.
Certain statements in this report are forward-looking statements. Discussions of specific investments are for illustration only and are not intended as recommendations of individual investments. The forward-looking statements and other views expressed herein are those of the portfolio managers as of the date of this report. Actual future results or occurrences may differ significantly from those anticipated in any forward-looking statements and the views expressed herein are subject to change at any time, due to numerous market and other factors. Each Fund disclaims any obligation to update publicly or revise any forward-looking statements or views expressed herein.
Refer to the Glossary of Terms Used in this report for further definition of the terms used within this section.
5
Portfolio Managers’ Comments (continued)
With the U.S. economy delivering a sustainable growth rate and employment strengthening, the Federal Reserve’s (Fed) policy making committee continued to incrementally raise its main benchmark interest rate. The most recent increase, in September 2018, was the third rate hike in 2018 to date and the eighth rate hike since December 2015. Fed Chair Janet Yellen’s term expired in February 2018, and incoming Chairman Jerome Powell indicated he would likely maintain the Fed’s gradual pace of interest rate hikes. The September 2018 meeting confirmed the market’s expectations of another increase in December 2018 (subsequent to the close of the reporting period, there was an interest rate increase on December 19, 2018), followed by additional increases in 2019. Notably, the Fed’s statement dropped “accommodative” from the description of its monetary policy, which Chairman Powell explained did not represent a change in the course of policy but rather an acknowledgement of the strengthening economy. Additionally, the Fed continued reducing its balance sheet by allowing a small amount of maturing Treasury and mortgage securities to roll off each month without reinvestment.
During the twelve-month reporting period, geopolitical news remained a prominent market driver. The U.S. moved forward with tariffs on imported goods from China, as well as on steel and aluminum from Canada, Mexico and Europe. These countries announced retaliatory measures in kind, intensifying concerns about a trade war, although there have been some positive developments. In July 2018, the U.S. and the European Union announced they would refrain from further tariffs while they negotiate trade terms, and in October 2018, the U.S., Mexico and Canada agreed to a new trade deal to replace the North American Free Trade Agreement. The U.S. and China resumed trade negotiations in August 2018, but the talks yielded little progress and President Trump subsequently mentioned imposing tariffs on the balance of Chinese goods. Brexit negotiations made modest progress, but the Irish border remained a sticking point and Prime Minister Theresa May was expected to face difficulty getting a plan approved in Parliament. Elsewhere in Europe, markets remained nervous about Italy’s new euroskeptic coalition government, immigration policy and political risk in Turkey. The U.S. Treasury issued additional sanctions on Russia in April 2018 and re-imposed sanctions on Iran following the U.S. withdrawal from the 2015 nuclear agreement. Bearish crude oil supply news, along with heightened tensions between the U.S. and Saudi Arabia after the disappearance of a Saudi journalist, drove oil price volatility. On the Korean peninsula, the leaders of South Korea and North Korea met during April 2018 and jointly announced a commitment toward peace, while the U.S.-North Korea summit yielded an agreement with few additional details.
Despite mounting geopolitical worries and trade war risks during the twelve-month reporting period, U.S. stocks were buoyed by favorable macroeconomic data and strong corporate earnings and sales growth reports. However, volatility increased significantly in the last month of the reporting period, as investors were spooked by waning global growth, rising interest rates and weaker outlooks from company managements.
What key strategies were used to manage the Funds during the twelve-month reporting period and how did these strategies influence performance?
These Funds employ a passive management (or “indexing”) approach, seeking to track the investment results, before fees and expenses, of their respective indexes that meet certain environment, social and governance (“ESG”) criteria. You cannot invest directly in an index. Each Fund seeks to track its index by investing all, or substantially all, of its assets in the securities represented in its index in approximately the same proportions as the index. Each Fund rebalances its holdings quarterly in response to the quarterly rebalance of its index, which occurs in February, May, August and November.
NUEM seeks to track the investment results, before fees and expenses, of the TIAA ESG Emerging Markets Equity Index (the “NUEM Index”), which is comprised solely of listed equity securities issued by companies (and depositary receipts representing such securities) located in countries with emerging markets that meet certain ESG criteria. The NUEM Index selects from the securities included in the MSCI Emerging Markets Index (the “NUEM Base Index”), which currently consists of large- and mid-capitalization companies located in one of the following 24 emerging market countries: Brazil, Chile, China, Colombia, Czech Republic, Egypt, Greece, Hungary, India, Indonesia, Korea, Malaysia, Mexico, Pakistan, Peru, Philippines, Poland, Qatar, Russia, South Africa, Taiwan, Thailand, Turkey and the United Arab Emirates.
NUDM seeks to track the investment results, before fees and expenses, of the TIAA ESG International Developed Markets Equity Index (the “NUDM Index”), which is comprised solely of listed equity securities issued by companies (and depositary receipts representing such securities) located in countries with developed markets, excluding the United States and Canada, that meet certain ESG criteria. The NUDM Index selects from the securities included in the MSCI EAFE Index (the “NUDM Base Index”), which currently consists of large- and mid-capitalization companies located in one of the following 21 developed market countries: Australia, Austria, Belgium, Denmark, Finland, France, Germany, Hong Kong, Ireland, Israel, Italy, Japan, the Netherlands, New Zealand, Norway, Portugal, Singapore, Spain, Sweden, Switzerland and the United Kingdom.
6
NULG seeks to track the investment results, before fees and expenses, of the TIAA ESG USA Large-Cap Growth Index (the “NULG Index”), which is comprised of equity securities issued by large-capitalization companies listed on U.S. exchanges that meet certain ESG criteria. The NULG Index selects from the securities included in the MSCI USA Growth Index (the “NULG Base Index”), which generally consists of large- and mid-capitalization U.S. equity securities that exhibit overall growth style characteristics based on five variables: long-term forward earnings per share (“EPS”) growth rate, short-term forward EPS growth rate, current internal growth rate, long-term historical EPS growth trend, and long-term historical sales per share growth trend.
NULV seeks to track the investment results, before fees and expenses, of the TIAA ESG USA Large-Cap Value Index (the “NULV Index”), which is comprised of equity securities issued by large-capitalization companies listed on U.S. exchanges that meet certain ESG criteria. The NULV Index selects from the securities included in the MSCI USA Value Index (the “NULV Base Index”), which generally consists of large- and mid-capitalization U.S. equity securities that exhibit overall value style characteristics based on three variables: book value to price, 12-month forward earnings to price and dividend yield.
NUMG seeks to track the investment results, before fees and expenses, of the TIAA ESG USA Mid-Cap Growth Index (the “NUMG Index”), which is comprised of equity securities issued by mid-capitalization companies listed on U.S. exchanges that meet certain ESG criteria. The NUMG Index selects from the securities included in the MSCI USA Mid-Cap Growth Index (the “NUMG Base Index”), which generally consists of mid-capitalization U.S. equity securities that exhibit overall growth style characteristics based on five variables: long-term forward EPS growth rate, short-term forward EPS growth rate, current internal growth rate, long-term historical EPS growth trend and long-term historical sales per share growth trend.
NUMV seeks to track the investment results, before fees and expenses, of the TIAA ESG USA Mid-Cap Value Index (the “NUMV Index”), which is comprised of equity securities issued by mid-capitalization companies listed on U.S. exchanges that meet certain ESG criteria. The NUMV Index selects from the securities included in the MSCI USA Mid-Cap Value Index (the “NUMV Base Index”), which generally consists of mid-capitalization U.S. equity securities that exhibit overall value style characteristics based on three variables: book value to price, 12-month forward earnings to price and dividend yield.
NUSC seeks to track the investment results, before fees and expenses, of the TIAA ESG USA Small-Cap Index (the “NUSC Index”), which is comprised of equity securities issued by small-capitalization companies listed on U.S. exchanges that meet certain ESG criteria. The NUSC Index selects from the securities included in the MSCI USA Small Cap Index (the “NUSC Base Index”), which generally consists of equity securities that comprise the small-cap segment of the U.S. market.
MSCI Inc. (“MSCI”) is the index provider for each Index and Base Index. Each Index and Base Index are owned, calculated and controlled by MSCI, in its sole discretion. Neither the sub-adviser nor its affiliates has any discretion to select Index components or change the Index methodology. Each Index identifies equity securities from its Base Index that satisfy certain ESG criteria, based on ESG performance data collected by MSCI ESG Research, Inc. ESG performance is measured on an industry-specific basis, with assessment categories varying by industry.
During the twelve-month reporting period, equity market performance diverged widely by geography. U.S. stocks were generally positive, while non-U.S. stocks across both developed and emerging markets declined. Within the U.S., large-cap growth stocks were the top-performing segment, followed by mid-cap growth, large-cap value, small caps, and a small gain in mid-cap value. Accordingly, across the U.S. Funds, NULG delivered the largest absolute return over the reporting period and NUMV had the smallest absolute return.
Emerging market stocks were the weakest performers during the twelve-month reporting period, as tightening financial conditions, trade war concerns and a number of idiosyncratic issues increased risk aversion among investors. International developed markets also ended the reporting period lower due to mixed economic data and an outlook clouded by trade and political issues. Both NUEM and NUDM posted losses for the reporting period.
How did the Funds perform in the twelve-month reporting period ended October 31, 2018?
The tables in each Fund’s Performance Overview and Expense Ratios section of this report provides the Funds’ total return performance for the one-year and since inception periods through October 31, 2018. Each Fund’s total returns at net asset value (NAV) are compared with the performance of the Index, which each Fund is designed to track.
The total return for each Fund underperformed its respective Index during the reporting period. The trailing performance is primarily attributable to fees and expenses. The Indexes are unmanaged and therefore their returns do not reflect any fees or expenses, which would detract from their performance. You cannot invest directly in an index.
7
Risk Considerations
Nushares ESG Emerging Markets Equity ETF (NUEM)
Investing involves risk; principal loss is possible. There is no guarantee the Fund’s investment objectives will be achieved. This ETF seeks to generally track the investment results of an index; however the Fund may underperform, outperform or be more volatile than the referenced index. Non-U.S. investments involve risks such as currency fluctuation, political and economic instability, lack of liquidity and differing legal and accounting standards. These risks are magnified in emerging markets. In addition, because the Index selects securities for inclusion based on environmental, social, and governance (ESG) criteria, the Fund may forgo some market opportunities available to funds that don’t use these criteria. A portfolio concentrated in a single industry sector or country may present more risk than a portfolio broadly diversified over several industries or countries. These and other risks, such as mid-cap stock risk, are described in the Fund’s prospectus.
Nushares ESG International Developed Markets Equity ETF (NUDM)
Investing involves risk; principal loss is possible. There is no guarantee the Fund’s investment objectives will be achieved. An exchange-traded fund seeks to generally track the investment results of an index; however the Fund may underperform, outperform or be more volatile than the referenced index. Non-U.S. investments involve risks such as currency fluctuation, political and economic instability, lack of liquidity and differing legal and accounting standards. In addition, because the Index selects securities for inclusion based on environmental, social, and governance (ESG) criteria, the Fund may forgo some market opportunities available to funds that don’t use these criteria. A portfolio concentrated in a single industry sector or country may present more risk than a portfolio broadly diversified over several industries or countries. These and other risks, such as mid-cap stock risk, are described in the Fund’s prospectus.
Nushares ESG Large-Cap Growth ETF (NULG)
Investing involves risk; principal loss is possible. There is no guarantee the Fund’s investment objectives will be achieved. This ETF seeks to generally track the investment results of an index; however the Fund may underperform, outperform or be more volatile than the referenced index. In addition, because the Index selects securities for inclusion based on environmental, social, and governance (ESG) criteria, the Fund may forgo some market opportunities available to funds that don’t use these criteria. The value of equity securities may decline significantly over short or extended periods of time. Growth stocks tend to be more volatile and can experience sharp price declines. Because it invests primarily in large-capitalization stocks, the Fund may underperform funds that invest primarily in stocks of smaller capitalization companies during periods when the stocks of such companies are in favor. These and other risk considerations are described in detail in the Fund’s prospectus.
Nushares ESG Large-Cap Value ETF (NULV)
Investing involves risk; principal loss is possible. There is no guarantee the Fund’s investment objectives will be achieved. This ETF seeks to generally track the investment results of an index; however the Fund may underperform, outperform or be more volatile than the referenced index. In addition, because the Index selects securities for inclusion based on environmental, social, and governance (ESG) criteria, the Fund may forgo some market opportunities available to funds that don’t use these criteria. The value of equity securities may decline significantly over short or extended periods of time. Value stocks may not be fully recognized by the market and be undervalued. Because it invests primarily in large-capitalization stocks, the Fund may underperform funds that invest primarily in stocks of smaller capitalization companies during periods when the stocks of such companies are in favor. These and other risk considerations are described in detail in the Fund’s prospectus.
Nushares ESG Mid-Cap Growth ETF (NUMG)
Investing involves risk; principal loss is possible. There is no guarantee the Fund’s investment objectives will be achieved. This ETF seeks to generally track the investment results of an index; however the Fund may underperform, outperform or be more volatile than the referenced index. In addition, because the Index selects securities for inclusion based on environmental, social, and governance (ESG) criteria, the Fund may forgo some market opportunities available to funds that don’t use these criteria. The value of equity securities may decline significantly over short or extended periods of time. Because it invests primarily in mid-capitalization stocks,
8
the Fund may be subject to greater volatility than those that invest in larger companies, but may be less volatile than investments in smaller companies. Growth stocks tend to be more volatile and can experience sharp price declines. These and other risk considerations are described in detail in the Fund’s prospectus.
Nushares ESG Mid-Cap Value ETF (NUMV)
Investing involves risk; principal loss is possible. There is no guarantee the Fund’s investment objectives will be achieved. This ETF seeks to generally track the investment results of an index; however the Fund may underperform, outperform or be more volatile than the referenced index. In addition, because the Index selects securities for inclusion based on environmental, social, and governance (ESG) criteria, the Fund may forgo some market opportunities available to funds that don’t use these criteria. The value of equity securities may decline significantly over short or extended periods of time. Value stocks may not be fully recognized by the market and be undervalued. Because it invests primarily in mid-capitalization stocks, the Fund may be subject to greater volatility than those that invest in larger companies, but may be less volatile than investments in smaller companies. These and other risk considerations are described in detail in the Fund’s prospectus.
Nushares ESG Small-Cap ETF (NUSC)
Investing involves risk; principal loss is possible. There is no guarantee the Fund’s investment objectives will be achieved. This ETF seeks to generally track the investment results of an index; however the Fund may underperform, outperform or be more volatile than the referenced index. In addition, because the Index selects securities for inclusion based on environmental, social, and governance (ESG) criteria, the Fund may forgo some market opportunities available to funds that don’t use these criteria. The value of equity securities may decline significantly over short or extended periods of time. Investments in smaller companies are subject to greater volatility than those of larger companies. These and other risk considerations are described in detail in the Fund’s prospectus.
9
THIS PAGE INTENTIONALLY LEFT BLANK
10
Fund Performance and Expense Ratios
The Fund Performance and Expense Ratio for each Fund are shown within this section of the report.
Returns quoted represent past performance, which is no guarantee of future results. Investment returns and principal value will fluctuate so that when shares are sold, they may be worth more or less than their original cost. Current performance may be higher or lower than the performance shown. Total returns for a period of less than one year are not annualized. Returns assume reinvestment of dividends and capital gains. Market price returns are based on the closing market price as of the end of the reporting period. For performance current to the most recent month-end visit nuveen.com or call (800) 257-8787.
Returns do not reflect the deduction of taxes that a shareholder would pay on Fund distributions or the sale of Fund shares.
The expense ratios represents each Fund’s total operating expenses as reflected in the most recent prospectus. The expense ratios shown include management fees and other applicable fees and expenses paid by the Fund.
11
Fund Performance and Expense Ratios (continued)
Nushares ESG Emerging Markets Equity ETF (NUEM)
Refer to the first page of this Fund Performance and Expense Ratios section for further explanation of the information included within this section. Refer to the Glossary of Terms Used in this Report for definitions of terms used within this section.
Fund Performance
Average Annual Total Returns as of October 31, 2018
| | | | | | | | |
| | | Average Annual | |
| | | 1-Year | | | Since
Inception | |
NUEM at NAV | | | (13.55)% | | | | (2.88)% | |
NUEM at Market Price | | | (14.18)% | | | | (2.53)% | |
TIAA ESG Emerging Markets Equity Index | | | (12.98)% | | | | (2.19)% | |
MSCI Emerging Markets Index | | | (12.52)% | | | | (1.72)% | |
Average Annual Total Returns as of September 30, 2018 (Most Recent Calendar Quarter)
| | | | | | | | |
| | | Average Annual | |
| | | 1-Year | | | Since
Inception | |
NUEM at NAV | | | (1.61)% | | | | 4.19% | |
NUEM at Market Price | | | (2.68)% | | | | 4.36% | |
Since inception returns are from 6/6/17. Indexes are not available for direct investment.
Expense Ratio as of Most Recent Prospectus
12
Growth of an Assumed $10,000 Investment as of October 31, 2018
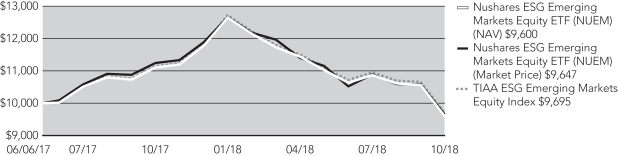
The graph does not reflect the deduction of taxes that a shareholder may pay on Fund distributions or the redemption of Fund shares.
13
Fund Performance and Expense Ratios (continued)
Nushares ESG International Developed Markets Equity ETF (NUDM)
Refer to the first page of this Fund Performance and Expense Ratios section for further explanation of the information included within this section. Refer to the Glossary of Terms Used in this Report for definitions of terms used within this section.
Fund Performance
Average Annual Total Returns as of October 31, 2018
| | | | | | | | |
| | | Average Annual | |
| | | 1-Year | | | Since
Inception | |
NUDM at NAV | | | (8.25)% | | | | (1.92)% | |
NUDM at Market Price | | | (8.79)% | | | | (1.87)% | |
TIAA ESG International Developed Markets Equity Index | | | (8.06)% | | | | (1.67)% | |
MSCI EAFE Index | | | (6.85)% | | | | (0.94)% | |
Average Annual Total Returns as of September 30, 2018 (Most Recent Calendar Quarter)
| | | | | | | | |
| | | Average Annual | |
| | | 1-Year | | | Since
Inception | |
NUDM at NAV | | | 1.78% | | | | 4.53% | |
NUDM at Market Price | | | 1.91% | | | | 4.61% | |
Since inception returns are from 6/6/17. Indexes are not available for direct investment.
Expense Ratio as of Most Recent Prospectus
14
Growth of an Assumed $10,000 Investment as of October 31, 2018
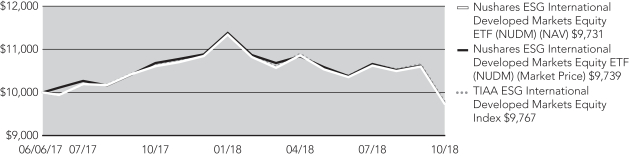
The graph does not reflect the deduction of taxes that a shareholder may pay on Fund distributions or the redemption of Fund shares.
15
Fund Performance and Expense Ratios (continued)
Nushares ESG Large-Cap Growth ETF (NULG)
Refer to the first page of this Fund Performance and Expense Ratios section for further explanation of the information included within this section. Refer to the Glossary of Terms Used in this Report for definitions of terms used within this section.
Fund Performance
Average Annual Total Returns as of October 31, 2018
| | | | | | | | |
| | | Average Annual | |
| | | 1-Year | | | Since
Inception | |
NULG at NAV | | | 11.70% | | | | 17.30% | |
NULG at Market Price | | | 11.61% | | | | 17.36% | |
TIAA ESG USA Large-Cap Growth Index | | | 12.11% | | | | 17.75% | |
MSCI USA Growth Index | | | 10.72% | | | | 17.24% | |
Average Annual Total Returns as of September 30, 2018 (Most Recent Calendar Quarter)
| | | | | | | | |
| | | Average Annual | |
| | | 1-Year | | | Since
Inception | |
NULG at NAV | | | 26.93% | | | | 24.81% | |
NULG at Market Price | | | 27.15% | | | | 24.83% | |
Since inception returns are from 12/13/16. Indexes are not available for direct investment.
Expense Ratio as of Most Recent Prospectus
16
Growth of an Assumed $10,000 Investment as of October 31, 2018
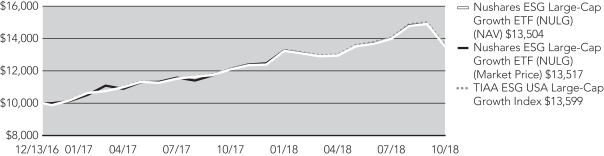
The graph does not reflect the deduction of taxes that a shareholder may pay on Fund distributions or the redemption of Fund shares.
17
Fund Performance and Expense Ratios (continued)
Nushares ESG Large-Cap Value ETF (NULV)
Refer to the first page of this Fund Performance and Expense Ratios section for further explanation of the information included within this section. Refer to the Glossary of Terms Used in this Report for definitions of terms used within this section.
Fund Performance
Average Annual Total Returns as of October 31, 2018
| | | | | | | | |
| | | Average Annual | |
| | | 1-Year | | | Since
Inception | |
NULV at NAV | | | 4.57% | | | | 8.19% | |
NULV at Market Price | | | 4.56% | | | | 8.29% | |
TIAA ESG USA Large-Cap Value Index | | | 4.94% | | | | 8.57% | |
MSCI USA Value Index | | | 3.56% | | | | 6.81% | |
Average Annual Total Returns as of September 30, 2018 (Most Recent Calendar Quarter)
| | | | | | | | |
| | | Average Annual | |
| | | 1-Year | | | Since
Inception | |
NULV at NAV | | | 12.06% | | | | 11.63% | |
NULV at Market Price | | | 12.19% | | | | 11.73% | |
Since inception returns are from 12/13/16. Indexes are not available for direct investment.
Expense Ratio as of Most Recent Prospectus
18
Growth of an Assumed $10,000 Investment as of October 31, 2018
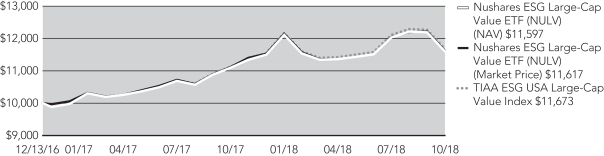
The graph does not reflect the deduction of taxes that a shareholder may pay on Fund distributions or the redemption of Fund shares.
19
Fund Performance and Expense Ratios (continued)
Nushares ESG Mid-Cap Growth ETF (NUMG)
Refer to the first page of this Fund Performance and Expense Ratios section for further explanation of the information included within this section. Refer to the Glossary of Terms Used in this Report for definitions of terms used within this section.
Fund Performance
Average Annual Total Returns as of October 31, 2018
| | | | | | | | |
| | | Average Annual | |
| | | 1-Year | | | Since
Inception | |
NUMG at NAV | | | 5.84% | | | | 10.13% | |
NUMG at Market Price | | | 6.41% | | | | 10.49% | |
TIAA ESG USA Mid-Cap Growth Index | | | 6.28% | | | | 10.60% | |
MSCI USA Mid-Cap Growth Index | | | 4.31% | | | | 9.52% | |
Average Annual Total Returns as of September 30, 2018 (Most Recent Calendar Quarter)
| | | | | | | | |
| | | Average Annual | |
| | | 1-Year | | | Since
Inception | |
NUMG at NAV | | | 23.85% | | | | 19.18% | |
NUMG at Market Price | | | 24.33% | | | | 19.26% | |
Since inception returns are from 12/13/16. Indexes are not available for direct investment.
Expense Ratio as of Most Recent Prospectus
20
Growth of an Assumed $10,000 Investment as of October 31, 2018
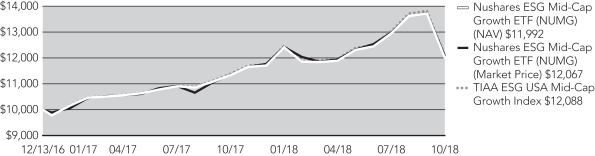
The graph does not reflect the deduction of taxes that a shareholder may pay on Fund distributions or the redemption of Fund shares.
21
Fund Performance and Expense Ratios (continued)
Nushares ESG Mid-Cap Value ETF (NUMV)
Refer to the first page of this Fund Performance and Expense Ratios section for further explanation of the information included within this section. Refer to the Glossary of Terms Used in this Report for definitions of terms used within this section.
Fund Performance
Average Annual Total Returns as of October 31, 2018
| | | | | | | | |
| | | Average Annual | |
| | | 1-Year | | | Since
Inception | |
NUMV at NAV | | | 0.97% | | | | 4.62% | |
NUMV at Market Price | | | 1.13% | | | | 4.72% | |
TIAA ESG USA Mid-Cap Value Index | | | 1.36% | | | | 5.03% | |
MSCI USA Mid-Cap Value Index | | | 1.36% | | | | 5.57% | |
Average Annual Total Returns as of September 30, 2018 (Most Recent Calendar Quarter)
| | | | | | | | |
| | | Average Annual | |
| | | 1-Year | | | Since
Inception | |
NUMV at NAV | | | 8.23% | | | | 8.40% | |
NUMV at Market Price | | | 9.23% | | | | 8.44% | |
Since inception returns are from 12/13/16. Indexes are not available for direct investment.
Expense Ratio as of Most Recent Prospectus
22
Growth of an Assumed $10,000 Investment as of October 31, 2018
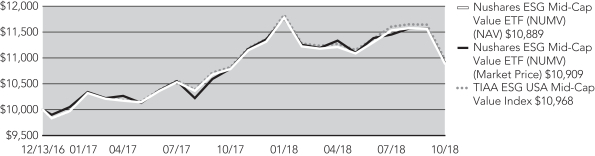
The graph does not reflect the deduction of taxes that a shareholder may pay on Fund distributions or the redemption of Fund shares.
23
Fund Performance and Expense Ratios (continued)
Nushares ESG Small-Cap ETF (NUSC)
Refer to the first page of this Fund Performance and Expense Ratios section for further explanation of the information included within this section. Refer to the Glossary of Terms Used in this Report for definitions of terms used within this section.
Fund Performance
Average Annual Total Returns as of October 31, 2018
| | | | | | | | |
| | | Average Annual | |
| | | 1-Year | | | Since
Inception | |
NUSC at NAV | | | 2.32% | | | | 7.17% | |
NUSC at Market Price | | | 2.30% | | | | 7.26% | |
TIAA ESG USA Small-Cap Index | | | 2.74% | | | | 7.63% | |
MSCI USA Small-Cap Index | | | 2.85% | | | | 7.87% | |
Average Annual Total Returns as of September 30, 2018 (Most Recent Calendar Quarter)
| | | | | | | | |
| | | Average Annual | |
| | | 1-Year | | | Since
Inception | |
NUSC at NAV | | | 16.25% | | | | 14.47% | |
NUSC at Market Price | | | 15.70% | | | | 14.47% | |
Since inception returns are from 12/13/16. Indexes are not available for direct investment.
Expense Ratio as of Most Recent Prospectus
24
Growth of an Assumed $10,000 Investment as of October 31, 2018
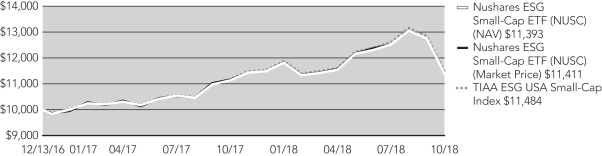
The graph does not reflect the deduction of taxes that a shareholder may pay on Fund distributions or the redemption of Fund shares.
25
Holding Summaries as of October 31, 2018
This data relates to the securities held in each Fund’s portfolio of investments as of the end of this reporting period. It should not be construed as a measure of performance for the Fund itself. Holdings are subject to change.
Nushares ESG Emerging Markets Equity ETF (NUEM)
Fund Allocation
(% of net assets)
| | | | |
Common Stocks | | | 99.8% | |
Common Stock Rights | | | 0.0% | |
Other Assets Less Liabilities | | | 0.2% | |
Net Assets | | | 100% | |
Top Five Common Stock Holdings
(% of net assets)
| | | | |
Taiwan Semiconductor Manufacturing Co Ltd | | | 5.4% | |
Tencent Holdings Ltd | | | 5.3% | |
Naspers Ltd | | | 2.7% | |
Infosys Ltd | | | 2.0% | |
Itau Unibanco Holding SA | | | 1.9% | |
Portfolio Composition
(% of net assets)
| | | | |
Financials | | | 21.6% | |
Information Technology | | | 19.7% | |
Communication Services | | | 15.4% | |
Materials | | | 8.7% | |
Industrials | | | 8.5% | |
Consumer Discretionary | | | 7.7% | |
Consumer Staples | | | 6.1% | |
Energy | | | 5.0% | |
Other | | | 7.1% | |
Other Assets Less Liabilities | | | 0.2% | |
Net Assets | | | 100% | |
Country Allocation
(% of net assets)
| | | | |
China | | | 27.2% | |
Korea, Republic Of | | | 13.9% | |
Taiwan | | | 13.5% | |
India | | | 11.1% | |
Brazil | | | 8.1% | |
South Africa | | | 6.2% | |
Mexico | | | 3.1% | |
Thailand | | | 2.9% | |
Malaysia | | | 2.8% | |
Indonesia | | | 2.0% | |
Other | | | 9.0% | |
Other Assets Less Liabilities | | | 0.2% | |
Net Assets | | | 100% | |
26
Nushares ESG International Developed Markets Equity ETF (NUDM)
Fund Allocation
(% of net assets)
| | | | |
Common Stocks | | | 99.5% | |
Other Assets Less Liabilities | | | 0.5% | |
Net Assets | | | 100% | |
Top Five Common Stock Holdings
(% of net assets)
| | | | |
Nestle SA | | | 3.3% | |
Roche Holding AG | | | 2.1% | |
AstraZeneca PLC | | | 2.0% | |
Commonwealth Bank of Australia | | | 1.9% | |
Sony Corp | | | 1.8% | |
Portfolio Composition
(% of net assets)
| | | | |
Financials | | | 20.7% | |
Industrials | | | 17.9% | |
Consumer Staples | | | 13.2% | |
Consumer Discretionary | | | 11.7% | |
Health Care | | | 9.7% | |
Materials | | | 6.9% | |
Communication Services | | | 5.5% | |
Other | | | 13.9% | |
Other Assets Less Liabilities | | | 0.5% | |
Net Assets | | | 100% | |
Country Allocation
(% of net assets)
| | | | |
Japan | | | 24.2% | |
United Kingdom | | | 16.5% | |
France | | | 10.6% | |
Germany | | | 9.8% | |
Switzerland | | | 8.1% | |
Australia | | | 6.4% | |
Spain | | | 3.5% | |
Hong Kong | | | 3.5% | |
Sweden | | | 3.0% | |
Netherlands | | | 2.9% | |
Other | | | 11.0% | |
Other Assets Less Liabilities | | | 0.5% | |
Net Assets | | | 100% | |
27
Holding Summaries as of October 31, 2018 (continued)
Nushares ESG Large-Cap Growth ETF (NULG)
Fund Allocation
(% of net assets)
| | | | |
Common Stocks | | | 99.8% | |
Other Assets Less Liabilities | | | 0.2% | |
Net Assets | | | 100% | |
Portfolio Composition
(% of net assets)
| | | | |
Information Technology | | | 33.8% | |
Consumer Discretionary | | | 13.7% | |
Health Care | | | 12.1% | |
Industrials | | | 11.5% | |
Communication Services | | | 11.4% | |
Financials | | | 7.0% | |
Other | | | 10.3% | |
Other Assets Less Liabilities | | | 0.2% | |
Net Assets | | | 100% | |
Top Five Common Stock Holdings
(% of net assets)
| | | | |
Apple Inc. | | | 10.2% | |
Microsoft Corp | | | 5.5% | |
Alphabet Inc. | | | 4.0% | |
Walt Disney Co/The | | | 2.8% | |
Home Depot Inc./The | | | 2.6% | |
28
Nushares ESG Large-Cap Value ETF (NULV)
Fund Allocation
(% of net assets)
| | | | |
Common Stocks | | | 99.8% | |
Other Assets Less Liabilities | | | 0.2% | |
Net Assets | | | 100% | |
Portfolio Composition
(% of net assets)
| | | | |
Financials | | | 22.2% | |
Health Care | | | 13.8% | |
Information Technology | | | 12.5% | |
Consumer Staples | | | 12.5% | |
Communication Services | | | 7.7% | |
Utilities | | | 6.6% | |
Industrials | | | 6.5% | |
Energy | | | 5.4% | |
Consumer Discretionary | | | 5.2% | |
Other | | | 7.4% | |
Other Assets Less Liabilities | | | 0.2% | |
Net Assets | | | 100% | |
Top Five Common Stock Holdings
(% of net assets)
| | | | |
Microsoft Corp | | | 3.7% | |
Bank of America Corp | | | 3.4% | |
Verizon Communications Inc. | | | 3.4% | |
Procter & Gamble Co/The | | | 3.3% | |
Intel Corp | | | 3.2% | |
29
Holding Summaries as of October 31, 2018 (continued)
Nushares ESG Mid-Cap Growth ETF (NUMG)
Fund Allocation
(% of net assets)
| | | | |
Common Stocks | | | 99.8% | |
Other Assets Less Liabilities | | | 0.2% | |
Net Assets | | | 100% | |
Portfolio Composition
(% of net assets)
| | | | |
Industrials | | | 26.1% | |
Information Technology | | | 23.7% | |
Health Care | | | 14.6% | |
Consumer Discretionary | | | 13.0% | |
Materials | | | 6.0% | |
Communication Services | | | 5.5% | |
Other | | | 10.9% | |
Other Assets Less Liabilities | | | 0.2% | |
Net Assets | | | 100% | |
Top Five Common Stock Holdings
(% of net assets)
| | | | |
Square Inc. | | | 2.6% | |
Take-Two Interactive Software Inc. | | | 2.3% | |
Advanced Micro Devices Inc. | | | 2.2% | |
Laboratory Corp of America Holdings | | | 2.2% | |
Fortinet Inc. | | | 2.2% | |
30
Nushares ESG Mid-Cap Value ETF (NUMV)
Fund Allocation
(% of net assets)
| | | | |
Common Stocks | | | 99.8% | |
Other Assets Less Liabilities | | | 0.2% | |
Net Assets | | | 100% | |
Portfolio Composition
(% of net assets)
| | | | |
Financials | | | 19.7% | |
Consumer Discretionary | | | 15.9% | |
Real Estate | | | 14.5% | |
Industrials | | | 9.8% | |
Utilities | | | 8.6% | |
Materials | | | 7.8% | |
Information Technology | | | 7.3% | |
Communications Services | | | 6.9% | |
Consumer Staples | | | 5.4% | |
Other | | | 3.9% | |
Other Assets Less Liabilities | | | 0.2% | |
Net Assets | | | 100% | |
Top Five Common Stock Holdings
(% of net assets)
| | | | |
Eversource Energy | | | 2.6% | |
CenturyLink Inc. | | | 2.3% | |
Citizens Financial Group Inc. | | | 2.3% | |
CMS Energy Corp | | | 2.2% | |
Arthur J Gallagher & Co | | | 2.2% | |
31
Holding Summaries as of October 31, 2018 (continued)
Nushares ESG Small-Cap ETF (NUSC)
Fund Allocation
(% of net assets)
| | | | |
Common Stocks | | | 99.8% | |
Common Stock Rights | | | 0.0% | |
U.S. Government and Agency Obligations | | | 0.2% | |
Other Assets Less Liabilities | | | 0.0% | |
Net Assets | | | 100% | |
Portfolio Composition
(% of net assets)
| | | | |
Financials | | | 16.1% | |
Information Technology | | | 15.6% | |
Industrials | | | 14.2% | |
Health Care | | | 13.6% | |
Consumer Discretionary | | | 11.8% | |
Real Estate | | | 10.2% | |
Materials | | | 5.4% | |
Other | | | 12.9% | |
U.S. Government and Agency Obligations | | | 0.2% | |
Other Assets Less Liabilities | | | 0.0% | |
Net Assets | | | 100% | |
Top Five Common Stock Holdings
(% of net assets)
| | | | |
Booz Allen Hamilton Holding Corp | | | 1.1% | |
WEX Inc. | | | 0.9% | |
Pool Corp | | | 0.9% | |
LivaNova PLC | | | 0.8% | |
Starwood Property Trust Inc. | | | 0.8% | |
32
Expense Examples
As a shareholder of one or more of the Funds, you incur two types of costs: (1) transaction costs, including brokerage commissions on purchases and sales of Fund shares, and (2) ongoing costs, including management fees and other applicable Fund expenses. The Examples below are intended to help you understand your ongoing costs (in dollars) of investing in the Funds and to compare these costs with the ongoing costs of investing in other funds.
The Examples below are based on an investment of $1,000 invested at the beginning of the period and held through October 31, 2018.
The beginning of the period is May 1, 2018.
The information under “Actual Performance,” together with the amount you invested, allows you to estimate actual expenses incurred over the reporting period. Simply divide your account value by $1,000 (for example, an $8,600 account value divided by $1,000 = 8.60) and multiply the result by the cost shown for your Fund in the row entitled “Expenses Incurred During Period” to estimate the expenses incurred on your account during this period.
The information under “Hypothetical Performance” provides information about hypothetical account values and hypothetical expenses based on each Fund’s actual expense ratio and an assumed rate of return of 5% per year before expenses, which is not the Fund’s actual return. The hypothetical account values and expenses may not be used to estimate the actual ending account balance or expense you incurred for the period. You may use this information to compare the ongoing costs of investing in the Fund and other funds. To do so, compare this 5% hypothetical example with the 5% hypothetical examples that appear in the shareholder reports of the other funds.
Please note that the expenses shown in the tables are meant to highlight your ongoing costs only and do not reflect any transaction costs. Therefore, the hypothetical information is useful in comparing ongoing costs only, and will not help you determine the relative total costs of owning different funds. In addition, if these transaction costs were included, your costs would have been higher.
Nushares ESG Emerging Markets Equity ETF (NUEM)
| | | | |
Actual Performance | | | | |
Beginning Account Value | | $ | 1,000.00 | |
Ending Account Value | | $ | 839.40 | |
Expenses Incurred During Period | | $ | 2.09 | |
Hypothetical Performance (5% annualized return before expenses) | | | | |
Beginning Account Value | | $ | 1,000.00 | |
Ending Account Value | | $ | 1,022.94 | |
Expenses Incurred During Period | | $ | 2.29 | |
Expenses are equal to the Fund’s annualized net expense ratio of 0.45% multiplied by the average account value over the period, multiplied by 184/365 (to reflect the one-half year period).
33
Expense Examples (continued)
Nushares ESG International Developed Markets Equity ETF (NUDM)
| | | | |
Actual Performance | | | | |
Beginning Account Value | | $ | 1,000.00 | |
Ending Account Value | | $ | 896.50 | |
Expenses Incurred During Period | | $ | 1.91 | |
Hypothetical Performance (5% annualized return before expenses) | | | | |
Beginning Account Value | | $ | 1,000.00 | |
Ending Account Value | | $ | 1,023.19 | |
Expenses Incurred During Period | | $ | 2.04 | |
Expenses are equal to the Fund’s annualized net expense ratio of 0.40% multiplied by the average account value over the period, multiplied by 184/365 (to reflect the one-half year period).
Nushares ESG Large-Cap Growth ETF (NULG)
| | | | |
Actual Performance | | | | |
Beginning Account Value | | $ | 1,000.00 | |
Ending Account Value | | $ | 1,043.90 | |
Expenses Incurred During Period | | $ | 1.80 | |
Hypothetical Performance (5% annualized return before expenses) | | | | |
Beginning Account Value | | $ | 1,000.00 | |
Ending Account Value | | $ | 1,023.44 | |
Expenses Incurred During Period | | $ | 1.79 | |
Expenses are equal to the Fund’s annualized net expense ratio of 0.35% multiplied by the average account value over the period, multiplied by 184/365 (to reflect the one-half year period).
Nushares ESG Large-Cap Value ETF (NULV)
| | | | |
Actual Performance | | | | |
Beginning Account Value | | $ | 1,000.00 | |
Ending Account Value | | $ | 1,021.20 | |
Expenses Incurred During Period | | $ | 1.78 | |
Hypothetical Performance (5% annualized return before expenses) | | | | |
Beginning Account Value | | $ | 1,000.00 | |
Ending Account Value | | $ | 1,023.44 | |
Expenses Incurred During Period | | $ | 1.79 | |
Expenses are equal to the Fund’s annualized net expense ratio of 0.35% multiplied by the average account value over the period, multiplied by 184/365 (to reflect the one-half year period).
34
Nushares ESG Mid-Cap Growth ETF (NUMG)
| | | | |
Actual Performance | | | | |
Beginning Account Value | | $ | 1,000.00 | |
Ending Account Value | | $ | 1,008.40 | |
Expenses Incurred During Period | | $ | 2.02 | |
Hypothetical Performance (5% annualized return before expenses) | | | | |
Beginning Account Value | | $ | 1,000.00 | |
Ending Account Value | | $ | 1,023.19 | |
Expenses Incurred During Period | | $ | 2.04 | |
Expenses are equal to the Fund’s annualized net expense ratio of 0.40% multiplied by the average account value over the period, multiplied by 184/365 (to reflect the one-half year period).
Nushares ESG Mid-Cap Value ETF (NUMV)
| | | | |
Actual Performance | | | | |
Beginning Account Value | | $ | 1,000.00 | |
Ending Account Value | | $ | 971.70 | |
Expenses Incurred During Period | | $ | 1.99 | |
Hypothetical Performance (5% annualized return before expenses) | | | | |
Beginning Account Value | | $ | 1,000.00 | |
Ending Account Value | | $ | 1,023.19 | |
Expenses Incurred During Period | | $ | 2.04 | |
Expenses are equal to the Fund’s annualized net expense ratio of 0.40% multiplied by the average account value over the period, multiplied by 184/365 (to reflect the one-half year period).
Nushares ESG Small-Cap ETF (NUSC)
| | | | |
Actual Performance | | | | |
Beginning Account Value | | $ | 1,000.00 | |
Ending Account Value | | $ | 987.70 | |
Expenses Incurred During Period | | $ | 2.00 | |
Hypothetical Performance (5% annualized return before expenses) | | | | |
Beginning Account Value | | $ | 1,000.00 | |
Ending Account Value | | $ | 1,023.19 | |
Expenses Incurred During Period | | $ | 2.04 | |
Expenses are equal to the Fund’s annualized net expense ratio of 0.40% multiplied by the average account value over the period, multiplied by 184/365 (to reflect the one-half year period).
35
Report of Independent Registered Public Accounting Firm
To the Shareholders and Board of Trustees of
Nushares ETF Trust:
Opinion on the Financial Statements
We have audited the accompanying statements of assets and liabilities, including the portfolios of investments, of Nushares ESG Emerging Markets Equity ETF, Nushares ESG International Developed Markets Equity ETF, Nushares ESG Large-Cap Growth ETF, Nushares ESG Large-Cap Value ETF, Nushares ESG Mid-Cap Growth ETF, Nushares ESG Mid-Cap Value ETF, and Nushares ESG Small-Cap Value ETF (seven of the funds comprising Nushares ETF Trust) (the “Funds”) as of October 31, 2018, the related statements of operations for the year then ended, the statements of changes in net assets for the year then ended and the period from June 6, 2017 (commencement of operations) to October 31, 2017 for Nushares ESG Emerging Markets Equity ETF and Nushares ESG International Developed Markets Equity ETF and the period from December 13, 2016 (commencement of operations) to October 31, 2017 for Nushares ESG Large-Cap Growth ETF, Nushares ESG Large-Cap Value ETF, Nushares ESG Mid-Cap Growth ETF, Nushares ESG Mid-Cap Value ETF, and Nushares ESG Small-Cap ETF, and the related notes (collectively, the “financial statements”) and the financial highlights for the year then ended and the period from June 6, 2017 to October 31, 2017 for Nushares ESG Emerging Markets Equity ETF and Nushares ESG International Developed Markets Equity ETF and the period from December 13, 2016 to October 31, 2017 for Nushares ESG Large-Cap Growth ETF, Nushares ESG Large-Cap Value ETF, Nushares ESG Mid-Cap Growth ETF, Nushares ESG Mid-Cap Value ETF, and Nushares ESG Small-Cap ETF. In our opinion, the financial statements and financial highlights present fairly, in all material respects, the financial position of the Funds as of October 31, 2018, the results of their operations for the year then ended, and the changes in their net assets and the financial highlights for the year then ended and the period from June 6, 2017 to October 31, 2017 for Nushares ESG Emerging Markets Equity ETF and Nushares ESG International Developed Markets Equity ETF and the period from December 13, 2016 to October 31, 2017 for Nushares ESG Large-Cap Growth ETF, Nushares ESG Large-Cap Value ETF, Nushares ESG Mid-Cap Growth ETF, Nushares ESG Mid-Cap Value ETF, and Nushares ESG Small-Cap ETF, in conformity with U.S. generally accepted accounting principles.
Basis for Opinion
These financial statements and financial highlights are the responsibility of the Funds’ management. Our responsibility is to express an opinion on these financial statements and financial highlights based on our audits. We are a public accounting firm registered with the Public Company Accounting Oversight Board (United States) (“PCAOB”) and are required to be independent with respect to the Funds in accordance with the U.S. federal securities laws and the applicable rules and regulations of the Securities and Exchange Commission and the PCAOB.
We conducted our audits in accordance with the standards of the PCAOB. Those standards require that we plan and perform the audit to obtain reasonable assurance about whether the financial statements and financial highlights are free of material misstatement, whether due to error or fraud. Our audits included performing procedures to assess the risks of material misstatement of the financial statements and financial highlights, whether due to error or fraud, and performing procedures that respond to those risks. Such procedures included examining, on a test basis, evidence regarding the amounts and disclosures in the financial statements and financial highlights. Such procedures also included confirmation of securities owned as of October 31, 2018, by correspondence with the custodian and brokers or other appropriate auditing procedures. Our audits also included evaluating the accounting principles used and significant estimates made by management, as well as evaluating the overall presentation of the financial statements and financial highlights. We believe that our audits provide a reasonable basis for our opinion.

We have served as the auditor of one or more Nuveen investment companies since 2014.
Chicago, Illinois
December 27, 2018
36
Nushares ESG Emerging Markets Equity ETF (NUEM)
Portfolio of Investments October 31, 2018
| | | | | | | | |
| Shares | | | Description (1) | | Value | |
| | |
| | | | LONG-TERM INVESTMENTS – 99.8% | | | | |
| | |
| | | | COMMON STOCKS – 99.8% | | | | |
| | |
| | | | Communication Services – 15.4% | | | |
| | |
| | 726 | | | Advanced Info Service PCL, (2) | | $ | 4,238 | |
| | |
| | 37,375 | | | Alibaba Pictures Group Ltd, (2) | | | 5,149 | |
| | |
| | 10,686 | | | Astro Malaysia Holdings Bhd | | | 3,448 | |
| | |
| | 210,695 | | | Axiata Group Bhd | | | 171,698 | |
| | |
| | 104,826 | | | Bharti Airtel Ltd | | | 413,024 | |
| | |
| | 969 | | | Bharti Infratel Ltd | | | 3,499 | |
| | |
| | 1,054 | | | CD Projekt SA | | | 43,557 | |
| | |
| | 36,349 | | | Chunghwa Telecom Co Ltd | | | 128,631 | |
| | |
| | 3,605 | | | DiGi.Com Bhd | | | 3,713 | |
| | |
| | 34,146 | | | Emirates Telecommunications Group Co PJSC | | | 161,755 | |
| | |
| | 395 | | | Empresa Nacional de Telecomunicaciones SA | | | 2,864 | |
| | |
| | 16,201 | | | Fang Holdings Ltd, Sponsored ADR, (2) | | | 32,888 | |
| | |
| | 1,899 | | | Far EasTone Telecommunications Co Ltd | | | 4,523 | |
| | |
| | 144 | | | Globe Telecom Inc. | | | 5,625 | |
| | |
| | 6,518 | | | Hellenic Telecommunications Organization SA | | | 72,744 | |
| | |
| | 188 | | | KT Corp | | | 4,718 | |
| | |
| | 3,139 | | | Maxis Bhd | | | 3,923 | |
| | |
| | 5,559 | | | Naspers Ltd | | | 976,058 | |
| | |
| | 4,794 | | | NAVER Corp | | | 481,693 | |
| | |
| | 10 | | | NCSoft Corp | | | 3,769 | |
| | |
| | 1,453 | | | O2 Czech Republic AS | | | 15,293 | |
| | |
| | 6,192 | | | Ooredoo QPSC | | | 117,122 | |
| | |
| | 152 | | | PLDT Inc. | | | 3,949 | |
| | |
| | 1,561 | | | SK Telecom Co Ltd | | | 367,117 | |
| | |
| | 27,800 | | | Surya Citra Media Tbk PT | | | 2,871 | |
| | |
| | 1,258 | | | Taiwan Mobile Co Ltd | | | 4,492 | |
| | |
| | 355 | | | Telefonica Brasil SA | | | 4,131 | |
| | |
| | 3,458 | | | Telekom Malaysia Bhd | | | 1,967 | |
| | |
| | 2,014,720 | | | Telekomunikasi Indonesia Persero Tbk PT | | | 510,223 | |
| | |
| | 1,273 | | | Telkom SA SOC Ltd | | | 4,625 | |
| | |
| | 55,346 | | | Tencent Holdings Ltd | | | 1,885,015 | |
| | |
| | 1,189 | | | TIM Participacoes SA | | | 3,710 | |
| | |
| | 21,092 | | | True Corp PCL, (2), (3) | | | 3,754 | |
| | |
| | 1,498 | | | Turkcell Iletisim Hizmetleri AS | | | 3,034 | |
37
Nushares ESG Emerging Markets Equity ETF (NUEM) (continued)
Portfolio of Investments October 31, 2018
| | | | | | | | |
| Shares | | | Description (1) | | Value | |
| | |
| | | | Communication Services (continued) | | | |
| | |
| | 321 | | | Vodacom Group Ltd | | $ | 2,704 | |
| | |
| | 57,106 | | | Vodafone Idea Ltd, (2) | | | 29,887 | |
| | | | Total Communication Services | | | 5,487,411 | |
| | |
| | | | Consumer Discretionary – 7.7% | | | |
| | |
| | 1,216 | | | Alsea SAB de CV, (2) | | | 3,124 | |
| | |
| | 8,696 | | | ANTA Sports Products Ltd | | | 35,718 | |
| | |
| | 136,323 | | | BAIC Motor Corp Ltd, 144A | | | 76,514 | |
| | |
| | 86 | | | Bajaj Auto Ltd | | | 3,016 | |
| | |
| | 2,409 | | | Brilliance China Automotive Holdings Ltd | | | 2,102 | |
| | |
| | 49,527 | | | BYD Co Ltd | | | 320,939 | |
| | |
| | 2,583 | | | Cheng Shin Rubber Industry Co Ltd | | | 3,635 | |
| | |
| | 6,516 | | | China First Capital Group Ltd, (2) | | | 2,627 | |
| | |
| | 168,045 | | | China Travel International Investment Hong Kong Ltd | | | 45,016 | |
| | |
| | 55,700 | | | Chongqing Changan Automobile Co Ltd, (2) | | | 37,515 | |
| | |
| | 10 | | | Eicher Motors Ltd | | | 2,936 | |
| | |
| | 654 | | | Feng TAY Enterprise Co Ltd | | | 3,931 | |
| | |
| | 460 | | | FF Group, (2), (4) | | | 625 | |
| | |
| | 4,119 | | | Formosa Taffeta Co Ltd | | | 4,479 | |
| | |
| | 229 | | | Foschini Group Ltd/The | | | 2,500 | |
| | |
| | 184,648 | | | Geely Automobile Holdings Ltd | | | 353,308 | |
| | |
| | 831,051 | | | GOME Retail Holdings Ltd, (2) | | | 82,687 | |
| | |
| | 93,041 | | | Guangzhou Automobile Group Co Ltd | | | 94,116 | |
| | |
| | 373 | | | Hanon Systems | | | 3,584 | |
| | |
| | 104,809 | | | HengTen Networks Group Ltd, (2) | | | 3,743 | |
| | |
| | 10,428 | | | Home Product Center PCL, (3) | | | 4,687 | |
| | |
| | 455 | | | Hotai Motor Co Ltd | | | 3,139 | |
| | |
| | 266 | | | Imperial Holdings Ltd | | | 2,935 | |
| | |
| | 495 | | | Lojas Renner SA | | | 5,011 | |
| | |
| | 2 | | | LPP SA | | | 4,099 | |
| | |
| | 18,492 | | | Mahindra & Mahindra Ltd | | | 191,184 | |
| | |
| | 2,425 | | | Minor International PCL, (2), (3) | | | 2,670 | |
| | |
| | 7,370 | | | New Oriental Education & Technology Group Inc., Sponsored ADR | | | 431,219 | |
| | |
| | 43,369 | | | SACI Falabella | | | 327,272 | |
| | |
| | 46,940 | | | Shenzhou International Group Holdings Ltd | | | 518,535 | |
| | |
| | 381 | | | Titan Co Ltd | | | 4,337 | |
| | |
| | 627 | | | Truworths International Ltd | | | 3,436 | |
| | |
| | 2,712 | | | UMW Holdings Bhd | | | 3,079 | |
| | |
| | 33,433 | | | Vipshop Holdings Ltd, Sponsored ADR, (2) | | | 162,484 | |
| | |
| | 804 | | | Woolworths Holdings Ltd/South Africa | | | 2,773 | |
| | |
| | 1,396 | | | Zhongsheng Group Holdings Ltd | | | 2,546 | |
| | | | Total Consumer Discretionary | | | 2,751,521 | |
38
| | | | | | | | |
| Shares | | | Description (1) | | Value | |
| | |
| | | | Consumer Staples – 6.1% | | | |
| | |
| | 13 | | | Amorepacific Corp | | $ | 1,745 | |
| | |
| | 27 | | | Amorepacific Corp | | | 2,132 | |
| | |
| | 35 | | | AMOREPACIFIC Group | | | 1,907 | |
| | |
| | 770 | | | Anadolu Efes Biracilik Ve Malt Sanayii AS | | | 2,582 | |
| | |
| | 776 | | | Arca Continental SAB de CV | | | 3,909 | |
| | |
| | 1,155 | | | Atacadao Distribuicao Comercio e Industria Ltda | | | 4,739 | |
| | |
| | 196 | | | Bid Corp Ltd | | | 3,673 | |
| | |
| | 52 | | | Britannia Industries Ltd | | | 3,954 | |
| | |
| | 162,259 | | | China Agri-Industries Holdings Ltd | | | 54,228 | |
| | |
| | 125,313 | | | China Mengniu Dairy Co Ltd | | | 369,254 | |
| | |
| | 3,381 | | | Cia Brasileira de Distribuicao | | | 71,197 | |
| | |
| | 13 | | | CJ CheilJedang Corp | | | 3,696 | |
| | |
| | 256 | | | Clicks Group Ltd | | | 3,259 | |
| | |
| | 13,989 | | | Coca-Cola Femsa SAB de CV | | | 80,137 | |
| | |
| | 856 | | | Coca-Cola Icecek AS | | | 4,210 | |
| | |
| | 105,819 | | | CP ALL PCL | | | 211,478 | |
| | |
| | 5,228 | | | Dali Foods Group Co Ltd, 144A | | | 3,735 | |
| | |
| | 941 | | | Embotelladora Andina SA | | | 3,311 | |
| | |
| | 65,776 | | | Fomento Economico Mexicano SAB de CV | | | 562,008 | |
| | |
| | 429 | | | Fraser & Neave Holdings Bhd | | | 3,455 | |
| | |
| | 279 | | | Gruma SAB de CV | | | 2,928 | |
| | |
| | 24,774 | | | Hindustan Unilever Ltd | | | 541,748 | |
| | |
| | 2,539 | | | Kimberly-Clark de Mexico SAB de CV | | | 3,670 | |
| | |
| | 3 | | | LG Household & Health Care Ltd | | | 2,748 | |
| | |
| | 6 | | | LG Household & Health Care Ltd | | | 3,854 | |
| | |
| | 385 | | | M Dias Branco SA, (2) | | | 4,609 | |
| | |
| | 1,005 | | | Marico Ltd | | | 4,351 | |
| | |
| | 600 | | | Natura Cosmeticos SA | | | 5,264 | |
| | |
| | 580 | | | Nestle India Ltd | | | 79,456 | |
| | |
| | 120 | | | Nestle Malaysia Bhd | | | 4,124 | |
| | |
| | 372 | | | Pioneer Foods Group Ltd | | | 2,040 | |
| | |
| | 1,058 | | | PPB Group Bhd | | | 4,238 | |
| | |
| | 625 | | | President Chain Store Corp | | | 7,049 | |
| | |
| | 300 | | | Shoprite Holdings Ltd | | | 3,663 | |
| | |
| | 1,793 | | | Standard Foods Corp | | | 2,692 | |
| | |
| | 1,663 | | | Ulker Biskuvi Sanayi AS | | | 4,387 | |
| | |
| | 32,012 | | | Unilever Indonesia Tbk PT | | | 91,019 | |
| | |
| | 1,894 | | | Uni-President Enterprises Corp | | | 4,585 | |
| | | | Total Consumer Staples | | | 2,167,034 | |
| | |
| | | | Energy – 5.0% | | | |
| | |
| | 12,616 | | | Cosan SA | | | 109,535 | |
39
Nushares ESG Emerging Markets Equity ETF (NUEM) (continued)
Portfolio of Investments October 31, 2018
| | | | | | | | |
| Shares | | | Description (1) | | Value | |
| | |
| | | | Energy (continued) | | | |
| | |
| | 283,283 | | | Dialog Group Bhd | | $ | 229,497 | |
| | |
| | 3,861 | | | Energy Absolute PCL, (2), (3) | | | 5,765 | |
| | |
| | 775,665 | | | IRPC PCL, (2), (3) | | | 142,732 | |
| | |
| | 4,701 | | | Motor Oil Hellas Corinth Refineries SA | | | 111,323 | |
| | |
| | 15,361 | | | Petronas Dagangan Bhd | | | 95,444 | |
| | |
| | 46,371 | | | Petronet LNG Ltd | | | 142,289 | |
| | |
| | 3,482 | | | S-Oil Corp | | | 378,893 | |
| | |
| | 86,560 | | | Thai Oil PCL, (2), (3) | | | 221,296 | |
| | |
| | 1,275 | | | Tupras Turkiye Petrol Rafinerileri AS | | | 29,968 | |
| | |
| | 28,062 | | | Ultrapar Participacoes SA | | | 334,296 | |
| | | | Total Energy | | | 1,801,038 | |
| | |
| | | | Financials – 21.6% | | | |
| | |
| | 246 | | | Absa Group Ltd | | | 2,484 | |
| | |
| | 4,246 | | | Alliance Bank Malaysia Bhd | | | 4,018 | |
| | |
| | 128,211 | | | AMMB Holdings Bhd | | | 116,430 | |
| | |
| | 68,350 | | | Axis Bank Ltd | | | 535,653 | |
| | |
| | 759 | | | B3 SA – Brasil Bolsa Balcao, (2) | | | 5,423 | |
| | |
| | 150 | | | Bajaj Finance Ltd | | | 4,804 | |
| | |
| | 15,515 | | | Banco Bradesco SA, (2) | | | 126,350 | |
| | |
| | 71,173 | | | Banco Bradesco SA, (2) | | | 657,217 | |
| | |
| | 67 | | | Banco de Credito e Inversiones SA | | | 4,198 | |
| | |
| | 546 | | | Banco do Brasil SA, (2) | | | 6,284 | |
| | |
| | 10,453 | | | Banco Santander Brasil SA | | | 118,755 | |
| | |
| | 53,277 | | | Banco Santander Chile | | | 3,932 | |
| | |
| | 59,415 | | | Banco Santander Mexico SA Institucion de Banca Multiple Grupo Financiero Santand | | | 74,610 | |
| | |
| | 515 | | | Bancolombia SA | | | 4,841 | |
| | |
| | 31,931 | | | Bancolombia SA | | | 298,347 | |
| | |
| | 13,102 | | | Bank Danamon Indonesia Tbk PT | | | 6,399 | |
| | |
| | 183 | | | Bank Handlowy w Warszawie SA | | | 3,344 | |
| | |
| | 11,481 | | | Bank Mandiri Persero Tbk PT | | | 5,173 | |
| | |
| | 1,922 | | | Bank Millennium SA, (2) | | | 4,431 | |
| | |
| | 6,668 | | | Bank Negara Indonesia Persero Tbk PT | | | 3,213 | |
| | |
| | 158 | | | Bank Polska Kasa Opieki SA | | | 4,319 | |
| | |
| | 421,187 | | | Bank Rakyat Indonesia Persero Tbk PT | | | 87,271 | |
| | |
| | 356,491 | | | Cathay Financial Holding Co Ltd | | | 564,524 | |
| | |
| | 690,523 | | | China CITIC Bank Corp Ltd | | | 427,206 | |
| | |
| | 164,790 | | | China Merchants Bank Co Ltd | | | 634,826 | |
| | |
| | 164,862 | | | CIMB Group Holdings Bhd | | | 225,358 | |
| | |
| | 549 | | | Commercial Bank PQSC/The | | | 6,249 | |
| | |
| | 7,273 | | | Commercial International Bank Egypt SAE | | | 32,239 | |
| | |
| | 811 | | | Coronation Fund Managers Ltd | | | 2,698 | |
40
| | | | | | | | |
| Shares | | | Description (1) | | Value | |
| | |
| | | | Financials (continued) | | | |
| | |
| | 519 | | | DGB Financial Group Inc. | | $ | 4,281 | |
| | |
| | 2,958 | | | Dubai Islamic Bank PJSC | | | 4,236 | |
| | |
| | 6,485 | | | E.Sun Financial Holding Co Ltd | | | 4,296 | |
| | |
| | 6,312 | | | First Financial Holding Co Ltd | | | 3,988 | |
| | |
| | 48,903 | | | FirstRand Ltd | | | 212,982 | |
| | |
| | 351,678 | | | Fubon Financial Holding Co Ltd | | | 550,651 | |
| | |
| | 16,165 | | | Grupo Financiero Banorte SAB de CV | | | 89,394 | |
| | |
| | 132 | | | Hyundai Marine & Fire Insurance Co Ltd | | | 4,842 | |
| | |
| | 686 | | | Investec Ltd | | | 4,263 | |
| | |
| | 52,005 | | | Itau Unibanco Holding SA | | | 689,527 | |
| | |
| | 1,517 | | | Itausa – Investimentos Itau SA | | | 4,590 | |
| | |
| | 1,445 | | | Kasikornbank PCL | | | 8,696 | |
| | |
| | 13,564 | | | KB Financial Group Inc. | | | 564,200 | |
| | |
| | 103 | | | Komercni banka as | | | 3,913 | |
| | |
| | 7,974 | | | Krung Thai Bank PCL, (3) | | | 4,835 | |
| | |
| | 1,597 | | | Malayan Banking Bhd | | | 3,622 | |
| | |
| | 1,144 | | | mBank SA | | | 111,696 | |
| | |
| | 14,303 | | | Mega Financial Holding Co Ltd | | | 12,088 | |
| | |
| | 4,218 | | | Nedbank Group Ltd | | | 71,104 | |
| | |
| | 125,918 | | | Old Mutual Ltd | | | 193,487 | |
| | |
| | 3,371 | | | OTP Bank Nyrt | | | 121,044 | |
| | |
| | 261 | | | PSG Group Ltd | | | 3,888 | |
| | |
| | 694 | | | Public Bank Bhd | | | 4,080 | |
| | |
| | 288 | | | Remgro Ltd | | | 3,709 | |
| | |
| | 3,141 | | | RHB Capital Bhd | | | 3,926 | |
| | |
| | 891 | | | RMB Holdings Ltd | | | 4,493 | |
| | |
| | 146 | | | Samsung Card Co Ltd | | | 4,311 | |
| | |
| | 1,568 | | | Samsung Fire & Marine Insurance Co Ltd | | | 383,211 | |
| | |
| | 874 | | | Sanlam Ltd | | | 4,395 | |
| | |
| | 43 | | | Santander Bank Polska SA | | | 3,821 | |
| | |
| | 146 | | | Shinhan Financial Group Co Ltd | | | 5,452 | |
| | |
| | 1,036 | | | Siam Commercial Bank PCL/The, (2), (3) | | | 4,297 | |
| | |
| | 30,850 | | | Standard Bank Group Ltd | | | 341,233 | |
| | |
| | 10,104 | | | Taishin Financial Holding Co Ltd | | | 4,490 | |
| | |
| | 14,357 | | | Taiwan Business Bank | | | 4,733 | |
| | |
| | 59,372 | | | TMB Bank PCL, (2), (3) | | | 4,084 | |
| | |
| | 901 | | | Yes Bank Ltd | | | 2,295 | |
| | |
| | 604,772 | | | Yuanta Financial Holding Co Ltd | | | 293,171 | |
| | | | Total Financials | | | 7,713,920 | |
| | |
| | | | Health Care – 2.8% | | | |
| | |
| | 2,247 | | | 3SBio Inc., 144A | | | 3,262 | |
41
Nushares ESG Emerging Markets Equity ETF (NUEM) (continued)
Portfolio of Investments October 31, 2018
| | | | | | | | |
| Shares | | | Description (1) | | Value | |
| | |
| | | | Health Care (continued) | | | |
| | |
| | 5,349 | | | Bangkok Dusit Medical Services PCL, (2), (3) | | $ | 3,953 | |
| | |
| | 751 | | | Bumrungrad Hospital PCL, (2), (3) | | | 4,372 | |
| | |
| | 1,921 | | | China Medical System Holdings Ltd | | | 2,286 | |
| | |
| | 2,220 | | | CSPC Pharmaceutical Group Ltd | | | 4,684 | |
| | |
| | 2,171 | | | Genscript Biotech Corp, (2) | | | 3,312 | |
| | |
| | 2,355 | | | Hartalega Holdings Bhd | | | 3,523 | |
| | |
| | 3,099 | | | IHH Healthcare Bhd | | | 3,703 | |
| | |
| | 38,938 | | | Kalbe Farma Tbk PT | | | 3,509 | |
| | |
| | 2,027 | | | Life Healthcare Group Holdings Ltd | | | 3,363 | |
| | |
| | 4,329 | | | Luye Pharma Group Ltd, 144A | | | 3,341 | |
| | |
| | 1,485 | | | Netcare Ltd | | | 2,497 | |
| | |
| | 112 | | | Piramal Enterprises Ltd | | | 3,258 | |
| | |
| | 205 | | | Richter Gedeon Nyrt | | | 3,809 | |
| | |
| | 147,795 | | | Shandong Weigao Group Medical Polymer Co Ltd | | | 132,158 | |
| | |
| | 37,980 | | | Shanghai Fosun Pharmaceutical Group Co Ltd | | | 113,852 | |
| | |
| | 1,472 | | | Shanghai Pharmaceuticals Holding Co Ltd | | | 3,252 | |
| | |
| | 416,408 | | | Sino Biopharmaceutical Ltd | | | 373,415 | |
| | |
| | 62,613 | | | Sinopharm Group Co Ltd | | | 301,907 | |
| | |
| | 4,922 | | | SSY Group Ltd | | | 4,138 | |
| | |
| | 2,686 | | | Tong Ren Tang Technologies Co Ltd | | | 3,844 | |
| | |
| | 3,294 | | | Top Glove Corp Bhd | | | 4,676 | |
| | |
| | 20 | | | ViroMed Co Ltd, (2) | | | 3,270 | |
| | |
| | 443 | | | Wuxi Biologics Cayman Inc., 144A, (2) | | | 3,156 | |
| | |
| | 21 | | | Yuhan Corp | | | 3,087 | |
| | | | Total Health Care | | | 995,627 | |
| | |
| | | | Industrials – 8.5% | | | |
| | |
| | 152,480 | | | Aboitiz Equity Ventures Inc. | | | 133,942 | |
| | |
| | 3,510 | | | Air China Ltd | | | 2,825 | |
| | |
| | 92,476 | | | Airports of Thailand PCL, (2) | | | 177,141 | |
| | |
| | 957 | | | Aselsan Elektronik Sanayi Ve Ticaret AS | | | 4,314 | |
| | |
| | 2,161 | | | Ashok Leyland Ltd | | | 3,343 | |
| | |
| | 258 | | | Bidvest Group Ltd/The | | | 3,211 | |
| | |
| | 16,084 | | | BOC Aviation Ltd, 144A | | | 114,997 | |
| | |
| | 14,935 | | | BTS Group Holdings PCL, (2), (3) | | | 4,122 | |
| | |
| | 4,972 | | | CAR Inc., (2) | | | 3,945 | |
| | |
| | 18,665 | | | CCR SA | | | 55,123 | |
| | |
| | 125,892 | | | China Conch Venture Holdings Ltd | | | 353,295 | |
| | |
| | 5,398 | | | China Eastern Airlines Corp Ltd | | | 2,982 | |
| | |
| | 33,031 | | | China International Marine Containers Group Co Ltd | | | 29,157 | |
| | |
| | 5,807 | | | China Southern Airlines Co Ltd | | | 3,141 | |
| | |
| | 30 | | | CJ Corp | | | 2,870 | |
42
| | | | | | | | |
| Shares | | | Description (1) | | Value | |
| | |
| | | | Industrials (continued) | | | |
| | |
| | 20,866 | | | COSCO SHIPPING Development Co Ltd, (2) | | $ | 2,129 | |
| | |
| | 66 | | | Daelim Industrial Co Ltd | | | 4,402 | |
| | |
| | 234 | | | Doosan Heavy Industries & Construction Co Ltd | | | 2,249 | |
| | |
| | 12,411 | | | DP World Ltd, (2) | | | 223,274 | |
| | |
| | 8,824 | | | Eva Airways Corp | | | 4,035 | |
| | |
| | 9,036 | | | Evergreen Marine Corp Taiwan Ltd | | | 3,329 | |
| | |
| | 224,704 | | | Far Eastern New Century Corp | | | 225,481 | |
| | |
| | 30,774 | | | Fullshare Holdings Ltd | | | 11,973 | |
| | |
| | 429 | | | Grupo Aeroportuario del Pacifico SAB de CV | | | 3,579 | |
| | |
| | 8,559 | | | Grupo Aeroportuario del Sureste SAB de CV | | | 141,633 | |
| | |
| | 136 | | | GS Engineering & Construction Corp | | | 4,983 | |
| | |
| | 2,026 | | | HAP Seng Consolidated Bhd | | | 4,769 | |
| | |
| | 315 | | | Hiwin Technologies Corp | | | 2,036 | |
| | |
| | 73 | | | Hyundai Engineering & Construction Co Ltd | | | 2,931 | |
| | |
| | 17,691 | | | Jasa Marga Persero Tbk PT | | | 4,829 | |
| | |
| | 75,430 | | | JG Summit Holdings Inc. | | | 66,682 | |
| | |
| | 345 | | | Latam Airlines Group SA | | | 3,146 | |
| | |
| | 5,792 | | | LG Corp | | | 336,984 | |
| | |
| | 656 | | | Localiza Rent a Car SA | | | 5,077 | |
| | |
| | 2,171 | | | Malaysia Airports Holdings Bhd | | | 4,306 | |
| | |
| | 24,115 | | | Rumo SA, (2) | | | 108,094 | |
| | |
| | 3,741 | | | Samsung C&T Corp | | | 356,192 | |
| | |
| | 2,247 | | | Siemens Ltd | | | 28,312 | |
| | |
| | 138,082 | | | Sime Darby Bhd | | | 72,597 | |
| | |
| | 145,640 | | | Sinotrans Ltd | | | 50,718 | |
| | |
| | 5,795 | | | SM Investments Corp | | | 97,477 | |
| | |
| | 4,819 | | | Taiwan High Speed Rail Corp | | | 4,781 | |
| | |
| | 922 | | | TAV Havalimanlari Holding AS | | | 3,827 | |
| | |
| | 5,227 | | | Teco Electric and Machinery Co Ltd | | | 2,998 | |
| | |
| | 2,997 | | | Turkiye Sise ve Cam Fabrikalari AS | | | 2,530 | |
| | |
| | 61,562 | | | WEG SA | | | 298,322 | |
| | |
| | 4,324 | | | Westports Holdings Bhd | | | 3,524 | |
| | |
| | 47,521 | | | Xinjiang Goldwind Science & Technology Co Ltd | | | 35,401 | |
| | | | Total Industrials | | | 3,017,008 | |
| | |
| | | | Information Technology – 19.7% | | | |
| | |
| | 19,369 | | | AAC Technologies Holdings Inc. | | | 147,379 | |
| | |
| | 5,200 | | | Acer Inc. | | | 3,647 | |
| | |
| | 97,437 | | | ASE Technology Holding Co Ltd | | | 196,493 | |
| | |
| | 483 | | | Asustek Computer Inc. | | | 3,575 | |
| | |
| | 524,047 | | | AU Optronics Corp | | | 206,618 | |
| | |
| | 3,683 | | | BYD Electronic International Co Ltd | | | 4,318 | |
43
Nushares ESG Emerging Markets Equity ETF (NUEM) (continued)
Portfolio of Investments October 31, 2018
| | | | | | | | |
| Shares | | | Description (1) | | Value | |
| | |
| | | | Information Technology (continued) | | | |
| | |
| | 357 | | | Catcher Technology Co Ltd | | $ | 3,594 | |
| | |
| | 1,823 | | | Chicony Electronics Co Ltd | | | 3,647 | |
| | |
| | 10,716 | | | Cielo SA | | | 38,081 | |
| | |
| | 64,605 | | | Delta Electronics Inc. | | | 271,423 | |
| | |
| | 2,240 | | | Delta Electronics Thailand PCL, (2), (3) | | | 4,662 | |
| | |
| | 1,719 | | | Foxconn Technology Co Ltd | | | 3,644 | |
| | |
| | 991,080 | | | GCL-Poly Energy Holdings Ltd, (2) | | | 58,787 | |
| | |
| | 4,537 | | | GDS Holdings Ltd, Sponsored ADR, (2) | | | 106,483 | |
| | |
| | 9,881 | | | HCL Technologies Ltd | | | 141,911 | |
| | |
| | 77,234 | | | Infosys Ltd | | | 716,461 | |
| | |
| | 12,115 | | | Innolux Corp | | | 3,669 | |
| | |
| | 5,545 | | | Inventec Corp | | | 4,471 | |
| | |
| | 53,348 | | | Kingboard Holdings Ltd | | | 142,907 | |
| | |
| | 3,607 | | | Kingdee International Software Group Co Ltd | | | 2,945 | |
| | |
| | 29,501 | | | Legend Holdings Corp, 144A | | | 80,156 | |
| | |
| | 557,460 | | | Lenovo Group Ltd | | | 354,839 | |
| | |
| | 17,985 | | | LG Display Co Ltd | | | 260,412 | |
| | |
| | 30 | | | LG Innotek Co Ltd | | | 3,264 | |
| | |
| | 3,608 | | | Lite-On Technology Corp | | | 4,139 | |
| | |
| | 2,944 | | | Macronix International | | | 1,632 | |
| | |
| | 30,858 | | | MediaTek Inc. | | | 226,875 | |
| | |
| | 1,032 | | | Micro-Star International Co Ltd | | | 2,278 | |
| | |
| | 12,423 | | | My EG Services Bhd | | | 3,563 | |
| | |
| | 2,416 | | | Quanta Computer Inc. | | | 3,814 | |
| | |
| | 2,482 | | | Samsung Electro-Mechanics Co Ltd | | | 257,010 | |
| | |
| | 2,988 | | | Samsung SDI Co Ltd | | | 617,502 | |
| | |
| | 254,339 | | | Taiwan Semiconductor Manufacturing Co Ltd | | | 1,923,388 | |
| | |
| | 24,314 | | | Tata Consultancy Services Ltd | | | 636,120 | |
| | |
| | 531 | | | Tech Mahindra Ltd | | | 5,342 | |
| | |
| | 71,754 | | | TravelSky Technology Ltd | | | 173,907 | |
| | |
| | 8,143 | | | United Microelectronics Corp | | | 3,105 | |
| | |
| | 2,056 | | | Vanguard International Semiconductor Corp, (2) | | | 3,787 | |
| | |
| | 556 | | | Win Semiconductors Corp, (2) | | | 1,707 | |
| | |
| | 87,460 | | | Wipro Ltd | | | 392,680 | |
| | |
| | 5,644 | | | Wistron Corp | | | 3,447 | |
| | |
| | 13,997 | | | Xinyi Solar Holdings Ltd | | | 4,374 | |
| | |
| | 393 | | | Yageo Corp | | | 4,007 | |
| | | | Total Information Technology | | | 7,032,063 | |
| | |
| | | | Materials – 8.7% | | | |
| | |
| | 2,155 | | | Anglo American Platinum Ltd | | | 70,333 | |
| | |
| | 257 | | | Asian Paints Ltd | | | 4,276 | |
44
| | | | | | | | |
| Shares | | | Description (1) | | Value | |
| | |
| | | | Materials (continued) | | | |
| | |
| | 9,230 | | | BBMG Corp | | $ | 2,543 | |
| | |
| | 288,972 | | | China Molybdenum Co Ltd | | | 107,267 | |
| | |
| | 126,392 | | | China Zhongwang Holdings Ltd | | | 56,107 | |
| | |
| | 41,433 | | | Empresas CMPC SA | | | 142,557 | |
| | |
| | 108,534 | | | Eregli Demir ve Celik Fabrikalari TAS | | | 175,489 | |
| | |
| | 10,960 | | | Fibria Celulose SA | | | 212,001 | |
| | |
| | 197 | | | Hanwha Chemical Corp | | | 2,792 | |
| | |
| | 2,280 | | | Indorama Ventures PCL, (2), (3) | | | 3,731 | |
| | |
| | 10,723 | | | Industrias Penoles SAB de CV | | | 151,438 | |
| | |
| | 10,826 | | | KGHM Polska Miedz SA | | | 245,543 | |
| | |
| | 4,995 | | | Kumba Iron Ore Ltd | | | 97,760 | |
| | |
| | 42 | | | Kumho Petrochemical Co Ltd | | | 3,173 | |
| | |
| | 119,973 | | | Lee & Man Paper Manufacturing Ltd | | | 102,689 | |
| | |
| | 1,752 | | | LG Chem Ltd | | | 533,495 | |
| | |
| | 288 | | | LG Chem Ltd | | | 50,420 | |
| | |
| | 1,325 | | | Lotte Chemical Corp | | | 305,219 | |
| | |
| | 208 | | | Mondi Ltd | | | 4,971 | |
| | |
| | 31,057 | | | Nan Ya Plastics Corp | | | 77,183 | |
| | |
| | 126,406 | | | Nine Dragons Paper Holdings Ltd | | | 120,611 | |
| | |
| | 26 | | | OCI Co Ltd | | | 1,944 | |
| | |
| | 9,013 | | | PhosAgro PJSC, GDR | | | 118,070 | |
| | |
| | 243 | | | Pidilite Industries Ltd | | | 3,155 | |
| | |
| | 4,170 | | | Polyus PJSC, GDR | | | 127,811 | |
| | |
| | 3,244 | | | Press Metal Aluminum Holdings Bhd | | | 3,752 | |
| | |
| | 86,906 | | | PTT Global Chemical PCL, (2) | | | 201,863 | |
| | |
| | 654 | | | Sappi Ltd | | | 3,673 | |
| | |
| | 285 | | | Siam Cement PCL/The | | | 3,542 | |
| | |
| | 256,761 | | | Sinopec Shanghai Petrochemical Co Ltd | | | 112,669 | |
| | |
| | 742 | | | Suzano Papel e Celulose SA | | | 7,561 | |
| | |
| | 5,682 | | | UPL Ltd | | | 51,606 | |
| | |
| | 5,044 | | | Zhaojin Mining Industry Co Ltd | | | 4,452 | |
| | | | Total Materials | | | 3,109,696 | |
| | |
| | | | Real Estate – 3.0% | | | |
| | |
| | 7,481 | | | Aldar Properties PJSC | | | 3,523 | |
| | |
| | 7,516 | | | Barwa Real Estate Co | | | 77,171 | |
| | |
| | 1,543 | | | BR Malls Participacoes SA | | | 5,276 | |
| | |
| | 35,312 | | | Bumi Serpong Damai Tbk PT | | | 2,555 | |
| | |
| | 1,771 | | | Central Pattana PCL, (2), (3) | | | 4,220 | |
| | |
| | 96,600 | | | China Vanke Co Ltd | | | 297,585 | |
| | |
| | 5,148 | | | CIFI Holdings Group Co Ltd | | | 2,154 | |
| | |
| | 4,895 | | | DAMAC Properties Dubai Co PJSC | | | 2,692 | |
45
Nushares ESG Emerging Markets Equity ETF (NUEM) (continued)
Portfolio of Investments October 31, 2018
| | | | | | | | |
| Shares | | | Description (1) | | Value | |
| | |
| | | | Real Estate (continued) | | | |
| | |
| | 7,561 | | | Emaar Malls PJSC | | $ | 3,767 | |
| | |
| | 14,022 | | | Emlak Konut Gayrimenkul Yatirim Ortakligi AS | | | 4,179 | |
| | |
| | 58,102 | | | Ezdan Holding Group QSC | | | 174,551 | |
| | |
| | 3,191 | | | Fibra Uno Administracion SA de CV | | | 3,427 | |
| | |
| | 3,253 | | | Fortress REIT Ltd | | | 3,725 | |
| | |
| | 44,557 | | | Fortress REIT Ltd | | | 43,422 | |
| | |
| | 2,775 | | | Greentown China Holdings Ltd | | | 1,926 | |
| | |
| | 520 | | | Hyprop Investments Ltd | | | 3,179 | |
| | |
| | 10,504 | | | IOI Properties Group Bhd | | | 3,288 | |
| | |
| | 2,229 | | | Jiayuan International Group Ltd | | | 3,912 | |
| | |
| | 7,672 | | | Kaisa Group Holdings Ltd | | | 1,869 | |
| | |
| | 11,302 | | | Land & Houses PCL, (2) | | | 3,512 | |
| | |
| | 70,230 | | | Longfor Group Holdings Ltd | | | 170,572 | |
| | |
| | 52,354 | | | Megaworld Corp | | | 4,315 | |
| | |
| | 797 | | | Multiplan Empreendimentos Imobiliarios SA | | | 4,935 | |
| | |
| | 12,313 | | | NEPI Rockcastle PLC | | | 106,226 | |
| | |
| | 120,370 | | | Pakuwon Jati Tbk PT | | | 3,785 | |
| | |
| | 5,674 | | | Redefine Properties Ltd | | | 3,685 | |
| | |
| | 641 | | | Resilient REIT Ltd | | | 2,597 | |
| | |
| | 3,179 | | | Ruentex Development Co Ltd | | | 4,397 | |
| | |
| | 3,015 | | | Shanghai Lujiazui Finance & Trade Zone Development Co Ltd | | | 3,829 | |
| | |
| | 9,969 | | | Shenzhen Investment Ltd | | | 2,861 | |
| | |
| | 14,224 | | | Shui On Land Ltd | | | 2,867 | |
| | |
| | 12,888 | | | Sime Darby Property Bhd | | | 3,003 | |
| | |
| | 6,188 | | | Sino-Ocean Group Holding Ltd | | | 2,423 | |
| | |
| | 68,313 | | | SM Prime Holdings Inc. | | | 43,154 | |
| | |
| | 158,136 | | | SOHO China Ltd, (2) | | | 53,657 | |
| | |
| | 5,948 | | | SP Setia Bhd Group | | | 2,985 | |
| | |
| | 7,768 | | | Yuzhou Properties Co Ltd | | | 2,775 | |
| | | | Total Real Estate | | | 1,063,999 | |
| | |
| | | | Utilities – 1.3% | | | |
| | |
| | 6,475 | | | Aboitiz Power Corp | | | 4,078 | |
| | |
| | 7,203 | | | Aguas Andinas SA | | | 3,765 | |
| | |
| | 436,674 | | | Beijing Enterprises Water Group Ltd | | | 222,253 | |
| | |
| | 244,560 | | | China Longyuan Power Group Corp Ltd | | | 185,930 | |
| | |
| | 2,071 | | | Cia Energetica de Minas Gerais | | | 6,150 | |
| | |
| | 1,176 | | | EDP – Energias do Brasil SA | | | 4,432 | |
| | |
| | 261 | | | Equatorial Energia SA | | | 4,777 | |
| | |
| | 10,897 | | | Huaneng Renewables Corp Ltd | | | 2,794 | |
| | |
| | 1,045 | | | Interconexion Electrica SA ESP | | | 3,880 | |
| | |
| | 786 | | | Manila Electric Co | | | 5,403 | |
46
| | | | | | | | |
| Shares | | | Description (1) | | Value | |
| | |
| | | | Utilities (continued) | | | |
| | |
| | 1,547 | | | Power Grid Corp of India Ltd | | $ | 3,891 | |
| | |
| | 43,438 | | | Towngas China Co Ltd | | | 31,584 | |
| | | | Total Utilities | | | 478,937 | |
| | | | Total Common Stocks (cost $40,518,514) | | | 35,618,254 | |
| | |
| Shares | | | Description (1) | | Value | |
| | |
| | | | COMMON STOCK RIGHTS – 0.0% | | | | |
| | |
| | 5 | | | Banco de Credito e Inversiones SA | | $ | 16 | |
| | |
| | 1,548 | | | BTS Group Holdings PCL | | | 3 | |
| | |
| | 1,402 | | | SACI Falabella | | | 141 | |
| | | | Total Common Stock Rights (cost $–) | | | 160 | |
| | | | Total Long-Term Investments (cost $40,518,514) | | | 35,618,414 | |
| | | | Other Assets Less Liabilities – 0.2% | | | 58,579 | |
| | | | Net Assets – 100% | | $ | 35,676,993 | |
For Fund portfolio compliance purposes, the Fund’s industry classifications refer to any one or more of the industry sub-classifications used by one or more widely recognized market indexes or ratings group indexes, and/or as defined by Fund management. This definition may not apply for purposes of this report, which may combine industry sub-classifications into sectors for reporting ease.
| (1) | All percentages shown in the Portfolio of Investments are based on net assets. |
| (2) | Non-income producing; issuer has not declared a dividend within the past twelve months. |
| (3) | For fair value measurement disclosure purposes, investment classified as Level 2. See Notes to Financial Statements, Note 2 – Investment Valuation and Fair Value Measurements for more information. |
| (4) | Investment valued at fair value using methods determined in good faith by, or at the discretion of, the Board. For fair value measurement disclosure purposes, investment classified as Level 3. See Notes to Financial Statements, Note 2 – Investment Valuation and Fair Value Measurements for more information. |
| 144A | Investment is exempt from registration under Rule 144A of the Securities Act of 1933, as amended. These investments may only be resold in transactions exempt from registration, which are normally transactions with qualified institutional buyers. |
| ADR | American Depositary Receipt |
| GDR | Global Depositary Receipt |
| REIT | Real Estate Investment Trust |
See accompanying notes to financial statements.
47
Nushares ESG International Developed Markets Equity ETF (NUDM)
Portfolio of Investments October 31, 2018
| | | | | | | | |
| Shares | | | Description (1) | | Value | |
| | |
| | | | LONG-TERM INVESTMENTS – 99.5% | | | | |
| | |
| | | | COMMON STOCKS – 99.5% | | | | |
| | |
| | | | Communication Services – 5.5% | | | |
| | |
| | 72 | | | Axel Springer SE | | $ | 4,789 | |
| | |
| | 1,767 | | | BT Group PLC | | | 5,431 | |
| | |
| | 175 | | | Eutelsat Communications SA | | | 3,551 | |
| | |
| | 540 | | | Informa PLC | | | 4,924 | |
| | |
| | 2,398 | | | ITV PLC | | | 4,564 | |
| | |
| | 162 | | | JCDecaux SA | | | 5,334 | |
| | |
| | 10,392 | | | KDDI Corp | | | 259,167 | |
| | |
| | 2,049 | | | Koninklijke KPN NV | | | 5,423 | |
| | |
| | 88 | | | Millicom International Cellular SA, Sponsored ADR | | | 4,978 | |
| | |
| | 296 | | | Nintendo Co Ltd | | | 92,219 | |
| | |
| | 15,237 | | | NTT DOCOMO Inc. | | | 384,047 | |
| | |
| | 356 | | | Orange SA | | | 5,574 | |
| | |
| | 479 | | | Pearson PLC | | | 5,500 | |
| | |
| | 159 | | | ProSiebenSat.1 Media SE | | | 3,679 | |
| | |
| | 73 | | | Publicis Groupe SA | | | 4,238 | |
| | |
| | 355 | | | Schibsted ASA | | | 11,277 | |
| | |
| | 241 | | | SES SA, Sponsored ADR | | | 5,181 | |
| | |
| | 2,622 | | | Singapore Press Holdings Ltd | | | 5,017 | |
| | |
| | 411 | | | Tele2 AB | | | 4,677 | |
| | |
| | 94 | | | Telenet Group Holding NV, (2) | | | 4,567 | |
| | |
| | 24,438 | | | Telenor ASA | | | 449,656 | |
| | |
| | 1,176 | | | Telia Co AB | | | 5,309 | |
| | |
| | 28,923 | | | Telstra Corp Ltd | | | 63,137 | |
| | |
| | 14,468 | | | Vivendi SA | | | 349,826 | |
| | |
| | 320,873 | | | Vodafone Group PLC | | | 606,055 | |
| | |
| | 10,045 | | | WPP PLC | | | 114,052 | |
| | | | Total Communication Services | | | 2,412,172 | |
| | |
| | | | Consumer Discretionary – 11.7% | | | |
| | |
| | 794 | | | Barratt Developments PLC | | | 5,215 | |
| | |
| | 5,359 | | | Bayerische Motoren Werke AG | | | 462,870 | |
| | |
| | 1,789 | | | Bayerische Motoren Werke AG | | | 135,203 | |
| | |
| | 135 | | | Benesse Holdings Inc. | | | 3,762 | |
| | |
| | 109 | | | Berkeley Group Holdings PLC | | | 4,876 | |
| | |
| | 193 | | | Burberry Group PLC | | | 4,466 | |
48
| | | | | | | | |
| Shares | | | Description (1) | | Value | |
| | |
| | | | Consumer Discretionary (continued) | | | |
| | |
| | 8,354 | | | Compass Group PLC | | $ | 164,385 | |
| | |
| | 8,308 | | | Denso Corp | | | 371,764 | |
| | |
| | 319 | | | Fast Retailing Co Ltd | | | 161,316 | |
| | |
| | 3,298 | | | Hennes & Mauritz AB | | | 58,363 | |
| | |
| | 24,514 | | | Honda Motor Co Ltd | | | 704,000 | |
| | |
| | 56 | | | HUGO BOSS AG | | | 4,009 | |
| | |
| | 7,191 | | | Industria de Diseno Textil SA | | | 203,124 | |
| | |
| | 470 | | | Kering SA | | | 209,605 | |
| | |
| | 26,887 | | | Kingfisher PLC | | | 87,502 | |
| | |
| | 190,649 | | | Li & Fung Ltd | | | 37,695 | |
| | |
| | 13,222 | | | Marks & Spencer Group PLC | | | 50,007 | |
| | |
| | 1,027 | | | Merlin Entertainments PLC, 144A | | | 4,241 | |
| | |
| | 71 | | | Next PLC | | | 4,721 | |
| | |
| | 181 | | | NGK Spark Plug Co Ltd | | | 3,676 | |
| | |
| | 136 | | | Nokian Renkaat OYJ | | | 4,327 | |
| | |
| | 4,916 | | | Oriental Land Co Ltd/Japan | | | 462,393 | |
| | |
| | 32,109 | | | Panasonic Corp | | | 355,502 | |
| | |
| | 88 | | | Pandora A/S | | | 5,507 | |
| | |
| | 328 | | | Peugeot SA | | | 7,816 | |
| | |
| | 10 | | | Puma SE | | | 5,144 | |
| | |
| | 28,184 | | | Rakuten Inc. | | | 190,799 | |
| | |
| | 4,960 | | | Renault SA | | | 371,309 | |
| | |
| | 324 | | | Sekisui Chemical Co Ltd | | | 5,090 | |
| | |
| | 3,769 | | | Sekisui House Ltd | | | 55,506 | |
| | |
| | 41,095 | | | Shangri-La Asia Ltd | | | 56,091 | |
| | |
| | 14,726 | | | Sony Corp | | | 801,184 | |
| | |
| | 155 | | | Stanley Electric Co Ltd | | | 4,594 | |
| | |
| | 10 | | | Swatch Group AG/The | | | 3,388 | |
| | |
| | 2,493 | | | Taylor Wimpey PLC | | | 5,144 | |
| | |
| | 113 | | | Valeo SA | | | 3,655 | |
| | |
| | 104 | | | Whitbread PLC | | | 5,847 | |
| | |
| | 6,276 | | | Yamada Denki Co Ltd | | | 29,585 | |
| | |
| | 108 | | | Yamaha Corp | | | 4,761 | |
| | |
| | 96 | | | Zalando SE, 144A, (2) | | | 3,720 | |
| | | | Total Consumer Discretionary | | | 5,062,162 | |
| | |
| | | | Consumer Staples – 13.2% | | | |
| | |
| | 16,286 | | | Aeon Co Ltd | | | 373,760 | |
| | |
| | 11,514 | | | Associated British Foods PLC | | | 351,029 | |
| | |
| | 3 | | | Barry Callebaut AG | | | 5,872 | |
| | |
| | 9,875 | | | Carrefour SA | | | 191,889 | |
| | |
| | 1,823 | | | Casino Guichard Perrachon SA | | | 80,556 | |
49
Nushares ESG International Developed Markets Equity ETF (NUDM) (continued)
Portfolio of Investments October 31, 2018
| | | | | | | | |
| Shares | | | Description (1) | | Value | |
| | |
| | | | Consumer Staples (continued) | | | |
| | |
| | 807 | | | Coca-Cola Amatil Ltd | | $ | 5,668 | |
| | |
| | 6,996 | | | Coca-Cola European Partners PLC | | | 318,248 | |
| | |
| | 5,508 | | | Coca-Cola HBC AG | | | 162,574 | |
| | |
| | 8,038 | | | Danone SA | | | 569,945 | |
| | |
| | 207 | | | Essity AB | | | 4,731 | |
| | |
| | 2,687 | | | Henkel AG & Co KGaA | | | 263,654 | |
| | |
| | 44 | | | Henkel AG & Co KGaA | | | 4,815 | |
| | |
| | 171 | | | ICA Gruppen AB | | | 6,060 | |
| | |
| | 57,056 | | | J Sainsbury PLC | | | 226,875 | |
| | |
| | 1,057 | | | Jeronimo Martins SGPS SA | | | 13,006 | |
| | |
| | 1,452 | | | Kao Corp | | | 96,894 | |
| | |
| | 48 | | | Kerry Group PLC | | | 4,922 | |
| | |
| | 212 | | | Koninklijke Ahold Delhaize NV | | | 4,859 | |
| | |
| | 560 | | | L’Oreal SA | | | 126,204 | |
| | |
| | 13,517 | | | Marine Harvest ASA | | | 328,077 | |
| | |
| | 5,905 | | | METRO AG | | | 88,986 | |
| | |
| | 17,109 | | | Nestle SA | | | 1,447,776 | |
| | |
| | 17,286 | | | Orkla ASA | | | 149,600 | |
| | |
| | 3,602 | | | Reckitt Benckiser Group PLC | | | 291,474 | |
| | |
| | 101 | | | Unilever NV, Sponsored ADR | | | 5,439 | |
| | |
| | 11,042 | | | Unilever PLC | | | 585,026 | |
| | |
| | 1,514 | | | Wm Morrison Supermarkets PLC | | | 4,799 | |
| | | | Total Consumer Staples | | | 5,712,738 | |
| | |
| | | | Energy – 3.3% | | | |
| | |
| | 8,481 | | | Caltex Australia Ltd | | | 169,868 | |
| | |
| | 7,376 | | | Enagas SA | | | 195,897 | |
| | |
| | 22,048 | | | John Wood Group PLC | | | 201,203 | |
| | |
| | 2,283 | | | Koninklijke Vopak NV | | | 103,470 | |
| | |
| | 4,167 | | | Neste Oyj | | | 343,530 | |
| | |
| | 6,127 | | | Showa Shell Sekiyu KK | | | 118,137 | |
| | |
| | 73,200 | | | Snam SpA | | | 303,060 | |
| | | | Total Energy | | | 1,435,165 | |
| | |
| | | | Financials – 20.7% | | | |
| | |
| | 3,154 | | | 3i Group PLC | | | 35,392 | |
| | |
| | 215 | | | ABN AMRO Group NV, Sponsored ADR, 144A | | | 5,286 | |
| | |
| | 19,100 | | | Aegon NV | | | 117,469 | |
| | |
| | 257 | | | AEON Financial Service Co Ltd | | | 5,046 | |
| | |
| | 26,656 | | | AIB Group PLC | | | 129,025 | |
| | |
| | 3,064 | | | Allianz SE | | | 640,314 | |
| | |
| | 2,751 | | | AMP Ltd | | | 4,816 | |
| | |
| | 344 | | | Assicurazioni Generali SpA | | | 5,566 | |
50
| | | | | | | | |
| Shares | | | Description (1) | | Value | |
| | |
| | | | Financials (continued) | | | |
| | |
| | 104 | | | ASX Ltd | | $ | 4,361 | |
| | |
| | 29,474 | | | Australia & New Zealand Banking Group Ltd | | | 541,670 | |
| | |
| | 12,192 | | | Aviva PLC | | | 66,753 | |
| | |
| | 13,319 | | | AXA SA | | | 334,117 | |
| | |
| | 54,855 | | | Banco Bilbao Vizcaya Argentaria SA | | | 303,620 | |
| | |
| | 15,961 | | | Bank Hapoalim BM | | | 108,059 | |
| | |
| | 9,157 | | | Bank Leumi Le-Israel BM | | | 57,124 | |
| | |
| | 654 | | | Bendigo & Adelaide Bank Ltd | | | 4,742 | |
| | |
| | 98 | | | BNP Paribas SA | | | 5,122 | |
| | |
| | 55,773 | | | BOC Hong Kong Holdings Ltd | | | 208,453 | |
| | |
| | 34,777 | | | CaixaBank SA, (2) | | | 141,106 | |
| | |
| | 5,531 | | | CNP Assurances | | | 123,458 | |
| | |
| | 531 | | | Commerzbank AG, (2) | | | 5,017 | |
| | |
| | 16,485 | | | Commonwealth Bank of Australia | | | 808,865 | |
| | |
| | 32,883 | | | DBS Group Holdings Ltd | | | 557,073 | |
| | |
| | 38 | | | Deutsche Boerse AG | | | 4,816 | |
| | |
| | 979 | | | Erste Group Bank AG | | | 39,933 | |
| | |
| | 1,506 | | | Eurazeo SE | | | 110,146 | |
| | |
| | 6,525 | | | Hang Seng Bank Ltd | | | 152,816 | |
| | |
| | 16,390 | | | Hong Kong Exchanges & Clearing Ltd | | | 434,870 | |
| | |
| | 1,595 | | | ING Groep NV | | | 18,940 | |
| | |
| | 848 | | | Insurance Australia Group Ltd | | | 4,105 | |
| | |
| | 184,752 | | | Intesa Sanpaolo SpA | | | 408,828 | |
| | |
| | 21,755 | | | Investec PLC | | | 134,540 | |
| | |
| | 13,287 | | | Investor AB | | | 576,710 | |
| | |
| | 81 | | | KBC Group NV | | | 5,589 | |
| | |
| | 6,519 | | | Kinnevik AB | | | 181,097 | |
| | |
| | 171 | | | L E Lundbergforetagen AB | | | 5,284 | |
| | |
| | 1,441 | | | Legal & General Group PLC | | | 4,631 | |
| | |
| | 84 | | | London Stock Exchange Group PLC | | | 4,631 | |
| | |
| | 299 | | | Mizrahi Tefahot Bank Ltd | | | 5,035 | |
| | |
| | 181 | | | MS&AD Insurance Group Holdings Inc. | | | 5,463 | |
| | |
| | 38 | | | Muenchener Rueckversicherungs-Gesellschaft AG in Muenchen | | | 8,178 | |
| | |
| | 5,858 | | | Natixis SA | | | 34,289 | |
| | |
| | 639 | | | ORIX Corp | | | 10,424 | |
| | |
| | 2,306 | | | Prudential PLC | | | 46,275 | |
| | |
| | 126 | | | Schroders PLC | | | 4,315 | |
| | |
| | 519 | | | Skandinaviska Enskilda Banken AB | | | 5,381 | |
| | |
| | 944 | | | Sompo Holdings Inc. | | | 39,147 | |
| | |
| | 78,551 | | | Standard Chartered PLC | | | 551,525 | |
| | |
| | 10,770 | | | Sumitomo Mitsui Trust Holdings Inc. | | | 428,872 | |
51
Nushares ESG International Developed Markets Equity ETF (NUDM) (continued)
Portfolio of Investments October 31, 2018
| | | | | | | | |
| Shares | | | Description (1) | | Value | |
| | |
| | | | Financials (continued) | | | |
| | |
| | 258 | | | Swedbank AB | | $ | 5,818 | |
| | |
| | 6,099 | | | Swiss Re AG | | | 551,511 | |
| | |
| | 307 | | | T&D Holdings Inc. | | | 4,948 | |
| | |
| | 8,123 | | | Tokio Marine Holdings Inc. | | | 384,791 | |
| | |
| | 38 | | | Wendel SA | | | 4,934 | |
| | |
| | 30,268 | | | Westpac Banking Corp | | | 575,998 | |
| | | | Total Financials | | | 8,966,294 | |
| | |
| | | | Health Care – 9.7% | | | |
| | |
| | 603 | | | Alfresa Holdings Corp | | | 16,110 | |
| | |
| | 35,280 | | | Astellas Pharma Inc. | | | 546,136 | |
| | |
| | 11,588 | | | AstraZeneca PLC | | | 886,913 | |
| | |
| | 4,161 | | | Chugai Pharmaceutical Co Ltd | | | 244,450 | |
| | |
| | 23 | | | Cochlear Ltd | | | 2,895 | |
| | |
| | 52 | | | Coloplast A/S | | | 4,857 | |
| | |
| | 28,699 | | | ConvaTec Group PLC, 144A | | | 59,406 | |
| | |
| | 619 | | | CSL Ltd | | | 82,479 | |
| | |
| | 7,355 | | | Eisai Co Ltd | | | 613,335 | |
| | |
| | 40 | | | EssilorLuxottica SA | | | 5,473 | |
| | |
| | 377 | | | Fisher & Paykel Healthcare Corp Ltd | | | 3,348 | |
| | |
| | 35 | | | Genmab A/S, (2) | | | 4,797 | |
| | |
| | 84 | | | H Lundbeck A/S | | | 3,924 | |
| | |
| | 56,466 | | | Healthscope Ltd | | | 84,443 | |
| | |
| | 2,537 | | | Koninklijke Philips NV | | | 94,630 | |
| | |
| | 505 | | | Lonza Group AG | | | 158,995 | |
| | |
| | 12,100 | | | Mediclinic International PLC | | | 58,210 | |
| | |
| | 52 | | | Merck KGaA | | | 5,575 | |
| | |
| | 3,374 | | | NMC Health PLC | | | 152,269 | |
| | |
| | 5,562 | | | Novo Nordisk A/S | | | 240,651 | |
| | |
| | 149 | | | QIAGEN NV, (2) | | | 5,414 | |
| | |
| | 124 | | | Ramsay Health Care Ltd | | | 4,941 | |
| | |
| | 3,763 | | | Roche Holding AG | | | 916,902 | |
| | |
| | 504 | | | Ryman Healthcare Ltd | | | 3,982 | |
| | |
| | 31 | | | Sartorius AG | | | 4,496 | |
| | |
| | 103 | | | Shionogi & Co Ltd | | | 6,600 | |
| | |
| | 26 | | | Sonova Holding AG | | | 4,253 | |
| | |
| | 655 | | | Sumitomo Dainippon Pharma Co Ltd | | | 13,709 | |
| | |
| | 58 | | | UCB SA | | | 4,875 | |
| | | | Total Health Care | | | 4,234,068 | |
| | |
| | | | Industrials – 17.9% | | | |
| | |
| | 20,168 | | | ABB Ltd | | | 407,009 | |
| | |
| | 99 | | | Adecco Group AG | | | 4,856 | |
52
| | | | | | | | |
| Shares | | | Description (1) | | Value | |
| | |
| | | | Industrials (continued) | | | |
| | |
| | 963 | | | Aeroports de Paris | | $ | 201,749 | |
| | |
| | 127 | | | Alstom SA | | | 5,562 | |
| | |
| | 5,657 | | | Ashtead Group PLC | | | 139,902 | |
| | |
| | 254 | | | Assa Abloy AB | | | 5,072 | |
| | |
| | 198 | | | Atlas Copco AB | | | 4,909 | |
| | |
| | 1,170 | | | Auckland International Airport Ltd | | | 5,340 | |
| | |
| | 6,125 | | | Bouygues SA | | | 223,743 | |
| | |
| | 867 | | | Brambles Ltd | | | 6,526 | |
| | |
| | 94 | | | Brenntag AG | | | 4,917 | |
| | |
| | 227 | | | Bureau Veritas SA | | | 5,131 | |
| | |
| | 8,996 | | | Cie de Saint-Gobain | | | 338,813 | |
| | |
| | 20,228 | | | CNH Industrial NV | | | 210,537 | |
| | |
| | 3,188 | | | Daifuku Co Ltd | | | 137,288 | |
| | |
| | 5,580 | | | Daikin Industries Ltd | | | 648,952 | |
| | |
| | 55 | | | DCC PLC | | | 4,719 | |
| | |
| | 8,732 | | | Deutsche Post AG | | | 276,532 | |
| | |
| | 46 | | | DSV A/S | | | 3,700 | |
| | |
| | 2,351 | | | Edenred | | | 89,317 | |
| | |
| | 1,335 | | | Eiffage SA | | | 130,721 | |
| | |
| | 311 | | | Ferguson PLC | | | 20,994 | |
| | |
| | 15,751 | | | Ferrovial SA | | | 315,886 | |
| | |
| | 557 | | | Fraport AG Frankfurt Airport Services Worldwide | | | 43,105 | |
| | |
| | 12 | | | Geberit AG | | | 4,704 | |
| | |
| | 13,954 | | | Getlink | | | 175,735 | |
| | |
| | 59 | | | HOCHTIEF AG | | | 8,757 | |
| | |
| | 2,701 | | | Intertek Group PLC | | | 161,792 | |
| | |
| | 159 | | | ISS A/S | | | 5,230 | |
| | |
| | 1,087 | | | Kajima Corp | | | 14,024 | |
| | |
| | 310 | | | Kawasaki Heavy Industries Ltd | | | 7,359 | |
| | |
| | 124 | | | Keio Corp | | | 6,735 | |
| | |
| | 75 | | | KION Group AG | | | 4,393 | |
| | |
| | 19,514 | | | Komatsu Ltd | | | 509,140 | |
| | |
| | 359 | | | Kubota Corp | | | 5,669 | |
| | |
| | 183 | | | Kyushu Railway Co | | | 5,611 | |
| | |
| | 76 | | | Legrand SA | | | 4,972 | |
| | |
| | 25,243 | | | Meggitt PLC | | | 170,883 | |
| | |
| | 414 | | | Mitsubishi Electric Corp | | | 5,259 | |
| | |
| | 49,100 | | | MTR Corp Ltd | | | 238,003 | |
| | |
| | 1,688 | | | MTU Aero Engines AG | | | 359,184 | |
| | |
| | 245 | | | Nagoya Railroad Co Ltd | | | 5,918 | |
| | |
| | 279 | | | NGK Insulators Ltd | | | 3,923 | |
53
Nushares ESG International Developed Markets Equity ETF (NUDM) (continued)
Portfolio of Investments October 31, 2018
| | | | | | | | |
| Shares | | | Description (1) | | Value | |
| | |
| | | | Industrials (continued) | | | |
| | |
| | 147 | | | Nippon Express Co Ltd | | $ | 9,313 | |
| | |
| | 6,267 | | | Obayashi Corp | | | 55,365 | |
| | |
| | 3,255 | | | OSRAM Licht AG | | | 132,107 | |
| | |
| | 77 | | | Randstad NV | | | 3,887 | |
| | |
| | 6,639 | | | Recruit Holdings Co Ltd | | | 178,660 | |
| | |
| | 17,276 | | | RELX PLC | | | 342,153 | |
| | |
| | 8,264 | | | Rexel SA | | | 105,527 | |
| | |
| | 29,330 | | | Royal Mail PLC | | | 134,540 | |
| | |
| | 313 | | | Sandvik AB | | | 4,962 | |
| | |
| | 7,546 | | | Schneider Electric SE | | | 546,858 | |
| | |
| | 2 | | | SGS SA | | | 4,756 | |
| | |
| | 605 | | | Shimizu Corp | | | 4,911 | |
| | |
| | 6,931 | | | Siemens AG | | | 798,824 | |
| | |
| | 59 | | | Societe BIC SA | | | 5,655 | |
| | |
| | 124 | | | Sohgo Security Services Co Ltd | | | 5,527 | |
| | |
| | 2,593 | | | Sydney Airport | | | 11,835 | |
| | |
| | 116 | | | Taisei Corp | | | 4,970 | |
| | |
| | 346 | | | Tokyu Corp | | | 5,712 | |
| | |
| | 46,668 | | | Transurban Group | | | 375,081 | |
| | |
| | 1,011 | | | Travis Perkins PLC | | | 14,300 | |
| | |
| | 4,746 | | | Volvo AB | | | 71,036 | |
| | |
| | 232 | | | Weir Group PLC/The | | | 4,701 | |
| | |
| | 87 | | | Wolters Kluwer NV | | | 4,944 | |
| | | | Total Industrials | | | 7,758,195 | |
| | |
| | | | Information Technology – 4.0% | | | |
| | |
| | 794 | | | Amadeus IT Group SA | | | 64,037 | |
| | |
| | 1,861 | | | ASML Holding NV | | | 318,231 | |
| | |
| | 38 | | | Dassault Systemes SE | | | 4,773 | |
| | |
| | 4,573 | | | Fujitsu Ltd | | | 278,055 | |
| | |
| | 90 | | | Ingenico Group SA | | | 6,388 | |
| | |
| | 2,582 | | | Konica Minolta Inc. | | | 25,647 | |
| | |
| | 39 | | | Murata Manufacturing Co Ltd | | | 5,932 | |
| | |
| | 901 | | | Nokia OYJ | | | 5,104 | |
| | |
| | 100 | | | Omron Corp | | | 4,058 | |
| | |
| | 6,629 | | | SAP SE | | | 710,990 | |
| | |
| | 12,025 | | | STMicroelectronics NV | | | 182,846 | |
| | |
| | 15,631 | | | Telefonaktiebolaget LM Ericsson | | | 136,442 | |
| | |
| | 137 | | | Yaskawa Electric Corp | | | 3,964 | |
| | |
| | 270 | | | Yokogawa Electric Corp | | | 5,314 | |
| | | | Total Information Technology | | | 1,751,781 | |
54
| | | | | | | | |
| Shares | | | Description (1) | | Value | |
| | |
| | | | Materials – 6.9% | | | |
| | |
| | 2,050 | | | Akzo Nobel NV | | $ | 172,534 | |
| | |
| | 552 | | | Amcor Ltd/Australia | | | 5,203 | |
| | |
| | 39 | | | Arkema SA | | | 4,100 | |
| | |
| | 21,305 | | | Asahi Kasei Corp | | | 256,177 | |
| | |
| | 8,879 | | | Boliden AB | | | 203,184 | |
| | |
| | 1,253 | | | Chr Hansen Holding A/S | | | 126,695 | |
| | |
| | 1,981 | | | Covestro AG, 144A | | | 128,210 | |
| | |
| | 140 | | | Croda International PLC | | | 8,622 | |
| | |
| | 2,094 | | | Daicel Corp | | | 22,173 | |
| | |
| | 1,138 | | | Fletcher Building Ltd | | | 4,488 | |
| | |
| | 4 | | | Givaudan SA | | | 9,719 | |
| | |
| | 2,688 | | | Hitachi Chemical Co Ltd | | | 42,420 | |
| | |
| | 7,029 | | | Hitachi Metals Ltd | | | 82,962 | |
| | |
| | 6,280 | | | Johnson Matthey PLC | | | 238,562 | |
| | |
| | 6,185 | | | K+S AG | | | 115,420 | |
| | |
| | 272 | | | Kaneka Corp | | | 11,376 | |
| | |
| | 1,100 | | | Kansai Paint Co Ltd | | | 16,287 | |
| | |
| | 1,171 | | | Koninklijke DSM NV | | | 102,668 | |
| | |
| | 627 | | | Mitsubishi Chemical Holdings Corp | | | 4,895 | |
| | |
| | 69 | | | Nitto Denko Corp | | | 4,327 | |
| | |
| | 261 | | | Novozymes A/S | | | 12,902 | |
| | |
| | 4,399 | | | Showa Denko KK | | | 192,168 | |
| | |
| | 82 | | | Sika AG | | | 10,532 | |
| | |
| | 9,520 | | | Stora Enso OYJ | | | 143,516 | |
| | |
| | 48,260 | | | Sumitomo Chemical Co Ltd | | | 242,038 | |
| | |
| | 7,598 | | | Sumitomo Metal Mining Co Ltd | | | 239,678 | |
| | |
| | 380 | | | Teijin Ltd | | | 6,600 | |
| | |
| | 37,874 | | | Toray Industries Inc. | | | 269,117 | |
| | |
| | 6,798 | | | Umicore SA | | | 320,346 | |
| | | | Total Materials | | | 2,996,919 | |
| | |
| | | | Real Estate – 2.8% | | | |
| | |
| | 1,368 | | | Azrieli Group Ltd | | | 66,375 | |
| | |
| | 8,169 | | | British Land Co PLC/The | | | 61,793 | |
| | |
| | 66,441 | | | CapitaLand Ltd | | | 150,653 | |
| | |
| | 10,599 | | | City Developments Ltd | | | 60,542 | |
| | |
| | 1,593 | | | Daiwa House Industry Co Ltd | | | 48,120 | |
| | |
| | 120 | | | Deutsche Wohnen SE | | | 5,498 | |
| | |
| | 775 | | | Dexus | | | 5,603 | |
| | |
| | 33 | | | Gecina SA | | | 4,850 | |
| | |
| | 702 | | | Goodman Group | | | 5,164 | |
| | |
| | 10,420 | | | Hammerson PLC | | | 58,383 | |
55
Nushares ESG International Developed Markets Equity ETF (NUDM) (continued)
Portfolio of Investments October 31, 2018
| | | | | | | | |
| Shares | | | Description (1) | | Value | |
| | |
| | | | Real Estate (continued) | | | |
| | |
| | 496 | | | Hulic Co Ltd | | $ | 4,549 | |
| | |
| | 20,204 | | | Hysan Development Co Ltd | | | 94,714 | |
| | |
| | 62 | | | ICADE | | | 5,262 | |
| | |
| | 3 | | | Japan Retail Fund Investment Corp | | | 5,540 | |
| | |
| | 140 | | | Klepierre SA | | | 4,759 | |
| | |
| | 378 | | | LendLease Group | | | 4,715 | |
| | |
| | 14,363 | | | Mitsui Fudosan Co Ltd | | | 323,774 | |
| | |
| | 3 | | | Nippon Prologis REIT Inc. | | | 6,050 | |
| | |
| | 568 | | | Segro PLC | | | 4,461 | |
| | |
| | 1,846 | | | Stockland | | | 4,723 | |
| | |
| | 38,030 | | | Swire Properties Ltd | | | 129,768 | |
| | |
| | 26 | | | Unibail-Rodamco-Westfield | | | 4,722 | |
| | |
| | 951 | | | UOL Group Ltd | | | 4,141 | |
| | |
| | 25,066 | | | Wharf Real Estate Investment Co Ltd | | | 155,236 | |
| | | | Total Real Estate | | | 1,219,395 | |
| | |
| | | | Utilities – 3.8% | | | |
| | |
| | 27,201 | | | Meridian Energy Ltd | | | 55,685 | |
| | |
| | 65,131 | | | National Grid PLC | | | 690,070 | |
| | |
| | 6,130 | | | Orsted A/S, 144A | | | 389,601 | |
| | |
| | 14,062 | | | Red Electrica Corp SA, (2) | | | 291,573 | |
| | |
| | 22,172 | | | United Utilities Group PLC | | | 205,848 | |
| | | | Total Utilities | | | 1,632,777 | |
| | | | Total Long-Term Investments (cost $47,466,372) | | | 43,181,666 | |
| | | | Other Assets Less Liabilities – 0.5% | | | 202,071 | |
| | | | Net Assets – 100% | | $ | 43,383,737 | |
For Fund portfolio compliance purposes, the Fund’s industry classifications refer to any one or more of the industry sub-classifications used by one or more widely recognized market indexes or ratings group indexes, and/or as defined by Fund management. This definition may not apply for purposes of this report, which may combine industry sub-classifications into sectors for reporting ease.
| (1) | All percentages shown in the Portfolio of Investments are based on net assets. |
| (2) | Non-income producing; issuer has not declared a dividend within the past twelve months. |
| 144A | Investment is exempt from registration under Rule 144A of the Securities Act of 1933, as amended. These investments may only be resold in transactions exempt from registration, which are normally transactions with qualified institutional buyers. |
| ADR | American Depositary Receipt |
| REIT | Real Estate Investment Trust |
See accompanying notes to financial statements.
56
Nushares ESG Large-Cap Growth ETF (NULG)
Portfolio of Investments October 31, 2018
| | | | | | | | |
| Shares | | | Description (1) | | Value | |
| | |
| | | | LONG-TERM INVESTMENTS – 99.8% | | | | |
| | |
| | | | COMMON STOCKS – 99.8% | | | | |
| | |
| | | | Communication Services – 11.4% | | | | |
| | |
| | 2,179 | | | Alphabet Inc., (2) | | $ | 2,346,282 | |
| | |
| | 2,580 | | | Liberty Broadband Corp, (2) | | | 213,959 | |
| | |
| | 9,448 | | | Liberty Global PLC, (2) | | | 242,152 | |
| | |
| | 528 | | | Liberty Global PLC, (2) | | | 13,221 | |
| | |
| | 4,442 | | | Netflix Inc., (2) | | | 1,340,507 | |
| | |
| | 9,996 | | | T-Mobile US Inc., (2) | | | 685,226 | |
| | |
| | 14,217 | | | Walt Disney Co/The | | | 1,632,538 | |
| | |
| | 8,400 | | | Zayo Group Holdings Inc., (2) | | | 250,992 | |
| | | | Total Communication Services | | | 6,724,877 | |
| | |
| | | | Consumer Discretionary – 13.7% | | | |
| | |
| | 11,880 | | | Aramark | | | 426,730 | |
| | |
| | 596 | | | Booking Holdings Inc., (2) | | | 1,117,250 | |
| | |
| | 620 | | | CarMax Inc., (2) | | | 42,104 | |
| | |
| | 70 | | | Hasbro Inc. | | | 6,420 | |
| | |
| | 1,538 | | | Hilton Worldwide Holdings Inc. | | | 109,459 | |
| | |
| | 8,750 | | | Home Depot Inc./The | | | 1,538,950 | |
| | |
| | 14,946 | | | LKQ Corp, (2) | | | 407,577 | |
| | |
| | 11,767 | | | Lowe’s Cos Inc. | | | 1,120,454 | |
| | |
| | 864 | | | Mohawk Industries Inc., (2) | | | 107,767 | |
| | |
| | 11,412 | | | NIKE Inc. | | | 856,356 | |
| | |
| | 38 | | | PVH Corp | | | 4,590 | |
| | |
| | 4,411 | | | Starbucks Corp | | | 257,029 | |
| | |
| | 3,067 | | | Tesla Inc., (2) | | | 1,034,560 | |
| | |
| | 2,838 | | | TJX Cos Inc./The | | | 311,839 | |
| | |
| | 107 | | | Tractor Supply Co | | | 9,832 | |
| | |
| | 3,646 | | | Under Armour Inc., (2) | | | 80,613 | |
| | |
| | 8,496 | | | Under Armour Inc., (2) | | | 168,476 | |
| | |
| | 1,956 | | | Vail Resorts Inc. | | | 491,582 | |
| | | | Total Consumer Discretionary | | | 8,091,588 | |
| | |
| | | | Consumer Staples – 2.1% | | | |
| | |
| | 139 | | | Colgate-Palmolive Co | | | 8,277 | |
| | |
| | 1,940 | | | Costco Wholesale Corp | | | 443,542 | |
| | |
| | 2,918 | | | Estee Lauder Cos Inc./The | | | 401,050 | |
| | |
| | 2,914 | | | McCormick & Co Inc./MD | | | 419,616 | |
| | | | Total Consumer Staples | | | 1,272,485 | |
57
Nushares ESG Large-Cap Growth ETF (NULG) (continued)
Portfolio of Investments October 31, 2018
| | | | | | | | |
| Shares | | | Description (1) | | Value | |
| | |
| | | | Energy – 2.7% | | | |
| | |
| | 20,205 | | | Baker Hughes a GE Co | | $ | 539,271 | |
| | |
| | 10,235 | | | Cheniere Energy Inc., (2) | | | 618,296 | |
| | |
| | 137 | | | National Oilwell Varco Inc. | | | 5,042 | |
| | |
| | 8,578 | | | Schlumberger Ltd | | | 440,137 | |
| | | | Total Energy | | | 1,602,746 | |
| | |
| | | | Financials – 7.0% | | | |
| | |
| | 10,865 | | | American Express Co | | | 1,116,161 | |
| | |
| | 1,962 | | | BlackRock Inc. | | | 807,206 | |
| | |
| | 4,214 | | | Marsh & McLennan Cos Inc. | | | 357,137 | |
| | |
| | 843 | | | Moody’s Corp | | | 122,640 | |
| | |
| | 7,249 | | | Progressive Corp/The | | | 505,255 | |
| | |
| | 4,956 | | | S&P Global Inc. | | | 903,578 | |
| | |
| | 56 | | | Signature Bank/New York NY | | | 6,154 | |
| | |
| | 1,320 | | | SVB Financial Group, (2) | | | 313,144 | |
| | | | Total Financials | | | 4,131,275 | |
| | |
| | | | Health Care – 12.1% | | | |
| | |
| | 14,742 | | | AbbVie Inc. | | | 1,147,665 | |
| | |
| | 2,045 | | | ABIOMED Inc., (2) | | | 697,754 | |
| | |
| | 109 | | | Agilent Technologies Inc. | | | 7,062 | |
| | |
| | 2,583 | | | Align Technology Inc., (2) | | | 571,360 | |
| | |
| | 3,771 | | | Becton Dickinson and Co | | | 869,216 | |
| | |
| | 30 | | | Biogen Inc., (2) | | | 9,128 | |
| | |
| | 482 | | | BioMarin Pharmaceutical Inc., (2) | | | 44,426 | |
| | |
| | 10,212 | | | Bristol-Myers Squibb Co | | | 516,114 | |
| | |
| | 8,849 | | | Celgene Corp, (2) | | | 633,588 | |
| | |
| | 176 | | | Cigna Corp | | | 37,631 | |
| | |
| | 27 | | | Cooper Cos Inc./The | | | 6,974 | |
| | |
| | 3,305 | | | Edwards Lifesciences Corp, (2) | | | 487,818 | |
| | |
| | 1,984 | | | HCA Inc. | | | 264,924 | |
| | |
| | 204 | | | Henry Schein Inc., (2) | | | 16,932 | |
| | |
| | 2,832 | | | Humana Inc. | | | 907,401 | |
| | |
| | 2,698 | | | IQVIA Holdings Inc., (2) | | | 331,665 | |
| | |
| | 39 | | | Jazz Pharmaceuticals PLC, (2) | | | 6,194 | |
| | |
| | 63 | | | Laboratory Corp of America Holdings, (2) | | | 10,115 | |
| | |
| | 65 | | | ResMed Inc. | | | 6,885 | |
| | |
| | 60 | | | Varian Medical Systems Inc., (2) | | | 7,162 | |
| | |
| | 1,804 | | | Vertex Pharmaceuticals Inc., (2) | | | 305,706 | |
| | |
| | 38 | | | Waters Corp, (2) | | | 7,208 | |
| | |
| | 3,114 | | | Zoetis Inc. | | | 280,727 | |
| | | | Total Health Care | | | 7,173,655 | |
58
| | | | | | | | |
| Shares | | | Description (1) | | Value | |
| | |
| | | | Industrials – 11.5% | | | |
| | |
| | 94 | | | Acuity Brands Inc. | | $ | 11,810 | |
| | |
| | 105 | | | AGCO Corp | | | 5,884 | |
| | |
| | 420 | | | AMERCO | | | 137,122 | |
| | |
| | 4,705 | | | AO Smith Corp | | | 214,219 | |
| | |
| | 3,363 | | | CH Robinson Worldwide Inc. | | | 299,408 | |
| | |
| | 931 | | | Copart Inc., (2) | | | 45,535 | |
| | |
| | 8,448 | | | Expeditors International of Washington Inc. | | | 567,537 | |
| | |
| | 520 | | | Fortive Corp | | | 38,610 | |
| | |
| | 128 | | | Fortune Brands Home & Security Inc. | | | 5,738 | |
| | |
| | 9,459 | | | IHS Markit Ltd, (2) | | | 496,881 | |
| | |
| | 999 | | | Illinois Tool Works Inc. | | | 127,442 | |
| | |
| | 7,895 | | | Ingersoll-Rand PLC | | | 757,446 | |
| | |
| | 31 | | | Lennox International Inc. | | | 6,538 | |
| | |
| | 96 | | | Robert Half International Inc. | | | 5,811 | |
| | |
| | 1,461 | | | Rockwell Automation Inc. | | | 240,671 | |
| | |
| | 6,251 | | | Rockwell Collins Inc. | | | 800,253 | |
| | |
| | 3,074 | | | Roper Technologies Inc. | | | 869,635 | |
| | |
| | 142 | | | Sensata Technologies Holding PLC, (2) | | | 6,660 | |
| | |
| | 5,520 | | | Spirit AeroSystems Holdings Inc. | | | 463,735 | |
| | |
| | 80 | | | Stanley Black & Decker Inc. | | | 9,322 | |
| | |
| | 2,290 | | | TransDigm Group Inc., (2) | | | 756,273 | |
| | |
| | 8,905 | | | TransUnion | | | 585,504 | |
| | |
| | 54 | | | WABCO Holdings Inc. | | | 5,802 | |
| | |
| | 23 | | | WW Grainger Inc. | | | 6,531 | |
| | |
| | 5,627 | | | Xylem Inc./NY | | | 369,019 | |
| | | | Total Industrials | | | 6,833,386 | |
| | |
| | | | Information Technology – 33.8% | | | |
| | |
| | 7,897 | | | Accenture PLC | | | 1,244,725 | |
| | |
| | 5,516 | | | Adobe Inc., (2) | | | 1,355,612 | |
| | |
| | 27,506 | | | Apple Inc. | | | 6,019,963 | |
| | |
| | 13,411 | | | Applied Materials Inc. | | | 440,954 | |
| | |
| | 6,880 | | | Autodesk Inc., (2) | | | 889,240 | |
| | |
| | 7,634 | | | Automatic Data Processing Inc. | | | 1,099,907 | |
| | |
| | 13,683 | | | Cadence Design Systems Inc., (2) | | | 609,851 | |
| | |
| | 4,947 | | | Intuit Inc. | | | 1,043,817 | |
| | |
| | 339 | | | Jack Henry & Associates Inc. | | | 50,792 | |
| | |
| | 30,447 | | | Microsoft Corp | | | 3,252,044 | |
| | |
| | 5,899 | | | NVIDIA Corp | | | 1,243,686 | |
| | |
| | 8,831 | | | salesforce.com Inc., (2) | | | 1,211,966 | |
| | |
| | 11,518 | | | Texas Instruments Inc. | | | 1,069,216 | |
| | |
| | 211 | | | Trimble Inc., (2) | | | 7,887 | |
59
Nushares ESG Large-Cap Growth ETF (NULG) (continued)
Portfolio of Investments October 31, 2018
| | | | | | | | |
| Shares | | | Description (1) | | Value | |
| | |
| | | | Information Technology (continued) | | | |
| | |
| | 3,577 | | | VMware Inc., (2) | | $ | 505,752 | |
| | | | Total Information Technology | | | 20,045,412 | |
| | |
| | | | Materials – 2.9% | | | |
| | |
| | 251 | | | Axalta Coating Systems Ltd, (2) | | | 6,195 | |
| | |
| | 3,521 | | | Ball Corp | | | 157,741 | |
| | |
| | 6,302 | | | Ecolab Inc. | | | 965,151 | |
| | |
| | 5,386 | | | PPG Industries Inc. | | | 566,015 | |
| | | | Total Materials | | | 1,695,102 | |
| | |
| | | | Real Estate – 2.6% | | | |
| | |
| | 7,107 | | | American Tower Corp | | | 1,107,342 | |
| | |
| | 902 | | | CBRE Group Inc., (2) | | | 36,342 | |
| | |
| | 5,836 | | | Prologis Inc. | | | 376,247 | |
| | | | Total Real Estate | | | 1,519,931 | |
| | | | Total Long-Term Investments (cost $56,839,961) | | | 59,090,457 | |
| | | | Other Assets Less Liabilities – 0.2% | | | 121,145 | |
| | | | Net Assets – 100% | | $ | 59,211,602 | |
For Fund portfolio compliance purposes, the Fund’s industry classifications refer to any one or more of the industry sub-classifications used by one or more widely recognized market indexes or ratings group indexes, and/or as defined by Fund management. This definition may not apply for purposes of this report, which may combine industry sub-classifications into sectors for reporting ease.
| (1) | All percentages shown in the Portfolio of Investments are based on net assets. |
| (2) | Non-income producing; issuer has not declared a dividend within the past twelve months. |
See accompanying notes to financial statements.
60
Nushares ESG Large-Cap Value ETF (NULV)
Portfolio of Investments October 31, 2018
| | | | | | | | |
| Shares | | | Description (1) | | Value | |
| | |
| | | | LONG-TERM INVESTMENTS – 99.8% | | | | |
| | |
| | | | COMMON STOCKS – 99.8% | | | | |
| | |
| | | | Communication Services – 7.7% | | | |
| | |
| | 28,581 | | | CenturyLink Inc. | | $ | 589,912 | |
| | |
| | 35,163 | | | Comcast Corp | | | 1,341,117 | |
| | |
| | 163 | | | Discovery Inc., (2) | | | 5,280 | |
| | |
| | 178 | | | Discovery Inc., (2) | | | 5,217 | |
| | |
| | 68 | | | Liberty Broadband Corp, (2) | | | 5,639 | |
| | |
| | 477 | | | Omnicom Group Inc. | | | 35,451 | |
| | |
| | 97 | | | TripAdvisor Inc., (2) | | | 5,058 | |
| | |
| | 27,391 | | | Verizon Communications Inc. | | | 1,563,752 | |
| | |
| | 168 | | | Viacom Inc. | | | 5,373 | |
| | | | Total Communication Services | | | 3,556,799 | |
| | |
| | | | Consumer Discretionary – 5.2% | | | |
| | |
| | 30 | | | Advance Auto Parts Inc. | | | 4,793 | |
| | |
| | 2,293 | | | Aptiv PLC | | | 176,102 | |
| | |
| | 2,023 | | | Autoliv Inc. | | | 168,597 | |
| | |
| | 64 | | | Best Buy Co Inc. | | | 4,490 | |
| | |
| | 97 | | | BorgWarner Inc. | | | 3,823 | |
| | |
| | 1,011 | | | Darden Restaurants Inc. | | | 107,722 | |
| | |
| | 151 | | | Gap Inc./The | | | 4,122 | |
| | |
| | 996 | | | Garmin Ltd | | | 65,895 | |
| | |
| | 61 | | | Genuine Parts Co | | | 5,973 | |
| | |
| | 2,297 | | | Goodyear Tire & Rubber Co/The | | | 48,375 | |
| | |
| | 333 | | | H&R Block Inc. | | | 8,838 | |
| | |
| | 257 | | | Hanesbrands Inc. | | | 4,410 | |
| | |
| | 6,535 | | | Harley-Davidson Inc. | | | 249,768 | |
| | |
| | 161 | | | L Brands Inc. | | | 5,220 | |
| | |
| | 74 | | | Lennar Corp | | | 3,181 | |
| | |
| | 19,069 | | | Newell Brands Inc. | | | 302,816 | |
| | |
| | 101 | | | Nordstrom Inc. | | | 6,643 | |
| | |
| | 3,457 | | | Royal Caribbean Cruises Ltd | | | 362,052 | |
| | |
| | 152 | | | Tapestry Inc. | | | 6,431 | |
| | |
| | 9,331 | | | Target Corp | | | 780,352 | |
| | |
| | 695 | | | Tiffany & Co | | | 77,354 | |
| | |
| | 123 | | | Toll Brothers Inc. | | | 4,140 | |
| | |
| | 64 | | | VF Corp | | | 5,304 | |
| | |
| | 28 | | | Whirlpool Corp | | | 3,073 | |
| | | | Total Consumer Discretionary | | | 2,409,474 | |
61
Nushares ESG Large-Cap Value ETF (NULV) (continued)
Portfolio of Investments October 31, 2018
| | | | | | | | |
| Shares | | | Description (1) | | Value | |
| | |
| | | | Consumer Staples – 12.5% | | | |
| | |
| | 5,523 | | | Bunge Ltd | | $ | 341,321 | |
| | |
| | 101 | | | Campbell Soup Co | | | 3,778 | |
| | |
| | 29,132 | | | Coca-Cola Co/The | | | 1,394,840 | |
| | |
| | 1,520 | | | Colgate-Palmolive Co | | | 90,516 | |
| | |
| | 12,738 | | | General Mills Inc. | | | 557,924 | |
| | |
| | 126 | | | Hormel Foods Corp | | | 5,499 | |
| | |
| | 114 | | | Kellogg Co | | | 7,465 | |
| | |
| | 534 | | | Kimberly-Clark Corp | | | 55,696 | |
| | |
| | 136 | | | McCormick & Co Inc./MD | | | 19,584 | |
| | |
| | 19,726 | | | Mondelez International Inc. | | | 828,097 | |
| | |
| | 8,164 | | | PepsiCo Inc. | | | 917,470 | |
| | |
| | 17,181 | | | Procter & Gamble Co/The | | | 1,523,611 | |
| | | | Total Consumer Staples | | | 5,745,801 | |
| | |
| | | | Energy – 5.4% | | | |
| | |
| | 3,292 | | | HollyFrontier Corp | | | 222,012 | |
| | |
| | 10,674 | | | ONEOK Inc. | | | 700,214 | |
| | |
| | 12,153 | | | Schlumberger Ltd | | | 623,570 | |
| | |
| | 95 | | | Targa Resources Corp | | | 4,909 | |
| | |
| | 8,371 | | | TechnipFMC PLC | | | 220,157 | |
| | |
| | 7,049 | | | Valero Energy Corp | | | 642,093 | |
| | |
| | 2,513 | | | Williams Cos Inc./The | | | 61,141 | |
| | | | Total Energy | | | 2,474,096 | |
| | |
| | | | Financials – 22.2% | | | |
| | |
| | 3,195 | | | Allstate Corp/The | | | 305,825 | |
| | |
| | 165 | | | Ally Financial Inc. | | | 4,193 | |
| | |
| | 13,650 | | | American International Group Inc. | | | 563,609 | |
| | |
| | 33 | | | Ameriprise Financial Inc. | | | 4,199 | |
| | |
| | 163 | | | Arch Capital Group Ltd, (2) | | | 4,624 | |
| | |
| | 66 | | | Arthur J Gallagher & Co | | | 4,885 | |
| | |
| | 44 | | | Assurant Inc. | | | 4,277 | |
| | |
| | 57,611 | | | Bank of America Corp | | | 1,584,303 | |
| | |
| | 14,376 | | | Bank of New York Mellon Corp/The | | | 680,416 | |
| | |
| | 14,184 | | | BB&T Corp | | | 697,285 | |
| | |
| | 7,973 | | | Capital One Financial Corp | | | 711,989 | |
| | |
| | 6,306 | | | Chubb Ltd | | | 787,682 | |
| | |
| | 117 | | | Citizens Financial Group Inc. | | | 4,370 | |
| | |
| | 4,509 | | | CME Group Inc. | | | 826,229 | |
| | |
| | 60 | | | Discover Financial Services | | | 4,180 | |
| | |
| | 5,688 | | | East West Bancorp Inc. | | | 298,279 | |
| | |
| | 8,336 | | | Franklin Resources Inc. | | | 254,248 | |
| | |
| | 41,912 | | | Huntington Bancshares Inc./OH | | | 600,599 | |
62
| | | | | | | | |
| Shares | | | Description (1) | | Value | |
| | |
| | | | Financials (continued) | | | |
| | |
| | 196 | | | Invesco Ltd | | $ | 4,255 | |
| | |
| | 32,338 | | | KeyCorp | | | 587,258 | |
| | |
| | 72 | | | Lincoln National Corp | | | 4,334 | |
| | |
| | 27 | | | M&T Bank Corp | | | 4,466 | |
| | |
| | 6,975 | | | Marsh & McLennan Cos Inc. | | | 591,131 | |
| | |
| | 99 | | | Morgan Stanley | | | 4,520 | |
| | |
| | 53 | | | Nasdaq Inc. | | | 4,596 | |
| | |
| | 235 | | | People’s United Financial Inc. | | | 3,680 | |
| | |
| | 149 | | | PNC Financial Services Group Inc./The | | | 19,145 | |
| | |
| | 72 | | | Principal Financial Group Inc. | | | 3,389 | |
| | |
| | 4,097 | | | Prudential Financial Inc. | | | 384,217 | |
| | |
| | 53 | | | Raymond James Financial Inc. | | | 4,065 | |
| | |
| | 246 | | | Regions Financial Corp | | | 4,175 | |
| | |
| | 125 | | | State Street Corp | | | 8,594 | |
| | |
| | 2,469 | | | Travelers Cos Inc./The | | | 308,946 | |
| | |
| | 17,419 | | | US Bancorp | | | 910,491 | |
| | |
| | 94 | | | Voya Financial Inc. | | | 4,113 | |
| | |
| | 29 | | | Willis Towers Watson PLC | | | 4,152 | |
| | |
| | 96 | | | Zions Bancorp NA | | | 4,517 | |
| | | | Total Financials | | | 10,201,236 | |
| | |
| | | | Health Care – 13.8% | | | |
| | |
| | 16,022 | | | Abbott Laboratories | | | 1,104,557 | |
| | |
| | 84 | | | Agilent Technologies Inc. | | | 5,442 | |
| | |
| | 2,876 | | | Allergan PLC | | | 454,437 | |
| | |
| | 37 | | | Alnylam Pharmaceuticals Inc., (2) | | | 2,976 | |
| | |
| | 92 | | | Amgen Inc. | | | 17,737 | |
| | |
| | 716 | | | Becton Dickinson and Co | | | 165,038 | |
| | |
| | 681 | | | Cardinal Health Inc. | | | 34,459 | |
| | |
| | 12,293 | | | CVS Health Corp | | | 889,890 | |
| | |
| | 4,132 | | | Danaher Corp | | | 410,721 | |
| | |
| | 9,659 | | | Eli Lilly & Co | | | 1,047,422 | |
| | |
| | 10,258 | | | Gilead Sciences Inc. | | | 699,390 | |
| | |
| | 19,421 | | | Merck & Co Inc. | | | 1,429,580 | |
| | |
| | 56 | | | Perrigo Co PLC | | | 3,937 | |
| | |
| | 704 | | | Quest Diagnostics Inc. | | | 66,253 | |
| | |
| | 85 | | | Seattle Genetics Inc., (2) | | | 4,771 | |
| | | | Total Health Care | | | 6,336,610 | |
| | |
| | | | Industrials – 6.5% | | | |
| | |
| | 4,139 | | | 3M Co | | | 787,486 | |
| | |
| | 4,528 | | | Caterpillar Inc. | | | 549,337 | |
| | |
| | 300 | | | Cummins Inc. | | | 41,007 | |
63
Nushares ESG Large-Cap Value ETF (NULV) (continued)
Portfolio of Investments October 31, 2018
| | | | | | | | |
| Shares | | | Description (1) | | Value | |
| | |
| | | | Industrials (continued) | | | |
| | |
| | 52 | | | Deere & Co | | $ | 7,043 | |
| | |
| | 93 | | | Flowserve Corp | | | 4,269 | |
| | |
| | 91 | | | IHS Markit Ltd, (2) | | | 4,780 | |
| | |
| | 18,873 | | | Johnson Controls International plc | | | 603,370 | |
| | |
| | 51 | | | ManpowerGroup Inc. | | | 3,891 | |
| | |
| | 70 | | | Owens Corning | | | 3,309 | |
| | |
| | 1,445 | | | Parker-Hannifin Corp | | | 219,105 | |
| | |
| | 27 | | | Rockwell Automation Inc. | | | 4,448 | |
| | |
| | 548 | | | Snap-on Inc. | | | 84,359 | |
| | |
| | 4,682 | | | Union Pacific Corp | | | 684,602 | |
| | | | Total Industrials | | | 2,997,006 | |
| | |
| | | | Information Technology – 12.5% | | | |
| | |
| | 40,183 | | | Hewlett Packard Enterprise Co | | | 612,791 | |
| | |
| | 31,392 | | | HP Inc. | | | 757,803 | |
| | |
| | 31,172 | | | Intel Corp | | | 1,461,343 | |
| | |
| | 7,799 | | | International Business Machines Corp | | | 900,239 | |
| | |
| | 87 | | | Keysight Technologies Inc., (2) | | | 4,966 | |
| | |
| | 15,818 | | | Microsoft Corp | | | 1,689,521 | |
| | |
| | 4,264 | | | TE Connectivity Ltd | | | 321,591 | |
| | |
| | 121 | | | Trimble Inc., (2) | | | 4,523 | |
| | | | Total Information Technology | | | 5,752,777 | |
| | |
| | | | Materials – 4.0% | | | |
| | |
| | 146 | | | Ball Corp | | | 6,541 | |
| | |
| | 46 | | | International Flavors & Fragrances Inc. | | | 6,654 | |
| | |
| | 3,333 | | | International Paper Co | | | 151,185 | |
| | |
| | 4,424 | | | Linde PLC | | | 732,039 | |
| | |
| | 2,849 | | | LyondellBasell Industries NV | | | 254,330 | |
| | |
| | 5,926 | | | Mosaic Co/The | | | 183,350 | |
| | |
| | 3,888 | | | Newmont Mining Corp | | | 120,217 | |
| | |
| | 3,520 | | | PPG Industries Inc. | | | 369,917 | |
| | |
| | 377 | | | Steel Dynamics Inc. | | | 14,929 | |
| | |
| | 87 | | | WestRock Co | | | 3,738 | |
| | | | Total Materials | | | 1,842,900 | |
| | |
| | | | Real Estate – 3.4% | | | |
| | |
| | 37 | | | Alexandria Real Estate Equities Inc. | | | 4,523 | |
| | |
| | 59 | | | Boston Properties Inc. | | | 7,125 | |
| | |
| | 43 | | | Digital Realty Trust Inc. | | | 4,440 | |
| | |
| | 185 | | | Duke Realty Corp | | | 5,100 | |
| | |
| | 3,559 | | | HCP Inc. | | | 98,050 | |
| | |
| | 234 | | | Host Hotels & Resorts Inc. | | | 4,472 | |
64
| | | | | | | | |
| Shares | | | Description (1) | | Value | |
| | |
| | | | Real Estate (continued) | | | |
| | |
| | 139 | | | Iron Mountain Inc. | | $ | 4,255 | |
| | |
| | 31 | | | Jones Lang LaSalle Inc. | | | 4,100 | |
| | |
| | 6,706 | | | Kimco Realty Corp | | | 107,900 | |
| | |
| | 98 | | | Liberty Property Trust | | | 4,103 | |
| | |
| | 74 | | | Macerich Co/The | | | 3,820 | |
| | |
| | 56 | | | Mid-America Apartment Communities Inc. | | | 5,472 | |
| | |
| | 65 | | | Regency Centers Corp | | | 4,118 | |
| | |
| | 164 | | | UDR Inc. | | | 6,427 | |
| | |
| | 1,197 | | | Ventas Inc. | | | 69,474 | |
| | |
| | 10,644 | | | Welltower Inc. | | | 703,249 | |
| | |
| | 18,805 | | | Weyerhaeuser Co | | | 500,777 | |
| | | | Total Real Estate | | | 1,537,405 | |
| | |
| | | | Utilities – 6.6% | | | |
| | |
| | 104 | | | CMS Energy Corp | | | 5,150 | |
| | |
| | 8,876 | | | Consolidated Edison Inc. | | | 674,576 | |
| | |
| | 8,954 | | | Edison International | | | 621,318 | |
| | |
| | 10,087 | | | Eversource Energy | | | 638,104 | |
| | |
| | 61 | | | Pinnacle West Capital Corp | | | 5,017 | |
| | |
| | 7,809 | | | Public Service Enterprise Group Inc. | | | 417,235 | |
| | |
| | 6,237 | | | Sempra Energy | | | 686,818 | |
| | | | Total Utilities | | | 3,048,218 | |
| | | | Total Long-Term Investments (cost $46,091,142) | | | 45,902,322 | |
| | | | Other Assets Less Liabilities – 0.2% | | | 92,499 | |
| | | | Net Assets – 100% | | $ | 45,994,821 | |
For Fund portfolio compliance purposes, the Fund’s industry classifications refer to any one or more of the industry sub-classifications used by one or more widely recognized market indexes or ratings group indexes, and/or as defined by Fund management. This definition may not apply for purposes of this report, which may combine industry sub-classifications into sectors for reporting ease.
| (1) | All percentages shown in the Portfolio of Investments are based on net assets. |
| (2) | Non-income producing; issuer has not declared a dividend within the past twelve months. |
See accompanying notes to financial statements.
65
Nushares ESG Mid-Cap Growth ETF (NUMG)
Portfolio of Investments October 31, 2018
| | | | | | | | |
| Shares | | | Description (1) | | Value | |
| | |
| | | | LONG-TERM INVESTMENTS – 99.8% | | | | |
| | |
| | | | COMMON STOCKS – 99.8% | | | | |
| | |
| | | | Communication Services – 5.5% | | | |
| | |
| | 7,056 | | | Liberty Broadband Corp, (2) | | $ | 585,154 | |
| | |
| | 8,658 | | | Take-Two Interactive Software Inc., (2) | | | 1,115,756 | |
| | |
| | 5,453 | | | TripAdvisor Inc., (2) | | | 284,319 | |
| | |
| | 24,173 | | | Zayo Group Holdings Inc., (2) | | | 722,289 | |
| | | | Total Communication Services | | | 2,707,518 | |
| | |
| | | | Consumer Discretionary – 13.0% | | | |
| | |
| | 23,751 | | | Aramark | | | 853,136 | |
| | |
| | 13,140 | | | CarMax Inc., (2) | | | 892,337 | |
| | |
| | 3,704 | | | Hasbro Inc. | | | 339,694 | |
| | |
| | 16,232 | | | LKQ Corp, (2) | | | 442,647 | |
| | |
| | 2,446 | | | Lululemon Athletica Inc., (2) | | | 344,226 | |
| | |
| | 34,439 | | | Mattel Inc. | | | 467,682 | |
| | |
| | 3,276 | | | MercadoLibre Inc. | | | 1,063,062 | |
| | |
| | 36 | | | PVH Corp | | | 4,348 | |
| | |
| | 2,338 | | | Tractor Supply Co | | | 214,839 | |
| | |
| | 29,083 | | | Under Armour Inc., (2) | | | 643,025 | |
| | |
| | 14,080 | | | Under Armour Inc., (2) | | | 279,206 | |
| | |
| | 3,484 | | | Vail Resorts Inc. | | | 875,599 | |
| | | | Total Consumer Discretionary | | | 6,419,801 | |
| | |
| | | | Consumer Staples – 2.1% | | | |
| | |
| | 7,284 | | | McCormick & Co Inc./MD | | | 1,048,896 | |
| | |
| | | | Energy – 2.1% | | | |
| | |
| | 16,951 | | | Cheniere Energy Inc., (2) | | | 1,024,010 | |
| | |
| | | | Financials – 3.7% | | | |
| | |
| | 189 | | | Arch Capital Group Ltd, (2) | | | 5,362 | |
| | |
| | 54 | | | Comerica Inc. | | | 4,404 | |
| | |
| | 10,794 | | | E*TRADE Financial Corp | | | 533,439 | |
| | |
| | 5,584 | | | First Republic Bank/CA | | | 508,088 | |
| | |
| | 58 | | | Signature Bank/New York NY | | | 6,374 | |
| | |
| | 3,186 | | | SVB Financial Group, (2) | | | 755,815 | |
| | | | Total Financials | | | 1,813,482 | |
| | |
| | | | Health Care – 14.6% | | | |
| | |
| | 2,357 | | | ABIOMED Inc., (2) | | | 804,208 | |
| | |
| | 4,057 | | | Align Technology Inc., (2) | | | 897,408 | |
| | |
| | 12,739 | | | Henry Schein Inc., (2) | | | 1,057,337 | |
66
| | | | | | | | |
| Shares | | | Description (1) | | Value | |
| | |
| | | | Health Care (continued) | | | |
| | |
| | 161 | | | IDEXX Laboratories Inc., (2) | | $ | 34,151 | |
| | |
| | 4,090 | | | Jazz Pharmaceuticals PLC, (2) | | | 649,574 | |
| | |
| | 6,741 | | | Laboratory Corp of America Holdings, (2) | | | 1,082,268 | |
| | |
| | 1,293 | | | Mettler-Toledo International Inc., (2) | | | 707,038 | |
| | |
| | 8,964 | | | ResMed Inc. | | | 949,467 | |
| | |
| | 5,459 | | | Waters Corp, (2) | | | 1,035,518 | |
| | | | Total Health Care | | | 7,216,969 | |
| | |
| | | | Industrials – 26.1% | | | |
| | |
| | 4,844 | | | Acuity Brands Inc. | | | 608,600 | |
| | |
| | 4,456 | | | AGCO Corp | | | 249,714 | |
| | |
| | 1,815 | | | Allegion PLC | | | 155,600 | |
| | |
| | 2,066 | | | AMERCO | | | 674,508 | |
| | |
| | 9,073 | | | CH Robinson Worldwide Inc. | | | 807,769 | |
| | |
| | 16,903 | | | Copart Inc., (2) | | | 826,726 | |
| | |
| | 7,946 | | | Expeditors International of Washington Inc. | | | 533,812 | |
| | |
| | 13,332 | | | Fastenal Co | | | 685,398 | |
| | |
| | 955 | | | Fortune Brands Home & Security Inc. | | | 42,813 | |
| | |
| | 15,248 | | | HD Supply Holdings Inc., (2) | | | 572,867 | |
| | |
| | 37 | | | IDEX Corp | | | 4,692 | |
| | |
| | 2,911 | | | Lennox International Inc. | | | 613,901 | |
| | |
| | 22,709 | | | Masco Corp | | | 681,270 | |
| | |
| | 6,132 | | | Middleby Corp/The, (2) | | | 688,624 | |
| | |
| | 12,383 | | | Robert Half International Inc. | | | 749,543 | |
| | |
| | 17,117 | | | Sensata Technologies Holding PLC, (2) | | | 802,787 | |
| | |
| | 11,103 | | | Spirit AeroSystems Holdings Inc. | | | 932,763 | |
| | |
| | 14,514 | | | TransUnion | | | 954,296 | |
| | |
| | 5,936 | | | United Rentals Inc., (2) | | | 712,735 | |
| | |
| | 2,015 | | | WABCO Holdings Inc. | | | 216,512 | |
| | |
| | 1,748 | | | WW Grainger Inc. | | | 496,380 | |
| | |
| | 13,839 | | | Xylem Inc./NY | | | 907,562 | |
| | | | Total Industrials | | | 12,918,872 | |
| | |
| | | | Information Technology – 23.7% | | | |
| | |
| | 59,502 | | | Advanced Micro Devices Inc., (2) | | | 1,083,531 | |
| | |
| | 14,267 | | | Akamai Technologies Inc., (2) | | | 1,030,791 | |
| | |
| | 3,051 | | | ANSYS Inc., (2) | | | 456,277 | |
| | |
| | 2,221 | | | Arista Networks Inc., (2) | | | 511,607 | |
| | |
| | 8,490 | | | Broadridge Financial Solutions Inc. | | | 992,821 | |
| | |
| | 20,559 | | | Cadence Design Systems Inc., (2) | | | 916,315 | |
| | |
| | 2,214 | | | Citrix Systems Inc. | | | 226,869 | |
| | |
| | 3,698 | | | Cognex Corp | | | 158,422 | |
67
Nushares ESG Mid-Cap Growth ETF (NUMG) (continued)
Portfolio of Investments October 31, 2018
| | | | | | | | |
| Shares | | | Description (1) | | Value | |
| | |
| | | | Information Technology (continued) | | | |
| | |
| | 14,447 | | | CommScope Holding Co Inc., (2) | | $ | 347,595 | |
| | |
| | 31 | | | F5 Networks Inc., (2) | | | 5,434 | |
| | |
| | 1,125 | | | Flex Ltd, (2) | | | 8,843 | |
| | |
| | 15,116 | | | FLIR Systems Inc. | | | 700,022 | |
| | |
| | 13,023 | | | Fortinet Inc., (2) | | | 1,070,230 | |
| | |
| | 1,340 | | | Jack Henry & Associates Inc. | | | 200,772 | |
| | |
| | 6,898 | | | Keysight Technologies Inc., (2) | | | 393,738 | |
| | |
| | 11,177 | | | Maxim Integrated Products Inc. | | | 559,074 | |
| | |
| | 13,322 | | | Microchip Technology Inc. | | | 876,321 | |
| | |
| | 1,256 | | | Skyworks Solutions Inc. | | | 108,971 | |
| | |
| | 17,254 | | | Square Inc., (2) | | | 1,267,306 | |
| | |
| | 20,711 | | | Trimble Inc., (2) | | | 774,177 | |
| | | | Total Information Technology | | | 11,689,116 | |
| | |
| | | | Materials – 6.0% | | | |
| | |
| | 55 | | | Avery Dennison Corp | | | 4,990 | |
| | |
| | 28,671 | | | Axalta Coating Systems Ltd, (2) | | | 707,600 | |
| | |
| | 19,445 | | | Ball Corp | | | 871,136 | |
| | |
| | 5,514 | | | International Flavors & Fragrances Inc. | | | 797,655 | |
| | |
| | 18,130 | | | Sealed Air Corp | | | 586,687 | |
| | | | Total Materials | | | 2,968,068 | |
| | |
| | | | Real Estate – 3.0% | | | |
| | |
| | 5,825 | | | CBRE Group Inc., (2) | | | 234,689 | |
| | |
| | 5,811 | | | SBA Communications Corp, (2) | | | 942,370 | |
| | |
| | 8,157 | | | UDR Inc. | | | 319,673 | |
| | | | Total Real Estate | | | 1,496,732 | |
| | | | Total Long-Term Investments (cost $49,497,770) | | | 49,303,464 | |
| | | | Other Assets Less Liabilities – 0.2% | | | 84,932 | |
| | | | Net Assets – 100% | | $ | 49,388,396 | |
For Fund portfolio compliance purposes, the Fund’s industry classifications refer to any one or more of the industry sub-classifications used by one or more widely recognized market indexes or ratings group indexes, and/or as defined by Fund management. This definition may not apply for purposes of this report, which may combine industry sub-classifications into sectors for reporting ease.
| (1) | All percentages shown in the Portfolio of Investments are based on net assets. |
| (2) | Non-income producing; issuer has not declared a dividend within the past twelve months. |
See accompanying notes to financial statements.
68
Nushares ESG Mid-Cap Value ETF (NUMV)
Portfolio of Investments October 31, 2018
| | | | | | | | |
| Shares | | | Description (1) | | Value | |
| | |
| | | | LONG-TERM INVESTMENTS – 99.8% | | | | |
| | |
| | | | COMMON STOCKS – 99.8% | | | | |
| | |
| | | | Communications Services – 6.9% | | | |
| | |
| | 53,803 | | | CenturyLink Inc. | | $ | 1,110,494 | |
| | |
| | 4,505 | | | Discovery Inc., (2) | | | 145,917 | |
| | |
| | 21,883 | | | Discovery Inc., (2) | | | 641,391 | |
| | |
| | 9,462 | | | Liberty Broadband Corp, (2) | | | 784,684 | |
| | |
| | 11,103 | | | TripAdvisor Inc., (2) | | | 578,910 | |
| | | | Total Communication Services | | | 3,261,396 | |
| | |
| | | | Consumer Discretionary – 15.9% | | | |
| | |
| | 14,284 | | | Best Buy Co Inc. | | | 1,002,165 | |
| | |
| | 5,458 | | | BorgWarner Inc. | | | 215,100 | |
| | |
| | 9,054 | | | Darden Restaurants Inc. | | | 964,704 | |
| | |
| | 7,569 | | | Gap Inc./The | | | 206,634 | |
| | |
| | 13,135 | | | Garmin Ltd | | | 869,012 | |
| | |
| | 10,490 | | | Genuine Parts Co | | | 1,027,181 | |
| | |
| | 43,884 | | | Hanesbrands Inc. | | | 753,049 | |
| | |
| | 19,499 | | | Harley-Davidson Inc. | | | 745,252 | |
| | |
| | 654 | | | Kohl’s Corp | | | 49,527 | |
| | |
| | 3,579 | | | Macy’s Inc. | | | 122,724 | |
| | |
| | 237 | | | Nordstrom Inc. | | | 15,587 | |
| | |
| | 8,146 | | | Tiffany & Co | | | 906,650 | |
| | |
| | 5,917 | | | Whirlpool Corp | | | 649,450 | |
| | | | Total Consumer Discretionary | | | 7,527,035 | |
| | |
| | | | Consumer Staples – 5.4% | | | |
| | |
| | 14,097 | | | Bunge Ltd | | | 871,195 | |
| | |
| | 6,545 | | | JM Smucker Co/The | | | 708,954 | |
| | |
| | 6,920 | | | McCormick & Co Inc./MD | | | 996,480 | |
| | | | Total Consumer Staples | | | 2,576,629 | |
| | |
| | | | Energy – 1.9% | | | |
| | |
| | 34,850 | | | TechnipFMC PLC | | | 916,555 | |
| | |
| | | | Financials – 19.7% | | | |
| | |
| | 29,869 | | | Ally Financial Inc. | | | 758,971 | |
| | |
| | 14,233 | | | Arthur J Gallagher & Co | | | 1,053,384 | |
| | |
| | 7,595 | | | Assurant Inc. | | | 738,310 | |
| | |
| | 29,517 | | | Citizens Financial Group Inc. | | | 1,102,460 | |
| | |
| | 4,350 | | | East West Bancorp Inc. | | | 228,114 | |
| | |
| | 14,808 | | | Huntington Bancshares Inc./OH | | | 212,199 | |
69
Nushares ESG Mid-Cap Value ETF (NUMV) (continued)
Portfolio of Investments October 31, 2018
| | | | | | | | |
| Shares | | | Description (1) | | Value | |
| | |
| | | | Financials (continued) | | | |
| | |
| | 694 | | | Invesco Ltd | | $ | 15,067 | |
| | |
| | 16,088 | | | Lincoln National Corp | | | 968,337 | |
| | |
| | 10,321 | | | Nasdaq Inc. | | | 894,934 | |
| | |
| | 36,805 | | | New York Community Bancorp Inc. | | | 352,592 | |
| | |
| | 43,338 | | | People’s United Financial Inc. | | | 678,673 | |
| | |
| | 19,563 | | | Principal Financial Group Inc. | | | 920,830 | |
| | |
| | 7,977 | | | Raymond James Financial Inc. | | | 611,756 | |
| | |
| | 22,376 | | | Regions Financial Corp | | | 379,721 | |
| | |
| | 3,801 | | | Voya Financial Inc. | | | 166,332 | |
| | |
| | 4,899 | | | Zions Bancorp NA | | | 230,498 | |
| | | | Total Financials | | | 9,312,178 | |
| | |
| | | | Health Care – 2.0% | | | |
| | |
| | 14,765 | | | DENTSPLY SIRONA Inc. | | | 511,312 | |
| | |
| | 4,444 | | | Quest Diagnostics Inc. | | | 418,225 | |
| | |
| | 72 | | | ResMed Inc. | | | 7,626 | |
| | | | Total Health Care | | | 937,163 | |
| | |
| | | | Industrials – 9.8% | | | |
| | |
| | 6,563 | | | CH Robinson Worldwide Inc. | | | 584,304 | |
| | |
| | 14,160 | | | Flowserve Corp | | | 649,944 | |
| | |
| | 4,414 | | | L3 Technologies Inc. | | | 836,321 | |
| | |
| | 3,189 | | | ManpowerGroup Inc. | | | 243,289 | |
| | |
| | 34,867 | | | Nielsen Holdings PLC | | | 905,845 | |
| | |
| | 12,657 | | | Owens Corning | | | 598,296 | |
| | |
| | 5,189 | | | Snap-on Inc. | | | 798,795 | |
| | | | Total Industrials | | | 4,616,794 | |
| | |
| | | | Information Technology – 7.3% | | | |
| | |
| | 2,160 | | | Avnet Inc. | | | 86,551 | |
| | |
| | 7,240 | | | CommScope Holding Co Inc., (2) | | | 174,194 | |
| | |
| | 7,329 | | | Keysight Technologies Inc., (2) | | | 418,339 | |
| | |
| | 9,613 | | | Sabre Corp | | | 236,960 | |
| | |
| | 14,516 | | | Seagate Technology PLC | | | 583,979 | |
| | |
| | 6,861 | | | Skyworks Solutions Inc. | | | 595,260 | |
| | |
| | 30,450 | | | Western Union Co/The | | | 549,318 | |
| | |
| | 29,189 | | | Xerox Corp | | | 813,497 | |
| | | | Total Information Technology | | | 3,458,098 | |
| | |
| | | | Materials – 7.8% | | | |
| | |
| | 19,729 | | | Ball Corp | | | 883,859 | |
| | |
| | 6,294 | | | International Flavors & Fragrances Inc. | | | 910,490 | |
| | |
| | 25,224 | | | Mosaic Co/The | | | 780,431 | |
| | |
| | 17,575 | | | Newmont Mining Corp | | | 543,419 | |
70
| | | | | | | | |
| Shares | | | Description (1) | | Value | |
| | |
| | | | Materials (continued) | | | |
| | |
| | 2,849 | | | Steel Dynamics Inc. | | $ | 112,820 | |
| | |
| | 10,875 | | | WestRock Co | | | 467,299 | |
| | | | Total Materials | | | 3,698,318 | |
| | |
| | | | Real Estate – 14.5% | | | |
| | |
| | 33,007 | | | Duke Realty Corp | | | 910,003 | |
| | |
| | 17,828 | | | HCP Inc. | | | 491,161 | |
| | |
| | 48,420 | | | Host Hotels & Resorts Inc. | | | 925,306 | |
| | |
| | 25,465 | | | Iron Mountain Inc. | | | 779,484 | |
| | |
| | 3,373 | | | Jones Lang LaSalle Inc. | | | 446,113 | |
| | |
| | 658 | | | Kimco Realty Corp | | | 10,587 | |
| | |
| | 18,931 | | | Liberty Property Trust | | | 792,641 | |
| | |
| | 9,541 | | | Mid-America Apartment Communities Inc. | | | 932,251 | |
| | |
| | 13,511 | | | Regency Centers Corp | | | 856,057 | |
| | |
| | 17,877 | | | UDR Inc. | | | 700,600 | |
| | | | Total Real Estate | | | 6,844,203 | |
| | |
| | | | Utilities – 8.6% | | | |
| | |
| | 21,313 | | | CMS Energy Corp | | | 1,055,420 | |
| | |
| | 19,620 | | | Eversource Energy | | | 1,241,161 | |
| | |
| | 34,211 | | | NiSource Inc. | | | 867,591 | |
| | |
| | 11,120 | | | Pinnacle West Capital Corp | | | 914,620 | |
| | | | Total Utilities | | | 4,078,792 | |
| | | | Total Long-Term Investments (cost $48,579,280) | | | 47,227,161 | |
| | | | Other Assets Less Liabilities – 0.2% | | | 91,319 | |
| | | | Net Assets – 100% | | $ | 47,318,480 | |
For Fund portfolio compliance purposes, the Fund’s industry classifications refer to any one or more of the industry sub-classifications used by one or more widely recognized market indexes or ratings group indexes, and/or as defined by Fund management. This definition may not apply for purposes of this report, which may combine industry sub-classifications into sectors for reporting ease.
| (1) | All percentages shown in the Portfolio of Investments are based on net assets. |
| (2) | Non-income producing; issuer has not declared a dividend within the past twelve months. |
See accompanying notes to financial statements.
71
Nushares ESG Small-Cap ETF (NUSC)
Portfolio of Investments October 31, 2018
| | | | | | | | | | | | | | | | | | | | |
| Shares | | | Description (1) | | | | | | | | | | | Value | |
| | | | | |
| | | | LONG-TERM INVESTMENTS – 99.8% | | | | | | | | | | | | | | | | |
| | | | | |
| | | | COMMON STOCKS – 99.8% | | | | | | | | | | | | | | | | |
| | | | | |
| | | | Communication Services – 3.1% | | | | | | | | | | | | |
| | | | | |
| | 4,967 | | | ANGI Homeservices Inc., (2) | | | | | | | | | | | | | | $ | 95,068 | |
| | | | | |
| | 309 | | | Cable One Inc. | | | | | | | | | | | | | | | 276,784 | |
| | | | | |
| | 725 | | | Cincinnati Bell Inc., (2) | | | | | | | | | | | | | | | 10,288 | |
| | | | | |
| | 8,325 | | | Cinemark Holdings Inc. | | | | | | | | | | | | | | | 346,070 | |
| | | | | |
| | 3,749 | | | Clear Channel Outdoor Holdings Inc., (2) | | | | | | | | | | | | | | | 21,819 | |
| | | | | |
| | 7,118 | | | Consolidated Communications Holdings Inc. | | | | | | | | | | | | | | | 89,117 | |
| | | | | |
| | 1,721 | | | Frontier Communications Corp | | | | | | | | | | | | | | | 8,278 | |
| | | | | |
| | 13,618 | | | Gannett Co Inc. | | | | | | | | | | | | | | | 132,095 | |
| | | | | |
| | 3,170 | | | GCI Liberty Inc., (2) | | | | | | | | | | | | | | | 150,036 | |
| | | | | |
| | 49,876 | | | Globalstar Inc., (2) | | | | | | | | | | | | | | | 17,342 | |
| | | | | |
| | 7,027 | | | Gogo Inc., (2) | | | | | | | | | | | | | | | 40,194 | |
| | | | | |
| | 2,516 | | | IMAX Corp, (2) | | | | | | | | | | | | | | | 48,710 | |
| | | | | |
| | 2,382 | | | Iridium Communications Inc., (2) | | | | | | | | | | | | | | | 47,187 | |
| | | | | |
| | 5,076 | | | John Wiley & Sons Inc. | | | | | | | | | | | | | | | 275,322 | |
| | | | | |
| | 1,537 | | | Loral Space & Communications Inc., (2) | | | | | | | | | | | | | | | 68,642 | |
| | | | | |
| | 2,170 | | | Marcus Corp/The | | | | | | | | | | | | | | | 84,673 | |
| | | | | |
| | 9,365 | | | National CineMedia Inc. | | | | | | | | | | | | | | | 83,817 | |
| | | | | |
| | 14,651 | | | New York Times Co/The | | | | | | | | | | | | | | | 386,786 | |
| | | | | |
| | 7,742 | | | ORBCOMM Inc., (2) | | | | | | | | | | | | | | | 73,781 | |
| | | | | |
| | 3,579 | | | Scholastic Corp | | | | | | | | | | | | | | | 155,257 | |
| | | | | |
| | 246 | | | Shenandoah Telecommunications Co | | | | | | | | | | | | | | | 9,353 | |
| | | | | |
| | 5,517 | | | Vonage Holdings Corp, (2) | | | | | | | | | | | | | | | 73,155 | |
| | | | Total Communication Services | | | | | | | | | | | | | | | 2,493,774 | |
| | | | | |
| | | | Consumer Discretionary – 11.8% | | | | | | | | | | | | |
| | | | | |
| | 2,158 | | | Aaron’s Inc. | | | | | | | | | | | | | | | 101,707 | |
| | | | | |
| | 1,574 | | | American Axle & Manufacturing Holdings Inc. | | | | | | | | | | | | | | | 23,878 | |
| | | | | |
| | 1,553 | | | American Public Education Inc., (2) | | | | | | | | | | | | | | | 50,830 | |
| | | | | |
| | 2,204 | | | At Home Group Inc., (2) | | | | | | | | | | | | | | | 60,257 | |
| | | | | |
| | 3,980 | | | AutoNation Inc., (2) | | | | | | | | | | | | | | | 161,110 | |
| | | | | |
| | 2,811 | | | BBX Capital Corp | | | | | | | | | | | | | | | 16,444 | |
| | | | | |
| | 1,218 | | | BJ’s Restaurants Inc. | | | | | | | | | | | | | | | 74,517 | |
| | | | | |
| | 2,582 | | | Bright Horizons Family Solutions Inc., (2) | | | | | | | | | | | | | | | 296,698 | |
| | | | | |
| | 2,950 | | | Brinker International Inc. | | | | | | | | | | | | | | | 127,883 | |
| | | | | |
| | 349 | | | Buckle Inc./The | | | | | | | | | | | | | | | 7,120 | |
| | | | | |
| | 244 | | | Caleres Inc. | | | | | | | | | | | | | | | 8,345 | |
| | | | | |
| | 4,907 | | | Callaway Golf Co | | | | | | | | | | | | | | | 105,010 | |
72
| | | | | | | | | | | | | | | | | | | | |
| Shares | | | Description (1) | | | | | | | | | | | Value | |
| | | | | |
| | | | Consumer Discretionary (continued) | | | | | | | | | | | | |
| | | | | |
| | 3,143 | | | Camping World Holdings Inc. | | | | | | | | | | | | | | $ | 53,902 | |
| | | | | |
| | 2,581 | | | Century Communities Inc., (2) | | | | | | | | | | | | | | | 54,769 | |
| | | | | |
| | 4,973 | | | Cheesecake Factory Inc./The | | | | | | | | | | | | | | | 240,395 | |
| | | | | |
| | 947 | | | Chico’s FAS Inc. | | | | | | | | | | | | | | | 7,263 | |
| | | | | |
| | 132 | | | Columbia Sportswear Co | | | | | | | | | | | | | | | 11,917 | |
| | | | | |
| | 1,199 | | | Cooper-Standard Holdings Inc., (2) | | | | | | | | | | | | | | | 111,087 | |
| | | | | |
| | 5,509 | | | Core-Mark Holding Co Inc. | | | | | | | | | | | | | | | 211,601 | |
| | | | | |
| | 3,826 | | | Crocs Inc., (2) | | | | | | | | | | | | | | | 78,586 | |
| | | | | |
| | 2,435 | | | Dave & Buster’s Entertainment Inc., (2) | | | | | | | | | | | | | | | 145,004 | |
| | | | | |
| | 841 | | | Deckers Outdoor Corp, (2) | | | | | | | | | | | | | | | 106,950 | |
| | | | | |
| | 1,924 | | | Dine Brands Global Inc. | | | | | | | | | | | | | | | 155,921 | |
| | | | | |
| | 2,400 | | | Dorman Products Inc., (2) | | | | | | | | | | | | | | | 189,624 | |
| | | | | |
| | 341 | | | DSW Inc. | | | | | | | | | | | | | | | 9,054 | |
| | | | | |
| | 3,923 | | | Dunkin’ Brands Group Inc. | | | | | | | | | | | | | | | 284,653 | |
| | | | | |
| | 681 | | | Ethan Allen Interiors Inc. | | | | | | | | | | | | | | | 13,034 | |
| | | | | |
| | 8,397 | | | Etsy Inc., (2) | | | | | | | | | | | | | | | 357,040 | |
| | | | | |
| | 1,808 | | | Fiesta Restaurant Group Inc., (2) | | | | | | | | | | | | | | | 46,664 | |
| | | | | |
| | 1,924 | | | Five Below Inc., (2) | | | | | | | | | | | | | | | 218,990 | |
| | | | | |
| | 334 | | | Floor & Decor Holdings Inc., (2) | | | | | | | | | | | | | | | 8,544 | |
| | | | | |
| | 2,796 | | | Foot Locker Inc. | | | | | | | | | | | | | | | 131,803 | |
| | | | | |
| | 5,078 | | | Fossil Group Inc., (2) | | | | | | | | | | | | | | | 110,243 | |
| | | | | |
| | 1,780 | | | Fox Factory Holding Corp, (2) | | | | | | | | | | | | | | | 95,639 | |
| | | | | |
| | 2,398 | | | frontdoor Inc., (2) | | | | | | | | | | | | | | | 81,652 | |
| | | | | |
| | 4,734 | | | GameStop Corp | | | | | | | | | | | | | | | 69,116 | |
| | | | | |
| | 208 | | | Genesco Inc., (2) | | | | | | | | | | | | | | | 8,900 | |
| | | | | |
| | 2,628 | | | Gentherm Inc., (2) | | | | | | | | | | | | | | | 114,686 | |
| | | | | |
| | 8,597 | | | GNC Holdings Inc. | | | | | | | | | | | | | | | 31,637 | |
| | | | | |
| | 132 | | | Graham Holdings Co | | | | | | | | | | | | | | | 76,699 | |
| | | | | |
| | 2,057 | | | Green Brick Partners Inc., (2) | | | | | | | | | | | | | | | 19,336 | |
| | | | | |
| | 2,322 | | | Group 1 Automotive Inc. | | | | | | | | | | | | | | | 134,072 | |
| | | | | |
| | 419 | | | Haverty Furniture Cos Inc. | | | | | | | | | | | | | | | 8,497 | |
| | | | | |
| | 989 | | | Helen of Troy Ltd, (2) | | | | | | | | | | | | | | | 122,755 | |
| | | | | |
| | 340 | | | Hibbett Sports Inc., (2) | | | | | | | | | | | | | | | 5,940 | |
| | | | | |
| | 1,381 | | | Hooker Furniture Corp | | | | | | | | | | | | | | | 40,422 | |
| | | | | |
| | 12,312 | | | Houghton Mifflin Harcourt Co, (2) | | | | | | | | | | | | | | | 82,490 | |
| | | | | |
| | 14,713 | | | Hovnanian Enterprises Inc., (2) | | | | | | | | | | | | | | | 21,481 | |
| | | | | |
| | 2,910 | | | International Speedway Corp | | | | | | | | | | | | | | | 109,154 | |
| | | | | |
| | 3,346 | | | iRobot Corp, (2) | | | | | | | | | | | | | | | 295,017 | |
| | | | | |
| | 1,551 | | | Jack in the Box Inc. | | | | | | | | | | | | | | | 122,420 | |
| | | | | |
| | 362 | | | KB Home | | | | | | | | | | | | | | | 7,229 | |
| | | | | |
| | 473 | | | Lands’ End Inc., (2) | | | | | | | | | | | | | | | 7,715 | |
73
Nushares ESG Small-Cap ETF (NUSC) (continued)
Portfolio of Investments October 31, 2018
| | | | | | | | | | | | | | | | | | | | |
| Shares | | | Description (1) | | | | | | | | | | | Value | |
| | | | | |
| | | | Consumer Discretionary (continued) | | | | | | | | | | | | |
| | | | | |
| | 2,369 | | | La-Z-Boy Inc. | | | | | | | | | | | | | | $ | 65,858 | |
| | | | | |
| | 2,224 | | | LGI Homes Inc., (2) | | | | | | | | | | | | | | | 95,165 | |
| | | | | |
| | 1,016 | | | Lithia Motors Inc. | | | | | | | | | | | | | | | 90,505 | |
| | | | | |
| | 3,092 | | | MarineMax Inc., (2) | | | | | | | | | | | | | | | 70,374 | |
| | | | | |
| | 1,936 | | | Marriott Vacations Worldwide Corp | | | | | | | | | | | | | | | 171,317 | |
| | | | | |
| | 283 | | | MDC Holdings Inc. | | | | | | | | | | | | | | | 7,952 | |
| | | | | |
| | 361 | | | Meritage Homes Corp, (2) | | | | | | | | | | | | | | | 13,447 | |
| | | | | |
| | 1,188 | | | Michaels Cos Inc./The, (2) | | | | | | | | | | | | | | | 18,830 | |
| | | | | |
| | 3,405 | | | Modine Manufacturing Co | | | | | | | | | | | | | | | 44,299 | |
| | | | | |
| | 922 | | | Monro Inc. | | | | | | | | | | | | | | | 68,597 | |
| | | | | |
| | 2,188 | | | Motorcar Parts of America Inc., (2) | | | | | | | | | | | | | | | 46,342 | |
| | | | | |
| | 847 | | | Movado Group Inc. | | | | | | | | | | | | | | | 32,618 | |
| | | | | |
| | 639 | | | Murphy USA Inc., (2) | | | | | | | | | | | | | | | 51,523 | |
| | | | | |
| | 3,614 | | | Nutrisystem Inc. | | | | | | | | | | | | | | | 128,514 | |
| | | | | |
| | 59,442 | | | Office Depot Inc. | | | | | | | | | | | | | | | 152,172 | |
| | | | | |
| | 4,864 | | | Pool Corp | | | | | | | | | | | | | | | 708,926 | |
| | | | | |
| | 3,414 | | | Quotient Technology Inc., (2) | | | | | | | | | | | | | | | 43,938 | |
| | | | | |
| | 234 | | | Red Robin Gourmet Burgers Inc., (2) | | | | | | | | | | | | | | | 7,067 | |
| | | | | |
| | 3,040 | | | Rent-A-Center Inc./TX | | | | | | | | | | | | | | | 43,320 | |
| | | | | |
| | 399 | | | RH, (2) | | | | | | | | | | | | | | | 46,168 | |
| | | | | |
| | 7,560 | | | Sally Beauty Holdings Inc., (2) | | | | | | | | | | | | | | | 134,644 | |
| | | | | |
| | 7,460 | | | Service Corp International/US | | | | | | | | | | | | | | | 309,366 | |
| | | | | |
| | 4,853 | | | ServiceMaster Global Holdings Inc., (2) | | | | | | | | | | | | | | | 208,097 | |
| | | | | |
| | 1,481 | | | Shake Shack Inc., (2) | | | | | | | | | | | | | | | 78,330 | |
| | | | | |
| | 1,887 | | | Shutterfly Inc., (2) | | | | | | | | | | | | | | | 94,350 | |
| | | | | |
| | 4,028 | | | Signet Jewelers Ltd | | | | | | | | | | | | | | | 225,769 | |
| | | | | |
| | 3,698 | | | Six Flags Entertainment Corp | | | | | | | | | | | | | | | 199,174 | |
| | | | | |
| | 842 | | | Sleep Number Corp, (2) | | | | | | | | | | | | | | | 30,624 | |
| | | | | |
| | 1,324 | | | Sotheby’s | | | | | | | | | | | | | | | 55,608 | |
| | | | | |
| | 418 | | | Tailored Brands Inc. | | | | | | | | | | | | | | | 8,782 | |
| | | | | |
| | 1,585 | | | Tenneco Inc. | | | | | | | | | | | | | | | 54,572 | |
| | | | | |
| | 4,283 | | | Tile Shop Holdings Inc. | | | | | | | | | | | | | | | 27,840 | |
| | | | | |
| | 6,100 | | | Tupperware Brands Corp | | | | | | | | | | | | | | | 214,110 | |
| | | | | |
| | 451 | | | Unifi Inc., (2) | | | | | | | | | | | | | | | 10,323 | |
| | | | | |
| | 2,187 | | | Visteon Corp, (2) | | | | | | | | | | | | | | | 172,860 | |
| | | | | |
| | 3,203 | | | Wayfair Inc., (2) | | | | | | | | | | | | | | | 353,259 | |
| | | | | |
| | 1,531 | | | Weight Watchers International Inc. | | | | | | | | | | | | | | | 101,199 | |
| | | | | |
| | 8,986 | | | Wendy’s Co/The | | | | | | | | | | | | | | | 154,919 | |
| | | | | |
| | 160 | | | Williams-Sonoma Inc. | | | | | | | | | | | | | | | 9,501 | |
| | | | | |
| | 3,875 | | | Wolverine World Wide Inc. | | | | | | | | | | | | | | | 136,284 | |
74
| | | | | | | | | | | | | | | | | | | | |
| Shares | | | Description (1) | | | | | | | | | | | Value | |
| | | | | |
| | | | Consumer Discretionary (continued) | | | | | | | | | | | | |
| | | | | |
| | 306 | | | Zumiez Inc., (2) | | | | | | | | | | | | | | $ | 7,118 | |
| | | | Total Consumer Discretionary | | | | | | | | | | | | | | | 9,529,361 | |
| | | | | |
| | | | Consumer Staples – 2.8% | | | | | | | | | | | | |
| | | | | |
| | 2,835 | | | Casey’s General Stores Inc. | | | | | | | | | | | | | | | 357,522 | |
| | | | | |
| | 13,129 | | | Darling Ingredients Inc., (2) | | | | | | | | | | | | | | | 271,245 | |
| | | | | |
| | 1,726 | | | Dean Foods Co | | | | | | | | | | | | | | | 13,791 | |
| | | | | |
| | 3,490 | | | Fresh Del Monte Produce Inc. | | | | | | | | | | | | | | | 115,275 | |
| | | | | |
| | 1,091 | | | Freshpet Inc., (2) | | | | | | | | | | | | | | | 41,567 | |
| | | | | |
| | 2,119 | | | Hain Celestial Group Inc./The, (2) | | | | | | | | | | | | | | | 52,721 | |
| | | | | |
| | 5,665 | | | Herbalife Nutrition Ltd | | | | | | | | | | | | | | | 301,718 | |
| | | | | |
| | 1,364 | | | Medifast Inc. | | | | | | | | | | | | | | | 288,732 | |
| | | | | |
| | 4,061 | | | Performance Food Group Co, (2) | | | | | | | | | | | | | | | 119,069 | |
| | | | | |
| | 243 | | | PriceSmart Inc. | | | | | | | | | | | | | | | 17,046 | |
| | | | | |
| | 803 | | | Simply Good Foods Co/The, (2) | | | | | | | | | | | | | | | 15,225 | |
| | | | | |
| | 4,294 | | | SpartanNash Co | | | | | | | | | | | | | | | 76,648 | |
| | | | | |
| | 2,104 | | | Sprouts Farmers Market Inc., (2) | | | | | | | | | | | | | | | 56,577 | |
| | | | | |
| | 4,947 | | | TreeHouse Foods Inc., (2) | | | | | | | | | | | | | | | 225,385 | |
| | | | | |
| | 2,780 | | | United Natural Foods Inc., (2) | | | | | | | | | | | | | | | 60,409 | |
| | | | | |
| | 5,565 | | | US Foods Holding Corp, (2) | | | | | | | | | | | | | | | 162,331 | |
| | | | | |
| | 983 | | | USANA Health Sciences Inc., (2) | | | | | | | | | | | | | | | 115,031 | |
| | | | Total Consumer Staples | | | | | | | | | | | | | | | 2,290,292 | |
| | | | | |
| | | | Energy – 3.8% | | | | | | | | | | | | |
| | | | | |
| | 8,968 | | | Antero Midstream GP LP | | | | | | | | | | | | | | | 144,474 | |
| | | | | |
| | 3,938 | | | Apergy Corp, (2) | | | | | | | | | | | | | | | 153,543 | |
| | | | | |
| | 15,426 | | | Archrock Inc. | | | | | | | | | | | | | | | 158,271 | |
| | | | | |
| | 7,339 | | | C&J Energy Services Inc., (2) | | | | | | | | | | | | | | | 137,826 | |
| | | | | |
| | 1,388 | | | Cactus Inc., (2) | | | | | | | | | | | | | | | 46,442 | |
| | | | | |
| | 3,950 | | | Core Laboratories NV | | | | | | | | | | | | | | | 336,698 | |
| | | | | |
| | 3,713 | | | Covia Holdings Corp, (2) | | | | | | | | | | | | | | | 21,461 | |
| | | | | |
| | 9,595 | | | Delek US Holdings Inc. | | | | | | | | | | | | | | | 352,328 | |
| | | | | |
| | 4,004 | | | Dril-Quip Inc., (2) | | | | | | | | | | | | | | | 170,410 | |
| | | | | |
| | 7,600 | | | EnLink Midstream LLC | | | | | | | | | | | | | | | 98,800 | |
| | | | | |
| | 3,855 | | | Exterran Corp, (2) | | | | | | | | | | | | | | | 80,531 | |
| | | | | |
| | 8,397 | | | Forum Energy Technologies Inc., (2) | | | | | | | | | | | | | | | 75,237 | |
| | | | | |
| | 9,176 | | | Frank’s International NV | | | | | | | | | | | | | | | 65,150 | |
| | | | | |
| | 4,710 | | | Green Plains Inc. | | | | | | | | | | | | | | | 80,258 | |
| | | | | |
| | 6,101 | | | Keane Group Inc., (2) | | | | | | | | | | | | | | | 76,690 | |
| | | | | |
| | 803 | | | KLX Energy Services Holdings Inc., (2) | | | | | | | | | | | | | | | 23,199 | |
| | | | | |
| | 3,243 | | | Matrix Service Co, (2) | | | | | | | | | | | | | | | 65,930 | |
| | | | | |
| | 17,363 | | | McDermott International Inc., (2) | | | | | | | | | | | | | | | 134,216 | |
| | | | | |
| | 1,145 | | | Natural Gas Services Group Inc., (2) | | | | | | | | | | | | | | | 22,099 | |
75
Nushares ESG Small-Cap ETF (NUSC) (continued)
Portfolio of Investments October 31, 2018
| | | | | | | | | | | | | | | | | | | | |
| Shares | | | Description (1) | | | | | | | | | | | Value | |
| | | | | |
| | | | Energy (continued) | | | | | | | | | | | | |
| | | | | |
| | 898 | | | NCS Multistage Holdings Inc., (2) | | | | | | | | | | | | | | $ | 10,147 | |
| | | | | |
| | 8,791 | | | Newpark Resources Inc., (2) | | | | | | | | | | | | | | | 72,174 | |
| | | | | |
| | 8,999 | | | Oceaneering International Inc. | | | | | | | | | | | | | | | 170,441 | |
| | | | | |
| | 6,058 | | | Oil States International Inc., (2) | | | | | | | | | | | | | | | 134,912 | |
| | | | | |
| | 4,025 | | | Renewable Energy Group Inc., (2) | | | | | | | | | | | | | | | 125,097 | |
| | | | | |
| | 5,577 | | | Select Energy Services Inc., (2) | | | | | | | | | | | | | | | 53,316 | |
| | | | | |
| | 495 | | | Tidewater Inc., (2) | | | | | | | | | | | | | | | 13,291 | |
| | | | | |
| | 7,030 | | | US Silica Holdings Inc. | | | | | | | | | | | | | | | 98,420 | |
| | | | | |
| | 94,507 | | | Weatherford International PLC, (2) | | | | | | | | | | | | | | | 127,584 | |
| | | | Total Energy | | | | | | | | | | | | | | | 3,048,945 | |
| | | | | |
| | | | Financials – 16.1% | | | | | | | | | | | | |
| | | | | |
| | 2,161 | | | Ameris Bancorp | | | | | | | | | | | | | | | 92,685 | |
| | | | | |
| | 13,056 | | | Apollo Commercial Real Estate Finance Inc. | | | | | | | | | | | | | | | 244,278 | |
| | | | | |
| | 6,386 | | | Arbor Realty Trust Inc. | | | | | | | | | | | | | | | 77,143 | |
| | | | | |
| | 6,513 | | | Aspen Insurance Holdings Ltd | | | | | | | | | | | | | | | 272,764 | |
| | | | | |
| | 8,272 | | | Associated Banc-Corp | | | | | | | | | | | | | | | 191,745 | |
| | | | | |
| | 563 | | | BancFirst Corp | | | | | | | | | | | | | | | 32,305 | |
| | | | | |
| | 2,106 | | | Bancorp Inc./The, (2) | | | | | | | | | | | | | | | 22,113 | |
| | | | | |
| | 10,276 | | | BancorpSouth Bank | | | | | | | | | | | | | | | 294,921 | |
| | | | | |
| | 811 | | | Bank of Hawaii Corp | | | | | | | | | | | | | | | 63,615 | |
| | | | | |
| | 14,386 | | | Bank OZK | | | | | | | | | | | | | | | 393,601 | |
| | | | | |
| | 8,674 | | | BankUnited Inc. | | | | | | | | | | | | | | | 287,109 | |
| | | | | |
| | 1,133 | | | Banner Corp | | | | | | | | | | | | | | | 65,510 | |
| | | | | |
| | 727 | | | Berkshire Hills Bancorp Inc. | | | | | | | | | | | | | | | 24,260 | |
| | | | | |
| | 478 | | | BOK Financial Corp | | | | | | | | | | | | | | | 40,979 | |
| | | | | |
| | 18,680 | | | Brown & Brown Inc. | | | | | | | | | | | | | | | 526,402 | |
| | | | | |
| | 614 | | | Cadence BanCorp | | | | | | | | | | | | | | | 13,545 | |
| | | | | |
| | 358 | | | Carolina Financial Corp | | | | | | | | | | | | | | | 11,846 | |
| | | | | |
| | 2,274 | | | Cathay General Bancorp | | | | | | | | | | | | | | | 85,662 | |
| | | | | |
| | 3,455 | | | Chemical Financial Corp | | | | | | | | | | | | | | | 161,901 | |
| | | | | |
| | 2,513 | | | Cohen & Steers Inc. | | | | | | | | | | | | | | | 96,474 | |
| | | | | |
| | 2,340 | | | Columbia Banking System Inc. | | | | | | | | | | | | | | | 86,791 | |
| | | | | |
| | 2,298 | | | Crawford & Co | | | | | | | | | | | | | | | 20,774 | |
| | | | | |
| | 2,303 | | | Cullen/Frost Bankers Inc. | | | | | | | | | | | | | | | 225,510 | |
| | | | | |
| | 1,662 | | | CVB Financial Corp | | | | | | | | | | | | | | | 36,315 | |
| | | | | |
| | 3,801 | | | Donnelley Financial Solutions Inc., (2) | | | | | | | | | | | | | | | 59,106 | |
| | | | | |
| | 3,544 | | | Enova International Inc., (2) | | | | | | | | | | | | | | | 83,816 | |
| | | | | |
| | 2,013 | | | FactSet Research Systems Inc. | | | | | | | | | | | | | | | 450,429 | |
| | | | | |
| | 1,602 | | | FCB Financial Holdings Inc., (2) | | | | | | | | | | | | | | | 62,686 | |
| | | | | |
| | 1,088 | | | Federal Agricultural Mortgage Corp | | | | | | | | | | | | | | | 75,986 | |
| | | | | |
| | 13,350 | | | First American Financial Corp | | | | | | | | | | | | | | | 591,806 | |
76
| | | | | | | | | | | | | | | | | | | | |
| Shares | | | Description (1) | | | | | | | | | | | Value | |
| | | | | |
| | | | Financials (continued) | | | | | | | | | | | | |
| | | | | |
| | 494 | | | First Busey Corp | | | | | | | | | | | | | | $ | 13,792 | |
| | | | | |
| | 2,783 | | | First Financial Bancorp | | | | | | | | | | | | | | | 72,831 | |
| | | | | |
| | 1,361 | | | First Hawaiian Inc. | | | | | | | | | | | | | | | 33,726 | |
| | | | | |
| | 1,240 | | | First Interstate BancSystem Inc. | | | | | | | | | | | | | | | 51,410 | |
| | | | | |
| | 5,349 | | | FirstCash Inc. | | | | | | | | | | | | | | | 430,060 | |
| | | | | |
| | 2,339 | | | Flagstar Bancorp Inc., (2) | | | | | | | | | | | | | | | 72,018 | |
| | | | | |
| | 1,306 | | | Flushing Financial Corp | | | | | | | | | | | | | | | 29,633 | |
| | | | | |
| | 6,156 | | | Fulton Financial Corp | | | | | | | | | | | | | | | 98,558 | |
| | | | | |
| | 45,133 | | | Genworth Financial Inc., (2) | | | | | | | | | | | | | | | 193,169 | |
| | | | | |
| | 1,498 | | | Glacier Bancorp Inc. | | | | | | | | | | | | | | | 63,515 | |
| | | | | |
| | 5,014 | | | Granite Point Mortgage Trust Inc. | | | | | | | | | | | | | | | 93,311 | |
| | | | | |
| | 3,242 | | | Great Western Bancorp Inc. | | | | | | | | | | | | | | | 118,819 | |
| | | | | |
| | 5,610 | | | Green Dot Corp, (2) | | | | | | | | | | | | | | | 424,901 | |
| | | | | |
| | 505 | | | Guaranty Bancorp | | | | | | | | | | | | | | | 13,140 | |
| | | | | |
| | 4,861 | | | Hancock Whitney Corp | | | | | | | | | | | | | | | 203,968 | |
| | | | | |
| | 6,389 | | | Hannon Armstrong Sustainable Infrastructure Capital Inc. | | | | | | | | | | | | | | | 132,572 | |
| | | | | |
| | 3,342 | | | Hanover Insurance Group Inc./The | | | | | | | | | | | | | | | 372,232 | |
| | | | | |
| | 620 | | | Heartland Financial USA Inc. | | | | | | | | | | | | | | | 32,947 | |
| | | | | |
| | 635 | | | Heritage Financial Corp/WA | | | | | | | | | | | | | | | 20,777 | |
| | | | | |
| | 2,129 | | | HomeStreet Inc. | | | | | | | | | | | | | | | 55,311 | |
| | | | | |
| | 960 | | | Independent Bank Corp/Rockland MA | | | | | | | | | | | | | | | 75,312 | |
| | | | | |
| | 1,831 | | | INTL. FCStone Inc., (2) | | | | | | | | | | | | | | | 82,908 | |
| | | | | |
| | 1,715 | | | Invesco Mortgage Capital Inc. | | | | | | | | | | | | | | | 25,862 | |
| | | | | |
| | 21,150 | | | Investors Bancorp Inc. | | | | | | | | | | | | | | | 236,457 | |
| | | | | |
| | 4,481 | | | Janus Henderson Group PLC | | | | | | | | | | | | | | | 110,098 | |
| | | | | |
| | 1,239 | | | KKR Real Estate Finance Trust Inc. | | | | | | | | | | | | | | | 24,879 | |
| | | | | |
| | 4,917 | | | Ladenburg Thalmann Financial Services Inc., (2) | | | | | | | | | | | | | | | 13,620 | |
| | | | | |
| | 2,390 | | | LegacyTexas Financial Group Inc. | | | | | | | | | | | | | | | 92,087 | |
| | | | | |
| | 8,569 | | | Legg Mason Inc. | | | | | | | | | | | | | | | 241,817 | |
| | | | | |
| | 2,894 | | | Live Oak Bancshares Inc. | | | | | | | | | | | | | | | 53,250 | |
| | | | | |
| | 136 | | | LPL Financial Holdings Inc. | | | | | | | | | | | | | | | 8,378 | |
| | | | | |
| | 3,494 | | | MB Financial Inc. | | | | | | | | | | | | | | | 155,099 | |
| | | | | |
| | 3,230 | | | Meta Financial Group Inc. | | | | | | | | | | | | | | | 81,525 | |
| | | | | |
| | 20,135 | | | MGIC Investment Corp, (2) | | | | | | | | | | | | | | | 245,848 | |
| | | | | |
| | 396 | | | Midland States Bancorp Inc. | | | | | | | | | | | | | | | 10,680 | |
| | | | | |
| | 2,208 | | | Morningstar Inc. | | | | | | | | | | | | | | | 275,558 | |
| | | | | |
| | 416 | | | National Bank Holdings Corp | | | | | | | | | | | | | | | 14,044 | |
| | | | | |
| | 1,800 | | | OceanFirst Financial Corp | | | | | | | | | | | | | | | 45,576 | |
| | | | | |
| | 5,115 | | | On Deck Capital Inc., (2) | | | | | | | | | | | | | | | 35,294 | |
| | | | | |
| | 1,272 | | | Opus Bank | | | | | | | | | | | | | | | 24,155 | |
| | | | | |
| | 322 | | | Park National Corp | | | | | | | | | | | | | | | 29,431 | |
77
Nushares ESG Small-Cap ETF (NUSC) (continued)
Portfolio of Investments October 31, 2018
| | | | | | | | | | | | | | | | | | | | |
| Shares | | | Description (1) | | | | | | | | | | | Value | |
| | | | | |
| | | | Financials (continued) | | | | | | | | | | | | |
| | | | | |
| | 391 | | | People’s Utah Bancorp | | | | | | | | | | | | | | $ | 13,102 | |
| | | | | |
| | 4,155 | | | Pinnacle Financial Partners Inc. | | | | | | | | | | | | | | | 217,307 | |
| | | | | |
| | 3,771 | | | Popular Inc. | | | | | | | | | | | | | | | 196,130 | |
| | | | | |
| | 5,431 | | | PRA Group Inc., (2) | | | | | | | | | | | | | | | 167,492 | |
| | | | | |
| | 643 | | | ProAssurance Corp | | | | | | | | | | | | | | | 28,241 | |
| | | | | |
| | 1,587 | | | Prosperity Bancshares Inc. | | | | | | | | | | | | | | | 103,203 | |
| | | | | |
| | 1,314 | | | Ready Capital Corp | | | | | | | | | | | | | | | 20,130 | |
| | | | | |
| | 456 | | | Sandy Spring Bancorp Inc. | | | | | | | | | | | | | | | 16,211 | |
| | | | | |
| | 2,811 | | | ServisFirst Bancshares Inc. | | | | | | | | | | | | | | | 101,140 | |
| | | | | |
| | 2,811 | | | Simmons First National Corp | | | | | | | | | | | | | | | 75,279 | |
| | | | | |
| | 899 | | | South State Corp | | | | | | | | | | | | | | | 60,835 | |
| | | | | |
| | 28,352 | | | Starwood Property Trust Inc. | | | | | | | | | | | | | | | 615,803 | |
| | | | | |
| | 584 | | | State Bank Financial Corp | | | | | | | | | | | | | | | 14,933 | |
| | | | | |
| | 10,754 | | | Sterling Bancorp/DE | | | | | | | | | | | | | | | 193,357 | |
| | | | | |
| | 2,523 | | | Stewart Information Services Corp | | | | | | | | | | | | | | | 104,149 | |
| | | | | |
| | 273 | | | Texas Capital Bancshares Inc., (2) | | | | | | | | | | | | | | | 17,808 | |
| | | | | |
| | 2,675 | | | TFS Financial Corp | | | | | | | | | | | | | | | 39,349 | |
| | | | | |
| | 606 | | | TriState Capital Holdings Inc., (2) | | | | | | | | | | | | | | | 15,283 | |
| | | | | |
| | 2,746 | | | Triumph Bancorp Inc., (2) | | | | | | | | | | | | | | | 98,472 | |
| | | | | |
| | 1,924 | | | Trustmark Corp | | | | | | | | | | | | | | | 59,259 | |
| | | | | |
| | 2,070 | | | UMB Financial Corp | | | | | | | | | | | | | | | 132,170 | |
| | | | | |
| | 9,343 | | | Umpqua Holdings Corp | | | | | | | | | | | | | | | 179,386 | |
| | | | | |
| | 1,607 | | | Union Bankshares Corp | | | | | | | | | | | | | | | 54,863 | |
| | | | | |
| | 3,321 | | | Virtu Financial Inc. | | | | | | | | | | | | | | | 78,774 | |
| | | | | |
| | 69 | | | Virtus Investment Partners Inc. | | | | | | | | | | | | | | | 6,854 | |
| | | | | |
| | 3,519 | | | Walker & Dunlop Inc. | | | | | | | | | | | | | | | 147,657 | |
| | | | | |
| | 4,154 | | | Washington Federal Inc. | | | | | | | | | | | | | | | 116,977 | |
| | | | | |
| | 3,211 | | | Webster Financial Corp | | | | | | | | | | | | | | | 188,935 | |
| | | | | |
| | 520 | | | Westamerica Bancorporation | | | | | | | | | | | | | | | 30,269 | |
| | | | | |
| | 3,680 | | | Western Alliance Bancorp, (2) | | | | | | | | | | | | | | | 177,523 | |
| | | | | |
| | 383 | | | White Mountains Insurance Group Ltd | | | | | | | | | | | | | | | 339,595 | |
| | | | | |
| | 2,348 | | | Wintrust Financial Corp | | | | | | | | | | | | | | | 178,777 | |
| | | | | |
| | 1,142 | | | WSFS Financial Corp | | | | | | | | | | | | | | | 48,569 | |
| | | | Total Financials | | | | | | | | | | | | | | | 12,938,477 | |
| | | | | |
| | | | Health Care – 13.6% | | | | | | | | | | | | |
| | | | | |
| | 399 | | | Acadia Healthcare Co Inc., (2) | | | | | | | | | | | | | | | 16,559 | |
| | | | | |
| | 9,440 | | | ACADIA Pharmaceuticals Inc., (2) | | | | | | | | | | | | | | | 183,891 | |
| | | | | |
| | 735 | | | Acceleron Pharma Inc., (2) | | | | | | | | | | | | | | | 37,316 | |
| | | | | |
| | 6,088 | | | Accuray Inc., (2) | | | | | | | | | | | | | | | 27,335 | |
| | | | | |
| | 2,054 | | | Aclaris Therapeutics Inc., (2) | | | | | | | | | | | | | | | 24,422 | |
| | | | | |
| | 160 | | | Addus HomeCare Corp, (2) | | | | | | | | | | | | | | | 10,480 | |
78
| | | | | | | | | | | | | | | | | | | | |
| Shares | | | Description (1) | | | | | | | | | | | Value | |
| | | | | |
| | | | Health Care (continued) | | | | | | | | | | | | |
| | | | | |
| | 4,887 | | | Aduro Biotech Inc., (2) | | | | | | | | | | | | | | $ | 20,721 | |
| | | | | |
| | 908 | | | Aerie Pharmaceuticals Inc., (2) | | | | | | | | | | | | | | | 48,287 | |
| | | | | |
| | 275 | | | Agios Pharmaceuticals Inc., (2) | | | | | | | | | | | | | | | 17,342 | |
| | | | | |
| | 2,045 | | | Akcea Therapeutics Inc., (2) | | | | | | | | | | | | | | | 45,644 | |
| | | | | |
| | 4,502 | | | Alder Biopharmaceuticals Inc., (2) | | | | | | | | | | | | | | | 57,175 | |
| | | | | |
| | 8,655 | | | Allscripts Healthcare Solutions Inc., (2) | | | | | | | | | | | | | | | 103,081 | |
| | | | | |
| | 1,192 | | | American Renal Associates Holdings Inc., (2) | | | | | | | | | | | | | | | 22,994 | |
| | | | | |
| | 8,781 | | | Amicus Therapeutics Inc., (2) | | | | | | | | | | | | | | | 98,172 | |
| | | | | |
| | 2,797 | | | AMN Healthcare Services Inc., (2) | | | | | | | | | | | | | | | 141,584 | |
| | | | | |
| | 1,990 | | | AnaptysBio Inc., (2) | | | | | | | | | | | | | | | 148,693 | |
| | | | | |
| | 670 | | | AngioDynamics Inc., (2) | | | | | | | | | | | | | | | 13,688 | |
| | | | | |
| | 2,454 | | | Assembly Biosciences Inc., (2) | | | | | | | | | | | | | | | 56,148 | |
| | | | | |
| | 1,538 | | | Atara Biotherapeutics Inc., (2) | | | | | | | | | | | | | | | 52,553 | |
| | | | | |
| | 1,971 | | | athenahealth Inc., (2) | | | | | | | | | | | | | | | 251,381 | |
| | | | | |
| | 1,636 | | | AtriCure Inc., (2) | | | | | | | | | | | | | | | 52,041 | |
| | | | | |
| | 177 | | | Atrion Corp | | | | | | | | | | | | | | | 120,746 | |
| | | | | |
| | 3,385 | | | Bellicum Pharmaceuticals Inc., (2) | | | | | | | | | | | | | | | 13,777 | |
| | | | | |
| | 8,087 | | | BioCryst Pharmaceuticals Inc., (2) | | | | | | | | | | | | | | | 59,197 | |
| | | | | |
| | 2,699 | | | BioTelemetry Inc., (2) | | | | | | | | | | | | | | | 156,812 | |
| | | | | |
| | 2,095 | | | Bluebird Bio Inc., (2) | | | | | | | | | | | | | | | 240,297 | |
| | | | | |
| | 22,406 | | | Brookdale Senior Living Inc., (2) | | | | | | | | | | | | | | | 200,086 | |
| | | | | |
| | 5,708 | | | Bruker Corp | | | | | | | | | | | | | | | 178,832 | |
| | | | | |
| | 2,904 | | | Capital Senior Living Corp, (2) | | | | | | | | | | | | | | | 26,136 | |
| | | | | |
| | 791 | | | Cardiovascular Systems Inc., (2) | | | | | | | | | | | | | | | 22,188 | |
| | | | | |
| | 2,072 | | | Cerus Corp, (2) | | | | | | | | | | | | | | | 13,882 | |
| | | | | |
| | 412 | | | Chemed Corp | | | | | | | | | | | | | | | 125,384 | |
| | | | | |
| | 1,075 | | | Civitas Solutions Inc., (2) | | | | | | | | | | | | | | | 15,545 | |
| | | | | |
| | 4,969 | | | Coherus Biosciences Inc., (2) | | | | | | | | | | | | | | | 58,088 | |
| | | | | |
| | 2,490 | | | Collegium Pharmaceutical Inc., (2) | | | | | | | | | | | | | | | 39,965 | |
| | | | | |
| | 441 | | | Computer Programs & Systems Inc. | | | | | | | | | | | | | | | 11,025 | |
| | | | | |
| | 461 | | | CorVel Corp, (2) | | | | | | | | | | | | | | | 26,720 | |
| | | | | |
| | 1,662 | | | Cross Country Healthcare Inc., (2) | | | | | | | | | | | | | | | 14,675 | |
| | | | | |
| | 494 | | | CryoLife Inc. | | | | | | | | | | | | | | | 15,304 | |
| | | | | |
| | 6,279 | | | Cymabay Therapeutics Inc., (2) | | | | | | | | | | | | | | | 66,243 | |
| | | | | |
| | 7,007 | | | Denali Therapeutics Inc., (2) | | | | | | | | | | | | | | | 101,391 | |
| | | | | |
| | 2,401 | | | Dicerna Pharmaceuticals Inc., (2) | | | | | | | | | | | | | | | 31,597 | |
| | | | | |
| | 1,133 | | | Diplomat Pharmacy Inc., (2) | | | | | | | | | | | | | | | 22,479 | |
| | | | | |
| | 1,420 | | | Eagle Pharmaceuticals Inc./DE, (2) | | | | | | | | | | | | | | | 69,921 | |
| | | | | |
| | 870 | | | Encompass Health Corp | | | | | | | | | | | | | | | 58,551 | |
| | | | | |
| | 2,295 | | | Endocyte Inc., (2) | | | | | | | | | | | | | | | 54,277 | |
| | | | | |
| | 7,374 | | | Endologix Inc., (2) | | | | | | | | | | | | | | | 8,996 | |
79
Nushares ESG Small-Cap ETF (NUSC) (continued)
Portfolio of Investments October 31, 2018
| | | | | | | | | | | | | | | | | | | | |
| Shares | | | Description (1) | | | | | | | | | | | Value | |
| | | | | |
| | | | Health Care (continued) | | | | | | | | | | | | |
| | | | | |
| | 2,773 | | | Esperion Therapeutics Inc., (2) | | | | | | | | | | | | | | $ | 125,977 | |
| | | | | |
| | 1,596 | | | FibroGen Inc., (2) | | | | | | | | | | | | | | | 68,421 | |
| | | | | |
| | 2,318 | | | Flexion Therapeutics Inc., (2) | | | | | | | | | | | | | | | 31,386 | |
| | | | | |
| | 2,436 | | | G1 Therapeutics Inc., (2) | | | | | | | | | | | | | | | 97,464 | |
| | | | | |
| | 5,910 | | | GenMark Diagnostics Inc., (2) | | | | | | | | | | | | | | | 31,500 | |
| | | | | |
| | 3,520 | | | Glaukos Corp, (2) | | | | | | | | | | | | | | | 203,949 | |
| | | | | |
| | 2,386 | | | Global Blood Therapeutics Inc., (2) | | | | | | | | | | | | | | | 83,725 | |
| | | | | |
| | 3,134 | | | Globus Medical Inc., (2) | | | | | | | | | | | | | | | 165,632 | |
| | | | | |
| | 2,607 | | | Haemonetics Corp, (2) | | | | | | | | | | | | | | | 272,353 | |
| | | | | |
| | 5,346 | | | Halozyme Therapeutics Inc., (2) | | | | | | | | | | | | | | | 83,023 | |
| | | | | |
| | 834 | | | Heska Corp, (2) | | | | | | | | | | | | | | | 83,583 | |
| | | | | |
| | 2,356 | | | HMS Holdings Corp, (2) | | | | | | | | | | | | | | | 67,900 | |
| | | | | |
| | 578 | | | Horizon Pharma Plc, (2) | | | | | | | | | | | | | | | 10,525 | |
| | | | | |
| | 6,818 | | | Insmed Inc., (2) | | | | | | | | | | | | | | | 99,543 | |
| | | | | |
| | 2,372 | | | Intersect ENT Inc., (2) | | | | | | | | | | | | | | | 66,558 | |
| | | | | |
| | 806 | | | Intra-Cellular Therapies Inc., (2) | | | | | | | | | | | | | | | 13,686 | |
| | | | | |
| | 2,402 | | | Karyopharm Therapeutics Inc., (2) | | | | | | | | | | | | | | | 25,317 | |
| | | | | |
| | 455 | | | LeMaitre Vascular Inc. | | | | | | | | | | | | | | | 12,149 | |
| | | | | |
| | 100 | | | LHC Group Inc., (2) | | | | | | | | | | | | | | | 9,143 | |
| | | | | |
| | 1,502 | | | Ligand Pharmaceuticals Inc., (2) | | | | | | | | | | | | | | | 247,545 | |
| | | | | |
| | 5,724 | | | LivaNova PLC, (2) | | | | | | | | | | | | | | | 641,029 | |
| | | | | |
| | 920 | | | Magellan Health Inc., (2) | | | | | | | | | | | | | | | 59,855 | |
| | | | | |
| | 3,030 | | | Medicines Co/The, (2) | | | | | | | | | | | | | | | 70,478 | |
| | | | | |
| | 4,211 | | | Medidata Solutions Inc., (2) | | | | | | | | | | | | | | | 296,033 | |
| | | | | |
| | 3,744 | | | MEDNAX Inc., (2) | | | | | | | | | | | | | | | 154,590 | |
| | | | | |
| | 2,436 | | | Merit Medical Systems Inc., (2) | | | | | | | | | | | | | | | 139,144 | |
| | | | | |
| | 12,526 | | | MiMedx Group Inc., (2) | | | | | | | | | | | | | | | 72,901 | |
| | | | | |
| | 3,882 | | | Minerva Neurosciences Inc., (2) | | | | | | | | | | | | | | | 42,586 | |
| | | | | |
| | 1,307 | | | Mirati Therapeutics Inc., (2) | | | | | | | | | | | | | | | 48,843 | |
| | | | | |
| | 3,190 | | | MyoKardia Inc., (2) | | | | | | | | | | | | | | | 168,879 | |
| | | | | |
| | 1,296 | | | National Research Corp | | | | | | | | | | | | | | | 49,313 | |
| | | | | |
| | 8,498 | | | NeoGenomics Inc., (2) | | | | | | | | | | | | | | | 156,703 | |
| | | | | |
| | 40,170 | | | OPKO Health Inc., (2) | | | | | | | | | | | | | | | 135,775 | |
| | | | | |
| | 957 | | | Optinose Inc., (2) | | | | | | | | | | | | | | | 10,125 | |
| | | | | |
| | 5,763 | | | OraSure Technologies Inc., (2) | | | | | | | | | | | | | | | 80,106 | |
| | | | | |
| | 212 | | | Orthofix Medical Inc., (2) | | | | | | | | | | | | | | | 12,894 | |
| | | | | |
| | 3,879 | | | Owens & Minor Inc. | | | | | | | | | | | | | | | 30,644 | |
| | | | | |
| | 3,227 | | | Paratek Pharmaceuticals Inc., (2) | | | | | | | | | | | | | | | 24,041 | |
| | | | | |
| | 9,847 | | | Patterson Cos Inc. | | | | | | | | | | | | | | | 222,345 | |
| | | | | |
| | 1,386 | | | Penumbra Inc., (2) | | | | | | | | | | | | | | | 188,496 | |
| | | | | |
| | 2,107 | | | PerkinElmer Inc. | | | | | | | | | | | | | | | 182,213 | |
80
| | | | | | | | | | | | | | | | | | | | |
| Shares | | | Description (1) | | | | | | | | | | | Value | |
| | | | | |
| | | | Health Care (continued) | | | | | | | | | | | | |
| | | | | |
| | 4,197 | | | Premier Inc., (2) | | | | | | | | | | | | | | $ | 188,865 | |
| | | | | |
| | 4,369 | | | Prestige Consumer Healthcare Inc., (2) | | | | | | | | | | | | | | | 157,983 | |
| | | | | |
| | 7,947 | | | Progenics Pharmaceuticals Inc., (2) | | | | | | | | | | | | | | | 39,814 | |
| | | | | |
| | 4,696 | | | Prothena Corp PLC, (2) | | | | | | | | | | | | | | | 58,230 | |
| | | | | |
| | 149 | | | Providence Service Corp/The, (2) | | | | | | | | | | | | | | | 9,847 | |
| | | | | |
| | 2,263 | | | Quidel Corp, (2) | | | | | | | | | | | | | | | 145,647 | |
| | | | | |
| | 10,296 | | | R1 RCM Inc., (2) | | | | | | | | | | | | | | | 87,207 | |
| | | | | |
| | 1,094 | | | RadNet Inc., (2) | | | | | | | | | | | | | | | 16,191 | |
| | | | | |
| | 1,306 | | | Reata Pharmaceuticals Inc., (2) | | | | | | | | | | | | | | | 76,963 | |
| | | | | |
| | 2,201 | | | Repligen Corp, (2) | | | | | | | | | | | | | | | 119,338 | |
| | | | | |
| | 2,222 | | | Revance Therapeutics Inc., (2) | | | | | | | | | | | | | | | 48,373 | |
| | | | | |
| | 1,916 | | | Sage Therapeutics Inc., (2) | | | | | | | | | | | | | | | 246,551 | |
| | | | | |
| | 2,696 | | | Sarepta Therapeutics Inc., (2) | | | | | | | | | | | | | | | 360,617 | |
| | | | | |
| | 4,458 | | | Select Medical Holdings Corp | | | | | | | | | | | | | | | 73,914 | |
| | | | | |
| | 1,989 | | | Spark Therapeutics Inc., (2) | | | | | | | | | | | | | | | 89,485 | |
| | | | | |
| | 3,717 | | | STAAR Surgical Co, (2) | | | | | | | | | | | | | | | 149,089 | |
| | | | | |
| | 1,951 | | | STERIS PLC | | | | | | | | | | | | | | | 213,264 | |
| | | | | |
| | 1,467 | | | Surgery Partners Inc., (2) | | | | | | | | | | | | | | | 19,937 | |
| | | | | |
| | 526 | | | Tactile Systems Technology Inc., (2) | | | | | | | | | | | | | | | 34,442 | |
| | | | | |
| | 2,530 | | | Teladoc Health Inc., (2) | | | | | | | | | | | | | | | 175,430 | |
| | | | | |
| | 4,599 | | | TESARO Inc., (2) | | | | | | | | | | | | | | | 132,819 | |
| | | | | |
| | 3,242 | | | Theravance Biopharma Inc., (2) | | | | | | | | | | | | | | | 78,683 | |
| | | | | |
| | 2,048 | | | Tivity Health Inc., (2) | | | | | | | | | | | | | | | 70,472 | |
| | | | | |
| | 1,993 | | | Ultragenyx Pharmaceutical Inc., (2) | | | | | | | | | | | | | | | 96,561 | |
| | | | | |
| | 342 | | | uniQure NV, (2) | | | | | | | | | | | | | | | 8,800 | |
| | | | | |
| | 174 | | | US Physical Therapy Inc. | | | | | | | | | | | | | | | 18,708 | |
| | | | | |
| | 4,314 | | | Varex Imaging Corp, (2) | | | | | | | | | | | | | | | 111,991 | |
| | | | | |
| | 1,263 | | | Vocera Communications Inc., (2) | | | | | | | | | | | | | | | 43,839 | |
| | | | | |
| | 2,026 | | | West Pharmaceutical Services Inc. | | | | | | | | | | | | | | | 214,594 | |
| | | | | |
| | 15,321 | | | ZIOPHARM Oncology Inc., (2) | | | | | | | | | | | | | | | 30,336 | |
| | | | | |
| | 1,583 | | | Zogenix Inc., (2) | | | | | | | | | | | | | | | 66,106 | |
| | | | Total Health Care | | | | | | | | | | | | | | | 10,952,089 | |
| | | | | |
| | | | Industrials – 14.2% | | | | | | | | | | | | |
| | | | | |
| | 1,978 | | | AAON Inc. | | | | | | | | | | | | | | | 68,221 | |
| | | | | |
| | 858 | | | ABM Industries Inc. | | | | | | | | | | | | | | | 26,384 | |
| | | | | |
| | 3,192 | | | ACCO Brands Corp | | | | | | | | | | | | | | | 25,759 | |
| | | | | |
| | 3,433 | | | Actuant Corp | | | | | | | | | | | | | | | 81,877 | |
| | | | | |
| | 4,324 | | | Advanced Drainage Systems Inc. | | | | | | | | | | | | | | | 120,164 | |
| | | | | |
| | 1,746 | | | Aegion Corp, (2) | | | | | | | | | | | | | | | 33,803 | |
| | | | | |
| | 614 | | | Alamo Group Inc. | | | | | | | | | | | | | | | 52,632 | |
| | | | | |
| | 8,042 | | | Allison Transmission Holdings Inc. | | | | | | | | | | | | | | | 354,491 | |
81
Nushares ESG Small-Cap ETF (NUSC) (continued)
Portfolio of Investments October 31, 2018
| | | | | | | | | | | | | | | | | | | | |
| Shares | | | Description (1) | | | | | | | | | | | Value | |
| | | | | |
| | | | Industrials (continued) | | | | | | | | | | | | |
| | | | | |
| | 1,593 | | | Argan Inc. | | | | | | | | | | | | | | $ | 70,124 | |
| | | | | |
| | 3,179 | | | Armstrong World Industries Inc. | | | | | | | | | | | | | | | 196,303 | |
| | | | | |
| | 1,643 | | | ASGN Inc., (2) | | | | | | | | | | | | | | | 110,212 | |
| | | | | |
| | 2,488 | | | Astronics Corp, (2) | | | | | | | | | | | | | | | 72,550 | |
| | | | | |
| | 52 | | | Astronics Corp, (2) | | | | | | | | | | | | | | | 1,513 | |
| | | | | |
| | 4,203 | | | Avis Budget Group Inc., (2) | | | | | | | | | | | | | | | 118,188 | |
| | | | | |
| | 3,599 | | | Axon Enterprise Inc., (2) | | | | | | | | | | | | | | | 222,130 | |
| | | | | |
| | 3,946 | | | Barnes Group Inc. | | | | | | | | | | | | | | | 223,344 | |
| | | | | |
| | 8,170 | | | Beacon Roofing Supply Inc., (2) | | | | | | | | | | | | | | | 228,025 | |
| | | | | |
| | 561 | | | Brady Corp | | | | | | | | | | | | | | | 22,603 | |
| | | | | |
| | 3,035 | | | Briggs & Stratton Corp | | | | | | | | | | | | | | | 44,099 | |
| | | | | |
| | 12,537 | | | Builders FirstSource Inc., (2) | | | | | | | | | | | | | | | 155,208 | |
| | | | | |
| | 3,345 | | | Carlisle Cos Inc. | | | | | | | | | | | | | | | 323,094 | |
| | | | | |
| | 2,224 | | | Chart Industries Inc., (2) | | | | | | | | | | | | | | | 151,343 | |
| | | | | |
| | 2,757 | | | Cimpress NV, (2) | | | | | | | | | | | | | | | 344,597 | |
| | | | | |
| | 14,938 | | | Civeo Corp, (2) | | | | | | | | | | | | | | | 42,573 | |
| | | | | |
| | 1,522 | | | Comfort Systems USA Inc. | | | | | | | | | | | | | | | 81,397 | |
| | | | | |
| | 1,522 | | | Cubic Corp | | | | | | | | | | | | | | | 99,858 | |
| | | | | |
| | 2,352 | | | Curtiss-Wright Corp | | | | | | | | | | | | | | | 257,450 | |
| | | | | |
| | 5,352 | | | Donaldson Co Inc. | | | | | | | | | | | | | | | 274,451 | |
| | | | | |
| | 1,308 | | | Echo Global Logistics Inc., (2) | | | | | | | | | | | | | | | 33,629 | |
| | | | | |
| | 2,352 | | | EMCOR Group Inc. | | | | | | | | | | | | | | | 166,945 | |
| | | | | |
| | 1,765 | | | EnerSys | | | | | | | | | | | | | | | 140,441 | |
| | | | | |
| | 3,021 | | | ESCO Technologies Inc. | | | | | | | | | | | | | | | 184,946 | |
| | | | | |
| | 4,267 | | | Essendant Inc. | | | | | | | | | | | | | | | 54,362 | |
| | | | | |
| | 2,120 | | | Esterline Technologies Corp, (2) | | | | | | | | | | | | | | | 248,803 | |
| | | | | |
| | 8,761 | | | Evoqua Water Technologies Corp, (2) | | | | | | | | | | | | | | | 84,106 | |
| | | | | |
| | 2,213 | | | Foundation Building Materials Inc., (2) | | | | | | | | | | | | | | | 21,090 | |
| | | | | |
| | 2,895 | | | Franklin Electric Co Inc. | | | | | | | | | | | | | | | 122,806 | |
| | | | | |
| | 739 | | | Gates Industrial Corp PLC, (2) | | | | | | | | | | | | | | | 11,122 | |
| | | | | |
| | 3,727 | | | GATX Corp | | | | | | | | | | | | | | | 279,264 | |
| | | | | |
| | 447 | | | Genesee & Wyoming Inc., (2) | | | | | | | | | | | | | | | 35,416 | |
| | | | | |
| | 2,100 | | | Granite Construction Inc. | | | | | | | | | | | | | | | 96,012 | |
| | | | | |
| | 4,906 | | | Great Lakes Dredge & Dock Corp | | | | | | | | | | | | | | | 28,504 | |
| | | | | |
| | 2,108 | | | Healthcare Services Group Inc. | | | | | | | | | | | | | | | 85,564 | |
| | | | | |
| | 2,010 | | | Herman Miller Inc. | | | | | | | | | | | | | | | 66,230 | |
| | | | | |
| | 6,021 | | | Hertz Global Holdings Inc., (2) | | | | | | | | | | | | | | | 82,789 | |
| | | | | |
| | 3,864 | | | Hexcel Corp | | | | | | | | | | | | | | | 226,121 | |
| | | | | |
| | 7,069 | | | Hillenbrand Inc. | | | | | | | | | | | | | | | 338,605 | |
| | | | | |
| | 180 | | | Hub Group Inc., (2) | | | | | | | | | | | | | | | 8,248 | |
| | | | | |
| | 1,914 | | | Hubbell Inc. | | | | | | | | | | | | | | | 194,654 | |
82
| | | | | | | | | | | | | | | | | | | | |
| Shares | | | Description (1) | | | | | | | | | | | Value | |
| | | | | |
| | | | Industrials (continued) | | | | | | | | | | | | |
| | | | | |
| | 460 | | | Hyster-Yale Materials Handling Inc. | | | | | | | | | | | | | | $ | 27,807 | |
| | | | | |
| | 4,440 | | | Insperity Inc. | | | | | | | | | | | | | | | 487,734 | |
| | | | | |
| | 1,996 | | | Interface Inc. | | | | | | | | | | | | | | | 32,515 | |
| | | | | |
| | 6,655 | | | KAR Auction Services Inc. | | | | | | | | | | | | | | | 378,936 | |
| | | | | |
| | 625 | | | Kelly Services Inc. | | | | | | | | | | | | | | | 14,681 | |
| | | | | |
| | 4,856 | | | KeyW Holding Corp/The, (2) | | | | | | | | | | | | | | | 38,022 | |
| | | | | |
| | 226 | | | Kforce Inc. | | | | | | | | | | | | | | | 6,965 | |
| | | | | |
| | 407 | | | Knoll Inc. | | | | | | | | | | | | | | | 8,079 | |
| | | | | |
| | 232 | | | Korn/Ferry International | | | | | | | | | | | | | | | 10,472 | |
| | | | | |
| | 180 | | | Lindsay Corp | | | | | | | | | | | | | | | 17,212 | |
| | | | | |
| | 1,529 | | | Matthews International Corp | | | | | | | | | | | | | | | 63,637 | |
| | | | | |
| | 282 | | | McGrath RentCorp | | | | | | | | | | | | | | | 15,056 | |
| | | | | |
| | 4,600 | | | Mercury Systems Inc., (2) | | | | | | | | | | | | | | | 215,556 | |
| | | | | |
| | 1,693 | | | Meritor Inc., (2) | | | | | | | | | | | | | | | 28,764 | |
| | | | | |
| | 3,661 | | | Mobile Mini Inc. | | | | | | | | | | | | | | | 150,540 | |
| | | | | |
| | 469 | | | MYR Group Inc., (2) | | | | | | | | | | | | | | | 15,660 | |
| | | | | |
| | 1,259 | | | Navigant Consulting Inc. | | | | | | | | | | | | | | | 27,194 | |
| | | | | |
| | 4,709 | | | Navistar International Corp, (2) | | | | | | | | | | | | | | | 157,704 | |
| | | | | |
| | 3,694 | | | Nexeo Solutions Inc., (2) | | | | | | | | | | | | | | | 38,602 | |
| | | | | |
| | 703 | | | Oshkosh Corp | | | | | | | | | | | | | | | 39,466 | |
| | | | | |
| | 22,593 | | | Pitney Bowes Inc. | | | | | | | | | | | | | | | 149,566 | |
| | | | | |
| | 25,467 | | | Plug Power Inc., (2) | | | | | | | | | | | | | | | 47,114 | |
| | | | | |
| | 2,384 | | | Quad/Graphics Inc. | | | | | | | | | | | | | | | 36,785 | |
| | | | | |
| | 6,846 | | | Quanta Services Inc., (2) | | | | | | | | | | | | | | | 213,595 | |
| | | | | |
| | 1,989 | | | Raven Industries Inc. | | | | | | | | | | | | | | | 86,482 | |
| | | | | |
| | 2,681 | | | Regal Beloit Corp | | | | | | | | | | | | | | | 192,228 | |
| | | | | |
| | 7,909 | | | RR Donnelley & Sons Co | | | | | | | | | | | | | | | 46,426 | |
| | | | | |
| | 3,268 | | | Ryder System Inc. | | | | | | | | | | | | | | | 180,753 | |
| | | | | |
| | 4,569 | | | SiteOne Landscape Supply Inc., (2) | | | | | | | | | | | | | | | 310,875 | |
| | | | | |
| | 955 | | | Steelcase Inc. | | | | | | | | | | | | | | | 15,853 | |
| | | | | |
| | 3,433 | | | Team Inc., (2) | | | | | | | | | | | | | | | 68,317 | |
| | | | | |
| | 241 | | | Teledyne Technologies Inc., (2) | | | | | | | | | | | | | | | 53,328 | |
| | | | | |
| | 705 | | | Tennant Co | | | | | | | | | | | | | | | 43,090 | |
| | | | | |
| | 568 | | | Tetra Tech Inc. | | | | | | | | | | | | | | | 37,511 | |
| | | | | |
| | 5,208 | | | Toro Co/The | | | | | | | | | | | | | | | 293,367 | |
| | | | | |
| | 2,778 | | | TriMas Corp, (2) | | | | | | | | | | | | | | | 81,812 | |
| | | | | |
| | 5,248 | | | TriNet Group Inc., (2) | | | | | | | | | | | | | | | 246,604 | |
| | | | | |
| | 1,610 | | | TrueBlue Inc., (2) | | | | | | | | | | | | | | | 37,561 | |
| | | | | |
| | 1,178 | | | Valmont Industries Inc. | | | | | | | | | | | | | | | 146,437 | |
| | | | | |
| | 1,419 | | | Veritiv Corp, (2) | | | | | | | | | | | | | | | 47,309 | |
| | | | | |
| | 5,534 | | | Wabash National Corp | | | | | | | | | | | | | | | 83,563 | |
83
Nushares ESG Small-Cap ETF (NUSC) (continued)
Portfolio of Investments October 31, 2018
| | | | | | | | | | | | | | | | | | | | |
| Shares | | | Description (1) | | | | | | | | | | | Value | |
| | | | | |
| | | | Industrials (continued) | | | | | | | | | | | | |
| | | | | |
| | 3,524 | | | WageWorks Inc., (2) | | | | | | | | | | | | | | $ | 140,290 | |
| | | | | |
| | 783 | | | Watts Water Technologies Inc. | | | | | | | | | | | | | | | 54,849 | |
| | | | | |
| | 8,062 | | | Welbilt Inc., (2) | | | | | | | | | | | | | | | 150,921 | |
| | | | | |
| | 1,999 | | | WESCO International Inc., (2) | | | | | | | | | | | | | | | 100,310 | |
| | | | | |
| | 6,134 | | | Woodward Inc. | | | | | | | | | | | | | | | 451,708 | |
| | | | Total Industrials | | | | | | | | | | | | | | | 11,403,306 | |
| | | | | |
| | | | Information Technology – 15.6% | | | | | | | | | | | | |
| | | | | |
| | 3,801 | | | Anixter International Inc., (2) | | | | | | | | | | | | | | | 249,688 | |
| | | | | |
| | 4,677 | | | ARRIS International PLC, (2) | | | | | | | | | | | | | | | 116,317 | |
| | | | | |
| | 2,568 | | | Avaya Holdings Corp, (2) | | | | | | | | | | | | | | | 42,167 | |
| | | | | |
| | 625 | | | AVX Corp | | | | | | | | | | | | | | | 10,425 | |
| | | | | |
| | 3,491 | | | Badger Meter Inc. | | | | | | | | | | | | | | | 171,443 | |
| | | | | |
| | 2,493 | | | Belden Inc. | | | | | | | | | | | | | | | 134,747 | |
| | | | | |
| | 389 | | | Benefitfocus Inc., (2) | | | | | | | | | | | | | | | 13,821 | |
| | | | | |
| | 6,037 | | | Black Knight Inc., (2) | | | | | | | | | | | | | | | 294,424 | |
| | | | | |
| | 2,919 | | | Blackbaud Inc. | | | | | | | | | | | | | | | 209,351 | |
| | | | | |
| | 1,990 | | | Blackline Inc., (2) | | | | | | | | | | | | | | | 92,296 | |
| | | | | |
| | 17,121 | | | Booz Allen Hamilton Holding Corp | | | | | | | | | | | | | | | 848,168 | |
| | | | | |
| | 4,781 | | | Brooks Automation Inc. | | | | | | | | | | | | | | | 148,354 | |
| | | | | |
| | 3,057 | | | Cabot Microelectronics Corp | | | | | | | | | | | | | | | 298,424 | |
| | | | | |
| | 2,263 | | | ChannelAdvisor Corp, (2) | | | | | | | | | | | | | | | 26,206 | |
| | | | | |
| | 2,861 | | | Cirrus Logic Inc., (2) | | | | | | | | | | | | | | | 107,116 | |
| | | | | |
| | 160 | | | Coherent Inc., (2) | | | | | | | | | | | | | | | 19,702 | |
| | | | | |
| | 15,198 | | | Conduent Inc., (2) | | | | | | | | | | | | | | | 290,282 | |
| | | | | |
| | 181 | | | Coupa Software Inc., (2) | | | | | | | | | | | | | | | 11,734 | |
| | | | | |
| | 3,940 | | | Cray Inc., (2) | | | | | | | | | | | | | | | 89,399 | |
| | | | | |
| | 6,897 | | | Cree Inc., (2) | | | | | | | | | | | | | | | 267,742 | |
| | | | | |
| | 3,609 | | | CSG Systems International Inc. | | | | | | | | | | | | | | | 126,676 | |
| | | | | |
| | 1,100 | | | CTS Corp | | | | | | | | | | | | | | | 29,359 | |
| | | | | |
| | 2,434 | | | Daktronics Inc. | | | | | | | | | | | | | | | 17,793 | |
| | | | | |
| | 7,575 | | | Diebold Nixdorf Inc. | | | | | | | | | | | | | | | 29,543 | |
| | | | | |
| | 933 | | | Dolby Laboratories Inc. | | | | | | | | | | | | | | | 64,200 | |
| | | | | |
| | 2,175 | | | EchoStar Corp, (2) | | | | | | | | | | | | | | | 88,196 | |
| | | | | |
| | 13,900 | | | Entegris Inc. | | | | | | | | | | | | | | | 368,906 | |
| | | | | |
| | 454 | | | ePlus Inc., (2) | | | | | | | | | | | | | | | 38,536 | |
| | | | | |
| | 1,417 | | | ExlService Holdings Inc., (2) | | | | | | | | | | | | | | | 90,830 | |
| | | | | |
| | 329 | | | Fabrinet, (2) | | | | | | | | | | | | | | | 14,252 | |
| | | | | |
| | 1,145 | | | Fair Isaac Corp | | | | | | | | | | | | | | | 220,653 | |
| | | | | |
| | 213 | | | FARO Technologies Inc., (2) | | | | | | | | | | | | | | | 10,765 | |
| | | | | |
| | 5,418 | | | First Solar Inc., (2) | | | | | | | | | | | | | | | 226,472 | |
| | | | | |
| | 4,629 | | | Five9 Inc., (2) | | | | | | | | | | | | | | | 182,197 | |
84
| | | | | | | | | | | | | | | | | | | | |
| Shares | | | Description (1) | | | | | | | | | | | Value | |
| | | | | |
| | | | Information Technology (continued) | | | | | | | | | | | | |
| | | | | |
| | 1,489 | | | Ichor Holdings Ltd, (2) | | | | | | | | | | | | | | $ | 26,430 | |
| | | | | |
| | 972 | | | Insight Enterprises Inc., (2) | | | | | | | | | | | | | | | 50,243 | |
| | | | | |
| | 1,699 | | | InterDigital Inc. | | | | | | | | | | | | | | | 120,544 | |
| | | | | |
| | 286 | | | Itron Inc., (2) | | | | | | | | | | | | | | | 14,912 | |
| | | | | |
| | 3,040 | | | KEMET Corp | | | | | | | | | | | | | | | 66,211 | |
| | | | | |
| | 4,858 | | | Kulicke & Soffa Industries Inc. | | | | | | | | | | | | | | | 98,763 | |
| | | | | |
| | 10,927 | | | Limelight Networks Inc., (2) | | | | | | | | | | | | | | | 44,036 | |
| | | | | |
| | 780 | | | Littelfuse Inc. | | | | | | | | | | | | | | | 141,305 | |
| | | | | |
| | 4,566 | | | LogMeIn Inc. | | | | | | | | | | | | | | | 393,224 | |
| | | | | |
| | 1,785 | | | Lumentum Holdings Inc., (2) | | | | | | | | | | | | | | | 97,550 | |
| | | | | |
| | 4,036 | | | Manhattan Associates Inc., (2) | | | | | | | | | | | | | | | 192,679 | |
| | | | | |
| | 4,926 | | | Mellanox Technologies Ltd, (2) | | | | | | | | | | | | | | | 417,183 | |
| | | | | |
| | 3,946 | | | Methode Electronics Inc. | | | | | | | | | | | | | | | 116,802 | |
| | | | | |
| | 1,811 | | | MINDBODY Inc., (2) | | | | | | | | | | | | | | | 57,662 | |
| | | | | |
| | 3,743 | | | MoneyGram International Inc., (2) | | | | | | | | | | | | | | | 15,870 | |
| | | | | |
| | 295 | | | MTS Systems Corp | | | | | | | | | | | | | | | 13,968 | |
| | | | | |
| | 2,144 | | | Nanometrics Inc., (2) | | | | | | | | | | | | | | | 68,737 | |
| | | | | |
| | 1,710 | | | National Instruments Corp | | | | | | | | | | | | | | | 83,739 | |
| | | | | |
| | 7,741 | | | NCR Corp, (2) | | | | | | | | | | | | | | | 207,846 | |
| | | | | |
| | 1,387 | | | NETGEAR Inc., (2) | | | | | | | | | | | | | | | 76,951 | |
| | | | | |
| | 2,219 | | | New Relic Inc., (2) | | | | | | | | | | | | | | | 198,046 | |
| | | | | |
| | 1,323 | | | Novanta Inc., (2) | | | | | | | | | | | | | | | 77,012 | |
| | | | | |
| | 5,355 | | | Nutanix Inc., (2) | | | | | | | | | | | | | | | 222,286 | |
| | | | | |
| | 510 | | | NVE Corp | | | | | | | | | | | | | | | 43,197 | |
| | | | | |
| | 5,373 | | | Oclaro Inc., (2) | | | | | | | | | | | | | | | 44,166 | |
| | | | | |
| | 233 | | | OSI Systems Inc., (2) | | | | | | | | | | | | | | | 16,114 | |
| | | | | |
| | 2,324 | | | Paycom Software Inc., (2) | | | | | | | | | | | | | | | 290,965 | |
| | | | | |
| | 1,013 | | | Paylocity Holding Corp, (2) | | | | | | | | | | | | | | | 66,645 | |
| | | | | |
| | 1,479 | | | Plantronics Inc. | | | | | | | | | | | | | | | 87,217 | |
| | | | | |
| | 347 | | | Plexus Corp, (2) | | | | | | | | | | | | | | | 20,265 | |
| | | | | |
| | 571 | | | Power Integrations Inc. | | | | | | | | | | | | | | | 32,159 | |
| | | | | |
| | 1,549 | | | PTC Inc., (2) | | | | | | | | | | | | | | | 127,653 | |
| | | | | |
| | 2,113 | | | Qualys Inc., (2) | | | | | | | | | | | | | | | 150,530 | |
| | | | | |
| | 8,895 | | | Rambus Inc., (2) | | | | | | | | | | | | | | | 77,475 | |
| | | | | |
| | 1,839 | | | Ribbon Communications Inc., (2) | | | | | | | | | | | | | | | 12,505 | |
| | | | | |
| | 3,865 | | | RingCentral Inc., (2) | | | | | | | | | | | | | | | 300,426 | |
| | | | | |
| | 564 | | | Rogers Corp, (2) | | | | | | | | | | | | | | | 69,406 | |
| | | | | |
| | 1,932 | | | Sanmina Corp, (2) | | | | | | | | | | | | | | | 48,880 | |
| | | | | |
| | 5,086 | | | Science Applications International Corp | | | | | | | | | | | | | | | 353,528 | |
| | | | | |
| | 5,595 | | | ServiceSource International Inc., (2) | | | | | | | | | | | | | | | 7,441 | |
| | | | | |
| | 2,796 | | | Silicon Laboratories Inc., (2) | | | | | | | | | | | | | | | 227,958 | |
85
Nushares ESG Small-Cap ETF (NUSC) (continued)
Portfolio of Investments October 31, 2018
| | | | | | | | | | | | | | | | | | | | |
| Shares | | | Description (1) | | | | | | | | | | | Value | |
| | | | | |
| | | | Information Technology (continued) | | | | | | | | | | | | |
| | | | | |
| | 1,356 | | | SPS Commerce Inc., (2) | | | | | | | | | | | | | | $ | 126,230 | |
| | | | | |
| | 1,461 | | | Sykes Enterprises Inc., (2) | | | | | | | | | | | | | | | 44,809 | |
| | | | | |
| | 870 | | | SYNNEX Corp | | | | | | | | | | | | | | | 67,521 | |
| | | | | |
| | 2,856 | | | Tableau Software Inc., (2) | | | | | | | | | | | | | | | 304,678 | |
| | | | | |
| | 4,920 | | | Teradata Corp, (2) | | | | | | | | | | | | | | | 179,088 | |
| | | | | |
| | 14,827 | | | TiVo Corp | | | | | | | | | | | | | | | 163,097 | |
| | | | | |
| | 14,759 | | | Travelport Worldwide Ltd | | | | | | | | | | | | | | | 220,795 | |
| | | | | |
| | 1,597 | | | TTEC Holdings Inc. | | | | | | | | | | | | | | | 39,797 | |
| | | | | |
| | 1,730 | | | Twilio Inc., (2) | | | | | | | | | | | | | | | 130,131 | |
| | | | | |
| | 975 | | | Ultimate Software Group Inc./The, (2) | | | | | | | | | | | | | | | 259,964 | |
| | | | | |
| | 1,575 | | | Virtusa Corp, (2) | | | | | | | | | | | | | | | 78,104 | |
| | | | | |
| | 4,094 | | | WEX Inc., (2) | | | | | | | | | | | | | | | 720,378 | |
| | | | | |
| | 302 | | | Workiva Inc., (2) | | | | | | | | | | | | | | | 10,295 | |
| | | | | |
| | 2,718 | | | Zebra Technologies Corp, (2) | | | | | | | | | | | | | | | 452,003 | |
| | | | Total Information Technology | | | | | | | | | | | | | | | 12,525,603 | |
| | | | | |
| | | | Materials – 5.4% | | | | | | | | | | | | |
| | | | | |
| | 1,448 | | | AptarGroup Inc. | | | | | | | | | | | | | | | 147,638 | |
| | | | | |
| | 1,889 | | | Bemis Co Inc. | | | | | | | | | | | | | | | 86,460 | |
| | | | | |
| | 5,340 | | | Berry Global Group Inc., (2) | | | | | | | | | | | | | | | 232,931 | |
| | | | | |
| | 1,556 | | | Boise Cascade Co | | | | | | | | | | | | | | | 47,909 | |
| | | | | |
| | 1,925 | | | Clearwater Paper Corp, (2) | | | | | | | | | | | | | | | 46,470 | |
| | | | | |
| | 22,217 | | | Coeur Mining Inc., (2) | | | | | | | | | | | | | | | 106,197 | |
| | | | | |
| | 4,059 | | | Compass Minerals International Inc. | | | | | | | | | | | | | | | 196,902 | |
| | | | | |
| | 3,234 | | | Domtar Corp | | | | | | | | | | | | | | | 149,767 | |
| | | | | |
| | 9,097 | | | Ferro Corp | | | | | | | | | | | | | | | 154,103 | |
| | | | | |
| | 1,923 | | | Forterra Inc., (2) | | | | | | | | | | | | | | | 8,673 | |
| | | | | |
| | 270 | | | Greif Inc. | | | | | | | | | | | | | | | 13,867 | |
| | | | | |
| | 4,845 | | | HB Fuller Co | | | | | | | | | | | | | | | 215,409 | |
| | | | | |
| | 1,381 | | | Innospec Inc. | | | | | | | | | | | | | | | 92,417 | |
| | | | | |
| | 3,253 | | | KapStone Paper and Packaging Corp | | | | | | | | | | | | | | | 113,855 | |
| | | | | |
| | 14,895 | | | Louisiana-Pacific Corp | | | | | | | | | | | | | | | 324,264 | |
| | | | | |
| | 2,434 | | | Materion Corp | | | | | | | | | | | | | | | 138,324 | |
| | | | | |
| | 3,983 | | | Minerals Technologies Inc. | | | | | | | | | | | | | | | 218,069 | |
| | | | | |
| | 789 | | | Myers Industries Inc. | | | | | | | | | | | | | | | 12,514 | |
| | | | | |
| | 1,823 | | | PH Glatfelter Co | | | | | | | | | | | | | | | 32,632 | |
| | | | | |
| | 7,112 | | | Reliance Steel & Aluminum Co | | | | | | | | | | | | | | | 561,279 | |
| | | | | |
| | 814 | | | Royal Gold Inc. | | | | | | | | | | | | | | | 62,377 | |
| | | | | |
| | 1,241 | | | Ryerson Holding Corp, (2) | | | | | | | | | | | | | | | 11,392 | |
| | | | | |
| | 1,498 | | | Schnitzer Steel Industries Inc. | | | | | | | | | | | | | | | 40,296 | |
| | | | | |
| | 122 | | | Scotts Miracle-Gro Co/The | | | | | | | | | | | | | | | 8,142 | |
| | | | | |
| | 5,059 | | | Sensient Technologies Corp | | | | | | | | | | | | | | | 328,127 | |
86
| | | | | | | | | | | | | | | | | | | | |
| Shares | | | Description (1) | | | | | | | | | | | Value | |
| | | | | |
| | | | Materials (continued) | | | | | | | | | | | | |
| | | | | |
| | 1,591 | | | Sonoco Products Co | | | | | | | | | | | | | | $ | 86,837 | |
| | | | | |
| | 2,434 | | | Stepan Co | | | | | | | | | | | | | | | 201,024 | |
| | | | | |
| | 4,056 | | | Trinseo SA | | | | | | | | | | | | | | | 218,537 | |
| | | | | |
| | 676 | | | US Concrete Inc., (2) | | | | | | | | | | | | | | | 22,065 | |
| | | | | |
| | 22,892 | | | Valvoline Inc. | | | | | | | | | | | | | | | 456,009 | |
| | | | Total Materials | | | | | | | | | | | | | | | 4,334,486 | |
| | | | | |
| | | | Real Estate – 10.2% | | | | | | | | | | | | |
| | | | | |
| | 244 | | | Altisource Portfolio Solutions SA, (2) | | | | | | | | | | | | | | | 6,156 | |
| | | | | |
| | 6,562 | | | American Campus Communities Inc. | | | | | | | | | | | | | | | 259,265 | |
| | | | | |
| | 1,069 | | | Americold Realty Trust | | | | | | | | | | | | | | | 26,458 | |
| | | | | |
| | 925 | | | Brandywine Realty Trust | | | | | | | | | | | | | | | 13,006 | |
| | | | | |
| | 7,830 | | | Brixmor Property Group Inc. | | | | | | | | | | | | | | | 126,846 | |
| | | | | |
| | 2,403 | | | CatchMark Timber Trust Inc. | | | | | | | | | | | | | | | 21,267 | |
| | | | | |
| | 20,767 | | | CBL & Associates Properties Inc. | | | | | | | | | | | | | | | 68,531 | |
| | | | | |
| | 3,122 | | | Chatham Lodging Trust | | | | | | | | | | | | | | | 60,879 | |
| | | | | |
| | 2,497 | | | Chesapeake Lodging Trust | | | | | | | | | | | | | | | 73,387 | |
| | | | | |
| | 1,066 | | | CorePoint Lodging Inc. | | | | | | | | | | | | | | | 17,450 | |
| | | | | |
| | 2,633 | | | CoreSite Realty Corp | | | | | | | | | | | | | | | 247,133 | |
| | | | | |
| | 6,120 | | | Corporate Office Properties Trust | | | | | | | | | | | | | | | 158,141 | |
| | | | | |
| | 9,629 | | | Cousins Properties Inc. | | | | | | | | | | | | | | | 80,017 | |
| | | | | |
| | 7,697 | | | CyrusOne Inc. | | | | | | | | | | | | | | | 409,711 | |
| | | | | |
| | 11,273 | | | DiamondRock Hospitality Co | | | | | | | | | | | | | | | 117,803 | |
| | | | | |
| | 6,263 | | | Douglas Emmett Inc. | | | | | | | | | | | | | | | 226,658 | |
| | | | | |
| | 6,895 | | | Easterly Government Properties Inc. | | | | | | | | | | | | | | | 125,282 | |
| | | | | |
| | 8,029 | | | Forest City Realty Trust Inc. | | | | | | | | | | | | | | | 202,010 | |
| | | | | |
| | 3,783 | | | Four Corners Property Trust Inc. | | | | | | | | | | | | | | | 98,661 | |
| | | | | |
| | 7,146 | | | Franklin Street Properties Corp | | | | | | | | | | | | | | | 49,736 | |
| | | | | |
| | 4,369 | | | Government Properties Income Trust | | | | | | | | | | | | | | | 38,578 | |
| | | | | |
| | 1,543 | | | HFF Inc., (2) | | | | | | | | | | | | | | | 56,705 | |
| | | | | |
| | 6,989 | | | Hospitality Properties Trust | | | | | | | | | | | | | | | 179,058 | |
| | | | | |
| | 4,909 | | | Howard Hughes Corp/The, (2) | | | | | | | | | | | | | | | 547,452 | |
| | | | | |
| | 4,959 | | | Hudson Pacific Properties Inc. | | | | | | | | | | | | | | | 150,258 | |
| | | | | |
| | 4,972 | | | iStar Inc. | | | | | | | | | | | | | | | 52,206 | |
| | | | | |
| | 13,009 | | | Kennedy-Wilson Holdings Inc. | | | | | | | | | | | | | | | 246,911 | |
| | | | | |
| | 3,356 | | | Kilroy Realty Corp | | | | | | | | | | | | | | | 231,161 | |
| | | | | |
| | 323 | | | Marcus & Millichap Inc., (2) | | | | | | | | | | | | | | | 11,215 | |
| | | | | |
| | 8,506 | | | MGM Growth Properties LLC | | | | | | | | | | | | | | | 240,635 | |
| | | | | |
| | 264 | | | National Health Investors Inc. | | | | | | | | | | | | | | | 19,393 | |
| | | | | |
| | 1,859 | | | New York REIT Inc., (2) | | | | | | | | | | | | | | | 26,212 | |
| | | | | |
| | 5,579 | | | NorthStar Realty Europe Corp | | | | | | | | | | | | | | | 74,870 | |
| | | | | |
| | 16,650 | | | Outfront Media Inc. | | | | | | | | | | | | | | | 295,038 | |
87
Nushares ESG Small-Cap ETF (NUSC) (continued)
Portfolio of Investments October 31, 2018
| | | | | | | | | | | | | | | | | | | | |
| Shares | | | Description (1) | | | | | | | | | | | Value | |
| | | | | |
| | | | Real Estate (continued) | | | | | | | | | | | | |
| | | | | |
| | 12,876 | | | Paramount Group Inc. | | | | | | | | | | | | | | $ | 183,998 | |
| | | | | |
| | 16,487 | | | Park Hotels & Resorts Inc. | | | | | | | | | | | | | | | 479,277 | |
| | | | | |
| | 7,138 | | | PotlatchDeltic Corp | | | | | | | | | | | | | | | 258,753 | |
| | | | | |
| | 6,096 | | | QTS Realty Trust Inc. | | | | | | | | | | | | | | | 233,599 | |
| | | | | |
| | 5,007 | | | Rayonier Inc. | | | | | | | | | | | | | | | 151,211 | |
| | | | | |
| | 6,090 | | | Realogy Holdings Corp | | | | | | | | | | | | | | | 116,136 | |
| | | | | |
| | 1,949 | | | Redfin Corp, (2) | | | | | | | | | | | | | | | 30,112 | |
| | | | | |
| | 5,437 | | | Rexford Industrial Realty Inc. | | | | | | | | | | | | | | | 172,190 | |
| | | | | |
| | 19,793 | | | RLJ Lodging Trust | | | | | | | | | | | | | | | 384,776 | |
| | | | | |
| | 384 | | | RMR Group Inc./The | | | | | | | | | | | | | | | 29,138 | |
| | | | | |
| | 17,946 | | | Sabra Health Care REIT Inc. | | | | | | | | | | | | | | | 388,531 | |
| | | | | |
| | 4,567 | | | Select Income REIT | | | | | | | | | | | | | | | 86,362 | |
| | | | | |
| | 648 | | | Senior Housing Properties Trust | | | | | | | | | | | | | | | 10,413 | |
| | | | | |
| | 4,729 | | | St Joe Co/The, (2) | | | | | | | | | | | | | | | 71,834 | |
| | | | | |
| | 11,246 | | | Sunstone Hotel Investors Inc. | | | | | | | | | | | | | | | 162,730 | |
| | | | | |
| | 451 | | | Tejon Ranch Co, (2) | | | | | | | | | | | | | | | 8,569 | |
| | | | | |
| | 2,662 | | | Tier REIT Inc. | | | | | | | | | | | | | | | 57,686 | |
| | | | | |
| | 20,154 | | | Uniti Group Inc. | | | | | | | | | | | | | | | 385,748 | |
| | | | | |
| | 10,096 | | | VICI Properties Inc. | | | | | | | | | | | | | | | 217,973 | |
| | | | | |
| | 21,739 | | | Washington Prime Group Inc. | | | | | | | | | | | | | | | 139,130 | |
| | | | | |
| | 2,061 | | | Washington Real Estate Investment Trust | | | | | | | | | | | | | | | 57,440 | |
| | | | | |
| | 182 | | | WP Carey Inc. | | | | | | | | | | | | | | | 12,014 | |
| | | | Total Real Estate | | | | | | | | | | | | | | | 8,195,709 | |
| | | | | |
| | | | Utilities – 3.2% | | | | | | | | | | | | |
| | | | | |
| | 14,598 | | | Aqua America Inc. | | | | | | | | | | | | | | | 474,873 | |
| | | | | |
| | 1,913 | | | Chesapeake Utilities Corp | | | | | | | | | | | | | | | 151,988 | |
| | | | | |
| | 7,973 | | | New Jersey Resources Corp | | | | | | | | | | | | | | | 359,582 | |
| | | | | |
| | 6,541 | | | NextEra Energy Partners LP | | | | | | | | | | | | | | | 297,812 | |
| | | | | |
| | 4,499 | | | ONE Gas Inc. | | | | | | | | | | | | | | | 355,016 | |
| | | | | |
| | 4,552 | | | Ormat Technologies Inc. | | | | | | | | | | | | | | | 232,926 | |
| | | | | |
| | 10,050 | | | Pattern Energy Group Inc. | | | | | | | | | | | | | | | 180,096 | |
| | | | | |
| | 5,684 | | | Southwest Gas Holdings Inc. | | | | | | | | | | | | | | | 439,203 | |
| | | | | |
| | 8,051 | | | TerraForm Power Inc., (2) | | | | | | | | | | | | | | | 90,735 | |
| | | | Total Utilities | | | | | | | | | | | | | | | 2,582,231 | |
| | | | Total Common Stocks (cost $83,562,097) | | | | | | | | | | | | | | | 80,294,273 | |
| | | | | |
| Shares | | | Description (1) | | | | | | | | | | | Value | |
| | | | | |
| | | | COMMON STOCK RIGHTS – 0.0% | | | | | | | | | | | | | | | | |
| | | | | |
| | 1,243 | | | NewStar Financial Inc., (3) | | | | | | | | | | | | | | $ | 323 | |
| | | | Total Common Stock Rights (cost $–) | | | | | | | | | | | | | | | 323 | |
| | | | Total Long-Term Investments (cost $83,562,097) | | | | | | | | | | | | | | | 80,294,596 | |
88
| | | | | | | | | | | | | | | | | | | | |
Principal
Amount (000) | | | Description (1) | | Coupon | | | Maturity | | | Ratings (4) | | | Value | |
| | | | | |
| | | | SHORT-TERM INVESTMENTS – 0.2% | | | | | | | | | | | | | | | | |
| | | |
| | | | U.S. GOVERNMENT AND AGENCY OBLIGATIONS – 0.2% | | | | | | | | | |
| | | | | |
| $ | 120 | | | Federal Home Loan Bank, Discount Notes | | | 0.000% | | | | 11/01/18 | | | | N/R | | | $ | 120,000 | |
| | | | Total Short-Term Investments (cost $120,000) | | | | | | | | | | | | | | | 120,000 | |
| | | | Total Investments (cost $83,682,097) – 100.0% | | | | | | | | | | | | | | | 80,414,596 | |
| | | | Other Assets Less Liabilities – 0.0% | | | | | | | | | | | | | | | 32,125 | |
| | | | Net Assets – 100% | | | | | | | | | | | | | | $ | 80,446,721 | |
For Fund portfolio compliance purposes, the Fund’s industry classifications refer to any one or more of the industry sub-classifications used by one or more widely recognized market indexes or ratings group indexes, and/or as defined by Fund management. This definition may not apply for purposes of this report, which may combine industry sub-classifications into sectors for reporting ease.
| (1) | All percentages shown in the Portfolio of Investments are based on net assets. |
| (2) | Non-income producing; issuer has not declared a dividend within the past twelve months. |
| (3) | Investment valued at fair value using methods determined in good faith by, or at the discretion of, the Board. For fair value measurement disclosure purposes, investment classified as Level 3. See Notes to Financial Statements, Note 2 – Investment Valuation and Fair Value Measurements for more information. |
| (4) | For financial reporting purposes, the ratings disclosed are the highest of Standard & Poor’s Group (“Standard & Poor’s”), Moody’s Investors Service, Inc. (“Moody’s”) or Fitch, Inc. (“Fitch”) rating. This treatment of split-rated securities may differ from that used for other purposes, such as for Fund investment policies. Ratings below BBB by Standard & Poor’s, Baa by Moody’s or BBB by Fitch are considered to be below investment grade. Holdings designated N/R are not rated by any of these national rating agencies. Ratings are not covered by the report of independent registered public accounting firm. |
| REIT | Real Estate Investment Trust |
See accompanying notes to financial statements.
89
Statement of Assets and Liabilities
October 31, 2018
| | | | | | | | | | | | | | | | | | | | | | | | | | | | |
| | | NUEM | | | NUDM | | | NULG | | | NULV | | | NUMG | | | NUMV | | | NUSC | |
Assets | | | | | | | | | | | | | | | | | | | | | | | | | | | | |
Long-term investments, at value (cost $40,518,514, $47,466,372, $56,839,961, $46,091,142, $49,497,770, $48,579,280 and $83,562,097, respectively) | | $ | 35,618,414 | | | $ | 43,181,666 | | | $ | 59,090,457 | | | $ | 45,902,322 | | | $ | 49,303,464 | | | $ | 47,227,161 | | | $ | 80,294,596 | |
Short-term investments, at value (cost approximates value) | | | — | | | | — | | | | — | | | | — | | | | — | | | | — | | | | 120,000 | |
Cash | | | 44,842 | | | | 75,820 | | | | 87,621 | | | | 46,598 | | | | 86,207 | | | | 57,330 | | | | 5,595 | |
Cash denominated in foreign currencies (cost $13,051, $—, $—, $—, $—, $— and $—, respectively) | | | 13,051 | | | | — | | | | — | | | | — | | | | — | | | | — | | | | — | |
Receivable for: | | | | | | | | | | | | | | | | | | | | | | | | | | | | |
Dividends | | | 29,512 | | | | 103,400 | | | | 49,369 | | | | 60,050 | | | | 16,477 | | | | 50,210 | | | | 48,755 | |
Investments sold | | | — | | | | — | | | | — | | | | — | | | | — | | | | — | | | | 29 | |
Reclaims | | | 82 | | | | 38,337 | | | | 2,315 | | | | 18 | | | | 10 | | | | — | | | | 20 | |
Shares sold | | | — | | | | — | | | | — | | | | — | | | | — | | | | — | | | | 3,986 | |
Total assets | | | 35,705,901 | | | | 43,399,223 | | | | 59,229,762 | | | | 46,008,988 | | | | 49,406,158 | | | | 47,334,701 | | | | 80,472,981 | |
Liabilities | | | | | | | | | | | | | | | | | | | | | | | | | | | | |
Payable for: | | | | | | | | | | | | | | | | | | | | | | | | | | | | |
Capital gains tax | | | 15,335 | | | | — | | | | — | | | | — | | | | — | | | | — | | | | — | |
Investments purchased | | | 30 | | | | — | | | | — | | | | — | | | | — | | | | — | | | | — | |
Accrued expenses: | | | | | | | | | | | | | | | | | | | | | | | | | | | | |
Management fees | | | 13,261 | | | | 15,155 | | | | 17,862 | | | | 13,924 | | | | 17,466 | | | | 15,928 | | | | 25,949 | |
Professional fees | | | 100 | | | | 103 | | | | 52 | | | | 45 | | | | 66 | | | | 78 | | | | 17 | |
Trustees fees | | | 182 | | | | 228 | | | | 246 | | | | 198 | | | | 230 | | | | 215 | | | | 294 | |
Total liabilities | | | 28,908 | | | | 15,486 | | | | 18,160 | | | | 14,167 | | | | 17,762 | | | | 16,221 | | | | 26,260 | |
Net assets | | $ | 35,676,993 | | | $ | 43,383,737 | | | $ | 59,211,602 | | | $ | 45,994,821 | | | $ | 49,388,396 | | | $ | 47,318,480 | | | $ | 80,446,721 | |
Shares outstanding | | | 1,500,000 | | | | 1,800,000 | | | | 1,750,000 | | | | 1,600,000 | | | | 1,650,000 | | | | 1,750,000 | | | | 2,850,000 | |
Net asset value (“NAV”) per share | | $ | 23.78 | | | $ | 24.10 | | | $ | 33.84 | | | $ | 28.75 | | | $ | 29.93 | | | $ | 27.04 | | | $ | 28.23 | |
Net assets consist of: | | | | | | | | | | | | | | | | | | | | | | | | | | | | |
Capital paid-in | | $ | 40,595,137 | | | $ | 46,876,379 | | | $ | 55,042,031 | | | $ | 44,667,494 | | | $ | 47,402,545 | | | $ | 47,269,634 | | | $ | 81,089,174 | |
Total distributable earnings | | | (4,918,144 | ) | | | (3,492,642 | ) | | | 4,169,571 | | | | 1,327,327 | | | | 1,985,851 | | | | 48,846 | | | | (642,453 | ) |
Net assets | | $ | 35,676,993 | | | $ | 43,383,737 | | | $ | 59,211,602 | | | $ | 45,994,821 | | | $ | 49,388,396 | | | $ | 47,318,480 | | | $ | 80,446,721 | |
Authorized shares | | | Unlimited | | | | Unlimited | | | | Unlimited | | | | Unlimited | | | | Unlimited | | | | Unlimited | | | | Unlimited | |
Par value per share | | $ | 0.01 | | | $ | 0.01 | | | $ | 0.01 | | | $ | 0.01 | | | $ | 0.01 | | | $ | 0.01 | | | $ | 0.01 | |
See accompanying notes to financial statements.
90
Statement of Operations
Year Ended October 31, 2018
| | | | | | | | | | | | | | | | | | | | | | | | | | | | |
| | | NUEM | | | NUDM | | | NULG | | | NULV | | | NUMG | | | NUMV | | | NUSC | |
Investment Income | | $ | 1,080,430 | | | $ | 1,465,991 | | | $ | 508,280 | | | $ | 1,102,807 | | | $ | 279,248 | | | $ | 1,115,658 | | | $ | 852,627 | |
Foreign tax withheld on dividend income | | | (115,371 | ) | | | (129,713 | ) | | | — | | | | — | | | | — | | | | — | | | | (959 | ) |
Total investment income | | | 965,059 | | | | 1,336,278 | | | | 508,280 | | | | 1,102,807 | | | | 279,248 | | | | 1,115,658 | | | | 851,668 | |
Expenses | | | | | | | | | | | | | | | | | | | | | | | | | | | | |
Management fees | | | 168,807 | | | | 171,430 | | | | 163,295 | | | | 137,125 | | | | 176,048 | | | | 165,073 | | | | 216,133 | |
Professional fees | | | 657 | | | | 743 | | | | 863 | | | | 770 | | | | 819 | | | | 770 | | | | 1,092 | |
Trustees fees | | | 1,171 | | | | 1,308 | | | | 1,361 | | | | 1,198 | | | | 1,295 | | | | 1,219 | | | | 1,569 | |
Total expenses | | | 170,635 | | | | 173,481 | | | | 165,519 | | | | 139,093 | | | | 178,162 | | | | 167,062 | | | | 218,794 | |
Net investment income (loss) | | | 794,424 | | | | 1,162,797 | | | | 342,761 | | | | 963,714 | | | | 101,086 | | | | 948,596 | | | | 632,874 | |
Realized and Unrealized Gain (Loss) | | | | | | | | | | | | | | | | | | | | | | | | | | | | |
Net realized gain (loss) from: | | | | | | | | | | | | | | | | | | | | | | | | | | | | |
Investments and foreign currency | | | (669,421 | ) | | | (271,500 | ) | | | 1,630,906 | | | | 732,401 | | | | 2,109,805 | | | | 588,130 | | | | 2,114,159 | |
In-kind redemptions | | | — | | | | — | | | | 735,242 | | | | 1,136,754 | | | | 221,974 | | | | — | | | | 384,322 | |
Change in net unrealized appreciation (depreciation) of investments and foreign currency | | | (6,055,818 | ) | | | (4,874,240 | ) | | | 1,080,686 | | | | (1,037,741 | ) | | | (969,329 | ) | | | (1,712,176 | ) | | | (4,861,143 | ) |
Net realized and unrealized gain (loss) | | | (6,725,239 | ) | | | (5,145,740 | ) | | | 3,446,834 | | | | 831,414 | | | | 1,362,450 | | | | (1,124,046 | ) | | | (2,362,662 | ) |
Net increase (decrease) in net assets from operations | | $ | (5,930,815 | ) | | $ | (3,982,943 | ) | | $ | 3,789,595 | | | $ | 1,795,128 | | | $ | 1,463,536 | | | $ | (175,450 | ) | | $ | (1,729,788 | ) |
See accompanying notes to financial statements.
91
Statement of Changes in Net Assets
| | | | | | | | | | | | | | | | | | | | |
| | | NUEM | | | | | | NUDM | |
| | | Year Ended
10/31/18 | | | For the Period
June 6, 2017
(commencement
of operations)
through
October 31, 2017(1) | | | | | | Year Ended
10/31/18 | | | For the Period
June 6, 2017
(commencement
of operations)
through
October 31, 2017(1) | |
Operations | | | | | | | | | | | | | | | | | | | | |
Net investment income (loss) | | $ | 794,424 | | | $ | 97,618 | | | | | | | $ | 1,162,797 | | | $ | 76,148 | |
Net realized gain (loss) from: | | | | | | | | | | | | | | | | | | | | |
Investments and foreign currency | | | (669,421 | ) | | | (2,753 | ) | | | | | | | (271,500 | ) | | | 16,523 | |
In-kind redemptions | | | — | | | | — | | | | | | | | — | | | | — | |
Change in net unrealized appreciation (depreciation) of investments and foreign currency | | | (6,055,818 | ) | | | 1,155,446 | | | | | | | | (4,874,240 | ) | | | 587,380 | |
Net increase (decrease) in net assets from operations | | | (5,930,815 | ) | | | 1,250,311 | | | | | | | | (3,982,943 | ) | | | 680,051 | |
Distributions to Shareholders(2) | | | | | | | | | | | | | | | | | | | | |
Dividends | | | (237,640 | ) | | | — | | | | | | | | (189,750 | ) | | | — | |
Decrease in net assets from distributions to shareholders | | | (237,640 | ) | | | — | | | | | | | | (189,750 | ) | | | — | |
Fund Share Transactions | | | | | | | | | | | | | | | | | | | | |
Proceeds from shares sold | | | 16,928,471 | | | | 23,666,666 | | | | | | | | 23,801,244 | | | | 23,075,135 | |
Cost of shares redeemed | | | — | | | | — | | | | | | | | — | | | | — | |
Net increase (decrease) in net assets from Fund share transactions | | | 16,928,471 | | | | 23,666,666 | | | | | | | | 23,801,244 | | | | 23,075,135 | |
Net increase (decrease) in net assets | | | 10,760,016 | | | | 24,916,977 | | | | | | | | 19,628,551 | | | | 23,755,186 | |
Net assets at the beginning of period | | | 24,916,977 | | | | — | | | | | | | | 23,755,186 | | | | — | |
Net assets at the end of period | | $ | 35,676,993 | | | $ | 24,916,977 | | | | | | | $ | 43,383,737 | | | $ | 23,755,186 | |
| (1) | Prior period amounts have been conformed to current year presentation. See Notes to Financial Statements, Note 8 – New Accounting Pronouncements for further details. |
| (2) | The composition and per share amounts of the Funds’ distributions are presented in the Financial Highlights. The distribution information for the Funds as of its most recent tax year end is presented within the Notes to Financial Statements, Note 6 – Income Tax Information. |
See accompanying notes to financial statements.
92
| | | | | | | | | | | | | | | | | | | | |
| | | NULG | | | | | | NULV | |
| | | Year Ended
10/31/18 | | | For the Period
December 13, 2016
(commencement
of operations)
through
October 31, 2017(1) | | | | | | Year Ended
10/31/18 | | | For the Period
December 13, 2016
(commencement
of operations)
through
October 31, 2017(1) | |
Operations | | | | | | | | | | | | | | | | | | | | |
Net investment income (loss) | | $ | 342,761 | | | $ | 64,985 | | | | | | | $ | 963,714 | | | $ | 191,220 | |
Net realized gain (loss) from: | | | | | | | | | | | | | | | | | | | | |
Investments and foreign currency | | | 1,630,906 | | | | 124,838 | | | | | | | | 732,401 | | | | 112,077 | |
In-kind redemptions | | | 735,242 | | | | 137,401 | | | | | | | | 1,136,754 | | | | 7,653 | |
Change in net unrealized appreciation (depreciation) of investments and foreign currency | | | 1,080,686 | | | | 1,169,810 | | | | | | | | (1,037,741 | ) | | | 848,921 | |
Net increase (decrease) in net assets from operations | | | 3,789,595 | | | | 1,497,034 | | | | | | | | 1,795,128 | | | | 1,159,871 | |
Distributions to Shareholders(2) | | | | | | | | | | | | | | | | | | | | |
Dividends | | | (246,220 | ) | | | — | | | | | | | | (489,300 | ) | | | — | |
Decrease in net assets from distributions to shareholders | | | (246,220 | ) | | | — | | | | | | | | (489,300 | ) | | | — | |
Fund Share Transactions | | | | | | | | | | | | | | | | | | | | |
Proceeds from shares sold | | | 34,579,855 | | | | 25,501,848 | | | | | | | | 24,269,935 | | | | 27,911,667 | |
Cost of shares redeemed | | | (3,291,410 | ) | | | (2,619,100 | ) | | | | | | | (7,408,650 | ) | | | (1,243,830 | ) |
Net increase (decrease) in net assets from Fund share transactions | | | 31,288,445 | | | | 22,882,748 | | | | | | | | 16,861,285 | | | | 26,667,837 | |
Net increase (decrease) in net assets | | | 34,831,820 | | | | 24,379,782 | | | | | | | | 18,167,113 | | | | 27,827,708 | |
Net assets at the beginning of period | | | 24,379,782 | | | | — | | | | | | | | 27,827,708 | | | | — | |
Net assets at the end of period | | $ | 59,211,602 | | | $ | 24,379,782 | | | | | | | $ | 45,994,821 | | | $ | 27,827,708 | |
| (1) | Prior period amounts have been conformed to current year presentation. See Notes to Financial Statements, Note 8 – New Accounting Pronouncements for further details. |
| (2) | The composition and per share amounts of the Funds’ distributions are presented in the Financial Highlights. The distribution information for the Funds as of its most recent tax year end is presented within the Notes to Financial Statements, Note 6 – Income Tax Information. |
See accompanying notes to financial statements.
93
Statement of Changes in Net Assets (continued)
| | | | | | | | | | | | | | | | | | | | | | | | | | | | | | | | |
| | | NUMG | | | | | | NUMV | | | | | | NUSC | |
| | | Year Ended
10/31/18 | | | For the Period
December 13, 2016
(commencement
of operations)
through
October 31, 2017(1) | | | | | | Year Ended
10/31/18 | | | For the Period
December 13, 2016
(commencement
of operations)
through
October 31, 2017(1) | | | | | | Year Ended
10/31/18 | | | For the Period
December 13, 2016
(commencement
of operations)
through
October 31, 2017(1) | |
Operations | | | | | | | | | | | | | | | | | | | | | | | | | | | | | | | | |
Net investment income (loss) | | $ | 101,086 | | | $ | 23,694 | | | | | | | $ | 948,596 | | | $ | 128,635 | | | | | | | $ | 632,874 | | | $ | 149,970 | |
Net realized gain (loss) from: | | | | | | | | | | | | | | | | | | | | | | | | | | | | | | | | |
Investments and foreign currency | | | 2,109,805 | | | | 166,411 | | | | | | | | 588,130 | | | | 50,688 | | | | | | | | 2,114,159 | | | | 110,562 | |
In-kind redemptions | | | 221,974 | | | | 66,315 | | | | | | | | — | | | | — | | | | | | | | 384,322 | | | | 26,959 | |
Change in net unrealized appreciation (depreciation) of investments and foreign currency | | | (969,329 | ) | | | 775,023 | | | | | | | | (1,712,176 | ) | | | 360,057 | | | | | | | | (4,861,143 | ) | | | 1,593,642 | |
Net increase (decrease) in net assets from operations | | | 1,463,536 | | | | 1,031,443 | | | | | | | | (175,450 | ) | | | 539,380 | | | | | | | | (1,729,788 | ) | | | 1,881,133 | |
Distributions to Shareholders(2) | | | | | | | | | | | | | | | | | | | | | | | | | | | | | | | | |
Dividends | | | (221,130 | ) | | | — | | | | | | | | (315,225 | ) | | | — | | | | | | | | (387,730 | ) | | | — | |
Decrease in net assets from distributions to shareholders | | | (221,130 | ) | | | — | | | | | | | | (315,225 | ) | | | — | | | | | | | | (387,730 | ) | | | — | |
Fund Share Transactions | | | | | | | | | | | | | | | | | | | | | | | | | | | | | | | | |
Proceeds from shares sold | | | 28,270,865 | | | | 21,610,997 | | | | | | | | 24,857,815 | | | | 22,411,960 | | | | | | | | 53,444,235 | | | | 29,992,821 | |
Cost of shares redeemed | | | (1,454,885 | ) | | | (1,312,430 | ) | | | | | | | — | | | | — | | | | | | | | (1,508,955 | ) | | | (1,244,995 | ) |
Net increase (decrease) in net assets from Fund share transactions | | | 26,815,980 | | | | 20,298,567 | | | | | | | | 24,857,815 | | | | 22,411,960 | | | | | | | | 51,935,280 | | | | 28,747,826 | |
Net increase (decrease) in net assets | | | 28,058,386 | | | | 21,330,010 | | | | | | | | 24,367,140 | | | | 22,951,340 | | | | | | | | 49,817,762 | | | | 30,628,959 | |
Net assets at the beginning of period | | | 21,330,010 | | | | — | | | | | | | | 22,951,340 | | | | — | | | | | | | | 30,628,959 | | | | — | |
Net assets at the end of period | | $ | 49,388,396 | | | $ | 21,330,010 | | | | | | | $ | 47,318,480 | | | $ | 22,951,340 | | | | | | | $ | 80,446,721 | | | $ | 30,628,959 | |
| (1) | Prior period amounts have been conformed to current year presentation. See Notes to Financial Statements, Note 8 – New Accounting Pronouncements for further details. |
| (2) | The composition and per share amounts of the Funds’ distributions are presented in the Financial Highlights. The distribution information for the Funds as of its most recent tax year end is presented within the Notes to Financial Statements, Note 6 – Income Tax Information. |
See accompanying notes to financial statements.
94
THIS PAGE INTENTIONALLY LEFT BLANK
95
Financial Highlights
Selected data for a share outstanding throughout each period:
| | | | | | | | | | | | | | | | | | | | | | | | | | | | | | | | | | | | | | | | |
| | | | | | Investment Operations | | | | | | Less Distributions | | | | | | | |
| | | | | | | | | | |
| Year Ended October 31, | | Beginning
NAV | | | Net
Investment
Income
(Loss)(a) | | | Net
Realized/
Unrealized
Gain (Loss) | | | Total | | | | | | From
Net
Investment
Income | | | From
Accumulated
Net Realized
Gains | | | Total | | | Ending
NAV | | | Ending
Market
Price | |
NUEM | | | | | | | | | | | | | | | | | | | | | | | | | | | | | | | | | | | | | | | | |
2018 | | $ | 27.69 | | | $ | 0.59 | | | $ | (4.31 | ) | | $ | (3.72 | ) | | | | | | $ | (0.18 | ) | | $ | (0.01 | ) | | $ | (0.19 | ) | | $ | 23.78 | | | $ | 23.92 | |
2017(c) | | | 24.95 | | | | 0.20 | | | | 2.54 | | | | 2.74 | | | | | | | | — | | | | — | | | | — | | | | 27.69 | | | | 28.05 | |
NUDM | | | | | | | | | | | | | | | | | | | | | | | | | | | | | | | | | | | | | | | | |
2018 | | | 26.39 | | | | 0.71 | | | | (2.87 | ) | | | (2.16 | ) | | | | | | | (0.12 | ) | | | (0.01 | ) | | | (0.13 | ) | | | 24.10 | | | | 24.12 | |
2017(c) | | | 24.88 | | | | 0.17 | | | | 1.34 | | | | 1.51 | | | | | | | | — | | | | — | | | | — | | | | 26.39 | | | | 26.57 | |
NULG | | | | | | | | | | | | | | | | | | | | | | | | | | | | | | | | | | | | | | | | |
2018 | | | 30.47 | | | | 0.25 | | | | 3.31 | | | | 3.56 | | | | | | | | (0.09 | ) | | | (0.10 | ) | | | (0.19 | ) | | | 33.84 | | | | 33.87 | |
2017(d) | | | 25.21 | | | | 0.24 | | | | 5.02 | | | | 5.26 | | | | | | | | — | | | | — | | | | — | | | | 30.47 | | | | 30.53 | |
NULV | | | | | | | | | | | | | | | | | | | | | | | | | | | | | | | | | | | | | | | | |
2018 | | | 27.83 | | | | 0.71 | | | | 0.56 | | | | 1.27 | | | | | | | | (0.27 | ) | | | (0.08 | ) | | | (0.35 | ) | | | 28.75 | | | | 28.80 | |
2017(d) | | | 25.09 | | | | 0.53 | | | | 2.21 | | | | 2.74 | | | | | | | | — | | | | — | | | | — | | | | 27.83 | | | | 27.88 | |
NUMG | | | | | | | | | | | | | | | | | | | | | | | | | | | | | | | | | | | | | | | | |
2018 | | | 28.44 | | | | 0.07 | | | | 1.58 | | | | 1.65 | | | | | | | | (0.04 | ) | | | (0.12 | ) | | | (0.16 | ) | | | 29.93 | | | | 30.12 | |
2017(d) | | | 25.10 | | | | 0.09 | | | | 3.25 | | | | 3.34 | | | | | | | | — | | | | — | | | | — | | | | 28.44 | | | | 28.46 | |
NUMV | | | | | | | | | | | | | | | | | | | | | | | | | | | | | | | | | | | | | | | | |
2018 | | | 27.00 | | | | 0.65 | | | | (0.38 | ) | | | 0.27 | | | | | | | | (0.19 | ) | | | (0.04 | ) | | | (0.23 | ) | | | 27.04 | | | | 27.09 | |
2017(d) | | | 25.04 | | | | 0.48 | | | | 1.48 | | | | 1.96 | | | | | | | | — | | | | — | | | | — | | | | 27.00 | | | | 27.01 | |
NUSC | | | | | | | | | | | | | | | | | | | | | | | | | | | | | | | | | | | | | | | | |
2018 | | | 27.84 | | | | 0.35 | | | | 0.30 | | | | 0.65 | | | | | | | | (0.18 | ) | | | (0.08 | ) | | | (0.26 | ) | | | 28.23 | | | | 28.27 | |
2017(d) | | | 25.01 | | | | 0.27 | | | | 2.56 | | | | 2.83 | | | | | | | | — | | | | — | | | | — | | | | 27.84 | | | | 27.89 | |
96
| | | | | | | | | | | | | | | | | | | | | | | | | | | | | | | | | | | | | | |
| | | | | | | | | | | | | Ratios/Supplemental Data | |
| | | | Total Return | | | | | | | | | | | | Ratios to Average Net Assets | | | | | | | |
| | | | | | | | | |
| | | | Based on NAV(b) | | | Based
on
Market
Price(b) | | | | | | Ending
Net
Assets
(000) | | | | | | Expenses | | | Net
Investment
Income
(Loss) | | | | | | Portfolio
Turnover
Rate(e) | |
| | | | | | | | | | | | | | | | | | | | | | | | | | | | | | | | | | | | | | |
| | | | | (13.55 | )% | | | (14.18 | )% | | | | | | $ | 35,676 | | | | | | | | 0.45 | % | | | 2.12 | % | | | | | | | 65 | % |
| | | | | | 11.03 | | | | 12.42 | | | | | | | | 24,917 | | | | | | | | 0.45 | * | | | 1.86 | * | | | | | | | 13 | |
| | | | | | | | | | | | | | | | | | | | | | | | | | | | | | | | | | | | | | |
| | | | | (8.25 | ) | | | (8.79 | ) | | | | | | | 43,384 | | | | | | | | 0.40 | | | | 2.71 | | | | | | | | 56 | |
| | | | | | 6.07 | | | | 6.78 | | | | | | | | 23,755 | | | | | | | | 0.40 | * | | | 1.65 | * | | | | | | | 9 | |
| | | | | | | | | | | | | | | | | | | | | | | | | | | | | | | | | | | | | | |
| | | | | 11.70 | | | | 11.61 | | | | | | | | 59,212 | | | | | | | | 0.35 | | | | 0.73 | | | | | | | | 65 | |
| | | | | | 20.88 | | | | 21.10 | | | | | | | | 24,380 | | | | | | | | 0.35 | * | | | 0.98 | * | | | | | | | 30 | |
| | | | | | | | | | | | | | | | | | | | | | | | | | | | | | | | | | | | | | |
| | | | | 4.57 | | | | 4.56 | | | | | | | | 45,995 | | | | | | | | 0.35 | | | | 2.46 | | | | | | | | 59 | |
| | | | | | 10.90 | | | | 11.11 | | | | | | | | 27,828 | | | | | | | | 0.35 | * | | | 2.30 | * | | | | | | | 33 | |
| | | | | | | | | | | | | | | | | | | | | | | | | | | | | | | | | | | | | | |
| | | | | 5.84 | | | | 6.41 | | | | | | | | 49,388 | | | | | | | | 0.40 | | | | 0.23 | | | | | | | | 60 | |
| | | | | | 13.30 | | | | 13.38 | | | | | | | | 21,330 | | | | | | | | 0.40 | * | | | 0.38 | * | | | | | | | 53 | |
| | | | | | | | | | | | | | | | | | | | | | | | | | | | | | | | | | | | | | |
| | | | | 0.97 | | | | 1.13 | | | | | | | | 47,318 | | | | | | | | 0.40 | | | | 2.30 | | | | | | | | 69 | |
| | | | | | 7.82 | | | | 7.86 | | | | | | | | 22,951 | | | | | | | | 0.40 | * | | | 2.12 | * | | | | | | | 46 | |
| | | | | | | | | | | | | | | | | | | | | | | | | | | | | | | | | | | | | | |
| | | | | 2.32 | | | | 2.30 | | | | | | | | 80,447 | | | | | | | | 0.40 | | | | 1.17 | | | | | | | | 54 | |
| | | | | | 11.34 | | | | 11.54 | | | | | | | | 30,629 | | | | | | | | 0.40 | * | | | 1.17 | * | | | | | | | 36 | |
| (a) | Per share Net Investment Income (Loss) is calculated using the average daily shares method. | |
| (b) | Total Return Based on NAV reflects the change in NAV over the period, including the assumed reinvestment of distributions, if any, at NAV on each ex-dividend payment date during the period. Total Return Based on Market Price reflects the change in the market price per share over the period, including the assumed reinvestment of distributions, if any, at the ending market price per share on each ex-dividend payment date during the period. Total returns are not annualized. | |
| (c) | For the period June 6, 2017 (commencement of operations) through October 31, 2017. | |
| (d) | For the period December 13, 2016 (commencement of operations) through October 31, 2017. | |
| (e) | Portfolio Turnover Rate is calculated based on the lesser of long-term purchases or sales (as disclosed in Note 5 – Investment Transactions) divided by the average long-term market value during the period. Portfolio Turnover Rate excludes securities received or delivered as a result of processing in-kind creations or redemptions of Fund shares (as disclosed in Note 4 – Fund Shares). | |
See accompanying notes to financial statements.
97
Notes to Financial Statements
1. General Information and Significant Accounting Policies
General Information
Trust and Fund Information
The Nushares ETF Trust (the “Trust”) is an open-end management investment company registered under the Investment Company Act of 1940, as amended (the “1940 Act”). The Trust is comprised of Nushares ESG Emerging Markets Equity ETF (NUEM), Nushares ESG International Developed Markets Equity ETF (NUDM), Nushares ESG Large-Cap Growth ETF (NULG), Nushares ESG Large-Cap Value ETF (NULV), Nushares ESG Mid-Cap Growth ETF (NUMG), Nushares ESG Mid-Cap Value ETF (NUMV) and Nushares ESG Small-Cap ETF (NUSC) (each a “Fund” and collectively, the “Funds”), as diversified funds, among others. The Trust was organized as a Massachusetts business trust on February 20, 2015. Shares of the Funds are listed and traded on the Cboe BZX Exchange, Inc. (the “Exchange”).
The end of the reporting period for the Funds is October 31, 2018, and the period covered by these Notes to Financial Statements is the fiscal year ended October 31, 2018 (the “current fiscal period”).
Investment Adviser
The Funds’ investment adviser is Nuveen Fund Advisors, LLC (the “Adviser”), a subsidiary of Nuveen, LLC (“Nuveen”). Nuveen is the investment management arm of Teachers Insurance and Annuity Association of America (“TIAA”). The Adviser has overall responsibility for management of the Funds, oversees the management of the Funds’ portfolios, manages the Funds’ business affairs and provides certain clerical, bookkeeping and other administrative services. The Adviser has entered into a sub-advisory agreement with Teachers Advisors, LLC (the “Sub-Adviser”), an affiliate of the Adviser, under which the Sub-Adviser manages the investment portfolios of the Funds.
Investment Objectives
NUEM seeks to track the investment results, before fees and expenses, of the TIAA ESG Emerging Markets Equity Index. NUDM seeks to track the investment results, before fees and expenses, of the TIAA ESG International Developed Markets Equity Index. NULG seeks to track the investments results, before fees and expenses, of the TIAA ESG USA Large-Cap Growth Index. NULV seeks to track the investments results, before fees and expenses, of the TIAA ESG USA Large-Cap Value Index. NUMG seeks to track the investments results, before fees and expenses, of the TIAA ESG USA Mid-Cap Growth Index. NUMV seeks to track the investments results, before fees and expenses, of the TIAA ESG USA Mid-Cap Value Index. NUSC seeks to track the investments results, before fees and expenses, of the TIAA ESG USA Small-Cap Index.
The Funds’ most recent prospectus provides further description of each Fund’s investment objective, principal investment strategies and principal risks.
Significant Accounting Policies
Each Fund is an investment company and follows accounting and reporting guidance under Financial Accounting Standards Board (FASB) Accounting Standards Codification (ASC) Topic 946 “Financial Services – Investment Companies.” The following is a summary of significant accounting policies followed by the Funds in the preparation of their financial statements in accordance with U.S. generally accepted accounting principles (“U.S. GAAP”).
Investment Transactions
Investment transactions are recorded on a trade date basis. Realized gains and losses from investment transactions are determined on the specific identification method, which is the same basis used for federal income tax purposes. Investments purchased on a when-issued/delayed delivery basis may have extended settlement periods. Any investments so purchased are subject to market fluctuation during this period. The Funds have earmarked securities in their portfolios with a current value at least equal to the amount of the when-issued/delayed delivery purchase commitments.
As of the end of the reporting period, the Funds did not have any outstanding when-issued/delayed delivery purchase commitments.
Investment Income
Dividend income is recorded on the ex-dividend date or, for foreign securities, when information is available. Non-cash dividends received in the form of stock, if any, are recognized on the ex-dividend date and recorded at fair value. Interest income is recorded on an accrual basis.
Professional Fees
Professional fees presented on the Statement of Operations consist of fees and expenses of legal counsel to the Funds’ Board of Trustees (the “Board”).
98
Dividends and Distributions to Shareholders
Dividends from net investment income, if any, are declared and distributed to shareholders annually. Net realized capital gains from investment transactions, if any, are declared and distributed to shareholders at least annually. Furthermore, capital gains are distributed only to the extent they exceed available capital loss carryforwards.
Distributions to shareholders are recorded on the ex-dividend date. The amount and timing of distributions are determined in accordance with federal income tax regulations, which may differ from U.S. GAAP.
Compensation
The Trust pays no compensation directly to those of its trustees who are affiliated with the Adviser or to its officers, all of whom receive remuneration for their services to the Trust from the Adviser or its affiliates. The Board has adopted a deferred compensation plan for independent trustees that enables trustees to elect to defer receipt of all or a portion of the annual compensation they are entitled to receive from certain Nuveen-advised funds. Under the plan, deferred amounts are treated as though equal dollar amounts had been invested in shares of select Nuveen-advised funds.
Indemnifications
Under the Trust’s organizational documents, its officers and trustees are indemnified against certain liabilities arising out of the performance of their duties to the Trust. In addition, in the normal course of business, the Trust enters into contracts that provide general indemnifications to other parties. The Trust’s maximum exposure under these arrangements is unknown as this would involve future claims that may be made against the Trust that have not yet occurred. However, the Trust has not had prior claims or losses pursuant to these contracts and expects the risk of loss to be remote.
Use of Estimates
The preparation of financial statements in conformity with U.S. GAAP requires management to make estimates and assumptions that affect the reported amounts of assets and liabilities at the date of the financial statements and the reported amounts of increases and decreases in net assets from operations during the reporting period. Actual results may differ from those estimates.
2. Investment Valuation and Fair Value Measurements
The fair valuation input levels as described below are for fair value measurement purposes.
Fair value is defined as the price that would be received upon selling an investment or transferring a liability in an orderly transaction to an independent buyer in the principal or most advantageous market for the investment. A three-tier hierarchy is used to maximize the use of observable market data and minimize the use of unobservable inputs and to establish classification of fair value measurements for disclosure purposes. Observable inputs reflect the assumptions market participants would use in pricing the asset or liability. Observable inputs are based on market data obtained from sources independent of the reporting entity. Unobservable inputs reflect the reporting entity’s own assumptions about the assumptions market participants would use in pricing the asset or liability. Unobservable inputs are based on the best information available in the circumstances. The following is a summary of the three-tiered hierarchy of valuation input levels.
| | |
| Level 1 – | | Inputs are unadjusted and prices are determined using quoted prices in active markets for identical securities. |
| Level 2 – | | Prices are determined using other significant observable inputs (including quoted prices for similar securities, interest rates, credit spreads, etc.). |
| Level 3 – | | Prices are determined using significant unobservable inputs (including management’s assumptions in determining the fair value of investments). |
Common stocks and other equity-type securities are valued at the last sales price on the securities exchange on which such securities are primarily traded and are generally classified as Level 1. Securities primarily traded on the Nasdaq National Market (“Nasdaq”) are valued at the Nasdaq Official Closing Price and are generally classified as Level 1. However, securities traded on a securities exchange or Nasdaq for which there were no transactions on a given day or securities not listed on a securities exchange or Nasdaq are valued at the quoted bid price and are generally classified as Level 2. Prices of certain American Depositary Receipts (“ADR”) held by the Funds that trade in the United States are valued based on the last traded price, official closing price or the most recent bid price of the underlying non-U.S.-traded stock, adjusted as appropriate for the underlying-to-ADR conversion ratio and foreign exchange rate, and from time-to-time may also be adjusted further to take into account material events that may take place after the close of the local non-U.S. market but before the close of the New York Stock Exchange (“NYSE”), which may represent a transfer from a Level 1 to a Level 2 security.
Investments initially valued in currencies other than the U.S. dollar are converted to the U.S. dollar using exchange rates obtained from an independent pricing service (“pricing service”). As a result, the net asset value (“NAV”) of a Fund’s shares may be affected by changes in the value of currencies in relation to the U.S. dollar. The value of securities traded in markets outside the United States or denominated in currencies other than the U.S. dollar may be affected significantly on a day that the NYSE is closed and an investor is not able to purchase, redeem or exchange shares. If significant market events occur between the time of determination of the closing price of a foreign security on an exchange and the time that the Funds’ NAV is determined, or if under the Funds’ procedures, the closing price of a foreign security is not deemed to be reliable, the security would be valued at fair value as determined in accordance with procedures established in good faith by the Board. These securities are generally classified as Level 2 or Level 3 depending on the observability of the significant inputs.
99
Notes to Financial Statements (continued)
Certain securities may not be able to be priced by the pre-established pricing methods as described above. Such securities may be valued by the Board and/or its appointee at fair value. These securities generally include, but are not limited to, restricted securities (securities which may not be publicly sold without registration under the Securities Act of 1933, as amended) for which a pricing service is unable to provide a market price; securities whose trading has been formally suspended; debt securities that have gone into default and for which there is no current market quotation; a security whose market price is not available from a pre-established pricing source; a security with respect to which an event has occurred that is likely to materially affect the value of the security after the market has closed but before the calculation of the Fund’s NAV (as may be the case in non-U.S. markets on which the security is primarily traded) or make it difficult or impossible to obtain a reliable market quotation; and a security whose price, as provided by the pricing service, is not deemed to reflect the security’s fair value. As a general principle, the fair value of a security would appear to be the amount that the owner might reasonably expect to receive for it in a current sale. A variety of factors may be considered in determining the fair value of such securities, which may include consideration of the following: yields or prices of investments of comparable quality, type of issue, coupon, maturity and rating, market quotes or indications of value from security dealers, evaluations of anticipated cash flows or collateral, general market conditions and other information and analysis, including the obligor’s credit characteristics considered relevant. These securities are generally classified as Level 2 or Level 3 depending on the observability of the significant inputs. Regardless of the method employed to value a particular security, all valuations are subject to review by the Board and/or its appointee.
The inputs or methodologies used for valuing securities are not an indication of the risks associated with investing in those securities. The following is a summary of each Fund’s fair value measurements as of the end of the reporting period:
| | | | | | | | | | | | | | | | |
| NUEM | | Level 1 | | | Level 2 | | | Level 3 | | | Total | |
| Long-Term Investments*: | | | | | | | | | | | | | | | | |
Common Stocks | | $ | 35,198,449 | | | $ | 419,180 | ** | | $ | 625 | *** | | $ | 35,618,254 | |
Common Stock Rights | | | 160 | | | | — | | | | — | | | | 160 | |
| Total | | $ | 35,198,609 | | | $ | 419,180 | | | $ | 625 | | | $ | 35,618,414 | |
| | | | |
| NUDM | | | | | | | | | | | | |
| Long-Term Investments*: | | | | | | | | | | | | | | | | |
Common Stocks | | $ | 43,181,666 | | | $ | — | | | $ | — | | | $ | 43,181,666 | |
| | | | |
| NULG | | | | | | | | | | | | |
| Long-Term Investments*: | | | | | | | | | | | | | | | | |
Common Stocks | | $ | 59,090,457 | | | $ | — | | | $ | — | | | $ | 59,090,457 | |
| | | | |
| NULV | | | | | | | | | | | | |
| Long-Term Investments*: | | | | | | | | | | | | | | | | |
Common Stocks | | $ | 45,902,322 | | | $ | — | | | $ | — | | | $ | 45,902,322 | |
| | | | |
| NUMG | | | | | | | | | | | | |
| Long-Term Investments*: | | | | | | | | | | | | | | | | |
Common Stocks | | $ | 49,303,464 | | | $ | — | | | $ | — | | | $ | 49,303,464 | |
| | | | |
| NUMV | | | | | | | | | | | | |
| Long-Term Investments*: | | | | | | | | | | | | | | | | |
Common Stocks | | $ | 47,227,161 | | | $ | — | | | $ | — | | | $ | 47,227,161 | |
| | | | |
| NUSC | | | | | | | | | | | | |
| Long-Term Investments*: | | | | | | | | | | | | | | | | |
Common Stocks | | $ | 80,294,273 | | | $ | — | | | $ | — | | | $ | 80,294,273 | |
Common Stock Rights | | | — | | | | — | | | | 323 | *** | | | 323 | |
| Short-Term Investments: | | | | | | | | | | | | | | | | |
U.S. Government and Agency Obligations | | | — | | | | 120,000 | | | | — | | | | 120,000 | |
| Total | | $ | 80,294,273 | | | $ | 120,000 | | | $ | 323 | | | $ | 80,414,596 | |
| * | Refer to the Fund’s Portfolio of Investments for industry classifications. |
| ** | Refer to the Fund’s Portfolio of Investments for securities classified as Level 2. |
| *** | Refer to the Fund’s Portfolio of Investments for securities classified as Level 3. |
100
3. Portfolio Securities and Investments in Derivatives
Portfolio Securities
Foreign Currency Transactions
To the extent that the Funds invest in securities and/or contracts that are denominated in a currency other than U.S. dollars, the Funds will be subject to currency risk, which is the risk that an increase in the U.S. dollar relative to the foreign currency will reduce returns or portfolio value. Generally, when the U.S. dollar rises in value against a foreign currency, the Funds’ investments denominated in that currency will lose value because its currency is worth fewer U.S. dollars; the opposite effect occurs if the U.S. dollar falls in relative value. Investments and other assets and liabilities denominated in foreign currencies are converted into U.S. dollars on a spot (i.e. cash) basis at the spot rate prevailing in the foreign currency exchange market at the time of valuation. Purchases and sales of investments and income denominated in foreign currencies are translated into U.S. dollars on the respective dates of such transactions.
As of the end of the reporting period, the following Funds’ investments in non-U.S. securities were as follows:
| | | | | | | | |
| NUEM | | Value | | | % of
Net Assets | |
| Country: | | | | | | | | |
China | | $ | 9,715,964 | | | | 27.2 | % |
Korea, Republic of | | | 4,974,351 | | | | 13.9 | |
Taiwan | | | 4,808,295 | | | | 13.5 | |
India | | | 3,952,787 | | | | 11.1 | |
Brazil | | | 2,900,467 | | | | 8.1 | |
South Africa | | | 2,201,047 | | | | 6.2 | |
Mexico | | | 1,119,856 | | | | 3.1 | |
Thailand | | | 1,029,655 | | | | 2.9 | |
Malaysia | | | 995,707 | | | | 2.8 | |
Indonesia | | | 720,848 | | | | 2.0 | |
Other | | | 3,199,437 | | | | 9.0 | |
| Total non-U.S. securities | | $ | 35,618,414 | | | | 99.8 | % |
| | | | | | | | |
| NUDM | | Value | | | % of
Net Assets | |
| Country: | | | | | | | | |
Japan | | $ | 10,512,741 | | | | 24.2 | % |
United Kingdom | | | 7,169,880 | | | | 16.5 | |
France | | | 4,603,705 | | | | 10.6 | |
Germany | | | 4,238,617 | | | | 9.8 | |
Switzerland | | | 3,526,886 | | | | 8.1 | |
Australia | | | 2,776,840 | | | | 6.4 | |
Spain | | | 1,515,242 | | | | 3.5 | |
Hong Kong | | | 1,507,645 | | | | 3.5 | |
Sweden | | | 1,284,013 | | | | 3.0 | |
Netherlands | | | 1,276,028 | | | | 2.9 | |
Other | | | 4,770,069 | | | | 11.0 | |
| Total non-U.S. securities | | $ | 43,181,666 | | | | 99.5 | % |
The books and records of the Funds are maintained in U.S. dollars. Foreign currencies, assets and liabilities are translated into U.S. dollars at 4:00 p.m. London Time. Investment transactions, income and expenses are translated on the respective dates of such transactions. Net realized foreign currency gains and losses resulting from changes in exchange rates include foreign currency gains and losses between trade date and settlement date of the transactions, foreign currency transactions, and the difference between the amounts of interest and dividends recorded on the books of the Funds and the amounts actually received.
The realized gains and losses resulting from changes in foreign currency exchange rates and changes in foreign exchange rates associated with (i) foreign currency, (ii) investments, (iii) investments in derivatives and (iv) other assets and liabilities are recognized as a component of “Net realized gain (loss) from investments and foreign currency” on the Statement of Operations, when applicable.
The unrealized gains and losses resulting from changes in foreign currency exchange rates and changes in foreign exchange rates associated with (i) investments and (ii) other assets and liabilities are recognized as a component of “Change in net unrealized appreciation (depreciation) of investments and foreign currency” on the Statement of Operations, when applicable. The unrealized gains and losses resulting from changes in foreign exchange rates associated with investments in derivatives are recognized as a component of the respective derivative’s related “Change in net unrealized appreciation (depreciation)” on the Statement of Operations, when applicable.
101
Notes to Financial Statements (continued)
Investments in Derivatives
Each Fund is authorized to invest in certain derivative instruments. The Funds record derivative instruments at fair value, with changes in fair value recognized on the Statement of Operations, when applicable. Even though the Funds’ investments in derivatives may represent economic hedges, they are not considered to be hedge transactions for financial reporting purposes.
Although each Fund is authorized to invest in derivative instruments, and may do so in the future, they did not make any such investments during the current fiscal period.
Market and Counterparty Credit Risk
In the normal course of business each Fund may invest in financial instruments and enter into financial transactions where risk of potential loss exists due to changes in the market (market risk) or failure of the other party to the transaction to perform (counterparty credit risk). The potential loss could exceed the value of the financial assets recorded on the financial statements. Financial assets, which potentially expose each Fund to counterparty credit risk, consist principally of cash due from counterparties on forward, option and swap transactions, when applicable. The extent of each Fund’s exposure to counterparty credit risk in respect to these financial assets approximates their carrying value as recorded on the Statement of Assets and Liabilities.
Each Fund helps manage counterparty credit risk by entering into agreements only with counterparties the Adviser believes have the financial resources to honor their obligations and by having the Adviser monitor the financial stability of the counterparties. Additionally, counterparties may be required to pledge collateral daily (based on the daily valuation of the financial asset) on behalf of each Fund with a value approximately equal to the amount of any unrealized gain above a pre-determined threshold. Reciprocally, when each Fund has an unrealized loss, the Funds have instructed the custodian to pledge assets of the Funds as collateral with a value approximately equal to the amount of the unrealized loss above a pre-determined threshold. Collateral pledges are monitored and subsequently adjusted if and when the valuations fluctuate, either up or down, by at least the pre-determined threshold amount.
4. Fund Shares
Each Fund issues and redeems its shares on a continuous basis at NAV only in aggregations of a specified number of shares or multiples thereof (“Creation Units”). Only certain institutional investors (referred to as “Authorized Participants”) who have entered into agreements with Nuveen Securities, LLC, the Funds’ distributor, may purchase and redeem Creation Units. Once created, shares of the Funds trade on the Exchange at market prices and are only available to individual investors through their brokers.
Creation Units are purchased and redeemed in-kind for a designated portfolio of securities included in each Fund’s respective Index and/or a specified amount of cash. Authorized Participants are charged fixed transaction fees in connection with purchasing and redeeming Creation Units. Authorized Participants transacting in Creation Units for cash may also pay an additional variable charge to compensate the relevant Fund for certain transaction costs (i.e., taxes on currency or other financial transactions, and brokerage costs) and market impact expenses it incurs in purchasing or selling portfolio securities. Such variable charges, if any, are included in “Proceeds from shares sold” on the Statements of Changes in Net Assets.
Transactions in Fund shares during the current and prior fiscal period were as follows:
| | | | | | | | | | | | | | | | | | | | | | | | | | | | | | | | |
| | | NUEM | | | NUDM | |
| | | Year Ended
10/31/18 | | | For the period 6/6/17
(commencement of operations)
through 10/31/17 | | | Year Ended
10/31/18 | | | For the period 6/6/17
(commencement of operations)
through 10/31/17 | |
| | | Shares | | | Amount | | | Shares | | | Amount | | | Shares | | | Amount | | | Shares | | | Amount | |
| Shares sold | | | 600,000 | | | $ | 16,928,471 | | | | 900,000 | | | $ | 23,666,666 | | | | 900,000 | | | $ | 23,801,244 | | | | 900,000 | | | $ | 23,075,135 | |
| | | | | | | | | | | | | | | | | | | | | | | | | | | | | | | | |
| | | NULG | | | NULV | |
| | | Year Ended
10/31/18 | | | For the period 12/13/16
(commencement of operations)
through 10/31/17 | | | Year Ended
10/31/18 | | | For the period 12/13/16
(commencement of operations)
through 10/31/17 | |
| | | Shares | | | Amount | | | Shares | | | Amount | | | Shares | | | Amount | | | Shares | | | Amount | |
| Shares sold | | | 1,050,000 | | | $ | 34,579,855 | | | | 900,000 | | | $ | 25,501,848 | | | | 850,000 | | | $ | 24,269,935 | | | | 1,050,000 | | | $ | 27,911,667 | |
| Shares redeemed | | | (100,000 | ) | | | (3,291,410 | ) | | | (100,000 | ) | | | (2,619,100 | ) | | | (250,000 | ) | | | (7,408,650 | ) | | | (50,000 | ) | | | (1,243,830 | ) |
| Net increase | | | 950,000 | | | $ | 31,288,445 | | | | 800,000 | | | $ | 22,882,748 | | | | 600,000 | | | $ | 16,861,285 | | | | 1,000,000 | | | $ | 26,667,837 | |
102
| | | | | | | | | | | | | | | | | | | | | | | | | | | | | | | | |
| | | NUMG | | | NUMV | |
| | | Year Ended
10/31/18 | | | For the period 12/13/16
(commencement of operations)
through 10/31/17 | | | Year Ended
10/31/18 | | | For the period 12/13/16
(commencement of operations)
through 10/31/17 | |
| | | Shares | | | Amount | | | Shares | | | Amount | | | Shares | | | Amount | | | Shares | | | Amount | |
| Shares sold | | | 950,000 | | | $ | 28,270,865 | | | | 800,000 | | | $ | 21,610,997 | | | | 900,000 | | | $ | 24,857,815 | | | | 850,000 | | | $ | 22,411,960 | |
| Shares redeemed | | | (50,000 | ) | | | (1,454,885 | ) | | | (50,000 | ) | | | (1,312,430 | ) | | | — | | | | — | | | | — | | | | — | |
| Net increase | | | 900,000 | | | $ | 26,815,980 | | | | 750,000 | | | $ | 20,298,567 | | | | 900,000 | | | $ | 24,857,815 | | | | 850,000 | | | $ | 22,411,960 | |
| | | | | | | | | | | | | | | | | | | | | | | | |
| | | | | | | | | NUSC | |
| | | | | | | | | Year Ended
10/31/18 | | | For the period 12/13/16
(commencement of operations)
through 10/31/17 | |
| | | | | | | | | Shares | | | Amount | | | Shares | | | Amount | |
| Shares sold | | | | | | | | | | | 1,800,000 | | | $ | 53,444,235 | | | | 1,150,000 | | | $ | 29,992,821 | |
| Shares redeemed | | | | | | | | | | | (50,000 | ) | | | (1,508,955 | ) | | | (50,000 | ) | | | (1,244,995 | ) |
| Net increase | | | | | | | | | | | 1,750,000 | | | $ | 51,935,280 | | | | 1,100,000 | | | $ | 28,747,826 | |
5. Investment Transactions
Long-term purchases and sales (excluding in-kind transactions) during the current fiscal period were as follows:
| | | | | | | | | | | | | | | | | | | | | | | | | | | | |
| | | NUEM | | | NUDM | | | NULG | | | NULV | | | NUMG | | | NUMV | | | NUSC | |
| Purchases | | $ | 38,212,414 | | | $ | 25,626,238 | | | $ | 30,270,936 | | | $ | 23,498,411 | | | $ | 25,853,717 | | | $ | 28,757,649 | | | $ | 29,505,283 | |
| Sales | | | 24,372,673 | | | | 23,573,162 | | | | 30,143,705 | | | | 22,983,776 | | | | 25,977,774 | | | | 27,996,742 | | | | 29,129,258 | |
In-kind transactions during the current fiscal period were as follows:
| | | | | | | | | | | | | | | | | | | | | | | | | | | | |
| | | NUEM | | | NUDM | | | NULG | | | NULV | | | NUMG | | | NUMV | | | NUSC | |
| In-kind purchases | | $ | 3,428,593 | | | $ | 22,825,307 | | | $ | 34,507,948 | | | $ | 24,195,995 | | | $ | 28,209,330 | | | $ | 24,704,966 | | | $ | 53,251,053 | |
| In-kind sales | | | — | | | | — | | | | 3,284,413 | | | | 7,401,526 | | | | 1,453,707 | | | | — | | | | 1,504,922 | |
6. Income Tax Information
Each Fund is a separate taxpayer for federal income tax purposes. Each Fund intends to distribute substantially all of its net investment income and net capital gains to shareholders and to otherwise comply with the requirements of Subchapter M of the Internal Revenue Code applicable to regulated investment companies. Therefore, no federal income tax provision is required.
For all open tax years and all major taxing jurisdictions, management of the Funds has concluded that there are no significant uncertain tax positions that would require recognition in the financial statements. Open tax years are those that are open for examination by taxing authorities (i.e., generally the last four tax year ends and the interim tax period since then). Furthermore, management of the Funds is also not aware of any tax positions for which it is reasonably possible that the total amounts of unrecognized tax benefits will significantly change in the next twelve months.
The following information is presented on an income tax basis. Differences between amounts for financial statement and federal income tax purposes are primarily due to timing differences in recognizing certain gains and losses on investment transactions. To the extent that differences arise that are permanent in nature, such amounts are reclassified within the capital accounts as detailed below. Temporary differences do not require reclassification. Temporary and permanent differences do not impact the NAVs of the Funds.
The table below presents the cost and unrealized appreciation (depreciation) of each Fund’s investment portfolio, as determined on a federal income
tax basis, as of October 31, 2018.
| | | | | | | | | | | | | | | | | | | | | | | | | | | | |
| | | NUEM | | | NUDM | | | NULG | | | NULV | | | NUMG | | | NUMV | | | NUSC | |
| Tax cost of investments | | $ | 40,654,856 | | | $ | 47,541,401 | | | $ | 56,845,535 | | | $ | 46,126,260 | | | $ | 49,515,169 | | | $ | 48,595,666 | | | $ | 83,743,812 | |
| Gross unrealized: | | | | | | | | | | | | | | | | | | | | | | | | | | | | |
Appreciation | | $ | 1,084,886 | | | $ | 1,150,562 | | | $ | 5,123,228 | | | $ | 2,485,349 | | | $ | 3,417,675 | | | $ | 2,136,910 | | | $ | 4,393,955 | |
Depreciation | | | (6,121,328 | ) | | | (5,510,297 | ) | | | (2,878,306 | ) | | | (2,709,287 | ) | | | (3,629,380 | ) | | | (3,505,415 | ) | | | (7,723,171 | ) |
| Net unrealized appreciation (depreciation) of investments | | $ | (5,036,442 | ) | | $ | (4,359,735 | ) | | $ | 2,244,922 | | | $ | (223,938 | ) | | $ | (211,705 | ) | | $ | (1,368,505 | ) | | $ | (3,329,216 | ) |
Permanent differences, primarily due to foreign currency transactions, redemption in-kind, capital gain tax expense, federal taxes paid, distribution reallocations and investments in passive foreign investment companies, resulted in reclassifications among the Funds’ components of net assets as of October 31, 2018, the Funds’ tax year end.
103
Notes to Financial Statements (continued)
The tax components of undistributed net ordinary income and net long-term capital gains as of October 31, 2018, the Funds’ tax year end, were as follows:
| | | | | | | | | | | | | | | | | | | | | | | | | | | | |
| | | NUEM | | | NUDM | | | NULG | | | NULV | | | NUMG | | | NUMV | | | NUSC | |
| Undistributed net ordinary income1 | | $ | 696,064 | | | $ | 1,105,230 | | | $ | 1,858,047 | | | $ | 1,483,975 | | | $ | 1,854,764 | | | $ | 1,324,031 | | | $ | 2,253,415 | |
| Undistributed net long-term capital gains | | | — | | | | — | | | | 66,602 | | | | 67,290 | | | | 342,792 | | | | 93,320 | | | | 433,348 | |
| 1 | Net ordinary income consists of net taxable income derived from dividends, interest, and net short-term capital gains, if any. |
The tax character of distributions paid during the Funds’ tax years ended October 31, 2018 and October 31, 2017 was designated for purposes of the dividends paid deduction as follows:
| | | | | | | | | | | | | | | | | | | | | | | | | | | | |
| 2018 | | NUEM | | | NUDM | | | NULG | | | NULV | | | NUMG | | | NUMV | | | NUSC | |
| Distributions from net ordinary income1 | | $ | 237,640 | | | $ | 189,750 | | | $ | 246,098 | | | $ | 486,906 | | | $ | 220,545 | | | $ | 310,481 | | | $ | 381,407 | |
| Distributions from net long-term capital gains | | | — | | | | — | | | | 122 | | | | 2,394 | | | | 585 | | | | 4,744 | | | | 6,323 | |
| | | | | | | | |
| For the period June 6, 2017 (commencement of operations) through October 31, 2017 | | NUEM | | | NUDM | |
| Distributions from net ordinary income1 | | $ | — | | | $ | — | |
| Distributions from net long-term capital gains | | | — | | | | — | |
| | | | | | | | | | | | | | | | | | | | |
| For the period December 13, 2016 (commencement of operations) through October 31, 2017 | | NULG | | | NULV | | | NUMG | | | NUMV | | | NUSC | |
| Distributions from net ordinary income1 | | $ | — | | | $ | — | | | $ | — | | | $ | — | | | $ | — | |
| Distributions from net long-term capital gains | | | — | | | | — | | | | — | | | | — | | | | — | |
| 1 | Net ordinary income consists of net taxable income derived from dividends, interest, and net short-term capital gains, if any. |
As of October 31, 2018, the Funds’ tax year end, the following Funds had unused capital losses carrying forward available for federal income tax purposes to be applied against future capital gains, if any. The capital losses are not subject to expiration.
| | | | | | | | |
| | | NUEM | | | NUDM | |
| Not subject to expiration: | | | | | | | | |
Short-term | | $ | 457,682 | | | $ | 235,983 | |
Long-term | | | 104,477 | | | | — | |
| Total | | $ | 562,159 | | | $ | 235,983 | |
7. Management Fees and Other Transactions with Affiliates
Management Fees
Each Fund’s management fee compensates the Adviser for its investment advisory services to the Funds. The Sub-Adviser is compensated for its services to the Funds from the management fees paid to the Adviser. The Adviser is responsible for substantially all other expenses of the Funds, except any future distribution and/or service fees, interest expenses, taxes, acquired fund fees and expenses, fees incurred in acquiring and disposing of portfolio securities, fees and expenses of the independent trustees (including any trustees’ counsel fees), certain compensation expenses of the Funds’ chief compliance officer, litigation expenses and extraordinary expenses.
The annual management fee, payable monthly, for each Fund is based on a percentage of average daily net assets according to the following rates:
| | | | |
| Fund | | Management Fee | |
| NUEM | | | 0.45 | % |
| NUDM | | | 0.40 | |
| NULG | | | 0.35 | |
| NULV | | | 0.35 | |
| NUMG | | | 0.40 | |
| NUMV | | | 0.40 | |
| NUSC | | | 0.40 | |
Other Transactions with Affiliates
Each Fund is permitted to purchase or sell securities from or to certain other funds or other accounts managed by the Sub-Adviser (“inter-fund trade”) under specified conditions outlined in procedures adopted by the Board. These procedures have been designed to ensure that any inter-fund trade of securities by the Fund from or to another fund or an account that is, or could be, considered an affiliate of the Fund under certain limited circumstances by virtue of having a common investment adviser (or affiliated investment adviser), common officer and/or common trustee complies with Rule 17a-7 under the 1940 Act. Each inter-fund trade is effected at the current market price, determined in accordance with the procedures. Unsettled inter-fund trades as of the end of the reporting period are recognized as a component of “Receivable for investments sold” and/or “Payable for investments purchased” on the Statement of Assets and Liabilities, when applicable.
104
During the current fiscal period, the following Funds engaged in inter-fund trades pursuant to these procedures as follows:
| | | | | | | | | | | | | | |
| Inter-Fund Trades | | NULG | | | NULV | | NUMG | | | NUMV | | NUSC |
| Purchases | | $ | 13,568,369 | | | $10,011,472 | | $ | 10,953,497 | | | $10,394,583 | | $2,742,968 |
| Sales | | $ | 8,066,238 | | | $4,100,506 | | $ | 3,020,665 | | | $5,305,747 | | $2,404,728 |
As of the end of the reporting period, TIAA owned shares of the Funds as follows:
| | | | | | | | | | | | | | | | | | |
| Fund | | NUEM | | | NUDM | | NULG | | | NULV | | NUMG | | NUMV | | NUSC |
| TIAA owned shares | | | 1,154,900 | | | 1,335,500 | | | 1,121,100 | | | 992,800 | | 1,204,500 | | 1,250,400 | | 946,000 |
8. New Accounting Pronouncements
Disclosure Update and Simplification
During August 2018, the Securities and Exchange Commission (the “SEC”) issued Final Rule Release No. 33-10532, Disclosure Update and Simplification (“Final Rule Release No. 33-10532”). Final Rule Release No. 33-10532 amends certain financial statement disclosure requirements to conform to U.S. GAAP. The amendments to Rule 6-04.17 of Regulation S-X (balance sheet) remove the requirement to separately state the book basis components of net assets: undistributed (over-distribution of) net investment income (“UNII”), accumulated undistributed net realized gains (losses), and net unrealized appreciation (depreciation) at the balance sheet date. Instead, consistent with U.S. GAAP, funds will be required to disclose total distributable earnings. The amendments to Rule 6-09 of Regulation S-X (statement of changes in net assets) remove the requirement to separately state the sources of distributions paid. Instead, consistent with U.S. GAAP, funds will be required to disclose the total amount of distributions paid, except that any tax return of capital must be separately disclosed. The amendments also remove the requirement to parenthetically state the book basis amount of UNII on the statement of changes in net assets.
The requirements of Final Rule Release No. 33-10532 are effective November 5, 2018, and the Funds’ Statement of Assets and Liabilities and Statement of Changes in Net Assets for the current reporting period have been modified accordingly. In addition, certain amounts within each Fund’s Statement of Changes in Net Assets for the prior fiscal period have been modified to conform to Final Rule Release No. 33-10532. For the prior fiscal period, the total amount of distributions paid to shareholders from net investment income and from accumulated net realized gains, if any, are recognized as “Dividends” on the Statement of Changes in Net Assets.
As of October 31, 2017, the Funds’ Statements of Changes in Net Assets reflected the following UNII balances.
| | | | | | | | | | | | | | | | | | | | | | | | | | | | |
| | | NUEM | | | NUDM | | | NULG | | | NULV | | | NUMG | | | NUMV | | | NUSC | |
| UNII at the end of period | | $ | 88,285 | | | $ | 81,396 | | | $ | 65,029 | | | $ | 191,262 | | | $ | 23,741 | | | $ | 128,674 | | | $ | 150,056 | |
105
Additional Fund Information
(Unaudited)
| | | | | | | | | | |
| | | | | |
| | Adviser Nuveen Fund Advisors, LLC 333 West Wacker Drive Chicago, IL 60606 Sub-Adviser Teachers Advisors, LLC 730 Third Avenue New York, NY 10017-3206 | | Independent Registered
Public Accounting Firm KPMG LLP 200 East Randolph Street Chicago, IL 60601 Administrator, Custodian and
Transfer Agent Brown Brothers Harriman 50 Post Office Square Boston, MA 02110 | | Legal Counsel Chapman and Cutler LLP Chicago, IL 60603 Morgan, Lewis & Bockius LLP 1111 Pennsylvania Avenue, NW Washington, D.C. 20004 | | | | |
| | | | | | | | | | | | | | | | | | | | | | | | | | | | | | | | | | | | | | |
| | | | | | | | | | |
| | | | | | | | | | | | | | | | | | | | | | | | | | | | | | | | | | |
| | Foreign Taxes: NUEM and NUDM paid qualifying foreign taxes of $122,736 and $124,547, respectively, and earned $1,079,001 and $1,462,177 of foreign source income, respectively, during the fiscal year ended October 31, 2018. Pursuant to Section 853 of the Internal Revenue Code, NUEM and NUDM hereby designate $0.08 and $0.07 per share as foreign taxes paid, respectively, and $0.72 and $0.81 per share as income earned from foreign sources, respectively, for the fiscal year ended October 31, 2018. The actual foreign tax credit distribution will be reported to shareholders on Form 1099-DIV which will be sent to shareholders shortly after calendar year end. | | | |
| | | | | | | | |
| | | | | | | | | | | | | | | | | | | | | | | |
| | Distribution Information: The Funds hereby designate their percentages of dividends paid from net ordinary income as dividends qualifying for the 70% dividends received deduction (“DRD”) for corporations and their percentages as qualified dividend income (“QDI”) for individuals under Section 1 (h)(11) of the Internal Revenue Code as shown in the accompanying table. The actual qualified dividend income distributions will be reported to shareholders on Form 1099-DIV which will be sent to shareholders shortly after calendar year end. | | | |
| | | | | | | | | |
| | | | | NUEM | | | NUDM | | | NULG | | | NULV | | | NUMG | | | NUMV | | | NUSC | | | |
| | % QDI | | | 21.2% | | | | 74.6% | | | | 52.5% | | | | 69.0% | | | | 29.1% | | | | 52.3% | | | | 42.4% | | | |
| | % DRD | | | 0.0% | | | | 0.0% | | | | 49.8% | | | | 67.2% | | | | 29.4% | | | | 51.1% | | | | 46.9% | | | |
106
| | | | | | | | | | | | | | |
| | | | | |
| | | | | | | | | | |
| | The tables below show the number and percentage of days during the current fiscal period that each Fund’s market price was greater than its NAV per share (i.e., at a premium) and less than its NAV per share (i.e., at a discount). The market price is determined using the midpoint between the highest bid and the lowest offer on the applicable Fund’s listing exchange, as of the time that the Fund’s NAV is calculated (normally 4:00 p.m. Eastern Time). | | |
| | | | |
| | | | | NUEM | | NUDM | | |
| | | Fiscal year ended October 31, 2018 | | Number of Days | | % of Total Days | | Number of Days | | % of Total Days | | |
| | Premium/Discount Range: | | | | | | | | | | |
| | 1.01% to 3.00% | | 63 | | 25.0% | | 14 | | 5.5% | | |
| | 0.51% to 1.00% | | 76 | | 30.1% | | 108 | | 42.8% | | |
| | 0.26% to 0.50% | | 33 | | 13.1% | | 76 | | 30.2% | | |
| | 0.00% to 0.25% | | 29 | | 11.5% | | 32 | | 12.7% | | |
| | (0.01)% to (0.25)% | | 24 | | 9.5% | | 9 | | 3.6% | | |
| | (0.26)% to (0.50)% | | 9 | | 3.6% | | 5 | | 2.0% | | |
| | (0.51)% to (1.00)% | | 12 | | 4.8% | | 5 | | 2.0% | | |
| | (1.01)% to (3.00)% | | | | 5 | | 2.0% | | 3 | | 1.2% | | |
| | Less than (3.00)% | | | | 1 | | 0.4% | | — | | 0.0% | | |
| | | | 252 | | 100% | | 252 | | 100% | | |
| | | | |
| | | | | NULG | | NULV | | |
| | | Fiscal year ended October 31, 2018 | | Number of Days | | % of Total Days | | Number of Days | | % of Total Days | | |
| | Premium/Discount Range: | | | | | | | | | | |
| | Greater than 3.00% | | 1 | | 0.4% | | — | | 0.0% | | |
| | 0.00% to 0.25% | | 234 | | 92.9% | | 214 | | 84.9% | | |
| | (0.01)% to (0.25)% | | 17 | | 6.7% | | 38 | | 15.1% | | |
| | | | | | 252 | | 100% | | 252 | | 100% | | |
| | | | |
| | | | | NUMG | | NUMV | | |
| | | Fiscal year ended October 31, 2018 | | Number of Days | | % of Total Days | | Number of Days | | % of Total Days | | |
| | Premium/Discount Range: | | | | | | | | | | |
| | Greater than 3.00% | | 1 | | 0.4% | | 1 | | 0.4% | | |
| | 0.00% to 0.25% | | 222 | | 88.1% | | 200 | | 79.4% | | |
| | (0.01)% to (0.25)% | | 29 | | 11.5% | | 51 | | 20.2% | | |
| | | | | | 252 | | 100% | | 252 | | 100% | | |
| | | | | | |
| | | | | | | | | | | NUSC | | |
| | | Fiscal year ended October 31, 2018 | | | | | | Number of Days | | % of Total Days | | |
| | Premium/Discount Range: | | | | | | | | | | |
| | 0.00% to 0.25% | | | | | | 206 | | 81.7% | | |
| | (0.01)% to (0.25)% | | | | | | 46 | | 18.3% | | |
| | | | | | | | | | 252 | | 100% | | |
| | | | | | | | | | | | | | |
| | | |
| | | | | | |
| | |
| | Quarterly Form N-Q Portfolio of Investments Information: Each Fund is required to file its complete schedule of portfolio holdings with the Securities and Exchange Commission (SEC) for the first and third quarters of each fiscal year on Form N-Q. You may obtain this information directly from the SEC. Visit the SEC on-line at http://www.sec.gov or in person at the SEC’s Public Reference Room in Washington, D.C. Call the SEC toll-free at (800) SEC-0330 for room hours and operation. | | |
| | | | | |
| | | | | | | | | | |
| | |
| | Nuveen Funds’ Proxy Voting Information: You may obtain (i) information regarding how each fund voted proxies relating to portfolio securities held during the most recent twelve-month period ended June 30, without charge, upon request, by calling Nuveen toll-free at (800) 257-8787 or on Nuveen’s website at www.nuveen.com and (ii) a description of the policies and procedures that each fund used to determine how to vote proxies relating to portfolio securities without charge, upon request, by calling Nuveen toll-free at (800) 257-8787. You may also obtain this information directly from the SEC. Visit the SEC on-line at http://www.sec.gov. | | |
| | | |
| | | | | | |
| | |
| | FINRA BrokerCheck: The Financial Industry Regulatory Authority (FINRA) provides information regarding the disciplinary history of FINRA member firms and associated investment professionals. This information as well as an investor brochure describing FINRA BrokerCheck is available to the public by calling the FINRA BrokerCheck Hotline number at (800) 289-9999 or by visiting www.FlNRA.org. | | |
107
Glossary of Terms Used in this Report
(Unaudited)
Average Annual Total Return: This is a commonly used method to express an investment’s performance over a particular, usually multi-year time period. It expresses the return that would have been necessary each year to equal the investment’s actual cumulative performance (including change in NAV or market price and reinvested dividends and capital gains distributions, if any) over the time period being considered.
Gross Domestic Product (GDP): The total market value of all final goods and services produced in a country/region in a given year, equal to total consumer, investment and government spending, plus the value of exports, minus the value of imports.
MSCI EAFE Index: The MSCI (Morgan Stanley Capital International) EAFE (Europe, Australasia, Far East) Index is a free float-adjusted market capitalization weighted index designed to measure developed market equity performance, excluding the U.S. and Canada. The MSCI EAFE Index consists of the following 21 developed market country indexes: Australia, Austria, Belgium, Denmark, Finland, France, Germany, Hong Kong, Ireland, Israel, Italy, Japan, the Netherlands, New Zealand, Norway, Portugal, Singapore, Spain, Sweden, Switzerland, and the United Kingdom. The index returns assume reinvestment of distributions, but do not reflect any applicable sales charges or management fees.
MSCI USA Growth Index: An index designed to capture large and mid cap securities exhibiting overall growth style characteristics in the U.S. The index returns assume reinvestment of distributions, but do not reflect any applicable sales charges or management fees.
MSCI USA Mid Cap Growth Index: An index designed to capture mid cap securities exhibiting overall growth style characteristics in the U.S. The index returns assume reinvestment of distributions, but do not reflect any applicable sales charges or management fees.
MSCI USA Mid Cap Value Index: An index designed to capture mid cap U.S. securities exhibiting overall value style characteristics. The index returns assume reinvestment of distributions, but do not reflect any applicable sales charges or management fees.
MSCI USA Small Cap Index: An index designed to measure the performance of the small cap segment of the U.S. equity market. The index returns assume reinvestment of distributions, but do not reflect any applicable sales charges or management fees.
MSCI USA Value Index: An index designed to capture large and mid cap U.S. securities exhibiting overall value style characteristics. The index returns assume reinvestment of distributions, but do not reflect any applicable sales charges or management fees.
Net Asset Value (NAV) Per Share: A fund’s Net Assets is equal to its total assets (securities, cash, accrued earnings and receivables) less its total liabilities. NAV per share is equal to the fund’s Net Assets divided by its number of shares outstanding.
TIAA ESG Emerging Markets Equity Index: A custom index that is owned and calculated by MSCI Inc., based on the MSCI Emerging Markets Index, and aims to increase exposure to positive environmental, social and governance (ESG) factors and exhibit lower carbon exposure as compared to the MSCI Emerging Markets Index. The NuShares ESG Emerging Markets Equity ETF (“Fund”) is not sponsored, endorsed, issued, sold or promoted by or affiliated with MSCI Inc. MSCI Inc. does not make any representation regarding the advisability of investing in the Fund. Index returns assume reinvestment of distributions, but do not include the effects of any applicable sales charges or management fees.
108
TIAA ESG International Developed Markets Equity Index: A custom index that is owned and calculated by MSCI Inc., based on the MSCI EAFE Index, and aims to increase exposure to positive environmental, social and governance (ESG) factors and exhibit lower carbon exposure as compared to the MSCI EAFE Index. The NuShares ESG International Developed Markets Equity ETF (“Fund”) is not sponsored, endorsed, issued, sold or promoted by or affiliated with MSCI Inc. MSCI Inc. does not make any representation regarding the advisability of investing in the Fund. Index returns assume reinvestment of distributions, but do not include the effects of any applicable sales charges or management fees.
TIAA ESG USA Large-Cap Growth Index: Based on the MSCI USA Growth index, its parent index, which captures large-cap securities exhibiting overall growth style characteristics in the U.S. The TIAA ESG USA Large-Cap Growth Index is designed to represent the performance of a TIAA strategy that aims to increase the Index’s exposure to positive environmental, social and governance (ESG) factors as well as exhibit lower carbon exposure than the Parent Index. The index also aims to minimize the tracking error relative to the Parent Index through an optimization process. The index returns assume reinvestment of distributions, but do not reflect any applicable sales charges or management fees.
TIAA ESG USA Large-Cap Value Index: Based on the MSCI USA Value index, its parent index, which captures large-cap U.S. securities exhibiting overall value style characteristics. The TIAA ESG Large-Cap Value is designed to represent the performance of a TIAA strategy that aims to increase the Index’s exposure to positive environmental, social and governance (ESG) factors as well as exhibit lower carbon exposure than the Parent Index. The index also aims to minimize the tracking error relative to the Parent Index through an optimization process. The index returns assume reinvestment of distributions, but do not reflect any applicable sales charges or management fees.
TIAA ESG USA Mid-Cap Growth Index: Based on the MSCI USA Mid-Cap Growth Index, its parent index, which captures mid cap securities exhibiting overall growth style characteristics in the US. The TIAA ESG USA Mid-Cap Growth is designed to represent the performance of a TIAA strategy that aims to increase the Index’s exposure to positive environmental, social and governance (ESG) factors as well as exhibit lower carbon exposure than the Parent Index. The index also aims to minimize the tracking error relative to the Parent Index through an optimization process. The index returns assume reinvestment of distributions, but do not reflect any applicable sales charges or management fees.
TIAA ESG USA Mid-Cap Value Index: Based on the MSCI USA Mid-Cap Value Index, its parent index, which captures mid-cap securities exhibiting overall value style characteristics in the U.S. The TIAA ESG USA Mid-Cap Value Index is designed to represent the performance of a TIAA strategy that aims to increase exposure to positive environmental, social and governance (ESG) factors and exhibit lower carbon exposure as compared to the MSCI USA Mid-Cap Value Index. The index returns assume reinvestment of distributions, but do not reflect any applicable sales charges or management fees.
TIAA ESG USA Small-Cap Index: Based on the MSCI USA Small-Cap Index, its parent index, which captures small-cap securities exhibiting overall style characteristics in the U.S. The TIAA ESG USA Small-Cap Index is designed to represent the performance of a TIAA strategy that aims to increase exposure to positive environmental, social and governance (ESG) factors and exhibit lower carbon exposure as compared to the MSCI USA Small-Cap Index. The index returns assume reinvestment of distributions, but do not reflect any applicable sales charges or management fees.
109
Annual Investment Management Agreement Approval Process
(Unaudited)
At a meeting held on May 22-24, 2018 (the “May Meeting”), the Board of Trustees (the “Board,” and each Trustee, a “Board Member”) of Nushares ETF Trust, including the Board Members who are not “interested persons” (as defined under the Investment Company Act of 1940 (the “1940 Act”)) (the “Independent Board Members”), approved, for each Fund, the renewal of the management agreement (the “Investment Management Agreement”) with Nuveen Fund Advisors, LLC (the “Adviser”) pursuant to which the Adviser serves as investment adviser to such Fund and the sub-advisory agreement (the “Sub-Advisory Agreement”) with Teachers Advisors, LLC (the “Sub-Adviser”) pursuant to which the Sub-Adviser serves as investment sub-adviser to such Fund. Following an initial two-year period, the Board, including the Independent Board Members, is required under the 1940 Act to review and approve each Investment Management Agreement and Sub-Advisory Agreement on behalf of the applicable Fund on an annual basis. The Investment Management Agreements and Sub-Advisory Agreements are collectively referred to as the “Advisory Agreements” and the Adviser and the Sub-Adviser are collectively, the “Fund Advisers” and each, a “Fund Adviser.”
In response to a request on behalf of the Independent Board Members by independent legal counsel, the Board received and reviewed prior to the May Meeting extensive materials specifically prepared for the annual review of Advisory Agreements by the Adviser as well as by Broadridge Financial Solutions, Inc. (“Broadridge” or “Lipper”), an independent provider of investment company data. The materials provided in connection with the annual review covered a breadth of subject matter including, but not limited to, a description of the nature, extent and quality of services provided by each Fund Adviser; a review of the Sub-Adviser and the applicable investment team(s); an analysis of fund performance in absolute terms and as compared to the performance of certain peer funds and benchmarks with a focus on any performance outliers; an analysis of the fees and expense ratios of the Nuveen funds in absolute terms and as compared to those of certain peer funds with a focus on any expense outliers; a description of portfolio manager compensation; a review of the performance of various service providers; a description of various initiatives Nuveen had undertaken or continued during the year for the benefit of particular Nuveen fund(s) and/or the complex; a description of the profitability or financial data of Nuveen and the various sub-advisers to the Nuveen funds; and a description of indirect benefits received by the Fund Advisers as a result of their relationships with the Nuveen funds. The Independent Board Members also received a memorandum from independent legal counsel outlining their fiduciary duties and legal standards in reviewing the Advisory Agreements. The Board Members held an in-person meeting on April 10-11, 2018 (the “April Meeting”), in part, to review and discuss the performance of the Nuveen funds and the Adviser’s evaluation of the various sub-advisers to the Nuveen funds. Prior to the May Meeting, the Board Members also received and reviewed supplemental information provided in response to questions posed by the Board Members.
The information prepared specifically for the annual review of the Advisory Agreements supplemented the information provided to the Board and its committees throughout the year. The Board and its committees met regularly during the year and the information provided and topics discussed were relevant to the review of the Advisory Agreements. Some of these reports and other data included, among other things, materials that outlined the investment performance of the Nuveen funds; strategic plans of the Adviser which may impact the services it provides to the Nuveen funds; the review of the Nuveen funds and applicable investment teams; compliance, regulatory and risk management matters; the trading practices of the various sub-advisers; valuation of securities; fund expenses; payments to financial intermediaries; and overall market and regulatory developments. The Board further continued its practice of seeking to meet periodically with the various sub-advisers to the Nuveen funds and their investment teams, when feasible. As a result, the Independent Board Members considered the review of the Advisory Agreements to be an ongoing process and employed the accumulated information, knowledge, and experience the Board Members had gained during their tenure on the boards governing the Nuveen funds and working with the Fund Advisers in their review of the Advisory Agreements. Throughout the year and during the annual review of Advisory Agreements, the Independent Board Members met in executive sessions with independent legal counsel and had the benefit of counsel’s advice.
In deciding to renew the Advisory Agreements, the Independent Board Members did not identify a particular factor as determinative, but rather the decision reflected the comprehensive consideration of all the information provided, and each Board Member may have attributed different levels of importance to the various factors and information considered in connection with the approval process. The following summarizes the principal factors, but not all the factors, the Board considered in deciding to renew the Advisory Agreements and its conclusions.
A. Nature, Extent and Quality of Services
In evaluating the renewal of the Advisory Agreements, the Independent Board Members received and considered information regarding the nature, extent and quality of the applicable Fund Adviser’s services provided to the respective Fund and the resulting performance of each Fund. With respect to the Adviser, the Board recognized the comprehensive set of management, oversight and administrative services the Adviser and its affiliates provided to manage and operate the Nuveen funds in a highly regulated industry. As illustrative, these services included, but were not limited to, product management; investment oversight, risk management and securities valuation services; fund accounting and administration services; board support and administration services; compliance and regulatory oversight services; and legal support.
110
In addition to the services necessary to operate and maintain the Nuveen funds, the Board recognized the Adviser’s continued program of improvements and innovations to make the Nuveen fund complex more relevant and attractive to existing and new investors and to accommodate the new and changing regulatory requirements in an increasingly complex regulatory environment. The Board noted that some of the initiatives the Adviser had taken over recent years to benefit the complex and particular Nuveen funds included, among other things:
| | • | | Fund Rationalizations – continuing efforts to rationalize the product line through mergers, liquidations and repositionings in seeking to enhance shareholder value over the years through increased efficiency, reduced costs, improved performance and revised investment approaches more relevant to current shareholder needs; |
| | • | | Product Innovations – developing product innovations and launching new products that will help the Nuveen fund complex offer a variety of products that will attract new investors and retain existing investors, such as launching the target term funds, exchange-traded funds (“ETFs”) and multi-asset class funds; |
| | • | | Risk Management Enhancements – continuing efforts to enhance risk management, including enhancing reporting to increase the efficiency of risk monitoring, implementing programs to strengthen the ability to detect and mitigate operational risks, dedicating resources and staffing necessary to create standards to help ensure compliance with new liquidity requirements, and implementing a price verification system; |
| | • | | Additional Compliance Services – the continuing investment of significant resources, time and additional staffing to meet the various new regulatory requirements affecting the Nuveen funds over the past several years, the further implementation of unified compliance policies and processes, the development of additional compliance training modules, and the reorganization of the compliance team adding further depth to its senior leadership; and |
| | • | | Expanded Dividend Management Services – as the Nuveen fund complex has grown, the additional services necessary to manage the distributions of the varied funds offered and investing in automated systems to assist in this process. |
In addition to the services provided by the Adviser, the Board also noted the business related risks the Adviser incurred in managing the Nuveen funds, including entrepreneurial, legal and litigation risks.
The Board further considered the division of responsibilities between the Adviser and the Sub-Adviser and the investment and compliance oversight over the Sub-Adviser provided by the Adviser. The Board recognized that the Sub-Adviser generally provided the portfolio advisory services for the Funds. The Board reviewed the Adviser’s analysis of the Sub-Adviser which evaluated, among other things, the investment team and any changes to the team during the year, the team’s investment approach and the performance of the Funds over various periods. The Board noted that the Adviser recommended the renewal of the Sub-Advisory Agreements.
Based on its review, the Board determined, in the exercise of its reasonable business judgment, that it was satisfied with the nature, extent and quality of services provided to the respective Funds under each applicable Advisory Agreement.
B. The Investment Performance of the Funds and Fund Advisers
As part of its evaluation of the services provided by the Fund Advisers, the Board considered the investment performance of each Fund. In this regard, the Board reviewed fund performance over the quarter and one-year periods ending December 31, 2017 (or for such shorter periods available for Nushares ESG International Developed Markets Equity ETF (the “Developed Markets Equity Fund”) and Nushares ESG Emerging Markets Equity ETF (the “Emerging Markets Equity Fund”), which did not exist for part of the foregoing time frame) as well as performance data for the first quarter of 2018 ending March 31, 2018. The Independent Board Members noted that they reviewed and discussed fund performance over various time periods with management at their quarterly meetings throughout the year and their review and analysis of performance during the annual review of Advisory Agreements incorporated such discussions.
Given that the investment strategy of each Fund was to track the performance of a specified index (the “Underlying Index”), the Board received and reviewed, among other things, the net asset value performance of each Fund, the performance of such Fund’s Underlying Index and parent index, its relative performance compared to the performance of peer funds (the “Performance Peer Group”) and such Fund’s tracking error and excess return compared to its Underlying Index to assess the Fund’s performance in accordance with its investment objective. Given each Fund’s investment objective of seeking investment results that correspond generally to the performance of its Underlying Index, the Board placed more emphasis on its review of correlation and tracking error in evaluating a Fund’s performance.
In reviewing performance data, the Independent Board Members appreciated some of the inherent limitations of such data. In this regard, the Independent Board Members recognized that there may be limitations with the comparative data of certain peer groups or benchmarks as they may pursue objective(s), strategies or have other characteristics that are different from the respective Nuveen fund and therefore the performance results necessarily are different and limit the value of the comparisons. The Board was aware that the performance data was measured as of a specific date and a different time period may reflect significantly different results and a period of underperformance can significantly impact long-term performance figures. The Board further recognized that a shareholder’s experience in a Fund depends on his or her own holding period which may differ from that reviewed by the Independent Board Members.
111
Annual Investment Management Agreement Approval Process (Unaudited) (continued)
In their review of performance, the Independent Board Members focused, in particular, on the Adviser’s analysis of Nuveen funds determined to be underperforming performance outliers. The Independent Board Members noted that only a limited number of the Nuveen funds appeared to be underperforming performance outliers at the end of 2017 and considered the factors contributing to the respective fund’s performance and whether there were any performance concerns that needed to be addressed. The Board recognized that some periods of underperformance may only be temporary while other periods of underperformance may indicate a broader issue that may require a corrective action. Accordingly, with respect to any Nuveen funds for which the Board had identified performance issues, the Board monitors such funds closely until performance improves, discusses with the Adviser the reasons for such results, considers whether any steps are necessary or appropriate to address such issues, and reviews the results of any efforts undertaken.
For Nushares ESG Large-Cap Growth ETF (the “Large-Cap Growth Fund”), the Board noted that the Fund ranked in the fourth quartile of its Performance Peer Group for the one-year period; however, the Board noted certain limitations with the peer set which was comprised of a diverse array of exchange-traded funds tracking various indexes. The Board further noted that the Fund’s performance compared to that of its Underlying Index was within expected thresholds. The Board also recognized that the Fund was relatively new with a limited performance history, limiting the ability to make a meaningful assessment of performance. Nevertheless, the Board was satisfied with the Fund’s performance.
For Nushares ESG Large-Cap Value ETF (the “Large-Cap Value Fund”), the Board noted that the Fund ranked in the third quartile of its Performance Peer Group for the one-year period. The Board further noted that the Fund’s performance compared to that of its Underlying Index was within expected thresholds. The Board also recognized that the Fund was relatively new with a limited performance history, limiting the ability to make a meaningful assessment of performance. Nevertheless, the Board was satisfied with the Fund’s performance.
For Nushares ESG Mid-Cap Growth ETF (the “Mid-Cap Growth Fund”), the Board noted that the Fund ranked in the fourth quartile of its Performance Peer Group for the one-year period; however, the Board noted certain limitations of the peer set due, in part, to the composition and investment focus of certain peers that were similar to a large-cap growth ETF universe. The Board further noted that the Fund’s performance compared to that of its Underlying Index was within expected thresholds. The Board also recognized that the Fund was relatively new with a limited performance history, limiting the ability to make a meaningful assessment of performance. Nevertheless, the Board was satisfied with the Fund’s performance.
For Nushares ESG Mid-Cap Value ETF (the “Mid-Cap Value Fund”), the Board noted that the Fund ranked in the second quartile of its Performance Peer Group for the one-year period. The Board further noted that the Fund’s performance compared to that of its Underlying Index was within expected thresholds. The Board also recognized that the Fund was relatively new with a limited performance history, limiting the ability to make a meaningful assessment of performance. Nevertheless, the Board was satisfied with the Fund’s performance.
For Nushares ESG Small-Cap ETF (the “Small-Cap Fund”), the Board noted that the Fund ranked in the first quartile of its Performance Peer Group for the one-year period. The Board further noted that the Fund’s performance compared to that of its Underlying Index was within expected thresholds. The Board also recognized that the Fund was relatively new with a limited performance history, limiting the ability to make a meaningful assessment of performance. Nevertheless, the Board was satisfied with the Fund’s performance.
For the Developed Markets Equity Fund, the Board noted that the Fund was new with an available performance history too limited to make a meaningful assessment of performance.
For the Emerging Markets Equity Fund, the Board noted that the Fund was new with an available performance history too limited to make a meaningful assessment of performance.
C. Fees, Expenses and Profitability
1. Fees and Expenses
In its annual review, the Board considered the fees paid to the Fund Advisers and the total operating expense ratio of each Fund. More specifically, the Board recognized that each Fund pays a single, all-inclusive (or unified) management fee (as described further below) and, therefore, among other things, reviewed the unified fee compared to the gross and net management fee rates and net total expense ratios of a group of comparable funds (the “Peer Group”) established by Broadridge. The Independent Board Members reviewed the methodology Broadridge employed to establish its Peer Group and recognized that differences between the applicable fund and its respective Peer Group may limit some of the value of the comparative data. The Independent Board Members also considered a fund’s operating expense ratio as it more directly reflected the shareholder’s costs in investing in the respective fund. In their review, the Independent Board Members considered, in particular, each fund with a net expense ratio of six basis points or higher compared to that of its peer average (each an “Expense Outlier Fund”). The Board noted that the number of Nuveen funds classified as an Expense Outlier Fund pursuant to the foregoing criteria had decreased over the past few years with only a limited number of the Nuveen funds (including the Large-Cap Growth Fund and the Large-Cap Value Fund) identified as Expense Outlier Funds in 2017. The Independent Board Members reviewed an analysis as to the factors contributing to each such fund’s higher relative net expense ratio. Accordingly, in reviewing the comparative data between a fund and its peers, the Board generally considered the fund’s net expense ratio and fees to be higher if they were over 10 basis points higher, slightly higher if they were 6 to 10 basis points higher, in line if they were within approximately 5 basis points higher than the peer average and below if they were below the peer average of the Peer Group.
112
In their review of the fee arrangements for the Nuveen funds, in addition to the management fee schedules, the Independent Board Members considered the sub-advisory fees paid to the applicable sub-advisers, and as described below, comparative data of the fees the sub-advisers charge to other clients.
As indicated above, the Board recognized that each Fund pays the Adviser a single, all-inclusive (or unified) management fee for providing all services necessary for the management and operation of the Fund, other than any distribution and/or service fees, interest expenses, taxes, acquired fund fees and expenses, expenses incurred in acquiring and disposing of portfolio securities, fees and expenses of the Independent Board Members (including any of their counsel’s fees), certain expenses of such Fund’s chief compliance officer, litigation expenses and extraordinary expenses. Unlike the typical fee arrangements of the other Nuveen funds in which the funds pay a variety of fees and expenses such as investment advisory fees, transfer agency fees, audit fees, custodian fees, administration fees, compliance expenses, recordkeeping expenses, marketing and shareholder service fees, distribution charges and other expenses, Nushares ETFs (including each Fund) pay the Adviser a unified fee, and the Adviser is responsible for providing such services or arranging and supervising third parties to provide such services (subject to the noted exceptions). Under the unified fee structure, the Board recognized that the Adviser generally bears the risks of the operating costs rising (and benefits if such expenses decrease) and therefore has an incentive to be administratively efficient. As part of the Board’s analysis of the fee level of each Fund, the Independent Board Members reviewed, among other things, the unified fee compared to the gross and net management fees and net total expense ratios of its respective Peer Group.
The Independent Board Members noted that (a) the Emerging Markets Equity Fund, Developed Markets Equity Fund, Mid-Cap Growth Fund and Mid-Cap Value Fund each had a net management fee and a net expense ratio that were below the averages of its respective Peer Group; (b) the Small-Cap Fund had a net management fee that was slightly higher than its Peer Group average, but a net expense ratio that was in line with its Peer Group average; and (c) the Large-Cap Growth Fund and the Large-Cap Value Fund each had a net management fee and a net expense ratio that were slightly higher than the averages of its respective Peer Group. With respect to the Large-Cap Growth Fund and the Large-Cap Value Fund, the Independent Board Members noted that each such Fund’s net expense ratio was slightly higher than its Peer Group average, in part, due to the small size and composition of the respective peer set.
Based on their review of the information provided, the Board determined that each Fund’s management fees (as applicable) to a Fund Adviser were reasonable in light of the nature, extent and quality of services provided to the Fund.
2. Comparisons with the Fees of Other Clients
In determining the appropriateness of fees, the Board also reviewed information regarding the fee rates the respective Fund Advisers charged for certain other types of clients and the type of services provided to these other clients. With respect to the Adviser and/or the Sub-Adviser, such other clients may include foreign investment companies offered by Nuveen and certain funds advised by the Sub-Adviser.
In this regard, the Board recognized that each Fund had an affiliated sub-adviser and reviewed, among other things, the range of fees assessed for foreign investment companies and the management fees and expense ratios of certain funds advised by the Sub-Adviser in the TIAA-CREF family of funds. In addition to the comparative fee data, the Board also reviewed, among other things, a description of the different levels of services provided to certain other clients compared to the services provided to the Nuveen funds as well as the differences in portfolio investment policies, investor profiles, account sizes and regulatory requirements, all of which contribute to the variations in fee schedules. The Board further considered the differences in the passive management of Nuveen’s Nushares ETFs compared to the active management of other Nuveen funds, which also contributed to differing management fee levels compared to the other Nuveen funds. In general, the Board noted that the higher fee levels reflect higher levels of services provided by Nuveen, increased investment management complexity, greater product management requirements and higher levels of business risk or some combination of these factors. The Board further considered that the Sub-Adviser’s fee is essentially for portfolio management services. The Board concluded the varying levels of fees were justified given, among other things, the inherent differences in the products and the level of services provided to the Nuveen funds versus other clients, the differing regulatory requirements and legal liabilities and the entrepreneurial risks incurred in sponsoring and advising a registered investment company.
3. Profitability of Fund Advisers
In conjunction with their review of fees, the Independent Board Members considered Nuveen’s level of profitability for its advisory services to the Nuveen funds for the calendar years 2017 and 2016. In considering profitability, the Independent Board Members reviewed the level of profitability realized by Nuveen including and excluding any distribution expenses incurred by Nuveen from its own resources. The Independent Board Members also reviewed a description of the expense allocation methodology employed to develop the financial information and a summary of the history of changes to the methodology over the years. For comparability purposes, the Board recognized that a prior year’s profitability would be restated to reflect any refinements to the methodology. The Independent Board Members were aware of the inherent limitations in calculating profitability as the use of different reasonable allocation methodologies may lead to significantly different results and in reviewing profitability margins over extended periods given the refinements to the methodology over time. The Board noted that two Independent Board Members, along with independent counsel, serve as the Board’s liaisons to review and discuss any proposed changes to the methodology prior to the full Board’s review.
113
Annual Investment Management Agreement Approval Process (Unaudited) (continued)
In their review, the Independent Board Members evaluated, among other things, Nuveen’s adjusted operating margins, gross and net revenue margins (pre-tax and after-tax) for advisory activities for the Nuveen funds, and the revenues, expenses, and net income (pre-tax and after-tax and before distribution) of Nuveen for fund advisory services for each of the last two calendar years. The Independent Board Members also reviewed an analysis of the key drivers behind the changes in revenues and expenses that impacted profitability in 2017 versus 2016. The Board noted that Nuveen recently launched its ETF product line in 2016 and reviewed the revenues, expenses and operating margin from this product line.
In addition to reviewing Nuveen’s profitability in absolute terms, the Independent Board Members also examined comparative profitability data reviewing, among other things, the revenues, expenses and adjusted total company margins of other advisory firms that had publicly available information and comparable assets under management (based on asset size and asset composition) for 2017 and as compared to their adjusted operating margins for 2016. The Independent Board Members, however, recognized the difficulty in comparing the profitability of various fund managers given the limited public information available and the subjective nature of calculating profitability which may be affected by numerous factors including the fund manager’s organizational structure, types of funds, other lines of business, methodology used to allocate expenses and cost of capital. Nevertheless, considering such limitations and based on the information provided, the Board noted that Nuveen’s adjusted operating margins appeared reasonable when compared to the adjusted margins of the peers.
Aside from Nuveen’s profitability, the Board recognized that the Adviser is a subsidiary of Nuveen, LLC, the investment management arm of Teachers Insurance and Annuity Association of America (“TIAA”). As such, the Board also reviewed a balance sheet for TIAA reflecting its assets, liabilities and capital and contingency reserves for the 2017 and 2016 calendar years to consider the financial strength of TIAA.
In reviewing profitability, the Independent Board Members also considered the profitability of the various sub-advisers from their relationships with the respective Nuveen fund(s). The Independent Board Members reviewed the Sub-Adviser’s revenues, expenses and pre-tax operating margins for its sub-advisory services to the applicable Nuveen funds for 2017.
In evaluating the reasonableness of the compensation, the Independent Board Members also considered any other ancillary benefits derived by the respective Fund Adviser from its relationship with the Nuveen funds as discussed in further detail below.
Based on a consideration of all the information provided, the Board noted that Nuveen’s and the Sub-Adviser’s level of profitability was acceptable and not unreasonable in light of the services provided.
D. Economies of Scale and Whether Fee Levels Reflect These Economies of Scale
The Independent Board Members considered the extent to which economies of scale may be achieved as a Fund grows and whether these economies of scale have been shared with shareholders. Although the Board recognized that economies of scale are difficult to measure, the Independent Board Members noted that there are several methods that may be used in seeking to share economies of scale, including through breakpoints in the management fee schedule reducing the fee rates as asset levels grow, fee waivers and/or expense limitation agreements and the Adviser’s investment in its business which can enhance the services provided to the Nuveen funds.
In general, the Nuveen funds pay the Adviser a management fee comprised of a fund-level component and a complex-level component each with its own breakpoint schedule. The Independent Board Members noted, however, that the Nushares ETFs do not have breakpoint schedules. The Board recognized that the Nushares ETFs (including the Funds) pay a unitary fee and, as a result, any reduction in fixed costs associated with the management of these funds would benefit the Adviser. However, the Independent Board Members noted that the unitary fee schedule provides shareholders with a level of certainty of the expenses of the Nushares ETFs. As the Nushares ETFs do not have breakpoints, they do not participate in the complex-level fee programs (which reduce fees on certain funds as the eligible assets in the complex pass certain thresholds). In addition, given that the Nushares ETFs product line was recently launched in 2016, the Independent Board Members recognized the Adviser’s costs in operating the Nushares ETFs during the start-up phase.
Further, the Independent Board Members recognized the Adviser’s continued reinvestment in its business through, among other things, improvements in technology, additional staffing, product innovations and other organizational changes designed to expand or enhance the services provided to the benefit of all of the Nuveen funds.
Based on its review, the Board concluded that the current fee arrangements together with the Adviser’s reinvestment in its business appropriately shared any economies of scale with shareholders. In addition, the Board concluded that the absence of a fund-level and complex-level breakpoint schedule or arrangement was acceptable.
E. Indirect Benefits
The Independent Board Members received and considered information regarding other benefits the respective Fund Adviser or its affiliates may receive as a result of their relationship with the Nuveen funds. In addition, the Independent Board Members considered whether the Sub-Adviser uses commissions paid by the applicable Nuveen funds on portfolio transactions to obtain research products and other services (“soft dollar transactions”) and considered that the Sub-Adviser does not benefit from formal soft dollar arrangements with respect to Fund portfolio transactions.
114
Based on their review, the Board concluded that any indirect benefits received by a Fund Adviser as a result of its relationship with the Funds were reasonable and within acceptable parameters.
F. Other Considerations
The Board Members did not identify any single factor discussed previously as all-important or controlling. The Board Members, including the Independent Board Members, concluded that the terms of each Advisory Agreement were fair and reasonable, that the respective Fund Adviser’s fees were reasonable in light of the services provided to each Fund and that the Advisory Agreements be renewed.
115
Trustees and Officers
(Unaudited)
The management of the Funds, including general supervision of the duties performed for the Funds by the Adviser, is the responsibility of the Board of Trustees of the Funds. The number of Trustees of the Funds is currently set at eleven. None of the Trustees who are not “interested” persons of the Funds (referred to herein as “independent Trustees”) has ever been a Trustee or employee of, or consultant to, Nuveen or its affiliates. The names and business addresses of the Trustees and officers of the Funds, their principal occupations and other affiliations during the past five years, the number of portfolios each oversees and other directorships they hold are set forth below.
The Funds’ Statement of Additional Information (“SAI”) includes more information about the Trustees. To request a free copy, call Nuveen Investments at (800) 257-8787 or visit the Funds’ website at www.nuveen.com.
| | | | | | | | |
Name,
Year of Birth
& Address | | Position(s)
Held with
the Funds | | Year First
Elected or
Appointed (1) | | Principal Occupation(s)
Including other Directorships
During Past 5 Years | | Number of
Portfolios in
Fund Complex
Overseen by
Trustee |
| |
| Independent Trustees: |
Terence J. Toth 1959 333 W. Wacker Drive Chicago, IL 60606 | | Chairman and Trustee | | 2008 | | Formerly, a Co-Founding Partner, Promus Capital (2008-2017); Director, Fulcrum IT Service LLC (since 2010) and Quality Control Corporation (since 2012); member: Catalyst Schools of Chicago Board (since 2008) and Mather Foundation Board (since 2012), and chair of its investment committee; formerly, Director, Legal & General Investment Management America, Inc. (2008-2013); formerly, CEO and President, Northern Trust Global Investments (2004-2007); Executive Vice President, Quantitative Management & Securities Lending (2000-2004); prior thereto, various positions with Northern Trust Company (since 1994); formerly, Member, Northern Trust Mutual Funds Board (2005-2007), Northern Trust Global Investments Board (2004-2007), Northern Trust Japan Board (2004-2007), Northern Trust Securities Inc. Board (2003-2007) and Northern Trust Hong Kong Board (1997-2004). | | 169 |
Jack B. Evans 1948 333 W. Wacker Drive Chicago, IL 60606 | | Trustee | | 1999 | | President, The Hall-Perrine Foundation, a private philanthropic corporation (since 1996); Director and Chairman, United Fire Group, a publicly held company; Director, Public member, American Board of Orthopaedic Surgery (since 2015); Life Trustee of Coe College and the Iowa College Foundation; formerly, President Pro-Tem of the Board of Regents for the State of Iowa University System; formerly, Director, Alliant Energy and The Gazette Company; formerly, Director, Federal Reserve Bank of Chicago; formerly, President and Chief Operating Officer, SCI Financial Group, Inc., a regional financial services firm. | | 169 |
William C. Hunter 1948 333 W. Wacker Drive Chicago, IL 60606 | | Trustee | | 2003 | | Dean Emeritus, formerly, Dean, Tippie College of Business, University of Iowa (2006-2012); Director of Wellmark, Inc. (since 2009); past Director (2005-2015), and past President (2010-2014) Beta Gamma Sigma, Inc., The International Business Honor Society; formerly, Director (2004-2018) of Xerox Corporation; Dean and Distinguished Professor of Finance, School of Business at the University of Connecticut (2003-2006); previously, Senior Vice President and Director of Research at the Federal Reserve Bank of Chicago (1995-2003); formerly, Director (1997-2007), Credit Research Center at Georgetown University. | | 169 |
116
| | | | | | | | |
Name,
Year of Birth
& Address | | Position(s)
Held with
the Funds | | Year First
Elected or
Appointed (1) | | Principal Occupation(s)
Including other Directorships
During Past 5 Years | | Number of
Portfolios in
Fund Complex
Overseen by
Trustee |
Albin F. Moschner 1952 333 W. Wacker Drive Chicago, IL 60606 | | Trustee | | 2016 | | Founder and Chief Executive Officer, Northcroft Partners, LLC, a management consulting firm (since 2012); Director, USA Technologies, Inc., a provider of solutions and services to facilitate electronic payment transactions (since 2012); formerly, Director, Wintrust Financial Corporation (1996-2016); previously, held positions at Leap Wireless International, Inc., including Consultant (2011-2012), Chief Operating Officer (2008-2011), and Chief Marketing Officer (2004-2008); formerly, President, Verizon Card Services division of Verizon Communications, Inc. (2000-2003); formerly, President, One Point Services at One Point Communications (1999-2000); formerly, Vice Chairman of the Board, Diba, Incorporated (1996-1997); formerly, various executive positions with Zenith Electronics Corporation (1991-1996). | | 169 |
John K. Nelson 1962 333 W. Wacker Drive Chicago, IL 60606 | | Trustee | | 2013 | | Member of Board of Directors of Core12 LLC (since 2008), a private firm which develops branding, marketing and communications strategies for clients; Director of The Curran Center for Catholic American Studies (since 2009) and The President’s Council, Fordham University (since 2010); formerly senior external advisor to the financial services practice of Deloitte Consulting LLP (2012-2014); formerly, Chairman of the Board of Trustees of Marian University (2010 as trustee, 2011-2014 as Chairman); formerly, Chief Executive Officer of ABN AMRO N.V. North America, and Global Head of its Financial Markets Division (2007-2008); prior senior positions held at ABN AMRO include Corporate Executive Vice President and Head of Global Markets-the Americas (2006-2007), CEO of Wholesale Banking-North America and Global Head of Foreign Exchange and Futures Markets (2001-2006), and Regional Commercial Treasurer and Senior Vice President Trading-North America (1996-2001); formerly, Trustee at St. Edmund Preparatory School in New York City. | | 169 |
William J. Schneider(1) 1944 333 W. Wacker Drive Chicago, IL 60606 | | Trustee | | 1996 | | Chairman of Miller-Valentine Partners, a real estate investment company; Board Member of WDPR Public Radio station; formerly, Senior Partner and Chief Operating Officer (retired (2004) of Miller-Valentine Group; formerly, Board member, Business Advisory Council of the Cleveland Federal Reserve Bank and University of Dayton Business School Advisory Council; past Chair and Director, Dayton Development Coalition. | | 169 |
Judith M. Stockdale 1947 333 W. Wacker Drive Chicago, IL 60606 | | Trustee | | 1997 | | Board Member, Land Trust Alliance (since 2013) and U.S. Endowment for Forestry and Communities (since 2013); formerly, Executive Director (1994-2012), Gaylord and Dorothy Donnelley Foundation; prior thereto, Executive Director, Great Lakes Protection Fund (1990-1994). | | 169 |
Carole E. Stone 1947 333 W. Wacker Drive Chicago, IL 60606 | | Trustee | | 2007 | | Former Director, Chicago Board Options Exchange (2006-2017), and C2 Options Exchange, Incorporated (2009-2017); Director, CBOE Global Markets, Inc., formerly, CBOE Holdings, Inc. (since 2010); formerly, Commissioner, New York State Commission on Public Authority Reform (2005-2010). | | 169 |
117
Trustees and Officers (Unaudited) (continued)
| | | | | | | | |
Name,
Year of Birth
& Address | | Position(s)
Held with
the Funds | | Year First
Elected or
Appointed (1) | | Principal Occupation(s)
Including other Directorships
During Past 5 Years | | Number of
Portfolios in
Fund Complex
Overseen by
Trustee |
Margaret L. Wolff 1955 333 W. Wacker Drive Chicago, IL 60606 | | Trustee | | 2016 | | Formerly, member of the Board of Directors (2013-2017) of Travelers Insurance Company of Canada and The Dominion of Canada General Insurance Company (each, a part of Travelers Canada, the Canadian operation of The Travelers Companies, Inc.); formerly, Of Counsel, Skadden, Arps, Slate, Meagher & Flom LLP (Mergers & Acquisitions Group) (2005-2014); Member of the Board of Trustees of New York-Presbyterian Hospital (since 2005); Member (since 2004) and Chair (since 2015) of the Board of Trustees of The John A. Hartford Foundation (a philanthropy dedicated to improving the care of older adults); formerly, Member (2005-2015) and Vice Chair (2011-2015) of the Board of Trustees of Mt. Holyoke College. | | 169 |
Robert L. Young(2) 1963 333 W. Wacker Drive Chicago, IL 60606 | | Trustee | | 2017 | | Formerly, Chief Operating Officer and Director, J.P. Morgan Investment Management Inc. (2010-2016); formerly, President and Principal Executive Officer (2013-2016), and Senior Vice President and Chief Operating Officer (2005-2010), of J.P. Morgan Funds; formerly, Director and various officer positions for J.P. Morgan Investment Management Inc. (formerly, JPMorgan Funds Management, Inc. and formerly, One Group Administrative Services) and JPMorgan Distribution Services, Inc. (formerly, One Group Dealer Services, Inc.) (1999-2017). | | 167 |
| |
| Interested Trustee: |
Margo L. Cook(3) 1964 333 W. Wacker Drive Chicago, IL 60606 | | Trustee | | 2016 | | President (since 2017), formerly, Co-Chief Executive Officer and Co-President (2016-2017), formerly, Senior Executive Vice President of Nuveen Investments, Inc; Executive Vice President (since 2017) of Nuveen, LLC; President, Global Products and Solutions (since 2017), and Co-Chief Executive Officer (since 2015), formerly, Executive Vice President (2013-2015) of Nuveen Securities, LLC; President (since 2017), formerly, Co-President (2016-2017), formerly Senior Executive Vice President (2015-2016) of Nuveen Fund Advisors, LLC (Executive Vice President 2011-2015); President (since 2017), Nuveen Alternative Investments, LLC; Chartered Financial Analyst. | | 169 |
| | | | | | | | |
Name,
Year of Birth
& Address | | Position(s)
Held with
the Funds | | Year First
Elected or
Appointed (4) | | Principal Occupation(s)
During Past 5 Years | | Number of
Portfolios in
Fund Complex
Overseen by
Officer |
| |
| Officers of the Funds: |
Martin Y.G. Kremenstein 1976 100 Park Avenue New York, NY 10017 | | Chief Administrative Officer | | 2017 | | Senior (since 2017) Managing Director (since 2016) of Nuveen Fund Advisors, LLC; formerly, Managing Director (2013-2015); formerly, Director (2009-2013) Deutsche Bank; CEO (2012-2015) DB Commodity Services LLC; CEO (2012-2014) DBX Advisors LLC and DBX Strategic Advisors LLC. | | 11 |
Mark J. Czarniecki 1979 901 Marquette Avenue Minneapolis, MN 55402 | | Vice President and Assistant Secretary | | 2013 | | Vice President and Assistant Secretary of Nuveen Securities, LLC (since 2016) and Nuveen Fund Advisors (since 2017); Vice President and Associate General Counsel of Nuveen (since 2013) and Vice President, Assistant Secretary and Associate General Counsel of Nuveen Asset Management (since March 2018). | | 169 |
Stephen D. Foy 1954 333 W. Wacker Drive Chicago, IL 60606 | | Vice President and Controller | | 1998 | | Managing Director (since 2014), formerly, Senior Vice President (2013-2014) and Vice President (2005-2013) of Nuveen Fund Advisors, LLC; Managing Director (since 2016) of Nuveen Securities, LLC; Managing Director (since 2016) of Nuveen Alternative Investments, LLC; Certified Public Accountant. | | 169 |
118
| | | | | | | | |
Name,
Year of Birth
& Address | | Position(s)
Held with
the Funds | | Year First
Elected or
Appointed (4) | | Principal Occupation(s)
During Past 5 Years | | Number of
Portfolios in
Fund Complex
Overseen by
Officer |
Diana R. Gonzalez 1978 333 West Wacker Drive Chicago, IL 60606 | | Vice President and Assistant Secretary | | 2017 | | Vice President and Assistant Secretary of Nuveen Fund Advisors, LLC (since 2017); Vice President and Associate General Counsel of Nuveen (since 2017); Associate General Counsel of Jackson National Asset Management (2012-2017). | | 169 |
Nathaniel T. Jones 1979 333 W. Wacker Drive Chicago, IL 60606 | | Vice President and Treasurer | | 2016 | | Managing Director (since 2017), formerly, Senior Vice President (2016-2017), formerly, Vice President (2011-2016) of Nuveen; Managing Director of Nuveen Fund Advisors, LLC; Chartered Financial Analyst. | | 169 |
Walter M. Kelly 1970 333 W. Wacker Drive Chicago, IL 60606 | | Chief Compliance Officer and Vice President | | 2003 | | Managing Director (since 2017), formerly, Senior Vice President (2008-2017) of Nuveen Investments Holdings, Inc. | | 169 |
Tina M. Lazar 1961 333 W. Wacker Drive Chicago, IL 60606 | | Vice President | | 2002 | | Managing Director (since 2017), formerly, Senior Vice President (2014-2017) of Nuveen Securities, LLC. | | 169 |
Kevin J. McCarthy 1966 333 W. Wacker Drive Chicago, IL 60606 | | Vice President and Assistant Secretary | | 2007 | | Senior Managing Director (since 2017) and Secretary and General Counsel (since 2016) of Nuveen Investments, Inc., formerly, Executive Vice President (2016-2017) and Managing Director and Assistant Secretary (2008-2016); Senior Managing Director (since 2017) and Assistant Secretary (since 2008) of Nuveen Securities, LLC, formerly Executive Vice President (2016-2017) and Managing Director (2008-2016); Senior Managing Director (since 2017), Secretary (since 2016) and Co-General Counsel (since 2011) of Nuveen Fund Advisors, LLC, formerly, Executive Vice President (2016-2017), Managing Director (2008-2016) and Assistant Secretary (2007-2016); Senior Managing Director (since 2017), Secretary (since 2016) and Associate General Counsel (since 2011) of Nuveen Asset Management, LLC, formerly Executive Vice President (2016-2017) and Managing Director and Assistant Secretary (2011-2016); Senior Managing Director (since 2017) and Secretary (since 2016) of Nuveen Investments Advisers, LLC, formerly Executive Vice President (2016-2017); Vice President (since 2007) and Secretary (since 2016), formerly, Assistant Secretary, of NWQ Investment Management Company, LLC, Symphony Asset Management, LLC, Santa Barbara Asset Management, LLC and Winslow Capital Management, LLC (since 2010). Senior Managing Director (since 2017) and Secretary (since 2016) of Nuveen Alternative Investments, LLC. | | 169 |
Christopher M. Rohrbacher 1971 333 W. Wacker Drive Chicago, IL 60606 | | Vice President and Secretary | | 2008 | | Managing Director (since 2017) and Assistant Secretary of Nuveen Securities, LLC; Managing Director (since 2017), formerly, Senior Vice President (2016-2017) and Assistant Secretary (since October 2016) of Nuveen Fund Advisors, LLC. | | 169 |
William A. Siffermann 1975 333 W. Wacker Drive Chicago, IL 60606 | | Vice President | | 2017 | | Managing Director (since 2017), formerly Senior Vice President (2016-2017) and Vice President (2011-2016) of Nuveen. | | 169 |
Joel T. Slager 1978 333 W. Wacker Drive Chicago, IL 60606 | | Vice President and Assistant Secretary | | 2013 | | Fund Tax Director for Nuveen Funds (since 2013); previously, Vice President of Morgan Stanley Investment Management, Inc., Assistant Treasurer of the Morgan Stanley Funds (from 2010 to 2013). | | 169 |
119
Trustees and Officers (Unaudited) (continued)
| | | | | | | | |
Name,
Year of Birth
& Address | | Position(s)
Held with
the Funds | | Year First
Elected or
Appointed (4) | | Principal Occupation(s)
During Past 5 Years | | Number of
Portfolios in
Fund Complex
Overseen by
Officer |
Gifford R. Zimmerman 1956 333 W. Wacker Drive Chicago, IL 60606 | | Vice President and Assistant Secretary | | 1988 | | Managing Director (since 2002), and Assistant Secretary of Nuveen Securities, LLC; Managing Director (since 2004) and Assistant Secretary (since 1994) of Nuveen Investments, Inc.; Managing Director (since 2002), Assistant Secretary (since 1997) and Co-General Counsel (since 2011) of Nuveen Fund Advisors, LLC; Managing Director, Assistant Secretary and Associate General Counsel of Nuveen Asset Management, LLC (since 2011); Vice President (since 2017), formerly, Managing Director (2003-2017) and Assistant Secretary (since 2003) of Symphony Asset Management LLC ; Managing Director and Assistant Secretary (since 2002) of Nuveen Investments Advisers, LLC; Vice President and Assistant Secretary of NWQ Investment Management Company, LLC (since 2002), Santa Barbara Asset Management, LLC (since 2006) and of Winslow Capital Management, LLC, (since 2010); Chartered Financial Analyst. | | 169 |
| (1) | Trustees serve an indefinite term until his/her successor is elected or appointed. The year first elected or appointed represents the year in which the director was first elected or appointed to any fund in the Nuveen Fund Complex. Mr. Schneider will retire from the Board as of December 31, 2018. |
| (2) | On May 25, 2017, Mr. Young was appointed as a Board Member, effective July 1, 2017. He is a Board Member of each of the Nuveen Funds, except Nuveen Diversified Dividend and Income Fund and Nuveen Real Estate Income Fund. |
| (3) | “Interested person” of the Trust, as defined in the 1940 Act, by reason of her position with Nuveen, LLC. and certain of its subsidiaries. |
| (4) | Officers serve one year terms through August of each year. The year first elected or appointed represents the year in which the officer was first elected or appointed to any fund in the Nuveen Fund Complex. |
120
Notes
121
Notes
122
Notes
123
Nuveen:
Serving Investors for Generations
Since 1898, financial advisors and their clients have relied on Nuveen to provide dependable investment solutions through continued adherence to proven, long-term investing principles. Today, we offer a range of high quality solutions designed to be integral components of a well-diversified core portfolio.
Focused on meeting investor needs.
Nuveen is the investment manager of TIAA. We have grown into one of the world’s premier global asset managers, with specialist knowledge across all major asset classes and particular strength in solutions that provide income for investors and that draw on our expertise in alternatives and responsible investing. Nuveen is driven not only by the independent investment processes across the firm, but also the insights, risk management, analytics and other tools and resources that a truly world-class platform provides. As a global asset manager, our mission is to work in partnership with our clients to create solutions which help them secure their financial future.
Find out how we can help you.
To learn more about how the products and services of Nuveen may be able to help you meet your financial goals, talk to your financial advisor, or call us at (800) 257-8787. Please read the information provided carefully before you invest. Investors should consider the investment objective and policies, risk considerations, charges and expenses of any investment carefully. Where applicable, be sure to obtain a prospectus, which contains this and other relevant information. To obtain a prospectus, please contact your securities representative or Nuveen, 333 W. Wacker Dr., Chicago, IL 60606. Please read the prospectus carefully before you invest or send money.
Learn more about Nushares ETFs at: www.nuveen.com/exchange-traded-funds
| | |
| Securities offered through Nuveen Securities, LLC, member FINRA and SIPC | 333 West Wacker Drive Chicago, IL 60606 | www.nuveen.com | | NAN-NSESG-1018D 690621-INV-Y-12/19 |
ITEM 2. CODE OF ETHICS.
As of the end of the period covered by this report, the registrant has adopted a code of ethics that applies to the registrant’s principal executive officer, principal financial officer, principal accounting officer or controller, or persons performing similar functions. There were no amendments to or waivers from the code during the period covered by this report. The registrant has posted the code of ethics on its website at www.nuveen.com/MutualFunds/ShareholderResources/FundGovernance.aspx. (To view the code, click on Code of Conduct.)
ITEM 3. AUDIT COMMITTEE FINANCIAL EXPERT.
As of the end of the period covered by this report, the registrant’s Board of Directors or Trustees (“Board”) determined that the registrant has at least one “audit committee financial expert” (as defined in Item 3 of Form N-CSR) serving on its Audit Committee. The registrant’s audit committee financial experts are Carole E. Stone, Jack B. Evans and William C. Hunter, who are “independent” for purposes of Item 3 of Form N-CSR.
Ms. Stone served for five years as Director of the New York State Division of the Budget. As part of her role as Director, Ms. Stone was actively involved in overseeing the development of the State’s operating, local assistance and capital budgets, its financial plan and related documents; overseeing the development of the State’s bond-related disclosure documents and certifying that they fairly presented the State’s financial position; reviewing audits of various State and local agencies and programs; and coordinating the State’s system of internal audit and control. Prior to serving as Director, Ms. Stone worked as a budget analyst/examiner with increasing levels of responsibility over a 30 year period, including approximately five years as Deputy Budget Director. Ms. Stone has also served as Chair of the New York State Racing Association Oversight Board, as Chair of the Public Authorities Control Board, as a Commissioner on the New York State Commission on Public Authority Reform and as a member of the Boards of Directors of several New York State public authorities. These positions have involved overseeing operations and finances of certain entities and assessing the adequacy of project/entity financing and financial reporting. Currently, Ms. Stone is on the Board of Directors of CBOE Holdings, Inc., of the Chicago Board Options Exchange, and of C2 Options Exchange. Ms. Stone’s position on the boards of these entities and as a member of both CBOE Holdings’ Audit Committee and its Finance Committee has involved, among other things, the oversight of audits, audit plans and preparation of financial statements.
Mr. Evans was formerly President and Chief Operating Officer of SCI Financial Group, Inc., a full service registered broker-dealer and registered investment adviser (“SCI”). As part of his role as President and Chief Operating Officer, Mr. Evans actively supervised the Chief Financial Officer (the “CFO”) and actively supervised the CFO’s preparation of financial statements and other filings with various regulatory authorities. In such capacity, Mr. Evans was actively involved in the preparation of SCI’s financial statements and the resolution of issues raised in connection therewith. Mr. Evans has also served on the audit committee of various reporting companies. At such companies, Mr. Evans was involved in the oversight of audits, audit plans, and the preparation of financial statements. Mr. Evans also formerly chaired the audit committee of the Federal Reserve Bank of Chicago.
Mr. Hunter was formerly a Senior Vice President at the Federal Reserve Bank of Chicago. As part of his role as Senior Vice President, Mr. Hunter was the senior officer responsible for all operations of each of the Economic Research, Statistics, and Community and Consumer Affairs units at the Federal Reserve Bank of Chicago. In such capacity, Mr. Hunter oversaw the subunits of the Statistics and Community and Consumer Affairs divisions responsible for the analysis and evaluation of bank and bank holding company financial statements and financial filings. Prior to serving as Senior Vice President at the Federal Reserve Bank of Chicago, Mr. Hunter was the Vice President of the Financial Markets unit at the Federal Reserve Bank of Atlanta where he supervised financial staff and bank holding company analysts who analyzed and evaluated bank and bank holding company financial statements. Mr. Hunter also currently serves on the Boards of Directors of Xerox Corporation and Wellmark, Inc. as well as on the Audit Committees of such Boards. As an Audit Committee member, Mr. Hunter’s responsibilities include, among other things, reviewing financial statements, internal audits and internal controls over financial reporting. Mr. Hunter also formerly was a Professor of Finance at the University of Connecticut School of Business and has authored numerous scholarly articles on the topics of finance, accounting and economics.
ITEM 4. PRINCIPAL ACCOUNTANT FEES AND SERVICES.
The following tables show the amount of fees that KPMG LLP, the Funds’ auditor, billed to the Funds’ during the Funds’ last two full fiscal years. The Audit Committee approved in advance all audit services and non-audit services that KPMG LLP provided to the Funds, except for those non-audit services that were subject to the pre-approval exception under Rule 2-01 of Regulation S-X (the “pre-approval exception”). The preapproval exception for services provided directly to the Funds waives the pre-approval requirement for services other than audit, review or attest services if: (A) the aggregate amount of all such services provided constitutes no more than 5% of the total amount of revenues paid by the Funds during the fiscal year in which the services are provided; (B) the Funds did not recognize the services as non-audit services at the time of the engagement; and (C) the services are promptly brought to the Audit Committee’s attention, and the Committee (or its delegate) approves the services before the audit is completed.
The Audit Committee has delegated certain pre-approval responsibilities to its Chairman (or, in his absence, any other member of the Audit Committee).
| | | | | | | | | | | | | | | | |
Fiscal Year Ended October 31, 2018 | | Audit Fees Billed
to Funds 1 | | | Audit-Related Fees
Billed to Funds 2 | | | Tax Fees
Billed to Funds 3 | | | All Other Fees
Billed to Funds 4 | |
Fund Name | | | | | | | | | | | | | | | | |
NuShares ESG International Developed Markets Equity ETF | | | 18,350 | | | | 0 | | | | 0 | | | | 0 | |
NuShares ESG Emerging Markets Equity ETF | | | 18,350 | | | | 0 | | | | 0 | | | | 0 | |
NuShares ESG Large-Cap Growth ETF | | | 15,920 | | | | 0 | | | | 0 | | | | 0 | |
NuShares ESG Large-Cap Value ETF | | | 15,920 | | | | 0 | | | | 0 | | | | 0 | |
NuShares ESG Mid-Cap Growth ETF | | | 15,920 | | | | 0 | | | | 0 | | | | 0 | |
NuShares ESG Mid-Cap Value ETF | | | 15,920 | | | | 0 | | | | 0 | | | | 0 | |
NuShares ESG Small-Cap ETF | | | 15,920 | | | | 0 | | | | 0 | | | | 0 | |
| | | | | | | | | | | | | | | | |
Total | | $ | 116,300 | | | $ | 0 | | | $ | 0 | | | $ | 0 | |
| 1 | | “Audit Fees” are the aggregate fees billed for professional services for the audit of the Fund’s annual financial statements and services provided in connection with statutory and regulatory filings or engagements. |
| 2 | | “Audit-Related Fees” are the aggregate fees billed for assurance and related services reasonably related to the performance of the audit or review of financial statements that are not reported under “Audit Fees”. These fees include offerings related to the Fund’s common shares and leverage. |
| 3 | | “Tax Fees” are the aggregate fees billed for professional services for tax advice, tax compliance, and tax planning. These fees include: all global withholding tax services; excise and state tax reviews; capital gain, tax equalization and taxable basis calculations performed by the principal accountant. |
| 4 | | “All Other Fees” are the aggregate fees billed for products and services other than “Audit Fees”, “Audit-Related Fees” and “Tax Fees”. These fees represent all “Agreed-Upon Procedures” engagements pertaining to the Fund’s use of leverage. |
| | | | | | | | | | | | | | | | |
| | | Percentage Approved Pursuant to Pre-approval Exception | |
| | | Audit Fees Billed
to Funds | | | Audit-Related Fees
Billed to Funds | | | Tax Fees
Billed to Funds | | | All Other Fees
Billed to Funds | |
Fund Name | | | | | | | | | | | | | | | | |
NuShares ESG International Developed Markets Equity ETF | | | 0 | % | | | 0 | % | | | 0 | % | | | 0 | % |
NuShares ESG Emerging Markets Equity ETF | | | 0 | % | | | 0 | % | | | 0 | % | | | 0 | % |
NuShares ESG Large-Cap Growth ETF | | | 0 | % | | | 0 | % | | | 0 | % | | | 0 | % |
NuShares ESG Large-Cap Value ETF | | | 0 | % | | | 0 | % | | | 0 | % | | | 0 | % |
NuShares ESG Mid-Cap Growth ETF | | | 0 | % | | | 0 | % | | | 0 | % | | | 0 | % |
NuShares ESG Mid-Cap Value ETF | | | 0 | % | | | 0 | % | | | 0 | % | | | 0 | % |
NuShares ESG Small-Cap ETF | | | 0 | % | | | 0 | % | | | 0 | % | | | 0 | % |
| | | | |
Fiscal Year Ended October 31, 2017 | | Audit Fees Billed
to Funds 1 | | | Audit-Related Fees
Billed to Funds 2 | | | Tax Fees
Billed to Funds 3 | | | All Other Fees
Billed to Funds 4 | |
Fund Name | | | | | | | | | | | | | | | | |
NuShares ESG International Developed Markets Equity ETF | | | 17,500 | | | | 0 | | | | 0 | | | | 0 | |
NuShares ESG Emerging Markets Equity ETF | | | 17,500 | | | | 0 | | | | 0 | | | | 0 | |
NuShares ESG Large-Cap Growth ETF | | | 15,500 | | | | 0 | | | | 0 | | | | 0 | |
NuShares ESG Large-Cap Value ETF | | | 15,500 | | | | 0 | | | | 0 | | | | 0 | |
NuShares ESG Mid-Cap Growth ETF | | | 15,500 | | | | 0 | | | | 0 | | | | 0 | |
NuShares ESG Mid-Cap Value ETF | | | 15,500 | | | | 0 | | | | 0 | | | | 0 | |
NuShares ESG Small-Cap ETF | | | 15,500 | | | | 0 | | | | 0 | | | | 0 | |
| | | | | | | | | | | | | | | | |
Total | | $ | 112,500 | | | $ | 0 | | | $ | 0 | | | $ | 0 | |
| 1 | | “Audit Fees” are the aggregate fees billed for professional services for the audit of the Fund’s annual financial statements and services provided in connection with statutory and regulatory filings or engagements. |
| 2 | | “Audit-Related Fees” are the aggregate fees billed for assurance and related services reasonably related to the performance of the audit or review of financial statements that are not reported under “Audit Fees”. These fees include offerings related to the Fund’s common shares and leverage. |
| 3 | | “Tax Fees” are the aggregate fees billed for professional services for tax advice, tax compliance, and tax planning. These fees include: all global withholding tax services; excise and state tax reviews; capital gain, tax equalization and taxable basis calculations performed by the principal accountant. |
| 4 | | “All Other Fees” are the aggregate fees billed for products and services other than “Audit Fees”, “Audit-Related Fees” and “Tax Fees”. These fees represent all “Agreed-Upon Procedures” engagements pertaining to the Fund’s use of leverage. |
| | | | | | | | | | | | | | | | |
| | | Percentage Approved Pursuant to Pre-approval Exception | |
| | | Audit Fees Billed
to Funds | | | Audit-Related Fees
Billed to Funds | | | Tax Fees
Billed to Funds | | | All Other Fees
Billed to Funds | |
Fund Name | | | | | | | | | | | | | | | | |
NuShares ESG International Developed Markets Equity ETF | | | 0 | % | | | 0 | % | | | 0 | % | | | 0 | % |
NuShares ESG Emerging Markets Equity ETF | | | 0 | % | | | 0 | % | | | 0 | % | | | 0 | % |
NuShares ESG Large-Cap Growth ETF | | | 0 | % | | | 0 | % | | | 0 | % | | | 0 | % |
NuShares ESG Large-Cap Value ETF | | | 0 | % | | | 0 | % | | | 0 | % | | | 0 | % |
NuShares ESG Mid-Cap Growth ETF | | | 0 | % | | | 0 | % | | | 0 | % | | | 0 | % |
NuShares ESG Mid-Cap Value ETF | | | 0 | % | | | 0 | % | | | 0 | % | | | 0 | % |
NuShares ESG Small-Cap ETF | | | 0 | % | | | 0 | % | | | 0 | % | | | 0 | % |
| | | | | | | | | | | | |
Fiscal Year Ended October 31, 2018 | | Audit-Related Fees
Billed to Adviser and
Affiliated Fund
Service Providers | | | Tax Fees Billed to
Adviser and
Affiliated Fund
Service Providers
| | | All Other Fees
Billed to Adviser
and Affiliated Fund
Service Providers | |
NuShares ETF Trust | | $ | 0 | | | $ | 0 | | | $ | 0 | |
| |
| | | Percentage Approved Pursuant to Pre-approval Exception | |
| | | Audit-Related Fees
Billed to Adviser and
Affiliated Fund
Service Providers | | | Tax Fees Billed to
Adviser and
Affiliated Fund
Service Providers | | | All Other Fees
Billed to Adviser
and Affiliated Fund
Service Providers | |
| | | 0 | % | | | 0 | % | | | 0 | % |
| | | |
Fiscal Year Ended October 31, 2017 | | Audit-Related Fees
Billed to Adviser and
Affiliated Fund
Service Providers | | | Tax Fees Billed to
Adviser and
Affiliated Fund
Service Providers | | | All Other Fees
Billed to Adviser
and Affiliated Fund
Service Providers | |
NuShares ETF Trust | | $ | 0 | | | $ | 0 | | | $ | 0 | |
| |
| | | Percentage Approved Pursuant to Pre-approval Exception | |
| | | Audit-Related Fees
Billed to Adviser and
Affiliated Fund
Service Providers | | | Tax Fees Billed to
Adviser and
Affiliated Fund
Service Providers | | | All Other Fees
Billed to Adviser
and Affiliated Fund
Service Providers | |
| | | 0 | % | | | 0 | % | | | 0 | % |
| | | | | | | | | | | | | | | | |
Fiscal Year Ended October 31, 2018 | | Total Non-Audit Fees
Billed to Trust | | | Total Non-Audit Fees
billed to Adviser and
Affiliated Fund Service
Providers (engagements
related directly to the
operations and financial
reporting of the Trust) | | | Total Non-Audit Fees
billed to Adviser and
Affiliated Fund Service
Providers (all other
engagements) | | | Total | |
Fund Name | | | | | | | | | | | | | | | | |
NuShares ESG International Developed Markets Equity ETF | | | 0 | | | | 0 | | | | 0 | | | | 0 | |
NuShares ESG Emerging Markets Equity ETF | | | 0 | | | | 0 | | | | 0 | | | | 0 | |
NuShares ESG Large-Cap Growth ETF | | | 0 | | | | 0 | | | | 0 | | | | 0 | |
NuShares ESG Large-Cap Value ETF | | | 0 | | | | 0 | | | | 0 | | | | 0 | |
NuShares ESG Mid-Cap Growth ETF | | | 0 | | | | 0 | | | | 0 | | | | 0 | |
NuShares ESG Mid-Cap Value ETF | | | 0 | | | | 0 | | | | 0 | | | | 0 | |
NuShares ESG Small-Cap ETF | | | 0 | | | | 0 | | | | 0 | | | | 0 | |
| | | | | | | | | | | | | | | | |
Total | | $ | 0 | | | $ | 0 | | | $ | 0 | | | $ | 0 | |
“Non-Audit Fees billed to Fund” for both fiscal year ends represent “Tax Fees” and “All Other Fees” billed to Fund in their respective amounts from the previous table.
Less than 50 percent of the hours expended on the principal accountant’s engagement to audit the registrant’s financial statements for the most recent fiscal year were attributed to work performed by persons other than the principal accountant’s full-time, permanent employees.
| | | | | | | | | | | | | | | | |
Fiscal Year Ended October 31, 2017 | | Total Non-Audit Fees
Billed to Trust | | | Total Non-Audit Fees
billed to Adviser and
Affiliated Fund Service
Providers (engagements
related directly to the
operations and financial
reporting of the Trust) | | | Total Non-Audit Fees
billed to Adviser and
Affiliated Fund Service
Providers (all other
engagements) | | | Total | |
Fund Name | | | | | | | | | | | | | | | | |
NuShares ESG International Developed Markets Equity ETF | | | 0 | | | | 0 | | | | 0 | | | | 0 | |
NuShares ESG Emerging Markets Equity ETF | | | 0 | | | | 0 | | | | 0 | | | | 0 | |
NuShares ESG Large-Cap Growth ETF | | | 0 | | | | 0 | | | | 0 | | | | 0 | |
NuShares ESG Large-Cap Value ETF | | | 0 | | | | 0 | | | | 0 | | | | 0 | |
NuShares ESG Mid-Cap Growth ETF | | | 0 | | | | 0 | | | | 0 | | | | 0 | |
NuShares ESG Mid-Cap Value ETF | | | 0 | | | | 0 | | | | 0 | | | | 0 | |
NuShares ESG Small-Cap ETF | | | 0 | | | | 0 | | | | 0 | | | | 0 | |
| | | | | | | | | | | | | | | | |
Total | | $ | 0 | | | $ | 0 | | | $ | 0 | | | $ | 0 | |
“Non-Audit Fees billed to Fund” for both fiscal year ends represent “Tax Fees” and “All Other Fees” billed to Fund in their respective amounts from the previous table.
Audit Committee Pre-Approval Policies and Procedures. Generally, the Audit Committee must approve (i) all non-audit services to be performed for the Funds by the Funds’ independent accountant and (ii) all audit and non-audit services to be performed by the Funds’ independent accountant for the Affiliated Fund Service Providers with respect to the operations and financial reporting of the Funds. Regarding tax and research projects conducted by the independent accountant for the Funds and Affiliated Fund Service Providers (with respect to operations and financial reports of the Trust), such engagements will be (i) pre-approved by the Audit Committee if they are expected to be for amounts greater than $10,000; (ii) reported to the Audit Committee Chairman for his verbal approval prior to engagement if they are expected to be for amounts under $10,000 but greater than $5,000; and (iii) reported to the Audit Committee at the next Audit Committee meeting if they are expected to be for an amount under $5,000.
ITEM 5. AUDIT COMMITTEE OF LISTED REGISTRANTS.
The registrant is an issuer as defined in Rule 10A-3 under the Securities Exchange Act of 1934 (the “Exchange Act”). The registrant’s Board has a separately designated Audit Committee established in accordance with Section 3(a)(58)(A) of the Securities Exchange Act of 1934, as amended (15 U.S.C. 78c(a)(58)(A)). As of the end of the period covered by this report, the members of the audit committee are Jack B. Evans, Chair, William C. Hunter, John K. Nelson, Carole E. Stone and Terence J. Toth.
ITEM 6. SCHEDULE OF INVESTMENTS.
| a) | | See Portfolio of Investments in Item 1. |
ITEM 7. DISCLOSURE OF PROXY VOTING POLICIES AND PROCEDURES FOR CLOSED-END
MANAGEMENT INVESTMENT COMPANIES.
Not applicable to this registrant.
ITEM 8. PORTFOLIO MANAGERS OF CLOSED-END MANAGEMENT INVESTMENT COMPANIES.
Not applicable to this registrant.
ITEM 9. PURCHASES OF EQUITY SECURITIES BY CLOSED-END MANAGEMENT INVESTMENT COMPANY AND AFFILIATED PURCHASERS.
Not applicable to this registrant.
ITEM 10. SUBMISSION OF MATTERS TO A VOTE OF SECURITY HOLDERS.
There have been no material changes to the procedures by which shareholders may recommend nominees to the registrant’s Board of Trustees implemented after the registrant last provided disclosure in response to this Item.
ITEM 11. CONTROLS AND PROCEDURES.
| | (a) | | The registrant’s principal executive and principal financial officers, or persons performing similar functions, have concluded that the registrant’s disclosure controls and procedures (as defined in Rule 30a-3(c) under the Investment Company Act of 1940, as amended (the “1940 Act”) (17 CFR 270.30a-3(c))) are effective, as of a date within 90 days of the filing date of this report that includes the disclosure required by this paragraph, based on their evaluation of the controls and procedures required by Rule 30a-3(b) under the 1940 Act (17 CFR 270.30a-3(b)) and Rules 13a-15(b) or 15d-15(b) under the Securities Exchange Act of 1934, as amended (the “Exchange Act”) (17 CFR 240.13a-15(b) or 240.15d-15(b)). |
| | (b) | | There were no changes in the registrant’s internal control over financial reporting (as defined in Rule 30a-3(d) under the 1940 Act (17 CFR 270.30a-3(d)) that occurred during the period covered by this report that has materially affected, or is reasonably likely to materially affect, the registrant’s internal control over financial reporting. |
ITEM 12. DISCLOSURE OF SECURITIES LENDING ACTIVITIES FOR CLOSED-END MANAGEMENT INVESTMENT COMPANIES.
Not applicable.
ITEM 13. EXHIBITS.
File the exhibits listed below as part of this Form.
| | |
| (a)(1) | | Any code of ethics, or amendment thereto, that is the subject of the disclosure required by Item 2, to the extent that the registrant intends to satisfy the Item 2 requirements through filing of an exhibit: Not applicable because the code is posted on registrant’s website at www.nuveen.com/MutualFunds/ShareholderResources/FundGovernance.aspx and there were no amendments during the period covered by this report. (To view the code, click on Code of Conduct.) |
| |
| (a)(2) | | A separate certification for each principal executive officer and principal financial officer of the registrant as required by Rule 30a-2(a) under the 1940 Act (17 CFR 270.30a-2(a)) in the exact form set forth below: See EX-99.CERT attached hereto. |
| |
| (a)(3) | | Any written solicitation to purchase securities under Rule 23c-1 under the 1940 Act (17 CFR 270.23c-1) sent or given during the period covered by the report by or on behalf of the registrant to 10 or more persons: Not applicable to this registrant. |
| |
| (a)(4) | | Change in the registrant’s independent public accountant. Not applicable. |
| |
| (b) | | If the report is filed under Section 13(a) or 15(d) of the Exchange Act, provide the certifications required by Rule 30a-2(b) under the 1940 Act (17 CFR 270.30a-2(b)), Rule 13a-14(b) or Rule 15d-14(b) under the Exchange Act (17 CFR 240.13a-14(b) or 240.15d-14(b)), and Section 1350 of Chapter 63 of Title 18 of the United States Code (18 U.S.C. 1350) as an Exhibit. A certification furnished pursuant to this paragraph will not be deemed “filed” for purposes of Section 18 of the Exchange Act (15 U.S.C. 78r), or otherwise subject to the liability of that section. Such certification will not be deemed to be incorporated by reference into any filing under the Securities Act of 1933 or the Exchange Act, except to the extent that the registration specifically incorporates it by reference: See EX-99.906 CERT attached hereto. |
SIGNATURES
Pursuant to the requirements of the Securities Exchange Act of 1934 and the Investment Company Act of 1940, the registrant has duly caused this report to be signed on its behalf by the undersigned, thereunto duly authorized.
(Registrant) NuShares ETF Trust
| | |
| |
| By (Signature and Title) | | /s/ Christopher M. Rohrbacher |
| | Christopher M. Rohrbacher |
| | Vice President and Secretary |
Date: January 7, 2019
Pursuant to the requirements of the Securities Exchange Act of 1934 and the Investment Company Act of 1940, this report has been signed below by the following persons on behalf of the registrant and in the capacities and on the dates indicated.
| | |
| |
| By (Signature and Title) | | /s/ Martin Kremenstein |
| | Martin Kremenstein |
| | Chief Administrative Officer |
| | (principal executive officer) |
Date: January 7, 2019
| | |
| |
| By (Signature and Title) | | /s/ Stephen D. Foy |
| | Stephen D. Foy |
| | Vice President and Controller |
| | (principal financial officer) |
Date: January 7, 2019