UNITED STATES
SECURITIES AND EXCHANGE COMMISSION
Washington, D.C. 20549
FORM N-CSR
CERTIFIED SHAREHOLDER REPORT OF REGISTERED
MANAGEMENT INVESTMENT COMPANIES
| | |
| Investment Company Act file number | | 811-23161 |
Nushares ETF Trust
(Exact name of registrant as specified in charter)
Nuveen Investments
333 West Wacker Drive
Chicago, Illinois 60606
(Address of principal executive offices) (Zip code)
Diana R. Gonzalez
Vice President and Secretary
8500 Andrew Carnegie Boulevard
Charlotte, North Carolina 28262
(Name and address of agent for service)
Registrant’s telephone number, including area code: (312) 917‑7700
Date of fiscal year end: October 31
Date of reporting period: October 31, 2024
Item 1. Reports to Stockholders.
| | |
 | |
Annual Shareholder Report
October 31, 2024 |
Nuveen ESG Dividend ETF
NUDV/Cboe BZX Exchange, Inc.
Annual Shareholder Report
This annual shareholder report contains important information about the Nuveen ESG Dividend ETF for the period of November 1, 2023 to October 31, 2024. You can find additional information at https://www.nuveen.com/en‑us/exchange‑traded‑funds/prospectuses. You can also request this information by contacting us at (800) 257‑8787.
This report describes changes to the Fund that occurred during the reporting period.
What were the Fund costs for the last year? (based on a hypothetical $10,000 investment)
| | | | |
| | |
| | | Cost of a $10,000 investment | | Costs paid as a percentage of
$10,000 investment* |
| | | |
| Nuveen ESG Dividend ETF | | $30 | | 0.26% |
* Annualized for period less than one year.
How did the Fund perform last year? What affected the Fund’s performance?
|
|
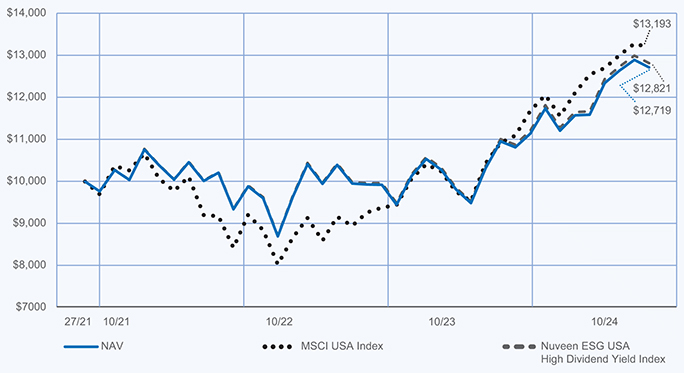
Performance Highlights • The Nuveen ESG Dividend ETF (NUDV)’s total return at net asset value (NAV) was 34.14% for the 12 months ended October 31, 2024. The Fund’s custom index, the Nuveen ESG USA High Dividend Index, returned 34.59%. • The difference between the Fund’s total return at NAV and that of the custom index is attributable to management fees and other expenses incurred by the Fund that are not incurred by the custom index. • During the reporting period, the Fund’s custom index underperformed the Fund’s base index, the MSCI USA Index, which returned 38.40%. • Performance drivers between the Fund’s custom index and base index during the reporting period: • Top contributors to the custom index’s relative performance » An overweight to and stock selection in the financials sector, led by overweights to Goldman Sachs Group, Inc. and Morgan Stanley. » An underweight to and stock selection in the energy sector, led by a lack of exposure to Exxon Mobil Corporation and Chevron Corporation. » Stock selection in the real estate sector, led by overweights to Iron Mountain, Inc. and Welltower Inc. • Top detractors from the custom index’s relative performance » An underweight to and stock selection in the information technology sector, including a lack of exposure to NVIDIA Corporation and Broadcom Inc. » Stock selection in the consumer staples sector, including overweights to Archer-Daniels-Midland Companies and PepsiCo, Inc. » An underweight to and stock selection in the communications services sector, including a lack of exposure to Meta Platforms and Netflix, Inc. |
How did the Fund perform over the period since inception?
Performance data shown represents past performance and does not predict or guarantee future results. The graph and table do not reflect the deduction of taxes that a shareholder would pay on Fund distributions or redemption of Fund Shares.
Fund Performance (September 27, 2021 through October 31, 2024) Initial Investment of $10,000
Average Annual Total Returns
| | | | |
| | |
| | | 1‑Year | | Since
Inception
(9/27/21) |
| | | |
| NAV | | 34.14% | | 8.09% |
| | | |
| MSCI USA Index | | 38.40% | | 9.37% |
| | | |
| Nuveen ESG USA High Dividend Yield Index | | 34.59% | | 8.37% |
Investment return and principal value will fluctuate, and you may have a gain or loss when you sell your shares. Current performance may differ from figures shown. For most recent month‑end performance, go to https://www.nuveen.com/en‑us/exchange‑traded‑funds/prospectuses or call (800) 257‑8787.
Fund Statistics (as of October 31, 2024)
| | | | |
| |
| Fund net assets | | $ | 11,701,928 | |
| |
| Total number of portfolio holdings | | | 121 | |
| |
| Portfolio turnover (%) | | | 68% | |
| |
| Total management fees paid for the year | | $ | 24,934 | |
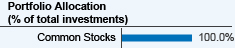
What did the Fund invest in? (as of October 31, 2024)
How has the Fund changed?
| | • | | Portfolio manager update: Effective June 18, 2024, Lei Lao retired and is no longer a portfolio manager of the Fund. Additionally, effective June 18, 2024, Nazar Romanyak, CFA and Darren Tran, CFA were added as portfolio managers of the Fund. | |
For more complete information, you may review the Fund’s next prospectus, which is expected to be available by February 28, 2025 at https://www.nuveen.com/en‑us/exchange‑traded‑funds/prospectuses or upon request at (800) 257‑8787.
Changes in independent registered public accounting firm
On October 24, 2024, the Fund’s Board of Trustees appointed PricewaterhouseCoopers LLP as the independent registered public accounting firm for the Fund and dismissed KPMG LLP (“KPMG”) as the independent registered public accounting firm for the Fund subject to the completion of the October 31, 2024 fiscal year audit. KPMG was informed of their dismissal on October 24, 2024. During the Fund’s fiscal years ended October 31, 2024 and October 31, 2023, and for the subsequent interim period through December 26, 2024, there have been no disagreements with KPMG on any matter of accounting principles or practices, financial statement disclosure or auditing scope or procedures.
Availability of additional information about the Fund
You can find additional information about the Fund at https://www.nuveen.com/en‑us/exchange‑traded‑funds/prospectuses, including its:
| | • | | prospectus • financial statements and other information • fund holdings • proxy voting information |
You can also request this information at (800) 257‑8787.
| | |
67092P813_AR_1024 4015310-INV-Y-12/25 | |  |
| | |
| |
Annual Shareholder Report
October 31, 2024 |
Nuveen ESG Emerging Markets Equity ETF
NUEM/Cboe BZX Exchange, Inc.
Annual Shareholder Report
This annual shareholder report contains important information about the Nuveen ESG Emerging Markets Equity ETF for the period of November 1, 2023 to October 31, 2024. You can find additional information at https://www.nuveen.com/en‑us/exchange‑traded‑funds/prospectuses. You can also request this information by contacting us at (800) 257‑8787.
This report describes changes to the Fund that occurred during the reporting period.
What were the Fund costs for the last year? (based on a hypothetical $10,000 investment)
| | | | |
| | |
| | | Cost of a $10,000 investment | | Costs paid as a percentage of $10,000 investment* |
| | | |
| Nuveen ESG Emerging Markets Equity ETF | | $40 | | 0.36% |
* Annualized for period less than one year.
How did the Fund perform last year? What affected the Fund’s performance?
|
|
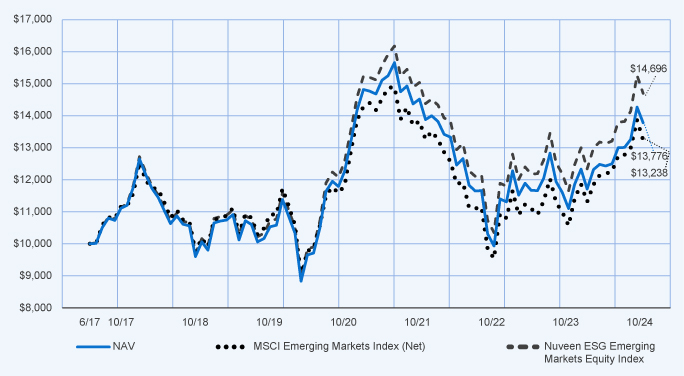
Performance Highlights • The Nuveen ESG Emerging Markets Equity ETF (NUEM)’s total return at net asset value (NAV) was 24.12% for the 12 months ended October 31, 2024. The Fund’s custom index, the Nuveen ESG Emerging Markets Equity Index, returned 26.15%. • The difference between the Fund’s total return at NAV and that of the custom index is attributable to management fees and other expenses, along with fair value pricing of the Fund’s international securities. • A non‑U.S. Equity Fund’s return may sometimes diverge from the return of its benchmark index more than would be expected. This may be the result of a fair-value pricing adjustment. Many foreign exchanges close before the Fund’s daily net asset value (NAV) is calculated (generally 4 p.m. ET). In the intervening hours, the value of foreign securities can change, and these changes are not reflected immediately in the Fund’s benchmark index. They may, however, be reflected in the calculation of the Fund’s NAV for that day. • During the reporting period, the Fund’s custom index outperformed the Fund’s base index, the MSCI Emerging Markets Index (Net), which returned 25.32%. • Performance drivers between the Fund’s custom index and base index during the reporting period: • Top contributors to the custom index’s relative performance » Security selection in the information technology sector, led by an overweight to Taiwan Semiconductor Manufacturing Co., Ltd. and a lack of exposure to Samsung Electronics Co., Ltd. » Security selection in the consumer discretionary sector, led by overweights to Meituan and Trent Limited. » An overweight to Yuhan Corporation. • Top detractors from the custom index’s relative performance » Security selection in the communication services sector, including a lack of exposure to Tencent Holdings Ltd. And an overweight to Netease Inc. » Security selection in the consumer staples sector, including overweights to Wal‑Mart de Mexico SAB de CV and Nongfu Spring Co., Ltd. |
How did the Fund perform over the period since inception?
Performance data shown represents past performance and does not predict or guarantee future results. The graph and table do not reflect the deduction of taxes that a shareholder would pay on Fund distributions or redemption of Fund Shares.
Fund Performance (June 6, 2017 through October 31, 2024) Initial Investment of $10,000
Average Annual Total Returns
| | | | | | | | | | | | | | | |
| | | |
| | | 1‑Year | | 5‑Year | | Since
Inception
(6/6/17) |
| | | | |
| NAV | | | | 24.12% | | | | | 5.52% | | | | | 4.42% | |
| | | | |
| MSCI Emerging Markets Index (Net) | | | | 25.32% | | | | | 3.93% | | | | | 3.86% | |
| | | | |
| Nuveen ESG Emerging Markets Equity Index | | | | 26.15% | | | | | 6.54% | | | | | 5.34% | |
Investment return and principal value will fluctuate, and you may have a gain or loss when you sell your shares. Current performance may differ from figures shown. For most recent month‑end performance, go to https://www.nuveen.com/en‑us/exchange‑traded‑funds/prospectuses or call (800) 257‑8787.
Fund Statistics (as of October 31, 2024)
| | | | |
| |
| Fund net assets | | $ | 290,624,535 | |
| |
| Total number of portfolio holdings | | | 210 | |
| |
| Portfolio turnover (%) | | | 58% | |
| |
| Total management fees paid for the year | | $ | 890,640 | |
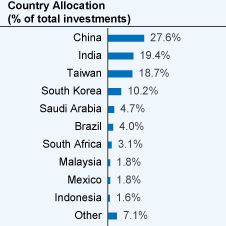
What did the Fund invest in? (as of October 31, 2024)
How has the Fund changed?
| | • | | Portfolio manager update: Effective June 18, 2024, Lei Lao retired and is no longer a portfolio manager of the Fund. Additionally, effective June 18, 2024, Nazar Romanyak, CFA and Darren Tran, CFA were added as portfolio managers of the Fund. | |
For more complete information, you may review the Fund’s next prospectus, which is expected to be available by February 28, 2025 at https://www.nuveen.com/en‑us/exchange‑traded‑funds/prospectuses or upon request at (800) 257‑8787.
Changes in independent registered public accounting firm
On October 24, 2024, the Fund’s Board of Trustees appointed PricewaterhouseCoopers LLP as the independent registered public accounting firm for the Fund and dismissed KPMG LLP (“KPMG”) as the independent registered public accounting firm for the Fund subject to the completion of the October 31, 2024 fiscal year audit. KPMG was informed of their dismissal on October 24, 2024. During the Fund’s fiscal years ended October 31, 2024 and October 31, 2023, and for the subsequent interim period through December 26, 2024, there have been no disagreements with KPMG on any matter of accounting principles or practices, financial statement disclosure or auditing scope or procedures.
Availability of additional information about the Fund
You can find additional information about the Fund at https://www.nuveen.com/en‑us/exchange‑traded‑funds/prospectuses, including its:
| | • | | prospectus • financial statements and other information • fund holdings • proxy voting information |
You can also request this information at (800) 257‑8787
| | |
67092P888_AR_1024 4015308‑INV‑Y‑12/25 | | |
| | |
| |
Annual Shareholder Report
October 31, 2024 |
Nuveen ESG International Developed Markets Equity ETF
NUDM/Cboe BZX Exchange, Inc.
Annual Shareholder Report
This annual shareholder report contains important information about the Nuveen ESG International Developed Markets Equity ETF for the period of November 1, 2023 to October 31, 2024. You can find additional information at https://www.nuveen.com/en‑us/exchange‑traded‑funds/prospectuses. You can also request this information by contacting us at (800) 257‑8787.
This report describes changes to the Fund that occurred during the reporting period.
What were the Fund costs for the last year? (based on a hypothetical $10,000 investment)
| | | | |
| | |
| | | Cost of a $10,000 investment | | Costs paid as a percentage of
$10,000 investment* |
| | | |
| Nuveen ESG International Developed Markets Equity ETF | | $35 | | 0.31% |
* Annualized for period less than one year.
How did the Fund perform last year? What affected the Fund’s performance?
|
|
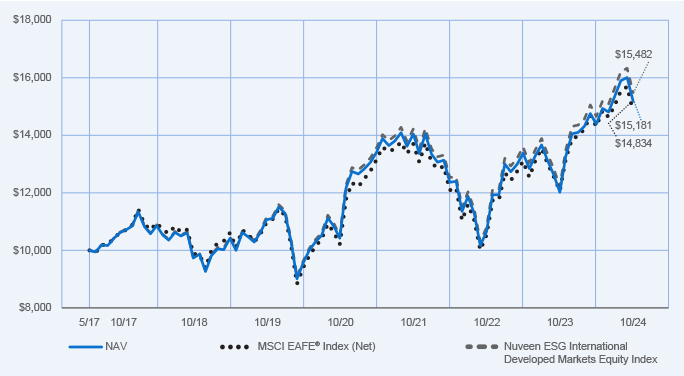
Performance Highlights • The Nuveen ESG International Developed Markets Equity ETF (NUDM)’s total return at net asset value (NAV) was 26.37% for the 12 months ended October 31, 2024. The Fund’s custom index, the Nuveen ESG International Developed Markets Equity Index, returned 26.77%. • The difference between the Fund’s total return at NAV and that of the custom index is attributable to management fees and other expenses, along with fair value pricing of the Fund’s international securities. • A non‑U.S. Equity Fund’s return may sometimes diverge from the return of its benchmark index more than would be expected. This may be the result of a fair-value pricing adjustment. Many foreign exchanges close before the Fund’s daily net asset value (NAV) is calculated (generally 4 p.m. ET). In the intervening hours, the value of foreign securities can change, and these changes are not reflected immediately in the Fund’s benchmark index. They may, however, be reflected in the calculation of the Fund’s NAV for that day. • During the reporting period, the Fund’s custom index outperformed the Fund’s base index, the MSCI EAFE Index (Net), which returned 22.97%. • Performance drivers between the Fund’s custom index and base index during the reporting period: • Top contributors to the custom index’s relative performance » Security selection in the financials sector, led by overweights to NatWest Group Plc and Intesa Sanpaolo S.p.A. » Security selection in the consumer staples sector, led by an overweight to Nestle S.A. and a lack of exposure to Diageo plc. » An underweight allocation to the energy sector. • Top detractors from the custom index’s relative performance » Security selection in the consumer discretionary sector, including overweights to Oriental Land Co., Ltd. and Panasonic HOldins Corporation. » Security selection in the materials sector, including overweights to Umicore SA and Pilbara Minerals Limited. |
How did the Fund perform over the period since inception?
Performance data shown represents past performance and does not predict or guarantee future results. The graph and table do not reflect the deduction of taxes that a shareholder would pay on Fund distributions or redemption of Fund Shares.
Fund Performance (June 6, 2017 through October 31, 2024) Initial Investment of $10,000
Average Annual Total Returns
| | | | | | | | | | | | | | | |
| | | |
| | | 1‑Year | | 5‑Year | | Since
Inception (6/6/17) |
| | | | |
| NAV | | | | 26.37% | | | | | 6.53% | | | | | 5.80% | |
| | | | |
MSCI EAFE® Index (Net) | | | | 22.97% | | | | | 6.24% | | | | | 5.47% | |
| | | | |
| Nuveen ESG International Developed Markets Equity Index | | | | 26.77% | | | | | 6.81% | | | | | 6.08% | |
Investment return and principal value will fluctuate, and you may have a gain or loss when you sell your shares. Current performance may differ from figures shown. For most recent month‑end performance, go to https://www.nuveen.com/en‑us/exchange‑traded‑funds/prospectuses or call (800) 257‑8787.
Fund Statistics (as of October 31, 2024)
| | | | |
| |
| Fund net assets | | $ | 464,730,362 | |
| |
| Total number of portfolio holdings | | | 151 | |
| |
| Portfolio turnover (%) | | | 58% | |
| |
| Total management fees paid for the year | | $ | 1,259,958 | |
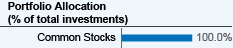
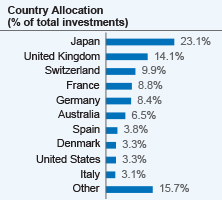
What did the Fund invest in? (as of October 31, 2024)
How has the Fund changed?
| | • | | Portfolio manager update: Effective June 18, 2024, Lei Lao retired and is no longer a portfolio manager of the Fund. Additionally, effective June 18, 2024, Nazar Romanyak, CFA and Darren Tran, CFA were added as portfolio managers of the Fund. | |
For more complete information, you may review the Fund’s next prospectus, which is expected to be available by February 28, 2025 at https://www.nuveen.com/en‑us/exchange‑traded‑funds/prospectuses or upon request at (800) 257‑8787.
Changes in independent registered public accounting firm
On October 24, 2024, the Fund’s Board of Trustees appointed PricewaterhouseCoopers LLP as the independent registered public accounting firm for the Fund and dismissed KPMG LLP (“KPMG”) as the independent registered public accounting firm for the Fund subject to the completion of the October 31, 2024 fiscal year audit. KPMG was informed of their dismissal on October 24, 2024. During the Fund’s fiscal years ended October 31, 2024 and October 31, 2023, and for the subsequent interim period through December 26, 2024, there have been no disagreements with KPMG on any matter of accounting principles or practices, financial statement disclosure or auditing scope or procedures.
Availability of additional information about the Fund
You can find additional information about the Fund at https://www.nuveen.com/en‑us/exchange‑traded‑funds/prospectuses, including its:
| | • | | prospectus • financial statements and other information • fund holdings • proxy voting information |
You can also request this information at (800) 257‑8787.
| | |
67092P805_AR_1024 4015307‑INV‑Y‑12/25 | | |
| | |
| |
Annual Shareholder Report
October 31, 2024 |
Nuveen ESG Large‑Cap ETF
NULC/Cboe BZX Exchange, Inc.
Annual Shareholder Report
This annual shareholder report contains important information about the Nuveen ESG Large‑Cap ETF for the period of November 1, 2023 to October 31, 2024. You can find additional information at https://www.nuveen.com/en‑us/exchange‑traded‑funds/prospectuses. You can also request this information by contacting us at (800) 257‑8787.
This report describes changes to the Fund that occurred during the reporting period.
What were the Fund costs for the last year? (based on a hypothetical $10,000 investment)
| | | | |
| | |
| | | Cost of a $10,000 investment | | Costs paid as a percentage of
$10,000 investment* |
| | | |
| Nuveen ESG Large‑Cap ETF | | $25 | | 0.21% |
* Annualized for a period less than one year.
How did the Fund perform last year? What affected the Fund’s performance?
|
|
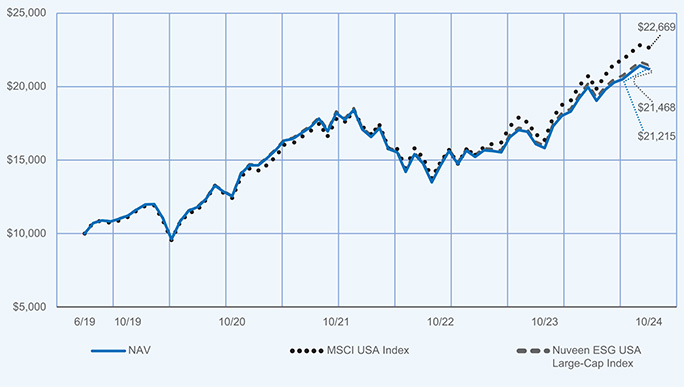
Performance Highlights • The Nuveen ESG Large‑Cap ETF (NULC)’s total return at net asset value (NAV) was 34.04% for the 12 months ended October 31, 2024. The Fund’s custom index, the Nuveen ESG USA Large‑Cap Index, returned 34.36%. • The difference between the Fund’s total return at NAV and that of the custom index is attributable to management fees and other expenses incurred by the Fund that are not incurred by the custom index. • During the reporting period, the Fund’s custom index significantly underperformed the Fund’s base index, the MSCI USA Index, which returned 38.4%. • Performance drivers between the Fund’s custom index and base index during the reporting period: • Top contributors to the custom index’s relative performance » An overweight to NVIDIA Corporation. » An underweight to and stock selection within the energy sector, led by a lack of exposure to Exxon Mobil Corporation and Chevron Corporation. » An overweight to Fiserv, Inc. • Top detractors from the custom index’s relative performance » An overweight to Intel Corporation. » Stock selection in the communication services sector, led by a lack of exposure to Meta Platforms Inc. » Stock selection in the consumer staples sector, led by overweights to Archer Daniels Midland Corporation and Procter & Gamble Company. |
How did the Fund perform over the period since inception?
Performance data shown represents past performance and does not predict or guarantee future results. The graph and table do not reflect the deduction of taxes that a shareholder would pay on Fund distributions or redemption of Fund Shares.
Fund Performance (June 3, 2019 through October 31, 2024) Initial Investment of $10,000
Average Annual Total Returns
| | | | | | |
| | | |
| | | 1‑Year | | 5‑Year | | Since
Inception
(6/3/19) |
| | | | |
| NAV | | 34.04% | | 13.58% | | 14.91% |
| | | | |
| MSCI USA Index | | 38.40% | | 15.27% | | 16.33% |
| | | | |
| Nuveen ESG USA Large‑Cap Index | | 34.36% | | 13.83% | | 15.16% |
Investment return and principal value will fluctuate, and you may have a gain or loss when you sell your shares. Current performance may differ from figures shown. For most recent month‑end performance, go to https://www.nuveen.com/en‑us/exchange‑traded‑funds/prospectuses or call (800) 257‑8787.
Fund Statistics (as of October 31, 2024)
| | | | |
| |
| Fund net assets | | $ | 34,344,806 | |
| |
| Total number of portfolio holdings | | | 123 | |
| |
| Portfolio turnover (%) | | | 50% | |
| |
| Total management fees paid for the year | | $ | 59,110 | |
What did the Fund invest in? (as of October 31, 2024)
How has the Fund changed?
| | • | | Portfolio manager update: Effective June 18, 2024, Lei Lao retired and is no longer a portfolio manager of the Fund. Additionally, effective June 18, 2024, Nazar Romanyak, CFA and Darren Tran, CFA were added as portfolio managers of the Fund. | |
For more complete information, you may review the Fund’s next prospectus, which is expected to be available by February 28, 2025 at https://www.nuveen.com/en‑us/exchange‑traded‑funds/prospectuses or upon request at (800) 257‑8787.
Changes in independent registered public accounting firm
On October 24, 2024, the Fund’s Board of Trustees appointed PricewaterhouseCoopers LLP as the independent registered public accounting firm for the Fund and dismissed KPMG LLP (“KPMG”) as the independent registered public accounting firm for the Fund subject to the completion of the October 31, 2024 fiscal year audit. KPMG was informed of their dismissal on October 24, 2024. During the Fund’s fiscal years ended October 31, 2024 and October 31, 2023, and for the subsequent interim period through December 26, 2024, there have been no disagreements with KPMG on any matter of accounting principles or practices, financial statement disclosure or auditing scope or procedures.
Availability of additional information about the Fund
You can find additional information about the Fund at https://www.nuveen.com/en‑us/exchange‑traded‑funds/prospectuses, including its:
| | • | | prospectus • financial statements and other information • fund holdings • proxy voting information |
You can also request this information at (800) 257‑8787.
| | |
67092P862_AR_1024 4015306‑INV‑Y‑12/25 | | |
| | |
| |
Annual Shareholder Report
October 31, 2024 |
Nuveen ESG Large‑Cap Growth ETF
NULG/Cboe BZX Exchange, Inc.
Annual Shareholder Report
This annual shareholder report contains important information about the Nuveen ESG Large‑Cap Growth ETF for the period of November 1, 2023 to October 31, 2024. You can find additional information at https://www.nuveen.com/en‑us/exchange‑traded‑funds/prospectuses. You can also request this information by contacting us at (800) 257‑8787.
This report describes changes to the Fund that occurred during the reporting period.
What were the Fund costs for the last year? (based on a hypothetical $10,000 investment)
| | | | |
| | |
| | | Cost of a $10,000 investment | | Costs paid as a percentage of
$10,000 investment* |
| | | |
| Nuveen ESG Large‑Cap Growth ETF | | $31 | | 0.26% |
* Annualized for period less than one year.
How did the Fund perform last year? What affected the Fund’s performance?
|
|
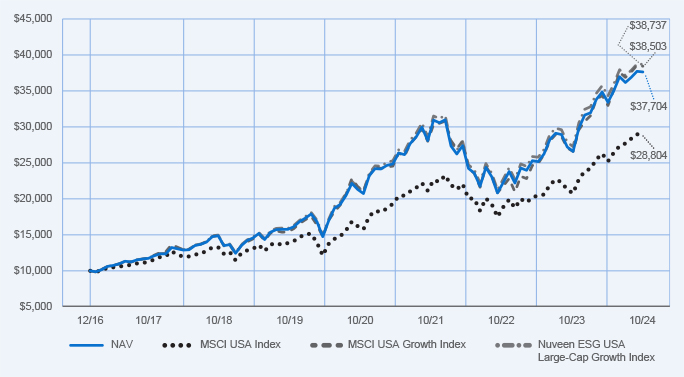
Performance Highlights • The Nuveen ESG Large‑Cap Growth ETF (NULG)’s total return at net asset value (NAV) was 41.51% for the 12 months ended October 31, 2024. The Fund’s custom index, the Nuveen ESG USA Large‑Cap Growth Index, returned 41.86%. • The difference between the Fund’s total return at NAV and that of the custom index is attributable to management fees and other expenses incurred by the Fund that are not incurred by the custom index. • During the reporting period, the Fund’s custom index underperformed the Fund’s base index, the MSCI USA Growth Index, which returned 44.69%. • Performance drivers between the Fund’s custom index and base index during the reporting period: • Top contributors to the custom index’s relative performance » Stock selection within information technology, led by a lack of exposure to Apple Inc., and an overweight to NVIDIA Corporation. » An underweight to the energy sector. » An overweight position in Axon Enterprise Inc. • Top detractors from the custom index’s relative performance » Stock selection within communication services, including a lack of exposure to Meta Platforms and an overweight to Warner Bros. Discovery, Inc. » An overweight to and stock selection within healthcare, including overweights to IDEXX Laboratories, Inc. and West Pharmaceutical Services, Inc. » An overweight to and stock selection within consumer discretionary, including overweights to lululemon athletica inc. and Tesla, Inc. |
How did the Fund perform over the period since inception?
Performance data shown represents past performance and does not predict or guarantee future results. The graph and table do not reflect the deduction of taxes that a shareholder would pay on Fund distributions or redemption of Fund Shares.
Fund Performance (December 13, 2016 through October 31, 2024) Initial Investment of $10,000
Average Annual Total Returns
| | | | | | |
| | | |
| | | 1‑Year | | 5‑Year | | Since
Inception
(12/13/16) |
| | | | |
| NAV | | 41.51% | | 18.49% | | 18.34% |
| | | | |
| MSCI USA Index | | 38.40% | | 15.27% | | 14.36% |
| | | | |
| MSCI USA Growth Index | | 44.69% | | 19.40% | | 18.65% |
| | | | |
| Nuveen ESG USA Large‑Cap Growth Index | | 41.86% | | 18.87% | | 18.74% |
Investment return and principal value will fluctuate, and you may have a gain or loss when you sell your shares. Current performance may differ from figures shown. For most recent month‑end performance, go to https://www.nuveen.com/en‑us/exchange‑traded‑funds/prospectuses or call (800) 257‑8787.
Fund Statistics (as of October 31, 2024)
| | | | |
| |
| Fund net assets | | $ | 1,499,008,938 | |
| |
| Total number of portfolio holdings | | | 59 | |
| |
| Portfolio turnover (%) | | | 60% | |
| |
| Total management fees paid for the year | | $ | 3,374,590 | |
What did the Fund invest in? (as of October 31, 2024)
How has the Fund changed?
| | • | | Portfolio manager update: Effective June 18, 2024, Lei Lao retired and is no longer a portfolio manager of the Fund. Additionally, effective June 18, 2024, Nazar Romanyak, CFA and Darren Tran, CFA were added as portfolio managers of the Fund. | |
For more complete information, you may review the Fund’s next prospectus, which is expected to be available by February 28, 2025 at https://www.nuveen.com/en‑us/exchange‑traded‑funds/prospectuses or upon request at (800) 257‑8787.
Changes in independent registered public accounting firm
On October 24, 2024, the Fund’s Board of Trustees appointed PricewaterhouseCoopers LLP as the independent registered public accounting firm for the Fund and dismissed KPMG LLP (“KPMG”) as the independent registered public accounting firm for the Fund subject to the completion of the October 31, 2024 fiscal year audit. KPMG was informed of their dismissal on October 24, 2024. During the Fund’s fiscal years ended October 31, 2024 and October 31, 2023, and for the subsequent interim period through December 26, 2024, there have been no disagreements with KPMG on any matter of accounting principles or practices, financial statement disclosure or auditing scope or procedures.
Availability of additional information about the Fund
You can find additional information about the Fund at https://www.nuveen.com/en‑us/exchange‑traded‑funds/prospectuses, including its:
| | • | | prospectus • financial statements and other information • fund holdings • proxy voting information |
You can also request this information at (800) 257‑8787.
| | |
67092P201_AR_1024 4015305‑INV‑Y‑12/25 | | |
| | |
| |
Annual Shareholder Report
October 31, 2024 |
Nuveen ESG Large-Cap Value ETF
NULV/Cboe BZX Exchange, Inc.
Annual Shareholder Report
This annual shareholder report contains important information about the Nuveen ESG Large-Cap Value ETF for the period of November 1, 2023 to October 31, 2024. You can find additional information at https://www.nuveen.com/en-us/exchange-traded-funds/prospectuses. You can also request this information by contacting us at (800) 257-8787.
This report describes changes to the Fund that occurred during the reporting period.
What were the Fund costs for the last year? (based on a hypothetical $10,000 investment)
| | | | |
| | |
| | | Cost of a $10,000 investment | | Costs paid as a percentage of
$10,000 investment* |
| | | |
| Nuveen ESG Large-Cap Value ETF | | $30 | | 0.26% |
* Annualized for period less than one year.
How did the Fund perform last year? What affected the Fund’s performance?
|
|
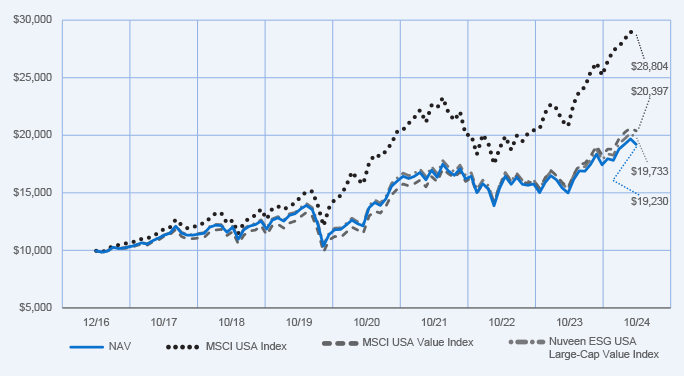
Performance Highlights • The Nuveen ESG Large-Cap Value ETF (NULV)’s total return at net asset value (NAV) was 28.04% for the 12 months ended October 31, 2024. The Fund’s custom index, the Nuveen ESG USA Large-Cap Value Index, returned 28.49%. • The difference between the Fund’s total return at NAV and that of the custom index is attributable to management fees and other expenses incurred by the Fund that are not incurred by the custom index. • During the reporting period, the Fund’s custom index underperformed the Fund’s base index, the MSCI USA Value Index, which returned 31.80%. • Performance drivers between the Fund’s custom index and base index during the reporting period: • Top contributors to the custom index’s relative performance » An underweight to and stock selection within energy, led by a lack of exposure to Chevron Corporation and Exxon Mobil Corporation. » An overweight to and stock selection within financials, led by overweights to Fiserv, Inc. and Bank of New York Mellon Corp. » An overweight to Welltower Inc. • Top detractors from the custom index’s relative performance » Stock selection within information technology, led by a lack of exposure to Broadcom Inc. and an overweight to Intel Corporation. » An overweight to and stock selection within consumer staples, led by an overweight to Archer-Daniels Midland Companies. » Stock selection in utilities, led by an overweight to Exelon Corporation and a lack of exposure to Constellation Energy Corporation. |
How did the Fund perform over the period since inception?
Performance data shown represents past performance and does not predict or guarantee future results. The graph and table do not reflect the deduction of taxes that a shareholder would pay on Fund distributions or redemption of Fund Shares.
Fund Performance (December 13, 2016 through October 31, 2024) Initial Investment of $10,000
Average Annual Total Returns
| | | | | | |
| | | |
| | | 1‑Year | | 5‑Year | | Since
Inception
(12/13/16) |
| | | | |
| NAV | | 28.04% | | 7.82% | | 8.65% |
| | | | |
| MSCI USA Index | | 38.40% | | 15.27% | | 14.36% |
| | | | |
| MSCI USA Value Index | | 31.80% | | 10.16% | | 9.46% |
| | | | |
| Nuveen ESG USA Large-Cap Value Index | | 28.49% | | 8.16% | | 9.01% |
Investment return and principal value will fluctuate, and you may have a gain or loss when you sell your shares. Current performance may differ from figures shown. For most recent month-end performance, go to https://www.nuveen.com/en-us/exchange-traded-funds/prospectuses or call (800) 257-8787.
Fund Statistics (as of October 31, 2024)
| | | | |
| |
| Fund net assets | | $ | 1,694,495,505 | |
| |
| Total number of portfolio holdings | | | 105 | |
| |
| Portfolio turnover (%) | | | 47% | |
| |
| Total management fees paid for the year | | $ | 3,962,191 | |
What did the Fund invest in? (as of October 31, 2024)
How has the Fund changed?
| | • | | Portfolio manager update: Effective June 18, 2024, Lei Lao retired and is no longer a portfolio manager of the Fund. Additionally, effective June 18, 2024, Nazar Romanyak, CFA and Darren Tran, CFA were added as portfolio managers of the Fund. | |
For more complete information, you may review the Fund’s next prospectus, which is expected to be available by February 28, 2025 at https://www.nuveen.com/en-us/exchange-traded-funds/prospectuses or upon request at (800) 257-8787.
Changes in independent registered public accounting firm
On October 24, 2024, the Fund’s Board of Trustees appointed PricewaterhouseCoopers LLP as the independent registered public accounting firm for the Fund and dismissed KPMG LLP (“KPMG”) as the independent registered public accounting firm for the Fund subject to the completion of the October 31, 2024 fiscal year audit. KPMG was informed of their dismissal on October 24, 2024. During the Fund’s fiscal years ended October 31, 2024 and October 31, 2023, and for the subsequent interim period through December 26, 2024, there have been no disagreements with KPMG on any matter of accounting principles or practices, financial statement disclosure or auditing scope or procedures.
Availability of additional information about the Fund
You can find additional information about the Fund at https://www.nuveen.com/en-us/exchange-traded-funds/prospectuses, including its:
| | • | | prospectus • financial statements and other information • fund holdings • proxy voting information |
You can also request this information at (800) 257-8787.
| | |
67092P300_AR_1024 4015304-INV-Y-12/25 | | |
| | |
| |
Annual Shareholder Report
October 31, 2024 |
Nuveen ESG Mid‑Cap Growth ETF
NUMG/Cboe BZX Exchange, Inc.
Annual Shareholder Report
This annual shareholder report contains important information about the Nuveen ESG Mid‑Cap Growth ETF for the period of November 1, 2023 to October 31, 2024. You can find additional information at https://www.nuveen.com/en‑us/exchange‑traded‑funds/prospectuses. You can also request this information by contacting us at (800) 257‑8787.
This report describes changes to the Fund that occurred during the reporting period.
What were the Fund costs for the last year? (based on a hypothetical $10,000 investment)
| | | | |
| | |
| | | Cost of a $10,000 investment | | Costs paid as a percentage of $10,000 investment* |
| | | |
| Nuveen ESG Mid‑Cap Growth ETF | | $36 | | 0.31% |
* Annualized for period less than one year.
How did the Fund perform last year? What affected the Fund’s performance?
|
|
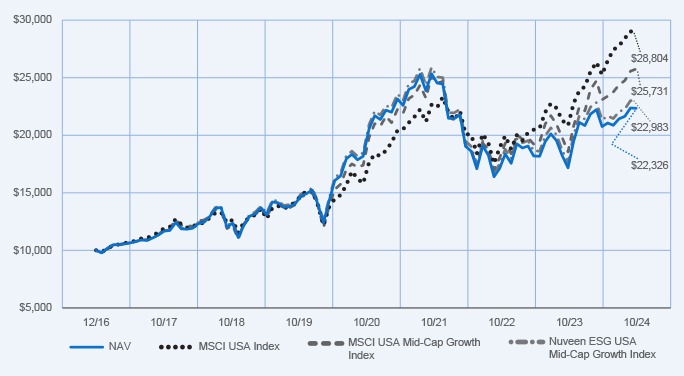
Performance Highlights • The Nuveen ESG Mid‑Cap Growth ETF (NUMG)’s total return at net asset value (NAV) was 30.07% for the 12 months ended October 31, 2024. The Fund’s custom index, the Nuveen ESG USA Mid‑Cap Growth Index, returned 30.46%. • The difference between the Fund’s total return at NAV and that of the custom index is attributable to management fees and other expenses incurred by the Fund that are not incurred by the custom index, along with the representative sampling process, which utilizes a subset of index securities in an effort to provide exposure similar to that of the custom index. • During the reporting period, the Fund’s custom index significantly underperformed the Fund’s base index, the MSCI USA Mid‑Growth Index, which returned 38.71%. • Performance drivers between the Fund’s custom index and base index during the reporting period: • Top contributors to the custom index’s relative performance » An overweight to Axon Enterprise Inc. » A lack of exposure to BioMarin Pharmaceuticals Inc. » An overweight to DaVita Inc. • Top detractors from the custom index’s relative performance » Stock selection in the information technology sector, including a lack of exposure to Palantir Technologies Inc. and AppLovin Corp. » Stock selection in the financials sector, including a lack of exposure to Coinbase Global, Inc. and an overweight to MarketAxess Holdings Inc. » A lack of exposure to Vertiv Holdings Co. |
How did the Fund perform over the period since inception?
Performance data shown represents past performance and does not predict or guarantee future results. The graph and table do not reflect the deduction of taxes that a shareholder would pay on Fund distributions or redemption of Fund Shares.
Fund Performance (December 13, 2016 through October 31, 2024) Initial Investment of $10,000
Average Annual Total Returns
| | | | | | | | | | |
| | | |
| | | 1‑Year | | | 5‑Year | | | Since
Inception
(12/13/16) |
| | | | |
| NAV | | | 30.07 | % | | | 9.75 | % | | 10.73% |
| | | | |
| MSCI USA Index | | | 38.40 | % | | | 15.27 | % | | 14.36% |
| | | | |
| MSCI USA Mid‑Cap Growth Index | | | 38.71 | % | | | 13.04 | % | | 12.74% |
| | | | |
| Nuveen ESG USA Mid‑Cap Growth Index | | | 30.46 | % | | | 10.12 | % | | 11.13% |
Investment return and principal value will fluctuate, and you may have a gain or loss when you sell your shares. Current performance may differ from figures shown. For most recent month‑end performance, go to https://www.nuveen.com/en‑us/exchange‑traded‑funds/prospectuses or call (800) 257‑8787.
Fund Statistics (as of October 31, 2024)
| | | | |
| |
| Fund net assets | | $ | 400,608,219 | |
| |
| Total number of portfolio holdings | | | 45 | |
| |
| Portfolio turnover (%) | | | 78% | |
| |
| Total management fees paid for the year | | $ | 1,157,986 | |
What did the Fund invest in? (as of October 31, 2024)
How has the Fund changed?
| | • | | Portfolio manager update: Effective June 18, 2024, Lei Lao retired and is no longer a portfolio manager of the Fund. Additionally, effective June 18, 2024, Nazar Romanyak, CFA and Darren Tran, CFA were added as portfolio managers of the Fund. | |
For more complete information, you may review the Fund’s next prospectus, which is expected to be available by February 28, 2025 at https://www.nuveen.com/en‑us/exchange‑traded‑funds/prospectuses or upon request at (800) 257‑8787.
Changes in independent registered public accounting firm
On October 24, 2024, the Fund’s Board of Trustees appointed PricewaterhouseCoopers LLP as the independent registered public accounting firm for the Fund and dismissed KPMG LLP (“KPMG”) as the independent registered public accounting firm for the Fund subject to the completion of the October 31, 2024 fiscal year audit. KPMG was informed of their dismissal on October 24, 2024. During the Fund’s fiscal years ended October 31, 2024 and October 31, 2023, and for the subsequent interim period through December 26, 2024, there have been no disagreements with KPMG on any matter of accounting principles or practices, financial statement disclosure or auditing scope or procedures.
Availability of additional information about the Fund
You can find additional information about the Fund at https://www.nuveen.com/en‑us/exchange‑traded‑funds/prospectuses, including its:
| | • | | prospectus • financial statements and other information • fund holdings • proxy voting information |
You can also request this information at (800) 257‑8787.
| | |
67092P409_AR_1024 4015303‑INV‑Y‑12/25 | | |
| | |
| |
Annual Shareholder Report
October 31, 2024 |
Nuveen ESG Mid-Cap Value ETF
NUMV/Cboe BZX Exchange, Inc.
Annual Shareholder Report
This annual shareholder report contains important information about the Nuveen ESG Mid-Cap Value ETF for the period of November 1, 2023 to October 31, 2024. You can find additional information at https://www.nuveen.com/en-us/exchange-traded-funds/prospectuses. You can also request this information by contacting us at (800) 257-8787.
This report describes changes to the Fund that occurred during the reporting period.
What were the Fund costs for the last year? (based on a hypothetical $10,000 investment)
| | | | |
| | |
| | | Cost of a $10,000 investment | | Costs paid as a percentage of
$10,000 investment* |
| | | |
| Nuveen ESG Mid-Cap Value ETF | | $37 | | 0.31% |
* Annualized for period less than one year.
How did the Fund perform last year? What affected the Fund’s performance?
|
|
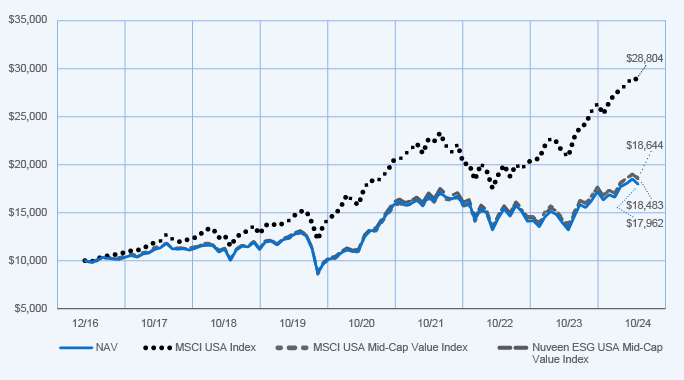
Performance Highlights • The Nuveen ESG Mid-Cap Value ETF (NUMV)’s total return at net asset value (NAV) was 36.20% for the 12 months ended October 31, 2024. The Fund’s custom index, the Nuveen ESG USA Mid-Cap Value Index, returned 36.71%. • The difference between the Fund’s total return at NAV and that of the custom index is attributable to management fees and other expenses incurred by the Fund that are not incurred by the custom index. • During the reporting period, the Fund’s custom index outperformed the Fund’s base index, the MSCI USA Mid-Value Index, which returned 35.09%. • Performance drivers between the Fund’s custom index and base index during the reporting period: • Top contributors to the custom index’s relative performance » An underweight to and stock selection within energy, led by a lack of exposure to Coterra Energy Inc. and APA Corporation. » Stock selection within real estate, led by overweights to Iron Mountain, Inc. and BXP Inc. » Stock selection in financials, led by overweights to Robinhood Markets, Inc and Regions Financial Corporation. • Top detractors from the custom index’s relative performance » Stock selection in the consumer discretionary sector, including overweights to LKQ Corporation and Vail Resorts, Inc. » An underweight to and stock selection in utilities, including a lack of exposure to Vistra Corp. and Constellation Energy Corporation. » Stock selection in health care, including overweights to Steris plc and Jazz Pharmaceuticals. |
How did the Fund perform over the period since inception?
Performance data shown represents past performance and does not predict or guarantee future results. The graph and table do not reflect the deduction of taxes that a shareholder would pay on Fund distributions or redemption of Fund Shares.
Fund Performance (December 13, 2016 through October 31, 2024) Initial Investment of $10,000
Average Annual Total Returns
| | | | | | |
| | | |
| | | 1‑Year | | 5‑Year | | Since
Inception
(12/13/16) |
| | | | |
| NAV | | 36.20% | | 7.77% | | 7.71% |
| | | | |
| MSCI USA Index | | 38.40% | | 15.27% | | 14.36% |
| | | | |
| MSCI USA Mid-Cap Value Index | | 35.09% | | 8.67% | | 8.22% |
| | | | |
| Nuveen ESG USA Mid-Cap Value Index | | 36.71% | | 8.13% | | 8.10% |
Investment return and principal value will fluctuate, and you may have a gain or loss when you sell your shares. Current performance may differ from figures shown. For most recent month-end performance, go to https://www.nuveen.com/en-us/exchange-traded-funds/prospectuses or call (800) 257-8787.
Fund Statistics (as of October 31, 2024)
| | | | |
| |
| Fund net assets | | $ | 365,080,533 | |
| |
| Total number of portfolio holdings | | | 92 | |
| |
| Portfolio turnover (%) | | | 51% | |
| |
| Total management fees paid for the year | | $ | 1,023,282 | |
What did the Fund invest in? (as of October 31, 2024)
How has the Fund changed?
| | • | | Portfolio manager update: Effective June 18, 2024, Lei Lao retired and is no longer a portfolio manager of the Fund. Additionally, effective June 18, 2024, Nazar Romanyak, CFA and Darren Tran, CFA were added as portfolio managers of the Fund. | |
For more complete information, you may review the Fund’s next prospectus, which is expected to be available by February 28, 2025 at https://www.nuveen.com/en-us/exchange-traded-funds/prospectuses or upon request at (800) 257-8787.
Changes in independent registered public accounting firm
On October 24, 2024, the Fund’s Board of Trustees appointed PricewaterhouseCoopers LLP as the independent registered public accounting firm for the Fund and dismissed KPMG LLP (“KPMG”) as the independent registered public accounting firm for the Fund subject to the completion of the October 31, 2024 fiscal year audit. KPMG was informed of their dismissal on October 24, 2024. During the Fund’s fiscal years ended October 31, 2024 and October 31, 2023, and for the subsequent interim period through December 26, 2024, there have been no disagreements with KPMG on any matter of accounting principles or practices, financial statement disclosure or auditing scope or procedures.
Availability of additional information about the Fund
You can find additional information about the Fund at https://www.nuveen.com/en-us/exchange-traded-funds/prospectuses, including its:
| | • | | prospectus • financial statements and other information • fund holdings • proxy voting information |
You can also request this information at (800) 257-8787.
| | |
67092P508_AR_1024 4015302-INV-Y-12/25 | | |
| | |
| |
Annual Shareholder Report
October 31, 2024 |
Nuveen ESG Small‑Cap ETF
NUSC/Cboe BZX Exchange, Inc.
Annual Shareholder Report
This annual shareholder report contains important information about the Nuveen ESG Small‑Cap ETF for the period of November 1, 2023 to October 31, 2024. You can find additional information at https://www.nuveen.com/en‑us/exchange‑traded‑funds/prospectuses. You can also request this information by contacting us at (800) 257‑8787.
This report describes changes to the Fund that occurred during the reporting period.
What were the Fund costs for the last year? (based on a hypothetical $10,000 investment)
| | | | |
| | |
| | | Cost of a $10,000 investment | | Costs paid as a percentage of
$10,000 investment* |
| | | |
| Nuveen ESG Small‑Cap ETF | | $36 | | 0.31% |
* Annualized for period less than one year.
How did the Fund perform last year? What affected the Fund’s performance?
|
|
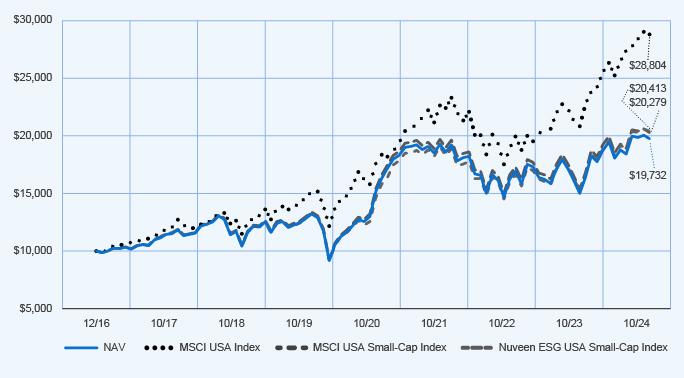
Performance Highlights • The Nuveen ESG Small‑Cap ETF (NUSC)’s total return at net asset value (NAV) was 31.69% for the 12 months ended October 31, 2024. The Fund’s custom index, the Nuveen ESG USA Small‑Cap Index, returned 32.13%. • The difference between the Fund’s total return at NAV and that of the custom index is attributable to management fees and other expenses incurred by the Fund that are not incurred by the custom index. • During the reporting period, the Fund’s custom index underperformed the Fund’s base index, the MSCI USA Small‑Cap Index, which returned 33.89%. • Performance drivers between the Fund’s custom index and base index during the reporting period: • Top contributors to the custom index’s relative performance » An underweight to and stock selection within energy, led by a lack of exposure to Range Resources Corporation and Murphy Oil Corporation. » Stock selection in financials, led by overweights to Jackson Financial Incorporation and East West Bancorp, Inc. » Stock selection in consumer staples, led by overweight positions in Freshpet Inc and US Foods Holding Corp. • Top detractors from the custom index’s relative performance » Stock selection in the industrials sector, led by overweights to Core & Main, Inc. and Plug Power Inc. » Stock selection in consumer discretionary, led by a lack of exposure to Carvana Co. and an overweight to Mattel, Inc. » Stock selection in information technology, led by a lack of exposure to MicroStrategy Incorporated and an overweight to Rambus inc. |
How did the Fund perform over the period since inception?
Performance data shown represents past performance and does not predict or guarantee future results. The graph and table do not reflect the deduction of taxes that a shareholder would pay on Fund distributions or redemption of Fund Shares.
Fund Performance (December 13, 2016 through October 31, 2024) Initial Investment of $10,000
Average Annual Total Returns
| | | | | | | | | | | | | | | |
| | | |
| | | 1‑Year | | 5‑Year | | Since
Inception
(12/13/16) |
| | | | |
| NAV | | | | 31.69 | % | | | | 9.66 | % | | | | 9.01 | % |
| | | | |
| MSCI USA Index | | | | 38.40 | % | | | | 15.27 | % | | | | 14.36 | % |
| | | | |
| MSCI USA Small‑Cap Index | | | | 33.89 | % | | | | 10.41 | % | | | | 9.48 | % |
| | | | |
| Nuveen ESG USA Small‑Cap Index | | | | 32.13 | % | | | | 9.98 | % | | | | 9.38 | % |
Investment return and principal value will fluctuate, and you may have a gain or loss when you sell your shares. Current performance may differ from figures shown. For most recent month‑end performance, go to https://www.nuveen.com/en‑us/exchange‑traded‑funds/prospectuses or call (800) 257‑8787.
Fund Statistics (as of October 31, 2024)
| | | | |
| |
| Fund net assets | | $ | 1,209,134,336 | |
| |
| Total number of portfolio holdings | | | 511 | |
| |
| Portfolio turnover (%) | | | 45% | |
| |
| Total management fees paid for the year | | $ | 3,343,361 | |
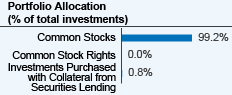
What did the Fund invest in? (as of October 31, 2024)
How has the Fund changed?
| | • | | Portfolio manager update: Effective June 18, 2024, Lei Lao retired and is no longer a portfolio manager of the Fund. Additionally, effective June 18, 2024, Nazar Romanyak, CFA and Darren Tran, CFA were added as portfolio managers of the Fund. | |
For more complete information, you may review the Fund’s next prospectus, which is expected to be available by February 28, 2025 at https://www.nuveen.com/en‑us/exchange‑traded‑funds/prospectuses or upon request at (800) 257‑8787.
Changes in independent registered public accounting firm
On October 24, 2024, the Fund’s Board of Trustees appointed PricewaterhouseCoopers LLP as the independent registered public accounting firm for the Fund and dismissed KPMG LLP (“KPMG”) as the independent registered public accounting firm for the Fund subject to the completion of the October 31, 2024 fiscal year audit. KPMG was informed of their dismissal on October 24, 2024. During the Fund’s fiscal years ended October 31, 2024 and October 31, 2023, and for the subsequent interim period through December 26, 2024, there have been no disagreements with KPMG on any matter of accounting principles or practices, financial statement disclosure or auditing scope or procedures.
Availability of additional information about the Fund
You can find additional information about the Fund at https://www.nuveen.com/en‑us/exchange‑traded‑funds/prospectuses, including its:
| | • | | prospectus • financial statements and other information • fund holdings • proxy voting information |
You can also request this information at (800) 257‑8787.
| | |
67092P607_AR_1024 4015301‑INV‑Y‑12/25 | | |
| | |
| | Annual Shareholder Report October 31, 2024 |
Nuveen Dividend Growth ETF
NDVG/NYSE Arca
Annual Shareholder Report
This annual shareholder report contains important information about the Nuveen Dividend Growth ETF for the period of November 1, 2023 to October 31, 2024. You can find additional information at https://www.nuveen.com/en‑us/exchange‑traded‑funds/prospectuses. You can also request this information by contacting us at (800) 257‑8787.
This report describes changes to the Fund that occurred during the reporting period.
What were the Fund costs for the last year? (based on a hypothetical $10,000 investment)
| | | | |
| | |
| | | Cost of a $10,000 investment | | Costs paid as a percentage of
$10,000 investment* |
| | | |
| Nuveen Dividend Growth ETF | | $75 | | 0.65% |
* Annualized for period less than one year.
How did the Fund perform last year? What affected the Fund’s performance?
|
|
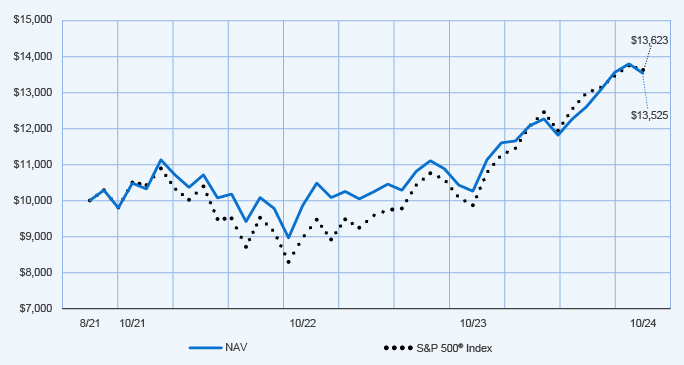
Performance Highlights • The Nuveen Dividend Growth ETF returned 31.80% for Common Shares at net asset value (NAV) for the 12 months ended October 31, 2024. The Fund significantly underperformed the S&P 500 Index, which returned 38.02%. • Top contributors to relative performance » An overweight to Broadcom Inc. » An overweight to American Express Company. • Top detractors from relative performance » Security selection in the information technology sector, including a lack of exposure to NVIDIA Corporation. » Security selection and an underweight to the communication services sector, including a lack of exposure to Meta Platforms Inc. and an overweight to Comcast Corporation. » An overweight to Elevance Health Inc. |
How did the Fund perform over the period since inception?
Performance data shown represents past performance and does not predict or guarantee future results. The graph and table do not reflect the deduction of taxes that a shareholder would pay on Fund distributions or redemption of Fund Shares.
Fund Performance (August 4, 2021 through October 31, 2024) Initial Investment of $10,000
Average Annual Total Returns
| | | | |
| | |
| | | 1‑Year | | Since
Inception
(8/4/21) |
| | | |
| NAV | | 31.80% | | 9.76% |
| | | |
S&P 500® Index | | 38.02% | | 10.01% |
Investment return and principal value will fluctuate, and you may have a gain or loss when you sell your shares. Current performance may differ from figures shown. For most recent month‑end performance, go to https://www.nuveen.com/en‑us/exchange‑traded‑funds/prospectuses or call (800) 257‑8787.
Fund Statistics (as of October 31, 2024)
| | | | |
| |
| Fund net assets | | $ | 11,341,709 | |
| |
| Total number of portfolio holdings | | | 42 | |
| |
| Portfolio turnover (%) | | | 10% | |
| |
| Total management fees paid for the year | | $ | 73,500 | |
What did the Fund invest in? (as of October 31, 2024)
How has the Fund changed?
For more complete information, you may review the Fund’s next prospectus, which is expected to be available by February 28, 2025 at https://www.nuveen.com/en‑us/exchange‑traded‑funds/prospectuses or upon request at (800) 257‑8787.
Changes in independent registered public accounting firm
On October 24, 2024, the Fund’s Board of Trustees appointed PricewaterhouseCoopers LLP as the independent registered public accounting firm for the Fund and dismissed KPMG LLP (“KPMG”) as the independent registered public accounting firm for the Fund subject to the completion of the October 31, 2024 fiscal year audit. KPMG was informed of their dismissal on October 24, 2024. During the Fund’s fiscal years ended October 31, 2024 and October 31, 2023, and for the subsequent interim period through December 26, 2024, there have been no disagreements with KPMG on any matter of accounting principles or practices, financial statement disclosure or auditing scope or procedures.
Availability of additional information about the Fund
You can find additional information about the Fund at https://www.nuveen.com/en‑us/exchange‑traded‑funds/prospectuses, including its:
| | • | | prospectus • financial statements and other information • fund holdings • proxy voting information |
You can also request this information at (800) 257‑8787.
| | |
67092P821_AR_1024 4015300‑INV‑Y‑12/25 | | |
| | |
| |
Annual Shareholder Report
October 31, 2024 |
Nuveen Growth Opportunities ETF
NUGO/NYSE Arca
Annual Shareholder Report
This annual shareholder report contains important information about the Nuveen Growth Opportunities ETF for the period of November 1, 2023 to October 31, 2024. You can find additional information at https://www.nuveen.com/en‑us/exchange‑traded‑funds/prospectuses. You can also request this information by contacting us at (800) 257‑8787.
This report describes changes to the Fund that occurred during the reporting period.
What were the Fund costs for the last year? (based on a hypothetical $10,000 investment)
| | | | |
| | |
| | | Cost of a $10,000 investment | | Costs paid as a percentage of $10,000 investment* |
| | | |
| Nuveen Growth Opportunities ETF | | $69 | | 0.56% |
* Annualized for period less than one year.
How did the Fund perform last year? What affected the Fund’s performance?
|
|
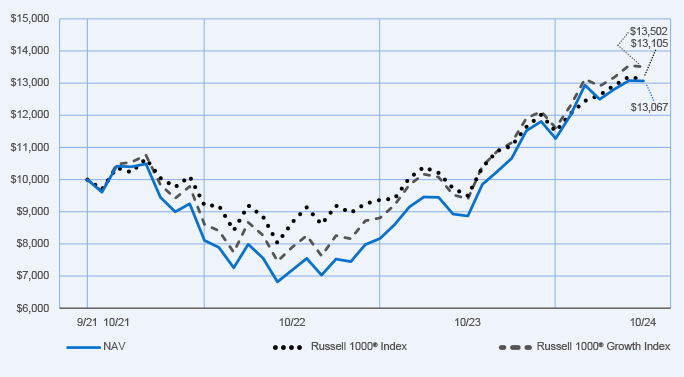
Performance Highlights • The Nuveen Growth Opportunities ETF returned 47.47% for Common Shares at net asset value (NAV) for the 12 months ended October 31, 2024. The Fund outperformed the Russell 1000 Growth Index, which returned 43.77%. • Top contributors to relative performance » Security selection and an overweight in the information technology sector, led by overweights to NVIDIA Corporation and Broadcom Inc. » Security selection in the communication services sector, led by an overweight to Meta Platforms Inc. » Security selection in the consumer staples sector, led by an overweight to Costco Wholesale Corporation. • Top detractors from relative performance » An overweight to DexCom Inc. » Security selection in the energy sector, including an out‑of‑benchmark position in EOG Resources, Inc. |
How did the Fund perform over the period since inception?
Performance data shown represents past performance and does not predict or guarantee future results. The graph and table do not reflect the deduction of taxes that a shareholder would pay on Fund distributions or redemption of Fund Shares.
Fund Performance (September 27, 2021 through October 31, 2024) Initial Investment of $10,000
Average Annual Total Returns
| | | | | | | | |
| | |
| | | 1‑Year | | | Since
Inception
(9/27/21) | |
| | | |
| NAV | | | 47.47 | % | | | 9.03 | % |
| | | |
Russell 1000® Index | | | 38.07 | % | | | 9.14 | % |
| | | |
Russell 1000® Growth Index | | | 43.77 | % | | | 10.19 | % |
Investment return and principal value will fluctuate, and you may have a gain or loss when you sell your shares. Current performance may differ from figures shown. For most recent month‑end performance, go to https://www.nuveen.com/en‑us/exchange‑traded‑funds/prospectuses or call (800) 257‑8787.
Fund Statistics (as of October 31, 2024)
| | | | |
| |
| Fund net assets | | $ | 2,750,826,793 | |
| |
| Total number of portfolio holdings | | | 41 | |
| |
| Portfolio turnover (%) | | | 22% | |
| |
| Total management fees paid for the year | | $ | 15,676,478 | |
What did the Fund invest in? (as of October 31, 2024)
How has the Fund changed?
For more complete information, you may review the Fund’s next prospectus, which is expected to be available by February 28, 2025 at https://www.nuveen.com/en‑us/exchange‑traded‑funds/prospectuses or upon request at (800) 257‑8787.
Changes in independent registered public accounting firm
On October 24, 2024, the Fund’s Board of Trustees appointed PricewaterhouseCoopers LLP as the independent registered public accounting firm for the Fund and dismissed KPMG LLP (“KPMG”) as the independent registered public accounting firm for the Fund subject to the completion of the October 31, 2024 fiscal year audit. KPMG was informed of their dismissal on October 24, 2024. During the Fund’s fiscal years ended October 31, 2024 and October 31, 2023, and for the subsequent interim period through December 26, 2024, there have been no disagreements with KPMG on any matter of accounting principles or practices, financial statement disclosure or auditing scope or procedures.
Availability of additional information about the Fund
You can find additional information about the Fund at https://www.nuveen.com/en‑us/exchange‑traded‑funds/prospectuses, including its:
| | • | | prospectus • financial statements and other information • fund holdings • proxy voting information |
You can also request this information at (800) 257‑8787.
| | |
67092P797_AR_1024 4015299‑INV‑Y‑12/25 | | |
| | |
| |
Annual Shareholder Report
October 31, 2024 |
Nuveen Small Cap Select ETF
NSCS/NYSE Arca
Annual Shareholder Report
This annual shareholder report contains important information about the Nuveen Small Cap Select ETF for the period of November 1, 2023 to October 31, 2024. You can find additional information at https://www.nuveen.com/en‑us/exchange‑traded‑funds/prospectuses. You can also request this information by contacting us at (800) 257‑8787.
This report describes changes to the Fund that occurred during the reporting period.
What were the Fund costs for the last year? (based on a hypothetical $10,000 investment)
| | | | |
| | |
| | | Cost of a $10,000 investment | | Costs paid as a percentage of
$10,000 investment* |
| | | |
| Nuveen Small Cap Select ETF | | $100 | | 0.86% |
* Annualized for period less than one year.
How did the Fund perform last year? What affected the Fund’s performance?
|
|
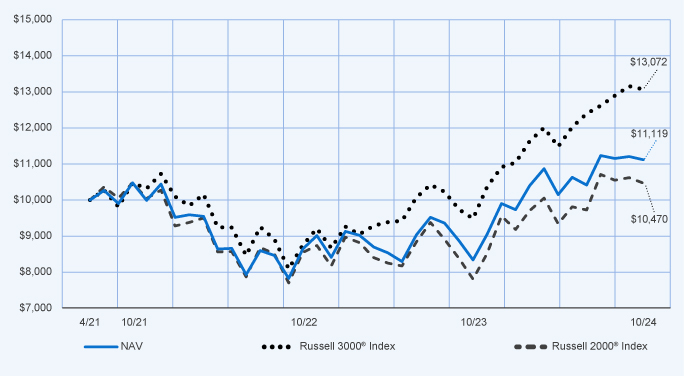
Performance Highlights • The Nuveen Small Cap Select ETF returned 33.38% for Common Shares at net asset value (NAV) for the 12 months ended October 31, 2024. The Fund underperformed the Russell 2000 Index, which returned 34.07%. • Top contributors to relative performance » Security selection in the information technology sector, led by overweights to Q2 Holdings, Inc., Semtech Corporation and Commvault Systems, Inc. » Security selection in the financials sector, led by an out‑of‑benchmark position in Evercore Inc. and an overweight to Piper Sandler Companies. » Security selection in the industrials sector, led by overweights to Atmus Filtration Technologies, Inc. and SPX Technologies, Inc. • Top detractors from relative performance » Security selection in the consumer discretionary sector, including overweights to Dana Incorporated, Arhaus, Inc. and Topgolf Callaway Brands Corp. » An overweight to Array Technologies Inc. in the industrials sector. » Security selection in the health care sector, including overweights to AtriCure, Inc., Option Care Health Inc. and SI‑BONE, Inc. |
How did the Fund perform over the period since inception?
Performance data shown represents past performance and does not predict or guarantee future results. The graph and table do not reflect the deduction of taxes that a shareholder would pay on Fund distributions or redemption of Fund Shares.
Fund Performance (August 4, 2021 through October 31, 2024) Initial Investment of $10,000
Average Annual Total Returns
| | | | | | |
| | |
| | | 1‑Year | | | Since
Inception
(8/4/21) |
| | | |
| NAV | | | 33.38 | % | | 3.33% |
| | | |
Russell 3000® Index | | | 37.86 | % | | 8.62% |
| | | |
Russell 2000® Index | | | 34.07 | % | | 1.43% |
Investment return and principal value will fluctuate, and you may have a gain or loss when you sell your shares. Current performance may differ from figures shown. For most recent month‑end performance, go to https://www.nuveen.com/en‑us/exchange‑traded‑funds/prospectuses or call (800) 257‑8787.
Fund Statistics (as of October 31, 2024)
| | | | |
| |
| Fund net assets | | $ | 7,460,445 | |
| |
| Total number of portfolio holdings | | | 87 | |
| |
| Portfolio turnover (%) | | | 49% | |
| |
| Total management fees paid for the year | | $ | 57,305 | |
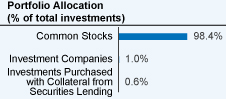
What did the Fund invest in? (as of October 31, 2024)
How has the Fund changed?
For more complete information, you may review the Fund’s next prospectus, which is expected to be available by February 28, 2025 at https://www.nuveen.com/en‑us/exchange‑traded‑funds/prospectuses or upon request at (800) 257‑8787.
Changes in independent registered public accounting firm
On October 24, 2024, the Fund’s Board of Trustees appointed PricewaterhouseCoopers LLP as the independent registered public accounting firm for the Fund and dismissed KPMG LLP (“KPMG”) as the independent registered public accounting firm for the Fund subject to the completion of the October 31, 2024 fiscal year audit. KPMG was informed of their dismissal on October 24, 2024. During the Fund’s fiscal years ended October 31, 2024 and October 31, 2023, and for the subsequent interim period through December 26, 2024, there have been no disagreements with KPMG on any matter of accounting principles or practices, financial statement disclosure or auditing scope or procedures.
Availability of additional information about the Fund
You can find additional information about the Fund at https://www.nuveen.com/en‑us/exchange‑traded‑funds/prospectuses, including its:
| | • | | prospectus • financial statements and other information • fund holdings • proxy voting information |
You can also request this information at (800) 257‑8787.
| | |
67092P839_AR_1024 4015298‑INV‑Y‑12/25 | | |
| | |
| |
Annual Shareholder Report
October 31, 2024 |
Nuveen Winslow Large-Cap Growth ESG ETF
NWLG/NYSE Arca
Annual Shareholder Report
This annual shareholder report contains important information about the Nuveen Winslow Large-Cap Growth ESG ETF for the period of November 1, 2023 to October 31, 2024. You can find additional information at https://www.nuveen.com/en-us/exchange-traded-funds/prospectuses. You can also request this information by contacting us at (800) 257-8787.
This report describes changes to the Fund that occurred during the reporting period.
What were the Fund costs for the last year? (based on a hypothetical $10,000 investment)
| | | | |
| | |
| | | Cost of a $10,000 investment | | Costs paid as a percentage of
$10,000 investment* |
| | | |
| Nuveen Winslow Large-Cap Growth ESG ETF | | $80 | | 0.65% |
* Annualized for period less than one year.
How did the Fund perform last year? What affected the Fund’s performance?
|
|
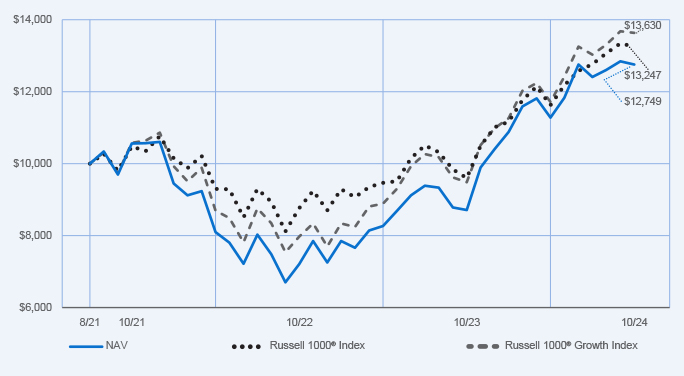
Performance Highlights • The Nuveen Winslow Large-Cap Growth ESG ETF returned 46.37% for Common Shares at net asset value (NAV) for the 12 months ended October 31, 2024. The Fund outperformed the Russell 1000 Growth Index, which returned 43.77%. • Top contributors to relative performance » Security selection in the consumer discretionary sector, led by an overweight to MercadoLibre, Inc. and a lack of exposure to Tesla, Inc. » Security selection in the health care sector, led by an overweight to Intuitive Surgical, Inc. » Security selection in the industrials sector, led by an overweight to Trane Technologies plc. • Top detractors from relative performance » Underweight and stock selection in the communication services sector, including a lack of exposure to Meta Platforms Inc and an underweight to Netflix, Inc. » Stock selection in the information technology sector, including an out-of-benchmark position in ASML Holding NV and an overweight to Workday, Inc. |
How did the Fund perform over the period since inception?
Performance data shown represents past performance and does not predict or guarantee future results. The graph and table do not reflect the deduction of taxes that a shareholder would pay on Fund distributions or redemption of Fund Shares.
Fund Performance (August 4, 2021 through October 31, 2024) Initial Investment of $10,000
Average Annual Total Returns
| | | | |
| | |
| | | 1‑Year | | Since
Inception
(8/04/21) |
| | | |
| NAV | | 46.37% | | 7.78% |
| | | |
Russell 1000® Index | | 38.07% | | 9.06% |
| | | |
Russell 1000® Growth Index | | 43.77% | | 10.03% |
Investment return and principal value will fluctuate, and you may have a gain or loss when you sell your shares. Current performance may differ from figures shown. For most recent month-end performance, go to https://www.nuveen.com/en-us/exchange-traded-funds/prospectuses or call (800) 257-8787.
Fund Statistics (as of October 31, 2024)
| | | | |
| |
| Fund net assets | | $ | 9,241,915 | |
| |
| Total number of portfolio holdings | | | 41 | |
| |
| Portfolio turnover (%) | | | 57% | |
| |
| Total management fees paid for the year | | $ | 49,004 | |
What did the Fund invest in? (as of October 31, 2024)
How has the Fund changed?
| | • | | Portfolio Manager Updates: Effective June 18, 2024, Calvin Bohman was added as a portfolio manager of the Fund. Effective September 30, 2024, Stephan Petersen retired from Winslow Capital Management and is no longer a portfolio manager of the Fund. | |
For more complete information, you may review the Fund’s next prospectus, which is expected to be available by February 28, 2025 at https://www.nuveen.com/en-us/exchange-traded-funds/prospectuses or upon request at (800) 257-8787.
Changes in independent registered public accounting firm
On October 24, 2024, the Fund’s Board of Trustees appointed PricewaterhouseCoopers LLP as the independent registered public accounting firm for the Fund and dismissed KPMG LLP (“KPMG”) as the independent registered public accounting firm for the Fund subject to the completion of the October 31, 2024 fiscal year audit. KPMG was informed of their dismissal on October 24, 2024. During the Fund’s fiscal years ended October 31, 2024 and October 31, 2023, and for the subsequent interim period through December 26, 2024, there have been no disagreements with KPMG on any matter of accounting principles or practices, financial statement disclosure or auditing scope or procedures.
Availability of additional information about the Fund
You can find additional information about the Fund at https://www.nuveen.com/en-us/exchange-traded-funds/prospectuses, including its:
| | • | | prospectus • financial statements and other information • fund holdings • proxy voting information |
You can also request this information at (800) 257-8787.
| | |
67092P847_AR_1024 4015284-INV-Y-12/25 | | |
As of the end of the period covered by this report, the registrant has adopted a code of ethics that applies to the registrant’s principal executive officer, principal financial officer, principal accounting officer or controller, or persons performing similar functions. There were no amendments to or waivers from the code during the period covered by this report. Upon request, a copy of the registrant’s code of ethics is available without charge by calling 800-257-8787.
| Item 3. | Audit Committee Financial Expert. |
As of the end of the period covered by this report, the registrant’s Board of Directors or Trustees (“Board”) had determined that the registrant has at least one “audit committee financial expert” (as defined in Item 3 of Form N-CSR) serving on its Audit Committee. The members of the registrant’s audit committee that have been designated as audit committee financial experts are Joseph A. Boateng, Albin F. Moschner, John K. Nelson, Loren M. Starr and Robert L. Young, who are “independent” for purposes of Item 3 of Form N-CSR.
Mr. Boateng has served as the Chief Investment Officer for Casey Family Programs since 2007. He was previously Director of U.S. Pension Plans for Johnson & Johnson from 2002-2006. Mr. Boateng is a board member of the Lumina Foundation and Waterside School, an emeritus board member of Year Up Puget Sound, member of the Investment Advisory Committee and former Chair for the Seattle City Employees’ Retirement System, and an Investment Committee Member for The Seattle Foundation. Mr. Boateng previously served on the Board of Trustees for the College Retirement Equities Fund (2018-2023) and on the Management Committee for TIAA Separate Account VA-1 (2019-2023).
Mr. Moschner is a consultant in the wireless industry and, in July 2012, founded Northcroft Partners, LLC, a management consulting firm that provides operational, management and governance solutions. Prior to founding Northcroft Partners, LLC, Mr. Moschner held various positions at Leap Wireless International, Inc., a provider of wireless services, where he was as a consultant from February 2011 to July 2012, Chief Operating Officer from July 2008 to February 2011, and Chief Marketing Officer from August 2004 to June 2008. Before he joined Leap Wireless International, Inc., Mr. Moschner was President of the Verizon Card Services division of Verizon Communications, Inc. from 2000 to 2003, and President of One Point Services at One Point Communications from 1999 to 2000. Mr. Moschner also served at Zenith Electronics Corporation as Director, President and Chief Executive Officer from 1995 to 1996, and as Director, President and Chief Operating Officer from 1994 to 1995.
Mr. Nelson formerly served on the Board of Directors of Core12, LLC from 2008 to 2023, a private firm which develops branding, marketing, and communications strategies for clients. Mr. Nelson has extensive experience in global banking and markets, having served in several senior executive positions with ABN AMRO Holdings N.V. and its affiliated entities and predecessors, including LaSalle Bank Corporation from 1996 to 2008, ultimately serving as Chief Executive Officer of ABN AMRO N.V. North America. During his tenure at the bank, he also served as Global Head of its Financial Markets Division, which encompassed the bank’s Currency, Commodity, Fixed Income, Emerging Markets, and Derivatives businesses. He was a member of the Foreign Exchange Committee of the Federal Reserve Bank of the United States and during his tenure with ABN AMRO served as the bank’s representative on various committees of The Bank of Canada, European Central Bank, and The Bank of England. Mr. Nelson previously served as a senior, external advisor to the financial services practice of Deloitte Consulting LLP. (2012-2014).
Mr. Starr was Vice Chair, Senior Managing Director from 2020 to 2021, and Chief Financial Officer, Senior Managing Director from 2005 to 2020, for Invesco Ltd. Mr. Starr is also a Director and member of the Audit Committee for AMG. He is former Chair and member of the Board of Directors, Georgia Leadership Institute for School Improvement (GLISI); former Chair and member of the Board of Trustees, Georgia Council on Economic Education (GCEE). Mr. Starr previously served on the Board of Trustees for the College Retirement Equities Fund and on the Management Committee for TIAA Separate Account VA-1 (2022-2023).
Mr. Young has more than 30 years of experience in the investment management industry. From 1997 to 2017, he held various positions with J.P. Morgan Investment Management Inc. (“J.P. Morgan Investment”) and its affiliates (collectively, “J.P. Morgan”). Most recently, he served as Chief Operating Officer and Director of J.P. Morgan Investment (from 2010 to 2016) and as President and Principal Executive Officer of the J.P. Morgan Funds (from 2013 to 2016). As Chief Operating Officer of J.P. Morgan Investment, Mr. Young led service, administration and business platform support activities for J.P. Morgan’s domestic retail mutual fund and institutional commingled and separate account businesses and co-led these activities for J.P. Morgan’s global retail and institutional
investment management businesses. As President of the J.P. Morgan Funds, Mr. Young interacted with various service providers to these funds, facilitated the relationship between such funds and their boards, and was directly involved in establishing board agendas, addressing regulatory matters, and establishing policies and procedures. Before joining J.P. Morgan, Mr. Young, a former Certified Public Accountant (CPA), was a Senior Manager (Audit) with Deloitte & Touche LLP (formerly, Touche Ross LLP), where he was employed from 1985 to 1996. During his tenure there, he actively participated in creating, and ultimately led, the firm’s midwestern mutual fund practice.
| Item 4. | Principal Accountant Fees and Services. |
The following tables show the amount of fees that KPMG LLP, the Funds’ auditor, billed to the Funds during the Funds’ last two full fiscal years. The Audit Committee approved in advance all audit services and non-audit services that KPMG LLP provided to the Funds, except for those non-audit services that were subject to the pre-approval exception under Rule 2-01 of Regulation S-X (the “pre-approval exception”). The pre-approval exception for services provided directly to the Funds waives the pre-approval requirement for services other than audit, review or attest services if: (A) the aggregate amount of all such services provided constitutes no more than 5% of the total amount of revenues paid by the Funds during the fiscal year in which the services are provided; (B) the Funds did not recognize the services as non-audit services at the time of the engagement; and (C) the services are promptly brought to the Audit Committee’s attention, and the Committee (or its delegate) approves the services before the audit is completed.
The Audit Committee has delegated certain pre-approval responsibilities to its Chair (or, in his absence, any other member of the Audit Committee).
| | | | | | | | | | | | | | | | |
| Fiscal Year Ended October 31, 2024 | | Audit Fees Billed to Funds1 | | | Audit-Related Fees Billed to Funds2 | | | Tax Fees Billed to Funds3 | | | All Other Fees Billed to Funds4 | |
| Nuveen ESG International Developed Markets Equity ETF | | | $22,800 | | | | $0 | | | | $0 | | | | $0 | |
| | | | | | | | | | | | | | | | |
| Nuveen ESG Dividend ETF | | | $17,100 | | | | $0 | | | | $0 | | | | $0 | |
| | | | | | | | | | | | | | | | |
| Nuveen ESG Emerging Markets Equity ETF | | | $22,800 | | | | $0 | | | | $0 | | | | $0 | |
| | | | | | | | | | | | | | | | |
| Nuveen ESG Large-Cap ETF | | | $17,100 | | | | $0 | | | | $0 | | | | $0 | |
| | | | | | | | | | | | | | | | |
| Nuveen ESG Large-Cap Growth ETF | | | $17,100 | | | | $0 | | | | $0 | | | | $0 | |
| | | | | | | | | | | | | | | | |
| Nuveen ESG Large-Cap Value ETF | | | $17,100 | | | | $0 | | | | $0 | | | | $0 | |
| | | | | | | | | | | | | | | | |
| Nuveen ESG Mid-Cap Growth ETF | | | $17,100 | | | | $0 | | | | $0 | | | | $0 | |
| | | | | | | | | | | | | | | | |
| Nuveen ESG Mid-Cap Value ETF | | | $17,100 | | | | $0 | | | | $0 | | | | $0 | |
| | | | | | | | | | | | | | | | |
| Nuveen ESG Small-Cap ETF | | | $17,100 | | | | $0 | | | | $0 | | | | $0 | |
| | | | | | | | | | | | | | | | |
| Nuveen Dividend Growth ETF | | | $17,100 | | | | $0 | | | | $0 | | | | $0 | |
| | | | | | | | | | | | | | | | |
| Nuveen Small Cap Select ETF | | | $17,100 | | | | $0 | | | | $0 | | | | $0 | |
| | | | | | | | | | | | | | | | |
| Nuveen Growth Opportunities ETF | | | $20,000 | | | | $0 | | | | $0 | | | | $0 | |
| | | | | | | | | | | | | | | | |
| Nuveen Winslow Large-Cap Growth ESG ETF | | | $17,100 | | | | $0 | | | | $0 | | | | $0 | |
| | | | | | | | | | | | | | | | |
| | | | |
Total | | | $236,600 | | | | $0 | | | | $0 | | | | $0 | |
| 1 | | “Audit Fees” are the aggregate fees billed for professional services for the audit of the Fund’s annual financial statements and services provided in connection with statutory and regulatory filings or engagements. |
| 2 | | “Audit-Related Fees” are the aggregate fees billed for assurance and related services reasonably related to the performance of the audit or review of financial statements that are not reported under “Audit Fees”. These fees include offerings related to the Fund’s common shares and leverage. |
| 3 | | “Tax Fees” are the aggregate fees billed for professional services for tax advice, tax compliance, and tax planning. These fees include: all global withholding tax services; excise and state tax reviews; capital gain, tax equalization and taxable basis calculations performed by the principal accountant. |
| 4 | | “All Other Fees” are the aggregate fees billed for products and services other than “Audit Fees”, “Audit-Related Fees” and “Tax Fees”. These fees represent all “Agreed-Upon Procedures” engagements pertaining to the Fund’s use of leverage. |
| | | | | | | | | | | | | | | | |
| | | Percentage Approved Pursuant to Pre-approval Exception | |
| Fiscal Year Ended October 31, 2024 | | Audit Fees Billed to Funds | | | Audit-Related Fees Billed to Funds | | | Tax Fees Billed to Funds | | | All Other Fees Billed to Funds | |
| Nuveen ESG International Developed Markets Equity ETF | | | 0% | | | | 0% | | | | 0% | | | | 0% | |
| | | | | | | | | | | | | | | | |
| Nuveen ESG Dividend ETF | | | 0% | | | | 0% | | | | 0% | | | | 0% | |
| | | | | | | | | | | | | | | | |
| Nuveen ESG Emerging Markets Equity ETF | | | 0% | | | | 0% | | | | 0% | | | | 0% | |
| | | | | | | | | | | | | | | | |
| Nuveen ESG Large-Cap ETF | | | 0% | | | | 0% | | | | 0% | | | | 0% | |
| | | | | | | | | | | | | | | | |
| Nuveen ESG Large-Cap Growth ETF | | | 0% | | | | 0% | | | | 0% | | | | 0% | |
| | | | | | | | | | | | | | | | |
| Nuveen ESG Large-Cap Value ETF | | | 0% | | | | 0% | | | | 0% | | | | 0% | |
| | | | | | | | | | | | | | | | |
| Nuveen ESG Mid-Cap Growth ETF | | | 0% | | | | 0% | | | | 0% | | | | 0% | |
| | | | | | | | | | | | | | | | |
| Nuveen ESG Mid-Cap Value ETF | | | 0% | | | | 0% | | | | 0% | | | | 0% | |
| | | | | | | | | | | | | | | | |
| Nuveen ESG Small-Cap ETF | | | 0% | | | | 0% | | | | 0% | | | | 0% | |
| | | | | | | | | | | | | | | | |
| Nuveen Dividend Growth ETF | | | 0% | | | | 0% | | | | 0% | | | | 0% | |
| | | | | | | | | | | | | | | | |
| Nuveen Small Cap Select ETF | | | 0% | | | | 0% | | | | 0% | | | | 0% | |
| | | | | | | | | | | | | | | | |
| Nuveen Growth Opportunities ETF | | | 0% | | | | 0% | | | | 0% | | | | 0% | |
| | | | | | | | | | | | | | | | |
| Nuveen Winslow Large-Cap Growth ESG ETF | | | 0% | | | | 0% | | | | 0% | | | | 0% | |
| | | | |
| Fiscal Year Ended October 31, 2023 | | Audit Fees Billed to Funds1 | | | Audit-Related Fees Billed to Funds2 | | | Tax Fees Billed to Funds3 | | | All Other Fees Billed to Funds4 | |
| Nuveen ESG International Developed Markets Equity ETF | | | $24,000 | | | | $0 | | | | $0 | | | | $0 | |
| | | | | | | | | | | | | | | | |
| Nuveen ESG Dividend ETF | | | $18,000 | | | | $0 | | | | $0 | | | | $0 | |
| | | | | | | | | | | | | | | | |
| Nuveen ESG Emerging Markets Equity ETF | | | $24,000 | | | | $0 | | | | $0 | | | | $0 | |
| | | | | | | | | | | | | | | | |
| Nuveen ESG Large-Cap ETF | | | $18,000 | | | | $0 | | | | $0 | | | | $0 | |
| | | | | | | | | | | | | | | | |
| Nuveen ESG Large-Cap Growth ETF | | | $18,000 | | | | $0 | | | | $0 | | | | $0 | |
| | | | | | | | | | | | | | | | |
| Nuveen ESG Large-Cap Value ETF | | | $18,000 | | | | $0 | | | | $0 | | | | $0 | |
| | | | | | | | | | | | | | | | |
| Nuveen ESG Mid-Cap Growth ETF | | | $18,000 | | | | $0 | | | | $0 | | | | $0 | |
| | | | | | | | | | | | | | | | |
| Nuveen ESG Mid-Cap Value ETF | | | $18,000 | | | | $0 | | | | $0 | | | | $0 | |
| | | | | | | | | | | | | | | | |
| Nuveen ESG Small-Cap ETF | | | $18,000 | | | | $0 | | | | $0 | | | | $0 | |
| | | | | | | | | | | | | | | | |
| Nuveen Dividend Growth ETF | | | $18,000 | | | | $0 | | | | $0 | | | | $0 | |
| | | | | | | | | | | | | | | | |
| Nuveen Small Cap Select ETF | | | $18,000 | | | | $0 | | | | $0 | | | | $0 | |
| | | | | | | | | | | | | | | | |
| Nuveen Growth Opportunities ETF | | | $21,000 | | | | $0 | | | | $0 | | | | $0 | |
| | | | | | | | | | | | | | | | |
| Nuveen Winslow Large-Cap Growth ESG ETF | | | $18,000 | | | | $0 | | | | $0 | | | | $0 | |
| | | | | | | | | | | | | | | | |
| | | | |
| Fiscal Year Ended October 31, 2023 | | Audit Fees Billed to Funds1 | | | Audit-Related Fees Billed to Funds2 | | | Tax Fees Billed to Funds3 | | | All Other Fees Billed to Funds4 | |
Total | | | $249,000 | | | | $0 | | | | $0 | | | | $0 | |
| 1 | | “Audit Fees” are the aggregate fees billed for professional services for the audit of the Fund’s annual financial statements and services provided in connection with statutory and regulatory filings or engagements. |
| 2 | | “Audit-Related Fees” are the aggregate fees billed for assurance and related services reasonably related to the performance of the audit or review of financial statements that are not reported under “Audit Fees”. These fees include offerings related to the Fund’s common shares and leverage. |
| 3 | | “Tax Fees” are the aggregate fees billed for professional services for tax advice, tax compliance, and tax planning. These fees include: all global withholding tax services; excise and state tax reviews; capital gain, tax equalization and taxable basis calculations performed by the principal accountant. |
| 4 | | “All Other Fees” are the aggregate fees billed for products and services other than “Audit Fees”, “Audit-Related Fees” and “Tax Fees”. These fees represent all “Agreed-Upon Procedures” engagements pertaining to the Fund’s use of leverage. |
| | | | | | | | | | | | | | | | |
| | | Percentage Approved Pursuant to Pre-approval Exception | |
| Fiscal Year Ended October 31, 2023 | | Audit Fees Billed to Funds | | | Audit-Related Fees Billed to Funds | | | Tax Fees Billed to Funds | | | All Other Fees Billed to Funds | |
| Nuveen ESG International Developed Markets Equity ETF | | | 0% | | | | 0% | | | | 0% | | | | 0% | |
| | | | | | | | | | | | | | | | |
| Nuveen ESG Dividend ETF | | | 0% | | | | 0% | | | | 0% | | | | 0% | |
| | | | | | | | | | | | | | | | |
| Nuveen ESG Emerging Markets Equity ETF | | | 0% | | | | 0% | | | | 0% | | | | 0% | |
| | | | | | | | | | | | | | | | |
| Nuveen ESG Large-Cap ETF | | | 0% | | | | 0% | | | | 0% | | | | 0% | |
| | | | | | | | | | | | | | | | |
| Nuveen ESG Large-Cap Growth ETF | | | 0% | | | | 0% | | | | 0% | | | | 0% | |
| | | | | | | | | | | | | | | | |
| Nuveen ESG Large-Cap Value ETF | | | 0% | | | | 0% | | | | 0% | | | | 0% | |
| | | | | | | | | | | | | | | | |
| Nuveen ESG Mid-Cap Growth ETF | | | 0% | | | | 0% | | | | 0% | | | | 0% | |
| | | | | | | | | | | | | | | | |
| Nuveen ESG Mid-Cap Value ETF | | | 0% | | | | 0% | | | | 0% | | | | 0% | |
| | | | | | | | | | | | | | | | |
| Nuveen ESG Small-Cap ETF | | | 0% | | | | 0% | | | | 0% | | | | 0% | |
| | | | | | | | | | | | | | | | |
| Nuveen Dividend Growth ETF | | | 0% | | | | 0% | | | | 0% | | | | 0% | |
| | | | | | | | | | | | | | | | |
| Nuveen Small Cap Select ETF | | | 0% | | | | 0% | | | | 0% | | | | 0% | |
| | | | | | | | | | | | | | | | |
| Nuveen Growth Opportunities ETF | | | 0% | | | | 0% | | | | 0% | | | | 0% | |
| | | | | | | | | | | | | | | | |
| Nuveen Winslow Large-Cap Growth ESG ETF | | | 0% | | | | 0% | | | | 0% | | | | 0% | |
| | | | | | | | | | | | |
| Fiscal Year Ended October 31, 2024 | | Audit-Related Fees Billed to Adviser and Affiliated Fund
Service Providers | | | Tax Fees Billed to Adviser and Affiliated Fund
Service Providers | | | All Other Fees Billed to Adviser and Affiliated Fund
Service Providers | |
Nushares ETF Trust | | | $0 | | | | $0 | | | | $0 | |
| |
| | | Percentage Approved Pursuant to Pre-approval Exception | |
| | | Audit-Related Fees Billed to Adviser and Affiliated Fund
Service Providers | | | Tax Fees Billed to Adviser and Affiliated Fund
Service Providers | | | All Other Fees Billed to Adviser and Affiliated Fund
Service Providers | |
| | | 0% | | | | 0% | | | | 0% | |
| | | | | | | | | | | | |
| Fiscal Year Ended October 31, 2023 | | Audit-Related Fees Billed to Adviser and Affiliated Fund
Service Providers | | | Tax Fees Billed to Adviser and Affiliated Fund
Service Providers | | | All Other Fees Billed to Adviser and Affiliated Fund
Service Providers | |
Nushares ETF Trust | | | $0 | | | | $0 | | | | $0 | |
| |
| | | Percentage Approved Pursuant to Pre-approval Exception | |
| | | Audit-Related Fees Billed to Adviser and Affiliated Fund
Service Providers | | | Tax Fees Billed to Adviser and Affiliated Fund
Service Providers | | | All Other Fees Billed to Adviser and Affiliated Fund
Service Providers | |
| | | 0% | | | | 0% | | | | 0% | |
| | | | | | | | | | | | | | | | |
| Fiscal Year Ended October 31, 2024 | | Total Non-Audit Fees
Billed to Fund | | | Total Non-Audit Fees
Billed to Adviser and
Affiliated Fund Service
Providers (engagements
related directly to the
operations and financial
reporting of the Trust) | | | Total Non-Audit Fees
Billed to Adviser and
Affiliated Fund Service
Providers (all other
engagements) | | | Total | |
| Nuveen ESG International Developed Markets Equity ETF | | | $0 | | | | $0 | | | | $0 | | | | $0 | |
| | | | | | | | | | | | | | | | |
| Nuveen ESG Dividend ETF | | | $0 | | | | $0 | | | | $0 | | | | $0 | |
| | | | | | | | | | | | | | | | |
| Nuveen ESG Emerging Markets Equity ETF | | | $0 | | | | $0 | | | | $0 | | | | $0 | |
| | | | | | | | | | | | | | | | |
| Nuveen ESG Large-Cap ETF | | | $0 | | | | $0 | | | | $0 | | | | $0 | |
| | | | | | | | | | | | | | | | |
| Nuveen ESG Large-Cap Growth ETF | | | $0 | | | | $0 | | | | $0 | | | | $0 | |
| | | | | | | | | | | | | | | | |
| Nuveen ESG Large-Cap Value ETF | | | $0 | | | | $0 | | | | $0 | | | | $0 | |
| | | | | | | | | | | | | | | | |
| Nuveen ESG Mid-Cap Growth ETF | | | $0 | | | | $0 | | | | $0 | | | | $0 | |
| | | | | | | | | | | | | | | | |
| Nuveen ESG Mid-Cap Value ETF | | | $0 | | | | $0 | | | | $0 | | | | $0 | |
| | | | | | | | | | | | | | | | |
| Nuveen ESG Small-Cap ETF | | | $0 | | | | $0 | | | | $0 | | | | $0 | |
| | | | | | | | | | | | | | | | |
| Nuveen Dividend Growth ETF | | | $0 | | | | $0 | | | | $0 | | | | $0 | |
| | | | | | | | | | | | | | | | |
| Nuveen Small Cap Select ETF | | | $0 | | | | $0 | | | | $0 | | | | $0 | |
| | | | | | | | | | | | | | | | |
| Nuveen Growth Opportunities ETF | | | $0 | | | | $0 | | | | $0 | | | | $0 | |
| | | | | | | | | | | | | | | | |
| Nuveen Winslow Large-Cap Growth ESG ETF | | | $0 | | | | $0 | | | | $0 | | | | $0 | |
| | | | | | | | | | | | | | | | |
| | | | |
Total | | | $0 | | | | $0 | | | | $0 | | | | $0 | |
“Non-Audit Fees billed to Fund” for both fiscal year ends represent “Tax Fees” and “All Other Fees” billed to Fund in their respective amounts from the previous table.
Less than 50 percent of the hours expended on the principal accountant’s engagement to audit the registrant’s financial statements for the most recent fiscal year were attributed to work performed by persons other than the principal accountant’s full-time, permanent employees.
| | | | | | | | | | | | | | | | |
| Fiscal Year Ended October 31, 2023 | | Total Non-Audit Fees
Billed to Fund | | | Total Non-Audit Fees
Billed to Adviser and
Affiliated Fund Service
Providers (engagements
related directly to the
operations and financial
reporting of the Trust) | | | Total Non-Audit Fees
Billed to Adviser and
Affiliated Fund Service
Providers (all other
engagements) | | | Total | |
| Nuveen ESG International Developed Markets Equity ETF | | | $0 | | | | $0 | | | | $0 | | | | $0 | |
| | | | | | | | | | | | | | | | |
Nuveen ESG Dividend ETF | | | $0 | | | | $0 | | | | $0 | | | | $0 | |
| | | | | | | | | | | | | | | | |
Nuveen ESG Emerging Markets Equity ETF | | | $0 | | | | $0 | | | | $0 | | | | $0 | |
| | | | | | | | | | | | | | | | |
Nuveen ESG Large-Cap ETF | | | $0 | | | | $0 | | | | $0 | | | | $0 | |
| | | | | | | | | | | | | | | | |
Nuveen ESG Large-Cap Growth ETF | | | $0 | | | | $0 | | | | $0 | | | | $0 | |
| | | | | | | | | | | | | | | | |
Nuveen ESG Large-Cap Value ETF | | | $0 | | | | $0 | | | | $0 | | | | $0 | |
| | | | | | | | | | | | | | | | |
Nuveen ESG Mid-Cap Growth ETF | | | $0 | | | | $0 | | | | $0 | | | | $0 | |
| | | | | | | | | | | | | | | | |
Nuveen ESG Mid-Cap Value ETF | | | $0 | | | | $0 | | | | $0 | | | | $0 | |
| | | | | | | | | | | | | | | | |
Nuveen ESG Small-Cap ETF | | | $0 | | | | $0 | | | | $0 | | | | $0 | |
| | | | | | | | | | | | | | | | |
Nuveen Dividend Growth ETF | | | $0 | | | | $0 | | | | $0 | | | | $0 | |
| | | | | | | | | | | | | | | | |
Nuveen Small Cap Select ETF | | | $0 | | | | $0 | | | | $0 | | | | $0 | |
| | | | | | | | | | | | | | | | |
Nuveen Growth Opportunities ETF | | | $0 | | | | $0 | | | | $0 | | | | $0 | |
| | | | | | | | | | | | | | | | |
| Nuveen Winslow Large-Cap Growth ESG ETF | | | $0 | | | | $0 | | | | $0 | | | | $0 | |
| | | | | | | | | | | | | | | | |
| | | | |
Total | | | $0 | | | | $0 | | | | $0 | | | | $0 | |
“Non-Audit Fees billed to Fund” for both fiscal year ends represent “Tax Fees” and “All Other Fees” billed to Fund in their respective amounts from the previous table.
Audit Committee Pre-Approval Policies and Procedures. Generally, the Audit Committee must approve (i) all non-audit services to be performed for the Funds by the Funds’ independent accountant and (ii) all audit and non-audit services to be performed by the Funds’ independent accountant for the Affiliated Fund Service Providers with respect to the operations and financial reporting of the Funds. Regarding tax and research projects conducted by the independent accountant for the Funds and Affiliated Fund Service Providers (with respect to operations and financial reports of the Trust), such engagements will be (i) pre-approved by the Audit Committee if they are expected to be for amounts greater than $10,000; (ii) reported to the Audit Committee Chair for his verbal approval prior to engagement if they are expected to be for amounts under $10,000 but greater than $5,000; and (iii) reported to the Audit Committee at the next Audit Committee meeting if they are expected to be for an amount under $5,000.
Item 4(i) and Item 4(j) are not applicable to the registrant.
| Item 5. | Audit Committee of Listed Registrants. |
The registrant is an issuer as defined in Rule 10A-3 under the Securities Exchange Act of 1934 (the “Exchange Act”). The registrant’s Board has a separately designated Audit Committee established in accordance with Section 3(a)(58)(A) of the Securities Exchange Act of 1934, as amended (15 U.S.C. 78c(a)(58)(A)). The members of the audit committee are Joseph A. Boateng, Albin F. Moschner, John K. Nelson, Chair, Loren M. Starr, Margaret L. Wolff and Robert L. Young.
| (a) | Schedule of Investments is included as part of the financial statements filed under Item 7 of this Form N-CSR. |
| Item 7. | Financial Statements and Financial Highlights for Open-End Management Investment Companies. |
Item
7.
Financial
Statements
and
Financial
Highlights
for
Open-End
Management
Investment
Companies
Report
of
Independent
Registered
Public
Accounting
Firm
To
the
Shareholders
and
Board
of
Trustees
Nushares
ETF
Trust:
Opinion
on
the
Financial
Statements
We
have
audited
the
accompanying
statements
of
assets
and
liabilities
of
the
Funds
listed
in
Appendix
A
(the
Funds),
including
the
portfolios
of
investments,
as
of
October
31,
2024,
the
related
statements
of
operations
and
changes
in
net
assets
for
the
Funds
and
periods
listed
in
Appendix
A,
and
the
related
notes
(collectively,
the
financial
statements)
and
the
financial
highlights
for
the
Funds
and
periods
listed
in
Appendix
A.
In
our
opinion,
the
financial
statements
and
financial
highlights
present
fairly,
in
all
material
respects,
the
financial
position
of
the
Funds
as
of
October
31,
2024,
the
results
of
their
operations
and
the
changes
in
their
net
assets
for
periods
listed
in
Appendix
A,
and
the
financial
highlights
for
the
Funds
and
periods
listed
in
Appendix
A,
in
conformity
with
U.S.
generally
accepted
accounting
principles.
Basis
for
Opinion
These
financial
statements
and
financial
highlights
are
the
responsibility
of
the
Funds'
management.
Our
responsibility
is
to
express
an
opinion
on
these
financial
statements
and
financial
highlights
based
on
our
audits.
We
are
a
public
accounting
firm
registered
with
the
Public
Company
Accounting
Oversight
Board
(United
States)
(PCAOB)
and
are
required
to
be
independent
with
respect
to
the
Funds
in
accordance
with
the
U.S.
federal
securities
laws
and
the
applicable
rules
and
regulations
of
the
Securities
and
Exchange
Commission
and
the
PCAOB.
We
conducted
our
audits
in
accordance
with
the
standards
of
the
PCAOB.
Those
standards
require
that
we
plan
and
perform
the
audit
to
obtain
reasonable
assurance
about
whether
the
financial
statements
and
financial
highlights
are
free
of
material
misstatement,
whether
due
to
error
or
fraud.
Our
audits
included
performing
procedures
to
assess
the
risks
of
material
misstatement
of
the
financial
statements
and
financial
highlights,
whether
due
to
error
or
fraud,
and
performing
procedures
that
respond
to
those
risks.
Such
procedures
included
examining,
on
a
test
basis,
evidence
regarding
the
amounts
and
disclosures
in
the
financial
statements
and
financial
highlights.
Such
procedures
also
included
confirmation
of
securities
owned
as
of
October
31,
2024,
by
correspondence
with
custodians
and
brokers;
when
replies
were
not
received
from
brokers,
we
performed
other
auditing
procedures.
Our
audits
also
included
evaluating
the
accounting
principles
used
and
significant
estimates
made
by
management,
as
well
as
evaluating
the
overall
presentation
of
the
financial
statements
and
financial
highlights.
We
believe
that
our
audits
provide
a
reasonable
basis
for
our
opinion.
/s/
KPMG
LLP
We
have
served
as
the
auditor
of
one
or
more
Nuveen
investment
companies
since
2014.
Chicago,
Illinois
December
26,
2024
Appendix
A
Nushares
ETF
Trust
For
the
year
ended
October
31,
2024
(statement
of
operations);
for
each
of
the
years
in
the
two-year
period
ended
October
31,
2024
(Statement
of
changes
in
net
assets);
for
each
of
the
years
in
the
three-year
period
ended
October
31,
2024,
and
the
period
September
27,
2021
(commencement
of
operations)
through
October
31,
2021
(financial
highlights):
Nuveen
ESG
Dividend
ETF
Nuveen
Growth
Opportunities
ETF
For
the
year
ended
October
31,
2024
(statement
of
operations);
for
each
of
the
years
in
the
two-
year
period
ended
October
31,
2024
(statement
of
changes
in
net
assets);
for
each
of
the
years
in
the
five-year
period
ended
October
31,
2024
(financial
highlights):
Nuveen
ESG
Emerging
Markets
Equity
ETF
Nuveen
ESG
International
Developed
Markets
Equity
ETF
Nuveen
ESG
Large
Cap
ETF
Nuveen
ESG
Large-Cap
Growth
ETF
Nuveen
ESG
Large-Cap
Value
ETF
Nuveen
ESG
Mid-Cap
Growth
ETF
Nuveen
ESG
Mid-Cap
Value
ETF
Nuveen
ESG
Small-Cap
ETF
For
the
year
ended
October
31,
2024
(statement
of
operations);
for
each
of
the
years
in
the
two-year
period
ended
October
31,
2024
(statement
of
changes
in
net
assets);
for
each
of
the
years
in
the
three-year
period
ended
October
31,
2024,
and
the
period
August
4,
2021
(commencement
of
operations)
through
October
31,
2021
(financial
highlights):
Nuveen
Dividend
Growth
ETF
Nuveen
Small
Cap
Select
ETF
Nuveen
Winslow
Large-Cap
Growth
ESG
ETF
Portfolio
of
Investments
October
31,
2024
NUDV
SHARES
DESCRIPTION
VALUE
LONG-TERM
INVESTMENTS
-
99.8%
COMMON
STOCKS
-
99.8%
COMMUNICATION
SERVICES
-
3.7%
4,422
Comcast
Corp,
Class
A
$
193,109
333
Fox
Corp,
Class
B
12,974
872
Interpublic
Group
of
Cos
Inc/The
25,637
1,374
Paramount
Global
15,031
4,424
Verizon
Communications
Inc
186,383
TOTAL
COMMUNICATION
SERVICES
433,134
CONSUMER
DISCRETIONARY
-
6.5%
490
Bath
&
Body
Works
Inc
13,906
479
Best
Buy
Co
Inc
43,316
134
Dick's
Sporting
Goods
Inc
26,230
466
Ferguson
Enterprises
Inc
91,681
613
Home
Depot
Inc/The
241,369
616
LKQ
Corp
22,663
718
Lowe's
Cos
Inc
187,994
90
Pool
Corp
32,547
249
Tractor
Supply
Co
66,112
297
Williams-Sonoma
Inc
39,837
TOTAL
CONSUMER
DISCRETIONARY
765,655
CONSUMER
STAPLES
-
11.5%
1,143
Archer-Daniels-Midland
Co
63,105
327
Bunge
Global
SA
27,474
449
Campbell
Soup
Co
20,946
287
Clorox
Co/The
45,504
2,982
Coca-Cola
Co/The
194,754
1,551
Colgate-Palmolive
Co
145,344
1,103
Conagra
Brands
Inc
31,921
696
Hormel
Foods
Corp
21,263
632
Kellanova
50,971
2,504
Keurig
Dr
Pepper
Inc
82,507
778
Kimberly-Clark
Corp
104,392
1,473
Kraft
Heinz
Co/The
49,286
1,584
Kroger
Co/The
88,340
333
Lamb
Weston
Holdings
Inc
25,871
583
McCormick
&
Co
Inc/MD
45,614
1,119
PepsiCo
Inc
185,843
1,069
Target
Corp
160,393
TOTAL
CONSUMER
STAPLES
1,343,528
ENERGY
-
2.0%
2,318
Baker
Hughes
Co
88,269
375
HF
Sinclair
Corp
14,479
1,349
ONEOK
Inc
130,691
TOTAL
ENERGY
233,439
FINANCIALS
-
23.7%
1,247
Aflac
Inc
130,673
635
Ally
Financial
Inc
22,257
120
Assurant
Inc
23,004
5,276
Bank
of
America
Corp
220,642
1,704
Bank
of
New
York
Mellon
Corp/The
128,413
882
Capital
One
Financial
Corp
143,581
2,745
Citigroup
Inc
176,147
582
Discover
Financial
Services
86,386
751
Equitable
Holdings
Inc
34,050
1,286
Fidelity
National
Information
Services
Inc
115,393
1,581
Fifth
Third
Bancorp
69,058
358
Goldman
Sachs
Group
Inc/The
185,369
685
Hartford
Financial
Services
Group
Inc/The
75,651
1,729
Huntington
Bancshares
Inc/OH
26,955
745
Marsh
&
McLennan
Cos
Inc
162,589
1,397
MetLife
Inc
109,553
SHARES
DESCRIPTION
VALUE
FINANCIALS
(continued)
1,684
Morgan
Stanley
$
195,765
472
Northern
Trust
Corp
47,446
904
PNC
Financial
Services
Group
Inc/The
170,196
542
Principal
Financial
Group
Inc
44,661
830
Prudential
Financial
Inc
101,658
2,114
Regions
Financial
Corp
50,461
690
State
Street
Corp
64,032
912
Synchrony
Financial
50,288
529
Travelers
Cos
Inc/The
130,102
898
Truist
Financial
Corp
38,659
3,590
US
Bancorp
173,433
TOTAL
FINANCIALS
2,776,422
HEALTH
CARE
-
12.0%
554
Amgen
Inc
177,369
3,353
Bristol-Myers
Squibb
Co
186,997
562
Cardinal
Health
Inc
60,988
477
Cigna
Group/The
150,164
2,177
Gilead
Sciences
Inc
193,361
1,438
Johnson
&
Johnson
229,879
1,808
Merck
&
Co
Inc
184,995
6,198
Pfizer
Inc
175,403
256
Quest
Diagnostics
Inc
39,636
TOTAL
HEALTH
CARE
1,398,792
INDUSTRIALS
-
15.6%
1,231
3M
Co
158,146
201
Allegion
plc
28,066
628
Automatic
Data
Processing
Inc
181,643
273
Broadridge
Financial
Solutions
Inc
57,565
523
Caterpillar
Inc
196,753
271
CH
Robinson
Worldwide
Inc
27,924
2,037
CNH
Industrial
NV
22,875
316
Cummins
Inc
103,958
439
Deere
&
Co
177,659
538
FedEx
Corp
147,331
175
IDEX
Corp
37,562
648
Illinois
Tool
Works
Inc
169,212
1,562
Johnson
Controls
International
plc
118,009
200
Owens
Corning
35,358
749
Paychex
Inc
104,358
263
Rockwell
Automation
Inc
70,145
240
Toro
Co/The
19,315
1,262
United
Parcel
Service
Inc,
Class
B
169,184
TOTAL
INDUSTRIALS
1,825,063
INFORMATION
TECHNOLOGY
-
9.9%
3,742
Cisco
Systems
Inc
204,949
3,001
Hewlett
Packard
Enterprise
Co
58,489
2,261
HP
Inc
80,311
7,714
Intel
Corp
166,005
933
International
Business
Machines
Corp
192,870
750
Juniper
Networks
Inc
29,175
477
NetApp
Inc
55,003
591
NXP
Semiconductors
NV
138,590
462
Seagate
Technology
Holdings
PLC
46,371
905
Texas
Instruments
Inc
183,860
TOTAL
INFORMATION
TECHNOLOGY
1,155,623
MATERIALS
-
2.8%
185
Avery
Dennison
Corp
38,301
590
International
Flavors
&
Fragrances
Inc
58,664
2,672
Newmont
Corp
121,416
542
PPG
Industries
Inc
67,484
Portfolio
of
Investments
October
31,
2024
(continued)
NUDV
SHARES
DESCRIPTION
VALUE
MATERIALS
(continued)
345
Steel
Dynamics
Inc
$
45,022
TOTAL
MATERIALS
330,887
REAL
ESTATE
-
9.0%
749
American
Tower
Corp
159,941
328
AvalonBay
Communities
Inc
72,688
344
BXP
Inc
27,713
1,005
Crown
Castle
Inc
108,027
192
Equinix
Inc
174,351
1,625
Healthpeak
Properties
Inc
36,481
678
Iron
Mountain
Inc
83,889
366
Public
Storage
120,436
406
Regency
Centers
Corp
29,005
248
SBA
Communications
Corp
56,909
1,351
Welltower
Inc
182,223
TOTAL
REAL
ESTATE
1,051,663
UTILITIES
-
3.1%
450
American
Water
Works
Co
Inc
62,150
349
Atmos
Energy
Corp
48,434
799
Consolidated
Edison
Inc
81,242
600
Essential
Utilities
Inc
23,160
817
Eversource
Energy
53,800
2,310
Exelon
Corp
90,783
TOTAL
UTILITIES
359,569
TOTAL
COMMON
STOCKS
(Cost
$10,973,670)
11,673,775
TOTAL
LONG-TERM
INVESTMENTS
(Cost
$10,973,670)
11,673,775
OTHER
ASSETS
&
LIABILITIES,
NET
-
0.2%
28,153
NET
ASSETS
-
100%
$
11,701,928
For
Fund
portfolio
compliance
purposes,
the
Fund’s
industry
classifications
refer
to
any
one
or
more
of
the
industry
sub-classifications
used
by
one
or
more
widely
recognized
market
indexes
or
ratings
group
indexes,
and/or
as
defined
by
Fund
management.
This
definition
may
not
apply
for
purposes
of
this
report,
which
may
combine
industry
sub-classifications
into
sectors
for
reporting
ease.
See
Notes
to
Financial
Statements
Portfolio
of
Investments
October
31,
2024
NUEM
SHARES
DESCRIPTION
VALUE
LONG-TERM
INVESTMENTS
-
100.6%
COMMON
STOCKS
-
100.6%
COMMUNICATION
SERVICES
-
10.7%
114,943
America
Movil
SAB
de
CV
$
90,699
24,100
Autohome
Inc,
ADR
677,210
267,964
Bharti
Airtel
Ltd
5,138,994
1,305
CD
Projekt
SA
52,337
153,600
(a)
China
Ruyi
Holdings
Ltd
37,736
17,098
Chunghwa
Telecom
Co
Ltd
65,105
101,453
Emirates
Telecommunications
Group
Co
PJSC
489,449
4,007
Hellenic
Telecommunications
Organization
SA
65,992
25,768
Info
Edge
India
Ltd
2,280,259
29,000
Jiangsu
Phoenix
Publishing
&
Media
Corp
Ltd,
Class
A
41,011
112,409
Kakao
Corp
3,009,792
95,530
Kanzhun
Ltd
1,389,962
113,987
Kingsoft
Corp
Ltd
394,403
10,404
(a),(b)
Krafton
Inc
2,495,452
704,874
(a),(b)
Kuaishou
Technology
4,161,571
709,463
Mobile
Telecommunications
Co
KSCP
1,054,826
188,071
NetEase
Inc
2,994,854
289,555
Ooredoo
QPSC
909,780
246,262
Saudi
Telecom
Co
2,763,784
19,357
SK
Telecom
Co
Ltd
795,320
43,155
Telefonica
Brasil
SA
392,430
145,900
Tencent
Music
Entertainment
Group,
ADR
1,623,867
TOTAL
COMMUNICATION
SERVICES
30,924,833
CONSUMER
DISCRETIONARY
-
15.0%
86,604
(a),(b)
Allegro.eu
SA
758,827
40,421
ANTA
Sports
Products
Ltd
431,277
121,029
BYD
Co
Ltd
4,380,732
38,020
BYD
Co
Ltd,
Class
A
1,563,877
5,083
China
Tourism
Group
Duty
Free
Corp
Ltd,
Class
A
48,371
441,474
Chow
Tai
Fook
Jewellery
Group
Ltd
417,942
19,998
Coway
Co
Ltd
912,952
8,954
Eicher
Motors
Ltd
521,211
60,014
(a)
Falabella
SA
215,417
460
(a),(c)
FF
Group
5
176,499
Great
Wall
Motor
Co
Ltd
280,604
123,892
Haier
Smart
Home
Co
Ltd
450,189
18,232
Hero
MotoCorp
Ltd
1,081,859
5,066
Indian
Hotels
Co
Ltd/The
40,770
222,164
JD.com
Inc,
Class
A
4,443,623
1,387
JUMBO
SA
36,892
38,520
LG
Electronics
Inc
2,498,217
50,918
(a)
Li
Auto
Inc,
Class
A
703,410
57
LPP
SA
206,344
105,921
Mahindra
&
Mahindra
Ltd
3,437,075
335,600
(a),(b)
Meituan,
Class
B
7,878,036
74,100
Midea
Group
Co
Ltd,
Class
A
742,471
13,164
Naspers
Ltd
3,085,625
169,992
(b)
Pop
Mart
International
Group
Ltd
1,541,526
360,604
PTT
Oil
&
Retail
Business
PCL
164,567
16,551
Titan
Co
Ltd
643,065
43,304
Trent
Ltd
3,671,065
68,779
Vipshop
Holdings
Ltd,
ADR
993,169
832,684
(a)
Zomato
Ltd
2,393,987
TOTAL
CONSUMER
DISCRETIONARY
43,543,105
CONSUMER
STAPLES
-
4.4%
420,378
(a)
Alibaba
Health
Information
Technology
Ltd
212,503
632
Amorepacific
Corp
53,400
2,973
CJ
CheilJedang
Corp
591,369
176,130
Fomento
Economico
Mexicano
SAB
de
CV
1,707,413
108,186
Hindustan
Unilever
Ltd
3,252,865
Portfolio
of
Investments
October
31,
2024
(continued)
NUEM
SHARES
DESCRIPTION
VALUE
CONSUMER
STAPLES
(continued)
241
LG
H&H
Co
Ltd
$
57,892
293,540
(b)
Nongfu
Spring
Co
Ltd
1,091,185
99,772
Raia
Drogasil
SA
419,512
59,374
Tata
Consumer
Products
Ltd
707,909
381,528
Varun
Beverages
Ltd
2,712,192
756,661
Wal-Mart
de
Mexico
SAB
de
CV
2,077,834
TOTAL
CONSUMER
STAPLES
12,884,074
ENERGY
-
1.9%
142,380
Empresas
Copec
SA
898,918
103,610
Offshore
Oil
Engineering
Co
Ltd,
Class
A
78,785
217,998
Qatar
Fuel
QSC
917,855
16,473
S-Oil
Corp
683,988
449,510
Thai
Oil
PCL
546,152
349,486
Turkiye
Petrol
Rafinerileri
AS
1,473,762
262,172
Ultrapar
Participacoes
SA
946,106
TOTAL
ENERGY
5,545,566
FINANCIALS
-
22.9%
29,642
Abu
Dhabi
Commercial
Bank
PJSC
72,148
74,091
Abu
Dhabi
Islamic
Bank
PJSC
254,165
7,017,033
Agricultural
Bank
of
China
Ltd
3,447,863
1,258,464
Agricultural
Bank
of
China
Ltd,
Class
A
835,109
117,021
Al
Rajhi
Bank
2,741,925
32,574
Axis
Bank
Ltd
449,196
1,118,674
B3
SA
-
Brasil
Bolsa
Balcao
2,052,311
171,900
Banco
Bradesco
SA
378,321
422,645
Banco
Bradesco
SA
1,049,174
624,111
Banco
do
Brasil
SA
2,838,755
5,168,167
Bank
Central
Asia
Tbk
PT
3,375,197
229,010
Cathay
Financial
Holding
Co
Ltd
492,472
8,017,656
China
Construction
Bank
Corp
6,218,675
205,998
China
Construction
Bank
Corp,
Class
A
229,180
958,484
China
Merchants
Bank
Co
Ltd
4,684,914
45,038
China
Merchants
Bank
Co
Ltd,
Class
A
236,063
260,028
CITIC
Securities
Co
Ltd
720,776
266,300
CITIC
Securities
Co
Ltd,
Class
A
1,050,577
165,172
Commercial
International
Bank
-
Egypt
(CIB)
269,944
3,799
Credicorp
Ltd
699,510
977,652
CTBC
Financial
Holding
Co
Ltd
1,095,434
205,053
Eurobank
Ergasias
Services
and
Holdings
SA
420,742
803,653
FirstRand
Ltd
3,504,618
1,149,272
Fubon
Financial
Holding
Co
Ltd
3,256,989
17,952
Hana
Financial
Group
Inc
779,221
279,371
HDFC
Bank
Ltd
5,766,748
12,093
(b)
HDFC
Life
Insurance
Co
Ltd
103,569
114,529
Huatai
Securities
Co
Ltd,
Class
A
283,276
25,376
(b)
ICICI
Prudential
Life
Insurance
Co
Ltd
223,623
7,455,325
Industrial
&
Commercial
Bank
of
China
Ltd
4,468,745
745,480
Industrial
&
Commercial
Bank
of
China
Ltd,
Class
A
631,705
22,104
Industrial
Bank
Co
Ltd,
Class
A
56,688
3,085
KakaoBank
Corp
48,399
49,559
KB
Financial
Group
Inc
3,242,882
126,016
Kotak
Mahindra
Bank
Ltd
2,594,316
544,285
Malayan
Banking
Bhd
1,305,091
36,574
Piraeus
Financial
Holdings
SA
136,511
86,216
Powszechna
Kasa
Oszczednosci
Bank
Polski
SA
1,200,253
1,547,636
Public
Bank
Bhd
1,562,126
28,934
Samsung
Life
Insurance
Co
Ltd
2,128,117
43,865
Sanlam
Ltd
217,663
27,973
Shinhan
Financial
Group
Co
Ltd
1,039,866
25,895
Standard
Bank
Group
Ltd
353,801
96,028
Yapi
ve
Kredi
Bankasi
AS
68,555
TOTAL
FINANCIALS
66,585,213
SHARES
DESCRIPTION
VALUE
HEALTH
CARE
-
3.5%
399,900
Bangkok
Dusit
Medical
Services
PCL
$
328,855
33,852
(a)
BeiGene
Ltd
530,352
28,500
Beijing
Tong
Ren
Tang
Co
Ltd,
Class
A
158,337
53,300
Chongqing
Zhifei
Biological
Products
Co
Ltd,
Class
A
212,217
11,721
Cipla
Ltd/India
216,302
15,151
Dr
Sulaiman
Al
Habib
Medical
Services
Group
Co
1,154,569
338,888
(b)
Hansoh
Pharmaceutical
Group
Co
Ltd
790,727
771,259
IHH
Healthcare
Bhd
1,276,919
32,336
(a),(b)
Innovent
Biologics
Inc
140,584
139,600
Jiangsu
Hengrui
Pharmaceuticals
Co
Ltd,
Class
A
912,668
7,700
(b)
Rede
D'Or
Sao
Luiz
SA
39,054
16,201
Richter
Gedeon
Nyrt
466,962
4,600
Shenzhen
Mindray
Bio-Medical
Electronics
Co
Ltd,
Class
A
172,052
717,473
Sino
Biopharmaceutical
Ltd
325,772
7,809
Torrent
Pharmaceuticals
Ltd
297,427
30,678
(b)
WuXi
AppTec
Co
Ltd
204,010
253,925
(a),(b)
Wuxi
Biologics
Cayman
Inc
533,692
20,445
Yuhan
Corp
2,054,871
9,240
Zhangzhou
Pientzehuang
Pharmaceutical
Co
Ltd,
Class
A
303,793
TOTAL
HEALTH
CARE
10,119,163
INDUSTRIALS
-
7.6%
2,414
ABB
India
Ltd
213,289
1,541,148
Airports
of
Thailand
PCL
2,797,313
41,980
Ayala
Corp
498,472
393,038
Bharat
Electronics
Ltd
1,331,687
62,761
Contemporary
Amperex
Technology
Co
Ltd,
Class
A
2,165,864
16,801
Doosan
Bobcat
Inc
456,549
43,000
(a)
Embraer
SA
360,119
286,072
(a)
GMR
Airports
Infrastructure
Ltd
269,857
21,487
Grupo
Aeroportuario
del
Sureste
SAB
de
CV,
Class
B
573,927
6,020
Havells
India
Ltd
117,298
3,903
HD
Hyundai
Electric
Co
Ltd
926,255
14,480
Hyundai
Engineering
&
Construction
Co
Ltd
292,748
717,473
(a),(b)
JD
Logistics
Inc
1,458,128
46,000
Kuang-Chi
Technologies
Co
Ltd,
Class
A
274,276
17,359
Metlen
Energy
&
Metals
SA
604,194
228,363
Rumo
SA
785,044
8,610
(a)
Samsung
E&A
Co
Ltd
111,431
105,872
SF
Holding
Co
Ltd,
Class
A
663,348
10,648
Shanghai
M&G
Stationery
Inc,
Class
A
43,322
30,104
Siemens
Ltd
2,497,608
33,218
(a)
SK
Square
Co
Ltd
2,041,222
80,056
SM
Investments
Corp
1,296,381
5,006
Sungrow
Power
Supply
Co
Ltd,
Class
A
63,644
942,112
(a)
Suzlon
Energy
Ltd
750,115
28,812
(a)
Turk
Hava
Yollari
AO
228,965
702,292
Weichai
Power
Co
Ltd
1,064,134
146,800
Weichai
Power
Co
Ltd,
Class
A
274,947
TOTAL
INDUSTRIALS
22,160,137
INFORMATION
TECHNOLOGY
-
21.3%
1,047,898
Acer
Inc
1,322,955
847,000
ASE
Technology
Holding
Co
Ltd
4,150,406
74,000
Asia
Vital
Components
Co
Ltd
1,473,533
350,543
Delta
Electronics
Inc
4,420,080
104,886
HCL
Technologies
Ltd
2,202,904
166,188
Infosys
Ltd
3,473,027
2,919,121
Lenovo
Group
Ltd
3,867,430
108,626
LG
Display
Co
Ltd
837,522
763,966
Lite-On
Technology
Corp
2,444,023
257,684
Sunny
Optical
Technology
Group
Co
Ltd
1,678,804
1,008,124
Taiwan
Semiconductor
Manufacturing
Co
Ltd
32,408,481
Portfolio
of
Investments
October
31,
2024
(continued)
NUEM
SHARES
DESCRIPTION
VALUE
INFORMATION
TECHNOLOGY
(continued)
2,425,000
United
Microelectronics
Corp
$
3,644,312
TOTAL
INFORMATION
TECHNOLOGY
61,923,477
MATERIALS
-
8.4%
1,887,238
(a)
Amman
Mineral
Internasional
PT
1,103,244
10,174
Anglo
American
Platinum
Ltd
396,487
2,904
Anglogold
Ashanti
Plc
80,465
19,011
APL
Apollo
Tubes
Ltd
343,758
73,054
Asian
Paints
Ltd
2,550,488
1,287,735
Cemex
SAB
de
CV
677,417
56,488
Chandra
Asri
Pacific
Tbk
PT
31,492
502,558
Gerdau
SA
1,588,739
72,030
Gold
Fields
Ltd
1,182,180
4,898
Hanwha
Solutions
Corp
76,132
13,998
KGHM
Polska
Miedz
SA
521,930
15,750
Klabin
SA
56,756
2,998
Korea
Zinc
Co
Ltd
2,168,119
17,033
Kumba
Iron
Ore
Ltd
319,850
2,768
LG
Chem
Ltd
421,217
9,185
LG
Chem
Ltd
2,086,592
5,320
PI
Industries
Ltd
283,980
54,261
Pidilite
Industries
Ltd
2,030,022
226,223
Press
Metal
Aluminium
Holdings
Bhd
245,389
42,725
SABIC
Agri-Nutrients
Co
1,294,594
296,752
(a)
Saudi
Arabian
Mining
Co
4,456,376
73,591
Saudi
Basic
Industries
Corp
1,424,519
251,300
Shandong
Nanshan
Aluminum
Co
Ltd,
Class
A
143,845
15,796
Supreme
Industries
Ltd
806,789
48,100
Western
Mining
Co
Ltd,
Class
A
119,375
26,300
Xiamen
Tungsten
Co
Ltd,
Class
A
71,729
TOTAL
MATERIALS
24,481,484
REAL
ESTATE
-
1.5%
1,131,523
Aldar
Properties
PJSC
2,347,456
32,626
China
Resources
Land
Ltd
108,482
10,500
KE
Holdings
Inc,
ADR
230,265
108,107
(b)
Macrotech
Developers
Ltd
1,550,837
TOTAL
REAL
ESTATE
4,237,040
UTILITIES
-
3.4%
271,536
China
Resources
Gas
Group
Ltd
1,049,555
531,200
China
Yangtze
Power
Co
Ltd,
Class
A
2,055,388
201,190
Cia
Paranaense
de
Energia
-
Copel
340,950
52,900
Engie
Brasil
Energia
SA
378,970
286,752
ENN
Energy
Holdings
Ltd
2,017,562
91,841
Interconexion
Electrica
SA
ESP
365,866
27,520
Manila
Electric
Co
232,056
710,905
Power
Grid
Corp
of
India
Ltd
2,712,195
242,052
Tenaga
Nasional
Bhd
776,070
TOTAL
UTILITIES
9,928,612
TOTAL
COMMON
STOCKS
(Cost
$247,821,001)
292,332,704
TOTAL
LONG-TERM
INVESTMENTS
(Cost
$247,821,001)
292,332,704
OTHER
ASSETS
&
LIABILITIES,
NET
-
(0.6)%
(
1,708,169
)
NET
ASSETS
-
100%
$
290,624,535
For
Fund
portfolio
compliance
purposes,
the
Fund’s
industry
classifications
refer
to
any
one
or
more
of
the
industry
sub-classifications
used
by
one
or
more
widely
recognized
market
indexes
or
ratings
group
indexes,
and/or
as
defined
by
Fund
management.
This
definition
may
not
apply
for
purposes
of
this
report,
which
may
combine
industry
sub-classifications
into
sectors
for
reporting
ease.
(a)
Non-income
producing;
issuer
has
not
declared
an
ex-dividend
date
within
the
past
twelve
months.
(b)
Security
is
exempt
from
registration
under
Rule
144A
of
the
Securities
Act
of
1933,
as
amended.
These
securities
are
deemed
liquid
and
may
be
resold
in
transactions
exempt
from
registration,
which
are
normally
those
transactions
with
qualified
institutional
buyers.
As
of
the
end
of
the
reporting
period,
the
aggregate
value
of
these
securities
is
$22,970,821
or
7.9%
of
Total
Investments.
(c)
For
fair
value
measurement
disclosure
purposes,
investment
classified
as
Level
3.
ADR
American
Depositary
Receipt
See
Notes
to
Financial
Statements
Portfolio
of
Investments
October
31,
2024
NUDM
h
SHARES
DESCRIPTION
VALUE
LONG-TERM
INVESTMENTS
-
99.4%
COMMON
STOCKS
-
99.4%
COMMUNICATION
SERVICES
-
5.0%
1,044,780
HKT
Trust
&
HKT
Ltd
$
1,298,181
49,517
KDDI
Corp
1,553,207
18,368
Publicis
Groupe
SA
1,948,650
401,900
Singapore
Telecommunications
Ltd
950,901
3,007,120
SoftBank
Corp
3,806,156
125,605
SoftBank
Group
Corp
7,831,914
404,778
Spark
New
Zealand
Ltd
701,029
2,920
Swisscom
AG
1,776,246
164,077
Telenor
ASA
2,009,610
135,572
WPP
PLC
1,418,432
TOTAL
COMMUNICATION
SERVICES
23,294,326
CONSUMER
DISCRETIONARY
-
11.6%
91,128
Amadeus
IT
Group
SA
6,588,925
6,734
Avolta
AG
266,027
59,666
Bayerische
Motoren
Werke
AG
4,684,614
16,263
Bayerische
Motoren
Werke
AG
1,192,654
2,500
Bridgestone
Corp
90,054
70,794
Cie
Generale
des
Etablissements
Michelin
SCA
2,386,418
49,299
Compass
Group
PLC
1,594,032
5,774
D'ieteren
Group
1,244,302
2,985
Fast
Retailing
Co
Ltd
970,407
24,826
H
&
M
Hennes
&
Mauritz
AB
367,168
974
Hermes
International
SCA
2,193,089
666,882
Honda
Motor
Co
Ltd
6,818,767
70,068
Industria
de
Diseno
Textil
SA
3,978,413
10,778
Kering
SA
2,677,797
96,965
Oriental
Land
Co
Ltd/Japan
2,358,479
644,964
Panasonic
Holdings
Corp
5,241,854
55,100
Sekisui
Chemical
Co
Ltd
784,947
30,500
Sekisui
House
Ltd
744,054
7,487
Sodexo
SA
648,633
496,985
Sony
Group
Corp
8,885,860
195,820
(a)
Volvo
Car
AB,
Class
B
419,547
TOTAL
CONSUMER
DISCRETIONARY
54,136,041
CONSUMER
STAPLES
-
10.7%
126,497
Ajinomoto
Co
Inc
4,902,927
59,500
Associated
British
Foods
PLC
1,698,973
967
Barry
Callebaut
AG
1,690,880
116,605
Carrefour
SA
1,840,012
21
Chocoladefabriken
Lindt
&
Spruengli
AG
2,438,302
6,155
(a)
Coca-Cola
Europacific
Partners
PLC
467,780
2,417
Coca-Cola
HBC
AG
84,211
105,663
Danone
SA
7,536,623
18,954
Kerry
Group
PLC,
Class
A
1,882,827
107,860
Mowi
ASA
1,848,612
154,641
Orkla
ASA
1,425,786
122,059
Reckitt
Benckiser
Group
PLC
7,350,343
1,258,240
Tesco
PLC
5,535,596
157,966
Unilever
PLC
9,606,068
533,524
Wilmar
International
Ltd
1,290,556
TOTAL
CONSUMER
STAPLES
49,599,496
ENERGY
-
0.7%
66,106
Ampol
Ltd
1,208,052
117,062
Neste
Oyj
1,865,651
TOTAL
ENERGY
3,073,703
FINANCIALS
-
21.7%
168,271
3i
Group
PLC
6,862,200
511,111
AIA
Group
Ltd
4,039,896
11,710
AIB
Group
PLC
62,217
SHARES
DESCRIPTION
VALUE
FINANCIALS
(continued)
20,894
Allianz
SE
$
6,564,605
364,078
ANZ
Group
Holdings
Ltd
7,428,363
168,968
AXA
SA
6,332,333
329,080
Bank
Hapoalim
BM
3,436,035
8,134
Banque
Cantonale
Vaudoise
809,920
563,562
Barclays
PLC
1,720,783
1,004,725
BOC
Hong
Kong
Holdings
Ltd
3,282,570
28,735
Commonwealth
Bank
of
Australia
2,686,754
10,000
Concordia
Financial
Group
Ltd
50,307
159,357
DNB
Bank
ASA
3,282,375
12,609
Eurazeo
SE
957,540
209,317
Generali
5,806,092
11,809
Gjensidige
Forsikring
ASA
212,512
1,574,929
Intesa
Sanpaolo
SpA
6,731,547
52,913
KBC
Group
NV
3,830,421
4,830,119
Lloyds
Banking
Group
PLC
3,316,042
345,663
Mizuho
Financial
Group
Inc
7,288,820
35,783
NN
Group
NV
1,755,527
39,223
Phoenix
Group
Holdings
PLC
247,697
122,074
(b)
Poste
Italiane
SpA
1,714,928
52,500
Sompo
Holdings
Inc
1,145,643
234,278
Standard
Chartered
PLC
2,711,989
403,676
Svenska
Handelsbanken
AB
4,180,102
193,130
Tokio
Marine
Holdings
Inc
7,059,562
242,843
UBS
Group
AG
7,453,514
TOTAL
FINANCIALS
100,970,294
HEALTH
CARE
-
12.9%
303,323
Astellas
Pharma
Inc
3,575,358
142,686
Chugai
Pharmaceutical
Co
Ltd
6,875,531
21,619
CSL
Ltd
4,063,333
184,078
Daiichi
Sankyo
Co
Ltd
6,019,317
19,604
EssilorLuxottica
SA
4,584,362
2,721
(a)
Genmab
A/S
607,774
46,608
(a)
Hoya
Corp
6,341,381
3,729
Lonza
Group
AG
2,296,826
30,603
Merck
KGaA
5,050,055
3,701
(a),(c)
NMC
Health
PLC
–
54,490
Novartis
AG
5,910,908
130,824
Novo
Nordisk
A/S,
Class
B
14,531,662
TOTAL
HEALTH
CARE
59,856,507
INDUSTRIALS
-
18.4%
102,456
ABB
Ltd
5,675,543
50,405
ACS
Actividades
de
Construccion
y
Servicios
SA
2,407,769
36,394
AerCap
Holdings
NV
3,404,659
9,531
Aeroports
de
Paris
SA
1,125,786
93,751
Alstom
SA
2,041,716
52,584
Bouygues
SA
1,680,089
383,195
Brambles
Ltd
4,608,219
34,672
Bunzl
PLC
1,520,929
145,848
Computershare
Ltd
2,520,089
107,630
Dai
Nippon
Printing
Co
Ltd
1,886,572
2,350
Daikin
Industries
Ltd
287,724
27,405
DCC
PLC
1,727,831
20,381
Eiffage
SA
1,890,936
70,323
Getlink
SE
1,189,851
423,712
(a)
Grab
Holdings
Ltd
1,728,745
403,551
Keppel
Ltd
1,952,322
4,911
Komatsu
Ltd
129,316
369,835
Mitsubishi
Electric
Corp
5,796,692
420,002
MTR
Corp
Ltd
1,528,871
14,894
MTU
Aero
Engines
AG
4,862,205
73,479
Nibe
Industrier
AB
353,247
Portfolio
of
Investments
October
31,
2024
(continued)
NUDM
SHARES
DESCRIPTION
VALUE
INDUSTRIALS
(continued)
180,315
RELX
PLC
$
8,252,827
62,178
Rexel
SA
1,699,734
186,694
Sandvik
AB
3,646,623
37,543
Schneider
Electric
SE
9,667,900
88,000
SG
Holdings
Co
Ltd
883,900
18,585
SGS
SA
1,966,610
30,305
Siemens
AG
5,869,453
95,796
Smiths
Group
PLC
1,883,110
357,930
Transurban
Group
2,979,780
24,500
West
Japan
Railway
Co
436,199
TOTAL
INDUSTRIALS
85,605,247
INFORMATION
TECHNOLOGY
-
7.4%
17,453
ASML
Holding
NV
11,770,368
383,698
Fujitsu
Ltd
7,463,628
57,438
Infineon
Technologies
AG
1,809,923
38,584
Logitech
International
SA
3,157,400
78,770
Nokia
Oyj
369,859
148,900
Ricoh
Co
Ltd
1,634,894
31,793
SAP
SE
7,414,029
8,354
Temenos
AG
577,254
TOTAL
INFORMATION
TECHNOLOGY
34,197,355
MATERIALS
-
6.0%
106,766
Antofagasta
PLC
2,377,397
75,711
Boliden
AB
2,340,662
4,561
Clariant
AG
63,243
36,301
Croda
International
PLC
1,729,130
816
DSM-Firmenich
AG
96,650
18,134
Endeavour
Mining
PLC
404,496
24,951
Evonik
Industries
AG
547,990
195,925
Fortescue
Ltd
2,460,099
1,472
Givaudan
SA
6,974,424
45,140
(a)
James
Hardie
Industries
PLC
1,444,627
48,911
Mineral
Resources
Ltd
1,262,244
797,997
Pilbara
Minerals
Ltd
1,489,659
16,249
Sika
AG
4,519,353
42,171
Sumitomo
Metal
Mining
Co
Ltd
1,187,958
8,059
Symrise
AG
967,664
TOTAL
MATERIALS
27,865,596
REAL
ESTATE
-
2.1%
187,800
CapitaLand
Ascendas
REIT
381,875
147,210
Goodman
Group
3,532,916
528,334
Mitsui
Fudosan
Co
Ltd
4,599,185
56,587
Sino
Land
Co
Ltd
56,628
115,239
Swire
Pacific
Ltd
968,675
TOTAL
REAL
ESTATE
9,539,279
UTILITIES
-
2.9%
301,618
Iberdrola
SA
4,468,063
591,678
National
Grid
PLC
7,425,832
2,894
Orsted
AS
168,797
18,850
Verbund
AG
1,538,926
TOTAL
UTILITIES
13,601,618
TOTAL
COMMON
STOCKS
(Cost
$404,936,635)
461,739,462
TOTAL
LONG-TERM
INVESTMENTS
(Cost
$404,936,635)
461,739,462
OTHER
ASSETS
&
LIABILITIES,
NET
-
0.6%
2,990,900
NET
ASSETS
-
100%
$
464,730,362
For
Fund
portfolio
compliance
purposes,
the
Fund’s
industry
classifications
refer
to
any
one
or
more
of
the
industry
sub-classifications
used
by
one
or
more
widely
recognized
market
indexes
or
ratings
group
indexes,
and/or
as
defined
by
Fund
management.
This
definition
may
not
apply
for
purposes
of
this
report,
which
may
combine
industry
sub-classifications
into
sectors
for
reporting
ease.
(a)
Non-income
producing;
issuer
has
not
declared
an
ex-dividend
date
within
the
past
twelve
months.
(b)
Security
is
exempt
from
registration
under
Rule
144A
of
the
Securities
Act
of
1933,
as
amended.
These
securities
are
deemed
liquid
and
may
be
resold
in
transactions
exempt
from
registration,
which
are
normally
those
transactions
with
qualified
institutional
buyers.
As
of
the
end
of
the
reporting
period,
the
aggregate
value
of
these
securities
is
$1,714,928
or
0.4%
of
Total
Investments.
(c)
For
fair
value
measurement
disclosure
purposes,
investment
classified
as
Level
3.
REIT
Real
Estate
Investment
Trust
See
Notes
to
Financial
Statements
Portfolio
of
Investments
October
31,
2024
NULC
SHARES
DESCRIPTION
VALUE
LONG-TERM
INVESTMENTS
-
99.8%
COMMON
STOCKS
-
99.8%
COMMUNICATION
SERVICES
-
8.8%
6,250
Alphabet
Inc,
Class
A
$
1,069,437
3,798
Alphabet
Inc,
Class
C
655,877
13,838
AT&T
Inc
311,908
6,194
Comcast
Corp,
Class
A
270,492
776
Electronic
Arts
Inc
117,060
1,885
Verizon
Communications
Inc
79,415
5,213
Walt
Disney
Co/The
501,491
TOTAL
COMMUNICATION
SERVICES
3,005,680
CONSUMER
DISCRETIONARY
-
9.4%
4
(a)
AutoZone
Inc
12,036
31
Booking
Holdings
Inc
144,964
5,786
(a)
Chipotle
Mexican
Grill
Inc
322,685
642
(a)
Deckers
Outdoor
Corp
103,291
2,630
eBay
Inc
151,251
1,388
Ferguson
Enterprises
Inc
273,075
183
Home
Depot
Inc/The
72,056
1,056
Lowe's
Cos
Inc
276,493
1,459
McDonald's
Corp
426,189
241
(a)
MercadoLibre
Inc
490,960
2,071
(a)
Tesla
Inc
517,439
3,852
TJX
Cos
Inc/The
435,392
TOTAL
CONSUMER
DISCRETIONARY
3,225,831
CONSUMER
STAPLES
-
6.0%
3,417
Archer-Daniels-Midland
Co
188,652
44
Bunge
Global
SA
3,697
8,870
Coca-Cola
Co/The
579,300
2,684
Kroger
Co/The
149,687
1,654
PepsiCo
Inc
274,696
3,076
Procter
&
Gamble
Co/The
508,094
2,379
Target
Corp
356,945
TOTAL
CONSUMER
STAPLES
2,061,071
ENERGY
-
2.9%
6,891
Baker
Hughes
Co
262,409
1,574
Cheniere
Energy
Inc
301,232
1,139
HF
Sinclair
Corp
43,977
4,024
ONEOK
Inc
389,845
TOTAL
ENERGY
997,463
FINANCIALS
-
16.6%
438
(a)
Arch
Capital
Group
Ltd
43,169
728
Cboe
Global
Markets
Inc
155,479
4,939
Citigroup
Inc
316,936
2,904
(a)
Fiserv
Inc
574,702
138
Goldman
Sachs
Group
Inc/The
71,455
144
LPL
Financial
Holdings
Inc
40,634
228
MarketAxess
Holdings
Inc
65,988
2,215
Marsh
&
McLennan
Cos
Inc
483,402
1,464
Mastercard
Inc
731,400
227
Moody's
Corp
103,067
4,204
Morgan
Stanley
488,715
2,238
PNC
Financial
Services
Group
Inc/The
421,348
2,164
Progressive
Corp/The
525,484
3,676
(a)
Robinhood
Markets
Inc,
Class
A
86,349
1,065
S&P
Global
Inc
511,583
680
Travelers
Cos
Inc/The
167,239
2,894
Truist
Financial
Corp
124,587
463
US
Bancorp
22,368
2,572
Visa
Inc,
Class
A
745,494
55
Willis
Towers
Watson
PLC
16,620
TOTAL
FINANCIALS
5,696,019
SHARES
DESCRIPTION
VALUE
HEALTH
CARE
-
12.1%
513
Agilent
Technologies
Inc
$
66,849
1,193
Amgen
Inc
381,951
378
Cardinal
Health
Inc
41,020
86
Cigna
Group/The
27,074
153
(a)
Cooper
Cos
Inc/The
16,016
2,008
Danaher
Corp
493,285
128
(a)
Dexcom
Inc
9,021
3,979
(a)
Edwards
Lifesciences
Corp
266,633
999
Eli
Lilly
&
Co
828,910
2,751
Gilead
Sciences
Inc
244,344
1,255
HCA
Healthcare
Inc
450,219
1,617
(a)
Hologic
Inc
130,767
42
(a)
IDEXX
Laboratories
Inc
17,091
855
McKesson
Corp
428,004
1,014
(a)
Solventum
Corp
73,596
1,061
(a)
Veeva
Systems
Inc,
Class
A
221,569
237
(a)
Vertex
Pharmaceuticals
Inc
112,807
501
West
Pharmaceutical
Services
Inc
154,273
1,145
Zoetis
Inc
204,703
TOTAL
HEALTH
CARE
4,168,132
INDUSTRIALS
-
8.2%
1,592
3M
Co
204,524
1,143
Automatic
Data
Processing
Inc
330,601
496
(a)
Axon
Enterprise
Inc
210,056
5,588
Carrier
Global
Corp
406,359
20
Dover
Corp
3,787
1,694
Eaton
Corp
PLC
561,697
127
EMCOR
Group
Inc
56,651
281
FedEx
Corp
76,952
2,015
Fortive
Corp
143,932
89
Fortune
Brands
Innovations
Inc
7,416
865
Jacobs
Solutions
Inc
121,602
1,339
TransUnion
135,641
57
Union
Pacific
Corp
13,228
2,906
United
Parcel
Service
Inc,
Class
B
389,578
203
United
Rentals
Inc
164,998
TOTAL
INDUSTRIALS
2,827,022
INFORMATION
TECHNOLOGY
-
28.9%
323
(a)
Adobe
Inc
154,420
1,912
(a)
Advanced
Micro
Devices
Inc
275,462
275
(a)
Akamai
Technologies
Inc
27,797
1,932
Applied
Materials
Inc
350,813
749
(a)
Atlassian
Corp
PLC,
Class
A
141,216
700
(a)
Cadence
Design
Systems
Inc
193,284
704
(a)
First
Solar
Inc
136,914
48
(a)
Gartner
Inc
24,120
8,934
Hewlett
Packard
Enterprise
Co
174,124
6,727
HP
Inc
238,943
15,716
Intel
Corp
338,208
2,777
International
Business
Machines
Corp
574,061
2,255
Juniper
Networks
Inc
87,720
1,200
(a)
Keysight
Technologies
Inc
178,812
3,713
Marvell
Technology
Inc
297,448
5,857
Microsoft
Corp
2,379,992
1,415
NetApp
Inc
163,164
20,261
NVIDIA
Corp
2,689,850
153
NXP
Semiconductors
NV
35,879
164
(a)
Palo
Alto
Networks
Inc
59,094
1,704
Salesforce
Inc
496,494
1,378
Seagate
Technology
Holdings
PLC
138,310
591
(a)
Synopsys
Inc
303,544
1,114
Texas
Instruments
Inc
226,320
Portfolio
of
Investments
October
31,
2024
(continued)
NULC
SHARES
DESCRIPTION
VALUE
INFORMATION
TECHNOLOGY
(continued)
1,691
(a)
Trimble
Inc
$
102,306
2,259
(a)
Western
Digital
Corp
147,535
TOTAL
INFORMATION
TECHNOLOGY
9,935,830
MATERIALS
-
2.8%
1,955
Ball
Corp
115,834
1,772
Ecolab
Inc
435,434
1,790
LyondellBasell
Industries
NV,
Class
A
155,461
2,248
Mosaic
Co/The
60,156
1,552
Newmont
Corp
70,523
1,026
Steel
Dynamics
Inc
133,893
TOTAL
MATERIALS
971,301
REAL
ESTATE
-
2.1%
1,788
American
Tower
Corp
381,810
162
Equinix
Inc
147,109
1,388
Iron
Mountain
Inc
171,737
193
Welltower
Inc
26,032
TOTAL
REAL
ESTATE
726,688
UTILITIES
-
2.0%
1,136
American
Water
Works
Co
Inc
156,893
2,387
Consolidated
Edison
Inc
242,710
6,894
Exelon
Corp
270,934
TOTAL
UTILITIES
670,537
TOTAL
COMMON
STOCKS
(Cost
$26,065,633)
34,285,574
TOTAL
LONG-TERM
INVESTMENTS
(Cost
$26,065,633)
34,285,574
OTHER
ASSETS
&
LIABILITIES,
NET
-
0.2%
59,232
NET
ASSETS
-
100%
$
34,344,806
For
Fund
portfolio
compliance
purposes,
the
Fund’s
industry
classifications
refer
to
any
one
or
more
of
the
industry
sub-classifications
used
by
one
or
more
widely
recognized
market
indexes
or
ratings
group
indexes,
and/or
as
defined
by
Fund
management.
This
definition
may
not
apply
for
purposes
of
this
report,
which
may
combine
industry
sub-classifications
into
sectors
for
reporting
ease.
(a)
Non-income
producing;
issuer
has
not
declared
an
ex-dividend
date
within
the
past
twelve
months.
S&P
Standard
&
Poor's
See
Notes
to
Financial
Statements
Portfolio
of
Investments
October
31,
2024
NULG
SHARES
DESCRIPTION
VALUE
LONG-TERM
INVESTMENTS
-
99.8%
COMMON
STOCKS
-
99.8%
COMMUNICATION
SERVICES
-
9.8%
400,762
Alphabet
Inc,
Class
A
$
68,574,386
394,307
Alphabet
Inc,
Class
C
68,092,876
1,345,185
(a)
Warner
Bros
Discovery
Inc
10,936,354
TOTAL
COMMUNICATION
SERVICES
147,603,616
CONSUMER
DISCRETIONARY
-
15.1%
136,183
(a)
Airbnb
Inc
18,356,107
17,582
(a)
Aptiv
PLC
999,185
3,212
(a)
AutoZone
Inc
9,664,908
6,597
Booking
Holdings
Inc
30,849,221
358,467
(a)
Chipotle
Mexican
Grill
Inc
19,991,705
88,095
(a)
Deckers
Outdoor
Corp
14,173,604
135,287
(a)
DoorDash
Inc,
Class
A
21,199,473
19,595
(a)
Expedia
Group
Inc
3,062,894
11,796
(a)
MercadoLibre
Inc
24,030,575
18,948
(a)
O'Reilly
Automotive
Inc
21,849,697
209,055
(a)
Tesla
Inc
52,232,392
71,737
Williams-Sonoma
Inc
9,622,084
TOTAL
CONSUMER
DISCRETIONARY
226,031,845
CONSUMER
STAPLES
-
3.3%
49,453
Church
&
Dwight
Co
Inc
4,940,849
46,586
Costco
Wholesale
Corp
40,724,550
41,712
Lamb
Weston
Holdings
Inc
3,240,605
TOTAL
CONSUMER
STAPLES
48,906,004
FINANCIALS
-
7.7%
14,287
FactSet
Research
Systems
Inc
6,487,155
85,634
Mastercard
Inc
42,781,890
48,291
Moody's
Corp
21,926,046
154,330
Visa
Inc,
Class
A
44,732,550
TOTAL
FINANCIALS
115,927,641
HEALTH
CARE
-
10.2%
60,789
Agilent
Technologies
Inc
7,921,414
229,925
(a)
Edwards
Lifesciences
Corp
15,407,274
66,022
Eli
Lilly
&
Co
54,781,094
35,203
(a)
IDEXX
Laboratories
Inc
14,324,805
37,356
(a)
Insulet
Corp
8,649,035
20,169
McKesson
Corp
10,096,400
5,647
(a)
Mettler-Toledo
International
Inc
7,294,512
42,090
West
Pharmaceutical
Services
Inc
12,960,774
116,632
Zoetis
Inc
20,851,469
TOTAL
HEALTH
CARE
152,286,777
INDUSTRIALS
-
9.8%
41,429
(a)
Axon
Enterprise
Inc
17,545,181
23,900
Broadridge
Financial
Solutions
Inc
5,039,554
115,970
Cintas
Corp
23,867,786
371,217
(a)
Copart
Inc
19,106,539
34,508
Graco
Inc
2,810,677
8,572
IDEX
Corp
1,839,894
91,077
Old
Dominion
Freight
Line
Inc
18,335,622
73,280
Quanta
Services
Inc
22,103,446
139,028
Veralto
Corp
14,207,271
20,624
WW
Grainger
Inc
22,876,760
TOTAL
INDUSTRIALS
147,732,730
INFORMATION
TECHNOLOGY
-
43.0%
57,629
(a)
Adobe
Inc
27,551,272
91,531
(a)
Advanced
Micro
Devices
Inc
13,186,871
136,932
Applied
Materials
Inc
24,864,113
77,835
(a)
Autodesk
Inc
22,089,573
42,434
(a)
Gartner
Inc
21,323,085
35,302
(a)
Keysight
Technologies
Inc
5,260,351
Portfolio
of
Investments
October
31,
2024
(continued)
NULG
SHARES
DESCRIPTION
VALUE
INFORMATION
TECHNOLOGY
(continued)
186,652
Lam
Research
Corp
$
13,877,576
248,295
Marvell
Technology
Inc
19,890,913
452,044
Microsoft
Corp
183,688,079
1,570,270
NVIDIA
Corp
208,469,045
8,961
(a)
Palo
Alto
Networks
Inc
3,228,917
69,090
(a)
PTC
Inc
12,804,450
110,836
Salesforce
Inc
32,294,285
115,280
Seagate
Technology
Holdings
PLC
11,570,654
7,103
(a)
ServiceNow
Inc
6,627,028
37,490
(a)
Synopsys
Inc
19,255,239
79,874
(a)
Workday
Inc,
Class
A
18,678,535
TOTAL
INFORMATION
TECHNOLOGY
644,659,986
MATERIALS
-
0.9%
53,308
Ecolab
Inc
13,099,375
TOTAL
MATERIALS
13,099,375
TOTAL
COMMON
STOCKS
(Cost
$1,242,259,974)
1,496,247,974
TOTAL
LONG-TERM
INVESTMENTS
(Cost
$1,242,259,974)
1,496,247,974
OTHER
ASSETS
&
LIABILITIES,
NET
-
0.2%
2,760,964
NET
ASSETS
-
100%
$
1,499,008,938
For
Fund
portfolio
compliance
purposes,
the
Fund’s
industry
classifications
refer
to
any
one
or
more
of
the
industry
sub-classifications
used
by
one
or
more
widely
recognized
market
indexes
or
ratings
group
indexes,
and/or
as
defined
by
Fund
management.
This
definition
may
not
apply
for
purposes
of
this
report,
which
may
combine
industry
sub-classifications
into
sectors
for
reporting
ease.
(a)
Non-income
producing;
issuer
has
not
declared
an
ex-dividend
date
within
the
past
twelve
months.
See
Notes
to
Financial
Statements
Portfolio
of
Investments
October
31,
2024
NULV
SHARES
DESCRIPTION
VALUE
LONG-TERM
INVESTMENTS
-
99.8%
COMMON
STOCKS
-
99.8%
COMMUNICATION
SERVICES
-
4.3%
135,625
Interpublic
Group
of
Cos
Inc/The
$
3,987,375
801,675
Verizon
Communications
Inc
33,774,568
358,268
Walt
Disney
Co/The
34,465,381
TOTAL
COMMUNICATION
SERVICES
72,227,324
CONSUMER
DISCRETIONARY
-
5.7%
108,856
Ferguson
Enterprises
Inc
21,416,329
32,747
Home
Depot
Inc/The
12,894,131
121,041
Lowe's
Cos
Inc
31,692,165
56,916
PulteGroup
Inc
7,372,330
238,455
Starbucks
Corp
23,297,054
TOTAL
CONSUMER
DISCRETIONARY
96,672,009
CONSUMER
STAPLES
-
9.7%
349,231
Archer-Daniels-Midland
Co
19,281,043
100,040
Bunge
Global
SA
8,405,361
112,196
Church
&
Dwight
Co
Inc
11,209,502
585,802
Coca-Cola
Co/The
38,258,729
361,084
Keurig
Dr
Pepper
Inc
11,897,718
94,040
Kimberly-Clark
Corp
12,618,287
425,654
Kroger
Co/The
23,738,723
202,151
PepsiCo
Inc
33,573,238
37,367
Sysco
Corp
2,800,657
18,772
Target
Corp
2,816,551
TOTAL
CONSUMER
STAPLES
164,599,809
ENERGY
-
3.4%
672,876
Baker
Hughes
Co
25,623,118
114,007
HF
Sinclair
Corp
4,401,811
279,182
ONEOK
Inc
27,047,152
TOTAL
ENERGY
57,072,081
FINANCIALS
-
21.6%
74,477
American
Express
Co
20,114,748
466,652
Bank
of
America
Corp
19,515,387
367,381
Bank
of
New
York
Mellon
Corp/The
27,685,832
74,386
Cboe
Global
Markets
Inc
15,886,618
462,336
Citigroup
Inc
29,668,101
161,126
Fidelity
National
Information
Services
Inc
14,457,836
163,911
(a)
Fiserv
Inc
32,437,987
50,034
Goldman
Sachs
Group
Inc/The
25,907,105
61,086
Hartford
Financial
Services
Group
Inc/The
6,746,338
114,541
Marsh
&
McLennan
Cos
Inc
24,997,428
94,016
MetLife
Inc
7,372,735
202,084
Morgan
Stanley
23,492,265
146,781
PNC
Financial
Services
Group
Inc/The
27,634,459
100,756
Progressive
Corp/The
24,466,579
11,006
Prudential
Financial
Inc
1,348,015
627,264
Regions
Financial
Corp
14,972,792
187,969
(a)
Robinhood
Markets
Inc,
Class
A
4,415,392
9,785
S&P
Global
Inc
4,700,322
104,352
Travelers
Cos
Inc/The
25,664,331
62,267
Truist
Financial
Corp
2,680,594
37,653
Willis
Towers
Watson
PLC
11,378,360
TOTAL
FINANCIALS
365,543,224
HEALTH
CARE
-
15.0%
102,602
Agilent
Technologies
Inc
13,370,067
100,625
Amgen
Inc
32,216,100
27,138
Bristol-Myers
Squibb
Co
1,513,486
172,111
Cardinal
Health
Inc
18,677,486
99,110
Cencora
Inc
22,605,009
80,103
Cigna
Group/The
25,217,225
122,942
Danaher
Corp
30,201,932
Portfolio
of
Investments
October
31,
2024
(continued)
NULV
SHARES
DESCRIPTION
VALUE
HEALTH
CARE
(continued)
123,301
Gilead
Sciences
Inc
$
10,951,595
68,765
HCA
Healthcare
Inc
24,668,756
82,754
(a)
Hologic
Inc
6,692,316
187,701
Johnson
&
Johnson
30,005,882
268,217
Merck
&
Co
Inc
27,443,963
785
(a)
Regeneron
Pharmaceuticals
Inc
657,987
103,932
(a)
Solventum
Corp
7,543,385
1,191
STERIS
PLC
264,223
14,726
Zimmer
Biomet
Holdings
Inc
1,574,504
TOTAL
HEALTH
CARE
253,603,916
INDUSTRIALS
-
12.4%
196,435
3M
Co
25,236,004
78,420
Automatic
Data
Processing
Inc
22,682,201
54,102
Broadridge
Financial
Solutions
Inc
11,407,948
46,692
Caterpillar
Inc
17,565,530
29,252
CNH
Industrial
NV
328,500
70,466
Deere
&
Co
28,516,886
6,524
Eaton
Corp
PLC
2,163,228
66,766
FedEx
Corp
18,283,869
248,051
Fortive
Corp
17,718,283
118,376
Ingersoll
Rand
Inc
11,364,096
88,330
Jacobs
Solutions
Inc
12,417,431
130,716
Johnson
Controls
International
plc
9,875,594
31,349
Owens
Corning
5,542,190
121,842
United
Parcel
Service
Inc,
Class
B
16,334,138
14,374
United
Rentals
Inc
11,683,187
TOTAL
INDUSTRIALS
211,119,085
INFORMATION
TECHNOLOGY
-
15.0%
1,301
Accenture
PLC,
Class
A
448,611
127,226
Analog
Devices
Inc
28,385,393
20,246
(a)
Aspentech
Corp
4,752,344
444,776
Cisco
Systems
Inc
24,360,381
71,713
(a)
First
Solar
Inc
13,946,744
279,996
HP
Inc
9,945,458
1,282,241
Intel
Corp
27,593,826
169,947
International
Business
Machines
Corp
35,131,444
99,216
NXP
Semiconductors
NV
23,266,152
264,884
Oracle
Corp
44,458,131
67,279
(a)
Qorvo
Inc
4,794,301
166,056
Texas
Instruments
Inc
33,735,937
52,249
(a)
Western
Digital
Corp
3,412,382
TOTAL
INFORMATION
TECHNOLOGY
254,231,104
MATERIALS
-
4.3%
27,511
Ball
Corp
1,630,027
90,731
Ecolab
Inc
22,295,329
183,618
LyondellBasell
Industries
NV,
Class
A
15,947,223
227,809
Mosaic
Co/The
6,096,169
182,913
Newmont
Corp
8,311,567
77,779
PPG
Industries
Inc
9,684,263
68,605
Steel
Dynamics
Inc
8,952,952
TOTAL
MATERIALS
72,917,530
REAL
ESTATE
-
3.8%
108,072
American
Tower
Corp
23,077,695
7,992
Equinix
Inc
7,257,375
14,850
Iron
Mountain
Inc
1,837,391
9,888
Public
Storage
3,253,745
219,176
Welltower
Inc
29,562,459
TOTAL
REAL
ESTATE
64,988,665
SHARES
DESCRIPTION
VALUE
UTILITIES
-
4.6%
5,334
American
Water
Works
Co
Inc
$
736,679
48,673
Atmos
Energy
Corp
6,754,839
184,010
CenterPoint
Energy
Inc
5,433,815
230,110
Consolidated
Edison
Inc
23,397,585
8,912
Essential
Utilities
Inc
344,003
247,776
Eversource
Energy
16,316,050
618,588
Exelon
Corp
24,310,508
TOTAL
UTILITIES
77,293,479
TOTAL
COMMON
STOCKS
(Cost
$1,529,122,937)
1,690,268,226
TOTAL
LONG-TERM
INVESTMENTS
(Cost
$1,529,122,937)
1,690,268,226
OTHER
ASSETS
&
LIABILITIES,
NET
-
0.2%
4,227,279
NET
ASSETS
-
100%
$
1,694,495,505
For
Fund
portfolio
compliance
purposes,
the
Fund’s
industry
classifications
refer
to
any
one
or
more
of
the
industry
sub-classifications
used
by
one
or
more
widely
recognized
market
indexes
or
ratings
group
indexes,
and/or
as
defined
by
Fund
management.
This
definition
may
not
apply
for
purposes
of
this
report,
which
may
combine
industry
sub-classifications
into
sectors
for
reporting
ease.
(a)
Non-income
producing;
issuer
has
not
declared
an
ex-dividend
date
within
the
past
twelve
months.
S&P
Standard
&
Poor's
See
Notes
to
Financial
Statements
Portfolio
of
Investments
October
31,
2024
NUMG
SHARES
DESCRIPTION
VALUE
LONG-TERM
INVESTMENTS
-
99.9%
COMMON
STOCKS
-
99.9%
COMMUNICATION
SERVICES
-
6.6%
100,133
(a)
Liberty
Media
Corp-Liberty
Formula
One,
Class
C
$
7,994,619
82,086
(a)
Live
Nation
Entertainment
Inc
9,615,554
1,089,296
(a)
Warner
Bros
Discovery
Inc
8,855,976
TOTAL
COMMUNICATION
SERVICES
26,466,149
CONSUMER
DISCRETIONARY
-
9.2%
87,651
(a)
Aptiv
PLC
4,981,207
31,096
(a)
Burlington
Stores
Inc
7,704,656
61,325
(a)
Deckers
Outdoor
Corp
9,866,579
16,502
Pool
Corp
5,967,783
298
Tractor
Supply
Co
79,122
60,924
Williams-Sonoma
Inc
8,171,736
TOTAL
CONSUMER
DISCRETIONARY
36,771,083
FINANCIALS
-
6.9%
161,853
Equitable
Holdings
Inc
7,338,415
7,016
FactSet
Research
Systems
Inc
3,185,685
36,998
LPL
Financial
Holdings
Inc
10,440,096
294,172
(a)
Robinhood
Markets
Inc,
Class
A
6,910,100
TOTAL
FINANCIALS
27,874,296
HEALTH
CARE
-
13.0%
43,029
(a)
DaVita
Inc
6,015,884
85,608
(a)
Incyte
Corp
6,345,265
7,700
(a)
Mettler-Toledo
International
Inc
9,946,475
56,023
(a)
Veeva
Systems
Inc,
Class
A
11,699,283
26,308
(a)
Waters
Corp
8,500,378
30,831
West
Pharmaceutical
Services
Inc
9,493,790
TOTAL
HEALTH
CARE
52,001,075
INDUSTRIALS
-
22.3%
27,441
(a)
Axon
Enterprise
Inc
11,621,264
31,191
Broadridge
Financial
Solutions
Inc
6,576,934
147,248
(a)
CoStar
Group
Inc
10,718,182
22,583
EMCOR
Group
Inc
10,073,599
16,682
Hubbell
Inc
7,123,714
93,902
Ingersoll
Rand
Inc
9,014,592
14,875
Lennox
International
Inc
8,963,229
94,048
Veralto
Corp
9,610,765
13,986
WW
Grainger
Inc
15,513,691
TOTAL
INDUSTRIALS
89,215,970
INFORMATION
TECHNOLOGY
-
36.2%
26,223
(a)
ANSYS
Inc
8,402,111
119,313
(a)
Dayforce
Inc
8,465,257
125,626
(a)
DocuSign
Inc
8,715,932
68,555
(a)
Enphase
Energy
Inc
5,692,807
7,780
(a)
Fair
Isaac
Corp
15,506,396
25,734
(a)
Gartner
Inc
12,931,335
58,065
(a)
GoDaddy
Inc,
Class
A
9,685,242
19,680
(a)
HubSpot
Inc
10,918,267
46,867
(a)
Keysight
Technologies
Inc
6,983,652
31,105
(a)
Manhattan
Associates
Inc
8,191,813
51,539
(a)
PTC
Inc
9,551,723
140,607
(a)
Pure
Storage
Inc,
Class
A
7,037,380
86,823
Seagate
Technology
Holdings
PLC
8,714,425
137,762
(a)
Trade
Desk
Inc/The,
Class
A
16,560,370
42,715
(a)
Zscaler
Inc
7,722,445
TOTAL
INFORMATION
TECHNOLOGY
145,079,155
MATERIALS
-
3.2%
46,458
Vulcan
Materials
Co
12,726,240
TOTAL
MATERIALS
12,726,240
SHARES
DESCRIPTION
VALUE
REAL
ESTATE
-
2.5%
43,686
SBA
Communications
Corp
$
10,024,626
TOTAL
REAL
ESTATE
10,024,626
TOTAL
COMMON
STOCKS
(Cost
$361,055,971)
400,158,594
TOTAL
LONG-TERM
INVESTMENTS
(Cost
$361,055,971)
400,158,594
OTHER
ASSETS
&
LIABILITIES,
NET
-
0.1%
449,625
NET
ASSETS
-
100%
$
400,608,219
For
Fund
portfolio
compliance
purposes,
the
Fund’s
industry
classifications
refer
to
any
one
or
more
of
the
industry
sub-classifications
used
by
one
or
more
widely
recognized
market
indexes
or
ratings
group
indexes,
and/or
as
defined
by
Fund
management.
This
definition
may
not
apply
for
purposes
of
this
report,
which
may
combine
industry
sub-classifications
into
sectors
for
reporting
ease.
(a)
Non-income
producing;
issuer
has
not
declared
an
ex-dividend
date
within
the
past
twelve
months.
See
Notes
to
Financial
Statements
Portfolio
of
Investments
October
31,
2024
NUMV
SHARES
DESCRIPTION
VALUE
LONG-TERM
INVESTMENTS
-
99.9%
COMMON
STOCKS
-
99.9%
COMMUNICATION
SERVICES
-
2.1%
89,382
Fox
Corp,
Class
B
$
3,482,323
144,173
Interpublic
Group
of
Cos
Inc/The
4,238,686
10,550
Paramount
Global
115,417
TOTAL
COMMUNICATION
SERVICES
7,836,426
CONSUMER
DISCRETIONARY
-
9.0%
42,320
(a)
Aptiv
PLC
2,405,046
42,378
Bath
&
Body
Works
Inc
1,202,688
32,579
(a)
CarMax
Inc
2,358,068
37,696
Ferguson
Enterprises
Inc
7,416,311
31,009
Genuine
Parts
Co
3,556,732
105,246
LKQ
Corp
3,872,000
6,587
Pool
Corp
2,382,123
52,484
PulteGroup
Inc
6,798,252
7,545
(a)
Ulta
Beauty
Inc
2,783,954
TOTAL
CONSUMER
DISCRETIONARY
32,775,174
CONSUMER
STAPLES
-
5.7%
54,471
Bunge
Global
SA
4,576,653
28,891
Church
&
Dwight
Co
Inc
2,886,500
3,661
Clorox
Co/The
580,452
58,637
Conagra
Brands
Inc
1,696,955
60,210
Hormel
Foods
Corp
1,839,415
75,775
Kellanova
6,111,254
40,715
McCormick
&
Co
Inc/MD
3,185,542
TOTAL
CONSUMER
STAPLES
20,876,771
ENERGY
-
4.8%
209,900
Baker
Hughes
Co
7,992,992
98,076
ONEOK
Inc
9,501,603
TOTAL
ENERGY
17,494,595
FINANCIALS
-
17.2%
105,087
Ally
Financial
Inc
3,683,299
3,664
(a)
Arch
Capital
Group
Ltd
361,124
27,566
Assurant
Inc
5,284,402
30,023
Cboe
Global
Markets
Inc
6,412,012
5,745
Citizens
Financial
Group
Inc
241,980
7,945
Discover
Financial
Services
1,179,276
20,430
Equitable
Holdings
Inc
926,296
63,722
Fifth
Third
Bancorp
2,783,377
63,805
Hartford
Financial
Services
Group
Inc/The
7,046,624
411,573
Huntington
Bancshares
Inc/OH
6,416,423
10,205
MarketAxess
Holdings
Inc
2,953,531
28,207
Nasdaq
Inc
2,085,062
27,925
Northern
Trust
Corp
2,807,021
76,345
Principal
Financial
Group
Inc
6,290,828
211,352
(a)
Robinhood
Markets
Inc,
Class
A
4,964,659
30,474
State
Street
Corp
2,827,987
16,002
Synchrony
Financial
882,350
19,293
Willis
Towers
Watson
PLC
5,830,152
TOTAL
FINANCIALS
62,976,403
HEALTH
CARE
-
8.9%
228,413
(a)
Avantor
Inc
5,109,599
59,494
Cardinal
Health
Inc
6,456,289
56,086
(a)
Hologic
Inc
4,535,675
12,720
Labcorp
Holdings
Inc
2,903,594
9,994
Quest
Diagnostics
Inc
1,547,371
83,247
(a)
Solventum
Corp
6,042,067
26,559
STERIS
PLC
5,892,114
TOTAL
HEALTH
CARE
32,486,709
SHARES
DESCRIPTION
VALUE
INDUSTRIALS
-
14.0%
40,591
Allegion
plc
$
5,667,721
27,348
Broadridge
Financial
Solutions
Inc
5,766,599
5,646
CH
Robinson
Worldwide
Inc
581,764
196,490
CNH
Industrial
NV
2,206,583
9,354
Dover
Corp
1,770,993
41,225
Expeditors
International
of
Washington
Inc
4,905,775
5,799
IDEX
Corp
1,244,697
34,773
Ingersoll
Rand
Inc
3,338,208
2,124
Jacobs
Solutions
Inc
298,592
12,378
JB
Hunt
Transport
Services
Inc
2,235,714
31,854
Owens
Corning
5,631,469
43,069
Pentair
PLC
4,268,999
1,038
Toro
Co/The
83,538
11,537
United
Rentals
Inc
9,377,274
31,191
Xylem
Inc/NY
3,798,440
TOTAL
INDUSTRIALS
51,176,366
INFORMATION
TECHNOLOGY
-
11.0%
33,016
(a)
Akamai
Technologies
Inc
3,337,257
14,980
(a)
Aspentech
Corp
3,516,255
28,350
(a)
First
Solar
Inc
5,513,508
220,940
Gen
Digital
Inc
6,431,564
294,357
Hewlett
Packard
Enterprise
Co
5,737,018
28,337
(a)
Keysight
Technologies
Inc
4,222,496
46,976
NetApp
Inc
5,416,803
87,049
(a)
Trimble
Inc
5,266,465
8,562
(a)
Western
Digital
Corp
559,184
TOTAL
INFORMATION
TECHNOLOGY
40,000,550
MATERIALS
-
7.7%
257
Avery
Dennison
Corp
53,207
89,006
Ball
Corp
5,273,605
27,315
Crown
Holdings
Inc
2,555,318
65,884
International
Flavors
&
Fragrances
Inc
6,550,846
66,793
LyondellBasell
Industries
NV,
Class
A
5,800,972
36,759
PPG
Industries
Inc
4,576,863
25,017
Steel
Dynamics
Inc
3,264,719
TOTAL
MATERIALS
28,075,530
REAL
ESTATE
-
11.1%
38,000
Alexandria
Real
Estate
Equities
Inc
4,238,900
243
AvalonBay
Communities
Inc
53,851
74,597
BXP
Inc
6,009,534
40,749
(a)
CBRE
Group
Inc,
Class
A
5,336,897
260,232
Healthpeak
Properties
Inc
5,842,208
325,170
Host
Hotels
&
Resorts
Inc
5,605,931
64,069
Iron
Mountain
Inc
7,927,257
3,376
Kimco
Realty
Corp
80,079
1,353
Regency
Centers
Corp
96,658
93,566
WP
Carey
Inc
5,213,498
TOTAL
REAL
ESTATE
40,404,813
UTILITIES
-
8.4%
47,090
American
Water
Works
Co
Inc
6,503,600
46,506
Atmos
Energy
Corp
6,454,103
133,247
Essential
Utilities
Inc
5,143,334
95,462
Eversource
Energy
6,286,173
Portfolio
of
Investments
October
31,
2024
(continued)
NUMV
SHARES
DESCRIPTION
VALUE
UTILITIES
(continued)
174,014
NiSource
Inc
$
6,118,332
TOTAL
UTILITIES
30,505,542
TOTAL
COMMON
STOCKS
(Cost
$322,254,770)
364,608,879
TOTAL
LONG-TERM
INVESTMENTS
(Cost
$322,254,770)
364,608,879
OTHER
ASSETS
&
LIABILITIES,
NET
-
0.1%
471,654
NET
ASSETS
-
100%
$
365,080,533
For
Fund
portfolio
compliance
purposes,
the
Fund’s
industry
classifications
refer
to
any
one
or
more
of
the
industry
sub-classifications
used
by
one
or
more
widely
recognized
market
indexes
or
ratings
group
indexes,
and/or
as
defined
by
Fund
management.
This
definition
may
not
apply
for
purposes
of
this
report,
which
may
combine
industry
sub-classifications
into
sectors
for
reporting
ease.
(a)
Non-income
producing;
issuer
has
not
declared
an
ex-dividend
date
within
the
past
twelve
months.
See
Notes
to
Financial
Statements
Portfolio
of
Investments
October
31,
2024
NUSC
SHARES
DESCRIPTION
VALUE
LONG-TERM
INVESTMENTS
-
99.8%
COMMON
STOCK
RIGHTS
-
0.0%
HEALTH
CARE
-
0.0%
26,689
(a)
Bristol-Myers
Squibb
Co
$
18,682
23,934
(a)
CinCor
Pharma
Inc
73,238
TOTAL
HEALTH
CARE
91,920
TOTAL
COMMON
STOCK
RIGHTS
(Cost
$0)
91,920
SHARES
DESCRIPTION
VALUE
COMMON
STOCKS
-
99.8%
COMMUNICATION
SERVICES
-
3.1%
137,284
(b)
Advantage
Solutions
Inc
420,089
9,650
(b)
Anterix
Inc
313,432
8,088
(b),(c)
Atlanta
Braves
Holdings
Inc,
Class
A
340,181
55,707
(b)
Atlanta
Braves
Holdings
Inc,
Class
C
2,200,984
76,847
(b)
Cars.com
Inc
1,228,784
86,138
(b)
Cinemark
Holdings
Inc
2,562,605
291,796
(b)
Clear
Channel
Outdoor
Holdings
Inc
428,940
81,293
(b)
Eventbrite
Inc,
Class
A
260,138
82,664
(b)
Frontier
Communications
Parent
Inc
2,953,585
71,198
(b)
Gogo
Inc
466,347
88,613
Gray
Television
Inc
505,980
8,097
(b)
IMAX
Corp
196,757
51,578
Iridium
Communications
Inc
1,512,783
52,838
John
Wiley
&
Sons
Inc,
Class
A
2,604,913
36,540
(b)
Liberty
Latin
America
Ltd,
Class
A
357,727
26,475
(b)
Lions
Gate
Entertainment
Corp,
Class
B
186,649
302,790
(b)
Lumen
Technologies
Inc
1,934,828
154,438
(b)
Magnite
Inc
1,927,386
28,351
Marcus
Corp/The
534,983
39,797
(b)
MediaAlpha
Inc,
Class
A
681,723
90,711
New
York
Times
Co/The,
Class
A
5,065,302
63,953
(b)
QuinStreet
Inc
1,343,013
30,580
Scholastic
Corp
759,301
109,821
(b)
Stagwell
Inc
681,988
47,356
(b)
Taboola.com
Ltd
157,222
171,657
TEGNA
Inc
2,820,324
118,864
(b)
TripAdvisor
Inc
1,906,579
94,480
(b)
Vimeo
Inc
450,670
56,018
(b)
Ziff
Davis
Inc
2,591,953
40,056
(b)
ZipRecruiter
Inc,
Class
A
371,319
TOTAL
COMMUNICATION
SERVICES
37,766,485
CONSUMER
DISCRETIONARY
-
16.2%
367,045
ADT
Inc
2,642,724
47,255
Advance
Auto
Parts
Inc
1,686,531
18,569
American
Eagle
Outfitters
Inc
363,767
6,922
(b)
America's
Car-Mart
Inc/TX
270,235
186,672
Aramark
7,061,802
77,894
Arko
Corp
517,995
2,819
(b)
Asbury
Automotive
Group
Inc
642,281
35,332
(b)
Beazer
Homes
USA
Inc
1,086,812
55,777
(b)
Bright
Horizons
Family
Solutions
Inc
7,444,556
33,366
(b)
Brinker
International
Inc
3,427,022
30,280
Camping
World
Holdings
Inc,
Class
A
607,417
10,869
Columbia
Sportswear
Co
874,628
160,311
(b)
Coursera
Inc
1,114,161
67,373
(b)
Crocs
Inc
7,264,157
41,145
(b)
Dave
&
Buster's
Entertainment
Inc
1,519,485
8,113
(b)
Etsy
Inc
417,333
36,397
(b)
European
Wax
Center
Inc
261,694
6,518
(b)
Five
Below
Inc
617,841
Portfolio
of
Investments
October
31,
2024
(continued)
NUSC
SHARES
DESCRIPTION
VALUE
CONSUMER
DISCRETIONARY
(continued)
17,413
Foot
Locker
Inc
$
403,807
94,657
(b)
Frontdoor
Inc
4,703,506
165,983
(b)
GameStop
Corp,
Class
A
3,681,503
93,992
Gap
Inc/The
1,952,214
13,234
Group
1
Automotive
Inc
4,821,411
167,154
H&R
Block
Inc
9,984,108
36,444
(b)
Hanesbrands
Inc
253,286
127,328
Harley-Davidson
Inc
4,068,130
63,292
Hasbro
Inc
4,153,854
27,403
(b)
Helen
of
Troy
Ltd
1,744,201
5,023
(b)
Hilton
Grand
Vacations
Inc
185,248
13,653
KB
Home
1,071,761
20,022
Kontoor
Brands
Inc
1,714,484
19,540
LCI
Industries
2,174,411
213,586
(b)
Leslie's
Inc
574,546
115,388
Levi
Strauss
&
Co,
Class
A
1,971,981
25,542
Lithia
Motors
Inc
8,489,395
409,300
(b),(c)
Lucid
Group
Inc
904,553
366,753
(b),(c)
Luminar
Technologies
Inc
284,380
127,368
Macy's
Inc
1,953,825
25,012
(b)
Malibu
Boats
Inc,
Class
A
1,122,539
24,461
(b)
MarineMax
Inc
712,549
8,435
Marriott
Vacations
Worldwide
Corp
649,748
369,155
(b)
Mattel
Inc
7,523,379
1,332
Meritage
Homes
Corp
241,358
57,587
(b)
Modine
Manufacturing
Co
6,782,021
35,528
Monro
Inc
973,822
17,959
Movado
Group
Inc
331,703
22,182
Murphy
USA
Inc
10,834,798
95,205
(b)
National
Vision
Holdings
Inc
990,132
456,039
Newell
Brands
Inc
4,013,143
54,850
Nordstrom
Inc
1,240,159
113,458
(b)
Petco
Health
&
Wellness
Co
Inc,
Class
A
484,466
51,032
(b)
Planet
Fitness
Inc
4,007,033
113,871
(b)
Playa
Hotels
&
Resorts
NV
967,904
33,398
PVH
Corp
3,288,367
21,382
(b)
Sally
Beauty
Holdings
Inc
277,966
154,160
Service
Corp
International/US
12,587,164
9,330
Signet
Jewelers
Ltd
855,374
150,508
(b)
Sonos
Inc
1,885,865
25,015
Standard
Motor
Products
Inc
805,233
50,402
(b)
Stride
Inc
4,701,499
78,605
Tapestry
Inc
3,729,807
27,908
(b)
Taylor
Morrison
Home
Corp
1,911,698
38,562
Thor
Industries
Inc
4,013,533
13,070
(b)
TopBuild
Corp
4,618,677
180,184
(b)
Topgolf
Callaway
Brands
Corp
1,749,587
9,022
(b)
Tri
Pointe
Homes
Inc
364,759
45,873
(b)
United
Parks
&
Resorts
Inc
2,414,296
26,349
Vail
Resorts
Inc
4,365,766
143,078
(b)
Valvoline
Inc
5,763,182
26,906
VF
Corp
557,223
103,182
(b)
Warby
Parker
Inc,
Class
A
1,746,871
18,250
Whirlpool
Corp
1,889,057
35,402
Winnebago
Industries
Inc
1,983,928
30,314
(b)
Xponential
Fitness
Inc,
Class
A
371,347
62,802
(b)
YETI
Holdings
Inc
2,211,258
TOTAL
CONSUMER
DISCRETIONARY
195,878,256
CONSUMER
STAPLES
-
3.8%
39,646
Andersons
Inc/The
1,799,928
23,769
Casey's
General
Stores
Inc
9,365,461
196,094
(b)
Darling
Ingredients
Inc
7,669,236
SHARES
DESCRIPTION
VALUE
CONSUMER
STAPLES
(continued)
56,680
(b)
Freshpet
Inc
$
7,512,367
108,952
(b)
Hain
Celestial
Group
Inc/The
951,151
4,437
(b)
Performance
Food
Group
Co
360,506
34,359
Spectrum
Brands
Holdings
Inc
3,079,254
19,517
(b)
Sprouts
Farmers
Market
Inc
2,506,568
140,296
(b)
US
Foods
Holding
Corp
8,649,249
37,014
(b)
Vital
Farms
Inc
1,283,646
9,923
WD-40
Co
2,600,521
TOTAL
CONSUMER
STAPLES
45,777,887
ENERGY
-
2.7%
181,820
Archrock
Inc
3,640,036
66,584
Cactus
Inc,
Class
A
3,947,765
233,441
ChampionX
Corp
6,587,705
21,750
Excelerate
Energy
Inc,
Class
A
519,390
107,962
(b)
Expro
Group
Holdings
NV
1,376,516
12,162
(b)
Innovex
International
Inc
172,579
211,294
NOV
Inc
3,277,170
319,527
TechnipFMC
PLC
8,528,176
62,325
Weatherford
International
PLC
4,923,675
TOTAL
ENERGY
32,973,012
FINANCIALS
-
17.4%
38,793
Affiliated
Managers
Group
Inc
7,521,963
718,083
AGNC
Investment
Corp
6,685,353
20,434
Amalgamated
Financial
Corp
677,694
55,244
(b)
Ambac
Financial
Group
Inc
624,810
156,834
Apollo
Commercial
Real
Estate
Finance
Inc
1,394,254
4,845
Artisan
Partners
Asset
Management
Inc,
Class
A
213,664
4,274
Atlantic
Union
Bankshares
Corp
161,557
63,901
(b)
AvidXchange
Holdings
Inc
526,544
81,115
(b)
Baldwin
Insurance
Group
Inc/The
3,752,380
12,533
Banc
of
California
Inc
192,507
60,281
(b)
Bancorp
Inc/The
3,029,723
84,908
Bank
OZK
3,714,725
5,406
Banner
Corp
346,200
17,233
Bar
Harbor
Bankshares
554,041
33,642
Berkshire
Hills
Bancorp
Inc
916,072
176,466
Blackstone
Mortgage
Trust
Inc,
Class
A
3,213,446
52,098
Bread
Financial
Holdings
Inc
2,597,085
9,928
Cadence
Bank
331,893
71,086
(b)
Cantaloupe
Inc
629,822
112,394
Commerce
Bancshares
Inc/MO
7,024,625
21,251
Crawford
&
Co,
Class
A
236,736
34,072
(b)
Donnelley
Financial
Solutions
Inc
1,987,760
123,595
East
West
Bancorp
Inc
12,049,277
45,901
Enterprise
Financial
Services
Corp
2,419,901
12,534
Essent
Group
Ltd
752,165
77,679
EVERTEC
Inc
2,544,764
126,905
First
American
Financial
Corp
8,140,956
203,928
First
BanCorp/Puerto
Rico
3,931,732
24,753
First
Financial
Bancorp
633,182
410,779
First
Horizon
Corp
7,118,800
9,035
First
Interstate
BancSystem
Inc,
Class
A
278,278
22,395
Glacier
Bancorp
Inc
1,167,899
70,631
HA
Sustainable
Infrastructure
Capital
Inc
2,471,379
31,106
(b)
Hamilton
Insurance
Group
Ltd,
Class
B
541,867
49,741
Hancock
Whitney
Corp
2,590,511
21,908
Hanmi
Financial
Corp
501,036
3,962
Hanover
Insurance
Group
Inc/The
587,683
26,343
Independent
Bank
Corp
1,656,975
24,761
Independent
Bank
Corp/MI
811,666
218,921
Invesco
Ltd
3,796,090
59,421
Invesco
Mortgage
Capital
Inc
479,527
Portfolio
of
Investments
October
31,
2024
(continued)
NUSC
SHARES
DESCRIPTION
VALUE
FINANCIALS
(continued)
93,927
Jackson
Financial
Inc,
Class
A
$
9,388,004
67,956
KKR
Real
Estate
Finance
Trust
Inc
787,610
38,617
Lincoln
National
Corp
1,341,941
29,166
MGIC
Investment
Corp
730,317
5,045
NBT
Bancorp
Inc
224,402
2,203
Nelnet
Inc,
Class
A
248,278
7,866
(b)
NMI
Holdings
Inc
304,257
74,651
Old
National
Bancorp/IN
1,437,778
7,071
Old
Republic
International
Corp
246,990
123,616
(b)
Open
Lending
Corp
692,250
30,535
(b)
Palomar
Holdings
Inc
2,741,127
30,939
Pathward
Financial
Inc
2,189,244
45,129
PennyMac
Financial
Services
Inc
4,498,459
39,719
Peoples
Bancorp
Inc/OH
1,222,551
7,765
Pinnacle
Financial
Partners
Inc
818,819
27,940
PJT
Partners
Inc,
Class
A
3,882,542
14,745
(b)
PRA
Group
Inc
297,259
23,214
Primerica
Inc
6,425,867
62,282
(b)
ProAssurance
Corp
927,379
40,334
PROG
Holdings
Inc
1,761,386
34,385
Reinsurance
Group
of
America
Inc
7,257,986
6,175
Renasant
Corp
210,629
99,283
(b)
Repay
Holdings
Corp
789,796
36,625
Ryan
Specialty
Holdings
Inc
2,412,489
43,245
S&T
Bancorp
Inc
1,642,445
2,688
Selective
Insurance
Group
Inc
244,124
47,289
SouthState
Corp
4,612,096
206,924
Starwood
Property
Trust
Inc
4,084,680
33,786
Stewart
Information
Services
Corp
2,324,477
84,714
Synovus
Financial
Corp
4,224,687
2,106
UMB
Financial
Corp
231,091
26,346
Unum
Group
1,690,886
433,373
Valley
National
Bancorp
4,104,042
51,533
Victory
Capital
Holdings
Inc,
Class
A
3,088,373
18,787
Voya
Financial
Inc
1,508,596
41,321
Walker
&
Dunlop
Inc
4,519,278
90,243
Webster
Financial
Corp
4,674,587
87,094
Western
Alliance
Bancorp
7,247,092
33,020
(b)
WEX
Inc
5,699,252
3,166
White
Mountains
Insurance
Group
Ltd
5,689,745
148,810
WisdomTree
Inc
1,540,183
65,907
Zions
Bancorp
NA
3,431,118
TOTAL
FINANCIALS
210,200,654
HEALTH
CARE
-
11.9%
87,026
(b)
89bio
Inc
677,062
7,120
(b)
Acadia
Healthcare
Co
Inc
303,953
55,863
(b)
Alector
Inc
274,846
197,043
(b)
Alkermes
PLC
5,064,005
46,456
(b)
AMN
Healthcare
Services
Inc
1,762,541
23,591
(b)
Apogee
Therapeutics
Inc
1,227,676
29,567
(b)
Arcturus
Therapeutics
Holdings
Inc
524,223
38,262
(b)
Arcus
Biosciences
Inc
585,409
129,921
(b)
Arcutis
Biotherapeutics
Inc
1,079,643
56,992
(b)
Arvinas
Inc
1,506,299
77,679
(b)
Avid
Bioservices
Inc
773,683
74,367
(b)
Avidity
Biosciences
Inc
3,142,749
31,592
(b)
Azenta
Inc
1,298,115
73,313
(b)
Biohaven
Ltd
3,648,055
217,957
(b)
Brookdale
Senior
Living
Inc
1,366,590
23,582
Bruker
Corp
1,334,977
56,206
(b)
Cassava
Sciences
Inc
1,450,396
32,092
(b)
Castle
Biosciences
Inc
1,112,630
SHARES
DESCRIPTION
VALUE
HEALTH
CARE
(continued)
75,995
(b)
Cogent
Biosciences
Inc
$
873,183
2,724
CONMED
Corp
185,886
10,049
(b)
CorVel
Corp
2,992,793
47,675
(b)
Crinetics
Pharmaceuticals
Inc
2,667,893
22,339
(b),(c)
CRISPR
Therapeutics
AG
1,036,306
40,407
(b)
Cross
Country
Healthcare
Inc
461,044
60,069
(b)
CryoPort
Inc
400,060
45,856
(b)
Cullinan
Therapeutics
Inc
713,061
54,112
(b)
Cytokinetics
Inc
2,759,712
52,746
(b)
Denali
Therapeutics
Inc
1,369,286
21,776
(b)
Disc
Medicine
Inc
976,000
50,014
(b)
Dyne
Therapeutics
Inc
1,443,404
45,773
(b)
Edgewise
Therapeutics
Inc
1,536,600
210,471
(b)
Elanco
Animal
Health
Inc
2,660,353
60,096
Embecta
Corp
846,152
23,006
(b),(c)
Enliven
Therapeutics
Inc
640,717
27,144
Ensign
Group
Inc/The
4,207,049
21,197
(b)
Entrada
Therapeutics
Inc
363,317
50,589
(b)
Envista
Holdings
Corp
1,060,851
4,620
(b),(c)
Establishment
Labs
Holdings
Inc
199,076
62,339
(b)
EyePoint
Pharmaceuticals
Inc
733,107
103,910
(b)
Fortrea
Holdings
Inc
1,747,766
12,823
(b)
Fulgent
Genetics
Inc
275,053
478,339
(b)
Geron
Corp
1,965,973
16,365
(b)
Glaukos
Corp
2,164,271
57,402
(b)
Guardant
Health
Inc
1,255,956
42,216
(b)
Haemonetics
Corp
3,004,091
23,354
(b)
HealthEquity
Inc
1,990,928
179,045
(b)
Hims
&
Hers
Health
Inc
3,371,417
101,456
(b),(c)
Humacyte
Inc
512,353
23,784
(b)
ICU
Medical
Inc
4,060,642
61,111
(b)
Ideaya
Biosciences
Inc
1,720,275
47,733
(b)
Immunome
Inc
547,497
63,858
(b)
Inari
Medical
Inc
3,090,727
16,090
(b)
Integer
Holdings
Corp
1,999,182
32,935
(b)
Integra
LifeSciences
Holdings
Corp
617,861
15,726
(b)
Jazz
Pharmaceuticals
PLC
1,730,332
52,416
(b)
Kura
Oncology
Inc
876,395
25,213
(b)
Kymera
Therapeutics
Inc
1,164,084
40,985
(b)
Longboard
Pharmaceuticals
Inc
2,447,624
169,678
(b)
Lyell
Immunopharma
Inc
162,942
102,736
(b)
MaxCyte
Inc
367,795
37,661
(b)
Merus
NV
1,880,414
73,854
(b)
Mind
Medicine
MindMed
Inc
465,280
25,756
(b)
MoonLake
Immunotherapeutics
1,195,593
52,529
(b)
Myriad
Genetics
Inc
1,153,537
101,661
(b)
NeoGenomics
Inc
1,381,573
62,480
(b)
Novocure
Ltd
948,446
20,701
(b)
Nurix
Therapeutics
Inc
508,831
105,846
(b)
Nuvation
Bio
Inc
233,920
56,199
(b)
Omnicell
Inc
2,733,519
19,200
(b)
Orthofix
Medical
Inc
310,848
88,834
(b)
Owens
&
Minor
Inc
1,129,080
45,876
(b),(c)
Paragon
28
Inc
243,143
49,288
Patterson
Cos
Inc
1,035,541
19,189
(b)
Pennant
Group
Inc/The
613,472
5,395
(b)
Penumbra
Inc
1,234,754
15,603
Perrigo
Co
PLC
399,905
45,838
(b),(c)
Phathom
Pharmaceuticals
Inc
786,122
24,746
Phibro
Animal
Health
Corp,
Class
A
572,127
40,080
(b)
Pliant
Therapeutics
Inc
563,926
30,808
(b)
PROCEPT
BioRobotics
Corp
2,772,720
Portfolio
of
Investments
October
31,
2024
(continued)
NUSC
SHARES
DESCRIPTION
VALUE
HEALTH
CARE
(continued)
42,646
(b)
Prothena
Corp
PLC
$
724,982
69,514
(b)
QuidelOrtho
Corp
2,645,008
206,524
(b)
R1
RCM
Inc
2,945,032
25,100
(b)
RadNet
Inc
1,632,504
222,703
(b),(c)
Recursion
Pharmaceuticals
Inc,
Class
A
1,407,483
119,836
(b)
Revance
Therapeutics
Inc
707,032
40,516
(b)
RxSight
Inc
2,052,541
119,580
(b)
Savara
Inc
434,673
31,494
(b)
Scholar
Rock
Holding
Corp
895,689
145,620
(b)
Sotera
Health
Co
2,281,865
30,941
(b)
Spyre
Therapeutics
Inc
1,006,511
17,376
(b)
STAAR
Surgical
Co
503,730
36,391
(b)
Syndax
Pharmaceuticals
Inc
686,334
52,227
(b)
Tango
Therapeutics
Inc
283,854
33,103
(b)
Tarsus
Pharmaceuticals
Inc
1,472,752
22,833
(b)
Teladoc
Health
Inc
205,497
43,203
(b)
Theravance
Biopharma
Inc
355,993
40,576
(b)
Treace
Medical
Concepts
Inc
189,084
49,467
(b)
Varex
Imaging
Corp
649,502
28,622
(b)
Vaxcyte
Inc
3,043,950
43,506
(b)
Vera
Therapeutics
Inc
1,756,772
69,153
(b)
Verve
Therapeutics
Inc
396,247
43,966
(b)
Viking
Therapeutics
Inc
3,189,294
55,276
(b)
Viridian
Therapeutics
Inc
1,192,303
97,360
(b)
WaVe
Life
Sciences
Ltd
1,334,806
55,847
(b)
Zymeworks
Inc
765,104
TOTAL
HEALTH
CARE
143,253,159
INDUSTRIALS
-
18.0%
53,143
AAON
Inc
6,069,993
18,837
(b)
AAR
Corp
1,105,732
6,053
Acuity
Brands
Inc
1,820,077
46,584
Advanced
Drainage
Systems
Inc
6,982,010
3,864
AGCO
Corp
385,782
130,588
Air
Lease
Corp
5,791,578
14,964
Allient
Inc
258,728
3,783
Arcosa
Inc
354,240
185,668
(b)
Array
Technologies
Inc
1,212,412
33,264
(b)
ASGN
Inc
3,063,614
44,709
Atkore
Inc
3,834,244
79,193
(b)
AZEK
Co
Inc/The
3,484,492
40,255
(b)
Beacon
Roofing
Supply
Inc
3,706,278
48,426
Boise
Cascade
Co
6,442,111
53,804
Brady
Corp
3,827,617
36,359
(b)
CECO
Environmental
Corp
865,344
368,103
(b)
Clarivate
PLC
2,429,480
17,184
Comfort
Systems
USA
Inc
6,719,631
221,460
(b)
Core
&
Main
Inc,
Class
A
9,806,249
59,826
Crane
Co
9,409,433
36,039
CSG
Systems
International
Inc
1,679,778
130,822
(b)
DNOW
Inc
1,547,624
11,293
Douglas
Dynamics
Inc
255,786
69,877
(b)
Energy
Recovery
Inc
1,248,003
67,425
Enerpac
Tool
Group
Corp
2,974,791
199,145
(b)
ExlService
Holdings
Inc
8,298,372
61,924
(b)
First
Advantage
Corp
1,122,063
35,071
(b)
FTI
Consulting
Inc
6,841,651
32,605
(b)
Generac
Holdings
Inc
5,397,758
30,298
Greenbrier
Cos
Inc/The
1,795,762
61,379
Hexcel
Corp
3,602,334
57,935
HNI
Corp
2,855,037
12,572
(b)
Huron
Consulting
Group
Inc
1,454,958
71,280
Interface
Inc
1,245,262
SHARES
DESCRIPTION
VALUE
INDUSTRIALS
(continued)
25,015
John
Bean
Technologies
Corp
$
2,787,171
145,393
KBR
Inc
9,742,785
26,025
(b)
Kratos
Defense
&
Security
Solutions
Inc
591,288
96,806
(b)
Leonardo
DRS
Inc
2,910,956
13,328
Lindsay
Corp
1,595,362
3,211
McGrath
RentCorp
365,091
61,157
(b)
Mercury
Systems
Inc
1,978,429
34,890
Moog
Inc,
Class
A
6,580,254
104,105
(b)
MRC
Global
Inc
1,276,327
28,767
MSA
Safety
Inc
4,773,884
10,561
Mueller
Water
Products
Inc,
Class
A
228,012
12,864
(b)
MYR
Group
Inc
1,685,184
129,669
(b)
NEXTracker
Inc,
Class
A
5,163,420
196,888
Pitney
Bowes
Inc
1,419,562
953,210
(b),(c)
Plug
Power
Inc
1,868,292
11,761
Powell
Industries
Inc
2,998,820
41,819
Primoris
Services
Corp
2,618,706
170,725
(b)
Resideo
Technologies
Inc
3,358,161
84,547
Robert
Half
Inc
5,758,496
8,691
Rush
Enterprises
Inc
422,035
28,071
Rush
Enterprises
Inc,
Class
A
1,588,257
47,310
Ryder
System
Inc
6,920,507
12,779
(b)
Saia
Inc
6,243,947
6,619
Sensata
Technologies
Holding
PLC
227,296
34,426
(b)
SiteOne
Landscape
Supply
Inc
4,810,689
19,987
(b)
SPX
Technologies
Inc
2,867,935
201,361
(b)
Sunrun
Inc
2,909,666
23,181
(b)
Titan
Machinery
Inc
318,159
27,698
TriNet
Group
Inc
2,351,283
31,986
(b)
Triumph
Group
Inc
442,686
15,369
(b)
V2X
Inc
946,730
24,835
(b)
Viad
Corp
929,822
18,683
VSE
Corp
1,917,249
53,088
Wabash
National
Corp
925,855
12,124
WESCO
International
Inc
2,327,444
64,424
(b)
WillScot
Holdings
Corp
2,135,011
26,313
(b)
XPO
Inc
3,434,636
TOTAL
INDUSTRIALS
217,307,631
INFORMATION
TECHNOLOGY
-
12.5%
128,787
(b)
ACI
Worldwide
Inc
6,336,320
4,363
(b)
Altair
Engineering
Inc,
Class
A
453,708
36,217
Badger
Meter
Inc
7,245,211
22,697
Belden
Inc
2,584,507
14,913
Benchmark
Electronics
Inc
645,733
39,435
(b)
Blackbaud
Inc
2,977,737
15,181
(b)
Box
Inc,
Class
A
482,149
72,072
(b)
Calix
Inc
2,549,907
59,185
(b)
Cirrus
Logic
Inc
6,499,697
53,963
(b)
CommVault
Systems
Inc
8,428,481
44,977
(b)
Confluent
Inc,
Class
A
1,177,048
4,281
CTS
Corp
211,867
44,528
(b)
Digi
International
Inc
1,289,976
11,031
(b),(c)
Digimarc
Corp
341,740
72,435
Dolby
Laboratories
Inc,
Class
A
5,280,511
110,835
(b)
DoubleVerify
Holdings
Inc
1,889,737
14,394
(b)
Dropbox
Inc,
Class
A
372,085
222,786
(b)
DXC
Technology
Co
4,424,530
188,518
(b)
E2open
Parent
Holdings
Inc
552,358
16,493
(b)
Elastic
NV
1,323,233
52,478
(b)
Envestnet
Inc
3,294,569
159,962
(b)
Flex
Ltd
5,545,883
33,877
(b)
Gitlab
Inc,
Class
A
1,820,889
Portfolio
of
Investments
October
31,
2024
(continued)
NUSC
SHARES
DESCRIPTION
VALUE
INFORMATION
TECHNOLOGY
(continued)
135,359
(b)
Harmonic
Inc
$
1,501,131
60,514
(b)
HashiCorp
Inc,
Class
A
2,049,004
114,442
(b),(c)
Infinera
Corp
769,050
7,719
(b)
Informatica
Inc,
Class
A
210,729
21,440
(b)
Insight
Enterprises
Inc
3,750,285
28,865
(b)
Intapp
Inc
1,448,157
30,947
InterDigital
Inc
4,655,667
53,803
(b)
Itron
Inc
6,013,023
12,208
(b)
Jamf
Holding
Corp
203,141
16,860
(b)
Kimball
Electronics
Inc
299,939
39,804
Kulicke
&
Soffa
Industries
Inc
1,785,607
76,629
(b)
Lattice
Semiconductor
Corp
3,882,025
4,554
Littelfuse
Inc
1,114,045
7,906
(b)
LiveRamp
Holdings
Inc
197,887
348,158
(b)
Matterport
Inc
1,587,600
27,166
(b)
Meridianlink
Inc
596,565
40,616
Methode
Electronics
Inc
354,171
235,831
(b)
Mirion
Technologies
Inc
3,490,299
37,669
(b)
N-able
Inc/US
460,692
168,684
(b)
NCR
Voyix
Corp
2,160,842
22,185
(b)
Novanta
Inc
3,776,774
158,359
(b)
Nutanix
Inc,
Class
A
9,834,094
25,281
(b)
Onto
Innovation
Inc
5,013,981
41,641
(b)
PAR
Technology
Corp
2,456,403
75,567
(b)
Paycor
HCM
Inc
1,140,306
37,549
(b)
PDF
Solutions
Inc
1,063,388
125,546
(b)
Procore
Technologies
Inc
8,242,095
36,785
Progress
Software
Corp
2,357,551
114,353
(b)
Ribbon
Communications
Inc
407,097
17,981
(b)
Rogers
Corp
1,803,135
18,009
(b)
Silicon
Laboratories
Inc
1,870,415
23,024
(b)
SPS
Commerce
Inc
3,798,960
49,008
(b)
Teradata
Corp
1,579,528
26,291
(b)
Veeco
Instruments
Inc
756,655
49,493
Vontier
Corp
1,835,200
43,434
(b)
Weave
Communications
Inc
608,945
145,796
(b),(c)
Wolfspeed
Inc
1,940,545
63,552
Xerox
Holdings
Corp
519,220
TOTAL
INFORMATION
TECHNOLOGY
151,262,027
MATERIALS
-
5.5%
2,722
AptarGroup
Inc
457,051
78,293
Avient
Corp
3,649,237
171,771
(b)
Axalta
Coating
Systems
Ltd
6,513,556
39,651
Balchem
Corp
6,634,802
113,099
Berry
Global
Group
Inc
7,967,824
42,696
Compass
Minerals
International
Inc
525,588
282,385
Element
Solutions
Inc
7,652,633
129,388
FMC
Corp
8,408,926
4,794
HB
Fuller
Co
350,825
35,251
(b)
Knife
River
Corp
3,430,627
25,870
Koppers
Holdings
Inc
879,839
57,648
Louisiana-Pacific
Corp
5,701,387
39,458
Minerals
Technologies
Inc
2,970,793
12,290
Olympic
Steel
Inc
440,965
32,451
Radius
Recycling
Inc
525,382
57,047
(b)
Ranpak
Holdings
Corp
346,846
34,002
Royal
Gold
Inc
4,966,332
44,073
Sensient
Technologies
Corp
3,326,630
3,605
Sonoco
Products
Co
189,335
27,518
Stepan
Co
1,990,652
TOTAL
MATERIALS
66,929,230
SHARES
DESCRIPTION
VALUE
REAL
ESTATE
-
6.3%
15,221
Agree
Realty
Corp
$
1,130,159
49,914
(b)
Anywhere
Real
Estate
Inc
192,668
27,023
Armada
Hoffler
Properties
Inc
292,659
15,548
CBL
&
Associates
Properties
Inc
411,245
450,973
(b)
Compass
Inc,
Class
A
2,863,679
28,946
CubeSmart
1,384,777
115,332
(b)
Curbline
Properties
Corp
2,609,952
20,021
(b)
Cushman
&
Wakefield
PLC
271,284
30,257
Easterly
Government
Properties
Inc
410,285
28,490
EastGroup
Properties
Inc
4,879,767
170,709
Empire
State
Realty
Trust
Inc,
Class
A
1,809,515
124,267
(b)
Equity
Commonwealth
2,459,244
107,907
Essential
Properties
Realty
Trust
Inc
3,419,573
92,846
(c)
eXp
World
Holdings
Inc
1,236,709
2,584
Federal
Realty
Investment
Trust
286,411
155,065
Hudson
Pacific
Properties
Inc
669,881
17,997
(b)
Jones
Lang
LaSalle
Inc
4,876,467
44,558
Kennedy-Wilson
Holdings
Inc
476,325
131,094
Kilroy
Realty
Corp
5,272,601
146,843
Omega
Healthcare
Investors
Inc
6,236,422
115,811
Outfront
Media
Inc
2,056,803
146,715
Pebblebrook
Hotel
Trust
1,757,646
30,425
Piedmont
Office
Realty
Trust
Inc,
Class
A
302,424
97,464
PotlatchDeltic
Corp
4,051,578
167,766
Rexford
Industrial
Realty
Inc
7,195,484
70,142
Ryman
Hospitality
Properties
Inc
7,508,701
12,333
Sabra
Health
Care
REIT
Inc
239,260
57,668
SITE
Centers
Corp
919,801
19,922
St
Joe
Co/The
1,029,967
117,369
Terreno
Realty
Corp
7,036,272
290,645
Uniti
Group
Inc
1,473,570
124,835
Xenia
Hotels
&
Resorts
Inc
1,768,912
TOTAL
REAL
ESTATE
76,530,041
UTILITIES
-
2.4%
26,768
Chesapeake
Utilities
Corp
3,206,539
42,217
Clearway
Energy
Inc,
Class
A
1,124,661
100,684
Clearway
Energy
Inc,
Class
C
2,857,412
121,603
New
Jersey
Resources
Corp
5,580,362
69,347
ONE
Gas
Inc
4,942,361
32,580
SJW
Group
1,813,403
26,538
Southwest
Gas
Holdings
Inc
1,943,908
5,200
Spire
Inc
332,072
129,180
(b),(c)
Sunnova
Energy
International
Inc
784,122
258,763
UGI
Corp
6,187,023
TOTAL
UTILITIES
28,771,863
TOTAL
COMMON
STOCKS
(Cost
$1,104,744,668)
1,206,650,245
TOTAL
LONG-TERM
INVESTMENTS
(Cost
$1,104,744,668)
1,206,742,165
SHARES
DESCRIPTION
RATE
VALUE
INVESTMENTS
PURCHASED
WITH
COLLATERAL
FROM
SECURITIES
LENDING
-
0.8%
9,344,093
(d)
State
Street
Navigator
Securities
Lending
Government
Money
Market
Portfolio
4
.860
%
(e)
$
9,344,093
TOTAL
INVESTMENTS
PURCHASED
WITH
COLLATERAL
FROM
SECURITIES
LENDING
(Cost
$9,344,093)
9,344,093
TOTAL
INVESTMENTS
-
100
.6
%
(Cost
$
1,114,088,761
)
1,216,086,258
OTHER
ASSETS
&
LIABILITIES,
NET
-
(0.6)%
(
6,951,922
)
NET
ASSETS
-
100%
$
1,209,134,336
Portfolio
of
Investments
October
31,
2024
(continued)
NUSC
For
Fund
portfolio
compliance
purposes,
the
Fund’s
industry
classifications
refer
to
any
one
or
more
of
the
industry
sub-classifications
used
by
one
or
more
widely
recognized
market
indexes
or
ratings
group
indexes,
and/or
as
defined
by
Fund
management.
This
definition
may
not
apply
for
purposes
of
this
report,
which
may
combine
industry
sub-classifications
into
sectors
for
reporting
ease.
(a)
For
fair
value
measurement
disclosure
purposes,
investment
classified
as
Level
3.
(b)
Non-income
producing;
issuer
has
not
declared
an
ex-dividend
date
within
the
past
twelve
months.
(c)
Investment,
or
a
portion
of
investment,
is
out
on
loan
for
securities
lending.
The
total
value
of
the
securities
out
on
loan
as
of
the
end
of
the
reporting
period
was
$8,526,480.
(d)
The
Fund
may
loan
securities
representing
up
to
one
third
of
the
value
of
its
total
assets
(which
includes
collateral
for
securities
on
loan)
to
broker
dealers,
banks,
and
other
institutions.
The
collateral
maintained
by
the
Fund
shall
have
a
value,
at
the
inception
of
each
loan,
equal
to
not
less
than
100%
of
the
value
of
the
loaned
securities.
The
cash
collateral
received
by
the
Fund
is
invested
in
this
money
market
fund.
(e)
The
rate
shown
is
the
one-day
yield
as
of
the
end
of
the
reporting
period.
REIT
Real
Estate
Investment
Trust
See
Notes
to
Financial
Statements
Portfolio
of
Investments
October
31,
2024
NDVG
SHARES
DESCRIPTION
VALUE
LONG-TERM
INVESTMENTS
-
98.9%
11220762
COMMON
STOCKS
-
98.9%
11220762
BANKS
-
3.4%
1,731
JPMorgan
Chase
&
Co
$
384,143
TOTAL
BANKS
384,143
CAPITAL
GOODS
-
6.9%
759
Eaton
Corp
PLC
251,670
890
Honeywell
International
Inc
183,055
250
Northrop
Grumman
Corp
127,255
595
Trane
Technologies
PLC
220,245
TOTAL
CAPITAL
GOODS
782,225
CONSUMER
DISCRETIONARY
DISTRIBUTION
&
RETAIL
-
4.1%
924
Lowe's
Cos
Inc
241,931
2,022
TJX
Cos
Inc/The
228,547
TOTAL
CONSUMER
DISCRETIONARY
DISTRIBUTION
&
RETAIL
470,478
CONSUMER
SERVICES
-
3.6%
951
McDonald's
Corp
277,796
1,317
Starbucks
Corp
128,671
TOTAL
CONSUMER
SERVICES
406,467
CONSUMER
STAPLES
DISTRIBUTION
&
RETAIL
-
2.4%
3,374
Walmart
Inc
276,499
TOTAL
CONSUMER
STAPLES
DISTRIBUTION
&
RETAIL
276,499
ENERGY
-
4.0%
1,421
Chevron
Corp
211,473
2,103
Exxon
Mobil
Corp
245,589
TOTAL
ENERGY
457,062
EQUITY
REAL
ESTATE
INVESTMENT
TRUSTS
(REITS)
-
4.3%
1,166
American
Tower
Corp
248,988
2,114
Prologis
Inc
238,755
TOTAL
EQUITY
REAL
ESTATE
INVESTMENT
TRUSTS
(REITS)
487,743
FINANCIAL
SERVICES
-
8.4%
1,176
American
Express
Co
317,614
1,684
Charles
Schwab
Corp/The
119,278
588
Mastercard
Inc
293,759
468
S&P
Global
Inc
224,808
TOTAL
FINANCIAL
SERVICES
955,459
FOOD,
BEVERAGE
&
TOBACCO
-
5.0%
2,413
Mondelez
International
Inc,
Class
A
165,242
957
PepsiCo
Inc
158,939
1,813
Philip
Morris
International
Inc
240,585
TOTAL
FOOD,
BEVERAGE
&
TOBACCO
564,766
HEALTH
CARE
EQUIPMENT
&
SERVICES
-
6.8%
2,166
Abbott
Laboratories
245,559
421
Elevance
Health
Inc
170,825
624
UnitedHealth
Group
Inc
352,248
TOTAL
HEALTH
CARE
EQUIPMENT
&
SERVICES
768,632
INSURANCE
-
2.2%
1,130
Marsh
&
McLennan
Cos
Inc
246,611
TOTAL
INSURANCE
246,611
MATERIALS
-
4.5%
741
Linde
PLC
338,007
777
Packaging
Corp
of
America
177,887
TOTAL
MATERIALS
515,894
MEDIA
&
ENTERTAINMENT
-
2.0%
5,319
Comcast
Corp,
Class
A
232,281
TOTAL
MEDIA
&
ENTERTAINMENT
232,281
PHARMACEUTICALS,
BIOTECHNOLOGY
&
LIFE
SCIENCES
-
5.7%
1,443
AbbVie
Inc
294,184
1,000
Novo
Nordisk
A/S,
Sponsored
ADR
111,950
1,318
Zoetis
Inc
235,632
TOTAL
PHARMACEUTICALS,
BIOTECHNOLOGY
&
LIFE
SCIENCES
641,766
Portfolio
of
Investments
October
31,
2024
(continued)
NDVG
SHARES
DESCRIPTION
VALUE
SEMICONDUCTORS
&
SEMICONDUCTOR
EQUIPMENT
-
7.8%
2,950
Broadcom
Inc
$
500,821
1,451
Taiwan
Semiconductor
Manufacturing
Co
Ltd,
Sponsored
ADR
276,474
528
Texas
Instruments
Inc
107,268
TOTAL
SEMICONDUCTORS
&
SEMICONDUCTOR
EQUIPMENT
884,563
SOFTWARE
&
SERVICES
-
10.1%
896
Accenture
PLC,
Class
A
308,959
2,052
Microsoft
Corp
833,830
TOTAL
SOFTWARE
&
SERVICES
1,142,789
TECHNOLOGY
HARDWARE
&
EQUIPMENT
-
11.9%
2,745
Amphenol
Corp,
Class
A
183,970
3,678
Apple
Inc
830,897
754
Motorola
Solutions
Inc
338,810
TOTAL
TECHNOLOGY
HARDWARE
&
EQUIPMENT
1,353,677
TRANSPORTATION
-
1.4%
670
Union
Pacific
Corp
155,487
TOTAL
TRANSPORTATION
155,487
UTILITIES
-
4.4%
3,612
NextEra
Energy
Inc
286,251
2,177
WEC
Energy
Group
Inc
207,969
TOTAL
UTILITIES
494,220
TOTAL
COMMON
STOCKS
(Cost
$9,839,387)
11,220,762
TOTAL
LONG-TERM
INVESTMENTS
(Cost
$9,839,387)
11,220,762
OTHER
ASSETS
&
LIABILITIES,
NET
-
1.1%
120,947
NET
ASSETS
-
100%
$
11,341,709
For
Fund
portfolio
compliance
purposes,
the
Fund’s
industry
classifications
refer
to
any
one
or
more
of
the
industry
sub-classifications
used
by
one
or
more
widely
recognized
market
indexes
or
ratings
group
indexes,
and/or
as
defined
by
Fund
management.
This
definition
may
not
apply
for
purposes
of
this
report,
which
may
combine
industry
sub-classifications
into
sectors
for
reporting
ease.
ADR
American
Depositary
Receipt
REIT
Real
Estate
Investment
Trust
S&P
Standard
&
Poor's
See
Notes
to
Financial
Statements
Portfolio
of
Investments
October
31,
2024
NUGO
SHARES
DESCRIPTION
VALUE
LONG-TERM
INVESTMENTS
-
98.4%
2707001387
COMMON
STOCKS
-
98.4%
2707001387
CAPITAL
GOODS
-
2.9%
338,323
Carrier
Global
Corp
$
24,602,849
72,575
Eaton
Corp
PLC
24,064,418
64,176
Emerson
Electric
Co
6,948,335
51,642
General
Electric
Co
8,871,063
56,759
HEICO
Corp
13,903,117
TOTAL
CAPITAL
GOODS
78,389,782
CONSUMER
DISCRETIONARY
DISTRIBUTION
&
RETAIL
-
9.0%
1,326,243
(a)
Amazon.com
Inc
247,211,695
TOTAL
CONSUMER
DISCRETIONARY
DISTRIBUTION
&
RETAIL
247,211,695
CONSUMER
SERVICES
-
4.1%
8,631
Booking
Holdings
Inc
40,360,714
576,191
(a)
Chipotle
Mexican
Grill
Inc
32,134,172
498,185
(a)
DraftKings
Inc
17,595,894
227,580
Starbucks
Corp
22,234,566
TOTAL
CONSUMER
SERVICES
112,325,346
CONSUMER
STAPLES
DISTRIBUTION
&
RETAIL
-
2.5%
79,093
Costco
Wholesale
Corp
69,141,519
TOTAL
CONSUMER
STAPLES
DISTRIBUTION
&
RETAIL
69,141,519
FINANCIAL
SERVICES
-
5.7%
233,969
(a)
Fiserv
Inc
46,302,465
223,630
Mastercard
Inc
111,723,312
TOTAL
FINANCIAL
SERVICES
158,025,777
HEALTH
CARE
EQUIPMENT
&
SERVICES
-
2.6%
245,605
(a)
Dexcom
Inc
17,310,240
87,193
(a)
Intuitive
Surgical
Inc
43,931,321
20,862
UnitedHealth
Group
Inc
11,776,599
TOTAL
HEALTH
CARE
EQUIPMENT
&
SERVICES
73,018,160
MATERIALS
-
2.5%
703,668
Corteva
Inc
42,867,455
54,849
Linde
PLC
25,019,371
TOTAL
MATERIALS
67,886,826
MEDIA
&
ENTERTAINMENT
-
10.9%
701,623
Alphabet
Inc,
Class
A
120,054,711
238,893
Meta
Platforms
Inc
135,590,889
59,094
(a)
Netflix
Inc
44,676,837
TOTAL
MEDIA
&
ENTERTAINMENT
300,322,437
PHARMACEUTICALS,
BIOTECHNOLOGY
&
LIFE
SCIENCES
-
6.7%
183,667
AstraZeneca
PLC,
Sponsored
ADR
13,067,907
139,536
Eli
Lilly
&
Co
115,778,601
341,623
Novo
Nordisk
A/S,
Sponsored
ADR
38,244,695
89,775
Zoetis
Inc
16,049,975
TOTAL
PHARMACEUTICALS,
BIOTECHNOLOGY
&
LIFE
SCIENCES
183,141,178
SEMICONDUCTORS
&
SEMICONDUCTOR
EQUIPMENT
-
19.6%
788,965
Broadcom
Inc
133,942,588
255,592
Lam
Research
Corp
19,003,265
2,891,791
NVIDIA
Corp
383,914,173
TOTAL
SEMICONDUCTORS
&
SEMICONDUCTOR
EQUIPMENT
536,860,026
SOFTWARE
&
SERVICES
-
18.9%
55,271
(a)
Crowdstrike
Holdings
Inc,
Class
A
16,408,302
18,484
Intuit
Inc
11,280,785
777,847
Microsoft
Corp
316,078,128
55,497
(a)
Palo
Alto
Networks
Inc
19,997,234
118,478
(a)
PTC
Inc
21,957,528
38,819
Salesforce
Inc
11,310,692
58,652
(a)
ServiceNow
Inc
54,721,730
85,677
(a)
Shopify
Inc,
Class
A
6,700,798
55,672
(a)
Synopsys
Inc
28,593,696
298,530
(a)
Trade
Desk
Inc/The,
Class
A
35,886,291
TOTAL
SOFTWARE
&
SERVICES
522,935,184
Portfolio
of
Investments
October
31,
2024
(continued)
NUGO
SHARES
DESCRIPTION
VALUE
TECHNOLOGY
HARDWARE
&
EQUIPMENT
-
12.3%
1,316,077
Apple
Inc
$
297,314,955
105,842
(a)
Arista
Networks
Inc
40,901,583
TOTAL
TECHNOLOGY
HARDWARE
&
EQUIPMENT
338,216,538
TRANSPORTATION
-
0.7%
271,019
(a)
Uber
Technologies
Inc
19,526,919
TOTAL
TRANSPORTATION
19,526,919
TOTAL
COMMON
STOCKS
(Cost
$1,774,798,686)
2,707,001,387
TOTAL
LONG-TERM
INVESTMENTS
(Cost
$1,774,798,686)
2,707,001,387
OTHER
ASSETS
&
LIABILITIES,
NET
-
1.6%
43,825,406
NET
ASSETS
-
100%
$
2,750,826,793
For
Fund
portfolio
compliance
purposes,
the
Fund’s
industry
classifications
refer
to
any
one
or
more
of
the
industry
sub-classifications
used
by
one
or
more
widely
recognized
market
indexes
or
ratings
group
indexes,
and/or
as
defined
by
Fund
management.
This
definition
may
not
apply
for
purposes
of
this
report,
which
may
combine
industry
sub-classifications
into
sectors
for
reporting
ease.
(a)
Non-income
producing;
issuer
has
not
declared
an
ex-dividend
date
within
the
past
twelve
months.
ADR
American
Depositary
Receipt
See
Notes
to
Financial
Statements
Portfolio
of
Investments
October
31,
2024
NSCS
SHARES
DESCRIPTION
VALUE
LONG-TERM
INVESTMENTS
-
99.1%
7324587
COMMON
STOCKS
-
98.2%
7324587
AUTOMOBILES
&
COMPONENTS
-
1.6%
3,016
Atmus
Filtration
Technologies
Inc
$
117,443
TOTAL
AUTOMOBILES
&
COMPONENTS
117,443
BANKS
-
10.8%
2,037
Banner
Corp
130,449
3,567
First
Interstate
BancSystem
Inc,
Class
A
109,864
3,623
Home
BancShares
Inc/AR
98,872
1,067
Preferred
Bank/Los
Angeles
CA
90,023
1,402
SouthState
Corp
136,737
2,274
Veritex
Holdings
Inc
61,398
1,517
Wintrust
Financial
Corp
175,806
TOTAL
BANKS
803,149
CAPITAL
GOODS
-
13.3%
509
(a)
AeroVironment
Inc
109,415
518
Applied
Industrial
Technologies
Inc
119,963
1,233
Arcosa
Inc
115,458
593
Enpro
Inc
86,347
934
ESCO
Technologies
Inc
117,254
2,349
(a)
Fluor
Corp
122,806
10,144
(a)
Hillman
Solutions
Corp
107,526
4,646
(a)
Kratos
Defense
&
Security
Solutions
Inc
105,557
773
(a)
SPX
Technologies
Inc
110,918
TOTAL
CAPITAL
GOODS
995,244
COMMERCIAL
&
PROFESSIONAL
SERVICES
-
3.0%
305
(a)
ASGN
Inc
28,090
1,195
Maximus
Inc
103,296
2,004
(a)
WNS
Holdings
Ltd
96,172
TOTAL
COMMERCIAL
&
PROFESSIONAL
SERVICES
227,558
CONSUMER
DISCRETIONARY
DISTRIBUTION
&
RETAIL
-
1.3%
1,027
Signet
Jewelers
Ltd
94,155
TOTAL
CONSUMER
DISCRETIONARY
DISTRIBUTION
&
RETAIL
94,155
CONSUMER
DURABLES
&
APPAREL
-
2.7%
2,310
Steven
Madden
Ltd
103,881
2,463
(a)
Tri
Pointe
Homes
Inc
99,579
TOTAL
CONSUMER
DURABLES
&
APPAREL
203,460
CONSUMER
SERVICES
-
4.3%
1,526
Boyd
Gaming
Corp
105,737
7,344
(a)
Everi
Holdings
Inc
97,895
981
(a)
Shake
Shack
Inc,
Class
A
119,358
TOTAL
CONSUMER
SERVICES
322,990
ENERGY
-
4.2%
1,758
Matador
Resources
Co
91,610
1,333
Noble
Corp
PLC
42,617
3,674
Northern
Oil
&
Gas
Inc
133,183
1,627
(a)
Vital
Energy
Inc
44,368
TOTAL
ENERGY
311,778
EQUITY
REAL
ESTATE
INVESTMENT
TRUSTS
(REITS)
-
3.4%
575
EastGroup
Properties
Inc
98,486
2,722
STAG
Industrial
Inc
101,476
8,329
Summit
Hotel
Properties
Inc
50,974
TOTAL
EQUITY
REAL
ESTATE
INVESTMENT
TRUSTS
(REITS)
250,936
FINANCIAL
SERVICES
-
6.7%
601
Evercore
Inc,
Class
A
158,766
1,184
FirstCash
Holdings
Inc
122,508
6,317
Ladder
Capital
Corp
72,077
507
Piper
Sandler
Cos
143,806
TOTAL
FINANCIAL
SERVICES
497,157
FOOD,
BEVERAGE
&
TOBACCO
-
1.8%
5,213
Primo
Water
Corp
136,737
TOTAL
FOOD,
BEVERAGE
&
TOBACCO
136,737
Portfolio
of
Investments
October
31,
2024
(continued)
NSCS
SHARES
DESCRIPTION
VALUE
HEALTH
CARE
EQUIPMENT
&
SERVICES
-
11.4%
1,225
(a)
Acadia
Healthcare
Co
Inc
$
52,295
3,002
(a)
Alphatec
Holdings
Inc
23,566
1,127
Encompass
Health
Corp
112,092
1,481
(a),(b)
Establishment
Labs
Holdings
Inc
63,816
661
(a)
Glaukos
Corp
87,417
2,720
(a)
Guardian
Pharmacy
Services
Inc,
Class
A
48,715
1,416
(a)
HealthEquity
Inc
120,714
1,208
(a)
Merit
Medical
Systems
Inc
119,181
1,924
(a)
Option
Care
Health
Inc
44,329
1,303
(a)
RadNet
Inc
84,747
3,937
(a)
SI-BONE
Inc
54,331
2,454
(a)
Tactile
Systems
Technology
Inc
35,608
TOTAL
HEALTH
CARE
EQUIPMENT
&
SERVICES
846,811
HOUSEHOLD
&
PERSONAL
PRODUCTS
-
1.1%
1,235
(a)
BellRing
Brands
Inc
81,300
TOTAL
HOUSEHOLD
&
PERSONAL
PRODUCTS
81,300
INSURANCE
-
0.9%
242
Primerica
Inc
66,988
TOTAL
INSURANCE
66,988
MATERIALS
-
5.5%
2,189
Avient
Corp
102,029
1,966
Commercial
Metals
Co
105,771
2,578
(a)
Summit
Materials
Inc,
Class
A
122,223
6,913
Tronox
Holdings
PLC
83,786
TOTAL
MATERIALS
413,809
MEDIA
&
ENTERTAINMENT
-
2.5%
9,450
(a)
Magnite
Inc
117,936
1,467
(a)
Ziff
Davis
Inc
67,878
TOTAL
MEDIA
&
ENTERTAINMENT
185,814
PHARMACEUTICALS,
BIOTECHNOLOGY
&
LIFE
SCIENCES
-
5.1%
634
(a)
Biohaven
Ltd
31,548
266
(a)
Blueprint
Medicines
Corp
23,278
1,000
(a)
Crinetics
Pharmaceuticals
Inc
55,960
1,037
(a)
Halozyme
Therapeutics
Inc
52,441
1,201
(a)
Immunovant
Inc
35,141
727
(a)
Insmed
Inc
48,912
292
(a)
Krystal
Biotech
Inc
50,379
124
(a)
Madrigal
Pharmaceuticals
Inc
32,158
443
(a)
Vaxcyte
Inc
47,113
TOTAL
PHARMACEUTICALS,
BIOTECHNOLOGY
&
LIFE
SCIENCES
376,930
SEMICONDUCTORS
&
SEMICONDUCTOR
EQUIPMENT
-
3.0%
2,549
(a)
Ichor
Holdings
Ltd
69,486
441
(a)
Onto
Innovation
Inc
87,463
649
(a)
Silicon
Laboratories
Inc
67,405
TOTAL
SEMICONDUCTORS
&
SEMICONDUCTOR
EQUIPMENT
224,354
SOFTWARE
&
SERVICES
-
7.8%
406
(a)
CommVault
Systems
Inc
63,413
715
(a)
Envestnet
Inc
44,888
6,534
(a)
Grid
Dynamics
Holdings
Inc
104,021
1,975
(a)
JFrog
Ltd
57,630
1,292
(a)
Q2
Holdings
Inc
109,381
2,388
(a)
Rubrik
Inc,
Class
A
98,529
1,317
(a)
Workiva
Inc
105,044
TOTAL
SOFTWARE
&
SERVICES
582,906
TECHNOLOGY
HARDWARE
&
EQUIPMENT
-
3.7%
731
(a)
Itron
Inc
81,696
1,477
(a)
Lumentum
Holdings
Inc
94,336
631
(a)
PAR
Technology
Corp
37,223
2,852
(a)
TTM
Technologies
Inc
63,999
TOTAL
TECHNOLOGY
HARDWARE
&
EQUIPMENT
277,254
SHARES
DESCRIPTION
VALUE
TRANSPORTATION
-
1.9%
807
ArcBest
Corp
$
84,073
520
(a)
Kirby
Corp
59,675
TOTAL
TRANSPORTATION
143,748
UTILITIES
-
2.2%
1,680
Black
Hills
Corp
99,439
1,012
Spire
Inc
64,627
TOTAL
UTILITIES
164,066
TOTAL
COMMON
STOCKS
(Cost
$6,102,169)
7,324,587
SHARES
DESCRIPTION
VALUE
71,608
INVESTMENT
COMPANIES
-
0.9%
71,608
738
(b)
SPDR
S&P
Biotech
ETF
71,608
TOTAL
INVESTMENT
COMPANIES
(Cost
$59,391)
71,608
TOTAL
LONG-TERM
INVESTMENTS
(Cost
$6,161,560)
7,396,195
SHARES
DESCRIPTION
RATE
VALUE
INVESTMENTS
PURCHASED
WITH
COLLATERAL
FROM
SECURITIES
LENDING
-
0.6%
45,384
State
Street
Navigator
Securities
Lending
Government
Money
Market
Portfolio(c)
4.860
%
(d)
$
45,384
TOTAL
INVESTMENTS
PURCHASED
WITH
COLLATERAL
FROM
SECURITIES
LENDING
(Cost
$45,384)
45,384
TOTAL
INVESTMENTS
-
99.7%
(Cost
$6,206,944
)
7,441,579
OTHER
ASSETS
&
LIABILITIES,
NET
-
0.3%
18,866
NET
ASSETS
-
100%
$
7,460,445
For
Fund
portfolio
compliance
purposes,
the
Fund’s
industry
classifications
refer
to
any
one
or
more
of
the
industry
sub-classifications
used
by
one
or
more
widely
recognized
market
indexes
or
ratings
group
indexes,
and/or
as
defined
by
Fund
management.
This
definition
may
not
apply
for
purposes
of
this
report,
which
may
combine
industry
sub-classifications
into
sectors
for
reporting
ease.
(a)
Non-income
producing;
issuer
has
not
declared
an
ex-dividend
date
within
the
past
twelve
months.
(b)
Investment,
or
a
portion
of
investment,
is
out
on
loan
for
securities
lending.
The
total
value
of
the
securities
out
on
loan
as
of
the
end
of
the
reporting
period
was
$42,460.
(c)
The
Fund
may
loan
securities
representing
up
to
one
third
of
the
value
of
its
total
assets
(which
includes
collateral
for
securities
on
loan)
to
broker
dealers,
banks,
and
other
institutions.
The
collateral
maintained
by
the
Fund
shall
have
a
value,
at
the
inception
of
each
loan,
equal
to
not
less
than
100%
of
the
value
of
the
loaned
securities.
The
cash
collateral
received
by
the
Fund
is
invested
in
this
money
market
fund.
(d)
The
rate
shown
is
the
one-day
yield
as
of
the
end
of
the
reporting
period.
ETF
Exchange-Traded
Fund
REIT
Real
Estate
Investment
Trust
S&P
Standard
&
Poor's
SPDR
Standard
&
Poor's
Depositary
Receipt
See
Notes
to
Financial
Statements
Portfolio
of
Investments
October
31,
2024
NWLG
SHARES
DESCRIPTION
VALUE
LONG-TERM
INVESTMENTS
-
99.4%
9188503
COMMON
STOCKS
-
99.4%
9188503
CAPITAL
GOODS
-
4.6%
997
General
Electric
Co
$
171,265
682
Trane
Technologies
PLC
252,449
TOTAL
CAPITAL
GOODS
423,714
COMMERCIAL
&
PROFESSIONAL
SERVICES
-
0.9%
474
Waste
Connections
Inc
83,779
TOTAL
COMMERCIAL
&
PROFESSIONAL
SERVICES
83,779
CONSUMER
DISCRETIONARY
DISTRIBUTION
&
RETAIL
-
11.7%
4,153
(a)
Amazon.com
Inc
774,119
95
(a)
MercadoLibre
Inc
193,532
96
(a)
O'Reilly
Automotive
Inc
110,702
TOTAL
CONSUMER
DISCRETIONARY
DISTRIBUTION
&
RETAIL
1,078,353
CONSUMER
SERVICES
-
4.0%
34
Booking
Holdings
Inc
158,993
2,121
(a)
Chipotle
Mexican
Grill
Inc
118,288
411
Hilton
Worldwide
Holdings
Inc
96,523
TOTAL
CONSUMER
SERVICES
373,804
FINANCIAL
SERVICES
-
5.1%
1,530
KKR
&
Co
Inc
211,507
519
Mastercard
Inc
259,287
TOTAL
FINANCIAL
SERVICES
470,794
HEALTH
CARE
EQUIPMENT
&
SERVICES
-
4.6%
1,099
(a)
Boston
Scientific
Corp
92,338
445
(a)
Intuitive
Surgical
Inc
224,209
305
Stryker
Corp
108,665
TOTAL
HEALTH
CARE
EQUIPMENT
&
SERVICES
425,212
MATERIALS
-
2.0%
383
Ecolab
Inc
94,115
329
Vulcan
Materials
Co
90,123
TOTAL
MATERIALS
184,238
MEDIA
&
ENTERTAINMENT
-
10.6%
1,771
Alphabet
Inc,
Class
A
303,036
1,506
Alphabet
Inc,
Class
C
260,071
243
(a)
Netflix
Inc
183,715
613
(a)
Spotify
Technology
SA
236,066
TOTAL
MEDIA
&
ENTERTAINMENT
982,888
PHARMACEUTICALS,
BIOTECHNOLOGY
&
LIFE
SCIENCES
-
2.9%
313
(a)
Alnylam
Pharmaceuticals
Inc
83,443
227
Eli
Lilly
&
Co
188,351
TOTAL
PHARMACEUTICALS,
BIOTECHNOLOGY
&
LIFE
SCIENCES
271,794
SEMICONDUCTORS
&
SEMICONDUCTOR
EQUIPMENT
-
18.1%
978
(a)
Advanced
Micro
Devices
Inc
140,901
177
ASML
Holding
NV
119,041
1,894
Broadcom
Inc
321,544
1,660
Lam
Research
Corp
123,421
6,549
NVIDIA
Corp
869,445
520
Texas
Instruments
Inc
105,643
TOTAL
SEMICONDUCTORS
&
SEMICONDUCTOR
EQUIPMENT
1,679,995
SOFTWARE
&
SERVICES
-
24.8%
152
(a)
Adobe
Inc
72,668
76
(a)
Fair
Isaac
Corp
151,476
296
Intuit
Inc
180,649
2,818
Microsoft
Corp
1,145,094
1,070
Oracle
Corp
179,589
181
(a)
ServiceNow
Inc
168,871
1,305
(a)
Shopify
Inc,
Class
A
102,064
177
(a)
Synopsys
Inc
90,909
843
(a)
Workday
Inc,
Class
A
197,136
TOTAL
SOFTWARE
&
SERVICES
2,288,456
SHARES
DESCRIPTION
VALUE
TECHNOLOGY
HARDWARE
&
EQUIPMENT
-
8.6%
1,580
Amphenol
Corp,
Class
A
$
105,892
2,550
Apple
Inc
576,071
280
(a)
Arista
Networks
Inc
108,203
TOTAL
TECHNOLOGY
HARDWARE
&
EQUIPMENT
790,166
TRANSPORTATION
-
1.5%
1,878
(a)
Uber
Technologies
Inc
135,310
TOTAL
TRANSPORTATION
135,310
TOTAL
COMMON
STOCKS
(Cost
$6,627,830)
9,188,503
TOTAL
LONG-TERM
INVESTMENTS
(Cost
$6,627,830)
9,188,503
OTHER
ASSETS
&
LIABILITIES,
NET
-
0.6%
53,412
NET
ASSETS
-
100%
$
9,241,915
For
Fund
portfolio
compliance
purposes,
the
Fund’s
industry
classifications
refer
to
any
one
or
more
of
the
industry
sub-classifications
used
by
one
or
more
widely
recognized
market
indexes
or
ratings
group
indexes,
and/or
as
defined
by
Fund
management.
This
definition
may
not
apply
for
purposes
of
this
report,
which
may
combine
industry
sub-classifications
into
sectors
for
reporting
ease.
(a)
Non-income
producing;
issuer
has
not
declared
an
ex-dividend
date
within
the
past
twelve
months.
See
Notes
to
Financial
Statements
Statement
of
Assets
and
Liabilities
See
Notes
to
Financial
Statements
October
31,
2024
NUDV
NUEM
NUDM
NULC
NULG
ASSETS
Long-term
investments,
at
value
†
$
11,673,775
$
292,332,704
$
461,739,462
$
34,285,574
$
1,496,247,974
Cash
16,344
478,136
1,199,796
41,425
2,946,890
Cash
denominated
in
foreign
currencies
^
—
21,023
2,033
—
—
Receivables:
Dividends
14,176
172,498
1,064,051
24,087
156,905
Interest
—
5,834
5
—
—
Reclaims
69
21,483
845,719
118
—
Other
99
—
8,853
270
15,003
Total
assets
11,704,463
293,031,678
464,859,919
34,351,474
1,499,366,772
LIABILITIES
Payables:
Management
fees
2,313
88,049
119,629
5,921
321,835
Capital
gains
tax
—
2,311,699
—
—
—
Accrued
expenses:
Professional
fees
25
790
1,331
95
4,396
Trustees
fees
98
3,139
5,228
382
16,600
Other
99
3,466
3,369
270
15,003
Total
liabilities
2,535
2,407,143
129,557
6,668
357,834
Net
assets
$
11,701,928
$
290,624,535
$
464,730,362
$
34,344,806
$
1,499,008,938
Shares
outstanding
400,000
9,600,000
14,600,000
750,000
18,150,000
Net
asset
value
("NAV")
per
share
$
29.25
$
30.27
$
31.83
$
45.79
$
82.59
NET
ASSETS
CONSIST
OF:
Paid-in
capital
10,513,342
281,137,619
412,611,778
25,638,688
1,353,679,842
Total
distributable
earnings
(loss)
1,188,586
9,486,916
52,118,584
8,706,118
145,329,096
Net
assets
$
11,701,928
$
290,624,535
$
464,730,362
$
34,344,806
$
1,499,008,938
Authorized
shares
Unlimited
Unlimited
Unlimited
Unlimited
Unlimited
Par
value
per
share
$
0.01
$
0.01
$
0.01
$
0.01
$
0.01
†
Long-term
investments,
cost
$
10,973,670
$
247,821,001
$
404,936,635
$
26,065,633
$
1,242,259,974
^ Cash
denominated
in
foreign
currencies,
cost
$
—
$
21,265
$
2,310
$
—
$
—
Statement
of
Assets
and
Liabilities
(continued)
See
Notes
to
Financial
Statements
October
31,
2024
NULV
NUMG
NUMV
NUSC
NDVG
ASSETS
Long-term
investments,
at
value
†‡
$
1,690,268,226
$
400,158,594
$
364,608,879
$
1,206,742,165
$
11,220,762
Investments
purchased
with
collateral
from
securities
lending,
at
value
(cost
approximates
value)
—
—
—
9,344,093
—
Cash
2,546,777
523,319
397,485
2,504,184
118,156
Receivables:
Dividends
1,974,556
34,727
146,980
170,599
9,236
Reclaims
98,956
—
23,940
—
—
Securities
lending
income
—
184
—
40,437
—
Other
23,001
5,628
6,736
19,662
85
Total
assets
1,694,911,516
400,722,452
365,184,020
1,218,821,140
11,348,239
LIABILITIES
Payables:
Management
fees
368,451
102,879
94,395
308,853
6,280
Collateral
from
securities
lending
—
—
—
9,344,093
—
Accrued
expenses:
Professional
fees
5,332
1,307
1,118
3,792
37
Trustees
fees
19,228
4,419
4,069
13,463
128
Other
23,000
5,628
3,905
16,603
85
Total
liabilities
416,011
114,233
103,487
9,686,804
6,530
Net
assets
$
1,694,495,505
$
400,608,219
$
365,080,533
$
1,209,134,336
$
11,341,709
Shares
outstanding
41,600,000
8,950,000
10,200,000
28,650,000
350,000
Net
asset
value
("NAV")
per
share
$
40.73
$
44.76
$
35.79
$
42.20
$
32.40
NET
ASSETS
CONSIST
OF:
Paid-in
capital
1,711,854,871
462,354,137
379,853,522
1,338,269,898
10,291,305
Total
distributable
earnings
(loss)
(17,359,366)
(61,745,918)
(14,772,989)
(129,135,562)
1,050,404
Net
assets
$
1,694,495,505
$
400,608,219
$
365,080,533
$
1,209,134,336
$
11,341,709
Authorized
shares
Unlimited
Unlimited
Unlimited
Unlimited
Unlimited
Par
value
per
share
$
0.01
$
0.01
$
0.01
$
0.01
$
0.01
†
Long-term
investments,
cost
$
1,529,122,937
$
361,055,971
$
322,254,770
$
1,104,744,668
$
9,839,387
‡
Includes
securities
loaned
of
$
—
$
—
$
—
$
8,526,480
$
—
Statement
of
Assets
and
Liabilities
(continued)
See
Notes
to
Financial
Statements
October
31,
2024
NUGO
NSCS
NWLG
ASSETS
Long-term
investments,
at
value
†‡
$
2,707,001,387
$
7,396,195
$
9,188,503
Investments
purchased
with
collateral
from
securities
lending,
at
value
(cost
approximates
value)
—
45,384
—
Cash
300,408
92,542
56,918
Receivables:
Dividends
252,856
1,138
1,260
Investments
sold
44,546,099
34,643
—
Reclaims
83,536
—
—
Securities
lending
income
—
31
—
Shares
sold
—
141
—
Other
31,141
62
511
Total
assets
2,752,215,427
7,570,136
9,247,192
LIABILITIES
Payables:
Management
fees
1,318,176
5,418
5,093
Collateral
from
securities
lending
—
45,384
—
Investments
purchased
-
regular
settlement
—
58,723
—
Accrued
expenses:
Professional
fees
8,305
21
25
Trustees
fees
31,013
83
103
Other
31,140
62
56
Total
liabilities
1,388,634
109,691
5,277
Net
assets
$
2,750,826,793
$
7,460,445
$
9,241,915
Shares
outstanding
84,580,000
270,000
290,000
Net
asset
value
("NAV")
per
share
$
32.52
$
27.63
$
31.87
NET
ASSETS
CONSIST
OF:
Paid-in
capital
2,529,616,192
6,941,206
7,583,330
Total
distributable
earnings
(loss)
221,210,601
519,239
1,658,585
Net
assets
$
2,750,826,793
$
7,460,445
$
9,241,915
Authorized
shares
Unlimited
Unlimited
Unlimited
Par
value
per
share
$
0.01
$
0.01
$
0.01
†
Long-term
investments,
cost
$
1,774,798,686
$
6,161,560
$
6,627,830
‡
Includes
securities
loaned
of
$
—
$
42,460
$
—
See
Notes
to
Financial
Statements
Year
Ended
October
31,
2024
NUDV
NUEM
NUDM
NULC
NULG
INVESTMENT
INCOME
Dividends
$
292,741
$
7,512,842
$
13,204,580
$
412,179
$
7,023,903
Interest
448
3,422
23,347
1,550
33,063
Securities
lending
income,
net
124
5,263
283
2,273
4,927
Tax
withheld
on
income
(267)
(1,203,853)
(1,241,192)
(77)
(22,079)
Total
investment
income
293,046
6,317,674
11,987,018
415,925
7,039,814
EXPENSES
Management
fees
24,934
890,640
1,259,958
59,110
3,374,590
Professional
fees
188
4,461
7,551
525
24,381
Trustees
fees
339
9,408
15,530
1,107
51,301
Other
—
3,336
10,890
436
—
Total
expenses
25,461
907,845
1,293,929
61,178
3,450,272
Net
investment
income
(loss)
267,585
5,409,829
10,693,089
354,747
3,589,542
REALIZED
AND
UNREALIZED
GAIN
(LOSS)
Realized
gain
(loss):
Investments*
521,144
(3,635,926)
12,733,795
660,894
(27,996,954)
In-kind
redemptions
501,011
—
2,583,164
—
223,912,069
Foreign
currency
transactions
—
(400,361)
(243,459)
—
—
Net
realized
gain
(loss)
1,022,155
(4,036,287)
15,073,500
660,894
195,915,115
Change
in
unrealized
appreciation
(depreciation)
on:
Investments**
1,786,753
51,272,893
65,112,608
6,989,499
232,916,309
Foreign
currency
translations
—
(8,321)
(37,657)
—
—
Net
change
in
unrealized
appreciation
(depreciation)
1,786,753
51,264,572
65,074,951
6,989,499
232,916,309
Net
realized
and
unrealized
gain
(loss)
2,808,908
47,228,285
80,148,451
7,650,393
428,831,424
Net
increase
(decrease)
in
net
assets
from
operations
$
3,076,493
$
52,638,114
$
90,841,540
$
8,005,140
$
432,420,966
*
Net
of
foreign
capital
gains
tax
$
—
$
(655,938)
$
—
$
—
$
—
**
Net
of
change
in
foreign
capital
gains
tax
$
—
$
(2,311,699)
$
—
$
—
$
—
Statement
of
Operations
(continued)
See
Notes
to
Financial
Statements
Year
Ended
October
31,
2024
NULV
NUMG
NUMV
NUSC
NDVG
INVESTMENT
INCOME
Dividends
$
37,347,408
$
1,532,462
$
7,486,664
$
14,311,479
$
208,417
Interest
38,352
11,722
10,605
40,004
3,381
Securities
lending
income,
net
1,118
12,958
5,899
304,142
—
Tax
withheld
on
income
(890)
—
21,463
(16,647)
(508)
Total
investment
income
37,385,988
1,557,142
7,524,631
14,638,978
211,290
EXPENSES
Management
fees
3,962,191
1,157,986
1,023,282
3,343,361
73,500
Professional
fees
29,226
7,308
6,308
20,579
208
Trustees
fees
58,685
14,267
12,610
41,462
413
Total
expenses
4,050,102
1,179,561
1,042,200
3,405,402
74,121
Net
investment
income
(loss)
33,335,886
377,581
6,482,431
11,233,576
137,169
REALIZED
AND
UNREALIZED
GAIN
(LOSS)
Realized
gain
(loss):
Investments
(59,548,216)
(29,853,875)
(17,373,895)
(95,956,614)
(79,912)
In-kind
redemptions
130,579,560
58,888,787
41,468,208
130,391,462
1,591,065
Net
realized
gain
(loss)
71,031,344
29,034,912
24,094,313
34,434,848
1,511,153
Change
in
unrealized
appreciation
(depreciation)
on:
Investments
277,350,070
68,340,429
73,454,661
239,944,443
1,314,288
Net
change
in
unrealized
appreciation
(depreciation)
277,350,070
68,340,429
73,454,661
239,944,443
1,314,288
Net
realized
and
unrealized
gain
(loss)
348,381,414
97,375,341
97,548,974
274,379,291
2,825,441
Net
increase
(decrease)
in
net
assets
from
operations
$
381,717,300
$
97,752,922
$
104,031,405
$
285,612,867
$
2,962,610
Statement
of
Operations
(continued)
See
Notes
to
Financial
Statements
Year
Ended
October
31,
2024
NUGO
NSCS
NWLG
INVESTMENT
INCOME
Affiliated
income
$
—
$
—
$
1,290
Dividends
15,021,544
73,523
36,623
Interest
164,057
1,463
1,050
Securities
lending
income,
net
—
2,188
—
Tax
withheld
on
income
(65,498)
(387)
(227)
Total
investment
income
15,120,103
76,787
38,736
EXPENSES
Management
fees
15,676,478
57,305
49,004
Professional
fees
50,564
116
134
Trustees
fees
105,658
249
292
Total
expenses
15,832,700
57,670
49,430
Net
investment
income
(loss)
(712,597)
19,117
(10,694)
REALIZED
AND
UNREALIZED
GAIN
(LOSS)
Realized
gain
(loss):
Investments
6,576,319
339,891
467,478
In-kind
redemptions
330,870,111
65,939
107,940
Net
realized
gain
(loss)
337,446,430
405,830
575,418
Change
in
unrealized
appreciation
(depreciation)
on:
Investments
760,424,659
1,373,117
2,009,562
Net
change
in
unrealized
appreciation
(depreciation)
760,424,659
1,373,117
2,009,562
Net
realized
and
unrealized
gain
(loss)
1,097,871,089
1,778,947
2,584,980
Net
increase
(decrease)
in
net
assets
from
operations
$
1,097,158,492
$
1,798,064
$
2,574,286
Statement
of
Changes
in
Net
Assets
See
Notes
to
Financial
Statements
NUDV
NUEM
Year
Ended
10/31/24
Year
Ended
10/31/23
Year
Ended
10/31/24
Year
Ended
10/31/23
OPERATIONS
Net
investment
income
(loss)
$
267,585
$
278,129
$
5,409,829
$
5,034,923
Net
realized
gain
(loss)
1,022,155
286,044
(4,036,287)
(13,341,599)
Net
change
in
unrealized
appreciation
(depreciation)
1,786,753
(795,812)
51,264,572
29,435,732
Net
increase
(decrease)
in
net
assets
from
operations
3,076,493
(231,639)
52,638,114
21,129,056
DISTRIBUTIONS
TO
SHAREHOLDERS
Dividends
(272,150)
(326,285)
(5,500,560)
(3,969,620)
Total
distributions
(272,150)
(326,285)
(5,500,560)
(3,969,620)
FUND
SHARE
TRANSACTIONS
Subscriptions
2,985,679
7,139,645
28,573,072
30,858,962
Redemptions
(5,303,640)
(3,598,170)
–
(10,718,220)
Net
increase
(decrease)
from
Fund
share
transactions
(2,317,961)
3,541,475
28,573,072
20,140,742
Net
increase
(decrease)
in
net
assets
486,382
2,983,551
75,710,626
37,300,178
Net
assets
at
the
beginning
of
period
11,215,546
8,231,995
214,913,909
177,613,731
Net
assets
at
the
end
of
period
$
11,701,928
$
11,215,546
$
290,624,535
$
214,913,909
Statement
of
Changes
in
Net
Assets
(continued)
See
Notes
to
Financial
Statements
NUDM
NULC
Year
Ended
10/31/24
Year
Ended
10/31/23
Year
Ended
10/31/24
Year
Ended
10/31/23
OPERATIONS
Net
investment
income
(loss)
$
10,693,089
$
9,980,684
$
354,747
$
354,786
Net
realized
gain
(loss)
15,073,500
(9,418,512)
660,894
1,353,183
Net
change
in
unrealized
appreciation
(depreciation)
65,074,951
30,173,610
6,989,499
245,183
Net
increase
(decrease)
in
net
assets
from
operations
90,841,540
30,735,782
8,005,140
1,953,152
DISTRIBUTIONS
TO
SHAREHOLDERS
Dividends
(12,192,840)
(5,913,680)
(334,750)
(648,635)
Total
distributions
(12,192,840)
(5,913,680)
(334,750)
(648,635)
FUND
SHARE
TRANSACTIONS
Subscriptions
44,047,979
60,945,222
4,170,767
4,918,970
Redemptions
(11,489,566)
–
–
(8,309,095)
Net
increase
(decrease)
from
Fund
share
transactions
32,558,413
60,945,222
4,170,767
(3,390,125)
Net
increase
(decrease)
in
net
assets
111,207,113
85,767,324
11,841,157
(2,085,608)
Net
assets
at
the
beginning
of
period
353,523,249
267,755,925
22,503,649
24,589,257
Net
assets
at
the
end
of
period
$
464,730,362
$
353,523,249
$
34,344,806
$
22,503,649
Statement
of
Changes
in
Net
Assets
(continued)
See
Notes
to
Financial
Statements
NULG
NULV
Year
Ended
10/31/24
Year
Ended
10/31/23
Year
Ended
10/31/24
Year
Ended
10/31/23
OPERATIONS
Net
investment
income
(loss)
$
3,589,542
$
4,124,487
$
33,335,886
$
38,907,636
Net
realized
gain
(loss)
195,915,115
67,858,673
71,031,344
21,621,444
Net
change
in
unrealized
appreciation
(depreciation)
232,916,309
89,994,365
277,350,070
(95,040,172)
Net
increase
(decrease)
in
net
assets
from
operations
432,420,966
161,977,525
381,717,300
(34,511,092)
DISTRIBUTIONS
TO
SHAREHOLDERS
Dividends
(5,151,450)
(3,194,800)
(37,705,745)
(32,805,740)
Total
distributions
(5,151,450)
(3,194,800)
(37,705,745)
(32,805,740)
FUND
SHARE
TRANSACTIONS
Subscriptions
802,955,683
597,868,760
657,608,987
723,029,485
Redemptions
(768,715,035)
(512,906,665)
(690,761,184)
(803,390,155)
Net
increase
(decrease)
from
Fund
share
transactions
34,240,648
84,962,095
(33,152,197)
(80,360,670)
Net
increase
(decrease)
in
net
assets
461,510,164
243,744,820
310,859,358
(147,677,502)
Net
assets
at
the
beginning
of
period
1,037,498,774
793,753,954
1,383,636,147
1,531,313,649
Net
assets
at
the
end
of
period
$
1,499,008,938
$
1,037,498,774
$
1,694,495,505
$
1,383,636,147
Statement
of
Changes
in
Net
Assets
(continued)
See
Notes
to
Financial
Statements
NUMG
NUMV
Year
Ended
10/31/24
Year
Ended
10/31/23
Year
Ended
10/31/24
Year
Ended
10/31/23
OPERATIONS
Net
investment
income
(loss)
$
377,581
$
731,134
$
6,482,431
$
7,554,459
Net
realized
gain
(loss)
29,034,912
(22,597,495)
24,094,313
(19,922,300)
Net
change
in
unrealized
appreciation
(depreciation)
68,340,429
22,679,298
73,454,661
(16,157,098)
Net
increase
(decrease)
in
net
assets
from
operations
97,752,922
812,937
104,031,405
(28,524,939)
DISTRIBUTIONS
TO
SHAREHOLDERS
Dividends
(696,525)
(626,285)
(7,463,725)
(18,324,390)
Total
distributions
(696,525)
(626,285)
(7,463,725)
(18,324,390)
FUND
SHARE
TRANSACTIONS
Subscriptions
225,747,538
141,769,215
140,045,348
141,288,495
Redemptions
(246,257,929)
(130,837,060)
(168,349,723)
(108,286,065)
Net
increase
(decrease)
from
Fund
share
transactions
(20,510,391)
10,932,155
(28,304,375)
33,002,430
Net
increase
(decrease)
in
net
assets
76,546,006
11,118,807
68,263,305
(13,846,899)
Net
assets
at
the
beginning
of
period
324,062,213
312,943,406
296,817,228
310,664,127
Net
assets
at
the
end
of
period
$
400,608,219
$
324,062,213
$
365,080,533
$
296,817,228
Statement
of
Changes
in
Net
Assets
(continued)
See
Notes
to
Financial
Statements
NUSC
NDVG
Year
Ended
10/31/24
Year
Ended
10/31/23
Year
Ended
10/31/24
Year
Ended
10/31/23
OPERATIONS
Net
investment
income
(loss)
$
11,233,576
$
11,618,485
$
137,169
$
116,926
Net
realized
gain
(loss)
34,434,848
(4,949,463)
1,511,153
(162,734)
Net
change
in
unrealized
appreciation
(depreciation)
239,944,443
(80,326,221)
1,314,288
328,589
Net
increase
(decrease)
in
net
assets
from
operations
285,612,867
(73,657,199)
2,962,610
282,781
DISTRIBUTIONS
TO
SHAREHOLDERS
Dividends
(11,720,700)
(10,372,580)
(138,827)
(115,641)
Total
distributions
(11,720,700)
(10,372,580)
(138,827)
(115,641)
FUND
SHARE
TRANSACTIONS
Subscriptions
495,291,080
523,390,850
8,141,413
1,021,307
Redemptions
(449,650,302)
(459,587,365)
(7,837,567)
(737,015)
Net
increase
(decrease)
from
Fund
share
transactions
45,640,778
63,803,485
303,846
284,292
Net
increase
(decrease)
in
net
assets
319,532,945
(20,226,294)
3,127,629
451,432
Net
assets
at
the
beginning
of
period
889,601,391
909,827,685
8,214,080
7,762,648
Net
assets
at
the
end
of
period
$
1,209,134,336
$
889,601,391
$
11,341,709
$
8,214,080
Statement
of
Changes
in
Net
Assets
(continued)
See
Notes
to
Financial
Statements
NUGO
NSCS
Year
Ended
10/31/24
Year
Ended
10/31/23
Year
Ended
10/31/24
Year
Ended
10/31/23
OPERATIONS
Net
investment
income
(loss)
$
(712,597)
$
5,915,201
$
19,117
$
10,935
Net
realized
gain
(loss)
337,446,430
(151,903,256)
405,830
(293,748)
Net
change
in
unrealized
appreciation
(depreciation)
760,424,659
666,187,348
1,373,117
87,311
Net
increase
(decrease)
in
net
assets
from
operations
1,097,158,492
520,199,293
1,798,064
(195,502)
DISTRIBUTIONS
TO
SHAREHOLDERS
Dividends
(5,148,114)
(5,361,255)
(7,904)
(16,390)
Return
of
capital
–
–
–
(3,136)
Total
distributions
(5,148,114)
(5,361,255)
(7,904)
(19,526)
FUND
SHARE
TRANSACTIONS
Subscriptions
71,062,856
169,892,907
534,060
–
Redemptions
(889,242,154)
(540,562,557)
(256,889)
–
Net
increase
(decrease)
from
Fund
share
transactions
(818,179,298)
(370,669,650)
277,171
–
Net
increase
(decrease)
in
net
assets
273,831,080
144,168,388
2,067,331
(215,028)
Net
assets
at
the
beginning
of
period
2,476,995,713
2,332,827,325
5,393,114
5,608,142
Net
assets
at
the
end
of
period
$
2,750,826,793
$
2,476,995,713
$
7,460,445
$
5,393,114
Statement
of
Changes
in
Net
Assets
(continued)
See
Notes
to
Financial
Statements
NWLG
Year
Ended
10/31/24
Year
Ended
10/31/23
OPERATIONS
Net
investment
income
(loss)
$
(10,694)
$
384
Net
realized
gain
(loss)
575,418
(440,594)
Net
change
in
unrealized
appreciation
(depreciation)
2,009,562
1,387,412
Net
increase
(decrease)
in
net
assets
from
operations
2,574,286
947,202
DISTRIBUTIONS
TO
SHAREHOLDERS
Dividends
(1,000)
–
Total
distributions
(1,000)
–
FUND
SHARE
TRANSACTIONS
Subscriptions
1,522,085
188,861
Redemptions
(297,956)
(192,596)
Net
increase
(decrease)
from
Fund
share
transactions
1,224,129
(3,735)
Net
increase
(decrease)
in
net
assets
3,797,415
943,467
Net
assets
at
the
beginning
of
period
5,444,500
4,501,033
Net
assets
at
the
end
of
period
$
9,241,915
$
5,444,500
The
following
data
is
for
a
share
outstanding
for
each
fiscal
year
end
unless
otherwise
noted:
Investment
Operations
Less
Distributions
Net
Asset
Value,
Beginning
of
Period
Net
Investment
Income
(Loss)(a)
Net
Realized
/Unrealized
Gain
(Loss)
Total
From
Net
Investment
Income
From
Net
Realized
Gains
Return
of
Capital
Total
Net
Asset
Value,
End
of
Period
Market
Price,
End
of
Period
NUDV
10/31/24
$
22.43
$
0.71
$
6.87
$
7.58
$
(
0.76
)
$
—
$
—
$
(
0.76
)
$
29.25
$
29.27
10/31/23
23.52
0.65
(
0.99
)
(
0.34
)
(
0.61
)
(
0.14
)
—
(
0.75
)
22.43
22.41
10/31/22
25.69
0.62
(
2.21
)
(
1.59
)
(
0.58
)
—
—
(
0.58
)
23.52
23.52
10/31/21(d)
25.00
0.05
0.64
0.69
—
—
—
—
25.69
25.71
NUEM
10/31/24
24.99
0.59
5.33
5.92
(
0.64
)
—
—
(
0.64
)
30.27
30.44
10/31/23
22.77
0.60
2.10
2.70
(
0.48
)
—
—
(
0.48
)
24.99
24.95
10/31/22
34.14
0.69
(
11.27
)
(
10.58
)
(
0.38
)
(
0.41
)
—
(
0.79
)
22.77
22.71
10/31/21
29.18
0.52
4.86
5.38
(
0.42
)
—
—
(
0.42
)
34.14
34.15
10/31/20
25.57
0.40
3.75
4.15
(
0.54
)
—
—
(
0.54
)
29.18
29.37
NUDM
10/31/24
25.99
0.78
5.98
6.76
(
0.92
)
—
—
(
0.92
)
31.83
31.85
10/31/23
23.49
0.81
2.20
3.01
(
0.51
)
—
—
(
0.51
)
25.99
26.15
10/31/22
32.30
0.78
(
8.26
)
(
7.48
)
(
0.88
)
(
0.45
)
—
(
1.33
)
23.49
23.51
10/31/21
24.33
0.98
7.42
8.40
(
0.43
)
—
—
(
0.43
)
32.30
32.53
10/31/20
26.74
0.54
(
2.03
)
(
1.49
)
(
0.92
)
—
—
(
0.92
)
24.33
24.50
NULC
10/31/24
34.62
0.51
11.18
11.69
(
0.52
)
—
—
(
0.52
)
45.79
45.89
10/31/23
32.79
0.51
2.08
2.59
(
0.44
)
(
0.32
)
—
(
0.76
)
34.62
34.62
10/31/22
43.34
0.51
(
8.52
)
(
8.01
)
(
0.43
)
(
2.11
)
—
(
2.54
)
32.79
32.82
10/31/21
31.05
0.46
13.25
13.71
(
0.48
)
(
0.94
)
—
(
1.42
)
43.34
43.39
10/31/20
28.01
0.53
2.74
3.27
(
0.21
)
(
0.02
)
—
(
0.23
)
31.05
30.95
NULG
10/31/24
58.62
0.20
24.07
24.27
(
0.30
)
—
—
(
0.30
)
82.59
82.53
10/31/23
49.30
0.24
9.28
9.52
(
0.20
)
—
—
(
0.20
)
58.62
58.58
10/31/22
71.98
0.25
(
19.45
)
(
19.20
)
(
0.14
)
(
3.34
)
—
(
3.48
)
49.30
49.30
10/31/21
49.60
0.07
23.82
23.89
(
0.11
)
(
1.40
)
—
(
1.51
)
71.98
72.01
10/31/20
38.97
0.18
10.91
11.09
(
0.20
)
(
0.26
)
—
(
0.46
)
49.60
49.54
(a)
Based
on
average
shares
outstanding.
(b)
Percentage
is
not
annualized.
(c)
Does
not
include
in-kind
transactions.
(d)
For
the
period
September
27,
2021
(commencement
of
operations)
through
October
31,
2021.
(e)
Annualized.
See
Notes
to
Financial
Statements
Ratios
and
Supplemental
Data
Total
Return
Ratios
to
Average
Net
Assets
Based
on
Net
Asset
Value(b)
Based
on
Market
Price(b)
Net
Assets,
End
of
Period
(000)
Expenses
Net
Investment
Income
(Loss)
Portfolio
Turnover
Rate(c)
34
.14
%
34
.35
%
$
11,702
0
.26
%
2
.68
%
68
%
(
1
.59
)
(
1
.69
)
11,216
0
.26
2
.74
57
(
6
.22
)
(
6
.31
)
8,232
0
.26
2
.52
76
2
.74
2
.85
5,137
0
.25
(e)
2
.04
(e)
0
24
.12
24
.98
290,625
0
.36
2
.13
58
11
.80
12
.00
214,914
0
.36
2
.28
71
(
31
.62
)
(
31
.88
)
177,614
0
.36
2
.45
63
18
.45
17
.77
122,896
0
.44
1
.49
61
16
.41
16
.47
46,695
0
.45
1
.56
81
26
.37
25
.71
464,730
0
.31
2
.55
58
12
.84
13
.40
353,523
0
.31
2
.94
66
(
24
.17
)
(
24
.57
)
267,756
0
.31
2
.93
62
34
.83
34
.73
161,503
0
.39
3
.16
64
(
5
.91
)
(
5
.67
)
53,520
0
.40
2
.17
66
34
.04
34
.32
34,345
0
.21
1
.20
50
8
.06
7
.96
22,504
0
.21
1
.48
71
(
19
.57
)
(
19
.59
)
24,589
0
.21
1
.39
57
45
.28
45
.91
30,335
0
.20
1
.20
49
11
.71
11
.43
17,079
0
.20
1
.81
61
41
.51
41
.50
1,499,009
0
.26
0
.27
60
19
.36
19
.29
1,037,499
0
.26
0
.42
78
(
27
.90
)
(
27
.94
)
793,754
0
.26
0
.44
80
49
.04
49
.29
942,876
0
.34
0
.11
66
28
.66
28
.42
344,703
0
.35
0
.39
86
Financial
Highlights
(continued)
The
following
data
is
for
a
share
outstanding
for
each
fiscal
year
end
unless
otherwise
noted:
Investment
Operations
Less
Distributions
Net
Asset
Value,
Beginning
of
Period
Net
Investment
Income
(Loss)(a)
Net
Realized
/Unrealized
Gain
(Loss)
Total
From
Net
Investment
Income
From
Net
Realized
Gains
Return
of
Capital
Total
Net
Asset
Value,
End
of
Period
Market
Price,
End
of
Period
NULV
10/31/24
$
32.63
$
0.80
$
8.22
$
9.02
$
(
0.92
)
$
—
$
—
$
(
0.92
)
$
40.73
$
40.74
10/31/23
34.26
0.87
(
1.77
)
(
0.90
)
(
0.73
)
—
—
(
0.73
)
32.63
32.59
10/31/22
39.42
0.77
(
4.17
)
(
3.40
)
(
0.63
)
(
1.13
)
—
(
1.76
)
34.26
34.30
10/31/21
28.62
0.77
10.50
11.27
(
0.47
)
—
—
(
0.47
)
39.42
39.44
10/31/20
31.52
0.77
(
3.19
)
(
2.42
)
(
0.48
)
—
—
(
0.48
)
28.62
28.65
NUMG
10/31/24
34.47
0.04
10.33
10.37
(
0.08
)
—
—
(
0.08
)
44.76
44.84
10/31/23
34.39
0.08
0.06
0.14
(
0.06
)
—
—
(
0.06
)
34.47
34.45
10/31/22
57.68
0.05
(
17.07
)
(
17.02
)
(
0.01
)
(
6.26
)
—
(
6.27
)
34.39
34.42
10/31/21
42.94
(
0.03
)
16.66
16.63
(
0.02
)
(
1.87
)
—
(
1.89
)
57.68
57.71
10/31/20
33.26
0.03
9.75
9.78
(
0.10
)
—
—
(
0.10
)
42.94
42.83
NUMV
10/31/24
26.86
0.63
8.99
9.62
(
0.69
)
—
—
(
0.69
)
35.79
35.82
10/31/23
31.07
0.68
(
3.17
)
(
2.49
)
(
0.64
)
(
1.08
)
—
(
1.72
)
26.86
26.84
10/31/22
38.44
0.68
(
5.61
)
(
4.93
)
(
0.48
)
(
1.96
)
—
(
2.44
)
31.07
31.10
10/31/21
25.64
0.54
12.68
13.22
(
0.42
)
—
—
(
0.42
)
38.44
38.50
10/31/20
29.50
0.57
(
3.71
)
(
3.14
)
(
0.72
)
—
—
(
0.72
)
25.64
25.67
NUSC
10/31/24
32.41
0.40
9.82
10.22
(
0.43
)
—
—
(
0.43
)
42.20
42.22
10/31/23
35.54
0.43
(
3.16
)
(
2.73
)
(
0.40
)
—
—
(
0.40
)
32.41
32.40
10/31/22
45.25
0.37
(
7.12
)
(
6.75
)
(
0.32
)
(
2.64
)
—
(
2.96
)
35.54
35.58
10/31/21
30.68
0.36
14.41
14.77
(
0.20
)
—
—
(
0.20
)
45.25
45.27
10/31/20
29.65
0.28
1.03
1.31
(
0.28
)
—
—
(
0.28
)
30.68
30.74
(a)
Based
on
average
shares
outstanding.
(b)
Percentage
is
not
annualized.
(c)
Does
not
include
in-kind
transactions.
See
Notes
to
Financial
Statements
Ratios
and
Supplemental
Data
Total
Return
Ratios
to
Average
Net
Assets
Based
on
Net
Asset
Value(b)
Based
on
Market
Price(b)
Net
Assets,
End
of
Period
(000)
Expenses
Net
Investment
Income
(Loss)
Portfolio
Turnover
Rate(c)
28
.04
%
28
.23
%
$
1,694,496
0
.26
%
2
.10
%
47
%
(
2
.73
)
(
2
.98
)
1,383,636
0
.26
2
.52
61
(
9
.09
)
(
9
.03
)
1,531,314
0
.26
2
.15
68
39
.68
39
.63
1,176,613
0
.34
2
.13
59
(
7
.87
)
(
7
.78
)
535,228
0
.35
2
.63
38
30
.07
30
.39
400,608
0
.31
0
.10
78
0
.43
0
.27
324,062
0
.31
0
.21
100
(
32
.50
)
(
32
.48
)
312,943
0
.31
0
.13
84
39
.51
39
.92
400,877
0
.39
(
0
.06
)
83
29
.43
28
.90
193,216
0
.40
0
.08
94
36
.20
36
.41
365,081
0
.31
1
.90
51
(
8
.58
)
(
8
.76
)
296,817
0
.31
2
.30
77
(
13
.71
)
(
13
.76
)
310,664
0
.31
2
.02
77
51
.97
52
.06
276,751
0
.39
1
.57
67
(
10
.98
)
(
11
.11
)
119,241
0
.40
2
.25
72
31
.69
31
.77
1,209,134
0
.31
1
.01
45
(
7
.77
)
(
7
.89
)
889,601
0
.31
1
.19
62
(
15
.68
)
(
15
.63
)
909,828
0
.31
0
.99
71
48
.28
48
.03
1,106,366
0
.39
0
.85
60
4
.40
4
.44
369,634
0
.40
0
.98
54
Financial
Highlights
(continued)
The
following
data
is
for
a
share
outstanding
for
each
fiscal
year
end
unless
otherwise
noted:
Investment
Operations
Less
Distributions
Net
Asset
Value,
Beginning
of
Period
Net
Investment
Income
(Loss)(a)
Net
Realized
/Unrealized
Gain
(Loss)
Total
From
Net
Investment
Income
From
Net
Realized
Gains
Return
of
Capital
Total
Net
Asset
Value,
End
of
Period
Market
Price,
End
of
Period
NDVG
10/31/24
$
24.89
$
0.35
$
7.53
$
7.88
$
(
0.37
)
$
—
$
—
$
(
0.37
)
$
32.40
$
32.45
10/31/23
24.26
0.37
0.62
0.99
(
0.36
)
—
—
(
0.36
)
24.89
24.90
10/31/22
26.13
0.34
(
1.87
)
(
1.53
)
(
0.33
)
(
0.01
)
—
(
0.34
)
24.26
24.27
10/31/21(d)
25.00
0.09
1.10
1.19
(
0.06
)
—
—
(
0.06
)
26.13
26.14
NUGO
10/31/24
22.10
(
0.01
)
10.48
10.47
(
0.05
)
—
—
(
0.05
)
32.52
32.51
10/31/23
17.97
0.05
4.13
4.18
(
0.05
)
—
—
(
0.05
)
22.10
22.08
10/31/22
26.04
0.02
(
8.09
)
(
8.07
)
—
—
—
—
17.97
17.93
10/31/21(f)
25.00
0.01
1.03
1.04
—
—
—
—
26.04
26.05
NSCS
10/31/24
20.74
0.07
6.85
6.92
(
0.03
)
—
—
(
0.03
)
27.63
27.68
10/31/23
21.57
0.04
(
0.79
)
(
0.75
)
(
0.07
)
—
(
0.01
)
(
0.08
)
20.74
20.74
10/31/22
26.21
0.06
(
4.67
)
(
4.61
)
(
0.03
)
—
—
(
0.03
)
21.57
21.57
10/31/21(d)
25.00
0.01
1.20
1.21
—
—
—
—
26.21
26.22
NWLG
10/31/24
21.78
(
0.04
)
10.13
10.09
—
(g)
—
—
—
31.87
31.84
10/31/23
18.00
—
3.78
3.78
—
—
—
—
21.78
21.78
10/31/22
26.39
(
0.02
)
(
8.37
)
(
8.39
)
—
—
—
—
18.00
18.00
10/31/21(d)
25.00
(
0.02
)
1.41
1.39
—
—
—
—
26.39
26.37
(a)
Based
on
average
shares
outstanding.
(b)
Percentage
is
not
annualized.
(c)
Does
not
include
in-kind
transactions.
(d)
For
the
period
August
4,
2021
(commencement
of
operations)
through
October
31,
2021.
(e)
Annualized.
(f)
For
the
period
September
27,
2021
(commencement
of
operations)
through
October
31,
2021.
(g)
Value
rounded
to
zero.
See
Notes
to
Financial
Statements.
Ratios
and
Supplemental
Data
Total
Return
Ratios
to
Average
Net
Assets
Based
on
Net
Asset
Value(b)
Based
on
Market
Price(b)
Net
Assets,
End
of
Period
(000)
Expenses
Net
Investment
Income
(Loss)
Portfolio
Turnover
Rate(c)
31
.80
%
31
.95
%
$
11,342
0
.65
%
1
.19
%
10
%
4
.08
4
.08
8,214
0
.65
1
.45
18
(
5
.89
)
(
5
.91
)
7,763
0
.64
1
.34
12
4
.76
4
.82
6,009
0
.64
(e)
1
.52
(e)
7
47
.47
47
.51
2,750,827
0
.56
(
0
.03
)
22
23
.30
23
.46
2,476,996
0
.56
0
.24
31
(
31
.01
)
(
31
.16
)
2,332,827
0
.55
0
.09
39
4
.18
4
.18
1,687,423
0
.55
(e)
0
.39
(e)
2
33
.38
33
.63
7,460
0
.86
0
.28
49
(
3
.49
)
(
3
.51
)
5,393
0
.86
0
.19
44
(
17
.61
)
(
17
.62
)
5,608
0
.85
0
.27
64
4
.84
4
.87
6,290
0
.85
(e)
0
.23
(e)
11
46
.37
46
.19
9,242
0
.65
(
0
.14
)
57
20
.95
21
.00
5,445
0
.65
0
.01
71
(
31
.77
)
(
31
.74
)
4,501
0
.64
(
0
.08
)
58
5
.56
5
.50
6,069
0
.64
(e)
(
0
.24
)
(e)
15
Notes
to
Financial
Statements
1.
General
Information
Trust
and
Fund
Information:
Nushares
ETF
Trust
(the
“Trust”)
is
an
open-end
management
investment
company
registered
under
the
Investment
Company
Act
of
1940,
as
amended
(the
“1940
Act”).
The
Trust
is
comprised
of
Nuveen
ESG
Dividend
ETF
(NUDV),
Nuveen
ESG
Emerging
Markets
Equity
ETF
(NUEM),
Nuveen
ESG
International
Developed
Markets
Equity
ETF
(NUDM),
Nuveen
ESG
Large-Cap
ETF
(NULC),
Nuveen
ESG
Large-
Cap
Growth
ETF
(NULG),
Nuveen
ESG
Large-Cap
Value
ETF
(NULV),
Nuveen
ESG
Mid-Cap
Growth
ETF
(NUMG),
Nuveen
ESG
Mid-Cap
Value
ETF
(NUMV),
Nuveen
ESG
Small-Cap
ETF
(NUSC),
Nuveen
Dividend
Growth
ETF
(NDVG),
Nuveen
Growth
Opportunities
ETF
(NUGO),
Nuveen
Small
Cap
Select
ETF
(NSCS)
and
Nuveen
Winslow
Large-Cap
Growth
ESG
ETF
(NWLG)
(each
a
“Fund”
and
collectively,
the
“Funds”).
The
Trust
was
organized
as
a
Massachusetts
business
trust
on
February
20,
2015.
Shares
of
NUDV,
NUEM,
NUDM,
NULC,
NULG,
NULV,
NUMG,
NUMV
AND
NUSC
are
listed
and
traded
on
the
Cboe
BZX
Exchange,
Inc.,
while
shares
of
NDVG,
NUGO,
NSCS
and
NWLG
are
listed
and
traded
on
the
NYSE
Arca.
The
Cboe
BZX
Exchange,
Inc.
and
NYSE
Arca
are
each
an
“Exchange”.
Current
Fiscal
Period:
The
end
of
the
reporting
period
for
the
Funds
is
October
31,
2024,
and
the
period
covered
by
these
Notes
to
Financial
Statements
is
the
fiscal
year
ended
October
31,
2024
(the
"current
fiscal
period").
Investment
Adviser
and
Sub-Adviser:
The
Funds’
investment
adviser
is
Nuveen
Fund
Advisors,
LLC
(the
“Adviser”),
a
subsidiary
of
Nuveen,
LLC
(“Nuveen”).
Nuveen
is
the
investment
management
arm
of
Teachers
Insurance
and
Annuity
Association
of
America
(“TIAA”).
The
Adviser
has
overall
responsibility
for
management
of
the
Funds,
oversees
the
management
of
the
Funds’
portfolios,
manages
the
Funds’
business
affairs
and
provides
certain
clerical,
bookkeeping
and
other
administrative
services.
The
Adviser
has
entered
into
sub-advisory
agreements
with
Nuveen
Asset
Management
(“NAM”)
and
Teachers
Advisors,
LLC
(“TAL”),
each
an
affiliate
of
the
Adviser,
and
Winslow
Capital
Management,
LLC
(“Winslow
Capital”),
(each
a
“Sub-Adviser”
and
collectively,
the
“Sub-Advisers”).
NAM
is
responsible
for
managing
the
investment
portfolio
of
NDVG,
NUGO
and
NSCS.
TAL
is
responsible
for
managing
the
investment
portfolio
of
NUDV,
NUEM,
NUDM,
NULC,
NULG,
NULV,
NUMG,
NUMV
AND
NUSC.
Winslow
Capital
is
responsible
for
managing
the
investment
portfolio
of
NWLG.
2.
Significant
Accounting
Policies
The
accompanying
financial
statements
were
prepared
in
accordance
with
accounting
principles
generally
accepted
in
the
United
States
of
America
(“U.S.
GAAP”),
which
may
require
the
use
of
estimates
made
by
management
and
the
evaluation
of
subsequent
events.
Actual
results
may
differ
from
those
estimates. Each
Fund
is
an
investment
company
and
follows
accounting
guidance
in
the
Financial
Accounting
Standards
Board
(“FASB”)
Accounting
Standards
Codification
946,
Financial
Services
–
Investment
Companies.
The
net
asset
value
(“NAV”)
for
financial
reporting
purposes
may
differ
from
the
NAV
for
processing
security
and
shareholder
transactions.
The
NAV
for
financial
reporting
purposes
includes
security
and
shareholder
transactions
through
the
date
of
the
report.
Total
return
is
computed
based
on
the
NAV
used
for
processing
security
and
shareholder
transactions.
The
following
is
a
summary
of
the
significant
accounting
policies
consistently
followed
by
the
Funds.
Compensation:
The Trust
pays
no
compensation
directly
to
those
of
its officers,
all
of
whom
receive
remuneration
for
their
services
to the
Trust
from
the
Adviser
or
its
affiliates.
The
Funds'
Board
of Trustees
(the
"Board") has
adopted
a
deferred
compensation
plan
for
independent
trustees
that
enables
trustees
to
elect
to
defer
receipt
of
all
or
a
portion
of
the
annual
compensation
they
are
entitled
to
receive
from
certain
Nuveen-advised
funds.
Under
the
plan,
deferred
amounts
are
treated
as
though
equal
dollar
amounts
had
been
invested
in
shares
of
select
Nuveen-advised
funds.
Distributions
to
Shareholders:
Distributions
to
shareholders
are
recorded
on
the
ex-dividend
date.
The
amount,
character
and
timing
of
distributions
are
determined
in
accordance
with
federal
income
tax
regulations,
which
may
differ
from
U.S.
GAAP.
Foreign
Currency
Transactions
and
Translation:
The
books
and
records
of
the
Funds
are
maintained
in
U.S.
dollars.
Assets,
including
investments,
and
liabilities
denominated
in
foreign
currencies
are
translated
into
U.S.
dollars
at
the
end
of
each
day.
Purchases
and
sales
of
securities,
income
and
expenses
are
translated
into
U.S.
dollars
at
the
prevailing
exchange
rate
on
the
respective
dates
of
the
transactions.
Net
realized
foreign
currency
gains
and
losses
resulting
from
changes
in
exchange
rates
associated
with
(i)
foreign
currency,
(ii)
investments
and
(iii)
derivatives
include
foreign
currency
gains
and
losses
between
trade
date
and
settlement
date
of
the
transactions,
foreign
currency
transactions,
and
the
difference
between
the
amounts
of
interest
and
dividends
recorded
on
the
books
of
the
Funds
and
the
amounts
actually
received
are
recognized
as
a
component
of
“Net
realized
gain
(loss)
from
foreign
currency
transactions”
on
the
Statement
of
Operations,
when
applicable.
The
unrealized
gains
and
losses
resulting
from
changes
in
foreign
currency
exchange
rates
and
changes
in
foreign
exchange
rates
associated
with
(i)
investments
and
(ii)
other
assets
and
liabilities
are
recognized
as
a
component
of
“Change
in
unrealized
appreciation
(depreciation)
on foreign
currency
translations”
on
the
Statement
of
Operations,
when
applicable.
The
unrealized
gains
and
losses
resulting
from
changes
in
foreign
exchange
rates
associated
with
investments
in
derivatives
are
recognized
as
a
component
of
the
respective
derivative’s
related
“Change
in
unrealized
appreciation
(depreciation)”
on
the
Statement
of
Operations,
when
applicable.
As
of
the
end
of
the
reporting
period,
the
following
Funds'
investments
in
non-U.S.
securities
were
as
follows:
Notes
to
Financial
Statements
(continued)
Foreign
Taxes:
The
Funds
may
be
subject
to
foreign
taxes
on
income,
gains
on
investments
or
foreign
currency
repatriation,
a
portion
of
which
may
be
recoverable.
The
Funds
will
accrue
such
taxes
and
recoveries
as
applicable,
based
upon
the
current
interpretation
of
tax
rules
and
regulations
that
exist
in
the
markets
in
which
the
Funds
invest.
Indemnifications:
Under
the
Trust’s
organizational
documents,
its
officers
and
trustees
are
indemnified
against
certain
liabilities
arising
out
of
the
performance
of
their
duties
to
the
Trust.
In
addition,
in
the
normal
course
of
business,
the
Trust
enters
into
contracts
that
provide
general
indemnifications
to
other
parties.
The
Trust’s
maximum
exposure
under
these
arrangements
is
unknown
as
this
would
involve
future
claims
that
may
be
made
against
the
Trust
that
have
not
yet
occurred.
However,
the
Trust
has
not
had
prior
claims
or
losses
pursuant
to
these
contracts
and
expects
the
risk
of
loss
to
be
remote.
Investments
and
Investment
Income:
Securities
transactions
are
accounted
for
as
of
the
end
of
trade
date
for
financial
reporting
purposes.
Dividend
income
is
recorded
on
the
ex-dividend
date.
Foreign
dividend
income
is
recorded
on
the
ex-dividend
date
or
as
soon
as
possible
after
the
Funds
determine
the
existence
of
a
dividend
declaration.
Non-cash
dividends
received
in
the
form
of
stock,
if
any,
are
recognized
on
the
ex-dividend
date
and
recorded
at
fair
value.
Interest
income
is
recorded
on
an
accrual
basis.
Distributions
received
on
securities
that
represent
a
return
of
capital
or
capital
gains
are
recorded
as
a
reduction
of
cost
of
investments
and/or
as
a
realized
gain.
The
Funds
estimate
the
components
of
distributions
received
that
may
be
considered
return
of
capital
distributions
or
capital
gain
distributions.
Securities
lending
income
is
comprised
of
fees
earned
from
borrowers
and
income
earned
on
cash
collateral
investments.
New
Accounting
Pronouncement:
In
November
2023,
the
FASB
issued
Accounting
Standard
Update
(“ASU”)
No.
2023-07,
Segment
Reporting
(Topic
280)
Improvements
to
Reportable
Segment
Disclosures
(“ASU
2023-07”).
The
amendments
in
ASU
2023-07
improve
reportable
segment
disclosure
requirements,
primarily
through
enhanced
disclosures
about
significant
segment
expenses.
ASU
2023-07
also
requires
a
public
entity
that
has
a
single
reportable
segment
to
provide
all
the
disclosures
required
by
the
amendments
in
ASU
2023-07
and
all
existing
segment
disclosures
in
Topic
280.
The
amendments
in
ASU
2023-07
are
effective
for
fiscal
years
beginning
after
December
15,
2023,
and
interim
periods
within
fiscal
years
beginning
after
December
15,
2024.
Early
adoption
is
permitted.
Management
has
assessed
the
new
guidance
and
determined
that
it
will
not
have
a
material
impact
on
the
financial
positions
or
results
of
operations
of
the
Funds.
3.
Investment
Valuation
and
Fair
Value
Measurements
The
Funds’
investments
in
securities
are
recorded
at
their
estimated
fair
value
utilizing
valuation
methods
approved
by
the
Adviser,
subject
to
oversight
of
the Board.
Fair
value
is
defined
as
the
price
that
would
be
received
upon
selling
an
investment
or
transferring
a
liability
in
an
orderly
transaction
to
an
independent
buyer
in
the
principal
or
most
advantageous
market
for
the
investment.
U.S.
GAAP
establishes
the
three-tier
hierarchy
which
is
used
to
maximize
the
use
of
observable
market
data
and
minimize
the
use
of
unobservable
inputs
and
to
establish
classification
of
fair
value
measurements
for
disclosure
purposes.
Observable
inputs
reflect
the
assumptions
market
participants
would
use
in
pricing
the
asset
or
liability.
NUEM
Value
%
of
Net
Assets
Country:
China
$
80,750,413
27.8
%
India
56,666,287
19.5
Taiwan
54,773,790
18.8
South
Korea
29,809,525
10.3
Saudi
Arabia
13,835,767
4.8
Brazil
11,626,242
4.0
South
Africa
9,060,224
3.1
Malaysia
5,165,595
1.8
Mexico
5,127,290
1.8
Indonesia
4,509,932
1.6
Other
21,007,639
7.1
Total
non-U.S.
Securities
$292,332,704
100.6%
NUDM
Value
%
of
Net
Assets
Country:
Japan
$
106,650,612
22.9
%
United
Kingdom
65,069,592
14.0
Switzerland
45,673,100
9.8
France
40,733,570
8.8
Germany
38,963,193
8.4
Australia
30,176,176
6.5
Spain
17,443,171
3.8
Denmark
15,308,233
3.3
Italy
14,336,778
3.1
Netherlands
13,525,895
2.9
Other
58,683,282
12.6
Total
non-U.S.
Securities
$446,563,602
96.1%
Observable
inputs
are
based
on
market
data
obtained
from
sources
independent
of
the
reporting
entity.
Unobservable
inputs
reflect
management’s
assumptions
about
the
assumptions
market
participants
would
use
in
pricing
the
asset
or
liability.
Unobservable
inputs
are
based
on
the
best
information
available
in
the
circumstances.
The
following
is
a
summary
of
the
three-tiered
hierarchy
of
valuation
input
levels.
Level
1
–
Inputs
are
unadjusted
and
prices
are
determined
using
quoted
prices
in
active
markets
for
identical
securities.
Level
2
–
Prices
are
determined
using
other
significant
observable
inputs
(including
quoted
prices
for
similar
securities,
interest
rates,
credit
spreads,
etc.).
Level
3
–
Prices
are
determined
using
significant
unobservable
inputs
(including
management’s
assumptions
in
determining
the
fair
value
of
investments).
A
description
of
the
valuation
techniques
applied
to
the
Funds’
major
classifications
of
assets
and
liabilities
measured
at
fair
value
follows:
Equity
securities
and
exchange-traded
funds
listed
or
traded
on
a
national
market
or
exchange
are
valued
based
on
their
last
reported
sales
price
or
official
closing
price
of
such
market
or
exchange
on
the
valuation
date.
Foreign
equity
securities
and
registered
investment
companies
that
trade
on
a
foreign
exchange
are
valued
at
the
last
reported
sales
price
or
official
closing
price
on
the
principal
exchange
where
traded,
and
converted
to
U.S.
dollars
at
the
prevailing
rates
of
exchange
on
the
valuation
date.
To
the
extent
these
securities
are
actively
traded
and
no
valuation
adjustments
are
applied,
they
are
generally
classified
as
Level
1.
When
valuation
adjustments
are
applied
to
the
most
recent
last
sales
price
or
official
closing
price,
these
securities
are
generally
classified
as
Level
2.
Investments
in
investment
companies
are
valued
at
their
respective
NAVs
or
share
price on
the
valuation
date
and
are
generally
classified
as
Level
1.
Prices
of
certain
American
Depositary
Receipts
(“ADR”)
held
by
the
Funds
that
trade
in
the
United
States
are
valued
based
on
the
last
traded
price,
official
closing
price,
or
an
evaluated
price
provided
by
the
pricing
services and
are
generally
classified
as
Level
1
or
2.
Prices
of
fixed-income
securities
are
generally
provided
by
pricing
services
approved
by
the
Adviser,
which
is
subject
to
review
by
the
Adviser
and
oversight
of
the
Board. Pricing
services
establish
a
security’s
fair
value
using
methods
that
may
include
consideration
of
the
following:
yields
or
prices
of
investments
of
comparable
quality,
type
of
issue,
coupon,
maturity
and
rating,
market
quotes
or
indications
of
value
from
security
dealers,
evaluations
of
anticipated
cash
flows
or
collateral,
general
market
conditions
and
other
information
and
analysis,
including
the
obligor’s
credit
characteristics
considered
relevant.
In
pricing
certain
securities,
particularly
less
liquid
and
lower
quality
securities,
pricing
services
may
consider
information
about
a
security,
its
issuer
or
market
activity
provided
by
the
Adviser.
These
securities
are
generally
classified
as
Level
2.
For
any
portfolio
security
or
derivative
for
which
market
quotations
are
not
readily
available
or
for
which
the
Adviser
deems
the
valuations
derived
using
the
valuation
procedures
described
above
not
to
reflect
fair
value,
the
Adviser
will
determine
a
fair
value
in
good
faith
using
alternative
procedures
approved
by
the
Adviser,
subject
to
the
oversight
of
the
Board.
As
a
general
principle,
the
fair
value
of
a
security
is
the
amount
that
the
owner
might
reasonably
expect
to
receive
for
it
in
a
current
sale.
A
variety
of
factors
may
be
considered
in
determining
the
fair
value
of
such
securities,
which
may
include
consideration
of
the
following:
yields
or
prices
of
investments
of
comparable
quality,
type
of
issue,
coupon,
maturity
and
rating,
market
quotes
or
indications
of
value
from
security
dealers,
evaluations
of
anticipated
cash
flows
or
collateral,
general
market
conditions
and
other
information
and
analysis,
including
the
obligor’s
credit
characteristics
considered
relevant.
To
the
extent
the
inputs
are
observable
and
timely,
the
values
would
be
classified
as Level
2;
otherwise
they
would
be
classified
as
Level
3.
The
following
table
summarizes
the
market
value
of
the
Funds’
investments
as
of
the
end
of
the
reporting
period,
based
on
the
inputs
used
to
value
them:
NUDV
Level
1
Level
2
Level
3
Total
Long-Term
Investments:
Common
Stocks
$
11,673,775
$
–
$
–
$
11,673,775
Total
$
11,673,775
$
–
$
–
$
11,673,775
a
NUEM
Level
1
Level
2
Level
3
Total
Long-Term
Investments:
Common
Stocks
$
288,495,812
$
3,836,887
$
5
$
292,332,704
Total
$
288,495,812
$
3,836,887
$
5
$
292,332,704
a
NUDM
Level
1
Level
2
Level
3
Total
Long-Term
Investments:
Common
Stocks
$
461,739,462
$
–
$
–*
$
461,739,462
Total
$
461,739,462
$
–
$
–
$
461,739,462
a
Notes
to
Financial
Statements
(continued)
NULC
Level
1
Level
2
Level
3
Total
Long-Term
Investments:
Common
Stocks
$
34,285,574
$
–
$
–
$
34,285,574
Total
$
34,285,574
$
–
$
–
$
34,285,574
a
NULG
Level
1
Level
2
Level
3
Total
Long-Term
Investments:
Common
Stocks
$
1,496,247,974
$
–
$
–
$
1,496,247,974
Total
$
1,496,247,974
$
–
$
–
$
1,496,247,974
a
NULV
Level
1
Level
2
Level
3
Total
Long-Term
Investments:
Common
Stocks
$
1,690,268,226
$
–
$
–
$
1,690,268,226
Total
$
1,690,268,226
$
–
$
–
$
1,690,268,226
a
NUMG
Level
1
Level
2
Level
3
Total
Long-Term
Investments:
Common
Stocks
$
400,158,594
$
–
$
–
$
400,158,594
Total
$
400,158,594
$
–
$
–
$
400,158,594
a
NUMV
Level
1
Level
2
Level
3
Total
Long-Term
Investments:
Common
Stocks
$
364,608,879
$
–
$
–
$
364,608,879
Total
$
364,608,879
$
–
$
–
$
364,608,879
a
NUSC
Level
1
Level
2
Level
3
Total
Long-Term
Investments:
Common
Stock
Rights
$
–
$
–
$
91,920
$
91,920
Common
Stocks
1,206,650,245
–
–
1,206,650,245
Investments
Purchased
with
Collateral
from
Securities
Lending
9,344,093
–
–
9,344,093
Total
$
1,215,994,338
$
–
$
91,920
$
1,216,086,258
a
NDVG
Level
1
Level
2
Level
3
Total
Long-Term
Investments:
Common
Stocks
$
11,220,762
$
–
$
–
$
11,220,762
Total
$
11,220,762
$
–
$
–
$
11,220,762
a
NUGO
Level
1
Level
2
Level
3
Total
Long-Term
Investments:
Common
Stocks
$
2,707,001,387
$
–
$
–
$
2,707,001,387
Total
$
2,707,001,387
$
–
$
–
$
2,707,001,387
a
4.
Portfolio
Securities
Securities
Lending:
Each
Fund
may
lend
securities
representing
up
to
one-third
of
the
value
of
its
total
assets
to
broker-dealers,
banks,
and
other
institutions
in
order
to
generate
additional
income.
When
loaning
securities, a
Fund
retains
the
benefits
of
owning
the
securities,
including
the
economic
equivalent
of
dividends
or
interest
generated
by
the
security.
The
loans
are
continuous,
can
be
recalled
at
any
time,
and
have
no
set
maturity.
State
Street
Bank
and
Trust
Company
serves
as
the
securities
lending
agent
(the
“Agent”).
When
a
Fund
loans
its
portfolio
securities,
it
will
receive,
at
the
inception
of
each
loan,
cash
collateral
equal
to
an
amount
not
less
than
100%
of
the
market
value
of
the
loaned
securities.
The
actual
percentage
of
the
cash
collateral
will
vary
depending
upon
the
asset
type
of
the
loaned
securities.
Collateral
for
the
loaned
securities
is
invested
in
a
government
money
market
vehicle
maintained
by
the
Agent,
which
is
subject
to
the
requirements
of
Rule
2a-7
under
the
1940
Act.
The
value
of
the
loaned
securities
and
the
liability
to
return
the
cash
collateral
received
are
recognized
on
the
Statement
of
Assets
and
Liabilities.
If
the
market
value
of
the
loaned
securities
increases,
the
borrower
must
furnish
additional
collateral
to
the
Fund,
which
is
also
recognized
on
the
Statement
of
Assets
and
Liabilities.
Securities
out
on
loan
are
subject
to
termination
at
any
time
at
the
option
of
the
borrower
or
the
Fund.
Upon
termination,
the
borrower
is
required
to
return
to
the
Fund
securities
identical
to
the
securities
loaned.
During
the
term
of
the
loan,
the
Fund
bears
the
market
risk
with
respect
to
the
investment
of
collateral
and
the
risk
that
the
Agent
may
default
on
its
contractual
obligations
to
the
Fund.
The
Agent
bears
the
risk
that
the
borrower
may
default
on
its
obligation
to
return
the
loaned
securities
as
the
Agent
is
contractually
obligated
to
indemnify
the
Fund
if
at
the
time
of
a
default
by
a
borrower
some
or
all
of
the
loan
securities
have
not
been
returned.
Securities
lending
income
recognized
by
a
Fund
consists
of
earnings
on
invested
collateral
and
lending
fees,
net
of
any
rebates
to
the
borrower
and
compensation
to
the
Agent.
Such
income
is
recognized
on
the
Statement
of
Operations.
As
of
the
end
of
the
current
fiscal
period,
the
total
value
of
the
loaned
securities
and
the
total
value
of
collateral
received
were
as
follows:
Purchases
and
Sales:
Long-term
purchases
and
sales
(excluding in-kind
transactions)
during
the
current fiscal
period
were
as
follows:
NSCS
Level
1
Level
2
Level
3
Total
Long-Term
Investments:
Common
Stocks
$
7,324,587
$
–
$
–
$
7,324,587
Investment
Companies
71,608
–
–
71,608
Investments
Purchased
with
Collateral
from
Securities
Lending
45,384
–
–
45,384
Total
$
7,441,579
$
–
$
–
$
7,441,579
a
NWLG
Level
1
Level
2
Level
3
Total
Long-Term
Investments:
Common
Stocks
$
9,188,503
$
–
$
–
$
9,188,503
Total
$
9,188,503
$
–
$
–
$
9,188,503
a
*
Value
equals
zero
as
of
the
end
of
the
reporting
period.
Fund
Asset
Class
out
on
Loan
Long-Term
Investments,
at
Value
Total
Collateral
Received
NUSC
Common
Stocks
$8,526,480
$9,344,093
NSCS
Common
Stocks
$42,460
$45,384
Notes
to
Financial
Statements
(continued)
In-kind
transactions
during
the
current
fiscal
period
were
as
follows:
The
Funds
may
purchase
securities
on
a
when-issued
or
delayed-delivery
basis.
Securities
purchased
on
a
when-issued
or
delayed-delivery
basis
may
have
extended
settlement
periods;
interest
income
is
not
accrued
until
settlement
date.
Any
securities
so
purchased
are
subject
to
market
fluctuation
during
this
period. If
a
Fund
has
outstanding
when-issued/delayed-delivery
purchases
commitments
as
of
the
end
of
the
reporting
period,
such
amounts
are
recognized
on
the
Statement
of
Assets
and
Liabilities.
5.
Derivative
Investments
Each
Fund
is
authorized
to
invest
in
certain
derivative
instruments.
As
defined
by
U.S.
GAAP,
a
derivative
is
a
financial
instrument
whose
value
is
derived
from
an
underlying
security
price,
foreign
exchange
rate,
interest
rate,
index
of
prices
or
rates,
or
other
variables.
Investments
in
derivatives
as
of
the
end
of
and/or
during
the
current
fiscal
period,
if
any,
are
included
within
the
Statement
of
Assets
and
Liabilities
and
the
Statement
of
Operations,
respectively.
Although
the
Funds
are
authorized
to
invest
in
derivative
instruments,
and
may
do
so
in
the
future,
they
did
not
make
any
such
investments
during
the
current
fiscal
period.
Market
and
Counterparty
Credit
Risk:
In
the
normal
course
of
business
each
Fund
may
invest
in
financial
instruments
and
enter
into
financial
transactions
where
risk
of
potential
loss
exists
due
to
changes
in
the
market
(market
risk)
or
failure
of
the
other
party
to
the
transaction
to
perform
(counterparty
credit
risk).
The
potential
loss
could
exceed
the
value
of
the
financial
assets
recorded
on
the
financial
statements.
Financial
assets,
Purchases
Sales
Fund
Non-U.S.
Government
Purchases
Non-U.S.
Government
Sales
NUDV
$
7,360,775
$
7,345,617
NUEM
184,113,926
161,165,918
NUDM
261,814,481
263,220,574
NULC
16,182,346
15,960,022
NULG
878,046,234
862,561,083
NULV
808,614,776
802,828,097
NUMG
329,331,588
322,393,035
NUMV
187,166,031
187,617,000
NUSC
568,738,664
532,673,476
NDVG
1,169,212
1,206,467
NUGO
681,186,223
714,952,348
NSCS
3,556,382
3,545,998
NWLG
4,685,462
4,704,716
Fund
In-Kind
Purchases
In-Kind
Sales
NUDV
$
2,976,555
$
5,296,805
NUEM
3,522,341
—
NUDM
41,944,282
10,994,093
NULC
4,161,126
—
NULG
784,328,269
758,213,979
NULV
644,310,575
688,970,698
NUMG
225,496,045
245,668,005
NUMV
139,693,679
167,841,893
NUSC
493,553,250
450,380,455
NDVG
8,121,820
7,809,126
NUGO
68,304,176
881,921,926
NSCS
532,332
248,215
NWLG
1,502,516
293,743
which
potentially
expose
each
Fund
to
counterparty
credit
risk,
consist
principally
of
cash
due
from
counterparties
on
forward,
option
and
swap
transactions,
when
applicable.
The
extent
of
each
Fund’s
exposure
to
counterparty
credit
risk
in
respect
to
these
financial
assets
approximates
their
carrying
value
as
recorded
on
the
Statement
of
Assets
and
Liabilities.
Each
Fund
helps
manage
counterparty
credit
risk
by
entering
into
agreements
only
with
counterparties
the
Adviser
believes
have
the
financial
resources
to
honor
their
obligations
and
by
having
the
Adviser
monitor
the
financial
stability
of
the
counterparties.
Additionally,
counterparties
may
be
required
to
pledge
collateral
daily
(based
on
the
daily
valuation
of
the
financial
asset)
on
behalf
of
each
Fund
with
a
value
approximately
equal
to
the
amount
of
any
unrealized
gain
above
a
pre-determined
threshold.
Reciprocally,
when
each
Fund
has
an
unrealized
loss,
the
Funds
have
instructed
the
custodian
to
pledge
assets
of
the
Funds
as
collateral
with
a
value
approximately
equal
to
the
amount
of
the
unrealized
loss
above
a
pre-determined
threshold.
Collateral
pledges
are
monitored
and
subsequently
adjusted
if
and
when
the
valuations
fluctuate,
either
up
or
down,
by
at
least
the
pre-determined
threshold
amount.
6.
Fund
Shares
Each Fund
issues
and
redeems its
shares
on
a
continuous
basis
at
NAV
only
in
aggregations
of
a
specified
number
of
shares
or
multiples
thereof
(“Creation
Units”).
Only
certain
institutional
investors
(referred
to
as
“Authorized
Participants”)
who
have
entered
into
agreements
with
Nuveen
Securities,
LLC,
the
Funds'
distributor,
may
purchase
and
redeem
Creation
Units.
Once
created,
shares
of
the
Funds
trade
on
the
Exchange
at
market
prices
and
are
only
available
to
individual
investors
through
their
brokers.
Creation
Units
are
purchased
and
redeemed
in-kind
for
a
designated
portfolio
of
securities
included
in each
Fund’s
respective Index
and/or
a
specified
amount
of
cash.
Authorized
Participants
are
charged
fixed
transaction
fees
in
connection
with
purchasing
and
redeeming
Creation
Units.
Authorized
Participants
transacting
in
Creation
Units
for
cash
may
also
pay
an
additional
variable
charge
to
compensate
the
relevant Fund
for
certain
transaction
costs
(i.e.,
taxes
on
currency
or
other
financial
transactions,
and
brokerage
costs)
and
market
impact
expenses
it
incurs
in
purchasing
or
selling
portfolio
securities.
Such
variable
charges,
if
any,
are
included
in
“Proceeds
from
shares
sold”
on
the
Statements
of
Changes
in
Net
Assets.
Transactions
in
Fund
shares
during
the
current
and
prior
period
were
as
follows:
NUDV
NUEM
Year
Ended
10/31/24
Year
Ended
10/31/23
Year
Ended
10/31/24
Year
Ended
10/31/23
Shares
Amount
Shares
Amount
Shares
Amount
Shares
Amount
Subscriptions
100,000
$2,985,679
300,000
$7,139,645
1,000,000
$28,573,072
1,200,000
$30,858,962
Redemptions
(200,000)
(5,303,640)
(150,000)
(3,598,170)
–
–
(400,000)
(10,718,220)
Net
increase
(decrease)
(100,000)
$(2,317,961)
150,000
$3,541,475
1,000,000
$28,573,072
800,000
$20,140,742
NUDM
NULC
Year
Ended
10/31/24
Year
Ended
10/31/23
Year
Ended
10/31/24
Year
Ended
10/31/23
Shares
Amount
Shares
Amount
Shares
Amount
Shares
Amount
Subscriptions
1,400,000
$44,047,979
2,200,000
$60,945,222
100,000
$4,170,767
150,000
$4,918,970
Redemptions
(400,000)
(11,489,566)
–
–
–
–
(250,000)
(8,309,095)
Net
increase
(decrease)
1,000,000
$32,558,413
2,200,000
$60,945,222
100,000
$4,170,767
(100,000)
$(3,390,125)
NULG
NULV
Year
Ended
10/31/24
Year
Ended
10/31/23
Year
Ended
10/31/24
Year
Ended
10/31/23
Shares
Amount
Shares
Amount
Shares
Amount
Shares
Amount
Subscriptions
11,300,000
$802,955,683
10,450,000
$597,868,760
17,750,000
$657,608,987
20,750,000
$723,029,485
Redemptions
(10,850,000)
(768,715,035)
(8,850,000)
(512,906,665)
(18,550,000)
(690,761,184)
(23,050,000)
(803,390,155)
Net
increase
(decrease)
450,000
$34,240,648
1,600,000
$84,962,095
(800,000)
$(33,152,197)
(2,300,000)
$(80,360,670)
NUMG
NUMV
Year
Ended
10/31/24
Year
Ended
10/31/23
Year
Ended
10/31/24
Year
Ended
10/31/23
Shares
Amount
Shares
Amount
Shares
Amount
Shares
Amount
Subscriptions
5,450,000
$225,747,538
3,800,000
$141,769,215
4,350,000
$140,045,348
4,800,000
$141,288,495
Redemptions
(5,900,000)
(246,257,929)
(3,500,000)
(130,837,060)
(5,200,000)
(168,349,723)
(3,750,000)
(108,286,065)
Net
increase
(decrease)
(450,000)
$(20,510,391)
300,000
$10,932,155
(850,000)
$(28,304,375)
1,050,000
$33,002,430
NUSC
NDVG
Year
Ended
10/31/24
Year
Ended
10/31/23
Year
Ended
10/31/24
Year
Ended
10/31/23
Shares
Amount
Shares
Amount
Shares
Amount
Shares
Amount
Subscriptions
12,700,000
$495,291,080
14,550,000
$523,390,850
290,000
$8,141,413
40,000
$1,021,307
Redemptions
(11,500,000)
(449,650,302)
(12,700,000)
(459,587,365)
(270,000)
(7,837,567)
(30,000)
(737,015)
Net
increase
(decrease)
1,200,000
$45,640,778
1,850,000
$63,803,485
20,000
$303,846
10,000
$284,292
Notes
to
Financial
Statements
(continued)
7.
Income
Tax
Information
Each
Fund
is
a
separate
taxpayer
for
federal
income
tax
purposes.
Each
Fund
intends
to
distribute
substantially
all
of
its
net
investment
income
and
net
capital
gains
to
shareholders
and
otherwise
comply
with
the
requirements
of
Subchapter
M
of
the
Internal
Revenue
Code
applicable
to
regulated
investment
companies.
Therefore,
no
federal
income
tax
provision
is
required.
Each
Fund
files
income
tax
returns
in
U.S.
federal
and
applicable
state
and
local
jurisdictions.
A
Fund's
federal
income
tax
returns
are
generally
subject
to
examination
for
a
period
of
three
fiscal
years
after
being
filed.
State
and
local
tax
returns
may
be
subject
to
examination
for
an
additional
period
of
time
depending
on
the
jurisdiction.
Management
has
analyzed
each
Fund's
tax
positions
taken
for
all
open
tax
years
and
has
concluded
that
no
provision
for
income
tax
is
required
in
the
Fund's
financial
statements.
Differences
between
amounts
for
financial
statement
and
federal
income
tax
purposes
are
primarily
due
to
timing
differences
in
recognizing
gains
and
losses
on
investment
transactions. Temporary
differences
do
not
require
reclassification. As
of
year
end,
permanent
differences
that
resulted
in
reclassifications
among
the
components
of
net
assets
relate
primarily
to
foreign
currency
transactions,
investments
in
passive
foreign
investment
companies,
nondeductible
expenses,
redemptions
in-kind,
return
of
capital
and
long-term
capital
gain
distributions
received
from
portfolio
investments,
and
taxable
overdistribution. Temporary
and
permanent
differences
have
no
impact
on
a
Fund's
net
assets.
As
of
year
end,
the
aggregate
cost
and
the
net
unrealized
appreciation/(depreciation)
of
all
investments
for
federal
income
tax
purposes
were
as
follows:
For
purposes
of
this
disclosure,
tax
cost
generally
includes
the
cost
of
portfolio
investments
as
well
as
up-front
fees
or
premiums
exchanged
on
derivatives
and
any
amounts
unrealized
for
income
statement
reporting
but
realized
income
and/or
capital
gains
for
tax
reporting,
if
applicable.
As
of
year
end,
the
components
of
accumulated
earnings
on
a
tax
basis
were
as
follows:
NUGO
NSCS
Year
Ended
10/31/24
Year
Ended
10/31/23
Year
Ended
10/31/24
Year
Ended
10/31/23
Shares
Amount
Shares
Amount
Shares
Amount
Shares
Amount
Subscriptions
2,320,000
$71,062,856
8,810,000
$169,892,907
20,000
$534,060
–
$–
Redemptions
(29,840,000)
(889,242,154)
(26,550,000)
(540,562,557)
(10,000)
(256,889)
–
–
Net
increase
(decrease)
(27,520,000)
$(818,179,298)
(17,740,000)
$(370,669,650)
10,000
$277,171
–
$–
NWLG
Year
Ended
10/31/24
Year
Ended
10/31/23
Shares
Amount
Shares
Amount
Subscriptions
50,000
$1,522,085
10,000
$188,861
Redemptions
(10,000)
(297,956)
(10,000)
(192,596)
Net
increase
(decrease)
40,000
$1,224,129
–
$(3,735)
Fund
Tax
Cost
Gross
Unrealized
Appreciation
Gross
Unrealized
(Depreciation)
Net
Unrealized
Appreciation
(Depreciation)
NUDV
$
11,011,888
$
1,085,922
$
(424,035)
$
661,887
NUEM
252,249,372
58,746,206
(18,662,874)
40,083,332
NUDM
410,895,880
70,673,275
(19,808,863)
50,864,412
NULC
26,175,187
8,960,491
(850,104)
8,110,387
NULG
1,249,440,937
280,744,174
(33,937,137)
246,807,037
NULV
1,540,562,719
212,826,478
(63,120,971)
149,705,507
NUMG
363,131,085
46,509,023
(9,481,514)
37,027,509
NUMV
324,275,950
50,434,333
(10,101,404)
40,332,929
NUSC
1,142,805,398
169,536,844
(96,255,984)
73,280,860
NDVG
9,846,991
1,527,431
(153,660)
1,373,771
NUGO
1,776,917,768
955,760,574
(25,676,955)
930,083,619
NSCS
6,217,764
1,566,317
(342,502)
1,223,815
NWLG
6,686,274
2,599,727
(97,498)
2,502,229
The
tax
character
of
distributions
paid
was
as
follows:
As
of
year
end,
the
Funds
had
capital
loss
carryforwards,
which
will
not
expire:
Fund
Undistributed
Ordinary
Income
Undistributed
Long-Term
Capital
Gains
Unrealized
Appreciation
(Depreciation)
Capital
Loss
Carryforwards
Late-Year
Loss
Deferrals
Other
Book-to-Tax
Differences
Total
NUDV
$
526,699
$
—
$
661,887
$
—
$
—
$
—
$
1,188,586
NUEM
4,820,362
—
40,082,657
(35,416,103)
—
—
9,486,916
NUDM
13,357,337
—
50,805,925
(12,044,678)
—
—
52,118,584
NULC
595,731
—
8,110,387
—
—
—
8,706,118
NULG
1,725,326
—
246,807,037
(103,203,267)
—
—
145,329,096
NULV
27,577,082
—
149,705,507
(194,641,955)
—
—
(17,359,366)
NUMG
165,990
—
37,027,509
(98,939,417)
—
—
(61,745,918)
NUMV
4,681,758
—
40,332,929
(59,787,676)
—
—
(14,772,989)
NUSC
10,317,401
—
73,280,860
(212,733,823)
—
—
(129,135,562)
NDVG
6,993
—
1,373,771
(330,360)
—
—
1,050,404
NUGO
—
—
930,083,619
(706,118,088)
(2,754,930)
—
221,210,601
NSCS
11,795
—
1,223,815
(716,371)
—
—
519,239
NWLG
—
—
2,502,229
(832,339)
(11,305)
—
1,658,585
10/31/24
10/31/23
Fund
Ordinary
Income
Long-Term
Capital
Gains
Return
of
Capital
Ordinary
Income
Long-Term
Capital
Gains
Return
of
Capital
NUDV
$
272,150
$
—
$
—
$
326,285
$
—
$
—
NUEM
5,500,560
—
—
3,969,620
—
—
NUDM
12,192,840
—
—
5,913,680
—
—
NULC
334,750
—
—
376,232
272,403
—
NULG
5,151,450
—
—
3,194,800
—
—
NULV
37,705,745
—
—
32,805,740
—
—
NUMG
696,525
—
—
626,285
—
—
NUMV
7,463,725
—
—
7,063,580
11,260,810
—
NUSC
11,720,700
—
—
10,372,580
—
—
NDVG
138,827
—
—
115,641
—
—
NUGO
5,148,114
—
—
5,361,255
—
—
NSCS
7,904
—
—
16,390
—
3,136
NWLG
1,000
—
—
—
—
—
Fund
Short-Term
Long-Term
Total
NUDV
$
—
$
—
$
—
NUEM
1
20,419,229
14,996,874
35,416,103
NUDM
8,887,623
3,157,055
12,044,678
NULC
—
—
—
NULG
57,608,196
45,595,071
103,203,267
NULV
103,890,778
90,751,177
194,641,955
NUMG
65,050,770
33,888,647
98,939,417
NUMV
33,682,969
26,104,707
59,787,676
NUSC
85,360,028
127,373,795
212,733,823
NDVG
75,108
255,252
330,360
NUGO
552,540,672
153,577,416
706,118,088
NSCS
657,025
59,346
716,371
NWLG
711,675
120,664
832,339
1
A
portion
of
NUEM's
capital
loss
carryforwards
is
subject
to
limitation
under
the
Internal
Revenue
Code
and
related
regulations.
Notes
to
Financial
Statements
(continued)
As
of
year
end,
the
Funds
utilized
the
following
capital
loss
carryforwards:
8.
Management
Fees
and
Other
Transactions
with
Affiliates
Management
Fees:
Each
Fund’s
management
fee
compensates
the
Adviser
for its
investment
advisory services
to
the
Funds.
The
Sub-Adviser
is
compensated
for
its
services
to
the
Funds
from
the
management
fees
paid
to
the
Adviser.
The
Adviser
is
responsible
for
substantially
all
other
expenses
of
the
Funds,
except
any
future
distribution
and/or
service
fees,
interest
expenses,
taxes,
acquired
fund
fees
and
expenses,
fees
incurred
in
acquiring
and
disposing
of
portfolio
securities,
fees
and
expenses
of
the
independent
trustees
(including
any
trustees’
counsel
fees),
certain
compensation
expenses
of
the
Funds’
chief
compliance
officer,
litigation
expenses
and
extraordinary
expenses.
The
annual management
fee,
payable
monthly,
for
each
Fund
is
based
on
a
percentage
of
average
daily
net
assets
according
to
the
following
rates:
Other
Transactions
with
Affiliates:
The
Funds
receive
voluntary
compensation
from
the
Adviser
in
amounts
that
approximate
the
cost
of
research
services
obtained
from
broker-dealers
and
research
providers
if
the
Adviser
had
purchased
the
research
services
directly.
This
income
received
by
the
Funds
is
recognized
in
"Affiliated
income"
on
the
Statement
of
Operations
and
any
amounts
due
to
the Funds
at
the
end
of
the
reporting
period
is
recognized
in
"Reimbursement
from
Adviser"
on
the
Statement
of
Assets
and Liabilities. During
the
current
fiscal
period,
the
values
of
voluntary
compensation
were
as
follows:
Each
Fund
is
permitted
to
purchase
or
sell
securities
from
or
to
certain
other
funds
or
accounts
managed
by
the
Sub-Adviser
(“Affiliated
Entity”)
under
specified
conditions
outlined
in
procedures
adopted
by
the
Board
("cross-trade").
These
procedures
have
been
designed
to
ensure
that
any
cross-trade
of
securities
by
the
Fund
from
or
to
an
Affiliated
Entity
by
virtue
of
having
a
common
investment
adviser
(or
affiliated
investment
adviser),
common
officer
and/or
common
trustee
complies
with
Rule
17a-7
under
the
1940
Act.
These
transactions
are
effected
at
the
current
market
price
(as
provided
by
an
independent
pricing
service)
without
incurring
broker
commissions.
Fund
Utilized
NUDV
$
23,476
NUEM
—
NUDM
11,985,451
NULC
364,841
NULG
—
NULV
—
NUMG
—
NUMV
—
NUSC
—
NDVG
—
NUGO
2,020,002
NSCS
330,050
NWLG
471,815
Fund
Management
Fee
NUDV
0.25%
NUEM
0.35
NUDM
0.30
NULC
0.20
NULG
0.25
NULV
0.25
NUMG
0.30
NUMV
0.30
NUSC
0.30
NDVG
0.64
NUGO
0.55
NSCS
0.85
NWLG
0.64
Fund
Amount
NWLG
$
1,290
During
the
current
fiscal
period,
the
Funds
did
notengage
in
cross-trades
pursuant
to
these
procedures.
As
of
the
end
of
the
reporting
period,
the
percentage
of
Fund
shares
owned
by
affiliates
was
as
follows:
Fund
Purchases
Sales
Realized
Gain
(Loss)
NUDV
$
—
$
—
$
—
NUEM
—
—
—
NUDM
—
—
—
NULC
—
—
—
NULG
9,793,780
48,062,795
(9,985,298)
NULV
42,424,933
16,880,816
(3,783,504)
NUMG
9,074,141
22,233,194
(2,012,539)
NUMV
23,336,333
3,645,254
(1,236,172)
NUSC
7,649,362
765,473
87,300
NDVG
—
—
—
NUGO
381,606
54,650
(8,131)
NSCS
—
—
—
NWLG
—
—
—
Underlying
Fund
TIAA
Nuveen
Equity
Funds
Nuveen
Lifecycle
Funds
Nuveen
Lifestyle
Funds
Nuveen
Managed
Allocation
Fund
Total
NUDV
–
%
–
%
–
%
–
%
–
%
–
%
NUEM
–
–
–
–
–
–
NUDM
–
–
–
–
–
–
NULC
–
27
–
–
–
27
NULG
–
–
–
–
–
–
NULV
–
–
–
–
–
–
NUMG
–
–
–
–
–
–
NUMV
–
–
–
–
–
–
NUSC
–
–
–
–
–
–
NDVG
63
–
–
–
–
63
NUGO
–
–
92
4
2
98
NSCS
81
–
–
–
–
81
NWLG
76
–
–
–
–
76
(U
naudited)
As
required
by
the
Internal
Revenue
Code
and
Treasury
Regulations,
certain
tax
information,
as
detailed
below,
must
be
provided
to
shareholders.
Shareholders
are
advised
to
consult
their
tax
advisor
with
respect
to
the
tax
implications
of
their
investment.
The
amounts
listed
below
may
differ
from
the
actual
amounts
reported
on
Form
1099-DIV,
which
will
be
sent
to
shareholders
shortly
after
calendar
year
end.
Long-Term
Capital
Gains
As
of
year
end,
each
Fund
designates
the
following
distribution
amounts,
or
maximum
amount
allowable,
as
being
from
net
long-term
capital
gains
pursuant
to
Section
852(b)(3)
of
the
Internal
Revenue
Code:
Dividends
Received
Deduction
(DRD)
Each
Fund
listed
below
had
the
following
percentage,
or
maximum
amount
allowable,
of
ordinary
income
distributions
eligible
for
the
dividends
received
deduction
for
corporate
shareholders:
Fund
Net
Long-Term
Capital
Gains
NUDV
$
—
NUEM
—
NUDM
—
NULC
—
NULG
—
NULV
—
NUMG
—
NUMV
—
NUSC
—
NDVG
—
NUGO
—
NSCS
—
NWLG
—
Fund
Percentage
NUDV
100
.0
%
NUEM
0
.4
NUDM
–
NULC
100
.0
NULG
100
.0
NULV
98
.5
NUMG
100
.0
NUMV
82
.9
NUSC
89
.1
NDVG
100
.0
NUGO
100
.0
NSCS
100
.0
NWLG
100
.0
Qualified
Dividend
Income
(QDI)
Each
Fund
listed
below
had
the
following
percentage,
or
maximum
amount
allowable,
of
ordinary
income
distributions
treated
as
qualified
dividend
income
for
individuals
pursuant
to
Section
1(h)(11)
of
the
Internal
Revenue
Code:
Foreign
Source
Income
and
Foreign
Tax
Credit
Pass
Through
Each
Fund
listed
below
has
made
an
election
under
Section
853
of
the
Internal
Revenue
Code
to
pass
through
foreign
taxes
paid:
Fund
Percentage
NUDV
100
.0
%
NUEM
56
.0
NUDM
81
.3
NULC
100
.0
NULG
100
.0
NULV
100
.0
NUMG
100
.0
NUMV
87
.3
NUSC
92
.6
NDVG
100
.0
NUGO
100
.0
NSCS
100
.0
NWLG
100
.0
Fund
Foreign
Source
Income
Foreign
Source
Income
Per
Share
Qualifying
Foreign
Taxes
Paid
Qualifying
Foreign
Taxes
Paid
Per
Share
NUDV
$
—
$
—
$
—
$
—
NUEM
5,473,460
0.57015
1,204,847
0.12550
NUDM
11,116,714
0.76142
1,000,633
0.06854
NULC
—
—
—
—
NULG
—
—
—
—
NULV
—
—
—
—
NUMG
—
—
—
—
NUMV
—
—
—
—
NUSC
—
—
—
—
NDVG
—
—
—
—
NUGO
—
—
—
—
NSCS
—
—
—
—
NWLG
—
—
—
—
| Item 8. | Changes in and Disagreements with Accountants for Open-End Management Investment Companies. |
Changes in Independent Registered Public Accounting Firm
(a) Previous independent registered public accounting firm: On October 24, 2024, the Funds’ Board of Trustees (the “Board”), upon recommendation from the Audit Committee, notified KPMG LLP (“KPMG”) that it would be dismissed as the independent registered public accounting firm for the Funds effective upon (i) completion of KPMG’s audit of the Funds’ financial statements to be included in the Funds’ Annual Report on Form N-CSR (the “2024 Annual Report”) for the fiscal year ended October 31, 2024 and (ii) the issuance of KPMG’s report on the same. KPMG’s dismissal as the Funds’ independent registered public accounting firm was effective on December 26, 2024, which is the date on which KPMG issued their report on their audit of the Funds’ financial statements to be included in the 2024 Annual Report. KPMG’s audit reports on the Funds’ financial statements as of and for the fiscal years ended October 31, 2024 and October 31, 2023 contained no adverse opinion or disclaimer of opinion nor were they qualified or modified as to uncertainty, audit scope or accounting principles. During the Funds’ fiscal years ended October 31, 2024 and October 31, 2023, and for the subsequent interim period through December 26, 2024, there were no disagreements with KPMG on any matter of accounting principles or practices, financial statement disclosure or auditing scope or procedures, which disagreements if not resolved to the satisfaction of KPMG would have caused them to make reference in connection with their reports opinion to the subject matter of the disagreement. During the Funds’ fiscal years ended October 31, 2024 and October 31, 2023 and for the subsequent interim period through December 26, 2024, there were no reportable events (as defined in Regulation S-K Item 304(a)(1)(v)).
The Funds provided KPMG with a copy of the foregoing disclosures and requested that KPMG furnish the Funds with a letter addressed to the U.S. Securities and Exchange Commission stating whether KPMG agrees with the above statements.
(b) New independent registered public accounting firm: On October 24, 2024, the Board, upon recommendation from the Audit Committee, appointed PricewaterhouseCoopers LLP (“PwC”) as the new independent registered public accounting firm for the Funds for the fiscal year ended October 31, 2025 audit. During the Funds’ fiscal years ended October 31, 2024 and October 31, 2023 and for the subsequent interim period through December 26, 2024, the Funds have not consulted with PwC regarding any of the matters described in Regulation S-K Item 304 (“S-K 304”), S-K 304(a)(2)(i) or S-K 304(a)(2)(ii) disclosure.
| Item 9. | Proxy Disclosures for Open-End Management Investment Companies. |
Not applicable.
| Item 10. | Remuneration Paid to Directors, Officers, and Others of Open-End Management Investment Companies. |
Remuneration paid to directors, officers and others is included in the Statement of Operations under the line items “Trustee Fees” and “Management Fees” as part of the financial statements filed under Item 7 of this Form N-CSR.
| Item 11. | Statement Regarding Basis for Approval of Investment Advisory Contract. |
Not applicable to this filing.
| Item 12. | Disclosure of Proxy Voting Policies and Procedures for Closed-End Management Investment Companies. |
Not applicable to open-end investment companies.
| Item 13. | Portfolio Managers of Closed-End Management Investment Companies. |
Not applicable to open-end investment companies.
| Item 14. | Purchases of Equity Securities by Closed-End Management Investment Company and Affiliated Purchasers. |
Not applicable to open-end investment companies.
| Item 15. | Submission of Matters to a Vote of Security Holders. |
There have been no material changes to the procedures by which shareholders may recommend nominees to the registrant’s Board of Trustees implemented after the registrant last provided disclosure in response to this Item.
| Item 16. | Controls and Procedures. |
| (a) | The registrant’s principal executive and principal financial officers, or persons performing similar functions, have concluded that the registrant’s disclosure controls and procedures (as defined in Rule 30a-3(c) under the Investment Company Act of 1940, as amended (the “1940 Act”) (17 CFR 270.30a-3(c))) are effective, as of a date within 90 days of the filing date of this report that includes the disclosure required by this paragraph, based on their evaluation of the controls and procedures required by Rule 30a-3(b) under the 1940 Act (17 CFR 270.30a-3(b)) and Rules 13a-15(b) or 15d-15(b) under the Securities Exchange Act of 1934, as amended (the “Exchange Act”) (17 CFR 240.13a-15(b) or 240.15d-15(b)). |
| (b) | There were no changes in the registrant’s internal control over financial reporting (as defined in Rule 30a-3(d) under the 1940 Act (17 CFR 270.30a-3(d)) that occurred during the period covered by this report that has materially affected, or is reasonably likely to materially affect, the registrant’s internal control over financial reporting. |
| Item 17. | Disclosure of Securities Lending Activities for Closed-End Management Investment Companies. |
| (a) | Not applicable to open-end investment companies. |
| (b) | Not applicable to open-end investment companies. |
| Item 18. | Recovery of Erroneously Awarded Compensation. |
| (a)(1) | Not applicable because the code of ethics is available, upon request and without charge, by calling 800-257-8787 and there were no amendments during the period covered by this report. |
SIGNATURES
Pursuant to the requirements of the Securities Exchange Act of 1934 and the Investment Company Act of 1940, the registrant has duly caused this report to be signed on its behalf by the undersigned, thereunto duly authorized.
Nushares ETF Trust
| | | | |
Date: January 6, 2025 | | By: /s/ Briton Ryan Briton Ryan Chief Administrative Officer | | |
Pursuant to the requirements of the Securities Exchange Act of 1934 and the Investment Company Act of 1940, this report has been signed below by the following persons on behalf of the registrant and in the capacities and on the dates indicated.
| | | | |
Date: January 6, 2025 | | By: /s/ Briton Ryan Briton Ryan Chief Administrative Officer (principal executive officer) | | |
| | |
Date: January 6, 2025 | | By: /s/ Marc Cardella Marc Cardella Vice President and Controller (principal financial officer) | | |