UNITED STATES
SECURITIES AND EXCHANGE COMMISSION
Washington, D.C. 20549
FORM N-CSR
CERTIFIED SHAREHOLDER REPORT OF REGISTERED
MANAGEMENT INVESTMENT COMPANIES
|
| Investment Company Act file number 811‑23161 |
Nushares ETF Trust
(Exact name of registrant as specified in charter)
Nuveen Investments
333 West Wacker Drive
Chicago, Illinois 60606
(Address of principal executive offices) (Zip code)
Diana R. Gonzalez
Vice President and Secretary
8500 Andrew Carnegie Boulevard
Charlotte, North Carolina 28262
(Name and address of agent for service)
Registrant’s telephone number, including area code: (312) 917‑7700
Date of fiscal year end: July 31
Date of reporting period: July 31, 2024
| Item 1. | Reports to Stockholders. |
| | |
 | |
Annual Shareholder Report
July 31, 2024 |
Nuveen Core Plus Bond ETF
NCPB/NASDAQ Stock Market LLC
Annual Shareholder Report
This annual shareholder report contains important information about the Nuveen Core Plus Bond ETF for the period of March 5, 2024 (inception) to July 31, 2024. You can find additional information at https://www.nuveen.com/en‑us/exchange‑traded‑funds/prospectuses. You can also request this information by contacting us at (800) 257-8787.
This report describes changes to the Fund that occurred during the reporting period.
What were the Fund costs for the period since inception? (based on a hypothetical $10,000 investment)
| | | | |
| | |
| | | Cost of a $10,000 investment | | Costs paid as a percentage of
$10,000 investment* |
| | | |
| Nuveen Core Plus Bond ETF | | $30 | | 0.30% |
| | * | Annualized for period less than one year. |
How did the Fund perform since inception? What affected the Fund’s performance?
| | |
| |
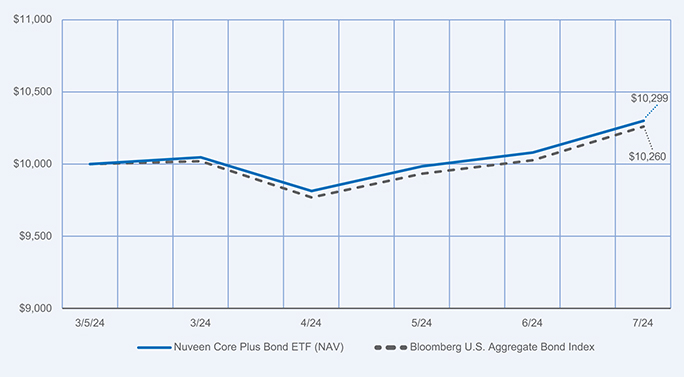
Performance Highlights • The Nuveen Core Plus Bond ETF returned 2.99% for Common Shares at net asset value (NAV) for the abbreviated reporting period from the Fund’s inception on March 5, 2024, through July 31, 2024. The Fund outperformed the Bloomberg U.S. Aggregate Bond Index, which returned 2.6%. • Top contributors to relative performance » The Fund’s exposure to higher-yielding spread sectors, particularly an out-of-benchmark allocation to high yield corporate bonds and overweight to emerging markets debt. » Underweight to U.S. Treasury bonds and an overweight to mortgage-backed securities (MBS). » Security selection within commercial mortgage-backed securities (CMBS), asset-backed securities (ABS) and corporate bonds. • Top detractors from relative performance » Yield curve positioning, including an underweight to the two- and five-year segments of the curve, as short-term rates decreased during the reporting period. » Security selection within U.S. Treasury bonds. | | Performance Attribution  Corporate bonds and emerging markets debt Underweight to U.S. Treasury bonds and MBS CMBS and ABS  Yield curve positioning Security selection within U.S. Treasury bonds |
How did the Fund perform over the period since inception?
Performance data shown represents past performance and does not predict or guarantee future results. The graph and table do not reflect the deduction of taxes that a shareholder would pay on Fund distributions or redemption of Fund Shares.
Fund Performance (March 5, 2024 through July 31, 2024) Initial Investment of $10,000
Average Annual Total Returns
| | | | |
| |
| | | Since
Inception
(3/5/24) | |
| | |
| Nuveen Core Plus Bond ETF (NAV) | | | 2.99 | % |
| | |
| Bloomberg U.S. Aggregate Bond Index | | | 2.60 | % |
Investment return and principal value will fluctuate, and you may have a gain or loss when you sell your shares. Current performance may differ from figures shown. For most recent month-end performance, go to https://www.nuveen.com/en-us/exchange-traded-funds/prospectuses or call (800) 257-8787.
Fund Statistics (as of July 31, 2024)
| | | | |
| |
| Fund net assets | | $ | 40,558,405 | |
| |
| Total number of portfolio holdings | | | 352 | |
| |
| Portfolio turnover (%) | | | 34% | |
| |
| Total management fees paid for the year | | $ | 39,070 | |
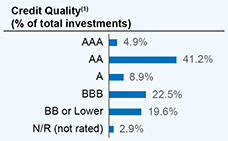
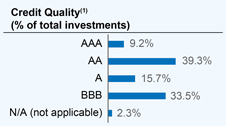
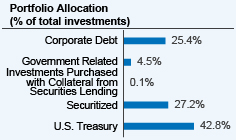
What did the Fund invest in? (as of July 31, 2024)
(1) The Fund uses credit quality ratings for its portfolio securities provided by Standard & Poor’s Group (“Standard & Poor’s”), Moody’s Investors Service, Inc. (“Moody’s”) and Fitch, Inc.(“Fitch”). If all three provide a rating for a security, the middle is used; if two of the three agencies rate a security, the lower rating is used; and if only one rating agency rates a security, that rating is used. AAA, AA, A, and BBB are investment grade ratings; BB, B, CCC/CC/C and D are below-investment grade ratings. Credit ratings are subject to change. Holdings designated N/R are not rated by Moody’s, S&P or Fitch.
How has the Fund changed?
For more complete information, you may review the Fund’s next prospectus, which is expected to be available by November 29, 2024 at https://www.nuveen.com/en-us/exchange-traded-funds/prospectuses or upon request at (800) 257-8787.
Availability of additional information about the Fund
You can find additional information about the Fund at https://www.nuveen.com/en-us/exchange-traded-funds/prospectuses, including its:
| | • | | prospectus • financial statements and other information • fund holdings • proxy voting information |
You can also request this information at (800) 257‑8787.
| | |
67092P763_AR_0724 3824552-INV-Y-09/25 | |  |
| | |
| |
Annual Shareholder Report
July 31, 2024 |
Nuveen Enhanced Yield U.S. Aggregate Bond ETF
NUAG/NYSE Arca
Annual Shareholder Report
This annual shareholder report contains important information about the Nuveen Enhanced Yield U.S. Aggregate Bond ETF for the period of August 1, 2023 to July 31, 2024. You can find additional information at
https://www.nuveen.com/en-us/exchange-traded-funds/prospectuses. You can also request this information by contacting us at (800) 257-8787.
This report describes changes to the Fund that occurred during the reporting period.
What were the Fund costs for the last year? (based on a hypothetical $10,000 investment)
| | | | |
| | |
| | | Cost of a $10,000 investment | | Costs paid as a percentage of
$10,000 investment* |
| | | |
| Nuveen Enhanced Yield U.S. Aggregate Bond ETF | | $21 | | 0.21% |
| | * | Annualized for period less than one year. |
How did the Fund perform last year? What affected the Fund’s performance?
|
|
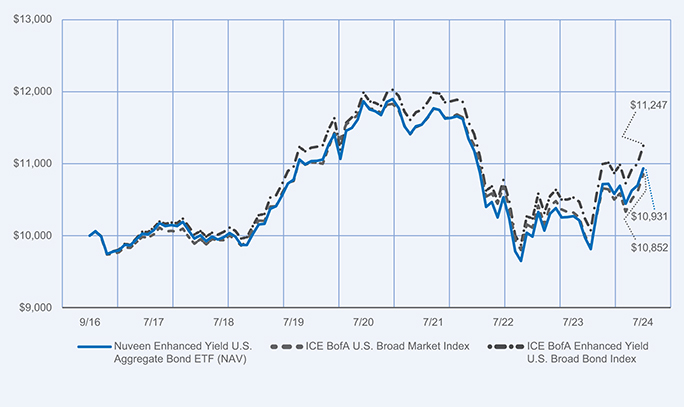
Performance Highlights • The Nuveen Enhanced Yield U.S. Aggregate Bond ETF (NUAG)’s total return at net asset value (NAV) was 6.44% for the 12 months ended July 31, 2024. The Fund’s custom index, the ICE BofA Enhanced Yield U.S. Broad Bond Index, returned 6.83%. • The difference between the Fund’s total return at NAV and that of the custom index is attributable to management fees and other expenses incurred by the Fund that are not incurred by the custom index, along with the representative sampling process, which utilizes a subset of index securities in an effort to provide exposure similar to that of the custom index. • During the reporting period, the Fund’s custom index outperformed the Fund’s base index, the ICE BofA U.S. Broad Market Index, which returned 5.18% • Performance drivers between the Fund’s custom index and base index during the reporting period: » Top contributors to the custom index’s relative performance § Overweight to corporate bonds and commercial mortgage-backed securities (CMBS). § Underweight to US treasury bonds, which generally underperformed spread sectors over the reporting period. » There were no material detractors from the custom index’s relative performance during the reporting period. |
How did the Fund perform over the period since inception?
Performance data shown represents past performance and does not predict or guarantee future results. The graph and table do not reflect the deduction of taxes that a shareholder would pay on Fund distributions or redemption of Fund Shares.
Fund Performance (September 14, 2016 through July 31, 2024) Initial Investment of $10,000
Average Annual Total Returns
| | | | | | | | | | | | |
| | | |
| | | 1-Year | | | 5-Year | | | Since
Inception
(9/14/16) | |
| | | | |
| Nuveen Enhanced Yield U.S. Aggregate Bond ETF (NAV) | | | 6.44 | % | | | 0.29 | % | | | 1.14 | % |
| | | | |
| ICE BofA U.S. Broad Market Index | | | 5.18 | % | | | 0.17 | % | | | 1.04 | % |
| | | | |
| ICE BofA Enhanced Yield U.S. Broad Bond Index | | | 6.83 | % | | | 0.53 | % | | | 1.50 | % |
Investment return and principal value will fluctuate, and you may have a gain or loss when you sell your shares. Current performance may differ from figures shown. For most recent month-end performance, go to https://www.nuveen.com/en-us/exchange-traded-funds/prospectuses or call (800) 257-8787.
Fund Statistics (as of July 31, 2024)
| | | | |
| |
| Fund net assets | | $ | 35,816,801 | |
| |
| Total number of portfolio holdings | | | 692 | |
| |
| Portfolio turnover (%) | | | 48% | |
| |
| Total management fees paid for the year | | $ | 66,045 | |
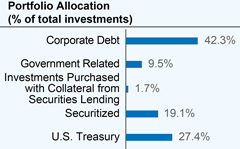
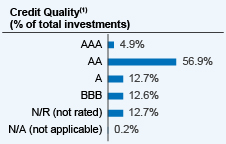
What did the Fund invest in? (as of July 31, 2024)
(1) The Fund uses credit quality ratings for its portfolio securities provided by Moody’s, S&P and Fitch. If all three of Moody’s, S&P, and Fitch provide a rating for a security, an average of the ratings is used; if two of the three agencies rate a security, an average of the two is used; and if only one rating agency rates a security, that rating is used. AAA, AA, A, and BBB are investment grade ratings; BB, B, CCC/CC/C and D are below-investment grade ratings. Credit ratings are subject to change. Holdings designated N/R are not rated by Moody’s, S&P or Fitch.
How has the Fund changed?
For more complete information, you may review the Fund’s next prospectus, which is expected to be available by November 29, 2024 at https://www.nuveen.com/en-us/exchange-traded-funds/prospectuses or upon request at (800) 257-8787.
Availability of additional information about the Fund
You can find additional information about the Fund at https://www.nuveen.com/en-us/exchange-traded-funds/prospectuses, including its:
| | • | | prospectus • financial statements and other information • fund holdings • proxy voting information |
You can also request this information at (800) 257-8787.
| | |
67092P102_AR_0724 3824569-INV-Y-09/25 | | |
| | |
| |
Annual Shareholder Report
July 31, 2024 |
Nuveen ESG 1-5 Year U.S. Aggregate Bond ETF
NUSA/NYSE Arca
Annual Shareholder Report
This annual shareholder report contains important information about the Nuveen ESG 1-5 Year U.S. Aggregate Bond ETF for the period of August 1, 2023 to July 31, 2024. You can find additional information at https://www.nuveen.com/en‑us/exchange‑traded‑funds/prospectuses. You can also request this information by contacting us at (800) 257-8787.
This report describes changes to the Fund that occurred during the reporting period.
What were the Fund costs for the last year? (based on a hypothetical $10,000 investment)
| | | | |
| | | Cost of a $10,000 investment | | Costs paid as a percentage of
$10,000 investment* |
| Nuveen ESG 1-5 Year U.S. Aggregate Bond ETF | | $16 | | 0.16% |
| | * | Annualized for period less than one year. |
How did the Fund perform last year? What affected the Fund’s performance?
|
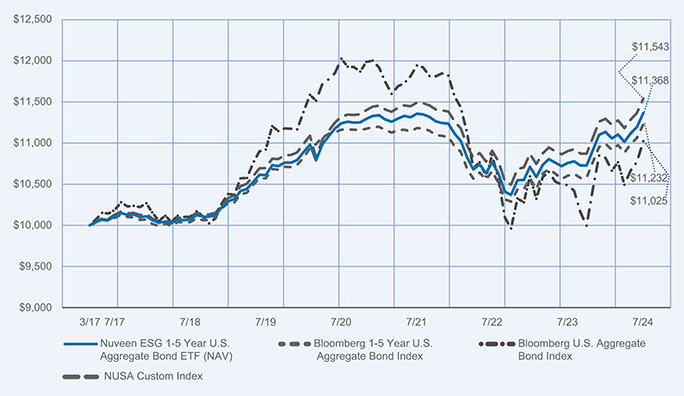
Performance Highlights • The Nuveen ESG 1-5 Year U.S. Aggregate Bond ETF (NUSA)’s total return at net asset value (NAV) was 5.65% for the 12 months ended July 31, 2024. The Fund’s custom index, the Bloomberg MSCI 1-5 Year U.S. Aggregate ESG Select Index, returned 5.85%. • The difference between the Fund’s total return at NAV and that of the custom index is attributable to management fees and other expenses incurred by the Fund that are not incurred by the custom index, along with the representative sampling process, which utilizes a subset of index securities in an effort to provide exposure similar to that of the custom index. • During the reporting period, the Fund’s custom index performed in line with the Fund’s base index, the Bloomberg 1-5 Year U.S. Aggregate Bond Index, which returned 5.91% • Sector allocations and performance were consistent in both the custom index and base index, and there were no material contributors or detractors between the custom index and base index over the reporting period. |
How did the Fund perform over the period since inception?
Performance data shown represents past performance and does not predict or guarantee future results. The graph and table do not reflect the deduction of taxes that a shareholder would pay on Fund distributions or redemption of Fund Shares.
Fund Performance (March 31, 2017 through July 31, 2024) Initial Investment of $10,000
Average Annual Total Returns
| | | | | | | | | | | | |
| | | 1‑Year | | | 5‑Year | | | Since
Inception
(3/31/17) | |
| Nuveen ESG 1-5 Year U.S. Aggregate Bond ETF (NAV) | | | 5.65 | % | | | 1.38 | % | | | 1.76 | % |
| Bloomberg 1‑5 Year U.S. Aggregate Bond Index | | | 5.91 | % | | | 1.22 | % | | | 1.60 | % |
| Bloomberg U.S. Aggregate Bond Index | | | 5.10 | % | | | 0.19 | % | | | 1.34 | % |
| NUSA Custom Index * | | | 5.85 | % | | | 1.53 | % | | | 1.98 | % |
* The NUSA Custom Index is defined as the linked returns between the Bloomberg MSCI 1-5 Year U.S. Aggregate ESG Select Index (effective July 1, 2023) and the ICE BofA Enhanced Yield 1-5 Year U.S. Broad Bond Index (through market close on June 30, 2023).
Investment return and principal value will fluctuate, and you may have a gain or loss when you sell your shares. Current performance may differ from figures shown. For most recent month‑end performance, go to
https://www.nuveen.com/en-us/exchange-traded-funds/prospectuses or call (800) 257‑8787.
Fund Statistics (as of July 31, 2024)
| | | | |
| Fund net assets | | $ | 32,433,010 | |
| Total number of portfolio holdings | | | 294 | |
| Portfolio turnover (%) | | | 37% | |
| Total management fees paid for the year | | $ | 47,258 | |
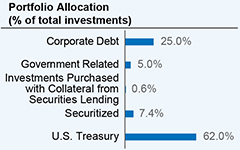
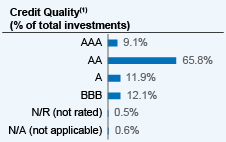
What did the Fund invest in? (as of July 31, 2024)
(1) The Fund uses credit quality ratings for its portfolio securities provided by Standard & Poor’s Group (“Standard & Poor’s”), Moody’s Investors Service, Inc. (“Moody’s”) and Fitch, Inc.(“Fitch”). If all three provide a rating for a security, the middle is used; if two of the three agencies rate a security, the lower rating is used; and if only one rating agency rates a security, that rating is used. AAA, AA, A, and BBB are investment grade ratings; BB, B, CCC/CC/C and D are below-investment grade ratings. Credit ratings are subject to change. Holdings designated N/R are not rated by Moody’s, S&P or Fitch.
How has the Fund changed?
For more complete information, you may review the Fund’s next prospectus, which is expected to be available by November 29, 2024 at https://www.nuveen.com/en‑us/exchange‑traded‑funds/prospectuses or upon request at (800) 257‑8787.
Availability of additional information about the Fund
You can find additional information about the Fund at https://www.nuveen.com/en‑us/exchange‑traded‑funds/prospectuses, including its:
| | • | | prospectus • financial statements and other information • fund holdings • proxy voting information |
You can also request this information at (800) 257‑8787.
| | |
67092P110_AR_0724 3824576-INV-Y-09/25 | | |
| | |
| |
Annual Shareholder Report
July 31, 2024 |
Nuveen ESG High Yield Corporate Bond ETF
NUHY/NYSE Arca
Annual Shareholder Report
This annual shareholder report contains important information about the Nuveen ESG High Yield Corporate Bond ETF for the period of August 1, 2023 to July 31, 2024. You can find additional information at
https://www.nuveen.com/en‑us/exchange‑traded‑funds/prospectuses. You can also request this information by contacting us at (800) 257-8787.
This report describes changes to the Fund that occurred during the reporting period.
What were the Fund costs for the last year? (based on a hypothetical $10,000 investment)
| | | | |
| | | Cost of a $10,000 investment | | Costs paid as a percentage of
$10,000 investment* |
| Nuveen ESG High Yield Corporate Bond ETF | | $33 | | 0.31% |
| | * | Annualized for period less than one year. |
How did the Fund perform last year? What affected the Fund’s performance?
|
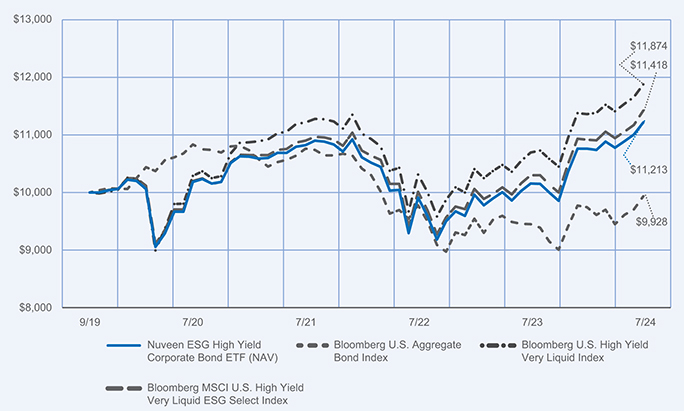
Performance Highlights • The Nuveen ESG High Yield Corporate Bond ETF (NUHY)’s total return at net asset value (NAV) was 10.43% for the 12 months ended July 31, 2024. The Fund’s custom index, the Bloomberg MSCI U.S. High Yield Very Liquid ESG Select Index, returned 10.91%. • The difference between the Fund’s total return at NAV and that of the custom index is attributable to management fees and other expenses incurred by the Fund that are not incurred by the custom index, along with the representative sampling process, which utilizes a subset of index securities in an effort to provide exposure similar to that of the custom index. • During the reporting period, the Fund’s custom index performed in line with the Fund’s base index, the Bloomberg U.S. High Yield Very Liquid Index, which returned 11.06%. • Performance drivers between the Fund’s custom index and base index during the reporting period: » Top contributors to the custom index’s relative performance § Security selection in the communications sector, led by overweights to Frontier Communications and CSC Holdings LLC. » Top detractors from the custom index’s relative performance § An overweight to lumber production and distribution company Enviva Inc., which filed for bankruptcy during the reporting period. |
How did the Fund perform over the period since inception?
Performance data shown represents past performance and does not predict or guarantee future results. The graph and table do not reflect the deduction of taxes that a shareholder would pay on Fund distributions or redemption of Fund Shares.
Fund Performance (September 25, 2019 through July 31, 2024) Initial Investment of $10,000
Average Annual Total Returns
| | | | | | | | |
| | |
| | | 1‑Year | | | Since
Inception
(9/25/19) | |
| | | |
| Nuveen ESG High Yield Corporate Bond ETF (NAV) | | | 10.43 | % | | | 2.39 | % |
| | | |
| Bloomberg U.S. Aggregate Bond Index | | | 5.10 | % | | | (0.15 | )% |
| | | |
| Bloomberg U.S. High Yield Very Liquid Index | | | 11.06 | % | | | 3.60 | % |
| | | |
| Bloomberg MSCI U.S. High Yield Very Liquid ESG Select Index | | | 10.91 | % | | | 2.77 | % |
Investment return and principal value will fluctuate, and you may have a gain or loss when you sell your shares. Current performance may differ from figures shown. For most recent month‑end performance, go to https://www.nuveen.com/en‑us/exchange‑traded‑funds/prospectuses or call (800) 257‑8787.
Fund Statistics (as of July 31, 2024)
| | | | |
| Fund net assets | | $ | 89,221,581 | |
| Total number of portfolio holdings | | | 394 | |
| Portfolio turnover (%) | | | 43% | |
| Total management fees paid for the year | | $ | 284,454 | |
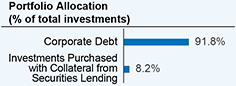
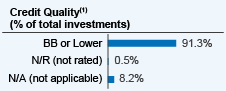
What did the Fund invest in? (as of July 31, 2024)
(1) The Fund uses credit quality ratings for its portfolio securities provided by Standard & Poor’s Group (“Standard & Poor’s”), Moody’s Investors Service, Inc. (“Moody’s”) and Fitch, Inc. (“Fitch”). If all three provide a rating for a security, the middle is used; if two of the three agencies rate a security, the lower rating is used; and if only one rating agency rates a security, that rating is used. AAA, AA, A, and BBB are investment grade ratings; BB, B, CCC/CC/C and D are below-investment grade ratings. Credit ratings are subject to change. Holdings designated N/R are not rated by Moody’s, S&P or Fitch.
How has the Fund changed?
For more complete information, you may review the Fund’s next prospectus, which is expected to be available by November 29, 2024 at https://www.nuveen.com/en‑us/exchange‑traded‑funds/prospectuses or upon request at (800) 257‑8787.
Availability of additional information about the Fund
You can find additional information about the Fund at https://www.nuveen.com/en‑us/exchange‑traded‑funds/prospectuses, including its:
| | • | | prospectus • financial statements and other information • fund holdings • proxy voting information |
You can also request this information at (800) 257‑8787.
| | |
67092P854_AR_0724 3824581-INV-Y-09/25 | | |
| | |
| |
Annual Shareholder Report
July 31, 2024 |
Nuveen ESG U.S. Aggregate Bond ETF
NUBD/NYSE Arca
Annual Shareholder Report
This annual shareholder report contains important information about the Nuveen ESG U.S. Aggregate Bond ETF for the period of August 1, 2023 to July 31, 2024. You can find additional information at
https://www.nuveen.com/en-us/exchange-traded-funds/prospectuses. You can also request this information by contacting us at (800) 257-8787.
This report describes changes to the Fund that occurred during the reporting period.
What were the Fund costs for the last year? (based on a hypothetical $10,000 investment)
| | | | |
| | | Cost of a $10,000 investment | | Costs paid as a percentage of
$10,000 investment* |
| Nuveen ESG U.S. Aggregate Bond ETF | | $16 | | 0.16% |
| | * | Annualized for period less than one year. |
How did the Fund perform last year? What affected the Fund’s performance?
|
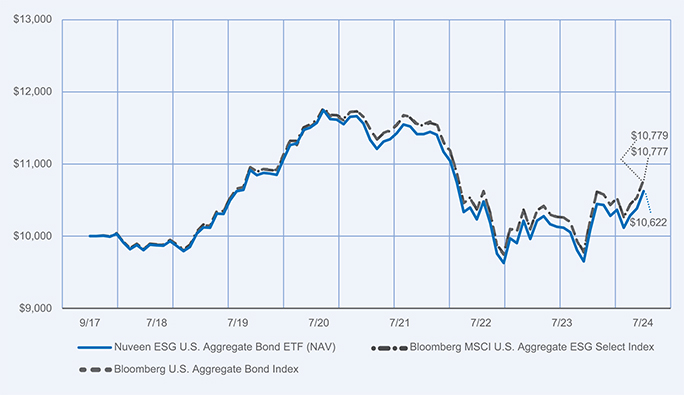
Performance Highlights • The Nuveen ESG U.S. Aggregate Bond ETF (NUBD)’s total return at net asset value (NAV) was 5.03% for the 12 months ended July 31, 2024. The Fund’s custom index, the Bloomberg MSCI U.S. Aggregate ESG Select Index, returned 5.09%. • The difference between the Fund’s total return at NAV and that of the custom index is attributable to management fees and other expenses incurred by the Fund that are not incurred by the custom index, along with the representative sampling process, which utilizes a subset of index securities in an effort to provide exposure similar to that of the custom index. • During the reporting period, the Fund’s custom index performed in line with the Fund’s base index, the Bloomberg U.S. Aggregate Bond Index, which returned 5.10%. • Sector allocations and performance were consistent in both the custom index and base index, and there were no material contributors or detractors between the custom index and base index over the reporting period. |
How did the Fund perform over the period since inception?
Performance data shown represents past performance and does not predict or guarantee future results. The graph and table do not reflect the deduction of taxes that a shareholder would pay on Fund distributions or redemption of Fund Shares.
Fund Performance (September 29, 2017 through July 31, 2024) Initial Investment of $10,000
Average Annual Total Returns
| | | | | | | | | | | | |
| | | 1‑Year | | | 5‑Year | | | Since
Inception
(9/29/17) | |
| Nuveen ESG U.S. Aggregate Bond ETF (NAV) | | | 5.03 | % | | | (0.04 | )% | | | 0.89 | % |
| Bloomberg U.S. Aggregate Bond Index | | | 5.10 | % | | | 0.19 | % | | | 1.10 | % |
| Bloomberg MSCI U.S. Aggregate ESG Select Index | | | 5.09 | % | | | 0.19 | % | | | 1.10 | % |
Investment return and principal value will fluctuate, and you may have a gain or loss when you sell your shares. Current performance may differ from figures shown. For most recent month‑end performance, go to
https://www.nuveen.com/en-us/exchange-traded-funds/prospectuses or call (800) 257‑8787.
Fund Statistics (as of July 31, 2024)
| | | | |
| Fund net assets | | $ | 368,721,828 | |
| Total number of portfolio holdings | | | 1,714 | |
| Portfolio turnover (%) | | | 13% | |
| Total management fees paid for the year | | $ | 473,283 | |
What did the Fund invest in? (as of July 31, 2024)
(1) The Fund uses credit quality ratings for its portfolio securities provided by Standard & Poor’s Group (“Standard & Poor’s”), Moody’s Investors Service, Inc. (“Moody’s”) and Fitch, Inc.(“Fitch”). If all three provide a rating for a security, the middle is used; if two of the three agencies rate a security, the lower rating is used; and if only one rating agency rates a security, that rating is used. AAA, AA, A, and BBB are investment grade ratings; BB, B, CCC/CC/C and D are below-investment grade ratings. Credit ratings are subject to change. Holdings designated N/R are not rated by Moody’s, S&P or Fitch.
How has the Fund changed?
For more complete information, you may review the Fund’s next prospectus, which is expected to be available by November 29, 2024 at https://www.nuveen.com/en-us/exchange-traded-funds/prospectuses or upon request at (800) 257-8787.
Availability of additional information about the Fund
You can find additional information about the Fund at https://www.nuveen.com/en-us/exchange-traded-funds/prospectuses, including its:
| | • | | prospectus • financial statements and other information • fund holdings • proxy voting information |
You can also request this information at (800) 257‑8787.
| | |
67092P870_AR_0724 3824595‑INV‑Y‑09/25 | | |
| | |
| |
Annual Shareholder Report
July 31, 2024 |
Nuveen Global Net Zero Transition ETF
NTZG/NASDAQ Stock Market LLC
Annual Shareholder Report
This annual shareholder report contains important information about the Nuveen Global Net Zero Transition ETF for the period of August 1, 2023 to July 31, 2024. You can find additional information at https://www.nuveen.com/en‑us/exchange‑traded‑funds/prospectuses. You can also request this information by contacting us at (800) 257-8787.
This report describes changes to the Fund that occurred during the reporting period.
What were the Fund costs for the last year? (based on a hypothetical $10,000 investment)
| | | | |
| | | Cost of a $10,000 investment | | Costs paid as a percentage of
$10,000 investment* |
| Nuveen Global Net Zero Transition ETF | | $59 | | 0.56% |
| | * | Annualized for period less than one year. |
How did the Fund perform last year? What affected the Fund’s performance?
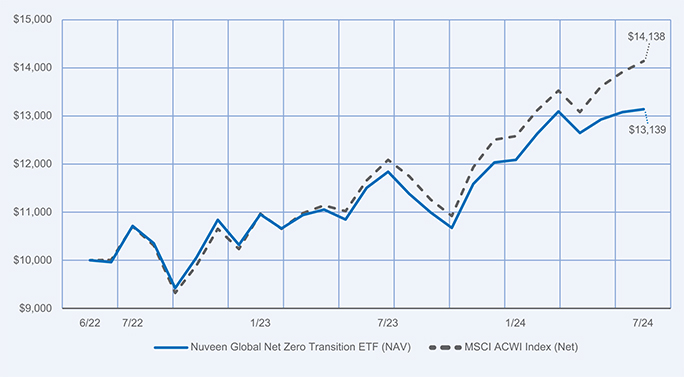
| | |
Performance Highlights • The Nuveen Global Net Zero Transition returned 10.99% for Common Shares at net asset value (NAV) for the 12 months ended July 31, 2024. The Fund significantly underperformed the MSCI ACWI Index (Net), which returned 17.02%. • Top contributors to relative performance » Security selection in the industrials sector, including an overweight to U.S. HVAC company Trane Technologies PLC. » Security selection in the consumer staples sector, including overweights to U.S.-based retailers Costco Wholesale Corporation and Walmart Inc. » An overweight to Danish pharmaceutical company Novo Nordisk A/S. • Top detractors from relative performance » Security selection in the information technology sector, including a lack of exposure to U.S.-based NVIDIA Corporation and an overweight to South Korean battery manufacturer Samsung SDI Co Ltd. » Security selection in the consumer discretionary sector, including an overweight to French luxury goods firm Kering SA. » Security selection in the financials sector, including an overweight to Dutch payment company Adyen NV. | | Performance Attribution Industrials Consumer staples Novo Nordisk A/S Information technology Consumer discretionary Financials |
How did the Fund perform over the period since inception?
Performance data shown represents past performance and does not predict or guarantee future results. The graph and table do not reflect the deduction of taxes that a shareholder would pay on Fund distributions or redemption of Fund Shares.
Fund Performance (June 23, 2022 through July 31, 2024) Initial Investment of $10,000
Average Annual Total Returns
| | | | | | | | |
| | |
| | | 1‑Year | | | Since
Inception
(6/23/22) | |
| Nuveen Global Net Zero Transition ETF (NAV) | | | 10.99 | % | | | 13.85 | % |
| MSCI ACWI Index (Net) | | | 17.02 | % | | | 17.89 | % |
Investment return and principal value will fluctuate, and you may have a gain or loss when you sell your shares. Current performance may differ from figures shown. For most recent month‑end performance, go to https://www.nuveen.com/en‑us/exchange‑traded‑funds/prospectuses or call (800) 257‑8787.
Fund Statistics (as of July 31, 2024)
| | | | |
| |
| Fund net assets | | $ | 6,440,931 | |
| |
| Total number of portfolio holdings | | | 70 | |
| |
| Portfolio turnover (%) | | | 22% | |
| |
| Total management fees paid for the year | | $ | 32,928 | |
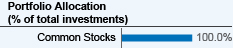
What did the Fund invest in? (as of July 31, 2024)
How has the Fund changed?
| | • | | On August 21, 2024, the Fund’s Board of Trustees approved the liquidation of the Fund, effective October 22, 2024. | |
Availability of additional information about the Fund
You can find additional information about the Fund at https://www.nuveen.com/en-us/exchange-traded-funds/prospectuses, including its:
| | • | | prospectus • financial statements and other information • fund holdings • proxy voting information |
You can also request this information at (800) 257‑8787.
| | |
67092P789_AR_0724 3824602‑INV‑Y‑09/25 | | |
| | |
| |
Annual Shareholder Report
July 31, 2024 |
Nuveen Preferred and Income ETF
NPFI/NASDAQ Stock Market LLC
Annual Shareholder Report
This annual shareholder report contains important information about the Nuveen Preferred and Income ETF for the period of March 5, 2024 (inception) to July 31, 2024. You can find additional information at https://www.nuveen.com/en‑us/exchange‑traded‑funds/prospectuses. You can also request this information by contacting us at (800) 257-8787.
This report describes changes to the Fund that occurred during the reporting period.
What were the Fund costs for the period since inception? (based on a hypothetical $10,000 investment)
| | | | |
| | | Cost of a $10,000 investment | | Costs paid as a percentage of
$10,000 investment* |
| Nuveen Preferred and Income ETF | | $56 | | 0.55% |
| | * | Annualized for period less than one year. |
How did the Fund perform since inception? What affected the Fund’s performance?
| | |
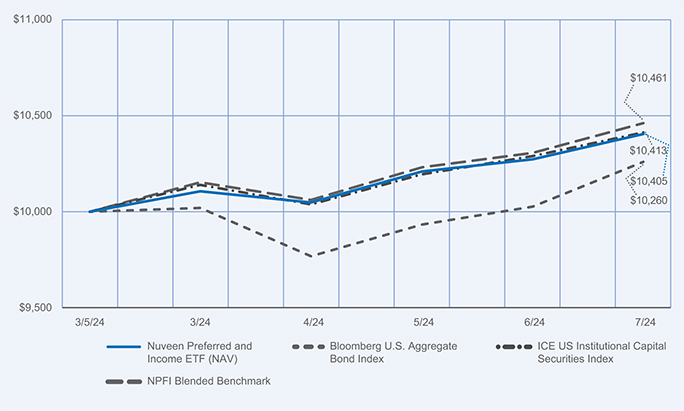
Performance Highlights • The Nuveen Preferred and Income ETF returned 4.05% for Common Shares at net asset value (NAV) for the abbreviated reporting period since the Fund’s inception on March 5, 2024, through July 31, 2024. The Fund underperformed the NPFI Blended Benchmark, which returned 4.61%. The NPFI Blended Benchmark consists of: 60% ICE US Institutional Capital Securities Index (IIPS), and 40% ICE USD Contingent Capital Index (CDLR). • Top contributors to relative performance » Security selection within fixed-to-fixed rate coupon securities, particularly recently issued, higher coupon securities, which outperformed the broader preferred securities market. • Top detractors from relative performance » Shorter-duration positioning, resulting from an overweight to floating-rate coupon securities, which detracted as short-term rates decreased during the reporting period. » Underweight to contingent capital securities (CoCos), which was partially offset by favorable security selection within that segment. | | Performance Attribution Fixed-to-fixed rate coupon securities Shorter-duration positioning Underweight CoCos |
How did the Fund perform over the period since inception?
Performance data shown represents past performance and does not predict or guarantee future results. The graph and table do not reflect the deduction of taxes that a shareholder would pay on Fund distributions or redemption of Fund Shares.
Fund Performance (March 5, 2024 through July 31, 2024) Initial Investment of $10,000
Average Annual Total Returns
| | | | |
| |
| | | Since
Inception
(3/5/24) | |
| | |
| Nuveen Preferred and Income ETF (NAV) | | | 4.05 | % |
| | |
| Bloomberg U.S. Aggregate Bond Index | | | 2.60 | % |
| ICE US Institutional Capital Securities Index | | | 4.13 | % |
| NPFI Blended Benchmark | | | 4.61 | % |
Investment return and principal value will fluctuate, and you may have a gain or loss when you sell your shares. Current performance may differ from figures shown. For most recent month-end performance, go to https://www.nuveen.com/en-us/exchange-traded-funds/prospectuses or call (800) 257-8787.
Return of Capital: During the current reporting period, $0.17 per share of the Fund’s distribution was re-characterized as a return of capital resulting from subsequent re-characterizations of cash flows received from the Fund’s investments.
Fund Statistics (as of July 31, 2024)
| | | | |
| |
| Fund net assets | | $ | 17,240,876 | |
| |
| Total number of portfolio holdings | | | 123 | |
| |
| Portfolio turnover (%) | | | 6% | |
| |
| Total management fees paid for the year | | $ | 35,238 | |
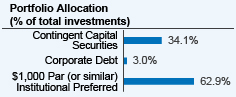
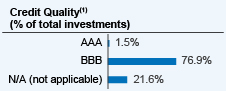
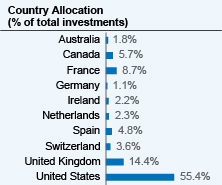
What did the Fund invest in? (as of July 31, 2024)
(1) The ratings disclosed are the highest rating given by one of the following national rating agencies: Standard & Poor’s (S&P), Moody’s Investors Service, Inc. (Moody’s) or Fitch, Inc (Fitch). This treatment of split-rated securities may differ from that used for other purposes, such as for Fund investment policies. Credit ratings are subject to change. AAA, AA, A, and BBB are investment grade ratings; BB, B, CCC, CC, C and D are below-investment grade ratings. Holdings designated N/R are not rated by these national ratings agencies.
How has the Fund changed?
For more complete information, you may review the Fund’s next prospectus, which is expected to be available by November 29, 2024 at https://www.nuveen.com/en-us/exchange-traded-funds/prospectuses or upon request at (800) 257-8787.
Availability of additional information about the Fund
You can find additional information about the Fund at https://www.nuveen.com/en-us/exchange-traded-funds/prospectuses, including its:
| | • | | prospectus • financial statements and other information • fund holdings • proxy voting information |
You can also request this information at (800) 257‑8787.
| | |
67092P771_AR_0724 3824613-INV-Y-09/25 | | |
| | |
| |
Annual Shareholder Report
July 31, 2024 |
Nuveen Sustainable Core ETF
NSCR/NASDAQ Stock Market LLC
Annual Shareholder Report
This annual shareholder report contains important information about the Nuveen Sustainable Core ETF for the period of March 5, 2024 (inception) to July 31, 2024. You can find additional information at https://www.nuveen.com/en‑us/exchange‑traded‑funds/prospectuses. You can also request this information by contacting us at (800) 257‑8787.
This report describes changes to the Fund that occurred during the reporting period.
What were the Fund costs for the period since inception? (based on a hypothetical $10,000 investment)
| | | | |
| | | Cost of a $10,000 investment | | Costs paid as a percentage of
$10,000 investment* |
| Nuveen Sustainable Core ETF | | $47 | | 0.46% |
| | * | Annualized for period less than one year. |
How did the Fund perform since inception? What affected the Fund’s performance?
| | |
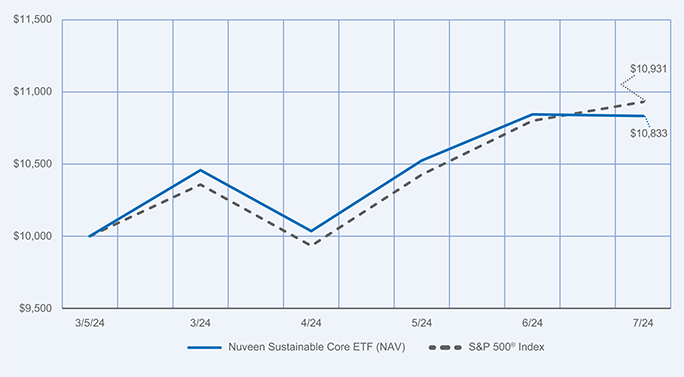
Performance Highlights • The Nuveen Sustainable Core ETF returned 8.33% for Common Shares at net asset value (NAV) for the abbreviated reporting period from the Fund’s inception on March 5, 2024, through July 31, 2024. The Fund underperformed the S&P 500 Index, which returned 9.31%. • Top contributors to relative performance » Security selection in the information technology sector, including a lack of exposure to U.S. chipmakers Advanced Micro Devices, Inc. and Intel Corporation. » Security selection in the utilities sector, including overweights to NextEra Energy, Inc. and American Electric Power Company, Inc. » An overweight to Bank of New York Mellon Corp. • Top detractors from relative performance » Security selection in the health care sector, including overweights to pharmaceutical firms Merck & Co., Inc. and Bristol-Myers Squibb Company. » An underweight to Apple, Inc. | | Performance Attribution Information technology Utilities Bank of New York Mellon Corp. Health care Apple, Inc. |
How did the Fund perform over the period since inception?
Performance data shown represents past performance and does not predict or guarantee future results. The graph and table do not reflect the deduction of taxes that a shareholder would pay on Fund distributions or redemption of Fund Shares.
Fund Performance (March 5, 2024 through July 31, 2024) Initial Investment of $10,000
Average Annual Total Returns
| | | | |
| | | Since
Inception
(3/5/24) | |
| Nuveen Sustainable Core ETF (NAV) | | | 8.33 | % |
S&P 500® Index | | | 9.31 | % |
Investment return and principal value will fluctuate, and you may have a gain or loss when you sell your shares. Current performance may differ from figures shown. For most recent month‑end performance, go to https://www.nuveen.com/en‑us/exchange‑traded‑funds/prospectuses or call (800) 257‑8787.
Fund Statistics (as of July 31, 2024)
| | | | |
| Fund net assets | | $ | 5,689,198 | |
| Total number of portfolio holdings | | | 51 | |
| Portfolio turnover (%) | | | 4% | |
| Total management fees paid for the year | | $ | 10,076 | |
What did the Fund invest in? (as of July 31, 2024)
How has the Fund changed?
For more complete information, you may review the Fund’s next prospectus, which is expected to be available by November 29, 2024 at https://www.nuveen.com/en‑us/exchange‑traded‑funds/prospectuses or upon request at (800) 257‑8787.
Availability of additional information about the Fund
You can find additional information about the Fund at https://www.nuveen.com/en‑us/exchange‑traded‑funds/prospectuses, including its:
| | • | | prospectus • financial statements and other information • fund holdings • proxy voting information |
You can also request this information at (800) 257‑8787.
| | |
67092P748_AR_0724 3824623-INV-Y-09/25 | | |
| | |
| |
Annual Shareholder Report
July 31, 2024 |
Nuveen Ultra Short Income ETF
NUSB/NASDAQ Stock Market LLC
Annual Shareholder Report
This annual shareholder report contains important information about the Nuveen Ultra Short Income ETF for the period of March 5, 2024 (inception) to July 31, 2024. You can find additional information at https://www.nuveen.com/enus/exchange‑traded‑funds/prospectuses. You can also request this information by contacting us at (800) 257-8787.
This report describes changes to the Fund that occurred during the reporting period.
What were the Fund costs for the period since inception? (based on a hypothetical $10,000 investment)
| | | | |
| | | Cost of a $10,000 investment | | Costs paid as a percentage of
$10,000 investment* |
| Nuveen Ultra Short Income ETF | | $17 | | 0.17% |
| | * | Annualized for period less than one year. |
How did the Fund perform last year? What affected the Fund’s performance?
| | |
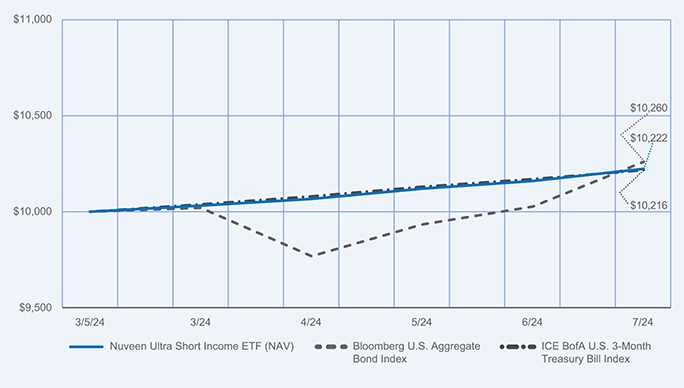
Performance Highlights • The Nuveen Ultra Short Income ETF returned 2.22% for Common Shares at net asset value (NAV) for the abbreviated reporting period since the Fund’s inception on March 5, 2024, through July 31, 2024. The Fund performed in line with the ICE BofA U.S. 3-Month Treasury Bill Index, which returned 2.16%. • Top contributors to relative performance » Out-of-benchmark allocations to spread sectors, notably to investment grade corporate bonds, which was driven by strong performance in the banking and insurance industries. » Out-of-benchmark allocation to asset-backed securities (ABS), led by automotive related securities. » Out-of-benchmark allocation to commercial mortgage-backed securities (CMBS), which rallied and outperformed during the reporting period. • There were no material detractors from relative performance. | | Performance Attribution Investment grade corporate bonds ABS CMBS |
How did the Fund perform over the period since inception?
Performance data shown represents past performance and does not predict or guarantee future results. The graph and table do not reflect the deduction of taxes that a shareholder would pay on Fund distributions or redemption of Fund Shares.
Fund Performance (March 5, 2024 through July 31, 2024) Initial Investment of $10,000
Average Annual Total Returns
| | | | |
| | | Since
Inception
(3/5/24) | |
| Nuveen Ultra Short Income ETF (NAV) | | | 2.22 | % |
| Bloomberg U.S. Aggregate Bond Index | | | 2.60 | % |
| ICE BofA U.S. 3‑Month Treasury Bill Index | | | 2.16 | % |
Investment return and principal value will fluctuate, and you may have a gain or loss when you sell your shares. Current performance may differ from figures shown. For most recent month‑end performance, go to https://www.nuveen.com/en‑us/exchange‑traded‑funds/prospectuses or call (800) 257‑8787.
Fund Statistics (as of July 31, 2024)
| | | | |
| |
| Fund net assets | | $ | 25,792,704 | |
| |
| Total number of portfolio holdings | | | 134 | |
| |
| Portfolio turnover (%) | | | 7% | |
| |
| Total management fees paid for the year | | $ | 11,077 | |
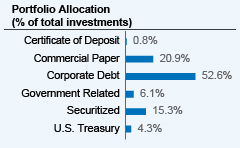
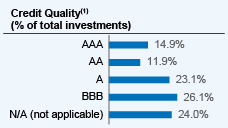
What did the Fund invest in? (as of July 31, 2024)
(1) The Fund uses credit quality ratings for its portfolio securities provided by Standard & Poor’s Group (“Standard & Poor’s”), Moody’s Investors Service, Inc. (“Moody’s”) and Fitch, Inc.(“Fitch”). If all three provide a rating for a security, the middle is used; if two of the three agencies rate a security, the lower rating is used; and if only one rating agency rates a security, that rating is used. AAA, AA, A, and BBB are investment grade ratings; BB, B, CCC/CC/C and D are below-investment grade ratings. Credit ratings are subject to change. Holdings designated N/R are not rated by Moody’s, S&P or Fitch.
How has the Fund changed?
For more complete information, you may review the Fund’s next prospectus, which is expected to be available by November 29, 2024 at https://www.nuveen.com/en‑us/exchange‑traded‑funds/prospectuses or upon request at (800) 257‑8787.
Availability of additional information about the Fund
You can find additional information about the Fund at https://www.nuveen.com/en‑us/exchange‑traded‑funds/prospectuses, including its:
| | • | | prospectus • financial statements and other information • fund holdings • proxy voting information |
You can also request this information at (800) 257‑8787.
| | |
67092P755_AR_0724 3824631-INV-Y-09/25 | | |
As of the end of the period covered by this report, the registrant has adopted a code of ethics that applies to the registrant’s principal executive officer, principal financial officer, principal accounting officer or controller, or persons performing similar functions. There were no amendments to or waivers from the code during the period covered by this report. Upon request, a copy of the registrant’s code of ethics is available without charge by calling 800-257-8787.
| Item 3. | Audit Committee Financial Expert. |
As of the end of the period covered by this report, the registrant’s Board of Directors or Trustees (“Board”) had determined that the registrant has at least one “audit committee financial expert” (as defined in Item 3 of Form N-CSR) serving on its Audit Committee. The members of the registrant’s audit committee that have been designated as audit committee financial experts are Joseph A. Boateng, Albin F. Moschner, John K. Nelson, Loren M. Starr and Robert L. Young, who are “independent” for purposes of Item 3 of Form N-CSR.
Mr. Boateng has served as the Chief Investment Officer for Casey Family Programs since 2007. He was previously Director of U.S. Pension Plans for Johnson & Johnson from 2002-2006. Mr. Boateng is a board member of the Lumina Foundation and Waterside School, an emeritus board member of Year Up Puget Sound, member of the Investment Advisory Committee and former Chair for the Seattle City Employees’ Retirement System, and an Investment Committee Member for The Seattle Foundation. Mr. Boateng previously served on the Board of Trustees for the College Retirement Equities Fund (2018-2023) and on the Management Committee for TIAA Separate Account VA-1 (2019-2023).
Mr. Moschner is a consultant in the wireless industry and, in July 2012, founded Northcroft Partners, LLC, a management consulting firm that provides operational, management and governance solutions. Prior to founding Northcroft Partners, LLC, Mr. Moschner held various positions at Leap Wireless International, Inc., a provider of wireless services, where he was as a consultant from February 2011 to July 2012, Chief Operating Officer from July 2008 to February 2011, and Chief Marketing Officer from August 2004 to June 2008. Before he joined Leap Wireless International, Inc., Mr. Moschner was President of the Verizon Card Services division of Verizon Communications, Inc. from 2000 to 2003, and President of One Point Services at One Point Communications from 1999 to 2000. Mr. Moschner also served at Zenith Electronics Corporation as Director, President and Chief Executive Officer from 1995 to 1996, and as Director, President and Chief Operating Officer from 1994 to 1995.
Mr. Nelson formerly served on the Board of Directors of Core12, LLC from 2008 to 2023, a private firm which develops branding, marketing, and communications strategies for clients. Mr. Nelson has extensive experience in global banking and markets, having served in several senior executive positions with ABN AMRO Holdings N.V. and its affiliated entities and predecessors, including LaSalle Bank Corporation from 1996 to 2008, ultimately serving as Chief Executive Officer of ABN AMRO N.V. North America. During his tenure at the bank, he also served as Global Head of its Financial Markets Division, which encompassed the bank’s Currency, Commodity, Fixed Income, Emerging Markets, and Derivatives businesses. He was a member of the Foreign Exchange Committee of the Federal Reserve Bank of the United States and during his tenure with ABN AMRO served as the bank’s representative on various committees of The Bank of Canada, European Central Bank, and The Bank of England. Mr. Nelson previously served as a senior, external advisor to the financial services practice of Deloitte Consulting LLP. (2012-2014).
Mr. Starr was Vice Chair, Senior Managing Director from 2020 to 2021, and Chief Financial Officer, Senior Managing Director from 2005 to 2020, for Invesco Ltd. Mr. Starr is also a Director and member of the Audit Committee for AMG. He is former Chair and member of the Board of Directors, Georgia Leadership Institute for School Improvement (GLISI); former Chair and member of the Board of Trustees, Georgia Council on Economic Education (GCEE). Mr. Starr previously served on the Board of Trustees for the College Retirement Equities Fund and on the Management Committee for TIAA Separate Account VA-1 (2022-2023).
Mr. Young has more than 30 years of experience in the investment management industry. From 1997 to 2017, he held various positions with J.P. Morgan Investment Management Inc. (“J.P. Morgan Investment”) and its affiliates (collectively, “J.P. Morgan”). Most recently, he served as Chief Operating Officer and Director of J.P. Morgan Investment (from 2010 to 2016) and as President and Principal Executive Officer of the J.P. Morgan Funds (from 2013 to 2016). As Chief Operating Officer of J.P. Morgan Investment, Mr. Young led service, administration and business platform support activities for J.P. Morgan’s domestic retail mutual fund and institutional commingled and separate account businesses and co-led these activities for J.P. Morgan’s global retail and institutional
investment management businesses. As President of the J.P. Morgan Funds, Mr. Young interacted with various service providers to these funds, facilitated the relationship between such funds and their boards, and was directly involved in establishing board agendas, addressing regulatory matters, and establishing policies and procedures. Before joining J.P. Morgan, Mr. Young, a former Certified Public Accountant (CPA), was a Senior Manager (Audit) with Deloitte & Touche LLP (formerly, Touche Ross LLP), where he was employed from 1985 to 1996. During his tenure there, he actively participated in creating, and ultimately led, the firm’s midwestern mutual fund practice.
| Item 4. | Principal Accountant Fees and Services. |
The following tables show the amount of fees that KPMG LLP, the Funds’ auditor, billed to the Funds during the Funds’ last two full fiscal years. The Audit Committee approved in advance all audit services and non-audit services that KPMG LLP provided to the Funds, except for those non-audit services that were subject to the pre-approval exception under Rule 2-01 of Regulation S-X (the “pre-approval exception”). The pre-approval exception for services provided directly to the Funds waives the pre-approval requirement for services other than audit, review or attest services if: (A) the aggregate amount of all such services provided constitutes no more than 5% of the total amount of revenues paid by the Funds during the fiscal year in which the services are provided; (B) the Funds did not recognize the services as non-audit services at the time of the engagement; and (C) the services are promptly brought to the Audit Committee’s attention, and the Committee (or its delegate) approves the services before the audit is completed.
The Audit Committee has delegated certain pre-approval responsibilities to its Chair (or, in his absence, any other member of the Audit Committee).
| | | | | | | | | | | | | | | | |
| Fiscal Year Ended July 31, 2024 | | Audit Fees
Billed to Funds1 | | | Audit-Related Fees
Billed to Funds2 | | | Tax Fees
Billed to Funds3 | | | All Other Fees
Billed to Funds4 | |
| Nuveen Enhanced Yield U.S. Aggregate Bond ETF | | | $20,000 | | | | $0 | | | | $0 | | | | $0 | |
| | | | | | | | | | | | | | | | |
| Nuveen ESG U.S. Aggregate Bond ETF | | | $20,000 | | | | $0 | | | | $0 | | | | $0 | |
| | | | | | | | | | | | | | | | |
| Nuveen ESG High Yield Corporate Bond ETF | | | $22,800 | | | | $0 | | | | $0 | | | | $0 | |
| | | | | | | | | | | | | | | | |
| Nuveen ESG 1-5 Year U.S. Aggregate Bond ETF | | | $20,000 | | | | $0 | | | | $0 | | | | $0 | |
| | | | | | | | | | | | | | | | |
| Nuveen Global Net Zero Transition ETF | | | $22,800 | | | | $0 | | | | $0 | | | | $0 | |
| | | | | | | | | | | | | | | | |
| Nuveen Core Plus Bond ETF5 | | | $20,000 | | | | $0 | | | | $0 | | | | $0 | |
| | | | | | | | | | | | | | | | |
| Nuveen Preferred and Income ETF5 | | | $22,800 | | | | $0 | | | | $0 | | | | $0 | |
| | | | | | | | | | | | | | | | |
| Nuveen Sustainable Core ETF5 | | | $17,100 | | | | $0 | | | | $0 | | | | $0 | |
| | | | | | | | | | | | | | | | |
| Nuveen Ultra Short Income ETF5 | | | $20,000 | | | | $0 | | | | $0 | | | | $0 | |
| | | | | | | | | | | | | | | | |
Total | | | $185,500 | | | | $0 | | | | $0 | | | | $0 | |
| 1 | “Audit Fees” are the aggregate fees billed for professional services for the audit of the Fund’s annual financial statements and services provided in connection with statutory and regulatory filings or engagements. |
| 2 | “Audit-Related Fees” are the aggregate fees billed for assurance and related services reasonably related to the performance of the audit or review of financial statements that are not reported under “Audit Fees”. These fees include offerings related to the Fund’s common shares and leverage. |
| 3 | “Tax Fees” are the aggregate fees billed for professional services for tax advice, tax compliance, and tax planning. These fees include: all global withholding tax services; excise and state tax reviews; capital gain, tax equalization and taxable basis calculations performed by the principal accountant. |
| 4 | “All Other Fees” are the aggregate fees billed for products and services other than “Audit Fees”, “Audit-Related Fees” and “Tax Fees”. These fees represent all “Agreed-Upon Procedures” engagements pertaining to the Fund’s use of leverage. |
| 5 | Funds commenced operations on 3/5/2024. |
| | | | | | | | | | | | | | | | |
| Fiscal Year Ended July 31, 2024 | | Percentage Approved Pursuant to Pre-approval Exception | |
| | Audit Fees
Billed to Funds | | | Audit-Related Fees
Billed to Funds | | | Tax Fees
Billed to Funds | | | All Other Fees
Billed to Funds | |
| Nuveen Enhanced Yield U.S. Aggregate Bond ETF | | | 0 | % | | | 0 | % | | | 0 | % | | | 0 | % |
| | | | | | | | | | | | | | | | |
| | | Percentage Approved Pursuant to Pre-approval Exception | |
| Fiscal Year Ended July 31, 2024 | | Audit Fees Billed to Funds | | | Audit-Related Fees Billed to Funds | | | Tax Fees Billed to Funds | | | All Other Fees Billed to Funds | |
Nuveen ESG U.S. Aggregate Bond ETF | | | 0% | | | | 0% | | | | 0% | | | | 0% | |
| | | | | | | | | | | | | | | | |
Nuveen ESG High Yield Corporate Bond ETF | | | 0% | | | | 0% | | | | 0% | | | | 0% | |
| | | | | | | | | | | | | | | | |
Nuveen ESG 1-5 Year U.S. Aggregate Bond ETF | | | 0% | | | | 0% | | | | 0% | | | | 0% | |
| | | | | | | | | | | | | | | | |
Nuveen Global Net Zero Transition ETF | | | 0% | | | | 0% | | | | 0% | | | | 0% | |
| | | | | | | | | | | | | | | | |
Nuveen Core Plus Bond ETF | | | 0% | | | | 0% | | | | 0% | | | | 0% | |
| | | | | | | | | | | | | | | | |
Nuveen Preferred and Income ETF | | | 0% | | | | 0% | | | | 0% | | | | 0% | |
| | | | | | | | | | | | | | | | |
Nuveen Sustainable Core ETF | | | 0% | | | | 0% | | | | 0% | | | | 0% | |
| | | | | | | | | | | | | | | | |
Nuveen Ultra Short Income ETF | | | 0% | | | | 0% | | | | 0% | | | | 0% | |
| | | | |
| Fiscal Year Ended July 31, 2023 | | Audit Fees Billed to Funds1 | | | Audit-Related Fees Billed to Funds2 | | | Tax Fees Billed to Funds3 | | | All Other Fees Billed to Funds4 | |
Nuveen Enhanced Yield U.S. Aggregate Bond ETF | | | $21,000 | | | | $0 | | | | $0 | | | | $0 | |
| | | | | | | | | | | | | | | | |
Nuveen ESG U.S. Aggregate Bond ETF | | | $21,000 | | | | $0 | | | | $0 | | | | $0 | |
| | | | | | | | | | | | | | | | |
Nuveen ESG High Yield Corporate Bond ETF | | | $24,000 | | | | $0 | | | | $0 | | | | $0 | |
| | | | | | | | | | | | | | | | |
Nuveen ESG 1-5 Year U.S. Aggregate Bond ETF | | | $21,000 | | | | $0 | | | | $0 | | | | $0 | |
| | | | | | | | | | | | | | | | |
Nuveen Global Net Zero Transition ETF | | | $24,000 | | | | $0 | | | | $0 | | | | $0 | |
| | | | | | | | | | | | | | | | |
Total | | | $111,000 | | | | $0 | | | | $0 | | | | $0 | |
| 1 | “Audit Fees” are the aggregate fees billed for professional services for the audit of the Fund’s annual financial statements and services provided in connection with statutory and regulatory filings or engagements. |
| 2 | “Audit-Related Fees” are the aggregate fees billed for assurance and related services reasonably related to the performance of the audit or review of financial statements that are not reported under “Audit Fees”. These fees include offerings related to the Fund’s common shares and leverage. |
| 3 | “Tax Fees” are the aggregate fees billed for professional services for tax advice, tax compliance, and tax planning. These fees include: all global withholding tax services; excise and state tax reviews; capital gain, tax equalization and taxable basis calculations performed by the principal accountant. |
| 4 | “All Other Fees” are the aggregate fees billed for products and services other than “Audit Fees”, “Audit-Related Fees” and “Tax Fees”. These fees represent all “Agreed-Upon Procedures” engagements pertaining to the Fund’s use of leverage. |
| | | | | | | | | | | | | | | | |
| | | Percentage Approved Pursuant to Pre-approval Exception | |
| Fiscal Year Ended July 31, 2023 | | Audit Fees Billed to Funds | | | Audit-Related Fees Billed to Funds | | | Tax Fees Billed to Funds | | | All Other Fees Billed to Funds | |
Nuveen Enhanced Yield U.S. Aggregate Bond ETF | | | 0 | % | | | 0 | % | | | 0 | % | | | 0 | % |
| | | | | | | | | | | | | | | | |
Nuveen ESG U.S. Aggregate Bond ETF | | | 0 | % | | | 0 | % | | | 0 | % | | | 0 | % |
| | | | | | | | | | | | | | | | |
Nuveen ESG High Yield Corporate Bond ETF | | | 0 | % | | | 0 | % | | | 0 | % | | | 0 | % |
| | | | | | | | | | | | | | | | |
| | | Percentage Approved Pursuant to Pre-approval Exception | |
| Fiscal Year Ended July 31, 2023 | | Audit Fees Billed to Funds | | | Audit-Related Fees Billed to Funds | | | Tax Fees Billed to Funds | | | All Other Fees Billed to Funds | |
| Nuveen ESG 1-5 Year U.S. Aggregate Bond ETF | | | 0 | % | | | 0 | % | | | 0 | % | | | 0 | % |
| | | | | | | | | | | | | | | | |
| Nuveen Global Net Zero Transition ETF | | | 0 | % | | | 0 | % | | | 0 | % | | | 0 | % |
| | | | | | | | | | | | |
| Fiscal Year Ended July 31, 2024 | | Audit-Related Fees
Billed to Adviser
and Affiliated Fund
Service Providers | | | Tax Fees
Billed to Adviser
and Affiliated Fund
Service Providers | | | All Other Fees
Billed to Adviser
and Affiliated Fund
Service Providers | |
Nushares ETF Trust | | | $0 | | | | $0 | | | | $0 | |
| |
| | | Percentage Approved Pursuant to Pre-approval Exception | |
| | Audit-Related Fees
Billed to Adviser
and Affiliated Fund
Service Providers | | | Tax Fees
Billed to Adviser
and Affiliated Fund
Service Providers | | | All Other Fees
Billed to Adviser
and Affiliated Fund
Service Providers | |
| | | 0 | % | | | 0 | % | | | 0 | % |
| | | |
| Fiscal Year Ended July 31, 2023 | | Audit-Related Fees
Billed to Adviser
and Affiliated Fund
Service Providers | | | Tax Fees
Billed to Adviser
and Affiliated Fund
Service Providers | | | All Other Fees
Billed to Adviser
and Affiliated Fund
Service Providers | |
Nushares ETF Trust | | | $0 | | | | $0 | | | | $0 | |
| |
| | | Percentage Approved Pursuant to Pre-approval Exception | |
| | Audit-Related Fees
Billed to Adviser
and Affiliated Fund
Service Providers | | | Tax Fees Billed to Adviser
and Affiliated Fund
Service Providers | | | All Other Fees
Billed to Adviser
and Affiliated Fund
Service Providers | |
| | | 0 | % | | | 0 | % | | | 0 | % |
| | | | | | | | | | | | | | | | |
| Fiscal Year Ended July 31, 2024 | | Total Non-Audit Fees
Billed to Fund | | | Total Non-Audit Fees
Billed to Adviser and
Affiliated Fund Service
Providers (engagements
related directly to the
operations and financial
reporting of the Trust) | | | Total Non-Audit Fees
Billed to Adviser and
Affiliated Fund Service
Providers (all other
engagements) | | | Total | |
| Nuveen Enhanced Yield U.S. Aggregate Bond ETF | | | $0 | | | | $0 | | | | $0 | | | | $0 | |
| | | | | | | | | | | | | | | | |
| Nuveen ESG U.S. Aggregate Bond ETF | | | $0 | | | | $0 | | | | $0 | | | | $0 | |
| | | | | | | | | | | | | | | | |
| Nuveen ESG High Yield Corporate Bond ETF | | | $0 | | | | $0 | | | | $0 | | | | $0 | |
| | | | | | | | | | | | | | | | |
| Nuveen ESG 1-5 Year U.S. Aggregate Bond ETF | | | $0 | | | | $0 | | | | $0 | | | | $0 | |
| | | | | | | | | | | | | | | | |
| Nuveen Global Net Zero Transition ETF | | | $0 | | | | $0 | | | | $0 | | | | $0 | |
| | | | | | | | | | | | | | | | |
| Nuveen Core Plus Bond ETF | | | $0 | | | | $0 | | | | $0 | | | | $0 | |
| | | | | | | | | | | | | | | | |
| Nuveen Preferred and Income ETF | | | $0 | | | | $0 | | | | $0 | | | | $0 | |
| | | | | | | | | | | | | | | | |
| Nuveen Sustainable Core ETF | | | $0 | | | | $0 | | | | $0 | | | | $0 | |
| | | | | | | | | | | | | | | | |
| Fiscal Year Ended July 31, 2024 | | Total Non-Audit Fees
Billed to Fund | | | Total Non-Audit Fees
Billed to Adviser and
Affiliated Fund Service
Providers (engagements
related directly to the
operations and financial
reporting of the Trust) | | | Total Non-Audit Fees
Billed to Adviser and
Affiliated Fund Service
Providers (all other
engagements) | | | Total | |
| | | | | | | | | | | | | | | | |
| Nuveen Ultra Short Income ETF | | | $0 | | | | $0 | | | | $0 | | | | $0 | |
| | | | | | | | | | | | | | | | |
Total | | | $0 | | | | $0 | | | | $0 | | | | $0 | |
“Non-Audit Fees billed to Fund” for both fiscal year ends represent “Tax Fees” and “All Other Fees” billed to Fund in their respective amounts from the previous table.
Less than 50 percent of the hours expended on the principal accountant’s engagement to audit the registrant’s financial statements for the most recent fiscal year were attributed to work performed by persons other than the principal accountant’s full-time, permanent employees.
| | | | | | | | | | | | | | | | |
| Fiscal Year Ended July 31, 2023 | | Total Non-Audit Fees
Billed to Fund | | | Total Non-Audit Fees Billed to Adviser and
Affiliated Fund Service
Providers (engagements
related directly to the
operations and financial
reporting of the Trust) | | | Total Non-Audit Fees
Billed to Adviser and
Affiliated Fund Service
Providers (all other
engagements) | | | Total | |
| Nuveen Enhanced Yield U.S. Aggregate Bond ETF | | | $0 | | | | $0 | | | | $0 | | | | $0 | |
| | | | | | | | | | | | | | | | |
| Nuveen ESG U.S. Aggregate Bond ETF | | | $0 | | | | $0 | | | | $0 | | | | $0 | |
| | | | | | | | | | | | | | | | |
| Nuveen ESG High Yield Corporate Bond ETF | | | $0 | | | | $0 | | | | $0 | | | | $0 | |
| | | | | | | | | | | | | | | | |
| Nuveen ESG 1-5 Year U.S. Aggregate Bond ETF | | | $0 | | | | $0 | | | | $0 | | | | $0 | |
| | | | | | | | | | | | | | | | |
| Nuveen Global Net Zero Transition ETF | | | $0 | | | | $0 | | | | $0 | | | | $0 | |
| | | | | | | | | | | | | | | | |
Total | | | $0 | | | | $0 | | | | $0 | | | | $0 | |
“Non-Audit Fees billed to Fund” for both fiscal year ends represent “Tax Fees” and “All Other Fees” billed to Fund in their respective amounts from the previous table.
Audit Committee Pre-Approval Policies and Procedures. Generally, the Audit Committee must approve (i) all non-audit services to be performed for the Funds by the Funds’ independent accountant and (ii) all audit and non-audit services to be performed by the Funds’ independent accountant for the Affiliated Fund Service Providers with respect to the operations and financial reporting of the Funds. Regarding tax and research projects conducted by the independent accountant for the Funds and Affiliated Fund Service Providers (with respect to operations and financial reports of the Trust), such engagements will be (i) pre-approved by the Audit Committee if they are expected to be for amounts greater than $10,000; (ii) reported to the Audit Committee Chair for his verbal approval prior to engagement if they are expected to be for amounts under $10,000 but greater than $5,000; and (iii) reported to the Audit Committee at the next Audit Committee meeting if they are expected to be for an amount under $5,000.
Item 4(i) and Item 4(j) are not applicable to the registrant.
| Item 5. | Audit Committee of Listed Registrants. |
The registrant is an issuer as defined in Rule 10A-3 under the Securities Exchange Act of 1934 (the “Exchange Act”). The registrant’s Board has a separately designated Audit Committee established in accordance with Section 3(a)(58)(A) of the Securities Exchange Act of 1934, as amended (15 U.S.C. 78c(a)(58)(A)). The members of the audit committee are Joseph A. Boateng, Albin F. Moschner, John K. Nelson, Chair, Loren M. Starr, Margaret L. Wolff and Robert L. Young.
| (a) | Schedule of Investments is included as part of the financial statements filed under Item 7 of this Form N-CSR. |
| Item 7. | Financial Statements and Financial Highlights for Open-End Management Investment Companies. |
Report
of
Independent
Registered
Public
Accounting
Firm
To
the
Shareholders
and
Board
of
Trustees
Nushares
ETF
Trust:
Opinion
on
the
Financial
Statements
We
have
audited
the
accompanying
statements
of
assets
and
liabilities
of
the
funds
listed
in
Appendix
A
(nine
of
the
funds
comprising
Nushares
ETF
Trust)
(the
Funds),
including
the
portfolios
of
investments,
as
of
July 31, 2024,
the
related
statements
of
operations
and
changes
in
net
assets
for
the
Funds
and
periods
listed
in
Appendix
A,
and
the
related
notes
(collectively,
the
financial
statements)
and
the
financial
highlights
for
the
Funds
and
periods
listed
in
Appendix
A.
In
our
opinion,
the
financial
statements
and
financial
highlights
present
fairly,
in
all
material
respects,
the
financial
position
of
the
Funds
as
of
July 31, 2024,
the
results
of
their
operations
and
changes
in
their
net
assets
for
the
Funds
and
periods
listed
in
Appendix
A,
and
the
financial
highlights
for
the
Funds
and
periods
listed
in
Appendix
A,
in
conformity
with
U.S. generally
accepted
accounting
principles.
Basis
for
Opinion
These
financial
statements
and
financial
highlights
are
the
responsibility
of
the
Funds'
management.
Our
responsibility
is
to
express
an
opinion
on
these
financial
statements
and
financial
highlights
based
on
our
audits.
We
are
a
public
accounting
firm
registered
with
the
Public
Company
Accounting
Oversight
Board
(United
States)
(PCAOB)
and
are
required
to
be
independent
with
respect
to
the
Funds
in
accordance
with
the
U.S.
federal
securities
laws
and
the
applicable
rules
and
regulations
of
the
Securities
and
Exchange
Commission
and
the
PCAOB.
We
conducted
our
audits
in
accordance
with
the
standards
of
the
PCAOB.
Those
standards
require
that
we
plan
and
perform
the
audit
to
obtain
reasonable
assurance
about
whether
the
financial
statements
and
financial
highlights
are
free
of
material
misstatement,
whether
due
to
error
or
fraud.
Our
audits
included
performing
procedures
to
assess
the
risks
of
material
misstatement
of
the
financial
statements
and
financial
highlights,
whether
due
to
error
or
fraud,
and
performing
procedures
that
respond
to
those
risks.
Such
procedures
included
examining,
on
a
test
basis,
evidence
regarding
the
amounts
and
disclosures
in
the
financial
statements
and
financial
highlights.
Such
procedures
also
included
confirmation
of
securities
owned
as
of
July 31, 2024,
by
correspondence
with
custodians
and
brokers;
when
replies
were
not
received
from
brokers,
we
performed
other
auditing
procedures.
Our
audits
also
included
evaluating
the
accounting
principles
used
and
significant
estimates
made
by
management,
as
well
as
evaluating
the
overall
presentation
of
the
financial
statements
and
financial
highlights.
We
believe
that
our
audits
provide
a
reasonable
basis
for
our
opinion.
Emphasis
of
Matter
As
discussed
in
note
9
to
the
financial
statements,
the
Board
of
Trustees
approved
the
liquidation
of
Nuveen
Global
Net
Zero
Transition
ETF,
effective
October
22,
2024.
Our
opinion
is
not
modified
with
respect
to
this
matter.
/s/
KPMG
LLP
We
have
served
as
the
auditor
of
one
or
more
Nuveen
investment
companies
since
2014.
Chicago,
Illinois
September
27,
2024
Report
of
Independent
Registered
Public
Accounting
Firm
(continued)
Appendix
A
Funds
and
Periods:
For
the
year
ended
July
31,
2024
(statements
of
operations);
each
of
the
years
in
the
two-year
period
ended
July
31,
2024
(statements
of
changes
in
net
assets);
each
of
the
years
in
the
five-year
period
ended
July
31,
2024
(financial
highlights):
Nuveen
Enhanced
Yield
U.S.
Aggregate
Bond
ETF
(NUAG)
Nuveen
ESG
1-5
Year
U.S.
Aggregate
Bond
ETF
(NUSA)
Nuveen
ESG
U.S.
Aggregate
Bond
ETF
(NUBD)
For
the
year
ended
July
31,
2024
(statements
of
operations);
each
of
the
years
in
the
two-year
period
ended
July
31,
2024
(statements
of
changes
in
net
assets);
each
of
the
years
in
the
four-year
period
ended
July
31,
2024
and
the
period
September
25,
2019
(commencement
of
operations)
through
July
31,
2020
(financial
highlights):
Nuveen
ESG
High
Yield
Corporate
Bond
ETF
(NUHY)
For
the
year
ended
July
31,
2024
(statements
of
operations);
each
of
the
years
in
the
two-
year
period
ended
July
31,
2024
(statements
of
changes
in
net
assets);
each
of
the
years
in
the
two-year
period
ended
July
31,
2024
and
the
period
June
23,
2022
(commencement
of
operations)
through
July
31,
2022
(financial
highlights):
Nuveen
Global
Net
Zero
Transition
ETF
(NTZG)
For
the
period
March
5,
2024
(commencement
of
operations)
through
July
31,
2024
(statements
of
operations,
change
in
net
assets
and
the
financial
highlights):
Nuveen
Core
Plus
Bond
ETF
(NCPB)
Nuveen
Preferred
and
Income
ETF
(NPFI)
Nuveen
Sustainable
Core
ETF
(NSCR)
Nuveen
Ultra
Short
Income
ETF
(NUSB)
Nuveen
Core
Plus
Bond
ETF
(NCPB)
Portfolio
of
Investments
July
31,
2024
Principal
Amount
(000)
Description
(a)
Coupon
Maturity
Value
LONG-TERM
INVESTMENTS
-
98.5%
X
–
SECURITIZED
-
37.6%
$
250
(b)
Avis
Budget
Rental
Car
Funding
AESOP
LLC
2023
2A
6.180%
10/20/27
$
250,227
250
BANK5
2024-5YR7
2024
5YR7
5.769%
6/15/57
257,906
250
(b)
BBCMS
Trust
2015-SRCH
2015
SRCH
4.957%
8/10/35
214,555
150
(b)
BBCMS
Trust
2018-CBM
2018
CBM
6.626%
7/15/37
148,309
200
Benchmark
2018-B2
Mortgage
Trust
2018
B2
4.284%
2/15/51
169,534
120
(b)
BX
TRUST
2022
PSB
7.780%
8/15/39
119,922
150
(b)
BX
Trust
2023-DELC
2023
DELC
8.668%
5/15/38
150,863
250
COMM
2015-CCRE26
Mortgage
Trust
2015
CR26
3.630%
10/10/48
243,831
25
(b)
Connecticut
Avenue
Securities
Trust
2022-R03
2022
R03
8.847%
3/25/42
26,355
300
(b)
Connecticut
Avenue
Securities
Trust
2023-R04
2023
R04
8.898%
5/25/43
321,982
185
(b)
Connecticut
Avenue
Securities
Trust
2023-R05
2023
R05
10.098%
6/25/43
200,877
150
(b)
DBSG
2024-ALTA
Mortgage
Trust
2024
ALTA
6.595%
6/10/37
152,009
387
Fannie
Mae
Pool
FN
FS1533
3.000%
4/01/52
340,947
90
Fannie
Mae
Pool
FN
FS7299
3.000%
5/01/52
79,409
229
Fannie
Mae
Pool
FN
MA4624
3.000%
6/01/52
200,203
59
Fannie
Mae
Pool
FN
MA4653
3.000%
7/01/52
51,456
55
Fannie
Mae
Pool
FN
MA4699
2022
1
3.500%
7/01/52
49,710
754
Fannie
Mae
Pool
FN
MA4700
2022
1
4.000%
7/01/52
706,939
775
Fannie
Mae
Pool
FN
MA4731
2022
1
3.500%
9/01/52
702,819
576
Fannie
Mae
Pool
FN
MA4733
4.500%
9/01/52
555,401
639
Fannie
Mae
Pool
FN
MA4784
4.500%
10/01/52
615,674
297
Fannie
Mae
Pool
FN
MA4785
5.000%
10/01/52
292,992
574
Fannie
Mae
Pool
FN
MA4805
2022
1
4.500%
11/01/52
553,575
914
Fannie
Mae
Pool
FN
MA4962
4.000%
3/01/53
856,755
872
Fannie
Mae
Pool
FN
MA4978
5.000%
4/01/53
859,301
487
Fannie
Mae
Pool
FN
MA5039
5.500%
6/01/53
487,691
425
Fannie
Mae
Pool
FN
MA5165
5.500%
10/01/53
425,652
263
Fannie
Mae
Pool
FN
MA5247
6.000%
1/01/54
266,188
459
Freddie
Mac
Pool
FR
RA6766
2.500%
2/01/52
389,773
66
Freddie
Mac
Pool
FR
SD4810
3.000%
4/01/52
58,642
185
(b)
Freddie
Mac
STACR
REMIC
Trust
2022-DNA3
2022
DNA3
8.647%
4/25/42
200,962
200
(b)
Freddie
Mac
STACR
REMIC
Trust
2022-DNA6
2022
DNA6
9.047%
9/25/42
213,189
150
(b)
Frontier
Issuer
LLC
2023
1
6.600%
8/20/53
153,009
54
Ginnie
Mae
II
Pool
G2
MA7419
2021
MTGE
3.000%
6/20/51
48,327
65
Ginnie
Mae
II
Pool
G2
MA8043
3.000%
5/20/52
57,589
294
Ginnie
Mae
II
Pool
G2
MA8149
3.500%
7/20/52
270,112
211
Ginnie
Mae
II
Pool
G2
MA8267
2022
A
4.000%
9/20/52
199,530
207
Ginnie
Mae
II
Pool
G2
MA8489
4.500%
12/20/52
200,352
150
(b)
GS
Mortgage
Securities
Corp
Trust
2022-AGSS
2022
ECI
7.022%
8/15/39
150,269
125
GS
Mortgage
Securities
Trust
2015-GC28
2015
GC28
3.980%
2/10/48
122,743
250
GS
Mortgage
Securities
Trust
2017-GS5
2017
GS5
3.826%
3/10/50
232,982
96
(b)
GS
Mortgage-Backed
Securities
Trust
2022-LTV2
2022
LTV2
4.336%
12/25/52
83,374
250
(b)
Hertz
Vehicle
Financing
III
LP
2021
2A
2.520%
12/27/27
229,831
186
(b)
J.P.
Morgan
Mortgage
Trust
2021-INV5
2021
INV5
3.188%
12/25/51
152,376
188
(b)
J.P.
Morgan
Mortgage
Trust
2021-INV8
2021
INV8
3.288%
5/25/52
149,914
80
(b)
JP
Morgan
Mortgage
Trust
2017-5
2017
5
5.477%
10/26/48
80,467
78
(b)
JP
Morgan
Mortgage
Trust
2021-11
2021
11
2.500%
1/25/52
63,275
186
(b)
JP
Morgan
Mortgage
Trust
2021-INV4
2021
INV4
3.216%
1/25/52
146,740
187
(b)
JP
Morgan
Mortgage
Trust
2021-INV6
2021
INV6
3.344%
4/25/52
147,999
82
(b)
JP
Morgan
Mortgage
Trust
Series
2024-3
2024
3
3.000%
5/25/54
69,264
100
JPMCC
Commercial
Mortgage
Securities
Trust
2017-JP6
2017
JP6
3.700%
7/15/50
72,316
150
JPMDB
Commercial
Mortgage
Securities
Trust
2017-C5
2017
C5
3.694%
3/15/50
143,147
250
(b)
Magnetite
XXIII
Ltd
2019
23A
8.596%
1/25/35
251,825
150
(b)
MetroNet
Infrastructure
Issuer
LLC
2024
1A
7.590%
4/20/54
155,045
Nuveen
Core
Plus
Bond
ETF
(NCPB)
(continued)
Portfolio
of
Investments
July
31,
2024
Principal
Amount
(000)
Description
(a)
Coupon
Maturity
Value
$
250
(b)
MetroNet
Infrastructure
Issuer
LLC
2024
1A
10.860%
4/20/54
$
252,753
91
(b)
Morgan
Stanley
Residential
Mortgage
Loan
Trust
2023-1
2023
1
4.000%
2/25/53
82,376
221
(b)
MVW
2021-1W
LLC
2021
1WA
1.940%
1/22/41
206,728
175
(b)
One
Bryant
Park
Trust
2019-OBP
2019
OBP
2.516%
9/15/54
151,403
441
(b)
RCKT
Mortgage
Trust
2021-2
2021
2
2.500%
6/25/51
356,548
221
(b)
Sequoia
Mortgage
Trust
2020-1
2020
1
3.851%
2/25/50
177,937
150
(b)
Subway
Funding
LLC
2024
1A
6.028%
7/30/54
153,914
147
(b)
Taco
Bell
Funding
LLC
2021
1A
2.294%
8/25/51
130,330
150
(b)
TX
Trust
2024-HOU
2024
HOU
6.920%
6/15/39
148,977
268
(b)
VR
Funding
LLC
2020
1A
2.790%
11/15/50
241,869
TOTAL
SECURITIZED
(cost
$15,049,591)
15,246,969
Principal
Amount
(000)
Description
(a)
Coupon
Maturity
Value
X
–
CORPORATE
DEBT
-
37.4%
FINANCIALS
-
12.5%
$
30
(b)
Acrisure
LLC
/
Acrisure
Finance
Inc
4.250%
2/15/29
27,608
170
AerCap
Ireland
Capital
DAC
/
AerCap
Global
Aviation
Trust
3.000%
10/29/28
157,303
200
AerCap
Ireland
Capital
DAC
/
AerCap
Global
Aviation
Trust
6.950%
3/10/55
202,241
30
(b)
Alliant
Holdings
Intermediate
LLC
/
Alliant
Holdings
Co-Issuer
6.750%
4/15/28
30,149
320
Bank
of
America
Corp
5.202%
4/25/29
323,908
280
Bank
of
America
Corp
5.468%
1/23/35
286,310
15
Bank
of
America
Corp
6.250%
N/A
(c)
14,986
75
Bank
of
America
Corp
6.125%
N/A
(c)
75,136
55
Bank
of
New
York
Mellon
Corp/
The
4.700%
N/A
(c)
54,061
45
Berkshire
Hathaway
Finance
Corp
3.850%
3/15/52
35,988
115
(b)
BNP
Paribas
SA
5.335%
6/12/29
116,811
100
Brixmor
Operating
Partnership
LP
3.850%
2/01/25
99,019
75
Brixmor
Operating
Partnership
LP
2.250%
4/01/28
68,117
40
Capital
One
Financial
Corp
3.950%
N/A
(c)
36,918
75
Centene
Corp
3.000%
10/15/30
65,556
75
Charles
Schwab
Corp/The
5.375%
N/A
(c)
74,122
170
Citigroup
Inc
4.910%
5/24/33
166,992
70
Citigroup
Inc
7.625%
N/A
(c)
72,799
25
Citigroup
Inc
4.000%
N/A
(c)
23,933
30
(b)
Compass
Group
Diversified
Holdings
LLC
5.250%
4/15/29
28,745
100
Deutsche
Bank
AG/New
York
NY
6.819%
11/20/29
105,783
60
Discover
Financial
Services
6.125%
N/A
(c)
59,554
35
Elevance
Health
Inc
5.125%
2/15/53
32,886
50
Equitable
Holdings
Inc
4.950%
N/A
(c)
49,076
120
Federal
Realty
OP
LP
1.250%
2/15/26
113,133
25
(b)
FirstCash
Inc
6.875%
3/01/32
25,284
55
(b)
Five
Corners
Funding
Trust
II
2.850%
5/15/30
49,751
55
Goldman
Sachs
Group
Inc/The
5.727%
4/25/30
56,812
80
Goldman
Sachs
Group
Inc/The
5.851%
4/25/35
83,597
30
Goldman
Sachs
Group
Inc/The
5.500%
N/A
(c)
29,918
80
Goldman
Sachs
Group
Inc/The
7.500%
N/A
(c)
83,692
95
Hartford
Financial
Services
Group
Inc/The
2.800%
8/19/29
86,590
Principal
Amount
(000)
Description
(a)
Coupon
Maturity
Value
FINANCIALS
(continued)
$
45
(b)
HAT
Holdings
I
LLC
/
HAT
Holdings
II
LLC
8.000%
6/15/27
$
47,074
40
Highwoods
Realty
LP
2.600%
2/01/31
32,858
115
HSBC
Holdings
PLC
7.390%
11/03/28
123,065
30
(b)
HUB
International
Ltd
7.250%
6/15/30
30,941
70
Huntington
Bancshares
Inc/OH
5.625%
N/A
(c)
67,049
40
Icahn
Enterprises
LP
/
Icahn
Enterprises
Finance
Corp
5.250%
5/15/27
38,364
40
JPMorgan
Chase
&
Co
3.875%
9/10/24
39,929
100
JPMorgan
Chase
&
Co
5.294%
7/22/35
101,403
225
JPMorgan
Chase
&
Co
3.157%
4/22/42
172,281
50
JPMorgan
Chase
&
Co
3.650%
N/A
(c)
47,480
55
JPMorgan
Chase
&
Co
6.875%
N/A
(c)
56,829
30
Kennedy-Wilson
Inc
4.750%
3/01/29
26,403
80
Kite
Realty
Group
Trust
4.750%
9/15/30
78,415
40
(b)
Liberty
Mutual
Group
Inc
3.951%
10/15/50
29,784
55
M&T
Bank
Corp
3.500%
N/A
(c)
47,414
50
MetLife
Inc
3.850%
N/A
(c)
48,468
100
Mid-America
Apartments
LP
2.750%
3/15/30
90,388
75
Morgan
Stanley
5.042%
7/19/30
75,522
125
Morgan
Stanley
5.320%
7/19/35
126,030
25
MPT
Operating
Partnership
LP
/
MPT
Finance
Corp
3.500%
3/15/31
16,426
30
Navient
Corp
5.500%
3/15/29
27,899
35
Northern
Trust
Corp
4.600%
N/A
(c)
33,953
30
OneMain
Finance
Corp
5.375%
11/15/29
28,829
30
(b)
Panther
Escrow
Issuer
LLC
7.125%
6/01/31
30,783
50
(b)
PennyMac
Financial
Services
Inc
7.875%
12/15/29
52,339
40
PNC
Financial
Services
Group
Inc/The
3.400%
N/A
(c)
35,763
30
PNC
Financial
Services
Group
Inc/The
6.200%
N/A
(c)
29,922
70
Prudential
Financial
Inc
5.125%
3/01/52
65,837
35
(b)
Rocket
Mortgage
LLC
/
Quicken
Loans
Co-Issuer
Inc
4.000%
10/15/33
30,103
140
SITE
Centers
Corp
3.625%
2/01/25
138,580
60
State
Street
Corp
6.700%
N/A
(c)
60,064
30
Truist
Financial
Corp
4.950%
N/A
(c)
29,404
60
Truist
Financial
Corp
4.800%
N/A
(c)
59,100
130
(b)
UBS
Group
AG
6.442%
8/11/28
134,892
80
UnitedHealth
Group
Inc
2.300%
5/15/31
68,798
65
Wells
Fargo
&
Co
5.574%
7/25/29
66,560
100
Wells
Fargo
&
Co
7.625%
N/A
(c)
106,367
40
Wells
Fargo
&
Co
3.900%
N/A
(c)
38,369
TOTAL
FINANCIALS
5,070,463
INDUSTRIAL
-
21.8%
35
AbbVie
Inc
5.050%
3/15/34
35,645
35
AbbVie
Inc
5.400%
3/15/54
35,457
30
(b)
Adient
Global
Holdings
Ltd
4.875%
8/15/26
29,444
35
(b)
ADT
Security
Corp/The
4.875%
7/15/32
32,540
30
(b)
Ahead
DB
Holdings
LLC
6.625%
5/01/28
28,534
30
(b)
Albertsons
Cos
Inc
/
Safeway
Inc
/
New
Albertsons
LP
/
Albertsons
LLC
6.500%
2/15/28
30,434
35
Amcor
Flexibles
North
America
Inc
4.000%
5/17/25
34,590
35
Amcor
Group
Finance
PLC
5.450%
5/23/29
35,688
205
American
Tower
Corp
2.750%
1/15/27
194,865
Nuveen
Core
Plus
Bond
ETF
(NCPB)
(continued)
Portfolio
of
Investments
July
31,
2024
Principal
Amount
(000)
Description
(a)
Coupon
Maturity
Value
INDUSTRIAL
(continued)
$
35
Amgen
Inc
5.250%
3/02/25
$
34,970
45
Amgen
Inc
5.250%
3/02/33
45,733
115
Amgen
Inc
5.650%
3/02/53
115,876
95
Anheuser-Busch
Cos
LLC
/
Anheuser-Busch
InBev
Worldwide
Inc
4.900%
2/01/46
89,938
65
Anheuser-Busch
InBev
Worldwide
Inc
5.000%
6/15/34
65,918
30
(b)
Antero
Midstream
Partners
LP
/
Antero
Midstream
Finance
Corp
6.625%
2/01/32
30,607
245
Apple
Inc
2.450%
8/04/26
235,437
30
(b)
Archrock
Partners
LP
/
Archrock
Partners
Finance
Corp
6.250%
4/01/28
29,928
30
(b)
Arsenal
AIC
Parent
LLC
8.000%
10/01/30
31,918
30
(b)
Asbury
Automotive
Group
Inc
5.000%
2/15/32
27,646
35
(b)
ASGN
Inc
4.625%
5/15/28
33,537
80
AT&T
Inc
2.550%
12/01/33
65,422
220
AT&T
Inc
3.500%
9/15/53
153,810
85
AT&T
Inc
3.800%
12/01/57
61,139
30
(b)
Avient
Corp
5.750%
5/15/25
29,928
30
Ball
Corp
6.875%
3/15/28
30,846
30
(b)
Bath
&
Body
Works
Inc
6.625%
10/01/30
30,285
35
(b)
Beacon
Roofing
Supply
Inc
6.500%
8/01/30
35,789
130
Berry
Global
Inc
1.570%
1/15/26
123,554
30
(b)
Block
Inc
6.500%
5/15/32
30,486
60
Boeing
Co/The
3.250%
2/01/28
55,948
85
Boeing
Co/The
5.805%
5/01/50
79,208
200
(b)
Brightline
East
LLC
11.000%
1/31/30
181,969
40
Bristol-Myers
Squibb
Co
2.350%
11/13/40
27,340
85
(b)
Broadcom
Inc
4.926%
5/15/37
82,025
45
Burlington
Northern
Santa
Fe
LLC
3.050%
2/15/51
30,928
200
(b)
C&W
Senior
Finance
Ltd
6.875%
9/15/27
195,280
30
(b)
Caesars
Entertainment
Inc
6.500%
2/15/32
30,396
100
Canadian
Pacific
Railway
Co
2.050%
3/05/30
87,334
30
(b)
Cargo
Aircraft
Management
Inc
4.750%
2/01/28
28,207
30
(b)
CCO
Holdings
LLC
/
CCO
Holdings
Capital
Corp
5.125%
5/01/27
29,138
30
(b)
CCO
Holdings
LLC
/
CCO
Holdings
Capital
Corp
4.500%
8/15/30
26,266
30
(b)
CCO
Holdings
LLC
/
CCO
Holdings
Capital
Corp
4.250%
2/01/31
25,526
20
Cenovus
Energy
Inc
5.400%
6/15/47
18,949
30
(b)
Chart
Industries
Inc
7.500%
1/01/30
31,209
95
Charter
Communications
Operating
LLC
/
Charter
Communications
Operating
Capital
5.250%
4/01/53
76,848
30
(b)
CHS/Community
Health
Systems
Inc
5.250%
5/15/30
26,162
55
(b)
Churchill
Downs
Inc
5.750%
4/01/30
53,926
55
(b)
Civitas
Resources
Inc
8.625%
11/01/30
59,406
30
(b)
Clarios
Global
LP
/
Clarios
US
Finance
Co
6.750%
5/15/28
30,550
25
(b)
Cleveland-Cliffs
Inc
7.000%
3/15/32
25,090
100
Comcast
Corp
2.650%
2/01/30
90,487
140
Comcast
Corp
2.887%
11/01/51
89,756
100
Constellation
Brands
Inc
2.875%
5/01/30
90,225
Principal
Amount
(000)
Description
(a)
Coupon
Maturity
Value
INDUSTRIAL
(continued)
$
35
(b)
Coty
Inc/HFC
Prestige
Products
Inc/HFC
Prestige
International
US
LLC
6.625%
7/15/30
$
35,939
30
(b)
CSC
Holdings
LLC
5.500%
4/15/27
25,081
30
(b)
Cushman
&
Wakefield
US
Borrower
LLC
6.750%
5/15/28
30,060
35
CVS
Health
Corp
4.780%
3/25/38
32,149
45
CVS
Health
Corp
5.050%
3/25/48
39,686
40
(b)
DaVita
Inc
4.625%
6/01/30
36,630
45
Diamondback
Energy
Inc
4.400%
3/24/51
37,044
20
(b)
DT
Midstream
Inc
4.125%
6/15/29
18,696
35
Enbridge
Inc
5.750%
7/15/80
33,206
30
Encompass
Health
Corp
4.500%
2/01/28
29,004
75
Energy
Transfer
LP
5.550%
5/15/34
75,673
55
Energy
Transfer
LP
5.950%
5/15/54
54,312
65
Energy
Transfer
LP
6.500%
N/A
(c)
64,576
25
Enterprise
Products
Operating
LLC
5.350%
1/31/33
25,814
100
Enterprise
Products
Operating
LLC
4.450%
2/15/43
88,206
30
(b)
EQM
Midstream
Partners
LP
4.500%
1/15/29
28,746
30
(b)
Ferrellgas
LP
/
Ferrellgas
Finance
Corp
5.875%
4/01/29
27,946
30
(b)
Flutter
Treasury
Designated
Activity
Co
6.375%
4/29/29
30,542
95
Ford
Motor
Credit
Co
LLC
6.950%
3/06/26
97,063
35
Ford
Motor
Credit
Co
LLC
7.350%
3/06/30
37,589
200
(b)
Ford
Otomotiv
Sanayi
AS
7.125%
4/25/29
203,789
55
(b)
Frontier
Communications
Holdings
LLC
5.875%
10/15/27
54,459
30
(b)
Garda
World
Security
Corp
4.625%
2/15/27
28,883
35
(b)
Gen
Digital
Inc
6.750%
9/30/27
35,599
100
General
Motors
Financial
Co
Inc
5.000%
4/09/27
100,168
45
General
Motors
Financial
Co
Inc
3.600%
6/21/30
41,370
80
General
Motors
Financial
Co
Inc
5.700%
N/A
(c)
75,895
20
General
Motors
Financial
Co
Inc
5.750%
N/A
(c)
18,990
30
Genesis
Energy
LP
/
Genesis
Energy
Finance
Corp
8.000%
1/15/27
30,676
30
Goodyear
Tire
&
Rubber
Co/
The
5.000%
7/15/29
28,314
30
Goodyear
Tire
&
Rubber
Co/
The
5.250%
4/30/31
27,975
35
(b)
Group
1
Automotive
Inc
4.000%
8/15/28
32,628
30
(b)
H&E
Equipment
Services
Inc
3.875%
12/15/28
27,412
50
Haleon
US
Capital
LLC
3.625%
3/24/32
45,911
41
(b)
Hawaiian
Brand
Intellectual
Property
Ltd
/
HawaiianMiles
Loyalty
Ltd
11.000%
4/15/29
39,273
105
HCA
Inc
3.500%
9/01/30
96,870
15
HCA
Inc
5.900%
6/01/53
14,928
55
(b)
Hilcorp
Energy
I
LP
/
Hilcorp
Finance
Co
8.375%
11/01/33
59,495
120
(b)
Hilton
Domestic
Operating
Co
Inc
5.875%
4/01/29
120,933
30
(b)
Hilton
Grand
Vacations
Borrower
Escrow
LLC
/
Hilton
Grand
Vacations
Borrower
Esc
6.625%
1/15/32
30,294
Nuveen
Core
Plus
Bond
ETF
(NCPB)
(continued)
Portfolio
of
Investments
July
31,
2024
Principal
Amount
(000)
Description
(a)
Coupon
Maturity
Value
INDUSTRIAL
(continued)
$
30
(b)
Hologic
Inc
3.250%
2/15/29
$
27,351
25
Home
Depot
Inc/The
4.950%
6/25/34
25,245
45
Honeywell
International
Inc
5.250%
3/01/54
44,623
40
(b)
Husky
Injection
Molding
Systems
Ltd
/
Titan
Co-
Borrower
LLC
9.000%
2/15/29
41,079
30
(b)
IHO
Verwaltungs
GmbH,
(cash
4.750%,
PIK
5.500%)
4.750%
9/15/26
29,251
30
(b)
Iliad
Holding
SASU
6.500%
10/15/26
30,062
30
(b)
Imola
Merger
Corp
4.750%
5/15/29
28,236
30
(b)
Iron
Mountain
Inc
7.000%
2/15/29
30,823
30
(b)
Kinetik
Holdings
LP
6.625%
12/15/28
30,591
30
(b)
Kodiak
Gas
Services
LLC
7.250%
2/15/29
30,861
30
Kohl's
Corp
4.625%
5/01/31
24,352
35
L3Harris
Technologies
Inc
5.400%
7/31/33
35,640
30
Lamar
Media
Corp
4.875%
1/15/29
29,123
30
(b)
LCM
Investments
Holdings
II
LLC
8.250%
8/01/31
31,462
50
(b)
Level
3
Financing
Inc
10.500%
5/15/30
51,100
30
(b)
Light
&
Wonder
International
Inc
7.500%
9/01/31
31,305
30
(b)
Live
Nation
Entertainment
Inc
6.500%
5/15/27
30,358
15
Lockheed
Martin
Corp
5.200%
2/15/64
14,735
40
Lowe's
Cos
Inc
4.250%
4/01/52
32,190
45
Marathon
Oil
Corp
5.300%
4/01/29
45,992
65
Marathon
Petroleum
Corp
4.750%
9/15/44
56,864
30
(b)
Marriott
Ownership
Resorts
Inc
4.500%
6/15/29
27,900
35
(b)
Michaels
Cos
Inc/The
5.250%
5/01/28
25,891
55
(b)
Mineral
Resources
Ltd
9.250%
10/01/28
58,490
80
MPLX
LP
1.750%
3/01/26
76,037
60
MPLX
LP
2.650%
8/15/30
52,978
40
MPLX
LP
4.700%
4/15/48
33,914
30
Newell
Brands
Inc
6.375%
9/15/27
29,966
55
Northrop
Grumman
Corp
3.250%
1/15/28
52,606
80
Nutrien
Ltd
4.900%
3/27/28
80,226
20
Occidental
Petroleum
Corp
6.600%
3/15/46
21,301
20
ONEOK
Inc
4.500%
3/15/50
16,362
30
(b)
Open
Text
Holdings
Inc
4.125%
2/15/30
27,363
35
Oracle
Corp
4.900%
2/06/33
34,744
65
Oracle
Corp
5.550%
2/06/53
63,217
45
O'Reilly
Automotive
Inc
4.200%
4/01/30
43,761
30
(b)
Organon
&
Co
/
Organon
Foreign
Debt
Co-Issuer
BV
4.125%
4/30/28
28,186
30
(b)
Organon
&
Co
/
Organon
Foreign
Debt
Co-Issuer
BV
5.125%
4/30/31
27,609
30
Paramount
Global
6.375%
3/30/62
27,544
30
(b)
Parkland
Corp/Canada
4.625%
5/01/30
27,892
30
(b)
Permian
Resources
Operating
LLC
7.000%
1/15/32
31,062
95
Pfizer
Investment
Enterprises
Pte
Ltd
5.300%
5/19/53
93,816
175
Philip
Morris
International
Inc
4.875%
2/13/29
176,038
40
Philip
Morris
International
Inc
5.250%
2/13/34
40,306
45
Phillips
66
Co
5.300%
6/30/33
45,528
30
(b)
Post
Holdings
Inc
6.250%
2/15/32
30,381
30
(b)
Prime
Security
Services
Borrower
LLC
/
Prime
Finance
Inc
6.250%
1/15/28
29,901
30
(b)
Primo
Water
Holdings
Inc
4.375%
4/30/29
27,937
80
Roper
Technologies
Inc
2.000%
6/30/30
68,553
65
RTX
Corp
1.900%
9/01/31
53,622
Principal
Amount
(000)
Description
(a)
Coupon
Maturity
Value
INDUSTRIAL
(continued)
$
75
Salesforce
Inc
2.700%
7/15/41
$
54,072
30
(b)
Sirius
XM
Radio
Inc
4.125%
7/01/30
26,075
35
(b)
Standard
Industries
Inc/NJ
5.000%
2/15/27
34,245
30
(b)
SunCoke
Energy
Inc
4.875%
6/30/29
27,436
30
(b)
Sunoco
LP
7.000%
5/01/29
30,878
30
(b)
Sunrise
FinCo
I
BV
4.875%
7/15/31
27,293
40
Sysco
Corp
6.600%
4/01/50
45,303
30
Tenet
Healthcare
Corp
6.125%
10/01/28
30,075
30
Tenet
Healthcare
Corp
4.375%
1/15/30
28,142
150
Teva
Pharmaceutical
Finance
Netherlands
III
BV
3.150%
10/01/26
142,050
250
T-Mobile
USA
Inc
2.250%
11/15/31
209,587
45
TotalEnergies
Capital
International
SA
2.986%
6/29/41
33,596
25
Transcanada
Trust
5.500%
9/15/79
23,241
30
(b)
TransDigm
Inc
6.875%
12/15/30
30,851
27
(b)
Transocean
Inc
8.750%
2/15/30
28,362
60
(b)
Tronox
Inc
4.625%
3/15/29
54,649
30
(b)
Univision
Communications
Inc
4.500%
5/01/29
26,204
65
USA
Compression
Partners
LP
/
USA
Compression
Finance
Corp
6.875%
9/01/27
65,372
20
(b)
Venture
Global
Calcasieu
Pass
LLC
4.125%
8/15/31
18,181
40
(b)
Venture
Global
LNG
Inc
9.875%
2/01/32
44,403
200
Verizon
Communications
Inc
1.750%
1/20/31
165,437
30
(b)
Vmed
O2
UK
Financing
I
PLC
4.750%
7/15/31
25,756
40
Vodafone
Group
PLC
4.125%
6/04/81
35,207
35
(b)
VZ
Secured
Financing
BV
5.000%
1/15/32
30,670
35
Walmart
Inc
1.050%
9/17/26
32,664
65
Walmart
Inc
1.800%
9/22/31
54,846
25
Walmart
Inc
4.500%
4/15/53
22,860
30
(b)
Wand
NewCo
3
Inc
7.625%
1/30/32
31,313
75
Warnermedia
Holdings
Inc
5.050%
3/15/42
59,166
30
(b)
WESCO
Distribution
Inc
7.250%
6/15/28
30,742
35
Williams
Cos
Inc/The
5.650%
3/15/33
36,147
30
(b)
Windsor
Holdings
III
LLC
8.500%
6/15/30
31,575
30
(b)
XPO
Inc
6.250%
6/01/28
30,327
30
ZF
North
America
Capital
Inc
6.750%
4/23/30
30,560
TOTAL
INDUSTRIAL
8,845,620
UTILITY
-
3.1%
105
AEP
Transmission
Co
LLC
5.400%
3/15/53
103,830
105
Ameren
Illinois
Co
4.950%
6/01/33
105,088
100
American
Water
Capital
Corp
2.300%
6/01/31
85,100
40
Atmos
Energy
Corp
6.200%
11/15/53
44,182
30
(b)
Clearway
Energy
Operating
LLC
4.750%
3/15/28
28,798
25
CMS
Energy
Corp
4.750%
6/01/50
23,070
35
Consolidated
Edison
Co
of
New
York
Inc
5.700%
5/15/54
35,913
45
Dominion
Energy
Inc
3.300%
4/15/41
33,629
35
Dominion
Energy
Inc
7.000%
6/01/54
36,757
25
DTE
Electric
Co
5.400%
4/01/53
24,890
45
Duke
Energy
Carolinas
LLC
4.250%
12/15/41
38,914
75
Exelon
Corp
4.050%
4/15/30
72,183
100
Florida
Power
&
Light
Co
4.800%
5/15/33
99,833
170
Georgia
Power
Co
2.650%
9/15/29
154,680
40
Interstate
Power
and
Light
Co
3.100%
11/30/51
26,184
Nuveen
Core
Plus
Bond
ETF
(NCPB)
(continued)
Portfolio
of
Investments
July
31,
2024
Principal
Amount
(000)
Description
(a)
Coupon
Maturity
Value
UTILITY
(continued)
$
55
NextEra
Energy
Capital
Holdings
Inc
6.750%
6/15/54
$
57,171
60
NiSource
Inc
1.700%
2/15/31
49,036
30
NRG
Energy
Inc
5.750%
1/15/28
29,814
30
(b)
Pattern
Energy
Operations
LP
/
Pattern
Energy
Operations
Inc
4.500%
8/15/28
28,310
45
PECO
Energy
Co
2.800%
6/15/50
28,890
45
Public
Service
Co
of
Colorado
4.050%
9/15/49
35,189
45
Sempra
4.875%
N/A
(c)
44,081
30
(b)
Talen
Energy
Supply
LLC
8.625%
6/01/30
32,329
30
(b)
TerraForm
Power
Operating
LLC
4.750%
1/15/30
27,854
TOTAL
UTILITY
1,245,725
TOTAL
CORPORATE
DEBT
(cost
$15,022,931)
15,161,808
Principal
Amount
(000)
Description
(a)
Coupon
Maturity
Value
X
–
U.S.
TREASURY
-
19.3%
$
1,000
United
States
Treasury
Note/Bond
4.250%
5/31/25
994,891
40
United
States
Treasury
Note/Bond
4.625%
2/28/26
40,103
41
United
States
Treasury
Note/Bond
4.000%
7/31/29
41,141
1,550
United
States
Treasury
Note/Bond
4.375%
5/15/34
1,589,719
3,275
United
States
Treasury
Note/Bond
4.625%
5/15/44
3,363,527
1,720
United
States
Treasury
Note/Bond
4.250%
2/15/54
1,691,512
100
United
States
Treasury
Note/Bond
4.625%
5/15/54
104,719
TOTAL
U.S.
TREASURY
(cost
$7,615,876)
7,825,612
Principal
Amount
(000)
Description
(a)
Coupon
Maturity
Value
X
–
GOVERNMENT
RELATED
-
4.2%
GOVERNMENT
AGENCY
-
2.2%
$
200
(b)
Corp
Nacional
del
Cobre
de
Chile
6.150%
10/24/36
204,962
200
Indian
Railway
Finance
Corp
Ltd
3.835%
12/13/27
192,644
25
(b)
NOVA
Chemicals
Corp
5.250%
6/01/27
24,398
200
(b)
Perusahaan
Perseroan
Persero
PT
Perusahaan
Listrik
Negara
5.450%
5/21/28
201,557
150
Petrobras
Global
Finance
BV
5.500%
6/10/51
122,620
200
Petroleos
Mexicanos
6.700%
2/16/32
170,520
TOTAL
GOVERNMENT
AGENCY
916,701
SOVEREIGN
DEBT
-
2.0%
225
Angolan
Government
International
Bond
8.750%
4/14/32
200,999
275
Colombia
Government
International
Bond
5.000%
6/15/45
195,959
250
(b)
Hungary
Government
International
Bond
2.125%
9/22/31
201,556
For
Fund
portfolio
compliance
purposes,
the
Fund’s
industry
classifications
refer
to
any
one
or
more
of
the
industry
sub-classifications
used
by
one
or
more
widely
recognized
market
indexes
or
ratings
group
indexes,
and/or
as
defined
by
Fund
management.
This
definition
may
not
apply
for
purpos-
es
of
this
report,
which
may
combine
industry
sub-classifications
into
sectors
for
reporting
ease.
Principal
Amount
(000)
Description
(a)
Coupon
Maturity
Value
SOVEREIGN
DEBT
(continued)
$
225
Republic
of
South
Africa
Government
International
Bond
6.250%
3/08/41
$
197,236
TOTAL
SOVEREIGN
DEBT
795,750
TOTAL
GOVERNMENT
RELATED
(cost
$1,691,166)
1,712,451
TOTAL
LONG-TERM
INVESTMENTS
(cost
$39,379,564)
39,946,840
OTHER
ASSETS
&
LIABILITIES,
NET
-
1.5%
611,565
NET
ASSETS
-
100%
$
40,558,405
(a)
All
percentages
shown
in
the
Portfolio
of
Investments
are
based
on
net
assets.
(b)
Security
is
exempt
from
registration
under
Rule
144A
of
the
Securities
Act
of
1933,
as
amended.
These
securities
are
deemed
liquid
and
may
be
resold
in
transactions
exempt
from
registration,
which
are
normally
those
transactions
with
qualified
institutional
buyers.
As
of
the
end
of
the
reporting
period,
the
aggregate
value
of
these
securities
is
$10,476,183
or
26.2%
of
Total
Investments.
(c)
Perpetual
security.
Maturity
date
is
not
applicable.
PIK
Payment-in-kind
(“PIK”)
security. Depending
on
the
terms
of
the
security,
income
may
be
received
in
the
form
of
cash,
securities,
or
a
combination
of
both. The
PIK
rate
shown,
where
applicable,
represents
the
annualized
rate
of
the
last
PIK
payment
made
by
the
issuer
as
of
the
end
of
the
reporting
period.
Nuveen
Enhanced
Yield
U.S.
Aggregate
Bond
ETF
(NUAG)
Portfolio
of
Investments
July
31,
2024
Principal
Amount
(000)
Description
(a)
Coupon
Maturity
Value
LONG-TERM
INVESTMENTS
-
98.6%
X
–
CORPORATE
DEBT
-
42.4%
FINANCIALS
-
15.9%
$
18
AerCap
Ireland
Capital
DAC
/
AerCap
Global
Aviation
Trust
1.750%
1/30/26
$
17,127
18
AerCap
Ireland
Capital
DAC
/
AerCap
Global
Aviation
Trust
2.450%
10/29/26
17,004
5
AerCap
Ireland
Capital
DAC
/
AerCap
Global
Aviation
Trust
4.625%
10/15/27
4,940
1
AerCap
Ireland
Capital
DAC
/
AerCap
Global
Aviation
Trust
3.000%
10/29/28
925
50
AerCap
Ireland
Capital
DAC
/
AerCap
Global
Aviation
Trust
6.150%
9/30/30
52,815
38
AerCap
Ireland
Capital
DAC
/
AerCap
Global
Aviation
Trust
3.300%
1/30/32
33,451
4
Aetna
Inc
4.500%
5/15/42
3,426
10
Aetna
Inc
4.750%
3/15/44
8,664
12
Affiliated
Managers
Group
Inc
3.500%
8/01/25
11,787
10
Affiliated
Managers
Group
Inc
3.300%
6/15/30
9,133
21
Air
Lease
Corp
1.875%
8/15/26
19,725
7
Air
Lease
Corp
2.200%
1/15/27
6,562
8
Air
Lease
Corp
3.625%
4/01/27
7,678
22
Air
Lease
Corp
3.250%
10/01/29
20,309
10
Air
Lease
Corp
3.000%
2/01/30
9,065
23
Alexandria
Real
Estate
Equities
Inc
3.550%
3/15/52
15,922
50
Allstate
Corp/The
5.250%
3/30/33
51,004
20
Ally
Financial
Inc
7.100%
11/15/27
21,103
28
Ally
Financial
Inc
2.200%
11/02/28
24,813
11
Ally
Financial
Inc
8.000%
11/01/31
12,378
30
American
Express
Co
5.098%
2/16/28
30,159
50
American
International
Group
Inc
4.750%
4/01/48
45,506
9
Aon
Corp
2.800%
5/15/30
8,096
1
Aon
Corp
/
Aon
Global
Holdings
PLC
2.600%
12/02/31
853
100
Aon
Corp
/
Aon
Global
Holdings
PLC
5.350%
2/28/33
101,746
5
Ares
Capital
Corp
3.875%
1/15/26
4,873
40
Ares
Capital
Corp
7.000%
1/15/27
41,281
40
Arthur
J
Gallagher
&
Co
6.750%
2/15/54
45,240
7
Assurant
Inc
3.700%
2/22/30
6,493
10
Assurant
Inc
2.650%
1/15/32
8,379
1
Athene
Holding
Ltd
6.150%
4/03/30
1,055
30
Athene
Holding
Ltd
6.250%
4/01/54
30,601
7
AXIS
Specialty
Finance
PLC
4.000%
12/06/27
6,785
64
Banco
Santander
SA
2.749%
12/03/30
54,986
44
Bank
of
America
Corp
4.948%
7/22/28
44,120
170
Bank
of
America
Corp
5.015%
7/22/33
169,864
100
Bank
of
America
Corp
5.872%
9/15/34
104,944
10
Bank
of
Montreal
5.920%
9/25/25
10,100
40
Bank
of
New
York
Mellon
Corp/
The
4.947%
4/26/27
40,080
57
Bank
of
Nova
Scotia/The
3.625%
10/27/81
49,295
11
BankUnited
Inc
5.125%
6/11/30
10,316
3
Barclays
PLC
5.200%
5/12/26
2,994
70
Barclays
PLC
5.501%
8/09/28
70,776
Principal
Amount
(000)
Description
(a)
Coupon
Maturity
Value
FINANCIALS
(continued)
$
3
Barclays
PLC
5.088%
6/20/30
$
2,935
4
Barclays
PLC
2.667%
3/10/32
3,414
14
Barclays
PLC
2.894%
11/24/32
11,925
24
Barclays
PLC
3.811%
3/10/42
19,024
14
Blackstone
Private
Credit
Fund
2.625%
12/15/26
12,997
20
(b)
Blackstone
Private
Credit
Fund
4.000%
1/15/29
18,664
16
Blackstone
Secured
Lending
Fund
2.125%
2/15/27
14,667
18
Blue
Owl
Capital
Corp
4.250%
1/15/26
17,650
1
Blue
Owl
Capital
Corp
2.625%
1/15/27
928
14
Blue
Owl
Credit
Income
Corp
4.700%
2/08/27
13,554
14
Brighthouse
Financial
Inc
5.625%
5/15/30
14,350
34
Brown
&
Brown
Inc
2.375%
3/15/31
28,599
40
(b)
Canadian
Imperial
Bank
of
Commerce
5.001%
4/28/28
40,349
6
Capital
One
Financial
Corp
1.878%
11/02/27
5,581
44
Capital
One
Financial
Corp
3.800%
1/31/28
42,437
21
Capital
One
Financial
Corp
4.927%
5/10/28
20,935
7
Capital
One
Financial
Corp
3.273%
3/01/30
6,447
46
Capital
One
Financial
Corp
2.359%
7/29/32
36,593
1
Capital
One
Financial
Corp
5.268%
5/10/33
986
45
Charles
Schwab
Corp/The
5.643%
5/19/29
46,104
36
CI
Financial
Corp
3.200%
12/17/30
29,027
20
Citigroup
Inc
4.450%
9/29/27
19,745
11
Citigroup
Inc
3.070%
2/24/28
10,514
10
Citigroup
Inc
4.658%
5/24/28
9,951
50
Citigroup
Inc
4.412%
3/31/31
48,598
60
Citigroup
Inc
4.910%
5/24/33
58,938
150
Citigroup
Inc
5.827%
2/13/35
152,039
42
Citizens
Financial
Group
Inc
2.500%
2/06/30
36,407
8
CNA
Financial
Corp
3.900%
5/01/29
7,712
8
CNO
Financial
Group
Inc
5.250%
5/30/29
7,874
10
CNO
Financial
Group
Inc
6.450%
6/15/34
10,238
20
Cooperatieve
Rabobank
UA
3.750%
7/21/26
19,479
46
Corebridge
Financial
Inc
3.850%
4/05/29
43,877
10
Deutsche
Bank
AG/New
York
NY
4.100%
1/13/26
9,847
4
Deutsche
Bank
AG/New
York
NY
2.129%
11/24/26
3,832
4
Deutsche
Bank
AG/New
York
NY
2.311%
11/16/27
3,739
1
Deutsche
Bank
AG/New
York
NY
3.547%
9/18/31
903
80
Deutsche
Bank
AG/New
York
NY
7.079%
2/10/34
83,342
7
Discover
Financial
Services
4.500%
1/30/26
6,920
8
Discover
Financial
Services
4.100%
2/09/27
7,796
40
Discover
Financial
Services
7.964%
11/02/34
46,077
30
Elevance
Health
Inc
5.650%
6/15/54
30,312
10
Enact
Holdings
Inc
6.250%
5/28/29
10,180
13
Enstar
Group
Ltd
3.100%
9/01/31
10,718
43
Equitable
Holdings
Inc
4.350%
4/20/28
42,216
24
Fairfax
Financial
Holdings
Ltd
4.625%
4/29/30
23,446
50
(c)
Fairfax
Financial
Holdings
Ltd
6.100%
3/15/55
49,962
31
Fidelity
National
Financial
Inc
3.400%
6/15/30
28,091
2
Fifth
Third
Bancorp
1.707%
11/01/27
1,859
3
Fifth
Third
Bancorp
3.950%
3/14/28
2,911
40
Fifth
Third
Bancorp
6.361%
10/27/28
41,436
11
First
American
Financial
Corp
2.400%
8/15/31
8,963
11
FS
KKR
Capital
Corp
3.250%
7/15/27
10,196
16
GATX
Corp
4.550%
11/07/28
15,874
Nuveen
Enhanced
Yield
U.S.
Aggregate
Bond
ETF
(NUAG)
(continued)
Portfolio
of
Investments
July
31,
2024
Principal
Amount
(000)
Description
(a)
Coupon
Maturity
Value
FINANCIALS
(continued)
$
30
GATX
Corp
6.050%
3/15/34
$
31,457
10
Globe
Life
Inc
4.550%
9/15/28
9,721
10
(b)
Goldman
Sachs
BDC
Inc
2.875%
1/15/26
9,658
6
Goldman
Sachs
Group
Inc/The
1.948%
10/21/27
5,615
80
Goldman
Sachs
Group
Inc/The
4.482%
8/23/28
79,043
54
Goldman
Sachs
Group
Inc/The
2.615%
4/22/32
46,389
66
Goldman
Sachs
Group
Inc/The
2.383%
7/21/32
55,498
81
Goldman
Sachs
Group
Inc/The
6.450%
5/01/36
88,837
23
Golub
Capital
BDC
Inc
2.050%
2/15/27
20,964
12
Hartford
Financial
Services
Group
Inc/The
2.800%
8/19/29
10,938
20
Hartford
Financial
Services
Group
Inc/The
2.900%
9/15/51
12,968
10
Hercules
Capital
Inc
3.375%
1/20/27
9,397
190
HSBC
Holdings
PLC
6.547%
6/20/34
200,802
96
HSBC
Holdings
PLC
6.800%
6/01/38
104,955
12
Huntington
Bancshares
Inc/OH
2.550%
2/04/30
10,550
50
ING
Groep
NV
4.050%
4/09/29
48,338
8
Jackson
Financial
Inc
5.170%
6/08/27
8,057
2
Janus
Henderson
US
Holdings
Inc
4.875%
8/01/25
1,989
9
Jefferies
Financial
Group
Inc
4.150%
1/23/30
8,571
40
Jefferies
Financial
Group
Inc
2.750%
10/15/32
32,942
6
JPMorgan
Chase
&
Co
1.470%
9/22/27
5,585
20
JPMorgan
Chase
&
Co
6.070%
10/22/27
20,519
50
JPMorgan
Chase
&
Co
4.979%
7/22/28
50,258
10
JPMorgan
Chase
&
Co
2.069%
6/01/29
9,050
4
JPMorgan
Chase
&
Co
3.702%
5/06/30
3,807
6
JPMorgan
Chase
&
Co
2.545%
11/08/32
5,113
12
JPMorgan
Chase
&
Co
4.912%
7/25/33
11,888
220
JPMorgan
Chase
&
Co
5.717%
9/14/33
227,861
12
(b)
Kemper
Corp
3.800%
2/23/32
10,506
10
KeyBank
NA/Cleveland
OH
6.950%
2/01/28
10,419
57
KeyCorp
2.550%
10/01/29
49,865
22
Kimco
Realty
OP
LLC
4.250%
4/01/45
18,034
21
Lazard
Group
LLC
4.500%
9/19/28
20,614
16
(b)
Lincoln
National
Corp
3.625%
12/12/26
15,534
63
Lloyds
Banking
Group
PLC
4.716%
8/11/26
62,608
21
Main
Street
Capital
Corp
3.000%
7/14/26
19,861
20
Manufacturers
&
Traders
Trust
Co
4.650%
1/27/26
19,815
9
Manulife
Financial
Corp
4.061%
2/24/32
8,745
12
Markel
Group
Inc
3.350%
9/17/29
11,246
50
Markel
Group
Inc
6.000%
5/16/54
50,696
50
MetLife
Inc
5.375%
7/15/33
51,553
20
Mitsubishi
UFJ
Financial
Group
Inc
5.017%
7/20/28
20,144
60
Mitsubishi
UFJ
Financial
Group
Inc
2.559%
2/25/30
53,518
50
(b)
Mizuho
Financial
Group
Inc
5.739%
5/27/31
51,809
13
Morgan
Stanley
4.350%
9/08/26
12,843
2
Morgan
Stanley
3.950%
4/23/27
1,951
110
Morgan
Stanley
3.622%
4/01/31
103,104
1
Morgan
Stanley
4.889%
7/20/33
985
100
Morgan
Stanley
5.424%
7/21/34
101,503
50
Morgan
Stanley
6.627%
11/01/34
55,124
1
Morgan
Stanley
2.484%
9/16/36
811
60
Nasdaq
Inc
5.550%
2/15/34
61,617
47
NatWest
Group
PLC
5.076%
1/27/30
47,057
11
NNN
REIT
Inc
3.000%
4/15/52
6,987
63
Nomura
Holdings
Inc
5.386%
7/06/27
63,824
Principal
Amount
(000)
Description
(a)
Coupon
Maturity
Value
FINANCIALS
(continued)
$
4
Nomura
Holdings
Inc
2.710%
1/22/29
$
3,636
12
Nomura
Holdings
Inc
3.103%
1/16/30
10,834
1
Nomura
Holdings
Inc
2.679%
7/16/30
871
10
Oaktree
Specialty
Lending
Corp
2.700%
1/15/27
9,223
50
(b),(c)
Oaktree
Strategic
Credit
Fund
6.500%
7/23/29
50,219
7
Old
Republic
International
Corp
3.875%
8/26/26
6,837
10
ORIX
Corp
4.000%
4/13/32
9,398
60
PNC
Financial
Services
Group
Inc/The
6.875%
10/20/34
66,775
13
(b)
Prospect
Capital
Corp
3.437%
10/15/28
11,381
7
Prudential
Financial
Inc
5.700%
9/15/48
6,892
51
Prudential
Financial
Inc
3.700%
10/01/50
44,939
7
Regency
Centers
LP
4.400%
2/01/47
5,860
24
Regions
Financial
Corp
1.800%
8/12/28
21,181
10
Reinsurance
Group
of
America
Inc
3.950%
9/15/26
9,807
10
Reinsurance
Group
of
America
Inc
3.150%
6/15/30
9,114
30
Royal
Bank
of
Canada
5.200%
8/01/28
30,684
7
Santander
Holdings
USA
Inc
3.244%
10/05/26
6,711
40
Santander
Holdings
USA
Inc
4.400%
7/13/27
39,200
1
Santander
Holdings
USA
Inc
2.490%
1/06/28
932
32
Santander
UK
Group
Holdings
PLC
1.532%
8/21/26
30,708
30
State
Street
Corp
5.159%
5/18/34
30,391
12
Stifel
Financial
Corp
4.000%
5/15/30
11,311
60
Sumitomo
Mitsui
Financial
Group
Inc
5.520%
1/13/28
61,411
50
Synchrony
Financial
5.935%
8/02/30
50,308
50
Toronto-Dominion
Bank/The
5.156%
1/10/28
50,712
10
Truist
Bank
3.800%
10/30/26
9,713
60
Truist
Financial
Corp
7.161%
10/30/29
64,629
17
Unum
Group
3.875%
11/05/25
16,708
50
Unum
Group
6.000%
6/15/54
49,327
80
US
Bancorp
5.775%
6/12/29
82,388
10
Wachovia
Corp
7.574%
8/01/26
10,479
1
Wells
Fargo
&
Co
3.526%
3/24/28
965
40
Wells
Fargo
&
Co
4.808%
7/25/28
39,897
50
Wells
Fargo
&
Co
5.389%
4/24/34
50,582
210
Wells
Fargo
&
Co
5.557%
7/25/34
214,703
37
Westpac
Banking
Corp
2.668%
11/15/35
31,438
14
Willis
North
America
Inc
4.500%
9/15/28
13,780
TOTAL
FINANCIALS
5,713,018
INDUSTRIAL
-
8.4%
34
Altria
Group
Inc
5.800%
2/14/39
34,982
5
American
Airlines
2016-2
Class
AA
Pass
Through
Trust2020
A
3.200%
6/15/28
4,294
88
Amgen
Inc
3.150%
2/21/40
67,492
6
Amgen
Inc
5.150%
11/15/41
5,763
1
Amgen
Inc
3.000%
1/15/52
675
11
Amgen
Inc
4.200%
2/22/52
8,913
13
Aptiv
PLC
3.100%
12/01/51
8,100
67
AT&T
Inc
4.850%
3/01/39
63,267
80
AT&T
Inc
3.500%
6/01/41
62,947
40
AT&T
Inc
3.500%
2/01/61
27,053
11
Barrick
North
America
Finance
LLC
5.700%
5/30/41
11,211
Nuveen
Enhanced
Yield
U.S.
Aggregate
Bond
ETF
(NUAG)
(continued)
Portfolio
of
Investments
July
31,
2024
Principal
Amount
(000)
Description
(a)
Coupon
Maturity
Value
INDUSTRIAL
(continued)
$
30
BAT
Capital
Corp
7.079%
8/02/43
$
32,839
13
Becton
Dickinson
&
Co
4.685%
12/15/44
11,766
22
Bell
Telephone
Co
of
Canada
or
Bell
Canada
3.650%
8/15/52
16,423
24
Biogen
Inc
5.200%
9/15/45
22,592
65
Boeing
Co/The
5.705%
5/01/40
61,955
10
Boeing
Co/The
3.825%
3/01/59
6,575
8
BorgWarner
Inc
4.375%
3/15/45
6,645
7
Boston
Scientific
Corp
4.550%
3/01/39
6,712
54
(c)
Broadcom
Inc
3.187%
11/15/36
44,044
5
Canadian
Natural
Resources
Ltd
5.850%
2/01/35
5,102
2
Canadian
Natural
Resources
Ltd
6.750%
2/01/39
2,186
24
Canadian
Pacific
Railway
Co
4.700%
5/01/48
21,238
10
Cardinal
Health
Inc
4.500%
11/15/44
8,545
16
Carrier
Global
Corp
3.577%
4/05/50
12,061
5
Cenovus
Energy
Inc
5.250%
6/15/37
4,881
10
CF
Industries
Inc
5.375%
3/15/44
9,450
1
Charter
Communications
Operating
LLC
/
Charter
Communications
Operating
Capital
3.500%
3/01/42
685
74
Charter
Communications
Operating
LLC
/
Charter
Communications
Operating
Capital
5.375%
5/01/47
61,256
21
Charter
Communications
Operating
LLC
/
Charter
Communications
Operating
Capital
5.250%
4/01/53
16,988
33
Cigna
Group/The
4.900%
12/15/48
29,653
11
Conagra
Brands
Inc
5.300%
11/01/38
10,714
10
Constellation
Brands
Inc
5.250%
11/15/48
9,516
10
Corning
Inc
3.900%
11/15/49
7,787
10
Crown
Castle
Inc
4.750%
5/15/47
8,758
49
CVS
Health
Corp
4.875%
7/20/35
46,876
18
CVS
Health
Corp
4.780%
3/25/38
16,534
20
CVS
Health
Corp
6.000%
6/01/63
19,746
10
Dell
International
LLC
/
EMC
Corp
8.350%
7/15/46
12,996
19
Devon
Energy
Corp
5.600%
7/15/41
18,232
26
Diamondback
Energy
Inc
4.250%
3/15/52
20,720
40
Discovery
Communications
LLC
5.300%
5/15/49
31,045
7
Dollar
General
Corp
4.125%
4/03/50
5,437
11
Dollar
Tree
Inc
3.375%
12/01/51
7,289
22
Dow
Chemical
Co/The
4.250%
10/01/34
20,578
8
Dow
Chemical
Co/The
5.250%
11/15/41
7,608
15
DuPont
de
Nemours
Inc
5.319%
11/15/38
15,888
26
Eastman
Chemical
Co
4.800%
9/01/42
23,301
22
Energy
Transfer
LP
5.800%
6/15/38
22,360
22
Energy
Transfer
LP
5.000%
5/15/44
19,508
17
Equifax
Inc
2.600%
12/15/25
16,422
22
Equifax
Inc
2.350%
9/15/31
18,557
20
FactSet
Research
Systems
Inc
3.450%
3/01/32
17,798
14
FedEx
Corp
4.050%
2/15/48
11,115
41
Fidelity
National
Information
Services
Inc
1.650%
3/01/28
36,817
37
Fiserv
Inc
2.250%
6/01/27
34,604
50
Fiserv
Inc
5.625%
8/21/33
51,768
10
Freeport-McMoRan
Inc
5.400%
11/14/34
9,977
Principal
Amount
(000)
Description
(a)
Coupon
Maturity
Value
INDUSTRIAL
(continued)
$
11
General
Electric
Co
4.350%
5/01/50
$
9,613
12
General
Mills
Inc
4.550%
4/17/38
11,006
32
General
Motors
Co
6.600%
4/01/36
34,207
17
Gilead
Sciences
Inc
4.000%
9/01/36
15,376
9
Gilead
Sciences
Inc
4.750%
3/01/46
8,214
20
Gilead
Sciences
Inc
5.550%
10/15/53
20,439
6
Global
Payments
Inc
4.950%
8/15/27
6,013
6
Global
Payments
Inc
4.450%
6/01/28
5,885
15
Global
Payments
Inc
2.900%
5/15/30
13,350
41
Global
Payments
Inc
2.900%
11/15/31
35,183
9
Halliburton
Co
4.500%
11/15/41
7,943
18
Halliburton
Co
4.750%
8/01/43
16,210
10
HCA
Inc
4.375%
3/15/42
8,437
10
HCA
Inc
3.500%
7/15/51
6,866
20
HCA
Inc
6.000%
4/01/54
20,151
14
Hewlett
Packard
Enterprise
Co
6.200%
10/15/35
15,060
18
International
Paper
Co
4.800%
6/15/44
16,041
10
International
Paper
Co
5.150%
5/15/46
9,288
7
International
Paper
Co
4.400%
8/15/47
5,840
16
J
M
Smucker
Co/The
4.250%
3/15/35
14,772
20
JBS
USA
Holding
Lux
Sarl/
JBS
USA
Food
Co/
JBS
Lux
Co
Sarl
6.500%
12/01/52
20,191
10
Johnson
Controls
International
plc
5.125%
9/14/45
9,316
12
Johnson
Controls
International
plc
4.950%
7/02/64
10,659
13
Keurig
Dr
Pepper
Inc
4.500%
4/15/52
11,095
41
Kinder
Morgan
Energy
Partners
LP
6.375%
3/01/41
42,930
11
Kinder
Morgan
Inc
3.600%
2/15/51
7,715
24
Kraft
Heinz
Foods
Co
5.500%
6/01/50
23,468
24
Kroger
Co/The
5.400%
1/15/49
23,231
10
L3Harris
Technologies
Inc
5.054%
4/27/45
9,454
2
Leggett
&
Platt
Inc
3.500%
11/15/51
1,338
9
Lowe's
Cos
Inc
4.050%
5/03/47
7,162
41
Lowe's
Cos
Inc
4.250%
4/01/52
32,994
19
LYB
International
Finance
BV
5.250%
7/15/43
17,678
21
Marathon
Petroleum
Corp
6.500%
3/01/41
22,437
5
Marriott
International
Inc/MD
4.500%
10/01/34
4,674
1
Martin
Marietta
Materials
Inc
3.200%
7/15/51
687
30
Mastercard
Inc
4.875%
3/09/28
30,591
45
McDonald's
Corp
4.700%
12/09/35
44,065
13
(b)
MDC
Holdings
Inc
3.966%
8/06/61
11,172
8
Molson
Coors
Beverage
Co
4.200%
7/15/46
6,593
7
Moody's
Corp
3.250%
1/15/28
6,713
35
Moody's
Corp
2.000%
8/19/31
29,227
42
MPLX
LP
4.500%
4/15/38
37,891
41
National
Fuel
Gas
Co
5.500%
1/15/26
41,127
20
Newmont
Corp
5.875%
4/01/35
21,301
11
Norfolk
Southern
Corp
4.800%
8/15/43
9,932
28
Norfolk
Southern
Corp
3.700%
3/15/53
20,826
30
Northrop
Grumman
Corp
5.200%
6/01/54
28,862
12
Nutrien
Ltd
5.625%
12/01/40
11,904
21
(b)
NXP
BV
/
NXP
Funding
LLC
/
NXP
USA
Inc
3.250%
11/30/51
14,181
20
Occidental
Petroleum
Corp
4.400%
4/15/46
16,157
13
ONEOK
Inc
5.150%
10/15/43
12,063
19
ONEOK
Partners
LP
6.125%
2/01/41
19,396
57
Oracle
Corp
3.800%
11/15/37
48,325
96
Oracle
Corp
3.650%
3/25/41
75,436
24
Orange
SA
5.375%
1/13/42
23,649
Nuveen
Enhanced
Yield
U.S.
Aggregate
Bond
ETF
(NUAG)
(continued)
Portfolio
of
Investments
July
31,
2024
Principal
Amount
(000)
Description
(a)
Coupon
Maturity
Value
INDUSTRIAL
(continued)
$
4
Owens
Corning
4.300%
7/15/47
$
3,304
3
Packaging
Corp
of
America
3.050%
10/01/51
2,030
24
Paramount
Global
4.900%
8/15/44
17,469
14
Parker-Hannifin
Corp
4.450%
11/21/44
12,274
6
Phillips
66
4.650%
11/15/34
5,733
5
Phillips
66
5.875%
5/01/42
5,159
16
Phillips
66
3.300%
3/15/52
10,732
10
(b)
Republic
Services
Inc
5.200%
11/15/34
10,209
33
Rogers
Communications
Inc
5.000%
3/15/44
30,243
14
RPM
International
Inc
4.250%
1/15/48
11,908
10
RTX
Corp
4.450%
11/16/38
9,153
40
RTX
Corp
6.400%
3/15/54
44,941
10
Sherwin-Williams
Co/The
4.000%
12/15/42
8,270
7
Southern
Copper
Corp
5.250%
11/08/42
6,613
40
Spectra
Energy
Partners
LP
4.500%
3/15/45
33,584
10
Stanley
Black
&
Decker
Inc
4.850%
11/15/48
8,766
31
Starbucks
Corp
3.350%
3/12/50
21,535
16
Stryker
Corp
4.100%
4/01/43
13,583
24
Suncor
Energy
Inc
4.000%
11/15/47
18,581
15
Sysco
Corp
3.150%
12/14/51
10,022
20
Takeda
Pharmaceutical
Co
Ltd
3.175%
7/09/50
13,590
30
Telefonica
Emisiones
SA
5.213%
3/08/47
27,420
9
TELUS
Corp
4.300%
6/15/49
7,314
20
Thomson
Reuters
Corp
3.350%
5/15/26
19,460
28
Time
Warner
Cable
LLC
5.500%
9/01/41
24,022
65
T-Mobile
USA
Inc
3.400%
10/15/52
45,574
20
T-Mobile
USA
Inc
6.000%
6/15/54
21,152
4
Trane
Technologies
Global
Holding
Co
Ltd
5.750%
6/15/43
4,192
19
TransCanada
PipeLines
Ltd
5.100%
3/15/49
17,730
36
Transcontinental
Gas
Pipe
Line
Co
LLC
3.950%
5/15/50
27,863
4
Triton
Container
International
Ltd
/
TAL
International
Container
Corp
3.250%
3/15/32
3,400
11
Tyson
Foods
Inc
5.100%
9/28/48
9,875
15
United
Airlines
2014-1
Class
A
Pass
Through
Trust2020
A
4.000%
4/11/26
14,884
33
Valero
Energy
Corp
3.650%
12/01/51
23,497
2
Verizon
Communications
Inc
3.400%
3/22/41
1,568
7
Verizon
Communications
Inc
2.850%
9/03/41
5,038
80
(b)
Verizon
Communications
Inc
4.862%
8/21/46
74,685
16
Verizon
Communications
Inc
4.000%
3/22/50
12,799
16
Verizon
Communications
Inc
3.875%
3/01/52
12,504
36
Viatris
Inc
3.850%
6/22/40
27,155
27
Vodafone
Group
PLC
4.875%
6/19/49
24,083
22
Warnermedia
Holdings
Inc
5.050%
3/15/42
17,355
11
Western
Union
Co/The
1.350%
3/15/26
10,361
23
Westlake
Corp
3.125%
8/15/51
14,907
10
Whirlpool
Corp
5.150%
3/01/43
8,950
2
Zimmer
Biomet
Holdings
Inc
4.250%
8/15/35
1,811
6
Zimmer
Biomet
Holdings
Inc
5.750%
11/30/39
6,185
11
Zoetis
Inc
4.700%
2/01/43
10,045
TOTAL
INDUSTRIAL
3,004,106
UTILITY
-
18.1%
65
AEP
Texas
Inc
3.800%
10/01/47
48,434
100
AEP
Texas
Inc
5.250%
5/15/52
92,863
50
AEP
Transmission
Co
LLC
5.400%
3/15/53
49,443
9
Ameren
Corp
1.950%
3/15/27
8,375
Principal
Amount
(000)
Description
(a)
Coupon
Maturity
Value
UTILITY
(continued)
$
8
Ameren
Corp
1.750%
3/15/28
$
7,202
4
American
Electric
Power
Co
Inc
4.300%
12/01/28
3,914
4
American
Electric
Power
Co
Inc
3.875%
2/15/62
3,723
60
American
Water
Capital
Corp
4.150%
6/01/49
49,561
10
American
Water
Capital
Corp
3.250%
6/01/51
6,974
50
Arizona
Public
Service
Co
5.700%
8/15/34
51,325
50
Arizona
Public
Service
Co
2.650%
9/15/50
30,131
40
Atmos
Energy
Corp
6.200%
11/15/53
44,182
30
Avangrid
Inc
3.200%
4/15/25
29,520
4
Black
Hills
Corp
3.150%
1/15/27
3,837
10
Black
Hills
Corp
4.200%
9/15/46
8,219
61
Black
Hills
Corp
3.875%
10/15/49
45,986
100
(b)
CenterPoint
Energy
Inc
5.400%
6/01/29
102,018
18
Cleco
Corporate
Holdings
LLC
4.973%
5/01/46
15,483
11
CMS
Energy
Corp
4.875%
3/01/44
10,192
100
CMS
Energy
Corp
3.750%
12/01/50
83,937
120
Consolidated
Edison
Co
of
New
York
Inc
5.900%
11/15/53
126,472
101
Constellation
Energy
Generation
LLC
5.600%
6/15/42
99,704
10
Consumers
Energy
Co
4.350%
8/31/64
7,956
70
Dayton
Power
&
Light
Co/The
3.950%
6/15/49
52,550
13
Delmarva
Power
&
Light
Co
4.000%
6/01/42
10,457
6
Dominion
Energy
Inc
3.600%
3/15/27
5,830
110
Dominion
Energy
Inc
3.375%
4/01/30
101,392
20
Dominion
Energy
Inc
2.250%
8/15/31
16,783
7
Dominion
Energy
Inc
4.900%
8/01/41
6,349
43
Dominion
Energy
Inc
4.850%
8/15/52
38,122
50
Dominion
Energy
Inc
7.000%
6/01/54
52,510
120
DTE
Energy
Co
5.100%
3/01/29
121,097
60
Duke
Energy
Corp
0.900%
9/15/25
57,336
11
Duke
Energy
Corp
3.150%
8/15/27
10,516
111
Duke
Energy
Corp
4.300%
3/15/28
109,386
337
Duke
Energy
Corp
3.950%
8/15/47
257,750
1
Duke
Energy
Corp
5.000%
8/15/52
897
100
Duke
Energy
Indiana
LLC
5.400%
4/01/53
98,105
27
El
Paso
Electric
Co
5.000%
12/01/44
23,666
18
Emera
US
Finance
LP
3.550%
6/15/26
17,402
52
Emera
US
Finance
LP
4.750%
6/15/46
43,840
23
Enel
Chile
SA
4.875%
6/12/28
22,615
50
Entergy
Arkansas
LLC
5.450%
6/01/34
51,630
1
Entergy
Corp
0.900%
9/15/25
956
1
Entergy
Corp
1.900%
6/15/28
899
1
Entergy
Corp
3.750%
6/15/50
729
50
Entergy
Louisiana
LLC
5.350%
3/15/34
50,962
50
Entergy
Louisiana
LLC
4.200%
9/01/48
40,443
21
Essential
Utilities
Inc
3.351%
4/15/50
14,507
50
Evergy
Kansas
Central
Inc
4.250%
12/01/45
42,063
4
Eversource
Energy
0.800%
8/15/25
3,819
21
Eversource
Energy
3.300%
1/15/28
19,941
100
Eversource
Energy
5.850%
4/15/31
103,721
6
Eversource
Energy
3.450%
1/15/50
4,268
6
Exelon
Corp
2.750%
3/15/27
5,708
50
Exelon
Corp
5.150%
3/15/29
50,816
100
Exelon
Corp
5.450%
3/15/34
102,007
3
Exelon
Corp
4.950%
6/15/35
2,891
21
Exelon
Corp
5.100%
6/15/45
19,616
7
Exelon
Corp
4.450%
4/15/46
5,973
1
Exelon
Corp
4.700%
4/15/50
873
50
FirstEnergy
Corp
2.250%
9/01/30
42,768
Nuveen
Enhanced
Yield
U.S.
Aggregate
Bond
ETF
(NUAG)
(continued)
Portfolio
of
Investments
July
31,
2024
Principal
Amount
(000)
Description
(a)
Coupon
Maturity
Value
UTILITY
(continued)
$
48
FirstEnergy
Pennsylvania
Electric
Co
6.150%
10/01/38
$
51,087
30
Fortis
Inc/Canada
3.055%
10/04/26
28,792
50
Georgia
Power
Co
5.004%
2/23/27
50,487
81
Georgia
Power
Co
3.700%
1/30/50
61,715
28
Iberdrola
International
BV
6.750%
7/15/36
32,231
10
Idaho
Power
Co
5.800%
4/01/54
10,213
10
Interstate
Power
and
Light
Co
4.100%
9/26/28
9,754
17
IPALCO
Enterprises
Inc
4.250%
5/01/30
16,132
1
ITC
Holdings
Corp
5.300%
7/01/43
947
12
National
Grid
USA
5.803%
4/01/35
12,304
60
National
Rural
Utilities
Cooperative
Finance
Corp
4.800%
3/15/28
60,283
18
NextEra
Energy
Capital
Holdings
Inc
4.450%
6/20/25
17,872
8
NextEra
Energy
Capital
Holdings
Inc
1.875%
1/15/27
7,463
100
NextEra
Energy
Capital
Holdings
Inc
4.900%
2/28/28
100,509
67
NextEra
Energy
Capital
Holdings
Inc
1.900%
6/15/28
60,377
4
NextEra
Energy
Capital
Holdings
Inc
3.500%
4/01/29
3,785
129
(b)
NextEra
Energy
Capital
Holdings
Inc
5.000%
7/15/32
128,974
100
NextEra
Energy
Capital
Holdings
Inc
6.700%
9/01/54
101,623
4
NextEra
Energy
Capital
Holdings
Inc
5.650%
5/01/79
3,859
3
NextEra
Energy
Capital
Holdings
Inc
3.800%
3/15/82
2,793
9
NiSource
Inc
3.490%
5/15/27
8,693
98
NiSource
Inc
5.950%
6/15/41
100,848
56
NiSource
Inc
5.650%
2/01/45
55,651
7
NiSource
Inc
3.950%
3/30/48
5,437
19
NiSource
Inc
5.000%
6/15/52
17,372
50
Northern
States
Power
Co/WI
5.650%
6/15/54
51,350
100
NSTAR
Electric
Co
4.950%
9/15/52
92,801
4
Oglethorpe
Power
Corp
5.950%
11/01/39
4,119
79
Oglethorpe
Power
Corp
4.200%
12/01/42
63,115
14
Oglethorpe
Power
Corp
4.250%
4/01/46
11,115
13
Oglethorpe
Power
Corp
5.050%
10/01/48
11,654
7
Oglethorpe
Power
Corp
5.250%
9/01/50
6,487
50
Ohio
Power
Co
5.650%
6/01/34
51,407
50
Oncor
Electric
Delivery
Co
LLC
5.350%
10/01/52
48,946
8
Pacific
Gas
and
Electric
Co
3.300%
12/01/27
7,567
9
(b)
Pacific
Gas
and
Electric
Co
3.000%
6/15/28
8,393
9
Pacific
Gas
and
Electric
Co
4.200%
3/01/29
8,664
100
Pacific
Gas
and
Electric
Co
5.900%
6/15/32
102,709
210
(b)
Pacific
Gas
and
Electric
Co
6.950%
3/15/34
231,669
109
Pacific
Gas
and
Electric
Co
4.200%
6/01/41
87,443
6
Pacific
Gas
and
Electric
Co
4.450%
4/15/42
4,908
8
Pacific
Gas
and
Electric
Co
3.750%
8/15/42
5,973
7
Pacific
Gas
and
Electric
Co
4.300%
3/15/45
5,507
7
Pacific
Gas
and
Electric
Co
4.000%
12/01/46
5,226
7
Pacific
Gas
and
Electric
Co
3.950%
12/01/47
5,179
106
Pacific
Gas
and
Electric
Co
4.950%
7/01/50
90,349
104
Pacific
Gas
and
Electric
Co
5.250%
3/01/52
91,726
230
PacifiCorp
5.500%
5/15/54
218,468
65
Piedmont
Natural
Gas
Co
Inc
3.640%
11/01/46
47,907
11
Piedmont
Natural
Gas
Co
Inc
3.350%
6/01/50
7,545
Principal
Amount
(000)
Description
(a)
Coupon
Maturity
Value
UTILITY
(continued)
$
30
Pinnacle
West
Capital
Corp
1.300%
6/15/25
$
28,928
100
Potomac
Electric
Power
Co
5.500%
3/15/54
100,660
10
PPL
Capital
Funding
Inc
3.100%
5/15/26
9,694
1
PPL
Capital
Funding
Inc
4.125%
4/15/30
962
100
PPL
Electric
Utilities
Corp
4.150%
6/15/48
83,501
110
Public
Service
Co
of
Colorado
5.250%
4/01/53
103,811
100
Public
Service
Electric
and
Gas
Co
5.450%
8/01/53
101,206
50
Public
Service
Enterprise
Group
Inc
5.200%
4/01/29
50,852
26
Puget
Energy
Inc
2.379%
6/15/28
23,490
36
Puget
Energy
Inc
4.100%
6/15/30
34,001
50
San
Diego
Gas
&
Electric
Co
4.150%
5/15/48
41,416
4
Sempra
3.250%
6/15/27
3,830
52
Sempra
3.400%
2/01/28
49,661
38
Sempra
3.800%
2/01/38
32,041
59
Sempra
4.000%
2/01/48
46,237
14
Sempra
4.125%
4/01/52
12,918
20
Southern
California
Edison
Co
5.150%
6/01/29
20,356
100
Southern
California
Edison
Co
5.700%
3/01/53
100,655
50
Southern
Co
Gas
Capital
Corp
6.000%
10/01/34
51,508
1
Southern
Co
Gas
Capital
Corp
4.400%
5/30/47
838
1
Southern
Co/The
5.113%
8/01/27
1,008
50
Southern
Co/The
4.850%
6/15/28
50,254
120
Southern
Co/The
5.700%
3/15/34
124,962
51
Southern
Power
Co
4.950%
12/15/46
45,572
45
Southwest
Gas
Corp
4.150%
6/01/49
35,121
8
Southwestern
Electric
Power
Co
1.650%
3/15/26
7,599
104
Southwestern
Electric
Power
Co
4.100%
9/15/28
100,978
1
Southwestern
Electric
Power
Co
3.900%
4/01/45
764
109
Southwestern
Electric
Power
Co
3.250%
11/01/51
71,411
21
Southwestern
Public
Service
Co
6.000%
10/01/36
21,808
38
Spire
Inc
4.700%
8/15/44
32,570
50
Union
Electric
Co
5.200%
4/01/34
50,810
35
Union
Electric
Co
5.450%
3/15/53
34,505
100
Virginia
Electric
and
Power
Co
5.350%
1/15/54
97,678
90
WEC
Energy
Group
Inc
4.750%
1/15/28
90,244
60
Wisconsin
Power
and
Light
Co
4.100%
10/15/44
48,185
11
Xcel
Energy
Inc
1.750%
3/15/27
10,163
1
Xcel
Energy
Inc
4.000%
6/15/28
971
7
Xcel
Energy
Inc
4.800%
9/15/41
6,189
TOTAL
UTILITY
6,487,429
TOTAL
CORPORATE
DEBT
(cost
$15,950,045)
15,204,553
Principal
Amount
(000)
Description
(a)
Coupon
Maturity
Value
X
–
U.S.
TREASURY
-
27.5%
$
425
United
States
Treasury
Note/Bond
0.375%
1/31/26
399,932
400
United
States
Treasury
Note/Bond
4.250%
1/31/26
398,703
425
United
States
Treasury
Note/Bond
0.750%
3/31/26
400,264
700
United
States
Treasury
Note/Bond
4.500%
3/31/26
701,012
703
United
States
Treasury
Note/Bond
0.750%
4/30/26
661,164
425
United
States
Treasury
Note/Bond
4.875%
4/30/26
428,536
100
United
States
Treasury
Note/Bond
4.875%
5/31/26
100,922
3
United
States
Treasury
Note/Bond
0.875%
6/30/26
2,626
Nuveen
Enhanced
Yield
U.S.
Aggregate
Bond
ETF
(NUAG)
(continued)
Portfolio
of
Investments
July
31,
2024
Principal
Amount
(000)
Description
(a)
Coupon
Maturity
Value
$
600
United
States
Treasury
Note/Bond
4.625%
6/30/26
$
603,492
450
United
States
Treasury
Note/Bond
4.375%
7/31/26
450,984
4
United
States
Treasury
Note/Bond
1.250%
12/31/26
3,363
1,200
United
States
Treasury
Note/Bond
4.000%
1/15/27
1,195,359
250
United
States
Treasury
Note/Bond
4.250%
3/15/27
250,801
1
United
States
Treasury
Note/Bond
2.500%
3/31/27
960
30
United
States
Treasury
Note/Bond
2.750%
4/30/27
28,952
200
United
States
Treasury
Note/Bond
4.500%
5/15/27
202,063
3
United
States
Treasury
Note/Bond
3.250%
6/30/27
2,738
0
(d)
United
States
Treasury
Note/Bond
2.750%
7/31/27
385
150
United
States
Treasury
Note/Bond
3.625%
5/31/28
148,078
105
United
States
Treasury
Note/Bond
4.375%
8/31/28
106,567
100
United
States
Treasury
Note/Bond
4.875%
10/31/28
103,512
150
United
States
Treasury
Note/Bond
3.125%
11/15/28
145,002
500
United
States
Treasury
Note/Bond
4.000%
1/31/29
501,035
275
United
States
Treasury
Note/Bond
4.250%
2/28/29
278,599
600
United
States
Treasury
Note/Bond
4.625%
4/30/29
617,625
550
United
States
Treasury
Note/Bond
4.500%
5/31/29
563,664
300
United
States
Treasury
Note/Bond
4.000%
7/31/29
301,031
100
United
States
Treasury
Note/Bond
4.250%
2/28/31
101,660
30
United
States
Treasury
Note/Bond
4.000%
2/15/34
29,873
250
United
States
Treasury
Note/Bond
4.375%
5/15/34
256,406
300
United
States
Treasury
Note/Bond
3.375%
8/15/42
261,633
100
United
States
Treasury
Note/Bond
3.875%
2/15/43
93,215
270
United
States
Treasury
Note/Bond
4.500%
2/15/44
272,700
150
United
States
Treasury
Note/Bond
4.625%
5/15/44
154,055
25
United
States
Treasury
Note/Bond
4.750%
11/15/53
26,684
50
United
States
Treasury
Note/Bond
4.625%
5/15/54
52,359
TOTAL
U.S.
TREASURY
(cost
$9,925,542)
9,845,954
Principal
Amount
(000)
Description
(a)
Coupon
Maturity
Value
X
–
SECURITIZED
-
19.2%
$
250
American
Express
Credit
Account
Master
Trust
2022
2
3.390%
5/17/27
246,615
100
(c)
Avis
Budget
Rental
Car
Funding
AESOP
LLC
2020
1A
2.330%
8/20/26
97,438
150
BANK
2024-BNK47
2024
BNK47
6.457%
6/15/57
157,692
50
BANK5
2023-5YR3
2023
5YR3
6.724%
9/15/56
53,117
43
BANK5
2023-5YR4
2023
5YR4
6.500%
12/15/56
45,566
100
BBCMS
Mortgage
Trust
2022-C17
2022
C17
4.174%
9/15/55
95,022
150
Benchmark
2021-B27
Mortgage
Trust
2021
B27
2.703%
7/15/54
105,024
100
Benchmark
2024-V7
Mortgage
Trust
2024
V7
6.228%
6/15/29
105,049
45
BMO
Mortgage
Trust
2023
5C2
6.673%
11/15/56
47,465
150
Capital
One
Multi-Asset
Execution
Trust
2022
A2
3.490%
5/15/27
148,015
50
Carmax
Auto
Owner
Trust
2024-3
2024
3
5.210%
9/15/27
50,069
50
(c)
Chase
Auto
Owner
Trust
2024-3
2024
3A
5.220%
7/25/29
50,536
250
COMM
2015-LC19
Mortgage
Trust
2015
LC19
3.527%
2/10/48
246,240
85
(c)
Dell
Equipment
Finance
Trust
2023
3
6.100%
4/23/29
85,085
50
(c)
Enterprise
Fleet
Financing
2024-3
LLC
2024
3
5.310%
4/20/27
50,157
50
Exeter
Automobile
Receivables
Trust
2024-4
2024
4A
5.290%
8/15/30
50,207
23
Fannie
Mae
Pool
FN
MA1489
3.000%
7/01/43
21,232
59
Fannie
Mae
Pool
FN
MA3211
4.000%
12/01/47
56,726
36
Fannie
Mae
Pool
FN
MA3277
4.000%
2/01/48
34,004
79
Fannie
Mae
Pool
FN
MA3305
3.500%
3/01/48
72,542
24
Fannie
Mae
Pool
FN
MA3306
4.000%
3/01/48
23,053
48
Fannie
Mae
Pool
FN
MA3383
3.500%
6/01/48
44,388
136
Fannie
Mae
Pool
FN
MA3416
4.500%
7/01/48
132,783
45
Fannie
Mae
Pool
FN
MA3663
3.500%
5/01/49
41,567
69
Fannie
Mae
Pool
FN
MA3744
3.000%
8/01/49
61,539
173
Fannie
Mae
Pool
FN
MA4160
3.000%
10/01/50
153,641
234
Fannie
Mae
Pool
FN
MA4305
2021
MTGE
2.000%
4/01/51
189,206
124
Fannie
Mae
Pool
FN
MA4438
2021
1
2.500%
10/01/51
105,289
Principal
Amount
(000)
Description
(a)
Coupon
Maturity
Value
$
115
Fannie
Mae
Pool
FN
MA4562
2.000%
3/01/52
$
92,498
242
Fannie
Mae
Pool
FN
MA4578
2.500%
4/01/52
204,499
85
Fannie
Mae
Pool
FN
MA4737
2022
1
5.000%
8/01/52
83,538
421
Fannie
Mae
Pool
FN
MA4738
5.500%
8/01/52
422,633
172
Fannie
Mae
Pool
FN
MA4761
5.000%
9/01/52
169,747
99
Fannie
Mae
Pool
FN
MA5216
6.000%
12/01/53
99,920
96
Fannie
Mae
Pool
FN
MA5295
6.000%
3/01/54
96,855
96
Fannie
Mae
Pool
FN
MA5329
6.500%
4/01/54
97,902
95
Fannie
Mae
Pool
FN
MA5391
7.000%
6/01/54
97,946
50
Ford
Credit
Auto
Lease
Trust
2024-B
2024
B
4.990%
12/15/27
50,263
50
Ford
Credit
Auto
Owner
Trust
2024-B
2024
B
5.100%
4/15/29
50,597
200
Freddie
Mac
Multifamily
Structured
Pass
Through
Certificates
2023
K505
4.819%
6/25/28
202,706
200
Freddie
Mac
Multifamily
Structured
Pass
Through
Certificates
2023
K506
4.650%
8/25/28
201,288
100
Freddie
Mac
Multifamily
Structured
Pass
Through
Certificates
2023
K507
4.800%
9/25/28
101,149
191
Freddie
Mac
Multifamily
Structured
Pass
Through
Certificates
2021
K127
1.353%
11/25/30
171,561
246
Freddie
Mac
Pool
FR
SD5345
2.500%
4/01/52
207,474
100
GM
Financial
Automobile
Leasing
Trust
2024-1
2024
1
5.090%
3/22/27
100,200
70
GM
Financial
Consumer
Automobile
Receivables
Trust
2022-2
2022
2
3.100%
2/16/27
69,114
221
GS
Mortgage
Securities
Trust
2016-GS4
2016
GS4
3.178%
11/10/49
213,096
100
(c)
Hertz
Vehicle
Financing
III
LLC
2022
1A
1.990%
6/25/26
97,658
50
Honda
Auto
Receivables
2024-2
Owner
Trust
2024
2
5.270%
11/20/28
50,674
100
(c)
HPEFS
Equipment
Trust
2023
2A
6.040%
1/21/31
100,319
108
Hyundai
Auto
Receivables
Trust
2022-B
2022
B
3.720%
11/16/26
107,173
100
John
Deere
Owner
Trust
2022
2022
A
2.490%
1/16/29
97,147
25
Mercedes-Benz
Auto
Receivables
Trust
2024-1
2024
1
4.790%
7/15/31
25,244
20
Morgan
Stanley
Bank
of
America
Merrill
Lynch
Trust
2015-
C20
2015
C20
3.249%
2/15/48
19,800
250
Morgan
Stanley
Capital
I
Trust
2021-L5
2021
L5
1.518%
5/15/54
230,821
100
(c)
OneMain
Financial
Issuance
Tru
2023
2A
6.170%
9/15/36
103,331
100
Santander
Drive
Auto
Receivabl
2023
4
6.040%
12/15/31
102,548
1
Santander
Drive
Auto
Receivables
Trust
2022-5
2022
5
4.110%
8/17/26
1,300
63
(c)
Tesla
Auto
Lease
Trust
2023-A
2023
A
5.860%
8/20/25
63,120
50
Toyota
Auto
Receivables
2024-C
Owner
Trust
2024
C
4.880%
3/15/29
50,309
100
UNITED
STATES
2023
B
5.600%
2/15/29
101,528
100
Verizon
Master
Trust
2022
7
5.230%
11/22/27
99,906
45
Verizon
Master
Trust
Series
2024-4
2024
4
5.210%
6/20/29
45,479
200
Wells
Fargo
Commercial
Mortgage
Trust
2024-5C1
2024
5C1
5.928%
7/15/57
207,422
10
(c)
Westlake
Automobile
Receivables
Trust
2022-1
2022
1A
2.750%
3/15/27
10,150
50
World
Omni
Auto
Receivables
Trust
2024-B
2024
B
5.270%
9/17/29
50,720
TOTAL
SECURITIZED
(cost
$6,714,361)
6,866,902
Principal
Amount
(000)
Description
(a)
Coupon
Maturity
Value
X
–
GOVERNMENT
RELATED
-
9.5%
GOVERNMENT
AGENCY
-
0.4%
$
20
Export-Import
Bank
of
Korea
2.500%
6/29/41
14,355
1
Federal
National
Mortgage
Association
1.875%
9/24/26
951
6
Federal
National
Mortgage
Association
5.625%
7/15/37
6,775
9
Tennessee
Valley
Authority
5.250%
9/15/39
9,527
129
Tennessee
Valley
Authority
3.500%
12/15/42
109,136
Nuveen
Enhanced
Yield
U.S.
Aggregate
Bond
ETF
(NUAG)
(continued)
Portfolio
of
Investments
July
31,
2024
Principal
Amount
(000)
Description
(a)
Coupon
Maturity
Value
GOVERNMENT
AGENCY
(continued)
$
5
Tennessee
Valley
Authority
4.250%
9/15/52
$
4,501
TOTAL
GOVERNMENT
AGENCY
145,245
MUNICIPAL
BONDS
-
3.6%
(e)
18
Bay
Area
Toll
Authority,
California,
Revenue
Bonds,
San
Francisco
Bay
Area
Toll
Bridge,
Series
2021
(Optional
Call:
4/31
at
100.00)
3.126%
4/01/55
12,789
16
Bay
Area
Toll
Authority,
California,
Revenue
Bonds,
San
Francisco
Bay
Area
Toll
Bridge,
Subordinate
Lien,
Build
America
Federally
Taxable
Bond
Series
2010S-1
(No
Opt.
Call)
6.918%
4/01/40
18,524
60
Board
of
Regents
of
the
University
of
Texas
System,
Revenue
Financing
System
Bonds,
Green
Series
2016B
(No
Opt.
Call)
3.852%
8/15/46
51,820
42
California
State
University,
Systemwide
Revenue
Bonds,
Taxable
Series
2021B
(No
Opt.
Call)
2.719%
11/01/52
29,472
10
California
State
University,
Systemwide
Revenue
Bonds,
Taxable
Series
2021B
(Optional
Call:
11/31
at
100.00)
2.939%
11/01/52
7,100
50
California
State,
General
Obligation
Bonds,
Taxable
Various
Purpose
Series
2018
(Optional
Call:
4/28
at
100.00)
4.500%
4/01/33
49,192
70
California
State,
General
Obligation
Bonds,
Taxable
Various
Purpose
Series
2018
(Optional
Call:
4/28
at
100.00)
4.600%
4/01/38
68,050
50
California
State,
General
Obligation
Bonds,
Various
Purpose
Build
America
Taxable
Bond
Series
2010
(No
Opt.
Call)
7.625%
3/01/40
61,265
10
Chicago
Greater
Metropolitan
Water
Reclamation
District,
Illinois,
General
Obligation
Bonds,
Build
America
Taxable
Bonds,
Series
2009
(No
Opt.
Call)
5.720%
12/01/38
10,560
29
Chicago
Transit
Authority,
Illinois,
Sales
and
Transfer
Tax
Receipts
Revenue
Bonds,
Pension
Funding
Taxable
Series
2008B
(No
Opt.
Call)
6.899%
12/01/40
32,701
47
Chicago,
Illinois,
General
Airport
Revenue
Bonds,
O'Hare
International
Airport,
Taxable
Senior
Lien
Series
2018C
(No
Opt.
Call)
4.572%
1/01/54
44,187
Principal
Amount
(000)
Description
(a)
Coupon
Maturity
Value
MUNICIPAL
BONDS
(continued)
$
40
Commonwealth
Financing
Authority,
Pennsylvania,
Revenue
Bonds,
Taxable
Series
2021A
(No
Opt.
Call)
2.991%
6/01/42
$
30,700
6
Commonwealth
Financing
Authority,
Pennsylvania,
State
Appropriation
Lease
Bonds,
Plancon
Program,
Taxable
Series
2018A
(No
Opt.
Call)
3.864%
6/01/38
5,527
10
Cook
County,
Illinois,
General
Obligation
Bonds,
Build
America
Taxable
Bonds,
Series
2010D
(No
Opt.
Call)
6.229%
11/15/34
10,789
40
Dallas
Area
Rapid
Transit,
Texas,
Sales
Tax
Revenue
Bonds,
Taxable
Refunding
Senior
Lien
Series
2021A
(Optional
Call:
12/31
at
100.00)
2.613%
12/01/48
28,095
20
Dallas
Fort
Worth
International
Airport,
Texas, Joint
Revenue
Bonds,
Taxable
Improvement
Series
2022A
(No
Opt.
Call)
4.087%
11/01/51
17,271
20
Dallas
Fort
Worth
International
Airport,
Texas, Joint
Revenue
Bonds,
Taxable
Improvement
Series
2022A
(Optional
Call:
11/32
at
100.00)
4.507%
11/01/51
18,452
40
Dallas-Fort
Worth
International
Airport,
Texas,
Joint
Revenue
Bonds,
Taxable
Refunding
Series
2021C
(Optional
Call:
11/31
at
100.00)
2.843%
11/01/46
29,721
1
Dormitory
Authority
of
the
State
of
New
York,
State
Personal
Income
Tax
Revenue
Bonds,
General
Purpose,
Series
2021C
(No
Opt.
Call)
2.202%
3/15/34
814
20
Florida
State
Board
of
Administration
Finance
Corporation,
Revenue
Bonds,
Taxable,
Series
2024A
(Optional
Call:
1/34
at
100.00)
5.526%
7/01/34
20,540
30
Golden
State
Tobacco
Securitization
Corporation,
California,
Tobacco
Settlement
Asset-Backed
Bonds,
Taxable
Senior
Series
2021A-1
(Optional
Call:
12/31
at
100.00)
4.214%
6/01/50
23,146
40
Grand
Parkway
Transportation
Corporation,
Texas,
System
Toll
Revenue
Bonds,
Taxable
Refunding
Subordinate
Lien
Series
2020B.
Tela
Supported
(Optional
Call:
4/30
at
100.00)
3.236%
10/01/52
30,234
126
Illinois
State,
General
Obligation
Bonds,
Pension
Funding
Series
2003
(No
Opt.
Call)
5.100%
6/01/33
125,550
40
Kansas
Development
Finance
Authority,
Kansas,
Revenue
Bonds,
State
of
Kansas
KPERS
Projects,
Taxable
Series
2021K
(No
Opt.
Call)
2.774%
5/01/51
28,513
Nuveen
Enhanced
Yield
U.S.
Aggregate
Bond
ETF
(NUAG)
(continued)
Portfolio
of
Investments
July
31,
2024
Principal
Amount
(000)
Description
(a)
Coupon
Maturity
Value
MUNICIPAL
BONDS
(continued)
$
30
Los
Angeles
Community
College
District,
California,
General
Obligation
Bonds,
Build
America
Taxable
Bonds,
Series
2010
(No
Opt.
Call)
6.750%
8/01/49
$
35,192
11
Michigan
Finance
Authority,
Hospital
Revenue
Bonds,
Trinity
Health
Credit
Group,
Taxable
Refunding
Series
2019-T
(No
Opt.
Call)
3.384%
12/01/40
9,175
21
Missouri
Health
and
Educational
Facilities
Authority,
Revenue
Bonds,
Washington
University,
Series
2016B
(No
Opt.
Call)
3.086%
9/15/51
15,297
36
Municipal
Electric
Authority
of
Georgia,
Plant
Vogtle
Units
3
&
4
Project
J
Bonds,
Taxable
Build
America
Bonds
Series
2010A
(No
Opt.
Call)
6.637%
4/01/57
40,536
45
New
Jersey
Turnpike
Authority,
Revenue
Bonds,
Build
America
Taxable
Bonds,
Series
2010A
(No
Opt.
Call)
7.102%
1/01/41
52,438
1
New
York
City
Municipal
Water
Finance
Authority,
New
York,
Water
and
Sewer
System
Revenue
Bonds,
Second
Generation
Resolution,
Build
America
Taxable
Bonds,
Fiscal
2011
Series
AA
(No
Opt.
Call)
5.440%
6/15/43
1,001
15
New
York
City
Transitional
Finance
Authority,
New
York,
Future
Tax
Secured
Bonds,
Build
America
Taxable
Bonds,
Series
2010B-1
(No
Opt.
Call)
5.572%
11/01/38
15,481
50
North
Texas
Tollway
Authority,
System
Revenue
Bonds,
Refunding
First
Tier
Taxable
Series
2021A
(Optional
Call:
1/31
at
100.00)
3.011%
1/01/43
39,161
10
Ohio
State
University,
General
Receipts
Bonds,
Build
America
Taxable
Bond
Series
2010C
(No
Opt.
Call)
4.910%
6/01/40
9,871
100
Port
Authority
of
New
York
and
New
Jersey,
Consolidated
Revenue
Bonds,
Two
Hundred
Twenty-Fifth
Series
2021
(Optional
Call:
7/31
at
100.00)
3.175%
7/15/60
69,534
39
Province
of
British
Columbia
Canada
(No
Opt.
Call)
1.300%
1/29/31
32,549
75
Sales
Tax
Securitization
Corporation,
Illinois,
Series
2021
(No
Opt.
Call)
3.238%
1/01/42
60,448
90
Texas
Transportation
Commission,
General
Obligation
Bonds,
Mobility
Fund,
Refunding
Series
2020
(Optional
Call:
10/30
at
100.00)
2.472%
10/01/44
64,992
Principal
Amount
(000)
Description
(a)
Coupon
Maturity
Value
MUNICIPAL
BONDS
(continued)
$
93
The
Rector
and
Visitors
of
the
University
of
Virginia,
General
Revenue
Bonds,
Taxable
Pledge
and
Refunding
Series
2020
(Optional
Call:
3/50
at
100.00)
2.256%
9/01/50
$
57,662
32
Tucson,
Arizona,
Certificates
of
Participation,
Taxable
Series
2021A
(No
Opt.
Call)
2.856%
7/01/47
23,851
30
University
of
Michigan,
General
Revenue
Bonds,
Series
2022A
(Optional
Call:
10/51
at
100.00)
3.504%
4/01/52
23,728
TOTAL
MUNICIPAL
BONDS
1,305,928
SOVEREIGN
DEBT
-
5.4%
1
Chile
Government
International
Bond
3.625%
10/30/42
786
102
Chile
Government
International
Bond
3.500%
1/25/50
74,628
13
Chile
Government
International
Bond
4.000%
1/31/52
10,232
13
Chile
Government
International
Bond
3.250%
9/21/71
8,225
9
Colombia
Government
International
Bond
4.125%
2/22/42
5,995
13
Colombia
Government
International
Bond
5.000%
6/15/45
9,264
19
Colombia
Government
International
Bond
5.200%
5/15/49
13,586
13
Colombia
Government
International
Bond
4.125%
5/15/51
7,904
13
Colombia
Government
International
Bond
3.875%
2/15/61
7,288
1
Hungary
Government
International
Bond
7.625%
3/29/41
1,151
1
Indonesia
Government
International
Bond
4.350%
1/11/48
872
1
Indonesia
Government
International
Bond
5.350%
2/11/49
1,009
143
Indonesia
Government
International
Bond
4.300%
3/31/52
122,015
10
Indonesia
Government
International
Bond
4.450%
4/15/70
8,354
25
Indonesia
Government
International
Bond
3.350%
3/12/71
16,435
20
Inter-American
Development
Bank
4.375%
1/24/44
19,165
28
Israel
Government
International
Bond
4.500%
1/30/43
23,240
100
Israel
Government
International
Bond
4.125%
1/17/48
75,157
11
Korea
International
Bond
3.875%
9/20/48
9,478
200
Mexico
Government
International
Bond
6.000%
5/07/36
199,038
70
Mexico
Government
International
Bond
4.280%
8/14/41
55,490
200
Mexico
Government
International
Bond
4.750%
3/08/44
163,733
200
Mexico
Government
International
Bond
6.338%
5/04/53
191,646
Nuveen
Enhanced
Yield
U.S.
Aggregate
Bond
ETF
(NUAG)
(continued)
Portfolio
of
Investments
July
31,
2024
Principal
Amount
(000)
Description
(a)
Coupon
Maturity
Value
SOVEREIGN
DEBT
(continued)
$
200
Panama
Government
International
Bond
6.875%
1/31/36
$
200,208
98
Panama
Government
International
Bond
4.500%
5/15/47
69,538
130
Panama
Government
International
Bond
3.870%
7/23/60
76,564
93
Peruvian
Government
International
Bond
3.300%
3/11/41
70,348
17
Peruvian
Government
International
Bond
3.550%
3/10/51
12,301
5
Peruvian
Government
International
Bond
2.780%
12/01/60
2,860
1
Peruvian
Government
International
Bond
3.600%
1/15/72
653
16
Peruvian
Government
International
Bond
3.230%
7/28/21
9,188
20
Philippine
Government
International
Bond
6.375%
10/23/34
22,175
10
Philippine
Government
International
Bond
5.000%
1/13/37
9,950
19
Philippine
Government
International
Bond
3.700%
3/01/41
15,675
200
Philippine
Government
International
Bond
3.200%
7/06/46
143,782
60
Republic
of
Italy
Government
International
Bond
4.000%
10/17/49
45,257
110
Republic
of
Poland
Government
International
Bond
5.125%
9/18/34
110,359
30
Republic
of
Poland
Government
International
Bond
5.500%
4/04/53
29,661
17
Uruguay
Government
International
Bond
5.100%
6/18/50
16,314
90
Uruguay
Government
International
Bond
4.975%
4/20/55
83,631
TOTAL
SOVEREIGN
DEBT
1,943,155
UTILITY
-
0.1%
20
San
Antonio,
Texas,
Electric
and
Gas
System
Revenue
Bonds,
Build
America
Taxable
Bond
Series
2010A
5.718%
2/01/41
20,621
TOTAL
UTILITY
20,621
TOTAL
GOVERNMENT
RELATED
(cost
$4,186,410)
3,414,949
TOTAL
LONG-TERM
INVESTMENTS
(cost
$36,776,358)
35,332,358
Shares
Description
(a)
Coupon
Value
INVESTMENTS
PURCHASED
WITH
COLLATERAL
FROM
SECURITIES
LENDING
-
1.7%
603,972
(f)
State
Street
Navigator
Securities
Lending
Government
Money
Market
Portfolio
5.310%(g)
$
603,972
TOTAL
INVESTMENTS
PURCHASED
WITH
COLLATERAL
FROM
SECURITIES
LENDING
(cost
$603,972)
$
603,972
TOTAL
INVESTMENTS
(cost
$37,380,330
)
-
100.3%
35,936,330
OTHER
ASSETS
&
LIABILITIES,
NET
-
(0.3)%
(119,529)
NET
ASSETS
-
100%
$
35,816,801
For
Fund
portfolio
compliance
purposes,
the
Fund’s
industry
classifications
refer
to
any
one
or
more
of
the
industry
sub-classifications
used
by
one
or
more
widely
recognized
market
indexes
or
ratings
group
indexes,
and/or
as
defined
by
Fund
management.
This
definition
may
not
apply
for
purposes
of
this
report,
which
may
combine
industry
sub-classifications
into
sectors
for
reporting
ease.
(a)
All
percentages
shown
in
the
Portfolio
of
Investments
are
based
on
net
assets.
(b)
Investment,
or
a
portion
of
investment,
is
out
on
loan
for
securities
lending.
The
total
value
of
the
securities
out
on
loan
as
of
the
end
of
the
reporting
period
was
$590,797.
(c)
Security
is
exempt
from
registration
under
Rule
144A
of
the
Securities
Act
of
1933,
as
amended.
These
securities
are
deemed
liquid
and
may
be
resold
in
transactions
exempt
from
registration,
which
are
normally
those
transactions
with
qualified
institutional
buyers.
As
of
the
end
of
the
reporting
period,
the
aggregate
value
of
these
securities
is
$802,019
or
2.2%
of
Total
Investments.
(d)
Principal
Amount
(000)
rounds
to
less
than
$1,000.
(e)
Optional
Call
Provisions:
Dates
(month
and
year)
and
prices
of
the
earliest
optional
call
or
redemption.
There
may
be
other
call
provisions
at
varying
prices
at
later
dates.
Certain
mortgage-backed
securities
may
be
subject
to
periodic
principal
paydowns.
Optional
Call
Provisions
are
not
covered
by
the
report
of
independent
registered
public
accounting
firm.
(f)
The
Fund
may
loan
securities
representing
up
to
one
third
of
the
value
of
its
total
assets
(which
includes
collateral
for
securities
on
loan)
to
broker
dealers,
banks,
and
other
institutions.
The
collateral
maintained
by
the
Fund
shall
have
a
value,
at
the
inception
of
each
loan,
equal
to
not
less
than
100%
of
the
value
of
the
loaned
securities.
The
cash
collateral
received
by
the
Fund
is
invested
in
this
money
market
fund.
(g)
The
rate
shown
is
the
one-day
yield
as
of
the
end
of
the
reporting
period.
REIT
Real
Estate
Investment
Trust
See
Notes
to
Financial
Statements
Nuveen
ESG
1-5
Year
U.S.
Aggregate
Bond
ETF
(NUSA)
Portfolio
of
Investments
July
31,
2024
Principal
Amount
(000)
Description
(a)
Coupon
Maturity
Value
LONG-TERM
INVESTMENTS
-
98.2%
X
–
U.S.
TREASURY
-
61.2%
$
150
United
States
Treasury
Note/Bond
4.875%
11/30/25
$
150,586
200
United
States
Treasury
Note/Bond
0.375%
12/31/25
188,758
550
United
States
Treasury
Note/Bond
4.250%
12/31/25
547,959
250
United
States
Treasury
Note/Bond
3.875%
1/15/26
247,793
800
United
States
Treasury
Note/Bond
4.000%
2/15/26
794,531
300
United
States
Treasury
Note/Bond
0.750%
4/30/26
281,906
2,700
United
States
Treasury
Note/Bond
4.875%
4/30/26
2,722,465
700
United
States
Treasury
Note/Bond
4.875%
5/31/26
706,453
50
United
States
Treasury
Note/Bond
0.875%
6/30/26
46,891
950
United
States
Treasury
Note/Bond
4.625%
6/30/26
955,529
550
United
States
Treasury
Note/Bond
4.375%
7/31/26
551,203
100
United
States
Treasury
Note/Bond
1.125%
10/31/26
93,449
100
United
States
Treasury
Note/Bond
1.250%
12/31/26
93,422
900
United
States
Treasury
Note/Bond
1.875%
2/28/27
850,676
300
United
States
Treasury
Note/Bond
2.500%
3/31/27
288,082
850
United
States
Treasury
Note/Bond
2.750%
4/30/27
820,316
850
United
States
Treasury
Note/Bond
2.625%
5/31/27
816,963
150
United
States
Treasury
Note/Bond
3.250%
6/30/27
146,684
250
United
States
Treasury
Note/Bond
2.750%
7/31/27
240,752
150
United
States
Treasury
Note/Bond
3.125%
8/31/27
145,969
500
United
States
Treasury
Note/Bond
4.125%
10/31/27
501,328
500
United
States
Treasury
Note/Bond
3.875%
11/30/27
497,559
100
United
States
Treasury
Note/Bond
3.875%
12/31/27
99,551
500
United
States
Treasury
Note/Bond
3.500%
1/31/28
491,621
300
United
States
Treasury
Note/Bond
4.000%
2/29/28
299,894
700
United
States
Treasury
Note/Bond
3.625%
3/31/28
691,113
700
United
States
Treasury
Note/Bond
3.500%
4/30/28
687,969
400
United
States
Treasury
Note/Bond
3.625%
5/31/28
394,875
200
United
States
Treasury
Note/Bond
4.000%
6/30/28
200,101
75
United
States
Treasury
Note/Bond
4.125%
7/31/28
75,390
300
United
States
Treasury
Note/Bond
4.625%
9/30/28
307,430
250
United
States
Treasury
Note/Bond
4.375%
11/30/28
254,141
300
United
States
Treasury
Note/Bond
4.000%
1/31/29
300,621
500
United
States
Treasury
Note/Bond
4.250%
2/28/29
506,543
300
United
States
Treasury
Note/Bond
4.125%
3/31/29
302,273
2,150
United
States
Treasury
Note/Bond
4.625%
4/30/29
2,213,156
1,000
United
States
Treasury
Note/Bond
4.500%
5/31/29
1,024,844
100
United
States
Treasury
Note/Bond
4.250%
6/30/29
101,383
200
United
States
Treasury
Note/Bond
4.000%
7/31/29
200,687
TOTAL
U.S.
TREASURY
(cost
$19,840,187)
19,840,866
Principal
Amount
(000)
Description
(a)
Coupon
Maturity
Value
X
–
CORPORATE
DEBT
-
24.7%
FINANCIALS
-
10.4%
$
60
AerCap
Ireland
Capital
DAC
/
AerCap
Global
Aviation
Trust
3.875%
1/23/28
57,844
20
Aflac
Inc
1.125%
3/15/26
18,879
20
Air
Lease
Corp
2.875%
1/15/26
19,335
30
Ally
Financial
Inc
7.100%
11/15/27
31,654
60
American
Express
Co
5.850%
11/05/27
62,196
90
Banco
Santander
SA
1.722%
9/14/27
83,612
131
Bank
of
America
Corp
1.734%
7/22/27
122,967
160
Bank
of
America
Corp
4.376%
4/27/28
158,001
Principal
Amount
(000)
Description
(a)
Coupon
Maturity
Value
FINANCIALS
(continued)
$
40
Bank
of
Montreal
5.717%
9/25/28
$
41,431
50
Bank
of
New
York
Mellon
Corp/
The
0.750%
1/28/26
47,136
50
Bank
of
Nova
Scotia/The
1.350%
6/24/26
46,858
80
Barclays
PLC
2.279%
11/24/27
75,072
11
Boston
Properties
LP
2.750%
10/01/26
10,372
20
Brixmor
Operating
Partnership
LP
3.900%
3/15/27
19,418
30
Canadian
Imperial
Bank
of
Commerce
3.945%
8/04/25
29,656
50
Canadian
Imperial
Bank
of
Commerce
5.260%
4/08/29
50,831
74
Capital
One
Financial
Corp
7.149%
10/29/27
77,156
14
Capital
One
Financial
Corp
3.800%
1/31/28
13,503
20
Centene
Corp
4.250%
12/15/27
19,364
20
Charles
Schwab
Corp/The
1.150%
5/13/26
18,704
17
Charles
Schwab
Corp/The
2.450%
3/03/27
16,037
20
Charles
Schwab
Corp/The
5.643%
5/19/29
20,491
150
Citigroup
Inc
4.658%
5/24/28
149,266
60
Citizens
Financial
Group
Inc
2.850%
7/27/26
57,425
30
Cooperatieve
Rabobank
UA
4.375%
8/04/25
29,683
60
Deutsche
Bank
AG/New
York
NY
2.129%
11/24/26
57,473
30
Digital
Realty
Trust
LP
3.700%
8/15/27
29,025
20
Elevance
Health
Inc
3.650%
12/01/27
19,390
20
Equitable
Holdings
Inc
4.350%
4/20/28
19,635
20
Fifth
Third
Bancorp
1.707%
11/01/27
18,592
20
GATX
Corp
3.250%
9/15/26
19,330
170
Goldman
Sachs
Group
Inc/The
4.482%
8/23/28
167,966
24
Goldman
Sachs
Group
Inc/The
6.484%
10/24/29
25,397
20
Healthpeak
OP
LLC
3.250%
7/15/26
19,376
122
HSBC
Holdings
PLC
4.755%
6/09/28
121,299
60
Humana
Inc
5.750%
12/01/28
62,111
30
ING
Groep
NV
1.726%
4/01/27
28,381
260
JPMorgan
Chase
&
Co
2.947%
2/24/28
248,119
58
JPMorgan
Chase
&
Co
4.851%
7/25/28
58,084
50
JPMorgan
Chase
&
Co
4.995%
7/22/30
50,371
40
Kimco
Realty
OP
LLC
3.800%
4/01/27
38,938
20
(b)
Lincoln
National
Corp
3.625%
12/12/26
19,418
60
Lloyds
Banking
Group
PLC
4.582%
12/10/25
59,382
30
(b)
M&T
Bank
Corp
7.413%
10/30/29
32,246
20
Manulife
Financial
Corp
4.150%
3/04/26
19,770
60
Mitsubishi
UFJ
Financial
Group
Inc
4.080%
4/19/28
58,840
83
Morgan
Stanley
5.164%
4/20/29
83,836
50
Morgan
Stanley
5.042%
7/19/30
50,348
40
Nasdaq
Inc
5.350%
6/28/28
40,994
30
NatWest
Group
PLC
4.800%
4/05/26
29,887
5
ORIX
Corp
5.000%
9/13/27
5,038
20
PNC
Financial
Services
Group
Inc/The
1.150%
8/13/26
18,600
50
PNC
Financial
Services
Group
Inc/The
6.615%
10/20/27
51,782
10
Progressive
Corp/The
2.500%
3/15/27
9,473
50
Royal
Bank
of
Canada
1.200%
4/27/26
46,989
50
(b)
Royal
Bank
of
Canada
4.969%
8/02/30
50,427
40
Santander
Holdings
USA
Inc
2.490%
1/06/28
37,280
20
Santander
UK
Group
Holdings
PLC
1.673%
6/14/27
18,727
20
SITE
Centers
Corp
4.700%
6/01/27
20,013
20
(b)
State
Street
Corp
5.820%
11/04/28
20,703
Nuveen
ESG
1-5
Year
U.S.
Aggregate
Bond
ETF
(NUSA)
(continued)
Portfolio
of
Investments
July
31,
2024
Principal
Amount
(000)
Description
(a)
Coupon
Maturity
Value
FINANCIALS
(continued)
$
68
Sumitomo
Mitsui
Financial
Group
Inc
3.784%
3/09/26
$
66,764
20
Toronto-Dominion
Bank/The
1.200%
6/03/26
18,759
50
Toronto-Dominion
Bank/The
1.250%
9/10/26
46,480
50
Truist
Financial
Corp
7.161%
10/30/29
53,857
50
UBS
Group
AG
4.550%
4/17/26
49,576
50
UnitedHealth
Group
Inc
4.600%
4/15/27
50,143
70
US
Bancorp
3.100%
4/27/26
67,842
30
Ventas
Realty
LP
3.850%
4/01/27
29,177
50
Westpac
Banking
Corp
5.050%
4/16/29
51,036
20
Willis
North
America
Inc
4.650%
6/15/27
19,883
TOTAL
FINANCIALS
3,387,648
INDUSTRIAL
-
12.7%
40
3M
Co
2.250%
9/19/26
37,939
60
Adobe
Inc
4.850%
4/04/27
60,695
10
Amcor
Finance
USA
Inc
3.625%
4/28/26
9,758
50
Amcor
Group
Finance
PLC
5.450%
5/23/29
50,983
50
American
Honda
Finance
Corp
5.250%
7/07/26
50,488
50
American
Tower
Corp
3.650%
3/15/27
48,512
70
Amgen
Inc
3.200%
11/02/27
66,911
50
Astrazeneca
Finance
LLC
1.200%
5/28/26
47,017
70
AT&T
Inc
1.700%
3/25/26
66,480
20
AutoZone
Inc
5.050%
7/15/26
20,106
20
Baxter
International
Inc
2.600%
8/15/26
19,126
50
Bristol-Myers
Squibb
Co
3.200%
6/15/26
48,676
40
Broadcom
Corp
/
Broadcom
Cayman
Finance
Ltd
3.875%
1/15/27
39,212
20
Canadian
Pacific
Railway
Co
1.750%
12/02/26
18,704
77
Caterpillar
Financial
Services
Corp
0.800%
11/13/25
73,348
20
Celanese
US
Holdings
LLC
6.165%
7/15/27
20,536
40
Charter
Communications
Operating
LLC
/
Charter
Communications
Operating
Capital
6.150%
11/10/26
40,765
21
Cigna
Group/The
1.250%
3/15/26
19,824
60
Cisco
Systems
Inc
4.900%
2/26/26
60,319
20
CNH
Industrial
Capital
LLC
1.450%
7/15/26
18,719
80
Comcast
Corp
3.300%
4/01/27
77,424
20
Conagra
Brands
Inc
5.300%
10/01/26
20,181
80
Crown
Castle
Inc
2.900%
3/15/27
76,083
70
CVS
Health
Corp
3.625%
4/01/27
67,981
14
Dell
International
LLC
/
EMC
Corp
6.020%
6/15/26
14,230
20
Dell
International
LLC
/
EMC
Corp
5.250%
2/01/28
20,373
20
Discovery
Communications
LLC
3.950%
3/20/28
18,820
10
Dollar
General
Corp
4.625%
11/01/27
9,916
10
DXC
Technology
Co
1.800%
9/15/26
9,321
50
Eastman
Chemical
Co
5.000%
8/01/29
50,148
20
eBay
Inc
1.400%
5/10/26
18,794
10
Equinix
Inc
1.450%
5/15/26
9,393
20
(b)
Equinix
Inc
1.800%
7/15/27
18,390
60
Fidelity
National
Information
Services
Inc
1.650%
3/01/28
53,879
30
Fiserv
Inc
5.450%
3/02/28
30,705
30
Fortive
Corp
3.150%
6/15/26
28,986
30
General
Mills
Inc
4.200%
4/17/28
29,553
Principal
Amount
(000)
Description
(a)
Coupon
Maturity
Value
INDUSTRIAL
(continued)
$
50
General
Motors
Financial
Co
Inc
5.400%
4/06/26
$
50,244
60
General
Motors
Financial
Co
Inc
5.800%
1/07/29
61,707
40
Gilead
Sciences
Inc
2.950%
3/01/27
38,449
60
Global
Payments
Inc
4.950%
8/15/27
60,127
100
HCA
Inc
3.125%
3/15/27
95,784
31
Home
Depot
Inc/The
2.125%
9/15/26
29,487
10
Home
Depot
Inc/The
4.900%
4/15/29
10,189
40
HP
Inc
1.450%
6/17/26
37,597
20
Illumina
Inc
5.750%
12/13/27
20,510
60
Intel
Corp
2.600%
5/19/26
57,767
60
International
Business
Machines
Corp
3.300%
5/15/26
58,609
20
IQVIA
Inc
6.250%
2/01/29
20,897
10
Jabil
Inc
4.250%
5/15/27
9,820
30
John
Deere
Capital
Corp
0.700%
1/15/26
28,319
93
John
Deere
Capital
Corp
4.950%
7/14/28
94,617
40
Johnson
&
Johnson
0.550%
9/01/25
38,283
50
Johnson
&
Johnson
4.800%
6/01/29
51,253
50
Kellanova
3.400%
11/15/27
47,983
60
Keurig
Dr
Pepper
Inc
5.050%
3/15/29
60,950
20
Kinder
Morgan
Inc
1.750%
11/15/26
18,689
30
Kinder
Morgan
Inc
4.300%
3/01/28
29,608
40
Kraft
Heinz
Foods
Co
3.000%
6/01/26
38,767
10
Kyndryl
Holdings
Inc
2.050%
10/15/26
9,341
20
Laboratory
Corp
of
America
Holdings
3.600%
9/01/27
19,319
30
Lennox
International
Inc
1.700%
8/01/27
27,428
40
Lowe's
Cos
Inc
4.800%
4/01/26
39,972
30
Mastercard
Inc
4.875%
3/09/28
30,591
50
McDonald's
Corp
5.000%
5/17/29
50,901
10
McKesson
Corp
1.300%
8/15/26
9,336
30
Merck
&
Co
Inc
4.050%
5/17/28
29,794
60
Microsoft
Corp
2.400%
8/08/26
57,719
20
Mondelez
International
Inc
2.625%
3/17/27
18,997
10
Motorola
Solutions
Inc
4.600%
2/23/28
9,965
30
MPLX
LP
4.125%
3/01/27
29,467
20
MPLX
LP
4.250%
12/01/27
19,612
20
Nokia
Oyj
4.375%
6/12/27
19,451
50
Nutrien
Ltd
5.200%
6/21/27
50,531
26
ONEOK
Inc
5.550%
11/01/26
26,363
80
Oracle
Corp
2.800%
4/01/27
76,140
30
PACCAR
Financial
Corp
5.050%
8/10/26
30,295
50
PACCAR
Financial
Corp
5.000%
5/13/27
50,729
10
Parker-Hannifin
Corp
4.250%
9/15/27
9,863
10
PayPal
Holdings
Inc
3.900%
6/01/27
9,829
30
PepsiCo
Inc
5.125%
11/10/26
30,412
20
PepsiCo
Inc
2.625%
3/19/27
19,090
50
(b)
PepsiCo
Inc
4.500%
7/17/29
50,429
70
Pfizer
Investment
Enterprises
Pte
Ltd
4.450%
5/19/26
69,736
30
Phillips
66
Co
3.750%
3/01/28
29,038
40
Procter
&
Gamble
Co/The
1.900%
2/01/27
37,720
10
Regal
Rexnord
Corp
6.050%
4/15/28
10,248
10
Republic
Services
Inc
2.900%
7/01/26
9,659
20
Rogers
Communications
Inc
3.200%
3/15/27
19,210
30
Roper
Technologies
Inc
1.400%
9/15/27
27,142
11
Ryder
System
Inc
2.850%
3/01/27
10,480
50
Ryder
System
Inc
6.300%
12/01/28
52,938
10
S&P
Global
Inc
2.450%
3/01/27
9,482
Nuveen
ESG
1-5
Year
U.S.
Aggregate
Bond
ETF
(NUSA)
(continued)
Portfolio
of
Investments
July
31,
2024
Principal
Amount
(000)
Description
(a)
Coupon
Maturity
Value
INDUSTRIAL
(continued)
$
50
Sabine
Pass
Liquefaction
LLC
5.000%
3/15/27
$
50,149
20
Sherwin-Williams
Co/The
3.450%
6/01/27
19,319
20
Starbucks
Corp
3.500%
3/01/28
19,241
60
Sysco
Corp
3.250%
7/15/27
57,594
20
Thermo
Fisher
Scientific
Inc
5.000%
1/31/29
20,401
80
Toyota
Motor
Corp
5.275%
7/13/26
80,889
10
Toyota
Motor
Credit
Corp
4.450%
5/18/26
9,959
50
Toyota
Motor
Credit
Corp
4.650%
1/05/29
50,249
32
TransCanada
PipeLines
Ltd
4.250%
5/15/28
31,337
50
Tyco
Electronics
Group
SA
4.625%
2/01/30
50,124
20
Unilever
Capital
Corp
4.875%
9/08/28
20,332
30
Verizon
Communications
Inc
3.000%
3/22/27
28,815
40
Verizon
Communications
Inc
2.100%
3/22/28
36,664
50
Visa
Inc
3.150%
12/14/25
48,997
10
VMware
LLC
1.400%
8/15/26
9,327
50
VMware
LLC
3.900%
8/21/27
48,620
50
Walt
Disney
Co/The
1.750%
1/13/26
47,890
30
Warnermedia
Holdings
Inc
3.755%
3/15/27
28,577
10
Waste
Management
Inc
3.150%
11/15/27
9,587
20
Western
Union
Co/The
1.350%
3/15/26
18,837
80
Weyerhaeuser
Co
4.750%
5/15/26
79,826
10
Zimmer
Biomet
Holdings
Inc
5.350%
12/01/28
10,233
TOTAL
INDUSTRIAL
4,110,145
UTILITY
-
1.6%
8
American
Water
Capital
Corp
2.950%
9/01/27
7,612
10
Atmos
Energy
Corp
3.000%
6/15/27
9,572
20
CMS
Energy
Corp
3.000%
5/15/26
19,313
50
DTE
Energy
Co
4.950%
7/01/27
50,185
10
(b)
Enel
Americas
SA
4.000%
10/25/26
9,724
10
Evergy
Kansas
Central
Inc
2.550%
7/01/26
9,618
49
Eversource
Energy
2.900%
3/01/27
46,675
27
Exelon
Corp
3.400%
4/15/26
26,374
20
Fortis
Inc/Canada
3.055%
10/04/26
19,195
10
Louisville
Gas
and
Electric
Co
3.300%
10/01/25
9,803
50
National
Rural
Utilities
Cooperative
Finance
Corp
5.100%
5/06/27
50,763
26
NiSource
Inc
0.950%
8/15/25
24,911
50
OGE
Energy
Corp
5.450%
5/15/29
51,212
20
Public
Service
Electric
and
Gas
Co
2.250%
9/15/26
19,035
50
Public
Service
Enterprise
Group
Inc
5.200%
4/01/29
50,852
48
Sempra
5.400%
8/01/26
48,429
36
Southern
California
Edison
Co
4.900%
6/01/26
35,984
20
WEC
Energy
Group
Inc
5.000%
9/27/25
19,981
TOTAL
UTILITY
509,238
TOTAL
CORPORATE
DEBT
(cost
$7,979,026)
8,007,031
Principal
Amount
(000)
Description
(a)
Coupon
Maturity
Value
X
–
SECURITIZED
-
7.3%
$
50
BANK
2021-BNK34
2021
BN34
1.935%
6/15/63
46,823
100
Benchmark
2021-B29
Mortgage
Trust
2021
B29
2.024%
9/15/54
90,046
50
Benchmark
2024-V7
Mortgage
Trust
2024
V7
6.228%
6/15/29
52,525
100
CarMax
Auto
Owner
Trust
2023
4
6.000%
7/17/28
101,888
68
Fannie
Mae
Pool
FN
MA3798
3.000%
10/01/34
64,211
18
Fannie
Mae
Pool
FN
MA3828
3.000%
11/01/34
17,636
Principal
Amount
(000)
Description
(a)
Coupon
Maturity
Value
$
20
Fannie
Mae
Pool
FN
MA3897
3.000%
1/01/35
$
19,293
112
Fannie
Mae
Pool
FN
MA3985
3.000%
4/01/35
106,223
266
Fannie
Mae
Pool
FN
MA4206
2.000%
12/01/35
239,950
107
Fannie
Mae
Pool
FN
MA4417
1.500%
9/01/36
93,724
199
Fannie
Mae
Pool
FN
MA4469
1.500%
11/01/36
174,512
154
Fannie
Mae
Pool
FN
MA4567
2022
2022
2.000%
3/01/37
138,295
78
Fannie
Mae
Pool
FN
MA4583
2.500%
4/01/37
71,501
120
Fannie
Mae
Pool
FN
MA4602
2.000%
5/01/37
107,506
83
Fannie
Mae
Pool
FN
MA4990
4.500%
4/01/38
82,628
88
Fannie
Mae
Pool
FN
MA5023
4.000%
5/01/38
85,701
98
Fannie
Mae
Pool
FN
MA5061
5.500%
6/01/38
99,469
40
Fannie
Mae
Pool
FN
MA5093
5.000%
7/01/38
40,423
95
Fannie
Mae
Pool
FN
MA5145
6.000%
9/01/38
96,576
68
Freddie
Mac
Gold
Pool
FG
G18642
3.500%
4/01/32
66,393
199
Freddie
Mac
Multifamily
Structured
Pass
Through
Certificates
2015
K046
3.205%
3/25/25
195,917
100
Freddie
Mac
Multifamily
Structured
Pass
Through
Certificates
2023
K505
4.819%
6/25/28
101,353
50
John
Deere
Owner
Trust
2021
B
0.740%
5/15/28
48,505
48
(c)
SoFi
Professional
Loan
Program
2020-C
Trust
2020
C
1.950%
2/15/46
44,345
50
Toyota
Auto
Receivables
2021-B
Owner
Trust
2021
B
0.530%
10/15/26
48,410
45
Verizon
Master
Trust
Series
2024-4
2024
4
5.210%
6/20/29
45,479
100
Wells
Fargo
Commercial
Mortgage
Trust
2018-C44
2018
C44
3.948%
5/15/51
96,812
TOTAL
SECURITIZED
(cost
$2,489,642)
2,376,144
Principal
Amount
(000)
Description
(a)
Coupon
Maturity
Value
X
–
GOVERNMENT
RELATED
-
5.0%
GOVERNMENT
AGENCY
-
2.2%
$
50
Export
Development
Canada
4.375%
6/29/26
50,003
100
Federal
National
Mortgage
Association
0.625%
4/22/25
96,939
37
Kreditanstalt
fuer
Wiederaufbau
0.625%
1/22/26
34,974
265
Kreditanstalt
fuer
Wiederaufbau
3.625%
4/01/26
261,555
110
Landwirtschaftliche
Rentenbank
1.750%
7/27/26
104,586
10
Oesterreichische
Kontrollbank
AG
2.875%
5/23/25
9,835
60
(b)
Oesterreichische
Kontrollbank
AG
0.500%
2/02/26
56,507
50
Oesterreichische
Kontrollbank
AG
4.750%
5/21/27
50,698
36
Svensk
Exportkredit
AB
4.375%
2/13/26
35,879
TOTAL
GOVERNMENT
AGENCY
700,976
MUNICIPAL
BONDS
-
0.5%
(d)
28
Province
of
British
Columbia
Canada
(No
Opt.
Call)
4.800%
11/15/28
28,671
60
Province
of
Ontario
Canada
(No
Opt.
Call)
4.200%
1/18/29
60,001
60
Province
of
Quebec
Canada
(No
Opt.
Call)
4.500%
4/03/29
60,789
TOTAL
MUNICIPAL
BONDS
149,461
Nuveen
ESG
1-5
Year
U.S.
Aggregate
Bond
ETF
(NUSA)
(continued)
Portfolio
of
Investments
July
31,
2024
Principal
Amount
(000)
Description
(a)
Coupon
Maturity
Value
SOVEREIGN
DEBT
-
2.3%
$
100
African
Development
Bank
0.875%
7/22/26
$
93,404
50
Asian
Development
Bank
4.250%
1/09/26
49,807
130
Asian
Development
Bank
1.000%
4/14/26
122,730
50
Canada
Government
International
Bond
3.750%
4/26/28
49,442
30
European
Bank
for
Reconstruction
&
Development
0.500%
5/19/25
28,963
50
European
Investment
Bank
2.750%
8/15/25
48,998
110
European
Investment
Bank
2.375%
5/24/27
104,902
50
European
Investment
Bank
4.750%
6/15/29
51,600
100
Inter-American
Development
Bank
4.500%
5/15/26
100,154
60
International
Bank
for
Reconstruction
&
Development
4.625%
8/01/28
61,234
32
International
Finance
Corp
3.625%
9/15/25
31,633
18
International
Finance
Corp
4.500%
7/13/28
18,289
TOTAL
SOVEREIGN
DEBT
761,156
TOTAL
GOVERNMENT
RELATED
(cost
$1,519,502)
1,611,593
TOTAL
LONG-TERM
INVESTMENTS
(cost
$31,828,357)
31,835,634
Shares
Description
(a)
Coupon
Value
INVESTMENTS
PURCHASED
WITH
COLLATERAL
FROM
SECURITIES
LENDING
-
0.6%
196,094
(e)
State
Street
Navigator
Securities
Lending
Government
Money
Market
Portfolio
5.310%(f)
$
196,094
TOTAL
INVESTMENTS
PURCHASED
WITH
COLLATERAL
FROM
SECURITIES
LENDING
(cost
$196,094)
196,094
TOTAL
INVESTMENTS
(cost
$32,024,451
)
-
98.8%
32,031,728
OTHER
ASSETS
&
LIABILITIES,
NET
-
1.2%
401,282
NET
ASSETS
-
100%
$
32,433,010
For
Fund
portfolio
compliance
purposes,
the
Fund’s
industry
classifications
refer
to
any
one
or
more
of
the
industry
sub-classifications
used
by
one
or
more
widely
recognized
market
indexes
or
ratings
group
indexes,
and/or
as
defined
by
Fund
management.
This
definition
may
not
apply
for
purposes
of
this
report,
which
may
combine
industry
sub-classifications
into
sectors
for
reporting
ease.
(a)
All
percentages
shown
in
the
Portfolio
of
Investments
are
based
on
net
assets.
(b)
Investment,
or
a
portion
of
investment,
is
out
on
loan
for
securities
lending.
The
total
value
of
the
securities
out
on
loan
as
of
the
end
of
the
reporting
period
was
$191,735.
(c)
Security
is
exempt
from
registration
under
Rule
144A
of
the
Securities
Act
of
1933,
as
amended.
These
securities
are
deemed
liquid
and
may
be
resold
in
transactions
exempt
from
registration,
which
are
normally
those
transactions
with
qualified
institutional
buyers.
As
of
the
end
of
the
reporting
period,
the
aggregate
value
of
these
securities
is
$44,345
or
0.1%
of
Total
Investments.
(d)
Optional
Call
Provisions:
Dates
(month
and
year)
and
prices
of
the
earliest
optional
call
or
redemption.
There
may
be
other
call
provisions
at
varying
prices
at
later
dates.
Certain
mortgage-backed
securities
may
be
subject
to
periodic
principal
paydowns.
Optional
Call
Provisions
are
not
covered
by
the
report
of
independent
registered
public
accounting
firm.
(e)
The
Fund
may
loan
securities
representing
up
to
one
third
of
the
value
of
its
total
assets
(which
includes
collateral
for
securities
on
loan)
to
broker
dealers,
banks,
and
other
institutions.
The
collateral
maintained
by
the
Fund
shall
have
a
value,
at
the
inception
of
each
loan,
equal
to
not
less
than
100%
of
the
value
of
the
loaned
securities.
The
cash
collateral
received
by
the
Fund
is
invested
in
this
money
market
fund.
(f)
The
rate
shown
is
the
one-day
yield
as
of
the
end
of
the
reporting
period.
S&P
Standard
&
Poor's
See
Notes
to
Financial
Statements
Nuveen
ESG
High
Yield
Corporate
Bond
ETF
(NUHY)
Portfolio
of
Investments
July
31,
2024
Principal
Amount
(000)
Description
(a)
Coupon
Maturity
Value
LONG-TERM
INVESTMENTS
-
97.9%
X
–
CORPORATE
DEBT
-
97.9%
FINANCIALS
-
9.1%
$
150
Ally
Financial
Inc
6.700%
2/14/33
$
154,182
50
(b)
Apollo
Commercial
Real
Estate
Finance
Inc
4.625%
6/15/29
42,662
250
(b)
Baldwin
Insurance
Group
Holdings
LLC
/
Baldwin
Insurance
Group
Holdings
Finance
7.125%
5/15/31
257,784
20
(b)
Bread
Financial
Holdings
Inc
7.000%
1/15/26
19,938
10
(b)
Bread
Financial
Holdings
Inc
9.750%
3/15/29
10,722
160
(b)
Brookfield
Property
REIT
Inc
/
BPR
Cumulus
LLC
/
BPR
Nimbus
LLC
/
GGSI
Sellco
LL
4.500%
4/01/27
151,245
10
(b)
Compass
Group
Diversified
Holdings
LLC
5.250%
4/15/29
9,582
150
(b),(c)
Credit
Acceptance
Corp
9.250%
12/15/28
160,072
19
Diversified
Healthcare
Trust
4.375%
3/01/31
14,472
200
(b)
Encore
Capital
Group
Inc
8.500%
5/15/30
207,471
100
(b)
FTAI
Aviation
Ltd
7.000%
5/01/31
103,102
450
(b)
Global
Atlantic
Fin
Co
4.700%
10/15/51
422,128
100
(b)
Global
Atlantic
Fin
Co
7.950%
10/15/54
101,484
200
goeasy
Ltd
9.250%
12/01/28
204,570
100
(b)
goeasy
Ltd
9.250%
12/01/28
107,242
70
(b)
Howard
Hughes
Corp/The
5.375%
8/01/28
67,882
140
(b)
Howard
Hughes
Corp/The
4.375%
2/01/31
125,130
90
(b)
Intesa
Sanpaolo
SpA
4.198%
6/01/32
77,921
410
(b)
Jefferies
Finance
LLC
/
JFIN
Co-Issuer
Corp
5.000%
8/15/28
380,794
200
Kennedy-Wilson
Inc
4.750%
3/01/29
176,018
350
Kennedy-Wilson
Inc
4.750%
2/01/30
299,135
265
(c)
Kennedy-Wilson
Inc
5.000%
3/01/31
223,645
70
(b)
Liberty
Mutual
Group
Inc
4.125%
12/15/51
65,519
30
(b)
Molina
Healthcare
Inc
4.375%
6/15/28
28,559
110
(b)
Molina
Healthcare
Inc
3.875%
11/15/30
99,477
90
(b)
Molina
Healthcare
Inc
3.875%
5/15/32
79,367
200
(b)
Nationstar
Mortgage
Holdings
Inc
5.500%
8/15/28
194,242
300
OneMain
Finance
Corp
3.875%
9/15/28
274,056
300
OneMain
Finance
Corp
7.875%
3/15/30
312,799
150
OneMain
Finance
Corp
4.000%
9/15/30
131,303
400
OneMain
Finance
Corp
7.500%
5/15/31
411,309
140
(b)
Park
Intermediate
Holdings
LLC
/
PK
Domestic
Property
LLC
/
PK
Finance
Co-Issuer
5.875%
10/01/28
138,600
150
(b)
Park
Intermediate
Holdings
LLC
/
PK
Domestic
Property
LLC
/
PK
Finance
Co-Issuer
4.875%
5/15/29
141,736
80
(b)
PennyMac
Financial
Services
Inc
5.375%
10/15/25
79,521
210
(b)
PennyMac
Financial
Services
Inc
7.875%
12/15/29
219,825
145
(b),(c)
PennyMac
Financial
Services
Inc
5.750%
9/15/31
138,521
310
(b)
PROG
Holdings
Inc
6.000%
11/15/29
298,208
100
RHP
Hotel
Properties
LP
/
RHP
Finance
Corp
4.750%
10/15/27
97,082
Nuveen
ESG
High
Yield
Corporate
Bond
ETF
(NUHY)
(continued)
Portfolio
of
Investments
July
31,
2024
Principal
Amount
(000)
Description
(a)
Coupon
Maturity
Value
FINANCIALS
(continued)
$
360
(b)
RHP
Hotel
Properties
LP
/
RHP
Finance
Corp
4.500%
2/15/29
$
341,056
200
(b)
RHP
Hotel
Properties
LP
/
RHP
Finance
Corp
6.500%
4/01/32
202,259
40
SLM
Corp
4.200%
10/29/25
39,269
251
SLM
Corp
3.125%
11/02/26
237,525
70
(b)
Starwood
Property
Trust
Inc
4.375%
1/15/27
67,216
65
(b)
Starwood
Property
Trust
Inc
7.250%
4/01/29
66,849
80
Synchrony
Financial
7.250%
2/02/33
81,821
270
(b)
UniCredit
SpA
5.459%
6/30/35
259,195
300
Western
Alliance
Bancorp
3.000%
6/15/31
268,509
40
(b)
XHR
LP
6.375%
8/15/25
40,004
460
(b)
XHR
LP
4.875%
6/01/29
434,065
TOTAL
FINANCIALS
8,065,073
INDUSTRIAL
-
87.9%
302
(b)
1011778
BC
ULC
/
New
Red
Finance
Inc
3.875%
1/15/28
283,946
350
(b)
1011778
BC
ULC
/
New
Red
Finance
Inc
4.375%
1/15/28
332,811
320
(b),(c)
1011778
BC
ULC
/
New
Red
Finance
Inc
3.500%
2/15/29
293,260
930
(b)
1011778
BC
ULC
/
New
Red
Finance
Inc
4.000%
10/15/30
829,536
60
(b)
180
Medical
Inc
3.875%
10/15/29
54,392
100
(b),(c)
ACCO
Brands
Corp
4.250%
3/15/29
91,042
130
(b),(c)
AdaptHealth
LLC
4.625%
8/01/29
116,043
310
(b),(c)
AdaptHealth
LLC
5.125%
3/01/30
277,085
200
(b)
Adient
Global
Holdings
Ltd
7.000%
4/15/28
204,429
150
(b)
Adient
Global
Holdings
Ltd
8.250%
4/15/31
157,707
200
(b)
Air
Canada
3.875%
8/15/26
192,368
350
(b)
Albertsons
Cos
Inc
/
Safeway
Inc
/
New
Albertsons
LP
/
Albertsons
LLC
4.625%
1/15/27
341,234
150
(b)
Albertsons
Cos
Inc
/
Safeway
Inc
/
New
Albertsons
LP
/
Albertsons
LLC
5.875%
2/15/28
148,727
550
(b),(c)
Albertsons
Cos
Inc
/
Safeway
Inc
/
New
Albertsons
LP
/
Albertsons
LLC
6.500%
2/15/28
557,955
410
(b)
Albertsons
Cos
Inc
/
Safeway
Inc
/
New
Albertsons
LP
/
Albertsons
LLC
4.875%
2/15/30
391,718
110
(b),(c)
Allegiant
Travel
Co
7.250%
8/15/27
102,594
40
(b)
Allison
Transmission
Inc
5.875%
6/01/29
39,992
110
(b),(c)
Allison
Transmission
Inc
3.750%
1/30/31
97,905
200
(b),(c)
Amer
Sports
Co
6.750%
2/16/31
198,940
410
(b),(c)
American
Airlines
Inc
7.250%
2/15/28
409,652
270
(b)
American
Airlines
Inc
8.500%
5/15/29
277,968
400
(b)
American
Airlines
Inc/
AAdvantage
Loyalty
IP
Ltd2022
1
5.750%
4/20/29
390,882
150
American
Axle
&
Manufacturing
Inc
5.000%
10/01/29
137,576
110
(b)
AmeriGas
Partners
LP
/
AmeriGas
Finance
Corp
9.375%
6/01/28
115,154
100
(b)
AMN
Healthcare
Inc
4.625%
10/01/27
96,062
30
(b)
Antero
Midstream
Partners
LP
/
Antero
Midstream
Finance
Corp
5.750%
1/15/28
29,798
Principal
Amount
(000)
Description
(a)
Coupon
Maturity
Value
INDUSTRIAL
(continued)
$
170
(b)
Antero
Midstream
Partners
LP
/
Antero
Midstream
Finance
Corp
5.375%
6/15/29
$
166,227
172
(b)
Anywhere
Real
Estate
Group
LLC
/
Anywhere
Co-Issuer
Corp
7.000%
4/15/30
145,877
20
(b)
Anywhere
Real
Estate
Group
LLC
/
Realogy
Co-Issuer
Corp
5.750%
1/15/29
13,748
120
(b)
APX
Group
Inc
6.750%
2/15/27
119,861
460
(b)
APX
Group
Inc
5.750%
7/15/29
447,524
120
(b)
Archrock
Partners
LP
/
Archrock
Partners
Finance
Corp
6.875%
4/01/27
120,532
510
(b)
Archrock
Partners
LP
/
Archrock
Partners
Finance
Corp
6.250%
4/01/28
508,773
80
(b),(c)
Ardagh
Metal
Packaging
Finance
USA
LLC
/
Ardagh
Metal
Packaging
Finance
PLC
4.000%
9/01/29
67,948
175
(b)
Asbury
Automotive
Group
Inc
4.625%
11/15/29
163,523
260
(b)
Asbury
Automotive
Group
Inc
5.000%
2/15/32
239,598
120
(b)
ASGN
Inc
4.625%
5/15/28
114,982
200
(b)
Aston
Martin
Capital
Holdings
Ltd
10.000%
3/31/29
200,806
120
(b)
Avantor
Funding
Inc
4.625%
7/15/28
115,537
100
(b)
Avantor
Funding
Inc
3.875%
11/01/29
92,144
100
(b)
Avient
Corp
7.125%
8/01/30
102,675
140
(b)
Avis
Budget
Car
Rental
LLC
/
Avis
Budget
Finance
Inc
4.750%
4/01/28
128,749
200
(b)
Avis
Budget
Car
Rental
LLC
/
Avis
Budget
Finance
Inc
5.375%
3/01/29
183,056
50
(b),(c)
Axalta
Coating
Systems
Dutch
Holding
B
BV
7.250%
2/15/31
52,437
60
(b)
Axalta
Coating
Systems
LLC
3.375%
2/15/29
54,617
60
(b)
Axalta
Coating
Systems
LLC
/
Axalta
Coating
Systems
Dutch
Holding
B
BV
4.750%
6/15/27
58,737
50
(c)
B&G
Foods
Inc
5.250%
9/15/27
46,838
150
(b)
B&G
Foods
Inc
8.000%
9/15/28
152,948
220
Ball
Corp
2.875%
8/15/30
188,978
200
Ball
Corp
3.125%
9/15/31
170,724
150
(b)
Bath
&
Body
Works
Inc
6.625%
10/01/30
151,425
100
(b)
Bausch
Health
Cos
Inc
4.875%
6/01/28
77,010
720
(b)
Bausch
Health
Cos
Inc
11.000%
9/30/28
673,560
55
(b)
Block
Inc
6.500%
5/15/32
55,891
29
(b)
Bombardier
Inc
7.875%
4/15/27
29,044
200
(b)
British
Telecommunications
PLC
4.875%
11/23/81
179,822
240
(b)
Brookfield
Residential
Properties
Inc
/
Brookfield
Residential
US
LLC
4.875%
2/15/30
220,015
60
(b)
Builders
FirstSource
Inc
5.000%
3/01/30
57,406
371
(b)
Builders
FirstSource
Inc
4.250%
2/01/32
331,571
150
(b)
Cable
One
Inc
4.000%
11/15/30
115,329
80
(b)
Camelot
Finance
SA
4.500%
11/01/26
77,990
100
(b)
Camelot
Return
Merger
Sub
Inc
8.750%
8/01/28
99,421
250
(b)
Catalent
Pharma
Solutions
Inc
3.125%
2/15/29
241,371
470
(b)
Catalent
Pharma
Solutions
Inc
3.500%
4/01/30
452,916
450
(b)
CCO
Holdings
LLC
/
CCO
Holdings
Capital
Corp
4.750%
3/01/30
402,864
410
(b)
CCO
Holdings
LLC
/
CCO
Holdings
Capital
Corp
4.500%
8/15/30
358,972
510
(b)
CCO
Holdings
LLC
/
CCO
Holdings
Capital
Corp
4.250%
2/01/31
433,938
Nuveen
ESG
High
Yield
Corporate
Bond
ETF
(NUHY)
(continued)
Portfolio
of
Investments
July
31,
2024
Principal
Amount
(000)
Description
(a)
Coupon
Maturity
Value
INDUSTRIAL
(continued)
$
250
(b)
CCO
Holdings
LLC
/
CCO
Holdings
Capital
Corp
4.750%
2/01/32
$
213,801
500
CCO
Holdings
LLC
/
CCO
Holdings
Capital
Corp
4.500%
5/01/32
418,639
100
(b)
CCO
Holdings
LLC
/
CCO
Holdings
Capital
Corp
4.500%
6/01/33
82,150
100
(b)
CCO
Holdings
LLC
/
CCO
Holdings
Capital
Corp
4.250%
1/15/34
78,999
210
(b)
Central
Parent
Inc
/
CDK
Global
Inc
7.250%
6/15/29
211,801
290
(b)
Century
Communities
Inc
3.875%
8/15/29
264,407
610
(b)
Charles
River
Laboratories
International
Inc
3.750%
3/15/29
564,298
750
(b)
Charles
River
Laboratories
International
Inc
4.000%
3/15/31
681,469
200
(b)
Chart
Industries
Inc
7.500%
1/01/30
208,060
130
(b)
Chart
Industries
Inc
9.500%
1/01/31
141,201
310
(b)
Chemours
Co/The
5.750%
11/15/28
290,004
420
(b),(c)
Chemours
Co/The
4.625%
11/15/29
367,869
400
(b)
CHS/Community
Health
Systems
Inc
5.625%
3/15/27
383,022
600
(b)
CHS/Community
Health
Systems
Inc
6.000%
1/15/29
557,072
200
(b)
CHS/Community
Health
Systems
Inc
5.250%
5/15/30
174,415
350
(b),(c)
Cinemark
USA
Inc
5.250%
7/15/28
338,355
45
(b)
Cinemark
USA
Inc
7.000%
8/01/32
45,799
450
(b)
Clarios
Global
LP
/
Clarios
US
Finance
Co
6.750%
5/15/28
458,243
118
(b)
Clarivate
Science
Holdings
Corp
3.875%
7/01/28
110,682
200
(b)
Clarivate
Science
Holdings
Corp
4.875%
7/01/29
188,931
310
(b)
Clear
Channel
Outdoor
Holdings
Inc
5.125%
8/15/27
300,275
350
(b)
Clear
Channel
Outdoor
Holdings
Inc
7.750%
4/15/28
309,114
440
(b)
Clear
Channel
Outdoor
Holdings
Inc
9.000%
9/15/28
467,200
410
(b)
Clear
Channel
Outdoor
Holdings
Inc
7.500%
6/01/29
352,055
250
(b)
Clear
Channel
Outdoor
Holdings
Inc
7.875%
4/01/30
254,425
120
(b)
Cogent
Communications
Group
LLC
3.500%
5/01/26
115,287
460
(b)
Coherent
Corp
5.000%
12/15/29
438,793
350
(b)
Concentra
Escrow
Issuer
Corp
6.875%
7/15/32
360,610
300
(b)
Condor
Merger
Sub
Inc
7.375%
2/15/30
279,842
700
(b)
Connect
Finco
SARL
/
Connect
US
Finco
LLC
6.750%
10/01/26
688,117
350
(b)
Consolidated
Communications
Inc
6.500%
10/01/28
315,217
382
Crowdstrike
Holdings
Inc
3.000%
2/15/29
342,806
170
(b)
Cushman
&
Wakefield
US
Borrower
LLC
6.750%
5/15/28
170,338
260
(b)
DaVita
Inc
4.625%
6/01/30
238,095
640
(b)
DaVita
Inc
3.750%
2/15/31
553,616
590
(b)
Directv
Financing
LLC
/
Directv
Financing
Co-Obligor
Inc
5.875%
8/15/27
568,142
270
(b)
Domtar
Corp
6.750%
10/01/28
245,764
140
(b)
DT
Midstream
Inc
4.125%
6/15/29
130,873
Principal
Amount
(000)
Description
(a)
Coupon
Maturity
Value
INDUSTRIAL
(continued)
$
161
(b)
DT
Midstream
Inc
4.375%
6/15/31
$
148,437
70
(b)
Dycom
Industries
Inc
4.500%
4/15/29
66,136
100
(b)
Dye
&
Durham
Ltd
8.625%
4/15/29
102,325
310
(b)
Edgewell
Personal
Care
Co
5.500%
6/01/28
303,888
100
(b)
Edgewell
Personal
Care
Co
4.125%
4/01/29
93,053
170
(b)
Elastic
NV
4.125%
7/15/29
156,624
300
(b)
Element
Solutions
Inc
3.875%
9/01/28
277,898
120
Encompass
Health
Corp
4.500%
2/01/28
116,014
210
Encompass
Health
Corp
4.750%
2/01/30
200,188
170
(b)
Enerflex
Ltd
9.000%
10/15/27
175,297
460
(b)
Energizer
Holdings
Inc
4.750%
6/15/28
436,339
250
(b)
Energizer
Holdings
Inc
4.375%
3/31/29
230,817
200
(b)
Entegris
Inc
5.950%
6/15/30
199,534
430
(b)
EQM
Midstream
Partners
LP
6.500%
7/01/27
438,193
12
(b)
EQM
Midstream
Partners
LP
7.500%
6/01/30
12,951
100
(b)
Fair
Isaac
Corp
4.000%
6/15/28
94,089
550
(b)
Frontier
Communications
Holdings
LLC
5.875%
10/15/27
544,588
800
(b)
Frontier
Communications
Holdings
LLC
5.000%
5/01/28
770,449
270
(b),(c)
Frontier
Communications
Holdings
LLC
6.750%
5/01/29
255,113
650
(b)
Frontier
Communications
Holdings
LLC
8.750%
5/15/30
680,961
270
(b)
Frontier
Communications
Holdings
LLC
8.625%
3/15/31
282,797
335
(b)
Gap
Inc/The
3.625%
10/01/29
292,822
100
(b)
Garrett
Motion
Holdings
Inc
/
Garrett
LX
I
Sarl
7.750%
5/31/32
101,681
150
(b)
Gates
Corp/DE
6.875%
7/01/29
152,739
150
(b)
Gen
Digital
Inc
6.750%
9/30/27
152,569
150
(b),(c)
Gen
Digital
Inc
7.125%
9/30/30
155,071
320
Genesis
Energy
LP
/
Genesis
Energy
Finance
Corp
8.000%
1/15/27
327,209
300
Genesis
Energy
LP
/
Genesis
Energy
Finance
Corp
7.750%
2/01/28
304,427
400
Genesis
Energy
LP
/
Genesis
Energy
Finance
Corp
8.250%
1/15/29
416,150
400
Genesis
Energy
LP
/
Genesis
Energy
Finance
Corp
8.875%
4/15/30
423,490
25
Genesis
Energy
LP
/
Genesis
Energy
Finance
Corp
7.875%
5/15/32
25,529
110
(b),(c)
Glatfelter
Corp
4.750%
11/15/29
93,184
100
Goodyear
Tire
&
Rubber
Co/
The
5.000%
7/15/29
94,380
200
(c)
Goodyear
Tire
&
Rubber
Co/
The
5.250%
7/15/31
186,984
870
(b)
Gray
Escrow
Inc
5.375%
11/15/31
567,107
200
(b)
Gray
Television
Inc
10.500%
7/15/29
208,701
290
(b)
Gray
Television
Inc
4.750%
10/15/30
194,695
180
Griffon
Corp
5.750%
3/01/28
176,203
210
(b)
Grifols
SA
4.750%
10/15/28
191,604
300
(b)
H&E
Equipment
Services
Inc
3.875%
12/15/28
274,121
495
(b)
Hawaiian
Brand
Intellectual
Property
Ltd
/
HawaiianMiles
Loyalty
Ltd
11.000%
4/15/29
471,279
260
(b)
HealthEquity
Inc
4.500%
10/01/29
244,910
195
(b)
Heartland
Dental
LLC
/
Heartland
Dental
Finance
Corp
10.500%
4/30/28
207,675
50
(b)
Herbalife
Nutrition
Ltd
/
HLF
Financing
Inc
7.875%
9/01/25
49,673
Nuveen
ESG
High
Yield
Corporate
Bond
ETF
(NUHY)
(continued)
Portfolio
of
Investments
July
31,
2024
Principal
Amount
(000)
Description
(a)
Coupon
Maturity
Value
INDUSTRIAL
(continued)
$
230
(b)
Herc
Holdings
Inc
5.500%
7/15/27
$
228,102
250
(b)
Hess
Midstream
Operations
LP
6.500%
6/01/29
254,881
100
Hillenbrand
Inc
6.250%
2/15/29
101,241
210
(b)
Hilton
Domestic
Operating
Co
Inc
5.750%
5/01/28
209,779
200
(b)
Hilton
Domestic
Operating
Co
Inc
3.750%
5/01/29
185,420
130
(b)
Hilton
Domestic
Operating
Co
Inc
4.000%
5/01/31
117,750
110
(b)
Hilton
Domestic
Operating
Co
Inc
3.625%
2/15/32
96,343
350
(b)
Hilton
Grand
Vacations
Borrower
Escrow
LLC
/
Hilton
Grand
Vacations
Borrower
Esc
5.000%
6/01/29
329,199
208
(b)
Hilton
Grand
Vacations
Borrower
Escrow
LLC
/
Hilton
Grand
Vacations
Borrower
Esc
4.875%
7/01/31
187,279
120
(b)
Hilton
Grand
Vacations
Borrower
Escrow
LLC
/
Hilton
Grand
Vacations
Borrower
Esc
6.625%
1/15/32
121,176
220
(b)
HLF
Financing
Sarl
LLC
/
Herbalife
International
Inc
4.875%
6/01/29
149,600
170
(b)
Hologic
Inc
3.250%
2/15/29
154,986
120
(b)
Ingevity
Corp
3.875%
11/01/28
109,871
1,160
(b)
Intelsat
Jackson
Holdings
SA
6.500%
3/15/30
1,103,535
100
(b)
Iron
Mountain
Inc
5.000%
7/15/28
96,940
230
(b)
Iron
Mountain
Inc
4.875%
9/15/29
219,754
111
(b)
Iron
Mountain
Inc
5.250%
7/15/30
106,828
160
(b)
Iron
Mountain
Information
Management
Services
Inc
5.000%
7/15/32
149,441
220
(b)
ITT
Holdings
LLC
6.500%
8/01/29
206,435
480
(b)
Jaguar
Land
Rover
Automotive
PLC
5.875%
1/15/28
475,264
410
(b)
Jazz
Securities
DAC
4.375%
1/15/29
385,055
180
(b),(c)
Kinetik
Holdings
LP
5.875%
6/15/30
178,180
10
Lamar
Media
Corp
4.000%
2/15/30
9,223
150
(b)
Lamb
Weston
Holdings
Inc
4.875%
5/15/28
145,327
400
(b)
Level
3
Financing
Inc
10.500%
5/15/30
408,800
60
(b)
Lithia
Motors
Inc
3.875%
6/01/29
54,491
310
(b)
Lithia
Motors
Inc
4.375%
1/15/31
278,247
200
(b)
Live
Nation
Entertainment
Inc
6.500%
5/15/27
202,384
200
(b),(c)
Live
Nation
Entertainment
Inc
4.750%
10/15/27
193,926
250
(b)
Live
Nation
Entertainment
Inc
3.750%
1/15/28
235,059
33
(b)
Macy's
Retail
Holdings
LLC
5.875%
4/01/29
32,231
280
(b),(c)
Marriott
Ownership
Resorts
Inc
4.500%
6/15/29
260,398
200
(b)
Masterbrand
Inc
7.000%
7/15/32
205,481
70
(b)
McGraw-Hill
Education
Inc
8.000%
8/01/29
68,252
350
(c)
Mercer
International
Inc
5.125%
2/01/29
296,642
74
Methanex
Corp
5.125%
10/15/27
72,052
150
(c)
Methanex
Corp
5.250%
12/15/29
145,981
130
(b)
Michaels
Cos
Inc/The
5.250%
5/01/28
96,165
110
(b)
MicroStrategy
Inc
6.125%
6/15/28
108,789
250
(b)
Mobius
Merger
Sub
Inc
9.000%
6/01/30
247,574
33
(b)
MPH
Acquisition
Holdings
LLC
5.500%
9/01/28
25,761
60
Murphy
Oil
USA
Inc
4.750%
9/15/29
57,400
100
(b)
Murphy
Oil
USA
Inc
3.750%
2/15/31
88,796
490
(b)
NCL
Corp
Ltd
5.875%
3/15/26
487,810
720
(b)
NCL
Corp
Ltd
5.875%
2/15/27
714,783
140
(b)
NCL
Corp
Ltd
8.375%
2/01/28
147,498
400
(b)
NCL
Corp
Ltd
8.125%
1/15/29
425,234
310
(b),(c)
NCL
Corp
Ltd
7.750%
2/15/29
326,271
Principal
Amount
(000)
Description
(a)
Coupon
Maturity
Value
INDUSTRIAL
(continued)
$
421
(b),(c)
NCR
Voyix
Corp
5.000%
10/01/28
$
402,573
540
(b)
NCR
Voyix
Corp
5.125%
4/15/29
515,905
483
(b)
New
Fortress
Energy
Inc
6.750%
9/15/25
474,841
500
(b),(c)
New
Fortress
Energy
Inc
6.500%
9/30/26
464,922
200
(b)
New
Fortress
Energy
Inc
8.750%
3/15/29
181,352
200
Newell
Brands
Inc
6.375%
9/15/27
199,773
200
(c)
Newell
Brands
Inc
6.625%
9/15/29
200,656
350
(b)
Nexstar
Media
Inc
5.625%
7/15/27
339,453
438
(b),(c)
Nexstar
Media
Inc
4.750%
11/01/28
402,992
81
Nordstrom
Inc
4.375%
4/01/30
73,645
250
NuStar
Logistics
LP
5.750%
10/01/25
250,031
450
NuStar
Logistics
LP
6.375%
10/01/30
459,261
260
(b)
ON
Semiconductor
Corp
3.875%
9/01/28
242,867
110
(b)
Open
Text
Corp
3.875%
2/15/28
102,686
210
(b)
Open
Text
Holdings
Inc
4.125%
12/01/31
186,956
300
(b)
Optics
Bidco
SpA
7.721%
6/04/38
321,246
110
(b)
Option
Care
Health
Inc
4.375%
10/31/29
102,738
500
(b)
Organon
&
Co
/
Organon
Foreign
Debt
Co-Issuer
BV
4.125%
4/30/28
469,760
220
(b),(c)
Organon
&
Co
/
Organon
Foreign
Debt
Co-Issuer
BV
5.125%
4/30/31
202,465
510
(b)
Outfront
Media
Capital
LLC
/
Outfront
Media
Capital
Corp
4.250%
1/15/29
472,890
100
(b),(c)
Outfront
Media
Capital
LLC
/
Outfront
Media
Capital
Corp
4.625%
3/15/30
91,883
200
(b),(c)
Owens-Brockway
Glass
Container
Inc
6.625%
5/13/27
200,195
70
(b),(c)
Owens-Brockway
Glass
Container
Inc
7.250%
5/15/31
69,261
20
(b)
Pactiv
Evergreen
Group
Issuer
Inc/Pactiv
Evergreen
Group
Issuer
LLC
4.375%
9/30/28
18,775
375
Paramount
Global
6.375%
3/30/62
344,297
160
(b)
Parkland
Corp
5.875%
7/15/27
159,459
100
(b)
Parkland
Corp/Canada
4.625%
5/01/30
92,972
200
(c)
PBF
Holding
Co
LLC
/
PBF
Finance
Corp
6.000%
2/15/28
196,185
200
(b)
PBF
Holding
Co
LLC
/
PBF
Finance
Corp
7.875%
9/15/30
207,139
611
(b)
Performance
Food
Group
Inc
5.500%
10/15/27
602,844
485
(b)
Performance
Food
Group
Inc
4.250%
8/01/29
449,197
110
Perrigo
Finance
Unlimited
Co
4.900%
6/15/30
103,828
200
(b)
Phinia
Inc
6.750%
4/15/29
204,002
440
(b),(c)
Post
Holdings
Inc
4.625%
4/15/30
409,912
550
(b)
Post
Holdings
Inc
4.500%
9/15/31
500,180
135
(b)
Post
Holdings
Inc
6.250%
2/15/32
136,713
120
(b)
Prestige
Brands
Inc
3.750%
4/01/31
105,792
230
(b)
Prime
Security
Services
Borrower
LLC
/
Prime
Finance
Inc
6.250%
1/15/28
229,244
100
(b)
Primo
Water
Holdings
Inc
4.375%
4/30/29
93,123
60
(b)
PTC
Inc
4.000%
2/15/28
56,827
201
(b),(c)
Rakuten
Group
Inc
5.125%
N/A
(d)
183,856
355
(b)
Rakuten
Group
Inc
6.250%
N/A
(d)
293,273
100
(b)
RB
Global
Inc
6.750%
3/15/28
102,102
110
(b)
RB
Global
Inc
7.750%
3/15/31
115,665
150
(b)
Reworld
Holding
Corp
4.875%
12/01/29
137,165
60
(b)
ROBLOX
Corp
3.875%
5/01/30
53,765
210
(b)
Rogers
Communications
Inc
5.250%
3/15/82
203,281
100
(b),(c)
Royal
Caribbean
Cruises
Ltd
4.250%
7/01/26
97,395
50
(b)
Royal
Caribbean
Cruises
Ltd
5.500%
8/31/26
49,775
Nuveen
ESG
High
Yield
Corporate
Bond
ETF
(NUHY)
(continued)
Portfolio
of
Investments
July
31,
2024
Principal
Amount
(000)
Description
(a)
Coupon
Maturity
Value
INDUSTRIAL
(continued)
$
60
(b)
Royal
Caribbean
Cruises
Ltd
5.375%
7/15/27
$
59,648
100
(b)
Royal
Caribbean
Cruises
Ltd
5.500%
4/01/28
99,620
640
(b)
Royal
Caribbean
Cruises
Ltd
7.250%
1/15/30
670,774
100
(b)
Royal
Caribbean
Cruises
Ltd
6.250%
3/15/32
101,980
117
(b)
Sabre
GLBL
Inc
8.625%
6/01/27
109,373
300
(b)
Sabre
GLBL
Inc
11.250%
12/15/27
297,092
350
SBA
Communications
Corp
3.875%
2/15/27
336,979
188
Seagate
HDD
Cayman
9.625%
12/01/32
215,063
100
(b)
Sealed
Air
Corp
6.125%
2/01/28
100,691
370
(b)
SeaWorld
Parks
&
Entertainment
Inc
5.250%
8/15/29
352,443
220
(b)
Sensata
Technologies
BV
4.000%
4/15/29
203,869
200
(b)
Sensata
Technologies
BV
5.875%
9/01/30
197,390
300
(b)
Sensata
Technologies
Inc
3.750%
2/15/31
264,971
400
Service
Corp
International/US
4.000%
5/15/31
360,384
215
(b),(c)
Sinclair
Television
Group
Inc
4.125%
12/01/30
149,438
135
(b)
Sirius
XM
Radio
Inc
3.125%
9/01/26
128,258
210
(b)
Sirius
XM
Radio
Inc
5.500%
7/01/29
200,736
150
(b)
Sirius
XM
Radio
Inc
4.125%
7/01/30
130,376
140
(b)
Sirius
XM
Radio
Inc
3.875%
9/01/31
116,949
250
(b)
Six
Flags
Entertainment
Corp
/
Six
Flags
Theme
Parks
Inc
6.625%
5/01/32
256,709
170
(b),(c)
Six
Flags
Entertainment
Corp/
DE
7.250%
5/15/31
175,260
300
(b),(c)
Sonic
Automotive
Inc
4.625%
11/15/29
274,220
300
(b)
Sonic
Automotive
Inc
4.875%
11/15/31
267,913
200
(b)
Sotera
Health
Holdings
LLC
7.375%
6/01/31
204,010
390
(b),(c)
Sotheby's
7.375%
10/15/27
324,716
200
(b)
Spirit
Loyalty
Cayman
Ltd
/
Spirit
IP
Cayman
Ltd
8.000%
9/20/25
126,450
150
(b)
SPX
FLOW
Inc
8.750%
4/01/30
156,291
300
(b)
Stagwell
Global
LLC
5.625%
8/15/29
282,874
200
(b)
Stena
International
SA
7.250%
1/15/31
204,593
420
(b),(c)
Studio
City
Finance
Ltd
6.500%
1/15/28
402,435
420
(b)
Studio
City
Finance
Ltd
5.000%
1/15/29
374,200
310
(b)
Suburban
Propane
Partners
LP/
Suburban
Energy
Finance
Corp
5.000%
6/01/31
281,380
100
(b)
Summit
Materials
LLC
/
Summit
Materials
Finance
Corp
5.250%
1/15/29
97,761
55
(b)
Summit
Materials
LLC
/
Summit
Materials
Finance
Corp
7.250%
1/15/31
57,350
300
(b)
Sunoco
LP
7.000%
5/01/29
308,779
580
(b),(c)
Sunoco
LP
7.250%
5/01/32
602,940
60
(b)
Superior
Plus
LP
/
Superior
General
Partner
Inc
4.500%
3/15/29
55,760
150
(b)
Surgery
Center
Holdings
Inc
7.250%
4/15/32
154,912
261
(b)
Taylor
Morrison
Communities
Inc
5.125%
8/01/30
254,481
100
(b)
TEGNA
Inc
4.750%
3/15/26
98,462
190
TEGNA
Inc
5.000%
9/15/29
173,383
50
(b)
Teleflex
Inc
4.250%
6/01/28
47,496
40
(b)
Tempur
Sealy
International
Inc
4.000%
4/15/29
36,536
200
(b)
Tempur
Sealy
International
Inc
3.875%
10/15/31
172,145
250
(b)
Tenneco
Inc
8.000%
11/17/28
226,890
110
(b)
Terex
Corp
5.000%
5/15/29
105,714
160
(b)
Thor
Industries
Inc
4.000%
10/15/29
144,176
50
(b)
TopBuild
Corp
4.125%
2/15/32
45,040
11
(b)
TransDigm
Inc
6.625%
3/01/32
11,251
100
(b)
Travel
+
Leisure
Co
6.625%
7/31/26
100,923
240
(b)
Travel
+
Leisure
Co
4.500%
12/01/29
223,071
120
(c)
TreeHouse
Foods
Inc
4.000%
9/01/28
108,264
Principal
Amount
(000)
Description
(a)
Coupon
Maturity
Value
INDUSTRIAL
(continued)
$
185
(b)
Triumph
Group
Inc
9.000%
3/15/28
$
194,859
210
(b)
Tronox
Inc
4.625%
3/15/29
191,271
250
(b)
TTM
Technologies
Inc
4.000%
3/01/29
232,129
140
Twilio
Inc
3.875%
3/15/31
125,715
70
(b)
Uber
Technologies
Inc
6.250%
1/15/28
70,618
570
(b)
Uber
Technologies
Inc
4.500%
8/15/29
549,430
150
(b),(c)
United
Natural
Foods
Inc
6.750%
10/15/28
137,029
99
(c)
United
Rentals
North
America
Inc
4.000%
7/15/30
90,550
300
(b)
United
Rentals
North
America
Inc
6.125%
3/15/34
301,414
120
(b)
Uniti
Group
LP
/
Uniti
Group
Finance
Inc
/
CSL
Capital
LLC
10.500%
2/15/28
121,374
700
(b)
Uniti
Group
LP
/
Uniti
Group
Finance
Inc
/
CSL
Capital
LLC
4.750%
4/15/28
604,541
24
(b)
Univision
Communications
Inc
4.500%
5/01/29
20,963
328
(b)
US
Foods
Inc
4.750%
2/15/29
314,074
100
(b)
US
Foods
Inc
4.625%
6/01/30
93,739
90
(b)
Valvoline
Inc
3.625%
6/15/31
78,673
130
(b)
Vertiv
Group
Corp
4.125%
11/15/28
123,167
328
(b),(c)
Victoria's
Secret
&
Co
4.625%
7/15/29
272,093
70
(b)
Virgin
Media
Finance
PLC
5.000%
7/15/30
58,992
110
(b)
Viridien
8.750%
4/01/27
105,686
220
Vodafone
Group
PLC
3.250%
6/04/81
207,398
325
Vodafone
Group
PLC
4.125%
6/04/81
286,059
1,430
(b)
VZ
Secured
Financing
BV
5.000%
1/15/32
1,253,082
345
(b)
Weatherford
International
Ltd
8.625%
4/30/30
359,119
401
(b)
WESCO
Distribution
Inc
7.250%
6/15/28
410,921
190
(b)
Williams
Scotsman
Inc
4.625%
8/15/28
180,803
100
(b)
Williams
Scotsman
Inc
7.375%
10/01/31
103,970
770
(b)
Windstream
Escrow
LLC
/
Windstream
Escrow
Finance
Corp
7.750%
8/15/28
742,753
210
(b)
WMG
Acquisition
Corp
3.875%
7/15/30
189,297
81
(b)
WMG
Acquisition
Corp
3.000%
2/15/31
69,838
200
(b),(c)
Wolverine
World
Wide
Inc
4.000%
8/15/29
170,512
150
(b)
Wyndham
Hotels
&
Resorts
Inc
4.375%
8/15/28
141,531
160
(b)
Xerox
Holdings
Corp
5.500%
8/15/28
135,747
180
(b)
XPO
Inc
7.125%
2/01/32
186,159
156
(b)
Yum!
Brands
Inc
4.750%
1/15/30
150,335
160
Yum!
Brands
Inc
3.625%
3/15/31
142,714
150
Yum!
Brands
Inc
4.625%
1/31/32
139,887
110
Yum!
Brands
Inc
5.375%
4/01/32
106,577
270
(b)
Ziggo
BV
4.875%
1/15/30
245,806
230
(b)
ZipRecruiter
Inc
5.000%
1/15/30
201,231
200
(b),(c)
ZoomInfo
Technologies
LLC/
ZoomInfo
Finance
Corp
3.875%
2/01/29
182,702
TOTAL
INDUSTRIAL
78,413,768
UTILITY
-
0.9%
110
Algonquin
Power
&
Utilities
Corp
4.750%
1/18/82
100,556
200
(b)
Clearway
Energy
Operating
LLC
4.750%
3/15/28
191,989
110
(b)
Clearway
Energy
Operating
LLC
3.750%
2/15/31
97,424
150
Edison
International
8.125%
6/15/53
157,146
210
(b)
NextEra
Energy
Operating
Partners
LP
7.250%
1/15/29
218,133
Nuveen
ESG
High
Yield
Corporate
Bond
ETF
(NUHY)
(continued)
Portfolio
of
Investments
July
31,
2024
Principal
Amount
(000)
Description
(a)
Coupon
Maturity
Value
UTILITY
(continued)
$
71
(b)
TerraForm
Power
Operating
LLC
4.750%
1/15/30
$
65,921
TOTAL
UTILITY
831,169
TOTAL
CORPORATE
DEBT
(cost
$87,408,285)
87,310,010
TOTAL
LONG-TERM
INVESTMENTS
(cost
$87,408,285)
87,310,010
Shares
Description
(a)
Coupon
Value
INVESTMENTS
PURCHASED
WITH
COLLATERAL
FROM
SECURITIES
LENDING
-
8.7%
7,774,979
(e)
State
Street
Navigator
Securities
Lending
Government
Money
Market
Portfolio
5.310%(f)
$
7,774,979
TOTAL
INVESTMENTS
PURCHASED
WITH
COLLATERAL
FROM
SECURITIES
LENDING
(cost
$7,774,979)
7,774,979
TOTAL
INVESTMENTS
(cost
$95,183,264
)
-
106.6%
95,084,989
OTHER
ASSETS
&
LIABILITIES,
NET
-
(6.6)%
(5,863,408)
NET
ASSETS
-
100%
$
89,221,581
For
Fund
portfolio
compliance
purposes,
the
Fund’s
industry
classifications
refer
to
any
one
or
more
of
the
industry
sub-classifications
used
by
one
or
more
widely
recognized
market
indexes
or
ratings
group
indexes,
and/or
as
defined
by
Fund
management.
This
definition
may
not
apply
for
purposes
of
this
report,
which
may
combine
industry
sub-classifications
into
sectors
for
reporting
ease.
(a)
All
percentages
shown
in
the
Portfolio
of
Investments
are
based
on
net
assets.
(b)
Security
is
exempt
from
registration
under
Rule
144A
of
the
Securities
Act
of
1933,
as
amended.
These
securities
are
deemed
liquid
and
may
be
resold
in
transactions
exempt
from
registration,
which
are
normally
those
transactions
with
qualified
institutional
buyers.
As
of
the
end
of
the
reporting
period,
the
aggregate
value
of
these
securities
is
$75,747,290
or
79.7%
of
Total
Investments.
(c)
Investment,
or
a
portion
of
investment,
is
out
on
loan
for
securities
lending.
The
total
value
of
the
securities
out
on
loan
as
of
the
end
of
the
reporting
period
was
$7,486,605.
(d)
Perpetual
security.
Maturity
date
is
not
applicable.
(e)
The
Fund
may
loan
securities
representing
up
to
one
third
of
the
value
of
its
total
assets
(which
includes
collateral
for
securities
on
loan)
to
broker
dealers,
banks,
and
other
institutions.
The
collateral
maintained
by
the
Fund
shall
have
a
value,
at
the
inception
of
each
loan,
equal
to
not
less
than
100%
of
the
value
of
the
loaned
securities.
The
cash
collateral
received
by
the
Fund
is
invested
in
this
money
market
fund.
(f)
The
rate
shown
is
the
one-day
yield
as
of
the
end
of
the
reporting
period.
REIT
Real
Estate
Investment
Trust
See
Notes
to
Financial
Statements
Nuveen
ESG
U.S.
Aggregate
Bond
ETF
(NUBD)
Portfolio
of
Investments
July
31,
2024
Principal
Amount
(000)
Description
(a)
Coupon
Maturity
Value
LONG-TERM
INVESTMENTS
-
98.6%
X
–
U.S.
TREASURY
-
42.2%
$
950
United
States
Treasury
Note/Bond
0.250%
8/31/25
$
905,691
1,800
United
States
Treasury
Note/Bond
0.250%
9/30/25
1,711,125
900
United
States
Treasury
Note/Bond
5.000%
9/30/25
903,340
800
United
States
Treasury
Note/Bond
0.250%
10/31/25
758,250
900
United
States
Treasury
Note/Bond
5.000%
10/31/25
904,043
1,820
United
States
Treasury
Note/Bond
0.375%
11/30/25
1,722,530
500
United
States
Treasury
Note/Bond
4.875%
11/30/25
501,953
1,300
United
States
Treasury
Note/Bond
0.375%
12/31/25
1,226,926
1,800
United
States
Treasury
Note/Bond
4.250%
12/31/25
1,793,320
3,500
United
States
Treasury
Note/Bond
0.375%
1/31/26
3,293,555
2,150
United
States
Treasury
Note/Bond
4.250%
1/31/26
2,143,029
500
United
States
Treasury
Note/Bond
0.500%
2/28/26
470,195
2,450
United
States
Treasury
Note/Bond
4.625%
2/28/26
2,456,316
1,900
United
States
Treasury
Note/Bond
0.750%
3/31/26
1,789,414
1,300
United
States
Treasury
Note/Bond
4.500%
3/31/26
1,301,879
3,200
United
States
Treasury
Note/Bond
0.750%
4/30/26
3,007,000
400
United
States
Treasury
Note/Bond
4.875%
4/30/26
403,328
700
United
States
Treasury
Note/Bond
0.750%
5/31/26
656,195
100
United
States
Treasury
Note/Bond
4.875%
5/31/26
100,922
1,700
United
States
Treasury
Note/Bond
0.875%
6/30/26
1,594,281
1,550
United
States
Treasury
Note/Bond
4.625%
6/30/26
1,559,021
1,100
United
States
Treasury
Note/Bond
0.625%
7/31/26
1,023,945
1,450
United
States
Treasury
Note/Bond
0.750%
8/31/26
1,349,859
2,600
United
States
Treasury
Note/Bond
0.875%
9/30/26
2,422,672
900
United
States
Treasury
Note/Bond
1.125%
10/31/26
841,043
1,600
United
States
Treasury
Note/Bond
1.250%
11/30/26
1,496,562
1,100
United
States
Treasury
Note/Bond
1.250%
12/31/26
1,027,641
1,750
United
States
Treasury
Note/Bond
1.875%
2/28/27
1,654,092
500
United
States
Treasury
Note/Bond
2.500%
3/31/27
480,137
1,250
United
States
Treasury
Note/Bond
2.750%
4/30/27
1,206,348
200
United
States
Treasury
Note/Bond
4.500%
5/15/27
202,062
2,000
United
States
Treasury
Note/Bond
2.625%
5/31/27
1,922,266
900
United
States
Treasury
Note/Bond
0.500%
6/30/27
812,461
2,500
United
States
Treasury
Note/Bond
3.250%
6/30/27
2,444,727
1,000
United
States
Treasury
Note/Bond
2.750%
7/31/27
963,008
2,186
United
States
Treasury
Note/Bond
2.250%
8/15/27
2,073,114
100
United
States
Treasury
Note/Bond
4.125%
9/30/27
100,262
1,600
United
States
Treasury
Note/Bond
4.125%
10/31/27
1,604,250
888
United
States
Treasury
Note/Bond
2.250%
11/15/27
839,299
320
United
States
Treasury
Note/Bond
0.625%
11/30/27
286,262
1,600
United
States
Treasury
Note/Bond
3.875%
11/30/27
1,592,188
3,798
United
States
Treasury
Note/Bond
3.875%
12/31/27
3,780,939
1,500
United
States
Treasury
Note/Bond
3.500%
1/31/28
1,474,863
2,344
United
States
Treasury
Note/Bond
2.750%
2/15/28
2,245,662
1,200
United
States
Treasury
Note/Bond
4.000%
2/29/28
1,199,578
3,200
United
States
Treasury
Note/Bond
3.625%
3/31/28
3,159,375
2,000
United
States
Treasury
Note/Bond
3.500%
4/30/28
1,965,625
1,100
United
States
Treasury
Note/Bond
3.625%
5/31/28
1,085,906
1,900
United
States
Treasury
Note/Bond
4.000%
6/30/28
1,900,965
2,450
United
States
Treasury
Note/Bond
4.125%
7/31/28
2,462,729
3,700
United
States
Treasury
Note/Bond
4.625%
9/30/28
3,791,633
650
United
States
Treasury
Note/Bond
1.375%
10/31/28
584,695
2,000
United
States
Treasury
Note/Bond
4.875%
10/31/28
2,070,234
2,550
United
States
Treasury
Note/Bond
4.375%
11/30/28
2,592,234
4,750
United
States
Treasury
Note/Bond
3.750%
12/31/28
4,710,479
300
United
States
Treasury
Note/Bond
1.750%
1/31/29
272,930
Nuveen
ESG
U.S.
Aggregate
Bond
ETF
(NUBD)
(continued)
Portfolio
of
Investments
July
31,
2024
Principal
Amount
(000)
Description
(a)
Coupon
Maturity
Value
$
2,850
United
States
Treasury
Note/Bond
4.000%
1/31/29
$
2,855,900
3,850
United
States
Treasury
Note/Bond
4.250%
2/28/29
3,900,381
2,650
United
States
Treasury
Note/Bond
4.125%
3/31/29
2,670,082
800
United
States
Treasury
Note/Bond
4.625%
4/30/29
823,500
1,470
United
States
Treasury
Note/Bond
2.375%
5/15/29
1,369,627
2,200
United
States
Treasury
Note/Bond
4.500%
5/31/29
2,254,656
3,650
United
States
Treasury
Note/Bond
4.250%
6/30/29
3,700,473
1,000
United
States
Treasury
Note/Bond
4.000%
7/31/29
1,003,438
514
United
States
Treasury
Note/Bond
1.625%
8/15/29
460,411
500
United
States
Treasury
Note/Bond
3.875%
12/31/29
498,008
100
United
States
Treasury
Note/Bond
0.625%
5/15/30
82,906
150
United
States
Treasury
Note/Bond
4.000%
1/31/31
150,287
750
United
States
Treasury
Note/Bond
4.625%
5/31/31
779,180
1,000
United
States
Treasury
Note/Bond
1.875%
2/15/32
862,656
3,050
United
States
Treasury
Note/Bond
2.875%
5/15/32
2,820,773
1,150
United
States
Treasury
Note/Bond
2.750%
8/15/32
1,050,813
1,150
United
States
Treasury
Note/Bond
4.125%
11/15/32
1,158,805
700
United
States
Treasury
Note/Bond
3.500%
2/15/33
673,039
800
United
States
Treasury
Note/Bond
3.375%
5/15/33
760,938
1,300
United
States
Treasury
Note/Bond
3.875%
8/15/33
1,282,938
1,750
United
States
Treasury
Note/Bond
4.500%
11/15/33
1,810,156
1,650
United
States
Treasury
Note/Bond
4.000%
2/15/34
1,643,039
2,500
United
States
Treasury
Note/Bond
4.375%
5/15/34
2,564,062
200
United
States
Treasury
Note/Bond
1.125%
8/15/40
126,647
1,300
United
States
Treasury
Note/Bond
1.875%
2/15/41
921,578
500
United
States
Treasury
Note/Bond
2.250%
5/15/41
374,590
1,050
United
States
Treasury
Note/Bond
1.750%
8/15/41
719,455
198
United
States
Treasury
Note/Bond
2.000%
11/15/41
140,789
1,400
United
States
Treasury
Note/Bond
2.375%
2/15/42
1,054,648
3,900
United
States
Treasury
Note/Bond
3.250%
5/15/42
3,346,992
1,964
United
States
Treasury
Note/Bond
2.750%
8/15/42
1,560,536
500
United
States
Treasury
Note/Bond
3.375%
8/15/42
436,055
135
United
States
Treasury
Note/Bond
2.750%
11/15/42
106,787
498
United
States
Treasury
Note/Bond
4.000%
11/15/42
473,489
600
United
States
Treasury
Note/Bond
3.875%
5/15/43
558,375
950
United
States
Treasury
Note/Bond
4.375%
8/15/43
945,361
2,340
United
States
Treasury
Note/Bond
4.750%
11/15/43
2,443,838
1,650
United
States
Treasury
Note/Bond
4.500%
2/15/44
1,666,500
800
United
States
Treasury
Note/Bond
4.625%
5/15/44
821,625
4,221
United
States
Treasury
Note/Bond
2.750%
8/15/47
3,176,632
1,850
United
States
Treasury
Note/Bond
1.250%
5/15/50
950,076
700
United
States
Treasury
Note/Bond
1.375%
8/15/50
370,699
200
United
States
Treasury
Note/Bond
1.625%
11/15/50
113,266
3,800
United
States
Treasury
Note/Bond
1.875%
2/15/51
2,294,844
1,100
United
States
Treasury
Note/Bond
2.375%
5/15/51
748,172
160
United
States
Treasury
Note/Bond
1.875%
11/15/51
96,031
1,300
United
States
Treasury
Note/Bond
2.250%
2/15/52
856,477
1,350
United
States
Treasury
Note/Bond
2.875%
5/15/52
1,022,414
550
United
States
Treasury
Note/Bond
3.000%
8/15/52
427,496
949
United
States
Treasury
Note/Bond
4.000%
11/15/52
892,727
550
United
States
Treasury
Note/Bond
3.625%
2/15/53
483,076
1,210
United
States
Treasury
Note/Bond
3.625%
5/15/53
1,063,288
1,590
United
States
Treasury
Note/Bond
4.125%
8/15/53
1,529,133
1,200
United
States
Treasury
Note/Bond
4.750%
11/15/53
1,280,813
1,700
United
States
Treasury
Note/Bond
4.250%
2/15/54
1,671,844
875
United
States
Treasury
Note/Bond
4.625%
5/15/54
916,289
TOTAL
U.S.
TREASURY
(cost
$165,684,323)
155,608,968
Principal
Amount
(000)
Description
(a)
Coupon
Maturity
Value
X
–
SECURITIZED
-
26.8%
$
150
American
Express
Credit
Account
Master
Trust
2023
3
5.230%
9/15/28
$
151,978
50
AmeriCredit
Automobile
Receivables
Trust
2021-2
2021
2
1.010%
1/19/27
47,935
50
BA
Credit
Card
Trust
2023
A2
4.980%
11/15/28
50,476
200
Bank
2019-BNK19
2019
BN19
2.926%
8/15/61
183,746
100
BANK
2021-BNK34
2021
BN34
1.935%
6/15/63
93,646
100
BANK
2021-BNK35
2021
BN35
2.067%
6/15/64
89,057
43
BANK5
2023-5YR4
2023
5YR4
6.500%
12/15/56
45,566
50
BANK5
Trust
2024-5YR6
2024
5YR6
6.225%
5/15/57
52,528
100
Barclays
Commercial
Mortgage
S
2023
C21
6.000%
9/15/56
107,409
500
BBCMS
Mortgage
Trust
2020-C6
2020
C6
2.690%
2/15/53
483,768
100
BBCMS
Mortgage
Trust
2024-C26
2024
C26
5.829%
5/15/57
106,574
200
Benchmark
2021-B24
Mortgage
Trust
2021
B24
2.264%
3/15/54
171,844
100
Benchmark
2021-B27
Mortgage
Trust
2021
B27
2.703%
7/15/54
70,016
100
Benchmark
2021-B28
Mortgage
Trust
2021
B28
2.073%
8/15/54
88,455
90
BMARK
2023-V4
2023
V4
6.841%
11/15/56
95,850
90
BMO
2024-C8
Mortgage
Trust
2024
C8
5.598%
3/15/57
94,037
100
BMO
Mortgage
Trust
2023
5C1
7.118%
8/15/56
105,766
100
Capital
One
Multi-Asset
Execution
Trust
2022
A2
3.490%
5/15/27
98,677
100
CarMax
Auto
Owner
Trust
2022
1
1.700%
8/16/27
95,156
57
(b)
Carvana
Auto
Receivables
Trust
2022-N1
2022
N1
4.130%
12/11/28
55,741
100
Citibank
Credit
Card
Issuance
Trust
2023
A1
5.230%
12/08/27
100,393
180
Citigroup
Commercial
Mortgage
Trust
2016-C1
2016
C1
3.209%
5/10/49
173,668
500
COMM
2015-LC19
Mortgage
Trust
2015
LC19
3.183%
2/10/48
494,716
100
Discover
Card
Execution
Note
Trust
2021
A1
0.580%
9/15/26
99,377
50
Exeter
Automobile
Receivables
Trust
2024-4
2024
4A
5.290%
8/15/30
50,207
251
Fannie
Mae
FN
MA4547
2023
MA4547
2.000%
2/01/52
202,059
183
Fannie
Mae
Pool
FN
MA2941
3.500%
3/01/32
178,337
57
Fannie
Mae
Pool
FN
MA3392
3.500%
6/01/33
55,278
121
Fannie
Mae
Pool
FN
MA3490
4.000%
10/01/33
119,478
46
Fannie
Mae
Pool
FN
MA3828
3.000%
11/01/34
44,089
93
Fannie
Mae
Pool
FN
MA3865
3.000%
12/01/34
88,582
110
Fannie
Mae
Pool
FN
MA3957
3.500%
3/01/35
106,724
513
Fannie
Mae
Pool
FN
MA4074
2.000%
7/01/35
462,122
794
Fannie
Mae
Pool
FN
MA4123
2.000%
9/01/35
717,564
443
Fannie
Mae
Pool
FN
MA4180
2.500%
11/01/35
407,793
345
Fannie
Mae
Pool
FN
MA4228
1.500%
1/01/36
303,078
456
Fannie
Mae
Pool
FN
MA4278
1.500%
3/01/36
399,448
520
Fannie
Mae
Pool
FN
MA4298
2.500%
3/01/36
479,529
135
Fannie
Mae
Pool
FN
MA4302
1.500%
4/01/36
118,745
59
Fannie
Mae
Pool
FN
MA4316
2021
MTGE
2.500%
4/01/36
54,029
151
Fannie
Mae
Pool
FN
MA4330
2.500%
5/01/36
139,302
280
Fannie
Mae
Pool
FN
MA4359
1.500%
6/01/36
245,212
63
Fannie
Mae
Pool
FN
MA4361
2021
MTGE
2.500%
6/01/36
58,240
143
Fannie
Mae
Pool
FN
MA4402
1.500%
8/01/36
125,125
262
Fannie
Mae
Pool
FN
MA4516
2.000%
1/01/37
235,152
214
Fannie
Mae
Pool
FN
MA4535
1.500%
2/01/37
186,412
1,037
Fannie
Mae
Pool
FN
MA4536
2.000%
2/01/37
930,803
314
Fannie
Mae
Pool
FN
MA4566
1.500%
3/01/37
274,045
204
Fannie
Mae
Pool
FN
MA4602
2.000%
5/01/37
182,761
95
Fannie
Mae
Pool
FN
MA4604
3.000%
5/01/37
88,905
283
Fannie
Mae
Pool
FN
MA4629
2022
1
3.000%
6/01/37
265,949
86
Fannie
Mae
Pool
FN
MA5042
4.500%
6/01/38
85,858
105
Fannie
Mae
Pool
FN
MA3890
3.000%
1/01/40
96,371
680
Fannie
Mae
Pool
FN
MA4268
2.000%
2/01/41
584,921
114
Fannie
Mae
Pool
FN
MA4310
1.500%
4/01/41
94,459
522
Fannie
Mae
Pool
FN
MA4334
2.500%
5/01/41
458,444
79
Fannie
Mae
Pool
FN
MA4364
2.000%
6/01/41
67,700
73
Fannie
Mae
Pool
FN
MA4366
2.500%
6/01/41
64,536
227
Fannie
Mae
Pool
FN
MA4387
2.000%
7/01/41
195,333
305
Fannie
Mae
Pool
FN
MA4423
2.500%
9/01/41
268,342
743
Fannie
Mae
Pool
FN
MA3143
3.000%
9/01/47
663,306
Nuveen
ESG
U.S.
Aggregate
Bond
ETF
(NUBD)
(continued)
Portfolio
of
Investments
July
31,
2024
Principal
Amount
(000)
Description
(a)
Coupon
Maturity
Value
$
435
Fannie
Mae
Pool
FN
MA3120
3.500%
9/01/47
$
401,942
48
Fannie
Mae
Pool
FN
MA3182
3.500%
11/01/47
44,439
160
Fannie
Mae
Pool
FN
MA3358
4.500%
5/01/48
156,420
2,168
Fannie
Mae
Pool
FN
FM5665
3.500%
8/01/48
2,005,617
90
Fannie
Mae
Pool
FN
MA3536
4.000%
12/01/48
86,427
155
Fannie
Mae
Pool
FN
MA3574
3.500%
1/01/49
142,854
1,444
Fannie
Mae
Pool
FN
FM5488
4.000%
5/01/49
1,383,250
908
Fannie
Mae
Pool
FN
MA3774
3.000%
9/01/49
806,833
612
Fannie
Mae
Pool
FN
MA3905
3.000%
1/01/50
544,196
364
Fannie
Mae
Pool
FN
MA4019
2.500%
5/01/50
309,171
640
Fannie
Mae
Pool
FN
MA4077
2.000%
7/01/50
521,244
234
Fannie
Mae
Pool
FN
MA4078
2.500%
7/01/50
198,993
347
Fannie
Mae
Pool
FN
MA4079
3.000%
7/01/50
308,203
223
Fannie
Mae
Pool
FN
MA4097
3.000%
8/01/50
198,145
247
Fannie
Mae
Pool
FN
MA4158
2.000%
10/01/50
200,304
1,944
Fannie
Mae
Pool
FN
MA4182
2.000%
11/01/50
1,577,648
244
Fannie
Mae
Pool
FN
MA4183
2.500%
11/01/50
207,169
1,252
Fannie
Mae
Pool
FN
MA4208
2.000%
12/01/50
1,016,566
798
Fannie
Mae
Pool
FN
MA4254
1.500%
2/01/51
613,699
862
Fannie
Mae
Pool
FN
MA4255
2.000%
2/01/51
696,262
327
Fannie
Mae
Pool
FN
MA4304
1.500%
4/01/51
252,119
2,198
Fannie
Mae
Pool
FN
MA4305
2021
MTGE
2.000%
4/01/51
1,779,350
76
Fannie
Mae
Pool
FN
MA4337
4.000%
4/01/51
72,021
1,431
Fannie
Mae
Pool
FN
MA4325
2.000%
5/01/51
1,158,634
292
Fannie
Mae
Pool
FN
MA4327
3.000%
5/01/51
257,755
1,698
Fannie
Mae
Pool
FN
MA4355
2021
MTGE
2.000%
6/01/51
1,374,675
575
Fannie
Mae
Pool
FN
MA4357
3.000%
6/01/51
506,163
170
Fannie
Mae
Pool
FN
MA4377
1.500%
7/01/51
131,016
245
Fannie
Mae
Pool
FN
MA4378
2.000%
7/01/51
198,056
431
Fannie
Mae
Pool
FN
MA4397
1.500%
8/01/51
332,245
1,278
Fannie
Mae
Pool
FN
MA4398
2.000%
8/01/51
1,030,277
928
Fannie
Mae
Pool
FN
MA4437
2021
MA4437
2.000%
10/01/51
749,857
305
Fannie
Mae
Pool
FN
MA4439
3.000%
10/01/51
267,027
691
Fannie
Mae
Pool
FN
MA4465
2.000%
11/01/51
557,502
1,545
Fannie
Mae
Pool
FN
MA4492
2.000%
12/01/51
1,245,331
1,387
Fannie
Mae
Pool
FN
MA4511
2021
2021
2.000%
12/01/51
1,116,406
6,770
Fannie
Mae
Pool
FN
MA4493
2.500%
12/01/51
5,733,755
801
Fannie
Mae
Pool
FN
MA4512
2.500%
1/01/52
676,689
437
Fannie
Mae
Pool
FN
MA4513
2021
2021
3.000%
1/01/52
383,133
1,338
Fannie
Mae
Pool
FN
MA4549
3.000%
2/01/52
1,170,292
1,298
Fannie
Mae
Pool
FN
MA4562
2.000%
3/01/52
1,044,512
2,900
Fannie
Mae
Pool
FN
MA4563
2.500%
3/01/52
2,449,858
319
Fannie
Mae
Pool
FN
MA4564
2022
1
3.000%
3/01/52
279,354
809
Fannie
Mae
Pool
FN
MA4565
3.500%
3/01/52
736,653
359
Fannie
Mae
Pool
FN
MA4577
2.000%
4/01/52
289,040
2,113
Fannie
Mae
Pool
FN
MA4578
2.500%
4/01/52
1,784,908
434
Fannie
Mae
Pool
FN
MA4579
3.000%
4/01/52
379,283
222
Fannie
Mae
Pool
FN
MA4600
2022
2
3.500%
5/01/52
201,247
595
Fannie
Mae
Pool
FN
MA4644
2022
1
4.000%
5/01/52
558,151
266
Fannie
Mae
Pool
FN
MA4625
2022
1
3.500%
6/01/52
240,929
852
Fannie
Mae
Pool
FN
MA4684
2022
1
4.500%
6/01/52
821,484
366
Fannie
Mae
Pool
FN
MA4686
5.000%
6/01/52
361,390
534
Fannie
Mae
Pool
FN
MA4653
3.000%
7/01/52
467,058
525
Fannie
Mae
Pool
FN
MA4699
2022
1
3.500%
7/01/52
476,388
210
Fannie
Mae
Pool
FN
MA4654
3.500%
7/01/52
190,994
312
Fannie
Mae
Pool
FN
MA4655
4.000%
7/01/52
291,960
624
Fannie
Mae
Pool
FN
MA4700
2022
1
4.000%
7/01/52
584,908
526
Fannie
Mae
Pool
FN
MA4701
2022
1
4.500%
7/01/52
506,893
698
Fannie
Mae
Pool
FN
MA4656
4.500%
7/01/52
672,679
339
Fannie
Mae
Pool
FN
MA4709
5.000%
7/01/52
333,823
931
Fannie
Mae
Pool
FN
MA4737
2022
1
5.000%
8/01/52
918,919
926
Fannie
Mae
Pool
FN
MA4738
5.500%
8/01/52
929,791
312
Fannie
Mae
Pool
FN
MA4731
2022
1
3.500%
9/01/52
282,791
Principal
Amount
(000)
Description
(a)
Coupon
Maturity
Value
$
360
Fannie
Mae
Pool
FN
MA4732
4.000%
9/01/52
$
337,566
555
Fannie
Mae
Pool
FN
MA4781
3.000%
10/01/52
485,383
462
Fannie
Mae
Pool
FN
MA4782
3.500%
10/01/52
418,730
575
Fannie
Mae
Pool
FN
MA4783
4.000%
10/01/52
538,551
543
Fannie
Mae
Pool
FN
MA4805
2022
1
4.500%
11/01/52
523,063
345
Fannie
Mae
Pool
FN
MA4807
5.500%
11/01/52
346,207
577
Fannie
Mae
Pool
FN
MA4847
6.000%
11/01/52
587,446
229
Fannie
Mae
Pool
FN
MA4852
6.500%
11/01/52
235,172
439
Fannie
Mae
Pool
FN
MA4842
2022
1
5.500%
12/01/52
441,038
919
Fannie
Mae
Pool
FN
MA4894
6.000%
1/01/53
933,684
626
Fannie
Mae
Pool
FN
MA4895
6.500%
1/01/53
643,581
415
Fannie
Mae
Pool
FN
MA5027
4.000%
5/01/53
388,814
280
Fannie
Mae
Pool
FN
MA5008
4.500%
5/01/53
269,881
378
Fannie
Mae
Pool
FN
MA5009
5.000%
5/01/53
372,629
249
Fannie
Mae
Pool
FN
MA5012
6.500%
5/01/53
255,674
192
Fannie
Mae
Pool
FN
MA5071
5.000%
7/01/53
189,238
797
Fannie
Mae
Pool
FN
MA5106
5.000%
8/01/53
785,204
195
Fannie
Mae
Pool
FN
MA5108
6.000%
8/01/53
198,186
1,119
Fannie
Mae
Pool
FN
MA5165
5.500%
10/01/53
1,120,884
92
Fannie
Mae
Pool
FN
MA5166
6.000%
10/01/53
93,471
262
Fannie
Mae
Pool
FN
MA5190
5.500%
11/01/53
262,379
193
Fannie
Mae
Pool
FN
MA5192
6.500%
11/01/53
198,343
84
Fannie
Mae
Pool
FN
MA5193
7.000%
11/01/53
87,218
859
Fannie
Mae
Pool
FN
MA5216
6.000%
12/01/53
870,732
181
Fannie
Mae
Pool
FN
MA5217
6.500%
12/01/53
185,596
249
Fannie
Mae
Pool
FN
MA5218
7.000%
12/01/53
256,821
191
Fannie
Mae
Pool
FN
MA5247
6.000%
1/01/54
193,591
203
Fannie
Mae
Pool
FN
MA5271
5.500%
2/01/54
203,195
179
Fannie
Mae
Pool
FN
MA5273
6.500%
2/01/54
183,136
143
Fannie
Mae
Pool
FN
MA5295
6.000%
3/01/54
145,282
88
Fannie
Mae
Pool
FN
MA5298
7.000%
3/01/54
90,899
234
Fannie
Mae
Pool
FN
MA5329
6.500%
4/01/54
239,860
263
Fannie
Mae
Pool
FN
MA5342
7.000%
4/01/54
271,441
402
Fannie
Mae
Pool
FN
MA5353
5.500%
5/01/54
402,683
153
Fannie
Mae
Pool
FN
MA5388
5.500%
6/01/54
153,248
191
Fannie
Mae
Pool
FN
MA5390
6.500%
6/01/54
195,729
155
Fannie
Mae
Pool
FN
MA5419
5.000%
7/01/54
152,609
399
Fannie
Mae
Pool
FN
MA5421
6.000%
7/01/54
404,652
195
Fannie
Mae
Pool
FN
MA5446
6.500%
8/01/54
199,932
180
Fannie
Mae-Aces
2018
M7
3.032%
3/25/28
172,954
249
Fannie
Mae-Aces
2018
M10
3.357%
7/25/28
240,472
50
Ford
Credit
Auto
Lease
Trust
2024-B
2024
B
4.990%
12/15/27
50,263
41
Ford
Credit
Auto
Owner
Trust
2022-A
2022
A
1.290%
6/15/26
40,297
50
Ford
Credit
Auto
Owner
Trust
2024-A
2024
A
5.010%
9/15/29
50,664
777
Freddie
Mac
Multifamily
Structured
Pass
Through
Certificates
2019
K735
2.862%
5/25/26
752,502
97
Freddie
Mac
Multifamily
Structured
Pass
Through
Certificates
2021
K742
0.861%
6/25/27
91,469
62
Freddie
Mac
Multifamily
Structured
Pass
Through
Certificates
2021
K742
1.760%
3/25/28
56,663
100
Freddie
Mac
Multifamily
Structured
Pass
Through
Certificates
2021
K743
1.770%
5/25/28
90,912
100
Freddie
Mac
Multifamily
Structured
Pass
Through
Certificates
2023
K505
4.819%
6/25/28
101,353
100
Freddie
Mac
Multifamily
Structured
Pass
Through
Certificates
2023
K506
4.650%
8/25/28
100,644
100
Freddie
Mac
Multifamily
Structured
Pass
Through
Certificates
2023
K507
4.800%
9/25/28
101,149
100
Freddie
Mac
Multifamily
Structured
Pass
Through
Certificates
2024
K517
5.355%
1/25/29
103,499
35
Freddie
Mac
Multifamily
Structured
Pass
Through
Certificates
2024
K518
5.400%
1/25/29
36,281
Nuveen
ESG
U.S.
Aggregate
Bond
ETF
(NUBD)
(continued)
Portfolio
of
Investments
July
31,
2024
Principal
Amount
(000)
Description
(a)
Coupon
Maturity
Value
$
100
Freddie
Mac
Multifamily
Structured
Pass
Through
Certificates
2024
K520
5.180%
3/25/29
$
102,961
294
Freddie
Mac
Multifamily
Structured
Pass
Through
Certificates
2019
K094
2.701%
4/25/29
281,723
93
Freddie
Mac
Multifamily
Structured
Pass
Through
Certificates
2021
K125
1.101%
8/25/30
82,482
100
Freddie
Mac
Multifamily
Structured
Pass
Through
Certificates
2023
K753
4.400%
10/25/30
100,012
95
Freddie
Mac
Multifamily
Structured
Pass
Through
Certificates
2021
K127
1.353%
11/25/30
85,780
50
Freddie
Mac
Multifamily
Structured
Pass
Through
Certificates
2024
K755
5.203%
2/25/31
52,193
100
Freddie
Mac
Multifamily
Structured
Pass
Through
Certificates
2021
K129
1.647%
5/25/31
84,120
100
Freddie
Mac
Multifamily
Structured
Pass
Through
Certificates
2024
K756
4.963%
5/25/31
103,133
100
Freddie
Mac
Multifamily
Structured
Pass
Through
Certificates
2023
160
4.500%
8/25/33
100,229
95
Freddie
Mac
Multifamily
Structured
Pass
Through
Certificates
2024
162
5.150%
12/25/33
99,669
98
Freddie
Mac
Multifamily
Structured
Pass
Through
Certificates
2021
1520
2.007%
7/25/35
82,034
685
Freddie
Mac
Pool
FR
SD3574
3.000%
11/01/48
613,820
99
Freddie
Mac
Pool
FR
SD8071
4.500%
6/01/50
96,496
237
Freddie
Mac
Pool
FR
SD8161
2.500%
8/01/51
201,303
355
Freddie
Mac
Pool
FR
SD5345
2.500%
4/01/52
298,762
215
Freddie
Mac
Pool
FR
SD8428
4.000%
5/01/54
201,246
421
Ginnie
Mae
II
Pool
G2
MA3663
3.500%
5/20/46
392,297
54
Ginnie
Mae
II
Pool
G2
MA5264
4.000%
6/20/48
51,211
61
Ginnie
Mae
II
Pool
G2
MA5398
4.000%
8/20/48
58,261
378
Ginnie
Mae
II
Pool
G2
MA6038
3.000%
7/20/49
340,555
176
Ginnie
Mae
II
Pool
G2
MA6283
3.000%
11/20/49
158,251
690
Ginnie
Mae
II
Pool
G2
MA6338
3.000%
12/20/49
618,824
206
Ginnie
Mae
II
Pool
G2
MA6340
4.000%
12/20/49
196,794
215
Ginnie
Mae
II
Pool
G2
MA6410
3.500%
1/20/50
198,975
133
Ginnie
Mae
II
Pool
G2
MA6542
3.500%
3/20/50
123,769
69
Ginnie
Mae
II
Pool
G2
MA6600
3.500%
4/20/50
64,193
70
Ginnie
Mae
II
Pool
G2
MA6820
3.000%
8/20/50
62,956
685
Ginnie
Mae
II
Pool
G2
MA6864
2.000%
9/20/50
567,670
612
Ginnie
Mae
II
Pool
G2
MA6865
2.500%
9/20/50
528,190
74
Ginnie
Mae
II
Pool
G2
MA6931
2.500%
10/20/50
63,733
246
Ginnie
Mae
II
Pool
G2
MA6995
2.500%
11/20/50
212,221
436
Ginnie
Mae
II
Pool
G2
MA7051
2020
GNMA
II
2.000%
12/20/50
362,079
213
Ginnie
Mae
II
Pool
G2
MA7054
3.500%
12/20/50
197,862
408
Ginnie
Mae
II
Pool
G2
MA7136
2.500%
1/20/51
351,426
464
Ginnie
Mae
II
Pool
G2
MA7312
2021
MTGE
2.500%
4/20/51
399,021
513
Ginnie
Mae
II
Pool
G2
MA7367
2.500%
5/20/51
441,743
337
Ginnie
Mae
II
Pool
G2
MA7419
2021
MTGE
3.000%
6/20/51
301,332
744
Ginnie
Mae
II
Pool
G2
MA7472
2.500%
7/20/51
640,482
238
Ginnie
Mae
II
Pool
G2
MA7533
2.000%
8/20/51
197,497
228
Ginnie
Mae
II
Pool
G2
MA7534
2.500%
8/20/51
195,887
744
Ginnie
Mae
II
Pool
G2
MA7704
2.000%
11/20/51
616,444
117
Ginnie
Mae
II
Pool
G2
MA7767
2.500%
12/20/51
101,080
251
Ginnie
Mae
II
Pool
G2
MA7826
2.000%
1/20/52
208,215
165
Ginnie
Mae
II
Pool
G2
MA7827
2.500%
1/20/52
142,187
1,381
Ginnie
Mae
II
Pool
G2
MA7882
3.000%
2/20/52
1,232,396
204
Ginnie
Mae
II
Pool
G2
MA7883
3.500%
2/20/52
187,441
1,447
Ginnie
Mae
II
Pool
G2
MA7935
2.000%
3/20/52
1,199,889
213
Ginnie
Mae
II
Pool
G2
MA7936
2.500%
3/20/52
183,505
415
Ginnie
Mae
II
Pool
G2
MA7937
3.000%
3/20/52
370,301
768
Ginnie
Mae
II
Pool
G2
MA7938
3.500%
3/20/52
705,594
198
Ginnie
Mae
II
Pool
G2
MA7939
4.000%
3/20/52
186,755
544
Ginnie
Mae
II
Pool
G2
MA8042
2.500%
5/20/52
468,494
Principal
Amount
(000)
Description
(a)
Coupon
Maturity
Value
$
203
Ginnie
Mae
II
Pool
G2
MA8044
3.500%
5/20/52
$
186,618
431
Ginnie
Mae
II
Pool
G2
MA8046
4.500%
5/20/52
417,791
742
Ginnie
Mae
II
Pool
G2
MA8100
4.000%
6/20/52
701,339
217
Ginnie
Mae
II
Pool
G2
MA8101
4.500%
6/20/52
210,819
424
Ginnie
Mae
II
Pool
G2
MA8102
5.000%
6/20/52
420,071
439
Ginnie
Mae
II
Pool
G2
MA8151
4.500%
7/20/52
425,644
179
Ginnie
Mae
II
Pool
G2
MA8200
4.000%
8/20/52
168,861
177
Ginnie
Mae
II
Pool
G2
MA8201
4.500%
8/20/52
171,955
174
Ginnie
Mae
II
Pool
G2
MA8202
5.000%
8/20/52
172,877
179
Ginnie
Mae
II
Pool
G2
MA8266
3.500%
9/20/52
164,501
198
Ginnie
Mae
II
Pool
G2
MA8267
2022
A
4.000%
9/20/52
186,794
169
Ginnie
Mae
II
Pool
G2
MA8349
5.500%
10/20/52
170,360
180
Ginnie
Mae
II
Pool
G2
MA8428
5.000%
11/20/52
177,898
160
Ginnie
Mae
II
Pool
G2
MA8430
6.000%
11/20/52
163,053
255
Ginnie
Mae
II
Pool
G2
MA8487
3.500%
12/20/52
234,014
437
Ginnie
Mae
II
Pool
G2
MA8491
5.500%
12/20/52
439,451
157
Ginnie
Mae
II
Pool
G2
MA8492
6.000%
12/20/52
160,282
401
Ginnie
Mae
II
Pool
G2
MA8571
6.000%
1/20/53
408,460
199
Ginnie
Mae
II
Pool
G2
MA8572
6.500%
1/20/53
203,092
328
Ginnie
Mae
II
Pool
G2
MA8801
5.500%
4/20/53
328,691
188
Ginnie
Mae
II
Pool
G2
MA8876
4.000%
5/20/53
177,624
144
Ginnie
Mae
II
Pool
G2
MA8881
6.500%
5/20/53
146,613
96
Ginnie
Mae
II
Pool
G2
MA9015
4.500%
7/20/53
93,414
287
Ginnie
Mae
II
Pool
G2
MA9106
5.500%
8/20/53
288,106
267
Ginnie
Mae
II
Pool
G2
MA9170
5.000%
9/20/53
263,994
192
Ginnie
Mae
II
Pool
G2
MA9171
5.500%
9/20/53
192,788
93
Ginnie
Mae
II
Pool
G2
MA9172
6.000%
9/20/53
95,144
82
Ginnie
Mae
II
Pool
G2
MA9244
7.000%
10/20/53
84,340
207
Ginnie
Mae
II
Pool
G2
MA9303
4.500%
11/20/53
200,491
296
Ginnie
Mae
II
Pool
G2
MA9361
5.000%
12/20/53
292,756
305
Ginnie
Mae
II
Pool
G2
MA9422
5.000%
1/20/54
301,788
291
Ginnie
Mae
II
Pool
G2
MA9424
6.000%
1/20/54
293,991
147
Ginnie
Mae
II
Pool
G2
MA9425
6.500%
1/20/54
149,844
290
Ginnie
Mae
II
Pool
G2
MA9490
6.500%
2/20/54
295,736
243
Ginnie
Mae
II
Pool
G2
MA9671
7.000%
5/20/54
248,994
100
Ginnie
Mae
II
Pool
G2
MA9725
5.500%
6/20/54
100,317
250
Ginnie
Mae
II
Pool
G2
MA9726
6.000%
6/20/54
252,460
250
Ginnie
Mae
II
Pool
G2
MA9779
5.500%
7/20/54
250,791
25
GM
Financial
Consumer
Automobile
Receivables
Trust
2022-1
2022
1
1.260%
11/16/26
24,065
50
GM
Financial
Consumer
Automobile
Receivables
Trust
2024-2
2024
2
5.100%
3/16/29
50,454
200
GS
Mortgage
Securities
Trust
2019-GC38
2019
GC38
3.968%
2/10/52
190,426
7
Honda
Auto
Receivables
2021-2
Owner
Trust
2021
2
0.330%
8/15/25
6,769
40
Honda
Auto
Receivables
2024-2
Owner
Trust
2024
2
5.210%
7/18/30
40,773
100
Hyundai
Auto
Receivables
Trust
2023
C
5.540%
10/16/28
101,415
50
John
Deere
Owner
Trust
2021
B
0.740%
5/15/28
48,505
25
Mercedes-Benz
Auto
Receivables
Trust
2024-1
2024
1
4.790%
7/15/31
25,244
100
Morgan
Stanley
Capital
I
Trust
2021-L5
2021
L5
1.518%
5/15/54
92,328
100
Santander
Drive
Auto
Receivables
Trust
2024-2
2024
2
5.630%
11/15/28
101,037
100
Synchrony
Card
Funding
LLC
2023
A1
5.540%
7/15/29
101,411
100
Toyota
Auto
Receivables
2021-B
Owner
Trust
2021
B
0.530%
10/15/26
96,821
100
UNITED
STATES
2023
B
5.600%
2/15/29
101,528
100
UNITED
STATES
2023
C22
6.804%
11/15/56
113,534
90
Verizon
Master
Trust
Series
2024-4
2024
4
5.210%
6/20/29
90,958
72
Wells
Fargo
Commercial
Mortgage
Trust
2016-C32
2016
C32
3.324%
1/15/59
71,175
300
Wells
Fargo
Commercial
Mortgage
Trust
2019-C49
2019
C49
3.760%
3/15/52
285,827
22
World
Omni
Auto
Receivables
Trust
2021-B
2021
B
0.420%
6/15/26
21,346
TOTAL
SECURITIZED
(cost
$105,797,473)
99,039,056
Nuveen
ESG
U.S.
Aggregate
Bond
ETF
(NUBD)
(continued)
Portfolio
of
Investments
July
31,
2024
Principal
Amount
(000)
Description
(a)
Coupon
Maturity
Value
X
–
CORPORATE
DEBT
-
25.1%
FINANCIALS
-
8.3%
$
10
Aegon
Ltd
5.500%
4/11/48
$
9,737
200
AerCap
Ireland
Capital
DAC
/
AerCap
Global
Aviation
Trust
2.450%
10/29/26
188,938
30
AerCap
Ireland
Capital
DAC
/
AerCap
Global
Aviation
Trust
3.650%
7/21/27
28,888
20
AerCap
Ireland
Capital
DAC
/
AerCap
Global
Aviation
Trust
3.875%
1/23/28
19,281
10
AerCap
Ireland
Capital
DAC
/
AerCap
Global
Aviation
Trust
5.100%
1/19/29
10,063
10
AerCap
Ireland
Capital
DAC
/
AerCap
Global
Aviation
Trust
6.150%
9/30/30
10,563
190
AerCap
Ireland
Capital
DAC
/
AerCap
Global
Aviation
Trust
3.300%
1/30/32
167,257
60
Aetna
Inc
4.125%
11/15/42
48,326
20
Affiliated
Managers
Group
Inc
3.500%
8/01/25
19,645
60
Aflac
Inc
3.600%
4/01/30
56,622
160
Air
Lease
Corp
2.875%
1/15/26
154,684
10
Air
Lease
Corp
4.625%
10/01/28
9,864
30
Air
Lease
Corp
3.125%
12/01/30
26,878
50
Air
Lease
Corp
5.200%
7/15/31
49,971
30
Air
Lease
Corp
2.875%
1/15/32
25,748
50
Aircastle
Ltd
4.250%
6/15/26
49,096
100
Alexandria
Real
Estate
Equities
Inc
3.375%
8/15/31
90,297
100
Alexandria
Real
Estate
Equities
Inc
2.950%
3/15/34
83,253
50
Alexandria
Real
Estate
Equities
Inc
5.625%
5/15/54
48,142
92
Ally
Financial
Inc
8.000%
11/01/31
103,526
30
Ally
Financial
Inc
8.000%
11/01/31
33,518
90
American
Express
Co
1.650%
11/04/26
84,038
150
American
Express
Co
5.625%
7/28/34
154,039
50
American
Homes
4
Rent
5.500%
7/15/34
50,333
120
American
International
Group
Inc
3.400%
6/30/30
111,062
70
Ameriprise
Financial
Inc
5.700%
12/15/28
72,706
10
Ameriprise
Financial
Inc
4.500%
5/13/32
9,779
110
Aon
Corp
/
Aon
Global
Holdings
PLC
5.350%
2/28/33
111,921
50
Aon
North
America
Inc
5.450%
3/01/34
51,030
10
Apollo
Global
Management
Inc
6.375%
11/15/33
10,826
90
Arthur
J
Gallagher
&
Co
3.050%
3/09/52
56,811
42
Assurant
Inc
2.650%
1/15/32
35,193
60
Australia
&
New
Zealand
Banking
Group
Ltd/New
York
NY
3.700%
11/16/25
59,237
120
AvalonBay
Communities
Inc
5.300%
12/07/33
122,082
320
Banco
Santander
SA
4.175%
3/24/28
311,886
150
Banco
Santander
SA
3.490%
5/28/30
137,980
170
Bank
of
America
Corp
5.080%
1/20/27
170,103
40
Bank
of
America
Corp
1.734%
7/22/27
37,547
300
Bank
of
America
Corp
2.087%
6/14/29
271,183
150
Bank
of
America
Corp
4.271%
7/23/29
146,920
740
Bank
of
America
Corp
3.974%
2/07/30
712,691
200
Bank
of
America
Corp
2.592%
4/29/31
176,747
250
Bank
of
America
Corp
2.651%
3/11/32
216,281
100
Bank
of
America
Corp
2.299%
7/21/32
83,953
310
Bank
of
America
Corp
5.872%
9/15/34
325,326
272
Bank
of
America
Corp
3.311%
4/22/42
209,222
Principal
Amount
(000)
Description
(a)
Coupon
Maturity
Value
FINANCIALS
(continued)
$
250
Bank
of
America
Corp
2.972%
7/21/52
$
168,590
100
Bank
of
Montreal
2.650%
3/08/27
95,150
50
Bank
of
Montreal
5.717%
9/25/28
51,789
48
Bank
of
Montreal
3.803%
12/15/32
45,811
100
Bank
of
New
York
Mellon
Corp/
The
2.800%
5/04/26
96,735
100
Bank
of
New
York
Mellon
Corp/
The
2.050%
1/26/27
94,289
100
Bank
of
New
York
Mellon
Corp/
The
5.188%
3/14/35
100,868
50
Bank
of
New
York
Mellon
Corp/
The
5.606%
7/21/39
50,794
130
Bank
of
Nova
Scotia/The
1.350%
6/24/26
121,831
100
Bank
of
Nova
Scotia/The
5.400%
6/04/27
101,853
310
Barclays
PLC
4.836%
5/09/28
304,817
200
Barclays
PLC
7.385%
11/02/28
213,237
200
Barclays
PLC
6.692%
9/13/34
216,873
50
BlackRock
Funding
Inc
5.350%
1/08/55
50,121
40
BlackRock
Inc
3.250%
4/30/29
37,956
30
BlackRock
Inc
2.400%
4/30/30
26,693
30
BlackRock
Inc
1.900%
1/28/31
25,368
10
BlackRock
Inc
4.750%
5/25/33
10,008
162
Boston
Properties
LP
2.900%
3/15/30
140,926
50
Brixmor
Operating
Partnership
LP
4.125%
6/15/26
49,160
120
Brookfield
Finance
I
UK
Plc
/
Brookfield
Finance
Inc
2.340%
1/30/32
99,741
20
Brookfield
Finance
Inc
3.900%
1/25/28
19,381
50
Brookfield
Finance
Inc
6.350%
1/05/34
53,725
10
Brookfield
Finance
Inc
5.968%
3/04/54
10,243
50
Brown
&
Brown
Inc
5.650%
6/11/34
50,621
50
Canadian
Imperial
Bank
of
Commerce
5.260%
4/08/29
50,831
100
Canadian
Imperial
Bank
of
Commerce
6.092%
10/03/33
106,214
200
Capital
One
Financial
Corp
5.468%
2/01/29
201,958
100
Capital
One
Financial
Corp
6.312%
6/08/29
103,716
100
Capital
One
Financial
Corp
7.624%
10/30/31
111,853
100
Capital
One
Financial
Corp
6.051%
2/01/35
102,778
10
Cboe
Global
Markets
Inc
3.650%
1/12/27
9,766
30
Cboe
Global
Markets
Inc
3.000%
3/16/32
26,520
280
Centene
Corp
3.375%
2/15/30
252,272
10
Charles
Schwab
Corp/The
3.200%
3/02/27
9,610
200
Charles
Schwab
Corp/The
2.000%
3/20/28
182,291
10
Charles
Schwab
Corp/The
4.000%
2/01/29
9,755
110
Charles
Schwab
Corp/The
5.643%
5/19/29
112,698
10
Charles
Schwab
Corp/The
3.250%
5/22/29
9,387
10
Charles
Schwab
Corp/The
6.136%
8/24/34
10,590
119
Chubb
Corp/The
6.000%
5/11/37
129,665
10
Chubb
INA
Holdings
LLC
1.375%
9/15/30
8,340
988
Citigroup
Inc
3.980%
3/20/30
949,304
190
Citigroup
Inc
2.561%
5/01/32
162,105
280
Citigroup
Inc
2.520%
11/03/32
235,911
100
Citigroup
Inc
6.174%
5/25/34
103,811
50
Citigroup
Inc
5.827%
2/13/35
50,680
100
Citigroup
Inc
5.449%
6/11/35
101,648
20
Citizens
Financial
Group
Inc
2.850%
7/27/26
19,142
100
Citizens
Financial
Group
Inc
2.638%
9/30/32
79,238
100
CME
Group
Inc
2.650%
3/15/32
87,595
60
CME
Group
Inc
5.300%
9/15/43
61,794
50
CNO
Financial
Group
Inc
6.450%
6/15/34
51,188
Nuveen
ESG
U.S.
Aggregate
Bond
ETF
(NUBD)
(continued)
Portfolio
of
Investments
July
31,
2024
Principal
Amount
(000)
Description
(a)
Coupon
Maturity
Value
FINANCIALS
(continued)
$
50
Comerica
Inc
5.982%
1/30/30
$
50,126
250
Commonwealth
Bank
of
Australia/New
York
NY
5.499%
9/12/25
251,869
140
Cooperatieve
Rabobank
UA
3.750%
7/21/26
136,355
100
COPT
Defense
Properties
LP
2.000%
1/15/29
86,939
150
Deutsche
Bank
AG/New
York
NY
2.552%
1/07/28
140,583
150
Deutsche
Bank
AG/New
York
NY
6.819%
11/20/29
158,675
100
Digital
Realty
Trust
LP
5.550%
1/15/28
102,004
130
Discover
Financial
Services
6.700%
11/29/32
139,930
10
Eaton
Vance
Corp
3.500%
4/06/27
9,690
30
Elevance
Health
Inc
3.650%
12/01/27
29,085
100
Elevance
Health
Inc
2.250%
5/15/30
87,548
50
Elevance
Health
Inc
5.500%
10/15/32
51,978
100
Elevance
Health
Inc
4.650%
1/15/43
89,971
30
Elevance
Health
Inc
3.125%
5/15/50
20,608
110
Elevance
Health
Inc
4.550%
5/15/52
94,746
36
Equitable
Holdings
Inc
5.000%
4/20/48
33,092
70
ERP
Operating
LP
2.500%
2/15/30
62,685
30
Everest
Reinsurance
Holdings
Inc
3.500%
10/15/50
20,558
50
Federal
Realty
OP
LP
3.500%
6/01/30
46,257
132
Fifth
Third
Bancorp
1.707%
11/01/27
122,708
100
Fifth
Third
Bancorp
6.339%
7/27/29
104,221
50
Fifth
Third
Bancorp
5.631%
1/29/32
50,833
30
First
American
Financial
Corp
2.400%
8/15/31
24,446
30
Franklin
Resources
Inc
1.600%
10/30/30
24,899
50
GATX
Corp
4.700%
4/01/29
49,551
10
GATX
Corp
4.000%
6/30/30
9,526
30
GATX
Corp
3.500%
6/01/32
26,633
10
GATX
Corp
5.450%
9/15/33
10,172
20
GATX
Corp
6.050%
3/15/34
20,971
10
GATX
Corp
5.200%
3/15/44
9,408
80
Goldman
Sachs
Bank
USA/New
York
NY
5.283%
3/18/27
80,317
200
Goldman
Sachs
Group
Inc/The
1.948%
10/21/27
187,156
350
Goldman
Sachs
Group
Inc/The
3.800%
3/15/30
333,593
50
Goldman
Sachs
Group
Inc/The
5.727%
4/25/30
51,647
652
Goldman
Sachs
Group
Inc/The
2.383%
7/21/32
548,252
200
Goldman
Sachs
Group
Inc/The
2.650%
10/21/32
170,320
100
Goldman
Sachs
Group
Inc/The
6.561%
10/24/34
109,932
50
Goldman
Sachs
Group
Inc/The
5.330%
7/23/35
50,371
80
Hartford
Financial
Services
Group
Inc/The
2.900%
9/15/51
51,873
100
Healthpeak
OP
LLC
2.125%
12/01/28
89,555
60
Healthpeak
OP
LLC
3.500%
7/15/29
56,479
70
Host
Hotels
&
Resorts
LP
4.500%
2/01/26
69,340
10
Host
Hotels
&
Resorts
LP
3.375%
12/15/29
9,128
200
HSBC
Holdings
PLC
7.336%
11/03/26
205,209
200
HSBC
Holdings
PLC
2.013%
9/22/28
182,716
270
HSBC
Holdings
PLC
2.206%
8/17/29
242,416
450
HSBC
Holdings
PLC
2.804%
5/24/32
385,440
200
HSBC
Holdings
PLC
6.547%
6/20/34
211,371
10
Humana
Inc
5.750%
12/01/28
10,352
30
Humana
Inc
4.875%
4/01/30
30,048
60
Humana
Inc
5.375%
4/15/31
60,932
100
Humana
Inc
2.150%
2/03/32
81,789
120
Huntington
Bancshares
Inc/OH
5.709%
2/02/35
121,315
100
ING
Groep
NV
3.950%
3/29/27
97,805
70
ING
Groep
NV
4.050%
4/09/29
67,674
Principal
Amount
(000)
Description
(a)
Coupon
Maturity
Value
FINANCIALS
(continued)
$
40
ING
Groep
NV
5.550%
3/19/35
$
40,614
64
Intercontinental
Exchange
Inc
3.750%
9/21/28
61,800
10
Intercontinental
Exchange
Inc
4.350%
6/15/29
9,808
50
Intercontinental
Exchange
Inc
5.250%
6/15/31
51,126
20
Intercontinental
Exchange
Inc
1.850%
9/15/32
15,951
20
Intercontinental
Exchange
Inc
4.600%
3/15/33
19,566
90
Intercontinental
Exchange
Inc
4.250%
9/21/48
76,242
30
Invesco
Finance
PLC
3.750%
1/15/26
29,433
100
Invitation
Homes
Operating
Partnership
LP
5.450%
8/15/30
102,369
20
Janus
Henderson
US
Holdings
Inc
4.875%
8/01/25
19,886
150
JPMorgan
Chase
&
Co
1.470%
9/22/27
139,622
50
JPMorgan
Chase
&
Co
4.979%
7/22/28
50,258
50
JPMorgan
Chase
&
Co
5.581%
4/22/30
51,560
570
JPMorgan
Chase
&
Co
3.702%
5/06/30
542,469
260
JPMorgan
Chase
&
Co
2.739%
10/15/30
235,160
648
JPMorgan
Chase
&
Co
4.493%
3/24/31
637,442
110
JPMorgan
Chase
&
Co
2.545%
11/08/32
93,729
160
JPMorgan
Chase
&
Co
3.157%
4/22/42
122,511
450
JPMorgan
Chase
&
Co
3.328%
4/22/52
326,943
20
KeyBank
NA/Cleveland
OH
6.950%
2/01/28
20,839
20
KeyBank
NA/Cleveland
OH
3.900%
4/13/29
18,445
110
KeyCorp
2.250%
4/06/27
101,787
60
KeyCorp
6.401%
3/06/35
62,587
40
Kilroy
Realty
LP
4.750%
12/15/28
38,665
20
Kilroy
Realty
LP
2.500%
11/15/32
15,439
100
Kimco
Realty
OP
LLC
2.250%
12/01/31
82,484
30
Legg
Mason
Inc
4.750%
3/15/26
29,990
40
Legg
Mason
Inc
5.625%
1/15/44
39,867
70
Lincoln
National
Corp
3.050%
1/15/30
63,731
20
Lincoln
National
Corp
3.400%
3/01/32
17,724
30
Lincoln
National
Corp
4.375%
6/15/50
23,498
90
Lloyds
Banking
Group
PLC
4.550%
8/16/28
89,031
200
Lloyds
Banking
Group
PLC
5.721%
6/05/30
205,714
50
Lloyds
Banking
Group
PLC
4.344%
1/09/48
40,267
20
LPL
Holdings
Inc
6.750%
11/17/28
21,116
60
LXP
Industrial
Trust
6.750%
11/15/28
63,084
100
(c)
M&T
Bank
Corp
7.413%
10/30/29
107,486
50
M&T
Bank
Corp
6.082%
3/13/32
51,302
40
Manulife
Financial
Corp
5.375%
3/04/46
39,851
120
Marsh
&
McLennan
Cos
Inc
2.250%
11/15/30
104,813
10
Marsh
&
McLennan
Cos
Inc
4.750%
3/15/39
9,567
40
Marsh
&
McLennan
Cos
Inc
4.350%
1/30/47
34,496
10
Marsh
&
McLennan
Cos
Inc
4.200%
3/01/48
8,347
50
Marsh
&
McLennan
Cos
Inc
5.450%
3/15/54
50,369
220
MetLife
Inc
4.875%
11/13/43
205,859
200
Mitsubishi
UFJ
Financial
Group
Inc
2.757%
9/13/26
191,749
150
Mitsubishi
UFJ
Financial
Group
Inc
1.538%
7/20/27
140,582
64
Mitsubishi
UFJ
Financial
Group
Inc
3.961%
3/02/28
62,611
200
Mitsubishi
UFJ
Financial
Group
Inc
5.441%
2/22/34
205,780
10
Mizuho
Financial
Group
Inc
3.663%
2/28/27
9,724
50
Mizuho
Financial
Group
Inc
4.254%
9/11/29
48,660
100
Mizuho
Financial
Group
Inc
2.869%
9/13/30
90,423
10
Mizuho
Financial
Group
Inc
1.979%
9/08/31
8,406
200
Mizuho
Financial
Group
Inc
5.594%
7/10/35
204,393
50
Morgan
Stanley
4.350%
9/08/26
49,398
Nuveen
ESG
U.S.
Aggregate
Bond
ETF
(NUBD)
(continued)
Portfolio
of
Investments
July
31,
2024
Principal
Amount
(000)
Description
(a)
Coupon
Maturity
Value
FINANCIALS
(continued)
$
50
Morgan
Stanley
5.652%
4/13/28
$
50,944
110
Morgan
Stanley
4.210%
4/20/28
108,204
10
Morgan
Stanley
3.591%
7/22/28
9,619
517
Morgan
Stanley
3.772%
1/24/29
499,374
100
Morgan
Stanley
5.123%
2/01/29
100,939
291
Morgan
Stanley
4.431%
1/23/30
286,011
50
Morgan
Stanley
5.656%
4/18/30
51,576
120
Morgan
Stanley
3.622%
4/01/31
112,477
200
Morgan
Stanley
2.239%
7/21/32
166,924
130
Morgan
Stanley
5.424%
7/21/34
131,954
100
Morgan
Stanley
6.627%
11/01/34
110,249
100
Morgan
Stanley
5.466%
1/18/35
101,767
50
Morgan
Stanley
5.831%
4/19/35
52,240
50
Morgan
Stanley
5.320%
7/19/35
50,412
100
Morgan
Stanley
2.484%
9/16/36
81,092
100
Morgan
Stanley
5.942%
2/07/39
101,721
20
Morgan
Stanley
4.300%
1/27/45
17,602
120
Nasdaq
Inc
5.550%
2/15/34
123,235
200
National
Australia
Bank
Ltd/
New
York
3.375%
1/14/26
196,333
80
NatWest
Group
PLC
4.892%
5/18/29
79,456
100
NatWest
Group
PLC
5.808%
9/13/29
103,076
100
NatWest
Group
PLC
5.076%
1/27/30
100,121
150
Nomura
Holdings
Inc
2.172%
7/14/28
134,802
10
Nomura
Holdings
Inc
6.087%
7/12/33
10,645
72
Northern
Trust
Corp
3.950%
10/30/25
71,108
20
Northern
Trust
Corp
3.150%
5/03/29
18,840
50
Old
Republic
International
Corp
5.750%
3/28/34
50,821
30
ORIX
Corp
3.700%
7/18/27
29,070
40
ORIX
Corp
2.250%
3/09/31
33,948
20
ORIX
Corp
4.000%
4/13/32
18,797
10
ORIX
Corp
5.200%
9/13/32
10,161
20
Piedmont
Operating
Partnership
LP
3.150%
8/15/30
16,533
10
PNC
Bank
NA
3.100%
10/25/27
9,507
90
PNC
Bank
NA
4.050%
7/26/28
87,376
20
PNC
Bank
NA
2.700%
10/22/29
17,900
100
PNC
Financial
Services
Group
Inc/The
5.582%
6/12/29
102,348
140
PNC
Financial
Services
Group
Inc/The
6.875%
10/20/34
155,808
50
PNC
Financial
Services
Group
Inc/The
5.676%
1/22/35
51,562
54
Principal
Financial
Group
Inc
3.700%
5/15/29
51,525
10
Principal
Financial
Group
Inc
2.125%
6/15/30
8,581
34
Progressive
Corp/The
3.200%
3/26/30
31,601
40
Progressive
Corp/The
3.000%
3/15/32
35,643
50
Progressive
Corp/The
4.200%
3/15/48
42,287
91
Prologis
LP
3.875%
9/15/28
88,476
50
Prologis
LP
2.875%
11/15/29
45,925
10
Prologis
LP
4.375%
9/15/48
8,637
100
Prologis
LP
5.250%
6/15/53
97,099
50
Prologis
LP
5.250%
3/15/54
48,344
41
Prudential
Financial
Inc
1.500%
3/10/26
38,947
30
Prudential
Financial
Inc
2.100%
3/10/30
26,273
70
Prudential
Financial
Inc
3.000%
3/10/40
53,355
20
(c)
Prudential
Financial
Inc
4.500%
9/15/47
19,039
133
Prudential
Financial
Inc
3.905%
12/07/47
106,089
10
Prudential
Financial
Inc
3.700%
10/01/50
8,812
30
Prudential
Funding
Asia
PLC
3.625%
3/24/32
27,183
Principal
Amount
(000)
Description
(a)
Coupon
Maturity
Value
FINANCIALS
(continued)
$
110
Public
Storage
Operating
Co
5.125%
1/15/29
$
112,682
30
Raymond
James
Financial
Inc
4.950%
7/15/46
27,885
50
Regency
Centers
Corp
5.250%
1/15/34
50,126
10
Regions
Financial
Corp
1.800%
8/12/28
8,825
20
Regions
Financial
Corp
7.375%
12/10/37
22,632
30
Reinsurance
Group
of
America
Inc
3.950%
9/15/26
29,420
29
Reinsurance
Group
of
America
Inc
3.900%
5/15/29
27,746
50
Reinsurance
Group
of
America
Inc
5.750%
9/15/34
51,145
100
Royal
Bank
of
Canada
1.200%
4/27/26
93,978
100
Royal
Bank
of
Canada
1.150%
7/14/26
93,332
110
Royal
Bank
of
Canada
5.200%
8/01/28
112,507
50
(c)
Royal
Bank
of
Canada
4.969%
8/02/30
50,427
100
Santander
Holdings
USA
Inc
2.490%
1/06/28
93,200
50
Santander
Holdings
USA
Inc
6.342%
5/31/35
51,230
200
Simon
Property
Group
LP
5.500%
3/08/33
206,202
50
State
Street
Corp
4.993%
3/18/27
50,501
10
State
Street
Corp
4.141%
12/03/29
9,775
160
State
Street
Corp
2.400%
1/24/30
144,197
60
State
Street
Corp
6.123%
11/21/34
63,827
50
Sumitomo
Mitsui
Financial
Group
Inc
2.632%
7/14/26
47,896
330
Sumitomo
Mitsui
Financial
Group
Inc
3.364%
7/12/27
317,831
90
Sumitomo
Mitsui
Financial
Group
Inc
3.544%
1/17/28
86,442
170
Sumitomo
Mitsui
Financial
Group
Inc
2.750%
1/15/30
152,733
10
Sumitomo
Mitsui
Financial
Group
Inc
1.710%
1/12/31
8,178
50
Sumitomo
Mitsui
Financial
Group
Inc
5.836%
7/09/44
52,092
50
Synchrony
Financial
5.935%
8/02/30
50,308
212
Toronto-Dominion
Bank/The
1.200%
6/03/26
198,849
100
Toronto-Dominion
Bank/The
5.523%
7/17/28
102,942
50
Toronto-Dominion
Bank/The
3.625%
9/15/31
48,194
102
Travelers
Cos
Inc/The
4.600%
8/01/43
93,865
20
Travelers
Cos
Inc/The
3.750%
5/15/46
16,028
20
Travelers
Cos
Inc/The
4.000%
5/30/47
16,601
10
Travelers
Cos
Inc/The
4.050%
3/07/48
8,379
51
Truist
Bank
3.625%
9/16/25
50,047
50
Truist
Financial
Corp
1.887%
6/07/29
44,741
100
Truist
Financial
Corp
7.161%
10/30/29
107,714
10
Truist
Financial
Corp
1.950%
6/05/30
8,515
200
UBS
AG/London
5.650%
9/11/28
207,073
60
UnitedHealth
Group
Inc
4.600%
4/15/27
60,172
80
UnitedHealth
Group
Inc
4.000%
5/15/29
78,317
210
UnitedHealth
Group
Inc
5.300%
2/15/30
217,590
110
UnitedHealth
Group
Inc
4.200%
5/15/32
105,615
100
UnitedHealth
Group
Inc
5.350%
2/15/33
103,433
401
UnitedHealth
Group
Inc
4.750%
5/15/52
362,489
300
US
Bancorp
5.384%
1/23/30
305,888
21
Ventas
Realty
LP
3.850%
4/01/27
20,424
20
Ventas
Realty
LP
4.400%
1/15/29
19,631
10
Ventas
Realty
LP
3.000%
1/15/30
9,043
54
Ventas
Realty
LP
4.750%
11/15/30
53,171
19
Voya
Financial
Inc
4.800%
6/15/46
16,556
40
Voya
Financial
Inc
4.700%
1/23/48
34,789
118
Welltower
OP
LLC
4.125%
3/15/29
114,811
Nuveen
ESG
U.S.
Aggregate
Bond
ETF
(NUBD)
(continued)
Portfolio
of
Investments
July
31,
2024
Principal
Amount
(000)
Description
(a)
Coupon
Maturity
Value
FINANCIALS
(continued)
$
10
Welltower
OP
LLC
2.750%
1/15/31
$
8,802
110
Westpac
Banking
Corp
1.953%
11/20/28
98,981
100
Westpac
Banking
Corp
2.150%
6/03/31
85,682
176
Westpac
Banking
Corp
4.322%
11/23/31
172,298
10
Willis
North
America
Inc
4.500%
9/15/28
9,843
60
Willis
North
America
Inc
2.950%
9/15/29
54,679
50
Willis
North
America
Inc
5.900%
3/05/54
50,032
20
XL
Group
Ltd
5.250%
12/15/43
19,121
20
Zions
Bancorp
NA
3.250%
10/29/29
17,197
TOTAL
FINANCIALS
30,425,100
INDUSTRIAL
-
14.4%
30
3M
Co
3.375%
3/01/29
28,422
78
3M
Co
2.375%
8/26/29
69,882
100
3M
Co
3.050%
4/15/30
92,211
10
3M
Co
3.625%
10/15/47
7,524
20
3M
Co
3.250%
8/26/49
13,957
20
ABB
Finance
USA
Inc
3.800%
4/03/28
19,750
48
Adobe
Inc
2.150%
2/01/27
45,391
70
Adobe
Inc
4.800%
4/04/29
71,254
60
Agilent
Technologies
Inc
2.100%
6/04/30
52,024
119
Air
Products
and
Chemicals
Inc
1.850%
5/15/27
110,743
10
Air
Products
and
Chemicals
Inc
2.050%
5/15/30
8,751
10
Air
Products
and
Chemicals
Inc
2.700%
5/15/40
7,331
30
Albemarle
Corp
4.650%
6/01/27
29,745
40
Allegion
US
Holding
Co
Inc
5.411%
7/01/32
40,855
90
Alphabet
Inc
0.800%
8/15/27
81,450
20
Alphabet
Inc
1.100%
8/15/30
16,771
50
Alphabet
Inc
1.900%
8/15/40
33,755
90
Alphabet
Inc
2.250%
8/15/60
51,972
10
Amcor
Finance
USA
Inc
4.500%
5/15/28
9,855
60
Amcor
Flexibles
North
America
Inc
2.630%
6/19/30
52,653
170
America
Movil
SAB
de
CV
4.700%
7/21/32
166,038
67
American
Airlines
2017-1
Class
AA
Pass
Through
Trust2020
A
3.650%
2/15/29
63,027
60
American
Honda
Finance
Corp
4.900%
3/13/29
60,814
100
American
Honda
Finance
Corp
5.850%
10/04/30
106,402
50
American
Honda
Finance
Corp
5.050%
7/10/31
50,631
10
American
Tower
Corp
3.375%
10/15/26
9,667
40
American
Tower
Corp
1.500%
1/31/28
35,803
110
American
Tower
Corp
5.250%
7/15/28
111,544
50
American
Tower
Corp
5.800%
11/15/28
51,871
70
American
Tower
Corp
2.900%
1/15/30
63,343
20
American
Tower
Corp
1.875%
10/15/30
16,734
110
American
Tower
Corp
4.050%
3/15/32
103,344
10
American
Tower
Corp
3.700%
10/15/49
7,454
30
American
Tower
Corp
3.100%
6/15/50
20,008
110
Amgen
Inc
5.150%
3/02/28
111,502
130
Amgen
Inc
3.000%
2/22/29
121,571
138
Amgen
Inc
2.300%
2/25/31
118,559
110
Amgen
Inc
2.000%
1/15/32
90,772
20
Amgen
Inc
5.750%
3/15/40
20,558
10
Amgen
Inc
4.950%
10/01/41
9,403
320
Amgen
Inc
5.600%
3/02/43
323,085
210
Amgen
Inc
4.400%
5/01/45
181,224
40
Amgen
Inc
4.663%
6/15/51
35,042
60
Amphenol
Corp
4.350%
6/01/29
59,275
70
Analog
Devices
Inc
1.700%
10/01/28
62,889
50
Analog
Devices
Inc
5.300%
4/01/54
50,256
Principal
Amount
(000)
Description
(a)
Coupon
Maturity
Value
INDUSTRIAL
(continued)
$
10
Applied
Materials
Inc
3.900%
10/01/25
$
9,908
22
Applied
Materials
Inc
5.100%
10/01/35
22,758
70
Applied
Materials
Inc
4.350%
4/01/47
62,863
20
Aptiv
PLC
4.350%
3/15/29
19,594
82
Aptiv
PLC
/
Aptiv
Corp
4.150%
5/01/52
62,375
20
Archer-Daniels-Midland
Co
2.500%
8/11/26
19,151
10
Archer-Daniels-Midland
Co
3.250%
3/27/30
9,328
120
Archer-Daniels-Midland
Co
2.700%
9/15/51
76,368
20
Astrazeneca
Finance
LLC
1.200%
5/28/26
18,807
50
Astrazeneca
Finance
LLC
4.800%
2/26/27
50,345
10
AstraZeneca
PLC
3.375%
11/16/25
9,837
50
AstraZeneca
PLC
0.700%
4/08/26
46,846
49
AstraZeneca
PLC
1.375%
8/06/30
41,041
205
AstraZeneca
PLC
6.450%
9/15/37
233,931
20
AstraZeneca
PLC
4.375%
11/16/45
17,811
20
AstraZeneca
PLC
2.125%
8/06/50
11,470
170
AT&T
Inc
5.539%
2/20/26
170,005
130
AT&T
Inc
5.400%
2/15/34
132,812
760
AT&T
Inc
4.850%
3/01/39
717,651
230
AT&T
Inc
6.375%
3/01/41
247,563
280
AT&T
Inc
3.650%
6/01/51
203,099
60
Autodesk
Inc
2.400%
12/15/31
51,000
70
Automatic
Data
Processing
Inc
1.700%
5/15/28
63,525
30
AutoNation
Inc
1.950%
8/01/28
26,570
30
AutoNation
Inc
4.750%
6/01/30
29,335
50
AutoZone
Inc
4.500%
2/01/28
49,603
100
AutoZone
Inc
5.200%
8/01/33
100,652
50
Avery
Dennison
Corp
2.250%
2/15/32
41,465
30
Avnet
Inc
4.625%
4/15/26
29,709
115
Baker
Hughes
Holdings
LLC
/
Baker
Hughes
Co-Obligor
Inc
3.138%
11/07/29
107,060
20
Baker
Hughes
Holdings
LLC
/
Baker
Hughes
Co-Obligor
Inc
4.486%
5/01/30
19,838
10
Baxter
International
Inc
2.600%
8/15/26
9,563
60
Baxter
International
Inc
1.730%
4/01/31
49,029
120
Baxter
International
Inc
2.539%
2/01/32
101,050
12
Bell
Telephone
Co
of
Canada
or
Bell
Canada
2.150%
2/15/32
9,824
80
Bell
Telephone
Co
of
Canada
or
Bell
Canada
3.650%
3/17/51
59,698
80
Berry
Global
Inc
5.500%
4/15/28
81,009
20
Biogen
Inc
2.250%
5/01/30
17,410
110
Biogen
Inc
3.150%
5/01/50
73,284
60
Block
Financial
LLC
2.500%
7/15/28
54,643
50
Booking
Holdings
Inc
3.600%
6/01/26
49,065
20
Booz
Allen
Hamilton
Inc
5.950%
8/04/33
20,829
62
BorgWarner
Inc
2.650%
7/01/27
58,591
60
Bristol-Myers
Squibb
Co
4.900%
2/22/29
60,943
90
Bristol-Myers
Squibb
Co
1.450%
11/13/30
74,877
40
Bristol-Myers
Squibb
Co
5.900%
11/15/33
43,010
660
Bristol-Myers
Squibb
Co
4.125%
6/15/39
589,341
50
Bristol-Myers
Squibb
Co
6.250%
11/15/53
55,330
60
British
Telecommunications
PLC
9.625%
12/15/30
74,724
50
Broadcom
Inc
5.150%
11/15/31
50,649
212
(b)
Broadcom
Inc
4.150%
4/15/32
200,012
485
Broadcom
Inc
4.300%
11/15/32
462,842
50
Broadridge
Financial
Solutions
Inc
2.600%
5/01/31
43,030
40
Brunswick
Corp/DE
4.400%
9/15/32
36,413
10
Bunge
Ltd
Finance
Corp
1.630%
8/17/25
9,638
Nuveen
ESG
U.S.
Aggregate
Bond
ETF
(NUBD)
(continued)
Portfolio
of
Investments
July
31,
2024
Principal
Amount
(000)
Description
(a)
Coupon
Maturity
Value
INDUSTRIAL
(continued)
$
40
Bunge
Ltd
Finance
Corp
3.250%
8/15/26
$
38,720
10
Bunge
Ltd
Finance
Corp
3.750%
9/25/27
9,685
50
Bunge
Ltd
Finance
Corp
2.750%
5/14/31
43,855
20
Cabot
Corp
5.000%
6/30/32
19,840
110
Campbell
Soup
Co
2.375%
4/24/30
97,106
10
Canadian
National
Railway
Co
2.750%
3/01/26
9,715
10
Canadian
National
Railway
Co
3.850%
8/05/32
9,439
60
Canadian
National
Railway
Co
6.375%
11/15/37
67,488
50
Canadian
National
Railway
Co
3.650%
2/03/48
39,706
30
Canadian
National
Railway
Co
4.450%
1/20/49
26,872
10
Canadian
Pacific
Railway
Co
2.050%
3/05/30
8,733
60
Canadian
Pacific
Railway
Co
2.450%
12/02/31
55,523
10
Canadian
Pacific
Railway
Co
4.800%
9/15/35
9,718
70
Canadian
Pacific
Railway
Co
4.300%
5/15/43
60,998
60
Canadian
Pacific
Railway
Co
6.125%
9/15/15
63,158
120
Cardinal
Health
Inc
4.500%
11/15/44
102,541
10
Cardinal
Health
Inc
4.900%
9/15/45
9,027
10
Carlisle
Cos
Inc
2.750%
3/01/30
8,991
20
Carlisle
Cos
Inc
2.200%
3/01/32
16,535
202
Carrier
Global
Corp
3.377%
4/05/40
161,023
10
Caterpillar
Financial
Services
Corp
0.800%
11/13/25
9,526
50
Caterpillar
Financial
Services
Corp
5.000%
5/14/27
50,697
180
Caterpillar
Inc
3.803%
8/15/42
151,335
10
Caterpillar
Inc
3.250%
9/19/49
7,368
30
CBRE
Services
Inc
4.875%
3/01/26
29,934
30
CBRE
Services
Inc
5.950%
8/15/34
31,478
112
CDW
LLC
/
CDW
Finance
Corp
2.670%
12/01/26
105,898
153
Celanese
US
Holdings
LLC
1.400%
8/05/26
142,166
50
Cencora
Inc
5.125%
2/15/34
50,405
60
CF
Industries
Inc
5.150%
3/15/34
59,392
20
CH
Robinson
Worldwide
Inc
4.200%
4/15/28
19,563
150
Charter
Communications
Operating
LLC
/
Charter
Communications
Operating
Capital
2.250%
1/15/29
131,224
200
Charter
Communications
Operating
LLC
/
Charter
Communications
Operating
Capital
4.400%
4/01/33
180,991
200
Charter
Communications
Operating
LLC
/
Charter
Communications
Operating
Capital
6.650%
2/01/34
206,715
290
Charter
Communications
Operating
LLC
/
Charter
Communications
Operating
Capital
5.500%
4/01/63
231,529
82
Cheniere
Corpus
Christi
Holdings
LLC
5.125%
6/30/27
82,407
50
(b)
Cheniere
Energy
Inc
5.650%
4/15/34
50,808
150
Cheniere
Energy
Partners
LP
5.950%
6/30/33
154,954
50
Church
&
Dwight
Co
Inc
3.150%
8/01/27
48,049
116
Cigna
Group/The
4.500%
2/25/26
115,309
300
Cigna
Group/The
3.050%
10/15/27
286,393
90
Cigna
Group/The
4.800%
8/15/38
85,431
10
Cigna
Group/The
6.125%
11/15/41
10,600
40
Cigna
Group/The
3.875%
10/15/47
31,052
100
Cintas
Corp
No
2
3.700%
4/01/27
97,684
308
Cisco
Systems
Inc
2.500%
9/20/26
295,992
Principal
Amount
(000)
Description
(a)
Coupon
Maturity
Value
INDUSTRIAL
(continued)
$
110
Cisco
Systems
Inc
5.300%
2/26/54
$
110,860
40
Clorox
Co/The
4.400%
5/01/29
39,674
10
Clorox
Co/The
1.800%
5/15/30
8,548
80
CNH
Industrial
NV
3.850%
11/15/27
77,604
10
Coca-Cola
Co/The
3.375%
3/25/27
9,762
5
Coca-Cola
Co/The
1.450%
6/01/27
4,621
50
Coca-Cola
Co/The
1.000%
3/15/28
44,665
170
Coca-Cola
Co/The
1.650%
6/01/30
145,711
10
Coca-Cola
Co/The
1.375%
3/15/31
8,224
110
Coca-Cola
Co/The
3.000%
3/05/51
76,615
50
Coca-Cola
Co/The
5.300%
5/13/54
50,879
70
Coca-Cola
Co/The
2.750%
6/01/60
43,806
10
Colgate-Palmolive
Co
3.100%
8/15/25
9,822
100
Colgate-Palmolive
Co
3.250%
8/15/32
91,561
80
Comcast
Corp
3.300%
4/01/27
77,424
290
Comcast
Corp
3.400%
4/01/30
271,977
250
Comcast
Corp
1.500%
2/15/31
204,977
100
Comcast
Corp
5.500%
11/15/32
104,419
150
Comcast
Corp
6.450%
3/15/37
166,719
370
(c)
Comcast
Corp
3.750%
4/01/40
307,398
60
Comcast
Corp
5.650%
6/01/54
61,181
390
Comcast
Corp
2.987%
11/01/63
235,799
20
Conagra
Brands
Inc
4.600%
11/01/25
19,881
60
Conagra
Brands
Inc
8.250%
9/15/30
70,320
30
Conagra
Brands
Inc
5.300%
11/01/38
29,219
70
Corning
Inc
5.350%
11/15/48
67,726
10
Corning
Inc
3.900%
11/15/49
7,787
10
Corning
Inc
4.375%
11/15/57
8,072
100
Costco
Wholesale
Corp
1.375%
6/20/27
92,028
20
Crown
Castle
Inc
3.700%
6/15/26
19,509
40
Crown
Castle
Inc
4.300%
2/15/29
38,969
154
Crown
Castle
Inc
3.300%
7/01/30
140,468
150
Crown
Castle
Inc
2.500%
7/15/31
127,067
55
CSX
Corp
4.250%
3/15/29
54,334
30
CSX
Corp
6.000%
10/01/36
32,659
120
CSX
Corp
4.100%
3/15/44
101,613
10
CSX
Corp
3.800%
11/01/46
7,983
80
CSX
Corp
4.750%
11/15/48
73,301
10
CSX
Corp
3.800%
4/15/50
7,873
62
CSX
Corp
4.250%
11/01/66
49,632
39
Cummins
Inc
1.500%
9/01/30
32,735
102
Cummins
Inc
2.600%
9/01/50
63,500
100
CVS
Health
Corp
5.400%
6/01/29
102,021
100
CVS
Health
Corp
5.550%
6/01/31
102,213
300
CVS
Health
Corp
2.125%
9/15/31
246,558
50
CVS
Health
Corp
5.700%
6/01/34
51,019
50
CVS
Health
Corp
6.000%
6/01/44
50,258
250
CVS
Health
Corp
6.050%
6/01/54
251,404
100
Danaher
Corp
2.800%
12/10/51
65,294
70
DCP
Midstream
Operating
LP
5.125%
5/15/29
70,650
130
Deere
&
Co
3.900%
6/09/42
111,800
162
Dell
International
LLC
/
EMC
Corp
8.100%
7/15/36
197,367
15
Delta
Air
Lines
2020-1
Class
AA
Pass
Through
Trust2020
A
2.000%
6/10/28
14,028
202
Discovery
Communications
LLC
3.625%
5/15/30
178,253
340
Discovery
Communications
LLC
5.000%
9/20/37
291,176
61
Discovery
Communications
LLC
6.350%
6/01/40
57,443
100
Dollar
General
Corp
3.500%
4/03/30
92,855
82
Dollar
Tree
Inc
3.375%
12/01/51
54,338
Nuveen
ESG
U.S.
Aggregate
Bond
ETF
(NUBD)
(continued)
Portfolio
of
Investments
July
31,
2024
Principal
Amount
(000)
Description
(a)
Coupon
Maturity
Value
INDUSTRIAL
(continued)
$
30
Dover
Corp
5.375%
10/15/35
$
31,160
10
(c)
Dow
Chemical
Co/The
2.100%
11/15/30
8,641
161
Dow
Chemical
Co/The
4.250%
10/01/34
150,593
70
Dow
Chemical
Co/The
5.600%
2/15/54
69,046
70
DR
Horton
Inc
1.300%
10/15/26
64,894
20
DuPont
de
Nemours
Inc
4.493%
11/15/25
19,833
100
DuPont
de
Nemours
Inc
5.319%
11/15/38
105,923
30
DXC
Technology
Co
1.800%
9/15/26
27,962
211
Eastern
Gas
Transmission
&
Storage
Inc
4.800%
11/01/43
190,188
60
Eastman
Chemical
Co
5.750%
3/08/33
61,723
48
Eaton
Corp
3.103%
9/15/27
46,037
62
Eaton
Corp
4.000%
11/02/32
59,224
154
eBay
Inc
2.700%
3/11/30
138,715
36
Ecolab
Inc
3.250%
12/01/27
34,548
10
Ecolab
Inc
4.800%
3/24/30
10,153
10
Ecolab
Inc
1.300%
1/30/31
8,145
110
Ecolab
Inc
2.700%
12/15/51
70,581
62
Electronic
Arts
Inc
1.850%
2/15/31
52,044
25
Eli
Lilly
&
Co
3.375%
3/15/29
24,037
180
Eli
Lilly
&
Co
4.700%
2/27/33
180,806
110
Eli
Lilly
&
Co
5.000%
2/09/54
107,226
50
Emerson
Electric
Co
2.000%
12/21/28
45,255
72
Emerson
Electric
Co
1.950%
10/15/30
62,248
30
Enbridge
Inc
3.700%
7/15/27
29,133
180
Enbridge
Inc
3.125%
11/15/29
165,837
140
Enbridge
Inc
4.500%
6/10/44
119,110
50
Enbridge
Inc
5.950%
4/05/54
50,727
50
Enbridge
Inc
8.250%
1/15/84
52,438
100
Enterprise
Products
Operating
LLC
7.550%
4/15/38
121,535
200
Enterprise
Products
Operating
LLC
6.125%
10/15/39
216,850
120
Enterprise
Products
Operating
LLC
4.850%
3/15/44
111,138
50
Equifax
Inc
5.100%
6/01/28
50,570
160
Equinix
Inc
3.900%
4/15/32
149,162
70
Equinix
Inc
3.000%
7/15/50
45,590
120
Estee
Lauder
Cos
Inc/The
2.600%
4/15/30
107,566
310
FedEx
Corp
3.900%
2/01/35
283,339
122
Fidelity
National
Information
Services
Inc
1.650%
3/01/28
109,554
40
Fiserv
Inc
2.250%
6/01/27
37,410
254
Fiserv
Inc
3.500%
7/01/29
240,237
40
Fiserv
Inc
2.650%
6/01/30
35,716
60
Flex
Ltd
4.875%
6/15/29
59,282
60
Flowserve
Corp
2.800%
1/15/32
50,870
10
FMC
Corp
5.150%
5/18/26
10,012
40
FMC
Corp
3.450%
10/01/29
36,833
20
FMC
Corp
4.500%
10/01/49
15,797
10
Fomento
Economico
Mexicano
SAB
de
CV
4.375%
5/10/43
8,764
89
Fomento
Economico
Mexicano
SAB
de
CV
3.500%
1/16/50
65,064
20
Fortinet
Inc
2.200%
3/15/31
16,833
40
Fortive
Corp
3.150%
6/15/26
38,648
100
Fortune
Brands
Innovations
Inc
5.875%
6/01/33
104,270
20
Fox
Corp
4.709%
1/25/29
19,972
100
Fox
Corp
6.500%
10/13/33
107,307
20
GE
HealthCare
Technologies
Inc
5.600%
11/15/25
20,115
Principal
Amount
(000)
Description
(a)
Coupon
Maturity
Value
INDUSTRIAL
(continued)
$
140
GE
HealthCare
Technologies
Inc
5.857%
3/15/30
$
146,815
184
General
Mills
Inc
2.875%
4/15/30
166,461
90
General
Motors
Co
5.600%
10/15/32
91,801
190
General
Motors
Financial
Co
Inc
5.000%
4/09/27
190,320
284
General
Motors
Financial
Co
Inc
5.650%
1/17/29
289,884
210
General
Motors
Financial
Co
Inc
4.300%
4/06/29
203,317
160
General
Motors
Financial
Co
Inc
6.100%
1/07/34
164,822
40
Genuine
Parts
Co
2.750%
2/01/32
34,022
190
Gilead
Sciences
Inc
4.600%
9/01/35
184,069
176
Gilead
Sciences
Inc
4.000%
9/01/36
159,182
50
Gilead
Sciences
Inc
5.650%
12/01/41
51,421
10
Gilead
Sciences
Inc
4.800%
4/01/44
9,222
40
GlaxoSmithKline
Capital
Inc
6.375%
5/15/38
45,300
70
GlaxoSmithKline
Capital
PLC
3.375%
6/01/29
66,794
200
Global
Payments
Inc
3.200%
8/15/29
183,277
60
Grupo
Televisa
SAB
5.000%
5/13/45
51,203
20
GXO
Logistics
Inc
1.650%
7/15/26
18,706
120
Haleon
US
Capital
LLC
3.375%
3/24/29
113,467
202
Halliburton
Co
4.850%
11/15/35
198,400
30
Harley-Davidson
Inc
4.625%
7/28/45
25,030
10
Hasbro
Inc
3.550%
11/19/26
9,662
10
Hasbro
Inc
3.500%
9/15/27
9,565
100
Hasbro
Inc
3.900%
11/19/29
94,360
30
HCA
Inc
5.250%
6/15/26
30,067
40
HCA
Inc
4.500%
2/15/27
39,549
80
HCA
Inc
3.125%
3/15/27
76,627
100
HCA
Inc
5.200%
6/01/28
101,043
206
HCA
Inc
4.125%
6/15/29
198,730
110
HCA
Inc
5.125%
6/15/39
104,879
120
HCA
Inc
3.500%
7/15/51
82,386
70
Hershey
Co/The
4.250%
5/04/28
69,792
30
Hewlett
Packard
Enterprise
Co
6.102%
4/01/26
30,001
100
Hewlett
Packard
Enterprise
Co
6.200%
10/15/35
107,574
30
Hexcel
Corp
4.950%
8/15/25
29,749
60
(b)
HF
Sinclair
Corp
5.000%
2/01/28
59,092
120
Home
Depot
Inc/The
4.875%
6/25/27
121,338
20
Home
Depot
Inc/The
2.950%
6/15/29
18,683
299
Home
Depot
Inc/The
5.400%
9/15/40
304,992
130
Home
Depot
Inc/The
5.950%
4/01/41
140,518
42
Home
Depot
Inc/The
4.400%
3/15/45
37,381
70
Home
Depot
Inc/The
4.500%
12/06/48
62,331
60
Home
Depot
Inc/The
3.125%
12/15/49
42,130
120
Honda
Motor
Co
Ltd
2.534%
3/10/27
113,938
50
Hormel
Foods
Corp
1.700%
6/03/28
45,173
52
HP
Inc
3.400%
6/17/30
48,429
110
HP
Inc
4.200%
4/15/32
104,121
30
Huntsman
International
LLC
4.500%
5/01/29
28,929
50
Hyatt
Hotels
Corp
5.750%
1/30/27
50,860
120
IBM
International
Capital
Pte
Ltd
5.300%
2/05/54
115,478
30
IDEX
Corp
2.625%
6/15/31
25,943
70
Illinois
Tool
Works
Inc
4.875%
9/15/41
68,255
50
Ingersoll
Rand
Inc
5.197%
6/15/27
50,664
10
Intel
Corp
3.750%
3/25/27
9,787
292
Intel
Corp
2.450%
11/15/29
262,134
130
Intel
Corp
5.125%
2/10/30
133,192
Nuveen
ESG
U.S.
Aggregate
Bond
ETF
(NUBD)
(continued)
Portfolio
of
Investments
July
31,
2024
Principal
Amount
(000)
Description
(a)
Coupon
Maturity
Value
INDUSTRIAL
(continued)
$
10
Intel
Corp
4.000%
12/15/32
$
9,433
110
Intel
Corp
4.600%
3/25/40
101,533
70
Intel
Corp
4.250%
12/15/42
59,503
70
Intel
Corp
4.100%
5/11/47
57,012
160
Intel
Corp
3.734%
12/08/47
121,296
10
Intel
Corp
3.250%
11/15/49
6,885
50
Intel
Corp
5.600%
2/21/54
49,694
20
International
Business
Machines
Corp
7.000%
10/30/25
20,509
200
International
Business
Machines
Corp
3.300%
5/15/26
195,363
10
International
Business
Machines
Corp
3.300%
1/27/27
9,709
100
International
Business
Machines
Corp
2.720%
2/09/32
87,838
72
International
Business
Machines
Corp
5.600%
11/30/39
75,897
70
International
Business
Machines
Corp
4.000%
6/20/42
58,836
90
International
Business
Machines
Corp
4.700%
2/19/46
81,187
40
International
Flavors
&
Fragrances
Inc
4.375%
6/01/47
31,724
10
International
Flavors
&
Fragrances
Inc
5.000%
9/26/48
8,838
45
International
Paper
Co
4.800%
6/15/44
40,102
52
International
Paper
Co
4.350%
8/15/48
43,504
60
Interpublic
Group
of
Cos
Inc/
The
2.400%
3/01/31
51,138
10
Interpublic
Group
of
Cos
Inc/
The
5.375%
6/15/33
10,062
80
Intuit
Inc
5.250%
9/15/26
81,162
18
Intuit
Inc
1.350%
7/15/27
16,479
10
Intuit
Inc
1.650%
7/15/30
8,522
50
IQVIA
Inc
6.250%
2/01/29
52,243
80
J
M
Smucker
Co/The
4.250%
3/15/35
73,860
100
J
M
Smucker
Co/The
2.750%
9/15/41
68,108
40
Jabil
Inc
4.250%
5/15/27
39,280
40
Jacobs
Engineering
Group
Inc
6.350%
8/18/28
41,826
30
JB
Hunt
Transport
Services
Inc
3.875%
3/01/26
29,519
30
JD.com
Inc
3.875%
4/29/26
29,449
8
JetBlue
2019-1
Class
AA
Pass
Through
Trust2020
A
2.750%
5/15/32
6,939
23
JetBlue
2020-1
Class
A
Pass
Through
Trust
4.000%
11/15/32
21,891
280
John
Deere
Capital
Corp
1.300%
10/13/26
261,080
110
John
Deere
Capital
Corp
4.900%
6/11/27
111,281
40
John
Deere
Capital
Corp
3.350%
4/18/29
38,271
110
John
Deere
Capital
Corp
4.700%
6/10/30
111,425
70
Johnson
&
Johnson
2.950%
3/03/27
67,822
60
Johnson
&
Johnson
4.800%
6/01/29
61,504
390
Johnson
&
Johnson
3.550%
3/01/36
351,819
50
Johnson
&
Johnson
5.250%
6/01/54
51,622
10
Johnson
Controls
International
plc
4.625%
7/02/44
8,807
16
Johnson
Controls
International
plc
5.125%
9/14/45
14,906
20
Johnson
Controls
International
plc
/
Tyco
Fire
&
Security
Finance
SCA
1.750%
9/15/30
16,957
Principal
Amount
(000)
Description
(a)
Coupon
Maturity
Value
INDUSTRIAL
(continued)
$
30
Johnson
Controls
International
plc
/
Tyco
Fire
&
Security
Finance
SCA
2.000%
9/16/31
$
24,820
40
Juniper
Networks
Inc
1.200%
12/10/25
37,864
70
Kellanova
3.400%
11/15/27
67,176
20
Kellanova
2.100%
6/01/30
17,306
20
Kellanova
4.500%
4/01/46
17,225
160
Kenvue
Inc
4.900%
3/22/33
161,506
10
Keurig
Dr
Pepper
Inc
3.400%
11/15/25
9,811
50
Keurig
Dr
Pepper
Inc
5.100%
3/15/27
50,535
30
Keurig
Dr
Pepper
Inc
3.200%
5/01/30
27,632
10
Keurig
Dr
Pepper
Inc
3.800%
5/01/50
7,626
180
Keurig
Dr
Pepper
Inc
4.500%
4/15/52
153,619
50
Keysight
Technologies
Inc
3.000%
10/30/29
45,569
20
Kimberly-Clark
Corp
3.950%
11/01/28
19,649
98
Kimberly-Clark
Corp
6.625%
8/01/37
114,408
90
Kinder
Morgan
Inc
1.750%
11/15/26
84,101
372
Kinder
Morgan
Inc
5.300%
12/01/34
371,131
60
Kinder
Morgan
Inc
3.250%
8/01/50
39,599
50
Kinder
Morgan
Inc
5.950%
8/01/54
50,153
10
KLA
Corp
4.650%
7/15/32
9,989
100
KLA
Corp
4.950%
7/15/52
95,294
10
Koninklijke
KPN
NV
8.375%
10/01/30
11,721
30
Kraft
Heinz
Foods
Co
3.875%
5/15/27
29,419
110
Kraft
Heinz
Foods
Co
4.250%
3/01/31
106,960
130
Kraft
Heinz
Foods
Co
5.500%
6/01/50
127,120
30
Kroger
Co/The
2.200%
5/01/30
26,109
10
Kroger
Co/The
1.700%
1/15/31
8,248
110
Kroger
Co/The
6.900%
4/15/38
126,339
9
Kroger
Co/The
5.400%
7/15/40
8,844
20
Kroger
Co/The
4.450%
2/01/47
17,036
60
Kyndryl
Holdings
Inc
6.350%
2/20/34
62,633
10
Laboratory
Corp
of
America
Holdings
3.600%
9/01/27
9,659
110
Laboratory
Corp
of
America
Holdings
2.700%
6/01/31
95,778
10
Lam
Research
Corp
3.750%
3/15/26
9,845
10
Lam
Research
Corp
1.900%
6/15/30
8,656
90
Lam
Research
Corp
3.125%
6/15/60
59,184
60
Lear
Corp
2.600%
1/15/32
50,355
40
Leggett
&
Platt
Inc
4.400%
3/15/29
37,590
30
Leggett
&
Platt
Inc
3.500%
11/15/51
20,070
10
Lennox
International
Inc
1.700%
8/01/27
9,143
50
Linde
Inc/CT
4.700%
12/05/25
49,961
20
Linde
Inc/CT
1.100%
8/10/30
16,504
90
Lowe's
Cos
Inc
3.350%
4/01/27
86,998
191
Lowe's
Cos
Inc
4.500%
4/15/30
189,036
300
Lowe's
Cos
Inc
5.000%
4/15/40
282,638
10
LYB
International
Finance
III
LLC
1.250%
10/01/25
9,549
190
LYB
International
Finance
III
LLC
3.375%
10/01/40
143,622
21
LYB
International
Finance
III
LLC
4.200%
5/01/50
16,400
70
Magna
International
Inc
2.450%
6/15/30
62,022
200
Marriott
International
Inc/MD
5.550%
10/15/28
206,158
142
Martin
Marietta
Materials
Inc
3.200%
7/15/51
97,605
60
Marvell
Technology
Inc
2.450%
4/15/28
55,092
10
Masco
Corp
2.000%
10/01/30
8,455
70
Masco
Corp
2.000%
2/15/31
58,472
20
Masco
Corp
4.500%
5/15/47
17,109
Nuveen
ESG
U.S.
Aggregate
Bond
ETF
(NUBD)
(continued)
Portfolio
of
Investments
July
31,
2024
Principal
Amount
(000)
Description
(a)
Coupon
Maturity
Value
INDUSTRIAL
(continued)
$
10
Mastercard
Inc
2.950%
11/21/26
$
9,665
32
Mastercard
Inc
2.950%
6/01/29
30,058
44
Mastercard
Inc
3.350%
3/26/30
41,685
120
Mastercard
Inc
2.000%
11/18/31
101,212
40
Mastercard
Inc
3.800%
11/21/46
32,863
70
McCormick
&
Co
Inc/MD
1.850%
2/15/31
58,211
250
McDonald's
Corp
4.600%
9/09/32
247,350
220
McDonald's
Corp
5.150%
9/09/52
208,380
50
McKesson
Corp
4.900%
7/15/28
50,632
10
McKesson
Corp
5.100%
7/15/33
10,216
50
(c)
MDC
Holdings
Inc
3.966%
8/06/61
42,969
30
Mead
Johnson
Nutrition
Co
4.125%
11/15/25
29,675
100
Merck
&
Co
Inc
1.900%
12/10/28
90,254
200
Merck
&
Co
Inc
1.450%
6/24/30
169,186
60
Merck
&
Co
Inc
6.500%
12/01/33
68,187
250
Merck
&
Co
Inc
2.750%
12/10/51
161,259
20
Micron
Technology
Inc
4.975%
2/06/26
19,972
50
Micron
Technology
Inc
4.185%
2/15/27
49,130
110
Micron
Technology
Inc
5.300%
1/15/31
111,953
10
Microsoft
Corp
3.400%
9/15/26
9,806
20
Microsoft
Corp
3.300%
2/06/27
19,539
50
Microsoft
Corp
1.350%
9/15/30
42,373
211
Microsoft
Corp
3.450%
8/08/36
189,568
60
Microsoft
Corp
3.750%
2/12/45
51,801
586
Microsoft
Corp
2.921%
3/17/52
411,603
70
Mohawk
Industries
Inc
5.850%
9/18/28
72,678
50
(c)
Mondelez
International
Inc
4.750%
2/20/29
50,304
20
Moody's
Corp
2.000%
8/19/31
16,701
10
Moody's
Corp
5.250%
7/15/44
9,815
110
Moody's
Corp
3.750%
2/25/52
84,487
10
Mosaic
Co/The
4.050%
11/15/27
9,737
50
Mosaic
Co/The
5.375%
11/15/28
50,957
120
Motorola
Solutions
Inc
2.750%
5/24/31
104,570
240
MPLX
LP
2.650%
8/15/30
211,910
180
MPLX
LP
4.950%
3/14/52
156,863
40
National
Fuel
Gas
Co
5.500%
1/15/26
40,124
10
National
Fuel
Gas
Co
5.500%
10/01/26
10,084
60
NetApp
Inc
2.375%
6/22/27
56,273
50
Norfolk
Southern
Corp
2.300%
5/15/31
43,115
32
Norfolk
Southern
Corp
4.837%
10/01/41
29,971
120
Norfolk
Southern
Corp
2.900%
8/25/51
77,143
130
Norfolk
Southern
Corp
5.350%
8/01/54
127,420
50
NOV
Inc
3.950%
12/01/42
38,737
120
Novartis
Capital
Corp
2.200%
8/14/30
106,295
110
Novartis
Capital
Corp
4.400%
5/06/44
100,999
20
Novartis
Capital
Corp
2.750%
8/14/50
13,421
40
Nutrien
Ltd
5.950%
11/07/25
40,438
100
Nutrien
Ltd
4.200%
4/01/29
97,611
60
NVIDIA
Corp
2.000%
6/15/31
51,680
122
NVIDIA
Corp
3.500%
4/01/40
103,513
50
NVR
Inc
3.000%
5/15/30
45,427
10
NXP
BV
/
NXP
Funding
LLC
/
NXP
USA
Inc
3.150%
5/01/27
9,566
92
NXP
BV
/
NXP
Funding
LLC
/
NXP
USA
Inc
2.500%
5/11/31
78,765
110
NXP
BV
/
NXP
Funding
LLC
/
NXP
USA
Inc
2.650%
2/15/32
93,435
10
Omnicom
Group
Inc
2.450%
4/30/30
8,815
80
Omnicom
Group
Inc
/
Omnicom
Capital
Inc
3.600%
4/15/26
78,156
Principal
Amount
(000)
Description
(a)
Coupon
Maturity
Value
INDUSTRIAL
(continued)
$
273
ONEOK
Inc
4.550%
7/15/28
$
270,418
39
ONEOK
Inc
4.350%
3/15/29
38,208
10
ONEOK
Inc
4.500%
3/15/50
8,181
70
ONEOK
Inc
7.150%
1/15/51
78,824
70
Oracle
Corp
2.800%
4/01/27
66,623
20
Oracle
Corp
4.650%
5/06/30
19,958
120
Oracle
Corp
4.900%
2/06/33
119,123
690
Oracle
Corp
4.300%
7/08/34
645,758
30
Oracle
Corp
6.125%
7/08/39
31,815
280
Oracle
Corp
6.900%
11/09/52
321,259
100
Orange
SA
5.375%
1/13/42
98,536
90
O'Reilly
Automotive
Inc
3.900%
6/01/29
86,907
110
Otis
Worldwide
Corp
3.112%
2/15/40
84,030
2
Owens
Corning
3.400%
8/15/26
1,940
70
Owens
Corning
3.875%
6/01/30
66,366
70
PACCAR
Financial
Corp
3.550%
8/11/25
69,052
20
PACCAR
Financial
Corp
5.200%
11/09/26
20,302
50
PACCAR
Financial
Corp
5.000%
5/13/27
50,729
20
Packaging
Corp
of
America
5.700%
12/01/33
20,836
60
Packaging
Corp
of
America
4.050%
12/15/49
48,117
20
Paramount
Global
4.200%
6/01/29
18,429
200
Paramount
Global
4.200%
5/19/32
170,559
50
Paramount
Global
5.900%
10/15/40
42,183
10
Parker-Hannifin
Corp
3.250%
3/01/27
9,653
30
Parker-Hannifin
Corp
3.250%
6/14/29
28,137
114
Parker-Hannifin
Corp
4.200%
11/21/34
107,349
20
Parker-Hannifin
Corp
4.450%
11/21/44
17,534
10
Parker-Hannifin
Corp
4.000%
6/14/49
8,073
10
PayPal
Holdings
Inc
3.900%
6/01/27
9,829
170
PayPal
Holdings
Inc
2.850%
10/01/29
155,992
40
PepsiCo
Inc
2.375%
10/06/26
38,269
50
PepsiCo
Inc
5.125%
11/10/26
50,686
50
(c)
PepsiCo
Inc
4.500%
7/17/29
50,429
100
PepsiCo
Inc
1.625%
5/01/30
85,757
10
PepsiCo
Inc
4.450%
4/14/46
9,065
364
PepsiCo
Inc
2.875%
10/15/49
250,864
50
Pepsico
Singapore
Financing
I
Pte
Ltd
4.650%
2/16/27
50,185
100
(c)
Pfizer
Inc
3.600%
9/15/28
97,256
350
Pfizer
Inc
4.200%
9/15/48
299,513
100
Pfizer
Investment
Enterprises
Pte
Ltd
4.450%
5/19/26
99,624
100
Pfizer
Investment
Enterprises
Pte
Ltd
4.450%
5/19/28
99,755
150
Pfizer
Investment
Enterprises
Pte
Ltd
4.650%
5/19/30
151,033
190
Pfizer
Investment
Enterprises
Pte
Ltd
4.750%
5/19/33
189,390
150
Pfizer
Investment
Enterprises
Pte
Ltd
5.110%
5/19/43
146,153
40
Phillips
66
Co
3.550%
10/01/26
38,934
173
Phillips
66
Co
4.680%
2/15/45
151,947
150
Plains
All
American
Pipeline
LP
/
PAA
Finance
Corp
5.700%
9/15/34
152,303
50
PPG
Industries
Inc
3.750%
3/15/28
48,482
50
Procter
&
Gamble
Co/The
1.000%
4/23/26
47,226
250
Procter
&
Gamble
Co/The
3.000%
3/25/30
234,645
10
Procter
&
Gamble
Co/The
4.050%
1/26/33
9,782
11
PulteGroup
Inc
5.000%
1/15/27
11,052
220
QUALCOMM
Inc
1.650%
5/20/32
177,714
40
QUALCOMM
Inc
4.250%
5/20/32
39,063
Nuveen
ESG
U.S.
Aggregate
Bond
ETF
(NUBD)
(continued)
Portfolio
of
Investments
July
31,
2024
Principal
Amount
(000)
Description
(a)
Coupon
Maturity
Value
INDUSTRIAL
(continued)
$
30
QUALCOMM
Inc
4.650%
5/20/35
$
30,008
20
Quanta
Services
Inc
2.900%
10/01/30
17,947
80
Quanta
Services
Inc
2.350%
1/15/32
66,765
50
Quest
Diagnostics
Inc
3.450%
6/01/26
48,745
10
Quest
Diagnostics
Inc
2.950%
6/30/30
9,103
130
Regal
Rexnord
Corp
6.300%
2/15/30
135,587
60
Regeneron
Pharmaceuticals
Inc
1.750%
9/15/30
50,715
20
Regeneron
Pharmaceuticals
Inc
2.800%
9/15/50
12,659
50
RELX
Capital
Inc
4.750%
5/20/32
49,686
10
Republic
Services
Inc
3.375%
11/15/27
9,624
70
Republic
Services
Inc
3.950%
5/15/28
68,492
28
Republic
Services
Inc
2.300%
3/01/30
24,806
80
Republic
Services
Inc
1.450%
2/15/31
65,309
20
Republic
Services
Inc
5.700%
5/15/41
20,664
10
Revvity
Inc
3.300%
9/15/29
9,269
110
Revvity
Inc
2.250%
9/15/31
91,399
50
Rockwell
Automation
Inc
4.200%
3/01/49
42,374
10
Rogers
Communications
Inc
3.625%
12/15/25
9,809
10
Rogers
Communications
Inc
2.900%
11/15/26
9,563
50
Rogers
Communications
Inc
3.200%
3/15/27
48,025
10
Rogers
Communications
Inc
3.800%
3/15/32
9,147
150
Rogers
Communications
Inc
5.450%
10/01/43
145,437
10
Rogers
Communications
Inc
3.700%
11/15/49
7,314
130
Roper
Technologies
Inc
3.800%
12/15/26
127,093
100
Royalty
Pharma
PLC
1.200%
9/02/25
95,723
50
Royalty
Pharma
PLC
5.900%
9/02/54
49,744
30
RPM
International
Inc
2.950%
1/15/32
25,879
10
Ryder
System
Inc
2.850%
3/01/27
9,527
50
Ryder
System
Inc
6.300%
12/01/28
52,938
50
Ryder
System
Inc
5.375%
3/15/29
51,095
50
Ryder
System
Inc
4.950%
9/01/29
50,091
130
S&P
Global
Inc
2.900%
3/01/32
114,848
60
(b)
S&P
Global
Inc
5.250%
9/15/33
62,059
23
S&P
Global
Inc
2.300%
8/15/60
12,425
20
Sabine
Pass
Liquefaction
LLC
5.875%
6/30/26
20,201
160
Sabine
Pass
Liquefaction
LLC
4.500%
5/15/30
156,919
60
Salesforce
Inc
2.700%
7/15/41
43,258
152
Salesforce
Inc
2.900%
7/15/51
100,898
10
Schlumberger
Finance
Canada
Ltd
1.400%
9/17/25
9,618
82
Schlumberger
Investment
SA
2.650%
6/26/30
73,961
10
Sherwin-Williams
Co/The
4.250%
8/08/25
9,913
101
Sherwin-Williams
Co/The
2.950%
8/15/29
93,054
42
Sherwin-Williams
Co/The
4.500%
6/01/47
36,561
20
Smith
&
Nephew
PLC
2.032%
10/14/30
16,973
60
(b)
Smurfit
Kappa
Treasury
ULC
5.438%
4/03/34
61,015
50
Snap-on
Inc
3.100%
5/01/50
34,604
150
(b)
Solventum
Corp
5.600%
3/23/34
150,913
70
Sonoco
Products
Co
2.850%
2/01/32
60,081
110
Stanley
Black
&
Decker
Inc
3.000%
5/15/32
96,361
10
Starbucks
Corp
2.250%
3/12/30
8,827
20
Starbucks
Corp
2.550%
11/15/30
17,662
150
Starbucks
Corp
3.000%
2/14/32
132,835
100
Starbucks
Corp
4.800%
2/15/33
99,741
60
Starbucks
Corp
3.500%
11/15/50
43,042
150
Stryker
Corp
1.950%
6/15/30
129,235
130
Sysco
Corp
3.250%
7/15/27
124,786
50
Sysco
Corp
6.000%
1/17/34
53,657
20
Sysco
Corp
6.600%
4/01/50
22,652
10
Takeda
Pharmaceutical
Co
Ltd
2.050%
3/31/30
8,643
Principal
Amount
(000)
Description
(a)
Coupon
Maturity
Value
INDUSTRIAL
(continued)
$
20
Takeda
Pharmaceutical
Co
Ltd
3.025%
7/09/40
$
14,869
60
Takeda
Pharmaceutical
Co
Ltd
3.375%
7/09/60
39,545
50
Take-Two
Interactive
Software
Inc
3.700%
4/14/27
48,685
30
Tapestry
Inc
4.125%
7/15/27
29,090
140
Tapestry
Inc
3.050%
3/15/32
116,259
75
Targa
Resources
Corp
6.150%
3/01/29
78,623
100
Targa
Resources
Corp
6.500%
3/30/34
108,256
1
Target
Corp
3.375%
4/15/29
959
120
Target
Corp
2.350%
2/15/30
107,524
72
Target
Corp
6.500%
10/15/37
81,894
19
Target
Corp
3.900%
11/15/47
15,494
40
TC
PipeLines
LP
3.900%
5/25/27
38,700
40
Teledyne
Technologies
Inc
2.250%
4/01/28
36,601
70
TELUS
Corp
3.700%
9/15/27
67,684
10
TELUS
Corp
4.600%
11/16/48
8,598
10
Texas
Eastern
Transmission
LP
7.000%
7/15/32
11,099
60
Texas
Instruments
Inc
1.750%
5/04/30
51,988
100
(c)
Texas
Instruments
Inc
1.900%
9/15/31
85,022
100
Texas
Instruments
Inc
3.875%
3/15/39
90,398
30
Texas
Instruments
Inc
4.150%
5/15/48
25,688
50
Thermo
Fisher
Scientific
Inc
4.953%
8/10/26
50,305
190
Thermo
Fisher
Scientific
Inc
2.800%
10/15/41
139,336
50
Thomson
Reuters
Corp
3.350%
5/15/26
48,649
170
Time
Warner
Cable
LLC
6.750%
6/15/39
168,355
30
Timken
Co/The
4.125%
4/01/32
27,979
50
TJX
Cos
Inc/The
3.875%
4/15/30
48,426
40
Toll
Brothers
Finance
Corp
4.875%
11/15/25
39,783
100
Toyota
Motor
Corp
5.118%
7/13/28
102,187
142
Toyota
Motor
Corp
2.760%
7/02/29
132,218
50
Toyota
Motor
Credit
Corp
5.200%
5/15/26
50,464
100
Toyota
Motor
Credit
Corp
1.125%
6/18/26
93,725
110
Toyota
Motor
Credit
Corp
5.250%
9/11/28
112,972
60
Toyota
Motor
Credit
Corp
4.650%
1/05/29
60,298
10
Toyota
Motor
Credit
Corp
2.150%
2/13/30
8,837
50
Toyota
Motor
Credit
Corp
4.550%
5/17/30
49,981
10
Trane
Technologies
Financing
Ltd
3.800%
3/21/29
9,641
70
Trane
Technologies
Financing
Ltd
5.250%
3/03/33
71,817
50
Trane
Technologies
Financing
Ltd
5.100%
6/13/34
50,876
290
TransCanada
PipeLines
Ltd
2.500%
10/12/31
249,544
60
Transcontinental
Gas
Pipe
Line
Co
LLC
7.850%
2/01/26
61,984
80
Transcontinental
Gas
Pipe
Line
Co
LLC
3.250%
5/15/30
73,678
70
Transcontinental
Gas
Pipe
Line
Co
LLC
3.950%
5/15/50
54,179
30
Trimble
Inc
6.100%
3/15/33
31,588
10
Triton
Container
International
Ltd
/
TAL
International
Container
Corp
3.250%
3/15/32
8,499
150
TSMC
Arizona
Corp
4.250%
4/22/32
148,107
39
TWDC
Enterprises
18
Corp
3.150%
9/17/25
38,277
10
TWDC
Enterprises
18
Corp
2.950%
6/15/27
9,583
20
TWDC
Enterprises
18
Corp
4.375%
8/16/41
17,895
30
TWDC
Enterprises
18
Corp
4.125%
12/01/41
26,094
50
Tyco
Electronics
Group
SA
4.625%
2/01/30
50,124
60
Tyco
Electronics
Group
SA
2.500%
2/04/32
51,913
21
Unilever
Capital
Corp
2.000%
7/28/26
19,976
Nuveen
ESG
U.S.
Aggregate
Bond
ETF
(NUBD)
(continued)
Portfolio
of
Investments
July
31,
2024
Principal
Amount
(000)
Description
(a)
Coupon
Maturity
Value
INDUSTRIAL
(continued)
$
150
Unilever
Capital
Corp
1.750%
8/12/31
$
125,245
10
Union
Pacific
Corp
3.750%
7/15/25
9,881
10
Union
Pacific
Corp
2.150%
2/05/27
9,437
20
Union
Pacific
Corp
3.375%
2/01/35
17,620
20
Union
Pacific
Corp
3.600%
9/15/37
17,316
498
Union
Pacific
Corp
3.550%
8/15/39
420,138
20
Union
Pacific
Corp
3.875%
2/01/55
15,649
80
United
Parcel
Service
Inc
4.450%
4/01/30
79,994
170
United
Parcel
Service
Inc
5.200%
4/01/40
169,604
10
United
Parcel
Service
Inc
3.750%
11/15/47
7,853
10
United
Parcel
Service
Inc
5.300%
4/01/50
9,893
60
United
Parcel
Service
Inc
5.500%
5/22/54
60,644
10
Valero
Energy
Corp
2.150%
9/15/27
9,258
130
Valero
Energy
Corp
2.800%
12/01/31
112,627
40
Valero
Energy
Corp
6.625%
6/15/37
43,810
30
Valmont
Industries
Inc
5.250%
10/01/54
27,601
30
VeriSign
Inc
4.750%
7/15/27
29,763
50
Verisk
Analytics
Inc
4.125%
3/15/29
48,986
149
Verizon
Communications
Inc
4.016%
12/03/29
144,004
90
Verizon
Communications
Inc
1.500%
9/18/30
75,314
115
Verizon
Communications
Inc
2.550%
3/21/31
99,630
605
Verizon
Communications
Inc
2.355%
3/15/32
506,131
100
Verizon
Communications
Inc
5.050%
5/09/33
100,748
112
Verizon
Communications
Inc
2.850%
9/03/41
80,613
50
Verizon
Communications
Inc
5.500%
3/16/47
51,440
80
Verizon
Communications
Inc
4.000%
3/22/50
63,997
320
Verizon
Communications
Inc
3.875%
3/01/52
250,073
20
Verizon
Communications
Inc
2.987%
10/30/56
12,612
30
VF
Corp
2.800%
4/23/27
27,894
50
Visa
Inc
2.050%
4/15/30
44,029
10
Visa
Inc
1.100%
2/15/31
8,155
241
Visa
Inc
4.150%
12/14/35
231,220
20
Visa
Inc
2.000%
8/15/50
11,608
120
VMware
LLC
1.400%
8/15/26
111,925
20
Vodafone
Group
PLC
6.250%
11/30/32
21,738
155
Vodafone
Group
PLC
6.150%
2/27/37
167,879
20
Vodafone
Group
PLC
4.875%
6/19/49
17,839
20
Vodafone
Group
PLC
4.250%
9/17/50
16,112
50
Vodafone
Group
PLC
5.750%
6/28/54
49,622
10
Walt
Disney
Co/The
3.800%
3/22/30
9,633
50
Walt
Disney
Co/The
2.650%
1/13/31
44,497
160
Walt
Disney
Co/The
6.400%
12/15/35
179,379
40
Walt
Disney
Co/The
6.650%
11/15/37
46,095
12
Walt
Disney
Co/The
4.750%
9/15/44
11,175
60
Walt
Disney
Co/The
4.950%
10/15/45
56,390
300
Walt
Disney
Co/The
2.750%
9/01/49
195,920
10
Walt
Disney
Co/The
3.600%
1/13/51
7,648
1
Warnermedia
Holdings
Inc
3.788%
3/15/25
987
11
Warnermedia
Holdings
Inc
5.391%
3/15/62
8,203
110
Waste
Connections
Inc
2.200%
1/15/32
92,000
10
Waste
Management
Inc
1.500%
3/15/31
8,213
120
Waste
Management
Inc
4.150%
4/15/32
115,782
70
Waste
Management
Inc
4.875%
2/15/34
70,276
110
Western
Midstream
Operating
LP
6.150%
4/01/33
114,285
30
Western
Union
Co/The
6.200%
11/17/36
31,255
50
Westlake
Corp
5.000%
8/15/46
44,904
20
Westlake
Corp
4.375%
11/15/47
16,496
30
Weyerhaeuser
Co
4.000%
4/15/30
28,734
20
Weyerhaeuser
Co
7.375%
3/15/32
22,784
Principal
Amount
(000)
Description
(a)
Coupon
Maturity
Value
INDUSTRIAL
(continued)
$
40
Weyerhaeuser
Co
3.375%
3/09/33
$
35,256
100
Whirlpool
Corp
4.700%
5/14/32
97,037
200
Williams
Cos
Inc/The
2.600%
3/15/31
172,991
50
Williams
Cos
Inc/The
5.150%
3/15/34
49,864
70
Workday
Inc
3.700%
4/01/29
66,985
90
WRKCo
Inc
4.000%
3/15/28
87,442
10
WRKCo
Inc
3.000%
6/15/33
8,595
10
WW
Grainger
Inc
4.600%
6/15/45
9,158
50
Xilinx
Inc
2.375%
6/01/30
44,314
31
Xylem
Inc/NY
2.250%
1/30/31
26,523
60
Zimmer
Biomet
Holdings
Inc
2.600%
11/24/31
51,391
20
Zoetis
Inc
4.500%
11/13/25
19,879
126
Zoetis
Inc
3.900%
8/20/28
122,509
9
Zoetis
Inc
2.000%
5/15/30
7,773
20
Zoetis
Inc
5.600%
11/16/32
20,892
TOTAL
INDUSTRIAL
53,182,228
UTILITY
-
2.4%
62
AEP
Texas
Inc
4.150%
5/01/49
48,330
20
AEP
Texas
Inc
3.450%
1/15/50
13,683
75
Ameren
Corp
5.000%
1/15/29
75,453
30
American
Electric
Power
Co
Inc
5.750%
11/01/27
30,882
80
American
Electric
Power
Co
Inc
5.200%
1/15/29
81,050
120
American
Water
Capital
Corp
2.800%
5/01/30
108,104
110
American
Water
Capital
Corp
2.300%
6/01/31
93,610
20
American
Water
Capital
Corp
3.750%
9/01/47
15,601
20
American
Water
Capital
Corp
4.200%
9/01/48
16,689
50
American
Water
Capital
Corp
5.450%
3/01/54
49,608
160
Appalachian
Power
Co
4.400%
5/15/44
131,894
10
Appalachian
Power
Co
3.700%
5/01/50
7,174
40
Atmos
Energy
Corp
2.625%
9/15/29
36,425
100
Atmos
Energy
Corp
5.900%
11/15/33
106,699
100
Atmos
Energy
Corp
2.850%
2/15/52
64,005
10
Avista
Corp
4.350%
6/01/48
8,486
70
Avista
Corp
4.000%
4/01/52
54,220
120
Berkshire
Hathaway
Energy
Co
3.700%
7/15/30
114,003
210
Berkshire
Hathaway
Energy
Co
5.150%
11/15/43
203,482
100
Berkshire
Hathaway
Energy
Co
4.600%
5/01/53
86,024
50
Black
Hills
Corp
5.950%
3/15/28
51,716
10
CenterPoint
Energy
Houston
Electric
LLC
5.200%
10/01/28
10,201
100
CenterPoint
Energy
Houston
Electric
LLC
3.000%
3/01/32
88,018
50
CenterPoint
Energy
Houston
Electric
LLC
5.150%
3/01/34
50,542
10
CenterPoint
Energy
Houston
Electric
LLC
3.550%
8/01/42
7,929
110
CenterPoint
Energy
Inc
1.450%
6/01/26
103,226
100
CenterPoint
Energy
Resources
Corp
4.100%
9/01/47
80,456
120
Cleveland
Electric
Illuminating
Co/The
5.950%
12/15/36
125,001
121
Commonwealth
Edison
Co
6.450%
1/15/38
135,092
110
Commonwealth
Edison
Co
2.750%
9/01/51
68,159
120
Connecticut
Light
and
Power
Co/The
2.050%
7/01/31
100,487
50
Consolidated
Edison
Co
of
New
York
Inc
2.400%
6/15/31
43,271
124
Consolidated
Edison
Co
of
New
York
Inc
5.500%
12/01/39
125,786
Nuveen
ESG
U.S.
Aggregate
Bond
ETF
(NUBD)
(continued)
Portfolio
of
Investments
July
31,
2024
Principal
Amount
(000)
Description
(a)
Coupon
Maturity
Value
UTILITY
(continued)
$
162
Consolidated
Edison
Co
of
New
York
Inc
4.650%
12/01/48
$
143,329
30
Consolidated
Edison
Co
of
New
York
Inc
3.950%
4/01/50
24,273
70
Consolidated
Edison
Co
of
New
York
Inc
4.300%
12/01/56
57,020
10
Consolidated
Edison
Co
of
New
York
Inc
4.500%
5/15/58
8,414
10
Consolidated
Edison
Co
of
New
York
Inc
3.700%
11/15/59
7,185
41
Consolidated
Edison
Co
of
New
York
Inc
3.000%
12/01/60
25,046
10
Consumers
Energy
Co
3.800%
11/15/28
9,711
100
Consumers
Energy
Co
4.900%
2/15/29
101,279
100
Consumers
Energy
Co
3.500%
8/01/51
74,893
136
DTE
Energy
Co
2.950%
3/01/30
122,900
122
Duke
Energy
Florida
LLC
2.400%
12/15/31
104,062
67
Duke
Energy
Florida
LLC
6.350%
9/15/37
73,637
170
Duke
Energy
Florida
LLC
5.950%
11/15/52
178,809
20
Duke
Energy
Indiana
LLC
3.250%
10/01/49
13,809
50
Edison
International
5.450%
6/15/29
50,882
92
Emera
US
Finance
LP
4.750%
6/15/46
77,563
60
Entergy
Arkansas
LLC
5.150%
1/15/33
60,840
50
Entergy
Louisiana
LLC
5.700%
3/15/54
50,773
10
Entergy
Texas
Inc
3.550%
9/30/49
7,283
110
Essential
Utilities
Inc
2.400%
5/01/31
93,795
10
Essential
Utilities
Inc
3.351%
4/15/50
6,908
100
Evergy
Metro
Inc
4.950%
4/15/33
99,600
10
Eversource
Energy
1.650%
8/15/30
8,282
50
Eversource
Energy
5.850%
4/15/31
51,861
120
Exelon
Corp
2.750%
3/15/27
114,161
10
Exelon
Corp
4.050%
4/15/30
9,624
60
Exelon
Corp
4.950%
6/15/35
57,817
90
Exelon
Corp
4.450%
4/15/46
76,797
20
Exelon
Corp
4.700%
4/15/50
17,462
50
Georgia
Power
Co
5.250%
3/15/34
51,077
50
Idaho
Power
Co
5.800%
4/01/54
51,066
48
Interstate
Power
and
Light
Co
3.600%
4/01/29
45,812
70
IPALCO
Enterprises
Inc
4.250%
5/01/30
66,427
50
MidAmerican
Energy
Co
5.750%
11/01/35
52,829
30
MidAmerican
Energy
Co
3.150%
4/15/50
20,771
70
National
Grid
PLC
5.418%
1/11/34
70,227
100
National
Rural
Utilities
Cooperative
Finance
Corp
5.000%
2/07/31
101,255
100
National
Rural
Utilities
Cooperative
Finance
Corp
2.750%
4/15/32
86,596
10
NiSource
Inc
3.490%
5/15/27
9,659
161
NiSource
Inc
3.600%
5/01/30
151,252
30
NiSource
Inc
1.700%
2/15/31
24,518
50
NiSource
Inc
5.350%
4/01/34
50,370
20
NiSource
Inc
4.800%
2/15/44
17,959
50
NiSource
Inc
4.375%
5/15/47
41,641
50
Northern
States
Power
Co/MN
5.400%
3/15/54
49,790
50
NSTAR
Electric
Co
3.200%
5/15/27
48,174
110
NSTAR
Electric
Co
3.950%
4/01/30
106,222
62
NSTAR
Electric
Co
5.500%
3/15/40
63,165
50
OGE
Energy
Corp
5.450%
5/15/29
51,212
100
Oklahoma
Gas
and
Electric
Co
4.150%
4/01/47
82,324
20
Oncor
Electric
Delivery
Co
LLC
2.750%
5/15/30
18,091
77
Oncor
Electric
Delivery
Co
LLC
7.500%
9/01/38
94,548
110
Oncor
Electric
Delivery
Co
LLC
4.950%
9/15/52
102,123
Principal
Amount
(000)
Description
(a)
Coupon
Maturity
Value
UTILITY
(continued)
$
30
ONE
Gas
Inc
4.250%
9/01/32
$
29,158
40
ONE
Gas
Inc
4.500%
11/01/48
34,368
90
PacifiCorp
2.700%
9/15/30
79,742
10
PacifiCorp
5.250%
6/15/35
10,042
110
PacifiCorp
5.800%
1/15/55
109,183
180
PECO
Energy
Co
4.600%
5/15/52
158,465
60
Piedmont
Natural
Gas
Co
Inc
2.500%
3/15/31
51,692
76
Potomac
Electric
Power
Co
6.500%
11/15/37
85,979
50
PPL
Capital
Funding
Inc
3.100%
5/15/26
48,471
50
PPL
Electric
Utilities
Corp
4.850%
2/15/34
49,897
60
PPL
Electric
Utilities
Corp
4.150%
10/01/45
51,114
18
Public
Service
Co
of
Colorado
6.500%
8/01/38
20,042
150
Public
Service
Co
of
Colorado
4.100%
6/15/48
118,381
50
Public
Service
Co
of
New
Hampshire
2.200%
6/15/31
42,391
20
Public
Service
Co
of
Oklahoma
2.200%
8/15/31
16,594
10
Public
Service
Electric
and
Gas
Co
2.250%
9/15/26
9,517
70
Public
Service
Electric
and
Gas
Co
1.900%
8/15/31
58,146
140
Public
Service
Electric
and
Gas
Co
5.800%
5/01/37
150,624
20
Public
Service
Electric
and
Gas
Co
2.050%
8/01/50
11,158
50
Public
Service
Electric
and
Gas
Co
5.450%
3/01/54
50,857
100
Puget
Energy
Inc
4.224%
3/15/32
91,740
30
Puget
Sound
Energy
Inc
5.638%
4/15/41
30,304
100
San
Diego
Gas
&
Electric
Co
3.000%
3/15/32
88,278
43
San
Diego
Gas
&
Electric
Co
4.150%
5/15/48
35,618
10
San
Diego
Gas
&
Electric
Co
4.100%
6/15/49
8,118
134
Sempra
6.000%
10/15/39
139,721
20
Sempra
4.000%
2/01/48
15,673
220
Southern
California
Edison
Co
4.700%
6/01/27
219,915
50
Southern
California
Edison
Co
5.200%
6/01/34
50,151
20
Southern
California
Edison
Co
4.500%
9/01/40
17,677
50
Southern
California
Edison
Co
3.600%
2/01/45
37,661
90
Southern
California
Edison
Co
4.875%
3/01/49
80,811
10
Southern
California
Edison
Co
3.650%
2/01/50
7,381
200
Southern
California
Edison
Co
5.450%
6/01/52
194,760
10
Southern
California
Gas
Co
2.600%
6/15/26
9,614
20
Southern
California
Gas
Co
2.550%
2/01/30
17,932
40
Southern
California
Gas
Co
4.300%
1/15/49
32,979
140
Southern
California
Gas
Co
5.750%
6/01/53
143,922
60
Southern
Co/The
5.200%
6/15/33
60,330
10
Southwest
Gas
Corp
5.800%
12/01/27
10,257
10
Southwest
Gas
Corp
3.700%
4/01/28
9,643
40
Southwest
Gas
Corp
2.200%
6/15/30
34,591
20
Southwest
Gas
Corp
3.800%
9/29/46
15,175
140
Southwestern
Electric
Power
Co
3.250%
11/01/51
91,720
126
Southwestern
Public
Service
Co
4.500%
8/15/41
109,088
23
Southwestern
Public
Service
Co
4.400%
11/15/48
18,681
10
Southwestern
Public
Service
Co
3.150%
5/01/50
6,588
20
Spire
Missouri
Inc
4.800%
2/15/33
19,985
50
Tampa
Electric
Co
5.000%
7/15/52
46,579
40
Tucson
Electric
Power
Co
3.250%
5/15/32
35,751
50
Tucson
Electric
Power
Co
3.250%
5/01/51
33,922
25
Union
Electric
Co
5.450%
3/15/53
24,646
50
Union
Electric
Co
5.250%
1/15/54
47,978
30
Washington
Gas
Light
Co
3.796%
9/15/46
23,404
Nuveen
ESG
U.S.
Aggregate
Bond
ETF
(NUBD)
(continued)
Portfolio
of
Investments
July
31,
2024
Principal
Amount
(000)
Description
(a)
Coupon
Maturity
Value
UTILITY
(continued)
$
10
WEC
Energy
Group
Inc
5.000%
9/27/25
$
9,990
100
WEC
Energy
Group
Inc
5.600%
9/12/26
101,408
100
WEC
Energy
Group
Inc
2.200%
12/15/28
90,002
20
Wisconsin
Power
and
Light
Co
1.950%
9/16/31
16,384
50
Wisconsin
Power
and
Light
Co
4.950%
4/01/33
49,794
68
Wisconsin
Public
Service
Corp
3.671%
12/01/42
55,022
TOTAL
UTILITY
8,839,443
TOTAL
CORPORATE
DEBT
(cost
$99,595,861)
92,446,771
Principal
Amount
(000)
Description
(a)
Coupon
Maturity
Value
X
–
GOVERNMENT
RELATED
-
4.5%
GOVERNMENT
AGENCY
-
1.4%
$
20
Equinor
ASA
3.000%
4/06/27
19,263
10
Equinor
ASA
3.625%
9/10/28
9,705
154
Equinor
ASA
3.125%
4/06/30
142,901
30
Equinor
ASA
5.100%
8/17/40
29,634
62
Equinor
ASA
3.950%
5/15/43
52,352
10
Equinor
ASA
3.250%
11/18/49
7,189
30
Equinor
ASA
3.700%
4/06/50
23,477
100
Export
Development
Canada
3.375%
8/26/25
98,676
100
Export
Development
Canada
4.375%
6/29/26
100,005
170
Export
Development
Canada
4.125%
2/13/29
170,581
81
Federal
National
Mortgage
Association
2.625%
9/06/24
80,768
70
(c)
Federal
National
Mortgage
Association
1.625%
1/07/25
68,944
200
Federal
National
Mortgage
Association
0.500%
6/17/25
192,658
280
Federal
National
Mortgage
Association
1.875%
9/24/26
266,321
379
Federal
National
Mortgage
Association
5.625%
7/15/37
427,925
20
Industrial
&
Commercial
Bank
of
China
Ltd/New
York
NY
3.538%
11/08/27
19,335
10
Israel
Government
AID
Bond
5.500%
9/18/33
10,797
99
Japan
Bank
for
International
Cooperation
2.500%
5/28/25
97,027
100
Japan
International
Cooperation
Agency
4.000%
5/23/28
98,676
40
Korea
Development
Bank/The
1.375%
4/25/27
36,853
170
Korea
Development
Bank/The
4.375%
2/15/28
170,068
200
Korea
Development
Bank/The
5.375%
10/23/28
207,978
20
Kreditanstalt
fuer
Wiederaufbau
1.375%
8/05/24
19,992
744
Kreditanstalt
fuer
Wiederaufbau
2.500%
11/20/24
737,721
79
Kreditanstalt
fuer
Wiederaufbau
0.375%
7/18/25
75,805
50
Kreditanstalt
fuer
Wiederaufbau
5.000%
3/16/26
50,425
100
Kreditanstalt
fuer
Wiederaufbau
4.625%
8/07/26
100,596
442
Kreditanstalt
fuer
Wiederaufbau
3.000%
5/20/27
428,676
100
Kreditanstalt
fuer
Wiederaufbau
4.750%
10/29/30
103,887
Principal
Amount
(000)
Description
(a)
Coupon
Maturity
Value
GOVERNMENT
AGENCY
(continued)
$
110
Kreditanstalt
fuer
Wiederaufbau
4.125%
7/15/33
$
109,892
75
Kreditanstalt
fuer
Wiederaufbau
4.375%
2/28/34
76,493
40
Landwirtschaftliche
Rentenbank
0.500%
5/27/25
38,585
110
Landwirtschaftliche
Rentenbank
3.875%
9/28/27
109,130
100
Landwirtschaftliche
Rentenbank
4.625%
4/17/29
102,569
100
Landwirtschaftliche
Rentenbank
5.000%
10/24/33
105,975
20
Oesterreichische
Kontrollbank
AG
0.500%
9/16/24
19,876
160
Oesterreichische
Kontrollbank
AG
2.875%
5/23/25
157,361
50
Oesterreichische
Kontrollbank
AG
4.750%
5/21/27
50,698
80
Oesterreichische
Kontrollbank
AG
4.125%
1/18/29
80,169
260
Svensk
Exportkredit
AB
4.625%
11/28/25
259,760
TOTAL
GOVERNMENT
AGENCY
4,958,743
MUNICIPAL
BONDS
-
0.9%
(d)
250
Province
of
Alberta
Canada
(No
Opt.
Call)
1.000%
5/20/25
242,314
160
Province
of
Alberta
Canada
(No
Opt.
Call)
3.300%
3/15/28
155,130
50
Province
of
Alberta
Canada
(No
Opt.
Call)
4.500%
6/26/29
50,712
40
Province
of
Alberta
Canada
(No
Opt.
Call)
1.300%
7/22/30
33,868
50
Province
of
Alberta
Canada
(No
Opt.
Call)
4.500%
1/24/34
50,152
175
Province
of
British
Columbia
Canada
(No
Opt.
Call)
1.750%
9/27/24
173,987
150
Province
of
British
Columbia
Canada
(No
Opt.
Call)
2.250%
6/02/26
144,163
110
Province
of
British
Columbia
Canada
(No
Opt.
Call)
0.900%
7/20/26
102,719
85
Province
of
British
Columbia
Canada
(No
Opt.
Call)
4.200%
7/06/33
83,397
100
Province
of
British
Columbia
Canada
(No
Opt.
Call)
4.750%
6/12/34
102,087
100
(c)
Province
of
Manitoba
Canada
(No
Opt.
Call)
1.500%
10/25/28
89,620
100
Province
of
Manitoba
Canada
(No
Opt.
Call)
4.300%
7/27/33
98,870
80
Province
of
New
Brunswick
Canada
(No
Opt.
Call)
3.625%
2/24/28
77,801
300
Province
of
Ontario
Canada
(No
Opt.
Call)
2.500%
4/27/26
289,975
260
Province
of
Ontario
Canada
(No
Opt.
Call)
3.100%
5/19/27
251,943
23
Province
of
Ontario
Canada
(No
Opt.
Call)
1.050%
5/21/27
21,061
150
Province
of
Ontario
Canada
(No
Opt.
Call)
4.200%
1/18/29
150,003
150
Province
of
Ontario
Canada
(No
Opt.
Call)
1.800%
10/14/31
126,951
Nuveen
ESG
U.S.
Aggregate
Bond
ETF
(NUBD)
(continued)
Portfolio
of
Investments
July
31,
2024
Principal
Amount
(000)
Description
(a)
Coupon
Maturity
Value
MUNICIPAL
BONDS
(continued)
$
100
Province
of
Ontario
Canada
(No
Opt.
Call)
2.125%
1/21/32
$
86,187
89
Province
of
Quebec
Canada
(No
Opt.
Call)
2.875%
10/16/24
88,528
180
Province
of
Quebec
Canada
(No
Opt.
Call)
1.500%
2/11/25
176,570
120
Province
of
Quebec
Canada
(No
Opt.
Call)
0.600%
7/23/25
115,185
305
Province
of
Quebec
Canada
(No
Opt.
Call)
2.500%
4/20/26
294,919
70
Province
of
Quebec
Canada
(No
Opt.
Call)
2.750%
4/12/27
67,312
140
Province
of
Quebec
Canada
(No
Opt.
Call)
4.500%
4/03/29
141,842
100
Province
of
Quebec
Canada
(No
Opt.
Call)
4.500%
9/08/33
100,353
TOTAL
MUNICIPAL
BONDS
3,315,649
SOVEREIGN
DEBT
-
2.2%
20
African
Development
Bank
3.375%
7/07/25
19,736
110
African
Development
Bank
0.875%
7/22/26
102,745
100
Asian
Development
Bank
4.875%
5/21/26
100,815
250
Asian
Development
Bank
1.500%
1/20/27
234,164
120
Asian
Development
Bank
4.500%
8/25/28
121,890
100
Asian
Development
Bank
4.375%
3/06/29
101,478
100
Asian
Development
Bank
1.875%
3/15/29
91,014
100
Asian
Development
Bank
3.125%
4/27/32
93,595
110
Asian
Development
Bank
4.125%
1/12/34
109,693
210
Canada
Government
International
Bond
3.750%
4/26/28
207,657
80
Chile
Government
International
Bond
3.125%
1/21/26
77,388
30
Chile
Government
International
Bond
3.240%
2/06/28
28,388
160
Chile
Government
International
Bond
2.450%
1/31/31
138,657
90
Chile
Government
International
Bond
4.950%
1/05/36
87,708
260
Chile
Government
International
Bond
3.250%
9/21/71
164,505
50
Council
Of
Europe
Development
Bank
0.875%
9/22/26
46,479
100
Council
Of
Europe
Development
Bank
4.625%
6/11/27
101,228
30
European
Bank
for
Reconstruction
&
Development
1.500%
2/13/25
29,424
100
European
Bank
for
Reconstruction
&
Development
4.375%
3/09/28
100,894
110
European
Investment
Bank
2.750%
8/15/25
107,796
100
European
Investment
Bank
0.750%
10/26/26
92,567
112
European
Investment
Bank
1.375%
3/15/27
104,239
100
European
Investment
Bank
4.500%
10/16/28
101,713
225
European
Investment
Bank
4.000%
2/15/29
224,780
100
European
Investment
Bank
4.750%
6/15/29
103,200
170
European
Investment
Bank
3.625%
7/15/30
166,702
100
European
Investment
Bank
4.375%
10/10/31
101,505
85
European
Investment
Bank
4.125%
2/13/34
84,855
84
Hungary
Government
International
Bond
7.625%
3/29/41
96,708
190
Indonesia
Government
International
Bond
4.550%
1/11/28
188,085
Principal
Amount
(000)
Description
(a)
Coupon
Maturity
Value
SOVEREIGN
DEBT
(continued)
$
70
Indonesia
Government
International
Bond
4.850%
1/11/33
$
69,410
280
Indonesia
Government
International
Bond
5.650%
1/11/53
286,384
100
Inter-American
Development
Bank
4.500%
5/15/26
100,155
100
Inter-American
Development
Bank
1.500%
1/13/27
93,700
90
Inter-American
Development
Bank
4.375%
2/01/27
90,342
100
Inter-American
Development
Bank
4.000%
1/12/28
99,591
110
Inter-American
Development
Bank
1.125%
7/20/28
98,237
240
Inter-American
Development
Bank
3.875%
10/28/41
216,171
535
International
Bank
for
Reconstruction
&
Development
1.500%
8/28/24
533,388
161
International
Bank
for
Reconstruction
&
Development
2.125%
3/03/25
158,301
40
International
Bank
for
Reconstruction
&
Development
0.625%
4/22/25
38,778
60
International
Bank
for
Reconstruction
&
Development
3.125%
11/20/25
58,908
60
International
Bank
for
Reconstruction
&
Development
2.500%
11/22/27
57,019
100
International
Bank
for
Reconstruction
&
Development
4.625%
8/01/28
102,057
92
International
Bank
for
Reconstruction
&
Development
4.000%
7/25/30
92,028
95
International
Bank
for
Reconstruction
&
Development
4.000%
1/10/31
94,825
100
International
Bank
for
Reconstruction
&
Development
4.500%
4/10/31
102,763
100
International
Bank
for
Reconstruction
&
Development
1.625%
11/03/31
84,591
112
International
Bank
for
Reconstruction
&
Development
2.500%
3/29/32
100,411
100
International
Bank
for
Reconstruction
&
Development
4.750%
11/14/33
104,493
50
International
Finance
Corp
2.126%
4/07/26
48,131
35
International
Finance
Corp
4.375%
1/15/27
35,124
180
Israel
Government
International
Bond
2.750%
7/03/30
154,482
280
Israel
Government
International
Bond
3.875%
7/03/50
198,450
30
Korea
International
Bond
2.750%
1/19/27
28,862
30
Korea
International
Bond
2.500%
6/19/29
27,898
60
Korea
International
Bond
1.000%
9/16/30
49,819
70
Korea
International
Bond
1.750%
10/15/31
59,099
200
Nordic
Investment
Bank
5.000%
10/15/25
200,846
40
Panama
Government
International
Bond
3.160%
1/23/30
34,354
80
Panama
Government
International
Bond
6.875%
1/31/36
80,083
200
Panama
Government
International
Bond
8.000%
3/01/38
215,327
250
Panama
Government
International
Bond
4.500%
5/15/47
177,392
90
Panama
Government
International
Bond
4.500%
4/16/50
62,086
Nuveen
ESG
U.S.
Aggregate
Bond
ETF
(NUBD)
(continued)
Portfolio
of
Investments
July
31,
2024
Principal
Amount
(000)
Description
(a)
Coupon
Maturity
Value
SOVEREIGN
DEBT
(continued)
$
65
Peruvian
Government
International
Bond
3.000%
1/15/34
$
53,666
96
Peruvian
Government
International
Bond
5.625%
11/18/50
95,036
20
Peruvian
Government
International
Bond
3.550%
3/10/51
14,471
120
Republic
of
Italy
Government
International
Bond
1.250%
2/17/26
113,343
140
Republic
of
Italy
Government
International
Bond
2.875%
10/17/29
126,840
200
Republic
of
Poland
Government
International
Bond
4.875%
10/04/33
198,224
75
Republic
of
Poland
Government
International
Bond
5.125%
9/18/34
75,245
15
Uruguay
Government
International
Bond
4.375%
1/23/31
14,741
83
Uruguay
Government
International
Bond
5.750%
10/28/34
88,479
200
Uruguay
Government
International
Bond
4.125%
11/20/45
176,355
TOTAL
SOVEREIGN
DEBT
8,239,513
TOTAL
GOVERNMENT
RELATED
(cost
$17,477,871)
16,513,905
TOTAL
LONG-TERM
INVESTMENTS
(cost
$388,555,528)
363,608,700
Shares
Description
(a)
Coupon
Value
INVESTMENTS
PURCHASED
WITH
COLLATERAL
FROM
SECURITIES
LENDING
-
0.2%
590,778
(e)
State
Street
Navigator
Securities
Lending
Government
Money
Market
Portfolio
5.310%(f)
$
590,778
TOTAL
INVESTMENTS
PURCHASED
WITH
COLLATERAL
FROM
SECURITIES
LENDING
(cost
$590,778)
590,778
TOTAL
INVESTMENTS
(cost
$389,146,306
)
-
98.8%
364,199,478
OTHER
ASSETS
&
LIABILITIES,
NET
-
1.2%
4,522,350
NET
ASSETS
-
100%
$
368,721,828
For
Fund
portfolio
compliance
purposes,
the
Fund’s
industry
classifications
refer
to
any
one
or
more
of
the
industry
sub-classifications
used
by
one
or
more
widely
recognized
market
indexes
or
ratings
group
indexes,
and/or
as
defined
by
Fund
management.
This
definition
may
not
apply
for
purposes
of
this
report,
which
may
combine
industry
sub-classifications
into
sectors
for
reporting
ease.
(a)
All
percentages
shown
in
the
Portfolio
of
Investments
are
based
on
net
assets.
(b)
Security
is
exempt
from
registration
under
Rule
144A
of
the
Securities
Act
of
1933,
as
amended.
These
securities
are
deemed
liquid
and
may
be
resold
in
transactions
exempt
from
registration,
which
are
normally
those
transactions
with
qualified
institutional
buyers.
As
of
the
end
of
the
reporting
period,
the
aggregate
value
of
these
securities
is
$639,640
or
0.2%
of
Total
Investments.
(c)
Investment,
or
a
portion
of
investment,
is
out
on
loan
for
securities
lending.
The
total
value
of
the
securities
out
on
loan
as
of
the
end
of
the
reporting
period
was
$574,282.
(d)
Optional
Call
Provisions:
Dates
(month
and
year)
and
prices
of
the
earliest
optional
call
or
redemption.
There
may
be
other
call
provisions
at
varying
prices
at
later
dates.
Certain
mortgage-backed
securities
may
be
subject
to
periodic
principal
paydowns.
Optional
Call
Provisions
are
not
covered
by
the
report
of
independent
registered
public
accounting
firm.
(e)
The
Fund
may
loan
securities
representing
up
to
one
third
of
the
value
of
its
total
assets
(which
includes
collateral
for
securities
on
loan)
to
broker
dealers,
banks,
and
other
institutions.
The
collateral
maintained
by
the
Fund
shall
have
a
value,
at
the
inception
of
each
loan,
equal
to
not
less
than
100%
of
the
value
of
the
loaned
securities.
The
cash
collateral
received
by
the
Fund
is
invested
in
this
money
market
fund.
(f)
The
rate
shown
is
the
one-day
yield
as
of
the
end
of
the
reporting
period.
S&P
Standard
&
Poor's
See
Notes
to
Financial
Statements
Nuveen
Global
Net
Zero
Transition
ETF
(NTZG)
Portfolio
of
Investments
July
31,
2024
Shares
Description
(a)
Value
LONG-TERM
INVESTMENTS
-
99.3%
X
–
COMMON
STOCKS
-
99.3%
COMMUNICATION
SERVICES
-
4.6%
1,284
Alphabet
Inc,
Class
A
$
220,257
848
Walt
Disney
Co/The
79,449
TOTAL
COMMUNICATION
SERVICES
299,706
CONSUMER
DISCRETIONARY
-
12.7%
586
(b)
Airbnb
Inc,
Class
A
81,782
1,742
(b)
Amazon.com
Inc
325,719
3,000
BYD
Co
Ltd
87,558
204
Kering
SA
62,803
256
McDonald's
Corp
67,943
476
NIKE
Inc,
Class
B
35,633
612
Starbucks
Corp
47,705
5,636
(b)
Toyota
Motor
Corp
110,465
TOTAL
CONSUMER
DISCRETIONARY
819,608
CONSUMER
STAPLES
-
7.0%
1,140
Anheuser-Busch
InBev
SA/NV
67,798
148
Costco
Wholesale
Corp
121,656
1,117
Kraft
Heinz
Co/The
39,330
476
Procter
&
Gamble
Co/The
76,522
2,079
Walmart
Inc
142,702
TOTAL
CONSUMER
STAPLES
448,008
ENERGY
-
9.5%
10,768
BP
PLC
63,464
588
Cheniere
Energy
Inc
107,392
632
Exxon
Mobil
Corp
74,945
7,407
(b)
NexGen
Energy
Ltd
49,328
1,293
Occidental
Petroleum
Corp
78,640
1,300
(c)
Reliance
Industries
Ltd,
Sponsored
GDR
93,730
1,102
Schlumberger
NV
53,216
2,450
Shell
PLC
89,372
TOTAL
ENERGY
610,087
FINANCIALS
-
11.0%
965
Commonwealth
Bank
of
Australia
86,639
404
(b)
Fiserv
Inc
66,082
3,856
ING
Groep
NV
69,891
562
JPMorgan
Chase
&
Co
119,594
434
London
Stock
Exchange
Group
PLC
52,791
240
Mastercard
Inc,
Class
A
111,290
396
Progressive
Corp/The
84,792
884
Sun
Life
Financial
Inc
43,859
1,292
Wells
Fargo
&
Co
76,667
TOTAL
FINANCIALS
711,605
HEALTH
CARE
-
11.2%
916
(b)
Centene
Corp
70,459
292
Cigna
Group/The
101,812
280
EssilorLuxottica
SA
64,142
4,119
GSK
PLC
79,995
578
Merck
&
Co
Inc
65,389
1,444
Novo
Nordisk
A/S,
Class
B
190,973
607
Sanofi
62,616
Nuveen
Global
Net
Zero
Transition
ETF
(NTZG)
(continued)
Portfolio
of
Investments
July
31,
2024
Shares
Description
(a)
Value
HEALTH
CARE
(continued)
269
Stryker
Corp
$
88,084
TOTAL
HEALTH
CARE
723,470
INDUSTRIALS
-
10.1%
1,752
Flowserve
Corp
88,564
420
Quanta
Services
Inc
111,460
784
Schneider
Electric
SE
189,058
396
Trane
Technologies
PLC
132,375
236
Union
Pacific
Corp
58,228
598
Vinci
SA
68,333
TOTAL
INDUSTRIALS
648,018
INFORMATION
TECHNOLOGY
-
21.5%
323
Apple
Inc
71,732
6,000
Delta
Electronics
Inc
75,662
14,000
E
Ink
Holdings
Inc
114,785
1,755
Infineon
Technologies
AG
60,866
1,623
Intel
Corp
49,891
188
Keyence
Corp
82,330
354
(b)
Manhattan
Associates
Inc
90,404
639
Microsoft
Corp
267,326
1,037
(b)
Procore
Technologies
Inc
73,658
3,300
Rohm
Co
Ltd
44,940
287
Samsung
SDI
Co
Ltd
66,603
95
(b)
ServiceNow
Inc
77,367
4,800
SUMCO
Corp
79,548
8,000
Taiwan
Semiconductor
Manufacturing
Co
Ltd
227,320
TOTAL
INFORMATION
TECHNOLOGY
1,382,432
MATERIALS
-
4.6%
2,254
BHP
Group
Ltd
62,260
733
Corteva
Inc
41,121
326
DSM-Firmenich
AG
41,644
332
Linde
PLC
150,562
TOTAL
MATERIALS
295,587
REAL
ESTATE
-
2.4%
2,807
Goodman
Group
64,337
696
Prologis
Inc
87,731
TOTAL
REAL
ESTATE
152,068
UTILITIES
-
4.7%
947
NextEra
Energy
Inc
72,341
2,444
RWE
AG
91,214
946
Southern
Co/The
79,010
1,951
Veolia
Environnement
SA
61,309
TOTAL
UTILITIES
303,874
TOTAL
COMMON
STOCKS
(cost
$5,050,854)
6,394,463
TOTAL
LONG-TERM
INVESTMENTS
(cost
$5,050,854)
6,394,463
OTHER
ASSETS
&
LIABILITIES,
NET
-
0.7%
46,468
NET
ASSETS
-
100%
$
6,440,931
For
Fund
portfolio
compliance
purposes,
the
Fund’s
industry
classifications
refer
to
any
one
or
more
of
the
industry
sub-classifications
used
by
one
or
more
widely
recognized
market
indexes
or
ratings
group
indexes,
and/or
as
defined
by
Fund
management.
This
definition
may
not
apply
for
purposes
of
this
report,
which
may
combine
industry
sub-classifications
into
sectors
for
reporting
ease.
(a)
All
percentages
shown
in
the
Portfolio
of
Investments
are
based
on
net
assets.
(b)
Non-income
producing;
issuer
has
not
declared
an
ex-dividend
date
within
the
past
twelve
months.
(c)
Security
is
exempt
from
registration
under
Rule
144A
of
the
Securities
Act
of
1933,
as
amended.
These
securities
are
deemed
liquid
and
may
be
resold
in
transactions
exempt
from
registration,
which
are
normally
those
transactions
with
qualified
institutional
buyers.
As
of
the
end
of
the
reporting
period,
the
aggregate
value
of
these
securities
is
$93,730
or
1.5%
of
Total
Investments.
GDR
Global
Depositary
Receipt
See
accompanying
notes
to
financial
statements.
Nuveen
Preferred
and
Income
ETF
(NPFI)
Portfolio
of
Investments
July
31,
2024
Principal
Amount
(000)
Description
(a)
Coupon
Maturity
Value
LONG-TERM
INVESTMENTS
-
98.2%
$1,000
PAR
(OR
SIMILAR)
INSTITUTIONAL
PREFERRED
-
61.8%
AUTOMOBILES
&
COMPONENTS
-
1.4%
$
105
General
Motors
Financial
Co
Inc
5.700%
N/A
(b)
$
99,611
146
General
Motors
Financial
Co
Inc
5.750%
N/A
(b)
138,626
251
TOTAL
AUTOMOBILES
&
COMPONENTS
238,237
BANKS
-
23.4%
41
Bank
of
America
Corp
4.375%
12/30/49
38,723
44
Bank
of
America
Corp
6.300%
9/10/72
44,164
17
Bank
of
America
Corp
6.100%
9/17/72
16,949
188
Bank
of
America
Corp
6.250%
N/A
(b)
187,826
150
Bank
of
America
Corp
6.500%
4/23/73
149,600
50
Citigroup
Inc
7.000%
12/30/49
50,720
65
Citigroup
Inc
7.125%
12/30/49
65,049
59
Citigroup
Inc
7.375%
8/15/72
60,501
121
Citigroup
Inc
5.950%
11/15/72
120,134
60
Citigroup
Inc
9.007%
11/17/72
60,054
85
Citigroup
Inc
4.150%
N/A
(b)
78,818
151
Citigroup
Inc
6.250%
2/15/73
150,927
146
Citigroup
Inc
7.625%
N/A
(b)
151,837
80
Citizens
Financial
Group
Inc
8.733%
1/07/73
79,376
250
CoBank
ACB
7.250%
7/01/73
255,195
81
Fifth
Third
Bancorp
4.500%
9/30/72
78,720
39
Fifth
Third
Bancorp
8.626%
12/31/72
38,654
188
First
Citizens
BancShares
Inc/NC
9.573%
6/15/73
191,124
10
Goldman
Sachs
Group
Inc/The
4.400%
8/10/72
9,796
135
Huntington
Bancshares
Inc/OH
5.625%
N/A
(b)
129,309
98
JPMorgan
Chase
&
Co
3.650%
N/A
(b)
93,060
130
JPMorgan
Chase
&
Co
5.000%
2/01/73
130,000
72
JPMorgan
Chase
&
Co
6.100%
4/01/73
71,588
375
JPMorgan
Chase
&
Co
6.875%
N/A
(b)
387,470
77
KeyCorp
5.000%
12/15/72
70,392
83
M&T
Bank
Corp
9.194%
8/15/72
83,061
17
M&T
Bank
Corp
3.500%
N/A
(b)
14,655
22
M&T
Bank
Corp
5.125%
5/01/73
21,014
36
PNC
Financial
Services
Group
Inc/The
6.000%
8/15/70
35,493
49
PNC
Financial
Services
Group
Inc/The
8.648%
12/01/72
49,096
30
PNC
Financial
Services
Group
Inc/The
3.400%
N/A
(b)
26,823
20
PNC
Financial
Services
Group
Inc/The
6.200%
N/A
(b)
19,948
30
PNC
Financial
Services
Group
Inc/The
5.000%
5/01/73
28,711
160
PNC
Financial
Services
Group
Inc/The
6.250%
6/15/73
155,975
155
Regions
Financial
Corp
5.750%
9/15/72
153,397
64
Truist
Financial
Corp
4.800%
N/A
(b)
63,040
141
Truist
Financial
Corp
5.100%
3/01/73
131,694
41
Truist
Financial
Corp
8.703%
6/15/73
41,164
224
Wells
Fargo
&
Co
7.625%
N/A
(b)
238,262
109
Wells
Fargo
&
Co
3.900%
N/A
(b)
104,556
153
Wells
Fargo
&
Co
5.875%
6/15/73
152,371
4,046
TOTAL
BANKS
4,029,246
CAPITAL
GOODS
-
0.9%
161
Air
Lease
Corp
4.650%
N/A
(b)
155,405
161
TOTAL
CAPITAL
GOODS
155,405
Principal
Amount
(000)
Description
(a)
Coupon
Maturity
Value
ENERGY
-
3.7%
$
109
Energy
Transfer
LP
6.500%
N/A
(b)
$
108,289
100
Energy
Transfer
LP
6.625%
2/15/73
98,041
47
Energy
Transfer
LP
7.125%
5/15/73
46,850
150
Transcanada
Trust
5.300%
3/15/77
141,020
255
Transcanada
Trust
5.600%
3/07/82
236,515
661
TOTAL
ENERGY
630,715
FINANCIAL
SERVICES
-
11.3%
365
AerCap
Ireland
Capital
DAC
/
AerCap
Global
Aviation
Trust
6.950%
3/10/55
369,089
36
Ally
Financial
Inc
4.700%
8/15/72
33,005
62
Ally
Financial
Inc
4.700%
8/15/72
51,456
50
American
Express
Co
3.550%
N/A
(b)
46,686
76
Bank
of
New
York
Mellon
Corp/The
4.700%
N/A
(b)
74,703
105
Capital
One
Financial
Corp
3.950%
N/A
(b)
96,910
99
Charles
Schwab
Corp/The
5.375%
N/A
(b)
97,841
159
Charles
Schwab
Corp/The
4.000%
6/01/73
148,480
37
Discover
Financial
Services
6.125%
N/A
(b)
36,725
15
Discover
Financial
Services
5.500%
4/30/73
13,540
131
Equitable
Holdings
Inc
4.950%
N/A
(b)
128,580
10
Goldman
Sachs
Group
Inc/The
3.800%
11/10/72
9,390
90
Goldman
Sachs
Group
Inc/The
5.300%
11/10/72
89,091
100
Goldman
Sachs
Group
Inc/The
7.500%
11/10/72
103,066
177
Goldman
Sachs
Group
Inc/The
5.500%
N/A
(b)
176,516
144
Goldman
Sachs
Group
Inc/The
7.500%
N/A
(b)
150,645
17
Goldman
Sachs
Group
Inc/The
4.125%
5/10/73
15,916
151
State
Street
Corp
6.700%
N/A
(b)
151,161
150
Voya
Financial
Inc
7.758%
3/15/73
157,781
1,974
TOTAL
FINANCIAL
SERVICES
1,950,581
FOOD,
BEVERAGE
&
TOBACCO
-
2.1%
450
(c)
Land
O'
Lakes
Inc
7.250%
6/15/73
371,245
450
TOTAL
FOOD,
BEVERAGE
&
TOBACCO
371,245
INSURANCE
-
8.4%
69
American
International
Group
Inc
5.750%
4/01/48
68,095
114
AXIS
Specialty
Finance
LLC
4.900%
1/15/40
106,255
226
Enstar
Finance
LLC
5.500%
1/15/42
201,949
166
Markel
Group
Inc
6.000%
12/01/72
165,013
104
(c)
MetLife
Inc
9.250%
4/08/38
121,864
23
MetLife
Inc
5.875%
9/15/72
22,894
46
MetLife
Inc
3.850%
N/A
(b)
44,591
84
PartnerRe
Finance
B
LLC
4.500%
10/01/50
76,510
50
Prudential
Financial
Inc
5.375%
5/15/45
49,427
107
Prudential
Financial
Inc
3.700%
10/01/50
94,284
125
Prudential
Financial
Inc
5.125%
3/01/52
117,566
75
Prudential
Financial
Inc
6.500%
3/15/54
76,463
309
(c)
QBE
Insurance
Group
Ltd
5.875%
11/12/72
306,147
1,498
TOTAL
INSURANCE
1,451,058
MEDIA
&
ENTERTAINMENT
-
1.7%
250
(c)
Farm
Credit
Bank
of
Texas
7.750%
12/30/49
254,567
38
Paramount
Global
6.375%
3/30/62
34,889
288
TOTAL
MEDIA
&
ENTERTAINMENT
289,456
TELECOMMUNICATION
SERVICES
-
0.8%
73
Vodafone
Group
PLC
7.000%
4/04/79
75,572
70
Vodafone
Group
PLC
4.125%
6/04/81
61,613
143
TOTAL
TELECOMMUNICATION
SERVICES
137,185
Nuveen
Preferred
and
Income
ETF
(NPFI)
(continued)
Portfolio
of
Investments
July
31,
2024
Principal
Amount
(000)
Description
(a)
Coupon
Maturity
Value
UTILITIES
-
8.1%
$
150
AES
Corp/The
7.600%
1/15/55
$
152,637
86
American
Electric
Power
Co
Inc
3.875%
2/15/62
80,035
100
Dominion
Energy
Inc
7.000%
6/01/54
105,020
50
Edison
International
5.000%
12/30/49
48,053
94
Edison
International
5.375%
9/15/72
91,852
308
Emera
Inc
6.750%
6/15/76
306,383
200
Entergy
Corp
7.125%
12/01/54
200,092
84
Sempra
4.125%
4/01/52
77,507
115
Sempra
4.875%
10/15/72
112,651
102
Southern
Co/The
4.000%
1/15/51
99,070
100
(c)
Vistra
Corp
8.000%
12/30/49
102,363
19
(c)
Vistra
Corp
7.000%
N/A
(b)
19,109
1,408
TOTAL
UTILITIES
1,394,772
TOTAL
$1,000
PAR
(OR
SIMILAR)
INSTITUTIONAL
PREFERRED
(cost
$10,528,957)
10,647,900
Principal
Amount
(000)
Description
(a)
Coupon
Maturity
Value
CONTINGENT
CAPITAL
SECURITIES
-
33.5%
BANKS
-
28.8%
356
Banco
Bilbao
Vizcaya
Argentaria
SA
9.375%
12/19/72
383,847
200
Banco
Santander
SA
4.750%
8/12/72
184,342
200
Banco
Santander
SA
9.625%
2/21/73
228,272
402
Barclays
PLC
8.000%
12/30/49
412,873
200
Barclays
PLC
9.625%
12/30/49
218,420
291
(c)
BNP
Paribas
SA
8.500%
12/30/49
305,226
283
(c)
BNP
Paribas
SA
9.250%
5/17/73
303,638
257
(c)
Credit
Agricole
SA
8.125%
3/23/73
262,141
218
HSBC
Holdings
PLC
8.000%
12/30/49
230,411
227
HSBC
Holdings
PLC
6.375%
9/30/72
226,693
222
HSBC
Holdings
PLC
6.000%
11/22/72
217,324
388
ING
Groep
NV
7.500%
5/16/72
394,790
306
Lloyds
Banking
Group
PLC
7.500%
12/27/72
307,077
200
NatWest
Group
PLC
8.125%
12/30/49
207,093
297
NatWest
Group
PLC
6.000%
9/30/72
293,167
200
(c)
Societe
Generale
SA
10.000%
N/A
(b)
211,163
377
(c)
Societe
Generale
SA
9.375%
5/22/73
386,675
200
(c)
Standard
Chartered
PLC
7.750%
12/30/49
204,450
4,824
TOTAL
BANKS
4,977,602
FINANCIAL
SERVICES
-
4.7%
200
Deutsche
Bank
AG
6.000%
4/30/73
191,655
543
(c)
UBS
Group
AG
9.250%
N/A
(b)
614,489
743
TOTAL
FINANCIAL
SERVICES
806,144
TOTAL
CONTINGENT
CAPITAL
SECURITIES
(cost
$5,644,338)
5,783,746
Principal
Amount
(000)
Description
(a)
Coupon
Maturity
Value
CORPORATE
BONDS
-
2.9%
ENERGY
-
1.6%
47
Enbridge
Inc
6.000%
1/15/77
45,781
48
Enbridge
Inc
5.750%
7/15/80
45,540
89
Enbridge
Inc
7.625%
1/15/83
92,478
85
Enbridge
Inc
8.500%
1/15/84
92,962
269
TOTAL
ENERGY
276,761
For
Fund
portfolio
compliance
purposes,
the
Fund’s
industry
classifications
refer
to
any
one
or
more
of
the
industry
sub-classifications
used
by
one
or
more
widely
recognized
market
indexes
or
ratings
group
indexes,
and/or
as
defined
by
Fund
management.
This
definition
may
not
apply
for
purpos-
es
of
this
report,
which
may
combine
industry
sub-classifications
into
sectors
for
reporting
ease.
Principal
Amount
(000)
Description
(a)
Coupon
Maturity
Value
INSURANCE
-
1.3%
$
222
Assurant
Inc
7.000%
3/27/48
$
225,775
222
TOTAL
INSURANCE
225,775
TOTAL
CORPORATE
BONDS
(cost
$498,187)
502,536
TOTAL
LONG-TERM
INVESTMENTS
(cost
$16,671,482)
16,934,182
OTHER
ASSETS
&
LIABILITIES,
NET
-
1.8%
306,694
NET
ASSETS
-
100%
$
17,240,876
(a)
All
percentages
shown
in
the
Portfolio
of
Investments
are
based
on
net
assets.
(b)
Perpetual
security.
Maturity
date
is
not
applicable.
(c)
Security
is
exempt
from
registration
under
Rule
144A
of
the
Securities
Act
of
1933,
as
amended.
These
securities
are
deemed
liquid
and
may
be
resold
in
transactions
exempt
from
registration,
which
are
normally
those
transactions
with
qualified
institutional
buyers.
As
of
the
end
of
the
reporting
period,
the
aggregate
value
of
these
securities
is
$3,463,077
or
20.5%
of
Total
Investments.
Nuveen
Sustainable
Core
ETF
(NSCR)
Portfolio
of
Investments
July
31,
2024
Shares
Description
(a)
Value
LONG-TERM
INVESTMENTS
-
92.7%
X
–
COMMON
STOCKS
-
92.7%
COMMUNICATION
SERVICES
-
8.2%
756
Alphabet
Inc,
Class
A
$
129,684
672
Alphabet
Inc,
Class
C
116,357
347
Meta
Platforms
Inc
164,766
609
Walt
Disney
Co/The
57,057
TOTAL
COMMUNICATION
SERVICES
467,864
CONSUMER
DISCRETIONARY
-
7.3%
1,302
(b)
Amazon.com
Inc
243,448
1,436
General
Motors
Co
63,643
441
Lowe's
Cos
Inc
108,270
TOTAL
CONSUMER
DISCRETIONARY
415,361
CONSUMER
STAPLES
-
2.5%
525
Bunge
Global
SA
55,246
42
Costco
Wholesale
Corp
34,524
357
Target
Corp
53,696
TOTAL
CONSUMER
STAPLES
143,466
ENERGY
-
4.5%
567
Chevron
Corp
90,986
465
EOG
Resources
Inc
58,962
1,911
Marathon
Oil
Corp
53,604
294
Marathon
Petroleum
Corp
52,044
TOTAL
ENERGY
255,596
FINANCIALS
-
12.7%
315
American
Express
Co
79,708
315
Ameriprise
Financial
Inc
135,472
399
Apollo
Global
Management
Inc
49,999
2,112
Bank
of
New
York
Mellon
Corp/The
137,428
420
Chubb
Ltd
115,777
378
(b)
Fiserv
Inc
61,830
441
KKR
&
Co
Inc
54,441
189
Mastercard
Inc,
Class
A
87,641
TOTAL
FINANCIALS
722,296
HEALTH
CARE
-
16.7%
672
Abbott
Laboratories
71,192
231
Becton
Dickinson
&
Co
55,685
945
Cardinal
Health
Inc
95,284
630
(b)
Centene
Corp
48,460
374
Cigna
Group/The
130,402
126
Elevance
Health
Inc
67,036
147
Eli
Lilly
&
Co
118,228
378
Labcorp
Holdings
Inc
81,436
1,302
Merck
&
Co
Inc
147,295
231
UnitedHealth
Group
Inc
133,093
TOTAL
HEALTH
CARE
948,111
For
Fund
portfolio
compliance
purposes,
the
Fund’s
industry
classifications
refer
to
any
one
or
more
of
the
industry
sub-classifications
used
by
one
or
more
widely
recognized
market
indexes
or
ratings
group
indexes,
and/or
as
defined
by
Fund
management.
This
definition
may
not
apply
for
purpos-
es
of
this
report,
which
may
combine
industry
sub-classifications
into
sectors
for
reporting
ease.
Shares
Description
(a)
Value
INDUSTRIALS
-
3.5%
420
Dover
Corp
$
77,389
210
Ferguson
PLC
46,756
378
Honeywell
International
Inc
77,396
TOTAL
INDUSTRIALS
201,541
INFORMATION
TECHNOLOGY
-
28.4%
1,444
Apple
Inc
320,683
273
Applied
Materials
Inc
57,931
147
(b)
Arista
Networks
Inc
50,943
420
Broadcom
Inc
67,486
84
Lam
Research
Corp
77,384
1,008
Microsoft
Corp
421,697
3,405
NVIDIA
Corp
398,453
483
Oracle
Corp
67,354
546
QUALCOMM
Inc
98,799
210
Salesforce
Inc
54,348
TOTAL
INFORMATION
TECHNOLOGY
1,615,078
MATERIALS
-
2.2%
903
Corteva
Inc
50,658
168
Linde
PLC
76,188
TOTAL
MATERIALS
126,846
REAL
ESTATE
-
3.2%
890
Simon
Property
Group
Inc
136,562
336
Sun
Communities
Inc
42,581
TOTAL
REAL
ESTATE
179,143
UTILITIES
-
3.5%
651
American
Electric
Power
Co
Inc
63,876
1,750
NextEra
Energy
Inc
133,683
TOTAL
UTILITIES
197,559
TOTAL
COMMON
STOCKS
(cost
$4,872,699)
5,272,861
TOTAL
LONG-TERM
INVESTMENTS
(cost
$4,872,699)
5,272,861
OTHER
ASSETS
&
LIABILITIES,
NET
-
7.3%
416,337
NET
ASSETS
-
100%
$
5,689,198
(a)
All
percentages
shown
in
the
Portfolio
of
Investments
are
based
on
net
assets.
(b)
Non-income
producing;
issuer
has
not
declared
an
ex-dividend
date
within
the
past
twelve
months.
Nuveen
Ultra
Short
Income
ETF
(NUSB)
Portfolio
of
Investments
July
31,
2024
Principal
Amount
(000)
Description
(a)
Coupon
Maturity
Value
LONG-TERM
INVESTMENTS
-
38.5%
X
–
CORPORATE
DEBT
-
23.3%
FINANCIALS
-
15.2%
$
195
(b)
American
Express
Co
6.118%
4/23/27
$
195,234
200
Banco
Santander
SA
5.147%
8/18/25
199,415
310
Bank
of
America
Corp
3.384%
4/02/26
305,853
180
Bank
of
New
York
Mellon
Corp/
The
4.947%
4/26/27
180,362
250
(b)
Citibank
NA
5.957%
4/30/26
250,035
100
Citigroup
Inc
5.610%
9/29/26
100,426
180
Goldman
Sachs
Group
Inc/The
5.798%
8/10/26
180,868
180
JPMorgan
Chase
&
Co
6.070%
10/22/27
184,674
260
(b),(c)
Massachusetts
Mutual
Life
Insurance
Co
6.109%
4/09/27
260,401
245
Morgan
Stanley
2.188%
4/28/26
239,237
180
Morgan
Stanley
5.050%
1/28/27
180,211
195
(b),(c)
New
York
Life
Global
Funding
6.040%
4/02/27
195,811
200
Prologis
LP
3.250%
6/30/26
194,624
245
(b)
Royal
Bank
of
Canada
6.447%
7/20/26
247,195
200
Simon
Property
Group
LP
3.300%
1/15/26
195,316
180
State
Street
Corp
5.104%
5/18/26
179,948
250
(b)
UnitedHealth
Group
Inc
5.862%
7/15/26
250,464
195
Wells
Fargo
&
Co
2.406%
10/30/25
193,487
180
Wells
Fargo
Bank
NA
4.811%
1/15/26
180,032
TOTAL
FINANCIALS
3,913,593
INDUSTRIAL
-
7.4%
100
AT&T
Inc
5.539%
2/20/26
100,003
195
(b),(c)
BMW
US
Capital
LLC
5.920%
4/02/26
195,682
180
Caterpillar
Financial
Services
Corp
4.350%
5/15/26
179,185
195
(b)
Caterpillar
Financial
Services
Corp
5.885%
5/14/27
195,481
180
Cigna
Group/The
5.685%
3/15/26
180,031
195
(b)
Home
Depot
Inc/The
5.698%
12/24/25
195,364
180
Intel
Corp
4.875%
2/10/26
180,092
180
John
Deere
Capital
Corp
4.800%
1/09/26
180,348
180
Lowe's
Cos
Inc
4.400%
9/08/25
178,718
180
Magna
International
Inc
4.150%
10/01/25
178,173
195
(b)
Toyota
Motor
Credit
Corp
5.814%
5/15/26
195,167
TOTAL
INDUSTRIAL
1,958,244
UTILITY
-
0.7%
180
NextEra
Energy
Capital
Holdings
Inc
4.950%
1/29/26
180,198
TOTAL
UTILITY
180,198
TOTAL
CORPORATE
DEBT
(cost
$6,038,862)
6,052,035
Principal
Amount
(000)
Description
(a)
Coupon
Maturity
Value
X
–
SECURITIZED
-
14.3%
$
100
American
Express
Credit
Account
Master
Trust
2022
2
3.390%
5/17/27
98,646
250
BA
Credit
Card
Trust
2022
A1
3.530%
11/15/27
246,606
122
Benchmark
2021-B30
Mortgage
Trust
2021
B30
1.190%
11/15/54
115,964
Principal
Amount
(000)
Description
(a)
Coupon
Maturity
Value
$
100
Capital
One
Multi-Asset
Execution
Trust
2022
A1
2.800%
3/15/27
$
98,496
150
CarMax
Auto
Owner
Trust
2024-2
2024
2
5.918%
5/17/27
150,309
200
(c)
Chase
Auto
Owner
Trust
2024-4
2024
4A
5.250%
9/27/27
200,121
68
Citigroup
Commercial
Mortgage
Trust
2016-C1
2016
C1
3.003%
5/10/49
66,536
96
(c)
Citizens
Auto
Receivables
Trust
2024-1
2024
1
5.937%
10/15/26
96,270
150
CNH
Equipment
Trust
2024-B
2024
B
5.737%
10/15/27
150,105
13
COMM
2014-CCRE17
Mortgage
Trust
2014
CR17
3.977%
5/10/47
12,927
80
COMM
2015-CCRE25
Mortgage
Trust
2015
CR25
3.537%
8/10/48
79,348
97
COMM
2015-CCRE27
Mortgage
Trust
2015
CR27
3.349%
10/10/48
95,117
85
COMM
2015-LC23
Mortgage
Trust
2015
LC23
3.521%
10/10/48
83,315
100
Discover
Card
Execution
Note
Trust
2022
A2
3.320%
5/15/27
98,585
250
Ford
Credit
Auto
Lease
Trust
2024-B
2024
B
0.000%
2/15/27
250,126
100
Ford
Credit
Auto
Owner
Trust
2024-A
2024
A
5.698%
1/15/27
100,020
150
GM
Financial
Consumer
Automobile
Receivables
Trust
2024-2
2024
2
5.728%
3/16/27
150,143
73
GS
Mortgage
Securities
Trust
2015-GC32
2015
GC32
3.498%
7/10/48
72,167
100
Hyundai
Auto
Receivables
Trust
2024-A
2024
A
5.757%
4/15/27
100,065
100
John
Deere
Owner
Trust
2024
2024
A
5.707%
2/16/27
100,041
99
JPMBB
Commercial
Mortgage
Securities
Trust
2015-C33
2015
C33
3.504%
12/15/48
96,785
84
(c)
MHC
Commercial
Mortgage
Trust
2021-MHC
2021
MHC
6.244%
4/15/38
83,202
115
Morgan
Stanley
Capital
I
Trust
2015-MS1
2015
MS1
3.779%
5/15/48
112,770
98
Morgan
Stanley
Capital
I
Trust
2016-UB11
2016
UB11
2.606%
8/15/49
96,240
59
(c)
Porsche
Financial
Auto
Securitization
Trust
2023-2
2023
2A
5.924%
11/23/26
59,025
100
(c)
Tesla
Auto
Lease
Trust
2024-A
2024
A
5.844%
6/22/26
100,026
200
Toyota
Auto
Receivables
2024-C
Owner
Trust
2024
C
5.700%
5/17/27
200,186
100
Verizon
Master
Trust
2024
1
5.991%
12/20/28
100,377
150
Volkswagen
Auto
Lease
Trust
2024-A
2024
A
5.814%
12/21/26
150,177
89
Wells
Fargo
Commercial
Mortgage
Trust
2015-NXS1
2015
NXS1
3.148%
5/15/48
87,327
84
World
Omni
Auto
Receivables
Tr
2023
D
5.910%
2/16/27
83,844
150
World
Omni
Automobile
Lease
Securitization
Trust
2024-A
2024
A
5.767%
2/16/27
150,131
TOTAL
SECURITIZED
(cost
$3,677,661)
3,684,997
Principal
Amount
(000)
Description
(a)
Coupon
Maturity
Value
X
–
GOVERNMENT
RELATED
-
0.9%
GOVERNMENT
AGENCY
-
0.9%
$
75
Federal
Farm
Credit
Banks
Funding
Corp
1.170%
6/23/25
72,354
50
Federal
Home
Loan
Banks
0.700%
8/26/25
47,996
75
Federal
Home
Loan
Banks
1.375%
9/30/25
72,303
25
Federal
Home
Loan
Banks
1.250%
12/15/25
23,907
TOTAL
GOVERNMENT
AGENCY
216,560
TOTAL
GOVERNMENT
RELATED
(cost
$215,293)
216,560
TOTAL
LONG-TERM
INVESTMENTS
(cost
$9,931,816)
9,953,592
Nuveen
Ultra
Short
Income
ETF
(NUSB)
(continued)
Portfolio
of
Investments
July
31,
2024
Principal
Amount
(000)
Description
(a)
Coupon
Maturity
Value
SHORT-TERM
INVESTMENTS
-
55.1%
X
–
CORPORATE
DEBT
-
25.9%
FINANCIALS
-
7.1%
$
180
Aetna
Inc
3.500%
11/15/24
$
178,872
205
Air
Lease
Corp
2.300%
2/01/25
201,597
245
Canadian
Imperial
Bank
of
Commerce
5.144%
4/28/25
244,858
180
Corebridge
Financial
Inc
3.500%
4/04/25
177,418
260
Elevance
Health
Inc
2.375%
1/15/25
256,385
245
Goldman
Sachs
Group
Inc/The
3.500%
4/01/25
241,940
180
(b),(c)
Pacific
Life
Global
Funding
II
6.227%
6/16/25
180,829
180
Truist
Bank
1.500%
3/10/25
175,719
180
Welltower
OP
LLC
4.000%
6/01/25
177,884
TOTAL
FINANCIALS
1,835,502
INDUSTRIAL
-
17.1%
180
AbbVie
Inc
3.600%
5/14/25
177,741
180
(b)
American
Honda
Finance
Corp
5.913%
2/12/25
180,253
180
American
Tower
Corp
2.400%
3/15/25
176,487
180
Amgen
Inc
5.250%
3/02/25
179,847
130
BAT
Capital
Corp
2.789%
9/06/24
129,606
180
Becton
Dickinson
&
Co
3.734%
12/15/24
178,794
205
Canadian
Pacific
Railway
Co
1.350%
12/02/24
202,143
130
Carrier
Global
Corp
2.242%
2/15/25
127,799
180
Chevron
Corp
1.554%
5/11/25
175,297
130
CVS
Health
Corp
2.625%
8/15/24
129,842
195
(b),(c)
Daimler
Truck
Finance
North
America
LLC
6.117%
12/13/24
195,370
180
Enterprise
Products
Operating
LLC
3.750%
2/15/25
178,562
180
Fiserv
Inc
3.850%
6/01/25
177,817
180
General
Motors
Financial
Co
Inc
3.800%
4/07/25
177,892
180
Marathon
Petroleum
Corp
4.700%
5/01/25
178,997
130
McCormick
&
Co
Inc/MD
3.150%
8/15/24
129,872
150
Oracle
Corp
2.500%
4/01/25
147,148
200
Oracle
Corp
2.950%
5/15/25
196,413
260
Otis
Worldwide
Corp
2.056%
4/05/25
254,340
180
Pfizer
Inc
0.800%
5/28/25
173,868
205
Philip
Morris
International
Inc
1.500%
5/01/25
199,473
130
Republic
Services
Inc
2.500%
8/15/24
129,840
195
Reynolds
American
Inc
4.450%
6/12/25
193,462
130
Sherwin-Williams
Co/The
4.050%
8/08/24
129,952
130
Thermo
Fisher
Scientific
Inc
1.215%
10/18/24
128,820
130
Verizon
Communications
Inc
3.376%
2/15/25
128,856
TOTAL
INDUSTRIAL
4,378,491
UTILITY
-
1.7%
130
Entergy
Louisiana
LLC
0.950%
10/01/24
128,943
180
NextEra
Energy
Capital
Holdings
Inc
6.051%
3/01/25
180,742
130
Public
Service
Electric
and
Gas
Co
3.150%
8/15/24
129,855
TOTAL
UTILITY
439,540
TOTAL
CORPORATE
DEBT
(cost
$6,652,473)
6,653,533
Principal
Amount
(000)
Description
(a)
Coupon
Maturity
Value
X
–
COMMERCIAL
PAPER
-
19.6%
$
300
Archer-Daniels-Midland
Co
0.000%
8/23/24
$
298,955
250
AT&T
Inc
0.000%
9/16/24
248,235
150
Atlantic
Asset
Securitization
LLC
0.000%
9/09/24
149,100
250
CABOT
TRAIL
FUNDING
LLC
0.000%
9/18/24
248,158
350
Cisco
Systems
Inc
0.000%
12/04/24
343,645
250
Duke
Energy
Corporation
0.000%
10/22/24
246,834
250
Fairway
Finance
Co
LLC
0.000%
1/06/25
244,254
250
GTA
FUNDING
LLC
0.000%
10/01/24
247,693
250
HSBC
USA
Inc
0.000%
11/12/24
246,103
100
ING
US
Funding
LLC
0.000%
8/20/24
99,704
300
John
Deere
Financial
Inc
0.000%
9/17/24
297,873
100
La
Fayette
Asset
Securitization
LLC
0.000%
9/05/24
99,463
100
Lloyds
Bank
PLC
0.000%
12/13/24
98,053
360
MetLife
Short
Term
Funding
LLC
0.000%
8/28/24
358,508
300
Old
Line
Funding
LLC
0.000%
10/15/24
296,613
300
Sheffield
Receivables
Co
LLC
0.000%
10/09/24
296,828
250
Societe
Generale
SA
0.000%
1/14/25
244,043
250
Sumitomo
Mitsui
Trust
Bank
Ltd/Singapore
0.000%
10/17/24
247,110
250
Swedbank
AB
0.000%
3/03/25
242,470
250
Thunder
Bay
Funding
LLC
0.000%
9/12/24
248,404
250
Walt
Disney
Co/The
0.000%
11/15/24
246,010
TOTAL
COMMERCIAL
PAPER
(cost
$5,048,228)
5,048,056
Principal
Amount
(000)
Description
(a)
Coupon
Maturity
Value
X
–
GOVERNMENT
RELATED
-
4.8%
GOVERNMENT
AGENCY
-
4.8%
$
400
Federal
Farm
Credit
Banks
Funding
Corp
2.510%
4/01/25
393,666
112
Federal
Home
Loan
Bank
Discount
Notes
0.000%
8/01/24
111,984
450
Federal
Home
Loan
Banks
1.000%
11/08/24
444,946
300
Federal
Home
Loan
Banks
1.200%
12/23/24
295,212
TOTAL
GOVERNMENT
AGENCY
1,245,808
TOTAL
GOVERNMENT
RELATED
(cost
$1,245,004)
1,245,808
Principal
Amount
(000)
Description
(a)
Coupon
Maturity
Value
X
–
U.S.
TREASURY
-
4.0%
$
200
United
States
Treasury
Bill
0.000%
9/12/24
198,767
875
United
States
Treasury
Bill
0.000%
6/12/25
839,814
TOTAL
U.S.
TREASURY
(cost
$1,036,950)
1,038,581
Nuveen
Ultra
Short
Income
ETF
(NUSB)
(continued)
Portfolio
of
Investments
July
31,
2024
For
Fund
portfolio
compliance
purposes,
the
Fund’s
industry
classifications
refer
to
any
one
or
more
of
the
industry
sub-classifications
used
by
one
or
more
widely
recognized
market
indexes
or
ratings
group
indexes,
and/or
as
defined
by
Fund
management.
This
definition
may
not
apply
for
purposes
of
this
report,
which
may
combine
industry
sub-classifications
into
sectors
for
reporting
ease.
Principal
Amount
(000)
Description
(a)
Coupon
Maturity
Value
X
–
CERTIFICATE
OF
DEPOSIT
-
0.8%
$
100
HSBC
Bank
USA
NA
5.980%
9/25/24
$
100,044
100
BNP
Paribas/New
York
NY
5.340%
10/08/24
99,965
TOTAL
CERTIFICATE
OF
DEPOSIT
(cost
$200,007)
200,009
TOTAL
SHORT-TERM
INVESTMENTS
(cost
$14,182,662)
14,185,987
TOTAL
INVESTMENTS
(cost
$24,114,478
)
-
93.6%
24,139,579
OTHER
ASSETS
&
LIABILITIES,
NET
-
6.4%
1,653,125
NET
ASSETS
-
100%
$
25,792,704
(a)
All
percentages
shown
in
the
Portfolio
of
Investments
are
based
on
net
assets.
(b)
Variable
rate
security.
The
rate
shown
is
the
coupon
as
of
the
end
of
the
reporting
period.
(c)
Security
is
exempt
from
registration
under
Rule
144A
of
the
Securities
Act
of
1933,
as
amended.
These
securities
are
deemed
liquid
and
may
be
resold
in
transactions
exempt
from
registration,
which
are
normally
those
transactions
with
qualified
institutional
buyers.
As
of
the
end
of
the
reporting
period,
the
aggregate
value
of
these
securities
is
$1,566,737
or
6.5%
of
Total
Investments.
Statement
of
Assets
and
Liabilities
See
Notes
to
Financial
Statements
July
31,
2024
NCPB
NUAG
NUSA
NUHY
NUBD
ASSETS
Long-term
investments,
at
value
†‡
$
39,946,840
$
35,332,358
$
31,835,634
$
87,310,010
$
363,608,700
Investments
purchased
with
collateral
from
securities
lending,
at
value
(cost
approximates
value)
—
603,972
196,094
7,774,979
590,778
Cash
408,567
347,316
332,659
1,272,709
1,644,986
Receivables:
Interest
373,961
346,898
267,056
1,456,700
2,806,418
Investments
sold
—
764,449
1,305,118
3,455,339
3,507,639
Securities
lending
income
—
261
58
2,516
209
Other
42,415
3,015
599
1,725
4,639
Total
assets
40,771,783
37,398,269
33,937,218
101,273,978
372,163,369
LIABILITIES
Payables:
Management
fees
10,184
5,857
4,086
22,169
45,642
Collateral
from
securities
lending
—
603,972
196,094
7,774,979
590,778
Interest
772
1,477
1,684
60,043
9,567
Investments
purchased
-
regular
settlement
202,080
954,828
1,300,906
4,190,947
2,782,423
Accrued
expenses:
Professional
fees
—
524
501
1,557
4,486
Trustees
fees
342
354
338
976
4,008
Other
—
14,456
599
1,726
4,637
Total
liabilities
213,378
1,581,468
1,504,208
12,052,397
3,441,541
Net
assets
$
40,558,405
$
35,816,801
$
32,433,010
$
89,221,581
$
368,721,828
Shares
outstanding
1,600,000
1,700,000
1,400,000
4,200,000
16,600,000
Net
asset
value
("NAV")
per
share
$
25
.35
$
21
.07
$
23
.17
$
21
.24
$
22
.21
NET
ASSETS
CONSIST
OF:
Paid-in
capital
40,053,663
64,198,098
34,718,044
103,051,988
405,336,466
Total
distributable
earnings
(loss)
504,742
(
28,381,297
)
(
2,285,034
)
(
13,830,407
)
(
36,614,638
)
Net
assets
$
40,558,405
$
35,816,801
$
32,433,010
$
89,221,581
$
368,721,828
Authorized
shares
Unlimited
Unlimited
Unlimited
Unlimited
Unlimited
Par
value
per
share
$
0
.01
$
0
.01
$
0
.01
$
0
.01
$
0
.01
†
Long-term
investments,
cost
$
39,379,564
$
36,776,358
$
31,828,357
$
87,408,285
$
388,555,528
‡
Includes
securities
loaned
of
$
—
$
590,797
$
191,735
$
7,486,605
$
574,282
Statement
of
Assets
and
Liabilities
(continued)
See
Notes
to
Financial
Statements
July
31,
2024
NTZG
NPFI
NSCR
NUSB
ASSETS
Long-term
investments,
at
value
†
$
6,394,463
$
16,934,182
$
5,272,861
$
9,953,592
Short-term
investments,
at
value
◊
—
—
—
14,185,987
Cash
45,427
66,458
416,331
2,425
Receivables:
Dividends
2,841
—
2,263
—
Interest
—
248,386
—
137,701
Reclaims
1,175
—
71
—
Shares
sold
—
—
—
5,032,704
Other
146
36
—
20
Total
assets
6,444,052
17,249,062
5,691,526
29,312,429
LIABILITIES
Payables:
Management
fees
3,015
7,992
2,181
2,445
Interest
—
—
—
20,226
Investments
purchased
-
regular
settlement
—
—
—
3,496,876
Accrued
expenses:
Professional
fees
22
—
73
—
Trustees
fees
—
194
74
178
Other
84
—
—
—
Total
liabilities
3,121
8,186
2,328
3,519,725
Net
assets
$
6,440,931
$
17,240,876
$
5,689,198
$
25,792,704
Shares
outstanding
200,000
675,000
210,000
1,025,000
Net
asset
value
("NAV")
per
share
$
32
.20
$
25
.54
$
27
.09
$
25
.16
NET
ASSETS
CONSIST
OF:
Paid-in
capital
5,008,860
17,004,229
5,271,227
25,681,483
Total
distributable
earnings
(loss)
1,432,071
236,647
417,971
111,221
Net
assets
$
6,440,931
$
17,240,876
$
5,689,198
$
25,792,704
Authorized
shares
Unlimited
Unlimited
Unlimited
Unlimited
Par
value
per
share
$
0
.01
$
0
.01
$
0
.01
$
0
.01
†
Long-term
investments,
cost
$
5,050,854
$
16,671,482
$
4,872,699
$
9,931,816
◊
Short-term
investments,
cost
$
–
$
–
$
–
$
14,182,662
See
Notes
to
Financial
Statements
Year
Ended
July
31,
2024
NCPB
1
NUAG
NUSA
NUHY
NUBD
INVESTMENT
INCOME
Interest
732,219
1,309,712
1,247,493
6,775,730
9,329,174
Securities
lending
income,
net
—
1,416
1,907
31,676
14,259
Total
investment
income
732,219
1,311,128
1,249,400
6,807,406
9,343,433
EXPENSES
Management
fees
39,070
66,045
47,258
284,454
473,283
Professional
fees
—
1,136
1,129
3,332
9,652
Trustees
fees
592
1,418
1,332
3,796
13,054
Total
expenses
39,662
68,599
49,719
291,582
495,989
Net
investment
income
(loss)
692,557
1,242,529
1,199,681
6,515,824
8,847,444
REALIZED
AND
UNREALIZED
GAIN
(LOSS)
Realized
gain
(loss):
Investments
(234,737)
(637,931)
(109,184)
(2,285,495)
(1,445,986)
In-kind
redemptions
—
(323,169)
(332,189)
(1,296,682)
(175,503)
Net
realized
gain
(loss)
(234,737)
(961,100)
(441,373)
(3,582,177)
(1,621,489)
Change
in
unrealized
appreciation
(depreciation)
on:
Investments
567,276
1,942,257
970,403
6,476,442
9,442,435
Net
change
in
unrealized
appreciation
(depreciation)
567,276
1,942,257
970,403
6,476,442
9,442,435
Net
realized
and
unrealized
gain
(loss)
332,539
981,157
529,030
2,894,265
7,820,946
Net
increase
(decrease)
in
net
assets
from
operations
$
1,025,096
$
2,223,686
$
1,728,711
$
9,410,089
$
16,668,390
Statement
of
Operations
(continued)
See
Notes
to
Financial
Statements
Year
Ended
July
31,
2024
NTZG
NPFI
1
NSCR
1
NUSB
1
INVESTMENT
INCOME
Dividends
$
113,661
$
—
$
27,410
$
—
Interest
4,060
409,463
376
348,999
Foreign
tax
withheld
on
income
(8,203)
—
—
—
Total
investment
income
109,518
409,463
27,786
348,999
EXPENSES
Management
fees
32,928
35,238
10,076
11,077
Professional
fees
192
—
80
—
Trustees
fees
197
320
119
308
Total
expenses
33,317
35,558
10,275
11,385
Net
investment
income
(loss)
76,201
373,905
17,511
337,614
REALIZED
AND
UNREALIZED
GAIN
(LOSS)
Realized
gain
(loss):
Investments
128,804
128
298
(3,996)
In-kind
redemptions
—
—
4,571
—
Foreign
currency
transactions
416
—
—
—
Net
realized
gain
(loss)
129,220
128
4,869
(3,996)
Change
in
unrealized
appreciation
(depreciation)
on:
Investments
431,729
262,700
400,162
25,101
Foreign
currency
translations
(11)
—
—
—
Net
change
in
unrealized
appreciation
(depreciation)
431,718
262,700
400,162
25,101
Net
realized
and
unrealized
gain
(loss)
560,938
262,828
405,031
21,105
Net
increase
(decrease)
in
net
assets
from
operations
$
637,139
$
636,733
$
422,542
$
358,719
1
For
the
period
March
5,
2024
(commencement
of
operations)
through
July
31,
2024.
Statement
of
Changes
in
Net
Assets
See
Notes
to
Financial
Statements
NCPB
NUAG
For
the
period
3/5/24
(commencement
of
operations)
through
7/31/24
Year
Ended
7/31/24
Year
Ended
7/31/23
OPERATIONS
Net
investment
income
(loss)
$
692,557
$
1,242,529
$
1,739,492
Net
realized
gain
(loss)
(234,737)
(961,100)
(21,475,106)
Net
change
in
unrealized
appreciation
(depreciation)
567,276
1,942,257
13,208,165
Net
increase
(decrease)
in
net
assets
from
operations
1,025,096
2,223,686
(6,527,449)
DISTRIBUTIONS
TO
SHAREHOLDERS
Dividends
(497,480)
(1,385,020)
(2,043,070)
Total
distributions
(497,480)
(1,385,020)
(2,043,070)
FUND
SHARE
TRANSACTIONS
Subscriptions
40,030,789
12,312,988
6,326,238
Redemptions
–
(10,351,166)
(129,921,150)
Net
increase
(decrease)
from
Fund
share
transactions
40,030,789
1,961,822
(123,594,912)
Net
increase
(decrease)
in
net
assets
40,558,405
2,800,488
(132,165,431)
Net
assets
at
the
beginning
of
period
–
33,016,313
165,181,744
Net
assets
at
the
end
of
period
$
40,558,405
$
35,816,801
$
33,016,313
See
Notes
to
Financial
Statements
Statement
of
Changes
in
Net
Assets
(continued)
NUSA
NUHY
Year
Ended
7/31/24
Year
Ended
7/31/23
Year
Ended
7/31/24
Year
Ended
7/31/23
OPERATIONS
Net
investment
income
(loss)
$
1,199,681
$
813,010
$
6,515,824
$
5,520,474
Net
realized
gain
(loss)
(441,373)
(1,703,908)
(3,582,177)
(6,212,013)
Net
change
in
unrealized
appreciation
(depreciation)
970,403
682,355
6,476,442
3,280,629
Net
increase
(decrease)
in
net
assets
from
operations
1,728,711
(208,543)
9,410,089
2,589,090
DISTRIBUTIONS
TO
SHAREHOLDERS
Dividends
(1,275,430)
(904,010)
(6,599,640)
(6,591,930)
Total
distributions
(1,275,430)
(904,010)
(6,599,640)
(6,591,930)
FUND
SHARE
TRANSACTIONS
Subscriptions
11,382,469
22,913,450
16,620,534
12,451,730
Redemptions
(20,491,350)
(18,278,320)
(33,252,640)
(2,057,310)
Net
increase
(decrease)
from
Fund
share
transactions
(9,108,881)
4,635,130
(16,632,106)
10,394,420
Net
increase
(decrease)
in
net
assets
(8,655,600)
3,522,577
(13,821,657)
6,391,580
Net
assets
at
the
beginning
of
period
41,088,610
37,566,033
103,043,238
96,651,658
Net
assets
at
the
end
of
period
$
32,433,010
$
41,088,610
$
89,221,581
$
103,043,238
See
Notes
to
Financial
Statements
NUBD
NTZG
Year
Ended
7/31/24
Year
Ended
7/31/23
Year
Ended
7/31/24
Year
Ended
7/31/23
OPERATIONS
Net
investment
income
(loss)
$
8,847,444
$
6,249,959
$
76,201
$
84,214
Net
realized
gain
(loss)
(1,621,489)
(3,159,683)
129,220
(78,813)
Net
change
in
unrealized
appreciation
(depreciation)
9,442,435
(11,799,112)
431,718
556,267
Net
increase
(decrease)
in
net
assets
from
operations
16,668,390
(8,708,836)
637,139
561,668
DISTRIBUTIONS
TO
SHAREHOLDERS
Dividends
(10,481,530)
(7,684,630)
(87,940)
(33,960)
Total
distributions
(10,481,530)
(7,684,630)
(87,940)
(33,960)
FUND
SHARE
TRANSACTIONS
Subscriptions
102,065,429
55,017,630
–
–
Redemptions
(12,943,120)
(22,156,440)
–
–
Net
increase
(decrease)
from
Fund
share
transactions
89,122,309
32,861,190
–
–
Net
increase
(decrease)
in
net
assets
95,309,169
16,467,724
549,199
527,708
Net
assets
at
the
beginning
of
period
273,412,659
256,944,935
5,891,732
5,364,024
Net
assets
at
the
end
of
period
$
368,721,828
$
273,412,659
$
6,440,931
$
5,891,732
See
Notes
to
Financial
Statements
Statement
of
Changes
in
Net
Assets
(continued)
NPFI
NSCR
NUSB
For
the
period
3/5/24
(commencement
of
operations)
through
7/31/24
For
the
period
3/5/24
(commencement
of
operations)
through
7/31/24
For
the
period
3/5/24
(commencement
of
operations)
through
7/31/24
OPERATIONS
Net
investment
income
(loss)
$
373,905
$
17,511
$
337,614
Net
realized
gain
(loss)
128
4,869
(3,996)
Net
change
in
unrealized
appreciation
(depreciation)
262,700
400,162
25,101
Net
increase
(decrease)
in
net
assets
from
operations
636,733
422,542
358,719
DISTRIBUTIONS
TO
SHAREHOLDERS
Dividends
(180,000)
–
(247,498)
Return
of
capital
(106,028)
–
–
Total
distributions
(286,028)
–
(247,498)
FUND
SHARE
TRANSACTIONS
Subscriptions
16,890,171
5,520,319
26,933,619
Redemptions
–
(253,663)
(1,252,136)
Net
increase
(decrease)
from
Fund
share
transactions
16,890,171
5,266,656
25,681,483
Net
increase
(decrease)
in
net
assets
17,240,876
5,689,198
25,792,704
Net
assets
at
the
beginning
of
period
–
–
–
Net
assets
at
the
end
of
period
$
17,240,876
$
5,689,198
$
25,792,704
The
following
data
is
for
a
share
outstanding
for
each
fiscal
year
end
unless
otherwise
noted:
Investment
Operations
Less
Distributions
Net
Asset
Value,
Beginning
of
Period
Net
Investment
Income
(Loss)(a)
Net
Realized
/Unrealized
Gain
(Loss)
Total
From
Net
Investment
Income
From
Net
Realized
Gains
Return
of
Capital
Total
Net
Asset
Value,
End
of
Period
Market
Price,
End
of
Period
NCPB
7/31/24(d)
$
25.00
$
0.53
$
0.21
$
0.74
$
(
0.39
)
$
—
$
—
$
(
0.39
)
$
25.35
$
25.35
NUAG
7/31/24
20.64
0.77
0.52
1.29
(
0.86
)
—
—
(
0.86
)
21.07
21.09
7/31/23
22.02
0.75
(
1.30
)
(
0.55
)
(
0.83
)
—
—
(
0.83
)
20.64
20.68
7/31/22
25.17
0.39
(
3.01
)
(
2.62
)
(
0.53
)
—
—
(
0.53
)
22.02
22.09
7/31/21
26.08
0.33
(
0.55
)
(
0.22
)
(
0.69
)
—
—
(
0.69
)
25.17
25.18
7/31/20
24.49
0.55
1.88
2.43
(
0.84
)
—
—
(
0.84
)
26.08
26.05
NUSA
7/31/24
22.83
0.87
0.39
1.26
(
0.92
)
—
—
(
0.92
)
23.17
23.21
7/31/23
23.48
0.56
(
0.58
)
(
0.02
)
(
0.63
)
—
—
(
0.63
)
22.83
22.83
7/31/22
25.29
0.31
(
1.62
)
(
1.31
)
(
0.50
)
—
—
(
0.50
)
23.48
23.52
7/31/21
25.61
0.34
(
0.08
)
0.26
(
0.58
)
—
—
(
0.58
)
25.29
25.31
7/31/20
24.86
0.55
0.90
1.45
(
0.70
)
—
—
(
0.70
)
25.61
25.69
NUHY
7/31/24
20.61
1.42
0.63
2.05
(
1.42
)
—
—
(
1.42
)
21.24
21.28
7/31/23
21.48
1.13
(
0.65
)
0.48
(
1.35
)
—
—
(
1.35
)
20.61
20.68
7/31/22
24.71
1.02
(
3.04
)
(
2.02
)
(
1.21
)
—
—
(
1.21
)
21.48
21.63
7/31/21
24.43
1.04
0.47
1.51
(
1.23
)
—
—
(
1.23
)
24.71
24.78
7/31/20(f)
25.00
0.93
(
0.53
)
0.40
(
0.97
)
—
—
(
0.97
)
24.43
24.74
NUBD
7/31/24
21.87
0.61
0.46
1.07
(
0.73
)
—
—
(
0.73
)
22.21
22.21
7/31/23
23.36
0.54
(
1.36
)
(
0.82
)
(
0.67
)
—
—
(
0.67
)
21.87
21.90
7/31/22
26.29
0.41
(
2.81
)
(
2.40
)
(
0.53
)
—
—
(
0.53
)
23.36
23.40
7/31/21
27.31
0.45
(
0.92
)
(
0.47
)
(
0.55
)
—
—
(
0.55
)
26.29
26.30
7/31/20
25.36
0.55
2.04
2.59
(
0.64
)
—
—
(
0.64
)
27.31
27.37
(a)
Based
on
average
shares
outstanding.
(b)
Percentage
is
not
annualized.
(c)
Does
not
include
in-kind
transactions.
(d)
For
the
period
March
5,
2024
(commencement
of
operations)
through
July
31,
2024.
(e)
Annualized.
(f)
For
the
period
September
25,
2019
(commencement
of
operations)
through
July
31,
2020.
See
Notes
to
Financial
Statements
Ratios
and
Supplemental
Data
Total
Return
Ratios
to
Average
Net
Assets
Based
on
Net
Asset
Value(b)
Based
on
Market
Price(b)
Net
Assets,
End
of
Period
(000)
Expenses
Net
Investment
Income
(Loss)
Portfolio
Turnover
Rate(c)
2
.99
%
2
.99
%
$
40,558
0
.30
%
(e)
5
.32
%
(e)
34
%
6
.44
6
.38
35,817
0
.21
3
.76
48
(
2
.51
)
(
2
.62
)
33,016
0
.21
3
.58
54
(
10
.50
)
(
10
.27
)
165,182
0
.20
1
.65
81
(
0
.81
)
(
0
.64
)
173,676
0
.20
1
.32
235
10
.11
10
.19
80,845
0
.20
2
.21
208
5
.65
5
.81
32,433
0
.16
3
.81
37
(
0
.08
)
(
0
.20
)
41,089
0
.20
2
.43
78
(
5
.20
)
(
5
.13
)
37,566
0
.20
1
.27
77
1
.03
0
.80
40,456
0
.20
1
.33
46
5
.93
6
.15
35,854
0
.20
2
.20
51
10
.43
10
.25
89,222
0
.31
6
.87
43
2
.47
2
.07
103,043
0
.31
5
.50
44
(
8
.44
)
(
8
.07
)
96,652
0
.31
4
.42
56
6
.32
5
.25
96,378
0
.35
4
.14
65
1
.79
3
.02
56,195
0
.35
(e)
4
.55
(e)
47
5
.03
4
.88
368,722
0
.16
2
.80
13
(
3
.47
)
(
3
.53
)
273,413
0
.16
2
.47
14
(
9
.24
)
(
9
.09
)
256,945
0
.16
1
.64
45
(
1
.72
)
(
1
.90
)
262,884
0
.20
1
.69
33
10
.38
10
.51
147,489
0
.20
2
.07
18
The
following
data
is
for
a
share
outstanding
for
each
fiscal
year
end
unless
otherwise
noted:
Investment
Operations
Less
Distributions
Net
Asset
Value,
Beginning
of
Period
Net
Investment
Income
(Loss)(a)
Net
Realized
/Unrealized
Gain
(Loss)
Total
From
Net
Investment
Income
From
Net
Realized
Gains
Return
of
Capital
Total
Net
Asset
Value,
End
of
Period
Market
Price,
End
of
Period
NTZG
7/31/24
$
29.46
$
0.38
$
2.80
$
3.18
$
(
0.44
)
$
—
$
—
$
(
0.44
)
$
32.20
$
32.35
7/31/23
26.82
0.42
2.39
2.81
(
0.17
)
—
—
(
0.17
)
29.46
29.50
7/31/22(d)
25.04
0.02
1.76
1.78
—
—
—
—
26.82
26.95
NPFI
7/31/24(f)
25.00
0.59
0.41
1.00
(
0.29
)
—
(
0.17
)
(
0.46
)
25.54
25.63
NSCR
7/31/24(f)
25.00
0.08
2.01
2.09
—
—
—
—
27.09
27.09
NUSB
7/31/24(f)
25.00
0.52
0.03
0.55
(
0.39
)
—
—
(
0.39
)
25.16
25.16
(a)
Based
on
average
shares
outstanding.
(b)
Percentage
is
not
annualized.
(c)
Does
not
include
in-kind
transactions.
(d)
For
the
period
June
23,
2022
(commencement
of
operations)
through
July
31,
2022.
(e)
Annualized.
(f)
For
the
period
March
5,
2024
(commencement
of
operations)
through
July
31,
2024.
See
accompanying
notes
to
financial
statements.
Ratios
and
Supplemental
Data
Total
Return
Ratios
to
Average
Net
Assets
Based
on
Net
Asset
Value(b)
Based
on
Market
Price(b)
Net
Assets,
End
of
Period
(000)
Expenses
Net
Investment
Income
(Loss)
Portfolio
Turnover
Rate(c)
10
.99
%
11
.34
%
$
6,441
0
.56
%
1
.27
%
22
%
10
.54
10
.16
5,892
0
.56
1
.57
39
7
.09
7
.61
5,364
0
.55
(e)
0
.59
(e)
0
4
.05
4
.41
17,241
0
.55
(e)
5
.84
(e)
6
8
.33
8
.36
5,689
0
.46
(e)
0
.78
(e)
4
2
.22
2
.21
25,793
0
.17
(e)
5
.18
(e)
7
Notes
to
Financial
Statements
1.
General
Information
Trust
and
Fund
Information:
Nushares
ETF
Trust
(the
“Trust”)
is
an
open-end
management
investment
company
registered
under
the
Investment
Company
Act
of
1940,
as
amended
(the
“1940
Act”).
The
Trust
is
comprised
of
Nuveen
Core
Plus
Bond
ETF
(NCPB),
Nuveen
Enhanced
Yield
U.S.
Aggregate
Bond
ETF
(NUAG),
Nuveen
ESG
1-5
Year
U.S.
Aggregate
Bond
ETF
(NUSA),
Nuveen
ESG
High
Yield
Corporate
Bond
ETF
(NUHY),
Nuveen
ESG
U.S.
Aggregate
Bond
ETF
(NUBD),
Nuveen
Global
Net
Zero
Transition
ETF
(NTZG),
Nuveen
Preferred
and
Income
ETF
(NPFI),
Nuveen
Sustainable
Core
ETF
(NSCR),
Nuveen
Ultra
Short
Income
ETF
(NUSB)
(each
a
“Fund”
and
collectively,
the
“Funds”),
among
others.
The
Trust
was
organized
as
a
Massachusetts
business
trust
on
February
20,
2015.
Shares
of
NUAG,
NUSA,
NUHY
and
NUBD
are
listed
and
traded
on
the
NYSE
Arca,
while
shares
of
NCPB,
NTZG,
NPFI,
NSCR
and
NUSB
are
listed
and
traded
on
the
NASDAQ
Stock
Market
LLC.
The
NYSE
Arca
and
the
NASDAQ
Stock
Market
LLC
are
each
an
“Exchange”.
Current
Fiscal
Period:
The
end
of
the
reporting
period
for
the
Funds
is
July
31,
2024,
and
the
period
covered
by
these
Notes
to
Financial
Statements
is
the
fiscal
year
ended
July
31,
2024
(the
"current
fiscal
period").
Investment
Adviser
and
Sub-Adviser:
The
Funds’
investment
adviser
is
Nuveen
Fund
Advisors,
LLC
(the
“Adviser”),
a
subsidiary
of
Nuveen,
LLC
(“Nuveen”).
Nuveen
is
the
investment
management
arm
of
Teachers
Insurance
and
Annuity
Association
of
America
(“TIAA”).
The
Adviser
has
overall
responsibility
for
management
of
the
Funds,
oversees
the
management
of
the
Funds’
portfolios,
manages
the
Funds’
business
affairs
and
provides
certain
clerical,
bookkeeping
and
other
administrative
services.
For
NUAG,
NUSA,
NUHY
and
NUBD,
the
Adviser
has
entered
into
a
sub-advisory
agreement
with
Teachers
Advisors,
LLC
(“TAL”),
an
affiliate
of
the
Adviser,
under
which
TAL
manages
the
investment
portfolios
of
the
Funds.
For
NCPB,
NTZG,
NPFI,
NSCR
and
NUSB,
the
Adviser
has
entered
into
a
sub-advisory
agreement
with
Nuveen
Asset
Management
,
LLC
(“NAM”),
an
affiliate
of
the
Adviser,
under
which
NAM
manages
the
investment
portfolio
of
the
Fund.
NAM
and
TAL
are
each
a
“Sub-Adviser”.
2.
Significant
Accounting
Policies
The
accompanying
financial
statements
were
prepared
in
accordance
with
accounting
principles
generally
accepted
in
the
United
States
of
America
(“U.S.
GAAP”),
which
may
require
the
use
of
estimates
made
by
management
and
the
evaluation
of
subsequent
events.
Actual
results
may
differ
from
those
estimates.
Each
Fund
is
an
investment
company
and
follows
accounting
guidance
in
the
Financial
Accounting
Standards
Board
(“FASB”)
Accounting
Standards
Codification
946,
Financial
Services
—
Investment
Companies.
The
Net
Asset
Value
("NAV")
for
financial
reporting
purposes
may
differ
from
the
NAV
for
processing
security
and
creation
unit
transactions.
The
NAV
for
financial
reporting
purposes
includes
security
and creation
unit transactions
through
the
date
of
the
report.
Total
return
is
computed
based
on
the
NAV
used
for
processing
security
and creation
unit transactions.
The
following
is
a
summary
of
the
significant
accounting
policies
consistently
followed
by
the
Funds.
Compensation:
The Trust
pays
no
compensation
directly
to
those
of
its officers,
all
of
whom
receive
remuneration
for
their
services
to the
Trust
from
the
Adviser
or
its
affiliates.
The
Funds'
Board
of Trustees
(the
"Board") has
adopted
a
deferred
compensation
plan
for
independent
trustees
that
enables
trustees
to
elect
to
defer
receipt
of
all
or
a
portion
of
the
annual
compensation
they
are
entitled
to
receive
from
certain
Nuveen-advised
funds.
Under
the
plan,
deferred
amounts
are
treated
as
though
equal
dollar
amounts
had
been
invested
in
shares
of
select
Nuveen-advised
funds.
Distributions
to
Shareholders:
Distributions
to
shareholders
are
recorded
on
the
ex-dividend
date.
The
amount,
character
and
timing
of
distributions
are
determined
in
accordance
with
federal
income
tax
regulations,
which
may
differ
from
U.S.
GAAP.
Foreign
Currency
Transactions
and
Translation:
The
books
and
records
of
the
Fund
are
maintained
in
U.S.
dollars.
Assets,
including
investments,
and
liabilities
denominated
in
foreign
currencies
are
translated
into
U.S.
dollars
at
the
end
of
each
day.
Purchases
and
sales
of
securities,
income
and
expenses
are
translated
into
U.S.
dollars
at
the
prevailing
exchange
rate
on
the
respective
dates
of
the
transactions.
Net
realized
foreign
currency
gains
and
losses
resulting
from
changes
in
exchange
rates
associated
with
(i)
foreign
currency,
(ii)
investments
and
(iii)
derivatives
include
foreign
currency
gains
and
losses
between
trade
date
and
settlement
date
of
the
transactions,
foreign
currency
transactions,
and
the
difference
between
the
amounts
of
interest
and
dividends
recorded
on
the
books
of
the
Fund
and
the
amounts
actually
received
are
recognized
as
a
component
of
“Net
realized
gain
(loss)
from
foreign
currency
transactions”
on
the
Statement
of
Operations,
when
applicable.
The
unrealized
gains
and
losses
resulting
from
changes
in
foreign
currency
exchange
rates
and
changes
in
foreign
exchange
rates
associated
with
(i)
investments
and
(ii)
other
assets
and
liabilities
are
recognized
as
a
component
of
“Change
in
unrealized
appreciation
(depreciation)
of foreign
currency
translations”
on
the
Statement
of
Operations,
when
applicable.
The
unrealized
gains
and
losses
resulting
from
changes
in
foreign
exchange
rates
associated
with
investments
in
derivatives
are
recognized
as
a
component
of
the
respective
derivative’s
related
“Change
net
unrealized
appreciation
(depreciation)”
on
the
Statement
of
Operations,
when
applicable.
As
of
the
end
of
the
reporting
period,
the
Fund's
investments
in
non-U.S.
securities
were
as
follows:
Notes
to
Financial
Statements
(continued)
Foreign
Taxes:
The
Funds
may
be
subject
to
foreign
taxes
on
income,
gains
on
investments
or
foreign
currency
repatriation,
a
portion
of
which
may
be
recoverable.
The
Funds
will
accrue
such
taxes
and
recoveries
as
applicable,
based
upon
the
current
interpretation
of
tax
rules
and
regulations
that
exist
in
the
markets
in
which
the
Funds
invest.
Indemnifications:
Under
the
Trust’s
organizational
documents,
its
officers
and
trustees
are
indemnified
against
certain
liabilities
arising
out
of
the
performance
of
their
duties
to
the
Trust.
In
addition,
in
the
normal
course
of
business,
the
Trust
enters
into
contracts
that
provide
general
indemnifications
to
other
parties.
The
Trust’s
maximum
exposure
under
these
arrangements
is
unknown
as
this
would
involve
future
claims
that
may
be
made
against
the
Trust
that
have
not
yet
occurred.
However,
the
Trust
has
not
had
prior
claims
or
losses
pursuant
to
these
contracts
and
expects
the
risk
of
loss
to
be
remote.
Investments
and
Investment
Income:
Securities
transactions
are
accounted
for
as
of
the
trade
date
for
financial
reporting
purposes.
Realized
gains
and
losses
on
securities
transactions
are
based
upon
the
specific
identification
method.
Dividend
income
is
recorded
on
the
ex-dividend
date.
Foreign
dividend
income
is
recorded
on
the
ex-dividend
date
or
as
soon
as
possible
after
the
Fund
determines
the
existence
of
a
dividend
declaration.
Non-cash
dividends
received
in
the
form
of
stock,
if
any,
are
recognized
on
the
ex-dividend
date
and
recorded
at
fair
value.
Interest
income,
which
is
recorded
on
an
accrual
basis
and
includes
accretion
of
discounts
and
amortization
of
premiums
for
financial
reporting
purposes.
Interest
income
also
reflects
payment-in-kind
(“PIK”)
interest
and
paydown
gains
and
losses,
if
any.
PIK
interest
represents
income
received
in
the
form
of
securities
in
lieu
of
cash.
Securities
lending
income
is
comprised
of
fees
earned
from
borrowers
and
income
earned
on
cash
collateral
investments.
3.
Investment
Valuation
and
Fair
Value
Measurements
The
Funds’
investments
in
securities
are
recorded
at
their
estimated
fair
value
utilizing
valuation
methods
approved
by
the
Adviser,
subject
to
oversight
of
the Board.
Fair
value
is
defined
as
the
price
that
would
be
received
upon
selling
an
investment
or
transferring
a
liability
in
an
orderly
transaction
to
an
independent
buyer
in
the
principal
or
most
advantageous
market
for
the
investment.
U.S.
GAAP
establishes
the
three-tier
hierarchy
which
is
used
to
maximize
the
use
of
observable
market
data
and
minimize
the
use
of
unobservable
inputs
and
to
establish
classification
of
fair
value
measurements
for
disclosure
purposes.
Observable
inputs
reflect
the
assumptions
market
participants
would
use
in
pricing
the
asset
or
liability.
Observable
inputs
are
based
on
market
data
obtained
from
sources
independent
of
the
reporting
entity.
Unobservable
inputs
reflect
management’s
assumptions
about
the
assumptions
market
participants
would
use
in
pricing
the
asset
or
liability.
Unobservable
inputs
are
based
on
the
best
information
available
in
the
circumstances.
The
following
is
a
summary
of
the
three-tiered
hierarchy
of
valuation
input
levels.
Level
1
–
Inputs
are
unadjusted
and
prices
are
determined
using
quoted
prices
in
active
markets
for
identical
securities.
Level
2
–
Prices
are
determined
using
other
significant
observable
inputs
(including
quoted
prices
for
similar
securities,
interest
rates,
credit
spreads,
etc.).
Level
3
–
Prices
are
determined
using
significant
unobservable
inputs
(including
management’s
assumptions
in
determining
the
fair
value
of
investments).
A
description
of
the
valuation
techniques
applied
to
the
Funds’
major
classifications
of
assets
and
liabilities
measured
at
fair
value
follows:
Prices
of
fixed-income
securities
are
generally
provided
by
pricing
services
approved
by
the
Adviser,
which
is
subject
to
review
by
the
Adviser
and
oversight
of
the
Board. Pricing
services
establish
a
security’s
fair
value
using
methods
that
may
include
consideration
of
the
following:
yields
or
prices
of
investments
of
comparable
quality,
type
of
issue,
coupon,
maturity
and
rating,
market
quotes
or
indications
of
value
from
security
dealers,
evaluations
of
anticipated
cash
flows
or
collateral,
general
market
conditions
and
other
information
and
analysis,
including
the
obligor’s
credit
characteristics
considered
relevant.
In
pricing
certain
securities,
particularly
less
liquid
and
lower
quality
securities,
pricing
services
may
consider
information
about
a
security,
its
issuer
or
market
activity
provided
by
the
Adviser.
These
securities
are
generally
classified
as
Level
2.
Equity
securities
and
exchange-traded
funds
listed
or
traded
on
a
national
market
or
exchange
are
valued
based
on
their
last
reported
sales
price
or
official
closing
price
of
such
market
or
exchange
on
the
valuation
date.
Foreign
equity
securities
and
registered
investment
companies
that
trade
on
a
foreign
exchange
are
valued
at
the
last
reported
sales
price
or
official
closing
price
on
the
principal
exchange
where
traded,
and
converted
to
U.S.
NTZG
Value
%
of
Net
Assets
Country:
Taiwan
$
417,767
6.5
%
Japan
317,283
4.9
France
256,587
4.1
Australia
213,236
3.3
Denmark
190,973
2.9
Germany
152,080
2.4
India
93,730
1.4
Canada
93,187
1.5
China
87,558
1.4
Other
298,727
4.7
Total
non-U.S.
Securities
$2,121,128
33.1%
dollars
at
the
prevailing
rates
of
exchange
on
the
valuation
date.
To
the
extent
these
securities
are
actively
traded
and
no
valuation
adjustments
are
applied,
they
are
generally
classified
as
Level
1.
When
valuation
adjustments
are
applied
to
the
most
recent
last
sales
price
or
official
closing
price,
these
securities
are
generally
classified
as
Level
2.
Prices
of
certain
American
Depositary
Receipts
(“ADR”)
held
by
the
Funds
that
trade
in
the
United
States
are
valued
based
on
the
last
traded
price,
official
closing
price,
or
an
evaluated
price
provided
by
the
pricing
services and
are
generally
classified
as
Level
1
or
2.
Investments
in
investment
companies
are
valued
at
their
respective
NAVs
or
share
price on
the
valuation
date
and
are
generally
classified
as
Level
1.
For
any
portfolio
security
or
derivative
for
which
market
quotations
are
not
readily
available
or
for
which
the
Adviser
deems
the
valuations
derived
using
the
valuation
procedures
described
above
not
to
reflect
fair
value,
the
Adviser
will
determine
a
fair
value
in
good
faith
using
alternative
procedures
approved
by
the
Adviser,
subject
to
the
oversight
of
the
Board.
As
a
general
principle,
the
fair
value
of
a
security
is
the
amount
that
the
owner
might
reasonably
expect
to
receive
for
it
in
a
current
sale.
A
variety
of
factors
may
be
considered
in
determining
the
fair
value
of
such
securities,
which
may
include
consideration
of
the
following:
yields
or
prices
of
investments
of
comparable
quality,
type
of
issue,
coupon,
maturity
and
rating,
market
quotes
or
indications
of
value
from
security
dealers,
evaluations
of
anticipated
cash
flows
or
collateral,
general
market
conditions
and
other
information
and
analysis,
including
the
obligor’s
credit
characteristics
considered
relevant.
To
the
extent
the
inputs
are
observable
and
timely,
the
values
would
be
classified
as
Level
2;
otherwise
they
would
be
classified
as
Level
3.
The
following
table
summarizes
the
market
value
of
the
Funds’
investments
as
of
the
end
of
the
reporting
period,
based
on
the
inputs
used
to
value
them:
NCPB
Level
1
Level
2
Level
3
Total
Long-Term
Investments:
Securitized
$
–
$
15,246,969
$
–
$
15,246,969
Corporate
Debt
–
15,161,808
–
15,161,808
U.S.
Treasury
–
7,825,612
–
7,825,612
Government
Related
–
1,712,451
–
1,712,451
Total
$
–
$
39,946,840
$
–
$
39,946,840
a
NUAG
Level
1
Level
2
Level
3
Total
Long-Term
Investments:
Corporate
Debt
$
–
$
15,204,553
$
–
$
15,204,553
U.S.
Treasury
–
9,845,954
–
9,845,954
Securitized
–
6,866,902
–
6,866,902
Government
Related
–
3,414,949
–
3,414,949
Investments
Purchased
with
Collateral
from
Securities
Lending
603,972
–
–
603,972
Total
$
603,972
$
35,332,358
$
–
$
35,936,330
a
NUSA
Level
1
Level
2
Level
3
Total
Long-Term
Investments:
U.S.
Treasury
$
–
$
19,840,866
$
–
$
19,840,866
Corporate
Debt
–
8,007,031
–
8,007,031
Securitized
–
2,376,144
–
2,376,144
Government
Related
–
1,611,593
–
1,611,593
Investments
Purchased
with
Collateral
from
Securities
Lending
196,094
–
–
196,094
Total
$
196,094
$
31,835,634
$
–
$
32,031,728
a
NUHY
Level
1
Level
2
Level
3
Total
Long-Term
Investments:
Corporate
Debt
$
–
$
87,310,010
$
–
$
87,310,010
Investments
Purchased
with
Collateral
from
Securities
Lending
7,774,979
–
–
7,774,979
Total
$
7,774,979
$
87,310,010
$
–
$
95,084,989
a
Notes
to
Financial
Statements
(continued)
4.
Portfolio
Securities
Securities
Lending:
Each
Fund
may
lend
securities
representing
up
to
one-third
of
the
value
of
its
total
assets
to
broker-dealers,
banks,
and
other
institutions
in
order
to
generate
additional
income.
When
loaning
securities,
the
Fund
retains
the
benefits
of
owning
the
securities,
including
the
economic
equivalent
of
dividends
or
interest
generated
by
the
security.
The
loans
are
continuous,
can
be
recalled
at
any
time,
and
have
no
set
maturity.
State
Street
Bank
and
Trust
Company,
serves
as
the
securities
lending
agent
(the
“Agent”).
When
a
Fund
loans
its
portfolio
securities,
it
will
receive,
at
the
inception
of
each
loan,
cash
collateral
equal
to
an
amount
not
less
than
100%
of
the
market
value
of
the
loaned
securities.
The
actual
percentage
of
the
cash
collateral
will
vary
depending
upon
the
asset
type
of
the
loaned
securities.
Collateral
for
the
loaned
securities
is
invested
in
a
government
money
market
vehicle
maintained
by
the
Agent,
which
is
subject
to
the
requirements
of
Rule
2a-7
under
the
1940
Act.
The
value
of
the
loaned
securities
and
the
liability
to
return
the
cash
collateral
received
are
recognized
on
the
Statement
of
Assets
and
Liabilities.
If
the
market
value
of
the
loaned
securities
increases,
the
borrower
must
furnish
additional
collateral
to
the
Fund,
which
is
also
recognized
on
the
Statement
of
Assets
and
Liabilities.
Securities
out
on
loan
are
subject
to
termination
at
any
time
at
the
option
of
the
borrower
or
the
Fund.
Upon
termination,
the
borrower
is
required
to
return
to
the
Fund
securities
identical
to
the
securities
loaned.
During
the
term
NUBD
Level
1
Level
2
Level
3
Total
Long-Term
Investments:
U.S.
Treasury
$
–
$
155,608,968
$
–
$
155,608,968
Securitized
–
99,039,056
–
99,039,056
Corporate
Debt
–
92,446,771
–
92,446,771
Government
Related
–
16,513,905
–
16,513,905
Investments
Purchased
with
Collateral
from
Securities
Lending
590,778
–
–
590,778
Total
$
590,778
$
363,608,700
$
–
$
364,199,478
a
NTZG
Level
1
Level
2
Level
3
Total
Long-Term
Investments:
Common
Stocks
$
6,394,463
$
–
$
–
$
6,394,463
Total
$
6,394,463
$
–
$
–
$
6,394,463
a
NPFI
Level
1
Level
2
Level
3
Total
Long-Term
Investments:
$1,000
Par
(or
similar)
Institutional
Preferred
$
–
$
10,647,900
$
–
$
10,647,900
Contingent
Capital
Securities
–
5,783,746
–
5,783,746
Corporate
Bonds
–
502,536
–
502,536
Total
$
–
$
16,934,182
$
–
$
16,934,182
a
NSCR
Level
1
Level
2
Level
3
Total
Long-Term
Investments:
Common
Stocks
$
5,272,861
$
–
$
–
$
5,272,861
Total
$
5,272,861
$
–
$
–
$
5,272,861
a
NUSB
Level
1
Level
2
Level
3
Total
Long-Term
Investments:
Corporate
Debt
$
–
$
6,052,035
$
–
$
6,052,035
Securitized
–
3,684,997
–
3,684,997
Government
Related
–
216,560
–
216,560
Short-Term
Investments:
Corporate
Debt
–
6,653,533
–
6,653,533
Commercial
Paper
–
5,048,056
–
5,048,056
Government
Related
–
1,245,808
–
1,245,808
U.S.
Treasury
–
1,038,581
–
1,038,581
Certificate
of
Deposit
–
200,009
–
200,009
Total
$
–
$
24,139,579
$
–
$
24,139,579
a
of
the
loan,
the
Fund
bears
the
market
risk
with
respect
to
the
investment
of
collateral
and
the
risk
that
the
Agent
may
default
on
its
contractual
obligations
to
the
Fund.
The
Agent
bears
the
risk
that
the
borrower
may
default
on
its
obligation
to
return
the
loaned
securities
as
the
Agent
is
contractually
obligated
to
indemnify
the
Fund
if
at
the
time
of
a
default
by
a
borrower
some
or
all
of
the
loan
securities
have
not
been
returned.
Securities
lending
income
recognized
by
a
Fund
consists
of
earnings
on
invested
collateral
and
lending
fees,
net
of
any
rebates
to
the
borrower
and
compensation
to
the
Agent.
Such
income
is
recognized
on
the
Statement
of
Operations.
As
of
the
end
of
the
reporting
period,
the
total
value
of
the
loaned
securities
and
the
total
value
of
collateral
received
were
as
follows:
Purchases
and
Sales:
Long-term
purchases
and
sales
(excluding in-kind
transactions)
during
the
current fiscal
period
were
as
follows:
In-kind
transactions during
the
current fiscal
period
were
as
follows:
The
Funds
may
purchase
securities
on
a
when-issued
or
delayed-delivery
basis.
Securities
purchased
on
a
when-issued
or
delayed-delivery
basis
may
have
extended
settlement
periods;
interest
income
is
not
accrued
until
settlement
date.
Any
securities
so
purchased
are
subject
to
market
fluctuation
during
this
period. If
a
Fund
has
outstanding
when-issued/delayed-delivery
purchases
commitments
as
of
the
end
of
the
reporting
period,
such
amounts
are
recognized
on
the
Statement
of
Assets
and
Liabilities.
Fund
Asset
Class
out
on
Loan
Long-Term
Investments,
at
Value
Total
Collateral
Received
NUAG
Corporate
Debt
$590,797
$
603,972
NUSA
Corporate
Debt
$149,355
$152,782
Government
Related
42,380
43,312
Total
$191,735
$196,094
NUHY
Corporate
Debt
$7,486,605
$7,774,979
NUBD
Corporate
Debt
$549,207
$565,148
Government
Related
25,075
25,630
Total
$574,282
$590,778
Purchases
Sales
Fund
Non-U.S.
Government
Purchases
U.S.
Government
and
Agency
Obligations
Non-U.S.
Government
Sales
U.S.
Government
and
Agency
Obligations
NCPB
$
30,990,475
$
22,476,482
$
3,554,837
$
10,587,633
NUAG
8,761,516
9,951,011
6,893,183
9,737,539
NUSA
3,153,299
9,201,612
2,593,149
10,089,100
NUHY
42,944,700
—
45,020,072
—
NUBD
18,258,780
55,632,213
11,794,831
33,471,499
NTZG
1,548,358
—
1,433,286
—
NPFI
17,971,675
—
1,047,515
—
NSCR
245,445
—
593,034
—
NUSB
12,167,795
142,276
951,914
—
Fund
In-Kind
Purchases
In-Kind
Sales
NCPB
$
—
$
—
NUAG
10,365,252
10,070,052
NUSA
9,976,751
18,601,216
NUHY
17,065,359
32,853,480
NUBD
69,248,582
6,127,905
NTZG
—
—
NPFI
—
—
NSCR
5,466,446
251,027
NUSB
—
—
Notes
to
Financial
Statements
(continued)
5.
Derivative
Investments
Each
Fund
is
authorized
to
invest
in
certain
derivative
instruments.
As
defined
by
U.S.
GAAP,
a
derivative
is
a
financial
instrument
whose
value
is
derived
from
an
underlying
security
price,
foreign
exchange
rate,
interest
rate,
index
of
prices
or
rates,
or
other
variables.
Investments
in
derivatives
as
of
the
end
of
and/or
during
the
current
fiscal
period,
if
any,
are
included
within
the
Statement
of
Assets
and
Liabilities
and
the
Statement
of
Operations,
respectively.
Although
the
Funds
are
authorized
to
invest
in
derivative
instruments,
and
may
do
so
in
the
future,
they
did
not
make
any
such
investments
during
the
current
fiscal
period.
Market
and
Counterparty
Credit
Risk:
In
the
normal
course
of
business
each
Fund
may
invest
in
financial
instruments
and
enter
into
financial
transactions
where
risk
of
potential
loss
exists
due
to
changes
in
the
market
(market
risk)
or
failure
of
the
other
party
to
the
transaction
to
perform
(counterparty
credit
risk).
The
potential
loss
could
exceed
the
value
of
the
financial
assets
recorded
on
the
financial
statements.
Financial
assets,
which
potentially
expose
each
Fund
to
counterparty
credit
risk,
consist
principally
of
cash
due
from
counterparties
on
forward,
option
and
swap
transactions,
when
applicable.
The
extent
of
each
Fund’s
exposure
to
counterparty
credit
risk
in
respect
to
these
financial
assets
approximates
their
carrying
value
as
recorded
on
the
Statement
of
Assets
and
Liabilities.
Each
Fund
helps
manage
counterparty
credit
risk
by
entering
into
agreements
only
with
counterparties
the
Adviser
believes
have
the
financial
resources
to
honor
their
obligations
and
by
having
the
Adviser
monitor
the
financial
stability
of
the
counterparties.
Additionally,
counterparties
may
be
required
to
pledge
collateral
daily
(based
on
the
daily
valuation
of
the
financial
asset)
on
behalf
of
each
Fund
with
a
value
approximately
equal
to
the
amount
of
any
unrealized
gain
above
a
pre-determined
threshold.
Reciprocally,
when
each
Fund
has
an
unrealized
loss,
the
Funds
have
instructed
the
custodian
to
pledge
assets
of
the
Funds
as
collateral
with
a
value
approximately
equal
to
the
amount
of
the
unrealized
loss
above
a
pre-determined
threshold.
Collateral
pledges
are
monitored
and
subsequently
adjusted
if
and
when
the
valuations
fluctuate,
either
up
or
down,
by
at
least
the
pre-determined
threshold
amount.
6.
Fund
Shares
Each Fund
issues
and
redeems its
shares
on
a
continuous
basis
at
NAV
only
in
aggregations
of
a
specified
number
of
shares
or
multiples
thereof
(“Creation
Units”).
Only
certain
institutional
investors
(referred
to
as
“Authorized
Participants”)
who
have
entered
into
agreements
with
Nuveen
Securities,
LLC,
the
Funds'
distributor,
may
purchase
and
redeem
Creation
Units.
Once
created,
shares
of
the
Funds
trade
on
the
Exchange
at
market
prices
and
are
only
available
to
individual
investors
through
their
brokers.
Creation
Units
are
purchased
and
redeemed
in-kind
for
a
designated
portfolio
of
securities
included
in each
Fund’s
respective Index
and/or
a
specified
amount
of
cash.
Authorized
Participants
are
charged
fixed
transaction
fees
in
connection
with
purchasing
and
redeeming
Creation
Units.
Authorized
Participants
transacting
in
Creation
Units
for
cash
may
also
pay
an
additional
variable
charge
to
compensate
the
relevant Fund
for
certain
transaction
costs
(i.e.,
taxes
on
currency
or
other
financial
transactions,
and
brokerage
costs)
and
market
impact
expenses
it
incurs
in
purchasing
or
selling
portfolio
securities.
Such
variable
charges,
if
any,
are
included
in
“Proceeds
from
shares
sold”
on
the
Statements
of
Changes
in
Net
Assets.
Transactions
in
Fund
shares
during
the
current
and
prior
period
were
as
follows:
NCPB
NUAG
NUSA
For
the
period
3/05/24
(commencement
of
operations)
through
7/31/24
Year
Ended
7/31/24
Year
Ended
7/31/23
Year
Ended
7/31/24
Shares
Amount
Shares
Amount
Shares
Amount
Shares
Amount
Subscriptions
1,600,000
$40,030,789
600,000
$12,312,988
300,000
$6,326,238
500,000
$11,382,469
Redemptions
–
–
(500,000)
(10,351,166)
(6,200,000)
(129,921,150)
(900,000)
(20,491,350)
Net
increase
(decrease)
1,600,000
$40,030,789
100,000
$1,961,822
(5,900,000)
$(123,594,912)
(400,000)
$(9,108,881)
NUSA
NUHY
NUBD
Year
Ended
7/31/23
Year
Ended
7/31/24
Year
Ended
7/31/23
Year
Ended
7/31/24
Shares
Amount
Shares
Amount
Shares
Amount
Shares
Amount
Subscriptions
1,000,000
$22,913,450
800,000
$16,620,534
600,000
$12,451,730
4,700,000
$102,065,429
Redemptions
(800,000)
(18,278,320)
(1,600,000)
(33,252,640)
(100,000)
(2,057,310)
(600,000)
(12,943,120)
Net
increase
(decrease)
200,000
$4,635,130
(800,000)
$(16,632,106)
500,000
$10,394,420
4,100,000
$89,122,309
NUBD
NTZG
NPFI
Year
Ended
7/31/23
Year
Ended
7/31/24
Year
Ended
7/31/23
For
the
period
3/05/24
(commencement
of
operations)
through
7/31/24
Shares
Amount
Shares
Amount
Shares
Amount
Shares
Amount
Subscriptions
2,500,000
$55,017,630
–
$–
–
$–
675,000
$16,890,171
Redemptions
(1,000,000)
(22,156,440)
–
–
–
–
–
–
Net
increase
(decrease)
1,500,000
$32,861,190
–
$–
–
$–
675,000
$16,890,171
7.
Income
Tax
Information
Each
Fund
is
a
separate
taxpayer
for
federal
income
tax
purposes.
Each
Fund
intends
to
distribute
substantially
all
of
its
net
investment
income
and
net
capital
gains
to
shareholders
and
otherwise
comply
with
the
requirements
of
Subchapter
M
of
the
Internal
Revenue
Code
applicable
to
regulated
investment
companies.
Therefore,
no
federal
income
tax
provision
is
required.
Each
Fund
files
income
tax
returns
in
U.S.
federal
and
applicable
state
and
local
jurisdictions.
A
Fund's
federal
income
tax
returns
are
generally
subject
to
examination
for
a
period
of
three
fiscal
years
after
being
filed.
State
and
local
tax
returns
may
be
subject
to
examination
for
an
additional
period
of
time
depending
on
the
jurisdiction.
Management
has
analyzed
each
Fund's
tax
positions
taken
for
all
open
tax
years
and
has
concluded
that
no
provision
for
income
tax
is
required
in
the
Fund's
financial
statements.
Differences
between
amounts
for
financial
statement
and
federal
income
tax
purposes
are
primarily
due
to
timing
differences
in
recognizing
gains
and
losses
on
investment
transactions.
Temporary
differences
do
not
require
reclassification.
As
of
year
end,
permanent
differences
that
resulted
in
reclassifications
among
the
components
of
net
assets
relate
primarily
to
bond
premium
amortization
adjustments,
complex
securities
character
adjustments,
distribution
reallocations,
foreign
currency
transactions,
paydowns,
redemptions
in-kind,
and
return
of
capital
and
long-term
capital
gain
distributions
received
from
portfolio
investments.
Temporary
and
permanent
differences
have
no
impact
on
a
Fund's
net
assets.
As
of
year
end,
the
aggregate
cost
and
the
net
unrealized
appreciation/(depreciation)
of
all
investments
for
federal
income
tax
purposes
were
as
follows:
For
purposes
of
this
disclosure,
tax
cost
generally
includes
the
cost
of
portfolio
investments
as
well
as
up-front
fees
or
premiums
exchanged
on
derivatives
and
any
amounts
unrealized
for
income
statement
reporting
but
realized
income
and/or
capital
gains
for
tax
reporting,
if
applicable.
As
of
year
end,
the
components
of
accumulated
earnings
on
a
tax
basis
were
as
follows:
NSCR
NUSB
For
the
period
3/05/24
(commencement
of
operations)
through
7/31/24
For
the
period
3/05/24
(commencement
of
operations)
through
7/31/24
Shares
Amount
Shares
Amount
Subscriptions
220,000
$5,520,319
1,075,000
$26,933,619
Redemptions
(10,000)
(253,663)
(50,000)
(1,252,136)
Net
increase
(decrease)
210,000
$5,266,656
1,025,000
$25,681,483
Fund
Tax
Cost
Gross
Unrealized
Appreciation
Gross
Unrealized
(Depreciation)
Net
Unrealized
Appreciation
(Depreciation)
NCPB
$
39,387,495
$
609,735
$
(50,390)
$
559,345
NUAG
37,693,747
424,287
(2,181,704)
(1,757,417)
NUSA
32,100,646
258,372
(327,291)
(68,919)
NUHY
95,850,688
1,503,978
(2,269,677)
(765,699)
NUBD
392,229,093
2,345,996
(30,375,611)
(28,029,615)
NTZG
5,059,076
1,499,664
(164,266)
1,335,398
NPFI
16,697,535
273,252
(36,605)
236,647
NSCR
4,872,581
477,227
(76,947)
400,280
NUSB
24,116,719
27,205
(4,345)
22,860
Fund
Undistributed
Ordinary
Income
Undistributed
Long-Term
Capital
Gains
Unrealized
Appreciation
(Depreciation)
Capital
Loss
Carryforwards
Late-Year
Loss
Deferrals
Other
Book-to-Tax
Differences
Total
NCPB
$
185,912
$
—
$
559,345
$
(240,515)
$
—
$
—
$
504,742
NUAG
165,652
—
(1,757,417)
(26,789,532)
—
—
(28,381,297)
NUSA
125,722
—
(68,919)
(2,341,837)
—
—
(2,285,034)
NUHY
548,200
—
(765,699)
(13,612,908)
—
—
(13,830,407)
NUBD
900,612
—
(28,029,615)
(9,485,635)
—
—
(36,614,638)
NTZG
50,483
46,190
1,335,398
—
—
—
1,432,071
NPFI
—
—
236,647
—
—
—
236,647
NSCR
17,682
9
400,280
—
—
—
417,971
NUSB
92,679
—
22,860
(4,318)
—
—
111,221
Notes
to
Financial
Statements
(continued)
The
tax
character
of
distributions
paid
was
as
follows:
As
of
year
end,
the
Funds
had
capital
loss
carryforwards,
which
will
not
expire:
As
of
year
end,
the
Funds
utilized
the
following
capital
loss
carryforwards:
7/31/24
7/31/23
Fund
Ordinary
Income
Long-Term
Capital
Gains
Return
of
Capital
Ordinary
Income
Long-Term
Capital
Gains
Return
of
Capital
NUAG
$
1,385,020
$
—
$
—
$
2,043,070
$
—
$
—
NUSA
1,275,430
—
—
904,010
—
—
NUHY
6,599,640
—
—
6,591,930
—
—
NUBD
10,481,530
—
—
7,684,630
—
—
NTZG
87,940
—
—
33,960
—
—
For
the
Period
3/05/24
(commencement
of
operations)
through
7/31/24
Ordinary
Income
Long-Term
Capital
Gains
Return
of
Capital
NCPB
$497,480
$–
$—
NPFI
180,000
–
106,028
NSCR
–
–
—
NUSB
247,498
–
—
Fund
Short-Term
Long-Term
Total
NCPB
$
240,515
$
—
$
240,515
NUAG
20,598,073
6,191,459
26,789,532
NUSA
554,944
1,786,893
2,341,837
NUHY
5,037,819
8,575,089
13,612,908
NUBD
4,135,619
5,350,016
9,485,635
NTZG
—
—
—
NPFI
—
—
—
NSCR
—
—
—
NUSB
4,318
—
4,318
Fund
Utilized
NCPB
$
—
NUAG
—
NUSA
—
NUHY
—
NUBD
—
NTZG
82,685
NPFI
—
NSCR
—
NUSB
—
8.
Management
Fees
and
Other
Transactions
with
Affiliates
Management
Fees:
Each
Fund’s
management
fee
compensates
the
Adviser
for its
investment
advisory services
to
the
Funds.
The
Sub-Adviser
is
compensated
for
its
services
to
the
Funds
from
the
management
fees
paid
to
the
Adviser.
The
Adviser
is
responsible
for
substantially
all
other
expenses
of
the
Funds,
except
any
future
distribution
and/or
service
fees,
interest
expenses,
taxes,
acquired
fund
fees
and
expenses,
fees
incurred
in
acquiring
and
disposing
of
portfolio
securities,
fees
and
expenses
of
the
independent
trustees
(including
any
trustees’
counsel
fees),
certain
compensation
expenses
of
the
Funds’
chief
compliance
officer,
litigation
expenses
and
extraordinary
expenses.
The
annual management
fee,
payable
monthly,
for
each
Fund
is
based
on
a
percentage
of
average
daily
net
assets
according
to
the
following
rates:
Other
Transactions
with
Affiliates:
NTZG
is
permitted
to
purchase
or
sell
securities
from
or
to
certain
other
funds
or
accounts
managed
by
the
Sub-Adviser
or
by
an
affiliate
of
the
Adviser (each
an
“Affiliated
Entity”)
under
specified
conditions
outlined
in
procedures
adopted
by
the
Board
("cross-trade").
These
procedures
have
been
designed
to
ensure
that
any
cross-trade
of
securities
by
the
Fund
from
or
to
an
Affiliated
Entity
by
virtue
of
having
a
common
investment
adviser
(or
affiliated
investment
adviser),
common
officer
and/or
common
trustee
complies
with
Rule
17a-7
under
the
1940
Act.
These
transactions
are
effected
at
the
current
market
price
(as
provided
by
an
independent
pricing
service)
without
incurring
broker
commissions.
During
the
current
fiscal
period,
the
Fund
did
not engage
in
cross-trades
pursuant
to
these
procedures.
As
of
the
end
of
the
reporting
period,
the
percentage
of
Fund
shares
owned
by
Nuveen
was
as
follows:
Fund
Management
Fee
NCPB
0.30%
NUAG
0.20
NUSA
0.15
NUHY
0.30
NUBD
0.15
NTZG
0.55
NPFI
0.55
NSCR
0.45
NUSB
0.17
Fund
Nuveen
Owned
Shares
NCPB
—
%
NUAG
—
*
NUSA
—
NUHY
—
NUBD
—
NTZG
—
NPFI
—
NSCR
—
NUSB
—
*
Value
rounded
to
zero.
Notes
to
Financial
Statements
(continued)
As
of
the
end
of
the
reporting
period,
the
percentage
of
Fund
shares
owned
by
TIAA
are
as
follows:
9.
Subsequent
Events
On
August
21,
2024,
the
Board
of
Trustees
approved
the
liquidation
of
NTZG,
effective
October
22,
2024.
Fund
TIAA
Owned
Shares
NCPB
75
%
NUAG
6
NUSA
—
NUHY
14
NUBD
—
NTZG
93
NPFI
94
NSCR
95
NUSB
—
Important
Tax
Information
(Unaudited)
As
required
by
the
Internal
Revenue
Code
and
Treasury
Regulations,
certain
tax
information,
as
detailed
below,
must
be
provided
to
shareholders.
Shareholders
are
advised
to
consult
their
tax
advisor
with
respect
to
the
tax
implications
of
their
investment.
The
amounts
listed
below
may
differ
from
the
actual
amounts
reported
on
Form
1099-DIV,
which
will
be
sent
to
shareholders
shortly
after
calendar
year
end.
Long-Term
Capital
Gains
As
of
year
end,
each
Fund
designates
the
following
distribution
amounts,
or
maximum
amount
allowable,
as
being
from
net
long-term
capital
gains
pursuant
to
Section
852(b)(3)
of
the
Internal
Revenue
Code:
Dividends
Received
Deduction
(DRD)
Each
Fund
listed
below
had
the
following
percentage,
or
maximum
amount
allowable,
of
ordinary
income
distributions
eligible
for
the
dividends
received
deduction
for
corporate
shareholders:
Qualified
Dividend
Income
(QDI)
Each
Fund
listed
below
had
the
following
percentage,
or
maximum
amount
allowable,
of
ordinary
income
distributions
treated
as
qualified
dividend
income
for
individuals
pursuant
to
Section
1(h)(11)
of
the
Internal
Revenue
Code:
Fund
Net
Long-Term
Capital
Gains
NCPB
$
—
NUAG
—
NUSA
—
NUHY
—
NUBD
—
NTZG
—
NPFI
—
NSCR
—
NUSB
—
Fund
Percentage
NCPB
–
%
NUAG
–
NUSA
–
NUHY
–
NUBD
–
NTZG
47
.6
NPFI
–
NSCR
–
NUSB
–
Fund
Percentage
NCPB
–
%
NUAG
–
NUSA
–
NUHY
–
NUBD
–
NTZG
100
.0
NPFI
–
NSCR
–
NUSB
–
Important
Tax
Information
(Unaudited)
(continued)
Qualified
Interest
Income
(QII)
Each
Fund
listed
below
had
the
following
percentage,
or
maximum
amount
allowable,
of
ordinary
income
distributions
treated
as
qualified
interest
income
and/or
short-term
capital
gain
dividends
pursuant
to
Section
871(k)
of
the
Internal
Revenue
Code:
163(j)
Each
Fund
listed
below
had
the
following
percentage,
or
maximum
amount
allowable,
of
ordinary
dividends
treated
as
Section
163(j)
interest
dividends
pursuant
to
Section
163(j)
of
the
Internal
Revenue
Code:
Fund
Prior
Year
End
to
12/31
Percentage
1/1
to
Current
Year
End
Percentage
NCPB
1
—
%
100.0
%
NUAG
100.0
52.9
NUSA
92.8
72.9
NUHY
61.2
98.0
NUBD
100.0
76.0
NTZG
—
—
NPFI
1
—
85.3
NSCR
1
—
—
NUSB
1
—
91.0
1
For
the
period
March
5,
2024
(commencement
of
operations)
through
July
31,
2024.
Fund
Percentage
NCPB
–
%
NUAG
100
.0
NUSA
100
.0
NUHY
100
.0
NUBD
100
.0
NTZG
–
NPFI
–
NSCR
–
NUSB
–
| Item 8. | Changes in and Disagreements with Accountants for Open-End Management Investment Companies. |
Not applicable.
| Item 9. | Proxy Disclosures for Open-End Management Investment Companies. |
Not applicable.
| Item 10. | Remuneration Paid to Directors, Officers, and Others of Open-End Management Investment Companies. |
Remuneration paid to directors, officers and others is included in the Statement of Operations under the line items “Trustee Fees” and “Management Fees” as part of the financial statements filed under Item 7 of this Form N-CSR.
Item 11. Statement Regarding Basis for Approval of Investment Advisory Contract
Nuveen Core Plus Bond ETF
Nuveen Enhanced Yield U.S. Aggregate Bond ETF
Nuveen ESG 1-5 Year U.S. Aggregate Bond ETF
Nuveen ESG High Yield Corporate Bond ETF
Nuveen ESG U.S. Aggregate Bond ETF
Nuveen Global Net Zero Transition ETF
Nuveen Preferred and Income ETF
Nuveen Sustainable Core ETF
Nuveen Ultra Short Income ETF
The Board of Trustees (the “Board” and each Trustee, a “Board Member”) of Nushares ETF Trust (the “Trust”) is responsible for determining whether to initially approve or, after an initial term, to renew, the advisory arrangements of the funds comprising the Trust. A discussion of the Board’s most recent approval of the renewal of the advisory arrangements of Nuveen Enhanced Yield U.S. Aggregate Bond ETF, Nuveen ESG 1-5 Year U.S. Aggregate Bond ETF, Nuveen ESG High Yield Corporate Bond ETF, Nuveen ESG U.S. Aggregate Bond ETF and Nuveen Global Net Zero Transition ETF is set forth in Part I below. The advisory arrangements of Nuveen Core Plus Bond ETF, Nuveen Preferred and Income ETF, Nuveen Sustainable Core ETF and Nuveen Ultra Short Income ETF have not yet been up for renewal, and a discussion of the Board’s initial approval of the advisory arrangements of such funds is set forth in Part II below. The Board Members are not “interested persons” (as defined under the Investment Company Act of 1940 (the “1940 Act”)) and, therefore, the Board is deemed to be comprised of all disinterested Board Members. References to the Board and the Board Members are interchangeable.
PART I
Nuveen Enhanced Yield U.S. Aggregate Bond ETF
Nuveen ESG 1-5 Year U.S. Aggregate Bond ETF
Nuveen ESG High Yield Corporate Bond ETF
Nuveen ESG U.S. Aggregate Bond ETF
Nuveen Global Net Zero Transition ETF
The Approval Process
At meetings held on April 18 and 19, 2024 (for purposes of this Part I, the “Meeting”), the Board approved, for each of Nuveen Enhanced Yield U.S. Aggregate Bond ETF, Nuveen ESG 1-5 Year U.S. Aggregate Bond ETF, Nuveen ESG High Yield Corporate Bond ETF, Nuveen ESG U.S. Aggregate Bond ETF and Nuveen Global Net Zero Transition ETF (for purposes of this Part I, collectively, the “Funds” and each a “Fund”), the renewal of the investment management agreement (for purposes of this Part I, each an “Investment Management Agreement”) with Nuveen Fund Advisors, LLC (for purposes of this Part I, “NFAL”; NFAL is an “Adviser”), pursuant to which NFAL serves as investment adviser to such Fund. Similarly, for each respective Fund, the Board approved the renewal of the sub-advisory agreement (for purposes of this Part I, each a “Sub-Advisory Agreement”) with (a) in the case of Nuveen Enhanced Yield U.S. Aggregate Bond ETF, Nuveen ESG 1-5 Year U.S. Aggregate Bond ETF, Nuveen ESG High Yield Corporate Bond ETF and Nuveen ESG U.S. Aggregate Bond ETF, Teachers Advisors, LLC (“TAL”), pursuant to which TAL serves as the sub-adviser to such Fund; and (b) in the case of Nuveen Global Net Zero Transition ETF, Nuveen Asset Management, LLC (for purposes of this Part I, “NAM,” and TAL and NAM are each a “Sub-Adviser”), pursuant to which NAM serves as the sub-adviser to such Fund. Below is a summary of the annual review process the Board undertook related to its most recent renewal of each Investment Management Agreement and Sub-Advisory Agreement on behalf of the applicable Fund.
In accordance with applicable law, following up to an initial two-year period, the Board considers the renewal of each Investment Management Agreement and Sub-Advisory Agreement on behalf of the applicable Fund on an annual basis. For purposes of this Part I, the Investment Management Agreements and Sub-Advisory Agreements are collectively referred to as the “Advisory Agreements,” and NFAL and the Sub-Advisers are collectively, the “Fund Advisers” and each a “Fund Adviser.” In addition, the fund complex consists of the group of funds advised by NFAL (collectively referred to as the “Nuveen funds”) and the group of funds advised by TAL (collectively referred to as the “TC funds”). For clarity, NFAL serves as Adviser to the Nuveen funds, including the Funds, and TAL, in addition to serving as the sub-adviser to certain Nuveen funds (including certain of the Funds), serves as “Adviser” to the TC funds. The Board Members considered that the prior separate boards of the TC funds and Nuveen funds were consolidated effective in January 2024. Accordingly, at the Meeting, the Board Members considered the review of the advisory agreements for the Nuveen funds as well as reviewed the investment management agreements for the TC funds. Depending on the appropriate context, references to “the Adviser” may be to NFAL with respect to the Nuveen funds and/or TAL with respect to the TC funds.
The Board Members considered the review of the advisory agreements of the Nuveen funds and the TC funds to be an ongoing process. The Board Members therefore employed the accumulated information, knowledge and experience they had gained during their tenure on the respective board of the TC funds or Nuveen funds (as the case may be) governing the applicable funds and working with the respective investment advisers and sub- advisers, as applicable, in their review of the advisory agreements for the fund complex.
1
Item 11. Statement Regarding Basis for Approval of Investment Advisory Contract (continued)
During the course of the year prior to the Meeting, the Board and/or its committees received a wide variety of materials that covered a range of topics relevant to the Board’s annual consideration of the renewal of the advisory agreements, including reports on fund investment results over various periods; product initiatives for various funds; fund expenses; compliance, regulatory and risk management matters; trading practices, including soft dollar arrangements (as applicable); the liquidity and derivatives risk management programs; management of distributions; valuation of securities; payments to financial intermediaries (as applicable); securities lending (as applicable); and overall market and regulatory developments. The Board also met periodically with and/or received presentations by key investment professionals managing a fund’s portfolio. In particular, at the Board meeting held on February 27-29, 2024 (the “February Meeting”), the Board and/or its Investment Committee received the annual performance review of the funds as described in further detail below. The presentations, discussions and meetings throughout the year also provide a means for the Board to evaluate and consider the level, breadth and quality of services provided by the Adviser and sub-advisers, as applicable, and how such services have changed over time in light of new or modified regulatory requirements, changes to market conditions or other factors.
In connection with its annual consideration of the advisory agreements, the Board, through its independent legal counsel, requested and received extensive materials and information prepared specifically for its review of the advisory agreements. The materials provided at the Meeting and/or prior meetings covered a wide range of matters including, but not limited to, a description of the nature, extent and quality of services provided by the Fund Advisers; the consolidation of the Nuveen fund family and TC fund family; a review of product actions advanced in 2023 for the benefit of particular funds and/or the fund complex; a review of each sub-adviser, if applicable, and/or applicable investment team; an analysis of fund performance with a focus on funds considered to have met certain challenged performance measurements; an analysis of the fees and expense ratios of the funds with a focus on funds considered to have certain expense characteristics; a list of management fee and, if applicable, sub-advisory fee schedules; a description of portfolio manager compensation; a description of the profitability and/or financial data of Nuveen, TAL and the sub-advisers; and a description of indirect benefits received by the Adviser and the sub-advisers as a result of their relationships with the funds, as applicable. The Board also considered information provided by Broadridge Financial Solutions, Inc. (“Broadridge”), an independent provider of investment company data, comparing fee and expense levels of each respective fund to those of a peer universe and, with respect to open-end funds, also to a peer group of funds selected by Broadridge, subject to certain exceptions.
The information prepared specifically for the annual review supplemented the information provided to the Board and its committees and the evaluations of the funds by the Board and its committees during the year. The Board’s review of the advisory agreements for the fund complex is based on all the information provided to the Board and its committees over time. The performance, fee and expense data and other information provided by a Fund Adviser, Broadridge or other service providers were not independently verified by the Board Members.
As part of their review, the Board Members and independent legal counsel met by videoconference in executive session on April 10, 2024 (the “April Executive Session”) to review and discuss materials provided in connection with their annual review of the advisory agreements for the fund complex. After reviewing this information, the Board Members requested, directly or through independent legal counsel, additional information, and the Board subsequently reviewed and discussed the responses to these follow-up questions and requests.
The Board Members were advised by independent legal counsel during the annual review process as well as throughout the year, including meeting in executive sessions with such counsel at which no representatives of management were present. In connection with their annual review, the Board Members also received a memorandum from independent legal counsel outlining their fiduciary duties and legal standards in reviewing the Advisory Agreements, including guidance from court cases evaluating advisory fees.
The Board’s decisions to renew each Advisory Agreement were not based on a single identified factor, but rather each decision reflected the comprehensive consideration of all the information provided to the Board and its committees throughout the year as well as the materials prepared specifically in connection with the annual review process. The contractual arrangements may reflect the results of prior year(s) of review, negotiation and information provided in connection with the Board’s annual review of the funds’ advisory arrangements and oversight of the funds. Each Board Member may have attributed different levels of importance to the various factors and information considered in connection with the annual review process and may have placed different emphasis on the relevant information year to year in light of, among other things, changing market and economic conditions. A summary of the principal factors and information, but not all the factors, the Board considered in deciding to renew the Advisory Agreements is set forth below.
A. Nature, Extent and Quality of Services
In evaluating the renewal of the Advisory Agreements, the Board Members received and considered information regarding the nature, extent and quality of the applicable Fund Adviser’s services provided to each respective Fund with particular focus on the services and enhancements or changes to such services provided during the last year. The Board Members considered the Investment Management Agreements and the Sub- Advisory Agreements separately in the course of their review. With this approach, they considered the roles of NFAL and the Sub-Advisers in providing services to the applicable Fund(s).
The Board considered that the Adviser provides a wide array of management, oversight and other services to manage and operate the applicable funds. The Board considered the Adviser’s and its affiliates’ dedication of resources, time, people and capital as well as continual program of improvement and innovation aimed at enhancing the funds and fund complex for investors and meeting the needs of an increasingly complex regulatory environment. In particular, over the past several years, the Board considered the significant resources, both financial and personnel, the Adviser and its affiliates have committed in working to consolidate the Nuveen fund family and TC fund family under one centralized umbrella. The Board considered that the organizational changes in bringing together Nuveen, its affiliates and TIAA’s (as defined below) asset management
2
businesses, consolidating the Nuveen and TC fund families and other initiatives were anticipated to provide various benefits for the funds through, among other things, enhanced operating efficiencies, centralized investment leadership and a centralized shared resources and support model. As part of these efforts, the boards of the TC funds and Nuveen funds were consolidated effective in January 2024.
The Board also reviewed information regarding other product actions undertaken or continued by management in the 2023 calendar year in seeking to improve the effectiveness of the organization, the product line-up as well as particular funds through, among other things, continuing to review and optimize the product line and gaining efficiencies through mergers and liquidations; reviewing and updating investment policies and benchmarks; implementing fee waivers and/or expense cap changes for certain funds; evaluating and adjusting portfolio management teams as appropriate for various funds; and developing policy positions on a broad range of regulatory proposals that may impact the funds and communicating with lawmakers and other regulatory authorities to help ensure these positions are considered. In its review, the Board considered that the funds operated in a highly regulated industry and the scope and complexity of the services and resources that the Adviser and its affiliates must provide to manage and operate the applicable funds have expanded over the years as a result of, among other things, regulatory, market and other developments, such as the adoption of the tailored shareholder report or the revised fund name rule.
In considering the breadth and quality of services the Adviser and its various teams provide, the Board considered that the Adviser provides investment advisory services. With respect to the Nuveen funds, such funds utilize sub-advisers to manage the portfolios of the funds subject to the supervision of NFAL. Accordingly, the Board considered that NFAL and its affiliates, among other things, oversee and review the performance of the respective sub-adviser and its investment team(s); evaluate Nuveen fund performance and market conditions; evaluate investment strategies and recommend changes thereto; set and manage distributions consistent with the respective Nuveen fund’s product design; oversee trade execution and, as applicable, securities lending; evaluate investment risks; and manage valuation matters. As each Fund is an exchange-traded fund (each an “ETF”), such services also include, but are not limited to, performance monitoring and assessment, evaluating tax efficiencies consistent with portfolio management, reviewing tracking error and analyzing secondary market dynamics. The Board further considered that over the course of the 2023 calendar year, the Nuveen global public product team which supports the funds in the fund complex and their shareholders assessed the investment personnel across the investment leadership teams which resulted in additions or other modifications to the portfolio management teams of various funds. The Board also reviewed a description of the compensation structure applicable to certain portfolio managers.
In addition to the above investment advisory services, the Board further considered the extensive compliance, regulatory, administrative and other services the Adviser and its various teams or affiliates provide to manage and operate the applicable funds. Given the highly regulated industry in which the funds operate, the Board considered the breadth of the Adviser’s compliance program and related policies and procedures. The Board reviewed various initiatives the Adviser’s compliance team undertook or continued in 2023, in part, to address new regulatory requirements, support international business growth and product development, enhance international trading capabilities, enhance monitoring capabilities in light of the new regulatory requirements and guidance and maintain a comprehensive training program. The Board further considered, among other things, that other non-advisory services provided included, among other things, board support and reporting; establishing and reviewing the services provided by other fund service providers (such as a fund’s custodian, accountant, and transfer agent); risk management, including reviews of the liquidity risk management and derivatives risk management programs; legal support services; regulatory advocacy; and cybersecurity, business continuity and disaster recovery planning and testing.
Aside from the services provided, the Board considered the financial resources of the Adviser and/or its affiliates and their willingness to make investments in the technology, personnel and infrastructure to support the funds, including to enhance global talent, middle office systems, software and international and internal capabilities. The Board considered the access provided by the Adviser and its affiliates to a seed capital budget to support new or existing funds and/or facilitate changes for a respective fund. The Board considered the benefits to shareholders of investing in a fund that is a part of a large fund complex with a variety of investment disciplines, capabilities, expertise and resources available to navigate and support the funds including during stressed times. The Board considered the overall reputation and capabilities of the Adviser and its affiliates and the Adviser’s continuing commitment to provide high quality services.
In its review, the Board also considered the significant risks borne by the Adviser and its affiliates in connection with their services to the applicable funds, including entrepreneurial risks in sponsoring and supporting new funds and smaller funds and ongoing risks with managing the funds, such as investment, operational, reputational, regulatory, compliance and litigation risks.
With respect to the Funds, the Board considered the division of responsibilities between NFAL and the Sub-Advisers and considered that each Sub-Adviser and its investment personnel generally are responsible for the management of each applicable Fund’s portfolio under the oversight of NFAL and the Board. The Board considered an analysis of each Sub-Adviser provided by NFAL which included, among other things, a summary of changes in the leadership teams and/or portfolio manager teams; the performance of the Nuveen funds sub-advised by the Sub-Adviser over various periods of time; and data reflecting product changes (if any) taken with respect to certain Nuveen funds. The Board considered that NFAL recommended the renewal of the Sub-Advisory Agreements.
Based on its review, the Board determined, in the exercise of its reasonable business judgment, that it was satisfied with the nature, extent and quality of services provided to the respective Funds under each applicable Advisory Agreement.
B. The Investment Performance of the Funds and Fund Advisers
In evaluating the quality of the services provided by the Fund Advisers, the Board also considered a variety of investment performance data of the Funds. In this regard, the Board and/or its Investment Committee reviewed, among other things, net asset value performance of the Funds over the quarter, one-, three- and five-year periods ending December 31, 2023 and March 31, 2024 (or for such shorter periods to the extent a Fund was not in existence during such periods). The Board performed its annual review of fund performance at its February Meeting and an additional review at the April Executive Session and also reviewed and discussed performance data at its other regularly scheduled quarterly meetings throughout the year. The Board therefore took into account the performance data, presentations and discussions (written and oral) that were provided at the Meeting and in prior meetings over time in evaluating fund performance, including management’s analysis of a fund’s performance with particular
3
Item 11. Statement Regarding Basis for Approval of Investment Advisory Contract (continued)
focus on funds that met certain challenged performance measurements as determined pursuant to a methodology approved by the Board or additional measurements as determined by management’s investment analysts. As various Nuveen funds have modified their portfolio teams and/ or made significant changes to their portfolio strategies over time, the Board reviewed, among other things, certain tracking performance data over specific periods comparing performance before and after such changes.
The Board considered that performance data reflects performance over a specified period which may differ significantly depending on the ending dates selected, particularly during periods of market volatility. Further, the Board considered that shareholders may evaluate performance based on their own respective holding periods which may differ from the performance periods reviewed by the Board and lead to differing results.
In its evaluation, the Board reviewed fund performance results from different perspectives. In general, subject to certain exceptions, the Board reviewed both absolute and relative fund performance over the various time periods and considered performance results in light of a fund’s investment objective(s), strategies and risks. With respect to the relative performance, the Board considered fund performance in comparison to the performance of peer funds (the “Performance Peer Group”), subject to certain exceptions, and recognized and/or customized benchmarks (i.e., generally benchmarks derived from multiple recognized benchmarks). In reviewing such comparative performance, the Board was cognizant of the inherent limitations of such data which can make meaningful performance comparisons generally difficult. As an illustration, differences in the composition of the Performance Peer Group, the investment objective(s), strategies, dates of fund inception and other characteristics of the peers in the Performance Peer Group, the level, type and cost of leverage (if any) of the peers, and the varying sizes of peers all may contribute to differences in the performance results of a Performance Peer Group compared to the applicable fund. With respect to relative performance of a fund compared to a benchmark index, differences, among other things, in the investment objective(s) and strategies of a fund and the benchmark (particularly an actively managed fund that does not directly follow an index) as well as the costs of operating a fund would necessarily contribute to differences in performance results and limit the value of the comparative performance information. To assist the Board in its review of the comparability of the relative performance, management generally has ranked the relevancy of the Performance Peer Groups to the funds as low, medium or high, subject to an exception with respect to those funds that are Nuveen ETFs designed to track the performance of a specified index (an “Underlying Index”; each such Nuveen ETF is an “Index ETF”). In its review of relative performance, the Board considered a Fund’s performance relative to its Performance Peer Group, among other things, by evaluating its quartile ranking with the 1st quartile representing the top performing funds within the Performance Peer Group and the 4th quartile representing the lowest performing funds.
With respect to the Funds, the Board considered that Nuveen Enhanced Yield U.S. Aggregate Bond ETF, Nuveen ESG 1-5 Year U.S. Aggregate Bond ETF, Nuveen ESG High Yield Corporate Bond ETF and Nuveen ESG U.S. Aggregate Bond ETF were Index ETFs, and Nuveen Global Net Zero Transition ETF was actively managed.
With respect to the relative benchmark performance for Index ETFs, the Board considered, among other things, the Index ETF’s performance in comparison to the performance of its Underlying Index and a broad-based index from which the Underlying Index is generally derived, the performance of the Underlying Index compared to such broad-based index over the one-, three- and five-year periods ended December 31, 2023 and March 31, 2024 (or such shorter periods for funds that did not exist during those time frames), each Index ETF’s tracking error over various periods and certain peer rankings. However, given the Index ETFs’ investment objective of seeking investment results that correspond generally to the performance of their respective Underlying Index, the Board considered that the extent to which an Index ETF tracked its benchmark was of greater relevance in assessing the performance of these funds and therefore placed more emphasis on the tracking error and correlation data.
The Board evaluated performance in light of various relevant factors which may include, among other things, general market conditions, issuer- specific information, asset class information, leverage and fund cash flows. The Board considered that long-term performance could be impacted by even one period of significant outperformance or underperformance and that a single investment theme could disproportionately affect performance. Further, the Board considered that market and economic conditions may significantly impact a fund’s performance, particularly over shorter periods, and such performance may be more reflective of such economic or market events and not necessarily reflective of management skill. Although the Board reviews short-, intermediate- and longer-term performance data, the Board considered that longer periods of performance may reflect full market cycles.
In their review from year to year, the Board Members consider and may place different emphasis on the relevant information in light of changing circumstances in market and economic conditions. In evaluating performance, the Board focused particular attention on funds with less favorable performance records. However, depending on the facts and circumstances, including any differences between the respective fund and its benchmark and/or Performance Peer Group, the Board may be satisfied with a fund’s performance notwithstanding that its performance may be below that of its benchmark and/or peer group for certain periods. With respect to any funds for which the Board has identified performance issues, the Board seeks to monitor such funds more closely until performance improves, discuss with the Adviser the reasons for such results, consider whether any steps are necessary or appropriate to address such issues, discuss and evaluate the potential consequences of such steps and review the results of any steps undertaken.
The performance determinations with respect to each Fund are summarized below.
4
| | • | | For Nuveen Enhanced Yield U.S. Aggregate Bond ETF, the Board considered, among other things, the performance of the Fund and its Underlying Index for the one-, three- and five-year periods ended December 31, 2023 and March 31, 2024 as well as its tracking error compared to its Underlying Index as of December 31, 2023 and March 31, 2024 and as of each month end for the 2023 calendar year. The Board considered that the Fund ranked in the first quartile of its Performance Peer Group for the one-year period, third quartile for the three-year period and second quartile for the five-year period ended December 31, 2023. Further, the Fund ranked in the first quartile of its Performance Peer Group for the one-year period and second quartile for the three- and five-year periods ended March 31, 2024. Given the Fund’s investment objective, however, the Board placed more emphasis on its review of the tracking error and correlation data and after review of such data and other metrics, the Board considered that the Fund had performed in line with expectations in 2023. On the basis of the Board’s ongoing review of investment performance and all relevant factors, including the relative market conditions during certain reporting periods, the Fund’s investment objective(s) and management’s discussion of performance, the Board concluded that the Fund’s performance supported renewal of the Advisory Agreements. |
| | • | | For Nuveen ESG 1-5 Year U.S. Aggregate Bond ETF, the Board considered, among other things, the performance of the Fund and its Underlying Index for the one-, three- and five-year periods ended December 31, 2023 and March 31, 2024 as well as its tracking error compared to its Underlying Index as of December 31, 2023 and March 31, 2024 and as of each month end for the 2023 calendar year. The Board considered that the Fund ranked in the fourth quartile of its Performance Peer Group for the one-, three- and five-year periods ended December 31, 2023 and March 31, 2024. Given the Fund’s investment objective, however, the Board placed more emphasis on its review of the tracking error and correlation data and after review of such data and other metrics, the Board considered that the Fund had performed in line with expectations in 2023. On the basis of the Board’s ongoing review of investment performance and all relevant factors, including the relative market conditions during certain reporting periods, the Fund’s investment objective(s) and management’s discussion of performance, the Board concluded that the Fund’s performance supported renewal of the Advisory Agreements. |
| | • | | For Nuveen ESG High Yield Corporate Bond ETF, the Board considered, among other things, the performance of the Fund and its Underlying Index for the one- and three-year periods ended December 31, 2023 and March 31, 2024 as well as its tracking error compared to its Underlying Index as of December 31, 2023 and March 31, 2024 and as of each month end for the 2023 calendar year. The Board considered that the Fund ranked in the fourth quartile of its Performance Peer Group for the three-year periods and third quartile for the one-year periods ended December 31, 2023 and March 31, 2024. Given the Fund’s investment objective, however, the Board placed more emphasis on its review of the tracking error and correlation data and after review of such data and other metrics, the Board considered that the Fund had performed in line with expectations in 2023. On the basis of the Board’s ongoing review of investment performance and all relevant factors, including the relative market conditions during certain reporting periods, the Fund’s investment objective(s) and management’s discussion of performance, the Board concluded that the Fund’s performance supported renewal of the Advisory Agreements. |
| | • | | For Nuveen ESG U.S. Aggregate Bond ETF, the Board considered, among other things, the performance of the Fund and its Underlying Index for the one-, three- and five-year periods ended December 31, 2023 and March 31, 2024 as well as its tracking error compared to its Underlying Index as of December 31, 2023 and March 31, 2024 and as of each month end for the 2023 calendar year. The Board considered that the Fund ranked in the fourth quartile of its Performance Peer Group for the one-, three- and five-year periods ended December 31, 2023 and March 31, 2024. Given the Fund’s investment objective, however, the Board placed more emphasis on its review of the tracking error and correlation data and after review of such data and other metrics, the Board considered that the Fund had performed in line with expectations in 2023. On the basis of the Board’s ongoing review of investment performance and all relevant factors, including the relative market conditions during certain reporting periods, the Fund’s investment objective(s) and management’s discussion of performance, the Board concluded that the Fund’s performance supported renewal of the Advisory Agreements. |
| | • | | For Nuveen Global Net Zero Transition ETF, the Board considered that although the Fund’s performance was below the performance of its benchmark for the one-year periods ended December 31, 2023 and March 31, 2024 and the Fund ranked in the fourth quartile of its Performance Peer Group for the one-year period ended December 31, 2023, the Fund ranked in the third quartile of its Performance Peer Group for the one-year period ended March 31, 2024. The Board took into account management’s analysis of the Fund’s performance, including the factors that contributed to or detracted from performance and the improved relative performance in the first quarter of 2024. The Board further considered that the Fund was relatively new with performance history too short to make a meaningful assessment of performance, and management deserved additional time to develop a performance record. |
5
Item 11. Statement Regarding Basis for Approval of Investment Advisory Contract (continued)
C. Fees, Expenses and Profitability
As part of its annual review, the Board generally reviewed, among other things, the contractual management fee and the net/actual management fee (i.e., the management fee after taking into consideration fee waivers and/or expense reimbursements, if any) paid by a fund to the Adviser in light of the nature, extent and quality of the services provided. The Board also reviewed information about other expenses and the total operating expense ratio of each fund (after any fee waivers and/or expense reimbursements). More specifically, the Board Members reviewed, among other things, each fund’s management fee rates and net total expense ratio in relation to similar data for a comparable universe of funds (the “Expense Universe”) and for a more focused subset of comparable funds (the “Expense Group”) established by Broadridge (subject to certain exceptions). The Board Members reviewed the methodology Broadridge employed to establish its Expense Universe and Expense Group (as applicable) and considered that differences between the applicable fund and its respective Expense Universe and/or Expense Group, as well as changes to the composition of the Expense Universe and/or Expense Group from year to year, may limit some of the value of the comparative data. The Board Members also considered that it can be difficult to compare management fees among funds as there are variations in the services that are included for the fees paid. The Board Members took these limitations and differences into account when reviewing comparative peer data.
The Board Members also considered a fund’s operating expense ratio as it more directly reflected a shareholder’s total costs in investing in the respective fund. In their review, the Board Members considered, in particular, each fund with a net total expense ratio meeting certain expense or fee criteria when compared to its Expense Universe and Expense Group (if any) and an analysis as to the factors contributing to each such fund’s relative net total expense ratio.
The Board Members also considered, in relevant part, a fund’s management fee and net total expense ratio in light of the fund’s performance history, including reviewing certain funds identified by management and/or the Board as having a higher net total expense ratio or management fee compared to their respective peers coupled with experiencing periods of challenged performance and considering the reasons for such comparative positions.
In their evaluation of the fee arrangements for the funds, the Board Members also reviewed the management fee schedules. With respect to the Funds, the Board considered that the Funds pay NFAL a single, all-inclusive (or unified) management fee for providing or paying for all services necessary for the management and operation of the Fund, subject to certain exceptions. Unlike the typical fee arrangements of other funds in which the funds pay a variety of fees and expenses such as investment advisory fees, transfer agency fees, audit fees, custodian fees, administration fees, compliance expenses, recordkeeping expenses, marketing and shareholder service fees, distribution charges and other expenses, Nuveen ETFs, such as the Funds, pay the Adviser a unified fee, and the Adviser is responsible for providing such services or arranging and supervising third parties to provide such services (subject to the certain exceptions). Under the unified fee structure, the Board considered that the Adviser generally bears the risks of the operating costs rising (and benefits if such expenses decrease) and therefore has an incentive to be administratively efficient. Accordingly, as part of the Board’s analysis of the fee level of each Nuveen ETF, the Board Members reviewed, among other things, the unified management fee compared to the contractual and actual management fees of its respective Expense Group and Expense Universe, as well as the fund’s net total expense ratio compared to the net total expense ratio of its respective Expense Group and Expense Universe.
With respect to each Sub-Adviser, the Board also considered, among other things, the sub-advisory fee schedule paid to the Sub-Adviser in light of the sub-advisory services provided to the respective Fund. In its review, the Board considered that the compensation paid to each Sub-Adviser is the responsibility of NFAL, not the applicable Fund(s).
The Board’s considerations regarding the comparative fee data for each of the Funds are set forth below. With respect to the quartile rankings noted below, the first quartile represents the range of funds with the lowest management fee rate or net total expense ratio, as applicable, and the fourth quartile represents the range of funds with the highest management fee rate or net total expense ratio, as applicable. The Board considered that Broadridge only calculates quartiles if a minimum number of peers is available and therefore quartile rankings may not be available for certain Expense Groups and/or Expense Universes.
| | • | | For Nuveen Enhanced Yield U.S. Aggregate Bond ETF, although the Fund’s contractual management fee rate, actual management fee rate and net total expense ratio each ranked in the fourth quartile of its Expense Universe, each ranked in the second quartile of its Expense Group. In addition, the Fund’s actual management fee rate and net total expense ratio matched the Expense Group median. |
| | • | | For Nuveen ESG 1-5 Year U.S. Aggregate Bond ETF, the Fund’s contractual management fee rate, actual management fee rate and net total expense ratio ranked in the first quartile, third quartile and third quartile of its Expense Group, respectively. In addition, although the Fund’s actual management fee rate and net total expense ratio ranked in the fourth quartile of its Expense Universe, the Fund’s contractual management fee rate ranked in the third quartile of its Expense Universe. Further, the Fund’s actual management fee rate and net total expense ratio were each generally in-line with the Expense Group median. |
| | • | | For Nuveen ESG High Yield Corporate Bond ETF, the Fund’s contractual management fee rate, actual management fee rate and net total expense ratio each ranked in the second quartile of its Expense Group. In addition, the Fund’s contractual management fee rate, actual management fee rate and net total expense ratio ranked in the first quartile, second quartile and first quartile of its Expense Universe, respectively. Further, the Fund’s actual management fee rate and net total expense ratio were below the Expense Group median. The Fund’s unified management fee also was reduced in September 2021. |
6
| | • | | For Nuveen ESG U.S. Aggregate Bond ETF, although the Fund’s actual management fee rate and net total expense ratio ranked in the fourth quartile of its Expense Group, the Fund’s contractual management fee rate ranked in the second quartile of its Expense Group. In addition, although the Fund’s net total expense ratio ranked in the fourth quartile of its Expense Universe, the Fund’s contractual management fee rate and actual management fee rate ranked in the third quartile of its Expense Universe. Further, the Fund’s actual management fee rate and net total expense ratio were each generally in-line with the Expense Group median. The Fund’s unified management fee also was reduced in September 2021. |
| | • | | For Nuveen Global Net Zero Transition ETF, the Fund’s contractual management fee rate, actual management fee rate and net total expense ratio each ranked in the first quartile of its Expense Group and Expense Universe, respectively. Further, the Fund’s actual management fee rate and net total expense ratio were below the Expense Group median. |
Based on its review of the information provided, the Board determined that each Fund’s management fees (as applicable) to a Fund Adviser were reasonable in light of the nature, extent and quality of services provided to the Fund.
| | 2. | Comparisons with the Fees of Other Clients |
In evaluating the appropriateness of fees, the Board also considered that the Adviser, affiliated sub-advisers and/or their affiliate(s) provide investment management services to other types of clients which may include: separately managed accounts, retail managed accounts, foreign funds (UCITS), other investment companies (as sub-advisers), limited partnerships and collective investment trusts. The Board reviewed the equal weighted average fee or other fee data for the other types of clients managed in a similar manner to certain of the Nuveen funds and TC funds. The Board considered the Adviser’s rationale for the differences in the management fee rates of the funds compared to the management fee rates charged to these other types of clients. In this regard, the Board considered that differences, including but not limited to, the amount, type and level of services provided by the Adviser to the funds compared to that provided to other clients as well as differences in investment policies; regulatory, disclosure and governance requirements; servicing relationships with vendors; the manner of managing such assets; product structure; investor profiles; and account sizes all may contribute to variations in relative fee rates. Further, differences in the client base, governing bodies, distribution, jurisdiction and operational complexities also would contribute to variations in management fees assessed the funds compared to foreign fund clients. In addition, differences in the level of advisory services required for passively managed funds, including the Index ETFs, also contribute to differences in the management fee levels of such funds compared to actively managed funds. As a general matter, higher fee levels reflect higher levels of service provided by the Adviser, increased investment management complexity, greater product management requirements, and higher levels of business risk or some combination of these factors. The Board considered the wide range of services in addition to investment management that the Adviser had provided to the funds compared to other types of clients as well as the increased entrepreneurial, legal and regulatory risks that the Adviser incurs in sponsoring and managing the funds. The Board further considered that a sub-adviser’s fee is essentially for portfolio management services and therefore more comparable to the fees it receives for retail wrap accounts and other external sub- advisory mandates. The Board concluded that the varying levels of fees were reasonable given, among other things, the more extensive services, regulatory requirements and legal liabilities, and the entrepreneurial, legal and regulatory risks incurred in sponsoring and advising a registered investment company compared to that required in advising other types of clients.
| | 3. | Profitability of Fund Advisers |
In their review, the Board Members considered various profitability data relating to the Fund Advisers’ services to the Nuveen funds.
With respect to the Nuveen funds, the Board Members reviewed the estimated profitability information of Nuveen as a result of its advisory services to the Nuveen funds overall as well as profitability data of certain other asset management firms. Such profitability information included, among other things, gross and net revenue margins (excluding distribution) of Nuveen Investments, Inc. (“Nuveen Investments”) for services to the Nuveen funds on a pre-tax and after-tax basis for the 2023 and 2022 calendar years as well as the revenues earned (less any expense reimbursements/fee waivers) and expenses incurred by Nuveen Investments for its advisory activities to the Nuveen funds (excluding distribution) for the 2023 and 2022 calendar years. The Board Members also considered the rationale for the change in Nuveen’s profitability from 2022 to 2023. In addition, the Board reviewed the revenues, expenses and operating margin (pre- and after-tax) NFAL derived from its ETF product line for the 2023 and 2022 calendar years.
In developing the profitability data, the Board Members considered the subjective nature of calculating profitability as the information is not audited and is necessarily dependent on cost allocation methodologies to allocate expenses throughout the complex and among the various advisory products. Given there is no single universally recognized expense allocation methodology and that other reasonable and valid allocation methodologies could be employed and could lead to significantly different results, the Board reviewed, among other things, a description of the cost allocation methodologies employed to develop the financial information, a summary of the refinements Nuveen had made to the methodology that had occurred over the years from 2010 through 2021 to provide Nuveen’s profitability analysis, and a historical expense analysis of Nuveen Investments’ revenues, expenses and pre-tax net revenue margins derived from its advisory services to the Nuveen funds (excluding distribution) for the calendar years from 2017 through 2023. The Board of the Nuveen funds had also appointed two Board Members to serve as the Board’s liaisons to meet with representatives of NFAL and review the development of the profitability data and to report to the full Board.
7
Item 11. Statement Regarding Basis for Approval of Investment Advisory Contract (continued)
In addition, the Board considered certain comparative operating margin data. In this regard, the Board reviewed the operating margins of Nuveen Investments compared to the adjusted operating margins of a peer group of asset management firms with publicly available data and the most comparable assets under management (based on asset size and asset composition) to Nuveen. The Board considered that the operating margins of the peers were adjusted generally to address that certain services provided by the peers were not provided by Nuveen. The Board also reviewed, among other things, the net revenue margins (pre-tax) of Nuveen Investments on a company-wide basis and the net revenue margins (pre-tax) of Nuveen Investments derived from its services to the Nuveen funds only (including and excluding distribution) compared to the adjusted operating margins of the peer group for each calendar year from 2014 to 2023. In their review of the comparative data, the Board Members considered the limitations of the comparative data given that peer data is not generally public and the calculation of profitability is subjective and affected by numerous factors (such as types of funds a peer manages, its business mix, its cost of capital, the numerous assumptions underlying the methodology used to allocate expenses and other factors) that can have a significant impact on the results.
Aside from the profitability data, the Board considered that NFAL and TAL are affiliates of Teachers Insurance and Annuity Association of America (“TIAA”). NFAL is a subsidiary of Nuveen, LLC, the investment management arm of TIAA, and TAL is an indirect wholly owned subsidiary of TIAA. Accordingly, the Board also reviewed a balance sheet for TIAA reflecting its assets, liabilities and capital and contingency reserves for the 2023 and 2022 calendar years to consider the financial strength of TIAA. The Board considered the benefit of an investment adviser and its parent with significant resources, particularly during periods of market volatility. The Board also considered the reinvestments the Adviser, its parent and/or other affiliates made into their business through, among other things, the investment of seed capital in certain funds, initiatives in international expansion, investments in infrastructure and continued investments in enhancements to technological capabilities.
The Board Members considered the profitability of each Sub-Adviser from its relationships with the respective Nuveen funds. In this regard, with respect to NAM, the Board Members reviewed, among other things, the Sub-Adviser’s revenues, expenses and net revenue margins (pre- and after-tax) for its advisory activities to the respective Nuveen funds for the calendar years ended December 31, 2023 and December 31, 2022. The Board Members also reviewed a profitability analysis reflecting the revenues, expenses and revenue margin (pre- and after- tax) grouped by similar types of funds (such as municipal, taxable fixed income, equity, real assets and index/asset allocation) for NAM for the calendar years ending December 31, 2023 and December 31, 2022. With respect to TAL, the Board Members reviewed, among other things, the revenues, expenses and net operating income for its advisory services to the Nuveen ETFs and Nuveen closed-end funds it sub- advises for the 2023 and 2022 calendar years.
In evaluating the reasonableness of the compensation, the Board Members also considered the indirect benefits NFAL or the Sub-Advisers received that were directly attributable to the management of the applicable funds as discussed in further detail below. Based on its review, the Board was satisfied that each Fund Adviser’s level of profitability from its relationship with each Nuveen fund was not unreasonable over various time frames in light of the nature, extent and quality of services provided.
D. Economies of Scale and Whether Fee Levels Reflect These Economies of Scale
The Board considered whether there have been economies of scale with respect to the management of the funds in the fund complex, including the Funds, whether these economies of scale have been appropriately shared with such funds and whether there is potential for realization of further economies of scale. Although the Board considered that economies of scale are difficult to measure with any precision and the rates at which certain expenses are incurred may not decline with a rise in assets, the Board considered that there are various methods that may be employed to help share the benefits of economies of scale, including, among other things, through the use of breakpoints in the management fee schedule, fee waivers and/or expense limitations, the pricing of funds at scale at inception and investments in the Adviser’s business which can enhance the services provided to the applicable funds for the fees paid. In this regard, the Board considered that, with respect to the Nuveen funds generally, although the management fee of NFAL typically was comprised of a fund-level component and a complex-level component each with its own breakpoint schedule, the Nuveen ETFs do not have breakpoint schedules. The Board considered that the Nuveen ETFs pay a unified fee and as a result, any reduction in fixed costs associated with the management of these funds would benefit the Adviser. However, the Board Members considered that the unified fee schedule provides shareholders with a level of certainty of the expenses of the Nuveen ETFs. The Board Members considered that the unified fees generally provide inherent economies of scale because the Nuveen ETF would maintain a relatively fixed fee over the annual contract period even if the particular fund’s assets declined and/or operating costs rose. The Board Members further considered that the Nuveen ETFs do not participate in the complex-level fee program.
The Board Members also considered the continued reinvestment in Nuveen/TIAA’s business to enhance its capabilities and services to the benefit of its various clients. The Board understood that many of these investments were not specific to individual funds, but rather incurred across a variety of products and services pursuant to which the family of funds as a whole may benefit. The Board further considered that the Adviser and its affiliates have provided certain additional services, including, but not limited to, services required by new regulations and regulatory interpretations, without raising advisory fees to the funds, and this was also a means of sharing economies of scale with the funds and their shareholders. The Board considered the Adviser’s and/or its affiliates’ ongoing efforts to streamline the product line-up, among other things, to create more scaled funds which may help improve both expense and trading economies.
Based on its review, the Board was satisfied that the current fee arrangements together with the reinvestment in management’s business appropriately shared any economies of scale with shareholders.
8
E. Indirect Benefits
The Board Members received and considered information regarding various indirect benefits the respective Fund Adviser or its affiliates may receive as a result of their relationship with the funds in the fund complex, including the Funds. These benefits included, among other things, economies of scale to the extent the Adviser or its affiliates share investment resources and/or personnel with other clients of the Adviser. The funds may also be used as investment options for other products or businesses offered by the Adviser and/or its affiliates, such as variable products, fund of funds and 529 education savings plans, and affiliates of the Adviser may serve as sub-advisers to various funds in which case all advisory and sub-advisory fees generated by such funds stay within Nuveen.
Further, the funds may pay the Adviser and/or its affiliates for other services, such as distribution. In this regard, the Board Members considered that an affiliate of the Adviser serves as principal underwriter providing distribution and/or shareholder services to the open-end funds for which it may be compensated. In addition, the Board Members considered that the Adviser and Sub-Advisers may utilize soft dollar brokerage arrangements attributable to the respective funds to obtain research and other services for any or all of their clients, although the Board Members also considered reimbursements of such costs by the Adviser and/or applicable Sub-Adviser.
The Adviser and its affiliates may also benefit from the advisory relationships with the funds in the fund complex to the extent this relationship results in potential investors viewing the TIAA group of companies as a leading retirement plan provider in the academic and nonprofit market and a single source for all their financial service needs. The Adviser and/or its affiliates may further benefit to the extent that they have pricing or other information regarding vendors the funds utilize in establishing arrangements with such vendors for other products.
Based on its review, the Board concluded that any indirect benefits received by a Fund Adviser as a result of its relationship with the applicable Fund(s) were reasonable in light of the services provided.
F. Other Considerations
The Board Members did not identify any single factor discussed previously as all-important or controlling. The Board Members concluded that the terms of each Advisory Agreement were reasonable, that the respective Fund Adviser’s fees were reasonable in light of the services provided to each applicable Fund and that the Advisory Agreements be renewed for an additional one-year period.
PART II
Nuveen Core Plus Bond ETF
Nuveen Preferred and Income ETF
Nuveen Sustainable Core ETF
Nuveen Ultra Short Income ETF
The Approval Process
At the meeting held on February 27-29, 2024 (for purposes of this Part II, the “Meeting”), the Board considered and approved for each of Nuveen Core Plus Bond ETF (for purposes of this Part II, the “Core Plus Bond Fund”), Nuveen Preferred and Income ETF (for purposes of this Part II, the “Preferred and Income Fund”), Nuveen Sustainable Core ETF (for purposes of this Part II, the “Sustainable Core Fund”) and Nuveen Ultra Short Income ETF (for purposes of this Part II, the “Ultra Short Income Fund” and, together with the Core Plus Bond Fund, Preferred and Income Fund and Sustainable Core Fund, the “Funds” and each, a “Fund”), each a series of the Trust, the investment management agreement (for purposes of this Part II, each, an “Investment Management Agreement”) pursuant to which Nuveen Fund Advisors, LLC (for purposes of this Part II, the “Adviser”) serves as investment adviser to such Fund and the investment sub-advisory agreement (for purposes of this Part II, each, a “Sub-Advisory Agreement”) pursuant to which Nuveen Asset Management, LLC (for purposes of this Part II, the “Sub-Adviser”) serves as investment sub-adviser to such Fund. For purposes of this Part II, the Adviser and the Sub-Adviser are each hereafter a “Fund Adviser.” In addition, for purposes of this Part II, the Investment Management Agreements and the Sub-Advisory Agreements are each hereafter an “Advisory Agreement” and collectively, the “Advisory Agreements.” The Board Members oversee both a group of funds advised by the Adviser (the “Nuveen funds”) and a group of funds advised by Teachers Advisors, LLC (“TAL” and such funds, the “TC funds”), an affiliate of the Adviser, as the result of a consolidation of the boards of the Nuveen funds and the TC funds that became effective in January 2024.
To assist the Board in its evaluation of an Advisory Agreement with a Fund Adviser at the Meeting, the Board Members had received, in adequate time in advance of the Meeting and/or at prior meetings, materials which outlined, among other things:
| | • | | the nature, extent and quality of the services expected to be provided by the Fund Adviser; |
| | • | | the organization of the Fund Adviser, including the responsibilities of various departments and key personnel; |
| | • | | the expertise and background of the Fund Adviser; |
| | • | | certain performance-related information (as described below); |
| | • | | certain profitability-related information (as described below); |
| | • | | the proposed unified fee structure for the Funds, including comparisons of each Fund’s proposed unified fee with the net expense ratios of comparable funds; and |
| | • | | the soft dollar practices of the Fund Adviser, if any. |
9
Item 11. Statement Regarding Basis for Approval of Investment Advisory Contract (continued)
At the Meeting and/or at prior meetings, the Adviser made presentations to and responded to questions from the Board. During the Meeting and/ or at prior meetings, the Board Members also met privately with their legal counsel to, among other things, review the Board’s duties under the 1940 Act, the general principles of state law in reviewing and approving advisory contracts, the standards used by courts in determining whether investment company boards of directors have fulfilled their duties, factors to be considered in voting on advisory contracts and an adviser’s fiduciary duty with respect to advisory agreements and compensation. It is with this background that the Board Members considered the Advisory Agreements. As outlined in more detail below, the Board Members considered various factors they believed relevant with respect to the Funds. Each Board Member may have accorded different weight to the various factors and information discussed below in reaching his or her conclusions with respect to a Fund’s Advisory Agreements. As applicable, the Board Members also considered information they had received in their capacity as trustees or directors of other registered investment companies advised by the Fund Advisers.
A. Nature, Extent and Quality of Services
The Board Members considered the nature, extent and quality of the respective Fund Adviser’s services, including portfolio management services and administrative services. Given that the Adviser and the Sub-Adviser already serve as adviser and sub-adviser, respectively, to other Nuveen funds overseen by the Board Members, the Board has a good understanding of each such Fund Adviser’s organization, operations, personnel and services. As the Board meets regularly throughout the year to oversee the Nuveen funds, including funds currently advised by the Fund Advisers, Board Members may have, in part, relied upon their knowledge from their meetings and any other interactions throughout the year with the respective Fund Adviser in evaluating the Advisory Agreements.
The Board Members considered information about the structure, investment objective, investment strategy and other characteristics of each Fund and considered that in contrast to certain other exchange-traded funds (“ETFs”) advised by the Adviser, which seek to track the investment results of a specified underlying index (referred to as “Index ETFs”), each Fund would be actively managed.
At the Meeting and/or at prior meetings, the Board Members reviewed materials outlining, among other things, the respective Fund Adviser’s organization and business; the types of services that such Fund Adviser or its affiliates provide to the Nuveen funds (as applicable) and are expected to provide to the Funds; and the experience of the respective Fund Adviser. Further, at the Meeting and/or at prior meetings, with respect to each Fund, the Board Members have evaluated the background and experience of the relevant investment personnel.
The Board has considered that the Adviser provides a wide array of management, oversight and administrative services to manage and operate the Nuveen funds and that the scope and complexity of these services, along with the undertakings required of the Adviser in connection with providing these services, have expanded over time as a result of, among other things, regulatory, market and other developments. The Board has considered the Adviser’s dedication of resources, time, personnel and capital and commitment to continuing to develop improvements and innovations that seek to enhance the fund complex and meet the needs of the Nuveen funds in an increasingly complex regulatory environment. At the Meeting and/or at prior meetings, the Board received and considered information regarding, among other things, the Adviser’s investment oversight responsibilities, regulatory and compliance services, administrative duties and other services.
Given the Nuveen funds operate in a highly regulated industry, the Board has further considered the extensive compliance, regulatory and administrative services the Adviser and its various teams provide to manage and operate the Nuveen funds. The Board has considered that such services have included, but are not limited to, managing compliance policies; monitoring compliance with applicable policies, laws and regulations; devising internal compliance programs in seeking to enhance compliance with regulatory requirements and creating a framework to review and assess compliance programs; overseeing sub-adviser compliance testing; preparing compliance training materials; and responding to regulatory requests.
In addition to the above functions, the Board has considered the quality and extent of other non-advisory services the Adviser provides including, among other things, various fund administration services (such as preparing, overseeing or assisting with the preparation of tax and regulatory filings); product management services (such as evaluating and enhancing products and strategies); legal support services; shareholder services and transfer agency function oversight services; and board support and reporting services.
The Board Members considered that the Adviser would oversee the Sub-Adviser, which was generally expected to provide portfolio advisory services to the Funds. In addition, the Board Members considered the experience and expertise of the applicable investment team expected to manage each Fund.
Based on its review, the Board determined, in the exercise of its reasonable business judgment, that it was satisfied with the nature, extent and quality of services expected to be provided to the respective Fund under each applicable Advisory Agreement.
B. Investment Performance
Each Fund was new and, therefore, did not have its own performance history. The Board Members, however, were familiar with the performance records of other Nuveen funds advised by the Adviser and sub-advised by the Sub-Adviser. In addition, the Board Members were aware that the portfolio management team expected to manage the Preferred and Income Fund also managed a mutual fund advised by the Adviser that utilized an investment process that was generally comparable in certain respects to that anticipated for such Fund, and the portfolio management team expected to manage the Core Plus Bond Fund managed a mutual fund advised by TAL that utilized an investment process that was generally comparable in certain respects to that anticipated for such Fund (each of the foregoing mutual funds, a “Comparable Mutual Fund”). The Board Members reviewed certain historical performance-related data pertaining to each Comparable Mutual Fund. Further, with respect to each Fund, the Board Members reviewed certain historical performance-related data pertaining to various unaffiliated ETFs (and, in the case of the Sustainable Core Fund, unaffiliated mutual funds) that, based on information provided by the Adviser, were generally comparable in certain respects to the Fund.
10
C. Fees, Expenses and Profitability
In evaluating the management fees and expenses that each Fund was expected to bear, the Board Members considered that each Fund would pay the Adviser a single, all-inclusive (or unified) management fee for providing or paying for all services necessary for the management and operation of the Fund, subject to certain exceptions. Unlike the typical fee arrangements of other funds in which the funds pay a variety of fees and expenses such as investment advisory fees, transfer agency fees, audit fees, custodian fees, administration fees, compliance expenses, recordkeeping expenses, marketing and shareholder service fees, distribution charges and other expenses, the Nuveen ETFs pay the Adviser a unified fee, and the Adviser is responsible for providing such services or arranging and supervising third parties to provide such services (subject to the certain exceptions). In this regard, the Board Members were provided with estimates of each Fund’s anticipated operating expenses as well as a description of the expenses excluded from the unified fee. In considering the proposed unified fee structure, the Board Members considered that the Adviser would generally bear the risk that certain of the Funds’ operating expenses would increase (but would also benefit if such expenses decrease) and the degree of expense stability that would be afforded to the Funds’ shareholders.
In their review, with respect to each Fund, the Board Members considered, among other things, the Fund’s proposed unified fee compared to expense data relating to the actively managed ETFs included in an anticipated peer group (each, a “Peer Group”). Because each Fund will pay a unified fee, the Board determined that net expense ratios were the most relevant comparative data point. With respect to each Fund, the Board Members considered the range of net expense ratios as well as the average net expense ratio of the ETFs comprising the applicable Peer Group. With respect to each Fund, the Board Members also considered the quartile of the Peer Group in which the Fund was expected to be ranked, based on its expected net expense ratio (with the first quartile representing the range of funds with the lowest net expense ratio and the fourth quartile representing the range of funds with the highest net expense ratio). In addition, with respect to each Fund, the Board Members reviewed expense data relating to a subset of the ETFs in the applicable Peer Group that the Adviser viewed as most relevant to the Fund (each such ETF, a “Comparable Active ETF”). This data included, among other things, for each Comparable Active ETF, its net expense ratio, its assets under management, and, to the extent available, a list of expenses excluded from its unified fee. With respect to the Preferred and Income Fund and the Core Plus Bond Fund, the Board Members also reviewed information regarding the management fee and net expense ratio of the corresponding Comparable Mutual Fund. Further, the Board Members considered the proposed sub-advisory fee for each Fund, which will be paid by the Adviser out of its unified fee.
Based on its review of the fee and expense information provided, the Board Members determined that each Fund’s proposed management fees (as applicable) to a Fund Adviser were reasonable in light of the nature, extent and quality of services expected to be provided to the Fund.
| 2. | Comparisons with the Fees of Other Clients |
The Board has considered, at the Meeting and/or at prior meetings, that the Fund Advisers provide services to various types of clients. In this regard, the Board has considered information regarding the fee rates that the respective Fund Advisers charge to certain other types of clients and the types of services provided to these other clients. With respect to the Adviser and/or the Sub-Adviser, such other clients may include: retail and institutional managed accounts sub-advised by the Sub-Adviser; hedge funds or other structured products managed by the Sub-Adviser; investment companies offered outside the Nuveen family and sub-advised by the Sub-Adviser; foreign investment companies offered by Nuveen and sub-advised by the Sub-Adviser; and collective investment trusts sub-advised by the Sub-Adviser. The Board has further considered that the Adviser also advises, and the Sub-Adviser sub-advises, certain additional ETFs sponsored by Nuveen. The Board considered that the Sub-Adviser is an affiliated sub-adviser and, with respect to affiliated sub-advisers, has reviewed, among other things, the range of fees assessed for managed accounts, hedge funds (along with their performance fee), foreign investment companies and ETFs offered by Nuveen, as applicable. The Board has also reviewed the fee range and average fee rate of certain selected investment strategies offered in retail and institutional managed accounts sub-advised by the Sub-Adviser, the hedge funds advised by the Sub-Adviser (along with their performance fee) and non-Nuveen investment companies sub-advised by certain affiliated sub-advisers.
11
Item 11. Statement Regarding Basis for Approval of Investment Advisory Contract (continued)
In considering the comparative fee data, the Board has considered that differences, including but not limited to, the amount, type and level of services provided by the Adviser to the Nuveen funds compared to that provided to other clients as well as differences in investment policies; eligible portfolio assets and the manner of managing such assets; product structure; investor profiles; account sizes; and regulatory requirements contribute to the variations in the fee schedules. Similarly, differences in the client base, governing bodies, distribution jurisdiction and operational complexities would also contribute to variations in management fees assessed the Nuveen funds compared to foreign fund clients. Further, with respect to ETFs, the Board has considered that the Index ETFs are passively managed compared to the active management of other Nuveen funds, which has also contributed to the differences in fee levels between such Index ETFs and the actively managed funds. The Board has considered the wide range of services in addition to investment management that the Adviser provides to the Nuveen funds compared to other types of clients as well as the increased entrepreneurial, legal and regulatory risks that the Adviser incurs in sponsoring and managing the Nuveen funds. In general, higher fee levels reflect higher levels of service provided by the Adviser, increased investment management complexity, greater product management requirements, and higher levels of business risk or some combination of these factors. The Board has further considered that the Sub-Adviser’s fee is essentially for portfolio management services and therefore more comparable to the fees it receives for retail wrap accounts and other external sub-advisory mandates. The Board has considered that the varying levels of fees are justified given, among other things, the more extensive services, regulatory requirements and legal liabilities, and the entrepreneurial, legal and regulatory risks incurred in sponsoring and advising a registered investment company compared to that required in advising other types of clients.
| 3. | Profitability of Fund Advisers |
In conjunction with their review of fees, at the Meeting and/or at prior meetings, the Board Members have considered profitability and other financial data for Nuveen, including estimated profitability information of Nuveen as a result of its advisory services to the Nuveen funds as well as profitability data of certain other asset management firms. Such profitability information has included, among other things, gross and net revenue margins (excluding distribution) of Nuveen Investments, Inc. (“Nuveen Investments”) for services to the Nuveen funds on a pre-tax and after-tax basis for the 2022 and 2021 calendar years as well as the revenues earned (less any expense reimbursements/fee waivers) and expenses incurred by Nuveen Investments for its advisory activities to the Nuveen funds (excluding distribution and certain other expenses) for the 2022 and 2021 calendar years. The Board Members have also considered a summary of some of the key factors that impacted Nuveen’s profitability in 2022. In addition, the Board has considered the revenues, expenses and operating margin (pre- and after-tax) the Adviser derived from its ETF product line for the 2022 and 2021 calendar years.
In developing the profitability data of the Adviser for its advisory services to the Nuveen funds, the Board Members have considered the subjective nature of calculating profitability as the information is not audited and is necessarily dependent on cost allocation methodologies to allocate expenses throughout the complex and among the various advisory products. Given there is no single universally recognized expense allocation methodology and that other reasonable and valid allocation methodologies could be employed and could lead to significantly different results, the Board has reviewed, among other things, a description of the cost allocation methodologies employed to develop the financial information, a summary of the history of changes to the methodology over the years from 2010 through 2022, and a historical expense analysis of Nuveen Investments’ revenues, expenses and pre-tax net revenue margins derived from its advisory services to the Nuveen funds (excluding distribution) for the calendar years from 2017 through 2022. The Board had also appointed four Board Members to serve as the Board’s liaisons, with the assistance of independent counsel, to meet with representatives of the Adviser and review the development of the profitability data and to report to the full Board.
In addition, the Board has considered certain comparative operating margin data. In this regard, the Board has reviewed the operating margins of Nuveen Investments compared to the adjusted operating margins of a peer group of asset management firms with publicly available data and the most comparable assets under management (based on asset size and asset composition) to Nuveen. The Board has considered that the operating margins of the peers were adjusted generally to address that certain services provided by the peers were not provided by Nuveen. The Board has also reviewed, among other things, the net revenue margins (pre-tax) of Nuveen Investments on a company-wide basis and the net revenue margins (pre-tax) of Nuveen Investments derived from its services to the Nuveen funds only (including and excluding distribution) compared to the adjusted operating margins of the peer group for each calendar year from 2012 to 2022. Although the total company operating margins of Nuveen Investments were in the bottom half of the peer group range for 2022 and 2021, the Board Members have considered the limitations of the comparative data given that peer data is not generally public and the calculation of profitability is subjective and affected by numerous factors (such as types of funds a peer manages, its business mix, its cost of capital, the numerous assumptions underlying the methodology used to allocate expenses and other factors) that can have a significant impact on the results.
Aside from Nuveen’s profitability, the Board has considered that the Adviser is a subsidiary of Nuveen, LLC, the investment management arm of Teachers Insurance and Annuity Association of America (“TIAA”). Accordingly, the Board has also reviewed a balance sheet for TIAA reflecting its assets, liabilities and capital and contingency reserves for the 2022 and 2021 calendar years to consider the financial strength of TIAA. The Board has considered the benefit of an investment adviser and its parent with significant resources, particularly during periods of market volatility. The Board has also considered the reinvestments Nuveen, its parent and/or other affiliates have made into its business through, among other things, the investment of seed capital in certain Nuveen funds and continued investments in enhancements to technological capabilities.
12
In addition to Nuveen, the Board Members have considered the profitability of the Sub-Adviser from its relationships with the respective Nuveen funds. In this regard, the Board Members have reviewed, among other things, the Sub-Adviser’s revenues, expenses and net revenue margins (pre- and after-tax) for its advisory activities to the respective Nuveen funds for the calendar years ended December 31, 2022 and December 31, 2021. The Board Members have also reviewed a profitability analysis reflecting the revenues, expenses and revenue margin (pre- and after-tax) by asset type for the Sub-Adviser for the calendar years ending December 31, 2022 and December 31, 2021.
In evaluating the reasonableness of the compensation, the Board Members have also considered any other ancillary benefits derived by the respective Fund Adviser from its relationship with the Nuveen funds as discussed in further detail below.
Based on its consideration of the information provided, the Board was satisfied that Nuveen’s and the Sub-Adviser’s level of profitability was acceptable and not unreasonable in light of the services to be provided.
D. Economies of Scale and Whether Fee Levels Reflect These Economies of Scale
The Board considered whether the Funds could be expected to benefit from any economies of scale. The Board has considered that although economies of scale are difficult to measure and certain expenses may not decline with a rise in assets, there are several methods to help share the benefits of economies of scale, including breakpoints in the management fee schedule, fee waivers and/or expense limitations, the pricing of Nuveen funds at scale at inception and investments in Nuveen’s business which can enhance the services provided to the Nuveen funds for the fees paid. The Board has considered that with respect to the Nuveen funds generally, although the management fee of the Adviser is typically comprised of a fund-level component and a complex-level component, each with its own breakpoint schedule, the Nuveen ETFs do not have breakpoint schedules and do not participate in the complex-level fee program. Similarly, the Funds will not have breakpoint schedules, participate in the complex-level fee program or have expense limitation agreements given that, as described above, the Adviser will generally pay the operating expenses of each Fund (subject to certain exceptions) under the unified fee structure. The Board also considered that the Adviser would benefit from any reduction in fixed costs associated with the management of the Funds, but that the unified fee schedule provides shareholders with a level of certainty of the expenses of a Fund. Further, the Board Members considered that the Funds’ unified fee structure generally provides inherent economies of scale because a Fund would maintain a relatively fixed fee over a given time period even if its assets declined and/or operating expenses rose. The Board Members also considered the Adviser’s representation that the Funds were being priced using an at-scale approach.
Based on its review, with respect to each Fund, the Board was satisfied that the proposed fee arrangements would appropriately share any economies of scale with the Fund’s shareholders.
E. Indirect Benefits
At the Meeting and/or prior meetings, the Board Members have received and considered information regarding other benefits the respective Fund Adviser or its affiliates may receive as a result of their relationship with the Nuveen funds. In addition, the Board Members have considered that the Adviser and Sub-Adviser may utilize soft dollar brokerage arrangements attributable to the respective Nuveen funds to obtain research and other services for any or all of their clients, although the Board Members have also considered reimbursements of such costs by the Adviser and/or Sub- Adviser.
Based on its review, the Board concluded that any indirect benefits expected to be received by a Fund Adviser as a result of its relationship with the Funds were reasonable in light of the services expected to be provided.
F. Approval
The Board Members did not identify any single factor discussed previously as all-important or controlling. With respect to each Fund, the Board Members concluded that the terms of the applicable Investment Management Agreement and Sub-Advisory Agreement were reasonable, that the Fund Advisers’ fees were reasonable in light of the services expected to be provided to the Fund, and that the applicable Investment Management Agreement and Sub-Advisory Agreement should be and were approved on behalf of the Fund.
13
| Item 12. | Disclosure of Proxy Voting Policies and Procedures for Closed-End Management Investment Companies. |
Not applicable to open-end investment companies.
| Item 13. | Portfolio Managers of Closed-End Management Investment Companies. |
Not applicable to open-end investment companies.
| Item 14. | Purchases of Equity Securities by Closed-End Management Investment Company and Affiliated Purchasers. |
Not applicable to open-end investment companies.
| Item 15. | Submission of Matters to a Vote of Security Holders. |
There have been no material changes to the procedures by which shareholders may recommend nominees to the registrant’s Board of Trustees implemented after the registrant last provided disclosure in response to this Item.
| Item 16. | Controls and Procedures. |
| (a) | The registrant’s principal executive and principal financial officers, or persons performing similar functions, have concluded that the registrant’s disclosure controls and procedures (as defined in Rule 30a-3(c) under the Investment Company Act of 1940, as amended (the “1940 Act”) (17 CFR 270.30a-3(c))) are effective, as of a date within 90 days of the filing date of this report that includes the disclosure required by this paragraph, based on their evaluation of the controls and procedures required by Rule 30a-3(b) under the 1940 Act (17 CFR 270.30a-3(b)) and Rules 13a-15(b) or 15d-15(b) under the Securities Exchange Act of 1934, as amended (the “Exchange Act”) (17 CFR 240.13a-15(b) or 240.15d-15(b)). |
| (b) | There were no changes in the registrant’s internal control over financial reporting (as defined in Rule 30a-3(d) under the 1940 Act (17 CFR 270.30a-3(d)) that occurred during the period covered by this report that has materially affected, or is reasonably likely to materially affect, the registrant’s internal control over financial reporting. |
| Item 17. | Disclosure of Securities Lending Activities for Closed-End Management Investment Companies. |
| (a) | Not applicable to open-end investment companies. |
| (b) | Not applicable to open-end investment companies. |
| Item 18. | Recovery of Erroneously Awarded Compensation. |
| (a)(1) | Not applicable because the code of ethics is available, upon request and without charge, by calling 800-257-8787 and there were no amendments during the period covered by this report. |
SIGNATURES
Pursuant to the requirements of the Securities Exchange Act of 1934 and the Investment Company Act of 1940, the registrant has duly caused this report to be signed on its behalf by the undersigned, thereunto duly authorized.
Nushares ETF Trust
| | | | | | |
| Date: October 4, 2024 | | By: | | /s/ Briton Ryan | | |
| | | | Briton Ryan Chief Administrative Officer | | |
Pursuant to the requirements of the Securities Exchange Act of 1934 and the Investment Company Act of 1940, this report has been signed below by the following persons on behalf of the registrant and in the capacities and on the dates indicated.
| | | | | | |
| Date: October 4, 2024 | | By: | | /s/ Briton Ryan | | |
| | | | Briton Ryan Chief Administrative Officer (principal executive officer) | | |
| | | |
| Date: October 4, 2024 | | By: | | /s/ E. Scott Wickerham | | |
| | | | E. Scott Wickerham Vice President and Controller (principal financial officer) | | |