| | OMB APPROVAL |
| | OMB Number: | 3235-0570 |
| | Expires: | January 31, 2017 |
| UNITED STATES | Estimated average burden hours per response. . . . . . . . . . . . . . .20.6 |
| SECURITIES AND EXCHANGE COMMISSION | |
| Washington, D.C. 20549 | |
FORM N-CSR
CERTIFIED SHAREHOLDER REPORT OF REGISTERED
MANAGEMENT INVESTMENT COMPANIES
Investment Company Act file number | 811-23037 |
|
Tekla World Healthcare Fund |
(Exact name of registrant as specified in charter) |
|
100 Federal Street, 19th Floor, Boston, MA | | 02110 |
(Address of principal executive offices) | | (Zip code) |
|
|
(Name and address of agent for service) |
|
Registrant’s telephone number, including area code: | 617-772-8500 | |
|
Date of fiscal year end: | September 30 | |
|
Date of reporting period: | October 1, 2015 to March 31, 2016 | |
| | | | | | | | | |
ITEM 1. REPORTS TO STOCKHOLDERS.
TEKLA WORLD
HEALTHCARE FUND

Semiannual Report
March 31, 2016
(Unaudited)
TEKLA WORLD
HEALTHCARE FUND
DISTRIBUTION POLICY
The Fund has implemented a managed distribution policy (the Policy) that provides for monthly distributions at a rate set by the Board of Trustees. Under the current Policy, the Fund intends to make monthly distributions at a rate of $0.1167 per share to shareholders of record. The Fund intends to use net investment income and net realized capital gains when making monthly distributions, if available, but the Policy would result in a return of capital to shareholders, if the amount of the distribution exceeds the Fund's net investment income and realized capital gains. With each distribution, the Fund will issue a notice to shareholders and a press release with detailed information regarding the amount and estimated composition of the distribution. You should not draw any conclusions about the Fund's investment performance from the amount of distributions pursuant to the Policy or from the terms of the Fund's Policy. The Policy has been established by the Trustees and may be changed or terminated by them without shareholder approval. The Trustees regularly review the Policy and the frequency and rate of distribution considering the purpose and effect of the Policy, the financial market environment, and the Fund's income, capital gains and capital available to pay distributions. The suspension or termination of the Policy could have the effect of creating a trading discount or widening an existing trading discount. At this time there are no reasonably foreseeable circumstances that might cause the Trustees to terminate the Policy.

To our Shareholders:
On March 31, 2016, the net asset value (NAV) per share of the Fund was $15.56. During the six month period ended March 31, 2016, total return at NAV of the Fund was -6.08%, with distributions reinvested. The total investment return at market with distributions reinvested was 2.35% during the same period. Comparisons to the relevant indices are listed below.
| Investment Returns | | Six Months
Ended 3/31/16 | |
At Market | | | 2.35 | % | |
At Net Asset Value | | | -6.08 | % | |
S&P 500 Index | | | 8.48 | % | |
MSCI World Healthcare Index | | | -0.03 | % | |
Investment Highlights
Despite several challenges in recent months, we continue to be cautiously optimistic about the future of the healthcare and biotech sectors. As we have noted, the longer term secular fundamentals in these industries remain appealing. People spend more money on healthcare as they age and, as has been widely reported, our population is getting older. This combination suggests that demand for healthcare services should continue to rise well into the future. Furthermore, development of new and novel products continues unabated. In the last several years, we have observed a spate of healthcare IPOs and private investment by traditional limited partners. This has produced a new generation of companies poised to develop and market products based on recent scientific discoveries that will treat unmet medical needs, thereby improving the quality of life for and/or extend the lives of patients.
For most of the last seven years these fundamental factors have led to outsized performance by the healthcare sector in general and the biotech sector in particular. As an example, the biotech sector, as measured by the NASDAQ Biotechnology Index (NBI), has, since its March 2009 low amidst the great financial crisis through its mid-2015 market highs, advanced by approximately 500% compared with an approximate 213% advance for the broad market S&P 500 Index. This represented an impressive period for the biotech sector, measured both by the magnitude of the sector's advance as well as by the duration of the outperformance.
Having said this, since the mid-2015 market highs, performance of the biotech sector has been uneven. As we reported in the Fund's
1
2015 Annual Report, the biotech sector underperformed the broader market in the calendar quarter ending September 30, 2015. In that three month period, the NBI declined by approximately 17.9% compared to a decline of approximately 6.4% for the broad market. The NBI had appeared to stabilize in October and November 2015, but ultimately extended the decline that began in mid-2015. In fact, during the current reporting period (i.e., the six month period ended March 31, 2016), the NBI declined an additional 13.8%, mostly during January 2016. In aggregate, the NBI declined approximately 29.8% from the July 2015 highs to the end of the current report period. This decline has certainly been material. However, despite the decline, it is clear we argue that the performance of the NBI has been impressive over the longer term.
Chart Below: NBI (black) Versus S&P 500 Index (blue) March 15, 2009 through March 31, 2016

Chart Below: NBI (black) Versus S&P 500 Index (blue) Sept 30, 2015 through March 31, 2016

2
Given recent performance, we think it is appropriate to comment on the current status of the factors we feel have driven sector performance in recent years and those that might have an impact in the near and intermediate future.
We believe that in recent years, population demographics and passage of the Affordable Care Act have increased demand and utilization of Healthcare products and services. Growth in the Healthcare and Biotech sectors had been consistently projected as elevated relative to many other sectors and valuations (particularly on a growth adjusted basis) had seemed to be attractive. In addition, Merger & Acquisition (M&A) activity had been notable, as had new IPO and follow-on financing activity. It is our view that these factors, in combination with accommodative monetary policies, had contributed to the equity performance in general and healthcare/biotech equity performance in particular.
However, in 2015, several mitigating factors have become more prominent. For example, a handful of US drug manufacturers had taken considerable liberties in pricing some of their drugs. As a result, concerns about drug pricing have become generally more common and have become a point of contention in the current US Presidential election discussion. Separately, M&A activity, an important contributor to sector sentiment, has been questioned, particularly for those transactions involving tax inversion. In addition, after several years of outperformance, valuations which we feel had remained attractive, have been considered stretched by others. It is our view that in combination, these and other factors have contributed to the sector downturn seen in the six to nine-month periods ending March 31, 2016. We also note that heightened IPO and follow-on financing activity, additional contributors to positive sentiment, also declined in this period.
The critical question is where are we now? Unfortunately the answer is that one can never know what will happen and that there will always be both encouraging and mitigating factors. But at the moment we think there are more things that make us optimistic than there are that give us pause.
In the near term, we think that the status of the political environment continues to be a significant factor in sentiment toward healthcare/biotech sectors. While we would point out that the vast majority of prescriptions are for relatively low cost generics and that (according to PHRMA) the percentage of each US healthcare dollar spent on drugs has not materially changed in many years, it also appears that out-of-pocket spending on drugs is increasing,
3
particularly on the approximately 10% of prescriptions written on branded drugs. These latter impressions appear to be an important topic in the current presidential election discussion. As a result there has been considerable commentary by presidential candidates and others about methods they can or will use to control growth of drug pricing. It is our view that political pressure to control price increase will continue but that the actual impact of current campaign rhetoric will be moderate. Moreover, it appears to us that in recognition of pricing concerns, thoughtful approaches (e.g. value based pricing approaches wherein the cost of a drug is linked to its effectiveness) are being introduced by the pharmaceutical industry.
On the other hand, there are quite a few factors that cause us, in aggregate, to remain generally optimistic. Population demographics and ACA-driven utilization that have each increased demand for healthcare products and services remain positive factors. We continue to think that growth drives price. And while growth of the US economy has generally been weak in recent years, expected growth rates in our sector, particularly in biotech, remain solid. And after the significant pullback described above, valuations have become more attractive of late.
It appears the pullback that has occurred in the last nine months or so has had a negative effect on sentiment. In addition, the matters described above have had an impact on the frequency of IPOs and related financings. The deal-a-day frenzy of the last couple years has diminished. But we are optimistic that we see signs of a reversal in sentiment. As we write this note in late April 2016, the NBI has been stable or up in the last couple of months, valuations are more attractive than they have been in some time, we are seeing the re-emergence of several interesting IPOs, and we are anticipating both the completion of the US Presidential cycle and the arrival of some important clinical and regulatory events in the second half of 2016. M&A activity may also be picking up. We think this combination of events could on balance improve sentiment and ultimately drive the healthcare/biotech sector upwards. We caution that ours is a volatile sector and that there could be negative events contrary to our expectation, but in general we remain cautiously optimistic.
Portfolio Highlights
THW seeks to invest globally in both the equity of healthcare companies and a variety of income producing assets associated with healthcare companies. The Fund emphasizes investment in most subsectors within the healthcare industry, with an emphasis on
4
innovation. At the current time we favor the biotech sector and are overweight this subsector relative to the Fund's narrow benchmark, the MSCI World Healthcare Index. In addition, in order to address our innovation emphasis, THW has by design invested an overweight position in small to medium sized companies relative the benchmark. In recent months while Fund market performance has tracked or exceeded the benchmark, NAV performance has trailed the benchmark, in part due to poor performance of the biotech sector in general and of the small to mid cap sector of the market in particular. Given both the growth and income objectives of the Fund and the intended biotech/innovation goals of the Fund, in contrast to the pure equity characteristics of the benchmark, we expect that there will be periods where performance of the Fund will differ from that of the benchmark. For example, in periods when the MSCI World Healthcare Index advances materially, we would not expect the performance of the Fund, which holds a considerable portion of its assets in corporate debt and other income producing investments, to necessarily track the performance of the benchmark. This would be especially true in low interest rate environments such as exists currently. Given this situation we are evaluating a variety of alternate or hybrid performance metrics against which Fund performance might additionally (or alternatively) be compared.
With respect to its equity portfolio, the Fund was impacted during the current report period by its ownership or non-ownership (relative to its benchmark) of a number of individual stocks. In the current report period, the Fund benefitted from its ownership or overweight positions in Healthcare Realty Trust, Ono Pharmaceuticals and Genmab A/S. It also benefitted from not owning or being underweight Novartis AG, Sanofi and Celgene Corporation. Conversely, the Fund was negatively affected by owning or being overweight Puma Biotechnologies, Ardelyx Inc, Endo International, Flamel Technologies and Shire PLC. The Fund was also negatively affected by being underweight Johnson and Johnson.
Investment Changes
During the six month period ended March 31, 2016, within the public portfolio, the Fund established positions in several companies including Sanofi, AstraZeneca PLC, Teva Pharmaceutical Industries Ltd., Celgene Corporation, Incyte Corporation , Eli Lilly & Co., Flamel Technologies SA, Valeant Pharmaceuticals International, Inc., and BeiGene Ltd. During the same six month period, the Fund exited positions in several companies including Syngenta AG, GW
5
Pharmaceuticals PLC, Ono Pharmaceutical Industries Ltd., Actelion Ltd, The Medicines Company, Alnylam Pharmaceuticals, Inc. and Isis Pharmaceuticals, Inc.
During the same six month period, within the venture portfolio, the Fund made initial investments in GenomeDx Biosciences, Inc., and BioClin Therapeutics, Inc. and IlluminOss Medical, Inc.
As always, if you have questions, please feel free to call us at (617) 772-8500.

Daniel R. Omstead, PhD
President
6
TEKLA WORLD
HEALTHCARE FUND
LARGEST HOLDINGS BY ISSUER
(Excludes Short-Term Investments)
As of March 31, 2016 (Unaudited)
| Issuer - Sector | | % of Net Assets | |
| Gilead Sciences, Inc. - Biotechnology | | | 4.8 | % | |
| Allergan plc - Pharmaceuticals | | | 4.1 | % | |
| Medtronic plc - Health Care Equipment & Supplies | | | 3.6 | % | |
| Novo Nordisk A/S - Pharmaceuticals | | | 3.3 | % | |
| SPDR S&P Biotech ETF - Health Care | | | 3.1 | % | |
| Roche Holding AG - Pharmaceuticals | | | 3.0 | % | |
| Biogen Inc. - Biotechnology | | | 2.7 | % | |
| Sanofi - Pharmaceuticals | | | 2.5 | % | |
| GlaxoSmithKline plc - Pharmaceuticals | | | 2.4 | % | |
| UCB SA - Pharmaceuticals | | | 2.2 | % | |
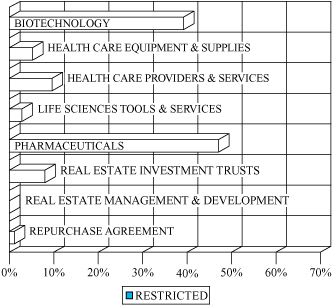
SECTOR DIVERSIFICATION (% of Net Assets)
As of March 31, 2016 (Unaudited)
COUNTRY DIVERSIFICATION
As of March 31, 2016 (Unaudited) | | % of Net Assets | |
Australia | | | 0.6 | % | |
Belgium | | | 4.0 | % | |
China | | | 0.7 | % | |
Denmark | | | 5.7 | % | |
France | | | 6.2 | % | |
Germany | | | 1.6 | % | |
Ireland | | | 16.8 | % | |
Israel | | | 3.9 | % | |
Netherlands | | | 2.9 | % | |
Spain | | | 0.5 | % | |
Switzerland | | | 5.2 | % | |
United Kingdom | | | 6.6 | % | |
United States | | | 58.3 | % | |
7
TEKLA WORLD
HEALTHCARE FUND
SCHEDULE OF INVESTMENTS
MARCH 31, 2016
(Unaudited)
PRINCIPAL
AMOUNT | | NON-CONVERTIBLE NOTES -
18.0% of Net Assets | | VALUE | |
| | | Ireland - 1.4% | |
$ | 3,000,000 | | | Endo Ltd/Endo Finance LLC/Endo Finco Inc.,
6.00% due 2/1/2025 | | $ | 2,812,500 | | |
| | 4,000,000 | | | Grifols Worldwide Operations Ltd.,
5.25% due 4/1/2022 | | | 4,110,000 | | |
| | | | 6,922,500 | | |
| | | United Kingdom - 0.8% | |
| | 4,000,000 | | | Hikma Pharmaceuticals PLC,
4.25% due 4/10/2020 | | | 3,985,000 | | |
| | | United States - 15.8% | |
| | 3,200,000 | | | AbbVie Inc., 4.50% due 5/14/2035 | | | 3,324,829 | | |
| | 4,100,000 | | | Actavis Funding SCS, 4.55% due 3/15/2035 | | | 4,224,271 | | |
| | 2,000,000 | | | Amgen Inc., 3.63% due 5/22/2024 | | | 2,104,056 | | |
| | 4,000,000 | | | Amgen Inc., 5.15% due 11/15/2041 | | | 4,414,184 | | |
| | 2,890,000 | | | Amsurg Corporation, 5.63% due 7/15/2022 | | | 2,976,700 | | |
| | 2,790,000 | | | Baxalta Inc., 4.00% due 6/23/2025 | | | 2,835,248 | | |
| | 1,200,000 | | | Becton Dickinson and Co.,
3.73% due 12/15/2024 | | | 1,277,526 | | |
| | 3,000,000 | | | DaVita HealthCare Partners Inc.,
5.00% due 5/1/2025 | | | 2,970,000 | | |
| | 4,000,000 | | | EMD Finance LLC, 3.25% due 3/19/2025 | | | 3,994,724 | | |
| | 1,385,000 | | | Express Scripts Holding Co.,
3.50% due 6/15/2024 | | | 1,372,679 | | |
| | 3,000,000 | | | Gilead Sciences, Inc., 4.60% due 9/1/2035 | | | 3,255,924 | | |
| | 2,000,000 | | | GlaxoSmithKline Capital Inc.,
2.80% due 3/18/2023 | | | 2,073,970 | | |
| | 1,200,000 | | | HCA Inc., 5.25% due 4/15/2025 | | | 1,236,000 | | |
| | 2,500,000 | | | HCA Inc., 5.38% due 2/1/2025 | | | 2,527,350 | | |
| | 2,000,000 | | | HCA Inc., 5.88% due 5/1/2023 | | | 2,097,500 | | |
| | 2,630,000 | | | HCP Inc., 4.20% due 3/1/2024 | | | 2,595,779 | | |
| | 3,000,000 | | | HealthSouth Corp, 5.75% due 11/01/24 | | | 3,039,000 | | |
| | 4,500,000 | | | Horizon Pharma Financing Inc.,
6.63% due 5/1/2023 | | | 3,971,250 | | |
| | 5,000,000 | | | Mallinckrodt International Finance SA/
Mallinckrodt CB LLC, 5.50% due 4/15/2025 | | | 4,412,500 | | |
| | 1,200,000 | | | McKesson Corp., 3.80% due 3/15/2024 | | | 1,252,658 | | |
| | 1,200,000 | | | Medtronic Inc., 4.38% due 3/15/2035 | | | 1,299,152 | | |
| | 1,463,000 | | | Merck & Co., Inc., 2.75% due 2/10/2025 | | | 1,497,648 | | |
| | 2,115,000 | | | Novartis Capital Corp., 3.40% due 5/6/2024 | | | 2,268,896 | | |
The accompanying notes are an integral part of these financial statements.
8
TEKLA WORLD
HEALTHCARE FUND
SCHEDULE OF INVESTMENTS
MARCH 31, 2016
(Unaudited, continued)
PRINCIPAL
AMOUNT | | United States - continued | | VALUE | |
$ | 4,000,000 | | | Omega Healthcare Investors, Inc.,
5.88% due 3/15/2024 | | $ | 4,142,260 | | |
| | 3,500,000 | | | Senior Housing Properties Trust,
4.75% due 5/1/2024 | | | 3,391,007 | | |
| | 3,000,000 | | | Tenet Healthcare Corp.,
6.75% due 6/15/2023 | | | 2,872,500 | | |
| | 5,000,000 | | | Zimmer Biomet Holdings, Inc.,
4.25% due 8/15/35 | | | 4,882,215 | | |
| | | | 76,309,826 | | |
| | | | | TOTAL NON-CONVERTIBLE NOTES
(Cost $86,146,839) | | | 87,217,326 | | |
| | SHARES | | | CONVERTIBLE SECURITIES - 0.8% | | | | | |
| | | Convertible Preferred Stock (Restricted) (b) - 0.8% | | | |
| | | Netherlands - 0.2% | |
| | 149,396 | | | Merus B.V. Class C (c) | | | 1,132,185 | | |
| | | United States - 0.6% | |
| | 754,437 | | | BioClin Therapeutics, Inc. Series A | | | 490,384 | | |
| | 1,333,333 | | | GenomeDx Biosciences, Inc. Series C | | | 2,000,000 | | |
| | 101,478 | | | IlluminOss Medical, Inc. Series AA | | | 101,478 | | |
| | 206,483 | | | IlluminOss Medical, Inc. Series
Junior Preferred | | | 206,483 | | |
| | | | 2,798,345 | | |
| | | | | TOTAL CONVERTIBLE SECURITIES
(Cost $3,698,017) | | | 3,930,530 | | |
| | | MANDATORY CONVERTIBLE PREFERRED STOCK - 1.3% | |
| | | Israel - 1.3% | |
| | 7,000 | | | Teva Pharmaceutical Industries Ltd.,
7.00% due 12/15/2018 | | | 6,187,580 | | |
| | | | | TOTAL MANDATORY CONVERTIBLE
PREFERRED STOCK
(Cost $7,000,000) | | | 6,187,580 | | |
The accompanying notes are an integral part of these financial statements.
9
TEKLA WORLD
HEALTHCARE FUND
SCHEDULE OF INVESTMENTS
MARCH 31, 2016
(Unaudited, continued)
SHARES | | COMMON STOCKS - 88.7% | | VALUE | |
| | | Australia - 0.6% | |
| | 38,000 | | | CSL Limited | | $ | 2,954,836 | | |
| | | Belgium - 4.0% | |
| | 199,100 | | | Galapagos NV (b) | | | 8,380,301 | | |
| | 142,500 | | | UCB SA | | | 10,903,015 | | |
| | | | 19,283,316 | | |
| | | China - 0.7% | |
| | 116,707 | | | BeiGene Ltd (b) | | | 3,420,682 | | |
| | | Denmark - 5.7% | |
| | 136,547 | | | Forward Pharma A/S (b) | | | 2,321,299 | | |
| | 29,800 | | | Genmab A/S (b) | | | 4,129,724 | | |
| | 294,600 | | | Novo Nordisk A/S | | | 15,964,374 | | |
| | 245,077 | | | Zealand Pharma A/S (b) | | | 5,052,362 | | |
| | | | 27,467,759 | | |
| | | France - 6.2% | |
| | 270,250 | | | Cellectis S.A. (b) | | | 7,431,875 | | |
| | 65,600 | | | DBV Technologies S.A. (b) | | | 2,135,280 | | |
| | 391,288 | | | Flamel Technologies SA (b) | | | 4,319,820 | | |
| | 300,000 | | | Innate Pharma SA (b) | | | 4,154,472 | | |
| | 305,000 | | | Sanofi | | | 12,248,800 | | |
| | | | 30,290,247 | | |
| | | Germany - 1.6% | |
| | 65,300 | | | Bayer AG | | | 7,675,692 | | |
| | | Ireland - 15.4% | |
| | 114,173 | | | Alkermes plc (b) | | | 3,903,575 | | |
| | 74,500 | | | Allergan plc (b) | | | 19,968,235 | | |
| | 110,248 | | | Endo International plc (b) | | | 3,103,481 | | |
| | 162,900 | | | Horizon Pharma plc (b) | | | 2,699,253 | | |
| | 114,900 | | | ICON plc (b) | | | 8,628,990 | | |
| | 61,900 | | | Mallinckrodt plc (b) | | | 3,793,232 | | |
| | 230,484 | | | Medtronic plc | | | 17,286,300 | | |
| | 37,300 | | | Perrigo Company plc | | | 4,771,789 | | |
| | 60,513 | | | Shire plc | | | 10,402,185 | | |
| | | | 74,557,040 | | |
| | | Israel - 2.6% | |
| | 552,265 | | | Foamix Pharmaceuticals Ltd. (b) | | | 3,600,768 | | |
| | 169,000 | | | Teva Pharmaceutical Industries Ltd. | | | 9,043,190 | | |
| | | | 12,643,958 | | |
The accompanying notes are an integral part of these financial statements.
10
TEKLA WORLD
HEALTHCARE FUND
SCHEDULE OF INVESTMENTS
MARCH 31, 2016
(Unaudited, continued)
SHARES | | Netherlands - 2.7% | | VALUE | |
| | 294,213 | | | Affimed NV (b) | | $ | 1,100,357 | | |
| | 198,652 | | | Mylan NV (b) | | | 9,207,520 | | |
| | 241,021 | | | UniQure NV (b) | | | 2,863,329 | | |
| | | | 13,171,206 | | |
| | | Spain - 0.5% | |
| | 166,000 | | | Grifols SA | | | 2,568,020 | | |
| | | Switzerland - 5.2% | |
| | 21,300 | | | Lonza Group AG (b) | | | 3,604,087 | | |
| | 92,700 | | | Novartis AG | | | 6,715,188 | | |
| | 484,000 | | | Roche Holding AG | | | 14,822,500 | | |
| | | | 25,141,775 | | |
| | | United Kingdom - 5.8% | |
| | 269,434 | | | Adaptimmune Therapeutics plc (b) | | | 2,190,498 | | |
| | 355,800 | | | AstraZeneca PLC | | | 10,019,328 | | |
| | 285,000 | | | GlaxoSmithKline plc | | | 11,556,750 | | |
| | 150,000 | | | Hikma Pharmaceuticals PLC | | | 4,265,660 | | |
| | | | 28,032,236 | | |
| | | United States - 37.7% | |
| | 168,083 | | | ACADIA Pharmaceuticals Inc. (b) | | | 4,699,601 | | |
| | 100,000 | | | Akorn, Inc. (b) | | | 2,353,000 | | |
| | 18,200 | | | Alexion Pharmaceuticals, Inc. (b) | | | 2,533,804 | | |
| | 22,100 | | | Anacor Pharmaceuticals, Inc. (b) | | | 1,181,245 | | |
| | 544,235 | | | Ardelyx, Inc. (b) | | | 4,228,706 | | |
| | 49,700 | | | Biogen Inc. (b) | | | 12,937,904 | | |
| | 12,000 | | | BioMarin Pharmaceutical Inc. (b) | | | 989,760 | | |
| | 22,800 | | | bluebird bio, Inc. (b) | | | 969,000 | | |
| | 11,121 | | | Care Capital Properties, Inc. | | | 298,488 | | |
| | 54,000 | | | Celgene Corporation (b) | | | 5,404,860 | | |
| | 105,800 | | | Celldex Therapeutics, Inc. (b) | | | 399,924 | | |
| | 94,900 | | | Community Health Systems, Inc. (b) | | | 1,756,599 | | |
| | 180,407 | | | Cynapsus Therapeutics, Inc. (b) | | | 2,146,843 | | |
| | 120,475 | | | Dynavax Technologies Corporation (b) | | | 2,317,939 | | |
| | 71,595 | | | Eli Lilly & Co. | | | 5,155,556 | | |
| | 116,000 | | | Epizyme, Inc. (b) | | | 1,405,920 | | |
| | 102,800 | | | Esperion Therapeutics, Inc. (b) | | | 1,738,348 | | |
| | 251,500 | | | Gilead Sciences, Inc. | | | 23,102,790 | | |
| | 29,900 | | | HCA Holdings, Inc. (b) | | | 2,333,695 | | |
| | 187,224 | | | Healthcare Realty Trust, Inc. | | | 5,783,349 | | |
| | 178,033 | | | Healthcare Trust of America, Inc. | | | 5,237,731 | | |
| | 17,300 | | | Humana, Inc. | | | 3,165,035 | | |
The accompanying notes are an integral part of these financial statements.
11
TEKLA WORLD
HEALTHCARE FUND
SCHEDULE OF INVESTMENTS
MARCH 31, 2016
(Unaudited, continued)
SHARES | | United States - continued | | VALUE | |
| | 8,604 | | | Illumina, Inc. (b) | | $ | 1,394,794 | | |
| | 76,000 | | | Incyte Corporation (b) | | | 5,507,720 | | |
| | 232,187 | | | Inotek Pharmaceuticals Corporation (b) | | | 1,718,184 | | |
| | 37,776 | | | Johnson & Johnson | | | 4,087,363 | | |
| | 56,900 | | | Juno Therapeutics, Inc. (b) | | | 2,167,321 | | |
| | 200,324 | | | Karyopharm Therapeutics, Inc. (b) | | | 1,786,890 | | |
| | 41,000 | | | Kite Pharma, Inc. (b) | | | 1,882,310 | | |
| | 197,641 | | | Lexicon Pharmaceuticals, Inc. (b) | | | 2,361,810 | | |
| | 15,000 | | | McKesson Corporation | | | 2,358,750 | | |
| | 410,486 | | | Medical Properties Trust, Inc. | | | 5,328,108 | | |
| | 98,000 | | | Medivation, Inc. (b) | | | 4,506,040 | | |
| | 96,097 | | | Merck & Co., Inc. | | | 5,084,492 | | |
| | 286,000 | | | Merrimack Pharmaceuticals, Inc. (b) | | | 2,393,820 | | |
| | 153,700 | | | Momenta Pharmaceuticals, Inc. (b) | | | 1,420,188 | | |
| | 430,997 | | | New Senior Investment Group, Inc. | | | 4,439,269 | | |
| | 71,581 | | | Paratek Pharmaceuticals, Inc. (b) | | | 1,085,884 | | |
| | 164,050 | | | Pfizer, Inc. | | | 4,862,442 | | |
| | 179,870 | | | Physicians Realty Trust | | | 3,341,985 | | |
| | 95,200 | | | Puma Biotechnology, Inc. (b) | | | 2,796,024 | | |
| | 82,800 | | | Sage Therapeutics, Inc. (b) | | | 2,654,568 | | |
| | 190,900 | | | Senior Housing Properties Trust | | | 3,415,201 | | |
| | 2,118 | | | The RMR Group Inc, Class A (b) | | | 52,971 | | |
| | 24,400 | | | United Therapeutics Corporation (b) | | | 2,718,892 | | |
| | 66,979 | | | UnitedHealth Group, Inc. | | | 8,633,593 | | |
| | 158,000 | | | Valeant Pharmaceuticals International, Inc (b) | | | 4,155,400 | | |
| | 76,484 | | | Ventas, Inc. | | | 4,815,433 | | |
| | 101,704 | | | Vertex Pharmaceuticals Incorporated (b) | | | 8,084,451 | | |
| | | | 183,194,000 | | |
| | | | | TOTAL COMMON STOCKS
(Cost $531,362,803) | | | 430,400,767 | | |
| | | EXCHANGE TRADED FUND - 3.1% | |
| | 294,000 | | | SPDR S&P Biotech ETF | | | 15,188,040 | | |
| | | | | TOTAL EXCHANGE TRADED FUND
(Cost $17,999,356) | | | 15,188,040 | | |
The accompanying notes are an integral part of these financial statements.
12
TEKLA WORLD
HEALTHCARE FUND
SCHEDULE OF INVESTMENTS
MARCH 31, 2016
(Unaudited, continued)
PRINCIPAL
AMOUNT | | SHORT-TERM INVESTMENT - 1.1% | | VALUE | |
$ | 5,286,000 | | | Repurchase Agreement, Fixed Income
Clearing Corp., repurchase value
$5,286,004, 0.03%, dated 03/31/16,
due 04/01/16 (collateralized by
U.S. Treasury 7.250%, due 08/15/22,
market value $5,397,356) | | $ | 5,286,000 | | |
| | | TOTAL SHORT-TERM INVESTMENT
(Cost $5,286,000) | | | 5,286,000 | | |
| | | TOTAL INVESTMENTS - 113.0%
(Cost $651,493,015) | | | 548,210,243 | | |
| | | OTHER ASSETS IN EXCESS OF
LIABILITIES - (13.0)% | | | (63,015,681 | ) | |
| | | NET ASSETS - 100% | | $ | 485,194,562 | | |
(a) Non-income producing security.
(b) Security fair valued. See Investment Valuation and Fair Value Measurements.
The accompanying notes are an integral part of these financial statements.
13
TEKLA WORLD
HEALTHCARE FUND
STATEMENT OF ASSETS AND LIABILITIES
MARCH 31, 2016
(Unaudited)
ASSETS: | |
Investments, at value (cost $646,207,015) | | $ | 542,924,243 | | |
Repurchase agreement, at value (cost $5,286,000) | | | 5,286,000 | | |
Total Investments | | | 548,210,243 | | |
Cash | | | 387 | | |
Dividends and interest receivable | | | 2,617,546 | | |
Receivable for investments sold | | | 153,141 | | |
Prepaid expenses | | | 140,325 | | |
Total assets | | | 551,121,642 | | |
LIABILITIES: | |
Accrued advisory fee | | | 454,612 | | |
Accrued investor support service fees | | | 54,553 | | |
Accrued shareholder reporting fees | | | 51,188 | | |
Accrued trustee fees | | | 39,880 | | |
Loan Payable | | | 62,500,000 | | |
Payable for open forward currency contracts | | | 2,225,433 | | |
Income distribution payable | | | 255,617 | | |
Interest payable | | | 230,267 | | |
Accrued other | | | 115,530 | | |
Total liabilities | | | 65,927,080 | | |
Commitments and Contingencies (see Note 1) | |
NET ASSETS | | $ | 485,194,562 | | |
SOURCES OF NET ASSETS: | |
Shares of beneficial interest, par value $.01 per share,
unlimited number of shares authorized, amount paid
in on 31,179,993 shares issued and outstanding | | $ | 594,290,869 | | |
Accumulated net investment loss | | | (20,424,959 | ) | |
Accumulated net realized gain on investments,
options and foreign currencies | | | 16,836,317 | | |
Net unrealized loss on investments and translation
of assets and liabilities in foreign currencies | | | (105,507,665 | ) | |
Total net assets (equivalent to $15.56 per
share based on 31,179,993 shares outstanding) | | $ | 485,194,562 | | |
The accompanying notes are an integral part of these financial statements.
14
TEKLA WORLD
HEALTHCARE FUND
STATEMENT OF OPERATIONS
SIX MONTHS ENDED MARCH 31, 2016
(Unaudited)
INVESTMENT INCOME: | |
Dividend income (net of foreign tax of $200,053) | | $ | 3,814,926 | | |
Interest and other income | | | 2,086,648 | | |
Total investment income | | | 5,901,574 | | |
EXPENSES: | |
Advisory fees | | | 2,785,968 | | |
Investor support service fees | | | 334,316 | | |
Interest expense | | | 267,593 | | |
Trustees' fees and expenses | | | 76,069 | | |
Administration and auditing fees | | | 75,894 | | |
Legal fees | | | 71,198 | | |
Custodian fees | | | 57,180 | | |
Shareholder reporting | | | 52,219 | | |
Transfer agent fees | | | 11,839 | | |
Other (see Note 2) | | | 191,798 | | |
Total expenses | | | 3,924,074 | | |
Net investment gain | | | 1,977,500 | | |
REALIZED AND UNREALIZED GAIN (LOSS): | |
Net realized gain (loss) on: | |
Investments | | | 4,130,963 | | |
Closed or expired option contracts written | | | 7,590,003 | | |
Foreign currency transactions | | | 2,443,811 | | |
Net realized gain | | | 14,164,777 | | |
Change in unrealized appreciation (depreciation) | |
Investments | | | (46,655,324 | ) | |
Option contracts written | | | (1,836,959 | ) | |
Foreign currency | | | (2,506,049 | ) | |
Change in unrealized appreciation (depreciation) | | | (50,998,332 | ) | |
Net realized and unrealized gain (loss) | | | (36,833,555 | ) | |
Net decrease in net assets resulting
from operations | | ($ | 34,856,055 | ) | |
The accompanying notes are an integral part of these financial statements.
15
TEKLA WORLD
HEALTHCARE FUND
STATEMENTS OF CHANGES IN NET ASSETS
| | | Six months ended
March 31, 2016
(Unaudited) | | For the Period
June 30, 2015
to
September 30,
2015 (1) | |
NET INCREASE (DECREASE) IN
NET ASSETS RESULTING
FROM OPERATIONS: | |
Net investment income (loss) | | $ | 1,977,500 | | | ($ | 539,062 | ) | |
Net realized gain | | | 14,164,777 | | | | 9,917,784 | | |
Change in net unrealized depreciation | | | (50,998,332 | ) | | | (54,509,333 | ) | |
Net decrease in net assets
resulting from operations | | | (34,856,055 | ) | | | (45,130,611 | ) | |
DISTRIBUTIONS TO SHAREHOLDERS
FROM: | |
Net investment income | | | (21,832,231 | ) | | | (7,277,410 | ) | |
Total distributions | | | (21,832,231 | ) | | | (7,277,410 | ) | |
CAPITAL SHARE TRANSACTIONS: | |
Net proceeds from sale of shares | | | — | | | | 594,290,869 | | |
Total capital share transactions | | | — | | | | 594,290,869 | | |
Net increase (decrease)
in net assets | | | (56,688,286 | ) | | | 541,882,848 | | |
NET ASSETS: | |
Beginning of period | | | 541,882,848 | | | | — | | |
End of period | | | 485,194,562 | | | | 541,882,848 | | |
Accumulated net investment loss
included in net assets at end
of period | | ($ | 20,424,959 | ) (a) | | ($ | 570,228 | ) (a) | |
(1) Commenced operations on June 30, 2015
(a) Reflects reclassifications to the Fund's capital accounts to reflect income and gains available for distribution under income tax regulations.
The accompanying notes are an integral part of these financial statements.
16
TEKLA WORLD
HEALTHCARE FUND
FINANCIAL HIGHLIGHTS
| | | Six months ended
March 31, 2016
(Unaudited) | | Period
June 30,
2015 to
September 30,
2015 (1) | |
OPERATING PERFORMANCE FOR A SHARE
OUTSTANDING THROUGHOUT EACH PERIOD | |
Net asset value per share, beginning of period | | $ | 17.38 | | | $ | 19.10 | (3) | |
Net investment income (loss) (2) | | | 0.06 | | | | (0.02 | ) | |
Net realized and unrealized loss | | | (1.18 | ) | | | (1.47 | ) | |
Total increase (decrease) from investment operations | | | (1.12 | ) | | | (1.49 | ) | |
Distributions to shareholders from: | |
Income | | | (0.70 | ) | | | (0.23 | ) | |
Total distributions | | | (0.70 | ) | | | (0.23 | ) | |
Net asset value per share, end of period | | $ | 15.56 | | | $ | 17.38 | | |
Per share market value, end of period | | $ | 14.03 | | | $ | 14.38 | | |
Total investment return at market value* | | | 2.35 | % | | | (27.07 | %) | |
Total investment return at net asset value* | | | (6.08 | %) | | | (7.46 | %) | |
RATIOS | |
Expenses to average net assets** | | | 1.48 | % | | | 1.32 | % | |
Net investment income (loss) to average net assets** | | | 0.74 | % | | | (0.37 | %) | |
Expenses, excluding interest expense** | | | 1.38 | % | | | — | | |
SUPPLEMENTAL DATA | |
Net assets at end of period (in millions) | | $ | 485 | | | $ | 542 | | |
Portfolio turnover rate* | | | 23.01 | % | | | 58.96 | % | |
* Not Annualized.
** Annualized.
(1) Commenced operations on June 30, 2015.
(2) Computed using average shares outstanding.
(3) Net asset value beginning of period reflects a deduction of $0.90 per share sales charge from the initial offering price of $20.00 per share.
The accompanying notes are an integral part of these financial statements.
17
TEKLA WORLD
HEALTHCARE FUND
NOTES TO FINANCIAL STATEMENTS
March 31, 2016
(Unaudited)
(1) Organization and Significant Accounting Policies
Tekla World Healthcare Fund (the Fund) is a Massachusetts business trust formed on March 5, 2015 and registered under the Investment Company Act of 1940 as a non-diversified closed-end management investment company. The Fund commenced operations on June 30, 2015. The investment objective is to seek current income and long-term capital appreciation through investments in U.S. and non-U.S. companies engaged in the healthcare industry (including equity securities, debt securities and pooled investment vehicles). The Fund invests primarily in securities of public and private companies believed by the Fund's Investment Adviser, Tekla Capital Management LLC (the Adviser), to have significant potential for above-average growth.
The preparation of these financial statements requires the use of certain estimates by management in determining the Fund's assets, liabilities, revenues and expenses. Actual results could differ from these estimates and such differences could be material. The following is a summary of significant accounting policies followed by the Fund, which are in conformity with accounting principles generally accepted in the United States of America ("GAAP"). The Fund is an investment company and follows accounting and reporting guidance in the Financial Accounting Standards Board Accounting Standards Codification 946. Events or transactions occurring after March 31, 2016, through the date that the financial statements were issued, have been evaluated in the preparation of these financial statements.
Currency Hedging Strategy Changes
The Fund's initial public offering prospectus stated that the Fund initially intends to hedge non-U.S. dollar exposure. The investment strategy of the Fund has been revised to provide that while the Fund may hedge its non-U.S. dollar exposure, it is currently expected to do so from time to time rather than continuously. And, to the extent that the Adviser may hedge its non-U.S. dollar exposure from 0%-100% at any given time. It typically expects to do so between 0% and 50% of such exposure.
A description of the attendant risk factor for the Fund's investment strategy with respect to hedging currency exposure is as follows: Forward contracts involve the purchase or sale of a specific quantity of a commodity, government security, foreign currency, or other asset at a specified price, with delivery and settlement at a specified future date. Because it is a completed contract, a purchase forward contract can be a cover for the sale of a futures contract. The Fund may enter into forward contracts for hedging purposes and non-hedging purposes (i.e., to increase returns). Forward contracts may be used by the Fund for hedging purposes to protect against uncertainty in the level of future foreign currency exchange rates, such as when the Fund anticipates purchasing or selling a foreign security. For example, this technique would allow the Fund to "lock in" the U.S. dollar price of the security. Forward contracts may also be used to attempt to protect the value of the Fund's existing holdings of foreign securities. There may be, however, an imperfect correlation between the Fund's foreign securities holdings and the forward contracts entered into with respect to those holdings. Forward contracts may also be used for non-hedging purposes to pursue the Fund's investment objective, such as when the Adviser anticipates that particular foreign currencies will appreciate or depreciate in value, even though securities denominated in those currencies are not then held in the Fund's portfolio. There is no requirement that the Fund hedge all or any portion of its exposure to foreign currency risks.
18
TEKLA WORLD
HEALTHCARE FUND
NOTES TO FINANCIAL STATEMENTS
March 31, 2016
(continued)
Forward contracts, unlike futures contracts, are not traded on exchanges and are not standardized; rather, banks and dealers act as principals in these markets, negotiating each transaction on an individual basis. The principals who deal in the forward markets are not required to continue to make markets in the currencies or commodities they trade and these markets can experience periods of illiquidity, sometimes of significant duration. There have been periods during which certain participants in these markets have refused to quote prices for certain currencies or commodities or have quoted prices with an unusually wide spread between the price at which they were prepared to buy and that at which they were prepared to sell. Disruptions can occur in any market traded by the Adviser due to unusually high trading volume, political intervention or other factors. Arrangements to trade forward contracts may be made with only one or a few counterparties, and liquidity problems therefore might be greater than if such arrangements were made with numerous counterparties. The imposition of controls by governmental authorities might also limit such forward (and futures) trading to less than that which the Adviser would otherwise recommend, to the possible detriment of the Fund. Market illiquidity or disruption could result in major losses to the Fund. In addition, the Fund will be exposed to credit risks with regard to counterparties with whom they trade as well as risks relating to settlement default. Such risks could result in substantial losses to the Fund.
Investment Valuation
Shares of publicly traded companies listed on national securities exchanges or trading in the over-the-counter market are typically valued at the last sale price, as of the close of trading, generally 4 p.m., Eastern time. The Fund holds securities or other assets that are denominated in a foreign currency. The Fund will normally use the currency exchange rates as of 4:00 p.m. (Eastern Time) when valuing such assets. The Board of Trustees of the Fund (the "Trustees") has established and approved fair valuation policies and procedures with respect to securities for which quoted prices may not be available or which do not reflect fair value. Convertible bonds, corporate and government bonds are valued using a third-party pricing system. Convertible bonds are valued using this pricing system only on days when there is no sale reported. Puts and calls generally are valued at the close of regular trading on the securities or commodities exchange on which they are primarily traded. Options on securities generally are valued at their last bid price in the case of exchange traded options or, in the case of OTC-traded options, the average of the last bid price as obtained from two or more dealers unless there is only one dealer, in which case that dealer's price is used. Forward foreign currency contracts are valued on the basis of the value of the underlying currencies at the prevailing forward exchange rates. Restricted securities of companies that are publicly traded are typically valued based on the closing market quote on the valuation date adjusted for the impact of the restriction as determined in good faith by the Adviser also using fair valuation policies and procedures approved by the Trustees described below. Non-exchange traded warrants of publicly traded companies are generally valued using the Black-Scholes model, which incorporates both observable and unobservable inputs. Short-term investments with a maturity of 60 days or less are generally valued at amortized cost, which approximates fair value.
Convertible preferred shares, warrants or convertible note interests in private companies, milestone interests, and other restricted securities, as well as shares of publicly traded companies for which market quotations are not readily available, such as stocks for which trading has
19
TEKLA WORLD
HEALTHCARE FUND
NOTES TO FINANCIAL STATEMENTS
March 31, 2016
(continued)
been halted or for which there are no current day sales, or which do not reflect fair value, are typically valued in good faith, based upon the recommendations made by the Adviser pursuant to fair valuation policies and procedures approved by the Trustees.
The Adviser has a Valuation Sub-Committee comprised of senior management which reports to the Valuation Committee of the Board at least quarterly. Each fair value determination is based on a consideration of relevant factors, including both observable and unobservable inputs. Observable and unobservable inputs the Adviser considers may include (i) the existence of any contractual restrictions on the disposition of securities; (ii) information obtained from the company, which may include an analysis of the company's financial statements, the company's products or intended markets or the company's technologies; (iii) the price of the same or similar security negotiated at arm's length in an issuer's completed subsequent round of financing; (iv) the price and extent of public trading in similar securities of the issuer or of comparable companies; or (v) a probability and time value adjusted analysis of contractual terms. Where available and appropriate, multiple valuation methodologies are applied to confirm fair value. Significant unobservable inputs identified by the Adviser are often used in the fair value determination. A significant change in any of these inputs may result in a significant change in the fair value measurement. Due to the uncertainty inherent in the valuation process, such estimates of fair value may differ significantly from the values that would have been used had a ready market for the investments existed, and differences could be material. Additionally, changes in the market environment and other events that may occur over the life of the investments may cause the gains or losses ultimately realized on these investments to be different from the valuations used at the date of these financial statements.
Options on Securities
An option contract is a contract in which the writer (seller) of the option grants the buyer of the option, upon payment of a premium, the right to purchase from (call option) or sell to (put option) the writer a designated instrument at a specified price within a specified period of time. Certain options, including options on indices, will require cash settlement by the Fund if the option is exercised. The Fund enters into option contracts in order to hedge against potential adverse price movements in the value of portfolio assets, as a temporary substitute for selling selected investments, to lock in the purchase price of a security or currency which it expects to purchase in the near future, as a temporary substitute for purchasing selected investments, or to enhance potential gain or to gain or hedge exposure to financial market risk.
The Fund's obligation under an exchange traded written option or investment in an exchange-traded purchased option is valued at the last sale price or in the absence of a sale, the mean between the closing bid and asked prices. Gain or loss is recognized when the option contract expires, is exercised or is closed.
If the Fund writes a covered call option, the Fund foregoes, in exchange for the premium, the opportunity to profit during the option period from an increase in the market value of the underlying security above the exercise price. If the Fund writes a put option it accepts the risk of a decline in the market value of the underlying security below the exercise price. Over-the-counter options have the risk of the potential inability of counterparties to meet the terms
20
TEKLA WORLD
HEALTHCARE FUND
NOTES TO FINANCIAL STATEMENTS
March 31, 2016
(continued)
of their contracts. The Fund's maximum exposure to purchased options is limited to the premium initially paid. In addition, certain risks may arise upon entering into option contracts including the risk that an illiquid secondary market will limit the Fund's ability to close out an option contract prior to the expiration date and that a change in the value of the option contract may not correlate exactly with changes in the value of the securities or currencies hedged.
All options on securities and securities indices written by the Fund are required to be covered. When the Fund writes a call option, this means that during the life of the option the Fund may own or have the contractual right to acquire the securities subject to the option or may maintain with the Fund's custodian in a segregated account appropriate liquid securities in an amount at least equal to the market value of the securities underlying the option. When the Fund writes a put option, this means that the Fund will maintain with the Fund's custodian in a segregated account appropriate liquid securities in an amount at least equal to the exercise price of the option.
Transactions in options written for the six months ended March 31, 2016 were as follows:
| | | Contracts | | Premiums | |
Options outstanding, September 30, 2015 | | | 15,845 | | | $ | 2,298,423 | | |
Options written | | | 28,106 | | | | 5,488,886 | | |
Options terminated in closing purchase transactions | | | (559 | ) | | | (293,766 | ) | |
Options exercised | | | (5,649 | ) | | | (1,423,612 | ) | |
Options expired | | | (37,743 | ) | | | (6,069,931 | ) | |
Options outstanding, March 31, 2016 | | | — | | | $ | — | | |
Average Number of Contracts | | | 341,267 | | | | |
Derivatives not accounted
for as hedging instruments
under ASC 815 | | Statement of Assets and
Liabilities Location | | Statement of Operations Location | |
Equity Contracts
| | | | | | | | | | | | | | Net realized gain on
closed or expired option
contracts written | | $ | 7,590,003 | | |
| | | | | | | | | | | | | | | | | Change in unrealized
appreciation (depreciation)
on option contracts written | | ($ | 1,836,959 | ) | |
Forward Currency
Contracts
| | | | | | Liabilities, forward
currency, at value
| | $ | 2,225,433
| | | Change in unrealized
appreciation (depreciation)
on foreign currency | | ($ | 2,512,012 | ) | |
Forward Contracts
Forward contracts involve the purchase or sale of a specific quantity of a commodity, government security, foreign currency, or other asset at a specified price, with delivery and settlement at a specified future date. Because it is a completed contract, a purchase forward contract can be a cover for the sale of a futures contract. The Fund may enter into forward contracts for hedging purposes and non-hedging purposes (i.e., to increase returns). Forward contracts may be used by the Fund for hedging purposes to protect against uncertainty in the level of future foreign currency exchange rates, such as when the Fund anticipates purchasing or
21
TEKLA WORLD
HEALTHCARE FUND
NOTES TO FINANCIAL STATEMENTS
March 31, 2016
(continued)
selling a foreign security. Forward contracts may also be used to attempt to protect the value of the Fund's existing holdings of foreign securities. Forward contracts may also be used for non-hedging purposes to pursue the Fund's investment objective. There is no requirement that the Fund hedge all or any portion of its exposure to foreign currency risks.
The following forward contracts were held as of March 31, 2016:
Description | | Counterparty | | Settlement
Date | | Currency | | Settlement
Value | | Current
Value | | Unrealized
Loss | |
Contracts Sold: | |
British Pound | | Goldman Sachs Bank | | 04/28/16 | | | (27,749,123 | ) GBP | | ($ | 39,525,628 | ) | | ($ | 39,857,539 | ) | | ($ | 331,911 | ) | |
Danish Krone | | Goldman Sachs Bank | | 04/28/16 | | | (159,883,370 | ) DKK | | | (24,038,119 | ) | | | (24,431,518 | ) | | | (393,399 | ) | |
Euro | | Goldman Sachs Bank | | 04/28/16 | | | (54,542,963 | ) EUR | | | (61,150,570 | ) | | | (62,109,099 | ) | | | (958,529 | ) | |
Israeli Sheqel | | Goldman Sachs Bank | | 04/28/16 | | | (43,046,427 | ) ILS | | | (11,243,680 | ) | | | (11,464,167 | ) | | | (220,487 | ) | |
Swiss Franc | | Goldman Sachs Bank | | 04/28/16 | | | (25,534,739 | ) CHF | | | (26,262,338 | ) | | | (26,583,445 | ) | | | (321,107 | ) | |
| | | | | | | | | | | ($ | 164,445,768 | ) | | ($ | 2,225,433 | ) | |
Average Notional Amount of Forward Contracts | | | 159,853,230 | | |
Investment Transactions and Income
Investment transactions are recorded on a trade date basis. Gains and losses from sales of investments are recorded using the "identified cost" method. Interest income is recorded on the accrual basis, adjusted for amortization of premiums and accretion of discounts. Dividend income is recorded on the ex-dividend date, less any foreign taxes withheld. Upon notification from issuers, some of the dividend income received may be redesignated as a reduction of cost of the related investment if it represents a return of capital.
The aggregate cost of purchases and proceeds from sales of investment securities (other than short-term investments) for the six months ended March 31, 2016 totaled $245,261,662 and $119,284,124, respectively.
Repurchase Agreements
In managing short-term investments the Fund may from time to time enter into transactions in repurchase agreements. In a repurchase agreement, the Fund's custodian takes possession of the underlying collateral securities from the counterparty, the market value of which is at least equal to the principal, including accrued interest, of the repurchase transaction at all times. In the event of default or bankruptcy by the other party to the agreement, realization and/or retention of the collateral by the Fund may be delayed. The Fund may enter into repurchase transactions with any broker, dealer, registered clearing agency or bank. Repurchase agreement transactions are not counted for purposes of the limitations imposed on the Fund's investment in debt securities.
Distribution Policy
Pursuant to a Securities and Exchange Commission exemptive order the Fund may make periodic distributions that include capital gains as frequently as 12 times in any one taxable year in respect of its common shares, and the Fund has implemented a managed distribution policy (the Policy) providing for monthly distributions at a rate set by the Board of Trustees. Under
22
TEKLA WORLD
HEALTHCARE FUND
NOTES TO FINANCIAL STATEMENTS
March 31, 2016
(continued)
the current Policy, the Fund intends to make monthly distributions at a rate of $0.1167 per share to shareholders of record. If taxable income and net long-term realized gains exceed the amount required to be distributed under the Policy, the Fund will at a minimum make distributions necessary to comply with the requirements of the Internal Revenue Code. The Policy has been established by the Trustees and may be changed by them without shareholder approval. The Trustees regularly review the Policy and the frequency and distribution rate considering the purpose and effect of the Policy, the financial market environment, and the Fund's income, capital gains and capital available to pay distributions.
Subsequent to March 31, 2016, the Fund declared a distribution of $0.1167 per share with a record date of April 18, 2016 and payable date of April 29, 2016. It is estimated that the Fund has distributed more than its income and net realized capital gains, therefore, a portion of the distribution may be a return of capital.
Share Repurchase Program
In December 2015, the Trustees authorized a share repurchase program. The share repurchase program allows the Fund to purchase up to 12% in the open market of its outstanding common shares for a one-year period beginning December 4, 2015. The share repurchase program is intended to enhance shareholder value and potentially reduce the discount between the market price and the Fund's shares and the Fund's net asset value.
During the four months ended March 31, 2016, the Fund did not repurchase any shares through the repurchase program.
Federal Taxes
It is the Fund's policy to comply with the requirements of the Internal Revenue Code applicable to regulated investment companies and to distribute to its shareholders substantially all of its taxable income and its net realized capital gains, if any. Therefore, no Federal income or excise tax provision is required.
As of March 31, 2016, the Fund had no uncertain tax positions that would require financial statement recognition or disclosure. The Fund's federal tax returns are subject to examination by the Internal Revenue Service for a period of three years.
Distributions
The Fund records all distributions to shareholders on the ex-dividend date. Such distributions are determined in conformity with income tax regulations, which may differ from GAAP. These differences include temporary and permanent differences from losses on wash sale transactions, installment sale adjustments and ordinary loss netting to reduce short term capital gains. Reclassifications are made to the Fund's capital accounts to reflect income and gains available for distribution under income tax regulations.
Commitments and Contingencies
Under the Fund's organizational documents, its officers and Trustees may be indemnified against certain liabilities and expenses arising out of the performance of their duties to the Fund. Additionally, in the normal course of business, the Fund enters into agreements with service providers that may contain indemnification clauses. The Fund's maximum exposure under these agreements is unknown as this would involve future claims that may be made
23
TEKLA WORLD
HEALTHCARE FUND
NOTES TO FINANCIAL STATEMENTS
March 31, 2016
(continued)
against the Fund that have not yet occurred. However, based on experience, the Fund expects the risk of loss to be remote.
Loan Payable
The Fund maintains a $125,000,000 line of credit with the Bank of Nova Scotia (the "Line of Credit") which expires on January 6, 2017. As of March 31, 2016, the Fund had drawn down $62,500,000 from the Line of Credit, which was the maximum borrowing outstanding during the period. The Fund is charged interest at the rate of 0.70% above the relevant LIBOR rate adjusted by the Statutory Reserve Rate for borrowing (per annum). The Fund is also charged a commitment fee on the daily unused balance of the line of credit at the rate of 0.25% (per annum). Per the Line of Credit agreement, the Fund paid an upfront fee of 0.10% on the total line of credit balance, which is being amortized through January 5, 2017. The Fund pledges its investment securities as the collateral for the line of credit per the terms of the agreement. The weighted average interest rate and the average outstanding loan payable for the period from January 6, 2016 to March 31, 2016 were 1.5423% and $62,500,000, respectively. The stated carrying amount of the line of credit approximates its fair value based upon the short term nature of the borrowings and the interest rates being based upon the market terms. The borrowings under the line of credit would be considered as Level 2 in the fair value hierarchy (See Note 3) at March 31, 2016.
On April 11, 2016, the Fund drew down an additional $57,500,000 on the Line of Credit.
Organizational Expenses and Offering Costs
All organizational expenses of the Trust were borne by Tekla Capital Management LLC. As a result, organizational expenses are not reflected in the Statement of Assets and Liabilities or the Statement of Operations. Offering costs of $1,246,990 were limited to $0.04 per share and were charged to paid in capital upon sale of the shares.
Investor Support Services
The Fund has retained Destra Capital Investment LLC to provide investor support services in connection with the ongoing operation of the Fund. The Fund will pay Destra a fee in an annual amount equal to (i) 0.12% of the average aggregate daily value of the Fund's Managed Assets from June 30, 2015 to June 29, 2016 and (ii) 0.05% of the average aggregate daily value of the Fund's Managed Assets from June 30, 2016 through the remaining term of the investor support services agreement.
(2) Investment Advisory and Other Affiliated Fees
The Fund has entered into an Investment Advisory Agreement (the Advisory Agreement) with the Adviser. Pursuant to the terms of the Advisory Agreement, the Fund pays the Adviser a monthly fee at the rate when annualized of 1.00% of the average daily value of the Fund's Managed Assets. Managed Assets means the total assets of the Fund minus the Fund's liabilities other than the loan payable.
The Fund has entered into a Services Agreement (the Agreement) with the Adviser. Pursuant to the terms of the Agreement, the Fund reimburses the Adviser for certain services related to a portion of the payment of salary and provision of benefits to the Fund's Chief Compliance Officer. During the six months ended March 31, 2016, these payments amounted to $7,138
24
TEKLA WORLD
HEALTHCARE FUND
NOTES TO FINANCIAL STATEMENTS
March 31, 2016
(continued)
and are included in the Other category of expenses in the Statement of Operations, together with insurance and other expenses incurred to unaffiliated entities. Expenses incurred pursuant to the Agreement as well as certain expenses paid for by the Adviser are allocated to the Fund in an equitable fashion as approved by the Trustees of the Fund.
The Fund pays compensation to Independent Trustees in the form of a retainer, attendance fees, and additional compensation to Board and Committee chairpersons. The Fund does not pay compensation directly to Trustees or officers of the Fund who are also officers of the Adviser.
(3) Fair Value Measurements
The Fund uses a three-tier hierarchy to prioritize the assumptions, referred to as inputs, used in valuation techniques to measure fair value. The three-tier hierarchy of inputs is summarized in the three broad levels. Level 1 includes quoted prices in active markets for identical investments. Level 2 includes prices determined using other significant observable inputs (including quoted prices for similar investments, interest rates, credit risk, etc.). The independent pricing vendor may value bank loans and debt securities at an evaluated bid price by employing methodologies designed to indentify the market value for such securities and such securities are considered Level 2 in the fair value hierarchy. Level 3 includes prices determined using significant unobservable inputs (including the Fund's own assumptions in determining the fair value of investments). These inputs or methodology used for valuing securities are not necessarily an indication of the risk associated with investing in those securities.
The following is a summary of the inputs used as of March 31, 2016 to value the Fund's net assets. For the six months ended March 31, 2016, there were no transfers between Levels 1 and 2. The Fund accounts for transfers between levels at the beginning of the period.
Assets at Value | | Level 1 | | Level 2 | | Level 3 | | Total | |
Non-Convertible Notes | |
Ireland | | | | | | $ | 6,922,500 | | | | | | | $ | 6,922,500 | | |
United Kingdom | | | | | | | 3,985,000 | | | | | | | | 3,985,000 | | |
United States | | | | | | | 76,309,826 | | | | | | | | 76,309,826 | | |
Convertible Securities | |
Convertible Preferred Stock | |
Netherlands | | | | | | | — | | | $ | 1,132,185 | | | | 1,132,185 | | |
United States | | | | | | | — | | | | 2,798,345 | | | | 2,798,345 | | |
Mandatory Convertible Preferred Stock | |
Israel | | $ | 6,187,580 | | | | — | | | | — | | | | 6,187,580 | | |
Common Stocks | |
Australia | | | 2,954,836 | | | | — | | | | — | | | | 2,954,836 | | |
Belgium | | | 19,283,316 | | | | — | | | | — | | | | 19,283,316 | | |
China | | | 3,420,682 | | | | — | | | | — | | | | 3,420,682 | | |
Denmark | | | 27,467,759 | | | | — | | | | — | | | | 27,467,759 | | |
France | | | 30,290,247 | | | | — | | | | — | | | | 30,290,247 | | |
Germany | | | 7,675,692 | | | | — | | | | — | | | | 7,675,692 | | |
Ireland | | | 74,557,040 | | | | — | | | | — | | | | 74,557,040 | | |
Israel | | | 12,643,958 | | | | — | | | | — | | | | 12,643,958 | | |
25
TEKLA WORLD
HEALTHCARE FUND
NOTES TO FINANCIAL STATEMENTS
March 31, 2016
(continued)
Assets at Value | | Level 1 | | Level 2 | | Level 3 | | Total | |
Netherlands | | $ | 13,171,206 | | | $ | — | | | $ | — | | | $ | 13,171,206 | | |
Spain | | | 2,568,020 | | | | — | | | | — | | | | 2,568,020 | | |
Switzerland | | | 25,141,775 | | | | — | | | | — | | | | 25,141,775 | | |
United Kingdom | | | 28,032,236 | | | | — | | | | — | | | | 28,032,236 | | |
United States | | | 183,194,000 | | | | — | | | | — | | | | 183,194,000 | | |
Exchange Traded Fund | | | 15,188,040 | | | | — | | | | — | | | | 15,188,040 | | |
Short-term Investment | |
Repurchase Agreement | | | — | | | | 5,286,000 | | | | — | | | | 5,286,000 | | |
Total | | $ | 451,776,387 | | | $ | 92,503,326 | | | $ | 3,930,530 | | | $ | 548,210,243 | | |
The following is a reconciliation of level 3 assets for which significant unobservable inputs were used to determine fair value.
Level 3 Assets | | Balance as of
September 30,
2015 | | Net
realized gain
(loss) and
change in
unrealized
appreciation
(depreciation) | | Cost of
purchases
and
conversions | | Proceeds
from
sales and
conversions | | Net
transfers
in
(out of)
Level 3 | | Balance as of
March 31,
2016 | |
Convertible Preferred
Stock | |
Netherlands, | | $ | 1,111,787 | | | $ | 118,926 | | | $ | 1,472 | | | $ | — | | | $ | — | | | $ | 1,132,185 | | |
United States | | | — | | | | 204,583 | | | | 2,593,762 | | | | — | | | | — | | | | 2,798,345 | | |
Total | | $ | 1,111,787 | | | $ | 223,509 | | | $ | 2,595,234 | | | $ | — | | | $ | — | | | $ | 3,930,530 | | |
Net change in unrealized appreciation (depreciation) from investments still held as of March 31, 2016 $223,508
The following is a quantitative disclosure about significant unobservable inputs used in the determination of the fair value of Level 3 assets.
| | | Fair Value at
3/31/2016 | | Valuation Technique | | Unobservable Input | | Range
(Weighted Average) | |
Private Companies and
Other Restricted
Securities | | $307,961 | | Adjusted capital asset
pricing model | | Discount Rate
Price to Sales Multiple | | 30.19% (30.19%)
2.67 (2.67) | |
| | | | 3,622,569 | | | Market approach,
recent transaction | | | (a) | | | | N/A | | |
| | | $ | 3,930,530 | | | | | | | | |
(a) The valuation technique used as a basis to approximate fair value of these investments is based upon subsequent financing rounds. There is no quantitative information to provide as these methods of measure are investment specific.
(4) Private Companies and Other Restricted Securities
The Fund may invest in private companies and other restricted securities if these securities would currently comprise 10% or less of Managed Assets. The value of these securities represented 1% of the Fund's net assets at March 31, 2016.
26
TEKLA WORLD
HEALTHCARE FUND
NOTES TO FINANCIAL STATEMENTS
March 31, 2016
(continued)
The following table details the acquisition date, cost, carrying value per unit, and value of the Fund's private companies and other restricted securities at March 31, 2016. The Fund on its own does not have the right to demand that such securities be registered.
Security (#) | | Acquisition
Date | | Cost | | Carrying Value
per Unit | | Value | |
BioClin Therapeutics, Inc. | |
Series A Cvt. Pfd | | 1/19/16 | | $ | 490,384 | | | $ | 0.65 | | | $ | 490,384 | | |
GenomeDx Biosciences, Inc. | |
Series C Cvt. Pfd | | 2/22/16 | | | 2,000,000 | | | | 1.50 | | | | 2,000,000 | | |
IlluminOss Medical, Inc. | |
Series AA Cvt. Pfd | | 1/21/16 | | | 34,065 | | | | 1.00 | | | | 101,478 | | |
Series Junior Pfd | | 1/21/16 | | | 69,313 | | | | 1.00 | | | | 206,483 | | |
Merus B.V. Class C Cvt. Pfd | | 8/15/17 | | | 1,104,255 | | | | 7.58 | | | | 1,132,185 | | |
| | | | | $ | 3,698,017 | | | | | $ | 3,930,530 | | |
(#) See Schedule of Investments and corresponding footnotes for more information on each issuer.
27
TEKLA WORLD
HEALTHCARE FUND
PRIVACY NOTICE
If you are a registered shareholder of the Fund, the Fund and Tekla Capital Management LLC, the Fund's investment adviser, may receive nonpublic personal information about you from the information collected by the transfer agent from your transactions in Fund shares. Any nonpublic personal information is not disclosed to third parties, except as permitted or required by law. In connection with servicing your account and effecting transactions, the information received may be shared with the investment adviser and non-affiliates, including transfer agents, custodians or other service companies. Access to your nonpublic personal information is restricted to employees who need to know that information to provide products or services to you. To maintain the security of your nonpublic personal information, physical, electronic, and procedural safeguards are in place that comply with federal standards. The policies and practices described above apply to both current and former shareholders.
If your Fund shares are held in "street name" at a bank or brokerage, we do not have access to your personal information and you should refer to your bank's or broker's privacy policies for a statement of the treatment of your personal information.
FOR MORE INFORMATION
A description of the Fund's proxy voting policies and procedures and information on how the Fund voted proxies relating to portfolio securities during the most recent 12-month period ended June 30 is available (i) without charge, upon request by calling 1-800-451-2597; (ii) by writing to Tekla Capital Management LLC at 100 Federal Street, 19th Floor, Boston, MA 02110; (iii) on the Fund's website at www.Teklacap.com; and (iv) on the SEC's website at http://www.sec.gov.
The Fund's complete Schedule of Investments for the first and third quarters of its fiscal year will be filed quarterly with the SEC on Form N-Q. This Schedule of Investments will also be available on the Fund's website at www.Teklacap.com, or the SEC's website at http://www.sec.gov. The Fund's Form N-Q may be reviewed and copied at the SEC's Public Reference Room in Washington, DC or by calling 1-800-SEC-0330.
You can find information regarding the Fund at the Fund's website, www.teklacap.com. The Fund regularly posts information to its website, including information regarding daily share pricing and distributions and press releases, and maintains links to the Fund's SEC filings.
DISTRIBUTION POLICY
The Fund has a fixed distribution policy as described in the Notes to Financial Statements. For more information contact your financial adviser.
SHARE REPURCHASE PROGRAM
In December 2015, the Trustees authorized the share repurchase program to allow the Fund to repurchase up to 12% of its outstanding shares for a one year period beginning December 4, 2015.
PORTFOLIO MANAGEMENT
Daniel R. Omstead, Ph.D., Jason C. Akus, M.D./M.B.A, Christian Richard, M.B.A, M.S., Timothy Gasperoni, Ph.D., M.B.A, Amanda Birdsey-Benson Ph.D., Alan Kwan, Ph.D., M.S., M.B.A, William Hite CFA, and Joshua Mosberg, Ph.D. are members of a team that analyzes investments on behalf of the Fund. Dr. Omstead exercises ultimate decision making authority with respect to investments.
HOUSEHOLDING
A number of banks, brokers and financial advisers have instituted "householding". Under this practice, which has been approved by the SEC, only one copy of shareholder documents may be delivered to multiple shareholders who share the same address and satisfy other conditions. Householding is intended to reduce expenses and eliminate duplicate mailings of shareholder documents. If you do not want the mailing of your shareholder documents to be combined with those of other members of your household, please contact your bank, broker or financial adviser.
28
TEKLA WORLD
HEALTHCARE FUND
New York Stock Exchange Symbol: THW
NAV Symbol: XTHWX
100 Federal Street, 19th Floor
Boston, Massachusetts 02110
(617) 772-8500
www.teklacap.com
Officers
Daniel R. Omstead, Ph.D., President
Laura Woodward, CPA, Chief Compliance Officer,
Secretary and Treasurer
Trustees
Michael W. Bonney
Rakesh K. Jain, Ph.D.
Daniel R. Omstead, Ph.D.
Oleg M. Pohotsky
William S. Reardon, CPA
Uwe E. Reinhardt, Ph.D.
Lucinda H. Stebbins, CPA
Investment Adviser
Tekla Capital Management LLC
Administrator & Custodian
State Street Bank and Trust Company
Transfer Agent
Computershare, Inc.
Legal Counsel
Dechert LLP
Shareholders with questions regarding share transfers may call
1-800-426-5523
Daily net asset value may be obtained from
our website (www.teklacap.com) or by calling
(617) 772-8500
Item 2. CODE OF ETHICS.
Not applicable to this semi-annual filing.
ITEM 3. AUDIT COMMITTEE FINANCIAL EXPERT.
Not applicable to this semi-annual filing.
ITEM 4. PRINCIPAL ACCOUNTANT FEES AND SERVICES.
Not applicable to this semi-annual filing.
ITEM 5. AUDIT COMMITTEE OF LISTED REGISTRANTS.
Not applicable to this semi-annual filing.
ITEM 6. INVESTMENTS.
The Registrant’s Schedule of Investments is included as part of the Report to Shareholders filed under Item 1 of this form.
ITEM 7. DISCLOSURE OF PROXY VOTING POLICIES AND PROCEDURES FOR CLOSED-END MANAGEMENT INVESTMENT COMPANIES.
Not applicable to this semi-annual filing.
ITEM 8. PORTFOLIO MANAGERS OF CLOSED-END MANAGEMENT INVESTMENT COMPANIES
Not applicable to this semi-annual filing.
ITEM 9. PURCHASES OF EQUITY SECURITIES BY CLOSED-END MANAGEMENT INVESTMENT COMPANY AND AFFILIATED PURCHASERS.
Period | | (a) Total No.
of Shares
Purchased (1) | | (b) Average
Price Paid per
Share | | (c) Total No.
of Shares
Purchased as
Part of
Publicly
Announced Plans
or Programs | | (d) Maximum No.
of Shares that
May Yet Be
Purchased Under
the Plans or
Programs | |
Month #3 (Dec. 4, 2015 – Dec. 31, 2015) | | | | | | | | | |
Month #4 (Jan. 1, 2016 – Jan. 31, 2016) | | | | | | | | | |
Month #5 (Feb. 1, 2016 – Feb. 29, 2016) | | | | | | | | | |
Month #6 (Mar. 1, 2016 – Mar. 31, 2016) | | | | | | | | | |
Total | | | | | | | | | |
On December 3, 2015, the share repurchase program was announced, allowing the Registrant to repurchase up to 12% of its outstanding shares for a one year period beginning December 4, 2015.
ITEM 10. SUBMISSION OF MATTERS TO A VOTE OF SECURITY HOLDERS.
There have been no material changes to the procedures by which the shareholders may recommend nominees to the Registrant’s Board of Trustees, where those changes were implemented after the Registrant last provided disclosure in response to the requirements of Item 7(d)(2)(ii)(G) of Schedule 14A, or this Item.
ITEM 11. CONTROLS AND PROCEDURES.
(a) In the opinion of the principal executive officer and principal financial officer, based on their evaluation which took place within 90 days of this filing, the Registrant’s disclosure controls and procedures are adequately designed and are operating effectively to ensure (i) that material information relating to the Registrant, including its consolidated subsidiaries, is made known to them by others within those entities, particularly during the period in which this report is being prepared; and (ii) that information required to be disclosed by the registrant on Form N-CSR is recorded, processed, summarized and reported within the time period specified in the Securities and Exchange Commission’s rules and forms.
(b) There were no changes in the Registrant’s internal control over financial reporting that occurred during the Registrant’s most recent fiscal half-year that have materially affected or that are reasonably likely to materially affect the Registrant’s internal control.
ITEM 12. EXHIBITS
(a)(1) Code of Ethics - Not applicable to this semi-annual filing.
(a)(2) Separate certifications of the Principal Executive and Financial Officers as required by Rule 30a-2(a) under the 1940 Act and Section 302 of the Sarbanes-Oxley Act of 2002 are attached hereto (Exhibit 1 and 2).
(a)(3) Notice to Fund’s shareholders in accordance with Investment Company Act Section 19(a) and Rule 19a-1 (Exhibit 3).
(b) Certifications pursuant to Section 906 of the Sarbanes-Oxley Act of 2002 are attached hereto (Exhibit 4).
SIGNATURES
Pursuant to the requirements of the Securities Exchange Act of 1934 and the Investment Company Act of 1940, the registrant has duly caused this report to be signed on its behalf by the undersigned, thereunto duly authorized.
(Registrant) | TEKLA WORLD HEALTHCARE FUND |
| |
By (Signature and Title)* | /s/ Daniel R. Omstead |
| Daniel R. Omstead, President |
| |
Date: | 6/3/16 | |
| | | |
Pursuant to the requirements of the Securities Exchange Act of 1934 and the Investment Company Act of 1940, this report has been signed below by the following persons on behalf of the registrant and in the capacities and on the dates indicated.
By (Signature and Title)* | /s/ Laura Woodward |
| Laura Woodward, Treasurer |
| |
Date: | 6/3/16 | |
| | | |
* Print the name and title of each signing officer under his or her signature.