| | OMB APPROVAL |
| | OMB Number: | 3235-0570 |
| | Expires: | August 31, 2020 |
| UNITED STATES | Estimated average burden hours per response. . . . . . . . . . . . . . .20.6 |
| SECURITIES AND EXCHANGE COMMISSION | |
| Washington, D.C. 20549 | |
FORM N-CSR
CERTIFIED SHAREHOLDER REPORT OF REGISTERED
MANAGEMENT INVESTMENT COMPANIES
Investment Company Act file number | 811-23037 |
|
Tekla World Healthcare Fund |
(Exact name of registrant as specified in charter) |
|
100 Federal Street, 19th Floor, Boston, MA | | 02110 |
(Address of principal executive offices) | | (Zip code) |
|
|
(Name and address of agent for service) |
|
Registrant’s telephone number, including area code: | 617-772-8500 | |
|
Date of fiscal year end: | September 30 | |
|
Date of reporting period: | October 1, 2018 to March 31, 2019 | |
| | | | | | | | | |
ITEM 1. REPORTS TO STOCKHOLDERS.
TEKLA WORLD HEALTHCARE FUND

Semiannual Report
March 31, 2019
Beginning on January 1, 2021, as permitted by regulations adopted by the Securities and Exchange Commission, paper copies of the Fund's annual and semi-annual shareholder reports will no longer be sent by mail, unless you specifically request paper copies of the reports. Instead, the reports will be made available on the Fund's website, teklacap.com., and you will be notified by mail each time a report is posted and provided with a website link to access the report.
Beginning on January 1, 2019, you may elect to receive all future reports in paper free of charge. If you invest through a financial intermediary, you can contact your financial intermediary to request that you continue to receive paper copies of your shareholder reports. If you invest directly with the Fund, you can call Computershare at 1-800-426-5523 to inform the Fund that you wish to continue receiving paper copies of your shareholder reports. Your election to receive reports in paper will apply to all funds held in your account if you invest through your financial intermediary or all funds held with the fund complex if you invest directly with the Fund.
TEKLA WORLD HEALTHCARE FUND
Distribution policy: The Fund has implemented a managed distribution policy (the Policy) that provides for monthly distributions at a rate set by the Board of Trustees. Under the current Policy, the Fund intends to make monthly distributions at a rate of $0.1167 per share to shareholders of record. The Policy would result in a return of capital to shareholders, if the amount of the distribution exceeds the Fund's net investment income and realized capital gains. A return of capital may occur, for example, when some or all of the money that you invested in the Fund is paid back to you. A return of capital distribution does not necessarily reflect the Fund's investment performance and should not be confused with "yield" or "income."
The amounts and sources of distributions reported in the Fund's notices pursuant to Section 19(a) of the Investment Company Act of 1940 are only estimates and are not being provided for tax reporting purposes. The actual amounts and sources of the amounts for tax reporting purposes will depend upon the Fund's investment experience during its fiscal year and may be subject to changes based on tax regulations. The Fund will send you a Form 1099-DIV for the calendar year that tells you how to report distributions for federal income tax purposes.
You should not draw any conclusions about the Fund's investment performance from the amount of distributions pursuant to the Policy or from the terms of the Policy. The Policy has been established by the Trustees and may be changed or terminated by them without shareholder approval. The Trustees regularly review the Policy and the frequency and rate of distributions considering the purpose and effect of the Policy, the financial market environment, and the Fund's income, capital gains and capital available to pay distributions. The suspension or termination of the Policy could have the effect of creating a trading discount or widening an existing trading discount. At this time there are no reasonably foreseeable circumstances that might cause the Trustees to terminate the Policy.
Consider these risks before investing: As with any investment company that invests in equity securities, the Fund is subject to market risk—the possibility that the prices of equity securities will decline over short or extended periods of time. As a result, the value of an investment in the Fund's shares will fluctuate with the market generally and market sectors in particular. You could lose money over short or long periods of time. Political and economic news can influence marketwide trends and can cause disruptions in the U.S. or world financial markets. Other factors may be ignored by the market as a whole but may cause movements in the price of one company's stock or the stock of companies in one or more industries. All of these factors may have a greater impact on initial public offerings and emerging company shares. Different types of equity securities tend to shift into and out of favor with investors, depending on market and economic conditions. The performance of funds that invest in equity securities of Healthcare Companies may at times be better or worse than the performance of funds that focus on other types of securities or that have a broader investment style.
TEKLA WORLD HEALTHCARE FUND
Dear Shareholders,
The healthcare/biotechnology sector was quite volatile during the six month period ended March 31, 2019. As can be seen in the graph below, the illustrated indices declined very significantly in the fourth quarter of 2018, particularly during December 2018. This was among the most aggressive short-term declines we have seen in recent years. Conversely, in the first quarter of 2019, we observed one of the most prolific short-term advances the healthcare/biotechnology sector has seen in many years. The result, while demonstrating quite high volatility in the report period, in aggregate left the sector and the Fund down moderately for the reporting period.
6 Month Performance Ending March 31, 2019

The question this leaves us with is: What happened and what might we expect going forward? Our sector is usually most affected by the results from individual scientific news, clinical trial results and regulatory approval/rejection as well as merger and acquisition (M&A) activity. We have observed such occurrences in recent months. During the first quarter of 2019, we saw both encouraging and disappointing events. These include a significant positive, the proposed acquisition of Celgene Corporation by Bristol-Myers Squibb Company, which is the biggest proposed acquisition in our sector in some years. Other significant and encouraging events were also seen. Conversely, the pivotal clinical trial failure of Biogen Inc.'s Aducanumab was also reported in the first quarter of 2019. The clinical trial result was probably the most highly anticipated event expected within the next year. Its failure has damaged the so-called amyloid hypothesis, a heretofore putative strategy for treating Alzheimer's Disease. We have certainly seen other positive clinical and regulatory developments in recent months but the Aducanumab trial failure was extremely disappointing.
We will continue to see, evaluate and report on positive and negative events, but we think macro related sentiment will have no less impact than events on sector performance in the short to intermediate term. As you are undoubtedly aware, in 2018 healthcare comprises nearly 18% of
1
U.S. GDP making it among the biggest sectors in the U.S. economy. Costs to provide healthcare products and services are widely considered to be too high. Opinions regarding how these costs should be controlled and paid for have been hotly debated for many years but have reached a crescendo of late. As the 2020 U.S. presidential election approaches, it is pretty clear to us that healthcare is and will be a topic that receives great attention. As prospects grow or fade for individual candidates (including the incumbent), we expect sentiment for, as well as the value of, the healthcare sector to improve or decline in tandem. We think that these macro factors will be as important to the healthcare sector as fundamentals for the next twelve to eighteen months.
In the medium to long term, headlines aside, we do not think there will be dramatic change in how healthcare is paid for or delivered. In the end, it seems likely to us that we will continue to have a system that is highly market dependent. Drugs that are differentiated and patent protected will sell well and receive premium pricing while generic drugs (which already comprise ~90% of prescriptions written) will also sell well but will be competitively priced. The Fund will continue to predominantly invest in companies that invent, develop and commercialize differentiated drugs that address unmet medical needs. We think that upon commercialization, such drugs will receive pricing that rewards the companies and their investors for risks taken in development and allow appropriate profit for the innovator. We will also continue to invest in companies that make generic drugs efficiently. We anticipate the general trend will be to increase utilization and that the "winners" in the generic drug space will be those that make (and sell) such drugs cheaply and well. Given that the quantity of generic drugs sold will continue to increase, we think there remains an opportunity to profitably invest in efficient manufacturers of such drugs.
We note that in the last ten years, the annualized return of the NASDAQ Biotechnology Index®* ("NBI") (+18.31%) has exceeded that of the S&P 500® Index* ("SPX") (+15.91%) while the S&P Global 1200 Health Care Index®* ("SGH") (+14.88%) underperformed the SPX.
As always, we thank you for your consideration of the Tekla Funds. Please call our distribution partner Destra Capital or us if you have any questions.
Be well,
Daniel R. Omstead, PhD
President and Portfolio Manager
2
TEKLA WORLD HEALTHCARE FUND
Fund Essentials
Objective of the Fund
The Fund's investment objective is to seek current income and long-term capital appreciation.
Description of the Fund
Tekla World Healthcare Fund ("THW") is a non-diversified closed-end fund traded on the New York Stock Exchange under the ticker THW. THW employs a versatile growth and income investment strategy investing across all healthcare subsectors and across a company's full capital structure. THW places an emphasis on innovative healthcare companies worldwide and invests at least 40% of managed assets in non-U.S. companies.
Investment Philosophy
Tekla Capital Management LLC, the Investment Adviser to the Fund, believes that:
• Aging demographics and adoption of new medical products and services may provide long-term tailwinds for healthcare companies
• Opportunities outside the United States may be underappreciated and timely
• Investment opportunity spans the globe including biotechnology, healthcare technology, life sciences and medical devices
• The potential for value creation may exist in companies both inside and outside the United States that are commercializing novel technologies
Fund Overview and Characteristics as of 3/31/19
Market Price1 | | $12.81 | |
NAV2 | | $13.97 | |
Premium/(Discount) | | -8.30% | |
Average 30 Day Volume | | 93,640 | |
Net Assets | | $421,185,072 | |
Managed Assets | | $541,185,072 | |
Leverage Outstanding | | $120,000,000 | |
Total Leverage Ratio3 | | 22.17% | |
Ticker | | THW | |
NAV Ticker | | XTHWX | |
Commencement of
Operations Date | |
6/30/15 | |
Fiscal Year
to Date
Distributions
per Share | | $0.70 | |
1 The closing price at which the Fund's shares were traded on the exchange.
2 Per-share dollar value of the Fund, calculated by dividing the total value of all the securities in its portfolio, plus any other assets and less liabilities, by the number of Fund shares outstanding.
3 As a percentage of managed assets
Holdings of the Fund (Data is based on net assets)
Asset Allocation as of 3/31/19

Sector Diversification as of 3/31/19
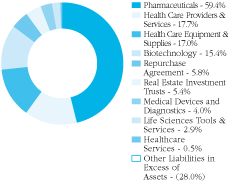
This data is subject to change on a daily basis.
3
TEKLA WORLD HEALTHCARE FUND
Largest Holdings by Issuer
(Excludes Short-Term Investments)
As of March 31, 2019
(Unaudited)
| Issuer – Sector | | % of Net
Assets | |
| Johnson & Johnson – Pharmaceuticals | | | 7.8 | % | |
| Novartis AG – Pharmaceuticals | | | 6.8 | % | |
| Pfizer Inc. – Pharmaceuticals | | | 5.2 | % | |
| Merck & Co., Inc. – Pharmaceuticals | | | 4.5 | % | |
| Medtronic plc – Health Care Equipment & Supplies | | | 4.2 | % | |
| UnitedHealth Group Incorporated – Health Care Providers & Services | | | 4.0 | % | |
| AstraZeneca PLC – Pharmaceuticals | | | 3.5 | % | |
| Amgen Inc. – Biotechnology | | | 3.2 | % | |
| Roche Holding AG – Pharmaceuticals | | | 3.2 | % | |
| Novo Nordisk A/S – Pharmaceuticals | | | 3.1 | % | |
| Allergan plc – Pharmaceuticals | | | 3.1 | % | |
| GlaxoSmithKline plc – Pharmaceuticals | | | 2.6 | % | |
| Bayer AG – Pharmaceuticals | | | 2.6 | % | |
| HCA Healthcare, Inc. – Health Care Providers & Services | | | 2.2 | % | |
| Bristol-Myers Squibb Company – Pharmaceuticals | | | 2.1 | % | |
| Eli Lilly and Company – Pharmaceuticals | | | 2.1 | % | |
| Gilead Sciences, Inc. – Biotechnology | | | 2.1 | % | |
| Sanofi – Pharmaceuticals | | | 1.9 | % | |
| Anthem, Inc. – Health Care Providers & Services | | | 1.9 | % | |
| CVS Health Corporation – Health Care Providers & Services | | | 1.9 | % | |
COUNTRY DIVERSIFICATION
As of March 31, 2019 (Unaudited) | | % of Net
Assets | | % of Managed
Assets | |
United States | | | 87.1 | % | | | 67.8 | % | |
Switzerland | | | 10.4 | % | | | 8.1 | % | |
United Kingdom | | | 9.1 | % | | | 7.1 | % | |
Ireland | | | 7.4 | % | | | 5.8 | % | |
Denmark | | | 3.5 | % | | | 2.7 | % | |
Japan | | | 2.7 | % | | | 2.1 | % | |
Germany | | | 2.6 | % | | | 2.1 | % | |
France | | | 2.6 | % | | | 2.0 | % | |
Netherlands | | | 0.9 | % | | | 0.7 | % | |
Israel | | | 0.6 | % | | | 0.5 | % | |
China | | | 0.5 | % | | | 0.4 | % | |
Belgium | | | 0.3 | % | | | 0.3 | % | |
India | | | 0.3 | % | | | 0.2 | % | |
4
Fund Performance
THW is a closed-end fund which invests predominantly in healthcare companies. Subject to regular consideration, the Trustees of THW have instituted a policy of making monthly distributions to shareholders.
The Fund invests in equity and debt of healthcare companies. The Fund seeks to benefit from the earnings growth of the healthcare industry while capturing income. Income is derived from multiple sources including equity dividends, fixed income coupons, real estate investment trust distributions, convertible securities coupons and selective equity covered call writing premiums. In order to accomplish its objectives, THW often holds a majority of its assets in equities. Allocation of assets to various healthcare sectors can vary significantly as can the percentage of the portfolio which is overwritten. Under normal market conditions, the Fund expects to invest at least 40 percent of its managed assets in companies organized or located outside of the U.S. or companies that do a substantial amount of business outside the U.S. ("Foreign Issuers").
The Fund may invest up to 20 percent of managed assets, measured at the time of investment, in non-convertible debt of healthcare companies. It may also invest up to 20 percent of managed assets in healthcare REITs. The Fund may also hold up to 30 percent of managed assets in convertible securities and may invest a portion of its assets in restricted securities. In order to generate additional "current" income THW often sells (or writes) calls against a material portion of its equity assets. The portion of equity assets overwritten can vary, but usually represents less than 20 percent of managed assets. At times, the overwritten portion of assets is materially less than 20 percent of managed assets. The use of covered calls is intended to produce "current" income, but may limit upside in bullish markets. The Fund may also use leverage to enhance yield. The Fund may incur leverage up to 20 percent of managed assets at the time of borrowing. "Managed assets" means the total assets of the Fund (including any assets attributable to borrowings for investment purposes) minus the sum of the Fund's accrued liabilities (other than liabilities representing borrowings for investment purposes).
The Fund considers investments in companies of all sizes and in all healthcare subsectors, including but not limited to, biotechnology, pharmaceuticals, healthcare equipment, healthcare supplies, life science tools and services, healthcare distributors, managed healthcare, healthcare technology, and healthcare facilities. The Fund expects to invest at least 40 percent of managed assets in companies organized or located outside the United States or companies that do a substantial amount of business outside the United States. The Fund also emphasizes innovation, investing both in public and pre-public venture companies. The Fund considers its pre-public and other restricted investments to be a differentiating
5
characteristic. Among the various healthcare subsectors, THW has considered the biotechnology subsector, including both pre-public and public companies, to be a key contributor to the healthcare sector. The Fund holds biotech assets, including both public and pre-public, often representing 10-25% of net assets.
There is no commonly published index which matches the investment strategy of THW. With respect to the Fund's equity investments, THW often holds 20-35% of its assets in biotechnology. By contrast, the SGH consists of more than 100 global companies representing most or all of the healthcare subsectors in which THW typically invests; biotechnology often represents up to 20% of this index. By contrast, the NBI, which contains approximately 220 constituents, is much more narrowly constructed. The vast majority of this index is comprised of biotechnology, pharmaceutical and life science tools companies. In recent years, biotechnology has often represented 72-82% of the NBI. Neither the SGH nor NBI indices contain any material amount of pre-public company assets.
The S&P 500® Health Care Corporate Bond Index®* ("SP5HCBIT") measures the performance of U.S. corporate debt issued by constituents in the healthcare sector of the SPX. This index is generally reflective of the debt assets in which THW invests though the Fund invests in the SPX index debt components as well as those of smaller capitalization companies.
The FTSE NAREIT Health Care Property Sector Index®* ("FNHEA") is comprised of U.S. publicly traded REITs in the healthcare sector. This index is generally reflective of the REITs in which THW invests.
Given the circumstances, we present both NAV and stock returns for the Fund in comparison to several commonly published indices. We note that THW is a dynamically configured multi-asset class global healthcare growth and income fund. There is no readily available index comprised of similar characteristics to THW and to which THW can directly be compared. Therefore, we provide returns for a number of indices representing the major components of THW's assets. Having said this, we note that there are no readily available indices representing the covered call strategy employed by THW or the restricted security components of THW. The following data for available funds over the six-month and one-year periods are provided for comparison.
Fund Performance for the Period Ended March 31, 2019
Period | | THW NAV | | THW MKT | | NBI | | SGH | | SPX | | SP5HCBIT | | FNHEA | |
| 6 month | | | -3.13 | | | | -3.58 | | | | -8.18 | | | | -1.66 | | | | -1.73 | | | | 4.66 | | | | 16.50 | | |
| 1 year | | | 11.11 | | | | 11.09 | | | | 5.24 | | | | 12.78 | | | | 9.48 | | | | 5.24 | | | | 36.47 | | |
inception | | | 1.53 | | | | -2.07 | | | | -2.29 | | | | 5.27 | | | | 10.51 | | | | 4.29 | | | | 8.44 | | |
Inception date June 26, 2015
6

All performance over one-year has been annualized.
Performance data quoted represents past performance, which is no guarantee of future results, and current performance may be lower or higher than the figures shown. The NAV total return takes into account the Fund's total annual expenses and does not reflect transaction charges. If transaction charges were reflected, NAV total return would be reduced. All distributions are assumed to be reinvested either in accordance with the dividend reinvestment plan (DRIP) for market price returns or NAV for NAV returns. Until the dRIP price is available from the Plan Agent, the market price returns reflect the reinvestment at the closing market price on the last business day of the month. Once the DRIP is available around mid-month, the market price returns are updated to reflect reinvestment at the DRIP price.
Portfolio Highlights as of March 31, 2019
Among other investments, Tekla World Healthcare's performance benefitted in the past year by the following:
Eisai Co., Ltd. (4523 JP) is a large-cap Japanese healthcare conglomorate that sells, among other categories, branded drugs, medical equipment, foods, and lifestock feed. The largest value drivers in the report period for Eisai were the pivotal trials for aducanumab in Alzheimer's with which Eisai was partnered with Biogen Inc. We attributed low probability of success for both these trials. For this reason we positioned the Fund to be underweight both the unconfirmed futility analysis and the ultimate data anticipated February 2020. Biogen and Eisai announced the discontinuation of both trials on March 21, 2019.
Amarin Corporation plc (AMRN) has appreciated in value since the surprisingly strong dyslipidemia outcomes data from the REDUCE-IT study late in 2018. The financial markets believe that the company is a potential acquisition target. Over time, we have built an overweight position into the stock's relative strength, benefiting the Fund's portfolio.
Celltrion Inc. (068270 KS) is a South Korea-based biotech company focused on biosimilars, with three marketed products in EU—Remsima (biosimilar Remicade), Truxima (biosimilar Rituxan) and Herzuma (biosimilar Herceptin). We remain underweight the stock which has been weak due to pricing pressure as biosimilars become more commoditized in the EU. Truxima and Herzuma are expected to launch soon in the US, but the overall landscape for biosimilar adoption and pricing remains uncertain.
7
Among other examples, THW's performance was negatively impacted by the following investments:
Allergan plc (AGN) is a large-cap specialty pharma company with a focus on aesthetics, neurology, ophthalmology, and gastroenterology. The company has suffered a number of setbacks to its late-stage pipeline and its core Botox franchise is facing competition on both the aesthetic (from cheaper or longer lasting products) and therapeutic (from CGRP inhibitors in migraine) fronts, although we expect both franchises to remain durable. Activist investors are pushing for a separation of the CEO and Chairman roles as well as a potential break-up and sale of the company as a way to unlock value.
Bayer AG (BAYN GR) is a large-cap European diversified company with both pharma and agricultural businesses. The company has been undergoing a transformative reorganization starting with the divestment of their Chemicals business unit into Covestro in 2015 and continuing with the recent acquisition of agricultural giant Monsanto. Notably, Monsanto's Roundup product has been the subject of several high profile litigations with initial verdicts going against the company and causing the stock to underperform over the last 6 months.
Teva Pharmaceutical (TEVA) is one of the largest manufacturers of generic pharmaceuticals. The generic drug industry has faced significant headwinds over the past several years due to increased competition, fewer blockbuster drugs rolling off patent, consolidation among large buying consortiums, and uncertainty around opioid drug litigation. Overall, this has led to persistent generic price deflation and a challenging operating environment. Following a management change in late 2017, turnaround efforts have included the rationalization of unprofitable products and significant cost cutting efforts. Overall, TEVA's restructuring efforts and stabilization of generic deflation helps position the company to deleverage its balance sheet and return to growth in 2020. We have decreased our ownership of this stock in recent quarters, but Fund performance was negatively affected in the reporting period.
*The trademarks NASDAQ Biotechnology Index®, S&P Composite 1500® Healthcare Index, S&P Global 1200 Health Care Index®, FTSE NAREIT Healthcare Property Sector Index®, S&P 500® Health Care Corporate Bond Index, and S&P 500® Index referenced in this report are the property of their respective owners. These trademarks are not owned by or associated with the Fund or its service providers, including Tekla Capital Management LLC.
8
TEKLA WORLD HEALTHCARE FUND
SCHEDULE OF INVESTMENTS
MARCH 31, 2019
(Unaudited)
PRINCIPAL
AMOUNT | | CONVERTIBLE AND NON-CONVERTIBLE
NOTES - 17.0% of Net Assets | |
VALUE | |
|
| | | Convertible Notes (Restricted) (a) - 0.2%
of Net Assets | |
| |
| | | United States - 0.2% | |
$ | 70,629 | | | IlluminOss Medical, Inc. Promissory Note,
8.00% due 06/30/19 | | $ | 70,629 | | |
| | 23,533 | | | IlluminOss Medical, Inc. Promissory Note,
8.00% due 06/30/19 | | | 23,533 | | |
| | 47,065 | | | IlluminOss Medical, Inc. Promissory Note,
8.00% due 06/30/19 | | | 47,065 | | |
| | 47,065 | | | IlluminOss Medical, Inc. Promissory Note,
8.00% due 06/30/19 | | | 47,065 | | |
| | 58,832 | | | IlluminOss Medical, Inc. Promissory Note,
8.00% due 06/30/19 | | | 58,832 | | |
| | 45,997 | | | IlluminOss Medical, Inc. Promissory Note,
8.00% due 06/30/19 | | | 45,997 | | |
| | 214,962 | | | Rainier Therapeutics, Inc. Promissory Note,
8.00% due 01/30/20 | | | 214,962 | | |
| | 214,962 | | | Rainier Therapeutics, Inc. Promissory Note,
8.00% due 01/30/20 | | | 214,962 | | |
| | | | | TOTAL CONVERTIBLE NOTES | | | 723,045 | | |
| | | | | Non-Convertible Notes - 16.8% of Net Assets | | | |
| | | Ireland - 0.5% | |
| | 3,000,000 | | | Endo Ltd/Endo Finance LLC/Endo Finco Inc.,
6.00% due 02/01/25 (b) | | | 2,169,840 | | |
| | | United Kingdom - 1.0% | |
| | 4,000,000 | | | Hikma Pharmaceuticals PLC, 4.25%
due 04/10/20 (c) | | | 3,999,760 | | |
| | | United States - 15.3% | |
| | 3,200,000 | | | AbbVie Inc., 4.50% due 05/14/35 | | | 3,130,180 | | |
| | 4,100,000 | | | Allergan Funding SCS, 4.55% due 03/15/35 | | | 4,015,379 | | |
| | 2,000,000 | | | Amgen Inc., 3.63% due 05/22/24 | | | 2,053,348 | | |
| | 4,475,000 | | | Amgen Inc., 4.66% due 06/15/51 | | | 4,500,766 | | |
| | 831,000 | | | Baxalta Inc., 4.00% due 06/23/25 | | | 849,445 | | |
| | 1,200,000 | | | Becton, Dickinson and Company, 3.73%
due 12/15/24 | | | 1,218,376 | | |
| | 3,000,000 | | | DaVita, Inc., 5.00% due 05/01/25 | | | 2,874,750 | | |
| | 4,000,000 | | | EMD Finance LLC, 3.25% due 03/19/25 (b) | | | 3,934,084 | | |
| | 3,000,000 | | | Encompass Health Corporation, 5.75%
due 11/01/24 | | | 3,037,500 | | |
The accompanying notes are an integral part of these financial statements.
9
TEKLA WORLD HEALTHCARE FUND
SCHEDULE OF INVESTMENTS
MARCH 31, 2019
(Unaudited, continued)
PRINCIPAL
AMOUNT | | United States - continued | | VALUE | |
$ | 1,385,000 | | | Express Scripts Holding Company, 3.50%
due 06/15/24 | | $ | 1,395,837 | | |
| | 3,000,000 | | | Gilead Sciences, Inc., 4.60% due 09/01/35 | | | 3,148,834 | | |
| | 2,000,000 | | | GlaxoSmithKline Capital Inc., 2.80%
due 03/18/23 | | | 2,003,427 | | |
| | 1,200,000 | | | HCA Healthcare, Inc., 5.25% due 04/15/25 | | | 1,288,535 | | |
| | 2,000,000 | | | HCA Healthcare, Inc., 5.88% due 05/01/23 | | | 2,132,500 | | |
| | 2,500,000 | | | HCA Healthcare, Inc., 5.38% due 02/01/25 | | | 2,650,000 | | |
| | 2,630,000 | | | HCP, Inc., 4.20% due 03/01/24 | | | 2,721,726 | | |
| | 8,000,000 | | | Mallinckrodt International Finance SA/
Mallinckrodt CB LLC, 5.50% due 04/15/25 (b) | | | 6,240,000 | | |
| | 1,200,000 | | | McKesson Corporation, 3.80% due 03/15/24 | | | 1,224,951 | | |
| | 1,200,000 | | | Medtronic, Inc., 4.38% due 03/15/35 | | | 1,310,194 | | |
| | 1,463,000 | | | Merck & Co., Inc., 2.75% due 02/10/25 | | | 1,465,612 | | |
| | 2,115,000 | | | Novartis Capital Corporation, 3.40%
due 05/06/24 | | | 2,188,466 | | |
| | 3,500,000 | | | Senior Housing Properties Trust, 4.75%
due 05/01/24 | | | 3,460,492 | | |
| | 3,000,000 | | | Tenet Healthcare Corporation, 6.75%
due 06/15/23 | | | 3,090,000 | | |
| | 5,000,000 | | | Zimmer Biomet Holdings, Inc., 4.25%
due 08/15/35 | | | 4,569,763 | | |
| | | | 64,504,165 | | |
| | | | | TOTAL NON-CONVERTIBLE NOTES | | | 70,673,765 | | |
| | | | | TOTAL CONVERTIBLE AND
NON-CONVERTIBLE NOTES
(Cost $73,084,905) | | | 71,396,810 | | |
SHARES | | CONVERTIBLE PREFERRED AND WARRANTS
(Restricted) (a) (d) - 1.6% | |
| |
| | | Switzerland - 0.3% | |
| | 136,200 | | | Oculis SA, Series B2 | | | 1,138,841 | | |
| | | United States - 1.3% | |
| | 386,266 | | | Atreca, Inc. Series C1 | | | 900,000 | | |
| | 569,450 | | | Decipher Biosciences, Inc. Series II, 8.00% | | | 516,491 | | |
| | 566,122 | | | Decipher Biosciences, Inc. Series III, 8.00% | | | 1,229,617 | | |
| | 569,028 | | | Galera Therapeutics, Inc. Series C, 6.00% | | | 1,259,999 | | |
| | 206,483 | | | IlluminOss Medical, Inc. Junior
Preferred, 8.00% | | | 206,483 | | |
The accompanying notes are an integral part of these financial statements.
10
TEKLA WORLD HEALTHCARE FUND
SCHEDULE OF INVESTMENTS
MARCH 31, 2019
(Unaudited, continued)
SHARES | | United States - continued | | VALUE | |
| | 219,196 | | | IlluminOss Medical, Inc. Series AA, 8.00% | | $ | 219,196 | | |
| | 17,657 | | | IlluminOss Medical, Inc. Warrants (expiration
03/31/27, exercise price $1.00) | | | 0 | | |
| | 14,707 | | | IlluminOss Medical, Inc. Warrants (expiration
09/06/27, exercise price $1.00) | | | 0 | | |
| | 5,883 | | | IlluminOss Medical, Inc. Warrants (expiration
11/20/27, exercise price $1.00) | | | 0 | | |
| | 11,766 | | | IlluminOss Medical, Inc. Warrants (expiration
01/11/28, exercise price $1.00) | | | 0 | | |
| | 11,766 | | | IlluminOss Medical, Inc. Warrants (expiration
02/06/28, exercise price $1.00) | | | 0 | | |
| | 11,499 | | | IlluminOss Medical, Inc. Warrants (expiration
01/29/29, exercise price $1.00) | | | 0 | | |
| | 1,307,690 | | | Rainier Therapeutics, Inc. Series A, 6.00% | | | 849,999 | | |
| | 757,575 | | | Rainier Therapeutics, Inc. Series B, 6.00% | | | 566,666 | | |
| | | | 5,748,451 | | |
| | | | | TOTAL CONVERTIBLE PREFERRED AND
WARRANTS
(Cost $8,182,188) | | | 6,887,292 | | |
| | | COMMON STOCKS AND WARRANTS - 103.6%
of Net Assets | |
| |
| | | Belgium - 0.3% | |
| | 12,099 | | | Galapagos NV (d) | | | 1,410,137 | | |
| | | China - 0.5% | |
| | 16,900 | | | BeiGene, Ltd. (d) (e) | | | 2,230,800 | | |
| | | Denmark - 3.5% | |
| | 9,650 | | | Genmab A/S (d) | | | 1,674,693 | | |
| | 251,600 | | | Novo Nordisk A/S (e) | | | 13,161,196 | | |
| | | | 14,835,889 | | |
| | | France - 2.5% | |
| | 98,335 | | | Cellectis S.A. (d) (e) | | | 1,803,464 | | |
| | 137,734 | | | Innate Pharma SA (d) | | | 968,735 | | |
| | 179,900 | | | Sanofi (e) | | | 7,965,972 | | |
| | | | 10,738,171 | | |
The accompanying notes are an integral part of these financial statements.
11
TEKLA WORLD HEALTHCARE FUND
SCHEDULE OF INVESTMENTS
MARCH 31, 2019
(Unaudited, continued)
SHARES | | Germany - 2.6% | | VALUE | |
| | 172,395 | | | Bayer AG | | $ | 11,138,926 | | |
| | | India - 0.3% | |
| | 28,950 | | | Dr. Reddy's Laboratories Ltd. (e) | | | 1,172,475 | | |
| | | Ireland - 6.9% | |
| | 62,406 | | | Allergan plc (f) | | | 9,136,862 | | |
| | 42,700 | | | Amarin Corporation plc (d) (e) (f) | | | 886,452 | | |
| | 496,788 | | | Avadel Pharmaceuticals plc (d) (e) | | | 715,375 | | |
| | 36,963 | | | Endo International plc (d) (f) | | | 296,813 | | |
| | 32,980 | | | Mallinckrodt plc (d) (f) | | | 716,985 | | |
| | 177,858 | | | Medtronic plc (f) | | | 16,199,307 | | |
| | 21,718 | | | Perrigo Company plc (f) | | | 1,045,939 | | |
| | | | 28,997,733 | | |
| | | Israel - 0.6% | |
| | 163,865 | | | Teva Pharmaceutical Industries Limited (d) (e) | | | 2,569,403 | | |
| | | Japan - 2.7% | |
| | 17,457 | | | Astellas Pharma Inc | | | 261,233 | | |
| | 10,800 | | | Chugai Pharmaceuticals Co., Ltd. | | | 741,568 | | |
| | 39,100 | | | Daiichi Sankyo Company Limited | | | 1,799,242 | | |
| | 4,114 | | | Hoya Corp | | | 271,310 | | |
| | 35,746 | | | Otsuka Holdings Co., Ltd. | | | 1,402,683 | | |
| | 4,453 | | | Shionogi & Co Ltd. | | | 275,304 | | |
| | 140,400 | | | Sosei Group Corporation (d) | | | 1,906,542 | | |
| | 178,128 | | | Takeda Pharmaceuticals Company Limited (d) (e) | | | 3,628,467 | | |
| | 19,200 | | | Takeda Pharmaceuticals Company Limited | | | 783,210 | | |
| | 8,676 | | | Terumo Corp | | | 264,593 | | |
| | | | 11,334,152 | | |
| | | Netherlands - 0.9% | |
| | 75,782 | | | Mylan N.V. (d) (f) | | | 2,147,662 | | |
| | 53,785 | | | Wright Medical Group N.V. (d) (f) | | | 1,691,538 | | |
| | | | 3,839,200 | | |
| | | Switzerland - 10.1% | |
| | 8,219 | | | Lonza Group AG (d) | | | 2,548,860 | | |
| | 276,847 | | | Novartis AG (e) (f) | | | 26,616,070 | | |
| | 387,400 | | | Roche Holding AG (e) | | | 13,322,686 | | |
| | | | 42,487,616 | | |
The accompanying notes are an integral part of these financial statements.
12
TEKLA WORLD HEALTHCARE FUND
SCHEDULE OF INVESTMENTS
MARCH 31, 2019
(Unaudited, continued)
SHARES | | United Kingdom - 8.2% | | VALUE | |
| | 79,748 | | | Adaptimmune Therapeutics plc (d) (e) | | $ | 342,916 | | |
| | 360,998 | | | AstraZeneca PLC (e) | | | 14,595,149 | | |
| | 6,300 | | | Cardinal Health, Inc. | | | 303,345 | | |
| | 218,700 | | | GlaxoSmithKline plc (e) | | | 9,139,473 | | |
| | 23,569 | | | Hikma Pharmaceuticals PLC | | | 549,945 | | |
| | 185,478 | | | Smith & Nephew plc (e) | | | 7,439,523 | | |
| | 1,282,978 | | | Verona Pharma plc (d) | | | 952,478 | | |
| | 159,500 | | | Verona Pharma plc (d) (e) | | | 996,875 | | |
| | 513,192 | | | Verona Pharma plc Warrants (expiration
04/27/22, exercise price $2.07) (a) (d) | | | 54,074 | | |
| | | | 34,373,778 | | |
| | | United States - 64.5% | |
| | 97,284 | | | Abbott Laboratories | | | 7,776,883 | | |
| | 21,313 | | | AbbVie Inc. | | | 1,717,615 | | |
| | 5,043 | | | ABIOMED, Inc. (d) | | | 1,440,230 | | |
| | 38,342 | | | Acadia Healthcare Company, Inc. (d) | | | 1,123,804 | | |
| | 12,111 | | | Alexion Pharmaceuticals, Inc. (d) | | | 1,637,165 | | |
| | 5,128 | | | Align Technology, Inc. (d) | | | 1,458,044 | | |
| | 32,919 | | | AmerisourceBergen Corporation (f) | | | 2,617,719 | | |
| | 35,965 | | | Amgen Inc. | | | 6,832,631 | | |
| | 27,563 | | | Anthem, Inc. (f) | | | 7,910,030 | | |
| | 319,235 | | | Ardelyx, Inc. (d) | | | 893,858 | | |
| | 168,812 | | | Bausch Health Cos, Inc. (d) (f) | | | 4,169,656 | | |
| | 21,837 | | | Baxter International Inc. | | | 1,775,566 | | |
| | 14,588 | | | Becton, Dickinson and Company | | | 3,643,061 | | |
| | 15,835 | | | Biogen Inc. (d) (f) | | | 3,743,077 | | |
| | 76,935 | | | Boston Scientific Corporation (d) (f) | | | 2,952,765 | | |
| | 186,241 | | | Bristol-Myers Squibb Company (f) | | | 8,885,558 | | |
| | 71,400 | | | Celgene Corporation (d) | | | 6,735,876 | | |
| | 7,053 | | | Celldex Therapeutics, Inc. (d) | | | 34,701 | | |
| | 34,925 | | | Centene Corporation (d) | | | 1,854,517 | | |
| | 22,273 | | | Cigna Corporation (d) | | | 3,581,944 | | |
| | 94,900 | | | Community Health Systems, Inc. (d) | | | 353,977 | | |
| | 144,689 | | | CVS Health Corporation (f) | | | 7,803,078 | | |
| | 34,005 | | | Danaher Corporation | | | 4,489,340 | | |
| | 36,623 | | | Dentsply Sirona, Inc. (f) | | | 1,816,135 | | |
| | 86,944 | | | Diplomat Pharmacy, Inc. (d) | | | 505,145 | | |
| | 11,596 | | | Edwards Lifesciences Corporation (d) (f) | | | 2,218,663 | | |
| | 68,073 | | | Eli Lilly and Company | | | 8,833,152 | | |
| | 84,475 | | | Gilead Sciences, Inc. | | | 5,491,720 | | |
| | 73,400 | | | Global Medical REIT Inc. | | | 720,788 | | |
| | 23,934 | | | HCA Healthcare, Inc. | | | 3,120,515 | | |
The accompanying notes are an integral part of these financial statements.
13
TEKLA WORLD HEALTHCARE FUND
SCHEDULE OF INVESTMENTS
MARCH 31, 2019
(Unaudited, continued)
SHARES | | United States - continued | | VALUE | |
| | 45,500 | | | HCP, Inc. | | $ | 1,424,150 | | |
| | 68,000 | | | Healthcare Realty Trust Incorporated | | | 2,183,480 | | |
| | 46,000 | | | Healthcare Trust of America, Inc. | | | 1,315,140 | | |
| | 3,455 | | | Hologic, Inc. (d) | | | 167,222 | | |
| | 11,925 | | | Humana Inc. | | | 3,172,050 | | |
| | 9,405 | | | IDEXX Laboratories, Inc. (d) | | | 2,102,958 | | |
| | 9,179 | | | Illumina, Inc. (d) | | | 2,851,823 | | |
| | 27,933 | | | Incyte Corporation (d) | | | 2,402,517 | | |
| | 7,953 | | | Intuitive Surgical, Inc. (d) (f) | | | 4,537,823 | | |
| | 4,161 | | | IQVIA Holdings, Inc. (d) | | | 598,560 | | |
| | 236,024 | | | Johnson & Johnson (f) | | | 32,993,795 | | |
| | 85,400 | | | Koninklijke Philips N.V. | | | 3,489,444 | | |
| | 13,533 | | | Laboratory Corporation of America Holdings (d) | | | 2,070,278 | | |
| | 11,400 | | | LivaNova PLC (d) (f) | | | 1,108,650 | | |
| | 19,299 | | | LTC Properties, Inc. | | | 883,894 | | |
| | 2,624 | | | Masimo Corporation (d) (f) | | | 362,847 | | |
| | 15,950 | | | McKesson Corporation | | | 1,867,107 | | |
| | 67,954 | | | Medical Properties Trust, Inc. | | | 1,257,829 | | |
| | 11,100 | | | Medicines Company (The) (d) (f) | | | 310,245 | | |
| | 211,506 | | | Merck & Co., Inc. (f) | | | 17,590,954 | | |
| | 15,602 | | | Nektar Therapeutics (d) | | | 524,227 | | |
| | 52,504 | | | New Senior Investment Group Inc. | | | 286,147 | | |
| | 213,000 | | | Novavax, Inc. (d) | | | 117,342 | | |
| | 49,471 | | | Omega Healthcare Investors, Inc. | | | 1,887,319 | | |
| | 511,389 | | | Pfizer Inc. (f) | | | 21,718,691 | | |
| | 55,300 | | | Physicians Realty Trust | | | 1,040,193 | | |
| | 22,900 | | | Quest Diagnostics, Inc. | | | 2,059,168 | | |
| | 23,725 | | | Quorum Health Corporation (d) | | | 33,215 | | |
| | 4,250 | | | Regeneron Pharmaceuticals, Inc. (d) | | | 1,745,135 | | |
| | 6,972 | | | ResMed Inc. | | | 724,879 | | |
| | 71,128 | | | Sabra Health Care REIT, Inc. | | | 1,384,862 | | |
| | 63,841 | | | Senior Housing Properties Trust | | | 752,047 | | |
| | 31,391 | | | STERIS Plc | | | 4,018,990 | | |
| | 29,892 | | | Stryker Corporation (f) | | | 5,904,268 | | |
| | 24,900 | | | Thermo Fisher Scientific Inc. | | | 6,815,628 | | |
| | 68,683 | | | UnitedHealth Group Incorporated | | | 16,982,559 | | |
| | 1,158 | | | Varian Medical Systems, Inc. (d) | | | 164,112 | | |
| | 22,250 | | | Ventas, Inc. | | | 1,419,772 | | |
| | 26,615 | | | Vertex Pharmaceuticals Incorporated (d) (f) | | | 4,895,829 | | |
| | 4,500 | | | WellCare Health Plans, Inc. (d) | | | 1,213,875 | | |
| | 24,860 | | | Welltower Inc. | | | 1,929,136 | | |
The accompanying notes are an integral part of these financial statements.
14
TEKLA WORLD HEALTHCARE FUND
SCHEDULE OF INVESTMENTS
MARCH 31, 2019
(Unaudited, continued)
SHARES | | United States - continued | | VALUE | |
| | 18,617 | | | Zimmer Biomet Holdings, Inc. | | $ | 2,377,391 | | |
| | 46,362 | | | Zoetis Inc. | | | 4,667,262 | | |
| | | | 271,490,026 | | |
| | | | | TOTAL COMMON STOCKS AND
WARRANTS
(Cost $501,887,738) | | | 436,618,306 | | |
PRINCIPAL
AMOUNT | | SHORT-TERM INVESTMENT - 5.8%
of Net Assets | | | |
$ | 24,363,000 | | | Repurchase Agreement, Fixed Income
Clearing Corp., repurchase value
$24,363,000, 0.50%, dated 03/29/19,
due 04/01/19 (collateralized by U.S.
Treasury Note 2.75%, due 08/15/21,
market value $24,475,000) | | | 24,363,000 | | |
| | | | | TOTAL SHORT-TERM INVESTMENT
(Cost $24,363,000) | | | 24,363,000 | | |
| | | | | TOTAL INVESTMENTS - 128.0%
(Cost $607,517,830) | | | 539,265,408 | | |
The accompanying notes are an integral part of these financial statements.
15
TEKLA WORLD HEALTHCARE FUND
SCHEDULE OF INVESTMENTS
MARCH 31, 2019
(Unaudited, continued)
NUMBER OF
CONTRACTS
(100 SHARES
EACH)/
NOTIONAL
AMOUNT ($) | | OPTION CONTRACTS
PURCHASED - 0.1% of Net Assets | | VALUE | |
| | CALL OPTION CONTRACTS
PURCHASED - 0.1% | | | | | |
35/1,260,000 | | Biogen Inc. Jun20 360 Call | | $ | 12,950 | | |
1,300/6,500,000 | | Bristol-Myers Squibb Company Jan20 50 Call | | | 416,000 | | |
| | TOTAL OPTION CONTRACTS
PURCHASED
(Premiums paid $757,201) | | | 428,950 | | |
| | OPTION CONTRACTS
WRITTEN - (0.1)% of Net Assets | |
| |
| | | CALL OPTION CONTRACTS
WRITTEN - (0.1)% | |
| |
93/(1,348,500) | | Allergan plc Apr19 145 Call | | | (33,480 | ) | |
427/(939,400) | | Amarin Corporation plc Apr19 22 Call | | | (40,565 | ) | |
162/(1,360,800) | | AmerisourceBergen Corporation
Apr19 84 Call | | | (7,290 | ) | |
34/(1,088,000) | | Anthem, Inc. Apr19 320 Call | | | (374 | ) | |
521/(1,354,600) | | Bausch Health Cos, Inc. Apr19 26 Call | | | (18,235 | ) | |
428/(1,690,600) | | Boston Scientific Corporation Apr19 39.5 Call | | | (17,120 | ) | |
1,300/(7,800,000) | | Bristol-Myers Squibb Company Jan20 60 Call | | | (91,000 | ) | |
223/(1,360,300) | | CVS Health Corporation Apr19 61 Call | | | (1,115 | ) | |
218/(1,090,000) | | Dentsply Sirona, Inc. Apr19 50 Call | | | (17,440 | ) | |
57/(1,111,500) | | Edwards Lifesciences Corporation
Apr19 195 Call | | | (14,535 | ) | |
225/(270,000) | | Endo International plc Apr19 12 Call | | | (8,325 | ) | |
304/(4,347,200) | | Johnson & Johnson Apr19 143 Call | | | (22,800 | ) | |
114/(1,083,000) | | LivaNova PLC Apr19 95 Call | | | (46,170 | ) | |
193/(540,400) | | Mallinckrodt plc Apr19 28 Call | | | (1,544 | ) | |
18/(261,000) | | Masimo Corporation Apr19 145 Call | | | (1,440 | ) | |
93/(269,700) | | Medicines Company (The) Apr19 29 Call | | | (10,463 | ) | |
593/(5,633,500) | | Medtronic plc Apr19 95 Call | | | (5,930 | ) | |
163/(1,369,200) | | Merck & Co., Inc. Apr19 84 Call | | | (12,551 | ) | |
506/(4,351,600) | | Merck & Co., Inc. Apr19 86 Call | | | (6,578 | ) | |
425/(1,360,000) | | Mylan N.V. Apr19 32 Call | | | (7,225 | ) | |
446/(4,348,500) | | Novartis AG Apr19 97.5 Call | | | (40,140 | ) | |
98/(539,000) | | Perrigo Company plc Apr19 55 Call | | | (1,372 | ) | |
The accompanying notes are an integral part of these financial statements.
16
TEKLA WORLD HEALTHCARE FUND
SCHEDULE OF INVESTMENTS
MARCH 31, 2019
(Unaudited, continued)
NUMBER OF
CONTRACTS
(100 SHARES
EACH)/
NOTIONAL
AMOUNT ($) | | CALL OPTION CONTRACTS
WRITTEN - continued | | VALUE | |
978/(4,352,100) | | Pfizer Inc. Apr19 44.5 Call | | $ | (3,912 | ) | |
41/(799,500) | | Stryker Corporation Apr19 195 Call | | | (18,245 | ) | |
42/(808,500) | | Vertex Pharmaceuticals Incorporated
Apr19 192.5 Call | | | (8,190 | ) | |
417/(1,355,250) | | Wright Medical Group N.V. Apr19 32.5 Call | | | (14,595 | ) | |
| | TOTAL CALL OPTION CONTRACTS
WRITTEN
(Premiums received $575,636) | | | (450,634 | ) | |
| | | PUT OPTION CONTRACTS
WRITTEN - 0.0% | |
| |
1,300/(5,200,000) | | Bristol-Myers Squibb Company Jan20 40 Put | | | (210,600 | ) | |
20/(1,080,000) | | Intuitive Surgical, Inc. Apr19 540 Put | | | (10,800 | ) | |
| | | TOTAL PUT OPTION CONTRACTS
WRITTEN
(Premiums received $363,235) | | | (221,400 | ) | |
| | | TOTAL OPTION CONTRACTS
WRITTEN
(Cost $(938,871)) | | | (672,034 | ) | |
| | TOTAL INVESTMENTS LESS OPTION
CONTRACTS WRITTEN - 128.0%
(Cost $607,336,161) | | | 539,022,324 | | |
| | | OTHER LIABILITIES IN EXCESS OF
ASSETS - (28.0)% | | | (117,837,252 | ) | |
| | | NET ASSETS - 100% | | $ | 421,185,072 | | |
(a) Security fair valued using significant unobservable inputs. See Investment Valuation and Fair Value Measurements.
(b) Security exempt from registration under Rule 144A of the Securities Act of 1933, as amended. These securities may be resold in transactions exempt from registration, normally to qualified institutional buyers.
(c) Securities sold under Regulation S may not be offered, sold or delivered within the United States or to, or for the account or benefit of, U.S. persons, except pursuant to an exemption from, or in a transaction not subject to, the registration requirements of the Securities Act of 1933.
The accompanying notes are an integral part of these financial statements.
17
TEKLA WORLD HEALTHCARE FUND
SCHEDULE OF INVESTMENTS
MARCH 31, 2019
(Unaudited, continued)
(d) Non-income producing security.
(e) American Depository Receipt
(f) A portion of security is pledged as collateral for call options written.
The following forward contract were held as of March 31, 2019:
Description | | Counterparty | | Settlement
Date | | Currency | | Settlement
Value (in USD) | | Current
Value | | Unrealized
Gain | |
Contracts Sold: | |
British Pound | | Goldman Sachs Bank | | 04/25/19 | | | 14,090,242 GBP | | | $ | 18,657,257 | | | $ | 18,373,151 | | | $ | 284,106 | | |
Danish Krone | | Goldman Sachs Bank | | 04/25/19 | | | 47,021,882 DKK | | | | 7,121,812 | | | | 7,079,972 | | | | 41,840 | | |
Euro | | Goldman Sachs Bank | | 04/25/19 | | | 13,782,604 EUR | | | | 15,582,171 | | | | 15,490,764 | | | | 91,407 | | |
Israeli Sheqel | | Goldman Sachs Bank | | 04/25/19 | | | 14,268,409 ILS | | | | 3,947,220 | | | | 3,933,889 | | | | 13,331 | | |
Japanese Yen | | Goldman Sachs Bank | | 04/25/19 | | | 484,962,749 JPY | | | | 4,401,382 | | | | 4,384,712 | | | | 16,670 | | |
Swiss Franc | | Goldman Sachs Bank | | 04/25/19 | | | 19,376,245 CHF | | | | 19,554,070 | | | | 19,501,573 | | | | 52,497 | | |
| | | | | | | | | | | $ | 68,764,061 | | | $ | 499,851 | | |
The accompanying notes are an integral part of these financial statements.
18
TEKLA WORLD HEALTHCARE FUND
STATEMENT OF ASSETS AND LIABILITIES
MARCH 31, 2019
(Unaudited)
ASSETS: | |
Investments, at value (cost $608,275,031) | | $ | 539,694,358 | | |
Cash | | | 23,963 | | |
Cash at broker | | | 6,280,000 | | |
Foreign currency, at value (cost $16,717) | | | 16,681 | | |
Dividends and interest receivable | | | 2,619,879 | | |
Receivable for investments sold | | | 1,406,967 | | |
Prepaid expenses | | | 686 | | |
Unrealized appreciation on forward currency contracts | | | 499,851 | | |
Total assets | | | 550,542,385 | | |
LIABILITIES: | |
Payable for investments purchased | | | 7,242,298 | | |
Accrued advisory fee | | | 431,368 | | |
Accrued investor support service fees | | | 21,568 | | |
Accrued shareholder reporting fees | | | 54,085 | | |
Accrued trustee fees | | | 40,731 | | |
Loan Payable | | | 120,000,000 | | |
Options written, at value (premium received $938,871) | | | 672,034 | | |
Income distribution payable | | | 180,412 | | |
Interest payable | | | 615,133 | | |
Accrued other | | | 99,684 | | |
Total liabilities | | | 129,357,313 | | |
Commitments and Contingencies (see Notes 1 and 5) | | | |
NET ASSETS | | $ | 421,185,072 | | |
SOURCES OF NET ASSETS: | |
Shares of beneficial interest, par value $.01 per share,
unlimited number of shares authorized, amount
paid in on 30,155,948 shares issued and outstanding | | $ | 554,147,178 | | |
Total distributable earnings (loss) | | | (132,962,106 | ) | |
Total net assets (equivalent to $13.97 per share
based on 30,155,948 shares outstanding) | | $ | 421,185,072 | | |
The accompanying notes are an integral part of these financial statements.
19
TEKLA WORLD HEALTHCARE FUND
STATEMENT OF OPERATIONS
SIX MONTHS ENDED MARCH 31, 2019
(Unaudited)
INVESTMENT INCOME: | |
Dividend income (net of foreign tax of $217,903) | | $ | 4,643,428 | | |
Interest and other income | | | 1,781,219 | | |
Total investment income | | | 6,424,647 | | |
EXPENSES: | |
Advisory fees | | | 2,682,255 | | |
Interest expense | | | 1,969,416 | | |
Investor support service fees | | | 134,113 | | |
Custodian fees | | | 86,428 | | |
Trustees' fees and expenses | | | 71,298 | | |
Auditing fees | | | 35,017 | | |
Shareholder reporting | | | 50,695 | | |
Administration fees | | | 47,545 | | |
Legal fees | | | 44,762 | | |
Transfer agent fees | | | 14,439 | | |
Other (see Note 2) | | | 164,749 | | |
Total expenses | | | 5,300,717 | | |
Net investment income | | | 1,123,930 | | |
REALIZED AND UNREALIZED GAIN (LOSS): | |
Net realized gain (loss) on: | |
Investments | | | (48,297,546 | ) | |
Closed or expired option contracts written | | | 1,839,513 | | |
Foreign currency transactions | | | 2,803,722 | | |
Net realized loss | | | (43,654,311 | ) | |
Change in unrealized appreciation (depreciation) | |
Investments | | | 24,917,200 | | |
Option contracts purchased | | | (328,251 | ) | |
Option contracts written | | | 422,366 | | |
Foreign currency | | | (6,936 | ) | |
Forward contracts | | | (547,694 | ) | |
Change in unrealized appreciation (depreciation) | | | 24,456,685 | | |
Net realized and unrealized gain (loss) | | | (19,197,626 | ) | |
Net decrease in net assets resulting from
operations | | ($ | 18,073,696 | ) | |
The accompanying notes are an integral part of these financial statements.
20
TEKLA WORLD HEALTHCARE FUND
STATEMENTS OF CHANGES IN NET ASSETS
| | | Six months ended
March 31, 2019
(Unaudited) | | Year ended
September 30,
2018 | |
NET INCREASE (DECREASE) IN NET
ASSETS RESULTING FROM OPERATIONS: | |
Net investment income | | $ | 1,123,930 | | | $ | 3,462,301 | | |
Net realized gain (loss) | | | (43,654,311 | ) | | | 18,358,382 | | |
Change in net unrealized appreciation | | | 24,456,685 | | | | 10,474,722 | | |
Net increase (decrease) in net
assets resulting from operations | | | (18,073,696 | ) | | | 32,295,405 | | |
DISTRIBUTIONS TO SHAREHOLDERS
FROM (See Note 1): | |
Distributions (net investment income,
realized gain (loss), other) | | | (21,200,673 | ) * | | | (18,341,648 | ) | |
Return of capital | | | — | | | | (24,336,437 | ) | |
Total distributions | | | (21,200,673 | ) | | | (42,678,085 | ) | |
CAPITAL SHARE TRANSACTIONS: | |
Fund shares repurchased (244,155 and
455,073 shares, respectively)
(see Note 1) | | | (2,802,190 | ) | | | (6,213,596 | ) | |
Total capital share transactions | | | (2,802,190 | ) | | | (6,213,596 | ) | |
Net decrease in net assets | | | (42,076,559 | ) | | | (16,596,276 | ) | |
NET ASSETS: | |
Beginning of period | | | 463,261,631 | | | | 479,857,907 | | |
End of period | | $ | 421,185,072 | | | $ | 463,261,631 | | |
* A portion of the distributions may be deemed a tax return of capital at year end.
The accompanying notes are an integral part of these financial statements.
21
TEKLA WORLD HEALTHCARE FUND
STATEMENT OF CASH FLOWS
SIX MONTHS ENDED MARCH 31, 2019
(Unaudited)
CASH FLOWS FROM OPERATING ACTIVITIES: | |
Purchases of portfolio securities | | ($ | 204,210,211 | ) | |
Purchases to close option contracts written | | | (959,142 | ) | |
Net maturities of short-term investments | | | (10,631,000 | ) | |
Sales of portfolio securities | | | 211,583,095 | | |
Proceeds from option contracts written | | | 3,134,097 | | |
Interest income received | | | 1,774,799 | | |
Dividend income received | | | 4,372,114 | | |
Other operating receipts (expenses paid) | | | (4,745,253 | ) | |
Net cash provided from operating activities | | | 318,499 | | |
CASH FLOWS FROM FINANCING ACTIVITIES: | |
Cash distributions paid | | | (21,195,950 | ) | |
Fund shares repurchased | | | (2,802,190 | ) | |
Cash at broker | | | 23,719,700 | | |
Net cash used for financing activities | | | (278,440 | ) | |
NET INCREASE IN CASH | | | 40,059 | | |
CASH AT BEGINNING OF YEAR | | | 585 | | |
CASH AT END OF SIX MONTHS | | $ | 40,644 | | |
RECONCILIATION OF NET INCREASE IN NET ASSETS
RESULTING FROM OPERATIONS TO NET CASH
PROVIDED FROM OPERATING ACTIVITIES: | |
Net decrease in net assets resulting from operations | | ($ | 18,073,696 | ) | |
Purchases of portfolio securities | | | (204,210,211 | ) | |
Purchases to close option contracts written | | | (959,142 | ) | |
Net maturities of short-term investments | | | (10,631,000 | ) | |
Sales of portfolio securities | | | 211,583,095 | | |
Proceeds from option contracts written | | | 3,134,097 | | |
Accretion of discount | | | (26,647 | ) | |
Net realized loss on investments, options and
foreign currencies | | | 43,654,311 | | |
Increase in net unrealized appreciation (depreciation)
on investments, options and foreign currencies | | | (24,456,685 | ) | |
Increase in dividends and interest receivable | | | (251,087 | ) | |
Decrease in accrued expenses | | | (95,542 | ) | |
Increase in prepaid expenses and interest payable | | | 651,006 | | |
Net cash provided from operating activities | | $ | 318,499 | | |
The accompanying notes are an integral part of these financial statements.
22
TEKLA WORLD HEALTHCARE FUND
| | | Six months
ended
March 31, 2019 | | Years ended September 30, | | For the period
June 30,
2015 to
September 30, | |
| | | (Unaudited) | | 2018 | | 2017 | | 2016 | | 2015(1) | |
OPERATING PERFORMANCE FOR A SHARE
OUTSTANDING THROUGHOUT EACH YEAR | |
Net asset value per share, beginning
of period | | $ | 15.24 | | | $ | 15.55 | | | $ | 16.08 | | | $ | 17.38 | | | $ | 19.10 | (2) | |
Net investment income (loss) (3) | | | 0.04 | | | | 0.11 | | | | 0.12 | | | | 0.09 | | | | (0.02 | ) | |
Net realized and unrealized gain (loss) | | | (0.62 | ) | | | 0.96 | | | | 0.74 | | | | (0.06 | ) | | | (1.47 | ) | |
Total increase (decrease) from
investment operations | | | (0.58 | ) | | | 1.07 | | | | 0.86 | | | | 0.03 | | | | (1.49 | ) | |
Distributions to shareholders from: | |
Income distributions to shareholders | | | (0.70 | ) | | | (0.60 | ) | | | (1.30 | ) | | | (1.40 | ) | | | (0.23 | ) | |
Net realized capital gains | | | — | | | | — | | | | (0.03 | ) | | | — | | | | — | | |
Return of capital (tax basis) | | | — | | | | (0.80 | ) | | | (0.07 | ) | | | — | | | | — | | |
Total distributions | | | (0.70 | ) | | | (1.40 | ) | | | (1.40 | ) | | | (1.40 | ) | | | (0.23 | ) | |
Increase resulting from shares
repurchased (3) | | | 0.01 | | | | 0.02 | | | | 0.01 | | | | 0.07 | | | | — | | |
Net asset value per share, end of period | | $ | 13.97 | | | $ | 15.24 | | | $ | 15.55 | | | $ | 16.08 | | | $ | 17.38 | | |
Per share market value, end of period | | $ | 12.81 | | | $ | 14.03 | | | $ | 14.56 | | | $ | 14.68 | | | $ | 14.38 | | |
Total investment return at market value | | | (3.58 | %)* | | | 6.91 | % | | | 9.47 | % | | | 12.34 | % | | | (27.07 | %)* | |
Total investment return at net asset value | | | (3.13 | %)* | | | 8.66 | % | | | 6.74 | % | | | 1.81 | % | | | (7.46 | %)* | |
RATIOS | |
Expenses to average net assets | | | 2.51 | %** | | | 2.28 | % | | | 2.05 | % | | | 1.70 | % | | | 1.32 | %** | |
Expenses, excluding interest expense,
to average net assets | | | 1.57 | %** | | | 1.57 | % | | | 1.55 | % | | | 1.47 | % | | | 1.32 | %** | |
Net investment income (loss) to average
net assets | | | 0.53 | %** | | | 0.78 | % | | | 0.77 | % | | | 0.53 | % | | | (0.37 | %)** | |
SUPPLEMENTAL DATA | |
Net assets at end of period (in millions) | | $ | 421 | | | $ | 463 | | | $ | 480 | | | $ | 499 | | | $ | 542 | | |
Portfolio turnover rate | | | 29.12 | %* | | | 54.60 | % | | | 58.05 | % | | | 67.00 | % | | | 58.96 | %* | |
* Not Annualized.
** Annualized.
(1) Commenced operations on June 30, 2015.
(2) Net asset value beginning of period reflects a deduction of $0.90 per share sales charge from the initial offering price of $20.00 per share.
(3) Computed using average shares outstanding.
The accompanying notes are an integral part of these financial statements.
23
TEKLA WORLD HEALTHCARE FUND
NOTES TO FINANCIAL STATEMENTS
MARCH 31, 2019
(Unaudited)
(1) Organization and Significant Accounting Policies
Tekla World Healthcare Fund (the Fund) is a Massachusetts business trust formed on March 5, 2015 and registered under the Investment Company Act of 1940 as a non-diversified closed-end management investment company. The Fund commenced operations on June 30, 2015. The investment objective is to seek current income and long-term capital appreciation through investments in U.S. and non-U.S. companies engaged in the healthcare industry (including equity securities and debt securities). The Fund invests primarily in securities of public and private companies believed by the Fund's Investment Adviser, Tekla Capital Management LLC (the Adviser), to have significant potential for above-average growth.
The preparation of these financial statements requires the use of certain estimates by management in determining the Fund's assets, liabilities, revenues and expenses. Actual results could differ from these estimates and such differences could be material. The following is a summary of significant accounting policies followed by the Fund, which are in conformity with accounting principles generally accepted in the United States of America (GAAP). The Fund is an investment company and follows accounting and reporting guidance in the Financial Accounting Standards Board Accounting Standards Codification 946. Events or transactions occurring after March 31, 2019, through the date that the financial statements were issued, have been evaluated in the preparation of these financial statements.
Investment Valuation
Shares of publicly traded companies listed on national securities exchanges or trading in the over-the-counter market are typically valued at the last sale price, as of the close of trading, generally 4 p.m., Eastern time. The Fund holds securities or other assets that are denominated in a foreign currency. The Fund will normally use the currency exchange rates as of 4:00 p.m. (Eastern Time) when valuing such assets. The Board of Trustees of the Fund (the Trustees) has established and approved fair valuation policies and procedures with respect to securities for which quoted prices may not be available or which do not reflect fair value. Convertible bonds, corporate and government bonds are valued using a third-party pricing service. Convertible bonds are valued using this pricing service only on days when there is no sale reported. Puts and calls generally are valued at the close of regular trading on the securities or commodities exchange on which they are primarily traded. Options on securities generally are valued at their last sale price in the case of exchange traded options or, in the case of OTC-traded options, the average of the last sale price as obtained from two or more dealers unless there is only one dealer, in which case that dealer's price is used. Forward foreign currency contracts are valued on the basis of the value of the underlying currencies at the prevailing forward exchange rates. Restricted securities of companies that are publicly traded are typically valued based on the closing market quote on the valuation date adjusted for the impact of the restriction as determined in good faith by the Adviser also using fair valuation policies and procedures approved by the Trustees described below. Short-term investments with a maturity of 60 days or less are generally valued at amortized cost, which approximates fair value.
Convertible preferred shares, warrants or convertible note interests in private companies, and other restricted securities, as well as shares of publicly traded companies for which market quotations are not available or which do not reflect fair value, are typically valued in good faith, based upon the recommendations made by the Adviser pursuant to fair valuation policies and procedures approved by the Trustees.
24
TEKLA WORLD HEALTHCARE FUND
NOTES TO FINANCIAL STATEMENTS
MARCH 31, 2019
(continued)
The Adviser has a Valuation Sub-Committee comprised of senior management which reports to the Valuation Committee of the Board at least quarterly. Each fair value determination is based on a consideration of relevant factors, including both observable and unobservable inputs. Observable and unobservable inputs the Adviser considers may include (i) the existence of any contractual restrictions on the disposition of securities; (ii) information obtained from the company, which may include an analysis of the company's financial statements, the company's products or intended markets or the company's technologies; (iii) the price of the same or similar security negotiated at arm's length in an issuer's completed subsequent round of financing; (iv) the price and extent of public trading in similar securities of the issuer or of comparable companies; or (v) a probability and time value adjusted analysis of contractual terms. Where available and appropriate, multiple valuation methodologies are applied to confirm fair value. Significant unobservable inputs identified by the Adviser are often used in the fair value determination. A significant change in any of these inputs may result in a significant change in the fair value measurement. Due to the uncertainty inherent in the valuation process, such estimates of fair value may differ significantly from the values that would have been used had a ready market for the investments existed, and differences could be material. Additionally, changes in the market environment and other events that may occur over the life of the investments may cause the gains or losses ultimately realized on these investments to be different from the valuations used at the date of these financial statements.
Options on Securities
An option contract is a contract in which the writer (seller) of the option grants the buyer of the option, upon payment of a premium, the right to purchase from (call option) or sell to (put option) the writer a designated instrument at a specified price within a specified period of time. Certain options, including options on indices, will require cash settlement by the Fund if the option is exercised. The Fund enters into option contracts in order to hedge against potential adverse price movements in the value of portfolio assets, as a temporary substitute for selling selected investments, to lock in the purchase price of a security or currency which it expects to purchase in the near future, as a temporary substitute for purchasing selected investments, or to enhance potential gain or to gain or hedge exposure to financial market risk.
The Fund's obligation under an exchange traded written option or investment in an exchange traded purchased option is valued at the last sale price or in the absence of a sale, the mean between the closing bid and asked prices. Gain or loss is recognized when the option contract expires, is exercised or is closed.
If the Fund writes a covered call option, the Fund foregoes, in exchange for the premium, the opportunity to profit during the option period from an increase in the market value of the underlying security above the exercise price. If the Fund writes a put option it accepts the risk of a decline in the market value of the underlying security below the exercise price. Over-the-counter options have the risk of the potential inability of counterparties to meet the terms of their contracts. The Fund's maximum exposure to purchased options is limited to the premium initially paid. In addition, certain risks may arise upon entering into option contracts including the risk that an illiquid secondary market will limit the Fund's ability to close out an option contract prior to the expiration date and that a change in the value of the option contract may not correlate exactly with changes in the value of the securities or currencies hedged.
25
TEKLA WORLD HEALTHCARE FUND
NOTES TO FINANCIAL STATEMENTS
MARCH 31, 2019
(continued)
All options on securities and securities indices written by the Fund are required to be covered. When the Fund writes a call option, this means that during the life of the option the Fund may own or have the contractual right to acquire the securities subject to the option or may maintain with the Fund's custodian in a segregated account appropriate liquid securities in an amount at least equal to the market value of the securities underlying the option. When the Fund writes a put option, this means that the Fund will maintain with the Fund's custodian in a segregated account appropriate liquid securities in an amount at least equal to the exercise price of the option.
The average number of outstanding options written and options purchased for the six months ended March 31, 2019 were 4,342 and 685 respectively.
Derivatives not accounted
for as hedging instruments
under ASC 815 | | Statement of Assets and
Liabilities Location | | | | Statement of Operations Location | | | |
Equity contracts
| | Assets, options,
purchased, at value
| | |
$428,950
| | | Change in unrealized
appreciation (depreciation) on
option contracts purchased | | |
($328,851) | | |
| | Liabilities, options
written, at value
| | |
$672,034
| | | Net realized gain on
closed or expired option
contracts written | | |
$1,839,513 | | |
| |
| |
| | Change in unrealized
appreciation (depreciation)
on option contracts written | | |
$422,366 | | |
Forward Currency
contracts | | Assets, forward
currency, unrealized
appreciation | | |
$499,851 | | | Change in unrealized
appreciation (depreciation)
on forward contracts | | |
$547,694 | | |
Forward Contracts
Forward contracts involve the purchase or sale of a specific quantity of a commodity, government security, foreign currency, or other asset at a specified price, with delivery and settlement at a specified future date. Because it is a completed contract, a purchase forward contract can be a cover for the sale of a futures contract. The Fund may enter into forward contracts for hedging purposes and non-hedging purposes (i.e., to increase returns). Forward contracts may be used by the Fund for hedging purposes to protect against uncertainty in the level of future foreign currency exchange rates, such as when the Fund anticipates purchasing or selling a foreign security. Forward contracts may also be used to attempt to protect the value of the Fund's existing holdings of foreign securities. Forward contracts may also be used for non-hedging purposes to pursue the Fund's investment objective. There is no requirement that the Fund hedge all or any portion of its exposure to foreign currency risks.
Average notional amount of forward contracts for the six months ended March 31, 2019 was $73,399,370.
Investment Transactions and Income
Investment transactions are recorded on a trade date basis. Gains and losses from sales of investments are recorded using the "identified cost" method. Interest income is recorded on the accrual basis, adjusted for amortization of premiums and accretion of discounts. Dividend income is recorded on the ex-dividend date, less any foreign taxes withheld. Upon notification
26
TEKLA WORLD HEALTHCARE FUND
NOTES TO FINANCIAL STATEMENTS
MARCH 31, 2019
(continued)
from issuers, some of the dividend income received may be redesignated as a reduction of cost of the related investment if it represents a return of capital.
The aggregate cost of purchases and proceeds from sales of investment securities (other than short-term investments) for the six months ended March 31, 2019 totaled $168,584,501 and $151,323,002, respectively.
Repurchase Agreements
In managing short-term investments the Fund may from time to time enter into transactions in repurchase agreements. In a repurchase agreement, the Fund's custodian takes possession of the underlying collateral securities from the counterparty, the market value of which is at least equal to the principal, including accrued interest, of the repurchase transaction at all times. In the event of default or bankruptcy by the other party to the agreement, realization and/or retention of the collateral by the Fund may be delayed. The Fund may enter into repurchase transactions with any broker, dealer, registered clearing agency or bank. Repurchase agreement transactions are not counted for purposes of the limitations imposed on the Fund's investment in debt securities.
Distribution Policy
Pursuant to a Securities and Exchange Commission exemptive order the Fund may make periodic distributions that include capital gains as frequently as 12 times in any one taxable year in respect of its common shares, and the Fund has implemented a managed distribution policy (the Policy) providing for monthly distributions at a rate set by the Board of Trustees. Under the current Policy, the Fund intends to make monthly distributions at a rate of $0.1167 per share to shareholders of record. If taxable income and net long-term realized gains exceed the amount required to be distributed under the Policy, the Fund will at a minimum make distributions necessary to comply with the requirements of the Internal Revenue Code. The Policy has been established by the Trustees and may be changed by them without shareholder approval. The Trustees regularly review the Policy and the frequency and distribution rate considering the purpose and effect of the Policy, the financial market environment, and the Fund's income, capital gains and capital available to pay distributions.
Share Repurchase Program
In March 2019, the Trustees approved the renewal of the repurchase program to allow the Fund to repurchase up to 12% of its outstanding shares in the open market for a one year period ending July 14, 2020. Prior to this renewal, in March 2018, the Trustees approved the renewal of the share repurchase program to allow the Fund to repurchase up to 12% of its outstanding shares for a one year period ending July 14, 2019. The share repurchase program is intended to enhance shareholder value and potentially reduce the discount between the market price of the Fund's shares and the Fund's net asset value.
During the six months ended March 31, 2019, the Fund repurchased 244,155 shares at a total cost of $2,802,190. The weighted average discount per share between the cost of repurchase and the net asset value applicable to such shares at the date of repurchase was 10.62%.
During the year ended September 30, 2018 the Fund repurchased 455,073 shares at a total cost of $6,213,596. The weighted average discount per share between the cost of repurchase and net asset value applicable to such shares at the date of repurchase was 7.04%.
27
TEKLA WORLD HEALTHCARE FUND
NOTES TO FINANCIAL STATEMENTS
MARCH 31, 2019
(continued)
Federal Taxes
It is the Fund's policy to comply with the requirements of the Internal Revenue Code applicable to regulated investment companies and to distribute to its shareholders substantially all of its taxable income and its net realized capital gains, if any. Therefore, no Federal income or excise tax provision is required.
As of March 31, 2019, the Fund had no uncertain tax positions that would require financial statement recognition or disclosure. The Fund's federal tax returns are subject to examination by the Internal Revenue Service for a period of three years.
Distributions
The Fund records all distributions to shareholders on the ex-dividend date. Such distributions are determined in conformity with income tax regulations, which may differ from GAAP. These differences include temporary and permanent differences from losses on wash sale transactions, installment sale adjustments and ordinary loss netting to reduce short term capital gains. Reclassifications are made to the Fund's capital accounts to reflect income and gains available for distribution under income tax regulations.
The cumulative distributions paid this fiscal year-to-date are currently estimated to be from the following sources: net investment income, net realized short-term capital gains, and return of capital or other capital source. The amounts and sources of distributions are only estimates and not being provided for tax reporting purposes. The actual amounts and sources of the amounts for tax reporting purposes will depend upon the Fund's investment experience during the remainder of its fiscal year and may be subject to changes based on tax regulations.
Statement of Cash Flows
The cash amount shown in the Statement of Cash Flows is the amount included in the Fund's Statement of Assets and Liabilities and represents cash on hand at March 31, 2019.
Commitments and Contingencies
Under the Fund's organizational documents, its officers and Trustees may be indemnified against certain liabilities and expenses arising out of the performance of their duties to the Fund. Additionally, in the normal course of business, the Fund enters into agreements with service providers that may contain indemnification clauses. The Fund's maximum exposure under these agreements is unknown as this would involve future claims that may be made against the Fund that have not yet occurred. However, based on experience, the Fund expects the risk of loss to be remote.
Loan Payable
The Fund maintains a $125,000,000 line of credit with the Bank of Nova Scotia (the Line of Credit) which expires on January 31, 2020. As of March 31, 2019, the Fund had drawn down $120,000,000 from the Line of Credit, which was the maximum borrowing outstanding during the period. The Fund is charged interest at the rate of 0.70% above the relevant LIBOR rate adjusted by the Statutory Reserve Rate for borrowing (per annum). The Fund is also charged a commitment fee on the daily unused balance of the line of credit at the rate of 0.10% (per annum). Per the Line of Credit agreement, the Fund paid an upfront fee of 0.05% on the total line of credit balance, which is being amortized through January 30, 2020. The Fund pledges its investment securities as the collateral for the line of credit per the terms of the agreement.
28
TEKLA WORLD HEALTHCARE FUND
NOTES TO FINANCIAL STATEMENTS
MARCH 31, 2019
(continued)
The weighted average interest rate and the average outstanding loan payable for the period from October 1, 2018 to March 31, 2019 were 3.2236% and $120,000,000, respectively. The stated carrying amount of the line of credit approximates its fair value based upon the short term nature of the borrowings and the interest rates being based upon the market terms. The borrowings under the line of credit would be considered as Level 2 in the fair value hierarchy (See Note 3) at March 31, 2019.
Investor Support Services
The Fund has retained Destra Capital Investment LLC (Destra) to provide investor support services in connection with the ongoing operation of the Fund. The Fund pays Destra a fee in an annual amount equal to 0.05% of the average aggregate daily value of the Fund's Managed Assets pursuant to the investor support services agreement.
(2) Investment Advisory and Other Affiliated Fees
The Fund has entered into an Investment Advisory Agreement (the Advisory Agreement) with the Adviser. Pursuant to the terms of the Advisory Agreement, the Fund pays the Adviser a monthly fee at the rate when annualized of 1.00% of the average daily value of the Fund's Managed Assets. Managed Assets means the total assets of the Fund minus the Fund's liabilities other than the loan payable.
The Fund has entered into a Services Agreement (the Agreement) with the Adviser. Pursuant to the terms of the Agreement, the Fund reimburses the Adviser for certain services related to a portion of the payment of salary and provision of benefits to the Fund's Chief Compliance Officer. During the six months ended March 31, 2019, these payments amounted to $25,083 and are included in the Other category of expenses in the Statement of Operations, together with insurance and other expenses incurred to unaffiliated entities. Expenses incurred pursuant to the Agreement as well as certain expenses paid for by the Adviser are allocated to the Fund in an equitable fashion as approved by the Trustees or officers of the Fund who are also officers of the Adviser.
The Fund pays compensation to Independent Trustees in the form of a retainer, attendance fees, and additional compensation to Board and Committee chairpersons. The Fund does not pay compensation directly to Trustees or officers of the Fund who are also officers of the Adviser.
(3) Fair Value Measurements
The Fund uses a three-tier hierarchy to prioritize the assumptions, referred to as inputs, used in valuation techniques to measure fair value. The three-tier hierarchy of inputs is summarized in the three broad levels. Level 1 includes quoted prices in active markets for identical investments. Level 2 includes prices determined using other significant observable inputs (including quoted prices for similar investments, interest rates, credit risk, etc.). The independent pricing vendor may value bank loans and debt securities at an evaluated bid price by employing methodologies that utilize actual market transactions, broker-supplied valuations, and/or other methodologies designed to identify the market value for such securities and such securities are considered Level 2 in the fair value hierarchy. Level 3 includes prices determined using significant unobservable inputs (including the Fund's own assumptions in determining the fair value of investments). These inputs or methodology used for valuing securities are not necessarily an indication of the risk associated with investing in those securities.
29
TEKLA WORLD HEALTHCARE FUND
NOTES TO FINANCIAL STATEMENTS
MARCH 31, 2019
(continued)
The following is a summary of the levels used as of March 31, 2019 to value the Fund's net assets.
Assets at Value | | Level 1 | | Level 2 | | Level 3 | | Total | |
Convertible Notes | |
United States | | $ | — | | | $ | — | | | $ | 723,045 | | | $ | 723,045 | | |
Non-Convertible Notes | |
Ireland | | | — | | | | 2,169,840 | | | | — | | | | 2,169,840 | | |
United Kingdom | | | — | | | | 3,999,760 | | | | — | | | | 3,999,760 | | |
United States | | | — | | | | 64,504,165 | | | | — | | | | 64,504,165 | | |
Convertible Preferred and Warrants | |
Switzerland | | | — | | | | — | | | | 1,138,841 | | | | 1,138,841 | | |
United States | | | — | | | | — | | | | 5,748,451 | | | | 5,748,451 | | |
Common Stocks and Warrants | |
Belgium | | | 1,410,137 | | | | — | | | | — | | | | 1,410,137 | | |
China | | | 2,230,800 | | | | — | | | | — | | | | 2,230,800 | | |
Denmark | | | 14,835,889 | | | | — | | | | — | | | | 14,835,889 | | |
France | | | 10,738,171 | | | | — | | | | — | | | | 10,738,171 | | |
Germany | | | 11,138,926 | | | | — | | | | — | | | | 11,138,926 | | |
India | | | 1,172,475 | | | | — | | | | — | | | | 1,172,475 | | |
Ireland | | | 28,997,733 | | | | — | | | | — | | | | 28,997,733 | | |
Israel | | | 2,569,403 | | | | — | | | | — | | | | 2,569,403 | | |
Japan | | | 11,334,152 | | | | — | | | | — | | | | 11,334,152 | | |
Netherlands | | | 3,839,200 | | | | — | | | | — | | | | 3,839,200 | | |
Switzerland | | | 42,487,616 | | | | — | | | | — | | | | 42,487,616 | | |
United Kingdom | | | 34,319,704 | | | | — | | | | 54,074 | | | | 34,373,778 | | |
United States | | | 271,490,026 | | | | — | | | | — | | | | 271,490,026 | | |
Short-term Investment | | | — | | | | 24,363,000 | | | | — | | | | 24,363,000 | | |
Total | | $ | 436,564,232 | | | $ | 95,036,765 | | | $ | 7,664,411 | | | $ | 539,265,408 | | |
Other Financial Instruments | |
Assets | |
Forward Currency Contracts | | $ | — | | | $ | 499,851 | | | $ | — | | | $ | 499,851 | | |
Options Contracts Purchased | | | 428,950 | | | | — | | | | — | | | | 428,950 | | |
Liabilities | |
Call Options Contracts Written | | | (672,034 | ) | | | — | | | | — | | | | (672,034 | ) | |
| Total | | ($ | 243,084 | ) | | $ | 499,851 | | | $ | — | | | $ | 256,767 | | |
30
TEKLA WORLD HEALTHCARE FUND
NOTES TO FINANCIAL STATEMENTS
MARCH 31, 2019
(continued)
The following is a reconciliation of Level 3 assets for which significant unobservable inputs were used to determine fair value.
Investments in
securities | | Balance as of
September 30,
2018 | | Net realized
gain (loss) and
change in
unreaized
appreciation
(depreciation) | | Cost of
purchases
and
conversions | | Proceeds
from
sales and
conversions | | Net
transfers
in
(out of)
Level 3 | | Balance
as of
March 31,
2019 | |
Convertible Notes | |
United States | | $ | 247,124 | | | $ | — | | | $ | 475,921 | | | $ | — | | | $ | — | | | $ | 723,045 | | |
Convertible
Preferred and
Warrants | |
Switzerland | | | — | | | | (6,557 | ) | | | 1,145,398 | | | | — | | | | — | | | | 1,138,841 | | |
United States | | | 5,080,794 | | | | (118,206 | ) | | | 3,423,708 | | | | (2,637,845 | ) | | | — | | | | 5,748,451 | | |
Common Stocks
and Warrants | |
United Kingdom | | | 48,963 | | | | 5,111 | | | | — | | | | — | | | | — | | | | 54,074 | | |
| | | $ | 5,376,881 | | | ($ | 119,652 | ) | | $ | 5,045,027 | | | ($ | 2,637,845 | ) | | $ | — | | | $ | 7,664,411 | | |
Net change in unrealized appreciation (depreciation)
from investments still held as of March 31, 2019 | | ($ | 119,511 | ) | |
The following is a quantitative disclosure about significant unobservable inputs used in the determination of the fair value of Level 3 assets.
| | | Fair Value at
March 31, 2019 | | Valuation Technique | | Unobservable Input | | Range
(Weighted Average) | |
Private Companies and
Other Restricted
Securities | | |
$54,074
| | |
Income approach,
Black-Scholes | |
Discount for lack
of marketability | | 20% (20)%
| |
| | | | 2,565,389
| | | Probability-
weighted expected
return model | | Discount rate
Price to sales multiple
| | 24.24%-35.14% (32.09%)
3.65x-4.34x (4.15x)
| |
| | | | 1,746,108
| | | Market Comparable
| | Discount rate
Earnings ratio | | 15.00% (15.00%)
4.60x (4.60x) | |
| | | | 3,298,840
| | | Market approach,
recent transactions | | (a)
| | N/A
| |
| | | | $7,664,411 | | | | | | | | |
(a) The Valuation technique used as a basis to approximate fair value of these investments is based upon subsequent financing rounds. There is no quantitative information as these methods of measure are investment specific.
(4) Private Companies and Other Restricted Securities
The Fund may invest in private companies and other restricted securities if these securities would currently comprise 10% or less of Managed Assets. The value of these securities represented 0% of the Fund's Managed Assets at March 31, 2019.
At March 31, 2019, the Fund had a commitment of $138,832 relating to additional investments in three private companies.
31
TEKLA WORLD HEALTHCARE FUND
NOTES TO FINANCIAL STATEMENTS
MARCH 31, 2019
(continued)
The following table details the acquisition date, cost, carrying value per unit, and value of the Fund's private companies and other restricted securities at March 31, 2019. The Fund on its own does not have the right to demand that such securities be registered.
Security (#) | | Acquisition
Date | | Cost | | Carrying Value
per Unit | | Value | |
Atreca, Inc. | |
Series C1 Cvt. Pfd | | 09/05/18 | | $ | 900,000 | | | $ | 2.33 | | | $ | 900,000 | | |
Decipher Biosciences, Inc. | |
Series II Cvt. Pfd | | 03/29/19 | | | 2,637,846 | | | | 0.91 | | | | 516,491 | | |
Series III Cvt. Pfd | | 03/29/19 | | | 596,715 | | | | 2.17 | | | | 1,229,617 | | |
Galera Therapeutics, Inc. | |
Series C Cvt. Pfd | | 08/30/18 | | | 1,260,031 | | | | 2.21 | | | | 1,259,999 | | |
IlluminOss Medical, Inc. | |
Series AA Cvt. Pfd | | 01/21/16 | | | 153,293 | | | | 1.00 | | | | 219,196 | | |
Junior Preferred | | 01/21/16 | | | 71,466 | | | | 1.00 | | | | 206,483 | | |
Cvt. Promissory Note | | 03/18/17 | | | 70,668 | | | | 100.00 | | | | 70,629 | | |
Cvt. Promissory Note | | 12/20/17 | | | 23,547 | | | | 100.00 | | | | 23,533 | | |
Cvt. Promissory Note | | 01/11/18 | | | 47,070 | | | | 100.00 | | | | 47,065 | | |
Cvt. Promissory Note | | 02/06/18 | | | 47,065 | | | | 100.00 | | | | 47,065 | | |
Cvt. Promissory Note | | 09/05/18 | | | 58,832 | | | | 100.00 | | | | 58,832 | | |
Cvt. Promissory Note | | 01/28/19 | | | 45,997 | | | | 100.00 | | | | 45,997 | | |
Warrants (expiration 01/11/28) | | 01/11/18 | | | 7 | | | | 0.00 | | | | 0 | | |
Warrants (expiration 01/29/29) | | 01/28/19 | | | 0 | | | | 0.00 | | | | 0 | | |
Warrants (expiration 11/20/27) | | 11/21/17 | | | 22 | | | | 0.00 | | | | 0 | | |
Warrants (expiration 02/06/28) | | 02/06/18 | | | 0 | | | | 0.00 | | | | 0 | | |
Warrants (expiration 03/31/27) | | 03/28/17 | | | 82 | | | | 0.00 | | | | 0 | | |
Warrants (expiration 09/06/27) | | 09/05/18 | | | 0 | | | | 0.00 | | | | 0 | | |
Oculis SA | |
Series B2 Cvt. Pfd | | 01/16/19 | | | 1,145,398 | | | | 8.36 | | | | 1,138,841 | | |
Rainier Therapeutics, Inc. | |
Series A Cvt. Pfd | | 01/19/16, 10/24/16 | | | 850,624 | | | | 0.65 | | | | 849,999 | | |
Series B Cvt. Pfd | | 03/03/17 | | | 566,703 | | | | 0.75 | | | | 566,666 | | |
Cvt. Promissory Note | | 01/30/19 | | | 214,962 | | | | 100.00 | | | | 214,962 | | |
Cvt. Promissory Note | | 03/28/19 | | | 214,962 | | | | 100.00 | | | | 214,962 | | |
| | | | | $ | 8,905,290 | | | | | $ | 7,610,337 | | |
(#) See Schedule of Investments and corresponding footnotes for more information on each issuer.
32
TEKLA WORLD HEALTHCARE FUND
INVESTMENT ADVISORY AGREEMENT APPROVAL
The Investment Advisory Agreement (the Advisory Agreement) between the Fund and the Adviser continues in effect so long as its continuance is approved at least annually by (i) the Trustees of the Fund and (ii) a majority of the Trustees of the Fund who are not interested persons (the Independent Trustees), by vote cast in person at a meeting called for the purpose of voting on such approval.
After considering the matter in a meeting held on March 21, 2019, the Board, and the Independent Trustees voting separately, determined that the terms of the Advisory Agreement are fair and reasonable and approved the continuance of the Advisory Agreement as being in the best interests of the Fund and its shareholders. In making its determination, the Board considered materials that were specifically prepared by the Adviser and by an independent data provider at the request of the Board and Fund counsel for purposes of the contract review process, including comparisons of (i) the Fund's performance to a variety of equity, debt and REIT benchmarks and to a peer group of other investment companies, (ii) the Fund's expenses and expense ratios to those of a peer group of other investment companies, and (iii) the Adviser's profitability with respect to its services for the Fund to the profitability of other investment advisers. The Trustees took into account that the Adviser provides investment management services only to Tekla World Healthcare Fund, Tekla Life Sciences Investors, Tekla Healthcare Investors and Tekla Healthcare Opportunities Fund and does not derive any significant benefit from its relationship with the Fund other than receipt of advisory fees pursuant to the Advisory Agreement, market research and potential marketing exposure for the Adviser. The Board also received and reviewed information throughout the year about the portfolio performance, the investment strategy, the portfolio management team and the fees and expenses of the Fund. In their deliberations, the Independent Trustees had the opportunity to meet privately without representatives of the Adviser present and were represented throughout the process by counsel to the Independent Trustees and the Fund.
In approving the Advisory Agreement, the Board considered, among other things, the nature, extent, and quality of the services to be provided by the Adviser, the investment performance of the Fund and the Adviser, the costs of services provided and profits realized by the Adviser and its affiliates, and whether fee levels reflect any economies of scale for the benefit of Fund shareholders and the extent to which economies of scale would be realized as the Fund grows. The Board reviewed information about the foregoing factors and considered changes, if any, in such information since its previous approval. The Board also evaluated the financial strength of the Adviser and the capability of the personnel of the Adviser, specifically the strength and background of its investment analysts. Fund counsel provided the Board with the statutory and regulatory requirements for approval and disclosure of investment advisory agreements. The Board, including the Independent Trustees, evaluated all of the foregoing and, considering all factors together, determined in the exercise of its business judgment that the continuance of the Advisory Agreement is in the best interests of the Fund and its shareholders. The following provides more detail on certain factors considered by the Trustees and the Board's conclusions with respect to each such factor.
The nature, extent and quality of the services to be provided by the Adviser. On a regular basis the Board considers the roles and responsibilities of the Adviser as a whole, along with specific portfolio management, support and trading functions the Adviser provides to the Fund. The Trustees considered the nature, extent and quality of the services provided by the Adviser to the Fund. The Trustees continue to be satisfied with the quality and value of the investment advisory services provided to the Fund by the Adviser, and, in particular, the management style and discipline followed by the Adviser and the quality of the Adviser's research, trading, portfolio management, compliance and administrative personnel. The Trustees also took into account the Adviser's significant investment in its business through the addition of portfolio
33
TEKLA WORLD HEALTHCARE FUND
INVESTMENT ADVISORY AGREEMENT APPROVAL
(continued)
management and administrative staff in recent years and the Adviser's commitment to continue to build out its infrastructure as future circumstances require.
The investment performance of the Fund and the Adviser. On a regular basis the Board reviews performance information of the Fund and discusses the Fund's investment strategy with the Adviser. The Trustees reviewed performance information for the Fund and, in particular, performance information for the one-year and three-year periods ending December 31, 2018. The Trustees noted that longer comparison cannot be made due to the short operating history of the Fund. In addition, the Trustees reviewed comparisons of the Fund's performance, individually and in combination, to the S&P Global 1200 Health Care Index® (SGH), the S&P 500® Health Care Corporate Bond Index (SP5HCBIT), and the FTSE NAREIT Health Care Property Sector Index® (FNHEA). The Trustees also compared performance to a peer group of funds as well as information relating to the performance of the Fund's venture capital portfolio. The Trustees noted that the performance information reviewed reflects a view of the Fund's performance only as of a certain date, and that the results might be significantly different if a different date was selected to generate the performance information. Additionally, the Trustees recognized that longer periods of performance for the Fund may be adversely and disproportionately affected by significant underperformance in one more recent period, and that such underperformance may be caused by a small number of investment decisions or positions.
The objective of the Fund is to provide both growth and income to investors by using a variety of healthcare assets. Growth, in large part, is to be provided by the Fund's ownership of the stock of a broad mix of healthcare companies. Such breadth is to be provided by representative ownership of stock in most or all of ten major healthcare subsectors represented in the SGH. Income is to be provided by (i) ownership of a variety of assets including but not limited to a) dividend producing stocks of traditional healthcare companies and healthcare-related REITS, b) the corporate debt of a variety of healthcare companies and (ii) premium income from selling covered call options associated with healthcare companies. The Fund is also required to maintain at least 40% of assets in companies located or incorporated outside of the U.S. or that do substantial business outside of the U.S. The Trustees considered that the performance associated with owning such a complex mix of assets by the Fund is likely to produce periods when the performance of the Fund would likely depart from the return associated with a single equity index. The Trustees thus considered that there may be periods when the Fund's NAV performance could be greater or lesser than that of relevant indices. The Trustees considered that determining such an exact combination of returns is difficult or impossible, given the general lack of appropriate component equity, debt, REIT, covered call and other indices.
The Trustees noted that as of December 31, 2018 the Fund underperformed a composite of the SGH, SP5HCBIT and FNHEA aggregated to represent the Fund's target allocation of these benchmarks for both the one-year and three-year periods. The Fund also underperformed the average return of an independently selected fund comparison group for these same one- and three-year periods ending December 31, 2018.
In considering the Fund's relative performance, the Trustees noted that, although an independent service provider had been engaged to help identify the appropriate benchmark and peer group for the Fund, the Fund's unique strategy presents challenges when comparing the Fund's performance to a single benchmark or peer group as no single benchmark or fund within the peer group contains exactly the same investment strategy as the Fund. The Trustees observed that the Fund's strategy contemplates ownership of a variety of healthcare-related asset classes. The Trustees noted that, as a result, all other things being
34
TEKLA WORLD HEALTHCARE FUND
INVESTMENT ADVISORY AGREEMENT APPROVAL
(continued)
equal, in periods when one asset class performs relatively better than another asset class, the Fund might be expected to underperform a particular benchmark and/or the peer group and vice versa. Additionally, the Trustees noted that unlike the indices comprising the blended benchmark and most of the peer group, the Fund may maintain a meaningful allocation to venture and restricted securities. In light of these differences, the Trustees recognized the more limited usefulness of these performance comparisons for the Fund.
The Trustees concluded they continue to be satisfied with the investment performance of the Fund and the Adviser.
The costs of services to be provided and profits to be realized by the Adviser from its relationship with the Fund. The Trustees considered the various services provided by the Adviser to the Fund and reviewed comparative information regarding the expenses and expense ratios of the Fund and a peer group of other investment companies. The Trustees noted that the Adviser's fees are within the range of fees presented in the comparative information and noted that a portion of the Fund's investment portfolio is invested in venture and restricted securities, a portfolio management service that can warrant higher management fees than those charged by the Adviser to the Fund. The Trustees also considered financial information provided by the Adviser, including financial statements of the Adviser and a comparison of the Adviser's profitability with respect to its services for the Fund to the profitability of other investment advisers.
The Trustees noted that the fees charged by the Adviser are within a reasonable range of fees as compared to fees charged by other investment advisers, and the services provided by the Adviser and the amounts paid under the Advisory Agreement are at least comparable to the services rendered and fees charged by others for similar services to warrant a finding that fees to be paid by the Fund are fair. Based on the information provided to and evaluated by the Trustees, the Trustees concluded that the fees charged by the Adviser are fair and reasonable in light of the quality and nature of the services provided by the Adviser and that the profitability of the Adviser's relationship with the Fund has not been excessive.
Whether fee levels reflect economies of scale and the extent to which economies of scale would be realized as the Fund grows. The Trustees considered the advisory fee schedule in the Advisory Agreement and noted that it does not provide for breakpoints that might reduce the effective fee to the extent that the Fund's net assets should increase. The Trustees determined that, given the closed-end structure of the Fund and the fact that the Fund has no current plans to seek additional assets beyond maintaining its dividend reinvestment plan and that any significant growth in its assets generally will occur through appreciation in the value of the Fund's investment portfolio (rather than sales of additional shares in the Fund), the Fund's advisory fee schedule is satisfactory and fair.
35
TEKLA WORLD HEALTHCARE FUND
PRIVACY NOTICE: If you are a registered shareholder of the Fund, the Fund and Tekla Capital Management LLC, the Fund's investment adviser, may receive nonpublic personal information about you from the information collected by the transfer agent from your transactions in Fund shares. Any nonpublic personal information is not disclosed to third parties, except as permitted or required by law. In connection with servicing your account and effecting transactions, the information received may be shared with the investment adviser and non-affiliates, including transfer agents, custodians or other service companies. Access to your nonpublic personal information is restricted to employees who need to know that information to provide products or services to you. To maintain the security of your nonpublic personal information, physical, electronic, and procedural safeguards are in place that comply with federal standards. The policies and practices described above apply to both current and former shareholders.
If your Fund shares are held in "street name" at a bank or brokerage, we do not have access to your personal information and you should refer to your bank's or broker's privacy policies for a statement of the treatment of your personal information.
FOR MORE INFORMATION: A description of the Fund's proxy voting policies and procedures and information on how the Fund voted proxies relating to portfolio securities during the most recent 12-month period ended June 30 is available (i) without charge, upon request by calling 1-800-451-2597; (ii) by writing to Tekla Capital Management LLC at 100 Federal Street, 19th Floor, Boston, MA 02110; (iii) on the Fund's website at www.teklacap.com; and (iv) on the SEC's website at http://www.sec.gov.
The Fund's complete Schedule of Investments for the first and third quarters of its fiscal year will be filed quarterly with the SEC on Form N-PORT. This Schedule of Investments will also be available on the Fund's website at www.teklacap.com, or the SEC's website at http://www.sec.gov.
You can find information regarding the Fund at the Fund's website, www.teklacap.com. The Fund regularly posts information to its website, including information regarding daily share pricing and distributions and press releases, and maintains links to the Fund's SEC filings. The Fund currently publishes and distributes quarterly fact cards, including performance, portfolio and sector information for each fiscal quarter. These fact cards will be available on the Fund's website and by request from the Fund's marketing and investor support services agent, Destra Capital Advisors, at 1-877-855-3434.
DISTRIBUTION POLICY: The Fund has a managed distribution policy as described in the Notes to Financial Statements. For more information contact your financial adviser.
SHARE REPURCHASE PROGRAM: In March 2019, the Trustees reauthorized the share repurchase program to allow the Fund to repurchase up to 12% of its outstanding shares for a one year period beginning July 14, 2020.
PORTFOLIO MANAGEMENT: Daniel R. Omstead, PhD, Jason C. Akus, MD/MBA, Timothy Gasperoni, MBA, PhD, Christian M. Richard, MBA, MS, Henry Skinner, PhD, Ashton L. Wilson, Christopher Abbott, Robert Benson, CFA, CAIA, Richard Goss, Alan Kwan, MBA, PhD and Loretta Tsa, PhD are members of a team that analyzes investments on behalf of the Fund. Dr. Omstead exercises ultimate decision making authority with respect to investments.
HOUSEHOLDING: A number of banks, brokers and financial advisers have instituted "householding". Under this practice, which has been approved by the SEC, only one copy of shareholder documents may be delivered to multiple shareholders who share the same address and satisfy other conditions. Householding is intended to reduce expenses and eliminate duplicate mailings of shareholder documents. If you do not want the mailing of your shareholder documents to be combined with those of other members of your household, please contact your bank, broker or financial adviser.
36
TEKLA WORLD HEALTHCARE FUND
New York Stock Exchange Symbol: THW
NAV Symbol: XTHWX
100 Federal Street, 19th Floor
Boston, Massachusetts 02110
(617) 772-8500
www.teklacap.com
Officers
Daniel R. Omstead, PhD, President
Laura Woodward, CPA, Chief Compliance Officer,
Secretary and Treasurer
Trustees
Rakesh K. Jain, PhD
Thomas M. Kent, CPA
Elizabeth G. Nabel, MD
Daniel R. Omstead, PhD
Oleg M. Pohotsky, MBA, JD
William S. Reardon, MBA
Lucinda H. Stebbins, MBA, CPA
Investment Adviser
Tekla Capital Management LLC
Administrator & Custodian
State Street Bank and Trust Company
Transfer Agent
Computershare, Inc.
Legal Counsel
Dechert LLP
Shareholders with questions regarding share transfers may call
1-800-426-5523
Daily net asset value may be obtained from
our website (www.teklacap.com) or by calling
617-772-8500
Item 2. CODE OF ETHICS.
Not applicable to this semi-annual filing.
ITEM 3. AUDIT COMMITTEE FINANCIAL EXPERT.
Not applicable to this semi-annual filing.
ITEM 4. PRINCIPAL ACCOUNTANT FEES AND SERVICES.
Not applicable to this semi-annual filing.
ITEM 5. AUDIT COMMITTEE OF LISTED REGISTRANTS.
Not applicable to this semi-annual filing.
ITEM 6. INVESTMENTS.
The Registrant’s Schedule of Investments is included as part of the Report to Shareholders filed under Item 1 of this form.
ITEM 7. DISCLOSURE OF PROXY VOTING POLICIES AND PROCEDURES FOR CLOSED-END MANAGEMENT INVESTMENT COMPANIES.
Not applicable to this semi-annual filing.
ITEM 8. PORTFOLIO MANAGERS OF CLOSED-END MANAGEMENT INVESTMENT COMPANIES
Not applicable to this semi-annual filing.
ITEM 9. PURCHASES OF EQUITY SECURITIES BY CLOSED-END MANAGEMENT INVESTMENT COMPANY AND AFFILIATED PURCHASERS.
Period | | (a) Total No.
of Shares
Purchased (1) | | (b) Average
Price Paid per
Share | | (c) Total No.
of Shares
Purchased as
Part of
Publicly
Announced Plans
or Programs | | (d) Maximum No.
of Shares that
May Yet Be
Purchased Under
the Plans or
Programs | |
Month #1 (Oct. 1, 2018—Oct. 31, 2018) | | — | | | — | | — | | 3,648,012 | |
Month #2 (Nov. 1, 2018 — Nov. 30, 2018) | | — | | | — | | — | | 3,648,012 | |
Month #3 (Dec. 1, 2018 — Dec. 31, 2018) | | 192,826 | (2) | $ | 11.30 | | 183,426 | | 3,464,586 | |
Month #4 (Jan. 1, 2019 — Jan. 31, 2019) | | 60,729 | | $ | 11.90 | | 60,729 | | 3,403,857 | |
Month #5 (Feb. 1, 2019 — Feb. 28, 2019) | | — | | — | | — | | 3,403,857 | |
Month #6 (Mar. 1, 2019 — Mar. 31, 2019) | | — | | — | | — | | 3,403,857 | |
Total | | 253,555 | | $ | 11.44 | | 244,155 | | | |
(1) On December 3, 2015, the share repurchase program was announced, which has been subsequently reviewed and approved by the Board of Trustees. On March 22, 2018, the Trustees approved the renewal of the repurchase program allowing the Registrant to repurchase up to 12% of its outstanding shares in the open market for a one year period ending July 14, 2019. On March 21, 2019, the Trustees approved the renewal of the repurchase program allowing the Registrant to repurchase up to 12% of its outstanding shares in the open market for a one year period ending July 14, 2020.
(2) 9,400 shares were purchased in Month #3 by Daniel R. Omstead in the open market. Dr. Omstead is a director of the Registrant and a controlling person of the Registrant's investment adviser. Accordingly, Dr. Omstead may be deemed an "affiliated purchaser" of the Registrant's shares as such term is defined by Rule 10b-18(a)(3) under the Exchange Act of 1934.
ITEM 10. SUBMISSION OF MATTERS TO A VOTE OF SECURITY HOLDERS.
There have been no material changes to the procedures by which the shareholders may recommend nominees to the Registrant’s Board of Trustees, where those changes were implemented after the Registrant last provided disclosure in response to the requirements of Item 7(d)(2)(ii)(G) of Schedule 14A, or this Item.
ITEM 11. CONTROLS AND PROCEDURES.
(a) In the opinion of the principal executive officer and principal financial officer, based on their evaluation which took place within 90 days of this filing, the Registrant’s disclosure controls and procedures are adequately designed and are operating effectively to ensure (i) that material information relating to the Registrant, including its consolidated subsidiaries, is made known to them by others within those entities, particularly during the period in which this report is being prepared; and (ii) that information required to be disclosed by the registrant on Form N-CSR is recorded, processed, summarized and reported within the time period specified in the Securities and Exchange Commission’s rules and forms.
(b) There were no changes in the Registrant’s internal control over financial reporting that occurred during the Registrant’s most recent fiscal half-year that have materially affected or that are reasonably likely to materially affect the Registrant’s internal control.
ITEM 12. EXHIBITS
(a)(1) Code of Ethics - Not applicable to this semi-annual filing.
(a)(2) Separate certifications of the Principal Executive and Financial Officers as required by Rule 30a-2(a) under the 1940 Act and Section 302 of the Sarbanes-Oxley Act of 2002 are attached hereto (Exhibit 1 and 2).
(a)(3) Notices to Fund’s shareholders in accordance with Investment Company Act Section 19(a) and Rule 19a-1 (Exhibit 3).
(b) Certifications pursuant to Section 906 of the Sarbanes-Oxley Act of 2002 are attached hereto (Exhibit 4).
SIGNATURES
Pursuant to the requirements of the Securities Exchange Act of 1934 and the Investment Company Act of 1940, the registrant has duly caused this report to be signed on its behalf by the undersigned, thereunto duly authorized.
(Registrant) | TEKLA WORLD HEALTHCARE FUND |
| |
By (Signature and Title)* | /s/ Daniel R. Omstead |
| Daniel R. Omstead, President |
| |
Date: | 6/5/19 | |
| | | |
Pursuant to the requirements of the Securities Exchange Act of 1934 and the Investment Company Act of 1940, this report has been signed below by the following persons on behalf of the registrant and in the capacities and on the dates indicated.
By (Signature and Title)* | /s/ Laura Woodward |
| Laura Woodward, Treasurer |
| |
Date: | 6/5/19 | |
| | | |
* Print the name and title of each signing officer under his or her signature.

