| | | OMB APPROVAL
OMB Number: 3235-0570
Expires: September 30, 2025
Estimated average burden hours per response 7.8 |
UNITED STATES
SECURITIES AND EXCHANGE COMMISSION
Washington, D.C. 20549
FORM N-CSR
CERTIFIED SHAREHOLDER REPORT OF REGISTERED
MANAGEMENT INVESTMENT COMPANIES
Investment Company Act file number 811-23037
Tekla World Healthcare Fund
(Exact name of registrant as specified in charter)
| | 100 Federal Street, 19th Floor, Boston, MA | | 02110 | |
| | (Address of principal executive offices) | | (Zip code) | |
(Name and address of agent for service)
Registrant's telephone number, including area code: 617-772-8500
Date of fiscal year end: September 30
Date of reporting period: October 1, 2022 to March 31, 2023
ITEM 1. REPORTS TO STOCKHOLDERS.

Semiannual Report
Tekla
World Healthcare Fund
March 31, 2023
Tekla World Healthcare Fund
Distribution policy: The Fund has implemented a managed distribution policy (the Policy) that provides for monthly distributions at a rate set by the Board of Trustees. Under the current Policy, the Fund intends to make monthly distributions at a rate of $0.1167 per share to shareholders of record. The Policy would result in a return of capital to shareholders if the amount of the distribution exceeds the Fund's net investment income and realized capital gains. A return of capital may occur, for example, when some or all of the money that you invested in the Fund is paid back to you. A return of capital distribution does not necessarily reflect the Fund's investment performance and should not be confused with "yield" or "income."
The amounts and sources of distributions reported in the Fund's notices pursuant to Section 19(a) of the Investment Company Act of 1940 are only estimates and are not being provided for tax reporting purposes. The actual amounts and sources of the amounts for tax reporting purposes will depend upon the Fund's investment experience during its fiscal year and may be subject to changes based on tax regulations. The Fund will send you a Form 1099-DIV for the calendar year that tells you how to report distributions for federal income tax purposes.
You should not draw any conclusions about the Fund's investment performance from the amount of distributions pursuant to the Policy or from the terms of the Policy. The Policy has been established by the Trustees and may be changed or terminated by them without shareholder approval. The Trustees regularly review the Policy and the frequency and rate of distributions considering the purpose and effect of the Policy, the financial market environment, and the Fund's income, capital gains and capital available to pay distributions. The suspension or termination of the Policy could have the effect of creating a trading discount or widening an existing trading discount. At this time there are no reasonably foreseeable circumstances that might cause the Trustees to terminate the Policy.
Consider these risks before investing: As with any investment company that invests in equity securities, the Fund is subject to market risk—the possibility that the prices of equity securities will decline over short or extended periods of time. As a result, the value of an investment in the Fund's shares will fluctuate with the market generally and market sectors in particular. You could lose money over short or long periods of time. Political and economic news can influence marketwide trends and can cause disruptions in the U.S. or world financial markets. Other factors may be ignored by the market as a whole but may cause movements in the price of one company's stock or the stock of companies in one or more industries. All of these factors may have a greater impact on initial public offerings and emerging company shares. Different types of equity securities tend to shift into and out of favor with investors, depending on market and economic conditions. The performance of funds that invest in equity securities of healthcare companies may at times be better or worse than the performance of funds that focus on other types of securities or that have a broader investment style.
Tekla World Healthcare Fund
Dear Shareholders,
In our view, the healthcare sector represents an attractive sector of the economy in which to invest over any reasonable timeframe and in particular in the current uncertain macro-environment. The sector has performed well over intermediate and long timeframes and is generally thought of as defensive. In addition, the sector is quite diverse, consisting of at least ten subsectors. We like the fact that these subsectors are diversified and often perform differently in divergent macroeconomic environments. Therefore, we can almost always identify a subsector which will benefit from, and hopefully outperform, in the current environment.
Macroeconomics provides much of the uncertainty currently. There is much debate about whether a U.S. and/or worldwide recession looms. Multi-decade highs in interest rates and inflation, an inverted yield curve and a potential housing slump after a Covid associated boom certainly raise the likelihood of a recession in the next year. But historically low unemployment, adequate real 4Q22 GDP growth and a favorable stock market argue against. Our view tips toward the likelihood of a modest recession sometime in the next year. But we have found over a career that while trying to time the market can be difficult, attempting to predict the timing of the next recession is about impossible. As Paul Samuelson once joked, "the stock market has predicted nine of the last five recessions". We think investment in healthcare could serve to blunt the potential impact of any recession.
Healthcare, along with consumer staples and utilities, are generally thought of as defensive. These sectors tend to address basic non-cyclical needs and therefore tend to deliver consistent earnings and stable dividends. As a sector that addresses the wellness of the population, healthcare spending will be among the last things people give up as money gets tight.
Healthcare can certainly exhibit ups and downs but has performed well over the long-term as can be seen in the following table. Over multiple timeframes, the S&P Composite 1500® Healthcare Index* (S15HLTH), representing the broad healthcare space, has performed well in comparison to the S&P 500® Index* (SPX), the broad market standard against which many or most investment approaches are typically compared.
Index | | One Year (%) | | Five Year (%) | | Ten Year (%) | | Twenty Year (%) | |
SPX | | | -7.8 | | | | 11.2 | | | | 12.2 | | | | 10.4 | | |
S15HLTH | | | -4.4 | | | | 11.5 | | | | 12.9 | | | | 10.6 | | |
We are particularly attracted to the diversity of investment opportunity provided by individual healthcare subsectors. These subsectors include pharmaceuticals, biotechnology, managed care (i.e., MCOs), providers (hospitals), medical technology (medtech), life science tools (LST), distributors, healthcare services and healthcare information technology.
Varying macroeconomic situations often influence our subsector allocation decision making. For example, when investment capital is freely available, speculation typically abounds. At
TEKLA WORLD HEALTHCARE FUND | SEMIANNUAL REPORT 1
such times, innovative, pre-profit or even pre-revenue companies in the biotech sector can be good investments. By contrast, when interest rates are high and capital is less available, profitable growing companies, including pharmaceuticals, can be better investments. At the moment, there is limited availability of capital. As such we are tending to be underweight not-yet profitable biotech companies and overweight profitable pharmaceuticals.
In an analogous way, when jobs are plentiful and wages are growing, individuals tend to seek more elective medical procedures. In this case, there is more demand for medical products and hospitals are busier. In this situation, managed care companies, which pay for medical procedures, tend to be more challenged. By contrast, when jobs are tight, demand for medical products and services often declines while managed care companies have lessened reimbursement demands and often perform better. At the moment, utilization of products and services is generally up, so we tend to be overweight medtech and hospitals and underweight managed care.
In large part, our management approach is to bias our subsector allocations based on macro factors while using our knowledge of associated individual companies to create a portfolio that is likely to perform well. In general, we seek to produce a solid risk adjusted performance that allows the Fund to continue to deliver the distributions to which shareholders have become accustomed. We summarize some of the macro factors that currently shape our views:
Clinical and commercial progress is always a key contributor to sentiment toward the healthcare area. In the last several years, particularly lately, we have seen some interesting developments that look to be creating enormous opportunities to address the needs of large groups of older patients. One example is the recent approval of Leqembi, a drug that slows the progression of Alzheimer's disease. This drug reduces the presence of beta amyloid plaque in the brain and has demonstrated an ability to slow the progression of Alzheimer's. Several other drugs are in late-stage development in the Alzheimer's disease space. The Alzheimer's Association reports that about one in every nine people over 65 have Alzheimer's.
Diabetes and obesity represent two of the biggest health issues we have seen in recent decades. Each of these conditions represents enormous challenges for the healthcare system. Approximately one in ten Americans have diabetes and approximately 40% of American adults over 20 are obese. This twin condition is often referred to as diabesity. In the last year or two we have seen the development of several drugs (i.e., Mounjaro, Wegovy and Ozempic) in the GLP 1 class that have had impact in one or both of these conditions. This class of drugs has the potential to dramatically impact diabesity with a market size that could reach $100B.
There has also been notable progress in the area of a condition called fatty liver which may affect 25% of the adult American population and particularly in an associated liver condition NASH (Non Alcoholic Steatohepatitus) which is thought to effect up to 6.5% of American
2 TEKLA WORLD HEALTHCARE FUND | SEMIANNUAL REPORT
adults with fatty liver. After many years and multiple attempts, we have, in the last year, seen a positive clinical trial (i.e., the MAESTRO_NASH study by Madrigal Pharmaceuticals, Inc.). This Phase III study showed, for the first time, statistically significant benefits in both NASH resolution and fibrosis improvement in a pivotal study. It has reignited the interests of both investors and biopharma companies to NASH, which is a potentially multi-billion dollar market that has heretofore seen few, if any, positive developments.
Merger & Acquisition (M&A) activity also contributes to sentiment in the healthcare space, particularly in the biotech subsector. It is notable that M&A activity is up as we write this letter in late April 2023. Importantly we have recently seen acquisitions of both large (i.e., Horizon Therapeutics plc and Seagen, Inc.) and small (i.e., Prometheus Biosciences, Inc., Bellus Health, Inc., Provention Bio, Inc., Concert Pharmaceuticals, Inc. and CinCor Pharma, Inc.) biotech companies. We are hopeful that this is the start of a longer M&A trend.
On the Regulatory/Legislative side, we note that In August 2022, President Biden signed into law the Inflation Reduction Act (IRA), which contains several material changes to Medicare reimbursement and drug pricing policies. While some aspects of the law may serve to lower patients' financial burden while also increasing access to medicines, such as a cap on Part D out-of-pocket spending, other portions may alter how and which drugs are developed by the biopharma industry. Most notably, beginning in 2026 Medicare will be able to "negotiate" prices for an increasing number of drugs with high overall Medicare spend that have been on the market for a certain length of time. This may result in companies re-evaluating the costs, risks and benefits of bringing certain medicines to market. Importantly, we may see a shift towards the development of more complex biologic drugs, as the IRA provides 13 years of protection prior to negotiation eligibility compared to only 9 years for oral "small molecule" drugs. Another provision of the law imposes a penalty on any company raising the price of their existing drugs more than the rate of inflation, although the impact of this may be limited given that annual price increases have moderated in recent years. The market has taken these developments in stride, but there may be increasing focus on the impacts of the law once CMS releases the initial list of negotiation-eligible drugs later in 2023.
Overall, despite a challenging macro environment that seems to have held the market back a bit, we see more positives than negatives in the above developments. In the short-term we see the defensive characteristics of healthcare as attractive. In the intermediate and longer-term, we see the underlying fundamentals combined with favorable U.S. population demographics compelling in comparison to most other sectors.
Be well,
Daniel R. Omstead
President and Portfolio Manager
TEKLA WORLD HEALTHCARE FUND | SEMIANNUAL REPORT 3
Fund Essentials
Objective of the Fund
The Fund's investment objective is to seek current income and long-term capital appreciation.
Description of the Fund
Tekla World Healthcare Fund (THW) is a non-diversified closed-end fund traded on the New York Stock Exchange under the ticker THW. THW employs a versatile growth and income investment strategy investing across all healthcare subsectors and across a company's full capital structure. THW invests at least 40% of AUM in ex-U.S. companies or those with substantial ex-U.S. revenues.
Investment Philosophy
Tekla Capital Management LLC, the Investment Adviser to the Fund, believes that:
• Aging demographics and adoption of new medical products and services may provide long-term tailwinds for healthcare companies
• Opportunities outside the United States may be underappreciated and timely
• Investment opportunity spans the globe including biotechnology, healthcare technology, life sciences and medical devices
• The potential for value creation may exist in companies both inside and outside the United States that are commercializing novel technologies
Fund Overview and Characteristics as of 3/31/23
Market Price1 | | $13.74 | |
NAV2 | | $12.64 | |
Premium/(Discount) | | 8.70% | |
Average 30 Day Volume | | 83,612 | |
Net Assets | | $479,622,074 | |
Managed Assets | | $599,622,074 | |
Leverage Outstanding | | $120,000,000 | |
Total Leverage Ratio3 | | 20.01% | |
Ticker | | THW | |
NAV Ticker | | XTHWX | |
Commencement of
Operations Date | | 6/30/15 | |
Fiscal Year to Date
Distributions
Per Share | | $0.70 | |
1 The closing price at which the Fund's shares were traded on the exchange.
2 Per-share dollar value of the Fund, calculated by dividing the total value of all the securities in its portfolio, plus any other assets and less liabilities, by the number of Fund shares outstanding.
3 As a percentage of managed assets.
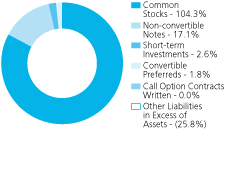
Holdings of the Fund (Data is based on net assets)
Asset Allocation as of 3/31/23
Sector Diversification as of 3/31/23
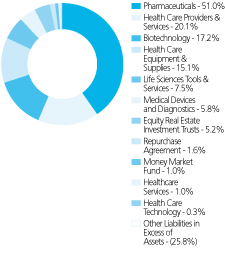
This data is subject to change on a daily basis.
4 TEKLA WORLD HEALTHCARE FUND | SEMIANNUAL REPORT
Largest Holdings by Issuer
(Excludes Short-Term Investments)
As of March 31, 2023
(Unaudited)
| Issuer – Sector | | % of Net
Assets | |
| UnitedHealth Group, Inc. – Health Care Providers & Services | | | 7.8 | % | |
| Johnson & Johnson – Pharmaceuticals | | | 7.1 | % | |
| Pfizer, Inc. – Pharmaceuticals | | | 5.5 | % | |
| AbbVie, Inc. – Biotechnology | | | 5.0 | % | |
| Eli Lilly & Co. – Pharmaceuticals | | | 4.9 | % | |
| AstraZeneca plc – Pharmaceuticals | | | 4.5 | % | |
| Abbott Laboratories – Health Care Equipment & Supplies | | | 4.5 | % | |
| Roche Holding AG – Pharmaceuticals | | | 4.2 | % | |
| Merck & Co., Inc. – Pharmaceuticals | | | 3.9 | % | |
| Novo Nordisk A/S – Pharmaceuticals | | | 3.7 | % | |
| Elevance Health, Inc. – Health Care Providers & Services | | | 3.3 | % | |
| Cigna Corp. – Health Care Providers & Services | | | 3.3 | % | |
| Amgen, Inc. – Biotechnology | | | 3.3 | % | |
| Thermo Fisher Scientific, Inc. – Life Sciences Tools & Services | | | 2.8 | % | |
| Novartis AG – Pharmaceuticals | | | 2.6 | % | |
| Bristol-Myers Squibb Co. – Pharmaceuticals | | | 2.4 | % | |
| Sanofi – Pharmaceuticals | | | 1.9 | % | |
| Illumina, Inc. – Life Sciences Tools & Services | | | 1.9 | % | |
| Bayer AG – Pharmaceuticals | | | 1.7 | % | |
| IDEXX Laboratories, Inc. – Health Care Equipment & Supplies | | | 1.6 | % | |
COUNTRY DIVERSIFICATION
As of March 31, 2023 | | % of Net
Assets | | % of Managed
Assets | |
United States | | | 68.0 | % | | | 54.7 | % | |
United States (with substantial ex-U.S. revenue) | | | 29.0 | % | | | 23.2 | % | |
Switzerland | | | 8.8 | % | | | 7.1 | % | |
United Kingdom | | | 5.6 | % | | | 4.5 | % | |
Denmark | | | 3.8 | % | | | 3.0 | % | |
France | | | 2.4 | % | | | 2.0 | % | |
Japan | | | 1.8 | % | | | 1.5 | % | |
Germany | | | 1.7 | % | | | 1.4 | % | |
Australia | | | 1.6 | % | | | 1.2 | % | |
Netherlands | | | 1.4 | % | | | 1.1 | % | |
Ireland | | | 1.3 | % | | | 1.0 | % | |
China | | | 0.2 | % | | | 0.2 | % | |
Israel | | | 0.2 | % | | | 0.1 | % | |
TEKLA WORLD HEALTHCARE FUND | SEMIANNUAL REPORT 5
Fund Performance
Fund and Benchmark Performance and Other Influencing Factors
THW is a closed-end fund which invests predominantly in healthcare companies. Subject to regular consideration, the Trustees of THW have instituted a policy of making monthly distributions to shareholders.
The Fund invests in equity and debt of healthcare companies. The Fund seeks to benefit from the earnings growth of the healthcare industry while capturing income. Income is derived from multiple sources including equity dividends, fixed income coupons, real estate investment trust distributions, convertible securities coupons and selective equity covered call writing premiums. In order to accomplish its objectives, THW often holds a majority of its assets in equities. Allocation of assets to various healthcare sectors can vary significantly, as can the percentage of the portfolio which is overwritten. Under normal market conditions, the Fund expects to invest at least 40 percent of its managed assets in companies organized or located outside of the U.S. or companies that do a substantial amount of business outside the U.S. (Foreign Issuers).
The Fund may invest up to 20 percent of managed assets, measured at the time of investment, in non-convertible debt of healthcare companies. It may also invest up to 20 percent of managed assets in healthcare REITs. The Fund may also hold up to 30 percent of managed assets in convertible securities and may invest a portion of its assets in restricted securities. In order to generate additional "current" income, THW often sells (or writes) calls against a material portion of its equity assets. The portion of equity assets overwritten can vary, but usually represents less than 20 percent of managed assets. At times, the overwritten portion of assets is materially less than 20 percent of managed assets. The use of covered calls is intended to produce "current" income but may limit upside in bullish markets. The Fund may also use leverage to enhance yield. The Fund may incur leverage up to 20 percent of managed assets at the time of borrowing. "Managed Assets" means the total assets of the Fund (including any assets attributable to borrowings for investment purposes) minus the sum of the Fund's accrued liabilities (other than liabilities representing borrowings for investment purposes).
The Fund considers investments in companies of all sizes and in all healthcare subsectors, including, but not limited to, biotechnology, pharmaceuticals, healthcare equipment, healthcare supplies, life science tools and services, healthcare distributors, managed healthcare, healthcare technology and healthcare facilities. The Fund expects to invest at least 40 percent of managed assets in companies organized or located outside the United States or companies that do a substantial amount of business outside the United States. The Fund also emphasizes innovation, investing both in public and pre-public venture companies. The Fund considers its pre-public and other restricted investments to be a differentiating characteristic. Among the various healthcare subsectors, THW has considered the biotechnology subsector, including both pre-public and public companies, to be a key contributor to the healthcare sector. The Fund holds biotech assets, including both public and pre-public, often representing 10-25% of net assets.
6 TEKLA WORLD HEALTHCARE FUND | SEMIANNUAL REPORT
There is no commonly published index which matches the investment strategy of THW. With respect to the Fund's equity investments, THW often holds 10-25% of its assets in biotechnology. By contrast, the S&P Global 1200 Healthcare Index®* (SGH) consists of approximately 110 global companies representing most or all of the healthcare subsectors in which THW typically invests; biotechnology often represents up to 20% of this index. By contrast, the NASDAQ Biotechnology Index®* (NBI) which contains approximately 270 constituents, is much more narrowly constructed. The vast majority of this index is comprised of biotechnology, pharmaceutical and life science tools companies. In recent years, biotechnology has often represented 72-82% of the NBI. Neither the SGH nor NBI indices contain any material amount of pre-public company assets.
The S&P 500® Health Care Corporate Bond Index* (SP5HCBIT) measures the performance of U.S. corporate debt issued by constituents in the healthcare sector of the SPX. This index is generally reflective of the debt assets in which THW invests though the Fund invests in the SPX index debt components as well as those of smaller capitalization companies.
The S&P Composite 1500® Health Care REITs Index* (S15HCRT) is comprised of U.S. publicly traded REITs in the healthcare sector. This index is generally reflective of the REITs in which THW invests.
Given the circumstances, we present both NAV and stock returns for the Fund in comparison to several commonly published indices. We note that THW is a dynamically configured multi-asset class global healthcare growth and income fund. There is no readily available index comprised of similar characteristics to THW and to which THW can directly be compared. Therefore, we provide returns for a number of indices representing the major components of THW's assets. Having said this, we note that there are no readily available indices representing the covered call strategy employed by THW or the restricted security components of THW.
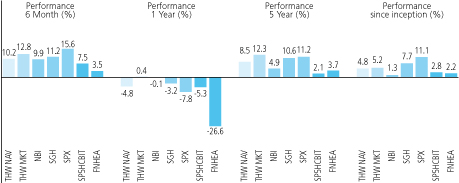
Fund Performance for the Period ended March 31, 2023
For the six-month period ended March 31, 2023, the Fund net asset value was up 10.2% and market value up 12.8%, including reinvestment of dividends and distributions. Over the same period the SGH was up 11.2%, the SP5HCBIT was up 7.5%, and the S15HCRT was up 3.5%, including reinvestment of dividends.
Period | | THW NAV (%) | | THW MKT (%) | | NBI (%) | | SGH (%) | | SPX (%) | | SP5HCBIT (%) | | S15HCRT (%) | |
| 6 month | | | 10.15 | | | | 12.75 | | | | 9.91 | | | | 11.25 | | | | 15.60 | | | | 7.53 | | | | 3.52 | | |
| 1 year | | | -4.80 | | | | 0.36 | | | | -0.14 | | | | -3.19 | | | | -7.75 | | | | -5.28 | | | | -26.64 | | |
| 5 year | | | 8.51 | | | | 12.27 | | | | 4.92 | | | | 10.61 | | | | 11.17 | | | | 2.10 | | | | 3.71 | | |
inception | | | 4.75 | | | | 5.22 | | | | 1.32 | | | | 7.71 | | | | 11.07 | | | | 2.75 | | | | 2.25 | | |
Inception date June 26, 2015
TEKLA WORLD HEALTHCARE FUND | SEMIANNUAL REPORT 7
Change in the value of a $10,000 investment
Cumulative total return from 6/26/2015 to 3/31/2023
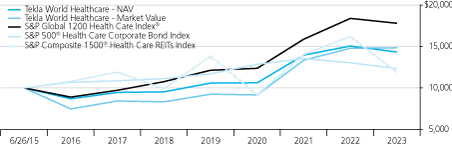
All performance over one-year has been annualized. Performance data quoted represents past performance, which is no guarantee of future results, and current performance may be lower or higher than the figures shown. The NAV total return takes into account the Fund's total annual expenses and does not reflect transaction charges. If transaction charges were reflected, NAV total return would be reduced. All distributions are assumed to be reinvested either in accordance with the dividend reinvestment plan (DRIP) for market price returns or NAV for NAV returns. Until the DRIP price is available from the Plan Agent, the market price returns reflect the reinvestment at the closing market price on the last business day of the month. Once the DRIP is available around mid-month, the market price returns are updated to reflect reinvestment at the DRIP price. The graph and table do not reflect the deduction of taxes a shareholder would pay on fund distributions or the sale of fund shares.
Risk Adjusted NASDAQ Biotechnology Index® computed by the Adviser using Bloomberg data for the NBI and applying the Fund's computed 0.90 beta to NBI performance to reflect the Fund's lower historical risk.
Portfolio Management Commentary
The largest positive contribution to Fund relative performance was company stock selection and an overweight allocation to health care facilities. Company stock selection was most positive in large cap biotechnology companies such as Horizon Therapeutics plc (HZNP) and in healthcare equipment companies such as DexCom, Inc. (DXCM). On December 12, 2022, Amgen, Inc. (AMGN) announced its nearly $28 billion acquisition offer (at a 36% premium) for Horizon, which develops treatments for thyroid eye disease. DexCom, which was up 44% in the period, is a leading provider of continuous glucose monitor devices for diabetes patients and continued its robust sales growth. The Fund had a positive industry allocation effect being overweight facilities including leading provider HCA Healthcare, Inc. (HCA), up 44% in the past six months.
8 TEKLA WORLD HEALTHCARE FUND | SEMIANNUAL REPORT
The largest negative contribution to Fund relative performance was company stock selection and foreign exchange hedging. Stock selection resulted in underperformance managed care companies including the fund holding Molina Healthcare, Inc. (MOH), which fell 19% in the past six months. The Fund hedges 50 percent of the foreign currency exposure from international equity positions to reduce portfolio risk. In the past six-months this resulted in losses as foreign currencies like the Euro, up over 10% versus the US Dollar, gained in value following a multi-year period of decline. We also estimate that the venture portfolio returns lagged the benchmark in the past six months detracting from performance.
We also note that interest expenses constituted a significant portion of overall Fund expenses in the reporting period and had a detrimental impact on performance.
Portfolio Highlights as of March 31, 2023
Among other investments, Tekla World Healthcare Fund's performance benefited in the past six-month period by the following:
CVS Health Corp. (CVS) is a large vertically integrated managed care organization and is one of the largest retail pharmacies and pharmacy benefit managers (PBMs) in the U.S. Recent underperformance has come on the heels of growing PBM political scrutiny and ongoing retail pharmacy reimbursement pressure. Additionally, a recent large PBM customer loss represents a headwind to the Company's 2024 outlook. The Fund benefited from being underweight CVS during this period of underperformance.
Horizon Therapeutics plc (HZNP) is a specialty pharmaceuticals company transitioning to a focused orphan disease business model. With 12 marketed therapies, including first-in-class Tepezza for thyroid eye disease, and a pipeline of over 20 programs in development, Horizon was recently acquired by Amgen for $28 billion. The Fund was overweight Horizon which had a strong positive return following Amgen's acquisition offer in December 2022.
IDEXX Laboratories, Inc. (IDXX) is a leading global animal health company providing diagnostics and lab testing services to veterinarians for pets as well as for the livestock, dairy and poultry industry. The Fund benefited from an overweight position in IDEXX as pet healthcare spending remains elevated from pre-pandemic levels, driving superior stock price performance.
Among other examples, Tekla World Healthcare Fund's performance was negatively impacted by the following investments:
Guardant Health, Inc. (GH) is a leading precision oncology company focused on using liquid biopsy for cancer detection and diagnostics through its proprietary blood tests, vast data sets and advanced analytics. The Fund has maintained an overweight position in the stock as it underperformed in the six-month period due to disappointing results from its colorectal cancer or CRC screening product. While the accuracy of the Guardant CRC screening test is not best in class, it did meet the bar needed for reimbursement and may see clinical adoption due to its convenience.
TEKLA WORLD HEALTHCARE FUND | SEMIANNUAL REPORT 9
Molina Healthcare, Inc. (MOH) provides Medicaid managed care services and has exposure to Medicare and state health insurance exchanges. In 2021 and 2022, Molina saw its Medicaid membership growth accelerate from new contract wins and from a halt in state Medicaid redeterminations during the COVID pandemic. More recently, the stock underperformed in anticipation that some of the membership gains would reverse once state Medicaid redeterminations resume and the Federal Public Health Emergency ends. The Fund was overweight during this period of underperformance.
Roche Holding AG (ROG SW) is a leading global developer of pharmaceuticals and diagnostics that primarily serve cancer patients. The Company's stock price declined in the six-month period and lagged its peers while the Fund held an overweight position. Stock weakness was partly due to a sales decline of its cancer fighting therapies Avastin and Herceptin which face generic competition. In addition, an experimental treatment in Roche's pipeline for Alzheimer's read out unsuccessfully.
*The trademarks NASDAQ Biotechnology Index®, S&P Global 1200 Health Care Index®, S&P Composite 1500® Health Care REITs Index, S&P 500® Health Care Corporate Bond Index, and S&P 500® Index referenced in this report are the property of their respective owners. These trademarks are not owned by or associated with the Fund or its service providers, including Tekla Capital Management LLC.
10 TEKLA WORLD HEALTHCARE FUND | SEMIANNUAL REPORT
Schedule of Investments
March 31, 2023 (Unaudited)
| | | Principal Amount | | Value | |
Non-Convertible Notes 17.1% | |
France 0.5% | |
Sanofi, 3.63% due 06/19/28 | | $ | 2,600,000 | | | $ | 2,536,096 | | |
Ireland 0.4% | |
Endo Dac/Endo Finance LLC/Endo Finco, Inc., 9.50% due 07/31/27 (a) | | | 516,000 | | | | 39,345 | | |
Endo Dac/Endo Finance LLC/Endo Finco, Inc., 6.00% due 06/30/28 (a) | | | 789,000 | | | | 59,175 | | |
Mallinckrodt International Finance S.A., 10.00% due 06/15/29 (a) | | | 997,897 | | | | 545,222 | | |
Shire Acquisitions Investments Ireland DAC, 3.20% due 09/23/26 | | | 1,500,000 | | | | 1,425,758 | | |
| | | | | | 2,069,500 | | |
United Kingdom 1.0% | |
AstraZeneca plc, 3.38% due 11/16/25 | | | 5,000,000 | | | | 4,884,826 | | |
United States 15.2% | |
Abbott Laboratories, 4.75% due 11/30/36 | | | 5,652,000 | | | | 5,862,695 | | |
AbbVie, Inc., 4.50% due 05/14/35 | | | 3,200,000 | | | | 3,098,836 | | |
AbbVie, Inc., 4.45% due 05/14/46 | | | 1,705,000 | | | | 1,539,982 | | |
Amgen, Inc., 3.63% due 05/22/24 | | | 2,000,000 | | | | 1,971,165 | | |
Amgen, Inc., 2.00% due 01/15/32 | | | 1,555,000 | | | | 1,264,674 | | |
Baxalta, Inc., 4.00% due 06/23/25 | | | 831,000 | | | | 813,457 | | |
Becton, Dickinson and Co., 3.73% due 12/15/24 | | | 328,000 | | | | 320,642 | | |
Bristol-Myers Squibb Co., 3.40% due 07/26/29 | | | 1,400,000 | | | | 1,330,394 | | |
Cigna Corp., 3.50% due 06/15/24 | | | 2,785,000 | | | | 2,731,417 | | |
Cigna Corp., 2.38% due 03/15/31 | | | 3,200,000 | | | | 2,697,225 | | |
CVS Health Corp., 1.88% due 02/28/31 | | | 2,448,000 | | | | 1,981,547 | | |
DH Europe Finance II Sarl, 3.25% due 11/15/39 | | | 985,000 | | | | 820,498 | | |
Elevance Health, Inc., 2.55% due 03/15/31 | | | 3,200,000 | | | | 2,745,272 | | |
EMD Finance LLC, 3.25% due 03/19/25 (a) | | | 4,000,000 | | | | 3,880,344 | | |
GlaxoSmithKline Capital plc, 3.00% due 06/01/24 | | | 1,400,000 | | | | 1,371,574 | | |
GlaxoSmithKline Capital plc, 3.38% due 06/01/29 | | | 1,000,000 | | | | 948,432 | | |
HCA, Inc., 5.38% due 02/01/25 | | | 1,250,000 | | | | 1,250,004 | | |
HCA, Inc., 5.25% due 04/15/25 | | | 600,000 | | | | 598,960 | | |
IQVIA, Inc., 5.00% due 05/15/27 (a) | | | 710,000 | | | | 697,639 | | |
Johnson & Johnson, 2.45% due 03/01/26 | | | 4,300,000 | | | | 4,129,139 | | |
Johnson & Johnson, 2.90% due 01/15/28 | | | 1,400,000 | | | | 1,340,278 | | |
Laboratory Corporation of America Holdings, 3.60% due 02/01/25 | | | 1,400,000 | | | | 1,360,926 | | |
Medtronic, Inc., 4.38% due 03/15/35 | | | 1,675,000 | | | | 1,649,896 | | |
Merck & Co., Inc., 2.80% due 05/18/23 | | | 1,400,000 | | | | 1,396,607 | | |
Merck & Co., Inc., 2.75% due 02/10/25 | | | 1,463,000 | | | | 1,428,043 | | |
Novartis Capital Corp., 3.40% due 05/06/24 | | | 2,115,000 | | | | 2,086,282 | | |
THE ACCOMPANYING NOTES ARE AN INTEGRAL PART OF THESE FINANCIAL STATEMENTS.
TEKLA WORLD HEALTHCARE FUND | SEMIANNUAL REPORT 11
| | | Principal Amount | | Value | |
United States (continued) | |
Par Pharmaceutical, Inc., 7.50% due 04/01/27 (a) | | $ | 193,000 | | | $ | 143,898 | | |
Pfizer, Inc., 3.45% due 03/15/29 | | | 5,300,000 | | | | 5,111,960 | | |
Pfizer, Inc., 4.00% due 12/15/36 | | | 1,800,000 | | | | 1,729,383 | | |
Senior Housing Properties Trust, 4.75% due 05/01/24 | | | 1,750,000 | | | | 1,576,073 | | |
Syneos Health, Inc., 3.63% due 01/15/29 (a) | | | 2,300,000 | | | | 1,893,712 | | |
UnitedHealth Group, Inc., 3.88% due 12/15/28 | | | 2,560,000 | | | | 2,502,272 | | |
UnitedHealth Group, Inc., 4.20% due 05/15/32 | | | 6,060,000 | | | | 5,930,273 | | |
Zimmer Biomet Holdings, Inc., 4.25% due 08/15/35 | | | 5,000,000 | | | | 4,391,828 | | |
| | | | | | 72,595,327 | | |
Total Non-Convertible Notes (Cost $88,162,242) | | | | | 82,085,749 | | |
| | | Shares | | | |
Convertible Preferreds (Restricted) (b) 1.8% | |
France 0.5% | |
Amolyt Pharma SAS Series C | | | 686,916 | | | | 1,594,215 | | |
Flamingo Therapeutics, Inc. Series A3 | | | 136,337 | | | | 903,409 | | |
| | | | | | 2,497,624 | | |
Ireland 0.5% | |
Priothera Ltd. Series A, 6.00% | | | 194,134 | | | | 2,105,383 | | |
United States 0.8% | |
Aristea Therapeutics, Inc. Series B, 8.00% | | | 290,187 | | | | 1,600,004 | | |
Endeavor Biomedicines, Inc. Series B, 8.00% | | | 424,079 | | | | 1,999,999 | | |
IO Light Holdings, Inc. Series A2 | | | 101,839 | | | | 343,706 | | |
| | | | | | 3,943,709 | | |
Total Convertible Preferreds (Cost $10,955,883) | | | | | 8,546,716 | | |
Common Stocks 104.3% | |
Australia 1.6% | |
CSL Ltd. | | | 38,719 | | | | 7,461,700 | | |
Canada 0.0% | |
Fusion Pharmaceuticals, Inc. (c) | | | 7,378 | | | | 27,815 | | |
Fusion Pharmaceuticals, Inc. (Restricted) (b) (c) | | | 3,689 | | | | 12,517 | | |
| | | | | | 40,332 | | |
China 0.2% | |
BeiGene Ltd. ADR (c) | | | 4,114 | | | | 886,690 | | |
I-Mab ADR (c) | | | 38,848 | | | | 134,414 | | |
| | | | | | 1,021,104 | | |
THE ACCOMPANYING NOTES ARE AN INTEGRAL PART OF THESE FINANCIAL STATEMENTS.
12 TEKLA WORLD HEALTHCARE FUND | SEMIANNUAL REPORT
| | | Shares | | Value | |
Denmark 3.8% | |
MorphoSys AG ADR (c) | | | 81,867 | | | $ | 323,375 | | |
Novo Nordisk A/S ADR | | | 111,323 | | | | 17,715,942 | | |
| | | | | | 18,039,317 | | |
France 1.4% | |
Sanofi ADR | | | 123,454 | | | | 6,718,367 | | |
Germany 1.8% | |
Affimed N.V. (c) | | | 10,000 | | | | 7,456 | | |
Bayer AG | | | 131,684 | | | | 8,385,879 | | |
| | | | | | 8,393,335 | | |
Ireland 0.4% | |
ICON plc (c) | | | 6,534 | | | | 1,395,597 | | |
Perrigo Co. plc | | | 15,882 | | | | 569,687 | | |
| | | | | | 1,965,284 | | |
Israel 0.2% | |
Teva Pharmaceutical Industries Ltd. ADR (c) | | | 90,281 | | | | 798,987 | | |
Japan 1.8% | |
Astellas Pharma, Inc. | | | 44,419 | | | | 629,945 | | |
Daiichi Sankyo Co., Ltd. | | | 54,075 | | | | 1,963,846 | | |
Eisai Co., Ltd. | | | 6,830 | | | | 386,009 | | |
Hoya Corp. | | | 9,682 | | | | 1,061,720 | | |
M3, Inc. | | | 7,436 | | | | 184,871 | | |
Olympus Corp. | | | 28,940 | | | | 505,347 | | |
Ono Pharmaceutical Co., Ltd. | | | 11,330 | | | | 235,859 | | |
Otsuka Holdings Co., Ltd. | | | 20,808 | | | | 658,678 | | |
Shionogi & Co., Ltd. | | | 7,707 | | | | 346,938 | | |
Sysmex Corp. | | | 3,715 | | | | 241,828 | | |
Takeda Pharmaceuticals Co., Ltd. | | | 9,600 | | | | 314,517 | | |
Takeda Pharmaceuticals Co., Ltd. ADR | | | 105,073 | | | | 1,731,603 | | |
Terumo Corp. | | | 17,288 | | | | 465,354 | | |
| | | | | | 8,726,515 | | |
Netherlands 1.4% | |
argenx SE ADR (c) | | | 12,509 | | | | 4,660,603 | | |
Koninklijke Philips N.V. | | | 109,860 | | | | 2,015,931 | | |
| | | | | | 6,676,534 | | |
Switzerland 8.8% | |
Lonza Group AG | | | 12,711 | | | | 7,604,789 | | |
Novartis AG ADR | | | 136,225 | | | | 12,532,700 | | |
Roche Holding AG ADR | | | 562,829 | | | | 20,183,048 | | |
Oculis Holding AG (Restricted) (b) | | | 304,333 | | | | 1,988,512 | | |
| | | | | | 42,309,049 | | |
THE ACCOMPANYING NOTES ARE AN INTEGRAL PART OF THESE FINANCIAL STATEMENTS.
TEKLA WORLD HEALTHCARE FUND | SEMIANNUAL REPORT 13
| | | Shares | | Value | |
United Kingdom 4.6% | |
AstraZeneca plc ADR (d) | | | 242,692 | | | $ | 16,845,252 | | |
Smith & Nephew plc ADR (e) | | | 181,710 | | | | 5,071,526 | | |
| | | | | | 21,916,778 | | |
United States 78.5% | |
Abbott Laboratories (d) | | | 153,165 | | | | 15,509,488 | | |
AbbVie, Inc. (d) | | | 122,534 | | | | 19,528,244 | | |
Acadia Healthcare Co., Inc. (c) | | | 51,920 | | | | 3,751,220 | | |
Align Technology, Inc. (c) | | | 2,572 | | | | 859,408 | | |
Amgen, Inc. (d) | | | 51,124 | | | | 12,359,227 | | |
Ardelyx, Inc. (c) | | | 282,002 | | | | 1,350,790 | | |
Avantor, Inc. (c) | | | 142,388 | | | | 3,010,082 | | |
Biogen, Inc. (c) (d) | | | 16,808 | | | | 4,673,128 | | |
Biohaven Ltd. (c) | | | 13,100 | | | | 178,946 | | |
Boston Scientific Corp. (c) (d) | | | 145,111 | | | | 7,259,903 | | |
Bristol-Myers Squibb Co. (d) | | | 147,326 | | | | 10,211,165 | | |
Catalent, Inc. (c) | | | 12,095 | | | | 794,763 | | |
Charles River Laboratories International, Inc. (c) | | | 23,664 | | | | 4,775,869 | | |
The Cigna Group (d) | | | 40,328 | | | | 10,305,014 | | |
Community Health Systems, Inc. (c) | | | 8,700 | | | | 42,630 | | |
Community Healthcare Trust, Inc. | | | 14,900 | | | | 545,340 | | |
Danaher Corp. | | | 30,958 | | | | 7,802,654 | | |
DexCom, Inc. (c) (d) | | | 64,567 | | | | 7,501,394 | | |
Diversified Healthcare Trust REIT | | | 63,841 | | | | 86,185 | | |
Edwards Lifesciences Corp. (c) (d) | | | 43,150 | | | | 3,569,800 | | |
Elevance Health, Inc. | | | 28,373 | | | | 13,046,189 | | |
Eli Lilly & Co. (d) | | | 69,036 | | | | 23,708,343 | | |
Galera Therapeutics, Inc. (c) | | | 161,709 | | | | 413,975 | | |
Gilead Sciences, Inc. | | | 87,662 | | | | 7,273,316 | | |
Global Medical REIT, Inc. | | | 143,229 | | | | 1,304,816 | | |
GSK plc ADR | | | 41,852 | | | | 1,489,094 | | |
Guardant Health, Inc. (c) | | | 53,333 | | | | 1,250,126 | | |
HCA Healthcare, Inc. (d) | | | 18,103 | | | | 4,773,399 | | |
Healthcare Realty Trust, Inc. | | | 149,567 | | | | 2,891,130 | | |
Healthpeak Properties, Inc. | | | 83,601 | | | | 1,836,714 | | |
Humana, Inc. (d) | | | 9,425 | | | | 4,575,461 | | |
IDEXX Laboratories, Inc. (c) (d) | | | 15,748 | | | | 7,875,260 | | |
Illumina, Inc. (c) (d) | | | 39,207 | | | | 9,117,588 | | |
Intuitive Surgical, Inc. (c) (d) | | | 29,795 | | | | 7,611,729 | | |
IQVIA Holdings, Inc. (c) | | | 12,104 | | | | 2,407,365 | | |
Johnson & Johnson (d) | | | 182,963 | | | | 28,359,265 | | |
THE ACCOMPANYING NOTES ARE AN INTEGRAL PART OF THESE FINANCIAL STATEMENTS.
14 TEKLA WORLD HEALTHCARE FUND | SEMIANNUAL REPORT
| | | Shares | | Value | |
United States (continued) | |
Laboratory Corporation of America Holdings | | | 7,189 | | | $ | 1,649,300 | | |
LTC Properties, Inc. | | | 46,903 | | | | 1,647,702 | | |
Mallinckrodt plc (c) | | | 35,048 | | | | 255,503 | | |
McKesson Corp. | | | 11,501 | | | | 4,094,931 | | |
Medical Properties Trust, Inc. (e) | | | 145,186 | | | | 1,193,429 | | |
Medtronic plc | | | 79,482 | | | | 6,407,839 | | |
Merck & Co., Inc. | | | 149,510 | | | | 15,906,369 | | |
Moderna, Inc. (c) | | | 14,416 | | | | 2,214,009 | | |
Molina Healthcare, Inc. (c) (d) | | | 14,583 | | | | 3,900,807 | | |
National Health Investors, Inc. | | | 4,442 | | | | 229,118 | | |
Omega Healthcare Investors, Inc. | | | 71,075 | | | | 1,948,166 | | |
Pfizer, Inc. (d) | | | 475,473 | | | | 19,399,298 | | |
Physicians Realty Trust | | | 291,309 | | | | 4,349,243 | | |
R1 RCM, Inc. (c) | | | 124,297 | | | | 1,864,455 | | |
Regeneron Pharmaceuticals, Inc. (c) | | | 5,845 | | | | 4,802,661 | | |
ResMed, Inc. (d) | | | 20,089 | | | | 4,399,290 | | |
Sabra Health Care REIT, Inc. | | | 90,781 | | | | 1,043,982 | | |
Stryker Corp. (e) | | | 16,321 | | | | 4,659,156 | | |
Thermo Fisher Scientific, Inc. (d) | | | 23,270 | | | | 13,412,130 | | |
UnitedHealth Group, Inc. (d) | | | 61,534 | | | | 29,080,353 | | |
Universal Health Realty Income Trust | | | 8,183 | | | | 393,684 | | |
Ventas, Inc. | | | 66,681 | | | | 2,890,621 | | |
Veradigm, Inc. (c) | | | 90,363 | | | | 1,179,237 | | |
Vertex Pharmaceuticals, Inc. (c) (d) | | | 16,833 | | | | 5,303,573 | | |
Welltower, Inc. | | | 41,484 | | | | 2,973,988 | | |
West Pharmaceutical Services, Inc. | | | 3,370 | | | | 1,167,604 | | |
Zimmer Biomet Holdings, Inc. | | | 23,986 | | | | 3,098,991 | | |
Zoetis, Inc. (d) | | | 29,308 | | | | 4,878,024 | | |
| | | | | | 376,392,483 | | |
Total Common Stocks (Cost $495,708,240) | | | | | 500,459,785 | | |
| | | Principal Amount | | | |
Short-Term Investments 2.6% | |
Repurchase Agreement, Fixed Income Clearing Corp.,
repurchase value $7,531,904, 1.44%, dated 03/31/23,
due 04/03/23 (collateralized by U.S. Treasury Note 2.625%,
due 04/15/25, market value $7,681,712) | | $ | 7,531,000 | | | | 7,531,000 | | |
THE ACCOMPANYING NOTES ARE AN INTEGRAL PART OF THESE FINANCIAL STATEMENTS.
TEKLA WORLD HEALTHCARE FUND | SEMIANNUAL REPORT 15
| | | Shares | | Value | |
State Street Institutional U.S. Government Money Market Fund,
Institutional Class, 4.67%, (f) | | | 4,998,623 | | | $ | 4,998,623 | | |
Total Short-Term Investments (Cost $12,529,623) | | | | | 12,529,623 | | |
Total Investments Before Milestone Interest 125.8%
(Cost $607,355,988) | | | | | 603,621,873 | | |
| | | Interests | | | |
Milestone Interest (Restricted) (b) 0.0% | |
Biotechnology 0.0% | |
Rainier Therapeutics Milestone Interest | | | 1 | | | | 131,009 | | |
Total Milestone Interest (Cost $143,115) | | | | | 131,009 | | |
| | | Number of Contracts
(100 shares each)/
Notional Amount ($) | | | |
Option Contracts Written 0.0% | |
Call Option Contracts Written 0.0% | |
Abbott Laboratories Apr23 110 Call | | | 228/ | (2,508,000) | | | (3,192 | ) | |
AbbVie, Inc. Apr23 155 Call | | | 31/ | (480,500) | | | (15,655 | ) | |
Amgen, Inc. Apr23 255 Call | | | 66/ | (1,683,000) | | | (2,640 | ) | |
AstraZeneca plc Apr23 70 Call | | | 364/ | (2,548,000) | | | (37,492 | ) | |
Biogen, Inc. Apr23 300 Call | | | 16/ | (480,000) | | | (1,344 | ) | |
Boston Scientific Corp. Apr23 50 Call | | | 280/ | (1,400,000) | | | (25,200 | ) | |
Bristol-Myers Squibb Co. Apr23 75 Call | | | 218/ | (1,635,000) | | | (436 | ) | |
Cigna Corp. Apr23 310 Call | | | 39/ | (1,209,000) | | | (390 | ) | |
DexCom, Inc. Apr23 125 Call | | | 70/ | (875,000) | | | (5,950 | ) | |
Edwards Lifesciences Corp. Apr23 80 Call | | | 61/ | (488,000) | | | (21,960 | ) | |
Eli Lilly & Co. Apr23 350 Call | | | 103/ | (3,605,000) | | | (45,423 | ) | |
HCA Healthcare, Inc. Apr23 270 Call | | | 18/ | (486,000) | | | (9,504 | ) | |
Humana, Inc. Apr23 530 Call | | | 14/ | (742,000) | | | (1,540 | ) | |
IDEXX Laboratories, Inc. Apr23 510 Call | | | 23/ | (1,173,000) | | | (21,160 | ) | |
Illumina, Inc. Apr23 220 Call | | | 42/ | (924,000) | | | (55,440 | ) | |
Intuitive Surgical, Inc. Apr23 250 Call | | | 44/ | (1,100,000) | | | (53,240 | ) | |
Johnson & Johnson Apr23 165 Call | | | 181/ | (2,986,500) | | | (3,077 | ) | |
Molina Healthcare, Inc. Apr23 310 Call | | | 14/ | (434,000) | | | (6,720 | ) | |
Pfizer, Inc. Apr23 45 Call | | | 577/ | (2,596,500) | | | (1,731 | ) | |
ResMed, Inc. Apr23 220 Call | | | 19/ | (418,000) | | | (7,885 | ) | |
Thermo Fisher Scientific, Inc. Apr23 570 Call | | | 15/ | (855,000) | | | (23,700 | ) | |
UnitedHealth Group, Inc. Apr23 510 Call | | | 91/ | (4,641,000) | | | (11,375 | ) | |
THE ACCOMPANYING NOTES ARE AN INTEGRAL PART OF THESE FINANCIAL STATEMENTS.
16 TEKLA WORLD HEALTHCARE FUND | SEMIANNUAL REPORT
| | | Number of Contracts
(100 shares each)/
Notional Amount ($) | | Value | |
Vertex Pharmaceuticals, Inc. Apr23 310 Call | | | 16/ | (496,000) | | ($ | 14,720 | ) | |
Zoetis, Inc. Apr23 180 Call | | | 18/ | (324,000) | | | (270 | ) | |
Total Option Contracts Written
(Premiums received ($579,144)) | | | | | (370,044 | ) | |
Total Investments 125.8% (Cost $606,919,959) | | | | | 603,382,838 | | |
Other Liabilities in Excess of Assets (25.8)% | | | | | (123,760,764 | ) | |
Net Assets 100% | | | | $ | 479,622,074 | | |
The percentage shown for each investment category in the Schedule of Investments is based on net assets.
(a) Security exempt from registration under Rule 144A of the Securities Act of 1933, as amended. These securities may be resold in transactions exempt from registration, normally to qualified institutional buyers.
(b) Security fair valued using significant unobservable inputs. See Investment Valuation and Fair Value Measurements.
(c) Non-income producing security.
(d) A portion of security is pledged as collateral for call options written.
(e) All or a portion of this security is on loan as of March 31, 2023. See Note 1.
(f) This security represents the investment of cash collateral received for securities lending and is a registered investment company advised by State Street Global Advisors. The rate shown is the annualized seven-day yield as of March 31, 2023.
ADR American Depository Receipt
The following forward contracts were held as of March 31, 2023:
Description | | Counterparty | | Settlement
Date | | Currency | | Settlement
Value (in USD) | | Current
Value | | Unrealized
Gain/(Loss) | |
Contracts Sold: | |
Australian Dollar | | Goldman Sachs Bank | | 04/28/23 | | 4,572,304 AUD | | $ | 3,060,019 | | | $ | 3,058,978 | | | $ | 1,041 | | |
British Pound | | Goldman Sachs Bank | | 04/28/23 | | 9,440,375 GBP | | | 11,633,625 | | | | 11,651,458 | | | | (17,833 | ) | |
Danish Krone | | Goldman Sachs Bank | | 04/28/23 | | 48,474,501 DKK | | | 7,045,462 | | | | 7,067,693 | | | | (22,231 | ) | |
Euro | | Goldman Sachs Bank | | 04/28/23 | | 11,686,116 EUR | | | 12,654,299 | | | | 12,690,602 | | | | (36,303 | ) | |
Israeli Sheqel | | Goldman Sachs Bank | | 04/28/23 | | 4,457,647 ILS | | | 1,250,544 | | | | 1,240,297 | | | | 10,247 | | |
Japanese Yen | | Goldman Sachs Bank | | 04/28/23 | | 523,322,125 JPY | | | 4,020,056 | | | | 3,955,063 | | | | 64,993 | | |
Swiss Franc | | Goldman Sachs Bank | | 04/28/23 | | 20,140,361 CHF | | | 22,085,824 | | | | 22,069,424 | | | | 16,400 | | |
| | | | | | | | | | | $ | 61,733,515 | | | $ | 16,314 | | |
THE ACCOMPANYING NOTES ARE AN INTEGRAL PART OF THESE FINANCIAL STATEMENTS.
TEKLA WORLD HEALTHCARE FUND | SEMIANNUAL REPORT 17
Financial statements
STATEMENT OF ASSETS AND LIABILITIES MARCH 31, 2023 (Unaudited)
ASSETS | |
Investments, at value (cost $607,355,988), including $4,985,118 of securities loaned | | $ | 603,621,873 | | |
Milestone interests, at value (cost $143,115) | | | 131,009 | | |
Total investments | | | 603,752,882 | | |
Cash | | | 2,053 | | |
Foreign currency, at value (cost $7,040) | | | 7,053 | | |
Dividends and interest receivable | | | 2,957,112 | | |
Securities lending income receivable | | | 656 | | |
Prepaid expenses | | | 96,512 | | |
Prepaid offering expenses (see Note 5) | | | 271,108 | | |
Unrealized appreciation on forward currency contracts | | | 92,681 | | |
Total assets | | | 607,180,057 | | |
LIABILITIES | |
Unrealized depreciation on forward currency contracts | | | 76,367 | | |
Accrued advisory fee | | | 486,800 | | |
Accrued investor support service fees | | | 24,340 | | |
Accrued shareholder reporting fees | | | 64,125 | | |
Accrued trustee fees | | | 4,490 | | |
Payable upon return of securities loaned | | | 4,998,623 | | |
Loan payable | | | 120,000,000 | | |
Options written, at value (premium received $579,144) | | | 370,044 | | |
Interest payable | | | 1,253,760 | | |
Accrued other | | | 279,434 | | |
Total liabilities | | | 127,557,983 | | |
Commitments and Contingencies (see Notes 1 and 4) | | | |
NET ASSETS | | $ | 479,622,074 | | |
SOURCES OF NET ASSETS CONSIST OF | |
Shares of beneficial interest, par value $.01 per share, unlimited number of shares authorized,
amount paid in on 37,945,713 shares issued and outstanding | | $ | 379,457 | | |
Additional paid-in-capital | | | 523,878,937 | | |
Total distributable earnings (loss) | | | (44,636,320 | ) | |
Total net assets (equivalent to $12.64 per share based on 37,945,713 shares outstanding) | | $ | 479,622,074 | | |
THE ACCOMPANYING NOTES ARE AN INTEGRAL PART OF THESE FINANCIAL STATEMENTS.
18 TEKLA WORLD HEALTHCARE FUND | SEMIANNUAL REPORT
STATEMENT OF OPERATIONS SIX-MONTHS ENDED MARCH 31, 2023 (Unaudited)
INVESTMENT INCOME | |
Dividend income (net of foreign tax of $247,983) | | $ | 4,985,099 | | |
Non-cash dividend income | | | 418,590 | | |
Interest and other income | | | 1,404,666 | | |
Securities lending | | | 4,907 | | |
Total investment income | | | 6,813,262 | | |
EXPENSES | |
Interest expense | | | 3,121,892 | | |
Advisory fees | | | 2,967,080 | | |
Investor support service fees | | | 148,354 | | |
Custodian fees | | | 82,620 | | |
Trustees' fees and expenses | | | 80,251 | | |
Administration fees | | | 65,784 | | |
Legal fees | | | 65,368 | | |
Shareholder reporting | | | 63,486 | | |
Professional services fees | | | 41,912 | | |
Transfer agent fees | | | 14,310 | | |
Other (see Note 2) | | | 169,584 | | |
Total expenses | | | 6,820,641 | | |
Net investment loss | | | (7,379 | ) | |
REALIZED AND UNREALIZED GAIN (LOSS) | |
Net realized gain (loss) on | | | |
Investments | | | (1,376,737 | ) | |
Closed or expired option contracts written | | | 1,726,367 | | |
Foreign currency transactions | | | 3,346 | | |
Forward contracts | | | (5,201,583 | ) | |
Net realized loss | | | (4,848,607 | ) | |
Net change in unrealized appreciation (depreciation) on | | | |
Investments | | | 49,843,484 | | |
Milestone interests | | | (7,511 | ) | |
Option contracts written | | | (29,675 | ) | |
Foreign currency | | | 30,743 | | |
Forward contracts | | | 685,635 | | |
Net change in unrealized appreciation (depreciation) | | | 50,522,676 | | |
Net realized and unrealized gain (loss) | | | 45,674,069 | | |
Net increase in net assets resulting from operations | | $ | 45,666,690 | | |
THE ACCOMPANYING NOTES ARE AN INTEGRAL PART OF THESE FINANCIAL STATEMENTS.
TEKLA WORLD HEALTHCARE FUND | SEMIANNUAL REPORT 19
STATEMENTS OF CHANGES IN NET ASSETS
| | | Six-months ended
March 31, 2023
(Unaudited) | | Year ended
September 30,
2022 | |
INCREASE (DECREASE) IN NET ASSETS FROM OPERATIONS | |
Net investment income gain (loss) | | ($ | 7,379 | ) | | $ | 1,947,208 | | |
Net realized gain (loss) | | | (4,848,607 | ) | | | 25,964,884 | | |
Change in net unrealized appreciation (depreciation) | | | 50,522,676 | | | | (90,748,168 | ) | |
Net increase (decrease) in net assets resulting from operations | | | 45,666,690 | | | | (62,836,076 | ) | |
DISTRIBUTIONS TO SHAREHOLDERS (See Note 1) | |
Distributions | | | (26,370,226 | ) | | | (31,069,521 | ) | |
Return of capital | | | — | | | | (21,264,321 | ) | |
Total distributions | | | (26,370,226 | ) | | | (52,333,842 | ) | |
CAPITAL SHARE TRANSACTIONS | |
Proceeds from at-the-market offering (274,984 and 0 shares,
respectively) | | | 3,950,593 | | | | — | | |
Expenses in connection with the at-the-market offering ( See Note 5) | | | (7,478 | ) | | | — | | |
Reinvestment of distributions (150,459 and 265,352 shares,
respectively) | | | 2,039,745 | | | | 3,830,775 | | |
Total capital share transactions | | | 5,982,860 | | | | 3,830,775 | | |
Net increase (decrease) in net assets | | | 25,279,324 | | | | (111,339,143 | ) | |
NET ASSETS | |
Beginning of period | | | 454,342,750 | | | | 565,681,893 | | |
End of period | | $ | 479,622,074 | | | $ | 454,342,750 | | |
THE ACCOMPANYING NOTES ARE AN INTEGRAL PART OF THESE FINANCIAL STATEMENTS.
20 TEKLA WORLD HEALTHCARE FUND | SEMIANNUAL REPORT
STATEMENT OF CASH FLOWS SIX-MONTHS ENDED MARCH 31, 2023 (Unaudited)
CASH FLOWS FROM OPERATING ACTIVITIES | |
Purchases of portfolio securities | | ($ | 104,638,870 | ) | |
Securities lending income | | | 4,732 | | |
Net maturities of short-term investments | | | 5,613,018 | | |
Sales of portfolio securities | | | 116,841,693 | | |
Proceeds from option contracts written | | | 2,388,929 | | |
Interest income received | | | 1,747,063 | | |
Dividend income received | | | 5,075,827 | | |
Other operating receipts (expenses paid) | | | (6,636,905 | ) | |
Net cash provided from operating activities | | | 20,395,487 | | |
CASH FLOWS FROM FINANCING ACTIVITIES | |
Cash distributions paid | | | (24,330,481 | ) | |
Net proceeds from at-the-market offering | | | 3,950,593 | | |
Expenses in connection with the at-the-market offering | | | (7,478 | ) | |
Net cash used for financing activities | | | (20,387,366 | ) | |
NET INCREASE IN CASH | | | 8,121 | | |
CASH AT BEGINNING OF YEAR | | | 985 | | |
CASH AT END OF SIX MONTHS | | $ | 9,106 | * | |
RECONCILIATION OF NET INCREASE IN NET ASSETS RESULTING FROM OPERATIONS TO NET CASH PROVIDED FROM OPERATING ACTIVITIES | |
Net increase in net assets resulting from operations | | $ | 45,666,690 | | |
Purchases of portfolio securities | | | (104,638,870 | ) | |
Net maturities of short-term investments | | | 5,613,018 | | |
Sales of portfolio securities | | | 116,841,693 | | |
Proceeds from option contracts written | | | 2,388,929 | | |
Accretion of discount | | | 347,717 | | |
Net realized loss on investments, options, foreign currencies and forwards | | | 4,848,607 | | |
Increase in net unrealized (appreciation) depreciation on investments, options, foreign
currencies and forwards | | | (50,522,676 | ) | |
Increase in dividends and interest receivable | | | (333,182 | ) | |
Increase in securities lending income receivable | | | (175 | ) | |
Decrease in accrued other expenses | | | (201,808 | ) | |
Increase in interest payable | | | 497,335 | | |
Increase in prepaid expenses and other assets | | | (111,791 | ) | |
Net cash provided from operating activities | | $ | 20,395,487 | | |
Supplemental disclosure: Cash paid for interest | | $ | 2,624,557 | | |
* Includes: $7,053 foreign currency.
THE ACCOMPANYING NOTES ARE AN INTEGRAL PART OF THESE FINANCIAL STATEMENTS.
TEKLA WORLD HEALTHCARE FUND | SEMIANNUAL REPORT 21
| | | Six-months ended March 31, 2023 | | Years ended September 30, | |
| | | (Unaudited) | | 2022 | | 2021 | | 2020 | | 2019 | | 2018 | |
OPERATING PERFORMANCE PER SHARE | |
Net asset value per share, Beginning of period | | $ | 12.11 | | | $ | 15.18 | | | $ | 14.14 | | | $ | 13.51 | | | $ | 15.24 | | | $ | 15.55 | | |
Net investment income (1) | | | — | (2) | | | 0.05 | | | | 0.08 | | | | 0.10 | | | | 0.06 | | | | 0.11 | | |
Net realized and
unrealized gain (loss) | | | 1.22 | | | | (4.52 | ) | | | 2.36 | | | | 1.93 | | | | (0.40 | ) | | | 0.96 | | |
| Total increase (decrease) from investment operations | | | 1.22 | | | | (4.47 | ) | | | 2.44 | | | | 2.03 | | | | (0.34 | ) | | | 1.07 | | |
Distributions to shareholders from | | | | | | | | | | | | | |
Net investment income | | | (0.70 | ) | | | (0.33 | ) | | | (0.14 | ) | | | (0.05 | ) | | | (0.19 | ) | | | (0.60 | ) | |
Net realized capital gains | | | — | | | | (0.50 | ) | | | — | | | | — | | | | — | | | | — | | |
Return of capital (tax basis) | | | — | | | | (0.57 | ) | | | (1.26 | ) | | | (1.35 | ) | | | (1.21 | ) | | | (0.80 | ) | |
Total distributions | | | (0.70 | ) | | | (1.40 | ) | | | (1.40 | ) | | | (1.40 | ) | | | (1.40 | ) | | | (1.40 | ) | |
Increase resulting from shares repurchased (1) | | | — | | | | — | | | | — | | | | — | (2) | | | 0.01 | | | | 0.02 | | |
Increase resulting from at-the-market offering (1) | | | 0.01 | | | | — | | | | — | | | | — | | | | — | | | | — | | |
Net asset value per share, end of period | | $ | 12.64 | | | $ | 12.11 | | | $ | 15.18 | | | $ | 14.14 | | | $ | 13.51 | | | $ | 15.24 | | |
Per share market value,
end of period | | $ | 13.74 | | | $ | 12.86 | | | $ | 16.45 | | | $ | 14.33 | | | $ | 13.44 | | | $ | 14.03 | | |
Total investment return
at market value | | | 12.75 | %* | | | (13.65 | %) | | | 26.00 | % | | | 18.14 | % | | | 6.80 | % | | | 6.91 | % | |
Total investment return
at net asset value | | | 10.15 | %* | | | (11.94 | %) | | | 17.91 | % | | | 15.97 | % | | | (1.10 | %) | | | 8.66 | % | |
RATIOS | |
Net investment income to average
net assets | | | — | (3)** | | | 0.37 | % | | | 0.53 | % | | | 0.68 | % | | | 0.45 | % | | | 0.78 | % | |
Expenses to average net assets | | | 2.82 | %** | | | 1.91 | % | | | 1.74 | % | | | 2.16 | % | | | 2.53 | % | | | 2.28 | % | |
Expenses, excluding interest
expense, to average net assets | | | 1.53 | %** | | | 1.53 | % | | | 1.51 | % | | | 1.57 | % | | | 1.59 | % | | | 1.57 | % | |
SUPPLEMENTAL DATA | |
Net assets at end of period
(in millions) | | $ | 480 | | | $ | 454 | | | $ | 566 | | | $ | 427 | | | $ | 407 | | | $ | 463 | | |
Portfolio turnover rate | | | 17.45 | %* | | | 43.87 | % | | | 69.37 | % | | | 48.11 | % | | | 55.17 | % | | | 54.60 | % | |
Senior securities (loan facility)
outstanding (in millions) | | $ | 120 | | | $ | 120 | | | $ | 120 | | | $ | 120 | | | $ | 120 | | | $ | 120 | | |
Asset coverage ratio on revolving
credit facility at period end | | | 500 | % | | | 479 | % | | | 571 | % | | | 455 | % | | | 440 | % | | | 486 | % | |
Asset coverage per $1,000 on
revolving credit facility at
period end | | $ | 4,997 | | | $ | 4,786 | | | $ | 5,714 | | | $ | 4,554 | | | $ | 4,396 | | | $ | 4,861 | | |
* Not annualized.
** Annualized.
(1) Computed using average shares outstanding.
(2) Amount represents less than $0.005 per share.
(3) Rounds to less than 0.05%.
THE ACCOMPANYING NOTES ARE AN INTEGRAL PART OF THESE FINANCIAL STATEMENTS.
22 TEKLA WORLD HEALTHCARE FUND | SEMIANNUAL REPORT
Notes to financial statements MARCH 31, 2023 (Unaudited)
(1) Organization and Significant Accounting Policies
Tekla World Healthcare Fund (the Fund) is a Massachusetts business trust formed on March 5, 2015 and registered under the Investment Company Act of 1940 as a non-diversified closed-end management investment company. The Fund commenced operations on June 30, 2015. The investment objective is to seek current income and long-term capital appreciation through investments in U.S. and non-U.S. companies engaged in the healthcare industry (including equity securities and debt securities). The Fund invests primarily in securities of public and private companies believed by the Fund's Investment Adviser, Tekla Capital Management LLC (the Adviser), to have significant potential for above-average growth.
The preparation of these financial statements requires the use of certain estimates by management in determining the Fund's assets, liabilities, revenues and expenses. Actual results could differ from these estimates and such differences could be material. The following is a summary of significant accounting policies followed by the Fund, which are in conformity with accounting principles generally accepted in the United States of America (GAAP). The Fund is an investment company and follows accounting and reporting guidance in the Financial Accounting Standards Board Accounting Standards Codification 946. Events or transactions occurring after March 31, 2023, through the date that the financial statements were issued, have been evaluated in the preparation of these financial statements.
The market value of the Fund's investments will move up and down, sometimes rapidly and unpredictably, based upon political, regulatory, market, economic and social conditions, as well as developments that impact specific economic sectors, industries or segments of the market, including conditions that directly relate to the issuers of the Fund's investments, such as management performance, financial condition and demand for the issuers' goods and services. The Fund is subject to the risk that geopolitical events will adversely affect global economies and markets. War, terrorism and related geopolitical events have led, and in the future may lead, to increased short-term market volatility and may have adverse long-term effects on global economies and markets. Likewise, natural and environmental disasters and epidemics or pandemics may be highly disruptive to economies and markets. This means that the Fund may lose money on its investment due to unpredictable drops in a security's value or periods of below-average performance in a given security or in the securities market as a whole.
Investment Valuation
Shares of publicly traded companies listed on national securities exchanges or trading in the over-the-counter market are typically valued at the last sale price as of the close of trading, generally 4 p.m. Eastern Time. The Fund holds securities, currencies and other assets that are denominated in a foreign currency. The Fund will normally use the currency exchange rates as
TEKLA WORLD HEALTHCARE FUND | SEMIANNUAL REPORT 23
of 4:00 p.m. (Eastern Time) when valuing such assets. The Board of Trustees of the Fund (the Trustees) has established and approved fair valuation policies and procedures with respect to securities for which quoted prices may not be available or which do not reflect fair value. Convertible, corporate and government bonds are valued using a third-party pricing service. Convertible bonds are valued using this pricing service only on days when there is no sale reported. Puts and calls generally are valued at the close of regular trading on the securities or commodities exchange on which they are primarily traded. Options on securities generally are valued at their last sale price in the case of exchange traded options or, in the case of OTC-traded options, the average of the last sale price as obtained from two or more dealers unless there is only one dealer, in which case that dealer's price is used. Forward foreign currency contracts are valued on the basis of the value of the underlying currencies at the prevailing forward exchange rates. Restricted securities of companies that are publicly traded are typically valued based on the closing market quote on the valuation date adjusted for the impact of the restriction as determined in good faith by the Adviser also using fair valuation policies and procedures approved by the Trustees described below. Short-term investments with a maturity of 60 days or less are generally valued at amortized cost, which approximates fair value.
Convertible preferred shares, warrants or convertible note interests in private companies, milestone interests and other restricted securities, as well as shares of publicly traded companies for which market quotations are not readily available, such as stocks for which trading has been halted or for which there are no current day sales, or which do not reflect fair value, are typically valued in good faith, based upon the recommendations made by the Adviser pursuant to fair valuation policies and procedures approved by the Trustees.
The Adviser has a Valuation Sub-Committee comprised of senior management which reports to the Valuation Committee of the Board at least quarterly. Each fair value determination is based on a consideration of relevant factors, including both observable and unobservable inputs. Observable and unobservable inputs the Adviser considers may include (i) the existence of any contractual restrictions on the disposition of securities; (ii) information obtained from the company, which may include an analysis of the company's financial statements, products, intended markets or technologies; (iii) the price of the same or similar security negotiated at arm's length in an issuer's completed subsequent round of financing; (iv) the price and extent of public trading in similar securities of the issuer or of comparable companies; or (v) a probability and time value adjusted analysis of contractual terms. Where available and appropriate, multiple valuation methodologies are applied to confirm fair value. Significant unobservable inputs identified by the Adviser are often used in the fair value determination. A significant change in any of these inputs may result in a significant change in the fair value measurement. Due to the uncertainty inherent in the valuation process, such estimates of fair value may differ significantly from the values that would have been used had a ready market for the investments existed, and differences could be material.
24 TEKLA WORLD HEALTHCARE FUND | SEMIANNUAL REPORT
Additionally, changes in the market environment and other events that may occur over the life of the investments may cause the gains or losses ultimately realized on these investments to be different from the valuations used at the date of these financial statements.
Milestone Interests
The Fund holds financial instruments which reflect the current value of future milestone payments the Fund may receive as a result of contractual obligations from other parties. The value of such payments are adjusted to reflect the estimated risk based on the relative uncertainty of both the timing and the achievement of individual milestones. A risk to the Fund is that the milestones will not be achieved and no payment will be received by the Fund. The milestone interests were received as part of the proceeds from the sale of one private company. Any payments received are treated as a reduction of the cost basis of the milestone interests with payments received in excess of the cost basis treated as a realized gain. The contractual obligations with respect to the milestone interests provide for payments at various stages of the development of Rainier Therapeutics' principal product candidate as of the date of the sale.
The following is a summary of the impact of the milestone interests on the financial statements as of and for the six-months ended March 31, 2023:
Statement of Assets and Liabilities, Milestone interests, at value | | $ | 131,009 | | |
Statement of Assets and Liabilities, Total distributable earnings | | ($ | 12,106 | ) | |
Statement of Operations, Change in unrealized appreciation (depreciation)
on milestone interests | | ($ | 7,511 | ) | |
Options on Securities
An option contract is a contract in which the writer (seller) of the option grants the buyer of the option, upon payment of a premium, the right to purchase from (call option) or sell to (put option) the writer a designated instrument at a specified price within a specified period of time. Certain options, including options on indices, will require cash settlement by the Fund if the option is exercised.
The Fund's obligation under an exchange traded written option or investment in an exchange traded purchased option is valued at the last sale price or in the absence of a sale, the mean between the closing bid and asked prices. Gain or loss is recognized when the option contract expires, is exercised or is closed.
If the Fund writes a covered call option, the Fund foregoes, in exchange for the premium, the opportunity to profit during the option period from an increase in the market value of the underlying security above the exercise price. If the Fund writes a put option it accepts the risk of a decline in the market value of the underlying security below the exercise price. Over-the-counter options have the risk of the potential inability of counterparties to meet the terms of
TEKLA WORLD HEALTHCARE FUND | SEMIANNUAL REPORT 25
their contracts. The Fund's maximum exposure to purchased options is limited to the premium initially paid. In addition, certain risks may arise upon entering into option contracts including the risk that an illiquid secondary market will limit the Fund's ability to close out an option contract prior to the expiration date and that a change in the value of the option contract may not correlate exactly with changes in the value of the securities or currencies hedged.
All options on securities and securities indices written by the Fund are required to be covered. When the Fund writes a call option, this means that during the life of the option the Fund may own or have the contractual right to acquire the securities subject to the option or may maintain with the Fund's custodian in a segregated account appropriate liquid securities in an amount at least equal to the market value of the securities underlying the option. The prices provided by a pricing service take into account broker dealer market price quotations for institutional size trading in similar groups of securities, yields or securities with similar characteristics, security quantity, maturity, coupon and other security characteristics as well as any developments related to the specific securities. The pricing service may use a matrix approach, regarding securities with similar characteristics to determine the valuation for a security. When the Fund writes a put option, this means that the Fund will maintain with the Fund's custodian in a segregated account appropriate liquid securities in an amount at least equal to the exercise price of the option.
The average number of outstanding call options written six-months ended March 31, 2023 was 3,489.
Derivatives not accounted
for as hedging instruments
under ASC 815 | | | | Statement of Assets and
Liabilities Location | | Statement of Operations Location
| |
Equity Contracts
| |
| | Liabilities, options
written, at value
| |
$370,044
| | Net realized gain (loss) on
closed or expired option
contracts written | | $1,726,367 | |
| | | |
| |
| |
| | Change in unrealized
appreciation (depreciation)
on option contracts written | | ($29,675) | |
Forward Currency
Contracts
| |
| | Unrealized appreciation
on forward currency
contract | |
$92,681
| | Net realized gain (loss)
on forward contracts
| | ($5,201,583) | |
| | | |
| | Unrealized depreciation
on forward currency
contracts | |
($76,367)
| | Change in unrealized
appreciation (depreciation)
on forward contracts | | $685,635 | |
Forward Contracts
Forward contracts involve the purchase or sale of a specific quantity of a commodity, government security, foreign currency, or other asset at a specified price, with delivery and settlement at a specified future date. Because it is a completed contract, a purchase forward
26TEKLA WORLD HEALTHCARE FUND | SEMIANNUAL REPORT
contract can be a cover for the sale of a futures contract. The Fund may enter into forward contracts for hedging purposes and non-hedging purposes (i.e., to increase returns). Forward contracts may be used by the Fund for hedging purposes to protect against uncertainty in the level of future foreign currency exchange rates, such as when the Fund anticipates purchasing or selling a foreign security. Forward contracts may also be used to attempt to protect the value of the Fund's existing holdings of foreign securities. Forward contracts may also be used for non-hedging purposes to pursue the Fund's investment objective. There is no requirement that the Fund hedge all or any portion of its exposure to foreign currency risks.
Average notional amount of forward contracts for the six-months ended March 31, 2023 was $61,620,558.
Investment Transactions and Income
Investment transactions are recorded on a trade date basis. Gains and losses from sales of investments are recorded using the "identified cost" method. Interest income is recorded on the accrual basis, adjusted for amortization of premiums and accretion of discounts. Dividend income is recorded on the ex-dividend date, less any foreign taxes withheld. Upon notification from issuers, some of the dividend income received may be redesignated as a reduction of cost of the related investment if it represents a return of capital. Stock dividends are reflected as non-cash dividend income on the Statement of Operations.
The aggregate cost of purchases and proceeds from sales of investment securities (other than short-term investments) for the six-months ended March 31, 2023 totaled $101,984,839 and $115,564,086, respectively.
Securities Lending
The Fund may lend its securities to approved borrowers to earn additional income. The Fund receives cash collateral from the borrower and the initial collateral received by the Fund is required to have a value of at least 102% of the current value of the loaned securities traded on U.S. exchanges, and a value of at least 105% for all other securities. The Fund will invest its cash collateral in State Street Institutional U.S. Government Money Market Fund (SAHXX), which is registered with the Securities and Exchange Commission (SEC) as an investment company. SAHXX invests substantially all of its assets in the State Street U.S. Government Money Market Portfolio. The Fund will receive the benefit of any gains and bear any losses generated by SAHXX with respect to the cash collateral.
The Fund has the right to recall loaned securities on demand. If a borrower fails to return loaned securities when due, then the lending agent is responsible and indemnifies the Fund for the lent securities. The lending agent uses the collateral received from the borrower to purchase replacement securities of the same issue, type, class and series of the loaned securities. If the value of the collateral is less than the purchase cost of replacement
TEKLA WORLD HEALTHCARE FUND | SEMIANNUAL REPORT 27
securities, the lending agent is responsible for satisfying the shortfall but only to the extent that the shortfall is not due to any decrease in the value of SAHXX.
Although the risk of loss on securities lent is mitigated by receiving collateral from the borrower and through lending agent indemnification, the Fund could experience a delay in recovering securities or could experience a lower than expected return if the borrower fails to return the securities on a timely basis. The Fund receives compensation for lending its securities by retaining a portion of the return on the investment of the collateral and compensation from fees earned from borrowers of the securities. Securities lending income received by the Fund is net of fees retained by the securities lending agent. Net income received from SAHXX is a component of securities lending income as recorded on the Statement of Operations.
Obligations to repay collateral received by the Fund are shown on the Statement of Assets and Liabilities as Payable upon return of securities loaned and are secured by the loaned securities. As of March 31, 2023 the Fund loaned securities valued at $4,985,118 and received $4,998,623 of cash collateral.
Repurchase Agreements
In managing short-term investments the Fund may from time to time enter into transactions in repurchase agreements. In a repurchase agreement, the Fund's custodian takes possession of the underlying collateral securities from the counterparty, the market value of which is at least equal to the principal, including accrued interest, of the repurchase transaction at all times. In the event of default or bankruptcy by the other party to the agreement, realization and/or retention of the collateral by the Fund may be delayed. The Fund may enter into repurchase transactions with any broker, dealer, registered clearing agency or bank. Repurchase agreement transactions are not counted for purposes of the limitations imposed on the Fund's investment in debt securities.
Distribution Policy
Pursuant to a Securities and Exchange Commission exemptive order the Fund may make periodic distributions that include capital gains as frequently as 12 times in any one taxable year in respect of its common shares, and the Fund has implemented a managed distribution policy (the Policy) providing for monthly distributions at a rate set by the Trustees. Under the current Policy, the Fund intends to make monthly distributions at a rate of $0.1167 per share to shareholders of record. If taxable income and net long-term realized gains exceed the amount required to be distributed under the Policy, the Fund will at a minimum make distributions necessary to comply with the requirements of the Internal Revenue Code. The Policy has been established by the Trustees and may be changed by them without shareholder approval. The Trustees regularly review the Policy and the frequency and
28 TEKLA WORLD HEALTHCARE FUND | SEMIANNUAL REPORT
distribution rate considering the purpose and effect of the Policy, the financial market environment, and the Fund's income, capital gains and capital available to pay distributions.
Share Repurchase Program
In March 2023, the Trustees approved the renewal of the repurchase program to allow the Fund to repurchase up to 12% of its outstanding shares in the open market for a one-year period ending July 14, 2024. Prior to this renewal, in March 2022, the Trustees approved the renewal of the share repurchase program to allow the Fund to repurchase up to 12% of its outstanding shares for a one-year period ending July 14, 2023. The share repurchase program is intended to enhance shareholder value and potentially reduce the discount between the market price of the Fund's shares and the Fund's net asset value.
During the six-months ended March 31, 2023 and the year ended September 30, 2022, the Fund did not repurchase any shares through the repurchase program.
Federal Taxes
It is the Fund's policy to comply with the requirements of the Internal Revenue Code applicable to regulated investment companies and to distribute to its shareholders substantially all of its taxable income and its net realized capital gains, if any. Therefore, no Federal income or excise tax provision is required.
As of March 31, 2023, the Fund had no uncertain tax positions that would require financial statement recognition or disclosure. The Fund's federal tax returns are subject to examination by the Internal Revenue Service for a period of three years.
Distributions
The Fund records all distributions to shareholders on the ex-dividend date. Such distributions are determined in conformity with income tax regulations, which may differ from GAAP. These differences include temporary and permanent differences from losses on wash sale transactions, distribution re-designations, return of capital distributions, passive foreign investment company transactions, foreign currency gains and losses, distributions from real estate investment trusts, losses disallowed on straddles, forward contracts mark-to-market, premium amortization accruals and book to tax difference due to merger. Reclassifications are made to the Fund's capital accounts to reflect income and gains available for distribution under income tax regulations.
The cumulative distributions paid this fiscal year-to-date are currently estimated to be from the following sources: net investment income, net realized short-term capital gains, and return of capital or other capital source. The amounts and sources of distributions are only estimates and not being provided for tax reporting purposes. The actual amounts and sources of the amounts for tax reporting purposes will depend upon the Fund's investment
TEKLA WORLD HEALTHCARE FUND | SEMIANNUAL REPORT 29
experience during the remainder of its fiscal year and may be subject to changes based on tax regulations.
Statement of Cash Flows
The cash and restricted cash amount shown in the Statement of Cash Flows is the amount included in the Fund's Statement of Assets and Liabilities and represents cash and restricted cash on hand at March 31, 2023.
Commitments and Contingencies
Under the Fund's organizational documents, its officers and Trustees may be indemnified against certain liabilities and expenses arising out of the performance of their duties to the Fund. Additionally, in the normal course of business, the Fund enters into agreements with service providers that may contain indemnification clauses. The Fund's maximum exposure under these agreements is unknown as this would involve future claims that may be made against the Fund that have not yet occurred. However, based on experience, the Fund expects the risk of loss to be remote.
Loan Payable
The Fund maintains a $125,000,000 line of credit with the Bank of Nova Scotia (the Line of Credit) which expires on January 24, 2024. As of March 31, 2023, the Fund had drawn down $120,000,000 from the Line of Credit, which was the maximum borrowing outstanding during the period. Between October 1, 2022 through January 27, 2023, the Fund was charged interest at the rate of 0.75% plus a SOFR Adjustment plus the relevant SOFR rate. Starting January 28, 2023, the Fund is charged interest at the rate of 0.95% plus a SOFR Adjustment plus the relevant SOFR rate. The Fund is also charged a commitment fee on the daily unused balance of the line of credit at the rate of 0.10% (per annum). Per the Line of Credit agreement, the Fund paid an upfront fee of 0.05% on the total line of credit balance, which is being amortized through January 28, 2023. The Fund pledges its investment securities as the collateral for the line of credit per the terms of the agreement. The weighted average interest rate and the average outstanding loan payable for the period from October 1, 2022 to March 31, 2023 were 5.2088% and $120,000,000, respectively. The stated carrying amount of the line of credit approximates its fair value based upon the short term nature of the borrowings and the interest rates being based upon the market terms. The borrowings under the line of credit would be considered as Level 2 in the fair value hierarchy (See Note 3) at March 31, 2023.
Investor Support Services
The Fund has retained Destra Capital Advisors LLC (Destra) to provide investor support services in connection with the ongoing operation of the Fund. The Fund pays Destra a fee in an annual amount equal to 0.05% of the average aggregate daily value of the Fund's Managed Assets pursuant to the investor support services agreement.
30 TEKLA WORLD HEALTHCARE FUND | SEMIANNUAL REPORT
(2) Investment Advisory and Other Affiliated Fees
The Fund has entered into an Investment Advisory Agreement (the Advisory Agreement) with the Adviser. Pursuant to the terms of the Advisory Agreement, the Fund pays the Adviser a monthly fee at the rate when annualized of 1.00% of the average daily value of the Fund's Managed Assets. Managed Assets means the total assets of the Fund minus the Fund's liabilities other than the loan payable.
The Fund has entered into a Services Agreement (the Agreement) with the Adviser. Pursuant to the terms of the Agreement, the Fund reimburses the Adviser for certain services related to a portion of the payment of salary and provision of benefits to the Fund's Chief Compliance Officer. During the six-months ended March 31, 2023, these payments amounted to $35,380 and are included in the Other category of expenses in the Statement of Operations, together with insurance and other expenses incurred to unaffiliated entities. Expenses incurred pursuant to the Agreement as well as certain expenses paid for by the Adviser are allocated to the Fund in an equitable fashion as approved by the Trustees or officers of the Fund who are also officers of the Adviser.
The Fund pays compensation to Independent Trustees in the form of a retainer, attendance fees and additional compensation to Board and Committee chairpersons. The Fund does not pay compensation directly to Trustees or officers of the Fund who are also officers of the Adviser.
(3) Fair Value Measurements
The Fund uses a three-tier hierarchy to prioritize the assumptions, referred to as inputs, used in valuation techniques to measure fair value. The three-tier hierarchy of inputs is summarized in the three broad levels. Level 1 includes quoted prices in active markets for identical investments. Level 2 includes prices determined using other significant observable inputs (including quoted prices for similar investments, interest rates, credit risk, etc.). The independent pricing vendor may value bank loans and debt securities at an evaluated bid price by employing methodologies that utilize actual market transactions, broker-supplied valuations, and/or other methodologies designed to identify the market value for such securities and such securities are considered Level 2 in the fair value hierarchy. Level 3 includes prices determined using significant unobservable inputs (including the Fund's own assumptions in determining the fair value of investments). These inputs or methodology used for valuing securities are not necessarily an indication of the risk associated with investing in those securities.
For the six-month period ended March 31, 2023, there were no transfers between levels.
TEKLA WORLD HEALTHCARE FUND | SEMIANNUAL REPORT 31
The following is a summary of the levels used as of March 31, 2023 to value the Fund's investments.
Assets at Value | | Level 1 | | Level 2 | | Level 3 | | Total | |
Non-convertible Notes | |
France | | $ | — | | | $ | 2,536,096 | | | $ | — | | | $ | 2,536,096 | | |
Ireland | | | — | | | | 2,069,500 | | | | — | | | | 2,069,500 | | |
United Kingdom | | | — | | | | 4,884,826 | | | | — | | | | 4,884,826 | | |
United States | | | — | | | | 72,595,327 | | | | — | | | | 72,595,327 | | |
Convertible Preferreds | |
France | | | — | | | | — | | | | 2,497,624 | | | | 2,497,624 | | |
Ireland | | | — | | | | — | | | | 2,105,383 | | | | 2,105,383 | | |
United States | | | — | | | | — | | | | 3,943,709 | | | | 3,943,709 | | |
Common Stocks | |
Australia | | | 7,461,700 | | | | — | | | | — | | | | 7,461,700 | | |
Canada | | | 27,815 | | | | 12,517 | | | | — | | | | 40,332 | | |
China | | | 1,021,104 | | | | — | | | | — | | | | 1,021,104 | | |
Denmark | | | 18,039,317 | | | | — | | | | — | | | | 18,039,317 | | |
France | | | 6,718,367 | | | | — | | | | — | | | | 6,718,367 | | |
Germany | | | 8,393,335 | | | | — | | | | — | | | | 8,393,335 | | |
Ireland | | | 1,965,284 | | | | — | | | | — | | | | 1,965,284 | | |
Israel | | | 798,987 | | | | — | | | | — | | | | 798,987 | | |
Japan | | | 8,726,515 | | | | — | | | | — | | | | 8,726,515 | | |
Netherlands | | | 6,676,534 | | | | — | | | | — | | | | 6,676,534 | | |
Switzerland | | | 40,320,537 | | | | 1,988,512 | | | | — | | | | 42,309,049 | | |
United Kingdom | | | 21,916,778 | | | | — | | | | — | | | | 21,916,778 | | |
United States | | | 376,392,483 | | | | — | | | | — | | | | 376,392,483 | | |
Short-term Investments | �� | | 4,998,623 | | | | 7,531,000 | | | | — | | | | 12,529,623 | | |
Milestone Interest | | | — | | | | — | | | | 131,009 | | | | 131,009 | | |
Total | | $ | 503,457,379 | | | $ | 91,617,778 | | | $ | 8,677,725 | | | $ | 603,752,882 | | |
Assets | |
Forward Currency Contracts | | $ | — | | | $ | 92,681 | | | $ | — | | | $ | 92,681 | | |
Liabilities | |
Forward Currency Contracts | | | — | | | | (76,367 | ) | | | — | | | | (76,367 | ) | |
Options Contracts Written | | ($ | 370,044 | ) | | $ | — | | | $ | — | | | ($ | 370,044 | ) | |
Total | | ($ | 370,044 | ) | | $ | 16,314 | | | $ | — | | | ($ | 353,730 | ) | |
32 TEKLA WORLD HEALTHCARE FUND | SEMIANNUAL REPORT
The following is a reconciliation of Level 3 assets for which significant unobservable inputs were used to determine fair value.
| Investments inSecurities | | Balance as ofSeptember 30,2022 | | Net realizedgain (loss) andchange inunrealizedappreciation(depreciation) | | Cost ofpurchasesandconversions | | Proceedsfromsales andconversions | | Nettransfersinto(out of)Level 3 | | Balanceas of March 31,2023 | |
Convertible Preferred | |
France | | $ | 960,713 | | | ($ | 71,584 | ) | | $ | 1,608,495 | | | $ | — | | | $ | — | | | $ | 2,497,624 | | |
Ireland | | | 1,902,611 | | | | 202,772 | | | | — | | | | — | | | | — | | | | 2,105,383 | | |
Switzerland | | | 2,047,583 | | | | (336,172 | ) | | | — | | | | (1,711,411 | ) | | | — | | | | — | | |
United States | | | 3,943,709 | | | | (182 | ) | | | 182 | | | | — | | | | — | | | | 3,943,709 | | |
Milestone Interest | |
United States | | | 138,520 | | | | (7,511 | ) | | | — | | | | — | | | | — | | | | 131,009 | | |
Total | | $ | 8,993,136 | | | ($ | 212,677 | ) | | $ | 1,608,677 | | | ($ | 1,711,411 | ) | | $ | — | | | $ | 8,677,725 | | |
Net change in unrealized appreciation (depreciation) from
investments still held as of March 31, 2023 | | $ | 123,495 | | |
The following is a quantitative disclosure about significant unobservable inputs used in the determination of the fair value of Level 3 assets.
| | | Fair Value atMarch 31,2023 | | Valuation Technique | | Unobservable Input | | Range(Weighted Average) | |
Convertible Preferred | | $ | 8,546,716
| | | Transaction price
| | (a)
Probability of events | | N/A
| |
Milestone Interest | | | 131,009 | | | Probability adjusted
value | | Probability of events
Timing of events | | 39.00%-99.00% (65.13%)
1.50-12.50 (4.11) years | |
| | | $ | 8,677,725 | | | | | | | | |
(a) There is no quantitative information to provide as this method of measure is investment specific.
(4) Private Companies and Other Restricted Securities
The Fund may invest in private companies and other restricted securities if these securities would currently comprise 10% or less of Managed Assets. The value of these securities represented 2% of the Fund's Managed Assets at March 31, 2023.
At March 31, 2023, the Fund had commitments of $1,003,008 relating to additional investments in two private companies.
TEKLA WORLD HEALTHCARE FUND | SEMIANNUAL REPORT 33
The following table details the acquisition date, cost, carrying value per unit, and value of the Fund's private companies and other restricted securities at March 31, 2023. The Fund on its own does not have the right to demand that such securities be registered.
Security# | | AcquisitionDate | | Cost | | Carrying Value per Unit | | Value | |
Amolyt Pharma SAS Series C Cvt. Pfd | | 01/25/23 | | $ | 1,608,363 | | | $ | 2.32 | | | $ | 1,594,215 | | |
Aristea Therapeutics, Inc. Series B Cvt. Pfd | | 07/27/21 | | | 1,600,004 | | | | 5.51 | | | | 1,600,004 | | |
Flamingo Therapeutics, Inc. Series A3 Cvt. Pfd | | 04/21/20, 10/28/20 | | | 3,142,774 | | | | 6.63 | | | | 903,409 | | |
Endeavor Biomedicines, Inc. Series B Cvt. Pfd | | 01/21/22 | | | 2,002,482 | | | | 4.72 | | | | 1,999,999 | | |
Fusion Pharmaceuticals, Inc. Common | | 09/20/22 | | | 0 | | | | 3.39 | | | | 12,517 | | |
IO Light Holdings, Inc. Series A2 Cvt. Pfd | | 04/30/20, 05/17/21, 09/15/21† | | | 337,063 | | | | 3.38 | | | | 343,706 | | |
Oculis Holding AG Common | | 03/06/23 | | | 2,558,401 | | | | 6.53 | | | | 1,988,512 | | |
Priothera Ltd. Series A Cvt. Pfd | | 10/07/20,10/19/21 | | | 2,265,198 | | | | 10.84 | | | | 2,105,384 | | |
Rainier Therapeutics Milestone Interest | | 09/28/21 | | | 143,115 | | | | 131,009.00 | | | | 131,009 | | |
| | | | | $ | 13,657,400 | | | | | $ | 10,678,755 | | |
# See Schedule of Investments and corresponding footnotes for more information on each issuer.
† Interest received as part of a corporate action for a previously owned security.
(5) At-the-Market Offering
The Fund has a registration statement on file with the SEC, initially effective on December 6, 2022, authorizing the Fund to issue shares through an At-the-Market Offering (ATM) having an aggregate value of up to $150,000,000. The offering costs associated with the Fund's ATM offering are approximately $278,586 of which $7,478 were charged to paid-in-capital upon the issuance of associated shares.
On December 14, 2022, the Fund entered into a distribution agreement with Foreside Fund Services, LLC (Foreside), pursuant to which the Fund may offer and sell up to $150,000,000 of shares from time to time, through Foreside as its agent, in transactions deemed to be at the market as defined in Rule 415 under the Securities Act of 1933, as amended (the Offering). Under the Distribution Agreement, Foreside may enter into sub-placement agent agreements with one or more selected dealers. Foreside has entered into a sub-placement agent agreement, dated December 14, 2022 (the Sub-Placement Agent Agreement), with UBS Securities LLC (UBS) relating to the shares to be offered under the Distribution Agreement. During the period ended on March 31, 2023, 274,984 shares were sold under this agreement for $3,950,593 (net of commissions to Foreside and UBS of $39,906).
34 TEKLA WORLD HEALTHCARE FUND | SEMIANNUAL REPORT
INVESTMENT ADVISORY AGREEMENT APPROVAL
The Investment Advisory Agreement (the Advisory Agreement) between the Fund and the Adviser continues in effect so long as its continuance is approved at least annually by (i) the Trustees of the Fund and (ii) a majority of the Trustees of the Fund who are not interested persons (the Independent Trustees), by vote cast in person at a meeting called for the purpose of voting on such approval.
After considering the matter in a meeting held on March 16, 2023, the Board, and the Independent Trustees voting separately, determined that the terms of the Advisory Agreement are fair and reasonable and approved the continuance of the Advisory Agreement as being in the best interests of the Fund and its shareholders. In making its determination, the Board considered materials that were specifically prepared by the Adviser and by an independent data provider at the request of the Board and Fund counsel for purposes of the contract review process, including comparisons of (i) the Fund's performance to a blend of equity, debt and REIT benchmarks and to a peer universe of other investment companies, (ii) the Fund's expenses and expense ratios to those of a peer group of other investment companies, and (iii) the Adviser's profitability with respect to its services for the Fund to the profitability of other investment advisers. The Trustees took into account that substantially all of the Adviser's business consists of providing investment management services to Tekla World Healthcare Fund, Tekla Life Sciences Investors, Tekla Healthcare Investors and Tekla Healthcare Opportunities Fund and the Adviser does not derive any significant benefit from its relationship with the Fund other than receipt of advisory fees pursuant to the Advisory Agreement, market research and potential marketing exposure for the Adviser. The Board also received and reviewed information throughout the year about the portfolio performance, the investment strategy, the portfolio management team and various fees and expenses of the Fund. In their deliberations, the Independent Trustees had the opportunity to meet privately without representatives of the Adviser present and were represented throughout the process by counsel to the Independent Trustees and the Fund.
In approving the Advisory Agreement, the Board considered, among other things, the nature, extent, and quality of the services to be provided by the Adviser, the investment performance of the Fund and the Adviser, the costs of services provided and profits realized by the Adviser and its affiliates, and whether fee levels reflect any economies of scale for the benefit of Fund shareholders and the extent to which economies of scale would be realized as the Fund grows. The Board reviewed information about the foregoing factors and considered changes, if any, in such information since its previous approval. The Board also evaluated the financial strength of the Adviser and the capability of the personnel of the Adviser, specifically the strength and background of its investment analysts. Fund counsel provided the Board with the statutory and regulatory requirements for approval and disclosure of investment advisory agreements. The Board, including the Independent Trustees, evaluated all of the foregoing and, considering all factors together, determined in the exercise of its business judgment that the continuance of the Advisory Agreement is in the best interests of the Fund and its
TEKLA WORLD HEALTHCARE FUND | SEMIANNUAL REPORT 35
shareholders. The following provides more detail on certain factors considered by the Trustees and the Board's conclusions with respect to each such factor.
The nature, extent and quality of the services to be provided by the Adviser. On a regular basis the Board considers the roles and responsibilities of the Adviser as a whole, along with specific portfolio management, support and trading functions the Adviser provides to the Fund. The Trustees considered the nature, extent and quality of the services provided by the Adviser to the Fund. The Trustees continue to be satisfied with the quality and value of the investment advisory services provided to the Fund by the Adviser, and, in particular, the management style and discipline followed by the Adviser and the quality of the Adviser's research, trading, portfolio management, compliance and administrative personnel. The Trustees also took into account the Adviser's significant investment in its business through the addition of portfolio management and administrative staff over the last several years and the Adviser's commitment to continue to build out its infrastructure as future circumstances require.
The investment performance of the Fund and the Adviser. On a regular basis the Board reviews performance information of the Fund and discusses the Fund's investment strategy with the Adviser. The Trustees reviewed performance information for the Fund for the one-, three- and five-year periods ended December 31, 2022 as compared to a blend of the S&P Global 1200 Health Care Index® (SGH), the S&P 500® Health Care Corporate Bond Index (SP5HCBIT) and the S&P Composite 1500® Health Care REITs Index (S15HCRT) (Blended Benchmark) and a peer universe of other investment companies identified by an independent service provider engaged by the Independent Trustees. The Trustees noted that the performance information reviewed reflects a view of the Fund's performance only as of a certain date, and that the results might be significantly different if a different date was selected to generate the performance information. Additionally, the Trustees recognized that longer periods of performance for the Fund may be adversely and disproportionately affected by significant underperformance in one more recent period, and that such underperformance may be caused by a small number of investment decisions or positions.
The objective of the Fund is to provide both growth and income to investors by using a variety of healthcare assets. Growth, in large part, is to be provided by the Fund's ownership of the stock of a broad mix of healthcare companies. Such breadth is to be provided by representative ownership of stock in most or all of ten major healthcare subsectors represented in the SGH. Income is to be provided by (i) ownership of a variety of assets including but not limited to a) dividend producing stocks of traditional healthcare companies and healthcare-related REITS, b) the corporate debt of a variety of healthcare companies and (ii) premium income from selling covered call options associated with healthcare companies. The Fund is also required to maintain at least 40% of assets in companies located or incorporated outside of the U.S. or that do substantial business outside of the U.S. The
36 TEKLA WORLD HEALTHCARE FUND | SEMIANNUAL REPORT
Trustees considered that the performance associated with owning such a complex mix of assets by the Fund is likely to produce periods when the performance of the Fund would likely depart from the return associated with a single equity index. The Trustees thus considered that there may be periods when the Fund's NAV performance could be greater or lesser than that of relevant indices. The Trustees considered that determining such an exact combination of returns is difficult or impossible, given the general lack of appropriate component equity, debt, REIT, covered call and other indices.
The Trustees noted the Fund's strong absolute performance as of December 31, 2022. In particular, the Trustees noted that on a net asset value basis, the Fund returned -7.64% for the one-year period and had annualized returns of .86% for the three-year period and .27% for the five-year period. The Trustees also noted that on a net asset value basis, as of December 31, 2022, the Fund slightly underperformed the Blended Benchmark for the one-, three- and five-year periods. The Trustees also noted that as of December 31, 2022, the Fund outperformed the peer universe average for the one-year period, slightly underperformed the peer universe average for the five-year period and underperformed the peer universe average for the three-year period.
In considering the Fund's relative performance, the Trustees recognized that the Fund's unique strategy presents challenges when comparing the Fund's performance to a benchmark or group of comparable funds. In particular, the Trustees observed that the Fund's strategy contemplates ownership of a variety of healthcare-related asset classes. The Trustees noted that, as a result, all other things being equal, in periods when one asset class performs relatively better than another asset class, the Fund might be expected to underperform a particular benchmark and/or the peer universe and vice versa. Additionally, the Trustees noted that unlike the indices comprising the blended benchmark and most of the peer universe, the Fund may maintain a meaningful allocation to venture and restricted securities. In light of these differences, the Trustees recognized the more limited usefulness of these performance comparisons for the Fund.
The Trustees concluded they continue to be satisfied with the investment performance of the Fund and the Adviser.
The costs of services to be provided and profits to be realized by the Adviser from its relationship with the Fund. The Trustees considered the various services provided by the Adviser to the Fund and reviewed comparative information regarding the expenses and expense ratios of the Fund and a peer group of other investment companies identified by an independent service provider engaged by the Independent Trustees. The Trustees noted that the Adviser's fees are within the range of fees presented in the comparative information and noted that the Fund maintains a meaningful allocation to venture and restricted securities, a portfolio management service that can warrant higher management fees than those charged by the Adviser to the Fund. The Trustees also considered financial information provided by the
TEKLA WORLD HEALTHCARE FUND | SEMIANNUAL REPORT 37
Adviser, including financial statements of the Adviser and a comparison of the Adviser's profitability with respect to its services for the Fund to the profitability of other investment advisers.
The Trustees noted that the fees charged by the Adviser are within a reasonable range of fees as compared to fees charged by other investment advisers for similar services, and the services provided by the Adviser and the amounts paid under the Advisory Agreement are at least comparable to the services rendered and fees charged by others for similar services to warrant a finding that fees to be paid by the Fund are fair. Based on the information provided to and evaluated by the Trustees, the Trustees concluded that the fees charged by the Adviser are fair and reasonable in light of the quality and nature of the services provided by the Adviser and that the profitability of the Adviser's relationship with the Fund has not been excessive.
Whether fee levels reflect economies of scale and the extent to which economies of scale would be realized as the Fund grows. The Trustees considered the advisory fee schedule in the Advisory Agreement and noted that it does not provide for breakpoints that might reduce the effective fee to the extent the Fund's net assets should increase. The Trustees noted that although the Fund has a closed-end structure and any significant growth generally occurs through appreciation in the value of the Fund's investment portfolio, the Fund had commenced an at-the-market offering in January 2023 and the Board would have an opportunity to evaluate any economies of scale generated by this offering in connection with future renewals of the Advisory Agreement.
38 TEKLA WORLD HEALTHCARE FUND | SEMIANNUAL REPORT
PRIVACY NOTICE: If you are a registered shareholder of the Fund, the Fund and Tekla Capital Management LLC, the Fund's investment adviser, may receive nonpublic personal information about you from the information collected by the transfer agent from your transactions in Fund shares. Any nonpublic personal information is not disclosed to third parties, except as permitted or required by law. In connection with servicing your account and effecting transactions, the information received may be shared with the investment adviser and non-affiliates, including transfer agents, custodians or other service companies. Access to your nonpublic personal information is restricted to employees who need to know that information to provide products or services to you. To maintain the security of your nonpublic personal information, physical, electronic, and procedural safeguards are in place that comply with federal standards. The policies and practices described above apply to both current and former shareholders.
If your Fund shares are held in "street name" at a bank or brokerage, we do not have access to your personal information and you should refer to your bank's or broker's privacy policies for a statement of the treatment of your personal information.
FOR MORE INFORMATION: A description of the Fund's proxy voting policies and procedures and information on how the Fund voted proxies relating to portfolio securities during the most recent 12-month period ended June 30 is available (i) without charge, upon request by calling 1-800-451-2597; (ii) by writing to Tekla Capital Management LLC at 100 Federal Street, 19th Floor, Boston, MA 02110; (iii) on the Fund's website at www.teklacap.com; and (iv) on the SEC's website at www.sec.gov.
The Fund's proxy committee (Proxy Committee) identifies any potential conflicts of interest. Each potential conflict must be addressed in a manner that will be in the best interest of the Fund and its shareholders. If any potential conflict is identified the Proxy Committee consults with the Fund's counsel. Where conflicts of interest arise between the Fund's shareholders, on the one hand, and those of the Adviser, the Fund's principal underwriter, or any affiliated person on the other hand, the Adviser may convene an ad-hoc committee to debate the conflict and to give a ruling on a preferred course of action. If the ad-hoc committee determines that the Adviser, the Fund's principal underwriter, or any affiliated person has a conflict of interest in any instance, the Adviser's Chief Compliance Officer shall disclose the conflict to the Board and seek voting instructions.
The Adviser may cause the proxies to be voted in accordance with the recommendations of an independent third-party service provider that the Adviser may use to assist in voting proxies.
The Fund's complete Schedule of Investments for the first and third quarters of its fiscal year will be filed with the SEC on Form N-PORT. These will also be available on the Fund's website at www.teklacap.com or the SEC's website at www.sec.gov.
TEKLA WORLD HEALTHCARE FUND | SEMIANNUAL REPORT 39
You can find information regarding the Fund at the Fund's website, www.teklacap.com. The Fund regularly posts information to its website, including information regarding daily share pricing, distributions, press releases and links to the Fund's SEC filings. The Fund currently publishes and distributes quarterly fact cards, which include performance, portfolio holdings and sector information for each fiscal quarter. These fact cards will be available on the Fund's website and by request from the Fund's marketing and investor support services agent, Destra Capital Advisors LLC, at 1-877-855-3434.
DISTRIBUTION POLICY: The Fund has a managed distribution policy as described in the Notes to Financial Statements. For more information contact your financial adviser.
SHARE REPURCHASE PROGRAM: In March 2023, the Trustees reauthorized the share repurchase program to allow the Fund to repurchase up to 12% of its outstanding shares for a one-year period ending July 14, 2024.
PORTFOLIO MANAGEMENT: Daniel R. Omstead, Ph.D., Jason C. Akus, M.D./M.B.A., Timothy Gasperoni, M.B.A., Ph.D., Ashton L. Wilson, Christopher Abbott, Robert Benson, Kelly Girskis, Ph.D., Richard Goss, Jack Liu, M.B.A., Ph.D., Christopher Seitz, M.B.A., Loretta Tse, Ph.D.; and Graham Attipoe, M.B.A., M.D. are members of a team that analyzes investments on behalf of the Fund. Dr. Omstead exercises ultimate decision making authority with respect to investments.
HOUSEHOLDING: A number of banks, brokers and financial advisers have instituted "householding". Under this practice, which has been approved by the SEC, only one copy of shareholder documents may be delivered to multiple shareholders who share the same address and satisfy other conditions. Householding is intended to reduce expenses and eliminate duplicate mailings of shareholder documents. If you do not want the mailing of your shareholder documents to be combined with those of other members of your household, please contact your bank, broker or financial adviser.
40 TEKLA WORLD HEALTHCARE FUND | SEMIANNUAL REPORT
Tekla World Healthcare Fund
New York Stock Exchange Symbol: THW
NAV Symbol: XTHWX
100 Federal Street, 19th Floor
Boston, Massachusetts 02110
617-772-8500
www.teklacap.com
Officers
Daniel R. Omstead, Ph.D., President
Laura Woodward, CPA, Chief Compliance Officer,
Secretary and Treasurer
Trustees
Jeffrey A. Bailey
Kathleen L. Goetz
Rakesh K. Jain, Ph.D.
Thomas M. Kent, CPA
Daniel R. Omstead, Ph.D.
W. Mark Watson, CPA
Investment Adviser
Tekla Capital Management LLC
Administrator & Custodian
State Street Bank and Trust Company
Transfer Agent
Computershare, Inc.
Legal Counsel
Dechert LLP
Shareholders with questions regarding share transfers may call
1-800-426-5523
Daily net asset value may be obtained from
our website (www.teklacap.com)