Exhibit 99.2
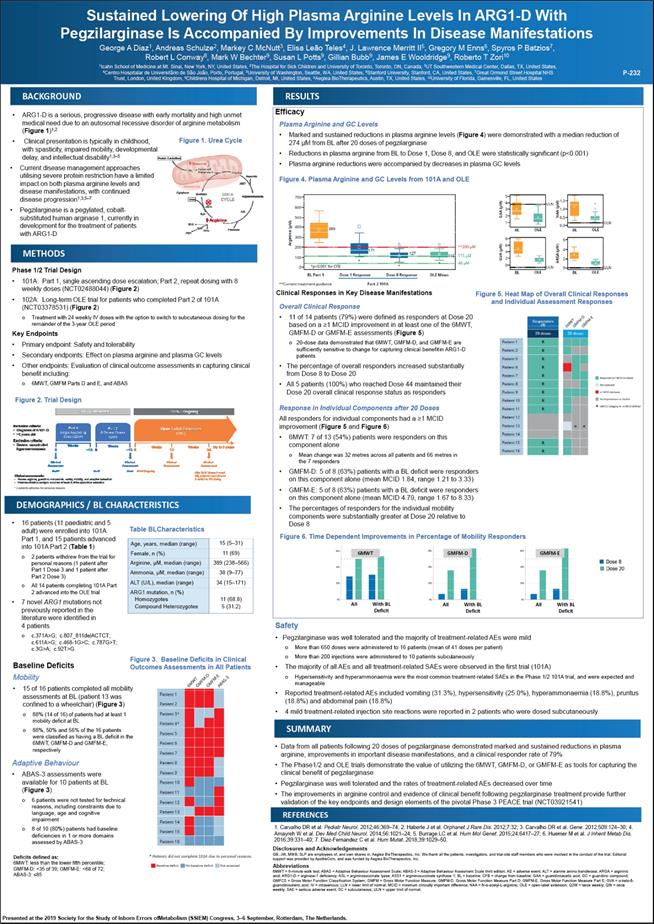
Sustained Lowering Of High Plasma Arginine Levels In ARG1-D With Pegzilarginase Is Accompanied By Improvements In Disease Manifestations George A Diaz1, Andreas Schulze2, Markey C McNutt3, Elisa Leão Teles4, J. Lawrence Merritt II5, Gregory M Enns6, Spyros P Batzios7, Robert L Conway8, Mark W Bechter9, Susan L Potts9, Gillian Bubb9, James E Wooldridge9, Roberto T Zori10 1Icahn School of Medicine at Mt. Sinai, New York, NY, United States, 2The Hospital for Sick Children and University of Toronto, Toronto, ON, Canada, 3UT Southwestern Medical Center, Dallas, TX, United States, 4Centro Hospitalar de Universitãrio de São João, Porto, Portugal, 5University of Washington, Seattle, WA, United States, 6Stanford University, Stanford, CA, United States, 7Great Ormond Street Hospital NHS Trust, London, United Kingdom, 8Childrens Hospital of Michigan, Detroit, MI, United States, 9Aeglea BioTherapeutics, Austin, TX, United States, 10University of Florida, Gainesville, FL, United States P-232 BACKGROUND • ARG1-D is a serious, progressive disease with early mortality and high unmet medical need due to an autosomal recessive disorder of arginine metabolism (Figure 1)1,2 Clinical presentation is typically in childhood Figure 1. Urea Cycle with spasticity, impaired mobility, developmental delay, and intellectual disability1,3–5 • Current disease management approaches utilising severe protein restriction have a limited impact on both plasma arginine levels and disease manifestations, with continued disease progression1,3,5–7 Pegzilarginase is a pegylated, cobalt- substituted human arginase 1, currently in development for the treatment of patients with ARG1-D METHODS Phase 1/2 Trial Design • 101A: Part 1, single ascending dose escalation; Part 2, repeat dosing with 8 weekly doses (NCT02488044) (Figure 2) • 102A: Long-term OLE trial for patients who completed Part 2 of 101A (NCT03378531) (Figure 2) o Treatment with 24 weekly IV doses with the option to switch to subcutaneous dosing for the remainder of the 3-year OLE period Key Endpoints • Primary endpoint: Safety and tolerability • Secondary endpoints: Effect on plasma arginine and plasma GC levels • Other endpoints: Evaluation of clinical outcome assessments in capturing clinical benefit including: o 6MWT, GMFM Parts D and E, and ABAS Figure 2. Trial Design DEMOGRAPHICS / BL CHARACTERISTICS 16 patients (11 paediatric and 5 adult) were enrolled into 101A Table BLCharacteristics Part 1, and 15 patients advanced into 101A Part 2 (Table 1) o 2 patients withdrew from the trial for personal reasons (1 patient after Part 1 Dose 3 and 1 patient after Part 2 Dose 3) o All 14 patients completing 101A Part 2 advanced into the OLE trial • 7 novel ARG1 mutations not previously reported in the literature were identified in 4 patients c.371A>G; c.807_811delACTCT; c.611A>G; c.468-1G>C; c.787G>T; c.3G>A; c.92T>G Age, years, median (range) 15 (5–31) Female, n (%) 11 (69) Arginine, µM, median (range) 389 (238–566) Ammonia, µM, median (range) 38 (9–77) ALT (U/L), median (range) 34 (15–171) ARG1 mutation, n (%) Homozygotes Compound Heterozygotes 11 (68.8) 5 (31.2) Baseline Deficits Baseline Deficits in Clinical Outcomes Assessments in All Patients Mobility 15 of 16 patients completed all mobility assessments at BL (patient 13 was confined to a wheelchair) (Figure 3) 88% (14 of 16) of patients had at least 1 mobility deficit at BL 88%, 50% and 56% of the 16 patients were classified as having a BL deficit in the 6MWT, GMFM-D and GMFM-E, respectively Adaptive Behaviour ABAS-3 assessments were available for 10 patients at BL (Figure 3) 6 patients were not tested for technical reasons, including constraints due to language, age and cognitive impairment 8 of 10 (80%) patients had baseline deficiencies in 1 or more domains assessed by ABAS-3 Deficits defined as: 6MWT: less than the lower fifth percentile; GMFM-D: <35 of 39; GMFM-E: <68 of 72; ABAS-3: ≤85 RESULTS Efficacy Plasma Arginine and GC Levels Marked and sustained reductions in plasma arginine levels (Figure 4) were demonstrated with a median reduction of274 µM from BL after 20 doses of pegzilarginase Reductions in plasma arginine from BL to Dose 1, Dose 8, and OLE were statistically significant (p<0.001) Plasma arginine reductions were accompanied by decreases in plasma GC levels Figure 4. Plasma Arginine and GC Levels from 101A and OLE Clinical Responses in Key Disease Manifestations Figure 5. Heat Map of Overall Clinical Responses and Individual Assessment Responses Overall Clinical Response 11 of 14 patients (79%) were defined as responders at Dose 20 based on a ≥1 MCID improvement in at least one of the 6MWT, GMFM-D or GMFM-E assessments (Figure 5) o 20-dose data demonstrated that 6MWT, GMFM-D, and GMFM-E are sufficiently sensitive to change for capturing clinical benefit in ARG1-D patients The percentage of overall responders increased substantially from Dose 8 to Dose 20 All 5 patients (100%) who reached Dose 44 maintained their Dose 20 overall clinical response status as responders Response in Individual Components after 20 Doses All responders for individual components had a ≥1 MCID improvement (Figure 5 and Figure 6) 6MWT: 7 of 13 (54%) patients were responders on this component alone o Mean change was 32 metres across all patients and 66 metres in the 7 responders GMFM-D: 5 of 8 (63%) patients with a BL deficit were responders on this component alone (mean MCID 1.84, range 1.21 to 3.33) GMFM-E: 5 of 8 (63%) patients with a BL deficit were responders on this component alone (mean MCID 4.79, range 1.67 to 8.33) The percentages of responders for the individual mobility components were substantially greater at Dose 20 relative to Dose 8 Figure 6. Time Dependent Improvements in Percentage of Mobility Responders Safety Pegzilarginase was well tolerated and the majority of treatment-related AEs were mild More than 650 doses were administered to 16 patients (mean of 41 doses per patient) More than 200 injections were administered to 10 patients subcutaneously The majority of all AEs and all treatment-related SAEs were observed in the first trial (101A) o Hypersensitivity and hyperammonaemia were the most common treatment-related SAEs in the Phase 1/2 101A trial, and were expected and manageable Reported treatment-related AEs included vomiting (31.3%), hypersensitivity (25.0%), hyperammonaemia (18.8%), pruritus (18.8%) and abdominal pain (18.8%) 4 mild treatment-related injection site reactions were reported in 2 patients who were dosed subcutaneously SUMMARY Data from all patients following 20 doses of pegzilarginase demonstrated marked and sustained reductions in plasma arginine, improvements in important disease manifestations, and a clinical responder rate of 79% The Phase1/2 and OLE trials demonstrate the value of utilizing the 6MWT, GMFM-D, or GMFM-E as tools for capturing the clinical benefit of pegzilarginase Pegzilarginase was well tolerated and the rates of treatment-related AEs decreased over time The improvements in arginine control and evidence of clinical benefit following pegzilarginase treatment provide further validation of the key endpoints and design elements of the pivotal Phase 3 PEACE trial (NCT03921541) REFERENCES 1. Carvalho DR et al. Pediatr Neurol. 2012;46:369–74; 2. Haberle J et al. Orphanet J Rare Dis. 2012;7:32; 3. Carvalho DR et al. Gene. 2012;509:124–30; 4. Amayreh W et al. Dev Med Child Neurol. 2014;56:1021–24; 5. Burrage LC et al. Hum Mol Genet. 2015;24:6417–27; 6. Huemer M et al. J Inherit Metab Dis. 2016;39:331–40; 7. Diez-Fernandez C et al. Hum Mutat. 2018;39:1029–50. Disclosures and Acknowledgements GB, JW, MWB, SLP are employees of, and own shares in, Aeglea BioTherapeutics, Inc. We thank all the patients, investigators, and trial-site staff members who were involved in the conduct of the trial. Editorial support was provided by ApotheCom, and was funded by Aeglea BioTherapeutics, Inc. Abbreviations 6MWT = 6-minute walk test; ABAS = Adaptive Behaviour Assessment Scale; ABAS-3 = Adaptive Behaviour Assesment Scale third edition; AE = adverse event; ALT = alanine amino transferase; ARGA = argininic acid; ARG1-D = arginase-1 deficiency; ASL = argininosuccinate lyase; ASS1 = argininosuccinate synthase 1; BL = baseline; CFB = change from baseline; GAA = guanidinoacetic acid; GC = guanidino compound; GMFCS = Gross Motor Function Classification System; GMFM = Gross Motor Function Measure; GMFM-D, Gross Motor Function Measure Part D; GMFM-E, Gross Motor Function Measure Part E; GVA = α-keto-δ- guanidinovaleric acid; IV = intravenous; LLN = lower limit of normal; MCID = minimum clinically important difference; NAA = N-α-acetyl-L-arginine; OLE = open-label extension; Q2W = twice weekly; QW = once weekly; SAE = serious adverse event; SC = subcutaneous; ULN = upper limit of norma Presented at the 2019 Society for the Study of Inborn Errors of Metabolism (SSIEM) Congress, 3–6 September, Rotterdam, The Netherlands Protein catabolism ammonia nh3 carbamoyl phosphate citrulline aspartate mitochondrion ass1 cytoplasm ornithine urea cycle argininosuccinate urea agr1 h2o asl srgine gaa gva naa arga fumarate 101A- Completed 102A – Ongoing Inclusion criteria: diagncsis of arg1-d 2 years old Exclusion criteria: severe, uncontrolled hyperammonaemia part1 single ascending dose(q2w) part 2 8 repeat doses (qw) open label extension (qw) weeks weeks weeks weeks up to 3 year 0 ~10 0 ~10 0 12 24 Clinical assessment n=16* n=15 clinical assessment n=14 n=14 ongoing clinical assessment clinical assessment after 24 iv doses(~week 25)patients were allowed to switch to sc dosing Clinical assessment: plasma arginine, guanidino, safety, mobility, and adaptive behavior pharmacokinetics analysis occurred at week 8 of the open label extension 2 patients withdrew for personal reasons Patient 1 Patient 2 Patient 3 Patient 4 Patient 5 Patient 6 Patient 7 Patient 8 Patient 9 Patient 10 Patient 11 Patient 12 Patient 12 Patient 13 Patient 14 Patient 15 Patient 16 6 mwt gmfm-d gmfm-e abas-3 * Patients did not complete 101A due to personal reasons. Baseline Deficits no Baseline Deficits not assessed Arginine (µm) 700 600 500 400 300 200 100 0 389 171 127 116 **200 µm 115 µm 40 µm *p<0.001 for cfb * Bl part 1 dose 1 response dose 8 response ole mean Gaa (µm) 5 4 3 2 1 bl ole uln naa(µm) 1.5 1.0 0.5 0.0 bl ole uln Gva(µm)8 6 4 2 0 bl ile uln arga (µm) bl ole uln Patient 1 Patient 2 Patient 3 Patient 4 Patient 5 Patient 6 Patient 7 Patient 8 Patient 9 Patient 10 Patient 11 Patient 12 Patient 12 Patient 13 Patient 14 Patient 15 Patient 16 responders (r)rrrrrrrrrrr 6mwt gmfm-d gmfm-e 20 dose a a responder (≥1 mcid increase) not assessed ≥1 mcid decrease no improvement or decline a gmfcs category iv no mcid defined 6MWT GMFM-D GMFM-E 60% 40%20% 0% all with bl deficit 60% 40%20% 0% all with bl deficit 60% 40%20% 0% all with bl deficit dose8 dose 20