UNITED STATES
SECURITIES AND EXCHANGE COMMISSION
Washington, D.C. 20549
FORM N-CSR
CERTIFIED SHAREHOLDER REPORT OF REGISTERED
MANAGEMENT INVESTMENT COMPANIES
Investment Company Act file number: 811-23059
CLOUGH FUNDS TRUST
(Exact name of registrant as specified in charter)
1290 Broadway, Suite 1100, Denver, Colorado 80203
(Address of principal executive offices) (Zip code)
303.623.5277
(Registrant’s telephone number, including area code)
Abigail J. Murray, Secretary
Clough Funds Trust
1290 Broadway, Suite 1100
Denver, CO 80203
(Name and address of agent for service)
Date of fiscal year end: October 31, 2015
Date of reporting period: September 30, 2015 – October 31, 2015
Item 1. Report to Stockholders.

| | |
Clough Global Long/Short Fund | | Table of Contents |
| | |
Clough Global Long/Short Fund | | Shareholder Letter |
| | October 31, 2015 (Unaudited) |
Dear Shareholders:
In this inaugural letter to you, the investors in the Clough Global Long/Short Fund (the “Fund”), we share our thoughts on the Fund’s investments over the course of its first fiscal year, which ended on October 31, 2015 and an outlook for the coming year. Our discussion of the Fund’s investment program covers the full period since the launch on January 2, 2015 of the Fund’s predecessor vehicle, a privately offered fund (the “Predecessor Fund”), which merged into the Fund at the Fund’s inception, and therefore, references to the Fund also include the Predecessor Fund in this context.
As you know, the objective of the Fund is to provide investors with long-term capital appreciation. The Fund invests primarily in equities and has a global mandate. Short positions are utilized to reduce the net exposure of the Fund and we expect this will help reduce volatility in the Fund’s returns. The Fund is invested primarily along a handful of global investment themes. Themes are generated on both the long and short side.
Performance
The Fund’s Institutional share class returned 1.74% net of fees for its fiscal year ended October 31, 2015. The Fund trailed the 2.71% return posted by the S&P 500 Index and outperformed the HFRI Long/Short Index (“HFRI”), which returned -0.27% for the same period. The Fund’s returns was less volatile than the benchmark S&P 500 as measured by standard deviation of returns, which was 8.74% for the Fund, as compared to the same measure for the S&P 500 (15.49%).
The Fund posted positive returns on both the long and short side for the period. Gains on the long side were primarily driven by strong performance of holdings in the consumer discretionary sector with investments in U.S. homebuilders, entertainment and consumer durables positions performing well. The Fund experienced losses on long positions in the financial sector, with U.S. money center banks such as Morgan Stanley and U.S. mortgage insurance providers including Radian Group amongst those trading lower. Losses in Financials were more than offset by gains on short positions in Brazilian banks and U.S. private equity fund managers. In the Materials sectors, short positions in mining companies exposed to weak industrial activity in China also produced gains.
From a regional perspective, holdings in both North America and Japan posted gains on both the long and short side, whereas the Fund generated losses on both long positions in India and short positions in Europe. Chinese positions were slightly positive despite the unusually high volatility in Chinese stocks during the year.
Market Review
After one of the longest and strongest market rallies in history, global equity markets have petered out this year. The global economy continues to expand yet growth remains lackluster in most of the world and this has begun to weigh on financial markets.
Manufacturing PMIs (Purchasing Managers Index) are hovering near to even below the 50 level in many parts of the world and Industrial Production in the U.S. is barely in positive territory1. A reading below 50 on the PMI is often associated with economic contractions. The CEO of Fastenal Co, a large distributor of industrial and construction supplies, said on a recent call with analysts that the U.S. was in the midst of an “industrial recession”. In this environment corporate profits have been listless. Indeed, it appears as if the third quarter of 2015 will see the first negative period for earnings growth for S&P 500 companies since 2009. Of course, the energy sector is a major drag on corporate earnings, but even excluding oil & gas stocks, profits have softened. Despite a solid housing market and decent household spending, weaker global activity and a strong dollar have been a headwind for U.S. stocks, which have struggled to remain in positive territory for much of the second half of 2015.
In Europe, deflationary pressures continue to weigh on growth and the European Central Bank (“ECB”) is expected to remain ultra-accommodative. The weak Euro has helped revive export growth, but weaker Chinese demand for imported industrial and consumer goods lingers. Europe won’t be able to export itself out of structural difficulties. The European Union (“EU”) remains plagued by a moribund banking sector that has struggled to recapitalize post the Global Financial Crisis (“GFC”) and subsequent Greek debt crisis. Weak bank balance sheets are a drag on growth which is likely to persist, though there are signs that regulators are beginning to push banks to raise capital levels as firms like Barclays PLC and Deutsche Bank are poised for further restructuring. Even so, European stock markets have outperformed U.S. stocks, though trailed in U.S. dollar terms1.
Chinese stocks have seen extreme volatility, surging earlier in the year and then dramatically falling. More recently they have recovered and the Shanghai Composite has re-entered “bull market” territory. This volatility reflects shifting investor sentiment on China’s economic outlook as gross domestic product (“GDP”) growth dipped below 7% for the first time in 15 years. It’s not all bad in China, as economic and social reforms help support a much needed rebalancing of its economy which had grown too dependent on fixed asset investment and government spending. This transition is much further ahead than most believe, as evidenced by strong consumer spending and services activity. Retail sales grew 14% for the year through September 2015, helped by E-commerce sales which have gained more than 36%. Restaurant sales surged more than 15% and the box office is booming with spending on movies gaining more than 50% year-to-date2. This contrasts with the industrial economy which has seen steel production decline for the second year in a row as inventories pile up globally. Steel prices have declined by nearly two thirds in China in the last five years. Similarly, cement consumption in China has shrunk 5% this year and electricity demand, heavily dependent on industrial activity, is flat on the year3. China has become a two speed economy (i.e., “New China vs. Old China”) and this push and pull continued to create opportunities on both the long and short side.
| | |
Clough Global Long/Short Fund | | Shareholder Letter |
| | October 31, 2015 (Unaudited) |
A strong dollar and weaker industrial activity in China has weighed the most on emerging markets, most notably Brazil in Latin America and some of the smaller ASEAN economies such as Indonesia and Thailand. There are some signs of credit stresses in the commodity-sensitive countries and weak currencies are exacerbating those issues. Emerging market stocks were down over 10% for the first ten months of the year, led by a 34% decline in Brazil’s Bovespa Index (in U.S. dollars).
Portfolio Overview – Investment Themes
We have structured the portfolio alongside the following key insights and themes:
Globally, we believe that interest rates are likely to remain at rock bottom levels and the capital markets, both equity and fixed income will struggle to generate the strong returns we have seen in the post-GFC period. The major global economies, U.S., EU, Japan and China, have decoupled as have their monetary policies. While the ECB and Bank of Japan (“BoJ”) are both continuing (and even possibly expanding) massive Quantitative Easing (“QE”) programs to reflate growth, the U.S. Federal Reserve has exited QE and has signaled a desire to raise interest rates. These divergences have helped to strengthen the dollar and led to increased volatility in the capital markets.
In a low return world, the acute shortage is “yield” and we think investors will need to think creatively and look for yield in the equity markets. Yield can take many forms, including dividends, but we are focusing our efforts in finding undervalued companies generating high levels of free cash flow (FCF) per share relative to their stock prices. We believe that the key to this strategy will be identifying high quality – meaning durable and visible – free cash streams that are being deployed to benefit shareholders. Corporations can allocate cash flow in various ways, but principally as follows: 1) invest in a high return business, 2) pay dividends to shareholders, 3) pay down high cost debt, 4) repurchase shares or 5) pursue value-enhancing acquisitions. Businesses with management teams able to make the right choices on capital allocation amongst these options should be able to create significant value for shareholders. We call these companies “Compounders.”
Compounders in our current portfolio include Allison Transmission, which has a dominant market position providing fully-automatic transmissions for medium and heavy-duty trucks. Allison has only modest revenue growth prospects, yet the company generates high quality, recurring FCF equal to more than 10% of its share price by our calculation. Allison’s borrowing costs are substantially less than that and its business does not require significant reinvestment so share repurchases are very accretive to shareholder value. The shares have not performed well, but we think value is accreting to us as owners and are willing to be patient.
We also find Compounders in the cable sector. The cable business is a digital age utility offering critical broadband infrastructure. Customers are paying up for broadband access and profits there
more than offset profit erosion that may emerge from so-called “cord cutting”. Companies like Charter and Comcast have durable, recurring cash flow and generate high returns on investment (ROI) by upgrading their plant and equipment to improve service levels. The broadening of high speed data networks is also powering the greater digital economy and the Fund has exposure to several of the leading internet companies focused on social media and cloud applications in both the U.S. and China.
The U.S. financial sector is the strongest in the world with healthy and we think excessively capitalized balance sheets. After years of legal and regulatory headwinds, which included massive fines and penalties, the large U.S. money center banks with strong investment banking franchises are poised to see earnings gains and sustained higher returns on equity (ROE). Competitive advantages vis-a-vis Europe’s large global banks are strengthening as the European banks struggle with weak capital positions, deflationary pressures and poor credit quality. Market share gains in the attractive capital markets businesses are structural for the likes of Morgan Stanley, Bank of America and Citigroup. According to Moody’s, from 2008 – 2014 the five largest U.S. banks booked $139 billion in legal provisions, with Bank of America alone incurring $70 billion, and we think that drain on shareholder funds is in the rear view mirror. Strong capital generation will finally be returned to owners of the banks in the form of dividends and stock buybacks and we think the U.S. financial sector offers significant upside in the coming years. We believe these financial companies have Compounder attributes as well.
Economic and social reforms across Asia are changing the outlook for growth and wealth creation. This region, led by China, India and Japan, offers attractive long-term tailwinds for investors. Each of these large economies has their own flavor of reform. Japanese policy has gone all out on reflation policies under Prime Minister Shinzo Abe who was elected in December 2012 with a clear mandate to end a two decade long deflationary economy in Japan. His so-called “Abenomics” agenda has successfully pulled the country out of its decade’s long deflationary stupor. The first phase of Abenomics saw massive QE and a sharp depreciation of the Yen which led to a surge in corporate earnings led by Japan’s large exporters whose foreign profits benefited from translation gains. Profit gains drove stock prices significantly higher.
You can’t devalue your way to greatness however, and Abe’s plan has shifted into Phase 2, which in our mind is driven by true economic reforms; none more important than the policies designed to improve corporate governance. Japanese companies have long ago paid down debts from the late 80s bubble economy and have more recently hoarded cash in a deflationary economy. Government policy and pressure from investors, including some activists, has changed the mindset of management teams. For the first time we are witnessing a Western-style focus on shareholder returns and that is bullish. Japan’s lazy, cash heavy balance sheets are being put to work and capital allocation is improving. Companies such as Nippon Telegraph and Telephone, Japan’s largest telecom provider are buying back stock in droves and this is improving ROEs and valuations are expanding. The large Japanese banks, such as Mizuho
| | |
Annual Report | October 31, 2015 | | 3 |
| | |
Clough Global Long/Short Fund | | Shareholder Letter |
| | October 31, 2015 (Unaudited) |
Financial and Mitsubishi UFJ are also becoming more shareholder friendly. The banks have maintained large equity holdings of their corporate clients which is an inefficient use of capital from a regulatory perspective. Recently the banks have committed to unwinding these cross shareholdings and are likely to accelerate the pace and size of share buybacks with the sales proceeds. This should be very accretive to shareholders given how cheap the bank stocks are, as they trade well below book value.
India is a modest exposure for us today but we expect it to grow in the coming years. India has been plagued by bad, populist governments who have squandered budget deficits with handouts for votes. A lack of infrastructure investment has contributed to persistent inflation pressures and growth disappointments. Narendra Modi was elected Prime Minister eighteen months ago with a clear mandate to build and grow the country and he has an aggressive reform agenda to foster an investment-led growth model for the country. We are optimistic that India’s vast potential may begin to be realized. In India, our investment focus is on infrastructure operators, as well as construction and industrial companies. Importantly, Modi’s arrival coincided with the appointment of the highly respected economist Raghuram Rajan to lead India’s central bank (RBI). The RBI has succeeded in bringing inflation levels down which means interest rates are also lower. This is critical to help fund the investment boom we foresee. Of course, the banking sector will benefit if a credit cycle develops as we expect. The Fund has modest exposure to Indian financials today, which could grow as our confidence increases.
China’s economic rebalancing is a structural, not cyclical event, and will pressure steel producers and suppliers of bulk materials like coal and iron ore across the World for years to come. The Fund has broad short exposure to mining and industrial companies leveraged to the deteriorating fundamentals of “Old China”. Change in China is also presenting many investment opportunities on the long side. We liken this development to the Rust Belt in the U.S. that emerged in the 1970s. Ironically, the suffering in the Rust Belt and the peak of U.S. industrialization did not spell the end of the road for investors in U.S. stocks. Indeed, from 1980 – 2000 U.S. stocks produced annualized returns of around 17.5% over two decades as the large, flexible U.S. economy rebalanced4 and a “New Economy” emerged, powered by a booming middle class. As China deals with its own Rust Belt, the development of its capital markets is critical, as growth led by the private sector, as opposed to government spending will be funded by the capital markets – not the state-owned banks. Evidence suggests that economic reform is proceeding, as the International Monetary Fund has now added the Chinese Yuan to the Special Drawing Rights basket, marking the Yuan as one of a handful of global reserve currencies.
We also believe the Chinese consumer is very investible given the income and wealth gain China has enjoyed. The middle class has emerged and that can be seen in the new brands emerging in China, booming online sales and spending on travel and entertainment. Importantly, many of the growth companies addressing Chinese consumption are privately owned and managed (i.e., they are not
directly affiliated with the government). We have investments in China’s leading mass market sneaker and apparel brand and the country’s largest mid-to-high end branded furniture manufacturer and retailer. Both are exposed to increase discretionary spending. E-commerce also remains a high growth sector where companies like Alibaba Group and JD.com Inc. have emerged as leaders. Innovation is underestimated in China and Chinese manufacturers are moving up the value chain, making more complex products. While companies like Tesla get all the attention, in our opinion China is likely to lead the world in bringing the Electric Vehicle (“EV”) industry to scale. Public bus and taxi fleet rollouts have begun domestically and are paired with a widespread rollout of the necessary charging infrastructure. Yutong Bus, China’s leading bus manufacturer, recently announced it is exporting EV buses to Paris as well.
On the short side, in addition to sectors and companies on the wrong side of China’s rebalancing, we see many large U.S. multi-nationals who are losing competiveness, domestically but even more acutely in overseas businesses which have driven much of their growth in the last couple of decades. The strong U.S. dollar has been an issue, though the value proposition for consumer staples and old line financial and technology providers is waning as well.
Technology cycles are shortening and commoditization is a broad problem even in the recently booming smartphone industry. Technology cycles have always had winners and losers and creative destruction is the rule, not the exception. Component suppliers to smartphones and PCs are seeing slowing growth and margin pressure. Consolidation via M&A is an offset for some, but broadly speaking we are seeking to hedge the portfolio with some short positions in these areas.
In addition, many smaller Emerging Markets are under pressure as the U.S. Federal Reserve exits QE and the strong U.S. dollar pressures capital flows away from countries and companies with structural trade and budget deficits. Smaller ASEAN markets are stressed with large debt burdens in a strong U.S. dollar environment and we see credit quality deteriorating. We are finding short opportunities in the industrial and financial sectors of select Emerging Market countries.
Outlook
While we are optimistic that our investment themes can produce positive returns in the coming years, it does appear that the broad capital markets are poised to generate lackluster upside, especially compared to the last five years. First, interest rates are low and are likely to remain that way for a long time. The global economy has only added to its leverage in the post-GFC recovery. That debt burden is deflationary as its buildup has effectively pulled forward growth from the future. The burden is so large that servicing debt at higher interest rates is very difficult. As evidence, simply observe that the original taper tantrum in the spring of 2013 caused mortgage rates to spike, which sharply curtailed what was then a robust U.S. housing recovery. Simply put, the economy can’t handle
| | |
Clough Global Long/Short Fund | | Shareholder Letter |
| | October 31, 2015 (Unaudited) |
higher interest rates and while interest rates are likely to remain low, we believe returns from bonds are going to be modest at best.
We also have to recognize that with rates so low and many of the large economies well into implementing unconventional monetary policies which had the explicit intent to raise asset values, stocks, real estate and other asset classes like art are fully inflated. Indeed, U.S. household net worth (“HNW”) is at an all-time high. More importantly, the ratio of HNW-to-GDP is also at an all-time high, eclipsing levels from both 2000 and 2007, periods that proceeded significant stresses in both global economic activity and stock prices. Why is this ratio important? It’s simple. All asset values, whether they are real estate investments, loans such as mortgages or corporate borrowings, or stocks must be supported by some form of cash flow or income. Since economic growth is sluggish and likely to remain so, and the HNW-to-GDP ratio is already beyond recent historical peaks, future returns on assets are likely to be much lower than in recent years.
Financial engineering has also worked to elevate profits and stock prices and slowing growth is revealing balance sheet stress in many corners of the world. Stock buybacks and M&A activity are at extreme levels relative to history. In most instances, buying back shares is a less attractive investment given stock prices are much higher than they were five years ago, but many firms are doing so more than ever despite the higher valuations. Some are even borrowing money for buybacks, which introduces financial risks. We have recently seen companies like Wal-Mart Stores, Caterpillar Inc. and even Oracle Corp. buy back shares at high prices which in retrospect look value-destroying for shareholders.
Lastly, we believe that passive investing has reached an extreme level and will likely contribute to both volatility and dispersion in coming years. Large stocks have had a persistent bid from waves of reallocation out of individual stocks and actively managed funds into indexed exchange-traded funds with the most popular being the S&P 500 ETF (“SPY”). Passive has worked and the SPY has been one of the best performing asset classes since the GFC reached its nadir in 2009. We have compared this period to the Nifty-Fifty era of the 1990s and 1970s and the go-go 1990s when investment flows were concentrated in a narrow group of large cap stocks and indexation first became a craze. Passive investing allocates capital based on company size and market capitalization, not necessarily by business fundamentals and valuations implying there is little value in fundamental research. When growth slows and price momentum wanes, fundamentals become the most important driver of stock prices and valuations are determined by factors such as ROI. In this environment, active management and long / short strategies could thrive.
We started our firm in March 2000 and have seen our share of cycles. Through it all we have placed a great deal of emphasis on investing our investors’ capital prudently, always paying great attention to our downside. Indeed, over the course of time, we believe that seeking to reduce the impact of drawdowns may be the most important driver of long-term returns. We will work diligently
to try to protect and grow your capital in the coming years and we thank you for the trust you have placed in us.
If you have any questions about your investment, please call 1-877-256-8445.
Sincerely,

Charles I. Clough, Jr.

Eric A. Brock

Vincent Lorusso
| 1 | Bloomberg data, October 2015 |
| 2 | UBS, China Equity Strategy, November 2015 |
| 3 | Credit Suisse, Basic Materials Monetary November 2015 |
| 4 | Bloomberg data, Clough Capital calculations |
| | |
Annual Report | October 31, 2015 | | 5 |
| | |
Clough Global Long/Short Fund | | Portfolio Allocation |
| | October 31, 2015 (Unaudited) |
Performance (as of October 31, 2015)
| | | | | | | | | | | | | | | | |
| | | 1 Month | | | | | | Quarter | | | | | | YTD | | Since Inception† |
Class A - NAV* | | 3.00% | | | | | | -3.62% | | | | | | 1.47% | | 1.47% |
Class A - MOP* | | -2.65% | | | | | | -8.92% | | | | | | -4.11% | | -4.11% |
Class C - NAV* | | 3.00% | | | | | | -3.72% | | | | | | 0.98% | | 0.98% |
Class C - CDSC* | | 2.00% | | | | | | -4.69% | | | | | | -0.02% | | -0.02% |
Class I - NAV^ | | 3.00% | | | | | | -3.56% | | | | | | 1.74% | | 1.74% |
S&P 500 Total Return Index(a) | | 8.44% | | | | | | -0.63% | | | | | | 2.70% | | 2.70% |
HFRI Equity Hedge (Total) Index(b) | | 2.96% | | | | | | -2.20% | | | | | | 0.40% | | 0.40% |
The performance data quoted above represents past performance. Past performance is not a guarantee of future results. Investment return and value of the Fund shares will fluctuate so that an investor’s shares, when sold or redeemed, may be worth more or less than their original cost. Performance may be lower or higher than performance data quoted. Fund performance current to the most recent month-end is available by calling (855) 425-6844 or by visiting www.cloughglobal.com.
| † | Fund’s commencement date is September 30, 2015. | |
| * | Returns shown prior to 9/30/2015 are based on the returns of Clough Global Long/Short Fund LP Predecessor adjusted for fees and expenses. | |
| ^ | Returns shown prior to 9/30/2015 are based on the returns of Clough Global Long/Short Fund LP Predecessor. | |
| (a) | The Standard & Poor’s composite index of 500 stocks, a widely recognized, unmanaged index of common stock prices. Index performance does not reflect fund performance. An investor cannot invest directly in an index. | |
| (b) | An index designed by Hedge Fund Research, Inc. to represent the performance of investment managers who maintain positions both long and short in primarily equity and equity derivative securities. A wide variety of investment processes can be employed by such managers to arrive at an investment decision, including both quantitative and fundamental techniques; strategies can be broadly diversified or narrowly focused on specific sectors and can range broadly in terms of levels of net exposure, leverage employed, holding period, concentrations of market capitalizations and valuation ranges of typical portfolios. An investor cannot invest directly in an index. | |
Returns of less than 1 year are cumulative.
An investor cannot invest directly in an index.
The Fund is new and has a limited operating history.
Performance of $10,000 Initial Investment (as of October 31, 2015)
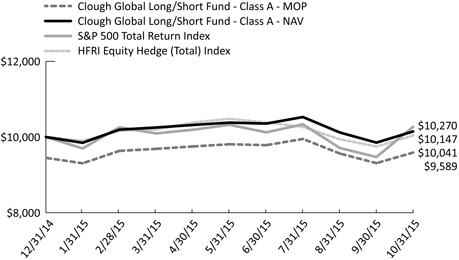
The graph shown above represents historical performance of a hypothetical investment of $10,000 in the Fund since inception, including the Predecessor. Past performance does not guarantee future results. All returns reflect reinvested dividends, but do not reflect the deduction of taxes that a shareholder would pay on Fund distributions or the redemption of Fund shares.
| | |
Clough Global Long/Short Fund | | Portfolio Allocation |
| | October 31, 2015 (Unaudited) |
| | | | | | |
| Top Ten Long Holdings (as a % of Net Assets)* | | | | | |
|
Citigroup, Inc. | | | 2.72 | % | | |
Liberty Ventures - Series A | | | 2.42 | % | | |
Bank of America Corp. | | | 2.19 | % | | |
Calpine Corp. | | | 1.86 | % | | |
iShares® MSCI India ETF | | | 1.73 | % | | |
IMAX Corp. | | | 1.71 | % | | |
DR Horton, Inc. | | | 1.65 | % | | |
Mizuho Financial Group, Inc. | | | 1.50 | % | | |
Signet Jewelers, Ltd. | | | 1.45 | % | | |
Lennar Corp. - Class A | | | 1.37 | % | | |
|
Top Ten Holdings | | | 18.60 | % | | |
|
| * | Holdings are subject to change |
| | | | | | | | |
| Sector Allocation ** | | Long Exposure % TNA | | Short Exposure % TNA | | Net Exposure % TNA | | |
|
Consumer Discretionary | | 26.05% | | -1.77% | | 24.28% | | |
Consumer Staples | | 1.99% | | -0.53% | | 1.46% | | |
Energy | | 1.76% | | -3.84% | | -2.08% | | |
Exchange Traded Funds | | 3.63% | | -4.06% | | -0.43% | | |
Financials | | 18.61% | | -5.35% | | 13.26% | | |
Health Care | | 7.73% | | -3.72% | | 4.01% | | |
Industrials | | 6.46% | | -7.65% | | -1.19% | | |
Information Technology | | 7.81% | | -2.57% | | 5.24% | | |
Materials | | 1.00% | | -0.40% | | 0.60% | | |
Real Estate | | 1.70% | | -0.19% | | 1.51% | | |
Telecommunication Services | | 3.43% | | 0.00% | | 3.43% | | |
Utilities | | 2.21% | | -0.30% | | 1.91% | | |
|
Total Investments | | 82.38% | | -30.38% | | 52.00% | | |
|
| | | | |
| Country Allocation ** | | Long Exposure % TNA | | Short Exposure % TNA | | Net Exposure % TNA | | |
|
China | | 14.11% | | -0.49% | | 13.62% | | |
Europe | | 2.55% | | -3.99% | | -1.44% | | |
India | | 3.03% | | 0.00% | | 3.03% | | |
Japan | | 7.12% | | -1.86% | | 5.26% | | |
Other Developed Markets | | 1.71% | | -0.67% | | 1.04% | | |
Other Emerging Markets | | 0.00% | | -5.72% | | -5.72% | | |
United States | | 53.86% | | -17.65% | | 36.21% | | |
|
Total Investments | | 82.38% | | -30.38% | | 52.00% | | |
|
| ** | Allocation summaries calculated as percent of total net assets using market value of cash traded securities, notional value of derivative contracts and excluding short-term investments and futures. |
| | |
Annual Report | October 31, 2015 | | 7 |
| | |
Clough Global Long/Short Fund | | Disclosure of Fund Expenses |
| | October 31, 2015 (Unaudited) |
Examples. As a shareholder of the Clough Global Long/Short Fund (the “Fund”), you incur two types of costs: (1) transaction costs, including applicable redemption fees; and (2) ongoing costs, including management fees, distribution and service (12b-1) fees and other Fund expenses. The following examples are intended to help you understand your ongoing costs (in dollars) of investing in the Fund and to compare these costs with the ongoing costs of investing in other mutual funds. The examples are based on an investment of $1,000 invested on May 1, 2015 and held through October 31, 2015.
Actual Expenses. The first line of the table below provides information about actual account values and actual expenses. You may use the information in this line, together with the amount you invested, to estimate the expenses that you paid over the period. Simply divide your account value by $1,000 (for example, an $8,600 account value divided by $1,000 = 8.6), then multiply the result by the number in the first line under the heading “Expenses Paid During Period October 1, 2015 –October 31, 2015” to estimate the expenses you paid on your account during this period.
Hypothetical Example for Comparison Purposes. The second line of the table below provides information about hypothetical account values and hypothetical expenses based on the Fund’s actual expense ratio and an assumed rate of return of 5% per year before expenses, which is not the Fund’s actual return. The hypothetical account values and expenses may not be used to estimate the actual ending account balance or expenses you paid for the period. You may use this information to compare the ongoing costs of investing in the Fund and other mutual funds. To do so, compare this 5% hypothetical example with the 5% hypothetical examples that appear in the shareholder reports of the other mutual funds.
Please note that the expenses shown in the table are meant to highlight your ongoing Fund costs only and do not reflect any transactional costs, such as redemption fees. Therefore, the second line of the table below is useful in comparing ongoing costs only and may not help you determine the relative total costs of owning different funds. In addition, if these transactional costs were included, your costs would have been higher.
| | | | | | | | | | | | | | | | | | | | |
| | | Beginning Account Value 5/1/2015 | | Ending Account Value 10/31/15 | | Expense Ratio(a)(b) | | Expenses Paid During period 5/1/2015 - 10/31/15(c) |
Clough Global Long/Short Fund(d) | | | | | | | | | | | | | | | | | | | | |
Class A | | | | | | | | | | | | | | | | | | | | |
Actual | | | $ | 1,000.00 | | | | $ | 1,030.00 | | | | | 2.67 | % | | | $ | 2.30 | |
Hypothetical (5% return before expenses) | | | $ | 1,000.00 | | | | $ | 1,011.75 | | | | | 2.67 | % | | | $ | 2.28 | |
Class C | | | | | | | | | | | | | | | | | | | | |
Actual | | | $ | 1,000.00 | | | | $ | 1,030.00 | | | | | 3.32 | % | | | $ | 2.86 | |
Hypothetical (5% return before expenses) | | | $ | 1,000.00 | | | | $ | 1,008.47 | | | | | 3.32 | % | | | $ | 2.83 | |
Class I | | | | | | | | | | | | | | | | | | | | |
Actual | | | $ | 1,000.00 | | | | $ | 1,030.00 | | | | | 2.32 | % | | | $ | 2.00 | |
Hypothetical (5% return before expenses) | | | $ | 1,000.00 | | | | $ | 1,013.51 | | | | | 2.32 | % | | | $ | 1.98 | |
| (a) | Expense ratio excluding interest expense and dividends paid on borrowed securities for the Clough Global Long/Short Fund is 1.95%, 2.60% and 1.60% for Class A, Class C and Class I respectively. |
| (b) | Annualized, based on the Fund’s most recent fiscal half year expenses. |
| (c) | Expenses are equal to the Fund’s annualized expense ratio multiplied by the average account value over the period, multiplied by the number of days in the most recent fiscal half-year (184)/365 (to reflect the half-year period). |
| (d) | Clough Global Long/Short Fund commenced operations on September 30, 2015. For the purposes of calculating the “Actual” figures, actual number of days from commencement of operations through October 31, 2015 were used (31 days). |
| | |
Clough Global Long/Short Fund | | Statement of Investments |
| | October 31, 2015 |
| | | | | | | | |
| | | Shares | | | Value | |
| |
COMMON STOCKS 76.86% | | | | | | | | |
Consumer Discretionary 25.55% | | | | | | | | |
AMC Entertainment Holdings, Inc. - Class A | | | 6,190 | | | | $169,420 | |
Anta Sports Products, Ltd. | | | 127,000 | | | | 356,392 | |
Best Buy Co., Inc. | | | 3,500 | | | | 122,605 | |
Blue Nile, Inc.(a) | | | 13,461 | | | | 459,020 | |
Carter’s, Inc. | | | 4,994 | | | | 453,855 | |
China ZhengTong Auto Services Holdings, Ltd. | | | 270,500 | | | | 121,105 | |
Comcast Corp. - Class A | | | 5,495 | | | | 344,097 | |
DR Horton, Inc.(b) | | | 20,108 | | | | 591,980 | |
Great Wall Motor Co., Ltd. - Class H | | | 139,500 | | | | 170,627 | |
IMAX Corp.(a) | | | 15,960 | | | | 612,704 | |
JD.com, Inc. - ADR(a) | | | 13,600 | | | | 375,632 | |
Lennar Corp. - Class A(b) | | | 9,801 | | | | 490,736 | |
Liberty Broadband Corp. - Class C(a)(b) | | | 7,359 | | | | 395,693 | |
Liberty Media Corp. - Class C(a)(b) | | | 12,271 | | | | 480,410 | |
Liberty Ventures - Series A(a)(b) | | | 19,852 | | | | 864,951 | |
Lions Gate Entertainment Corp. | | | 7,450 | | | | 290,327 | |
Man Wah Holdings, Ltd. | | | 184,000 | | | | 210,812 | |
Manchester United PLC - Class A | | | 4,900 | | | | 89,180 | |
Moncler SpA | | | 7,907 | | | | 127,381 | |
Monro Muffler Brake, Inc. | | | 1,000 | | | | 74,170 | |
NetFlix, Inc.(a) | | | 1,350 | | | | 146,313 | |
Pacific Textiles Holdings, Ltd. | | | 91,000 | | | | 130,090 | |
Priceline Group, Inc.(a) | | | 161 | | | | 234,133 | |
Rakuten, Inc. | | | 13,600 | | | | 190,188 | |
Restoration Hardware Holdings, Inc.(a) | | | 3,754 | | | | 387,000 | |
Service Corp. International(b) | | | 4,900 | | | | 138,474 | |
Signet Jewelers, Ltd. | | | 3,435 | | | | 518,479 | |
Starbucks Corp.(b) | | | 6,225 | | | | 389,498 | |
William Lyon Homes - Class A(a) | | | 10,077 | | | | 215,043 | |
| | | | | | | | |
| | | | | | | 9,150,315 | |
| | | | | | | | |
| | |
Consumer Staples 1.44% | | | | | | | | |
CVS Health Corp. | | | 700 | | | | 69,146 | |
Prestige Brands Holdings, Inc.(a) | | | 3,100 | | | | 151,931 | |
Suntory Beverage & Food, Ltd. | | | 4,200 | | | | 170,896 | |
WH Group, Ltd.(a) | | | 222,000 | | | | 122,878 | |
| | | | | | | | |
| | | | | | | 514,851 | |
| | | | | | | | |
| | |
Energy 1.76% | | | | | | | | |
Anadarko Petroleum Corp. | | | 2,000 | | | | 133,760 | |
Concho Resources, Inc.(a) | | | 1,250 | | | | 144,887 | |
Devon Energy Corp. | | | 2,800 | | | | 117,404 | |
EOG Resources, Inc. | | | 1,300 | | | | 111,605 | |
Pioneer Natural Resources Co. | | | 900 | | | | 123,426 | |
| | | | | | | | |
| | | | | | | 631,082 | |
| | | | | | | | |
| | | | | | | | |
| | | Shares | | | Value | |
| |
Financials 18.61% | | | | | | | | |
American International Group, Inc. | | | 7,238 | | | | $456,428 | |
Bank of America Corp.(b) | | | 46,750 | | | | 784,465 | |
Bank of China, Ltd. - Class H | | | 462,000 | | | | 218,763 | |
BOC Hong Kong Holdings, Ltd. | | | 78,500 | | | | 252,193 | |
China Construction Bank Corp. - Class H | | | 345,000 | | | | 250,606 | |
Citigroup, Inc.(b) | | | 18,349 | | | | 975,616 | |
Essent Group, Ltd.(a) | | | 9,600 | | | | 231,360 | |
Goldman Sachs Group, Inc. | | | 935 | | | | 175,313 | |
HDFC Bank, Ltd. - ADR | | | 2,100 | | | | 128,394 | |
ICICI Bank, Ltd. - Sponsored ADR | | | 39,002 | | | | 336,197 | |
JPMorgan Chase & Co. | | | 2,100 | | | | 134,925 | |
MGIC Investment Corp.(a) | | | 44,577 | | | | 419,024 | |
Mitsubishi UFJ Financial Group, Inc. | | | 59,600 | | | | 390,485 | |
Mizuho Financial Group, Inc. | | | 259,100 | | | | 537,439 | |
Monex Group, Inc. | | | 70,000 | | | | 198,392 | |
Morgan Stanley | | | 9,910 | | | | 326,733 | |
Radian Group, Inc. | | | 17,100 | | | | 247,437 | |
Solar Capital, Ltd. | | | 12,400 | | | | 214,644 | |
Sumitomo Mitsui Financial Group, Ltd. | | | 9,600 | | | | 386,641 | |
| | | | | | | | |
| | | | | | | 6,665,055 | |
| | | | | | | | |
| | |
Health Care 7.73% | | | | | | | | |
Akorn, Inc.(a) | | | 6,000 | | | | 160,440 | |
Allergan PLC(a) | | | 400 | | | | 123,388 | |
AstraZeneca PLC - Sponsored ADR | | | 1,517 | | | | 48,377 | |
Bristol - Meyers Squibb Co. | | | 1,526 | | | | 100,640 | |
Cerner Corp.(a) | | | 585 | | | | 38,780 | |
Cigna Corp. | | | 786 | | | | 105,355 | |
Community Health Systems, Inc.(a) | | | 1,300 | | | | 36,452 | |
Corindus Vascular Robotics, Inc.(a) | | | 27,700 | | | | 88,640 | |
Dynavax Technologies Corp.(a) | | | 1,975 | | | | 44,852 | |
Gilead Sciences, Inc. | | | 1,100 | | | | 118,943 | |
GW Pharmaceuticals PLC - ADR(a) | | | 1,651 | | | | 130,577 | |
HCA Holdings, Inc.(a) | | | 1,640 | | | | 112,816 | |
Healthways, Inc.(a) | | | 20,440 | | | | 240,579 | |
Hologic, Inc.(a) | | | 2,095 | | | | 81,412 | |
Humana, Inc. | | | 1,013 | | | | 180,952 | |
Intra - Cellular Therapies, Inc.(a) | | | 2,100 | | | | 100,485 | |
Intrexon Corp.(a) | | | 1,286 | | | | 43,210 | |
Intuitive Surgical, Inc.(a) | | | 85 | | | | 42,211 | |
Jazz Pharmaceuticals PLC(a) | | | 832 | | | | 114,217 | |
Perrigo Co. PLC | | | 740 | | | | 116,728 | |
Sinopharm Group Co., Ltd. - Class H | | | 76,400 | | | | 316,419 | |
Team Health Holdings, Inc.(a) | | | 1,200 | | | | 71,604 | |
Universal American Corp. | | | 7,000 | | | | 52,220 | |
Veracyte, Inc.(a) | | | 9,100 | | | | 59,241 | |
Vertex Pharmaceuticals, Inc.(a) | | | 1,925 | | | | 240,124 | |
| | | | | | | | |
| | | | | | | 2,768,662 | |
| | | | | | | | |
| | |
Annual Report | October 31, 2015 | | 9 |
| | |
Clough Global Long/Short Fund | | Statement of Investments |
| | October 31, 2015 |
| | | | | | | | |
| | | Shares | | | Value | |
| |
Industrials 5.62% | | | | | | | | |
Air China, Ltd. - Class H | | | 194,000 | | | | $187,477 | |
Allison Transmission Holdings, Inc.(b) | | | 16,200 | | | | 464,940 | |
Armstrong World Industries, Inc.(a) | | | 4,794 | | | | 237,878 | |
Beijing Enterprises Holdings, Ltd. | | | 14,000 | | | | 88,780 | |
Kansas City Southern | | | 4,370 | | | | 361,661 | |
Keisei Electric Railway Co., Ltd. | | | 7,000 | | | | 86,956 | |
Roper Technologies, Inc. | | | 1,880 | | | | 350,338 | |
Seibu Holdings, Inc. | | | 9,600 | | | | 195,787 | |
TransDigm Group, Inc.(a) | | | 175 | | | | 38,474 | |
| | | | | | | | |
| | | | | | | 2,012,291 | |
| | | | | | | | |
| | |
Information Technology 7.81% | | | | | | | | |
Alibaba Group Holding, Ltd. - Sponsored ADR(a) | | | 3,870 | | | | 324,422 | |
Alphabet, Inc. - Class C(a) | | | 601 | | | | 427,197 | |
Baidu, Inc. - Sponsored ADR(a) | | | 600 | | | | 112,482 | |
Electronics For Imaging, Inc.(a) | | | 4,200 | | | | 195,048 | |
Facebook, Inc. - Class A(a)(b) | | | 3,449 | | | | 351,694 | |
Lam Research Corp. | | | 4,064 | | | | 311,262 | |
Microsoft Corp. | | | 3,300 | | | | 173,712 | |
Nintendo Co., Ltd. | | | 829 | | | | 133,827 | |
Pandora Media, Inc.(a) | | | 14,700 | | | | 169,197 | |
Salesforce.com, Inc.(a) | | | 3,172 | | | | 246,496 | |
ServiceNow, Inc.(a) | | | 1,904 | | | | 155,462 | |
Western Digital Corp. | | | 2,928 | | | | 195,649 | |
| | | | | | | | |
| | | | | | | 2,796,448 | |
| | | | | | | | |
| | |
Materials 1.00% | | | | | | | | |
Axalta Coating Systems, Ltd.(a) | | | 9,600 | | | | 265,248 | |
W.R. Grace & Co.(a)(b) | | | 940 | | | | 94,282 | |
| | | | | | | | |
| | | | | | | 359,530 | |
| | | | | | | | |
| | |
Real Estate 1.70% | | | | | | | | |
Healthcare Trust of America, Inc. -
Class A(b) | | | 4,900 | | | | 128,919 | |
PennyMac Mortgage Investment Trust | | | 9,100 | | | | 133,042 | |
Starwood Property Trust, Inc. | | | 17,300 | | | | 347,557 | |
| | | | | | | | |
| | | | | | | 609,518 | |
| | | | | | | | |
| | |
Telecommunication Services 3.43% | | | | | | | | |
AT&T, Inc. | | | 7,900 | | | | 264,729 | |
China Mobile, Ltd. | | | 39,500 | | | | 472,944 | |
China Unicom Hong Kong, Ltd. | | | 186,000 | | | | 229,662 | |
| | | | | | | | |
| | | Shares | | | Value | |
| |
Telecommunication Services (continued) | | | | | |
Nippon Telegraph & Telephone Corp. | | | 7,000 | | | | $260,231 | |
| | | | | | | | |
| | | | | | | 1,227,566 | |
| | | | | | | | |
| | |
Utilities 2.21% | | | | | | | | |
Beijing Enterprises Water Group, Ltd. | | | 154,000 | | | | 122,992 | |
Calpine Corp.(a)(b) | | | 43,000 | | | | 666,930 | |
| | | | | | | | |
| | | | | | | 789,922 | |
| | | | | | | | |
| | |
TOTAL COMMON STOCKS (Cost $26,476,551) | | | | | | | 27,525,240 | |
| | | | | | | | |
| | |
EXCHANGE TRADED FUNDS 3.62% | | | | | | | | |
iShares® China Large Cap ETF(b) | | | 8,100 | | | | 309,987 | |
iShares® MSCI India ETF(b) | | | 21,800 | | | | 620,864 | |
Utilities Select Sector SPDR® ETF | | | 8,400 | | | | 367,500 | |
| | | | | | | | |
| | | | | | | 1,298,351 | |
| | | | | | | | |
| | |
TOTAL EXCHANGE TRADED FUNDS (Cost $1,281,356) | | | | | | | 1,298,351 | |
| | | | | | | | |
| | |
PARTICIPATION NOTES 1.90% | | | | | | | | |
Consumer Discretionary 0.51% | | | | | | | | |
Chongqing Changan Automobile Co., Ltd. - Class A (Loan Participation Notes issued by Morgan Stanley Asia Products), expiring 02/04/2016(a) | | | 75,200 | | | | 183,194 | |
| | | | | | | | |
| | |
Consumer Staples 0.55% | | | | | | | | |
Kweichow Moutai Co., Ltd. - Class A (Loan Participation Notes issued by Morgan Stanley Asia Products), expiring 12/09/2015(a) | | | 5,200 | | | | 176,031 | |
Shanghai Jahwa United Co., Ltd. - Class A (Loan Participation Notes issued by Morgan Stanley Asia Products), expiring 01/29/2016(a)(c) | | | 3,700 | | | | 20,182 | |
| | | | | | | | |
| | | | | | | 196,213 | |
| | | | | | | | |
| | |
Clough Global Long/Short Fund | | Statement of Investments |
| | October 31, 2015 |
| | | | | | | | |
| | |
Shares | | | Value | |
| |
Utilities (continued) | | | | | | | | |
Industrials 0.84% | | | | | | | | |
Zhengzhou Yutong Bus Co., Ltd. - Class A (Loan Participation Notes issued by Morgan Stanley Asia Products), expiring 11/18/2015(a) | | | 86,650 | | | | $300,652 | |
| | | | | | | | |
| | |
TOTAL PARTICIPATION NOTES (Cost $688,882) | | | | | | | 680,059 | |
| | | | | | | | |
| | |
| | | Shares | | | Value | |
| |
SHORT-TERM INVESTMENTS 17.87% | | | | | |
Money Market Fund 17.87% | | | | | | | | |
BlackRock Liquidity Funds, T-Fund Portfolio - Institutional Class (0.010% 7-day yield) | | | 6,398,013 | | | | 6,398,013 | |
| | | | | | | | |
| |
TOTAL SHORT-TERM INVESTMENTS (Cost $6,398,013) | | | | 6,398,013 | |
| | | | | | | | |
| | |
Total Investments - 100.25% (Cost $34,844,802) | | | | | | | 35,901,663 | |
Liabilities in Excess of Other Assets - (0.25%)(d) | | | | (89,531) | |
| | | | | | | | |
NET ASSETS - 100.00% | | | | | | | $35,812,132 | |
| | | | | | | | |
| | |
| SCHEDULE OF SECURITIES SOLD SHORT(a) | | Shares | | | Value | |
| |
COMMON STOCKS (25.55%) | | | | | | | | |
Consumer Discretionary (1.77%) | | | | | | | | |
Expedia, Inc. | | | (2,920) | | | | (397,996) | |
Fuji Heavy Industries, Ltd. | | | (3,500) | | | | (137,134) | |
MGM Resorts International | | | (2,100) | | | | (48,699) | |
Wynn Resorts, Ltd. | | | (700) | | | | (48,965) | |
| | | | | | | | |
| | | | | | | (632,794) | |
| | | | | | | | |
| | |
Consumer Staples (0.53%) | | | | | | | | |
Carlsberg A/S - Class B | | | (897) | | | | (73,534) | |
General Mills, Inc. | | | (1,992) | | | | (115,755) | |
| | | | | | | | |
| | | | | | | (189,289) | |
| | | | | | | | |
| | |
Energy (3.83%) | | | | | | | | |
Core Laboratories NV | | | (700) | | | | (81,431) | |
Ensco PLC - Class A | | | (10,000) | | | | (166,300) | |
Helmerich & Payne, Inc. | | | (1,700) | | | | (95,659) | |
National Oilwell Varco, Inc. | | | (4,600) | | | | (173,144) | |
Oil States International, Inc. | | | (2,900) | | | | (87,029) | |
| | | | | | | | |
SCHEDULE OF SECURITIES SOLD
SHORT(a) (continued) | | Shares | | | Value | |
| |
Energy (continued) | | | | | | | | |
Petroleo Brasileiro S.A. - Sponsored ADR | | | (59,100) | | | | $(288,408) | |
Rowan Cos., PLC - A Shares | | | (6,300) | | | | (123,984) | |
Seadrill, Ltd. | | | (9,500) | | | | (61,465) | |
Transocean, Ltd. | | | (18,700) | | | | (296,021) | |
| | | | | | | | |
| | | | | | | (1,373,441) | |
| | | | | | | | |
| | |
Financials (4.84%) | | | | | | | | |
Ally Financial, Inc. | | | (3,900) | | | | (77,688) | |
American Express Co. | | | (4,665) | | | | (341,758) | |
Apollo Global Management LLC - A Shares | | | (14,145) | | | | (258,429) | |
Banco Bilbao Vizcaya Argentaria S.A. - Sponsored ADR | | | (3,500) | | | | (30,170) | |
Banco Santander S.A. - Sponsored ADR | | | (6,300) | | | | (34,902) | |
The Blackstone Group LP | | | (2,800) | | | | (92,568) | |
Cullen/Frost Bankers, Inc. | | | (2,100) | | | | (143,724) | |
Greenhill & Co., Inc. | | | (5,958) | | | | (153,836) | |
Itau Unibanco Holding S.A. - Class H, Sponsored Preferred ADR | | | (42,830) | | | | (293,385) | |
PJT Partners, Inc. - Class A | | | (10) | | | | (215) | |
Seven Bank, Ltd. | | | (36,700) | | | | (168,491) | |
United Overseas Bank, Ltd. | | | (9,400) | | | | (136,414) | |
| | | | | | | | |
| | | | | | | (1,731,580) | |
| | | | | | | | |
| | |
Health Care (3.72%) | | | | | | | | |
AbbVie, Inc. | | | (2,200) | | | | (131,010) | |
Aetna, Inc. | | | (945) | | | | (108,467) | |
AmerisourceBergen Corp. | | | (875) | | | | (84,446) | |
Anacor Pharmaceuticals, Inc. | | | (620) | | | | (69,694) | |
ANI Pharmaceuticals, Inc. | | | (4,000) | | | | (167,360) | |
Bruker Corp. | | | (5,100) | | | | (93,687) | |
DaVita HealthCare Partners, Inc. | | | (1,290) | | | | (99,988) | |
Eagle Pharmaceuticals, Inc. | | | (2,279) | | | | (145,195) | |
Express Scripts Holding Co. | | | (1,200) | | | | (103,656) | |
UnitedHealth Group, Inc. | | | (1,864) | | | | (219,542) | |
Varian Medical Systems, Inc. | | | (1,410) | | | | (110,728) | |
| | | | | | | | |
| | | | | | | (1,333,773) | |
| | | | | | | | |
| | |
Industrials (7.65%) | | | | | | | | |
Air France-KLM | | | (20,959) | | | | (153,750) | |
Alfa Laval AB | | | (5,847) | | | | (102,862) | |
American Airlines Group, Inc. | | | (2,660) | | | | (122,945) | |
Caterpillar, Inc. | | | (5,020) | | | | (366,410) | |
Chicago Bridge & Iron Co. NV | | | (4,500) | | | | (201,915) | |
Cummins, Inc. | | | (700) | | | | (72,457) | |
Deutsche Lufthansa AG | | | (13,982) | | | | (206,490) | |
Emerson Electric Co., Inc. | | | (3,800) | | | | (179,474) | |
Flowserve Corp. | | | (4,200) | | | | (194,712) | |
International Consolidated Airlines Group S.A. | | | (19,559) | | | | (175,637) | |
| | |
Annual Report | October 31, 2015 | | 11 |
| | |
Clough Global Long/Short Fund | | Statement of Investments |
| | October 31, 2015 |
| | | | | | | | |
SCHEDULE OF SECURITIES SOLD
SHORT(a) (continued) | | Shares | | | Value | |
| |
Industrials (continued) | | | | | | | | |
Keppel Corp., Ltd. | | | (20,100) | | | | $(101,583) | |
Kone OYJ, B Shares | | | (1,806) | | | | (77,175) | |
Kuehne + Nagel International AG | | | (693) | | | | (96,121) | |
Metso OYJ | | | (6,900) | | | | (168,975) | |
Pentair PLC | | | (3,100) | | | | (173,352) | |
Sandvik AB | | | (7,968) | | | | (74,517) | |
Triumph Group, Inc. | | | (2,100) | | | | (97,818) | |
WW Grainger, Inc. | | | (818) | | | | (171,780) | |
| | | | | | | | |
| | | | | | | (2,737,973) | |
| | | | | | | | |
| | |
Information Technology (2.32%) | | | | | | | | |
Corning, Inc. | | | (3,700) | | | | (68,820) | |
International Business Machines Corp. | | | (850) | | | | (119,068) | |
Knowles Corp. | | | (4,700) | | | | (78,302) | |
Nippon Electric Glass Co., Ltd. | | | (35,000) | | | | (173,158) | |
Taiwan Semiconductor Manufacturing Co., Ltd. - Sponsored ADR | | | (13,200) | | | | (289,872) | |
Tech Data Corp. | | | (1,400) | | | | (101,906) | |
| | | | | | | | |
| | | | | | | (831,126) | |
| | | | | | | | |
| | |
Materials (0.40%) | | | | | | | | |
Cliffs Natural Resources, Inc. | | | (8,400) | | | | (23,184) | |
Vale S.A. - Sponsored ADR | | | (27,795) | | | | (121,186) | |
| | | | | | | | |
| | | | | | | (144,370) | |
| | | | | | | | |
| | |
Real Estate (0.19%) | | | | | | | | |
China Resources Land, Ltd. | | | (26,000) | | | | (67,930) | |
| | | | | | | | |
| | |
Utilities (0.30%) | | | | | | | | |
Hong Kong & China Gas Co., Ltd. | | | (52,700) | | | | (107,024) | |
| | | | | | | | |
| | |
TOTAL COMMON STOCKS (Proceeds $8,776,334) | | | | | | | (9,149,300) | |
| | | | | | | | |
| | |
EXCHANGE TRADED FUNDS (4.06%) | | | | | | | | |
iShares® MSCI Brazil Capped ETF | | | (2,100) | | | | (48,027) | |
iShares® MSCI Emerging Markets ETF | | | (3,500) | | | | (122,045) | |
iShares® MSCI Indonesia ETF | | | (9,200) | | | | (185,380) | |
iShares® MSCI Japan Index ETF | | | (15,100) | | | | (186,032) | |
iShares® MSCI Malaysia ETF | | | (9,900) | | | | (101,871) | |
iShares® MSCI South Korea Capped ETF | | | (3,900) | | | | (212,082) | |
iShares® MSCI Thailand Capped ETF | | | (3,614) | | | | (235,524) | |
Market Vectors® Oil Service ETF | | | (6,000) | | | | (183,420) | |
Market Vectors® Semiconductor ETF | | | (3,300) | | | | (178,893) | |
| | | | | | | | |
| | |
TOTAL EXCHANGE TRADED FUNDS (Proceeds $1,456,334) | | | | | | | (1,453,274) | |
| | | | | | | | |
| | | | | | | | |
SCHEDULE OF SECURITIES SOLD
SHORT(a) (continued) | | Shares | | | Value | |
| |
EXCHANGE TRADED FUNDS (continued) | | | | | |
PREFERRED STOCKS (0.51%) | | | | | | | | |
Financials (0.51%) | | | | | | | | |
Banco Bradesco S.A. - ADR | | | (33,820) | | | | (183,981) | |
| | | | | | | | |
| | |
TOTAL PREFERRED STOCKS (Proceeds $198,760) | | | | | | | $(183,981) | |
| | | | | | | | |
| | |
TOTAL SECURITIES SOLD SHORT (Proceeds $10,431,428) | | | | | | | $(10,786,555) | |
| | | | | | | | |
| (a) | Non-income producing security. |
| (b) | Pledged security; a portion or all of the security is pledged as collateral for total return swap contracts and securities sold short. As of October 31, 2015, the aggregate market value of those securities was $6,016,900 representing 16.80% of net assets. (See Note 1) |
| (c) | Fair valued security; valued by management in accordance with procedures approved by the Fund’s Board of Trustees. As of October 31, 2015, these securities had an aggregate market value of $20,182 or 0.06% of total net assets. |
| (d) | Includes cash which is being held as collateral for futures contracts. |
| | |
Clough Global Long/Short Fund | | Statement of Investments |
| | October 31, 2015 |
FUTURES CONTRACTS
| | | | | | | | | | | | | | | | | | | | |
| Description | | Position | | | | Contracts | | | | Expiration
Date | | | Underlying Face
Amount at Value | | | Unrealized
Appreciation | |
| |
Foreign Currency Contracts | | | | | | | | | | | | | | | | | | | | |
Japenese Yen Currency Future | | Short | | | | 28 | | | | | 12/15/2015 | | | $ | (1,450,400 | ) | | $ | 8,524 | |
| | | | | | | | | | | | | | | | |
| | | | | | | | | | | | | | $ | (1,450,400 | ) | | $ | 8,524 | |
| | | | | | | | | | | | | | | | |
TOTAL RETURN SWAP CONTRACTS
| | | | | | | | | | | | | | | | | | | | | | |
| Counter Party | | Reference
Entity/Obligation | | Notional
Amount | | | Floating Rate
Paid by the Fund | | | Floating
Rate Index | | | Termination
Date | | | Net Unrealized
Appreciation | |
| |
Morgan Stanley | | Catcher Technology Co., Ltd. | | $ | (91,172 | ) | | | 150 bps - 1D FEDEF | | | | 1D FEDEF | | | | 03/09/2017 | | | $ | 2,457 | |
| |
| | | | $ | (91,172 | ) | | | | | | | | | | | | | | $ | 2,457 | |
| |
Abbreviations:
1D FEDEF - Federal Funds Effective Rate (Daily)
AB - Aktiebolag is the Swedish equivalent of the term corporation
ADR - American Depositary Receipt
AG - Aktiengesellschaft is a German term that refers to a corporation that is limited by shares, i.e., owned by shareholders
A/S - Aktieselskab, Joint Stock Company in Denmark
bps - Basis Points
ETF - Exchange Traded Fund
LLC - Limited Liability Corporation
LP - Limited Partnership
Ltd. - Limited
MSCI - Morgan Stanley Capital International
NV - Naamloze Vennootschap (Dutch: Limited Liability Company)
OYJ - Osakeyhtio is the Finnish equivalent of a public limited company.
PLC - Public Limited Company
S.A. - Generally designates corporations in various countries, mostly those employing the civil law.
SpA - Societa` Per Azioni is an Italian shared company
For Fund compliance purposes, each Fund’s sector classifications refer to any one of the sector sub-classifications used by one or more widely recognized market indexes, and/or as defined by each Fund’s management. This definition may not apply for purposes of this report, which may combine industry sub-classifications for reporting ease. Sectors are shown as a percent of net assets. These sector classifications are unaudited.
See Notes to the Financial Statements.
| | |
Annual Report | October 31, 2015 | | 13 |
| | |
Clough Global Long/Short Fund | | Statement of Assets and Liabilities |
| | October 31, 2015 |
| | | | |
ASSETS: | | | | |
| |
Investments, at value (Cost - see below) | | $ | 35,901,663 | |
Foreign Currency, at value (Cost $2,677) | | | 2,685 | |
Deposit with broker for futures contracts | | | 46,113 | |
Deposit with broker for securities sold short | | | 10,072,012 | |
Unrealized appreciation on total return swap contracts | | | 2,457 | |
Dividends receivable | | | 6,689 | |
Interest receivable | | | 41 | |
Receivable for investments sold | | | 1,487,881 | |
Receivable for shares sold | | | 9 | |
Prepaid expenses and other assets | | | 97,970 | |
Total Assets | | | 47,617,520 | |
| |
LIABILITIES: | | | | |
| |
Variation margin payable | | | 4,900 | |
Securities sold short (Proceeds $10,431,428) | | | 10,786,555 | |
Payable for investments purchased | | | 916,774 | |
Dividends payable - short sales | | | 9,828 | |
Interest payable - margin account | | | 8,112 | |
Distribution and service fees | | | 30 | |
Accrued legal expense | | | 10,192 | |
Accrued administration fee | | | 4,336 | |
Accrued trustees fee | | | 5,333 | |
Other payables and accrued expenses | | | 59,328 | |
Total Liabilities | | | 11,805,388 | |
Net Assets | | $ | 35,812,132 | |
| | | | | |
Cost of Investments | | $ | 34,844,802 | |
| | | | | |
| |
| COMPOSITION OF NET ASSETS: | | | | |
| |
Paid-in capital | | $ | 35,139,162 | |
Accumulated net investment loss | | | (2,644) | |
Accumulated net realized loss on investment securities, futures contracts, securities sold short, total return swap contracts and foreign currency transactions | | | (37,079) | |
Net unrealized appreciation in value of investment securities, futures contracts, securities sold short, total return swap contracts and translation of assets and liabilities denominated in foreign currency | | | 712,693 | |
Net Assets | | $ | 35,812,132 | |
| | | | | |
PRICING OF CLASS A SHARES: | | | | |
Net Assets | | $ | 26,774 | |
Shares outstanding of no par value, unlimited shares authorized | | | 2,600 | |
Net Asset Value, offering and redemption price per share | | $ | 10.30 | |
| | | | | |
Maximum offering price per share (NAV/0.9425), based on maximum sales charge of 5.75% of the offering price | | $ | 10.93 | |
| | | | | |
PRICING OF CLASS C SHARES: | | | | |
Net Assets | | $ | 25,739 | |
Shares outstanding of no par value, unlimited shares authorized | | | 2,500 | |
Net Asset Value, offering and redemption price per share | | $ | 10.30 | |
| | | | | |
PRICING OF CLASS I SHARES: | | | | |
Net Assets | | $ | 35,759,619 | |
Shares outstanding of no par value, unlimited shares authorized | | | 3,472,903 | |
| | | | | |
Net Asset Value, offering and redemption price per share | | $ | 10.30 | |
See Notes to the Financial Statements.
| | |
Clough Global Long/Short Fund | | Statement of Operations |
| | For the period ended October 31, 2015 (a) |
| | | | |
INVESTMENT INCOME: | | | | |
| |
Dividends (net of foreign withholding taxes of $3) | | $ | 16,739 | |
Total Income | | | 16,739 | |
| |
EXPENSES: | | | | |
| |
Investment advisory fee | | | 34,010 | |
Distribution and shareholder service fees: | | | | |
Class A | | | 8 | |
Class C | | | 22 | |
Administration fee | | | 4,336 | |
Interest expense - margin account | | | 8,109 | |
Trustees fee | | | 5,333 | |
Dividend expense - short sales | | | 10,040 | |
Custody | | | 2,917 | |
Audit & Tax Services | | | 43,000 | |
Legal | | | 10,192 | |
Offering costs | | | 10,316 | |
Printing | | | 5,500 | |
Insurance | | | 2,202 | |
Transfer agent | | | 1,750 | |
Other expenses | | | 3,958 | |
Total Expenses Before Waivers and/or Reimbursements | | | 141,693 | |
Less fees waived and/or reimbursed by Adviser: | | | | |
Class A | | | (85) | |
Class C | | | (82) | |
Class I | | | (83,042) | |
Net Expenses | | | 58,484 | |
Net Investment Loss | | | (41,745) | |
| |
NET REALIZED GAIN/(LOSS) ON: | | | | |
Investment securities | | | 174,140 | |
Securities sold short | | | (153,665) | |
Total return swap contracts | | | (3) | |
Foreign currency transactions | | | (169) | |
NET CHANGE IN UNREALIZED APPRECIATION/(DEPRECIATION) ON: | | | | |
Investment securities | | | 1,056,861 | |
Futures contracts | | | 8,524 | |
Securities sold short | | | (355,127) | |
Total return swap contracts | | | 2,457 | |
Translation of assets and liabilities denominated in foreign currencies | | | (22) | |
Net realized and unrealized gain | | | 732,996 | |
Net Increase in Net Assets from Operations | | $ | 691,251 | |
| | | | | |
| (a) | Commencement of Operations September 30, 2015. |
See Notes to the Financial Statements.
| | |
Annual Report | October 31, 2015 | | 15 |
| | |
Clough Global Long/Short Fund | | Statement of Changes in Net Assets |
| | |
| | | | |
| | | For the Period Ended October 31, 2015 (a) | |
OPERATIONS: | | | | |
| |
Net investment loss | | $ | (41,745) | |
Net realized gain/(loss) from: | | | | |
Investment securities | | | 174,140 | |
Securities sold short | | | (153,665) | |
Total return swap contracts | | | (3) | |
Foreign currency transactions | | | (169) | |
Net change in urealized appreciation/(depreciation) on: | | | | |
Investment securities | | | 1,056,861 | |
Futures contracts | | | 8,524 | |
Securities sold short | | | (355,127) | |
Total return swap contracts | | | 2,457 | |
Translation of assets and liabilities denominated in foreign currencies | | | (22) | |
Net Increase in Net Assets From Operations | | | 691,251 | |
| |
CAPITAL SHARE TRANSACTIONS: | | | | |
Class A | | | | |
Proceeds from shares sold/proceeds from subscription in-kind | | | 25,994 | |
Net Increase in Net Assets From Class A Capital Share Transactions | | | 25,994 | |
| |
Class C | | | | |
Proceeds from shares sold | | | 25,000 | |
Net Increase in Net Assets From Class C Capital Share Transactions | | | 25,000 | |
| |
Class I | | | | |
Proceeds from shares sold/proceeds from subscription in-kind | | | 35,069,887 | |
Net Increase in Net Assets From Class I Capital Share Transactions | | | 35,069,887 | |
| |
Total Increase in Net Assets | | $ | 35,812,132 | |
| |
NET ASSETS: | | | | |
Beginning of period | | | – | |
End of period* | | $ | 35,812,132 | |
| | | | | |
*Includes accumulated net investment loss of: | | $ | (2,644) | |
| | | | | |
| (a) | Commencement of Operations September 30, 2015. |
See Notes to the Financial Statements.
| | |
Clough Global Long/Short Fund – Class A | | Financial Highlights |
| | For a share outstanding throughout the period indicated |
| | | | | |
| | | For the Period
September 30, 2015
(commencement) to
October 31, 2015 |
PER SHARE OPERATING PERFORMANCE: | | | | | |
NET ASSET VALUE, BEGINNING OF PERIOD | | | $ | 10.00 | |
INCOME/(LOSS) FROM OPERATIONS: | | | | | |
Net investment loss(a) | | | | (0.02) | |
Net realized and unrealized gain on investments | | | | 0.32 | |
Total from Investment Operations | | | | 0.30 | |
| |
Net asset value - end of period | | | $ | 10.30 | |
| | | | | | |
| |
Total Investment Return - Net Asset Value(b) | | | | 3.00 | % |
| |
RATIOS AND SUPPLEMENTAL DATA: | | | | | |
Net assets attributable to common shares, end of period (in 000s) | | | $ | 27 | |
| |
RATIOS TO AVERAGE NET ASSETS (including interest expense and dividend expense on securities sold short) | | | | | |
Operating expenses excluding fee waivers/reimbursements(c) | | | | 6.44 | %(d) |
Operating expenses including fee waivers/reimbursements(c) | | | | 2.67 | %(d) |
Net investment loss including fee waivers/reimbursements(c) | | | | (2.00) | %(d) |
RATIOS TO AVERAGE NET ASSETS (excluding interest expense and dividend expense on securities sold short) | | | | | |
Operating expenses excluding fee waivers/reimbursements(c) | | | | 5.72 | %(d) |
Operating expenses including fee waivers/reimbursements(c) | | | | 1.95 | %(d) |
Net investment loss including fee waivers/reimbursements(c) | | | | (1.28) | %(d) |
| |
PORTFOLIO TURNOVER RATE(e) | | | | 22 | % |
| (a) | Per share amounts are based upon average shares outstanding. |
| (b) | Total return is for the period indicated and has not been annualized. The total return would have been lower had certain expenses not been waived / reimbursed during the period. The return shown does not reflect the deduction of taxes that a shareholder would pay on Fund distributions or the redemption of Fund shares. |
| (c) | Expense ratios before reductions for startup periods may not be representative of longer term operating periods. |
| (e) | Portfolio turnover rate for periods less than one full year have not been annualized and is calculated at the fund level. |
See Notes to the Financial Statements.
| | |
Annual Report | October 31, 2015 | | 17 |
| | |
Clough Global Long/Short Fund – Class C | | Financial Highlights |
| | For a share outstanding throughout the period indicated |
| | | | | |
| | | For the Period
September 30, 2015
(commencement) to
October 31, 2015 |
PER SHARE OPERATING PERFORMANCE: | | | | | |
NET ASSET VALUE, BEGINNING OF PERIOD | | | $ | 10.00 | |
INCOME/(LOSS) FROM OPERATIONS: | | | | | |
Net investment loss(a) | | | | (0.02) | |
Net realized and unrealized gain on investments | | | | 0.32 | |
Total from Investment Operations | | | | 0.30 | |
| |
Net asset value - end of period | | | $ | 10.30 | |
| | | | | | |
| |
Total Investment Return - Net Asset Value(b) | | | | 3.00 | % |
| |
RATIOS AND SUPPLEMENTAL DATA: | | | | | |
Net assets attributable to common shares, end of period (in 000s) | | | $ | 26 | |
| |
RATIOS TO AVERAGE NET ASSETS (including interest expense and dividend expense on securities sold short) | | | | | |
Operating expenses excluding fee waivers/reimbursements(c) | | | | 7.09 | %(d) |
Operating expenses including fee waivers/reimbursements(c) | | | | 3.32 | %(d) |
Net investment loss including fee waivers/reimbursements(c) | | | | (2.66) | %(d) |
RATIOS TO AVERAGE NET ASSETS (excluding interest expense and dividend expense on securities sold short) | | | | | |
Operating expenses excluding fee waivers/reimbursements(c) | | | | 6.37 | %(d) |
Operating expenses including fee waivers/reimbursements(c) | | | | 2.60 | %(d) |
Net investment loss including fee waivers/reimbursements(c) | | | | (1.94) | %(d) |
| |
PORTFOLIO TURNOVER RATE(e) | | | | 22 | % |
| (a) | Per share amounts are based upon average shares outstanding. |
| (b) | Total return is for the period indicated and has not been annualized. The total return would have been lower had certain expenses not been waived / reimbursed during the period. The return shown does not reflect the deduction of taxes that a shareholder would pay on Fund distributions or the redemption of Fund shares. |
| (c) | Expense ratios before reductions for startup periods may not be representative of longer term operating periods. |
| (e) | Portfolio turnover rate for periods less than one full year have not been annualized and is calculated at the fund level. |
See Notes to the Financial Statements.
| | |
Clough Global Long/Short Fund – Class I | | Financial Highlights |
| | For a share outstanding throughout the period indicated |
| | | | | |
| | | For the Period September 30, 2015
(commencement) to
October 31, 2015 |
PER SHARE OPERATING PERFORMANCE: | | | | | |
NET ASSET VALUE, BEGINNING OF PERIOD | | | $ | 10.00 | |
INCOME/(LOSS) FROM OPERATIONS: | | | | | |
Net investment loss(a) | | | | (0.01) | |
Net realized and unrealized gain on investments | | | | 0.31 | |
Total from Investment Operations | | | | 0.30 | |
| |
Net asset value - end of period | | | $ | 10.30 | |
| | | | | | |
| |
Total Investment Return - Net Asset Value(b) | | | | 3.00 | % |
| |
RATIOS AND SUPPLEMENTAL DATA: | | | | | |
Net assets attributable to common shares, end of period (in 000s) | | | $ | 35,760 | |
| |
RATIOS TO AVERAGE NET ASSETS (including interest expense and dividend expense on securities sold short) | | | | | |
Operating expenses excluding fee waivers/reimbursements(c) | | | | 5.62 | %(d) |
Operating expenses including fee waivers/reimbursements(c) | | | | 2.32 | %(d) |
Net investment loss including fee waivers/reimbursements(c) | | | | (1.66) | %(d) |
RATIOS TO AVERAGE NET ASSETS (excluding interest expense and dividend expense on securities sold short) | | | | | |
Operating expenses excluding fee waivers/reimbursements(c) | | | | 4.90 | %(d) |
Operating expenses including fee waivers/reimbursements(c) | | | | 1.60 | %(d) |
Net investment loss including fee waivers/reimbursements(c) | | | | (0.94) | %(d) |
| |
PORTFOLIO TURNOVER RATE(e) | | | | 22 | % |
| (a) | Per share amounts are based upon average shares outstanding. |
| (b) | Total return is for the period indicated and has not been annualized. The total return would have been lower had certain expenses not been waived / reimbursed during the period. The return shown does not reflect the deduction of taxes that a shareholder would pay on Fund distributions or the redemption of Fund shares. |
| (c) | Expense ratios before reductions for startup periods may not be representative of longer term operating periods. |
| (e) | Portfolio turnover rate for periods less than one full year have not been annualized and is calculated at the fund level. |
See Notes to the Financial Statements.
| | |
Annual Report | October 31, 2015 | | 19 |
| | |
Clough Global Long/Short Fund | | Notes to Financial Statements |
| | October 31, 2015 |
1. ORGANIZATION AND SIGNIFICANT ACCOUNTING AND OPERATING POLICIES
The Clough Funds Trust (the “Trust”) is an open-end management investment company registered under the Investment Company Act of 1940, as amended (the “1940 Act”). The Trust was organized under the laws of the state of Delaware on March 17, 2015. The Trust currently offers shares of beneficial interest (“shares”) of the Fund. The Fund’s commencement date is September 30, 2015. The Fund is a diversified investment company with an investment objective to seek to provide long-term capital appreciation. The Fund currently offers three Classes of shares: Classes A, C and I. Each share class of the Fund represents an investment in the same portfolio of securities, but each share class has its own expense structure. As of October 31, 2015, over 99% of the Fund is owned by two shareholders, one of whom is an affiliated party that owns 28% of the Fund. The Board of Trustees (the “Board”) may establish additional funds and classes of shares at any time in the future without shareholder approval.
The following is a summary of significant accounting policies followed by the Fund. These policies are in conformity with U.S. generally accepted accounting principles (“GAAP”). The preparation of financial statements in accordance with GAAP requires management to make estimates and assumptions that affect the reported amounts and disclosures in the financial statements during the reporting period. Management believes the estimates and security valuations are appropriate; however, actual results may differ from those estimates, and the security valuations reflected in the financial statements may differ from the value the Fund ultimately realizes upon sale of the securities. The Fund is considered an investment company for financial reporting purposes under GAAP.
The net asset value per share of the Fund is determined no less frequently than daily, on each day that the New York Stock Exchange (“NYSE” or the “Exchange”) is open for trading, as of the close of regular trading on the Exchange (normally 4:00 p.m. New York time). Trading may take place in foreign issues held by the Fund at times when a Fund is not open for business. As a result, each Fund’s net asset value may change at times when it is not possible to purchase or sell shares of the Fund.
Investment Valuation: Securities held by the Fund for which exchange quotations are readily available are valued at the last sale price, or if no sale price or if traded on the over-the-counter market, at the mean of the bid and asked prices on such day. Most securities listed on a foreign exchange are valued at the last sale price at the close of the exchange on which the security is primarily traded. In certain countries market maker prices are used since they are the most representative of the daily trading activity. Market maker prices are usually the mean between the bid and ask prices. Certain markets are not closed at the time that the Fund prices its portfolio securities. In these situations, snapshot prices are provided by the individual pricing services or other alternate sources at the close of the NYSE as appropriate. Securities not traded on a particular day are valued at the mean between the last reported bid and the asked quotes, or the last sale price when appropriate; otherwise fair value will be determined by the board-appointed fair valuation committee. Debt securities for which the over-the-counter market is the primary market are normally valued on the basis of prices furnished by one or more pricing services or dealers at the mean between the latest available bid and asked prices. As authorized by the Board of Trustees, debt securities (including short-term obligations that will mature in 60 days or less) may be valued on the basis of valuations furnished by a pricing service which determines valuations based upon market transactions for normal, institutional-size trading units of securities or a matrix method which considers yield or price of comparable bonds provided by a pricing service. Total return swaps are priced based on valuations provided by a Board approved independent third party pricing agent. If a total return swap price cannot be obtained from an independent third party pricing agent the Fund shall seek to obtain a bid price from at least one independent and/or executing broker.
If the price of a security is unavailable in accordance with the aforementioned pricing procedures, or the price of a security is unreliable, e.g., due to the occurrence of a significant event, the security may be valued at its fair value determined by management pursuant to procedures adopted by the Board of Trustees. For this purpose, fair value is the price that the Fund reasonably expects to receive on a current sale of the security. Due to the number of variables affecting the price of a security, however; it is possible that the fair value of a security may not accurately reflect the price that the Fund could actually receive on a sale of the security.
A three-tier hierarchy has been established to classify fair value measurements for disclosure purposes. Inputs refer broadly to the assumptions that market participants would use in pricing the asset or liability, including assumptions about risk. Inputs may be observable or unobservable. Observable inputs are inputs that reflect the assumptions market participants would use in pricing the asset or liability that are developed based on market data obtained from sources independent of the reporting entity. Unobservable inputs are inputs that reflect the reporting entity’s own assumptions about the assumptions market participants would use in pricing the asset or liability that are developed based on the best information available.
| | |
Clough Global Long/Short Fund | | Notes to Financial Statements |
| | October 31, 2015 |
Various inputs are used in determining the value of the Fund’s investments as of the reporting period end. These inputs are categorized in the following hierarchy under applicable financial accounting standards:
| | | | |
Level 1 | | – | | Unadjusted quoted prices in active markets for identical, unrestricted assets or liabilities that a Fund has the ability to access at the measurement date; |
Level 2 | | – | | Quoted prices which are not active, quoted prices for similar assets or liabilities in active markets or inputs other than quoted prices that are observable (either directly or indirectly) for substantially the full term of the asset or liability; and |
Level 3 | | – | | Significant unobservable prices or inputs (including the Fund’s own assumptions in determining the fair value of investments) where there is little or no market activity for the asset or liability at the measurement date. |
The following is a summary of the inputs used as of October 31, 2015, in valuing the Fund’s investments carried at value. The Fund recognizes transfers between the levels as of the end of the period in which the transfer occurred. There were no transfers between Levels 1 and 2 during the period ended October 31, 2015.
Clough Global Long/Short Fund
| | | | | | | | | | | | | | | | | | |
| Investments in Securities at Value* | | Level 1 | | | Level 2 | | | Level 3 | | | Total | | | |
|
Common Stocks | | $ | 27,525,240 | | | $ | – | | | $ | – | | | $ | 27,525,240 | | | |
Exchange Traded Funds | | | 1,298,351 | | | | – | | | | – | | | | 1,298,351 | | | |
Participation Notes | | | – | | | | 680,059 | | | | – | | | | 680,059 | | | |
Short-Term Investments | | | 6,398,013 | | | | – | | | | – | | | | 6,398,013 | | | |
|
TOTAL | | $ | 35,221,604 | | | $ | 680,059 | | | $ | – | | | $ | 35,901,663 | | | |
|
| | | | | |
Other Financial Instruments | | | | | | | | | | | | | | | | | | |
|
Assets | | | | | | | | | | | | | | | | | | |
Futures Contracts** | | $ | 8,524 | | | $ | – | | | $ | – | | | $ | 8,524 | | | |
| | | | | |
Total Return Swap Contracts** | | | – | | | | 2,457 | | | | – | | | | 2,457 | | | |
| | | | | |
Liabilities | | | | | | | | | | | | | | | | | | |
Securities Sold Short | | | | | | | | | | | | | | | | | | |
Common Stocks | | | (9,149,300 | ) | | | – | | | | – | | | | (9,149,300 | ) | | |
Exchange Traded Funds | | | (1,453,274 | ) | | | – | | | | – | | | | (1,453,274 | ) | | |
Preferred Stocks | | | (183,981 | ) | | | – | | | | – | | | | (183,981 | ) | | |
|
TOTAL | | $ | (10,778,031 | ) | | $ | 2,457 | | | $ | – | | | $ | (10,775,574 | ) | | |
|
| * | For detailed industry descriptions, see the accompanying Statement of Investments. |
| ** | Swap contracts and futures contracts are reported at their unrealized appreciation/(depreciation) at measurement date, which represents the change in the contract’s value from trade date. |
In the event a Board approved independent pricing service is unable to provide an evaluated price for a security or Clough Capital believes the price provided is not reliable, securities of the Fund may be valued at fair value as described above. In these instances the Adviser may seek to find an alternative independent source, such as a broker/dealer to provide a price quote, or by using evaluated pricing models similar to the techniques and models used by the independent pricing service. These fair value measurement techniques may utilize unobservable inputs (Level 3).
On a monthly basis, the Fair Value Committee of the Fund meets and discusses securities that have been fair valued during the preceding month in accordance with the Fund’s Fair Value Procedures and reports quarterly to the Board of Trustees on the results of those meetings.
For the period ended October 31, 2015, the Fund did not have significant unobservable inputs (Level 3) used in determining fair value. Therefore, a reconciliation of assets in which significant unobservable inputs (Level 3) were used in determining fair value is not applicable.
Offering Costs: The Fund incurred offering costs during the period ended October 31, 2015. These offering costs, including fees for printing initial prospectuses, legal and registration fees, were amortized over the first twelve months from the inception date of the Fund. Amount amortized during the period ended October 31, 2015 is shown on the Fund’s Statement of Operations. The remaining amount to be amortized, $46,600, is included in Prepaid expenses and other assets on the Fund’s Statement of Assets and Liabilities.
| | |
Annual Report | October 31, 2015 | | 21 |
| | |
Clough Global Long/Short Fund | | Notes to Financial Statements |
| | October 31, 2015 |
Class Expenses: Expenses that are specific to a class of shares are charged directly to that share class. Fees provided under the distribution (Rule 12b-1) and/or shareholder service plans for a particular class of the Fund are charged to the operations of such class.
Income Taxes: The Fund’s policy is to comply with the provisions of the Internal Revenue Code applicable to regulated investment companies and to distribute all of its taxable income to its shareholders. Therefore, no federal income tax provision is required. As of and during the period ended October 31, 2015, the Fund did not have a liability for any unrecognized tax benefits. The Fund plans to file U.S. Federal and various state and local tax returns as required. The Fund’s tax returns are subject to examination by the relevant tax authorities until expiration of the applicable statute of limitations, which is generally three years after the filing of the tax return but which can be extended to six years in certain circumstances. Tax returns for open years have incorporated no uncertain tax positions that require a provision for income taxes.
Distributions to Shareholders: The Fund normally pays dividends on an annual basis. Any net capital gains earned by the Fund are distributed annually. Distributions to shareholders are recorded by the Fund on the ex-dividend date.
Securities Transactions and Investment Income: Investment security transactions are accounted for on a trade date basis. Dividend income and dividend expense-short sales are recorded on the ex-dividend date. Certain dividend income from foreign securities will be recorded, in the exercise of reasonable diligence, as soon as a Fund is informed of the dividend if such information is obtained subsequent to the ex-dividend date and may be subject to withholding taxes in these jurisdictions. Interest income, which includes amortization of premium and accretion of discount, is recorded on the accrual basis. Realized gains and losses from securities transactions and unrealized appreciation and depreciation of securities are determined using the identified cost basis for both financial reporting and income tax purposes. All of the realized and unrealized gains and losses and net investment income, other than class specific expenses, are allocated daily to each class in proportion to its average daily net assets.
Foreign Securities: The Fund may invest a portion of its assets in foreign securities. In the event that the Fund executes a foreign security transaction, the Fund will generally enter into a foreign currency spot contract to settle the foreign security transaction. Foreign securities may carry more risk than U.S. securities, such as political, market and currency risks.
The accounting records of the Fund are maintained in U.S. dollars. Prices of securities denominated in foreign currencies are translated into U.S. dollars at the closing rates of exchange at period end. Amounts related to the purchase and sale of foreign securities and investment income are translated at the rates of exchange prevailing on the respective dates of such transactions.
The effect of changes in foreign currency exchange rates on investments is reported with investment securities realized and unrealized gains and losses in the Fund’s Statement of Operations.
A foreign currency spot contract is a commitment to purchase or sell a foreign currency at a future date, at a negotiated rate. The Fund may enter into foreign currency spot contracts to settle specific purchases or sales of securities denominated in a foreign currency and for protection from adverse exchange rate fluctuation. Risks to the Fund include the potential inability of the counterparty to meet the terms of the contract.
The net U.S. dollar value of foreign currency underlying all contractual commitments held by the Fund and the resulting unrealized appreciation or depreciation are determined using prevailing forward foreign currency exchange rates. Unrealized appreciation and depreciation on foreign currency spot contracts are reported in the Fund’s Statements of Assets and Liabilities as a receivable or a payable and in the Fund’s Statement of Operations with the change in unrealized appreciation or depreciation on translation of assets and liabilities denominated in foreign currencies. These spot contracts are used by the broker to settle investments denominated in foreign currencies.
The Fund may realize a gain or loss upon the closing or settlement of the foreign transaction, excluding investment securities. Such realized gains and losses are reported with all other foreign currency gains and losses in the Statement of Operations.
Short Sales: The Fund may sell a security it does not own in anticipation of a decline in the fair value of that security. When the Fund sells a security short, it must borrow the security sold short and deliver it to the broker-dealer through which it made the short sale. A gain, limited to the price at which a Fund sold the security short, or a loss, unlimited in size, will be recognized upon the termination of the short sale.
The Fund’s obligation to replace the borrowed security will be secured by collateral deposited with the broker-dealer, usually cash, U.S. government securities or other liquid securities. The Fund will also be required to designate on its books and records similar collateral with its custodian to the extent, if any, necessary so that the aggregate collateral value is at all times at least equal to the current market value of the security sold short. The cash amount is reported on the Statement of Assets and Liabilities as Deposit with broker for securities sold short which is held with one counterparty. The Fund is obligated to pay interest to the broker for any debit balance of the margin account relating to short sales. The interest incurred by the Fund is reported on the Statement of Operations as Interest expense – margin account. Interest amounts payable are reported on the Statement of Assets and Liabilities as Interest payable – margin account.
| | |
Clough Global Long/Short Fund | | Notes to Financial Statements |
| | October 31, 2015 |
The Fund may also sell a security short if it owns at least an equal amount of the security sold short or another security convertible or exchangeable for an equal amount of the security sold short without payment of further compensation (a short sale against-the-box). In a short sale against-the-box, the short seller is exposed to the risk of being forced to deliver stock that it holds to close the position if the borrowed stock is called in by the lender, which would cause gain or loss to be recognized on the delivered stock. The Fund expects normally to close its short sales against-the-box by delivering newly acquired stock. Since the Fund intends to hold securities sold short for the short term, these securities are excluded from the purchases and sales of investment securities in Note 4 and the Fund’s Portfolio Turnover in the Financial Highlights.
Derivative Instruments and Hedging Activities: The following discloses the Fund’s use of derivative instruments and hedging activities.
The Fund’s investment objective not only permits the Fund to purchase investment securities, it also allows the Fund to enter into various types of derivative contracts, including, but not limited to, forward foreign currency contracts, futures, options and swaps. The Fund may use derivatives, among other reasons, as part of the Fund’s investment strategy, to attempt to employ its currency strategies, to seek to hedge against foreign exchange risk, and to gain access to foreign markets.
Risk of Investing in Derivatives: The Fund’s use of derivatives can result in losses due to unanticipated changes in the market risk factors and the overall market. In instances where the Fund is using derivatives to decrease or hedge exposures to market risk factors for securities held by the Fund, there are also risks that those derivatives may not perform as expected, resulting in losses for the combined or hedged positions.
Derivatives may have little or no initial cash investment relative to their market value exposure and therefore can produce significant gains or losses in excess of their cost. This use of embedded leverage allows the Fund to increase its market value exposure relative to its net assets and can substantially increase the volatility of the Fund’s performance.
Additional associated risks from investing in derivatives also exist and potentially could have significant effects on the valuation of the derivative and the Fund. Typically, the associated risks are not the risks that the Fund is attempting to increase or decrease exposure to its investment objective, but the additional risks from investing in derivatives. Associated risks can be different for each type of derivative and are discussed by each derivative type in the notes that follow.
Examples of these associated risks are liquidity risk, which is the risk that the Fund will not be able to sell the derivative in the open market in a timely manner, and counterparty credit risk, which is the risk that the counterparty will not fulfill its obligation to the Fund.
Market Risk Factors: In addition, in pursuit of its investment objectives, the Fund may seek to use derivatives, which may increase or decrease exposure to the following market risk factors:
Equity Risk: Equity risk relates to the change in value of equity securities as they relate to increases or decreases in the general market.
Foreign Exchange Rate Risk: Foreign exchange rate risk relates to the change in the U.S. dollar value of a security held that is denominated in a foreign currency. The value of a foreign currency denominated security will decrease as the dollar appreciates against the currency, while the value of the foreign currency denominated security will increase as the dollar depreciates against the currency.
Futures Contracts: The Fund may enter into futures contracts. A futures contract is an agreement to buy or sell a security or currency (or to deliver a final cash settlement price in the case of a contract relating to an index or otherwise not calling for physical delivery at the end of trading in the contract) for a set price at a future date. If the Fund buys a security futures contract, the Fund enters into a contract to purchase the underlying security and is said to be “long” under the contract. If the Fund sells a security futures contact, the Fund enters into a contract to sell the underlying security and is said to be “short” under the contract. The price at which the contract trades (the “contract price”) is determined by relative buying and selling interest on a regulated exchange. Futures contracts are marked to market daily and an appropriate payable or receivable for the change in value (“variation margin”) is recorded by the Fund. Such payables or receivables are recorded for financial statement purposes as variation margin payable or variation margin receivable by the Fund. The Fund pledges cash or liquid assets as collateral to satisfy the current obligations with respect to futures contracts. The cash amount is reported on the Statement of Assets and Liabilities as Deposit with broker for futures contracts which is held with one counterparty.
The Fund enters into such transactions for hedging and other appropriate risk-management purposes or to increase return. While the Fund may enter into futures contracts for hedging purposes, the use of futures contracts might result in a poorer overall performance for the Fund than if it had not engaged in any such transactions. If, for example, the Fund had insufficient cash, it might have to sell a portion of its underlying portfolio of securities in order to meet daily variation margin requirements on its futures contracts or options on futures contracts at a time when it might be disadvantageous to do so. There may be an imperfect correlation between the Fund’s portfolio holdings and futures contracts entered into by the Fund, which may prevent the Fund from achieving the intended hedge or expose the Fund to risk of loss.
| | |
Annual Report | October 31, 2015 | | 23 |
| | |
Clough Global Long/Short Fund | | Notes to Financial Statements |
| | October 31, 2015 |
Futures contract transactions may result in losses substantially in excess of the variation margin. There can be no guarantee that there will be a correlation between price movements in the hedging vehicle and in the portfolio securities being hedged. An incorrect correlation could result in a loss on both the hedged securities in the Fund and the hedging vehicle so that the portfolio return might have been greater had hedging not been attempted. There can be no assurance that a liquid market will exist at a time when the Fund seeks to close out a futures contract. Lack of a liquid market for any reason may prevent the Fund from liquidating an unfavorable position, and the Fund would remain obligated to meet margin requirements until the position is closed. In addition, the Fund could be exposed to risk if the counterparties to the contracts are unable to meet the terms of their contracts. With exchange-traded futures contracts, there is minimal counterparty credit risk to the Fund since futures contracts are exchange-traded and the exchange’s clearinghouse, as counterparty to all exchange-traded futures contracts, guarantees the futures contracts against default.
Swaps: During the period, the Fund engaged in total return swaps. A swap is an agreement that obligates two parties to exchange a series of cash flows at specified intervals based upon or calculated by reference to changes in specified prices or rates for a specified amount of an underlying asset. The Fund may utilize swap agreements as a means to gain exposure to certain assets and/or to “hedge” or protect the Fund from adverse movements in securities prices or interest rates. The Fund is subject to equity risk and interest rate risk in the normal course of pursuing its investment objective through investments in swap contracts. Swap agreements entail the risk that a party will default on its payment obligation to the Fund. If the other party to a swap defaults, the Fund would risk the loss of the net amount of the payments that it contractually is entitled to receive. If the Fund utilizes a swap at the wrong time or judges market conditions incorrectly, the swap may result in a loss to the Fund and reduce the Fund’s total return.
Total return swaps involve an exchange by two parties in which one party makes payments based on a set rate, either fixed or variable, while the other party makes payments based on the return of an underlying asset, which includes both the income it generates and any capital gains over the payment period. A Fund’s maximum risk of loss from counterparty risk or credit risk is the discounted value of the payments to be received from/paid to the counterparty over the contract’s remaining life, to the extent that the amount is positive. The risk is mitigated by having a netting arrangement between a Fund and the counterparty and by the posting of collateral to a Fund to cover the Fund’s exposure to the counterparty. Each Fund pledges cash or liquid assets as collateral to satisfy the current obligations with respect to swap contracts. The cash amount is reported on the Statement of Assets and Liabilities as Deposit with broker for total return swap contracts which is held with one counterparty.
During the period ended October 31, 2015, the Fund invested in swap agreements consistent with the Fund’s investment strategies to seek to hedge against foreign exchange risk or to gain exposure to certain markets or indices.
The effect of derivatives instruments on the Fund’s Statement of Assets and Liabilities as of October 31, 2015:
| | | | | | | | | | |
| | Asset Derivatives | | | | | | | | |
|
Risk Exposure | | Statements of Assets and Liabilities Location | | | | | Fair Value | | | |
|
Equity Contracts (Total Return Swap Contracts) | | Unrealized appreciation on total return swap contracts | | | | $ | 2,457 | | | |
|
Total | | | | | | $ | 2,457 | | | |
|
| | Liability Derivatives | | | | | | | | |
|
Risk Exposure | | Statements of Assets and Liabilities Location | | | | | Fair Value | | | |
|
Foreign Currency Contracts
(Futures Contracts) | | Variation margin payable | | | | $ | (8,524 | )(a) | | |
|
Total | | | | | | $ | (8,524 | ) | | |
|
| (a) | Includes cumulative appreciation of futures contracts as reported in the Statement of Investments. Only the current day’s net variation margin is reported within the Statement of Assets and Liabilities. |
| | |
Clough Global Long/Short Fund | | Notes to Financial Statements |
| | October 31, 2015 |
The effect of derivatives instruments on the Fund’s Statement of Operations for the period ended October 31, 2015:
| | | | | | | | | | |
| Risk Exposure | | Statements of Operations Location | | Realized
Gain/(Loss)
on Derivatives
Recognized
in Income | | | Change in
Unrealized
Appreciation/
(Depreciation)
on Derivatives
Recognized
in Income | |
Foreign Currency Contracts
(Futures Contracts) | | Net realized gain/(loss) on futures contracts/Net change in unrealized appreciation/(depreciation) on futures contracts | | $ | – | | | $ | 8,524 | |
Equity Contracts
(Total Return Swap Contracts) | | Net realized gain/(loss) on total return swap contracts/Net change in unrealized appreciation/(depreciation) on total return swap contracts | | | (3 | ) | | | 2,457 | |
| |
Total | | | | $ | (3 | ) | | $ | 10,981 | |
| |
The average futures contracts volume during the period ended October 31, 2015 is 28 contracts.
The average total return swap contracts notional amount during the period ended October 31, 2015 is $91,172.
Certain derivative contracts are executed under either standardized netting agreements or, for exchange-traded derivatives, the relevant contracts for a particular exchange which contain enforceable netting provisions. A derivative netting arrangement creates an enforceable right of set-off that becomes effective, and affects the realization of settlement on individual assets, liabilities and collateral amounts, only following a specified event of default or early termination. Default events may include the failure to make payments or deliver securities timely, material adverse changes in financial condition or insolvency, the breach of minimum regulatory capital requirements, or loss of license, charter or other legal authorization necessary to perform under the contract.
The following table presents derivative financial instruments that are subject to enforceable netting arrangements as of October 31, 2015.
| | | | | | | | | | | | | | | | | | | | | | | | |
| Offsetting of Derivatives Assets | |
| | | | | | | | | | | | Gross Amounts Not
Offset in the
Statements of
Assets and
Liabilities | |
| Description | | Gross Amounts of
Recognized Assets
| | | Gross Amounts
Offset in the
Statements of
Assets and
Liabilities | | | Net Amounts
Presented in the
Statements of
Assets and
Liabilities | | | Financial
Instruments | | | Cash Collateral
Pledged | | | Net Amount | |
Total Return Swap Contracts | | $ | 2,457 | | | $ | – | | | $ | 2,457 | | | $ | – | | | $ | – | | | $ | 2,457 | |
| |
Total | | $ | 2,457 | | | $ | – | | | $ | 2,457 | | | $ | – | | | $ | – | | | $ | 2,457 | |
| |
Counterparty Risk: The Fund runs the risk that the issuer or guarantor of a fixed income security, the counterparty to an over-the-counter derivatives contract or the obligor of an obligation underlying an asset-backed security will be unable or unwilling to make timely principal, interest, or settlement payments or otherwise honor its obligations. In addition, to the extent that the Fund uses over-the-counter derivatives, and/or has significant exposure to a single counterparty, this risk will be particularly pronounced for the Fund.
Other Risk Factors: Investing in the Fund may involve certain risks including, but not limited to, the following:
Unforeseen developments in market conditions may result in the decline of prices of, and the income generated by, the securities held by the Fund. These events may have adverse effects on the Fund such as a decline in the value and liquidity of many securities held by the Fund, and a decrease in net asset value. Such unforeseen developments may limit or preclude the Funds’ ability to achieve their investment objective.
Investing in stocks may involve larger price fluctuation and greater potential for loss than other types of investments. This may cause the securities held by the Fund to be subject to larger short-term declines in value.
| | |
Annual Report | October 31, 2015 | | 25 |
| | |
Clough Global Long/Short Fund | | Notes to Financial Statements |
| | October 31, 2015 |
The Fund may have elements of risk due to concentrated investments in foreign issuers located in a specific country. Such concentrations may subject the Fund to additional risks resulting from future political or economic conditions and/or possible impositions of adverse foreign governmental laws or currency exchange restrictions. Investments in securities of non-U.S. issuers have unique risks not present in securities of U.S. issuers, such as greater price volatility and less liquidity.
2. TAXES
Classification of Distributions: Net investment income/(loss) and net realized gain/(loss) may differ for financial statement and tax purposes. The character of distributions made during the year from net investment income or net realized gains may differ from its ultimate characterization for federal income tax purposes. Also, due to the timing of dividend distributions, the fiscal year in which amounts are distributed may differ from the fiscal year in which the income or realized gain was recorded by the Fund. There were no distributions for the period ended October 31, 2015.
Components of Earnings: Tax components of distributable earnings are determined in accordance with income tax regulations which may differ from composition of net assets reported under accounting principles generally accepted in the United States. Accordingly, for the period ended October 31, 2015, certain differences were reclassified. These differences relate primarily to the differing treatment of non-deductible offering costs, wash sales, net operating losses and investments in short securities.
The reclassifications were as follows:
| | | | | | | | | | | | | | |
| | | Undistributed Ordinary
Income | | | Accumulated Capital
Loss | | | Paid-in Capital | | | |
| | $ | 39,101 | | | $ | (57,382 | ) | | $ | 18,281 | | | |
Capital Losses: As of October 31, 2015, the Fund had no capital loss carryforwards.
Tax Basis of Distributable Earnings: Tax components of distributable earnings are determined in accordance with income tax regulations which may differ from composition of net assets reported under GAAP.
As of October 31, 2015, the components of distributable earnings on a tax basis were as follows:
| | | | |
| |
Undistributed net investment income | | $ | 147,324 | |
Accumulated net realized gain on investments | | | 5,615 | |
Net unrealized appreciation on investments | | | 531,192 | |
Other accumulated losses | | | (11,161) | |
| |
Total | | $ | 672,970 | |
| |
Tax Basis of Investments: Net unrealized appreciation/(depreciation) of investments based on federal tax costs as of October 31, 2015, was as follows:
| | | | |
| |
Gross appreciation (excess of value over tax cost) | | $ | 1,401,406 | |
Gross depreciation (excess of tax cost over value) | | | (526,046) | |
Net depreciation (excess of tax cost over value) of foreign currency and derivatives | | | (344,168) | |
| |
Net unrealized appreciation | | $ | 531,192 | |
| |
Cost of investments for income tax purposes | | $ | 35,026,303 | |
| |
The difference between book and tax basis unrealized appreciation is attributable primarily to wash sales and tax treatment of certain other investments.
| | |
Clough Global Long/Short Fund | | Notes to Financial Statements |
| | October 31, 2015 |
3. CAPITAL TRANSACTIONS
Common Shares: There is an unlimited number of shares of beneficial interest with no par value per share. Shares redeemed within 30 days of purchase may incur a 2.00% redemption fee deducted from the redemption amount. For the period ended October 31, 2015 there were no redemption fees charged.
| | | | |
| | | For the Period
September 30, 2015
(commencement) to
October 31, 2015 | |
Class A: | | | | |
Beginning of period | | | – | |
Shares sold | | | 2,600 | |
| |
Net increase in shares outstanding | | | 2,600 | |
| |
Shares outstanding, end of period | | | 2,600 | |
| |
Class C: | | | | |
Beginning of period | | | – | |
Shares sold | | | 2,500 | |
| |
Net increase in shares outstanding | | | 2,500 | |
| |
Shares outstanding, end of period | | | 2,500 | |
| |
Class I: | | | | |
Beginning of period | | | – | |
Shares sold | | | 3,472,903 | |
| |
Net increase in shares outstanding | | | 3,472,903 | |
| |
Shares outstanding, end of period | | | 3,472,903 | |
| |
4. PORTFOLIO SECURITIES
Purchases and sales of investment securities, excluding securities sold short intended to be held for less than one year and short-term securities, for the period ended October 31, 2015, are listed in the table below.
| | | | | | | | | | | | | | |
| Cost of Investments Purchased | | | Proceeds From Investments Sold | | | Purchases of Long-Term U.S.
Government Obligations | | | Proceeds from Sales of Long-Term U.S.
Government Obligations | |
| $ | 34,771,438 | | | $ | 6,493,523 | | | $ | – | | | $ | – | |
5. INVESTMENT ADVISORY AND OTHER AGREEMENTS
Investment Advisory Agreement: Clough Capital Partners L.P. (the “Adviser” or “Clough Capital”) will serve as the Fund’s investment adviser pursuant to an Investment Advisory Agreement with the Fund. As compensation for its services to the Fund, the Adviser receives an annual investment advisory fee of 1.35% based on the Fund’s average daily net assets, paid monthly. The Adviser has agreed contractually to limit the operating expenses of each class of the Fund (excluding Rule 12b-1 Distribution and Service Fees, Shareholder Services Fees, acquired fund fees and expenses, interest, taxes, brokerage costs and commissions, dividend and interest expense on short sales, and litigation, indemnification and extraordinary expenses as determined under generally accepted accounting principles) to an annual rate of 1.60% through August 31, 2016. The Adviser is permitted to recover, on a class-by-class basis, any fees waived and/or expenses reimbursed pursuant to the waiver agreement described above to the extent that such recovery does not cause total annual operating expenses to exceed the expense limitation in effect (i) at the time the fees and/or expenses to be recovered were waived and/or reimbursed and (ii) at the time of such recovery. The Adviser will not be entitled to recover any such waived or reimbursed fees and expenses more than three years after the end of the fiscal year in which the fees were waived or expenses were reimbursed. The Adviser may not terminate this waiver arrangement without the approval of the Fund’s Board of Trustees.
For the period ended October 31, 2015, the fee waivers and/or reimbursements were as follows:
| | | | | | | | |
| | | Expires in | | | | |
| | | 2018 | | | Total | |
Class A | | $ | (85) | | | $ | (85) | |
Class C | | $ | (82) | | | $ | (82) | |
Class I | | $ | (83,042) | | | $ | (83,042) | |
| | |
Annual Report | October 31, 2015 | | 27 |
| | |
Clough Global Long/Short Fund | | Notes to Financial Statements |
| | October 31, 2015 |
Administration Agreement: The Fund currently employs ALPS Fund Services, Inc. (“ALPS”) under an administration agreement to provide certain administrative services to the Fund. As compensation for its services to the Fund, ALPS receives an annual administration fee based on the Fund’s average daily net assets, paid monthly.
Transfer Agency and Service Agreement: ALPS, pursuant to a Transfer Agency and Service Agreement, serves as transfer agent for the Fund.
Distribution and Shareholder Services Plan: The Fund has adopted a separate plan of distribution for Class A and Class C shares, pursuant to Rule 12b-1 under the Investment Company Act of 1940 (“1940 Act”) (each, a “Plan” and collectively, the “Plans”). ALPS Portfolio Solutions Distributor, Inc. (the “Distributor”) serves as the Fund’s distributor.
The Plans allow the Fund, as applicable, to use Class A and Class C assets to pay fees in connection with the distribution and marketing of Class A and Class C shares and/or the provision of ongoing servicing for the benefit of shareholders. Each Plan permits payment for services in connection with the administration of plans or programs that use Class A and/or Class C shares of the Fund as their funding medium and for related expenses.
The Plans permit the Fund to make total payments at an annual rate of up to 0.25% of the Fund’s average daily net assets attributable to its Class A shares, and 1.00% of the Fund’s average daily net assets attributable to its Class C shares. Because these fees are paid out of the Fund’s Class A and Class C shares, respectively, on an ongoing basis, over time they will increase the cost of an investment in Class A and Class C shares. For example, the Class C Plan fees may cost an investor more than the Class A Plan sales charges over time.
Under the terms of the Plans, the Trust is authorized to make payments to the Distributor for remittance to financial intermediaries, as compensation for distribution and/or the provision of on-going servicing for the benefit of shareholders performed by such financial intermediaries for their customers who are investors in the Fund. Financial intermediaries may from time to time be required to meet certain additional criteria in order to continue to receive 12b-1 fees. For Class C shares, the Distributor is entitled to retain all fees paid under the Plan for the first 12 months on any investment in Class C Shares to recoup the expenses with respect to the payment of commissions on sales of Class C Shares. Financial intermediaries will become eligible for Class C Plan compensation beginning in the 13th month following the purchase of Class C Shares, although the Distributor may, pursuant to a written agreement between the Distributor and a particular financial intermediary, pay such financial intermediary 12b-1 fees prior to the 13th month following the purchase of Class C Shares. The Distributor may retain some or all compensation payable pursuant to the Plans under certain circumstances, such as when a financial intermediary is removed as the broker of record or a financial intermediary fails to meet certain qualification standards to be eligible to continue to be the broker of record.
Shareholder Services Plan for Class A Shares: The Fund has adopted a non-12b-1 shareholder services plan (the “Services Plan”) with respect to the Fund’s Class A shares. Under the Services Plan, the Fund is authorized to pay financial intermediaries an aggregate fee in an amount not to exceed on an annual basis 0.10% of the average daily net asset value of the Class A shares of the Fund attributable to or held in the name of the financial intermediary for its clients as compensation for maintaining customer accounts that hold Fund shares. These activities may include, but are not limited to, establishing and maintaining Fund shareholder accounts on a transaction processing and record keeping system, providing Fund shareholders with the ability to access current Fund information, including without limitation, share balances, dividend information and transaction history, and permitting the Fund’s transfer agent to receive order instructions from or on behalf of Fund shareholders for the purchase or redemption of Shares. None of these activities include distribution services. Any amount of the Services Plan fees not paid during the Fund’s fiscal year for such servicing shall be reimbursed to the Fund.
6. INDEMNIFICATION
Under the Trust’s organizational documents, its officers and Trustees are indemnified against certain liabilities arising out of the performance of their duties to the Trust. Additionally, in the normal course of business, the Trust enters into contracts with service providers that contain general indemnification clauses. The Trust’s maximum exposure under these arrangements is unknown, as this would involve future claims that may be made against the Trust that have not yet occurred. However, based on experience, the Trust believes the risk of loss to be remote.
7. OTHER
The Independent Trustees of the Fund receive a quarterly retainer of $4,000, plus $2,250 for each regular Board or Committee meeting attended, $1,000 for each special telephonic Board or Committee meeting attended and $2,250 for each special in-person Board meeting attended. The Independent Trustees are also reimbursed for all reasonable out-of-pocket expenses relating to attendance at meetings.
| | |
Report of Independent Registered Public Accounting Firm |
| | |
The Board of Trustees and Shareholders of
Clough Global Long/Short Fund
We have audited the accompanying statement of assets and liabilities, including the statement of investments, of Clough Global Long/Short Fund (constituting the Clough Funds Trust) (the “Fund”) as of October 31, 2015, and the related statements of operations, changes in net assets and financial highlights for the period September 30, 2015 (commencement) to October 31, 2015. These financial statements and financial highlights are the responsibility of the Fund’s management. Our responsibility is to express an opinion on these financial statements and financial highlights based on our audit.
We conducted our audit in accordance with the standards of the Public Company Accounting Oversight Board (United States). Those standards require that we plan and perform the audit to obtain reasonable assurance about whether the financial statements and financial highlights are free of material misstatement. We were not engaged to perform an audit of the Fund’s internal control over financial reporting. Our audit included consideration of internal control over financial reporting as a basis for designing audit procedures that are appropriate in the circumstances, but not for the purpose of expressing an opinion on the effectiveness of the Fund’s internal control over financial reporting. Accordingly, we express no such opinion. An audit also includes examining, on a test basis, evidence supporting the amounts and disclosures in the financial statements and financial highlights, assessing the accounting principles used and significant estimates made by management, and evaluating the overall financial statement presentation. Our procedures included confirmation of securities owned as of October 31, 2015, by correspondence with the custodian and others or by other appropriate auditing procedures where replies from others were not received. We believe that our audit provides a reasonable basis for our opinion.
In our opinion, the financial statements and financial highlights audited by us as referred to above present fairly, in all material respects, the financial position of the Clough Global Long/Short Fund at October 31, 2015, the results of its operations, the changes in its net assets, and the financial highlights for the period September 30, 2015 (commencement) to October 31, 2015, in conformity with U.S. generally accepted accounting principles.

Boston, Massachusetts
December 23, 2015
| | |
Annual Report | October 31, 2015 | | 29 |
| | |
Clough Global Long/Short Fund | | Additional Information |
| | October 31, 2015 (Unaudited) |
FUND PROXY VOTING POLICIES & PROCEDURES
The Fund’s policies and procedures used in determining how to vote proxies relating to portfolio securities are available on the Fund’s website at http://www.cloughglobal.com. Information regarding how the Fund voted proxies relating to portfolio securities held by the Fund for the period ended June 30, are available without charge, upon request, by contacting the Funds at 1-877-256-8445 and on the Commission’s website at http://www.sec.gov.
PORTFOLIO HOLDINGS
The Fund files its complete schedule of portfolio holdings with the Commission for the first and third quarters of each fiscal year on Form N–Q within 60 days after the end of the period. Copies of the Fund’s Form N–Q are available without a charge, upon request, by contacting the Fund at 1–877–256–8445 and on the Commission’s website at http://www.sec.gov. You may also review and copy Form N–Q at the Commission’s Public Reference Room in Washington, D.C. For more information about the operation of the Public Reference Room, please call the Commission at 1–800–SEC–0330.
| | |
Clough Global Long/Short Fund | | Investment Advisory Agreement Approval |
| | October 31, 2015 (Unaudited) |
Management Agreement Approval Process
Section 15(c) of the Investment Company Act of 1940, as amended (the “1940 Act”), requires that each mutual fund’s board of directors or trustees, including a majority of those directors or trustees who are not “interested persons” of the mutual fund, as defined in the 1940 Act, initially approve, and after an initial term not exceeding two years, annually review and consider the continuation of, the mutual fund’s investment advisory agreement. On July 9, 2015, the Board of Trustees (the “Board”) of Clough Funds Trust (the “Trust”), including the Trustees who are not interested persons of the Trust as defined by the 1940 Act (the “Independent Trustees”), approved the Management Agreement between the Trust, on behalf of the Clough Global Long/Short Fund (the “Fund”), and Clough Capital Partners L.P. (the “Adviser”). Prior to taking this action, the Board reviewed information relating to the Fund and the Adviser that was prepared in response to specific inquiries made on behalf of the Independent Trustees to assist them in their consideration of the Management Agreement. This information included, among other things, information about: the Adviser’s organization, operations and personnel; the services to be provide to the Fund by the Adviser; the Adviser’s portfolio management, trading and compliance practices; and the anticipated management fee level and total expense ratio of the Fund relative to a peer group of comparable alternative long-short equity funds, as detailed in a comparative analysis prepared by an independent data provider. The Board also received presentations from representatives of the Adviser regarding the Fund and its investment strategy.
Based on its review of the information provided, and such other factors and conclusions as the Board deemed relevant, the Board, including a majority of the Independent Trustees, concluded that the approval of the Management Agreement is in the best interests of the Fund. In making this determination, the Independent Trustees met in executive session separately from Fund management and the interested Trustees of the Trust to consider the information provided and to confer with independent legal counsel regarding their responsibilities under relevant laws and regulations. The Board considered, among others, each of the factors and conclusions described below (but with no single factor or conclusion being determinative and with each Board member not necessarily attributing the same weight to each factor or conclusion.)
Nature, Quality and Extent of Services
In evaluating the nature, quality and extent of services expected to be provided by the Adviser to the Fund, the Board reviewed information relating to the Adviser’s operations and personnel, including: its organizational and management structure; the qualifications, education and experience of the individual investment professionals whose responsibilities include portfolio management and investment research for the Fund; the portfolio management and trading practices to be employed in managing the Fund; the Adviser’s financial condition and its ability to devote the resources necessary to provide the services required under the Management Agreement; and the Adviser’s dedication to maintaining appropriate compliance programs with respect to the Fund. In particular, the Board noted that the Adviser is a well-regarded organization with an appropriate level of financial and human resources, including personnel with experience managing global long-short portfolios. Based upon these and other relevant factors, the Board concluded that the Adviser possesses the capability to effectively perform the duties required of it under the Management Agreement and that the Adviser’s personnel are qualified to manage the Fund’s assets in accordance with its stated investment objectives and policies.
Fees and Expenses
In considering the fee payable to the Adviser under the Management Agreement, the Board reviewed comparative information presented in the report of an independent data provider relating to the anticipated management fee level and total expense ratio of the Fund relative to a peer group of comparable alternative long-short equity funds. The Board also requested and reviewed information regarding the fees charged by the Adviser to the other registered funds and institutional separate accounts it manages. In addition, the Board noted that the Adviser had proposed to limit total operating expenses, including waiving advisory fees, if necessary, for each share class of the Fund for a period of one year from the date of the Fund’s prospectus. On the basis of the information provided, the Board concluded that the proposed advisory fee was reasonable in light of the nature, quality and extent of services expected to be provided by the Adviser.
Profitability
In considering the proposed fee schedule under the Management Agreement, the Board reviewed information regarding the Adviser’s estimated costs to provide investment management and related services to the Fund and the estimated profitability to the Adviser from all services to be provided to the Fund. In its evaluation, the Board considered the Adviser’s representation that the level of estimated profitability was reasonable based on the nature and quality of the services to be provided and the Adviser’s costs in delivering such services. The Board also considered that the actual profitability of the Fund to the Adviser would depend on the growth of assets under management, after giving effect to the Adviser’s agreement to limit total expenses for a period of one year from the date of the Fund’s prospectus. Based on these considerations, the Board concluded that the profits to be realized by the Adviser from its relationship with the Fund would not be excessive.
| | |
Annual Report | October 31, 2015 | | 31 |
| | |
Clough Global Long/Short Fund | | Investment Advisory Agreement Approval |
| | October 31, 2015 (Unaudited) |
Economies of Scale
In reviewing the Fund’s proposed management fee, the Board considered the extent to which the Adviser, on the one hand, and the Fund, on the other hand, can expect to benefit from economies of scale in the event the assets of the Fund increase over time. In considering the potential to realize benefits from economies of scale, the Board reviewed the Fund’s proposed advisory fee in comparison to comparable peer funds as well as the Fund’s estimated expense ratio after giving effect to the Adviser’s agreement to limit total expenses for a period of one year from the date of the Fund’s prospectus. On the basis of the foregoing, and in light of the Fund’s current and expected asset levels, the Board concluded that the structure of the advisory fee is appropriate and that fee breakpoints are not required at this time. The Board noted, however, that it would review future growth in Fund assets and the appropriateness of breakpoints as part of its future annual review of the Management Agreement.
Other Benefits
The Board considered other potential benefits to be derived by the Adviser from its relationship with the Fund, as well as any additional benefits which may be derived by the Fund as a result of its association with the Adviser.
Conclusion
Based upon all of the information provided, including a consideration of each of the factors identified above, the Board concluded that its approval of the Management Agreement is in the interests of the Fund. In reaching this determination, the Board did not assign relative weights to any factors taken into account or deem any one or group of them to be controlling in and of themselves.
| | |
Clough Global Long/Short Fund | | Trustees & Officers |
| | October 31, 2015 (Unaudited) |
| | | | | | | | | | |
Name, Address*
& Year of Birth | | Position(s)
Held with Fund | | Term of Office
and Length of
Time Served** | | Principal Occupation(s) During Past 5 Years | | Number of
Funds in Fund
Complex
Overseen by Trustee*** | | Other Directorships Held by Trustee
During Past 5 Years** |
Independent Trustees |
Jeremy W. Deems 1976 | | Trustee | | Since 2015 | | Mr. Deems is the Co-Founder, Chief Operations Officer and Chief Financial Officer of Green Alpha Advisors, LLC, a registered investment advisor, and Co-Portfolio Manager of the Shelton Green Alpha Fund. Prior to joining Green Alpha Advisors, Mr. Deems was CFO and Treasurer of Forward Management, LLC, ReFlow Management Co., LLC, ReFlow Fund, LLC, a private investment fund, and Sutton Place Management, LLC (an administrative services company) from 1998 to June 2007. From 2004 to 2005, Mr. Deems also served as Treasurer of the Forward Funds and the Sierra Club Funds. | | 2 | | Mr. Deems is a Trustee of ALPS ETF Trust (21 funds); ALPS Variable Investment Trust (7 funds); Financial Investors Trust (34 funds); and Reaves Utility Income Fund (1 fund). |
James M. Maxwell 1954 | | Trustee | | Since 2015 | | Mr. Maxwell is President of SPAD Associates (a private investigation and consulting company). Prior to joining SPAD Associates, he was the Vice President of Corporate Security for Credit Suisse from 2006 to 2007. Previously, he was a Special Agent with the Federal Bureau of Investigation from 1982 to 2006. | | 1 | | None |
Michael P. McCauley 1963 | | Lead
Independent
Trustee | | Since 2015 | | Mr. McCauley has been Chief Executive Officer (CEO) at O’Neil Securities, Inc. since 2015. Previously, he was the Head of Global Trading at Pyramis Global Advisors (a Fidelity Investments Company) from 2005 to 2014. Prior to joining Pyramis Global Advisors, Mr. McCauley was the President of Pulse Trading, Inc. (a broker-dealer firm) from 2002 to 2005. Previously, he was a Senior Equity Trader at Fidelity Investments from 1993 to 2002. | | 1 | | None |
Clifford J. Weber 1963 | | Trustee | | Since 2015 | | Mr. Weber is the founder of Financial Products Consulting Group, LLC (a consulting firm). Prior to starting Financial Products Consulting Group, he was the Executive Vice President – Global Index and Exchange Traded Products of the NYSE, a subsidiary of Intercontinental Exchange, from 2013 to 2015. Previously, Mr. Weber was the Executive Vice President – Head of Strategy and Product Development of NYSE Liffe U.S., a division of NYSE Euronext, from 2008 to 2013, and held various positions with the American Stock Exchange from 1990 to 2008. | | 1 | | None |
| | |
Annual Report | October 31, 2015 | | 33 |
| | |
Clough Global Long/Short Fund | | Trustees & Officers |
| | October 31, 2015 (Unaudited) |
| | | | | | | | | | |
Name, Address* & Year of Birth | | Position(s)
Held with
Fund | | Term of Office
and Length of
Time Served** | | Principal Occupation(s) During Past 5 Years | | Number of
Funds in Fund
Complex
Overseen by
Trustee*** | | Other Directorships
Held by Trustee |
Interested Trustees |
Edmund J. Burke 1961 | | Trustee
and
President | | Since 2015 | | Mr. Burke is President and a Director of ALPS Holdings, Inc. (“AHI”), a wholly-owned subsidiary of DST Systems, Inc. (“DST”), (since 2005) and Director of Boston Financial Data Services, Inc. (“BFDS”), ALPS Advisors, Inc. (“AAI”), ALPS Distributors, Inc. (“ADI”), ALPS Fund Services, Inc. (“AFS”) and ALPS Portfolio Solutions Distributor, Inc. (“APSD”) and from 2001-2008, was President of AAI, ADI, AFS and APSD. Mr. Burke is an “interested person” because of his positions with APSD and its affiliates, which are affiliates of the Trust. | | 5 | | Mr. Burke is a Trustee/Director of Financial Investors Trust (34 funds); Liberty All-Star Equity Fund (1 fund); and Liberty All-Star Growth Fund, Inc. (1 fund). |
James E. Canty 1962 | | Trustee
andChairman | | Since 2015 | | Mr. Canty is a founding partner, President and Portfolio Manager for the Adviser and a member of the Board of Directors of Clough Offshore Fund, Ltd. and Clough Offshore Fund (QP), Ltd. Mr. Canty is also currently a Trustee of St. Bonaventure University, Blacklight Power, Inc. and Razia’s Ray of Hope. Mr. Canty is a Certified Public Accountant. Mr. Canty is an “interested person” because of his positions with the Adviser, which is an affiliate of the Trust. | | 4 | | None |
| | |
Clough Global Long/Short Fund | | Trustees & Officers |
| | October 31, 2015 (Unaudited) |
| | | | | | |
Name, Address* & Year of Birth | | Position(s) Held with Fund | | Term of Office and Length of Time Served** | | Principal Occupation(s) During Past 5 Years |
| Officers |
Patrick D. Buchanan 1972 | | Treasurer | | Since 2015 | | Mr. Buchanan is Vice President of ALPS Advisors, Inc. Mr. Buchanan joined ALPS in 2007. Mr. Buchanan is also Treasurer of ALPS ETF Trust, ALPS Variable Insurance Trust and Principal Real Estate Income Fund. |
Abigail J. Murray 1975 | | Secretary | | Since 2015 | | Ms. Murray joined ALPS in April 2015. She is currently Vice President and Senior Counsel of ALPS. Prior to joining ALPS, Ms. Murray was an Attorney and Managing Member at Murray & Rouvina PLC from 2014 to 2015 and an Associate with Vedder Price P.C. from 2007 to 2014. Ms. Murray is also the Secretary of ALPS ETF Trust, Clough Global Allocation Fund, Clough Global Equity Fund, Clough Global Opportunities Fund and The Caldwell & Orkin Funds, Inc. |
Ted Uhl 1974 | | Chief Compliance Officer (“CCO”) | | Since 2015 | | Mr. Uhl joined ALPS in October 2006, and is currently Deputy Compliance Officer of ALPS. Prior to his current role, Mr. Uhl served as Senior Risk Manager for ALPS from October 2006 until June 2010. Before joining ALPS, Mr. Uhl served as a Sr. Analyst with Enenbach and Associates (RIA), and a Sr. Financial Analyst at Sprint. Mr. Uhl is also CCO of Financial Investors Trust, Centre Funds, Reality Shares Trust, Boulder Funds, and Transparent Value Trust. |
Jill Kerschen 1975 | | Assistant Treasurer | | Since 2015 | | Ms. Kerschen joined ALPS in July 2013 and is currently a Fund Controller at ALPS. Ms. Kerschen also serves as Treasurer of Reaves Utility Income Fund and Assistant Treasurer of the Westcore Funds, Clough Global Allocation Fund, Clough Global Equity Fund, Clough Global Opportunities and the Macquarie Global Infrastructure Total Return Fund. Prior to joining ALPS, Ms. Kerschen was Senior Manager, Financial & Tax Reporting at Great-West Financial from 2007 to 2013. |
| * | All communications to Trustees and Officers may be directed to Clough Funds Trust c/o 1290 Broadway, Suite 1100, Denver, CO 80203, except for Mr. Canty. For Mr. Canty, all communications may be sent to Clough Capital Partners, LP, One Post Office Square, 40th Floor, Boston, MA 02109. |
| ** | This is the year the Trustee or Officer began serving the Trust. Each Trustee serves an indefinite term, until his successor is elected. Officers are elected on an annual basis. |
| *** | The Fund Complex consists of the Fund, Clough Global Allocation Fund, Clough Global Equity Fund, Clough Global Opportunities Fund and Clough China Fund, a series of the Financial Investors Trust. Mr. Deems is a member of the Board of Financial Investors Trust. Mr. Burke is a member of the Board and the President of each such fund. Mr. Canty is a member of the Board of each such fund other than the Clough China Fund. |
The Statement of Additional Information includes additional information about the Fund’s Trustees and is available, without a charge, upon request, by contacting the Fund at 1 - 855 - 425 - 6844.
| | |
Annual Report | October 31, 2015 | | 35 |
| | |
Clough Global Long/Short Fund | | Privacy Policy |
| | October 31, 2015 (Unaudited) |
| | |
| FACTS | | WHAT DOES THE CLOUGH GLOBAL LONG/SHORT FUND (THE “FUND”) DO WITH YOUR PERSONAL INFORMATION? |
WHY? | | Financial companies choose how they share your personal information. Federal law gives consumers the right to limit some but not all sharing. Federal law also requires us to tell you how we collect, share, and protect your personal information. Please read this notice carefully to understand what we do. |
WHAT? | | The types of personal information we collect and share depend on the product or service you have with us. This information can include: ● Social security number and income; ● Account balances and transaction history; ● Assets and investment experience. |
HOW? | | All financial companies need to share customers’ personal information to run their everyday business. In the section below, we list the reasons financial companies can share their customers’ personal information; the reasons the Fund chooses to share such information; and whether you can limit this sharing |
| | | | | | |
| | | Reasons we can share your personal information | | Does the Fund Share? | | Can you limit this sharing? |
| | | For our everyday business purposes—such as to process your transactions, maintain your account(s), respond to court orders and legal investigations, or report to credit bureaus | | Yes | | No |
| | | For our marketing purposes—to offer our products and services to you | | No | | We do not share. |
| | | For joint marketing with other financial companies | | No | | We do not share. |
| | | For our affiliates’ everyday business purposes— information about your transactions and experiences | | Yes | | No |
| | | For our affiliates’ everyday business purposes— information about your creditworthiness | | No | | We do not share. |
| | | For nonaffiliates to market to you | | No | | We do not share. |
| | | | |
QUESTIONS? | | Call 855.425.6844 or go to www.cloughglobalfunds.com. |
| | |
| | |
WHO WE ARE |
Who is providing this notice? | | Clough Global Long/Short Fund |
WHAT WE DO |
How does the Fund protect my personal information? | | To protect your personal information from unauthorized access and use, we use security measures that comply with federal law. These measures include computer safeguards and secured files and buildings. |
How does the Fund collect my personal information? | | We collect your personal information, for example, when you open an account, provide account information or give us your contact information, make a wire transfer or deposit money |
Why can’t I limit all sharing? | | Federal law gives you the right to limit only: ● sharing for affiliates’ everyday business purposes — information about your creditworthiness ● affiliates from using your information to market to you ● sharing for non-affiliates to market to you State laws and individual companies may give you additional rights to limit sharing. |
| | |
Clough Global Long/Short Fund | | Privacy Policy |
| | October 31, 2015 (Unaudited) |
| | |
DEFINITIONS |
Affiliates | | Companies related by common ownership or control. They can be financial and nonfinancial companies. |
Non-affiliates | | Companies not related by common ownership or control. They can be financial and nonfinancial companies. ● The Fund does not share with non-affiliates so they can market to you. |
Joint marketing | | A formal agreement between non-affiliated financial companies that together market financial products or services to you. ● The Fund does not jointly market. |
Other Important Information |
California Residents | | If your account has a California home address, your personal information will not be disclosed to nonaffiliated third parties except as permitted by applicable California law, and we will limit sharing such personal information with our affiliates to comply with California privacy laws that apply to us. |
Vermont Residents | | The State of Vermont requires financial institutions to obtain your consent prior to sharing personal information that they collect about you with affiliated companies and nonaffiliated third parties other than in certain limited circumstances. Except as permitted by law, we will not share personal information we collect about you with nonaffiliated third parties or other affiliated companies unless you provide us with your written consent to share such information. |
| | |
Annual Report | October 31, 2015 | | 37 |

Item 2. Code of Ethics.
| | (a) | The registrant, as of the end of the period covered by this report, has adopted a code of ethics that applies to the registrant’s principal executive officer, principal financial officer, principal accounting officer or controller or any persons performing similar functions on behalf of the registrant. |
| | (c) | During the period covered by this report, no amendments to the provisions of the code of ethics adopted in Item 2(a) above were made. |
| | (d) | During the period covered by this report, no implicit or explicit waivers to the provisions of the code of ethics adopted in Item 2(a) above were granted. |
| | (f) | The registrant’s Code of Ethics is attached as an Exhibit to this report. |
Item 3. Audit Committee Financial Expert.
The Board of Trustees of the registrant has determined that the registrant has at least one Audit Committee Financial Expert serving on its audit committee. The Board of Trustees of the registrant has designated Jeremy Deems, as the registrant’s “Audit Committee Financial Experts.” Mr. Deems is “independent” as defined in paragraph (a)(2) of Item 3 to Form N-CSR.
Item 4. Principal Accountant Fees and Services.
| | (a) | Audit Fees: For the registrant’s fiscal period ending October 31, 2015, the aggregate fees billed for professional services rendered by the principal accountant for the audit of the registrant’s annual financial statements were $30,000, respectively. |
| | (b) | Audit-Related Fees: For the registrant’s fiscal period ending October 31, 2015, the aggregate fees billed for assurance and related services by the principal accountant that were reasonably related to the performance of the audit of the registrant’s financial statements and are not reported under paragraph (a) of this Item were $0, respectively. |
| | (c) | Tax Fees: For the registrant’s fiscal period ending October 31, 2015, the aggregate fees billed for professional services rendered by the principal accountant for tax compliance, tax advice and tax planning were $13,000, respectively. The fiscal period’s tax fees were for services for dividend calculation, excise tax preparation and tax return preparation. |
| | (d) | All Other Fees: For the registrant’s fiscal period ending October 31, 2015, $10,000 in fees were billed to registrant by the principal accountant in connection with the registrant’s seed capital audit. |
| | (e)(1) | Audit Committee Pre-Approval Policies and Procedures: All services to be performed by the registrant’s principal accountant must be pre-approved by the registrant’s audit committee. |
| | (e)(2) | No services described in paragraphs (b) through (d) of this Item were approved by the registrant’s audit committee pursuant to paragraph (c)(7)(i)(C) of Rule 2-01 of Regulation S-X. |
| | (g) | The aggregate non-audit fees billed by the registrant’s accountant for services rendered to the registrant, and rendered to the registrant’s investment adviser (not including any sub-adviser whose role is primarily portfolio management and is subcontracted with or overseen by another investment adviser), and any entity controlling, controlled by, or under common control with the adviser that provides ongoing services to the registrant, were $0 in the fiscal period ending October 31, 2015. These fees consisted of tax fees billed to the registrant as described in response to paragraph (c) of this Item. |
| | (h) | The registrant’s audit committee has considered whether the provision of non-audit services that were rendered to the registrant’s investment adviser (not including any sub-adviser whose role is primarily portfolio management and is subcontracted with or overseen by another investment adviser), and any entity controlling, controlled by, or under common control with the investment adviser that provides ongoing services to the registrant that were not pre-approved pursuant to paragraph (c)(7)(ii) of Rule 2-01 of Regulation S-X, is compatible with maintaining the principal accountant’s independence and has determined that the provision of such non-audit services is compatible with maintaining the principal accountant’s independence. |
Item 5. Audit Committee of Listed Registrants.
Not applicable.
Item 6. Investments.
| | (a) | Schedule of Investments is included as part of the Report to Stockholders filed under Item 1 of this Form N-CSR. |
Item 7. Disclosure of Proxy Voting Policies and Procedures for Closed-End Management Investment Companies.
Not applicable to the registrant.
Item 8. Portfolio Managers of Closed-End Management Investment Companies.
Not applicable to the registrant.
Item 9. Purchases of Equity Securities by Closed-End Management Investment Company and Affiliated Purchasers.
Not applicable to the registrant.
Item 10. Submission of Matters to Vote of Security Holders.
The Board will, when a vacancy exists, consider shareholder nominees for appointment or election as Trustees. All nominees must possess the appropriate characteristics, skills and experience for serving on the Board. In particular, the Board and its Independent Trustees will consider each nominee’s integrity, educational and professional background, understanding of the Trust’s business on a technical level and commitment to devote the time and attention necessary to fulfill a Trustee’s duties. All shareholders who wish to recommend nominees for consideration as Trustees shall submit the names and qualifications of the candidates to the Secretary of the Trust by writing to: Clough Funds Trust, 1290 Broadway, Suite 1100, Denver, Colorado, 80203.
Item 11. Controls and Procedures.
| | (a) | The registrant’s principal executive officer and principal financial officer have evaluated the registrant’s disclosure controls and procedures (as defined in Rule 30a-3(c) under the Investment Company Act of 1940, as amended) within 90 days of this report and have concluded that the registrant’s disclosure controls and procedures were effective as of that date. |
| | (b) | There was no change in the registrant’s internal control over financial reporting (as defined in Rule 30a-3(d) under the Investment Company Act of 1940, as amended) during the second fiscal quarter of the period covered by this report that has materially affected, or is reasonably likely to materially affect, the registrant’s internal control over financial reporting. |
Item 12. Exhibits.
| (a)(1) | The registrant’s Code of Ethics for Principal Executive and Senior Financial Officers, which is the subject of the disclosure required by Item 2 of Form N-CSR is filed herewith as Exhibit 12(a)(1). |
| (a)(2) | The certifications required by Rule 30a-2(a) of the Investment Company Act of 1940, as amended, and Section 302 of the Sarbanes-Oxley Act of 2002 are attached hereto as Exhibit 99.Cert. |
| (b) | The certifications by the registrant’s principal executive officer and principal financial officer, as required by Rule 30a-2(b) of the Investment Company Act of 1940, as amended, and Section 906 of the Sarbanes-Oxley Act of 2002 are attached hereto as Exhibit 99.906Cert. |
SIGNATURES
Pursuant to the requirements of the Securities Exchange Act of 1934 and the Investment Company Act of 1940, the Registrant has duly caused this report to be signed on its behalf by the undersigned, thereunto duly authorized.
CLOUGH FUNDS TRUST
| | | | |
| By: | | /s/ Edmund J. Burke | | |
| | Edmund J. Burke | | |
| | President/Principal Executive Officer | | |
| | |
| Date: | | January 8, 2016 | | |
Pursuant to the requirements of the Securities Exchange Act of 1934 and the Investment Company Act of 1940, this report has been signed below by the following persons on behalf of the Registrant and in the capacities and on the dates indicated.
CLOUGH FUNDS TRUST
| | | | |
| By: | | /s/ Edmund J. Burke | | |
| | Edmund J. Burke | | |
| | President/Principal Executive Officer | | |
| | |
| Date: | | January 8, 2016 | | |
| | |
| By: | | /s/ Patrick D. Buchanan | | |
| | Patrick D. Buchanan | | |
| | Treasurer/Principal Financial Officer | | |
| | |
| Date: | | January 8, 2016 | | |