UNITED STATES
SECURITIES AND EXCHANGE COMMISSION
Washington, D.C. 20549
FORM N-CSR
CERTIFIED SHAREHOLDER REPORT OF REGISTERED
MANAGEMENT INVESTMENT COMPANIES
Investment Company Act file number: 811-23059
CLOUGH FUNDS TRUST
(Exact name of registrant as specified in charter)
1290 Broadway, Suite 1100, Denver, Colorado 80203
(Address of principal executive offices) (Zip code)
303.623.2577
(Registrant’s telephone number, including area code)
Karen S. Gilomen, Secretary
Clough Funds Trust
1290 Broadway, Suite 1100
Denver, CO 80203
(Name and address of agent for service)
Date of fiscal year end: October 31
Date of reporting period: November 1, 2016 – October 31, 2017
Item 1. Report to Stockholders.
| Clough Global Long/Short Fund | Table of Contents |
| Shareholder Letter | 2 |
| Portfolio Performance | 5 |
| Disclosure of Fund Expenses | 8 |
| Statement of Investments | 9 |
| Statement of Assets and Liabilities | 12 |
| Statement of Operations | 13 |
| Statement of Changes in Net Assets | 14 |
| Financial Highlights | 15 |
| Notes to Financial Statements | 18 |
| Report of Independent Registered Public Accounting Firm | 28 |
| Additional Information | 29 |
| Trustees & Officers | 30 |
| Privacy Policy | 34 |
| Clough Global Long/Short Fund | Shareholder Letter |
October 31, 2017 (Unaudited)
Dear Shareholders:
For the fiscal year ended in 2017, the Fund had a total return of 17.34% for Class I1 compared to 23.63% for the S&P 500 and 12.99% for the HFRI Equity Hedge Index. The long book averaged an 84.5% exposure (contributing 23.3% to returns), while the short book averaged a 17.5% exposure (detracting 4.2% from returns in an up market).
The Fund outperformed its long/short benchmark, the HFRI Equity Hedge Index for the year by 399 basis points, and achieved 72% of the returns of its long-only benchmark, the S&P 500 Index - despite an average investment level for the year of approximately 68.2% on a net basis.
By region, the portfolio had meaningful gains from the U.S. (1,100 basis points), China (242 basis points), India (225 basis points), and Japan (151 basis points). By sector, the greatest contribution to returns were from Information Technology (977 basis points), Consumer Discretionary (598 basis points), Financials (355 basis points), Healthcare (90 basis points) and Consumer Staples (69 basis points). The sectors that detracted from the Fund’s returns were Industrials (-171 basis points) and Energy (-47 basis points).
Following is a summary of the key themes expressed in the Fund during the Fiscal Year:
Consumer Dynamism in Asia
The Fund’s average exposure to China and India combined was approximately 13.4% for the year.
Much of the Fund’s China exposure is in a group of what we consider to be “best in class” Chinese internet companies as well as leading local consumer brands. Consumption is accelerating and China’s services and technology sectors are booming. Together they account for more than 60% of gross domestic product (GDP) in the region. The backdrop for sustained growth in internet activity and overall consumption trends in China is solid. Further, the “One Belt - One Road” initiative (a massive development strategy proposed by China’s leader, Xi Jinping) promises fiscal stimulus for years to come.
China is growing increasingly data-based as three sectors evolve; entertainment, advertising and e-commerce. The e-commerce market in China is substantially larger than it is in the United States with the major companies generating 35-50% annual sales growth. We believe those growth rates are sustainable for several reasons. First, per capita incomes are rising to levels where spending on personal items is only beginning to accelerate. In addition, companies are finding it easier to monetize their customer bases. Finally, companies are further penetrating third-tier cities where incomes are growing on a percentage basis more rapidly than they are in first and second-tier cities. Not to be underestimated, China’s “third-tier” cities encompass 75 million households.
China’s internet companies are also pushing the envelope in terms of innovation. According to data from Forrester, the mobile payment market in China was $9 trillion last year, almost 90 times the size of the U.S. mobile-payment market. Chinese internet stocks, in aggregate, trade at substantial discounts to their U.S. counterparts, but their growth rates are so much higher that we think valuations can converge somewhat over time.
Our bullish view toward India stems from the emergence of a positive credit cycle, underpinned by significant economic development taking place in the region. One year removed from the government’s “demonetization scheme” the motives for the exchanging of old high value bank notes for new are becoming clearer. It was more than simply a crackdown on corruption and money-laundering. It more fully reflected Prime Minister Narendra Modi’s intent to purge India of socialist-era economic policies - by removing the easy use of cash as a means to operate within that pre-existing framework. Similarly broad in scope (and as important for their economic benefits) the implementation of a goods and service tax (“GST”) as well as bankruptcy reforms have increased productivity in the region.
Politically, the National Congress Party’s opposition to private investment was stifling growth, just as the young populace of India was becoming more aspirational. There is a growing sense in India that government policy should be focused on growing the economy. The people’s response to Prime Minister Modi’s economic initiatives has been to significantly strengthen his influence. Under his leadership, the expansion of market-based credit is providing a path to lift many Indian citizens out of poverty. We think the investment opportunity is in building India’s poor housing stock, which is where many government subsidies are aimed. The Fund’s India exposure currently skews towards the lenders and infrastructure companies we think may benefit disproportionately.
| 1 | See performance table for returns for other share classes. |
| Clough Global Long/Short Fund | Shareholder Letter |
October 31, 2017 (Unaudited)
Technological Innovation
The Fund’s average net exposure during the year to the Information Technology (IT) sector was approximately 17.3%.
A portion of the Fund’s IT contributions came from Chinese internet companies, where overall consumption is driving the accelerated growth of the pre-eminent brands in that part of the world.
The second portion of IT exposure benefiting the portfolio stemmed from our bullish views on the Apple supply chain. Form-factor and functionality advancements in the iPhone X (wireless charging, improved laser sensors, facial recognition, new chipset capabilities, organic light emitting diode (“OLED”) screens, etc.) disproportionately benefit several manufacturers within the supply chain, which the Fund owned during the year.
The third portion of the Fund’s IT gains were derived from our perspective on the secular demand story for the semiconductor chip industry. We think semiconductor companies, often maligned for their boom and bust cycles, have evolved into core holdings on the heels of industry consolidation and amidst secular growth in memory demand. In 2000, half of all semiconductors were used in personal computers (“PCs”). Today, they are used primarily in mobile devices, servers, and for cloud storage in datacenters. Meanwhile, artificial intelligence (specialized machine learning chips) and graphic processors are heavy semiconductor using functions. The “Internet of things” and auto usage are also major secular demand channels.
U.S. Household Formation
The Fund’s average exposure to our U.S. Household Formation theme has been expressed through U.S. homebuilders as well as several consumer companies that we believe are exposed to an increase in household formations. The average weighting to this theme for the entire year was approximately 7.2%, having reached 12.4% of the Fund’s net exposure by fiscal year end.
Millennials are entering the household formation stage of their lives at an older age than previous generations, but this largest cohort of the U.S. population (those born between 1982 and 2004) should not be portrayed as “perpetual renters” simply because of the slow start.
The common representation of a millennial reticent to move out of their parent’s basement or a one bedroom rental unit seems to coalesce with a view that this generation is less loyal to their employer, prefers mobility, and is only interested in spending their income on “experiences” and “entertainment.” In this view, these preferences leave little time to begin a family or to seek a more permanent form of residence - let alone become burdened with the associated expenditures for home furnishings, appliances, or to risk becoming tethered to a monthly cable bill!
Our perspective is a bit different. While household formation may be occurring at a later age than it did for previous generations, we observe a demographic cohort that is well-employed, has high confidence in its earnings power, is effectively working off its student loans and is emerging onto the household formation stage from a position of strength. This is happening in the context of a stable economic backdrop and a regulatory environment that is enabling increased lending to occur at low mortgage rates. Household formation has historically trended around 1.2 million annually, and although it has been running in the range of 1.0 million recently, we think there is opportunity for improvement.
The home-buying tailwind should, we believe, carryover to home renovation, home improvement, and home furnishing companies. Sales trends and purchase intentions for these categories look solid, especially relative to the more tepid overall consumer landscape. Home improvement and housing-related purchases are also generally more difficult to do online, compared to other consumer categories. Many of these purchases require some form of consultation, are harder to ship from a centralized warehouse, and may require installation and a discussion about warranties. These factors create a degree of insulation from online competition, which should help preserve market share and operating margins as overall sales grow.
Existing homeowners should also contribute to a broader trend as they tap into rising home values. The amount of home equity available has risen from $6.3 trillion in 2011 to more than $13 trillion today. TransUnion reported that approximately 10 million homeowners are expected to take out a home equity line of credit in the next four years – more than double the amount of originations between 2012 and 2016. A survey released by the Joint Center for Housing Studies indicated that homeowners are projected to spend in excess of $330 billion on home upgrades and replacements as well as routine maintenance in the coming years. We have positioned the portfolio to seek to benefit from this expected spending spree.
| Annual Report | October 31, 2017 | 3 |
| Clough Global Long/Short Fund | Shareholder Letter |
October 31, 2017 (Unaudited)
Biotechnology and Pharmaceuticals
The Fund’s average exposure to the Healthcare sector has been 10.5% for the year.
This exposure has been focused on biotech and pharmaceutical companies. Because we do not have a clear read on the Republican Party’s ability to deliver real change through approvable legislation, we have avoided investing in the areas of healthcare services that are most levered to the process and potential outcomes, surprise or otherwise. Instead, we have drilled down on finding valuation disconnects within what we think are the most innovative areas of therapeutics and medical devices focused on treating rare disease, oncology and novel aesthetics. Our logic is that the largest players in biotechnology and pharmaceuticals are starved for innovation, flush with cash, and in search of long-duration, high-value pipeline products. We continue to hunt for what we consider to be the ‘must-have’ assets in the sector as we believe scarcity value will continue to increase.
The Short Book
For the fiscal year, shorts had an average weighting of 17.5%, which help to reduce overall volatility in the portfolio, but ultimately detracted from performance. Short positions did become a meaningful tailwind for the portfolio in the second half of the fiscal year and we think they could play a more prominent role in the Fund’s returns at this stage of the capital market cycle.
Equity markets continue to be supported by liquidity in the system, but the increased dispersions and elevated valuations are creating more opportunities on the short side. Returns on invested capital for some of the largest companies appear to be in decline and equity markets are beginning to further differentiate winners and losers. Technically, the indices don’t look particularly exhausted, but some of the bellwether constituents are having a harder time keeping pace.
With the experience-based perspective that comes from managing global long/short strategies at Clough Capital over 18 years, we have always grasped the merits of entering into individually-researched short positions. During extended bull markets (particularly those characterized by the steady exodus of volatility) the benefits of these short positions are not always apparent. Recent performance has demonstrated, once again, the potential for a short book to reduce systemic risk and generate alpha. We have been building our short positions among consumer discretionary stocks, specific healthcare names, and within “legacy” information technology companies.
In Conclusion
Each of our current highest conviction long themes has helped the portfolio during the year, and we see good reason to stay with them for now. We believe that the Emerging Market story remains the single best growth story on the planet and equity prices have responded. The Household Formation thesis has worked well via the homebuilders, and has evolved into a broader perspective regarding the commensurate lift in spending within the home. Healthcare has increased as an area of exposure for the Fund, and we remain focused on the treatments and devices that we believe are insulated from political outcomes. Information Technology, now representing the largest sector of the S&P 500 Index, is underpinned by strong secular growth dynamics. We think the Fund is currently well-positioned with our ongoing investments in these areas.
At this stage of a market cycle, fundamentals begin to matter more. Equity dispersions are rising and our opportunity set is expanding globally. The potential to generate alpha for investors, while reducing systemic risk in the portfolio through individually researched short positions, looks like an increasingly valuable and scarce capability. We appreciate your interest in our approach to investing as we endeavor to outperform the S&P 500 and HFRI Equity Hedge indices over full market cycles, with less volatility.
Sincerely,
 |  |
| | |
| Charles I. Clough, Jr. | Vincent M. Lorusso, Jr. |
| Clough Global Long/Short Fund | Portfolio Performance |
October 31, 2017 (Unaudited)
Performance (as of October 31, 2017)
| | 1 Month | Quarter | 6 Month | 1 Year | Since Inception† |
| Class A - NAV* | 3.20% | 5.08% | 9.16% | 16.97% | 2.89% |
| Class A - MOP* | -2.49% | -0.72% | 3.20% | 10.48% | 0.85% |
| Class C - NAV* | 3.04% | 4.73% | 8.73% | 16.06% | 2.31% |
| Class C - CDSC* | 2.04% | 3.73% | 7.73% | 15.06% | 2.31% |
| Class I - NAV^ | 3.28% | 5.15% | 9.32% | 17.34% | 3.21% |
| S&P 500 Index(a) | 2.33% | 4.76% | 9.10% | 23.63% | 10.50% |
| HFRI Equity Hedge Index(b) | 0.99% | 3.03% | 5.78% | 12.99% | 5.25% |
The performance data quoted above represents past performance. Past performance is not a guarantee of future results. Investment return and value of the Fund shares will fluctuate so that an investor’s shares, when sold or redeemed, may be worth more or less than their original cost. Performance may be lower or higher than performance data quoted. Fund performance current to the most recent month-end is available by calling (855) 425-6844 or by visiting www.cloughglobal.com.
| † | Fund’s commencement date is September 30, 2015. The performance data quoted for periods prior to September 30, 2015 is that of an unregistered investment fund (the “Predecessor Fund”) that was managed by the Adviser and was reorganized into the Fund as of the date the Fund commenced investment operations. The Predecessor Fund was not a registered mutual fund and therefore was not subject to the same investment and tax restrictions as the Fund. Performance information reflects all fees and expenses incurred by the Predecessor Fund, and has not been adjusted to reflect Fund expenses. If it had been so adjusted, the Predecessor Fund’s performance might have been higher or lower for a given period depending on the amount of such expenses incurred for any given period. The Predecessor Fund commenced operations on January 2, 2015. |
| * | Returns shown prior to 9/30/2015 are based on the returns of the Predecessor Fund adjusted to reflect 12b-1 fees and shareholder services fees, as applicable. |
| ^ | Returns shown prior to 9/30/2015 are based on the returns of the Predecessor Fund. |
| (a) | The Standard & Poor’s composite index of 500 stocks, a widely recognized, unmanaged index of common stock prices. Index performance does not reflect fund performance. |
| (b) | An index designed by Hedge Fund Research, Inc. to represent the performance of investment managers who maintain positions both long and short in primarily equity and equity derivative securities. A wide variety of investment processes can be employed by such managers to arrive at an investment decision, including both quantitative and fundamental techniques; strategies can be broadly diversified or narrowly focused on specific sectors and can range broadly in terms of levels of net exposure, leverage employed, holding period, concentrations of market capitalizations and valuation ranges of typical portfolios. The HFRI family of indices reserves the right to revise historical performance data for a period of up to four months following the as of date. The performance shown was calculated using current, available data at the time of publication, but is subject to change outside of the control of the Fund and its affiliates. |
Returns of less than 1 year are cumulative.
An investor cannot invest directly in an index.
| Annual Report | October 31, 2017 | 5 |
| Clough Global Long/Short Fund | Portfolio Performance & Allocation |
October 31, 2017 (Unaudited)
Performance of $10,000 Initial Investment (as of October 31, 2017)
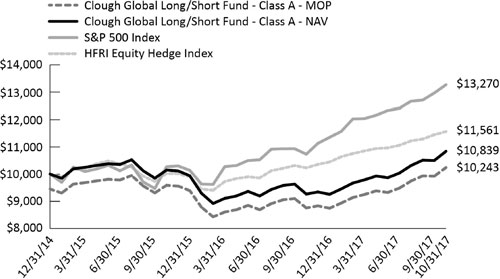
The graph shown above represents historical performance of a hypothetical investment of $10,000 in the Fund since inception. The historical performance prior to September 30, 2015 is that of the Predecessor Fund. Past performance does not guarantee future results. All returns reflect reinvested dividends, but do not reflect the deduction of taxes that a shareholder would pay on Fund distributions or the redemption of Fund shares.
| Top Ten Long Holdings (as a % of Net Assets)* | |
| Apple, Inc. | 3.11% |
| TRI Pointe Group, Inc. | 1.81% |
| Lam Research Corp. | 1.74% |
| Lennar Corp. | 1.71% |
| JPMorgan Chase & Co. | 1.71% |
| Amazon.com, Inc. | 1.62% |
| Samsung Electronics Co., Ltd. | 1.54% |
| PulteGroup, Inc. | 1.53% |
| Liberty Ventures | 1.40% |
| Alibaba Group Holding, Ltd. | 1.39% |
| Top Ten Holdings | 17.56% |
| * | Holdings are subject to change |
| Sector Allocation** | Long Exposure %
TNA | Short Exposure %
TNA | Gross Exposure %
TNA | Net Exposure %
TNA |
| Consumer Discretionary | 32.2% | -3.6% | 35.8% | 28.6% |
| Information Technology | 26.0% | -7.7% | 33.7% | 18.3% |
| Health Care | 14.5% | -3.2% | 17.7% | 11.3% |
| Financials | 9.6% | -3.8% | 13.4% | 5.8% |
| Real Estate | 1.5% | 0.0% | 1.5% | 1.5% |
| Consumer Staples | 2.4% | -0.9% | 3.3% | 1.5% |
| Industrials | 1.6% | -0.9% | 2.5% | 0.7% |
| Telecommunication Services | 0.4% | 0.0% | 0.4% | 0.4% |
| Total Investments | 88.2% | -20.1% | 108.3% | 68.1% |
| Clough Global Long/Short Fund | Portfolio Allocation |
October 31, 2017 (Unaudited)
| Country Allocation ** | Long Exposure %
TNA | Short Exposure %
TNA | Gross Exposure %
TNA | Net Exposure %
TNA |
| United States | 46.2% | -11.3% | 57.5% | 34.9% |
| China | 11.0% | 0.0% | 11.00% | 11.0% |
| Multinational | 10.9% | -3.5% | 14.4% | 7.4% |
| India | 6.4% | 0.0% | 6.4% | 6.4% |
| Japan | 4.4% | -0.7% | 5.1% | 3.7% |
| Europe | 3.8% | -1.6% | 5.4% | 2.2% |
| Other Emerging Markets | 4.3% | -3.0% | 7.3% | 1.3% |
| Other Developed Markets | 1.2% | 0.0% | 1.2% | 1.2% |
| Total Investments | 88.2% | -20.1% | 108.3% | 68.1% |
| ** | Allocation summaries and top ten long holdings calculated as percent of total net assets using market value of cash traded securities, notional value of derivative contracts and excluding short-term investments and futures. |
| Annual Report | October 31, 2017 | 7 |
| Clough Global Long/Short Fund | Disclosure of Fund Expenses |
October 31, 2017 (Unaudited)
Examples. As a shareholder of the Clough Global Long/Short Fund (the “Fund”), you incur two types of costs: (1) transaction costs, including applicable redemption fees and sales charges (loads); and (2) ongoing costs, including management fees, distribution and service (12b-1) fees and other Fund expenses. The following examples are intended to help you understand your ongoing costs (in dollars) of investing in the Fund and to compare these costs with the ongoing costs of investing in other mutual funds. The examples are based on an investment of $1,000 invested on May 1, 2017 and held through October 31, 2017.
Actual Expenses. The first line of the table below provides information about actual account values and actual expenses. You may use the information in this line, together with the amount you invested, to estimate the expenses that you paid over the period. Simply divide your account value by $1,000 (for example, an $8,600 account value divided by $1,000 = 8.6), then multiply the result by the number in the first line under the heading “Expenses Paid During Period May 1, 2017 – October 31, 2017” to estimate the expenses you paid on your account during this period.
Hypothetical Example for Comparison Purposes. The second line of the table below provides information about hypothetical account values and hypothetical expenses based on the Fund’s actual expense ratio and an assumed rate of return of 5% per year before expenses, which is not the Fund’s actual return. The hypothetical account values and expenses may not be used to estimate the actual ending account balance or expenses you paid for the period. You may use this information to compare the ongoing costs of investing in the Fund and other mutual funds. To do so, compare this 5% hypothetical example with the 5% hypothetical examples that appear in the shareholder reports of the other mutual funds.
Please note that the expenses shown in the table are meant to highlight your ongoing Fund costs only and do not reflect any transactional costs, such as redemption fees. Therefore, the second line of the table below is useful in comparing ongoing costs only and may not help you determine the relative total costs of owning different funds. In addition, if these transactional costs were included, your costs would have been higher.
| | Beginning Account Value 05/01/17 | Ending
Account Value
10/31/17 | Expense Ratio(a)(b) | Expenses Paid During period 05/01/17 - 10/31/17(c) |
| Clough Global Long/Short Fund | | | | |
| Class A | | | | |
| Actual | $1,000.00 | $1,091.60 | 2.34% | $12.34 |
| Hypothetical (5% return before expenses) | $1,000.00 | $1,013.41 | 2.34% | $11.88 |
| Class C | | | | |
| Actual | $1,000.00 | $1,087.30 | 3.05% | $16.05 |
| Hypothetical (5% return before expenses) | $1,000.00 | $1,009.83 | 3.05% | $15.45 |
| Class I | | | | |
| Actual | $1,000.00 | $1,093.20 | 2.07% | $10.92 |
| Hypothetical (5% return before expenses) | $1,000.00 | $1,014.77 | 2.07% | $10.51 |
| (a) | Expense ratio excluding interest expense and dividends paid on borrowed securities for the Clough Global Long/Short Fund is 1.89%, 2.60% and 1.60% for Class A, Class C and Class I respectively. |
| (b) | Annualized, based on the Fund's most recent fiscal half year expenses. |
| (c) | Expenses are equal to the Fund's annualized expense ratio multiplied by the average account value over the period, multiplied by the number of days in the most recent fiscal half-year (184)/365 (to reflect the half-year period). |
| Clough Global Long/Short Fund | Statement of Investments |
October 31, 2017
| | | Shares | | | Value | |
| COMMON STOCKS 79.54% | | | | | | | | |
| Consumer Discretionary 29.26%(a) | | | | | | | | |
| Altice USA, Inc. - Class A(b) | | | 5,200 | | | $ | 123,136 | |
| Amazon.com, Inc.(b) | | | 438 | | | | 484,113 | |
| AMC Entertainment Holdings, Inc. -Class A | | | 14,400 | | | | 200,160 | |
| ANTA Sports Products, Ltd. | | | 34,000 | | | | 152,101 | |
| BYD Co., Ltd. - Class H | | | 18,500 | | | | 162,083 | |
| Cable One, Inc. | | | 185 | | | | 131,315 | |
| Carter's, Inc. | | | 2,750 | | | | 266,007 | |
| Carvana Co.(b) | | | 20,700 | | | | 293,526 | |
| Children's Place, Inc. | | | 2,000 | | | | 217,600 | |
| Cinemark Holdings, Inc. | | | 6,100 | | | | 221,674 | |
| Ctrip.com International, Ltd. - ADR(b) | | | 3,954 | | | | 189,357 | |
| DR Horton, Inc.(c) | | | 8,960 | | | | 396,122 | |
| Floor & Decor Holdings, Inc. - Class A(b) | | | 5,900 | | | | 222,430 | |
| The Home Depot, Inc. | | | 2,400 | | | | 397,872 | |
| IMAX Corp.(b) | | | 15,860 | | | | 384,605 | |
| JD.com, Inc. - ADR(b) | | | 8,200 | | | | 307,664 | |
| Lennar Corp. - Class A(c) | | | 9,219 | | | | 513,222 | |
| Liberty Broadband Corp. - Class C(b)(c) | | | 4,259 | | | | 371,768 | |
| Liberty Ventures - Series A(b)(c) | | | 7,371 | | | | 419,852 | |
| Man Wah Holdings, Ltd. | | | 179,200 | | | | 161,710 | |
| Panasonic Corp. | | | 14,800 | | | | 221,339 | |
| Pool Corp. | | | 2,700 | | | | 326,106 | |
| PulteGroup, Inc.(c) | | | 15,173 | | | | 458,680 | |
| Regal Entertainment Group - Class A | | | 13,600 | | | | 222,360 | |
| Service Corp. International | | | 6,936 | | | | 245,951 | |
| Sony Corp. | | | 6,100 | | | | 236,747 | |
| Toll Brothers, Inc.(c) | | | 8,100 | | | | 372,924 | |
| TRI Pointe Group, Inc.(b)(c) | | | 30,600 | | | | 541,314 | |
| Wayfair, Inc. - Class A(b) | | | 4,000 | | | | 279,600 | |
| zooplus AG(b) | | | 1,422 | | | | 235,791 | |
| | | | | | | | 8,757,129 | |
| | | | | | | | | |
| Consumer Staples 1.18% | | | | | | | | |
| Japan Tobacco, Inc. | | | 5,000 | | | | 164,768 | |
| Prestige Brands Holdings, Inc.(b) | | | 4,030 | | | | 189,007 | |
| | | | | | | | 353,775 | |
| | | | | | | | | |
| Financials 6.96% | | | | | | | | |
| Bank of America Corp.(c) | | | 15,050 | | | | 412,220 | |
| Citigroup, Inc.(c) | | | 5,649 | | | | 415,202 | |
| Credit Acceptance Corp.(b)(c) | | | 673 | | | | 192,969 | |
| Franklin Resources, Inc. | | | 6,400 | | | | 269,632 | |
| JPMorgan Chase & Co. | | | 5,100 | | | | 513,111 | |
| Ping An Insurance Group Co. of China, Ltd. - Class H | | | 32,000 | | | | 280,975 | |
| | | | | | | | 2,084,109 | |
| Health Care 14.47% | | | | | | | | |
| Alexion Pharmaceuticals, Inc.(b)(c) | | | 859 | | | | 102,788 | |
| Align Technology, Inc.(b) | | | 1,015 | | | | 242,565 | |
| | | Shares | | | Value | |
| Health Care (continued) | | | | | | | | |
| Allergan PLC | | | 250 | | | $ | 44,307 | |
| Biogen, Inc.(b) | | | 818 | | | | 254,938 | |
| BioMarin Pharmaceutical, Inc.(b) | | | 1,236 | | | | 101,463 | |
| Bioverativ, Inc.(b)(c) | | | 2,200 | | | | 124,300 | |
| Bluebird Bio, Inc.(b) | | | 1,100 | | | | 153,010 | |
| Cardiome Pharma Corp.(b) | | | 31,770 | | | | 55,915 | |
| Celgene Corp.(b) | | | 1,647 | | | | 166,298 | |
| Clovis Oncology, Inc.(b) | | | 3,135 | | | | 236,285 | |
| CRISPR Therapeutics AG(b) | | | 17,200 | | | | 331,960 | |
| Dermira, Inc.(b)(c) | | | 12,800 | | | | 342,656 | |
| Express Scripts Holding Co.(b) | | | 2,400 | | | | 147,096 | |
| Galapagos NV - Sponsored ADR(b) | | | 2,083 | | | | 203,051 | |
| GW Pharmaceuticals PLC - ADR(b) | | | 1,371 | | | | 147,999 | |
| Hologic, Inc.(b) | | | 3,248 | | | | 122,937 | |
| Intra - Cellular Therapies, Inc.(b) | | | 13,200 | | | | 205,788 | |
| iRhythm Technologies, Inc.(b) | | | 3,300 | | | | 168,135 | |
| Jazz Pharmaceuticals PLC(b) | | | 900 | | | | 127,377 | |
| Keryx Biopharmaceuticals, Inc.(b) | | | 47,100 | | | | 305,208 | |
| Pacira Pharmaceuticals, Inc.(b) | | | 3,900 | | | | 124,995 | |
| Sienna Biopharmaceuticals, Inc.(b) | | | 5,700 | | | | 111,720 | |
| Vertex Pharmaceuticals, Inc.(b) | | | 1,182 | | | | 172,844 | |
| WAVE Life Sciences, Ltd.(b) | | | 14,600 | | | | 336,530 | |
| | | | | | | | 4,330,165 | |
| | | | | | | | | |
| Industrials 0.68% | | | | | | | | |
| GS Yuasa Corp. | | | 41,000 | | | | 204,450 | |
| | | | | | | | | |
| Information Technology 25.02%(a) | | | | | | | | |
| AAC Technologies Holdings, Inc. | | | 8,500 | | | | 155,587 | |
| Alibaba Group Holding, Ltd. - Sponsored ADR(b) | | | 2,250 | | | | 416,002 | |
| ams AG | | | 2,343 | | | | 213,598 | |
| Apple, Inc.(c) | | | 5,500 | | | | 929,720 | |
| Baidu, Inc. - Sponsored ADR(b) | | | 1,354 | | | | 330,295 | |
| Baozun, Inc. - Sponsored ADR(b) | | | 8,300 | | | | 260,537 | |
| Broadcom, Ltd. | | | 1,176 | | | | 310,358 | |
| | | | | | | | | |
| Cognizant Technology Solutions Corp.- Class A | | | 2,800 | | | | 211,876 | |
| Cypress Semiconductor Corp. | | | 12,000 | | | | 190,320 | |
| Facebook, Inc. - Class A(b) | | | 1,700 | | | | 306,102 | |
| Hon Hai Precision Industry Co., Ltd. | | | 39,000 | | | | 144,830 | |
| Lam Research Corp.(c) | | | 2,500 | | | | 521,425 | |
| LogMeIn, Inc. | | | 2,440 | | | | 295,362 | |
| Micron Technology, Inc.(b) | | | 4,100 | | | | 181,671 | |
| Microsemi Corp.(b) | | | 2,700 | | | | 144,099 | |
| Microsoft Corp. | | | 4,800 | | | | 399,264 | |
| Nintendo Co., Ltd. | | | 679 | | | | 261,556 | |
| Salesforce.com, Inc.(b) | | | 3,700 | | | | 378,658 | |
| Samsung Electronics Co., Ltd. | | | 187 | | | | 459,676 | |
| Silergy Corp. | | | 8,000 | | | | 172,682 | |
| Taiwan Semiconductor Manufacturing Co., Ltd. - Sponsored ADR | | | 7,800 | | | | 330,174 | |
| Annual Report | October 31, 2017 | 9 |
| Clough Global Long/Short Fund | Statement of Investments |
October 31, 2017
| | | Shares | | | Value | |
| Information Technology (continued) | | | | | | | | |
| Ulvac, Inc. | | | 3,300 | | | $ | 231,890 | |
| ViaSat, Inc.(b)(c) | | | 4,200 | | | | 273,420 | |
| Win Semiconductors Corp. | | | 27,000 | | | | 220,677 | |
| Yelp, Inc.(b)(c) | | | 3,200 | | | | 149,504 | |
| | | | | | | | 7,489,283 | |
| | | | | | | | | |
| Real Estate 1.54% | | | | | | | | |
| Blackstone Mortgage Trust, Inc. - Class A | | | 7,400 | | | | 235,542 | |
| Starwood Property Trust, Inc. | | | 10,500 | | | | 225,855 | |
| | | | | | | | 461,397 | |
| | | | | | | | | |
| Telecommunication Services 0.43% | | | | | | | | |
| Sarana Menara Nusantara PT | | | 423,600 | | | | 128,056 | |
| | | | | | | | | |
| TOTAL COMMON STOCKS | | | | | | | | |
| (Cost $20,551,102) | | | | | | | 23,808,364 | |
| | | | | | | | | |
| CLOSED-END FUNDS 1.01% | | | | | | | | |
| Altaba, Inc.(b) | | | 4,300 | | | | 301,516 | |
| | | | | | | | | |
| TOTAL CLOSED-END FUNDS | | | | | | | | |
| (Cost $286,139) | | | | | | | 301,516 | |
| | | | | | | | | |
| PARTICIPATION NOTES 1.37% | | | | | | | | |
| Consumer Discretionary 0.87% | | | | | | | | |
| Midea Group Co., Ltd. - Class A (Loan | | | | | | | | |
| Participation Notes issued by Morgan Stanley Asia Products), expiring 05/13/2019(d) | | | 33,800 | | | | 260,102 | |
| | | | | | | | | |
| Consumer Staples 0.50% | | | | | | | | |
| Kweichow Moutai Co., Ltd. - Class A (Loan Participation Notes issued by Morgan Stanley Asia Products), expiring 11/09/2017(d) | | | 1,625 | | | | 151,537 | |
| | | | | | | | | |
| TOTAL PARTICIPATION NOTES | | | | | | | | |
| (Cost $249,705) | | | | | | | 411,639 | |
| | | Shares | | | Value | |
| SHORT-TERM INVESTMENTS 16.62% | | | | | | | | |
| Money Market Fund 16.62% | | | | | | | | |
| BlackRock Liquidity Funds, T-Fund Portfolio - Institutional Class (0.936% 7-day yield) | | | 4,975,725 | | | $ | 4,975,725 | |
| | | | | | | | | |
| TOTAL SHORT-TERM INVESTMENTS | | | | | | | | |
| (Cost $4,975,725) | | | | | | | 4,975,725 | |
| | | | | | | | | |
| Total Investments - 98.54% | | | | | | | | |
| (Cost $26,062,671) | | | | | | | 29,497,244 | |
| | | | | | | | | |
| Other Assets in Excess of Liabilities - 1.46%(e) | | | | | | | 436,374 | |
| | | | | | | | | |
| NET ASSETS - 100.00% | | | | | | $ | 29,933,618 | |
| SCHEDULE OF SECURITIES SOLD SHORT(b) | | Shares | | | Value | |
| COMMON STOCKS (19.11%) | | | | | | | | |
| Consumer Discretionary (3.63%) | | | | | | | | |
| Chipotle Mexican Grill, Inc. | | | (580 | ) | | | (157,702 | ) |
| Dick's Sporting Goods, Inc. | | | (10,600 | ) | | | (259,382 | ) |
| Viacom, Inc. - Class B | | | (11,100 | ) | | | (266,733 | ) |
| Williams-Sonoma, Inc. | | | (7,800 | ) | | | (402,480 | ) |
| | | | | | | | (1,086,297 | ) |
| | | | | | | | | |
| Consumer Staples (0.91%) | | | | | | | | |
| Walgreens Boots Alliance, Inc. | | | (4,100 | ) | | | (271,707 | ) |
| | | | | | | | | |
| Financials (3.78%) | | | | | | | | |
| Ally Financial, Inc. | | | (12,290 | ) | | | (321,138 | ) |
| American Express Co. | | | (2,553 | ) | | | (243,862 | ) |
| Deutsche Bank AG | | | (16,100 | ) | | | (261,947 | ) |
| Santander Consumer USA Holdings, Inc. | | | (18,200 | ) | | | (302,848 | ) |
| | | | | | | | (1,129,795 | ) |
| | | | | | | | | |
| Health Care (3.20%) | | | | | | | | |
| AmerisourceBergen Corp. | | | (3,447 | ) | | | (265,246 | ) |
| Cardinal Health, Inc. | | | (4,200 | ) | | | (259,980 | ) |
| McKesson Corp. | | | (1,941 | ) | | | (267,625 | ) |
| Owens & Minor, Inc. | | | (6,700 | ) | | | (164,619 | ) |
| | | | | | | | (957,470 | ) |
| | | | | | | | | |
| Industrials (0.91%) | | | | | | | | |
| Jacobs Engineering Group, Inc. | | | (4,694 | ) | | | (273,238 | ) |
| | | | | | | | | |
| Information Technology (6.68%) | | | | | | | | |
| AU Optronics Corp. - Sponsored ADR | | | (86,234 | ) | | | (354,422 | ) |
| Gogo, Inc. | | | (20,000 | ) | | | (198,800 | ) |
| Ingenico Group SA | | | (2,340 | ) | | | (227,164 | ) |
| Intel Corp | | | (3,586 | ) | | | (163,127 | ) |
| International Business Machines Corp. | | | (2,765 | ) | | | (425,976 | ) |
| Clough Global Long/Short Fund | Statement of Investments |
October 31, 2017
| SCHEDULE OF SECURITIES SOLD SHORT(b) (continued) | | Shares | | | Value | |
| Information Technology (continued) | | | | | | | | |
| LG Display Co., Ltd. - ADR | | | (18,100 | ) | | $ | (235,119 | ) |
| LINE Corp. - Sponsored ADR | | | (5,400 | ) | | | (224,154 | ) |
| Manhattan Associates, Inc. | | | (4,100 | ) | | | (171,626 | ) |
| | | | | | | | (2,000,388 | ) |
| | | | | | | | | |
| TOTAL COMMON STOCKS | | | | | | | | |
| (Proceeds $5,759,578) | | | | | | | (5,718,895 | ) |
| | | | | | | | | |
| TOTAL SECURITIES SOLD SHORT | | | | | | | | |
| (Proceeds $5,759,578) | | | | | | $ | (5,718,895 | ) |
| (a) | When sector categorization is categorized by industry, no industry exceeds the 25% maximum specified in the Statement of Additional Information. |
| (b) | Non-income producing security. |
| (c) | Pledged security; a portion or all of the security is pledged as collateral for total return swap contracts and securities sold short. As of October 31, 2017, the aggregate market value of those securities was $1,997,284, representing 6.67% of net assets. (See Note 1) |
| (d) | Security exempt from registration of the Securities Act of 1933. These securities may be resold in transactions exempt from registration under Rule 144A, normally to qualified institutional buyers. As of October 31, 2017, the aggregate value of those securities was $411,639 or 1.38% of net assets. |
| (e) | Includes cash which is being held as collateral for total return swap contracts or securities sold short. |
TOTAL RETURN SWAP CONTRACTS
| Counter Party | | Reference Entity/Obligation | | Notional Amount | | | Floating Rate
Paid by the Fund | | Floating Rate Index | | Termination Date | | Market Value | | | Net Unrealized Appreciation | |
| Morgan Stanley | | Edelweiss Financial Services, Ltd. | | $ | 89,075 | | | 225 bps + 1D FEDEF | | 1 D FEDEF | | 07/12/2018 | | $ | 212,633 | | | $ | 123,558 | |
| Morgan Stanley | | Hero MotoCorp, Ltd. | | | 166,308 | | | 225 bps + 1D FEDEF | | 1 D FEDEF | | 10/18/2018 | | | 219,565 | | | | 53,257 | |
| Morgan Stanley | | Housing Development Finance Corp. | | | 205,372 | | | 225 bps + 1D FEDEF | | 1 D FEDEF | | 10/18/2018 | | | 283,928 | | | | 78,556 | |
| Morgan Stanley | | Indiabulls Housing Finance, Ltd. | | | 157,900 | | | 225 bps + 1D FEDEF | | 1 D FEDEF | | 07/12/2018 | | | 243,293 | | | | 85,393 | |
| Morgan Stanley | | Innolux Corp. | | | (181,703 | ) | | 1D FEDEF - 510 bps | | 1 D FEDEF | | 07/12/2018 | | | (172,006 | ) | | | 9,697 | |
| Morgan Stanley | | ITC, Ltd. | | | 194,848 | | | 225 bps + 1D FEDEF | | 1 D FEDEF | | 10/18/2018 | | | 224,583 | | | | 29,735 | |
| Morgan Stanley | | Larsen & Toubro, Ltd. | | | 198,774 | | | 225 bps + 1D FEDEF | | 1 D FEDEF | | 10/18/2018 | | | 281,537 | | | | 82,763 | |
| Morgan Stanley | | Mahindra & Mahindra, Ltd. | | | 304,655 | | | 225 bps + 1D FEDEF | | 1 D FEDEF | | 10/18/2018 | | | 355,036 | | | | 50,381 | |
| Morgan Stanley | | United Microelectronics Corp. | | | (144,288 | ) | | 1D FEDEF -75 bps | | 1 D FEDEF | | 09/24/2019 | | | (140,817 | ) | | | 3,471 | |
| | | | | $ | 990,941 | | | | | | | | | $ | 1,507,752 | | | $ | 516,811 | |
Investment Abbreviations:
1D FEDEF - Federal Funds Effective Rate (Daily)
For Fund compliance purposes, the Fund’s sector classifications refer to any one of the sector sub-classifications used by one or more widely recognized market indexes, and/or as defined by the Fund's management. This definition may not apply for purposes of this report, which may combine sector sub-classifications for reporting ease. Sectors are shown as a percent of net assets. These sector classifications are unaudited.
See Notes to the Financial Statements.
| Annual Report | October 31, 2017 | 11 |
| Clough Global Long/Short Fund | Statement of Assets and Liabilities |
October 31, 2017
| ASSETS: | | |
| | | |
| Investments, at value (Cost - see below) | | $ | 29,497,244 | |
| Cash | | | 85,523 | |
| Foreign currency, at value (Cost $160,537) | | | 160,704 | |
| Deposit with broker for securities sold short | | | 5,136,882 | |
| Deposit with broker for total return swap contracts | | | 839,047 | |
| Unrealized appreciation on total return swap contracts | | | 516,811 | |
| Interest receivable - margin account | | | 778 | |
| Dividends receivable | | | 5,076 | |
| Interest receivable | | | 129 | |
| Receivable for investments sold | | | 401,862 | |
| Receivable for shares sold | | | 33,178 | |
| Prepaid expenses and other assets | | | 21,687 | |
| Due from Adviser | | | 16,607 | |
| Total Assets | | | 36,715,528 | |
| | | | | |
| LIABILITIES: | | | | |
| | | | | |
| Securities sold short (Proceeds $5,759,578) | | | 5,718,895 | |
| Payable for investments purchased | | | 942,279 | |
| Dividends payable - short sales | | | 6,564 | |
| Accrued distribution and service fees | | | 117 | |
| Accrued legal expense | | | 35,560 | |
| Accrued administration fee | | | 6,406 | |
| Accrued trustees fee | | | 6,131 | |
| Other payables and accrued expenses | | | 65,958 | |
| Total Liabilities | | | 6,781,910 | |
| Net Assets | | $ | 29,933,618 | |
| Cost of Investments | | $ | 26,062,671 | |
| | | | | |
| COMPOSITION OF NET ASSETS: | | | | |
| | | | | |
| Paid-in capital | | $ | 27,599,761 | |
| Accumulated net investment loss | | | (645,999 | ) |
| Accumulated net realized loss | | | (1,012,297 | ) |
| Net unrealized appreciation | | | 3,992,153 | |
| Net Assets | | $ | 29,933,618 | |
| PRICING OF CLASS A SHARES: | | | | |
| Net Assets | | $ | 209,725 | |
| Shares outstanding of no par value, unlimited shares authorized | | | 19,143 | |
| Net Asset Value, offering and redemption price per share | | $ | 10.96 | |
| Maximum offering price per share (NAV/0.945), based on maximum sales charge of 5.50% of the offering price | | $ | 11.60 | |
| PRICING OF CLASS C SHARES: | | | | |
| Net Assets | | $ | 94,989 | |
| Shares outstanding of no par value, unlimited shares authorized | | | 8,760 | |
| Net Asset Value, offering and redemption price per share | | $ | 10.84 | |
| PRICING OF CLASS I SHARES: | | | | |
| Net Assets | | $ | 29,628,904 | |
| Shares outstanding of no par value, unlimited shares authorized | | | 2,687,347 | |
| Net Asset Value, offering and redemption price per share | | $ | 11.03 | |
See Notes to the Financial Statements.
| Clough Global Long/Short Fund | Statement of Operations |
For the year ended October 31, 2017
| INVESTMENT INCOME: | | | | |
| | | | | |
| Dividends (net of foreign withholding taxes of $4,833) | | $ | 344,409 | |
| Total Income | | | 344,409 | |
| | | | | |
| EXPENSES: | | | | |
| | | | | |
| Investment advisory fees | | | 466,296 | |
| Distribution and shareholder service fees: | | | | |
| Class A | | | 330 | |
| Class C | | | 710 | |
| Administration fees | | | 57,697 | |
| Interest expense - margin account | | | 3,737 | |
| Trustees fees | | | 88,048 | |
| Registration fees | | | 47,983 | |
| Dividend expense - short sales | | | 120,035 | |
| Custodian fees | | | 50,662 | |
| Audit & Tax Services fees | | | 45,730 | |
| Legal fees | | | 142,056 | |
| Printing fees | | | 7,537 | |
| Insurance fees | | | 25,956 | |
| Transfer agent fees | | | 33,342 | |
| Delegated transfer agent fees: | | | | |
| Class A | | | 48 | |
| Class C | | | 9 | |
| Class I | | | 1,827 | |
| Other expenses | | | 16,739 | |
| Total Expenses Before Waivers and/or Reimbursements | | | 1,108,742 | |
| Less fees waived and/or reimbursed by Adviser: | | | | |
| Class A | | | (1,398 | ) |
| Class C | | | (968 | ) |
| Class I | | | (429,730 | ) |
| Net Expenses | | | 676,646 | |
| Net Investment Loss | | | (332,237 | ) |
| | | | | |
| NET REALIZED GAIN/(LOSS) ON: | | | | |
| Investment securities | | | 5,351,710 | |
| Futures contracts | | | 108,870 | |
| Securities sold short | | | (1,387,954 | ) |
| Total return swap contracts | | | 158,203 | |
| Foreign currency transactions | | | (14,199 | ) |
| Net realized gain | | | 4,216,630 | |
| NET CHANGE IN UNREALIZED APPRECIATION/DEPRECIATION ON: | | | | |
| Investment securities | | | 1,322,096 | |
| Futures contracts | | | (15,429 | ) |
| Securities sold short | | | (412,815 | ) |
| Total return swap contracts | | | 531,897 | |
| Translation of assets and liabilities denominated in foreign currencies | | | 2,075 | |
| Net change in unrealized appreciation | | | 1,427,824 | |
| Net realized and unrealized gain | | | 5,644,454 | |
| Net Increase in Net Assets from Operations | | $ | 5,312,217 | |
See Notes to the Financial Statements.
| Annual Report | October 31, 2017 | 13 |
| Clough Global Long/Short Fund | Statement of Changes in Net Assets |
| | | For the
Year Ended
October 31,
2017 | | | For the
Year Ended
October 31,
2016 | |
| OPERATIONS: | | | | | | | | |
| | | | | | | | | |
| Net investment loss | | $ | (332,237 | ) | | $ | (556,123 | ) |
| Net realized gain/(loss) | | | 4,216,630 | | | | (5,002,666 | ) |
| Net change in unrealized appreciation | | | 1,427,824 | | | | 1,851,636 | |
| Net Increase/(Decrease) in Net Assets From Operations | | | 5,312,217 | | | | (3,707,153 | ) |
| | | | | | | | | |
| DISTRIBUTIONS TO COMMON SHAREHOLDERS: | | | | | | | | |
| Class A | | | | | | | | |
| Net realized gains | | | – | | | | (100 | ) |
| Net Decrease in Net Assets from Distributions | | | – | | | | (100 | ) |
| | | | | | | | | |
| Class C | | | | | | | | |
| Net realized gains | | | – | | | | (96 | ) |
| Net Decrease in Net Assets from Distributions | | | – | | | | (96 | ) |
| | | | | | | | | |
| Class I | | | | | | | | |
| Net realized gains | | | – | | | | (152,783 | ) |
| Net Decrease in Net Assets from Distributions | | | – | | | | (152,783 | ) |
| | | | | | | | | |
| CAPITAL SHARE TRANSACTIONS: | | | | | | | | |
| Class A | | | | | | | | |
| Proceeds from shares sold | | | 124,598 | | | | 52,168 | |
| Net asset value of shares issued in reinvestment of distributions to shareholders | | | – | | | | 100 | |
| Payments for shares redeemed | | | (6,586 | ) | | | (48 | ) |
| Net Increase in Net Assets From Investor Capital Share Transactions | | | 118,012 | | | | 52,220 | |
| | | | | | | | | |
| Class C | | | | | | | | |
| Proceeds from shares sold | | | 19,994 | | | | 49,300 | |
| Net asset value of shares issued in reinvestment of distributions to shareholders | | | – | | | | 96 | |
| Payments for shares redeemed | | | (8,916 | ) | | | – | |
| Net Increase in Net Assets From Class C Capital Share Transactions | | | 11,078 | | | | 49,396 | |
| | | | | | | | | |
| Class I | | | | | | | | |
| Proceeds from shares sold | | | 5,582,746 | | | | 18,945,076 | |
| Net asset value of shares issued in reinvestment of distributions to shareholders | | | – | | | | 152,783 | |
| Payments for shares redeemed | | | (25,241,907 | ) | | | (7,000,003 | ) |
| Net Increase/(Decrease) in Net Assets From Class I Capital Share Transactions | | | (19,659,161 | ) | | | 12,097,856 | |
| | | | | | | | | |
| Total Increase (Decrease) in Net Assets | | $ | (14,217,854 | ) | | $ | 8,339,340 | |
| | | | | | | | | |
| NET ASSETS: | | | | | | | | |
| Beginning of period | | | 44,151,472 | | | | 35,812,132 | |
| End of period* | | $ | 29,933,618 | | | $ | 44,151,472 | |
| *Includes accumulated net investment loss of: | | $ | (645,999 | ) | | $ | (317,399 | ) |
See Notes to the Financial Statements.
| Clough Global Long/Short Fund – Class A | Financial Highlights |
For a share outstanding throughout the period indicated
| | | For the
Year Ended
October 31,
2017 | | | For the
Year Ended
October 31,
2016 | | | For the Period September 30, 2015 (commencement) to October 31, 2015 | |
| PER SHARE OPERATING PERFORMANCE: | | | | | | | | | |
| NET ASSET VALUE, BEGINNING OF PERIOD | | $ | 9.37 | | | $ | 10.30 | | | $ | 10.00 | |
| INCOME/(LOSS) FROM OPERATIONS: | | | | | | | | | | | | |
| Net investment loss(a) | | | (0.14 | ) | | | (0.15 | ) | | | (0.02 | ) |
| Net realized and unrealized gain/(loss) on investments | | | 1.73 | | | | (0.74 | ) | | | 0.32 | |
| Total from Investment Operations | | | 1.59 | | | | (0.89 | ) | | | 0.30 | |
| | | | | | | | | | | | | |
| DISTRIBUTIONS TO COMMON SHAREHOLDERS FROM: | | | | | | | | | | | | |
| Net realized gains | | | – | | | | (0.04 | ) | | | – | |
| Total Distributions to Common Shareholders | | | – | | | | (0.04 | ) | | | – | |
| Net asset value - end of period | | $ | 10.96 | | | $ | 9.37 | | | $ | 10.30 | |
| | | | | | | | | | | | | |
| Total Investment Return - Net Asset Value(b) | | | 16.97 | % | | | (8.68 | )% | | | 3.00 | % |
| | | | | | | | | | | | | |
| RATIOS AND SUPPLEMENTAL DATA: | | | | | | | | | | | | |
| Net assets attributable to common shares, end of period (in 000s) | | $ | 210 | | | $ | 76 | | | $ | 27 | |
| | | | | | | | | | | | | |
| RATIOS TO AVERAGE NET ASSETS (including interest expense and dividend expense on securities sold short) | | | | | | | | | | | | |
| Operating expenses excluding fee waivers/reimbursements(c) | | | 3.78 | % | | | 4.23 | % | | | 6.44 | %(d) |
| Operating expenses including fee waivers/reimbursements(c) | | | 2.29 | % | | | 2.85 | % | | | 2.67 | %(d) |
| Net investment loss including fee waivers/reimbursements(c) | | | (1.36 | )% | | | (1.57 | )% | | | (2.00 | )%(d) |
| RATIOS TO AVERAGE NET ASSETS (excluding interest expense and dividend expense on securities sold short) | | | | | | | | | | | | |
| Operating expenses excluding fee waivers/reimbursements(c) | | | 3.38 | % | | | 3.33 | % | | | 5.72 | %(d) |
| Operating expenses including fee waivers/reimbursements(c) | | | 1.89 | %(e) | | | 1.95 | % | | | 1.95 | %(d) |
| Net investment loss including fee waivers/reimbursements(c) | | | (0.96 | )% | | | (0.67 | )% | | | (1.28 | )%(d) |
| | | | | | | | | | | | | |
| PORTFOLIO TURNOVER RATE(f) | | | 237 | % | | | 261 | % | | | 22 | % |
| (a) | Per share amounts are based upon average shares outstanding. |
| (b) | Total investment return is for the period indicated and has not been annualized. The total investment return would have been lower had certain expenses not been waived / reimbursed during the period. The return shown does not reflect the deduction of taxes that a shareholder would pay on Fund distributions or the redemption of Fund shares. Total investment return does not reflect the effect of sales charge. |
| (c) | Expense ratios before reductions for startup periods may not be representative of longer term operating periods. |
| (e) | According to the Fund's shareholder services plan with respect to the Fund's Class A shares, any amount of such payment not paid during the Fund's fiscal year for such services activities shall be reimbursed to the Fund as soon as practical after the end of the fiscal year. Fees were reimbursed to the Fund during the year ended September 30, 2017, for the prior fiscal year in the amount of 0.06% of average net assets of Class A shares. |
| (f) | Portfolio turnover rate for periods less than one full year have not been annualized and is calculated at the Fund level. |
See Notes to the Financial Statements.
| Annual Report | October 31, 2017 | 15 |
| Clough Global Long/Short Fund – Class C | Financial Highlights |
For a share outstanding throughout the period indicated
| | | For the
Year Ended
October 31,
2017 | | | For the
Year Ended
October 31,
2016 | | | For the Period September 30, 2015 (commencement) to October 31, 2015 | |
| PER SHARE OPERATING PERFORMANCE: | | | | | | | | | |
| NET ASSET VALUE, BEGINNING OF PERIOD | | $ | 9.34 | | | $ | 10.30 | | | $ | 10.00 | |
| INCOME/(LOSS) FROM OPERATIONS: | | | | | | | | | | | | |
| Net investment loss(a) | | | (0.20 | ) | | | (0.21 | ) | | | (0.02 | ) |
| Net realized and unrealized gain/(loss) on investments | | | 1.70 | | | | (0.71 | ) | | | 0.32 | |
| Total from Investment Operations | | | 1.50 | | | | (0.92 | ) | | | 0.30 | |
| | | | | | | | | | | | | |
| DISTRIBUTIONS TO COMMON SHAREHOLDERS FROM: | | | | | | | | | | | | |
| Net realized gains | | | – | | | | (0.04 | ) | | | – | |
| Total Distributions to Common Shareholders | | | – | | | | (0.04 | ) | | | – | |
| Net asset value - end of period | | $ | 10.84 | | | $ | 9.34 | | | $ | 10.30 | |
| | | | | | | | | | | | | |
| Total Investment Return - Net Asset Value(b) | | | 16.06 | % | | | (8.97 | )% | | | 3.00 | % |
| | | | | | | | | | | | | |
| RATIOS AND SUPPLEMENTAL DATA: | | | | | | | | | | | | |
| Net assets attributable to common shares, end of period (in 000s) | | $ | 95 | | | $ | 73 | | | $ | 26 | |
| | | | | | | | | | | | | |
| RATIOS TO AVERAGE NET ASSETS (including interest expense and dividend expense on securities sold short) | | | | | | | | | | | | |
| Operating expenses excluding fee waivers/reimbursements(c) | | | 4.33 | % | | | 4.78 | % | | | 7.09 | %(d) |
| Operating expenses including fee waivers/reimbursements(c) | | | 2.97 | % | | | 3.50 | % | | | 3.32 | %(d) |
| Net investment loss including fee waivers/reimbursements(c) | | | (2.03 | )% | | | (2.19 | )% | | | (2.66 | )%(d) |
| RATIOS TO AVERAGE NET ASSETS (excluding interest expense and dividend expense on securities sold short) | | | | | | | | | | | | |
| Operating expenses excluding fee waivers/reimbursements(c) | | | 3.96 | % | | | 3.88 | % | | | 6.37 | %(d) |
| Operating expenses including fee waivers/reimbursements(c) | | | 2.60 | % | | | 2.60 | % | | | 2.60 | %(d) |
| Net investment loss including fee waivers/reimbursements(c) | | | (1.66 | )% | | | (1.29 | )% | | | (1.94 | )%(d) |
| | | | | | | | | | | | | |
| PORTFOLIO TURNOVER RATE(e) | | | 237 | % | | | 261 | % | | | 22 | % |
| (a) | Per share amounts are based upon average shares outstanding. |
| (b) | Total investment return is for the period indicated and has not been annualized. The total investment return would have been lower had certain expenses not been waived / reimbursed during the period. The return shown does not reflect the deduction of taxes that a shareholder would pay on Fund distributions or the redemption of Fund shares. Total investment return does not reflect the effect of sales charge. |
| (c) | Expense ratios before reductions for startup periods may not be representative of longer term operating periods. |
| (e) | Portfolio turnover rate for periods less than one full year have not been annualized and is calculated at the Fund level. |
See Notes to the Financial Statements.
| Clough Global Long/Short Fund – Class I | Financial Highlights |
For a share outstanding throughout the period indicated
| | | For the
Year Ended
October 31,
2017 | | | For the
Year Ended
October 31,
2016 | | | For the Period September 30, 2015 (commencement) to October 31, 2015 | |
| PER SHARE OPERATING PERFORMANCE: | | | | | | | | | |
| NET ASSET VALUE, BEGINNING OF PERIOD | | $ | 9.40 | | | $ | 10.30 | | | $ | 10.00 | |
| INCOME/(LOSS) FROM OPERATIONS: | | | | | | | | | | | | |
| Net investment loss(a) | | | (0.10 | ) | | | (0.12 | ) | | | (0.01 | ) |
| Net realized and unrealized gain/(loss) on investments | | | 1.73 | | | | (0.74 | ) | | | 0.31 | |
| Total from Investment Operations | | | 1.63 | | | | (0.86 | ) | | | 0.30 | |
| | | | | | | | | | | | | |
| DISTRIBUTIONS TO COMMON SHAREHOLDERS FROM: | | | | | | | | | | | | |
| Net realized gains | | | – | | | | (0.04 | ) | | | – | |
| Total Distributions to Common Shareholders | | | – | | | | (0.04 | ) | | | – | |
| Net asset value - end of period | | $ | 11.03 | | | $ | 9.40 | | | $ | 10.30 | |
| | | | | | | | | | | | | |
| Total Investment Return - Net Asset Value(b) | | | 17.34 | % | | | (8.39 | )% | | | 3.00 | % |
| | | | | | | | | | | | | |
| RATIOS AND SUPPLEMENTAL DATA: | | | | | | | | | | | | |
| Net assets attributable to common shares, end of period (in 000s) | | $ | 29,629 | | | $ | 44,003 | | | $ | 35,760 | |
| | | | | | | | | | | | | |
| RATIOS TO AVERAGE NET ASSETS (including interest expense and dividend expense on securities sold short) | | | | | | | | | | | | |
| Operating expenses excluding fee waivers/reimbursements(c) | | | 3.21 | % | | | 3.76 | % | | | 5.62 | %(d) |
| Operating expenses including fee waivers/reimbursements(c) | | | 1.96 | % | | | 2.50 | % | | | 2.32 | %(d) |
| Net investment loss including fee waivers/reimbursements(c) | | | (0.96 | )% | | | (1.30 | )% | | | (1.66 | )%(d) |
| RATIOS TO AVERAGE NET ASSETS (excluding interest expense and dividend expense on securities sold short) | | | | | | | | | | | | |
| Operating expenses excluding fee waivers/reimbursements(c) | | | 2.85 | % | | | 2.86 | % | | | 4.90 | %(d) |
| Operating expenses including fee waivers/reimbursements(c) | | | 1.60 | % | | | 1.60 | % | | | 1.60 | %(d) |
| Net investment loss including fee waivers/reimbursements(c) | | | (0.60 | )% | | | (0.40 | )% | | | (0.94 | )%(d) |
| | | | | | | | | | | | | |
| PORTFOLIO TURNOVER RATE(e) | | | 237 | % | | | 261 | % | | | 22 | % |
| (a) | Per share amounts are based upon average shares outstanding. |
| (b) | Total investment return is for the period indicated and has not been annualized. The total investment return would have been lower had certain expenses not been waived / reimbursed during the period. The return shown does not reflect the deduction of taxes that a shareholder would pay on Fund distributions or the redemption of Fund shares. |
| (c) | Expense ratios before reductions for startup periods may not be representative of longer term operating periods. |
| (e) | Portfolio turnover rate for periods less than one full year have not been annualized and is calculated at the Fund level. |
See Notes to the Financial Statements.
| Annual Report | October 31, 2017 | 17 |
| Clough Global Long/Short Fund | Notes to Financial Statements |
October 31, 2017
1. ORGANIZATION AND SIGNIFICANT ACCOUNTING AND OPERATING POLICIES
Clough Funds Trust (the “Trust”) is an open-end management investment company registered under the Investment Company Act of 1940, as amended (the “1940 Act”). The Trust was organized under the laws of the state of Delaware on March 17, 2015. The Trust currently offers shares of beneficial interest (“shares”) of the Clough Global Long/Short Fund (the “Fund”). The Fund’s commencement date is September 30, 2015. The Fund is a diversified investment company with an investment objective to seek to provide long-term capital appreciation. The Fund currently offers three Classes of shares: Classes A, C and I. Each share class of the Fund represents an investment in the same portfolio of securities, but each share class has its own expense structure. As of October 31, 2017, over 75% of the Fund is owned by affiliated parties. The Board of Trustees (the “Board”) may establish additional funds and classes of shares at any time in the future without shareholder approval.
The following is a summary of significant accounting policies followed by the Fund. These policies are in conformity with U.S. generally accepted accounting principles (“GAAP”). The preparation of financial statements in accordance with GAAP requires management to make estimates and assumptions that affect the reported amounts and disclosures in the financial statements during the reporting period. Management believes the estimates and security valuations are appropriate; however, actual results may differ from those estimates, and the security valuations reflected in the financial statements may differ from the value the Fund ultimately realizes upon sale of the securities. The Fund is considered an investment company for financial reporting purposes under GAAP and follows the accounting and reporting guidance applicable to investment companies as codified in Accounting Standard Codification (“ASC”) 946 – Investment Companies.
The net asset value per share of the Fund is determined no less frequently than daily, on each day that the New York Stock Exchange (“NYSE” or the “Exchange”) is open for trading, as of the close of regular trading on the Exchange (normally 4:00 p.m. New York time). Trading may take place in foreign issues held by the Fund at times when the Fund is not open for business. As a result, the Fund’s net asset value may change at times when it is not possible to purchase or sell shares of the Fund.
Investment Valuation: Securities held by the Fund for which exchange quotations are readily available are valued at the last sale price, or if no sale price or if traded on the over-the-counter market, at the mean of the bid and asked prices on such day. Most securities listed on a foreign exchange are valued at the last sale price at the close of the exchange on which the security is primarily traded. In certain countries market maker prices are used since they are the most representative of the daily trading activity. Market maker prices are usually the mean between the bid and ask prices. Certain markets are not closed at the time that the Fund prices its portfolio securities. In these situations, snapshot prices are provided by the individual pricing services or other alternate sources at the close of the NYSE as appropriate. Securities not traded on a particular day are valued at the mean between the last reported bid and the asked quotes, or the last sale price when appropriate; otherwise fair value will be determined by the board-appointed fair valuation committee. Debt securities for which the over-the-counter market is the primary market are normally valued on the basis of prices furnished by one or more pricing services or dealers at the mean between the latest available bid and asked prices. As authorized by the Board, debt securities (including short-term obligations that will mature in 60 days or less) may be valued on the basis of valuations furnished by a pricing service which determines valuations based upon market transactions for normal, institutional-size trading units of securities or a matrix method which considers yield or price of comparable bonds provided by a pricing service. Total return swaps are priced based on valuations provided by a Board approved independent third party pricing agent. If a total return swap price cannot be obtained from an independent third party pricing agent the Fund shall seek to obtain a bid price from at least one independent and/or executing broker.
If the price of a security is unavailable in accordance with the aforementioned pricing procedures, or the price of a security is unreliable, e.g., due to the occurrence of a significant event, the security may be valued at its fair value determined by management pursuant to procedures adopted by the Board. For this purpose, fair value is the price that the Fund reasonably expects to receive on a current sale of the security. Due to the number of variables affecting the price of a security, however; it is possible that the fair value of a security may not accurately reflect the price that the Fund could actually receive on a sale of the security.
In accordance with ASC 820, a three-tier hierarchy has been established to classify fair value measurements for disclosure purposes. Inputs refer broadly to the assumptions that market participants would use in pricing the asset or liability, including assumptions about risk. Inputs may be observable or unobservable. Observable inputs are inputs that reflect the assumptions market participants would use in pricing the asset or liability that are developed based on market data obtained from sources independent of the reporting entity. Unobservable inputs are inputs that reflect the reporting entity’s own assumptions about the assumptions market participants would use in pricing the asset or liability that are developed based on the best information available.
| Clough Global Long/Short Fund | Notes to Financial Statements |
October 31, 2017
Various inputs are used in determining the value of the Fund’s investments as of the reporting period end. These inputs are categorized in the following hierarchy under applicable financial accounting standards:
| Level 1 – | Unadjusted quoted prices in active markets for identical, unrestricted assets or liabilities that the Fund has the ability to access at the measurement date; |
| Level 2 – | Quoted prices which are not active, quoted prices for similar assets or liabilities in active markets or inputs other than quoted prices that are observable (either directly or indirectly) for substantially the full term of the asset or liability; and |
| Level 3 – | Significant unobservable prices or inputs (including the Fund’s own assumptions in determining the fair value of investments) where there is little or no market activity for the asset or liability at the measurement date. |
The following is a summary of the inputs used as of October 31, 2017, in valuing the Fund’s investments carried at value. The Fund recognizes transfers between the levels as of the end of the period in which the transfer occurred. There were no transfers between Levels during the year ended October 31, 2017.
Clough Global Long/Short Fund
| Investments in Securities at Value* | | Level 1 | | | Level 2 | | | Level 3 | | | Total | |
| Common Stocks | | $ | 23,808,364 | | | $ | – | | | $ | – | | | $ | 23,808,364 | |
| Closed-End Funds | | | 301,516 | | | | – | | | | – | | | | 301,516 | |
| Participation Notes | | | – | | | | 411,639 | | | | – | | | | 411,639 | |
| Short-Term Investments | | | | | | | | | | | | | | | | |
| Money Market Fund | | | 4,975,725 | | | | – | | | | – | | | | 4,975,725 | |
| TOTAL | | $ | 29,085,605 | | | $ | 411,639 | | | $ | – | | | $ | 29,497,244 | |
| | | | | | | | | | | | | | | | | |
| Other Financial Instruments | | | | | | | | | | | | | | | | |
| Assets | | | | | | | | | | | | | | | | |
| Total Return Swap Contracts** | | $ | – | | | $ | 516,811 | | | $ | – | | | $ | 516,811 | |
| Liabilities | | | | | | | | | | | | | | | | |
| Securities Sold Short | | | | | | | | | | | | | | | | |
| Common Stocks | | | (5,718,895 | ) | | | – | | | | – | | | | (5,718,895 | ) |
| TOTAL | | $ | (5,718,895 | ) | | $ | 516,811 | | | $ | – | | | $ | (5,202,084 | ) |
| * | For detailed sector descriptions, see the accompanying Statement of Investments. |
| ** | Swap contracts are reported at their unrealized appreciation/(depreciation) at measurement date, which represents the change in the contract’s value from trade date. |
In the event a Board approved independent pricing service is unable to provide an evaluated price for a security or Clough Capital Partners L.P. (the “Adviser” or “Clough Capital”) believes the price provided is not reliable, securities of the Fund will be valued at fair value as described above. In these instances the Adviser may seek to find an alternative independent source, such as a broker/dealer to provide a price quote, or by using evaluated pricing models similar to the techniques and models used by the independent pricing service. These fair value measurement techniques may utilize unobservable inputs (Level 3).
On a monthly basis, the Fair Value Committee of the Fund meets and discusses securities that have been fair valued during the preceding month in accordance with the Fund’s Fair Value Procedures and reports quarterly to the Board on the results of those meetings.
For the year ended October 31, 2017, the Fund did not have significant unobservable inputs (Level 3) used in determining fair value. Therefore, a reconciliation of assets in which significant unobservable inputs (Level 3) were used in determining fair value is not applicable.
Class Expenses: Expenses that are specific to a class of shares are charged directly to that share class. Fees provided under the distribution (Rule 12b-1) and/or shareholder service plans for a particular class of the Fund are charged to the operations of such class.
Income Taxes: The Fund’s policy is to comply with the provisions of the Internal Revenue Code applicable to regulated investment companies and to distribute all of its taxable income to its shareholders. Therefore, no federal income tax provision is required. As of and during the year ended October 31, 2017, the Fund did not have a liability for any unrecognized tax benefits. The Fund plans to file U.S. Federal and various state and local tax returns as required. The Fund’s tax returns are subject to examination by the relevant tax authorities until expiration of the applicable statute of limitations, which is generally three years after the filing of the tax return but which can be extended to six years in certain circumstances. Tax returns for open years have incorporated no uncertain tax positions that require a provision for income taxes.
| Annual Report | October 31, 2017 | 19 |
| Clough Global Long/Short Fund | Notes to Financial Statements |
October 31, 2017
Distributions to Shareholders: The Fund normally pays dividends on an annual basis. Any net capital gains earned by the Fund are distributed annually. Distributions to shareholders are recorded by the Fund on the ex-dividend date.
Securities Transactions and Investment Income: Investment security transactions are accounted for on a trade date basis. Dividend income and dividend expense-short sales are recorded on the ex-dividend date. Certain dividend income from foreign securities will be recorded, in the exercise of reasonable diligence, as soon as a Fund is informed of the dividend if such information is obtained subsequent to the ex-dividend date and may be subject to withholding taxes in these jurisdictions. Interest income, which includes amortization of premium and accretion of discount, is recorded on the accrual basis. Realized gains and losses from securities transactions and unrealized appreciation and depreciation of securities are determined using the identified cost basis for both financial reporting and income tax purposes. All of the realized and unrealized gains and losses and net investment income, other than class specific expenses, are allocated daily to each class in proportion to its average daily net assets.
Foreign Securities: The Fund may invest a portion of its assets in foreign securities. In the event that the Fund executes a foreign security transaction, the Fund will generally enter into a foreign currency spot contract to settle the foreign security transaction. Foreign securities may carry more risk than U.S. securities, such as political, market and currency risks.
The accounting records of the Fund are maintained in U.S. dollars. Prices of securities denominated in foreign currencies are translated into U.S. dollars at the closing rates of exchange at period end. Amounts related to the purchase and sale of foreign securities and investment income are translated at the rates of exchange prevailing on the respective dates of such transactions.
The effect of changes in foreign currency exchange rates on investments is reported with investment securities realized and unrealized gains and losses in the Fund’s Statement of Operations.
A foreign currency spot contract is a commitment to purchase or sell a foreign currency at a future date, at a negotiated rate. The Fund may enter into foreign currency spot contracts to settle specific purchases or sales of securities denominated in a foreign currency and for protection from adverse exchange rate fluctuation. Risks to the Fund include the potential inability of the counterparty to meet the terms of the contract.
The net U.S. dollar value of foreign currency underlying all contractual commitments held by the Fund and the resulting unrealized appreciation or depreciation are determined using prevailing forward foreign currency exchange rates. Unrealized appreciation and depreciation on foreign currency spot contracts are reported in the Fund’s Statements of Assets and Liabilities as a receivable or a payable and in the Fund’s Statement of Operations with the change in unrealized appreciation or depreciation on translation of assets and liabilities denominated in foreign currencies. These spot contracts are used by the broker to settle investments denominated in foreign currencies.
The Fund may realize a gain or loss upon the closing or settlement of the foreign transaction, excluding investment securities. Such realized gains and losses are reported with all other foreign currency gains and losses in the Statement of Operations.
Exchange Traded Funds: The Fund may invest in exchange traded funds (“ETFs”), which are funds whose shares are traded on a national exchange. ETFs may be based on underlying equity or fixed income securities, as well as commodities or currencies. ETFs do not sell individual shares directly to investors and only issue their shares in large blocks known as “creation units.” The investor purchasing a creation unit then sells the individual shares on a secondary market. Although similar diversification benefits may be achieved through an investment in another investment company, ETFs generally offer greater liquidity and lower expenses. Because an ETF incurs its own fees and expenses, shareholders of a Fund investing in an ETF will indirectly bear those costs. Such Funds will also incur brokerage commissions and related charges when purchasing or selling shares of an ETF. Unlike typical investment company shares, which are valued once daily, shares in an ETF may be purchased or sold on a securities exchange throughout the trading day at market prices that are generally close to the NAV of the ETF.
Short Sales: The Fund may sell a security it does not own in anticipation of a decline in the fair value of that security. When the Fund sells a security short, it must borrow the security sold short and deliver it to the broker-dealer through which it made the short sale. A gain, limited to the price at which the Fund sold the security short, or a loss, unlimited in size, will be recognized upon the termination of the short sale.
The Fund’s obligation to replace the borrowed security will be secured by collateral deposited with the broker-dealer, usually cash, U.S. government securities or other liquid securities. The Fund will also be required to designate on its books and records similar collateral with its custodian to the extent, if any, necessary so that the aggregate collateral value is at all times at least equal to the current value of the security sold short. The cash amount is reported on the Statement of Assets and Liabilities as Deposit with broker for securities sold short which is held with one counterparty. The Fund is obligated to pay interest to the broker for any debit balance of the margin account relating to short sales. The interest incurred by the Fund is reported on the Statement of Operations as Interest expense – margin account. Interest amounts payable are reported on the Statement of Assets and Liabilities as Interest payable – margin account.
| Clough Global Long/Short Fund | Notes to Financial Statements |
October 31, 2017
The Fund may also sell a security short if it owns at least an equal amount of the security sold short or another security convertible or exchangeable for an equal amount of the security sold short without payment of further compensation (a short sale against-the-box). In a short sale against-the-box, the short seller is exposed to the risk of being forced to deliver stock that it holds to close the position if the borrowed stock is called in by the lender, which would cause gain or loss to be recognized on the delivered stock. The Fund expects normally to close its short sales against-the-box by delivering newly acquired stock. Since the Fund intends to hold securities sold short for the short term, these securities are excluded from the purchases and sales of investment securities in Note 4 and the Fund’s Portfolio Turnover in the Financial Highlights.
Derivative Instruments and Hedging Activities: The following discloses the Fund’s use of derivative instruments and hedging activities.
The Fund’s investment objective not only permits the Fund to purchase investment securities, it also allows the Fund to enter into various types of derivative contracts, including, but not limited to, forward foreign currency contracts, futures, options and swaps. The Fund may use derivatives, among other reasons, as part of the Fund’s investment strategy, to attempt to employ its currency strategies, to seek to hedge against foreign exchange risk, and to gain access to foreign markets.
Risk of Investing in Derivatives: The Fund’s use of derivatives can result in losses due to unanticipated changes in the market risk factors and the overall market. In instances where the Fund is using derivatives to decrease or hedge exposures to market risk factors for securities held by the Fund, there are also risks that those derivatives may not perform as expected, resulting in losses for the combined or hedged positions.
Derivatives may have little or no initial cash investment relative to their market value exposure and therefore can produce significant gains or losses in excess of their cost. This use of embedded leverage allows the Fund to increase its market value exposure relative to its net assets and can substantially increase the volatility of the Fund’s performance.
Additional associated risks from investing in derivatives also exist and potentially could have significant effects on the valuation of the derivative and the Fund. Typically, the associated risks are not the risks that the Fund is attempting to increase or decrease exposure to its investment objective, but the additional risks from investing in derivatives. Associated risks can be different for each type of derivative and are discussed by each derivative type in the notes that follow.
Examples of these associated risks are liquidity risk, which is the risk that the Fund will not be able to sell the derivative in the open market in a timely manner, and counterparty credit risk, which is the risk that the counterparty will not fulfill its obligation to the Fund.
Market Risk Factors: In addition, in pursuit of its investment objectives, the Fund may seek to use derivatives, which may increase or decrease exposure to the following market risk factors:
Equity Risk: Equity risk relates to the change in value of equity securities as they relate to increases or decreases in the general market.
Foreign Exchange Rate Risk: Foreign exchange rate risk relates to the change in the U.S. dollar value of a security held that is denominated in a foreign currency. The value of a foreign currency denominated security will decrease as the dollar appreciates against the currency, while the value of the foreign currency denominated security will increase as the dollar depreciates against the currency.
Futures Contracts: The Fund may enter into futures contracts. A futures contract is an agreement to buy or sell a security or currency (or to deliver a final cash settlement price in the case of a contract relating to an index or otherwise not calling for physical delivery at the end of trading in the contract) for a set price at a future date. If the Fund buys a security futures contract, the Fund enters into a contract to purchase the underlying security and is said to be “long” under the contract. If the Fund sells a security futures contact, the Fund enters into a contract to sell the underlying security and is said to be “short” under the contract. The price at which the contract trades (the “contract price”) is determined by relative buying and selling interest on a regulated exchange. Futures contracts are marked to market daily and an appropriate payable or receivable for the change in value (“variation margin”) is recorded by the Fund. Such payables or receivables are recorded for financial statement purposes as variation margin payable or variation margin receivable by the Fund. The Fund pledges cash or liquid assets as collateral to satisfy the current obligations with respect to futures contracts. The cash amount is reported on the Statement of Assets and Liabilities as Deposit with broker for futures contracts.
| Annual Report | October 31, 2017 | 21 |
| Clough Global Long/Short Fund | Notes to Financial Statements |
October 31, 2017
The Fund enters into such transactions for hedging and other appropriate risk-management purposes or to increase return. While the Fund may enter into futures contracts for hedging purposes, the use of futures contracts might result in a poorer overall performance for the Fund than if it had not engaged in any such transactions. If, for example, the Fund had insufficient cash, it might have to sell a portion of its underlying portfolio of securities in order to meet daily variation margin requirements on its futures contracts or options on futures contracts at a time when it might be disadvantageous to do so. There may be an imperfect correlation between the Fund’s portfolio holdings and futures contracts entered into by the Fund, which may prevent the Fund from achieving the intended hedge or expose the Fund to risk of loss.
Futures contract transactions may result in losses substantially in excess of the variation margin. There can be no guarantee that there will be a correlation between price movements in the hedging vehicle and in the portfolio securities being hedged. An incorrect correlation could result in a loss on both the hedged securities in the Fund and the hedging vehicle so that the portfolio return might have been greater had hedging not been attempted. There can be no assurance that a liquid market will exist at a time when the Fund seeks to close out a futures contract. Lack of a liquid market for any reason may prevent the Fund from liquidating an unfavorable position, and the Fund would remain obligated to meet margin requirements until the position is closed. In addition, the Fund could be exposed to risk if the counterparties to the contracts are unable to meet the terms of their contracts. With exchange-traded futures contracts, there is minimal counterparty credit risk to the Fund since futures contracts are exchange-traded and the exchange’s clearinghouse, as counterparty to all exchange-traded futures contracts, guarantees the futures contracts against default. The Fund did not hold any open future contracts as of October 31, 2017.
Swaps: During the period, the Fund engaged in total return swaps. A swap is an agreement that obligates two parties to exchange a series of cash flows at specified intervals based upon or calculated by reference to changes in specified prices or rates for a specified amount of an underlying asset. The Fund may utilize swap agreements as a means to gain exposure to certain assets and/or to “hedge” or protect the Fund from adverse movements in securities prices or interest rates. The Fund is subject to equity risk and interest rate risk in the normal course of pursuing its investment objective through investments in swap contracts. Swap agreements entail the risk that a party will default on its payment obligation to the Fund. If the other party to a swap defaults, the Fund would risk the loss of the net amount of the payments that it contractually is entitled to receive. If the Fund utilizes a swap at the wrong time or judges market conditions incorrectly, the swap may result in a loss to the Fund and reduce the Fund’s total return.
Total return swaps involve an exchange by two parties in which one party makes payments based on a set rate, either fixed or variable, while the other party makes payments based on the return of an underlying asset, which includes both the income it generates and any capital gains over the payment period. A Fund’s maximum risk of loss from counterparty risk or credit risk is the discounted value of the payments to be received from/paid to the counterparty over the contract’s remaining life, to the extent that the amount is positive. The risk is mitigated by having a netting arrangement between a Fund and the counterparty and by the posting of collateral to a Fund to cover the Fund’s exposure to the counterparty. The Fund pledges cash or liquid assets as collateral to satisfy the current obligations with respect to swap contracts. The cash amount is reported on the Statement of Assets and Liabilities as Deposit with broker for total return swap contracts which is held with one counterparty.
During the year ended October 31, 2017, the Fund invested in swap agreements consistent with the Fund’s investment strategies to seek to hedge against foreign exchange risk or to gain exposure to certain markets or indices.
The effect of derivatives instruments on the Fund’s Statement of Assets and Liabilities as of October 31, 2017:
| | | Asset Derivatives | | | |
| Risk Exposure | | Statements of Assets and Liabilities Location | | Fair Value | |
| Equity Contracts (Total Return Swap Contracts) | | Unrealized appreciation on total return swap contracts | | $ | 516,811 | |
| | | | | $ | 516,811 | |
| Clough Global Long/Short Fund | Notes to Financial Statements |
October 31, 2017
The effect of derivatives instruments on the Fund’s Statement of Operations for the year ended October 31, 2017:
| Risk Exposure | Statements of Operations Location | | Realized Gain/(Loss) on Derivatives Recognized in Income | | | Change in Unrealized Appreciation/ (Depreciation) on Derivatives Recognized in Income | |
| Foreign Currency Contracts (Futures Contracts) | Net realized gain/(loss) on futures contracts/Net change in unrealized appreciation/(depreciation) on futures contracts | | $ | 108,870 | | | $ | (15,429 | ) |
| Equity Contracts (Total Return Swap Contracts) | Net realized gain/(loss) on total return swap contracts/Net change in unrealized appreciation/(depreciation) on total return swap contracts | | | 158,203 | | | | 531,897 | |
| Total | | | $ | 267,073 | | | $ | 516,468 | |
The average futures contracts notional amount during the year ended October 31, 2017 is $(391,606).
The average total return swap contracts notional amount during the year ended October 31, 2017 is $1,807,037.
Certain derivative contracts are executed under either standardized netting agreements or, for exchange-traded derivatives, the relevant contracts for a particular exchange which contain enforceable netting provisions. A derivative netting arrangement creates an enforceable right of set-off that becomes effective, and affects the realization of settlement on individual assets, liabilities and collateral amounts, only following a specified event of default or early termination. Default events may include the failure to make payments or deliver securities timely, material adverse changes in financial condition or insolvency, the breach of minimum regulatory capital requirements, or loss of license, charter or other legal authorization necessary to perform under the contract.
The following table presents derivative financial instruments that are subject to enforceable netting arrangements as of October 31, 2017.
Offsetting of Derivatives Assets
| | | | | | | | | | | | Gross Amounts Not Offset in the Statements
of Assets and Liabilities | |
| | | Gross Amounts of Recognized Assets | | | Gross Amounts Offset in the Statements of Assets and Liabilities | | | Net Amounts Presented in the Statements of Assets and Liabilities | | | Financial Instruments(a) | | | Cash Collateral Pledged | | | Net Amount | |
| Total Return Swap Contracts | | $ | 516,811 | | | $ | – | | | $ | 516,811 | | | $ | (516,811 | ) | | $ | – | | | $ | – | |
| Total | | $ | 516,811 | | | $ | – | | | $ | 516,811 | | | $ | (516,811 | ) | | $ | – | | | $ | – | |
| (a) | These amounts are limited to the derivative asset/liability balance and, accordingly, do not include excess collateral received/pledged which is disclosed in the Statement of Investments. |
Counterparty Risk: The Fund runs the risk that the issuer or guarantor of a fixed income security, the counterparty to an over-the-counter derivatives contract or the obligor of an obligation underlying an asset-backed security will be unable or unwilling to make timely principal, interest, or settlement payments or otherwise honor its obligations. In addition, to the extent that the Fund uses over-the-counter derivatives, and/or has significant exposure to a single counterparty, this risk will be particularly pronounced for the Fund.
| Annual Report | October 31, 2017 | 23 |
| Clough Global Long/Short Fund | Notes to Financial Statements |
October 31, 2017
Other Risk Factors: Investing in the Fund may involve certain risks including, but not limited to, the following:
Unforeseen developments in market conditions may result in the decline of prices of, and the income generated by, the securities held by the Fund. These events may have adverse effects on the Fund such as a decline in the value and liquidity of many securities held by the Fund, and a decrease in net asset value. Such unforeseen developments may limit or preclude the Funds’ ability to achieve their investment objective.
Investing in stocks may involve larger price fluctuation and greater potential for loss than other types of investments. This may cause the securities held by the Fund to be subject to larger short-term declines in value.
The Fund may have elements of risk due to concentrated investments in foreign issuers located in a specific country. Such concentrations may subject the Fund to additional risks resulting from future political or economic conditions and/or possible impositions of adverse foreign governmental laws or currency exchange restrictions. Investments in securities of non-U.S. issuers have unique risks not present in securities of U.S. issuers, such as greater price volatility and less liquidity.
2. TAXES
Classification of Distributions: Net investment income/(loss) and net realized gain/(loss) may differ for financial statement and tax purposes. The character of distributions made during the year from net investment income or net realized gains may differ from its ultimate characterization for federal income tax purposes. Also, due to the timing of dividend distributions, the fiscal year in which amounts are distributed may differ from the fiscal year in which the income or realized gain was recorded by the Fund.
The tax character of the distributions paid by the Fund during the years ended October 31, 2017 and October 31, 2016, were as follows:
| | | Clough Global Long/Short Fund | |
| Distributions Paid From: | | 2017 | | | 2016 | |
| Ordinary Income | | $ | – | | | $ | 146,946 | |
| Long-Term Capital Gains | | | – | | | | 6,033 | |
| Total | | $ | – | | | $ | 152,979 | |
Components of Earnings: Tax components of distributable earnings are determined in accordance with income tax regulations which may differ from composition of net assets reported under GAAP. Accordingly, for the year ended October 31, 2017, certain differences were reclassified. These differences relate primarily to the differing treatment of foreign currency, passive foreign investment companies, net operating losses and investment in short securities.
The reclassifications were as follows:
| | | Undistributed Ordinary Income | | | Accumulated Capital Loss | | | Paid-in Capital | |
| | $ | 3,637 | | | $ | (3,639 | ) | | $ | 2 | |
Ordinary and Capital Losses: Short-term capital losses deferred to the year ending October 31, 2018 were $547,708.
The Fund used capital loss carryforwards during the year ended October 31, 2017 of $3,377,491.
The Fund elects to defer to the year ending October 31, 2018, late year ordinary losses in the amount of $59,628.
Tax Basis of Distributable Earnings: Tax components of distributable earnings are determined in accordance with income tax regulations which may differ from composition of net assets reported under GAAP.
| Clough Global Long/Short Fund | Notes to Financial Statements |
October 31, 2017
As of October 31, 2017, the components of distributable earnings on a tax basis were as follows:
| Undistributed ordinary income | | $ | – | |
| Accumulated net realized loss on investments | | | (547,708 | ) |
| Net unrealized appreciation on investments | | | 2,941,193 | |
| Other accumulated losses | | | (59,628 | ) |
| Total | | $ | 2,333,857 | |
Tax Basis of Investments: Net unrealized appreciation/(depreciation) of investments based on federal tax costs as of October 31, 2017, was as follows:
| Gross appreciation (excess of value over tax cost) | | $ | 5,632,659 | |
| Gross depreciation (excess of tax cost over value) | | | (2,692,370 | ) |
| Net appreciation (excess of tax cost over value) of foreign currency and derivatives | | | 904 | |
| Net unrealized appreciation | | $ | 2,941,193 | |
| Cost of investments for income tax purposes | | $ | 26,596,827 | |
The difference between book and tax basis unrealized appreciation is primarily attributable to wash sales, passive foreign investment companies, and notional principal contracts.
3. CAPITAL TRANSACTIONS
Common Shares: There is an unlimited number of shares of beneficial interest with no par value per share. Shares redeemed within 30 days of purchase may incur a 2.00% redemption fee deducted from the redemption amount.
| | | For the Year Ended October 31, 2017 | | | For the Year Ended October 31, 2016 | |
| Class C: | | | | | | | | |
| Beginning of period | | | 7,843 | | | | 2,500 | |
| Shares sold | | | 1,855 | | | | 5,333 | |
| Distributions reinvested | | | – | | | | 10 | |
| Shares redeemed | | | (938 | ) | | | – | |
| Net increase in shares outstanding | | | 917 | | | | 5,343 | |
| Shares outstanding, end of period | | | 8,760 | | | | 7,843 | |
| Class I: | | | | | | | | |
| Beginning of period | | | 4,681,053 | | | | 3,472,903 | |
| Shares sold | | | 546,132 | | | | 1,899,988 | |
| Distributions reinvested | | | – | | | | 15,233 | |
| Shares redeemed | | | (2,539,838 | ) | | | (707,071 | ) |
| Net increase (decrease) in shares outstanding | | | (1,993,706 | ) | | | 1,208,150 | |
| Shares outstanding, end of period | | | 2,687,347 | | | | 4,681,053 | |
| Class A: | | | | | | | | |
| Beginning of period | | | 8,059 | | | | 2,600 | |
| Shares sold | | | 11,740 | | | | 5,454 | |
| Distributions reinvested | | | – | | | | 10 | |
| Shares redeemed | | | (656 | ) | | | (5 | ) |
| Net increase in shares outstanding | | | 11,084 | | | | 5,459 | |
| Shares outstanding, end of period | | | 19,143 | | | | 8,059 | |
| Annual Report | October 31, 2017 | 25 |
| Clough Global Long/Short Fund | Notes to Financial Statements |
October 31, 2017
4. PORTFOLIO SECURITIES
Purchases and sales of investment securities, excluding securities sold short intended to be held for less than one year, short-term securities, and Long Term U.S. Government obligations, for the year ended October 31, 2017, are listed in the table below.
| | Cost of Investments Purchased | Proceeds From Investments Sold | |
| | $ | 64,088,897 | | | $ | 78,483,856 | |
5. INVESTMENT ADVISORY AND OTHER AGREEMENTS
Investment Advisory Agreement: Clough Capital will serve as the Fund’s investment adviser pursuant to an Investment Advisory Agreement with the Fund. As compensation for its services to the Fund, the Adviser receives an annual investment advisory fee of 1.35% based on the Fund’s average daily net assets, paid monthly. The Adviser has agreed contractually to limit the operating expenses of each class of the Fund (excluding Rule 12b-1 Distribution and Service Fees, Shareholder Services Fees, acquired fund fees and expenses, interest, taxes, brokerage costs and commissions, dividend and interest expense on short sales, and litigation, indemnification and extraordinary expenses as determined under generally accepted accounting principles) to an annual rate of 1.60% through February 28, 2018. The Adviser is permitted to recover, on a class-by-class basis, any fees waived and/or expenses reimbursed pursuant to the waiver agreement described above to the extent that such recovery does not cause total annual operating expenses to exceed the expense limitation in effect (i) at the time the fees and/or expenses to be recovered were waived and/or reimbursed and (ii) at the time of such recovery. The Adviser will not be entitled to recover any such waived or reimbursed fees and expenses more than three years after the end of the fiscal year in which the fees were waived or expenses were reimbursed. The Adviser may not terminate this waiver arrangement without the approval of the Fund’s Board.
As of October 31, 2017, the balances of future recoupable expenses were as follows:
| | | Expires in 2018 | | | Expires in 2019 | | | Expires in 2020 | | | Total | |
| Class A | | $ | (85 | ) | | $ | (470 | ) | | $ | (1,398 | ) | | $ | (1,953 | ) |
| Class C | | $ | (82 | ) | | $ | (734 | ) | | $ | (968 | ) | | $ | (1,784 | ) |
| Class I | | $ | (83,042 | ) | | $ | (537,227 | ) | | $ | (429,730 | ) | | $ | (1,049,999 | ) |
Administration Agreement: The Fund currently employs ALPS Fund Services, Inc. (“ALPS”) under an administration agreement to provide certain administrative services to the Fund. As compensation for its services to the Fund, ALPS receives an annual administration fee based on the Fund’s average daily net assets, paid monthly.
Transfer Agency and Service Agreement: ALPS, pursuant to a Transfer Agency and Service Agreement, serves as transfer agent for the Fund.
Distribution and Shareholder Services Plan: The Fund has adopted a separate plan of distribution for Class A and Class C shares, pursuant to Rule 12b-1 under the 1940 Act (each, a “Plan” and collectively, the “Plans”). ALPS Portfolio Solutions Distributor, Inc. (the “Distributor”) serves as the Fund’s distributor.
The Plans allow the Fund, as applicable, to use Class A and Class C assets to pay fees in connection with the distribution and marketing of Class A and Class C shares and/or the provision of ongoing servicing for the benefit of shareholders. Each Plan permits payment for services in connection with the administration of plans or programs that use Class A and/or Class C shares of the Fund as their funding medium and for related expenses.
The Plans permit the Fund to make total payments at an annual rate of up to 0.25% of the Fund’s average daily net assets attributable to its Class A shares, and 1.00% of the Fund’s average daily net assets attributable to its Class C shares. Because these fees are paid out of the Fund’s Class A and Class C shares, respectively, on an ongoing basis, over time they will increase the cost of an investment in Class A and Class C shares. For example, the Class C Plan fees may cost an investor more than the Class A Plan sales charges over time.
Under the terms of the Plans, the Trust is authorized to make payments to the Distributor for remittance to financial intermediaries, as compensation for distribution and/or the provision of on-going servicing for the benefit of shareholders performed by such financial intermediaries for their customers who are investors in the Fund. Financial intermediaries may from time to time be required to meet certain additional criteria in order to continue to receive 12b-1 fees. For Class C shares, the Distributor is entitled to retain all fees paid under the Plan for the first 12 months on any investment in Class C Shares to recoup the expenses with respect to the payment of commissions on sales of Class C Shares. Financial intermediaries will become eligible for Class C Plan compensation beginning in the 13th month following the purchase of Class C Shares, although the Distributor may, pursuant to a written agreement between the Distributor and a particular financial intermediary, pay such financial intermediary 12b-1 fees prior to the 13th month following the purchase of Class C Shares. The Distributor may retain some or all compensation payable pursuant to the Plans under certain circumstances, such as when a financial intermediary is removed as the broker of record or a financial intermediary fails to meet certain qualification standards to be eligible to continue to be the broker of record.
| Clough Global Long/Short Fund | Notes to Financial Statements |
October 31, 2017
Shareholder Services Plan for Class A Shares: The Fund has adopted a non-12b-1 shareholder services plan (the “Services Plan”) with respect to the Fund’s Class A shares. Under the Services Plan, the Fund is authorized to pay financial intermediaries an aggregate fee in an amount not to exceed on an annual basis 0.10% of the average daily net asset value of the Class A shares of the Fund attributable to or held in the name of the financial intermediary for its clients as compensation for maintaining customer accounts that hold Fund shares. These activities may include, but are not limited to, establishing and maintaining Fund shareholder accounts on a transaction processing and record keeping system, providing Fund shareholders with the ability to access current Fund information, including without limitation, share balances, dividend information and transaction history, and permitting the Fund’s transfer agent to receive order instructions from or on behalf of Fund shareholders for the purchase or redemption of Shares. None of these activities include distribution services. Any amount of the Services Plan fees not paid during the Fund’s fiscal year for such servicing shall be reimbursed to the Fund.
6. AFFILIATED TRANSACTIONS
The Fund may engage in cross trades with an affiliate pursuant to Rule 17a-7 under the 1940 Act. Cross trading is the buying or selling of portfolio securities between funds to which the Adviser serves as the investment adviser. The Board of Trustees previously adopted procedures that apply to transactions from or to another registered investment company, or any account which is considered an affiliated account by reason of having a common investment adviser. At its regularly scheduled meetings, the Trustees review such transactions as of the most current calendar quarter for compliance with the requirements set forth by Rule 17a-7 and the Fund’s procedures. The procedures require that the transactions be a purchase or sale for no consideration other than cash payment or cash credit (to be used to purchase shares of the Fund involved) against prompt delivery of a security for which market quotations are readily available, and be consistent with the investment policies of the Fund. During the year ended October 31, 2017 the Fund did not engage in cross trades.
7. INDEMNIFICATION
Under the Trust’s organizational documents, its officers and Trustees are indemnified against certain liabilities arising out of the performance of their duties to the Trust. Additionally, in the normal course of business, the Trust enters into contracts with service providers that contain general indemnification clauses. The Trust’s maximum exposure under these arrangements is unknown, as this would involve future claims that may be made against the Trust that have not yet occurred. However, based on experience, the Trust believes the risk of loss to be remote.
8. OTHER
The Independent Trustees of the Fund receive a quarterly retainer of $4,000, plus $2,250 for each regular Board meeting attended, $1,000 for each special telephonic Board or Committee meeting attended and $2,250 for each special in-person Board meeting attended. The Independent Trustees are also reimbursed for all reasonable out-of-pocket expenses relating to attendance at meetings.
9. RECENT ACCOUNTING PRONOUNCEMENT
In December 2016, the Financial Accounting Standards Board (“FASB”) issued Accounting Standards Update (“ASU”) 2016-19, “Technical Corrections and Improvements.” It includes an update to Accounting Standards Codification Topic 820 (“Topic 820”), Fair Value Measurement. The update to Topic 820 clarifies the difference between a valuation approach and a valuation technique. It also requires disclosure when there has been a change in either or both a valuation approach and/or a valuation technique. The changes related to Topic 820 are effective for annual reporting periods, including interim periods within those annual periods, beginning after December 15, 2016. Management is currently evaluating the impact of the ASU to the financial statements.
10. SUBSEQUENT EVENT
Effective December 1, 2017, Class A shares were renamed Investor Class shares, such shares are offered without an initial sales charge or a contingent deferred sales charge.
| Annual Report | October 31, 2017 | 27 |
Report of Independent Registered Public Accounting Firm
The Board of Trustees and Shareholders of
Clough Funds Trust
We have audited the accompanying statement of assets and liabilities, including the statement of investments, of Clough Global Long/Short Fund, constituting the Clough Funds Trust, (the “Trust”) as of October 31, 2017, and the related statement of operations for the year then ended, and the statements of changes in net assets for each of the two years then ended and the financial highlights for each of the periods indicated therein. These financial statements and financial highlights are the responsibility of the Trust’s management. Our responsibility is to express an opinion on these financial statements and financial highlights based on our audits.
We conducted our audits in accordance with the standards of the Public Company Accounting Oversight Board (United States). Those standards require that we plan and perform the audit to obtain reasonable assurance about whether the financial statements and financial highlights are free of material misstatement. We were not engaged to perform an audit of the Trust’s internal control over financial reporting. Our audit included consideration of internal control over financial reporting as a basis for designing audit procedures that are appropriate in the circumstances, but not for the purpose of expressing an opinion on the effectiveness of the Trust’s internal control over financial reporting. Accordingly, we express no such opinion. An audit also includes examining, on a test basis, evidence supporting the amounts and disclosures in the financial statements and financial highlights, assessing the accounting principles used and significant estimates made by management, and evaluating the overall financial statement presentation. Our procedures included confirmation of securities owned as of October 31, 2017, by correspondence with the custodian and others or by other appropriate auditing procedures where replies from others were not received. We believe that our audits provide a reasonable basis for our opinion.
In our opinion, the financial statements and financial highlights referred to above present fairly, in all material respects, the financial position of the Clough Global Long/Short Fund at October 31, 2017, the results of its operations for the year then ended and the changes in its net assets for each of the two years then ended and the financial highlights for each of the periods indicated therein in conformity with U.S. generally accepted accounting principles.

December 22, 2017
| Clough Global Long/Short Fund | Additional Information |
October 31, 2017 (Unaudited)
FUND PROXY VOTING POLICIES & PROCEDURES
The Fund’s policies and procedures used in determining how to vote proxies relating to portfolio securities are available on the Fund’s website at http://www.cloughglobal.com. Information regarding how the Fund voted proxies relating to portfolio securities held by the Fund for the period ended June 30, are available without charge, upon request, by contacting the Funds at 1-877-256-8445 and on the Commission’s website at http://www.sec.gov.
PORTFOLIO HOLDINGS
The Fund files its complete schedule of portfolio holdings with the Commission for the first and third quarters of each fiscal year on Form N–Q within 60 days after the end of the period. Copies of the Fund’s Form N–Q are available without a charge, upon request, by contacting the Fund at 1-877-256-8445 and on the Commission’s website at http://www.sec.gov. You may also review and copy Form N–Q at the Commission’s Public Reference Room in Washington, D.C. For more information about the operation of the Public Reference Room, please call the Commission at 1-800-SEC-0330.
| Annual Report | October 31, 2017 | 29 |
| Clough Global Long/Short Fund | Trustees & Officers |
October 31, 2017 (Unaudited)
| Name, Address* & Year of Birth | Position(s) Held with Trust | Term of Office and Length of Time Served** | Principal Occupation(s) During Past 5 Years | Number of Funds in Fund Complex Overseen by Trustee*** | Other Directorships Held by Trustee During Past 5 Years** |
| Independent Trustees |
Clifford J. Weber
1963 | Trustee and Chairman | Trustee since 2015 and Chairman since 2017 | Mr. Weber is the founder of Financial Products Consulting Group, LLC (a consulting firm). Prior to starting Financial Products Consulting Group, he was the Executive Vice President – Global Index and Exchange Traded Products of the NYSE, a subsidiary of Intercontinental Exchange, from 2013 to 2015. Previously, Mr. Weber was the Executive Vice President – Head of Strategy and Product Development of NYSE Liffe U.S., a division of NYSE Euronext, from 2008 to 2013, and held various positions with the American Stock Exchange from 1990 to 2008. | 4 | Janus Detroit Street Trust (9 funds); Clayton Street Trust (3 funds); Elevation ETF Trust (1 fund); Clough Global Equity Fund (1 fund); Clough Global Dividend and Income Fund (1 fund); Clough Global Opportunities Fund (1 fund). |
Jeremy W. Deems
1976 | Trustee | Since 2015 | Mr. Deems is the Co-Founder, Chief Compliance Officer and Chief Financial Officer of Green Alpha Advisors, LLC, a registered investment advisor, and Co-Portfolio Manager of the Shelton Green Alpha Fund. Prior to joining Green Alpha Advisors, Mr. Deems was CFO and Treasurer of Forward Management, LLC, ReFlow Management Co., LLC, ReFlow Fund, LLC, a private investment fund, and Sutton Place Management, LLC (an administrative services company) from 1998 to June 2007. From 2004 to 2005, Mr. Deems also served as Treasurer of the Forward Funds and the Sierra Club Funds. | 2 | Mr. Deems is a Trustee of ALPS ETF Trust (19 funds); ALPS Variable Investment Trust (10 funds); Financial Investors Trust (33 funds); Reaves Utility Income Fund (1 fund); and Elevation ETF Trust (1 fund). |
James M. Maxwell
1954 | Trustee | Since 2015 | Mr. Maxwell is President of SPAD Associates (a private investigation and consulting company). Prior to joining SPAD Associates, he was the Vice President of Corporate Security for Credit Suisse from 2006 to 2008. Previously, he was a Special Agent with the Federal Bureau of Investigation from 1982 to 2006. | 1 | None |
| Clough Global Long/Short Fund | Trustees & Officers |
October 31, 2017 (Unaudited)
| Name, Address* & Year of Birth | Position(s) Held with Trust | Term of Office and Length of Time Served** | Principal Occupation(s) During Past 5 Years | Number of Funds in Fund Complex Overseen by Trustee*** | Other Directorships Held by Trustee During Past 5 Years |
| Interested Trustees |
Edmund J. Burke
1961 | Trustee and President | Since 2015 | Mr. Burke is President and a Director of ALPS Holdings, Inc. (“AHI”), a wholly-owned subsidiary of DST Systems, Inc. (“DST”), (since 2005) and ALPS Advisers, Inc. (“AAI”) and Director of Boston Financial Data Services, Inc. (“BFDS”), ALPS Distributors, Inc. (“ADI”), ALPS Fund Services, Inc. (“AFS”) and ALPS Portfolio Solutions Distributor, Inc. (“APSD”). Mr. Burke is an “interested person” because of his positions with APSD and its affiliates. | 5 | Mr. Burke is a Trustee/Director of Financial Investors Trust (33 funds); Liberty All-Star Equity Fund (1 fund); Liberty All-Star Growth Fund, Inc. (1 fund); Clough Global Equity Fund (1 fund); Clough Global Dividend and Income Fund (1 fund); Clough Global Opportunities Fund (1 fund); ALPS ETF Trust (19 funds). |
Kevin McNally
1969 | Trustee | Trustee since 2017 | Mr. McNally has over 24 years of industry experience focusing almost exclusively on closed-end funds. Mr. McNally is currently a Managing Director at Clough and serves as the portfolio manager for an investment fund advised by Clough that invests primarily in closed-end funds. Prior to joining Clough Capital Partners L.P. in 2014, he served as the Director of Closed-End Funds at ALPS Fund Services, Inc. from 2003 to 2014, was Director of Closed-End Fund and ETF Research at Smith Barney, a division of Citigroup Global Markets, Inc. from 1998 to 2003, and Director of Closed-End Fund and ETF Marketing at Morgan Stanley Dean Witter Discover & Co. from 1997 to 1998. Previously, he was an analyst covering closed-end funds in the Mutual Fund Research Department at Merrill Lynch, Pierce, Fenner, & Smith, Inc. from 1994 to 1997, and also was Manager of the Closed-End Fund Marketing Department at Prudential Securities from 1992 to 1994. Mr. McNally received a Bachelor of Arts degree from the University of Massachusetts at Amherst in 1991 and an MBA in Finance from New York University’s Stern School of Business in 1998. | 4 | Clough Global Dividend & Income Fund, Clough Global Opportunities Fund and Clough Global Equity Fund |
| Annual Report | October 31, 2017 | 31 |
| Clough Global Long/Short Fund | Trustees & Officers |
October 31, 2017 (Unaudited)
| Name, Address* & Year of Birth | Position(s) Held with Trust | Term of Office and Length of Time Served** | Principal Occupation(s) During Past 5 Years |
| Officers |
Jill Kerschen
1975 | Treasurer | Since 2017 | Ms. Kerschen joined ALPS in July 2013 and is currently Vice President and Fund Controller. She currently serves as Treasurer of Reaves Utility Income Fund and Assistant Treasurer of Clough Global Dividend and Income Fund, Clough Global Equity Fund, and Clough Global Opportunities Fund. Prior to joining ALPS she spent twelve years at Great-West Financial in various fund administration roles, with the last seven years being in fund administration, tax and compliance, specifically related to mutual funds, collective trusts and separate accounts. At Great-West Financial, Ms. Kerschen served as the Senior Manager, Financial Reporting and as Assistant Treasurer for the mutual funds & the investment adviser. Prior to joining Great-West Financial, Ms. Kerschen worked at Oppenheimer Funds in fund administration. Ms. Kerschen holds a BS in Finance from Kansas State University. |
Karen S. Gilomen
1970 | Secretary | Since 2017 | Ms. Gilomen joined ALPS in August 2016 as Vice President and Senior Counsel. Prior to joining ALPS, Ms. Gilomen was Vice President - General Counsel & CCO of Monticello Associates, Inc. from 2010 to 2016. Ms. Gilomen is also the Secretary of Clough Global Dividend and Income Fund, Clough Global Equity Fund, Clough Global Opportunities Fund, Financial Investors Trust and Reaves Utility Income Fund, and the Assistant Secretary of the WesMark Funds. |
Ted Uhl
1974 | Interim Chief Compliance Officer (“CCO”) | Since 2017 | Mr. Uhl joined ALPS in October 2006, and is currently Deputy Compliance Officer of ALPS. Prior to his current role, Mr. Uhl served as Senior Risk Manager for ALPS from October 2006 until June 2010. Before joining ALPS, Mr. Uhl served a Sr. Analyst with Enenbach and Associates (RIA), and a Sr. Financial Analyst at Sprint. Mr. Uhl is also CCO of the Boulder Growth & Income Fund, Inc., Centre Funds, Elevation ETF Trust, Financial Investors Trust, Index Funds, Reality Shares ETF Trust, Reaves Utility Income Fund and XAI Octagon Floating Rate & Alternative Income Term Trust and the Interim CCO of Clough Global Dividend and Income Fund, Clough Global Equity Fund and Clough Global Opportunities Fund. |
| Clough Global Long/Short Fund | Trustees & Officers |
October 31, 2017 (Unaudited)
| Name, Address* & Year of Birth | Position(s) Held with Trust | Term of Office and Length of Time Served** | Principal Occupation(s) During Past 5 Years |
Jennifer Craig
1973 | Assistant Secretary | Since 2016 | Ms. Craig joined ALPS in 2007 and is currently Assistant Vice President and Paralegal Manager of ALPS. Prior to joining ALPS, Ms. Craig was Legal Manager at Janus Capital Management LLC and served as Assistant Secretary of Janus Investment Fund, Janus Adviser Series and Janus Aspen Series. Ms. Craig is also Assistant Secretary of Financial Investors Trust, Clough Global Dividend and Income Fund, Clough Global Equity Fund, Clough Global Opportunities Fund, Liberty All-Star Equity Fund and Liberty All-Star Growth Fund, Inc. |
Sareena Khwaja-Dixon
1980 | Assistant Secretary | Since 2016 | Ms. Khwaja-Dixon joined ALPS in August 2015 and is currently Senior Counsel and Vice President of ALPS Fund Services, Inc. Prior to joining ALPS, Ms. Khwaja-Dixon served as a Senior Paralegal/Paralegal for Russell Investments (2011 – 2015). Ms. Khwaja-Dixon is also Secretary of Liberty All-Star Equity Fund and Liberty All- Star Growth Fund, Inc. and Assistant Secretary of Clough Dividend and Income Fund, Clough Global Opportunities Fund and Clough Global Equity Fund. |
| * | All communications to Trustees and Officers may be directed to Clough Funds Trust, 1290 Broadway, Suite 1100, Denver, Colorado 80203, except for Mr. McNally. For Mr. McNally, all communications may be sent to Clough Capital Partners L.P., One Post Office Square, 40th Floor, Boston, Massachusetts 02109. |
| ** | This is the period for which the Trustee began serving the Trust. Each Trustee serves an indefinite term, until his successor is elected. |
| *** | The Fund Complex consists of the Fund, Clough Global Dividend and Income Fund, Clough Global Equity Fund, Clough Global Opportunities Fund and Clough China Fund, a series of the Financial Investors Trust. Mr. Burke is a member of the Board and the President of each such fund. Mr. Weber and Mr. McNally are members of the Board of each such fund other than the Clough China Fund. Mr. Deems is a member of the Board of the Fund and Clough China Fund. |
The Statement of Additional Information includes additional information about the Fund’s Trustees and is available, without a charge, upon request, by contacting the Fund at 1-855-425-6844.
| Annual Report | October 31, 2017 | 33 |
| Clough Global Long/Short Fund | Privacy Policy |
October 31, 2017 (Unaudited)
| FACTS | WHAT DOES THE CLOUGH GLOBAL LONG/SHORT FUND (THE “FUND”) DO WITH YOUR PERSONAL INFORMATION? |
| WHY? | Financial companies choose how they share your personal information. Federal law gives consumers the right to limit some but not all sharing. Federal law also requires us to tell you how we collect, share, and protect your personal information. Please read this notice carefully to understand what we do. |
| WHAT? | The types of personal information we collect and share depend on the product or service you have with us. This information can include: |
| | ● Social security number and income;
● Account balances and transaction history;
● Assets and investment experience. |
| HOW? | All financial companies need to share customers’ personal information to run their everyday business. In the section below, we list the reasons financial companies can share their customers’ personal information; the reasons the Fund chooses to share such information; and whether you can limit this sharing |
| Reasons we can share your personal information | Does the Fund Share? | Can you limit this sharing? |
| For our everyday business purposes—such as to process your transactions, maintain your account(s), respond to court orders and legal investigations, or report to credit bureaus | Yes | No |
| For our marketing purposes—to offer our products and services to you | No | We do not share. |
| For joint marketing with other financial companies | No | We do not share. |
| For our affiliates’ everyday business purposes — information about your transactions and experiences | Yes | No |
| For our affiliates’ everyday business purposes — information about your creditworthiness | No | We do not share. |
| For nonaffiliates to market to you | No | We do not share. |
| QUESTIONS? | Call 855.425.6844 or go to www.cloughglobalfunds.com. |
| WHO WE ARE | |
| Who is providing this notice? | Clough Global Long/Short Fund |
| WHAT WE DO | |
| How does the Fund protect my personal information? | To protect your personal information from unauthorized access and use, we use security measures that comply with federal law. These measures include computer safeguards and secured files and buildings. |
| How does the Fund collect my personal information? | We collect your personal information, for example, when you open an account, provide account information or give us your contact information, make a wire transfer or deposit money |
Why can’t I limit all sharing? | Federal law gives you the right to limit only: ● sharing for affiliates’ everyday business purposes — information about your creditworthiness ● affiliates from using your information to market to you ● sharing for non-affiliates to market to you State laws and individual companies may give you additional rights to limit sharing. |
| Clough Global Long/Short Fund | Privacy Policy |
October 31, 2017 (Unaudited)
| DEFINITIONS | |
| Affiliates | Companies related by common ownership or control. They can be financial and nonfinancial companies. |
| Non-affiliates | Companies not related by common ownership or control. They can be financial and nonfinancial companies. ● The Fund does not share with non-affiliates so they can market to you. |
| Joint marketing | A formal agreement between non-affiliated financial companies that together market financial products or services to you. ● The Fund does not jointly market. |
| Other Important Information | |
| California Residents | If your account has a California home address, your personal information will not be disclosed to nonaffiliated third parties except as permitted by applicable California law, and we will limit sharing such personal information with our affiliates to comply with California privacy laws that apply to us. |
| Vermont Residents | The State of Vermont requires financial institutions to obtain your consent prior to sharing personal information that they collect about you with affiliated companies and nonaffiliated third parties other than in certain limited circumstances. Except as permitted by law, we will not share personal information we collect about you with nonaffiliated third parties or other affiliated companies unless you provide us with your written consent to share such information. |
| Annual Report | October 31, 2017 | 35 |
Item 2. Code of Ethics.
| (a) | The registrant, as of the end of the period covered by this report, has adopted a code of ethics that applies to the registrant’s principal executive officer, principal financial officer, principal accounting officer or controller or any persons performing similar functions on behalf of the registrant. |
| (c) | During the period covered by this report, no amendments to the provisions of the code of ethics referenced in Item 2(a) above were made. |
| (d) | During the period covered by this report, no implicit or explicit waivers to the provisions of the code of ethics referenced in Item 2(a) above were granted. |
| (f) | The registrant’s Code of Ethics is attached as an Exhibit to this report. |
Item 3. Audit Committee Financial Expert.
| | The Board of Trustees of the registrant has determined that the registrant has at least one Audit Committee Financial Expert serving on its audit committee. The Board of Trustees of the registrant has designated Jeremy Deems, as the registrant’s “Audit Committee Financial Experts.” Mr. Deems is “independent” as defined in paragraph (a)(2) of Item 3 to Form N-CSR. |
Item 4. Principal Accountant Fees and Services.
| (a) | Audit Fees: For the registrant’s fiscal years ended October 31, 2017 and October 31, 2016, the aggregate fees billed for professional services rendered by the principal accountant for the audit of the registrant’s annual financial statements were $30,000 and $30,000, respectively. |
| (b) | Audit-Related Fees: For the registrant’s fiscal years ended October 31, 2017 and October 31, 2016, the aggregate fees billed for assurance and related services by the principal accountant that were reasonably related to the performance of the audit of the registrant’s financial statements and are not reported under paragraph (a) of this Item were $0 and $0, respectively. |
| (c) | Tax Fees: For the registrant’s fiscal years ended October 31, 2017 and October 31, 2016, the aggregate fees billed for professional services rendered by the principal accountant for tax compliance, tax advice and tax planning were $13,000 and $13,000, respectively. The fiscal year 2017 and 2016 tax fees were for services for dividend calculation, excise tax preparation and tax return preparation. |
| (d) | All Other Fees: For the registrant’s fiscal years ended October 31, 2017 and October 31, 2016, no fees were billed to registrant by the principal accountant for services rendered. |
| (e)(1) | Audit Committee Pre-Approval Policies and Procedures: All services to be performed by the registrant’s principal accountant must be pre-approved by the registrant’s audit committee or to its delegate as provided in the audit committee charter. |
| (e)(2) | No services described in paragraphs (b) through (d) of this Item were approved by the registrant’s audit committee pursuant to paragraph (c)(7)(i)(C) of Rule 2-01 of Regulation S-X. |
| (g) | The aggregate non-audit fees billed by the registrant’s accountant for services rendered to the registrant, and rendered to the registrant’s investment adviser (not including any sub-adviser whose role is primarily portfolio management and is subcontracted with or overseen by another investment adviser), and any entity controlling, controlled by, or under common control with the adviser that provides ongoing services to the registrant, were $0 and $0 in the fiscal years ended October 31, 2017 and October 31, 2016, respectively, other than those fees set forth in response to paragraph (c) of this Item. |
| (h) | The registrant’s audit committee has considered whether the provision of non-audit services that were rendered to the registrant’s investment adviser (not including any sub-adviser whose role is primarily portfolio management and is subcontracted with or overseen by another investment adviser), and any entity controlling, controlled by, or under common control with the investment adviser that provides ongoing services to the registrant that were not pre-approved pursuant to paragraph (c)(7)(ii) of Rule 2-01 of Regulation S-X, is compatible with maintaining the principal accountant’s independence and has determined that the provision of such non-audit services is compatible with maintaining the principal accountant’s independence. |
Item 5. Audit Committee of Listed Registrants.
| | Not applicable to registrant. |
Item 6. Investments.
| (a) | Schedule of Investments is included as part of the Report to Stockholders filed under Item 1 of this Form N-CSR. |
Item 7. Disclosure of Proxy Voting Policies and Procedures for Closed-End Management Investment Companies.
| | Not applicable to the registrant. |
Item 8. Portfolio Managers of Closed-End Management Investment Companies.
| | Not applicable to the registrant. |
Item 9. Purchases of Equity Securities by Closed-End Management Investment Company and Affiliated Purchasers.
| | Not applicable to the registrant. |
Item 10. Submission of Matters to Vote of Security Holders.
| | There have been no material changes by which shareholders may recommend nominees to the Board of Trustees. |
Item 11. Controls and Procedures.
| (a) | The registrant’s principal executive officer and principal financial officer have evaluated the registrant’s disclosure controls and procedures (as defined in Rule 30a-3(c) under the Investment Company Act of 1940, as amended) within 90 days of this report and have concluded that the registrant’s disclosure controls and procedures were effective as of that date. |
| (b) | There was no change in the registrant’s internal control over financial reporting (as defined in Rule 30a-3(d) under the Investment Company Act of 1940, as amended) during the period covered by this report that has materially affected, or is reasonably likely to materially affect, the registrant’s internal control over financial reporting. |
Item 12. Disclosure of Securities Lending Activities for Closed-End Management Investment Companies.
Not applicable to registrant.
Item 13. Exhibits.
| (a)(1) | The registrant’s Code of Ethics for Principal Executive and Senior Financial Officers, which is the subject of the disclosure required by Item 2 of Form N-CSR is filed herewith as Exhibit 13(a)(1). |
| (a)(2) | The certifications required by Rule 30a-2(a) of the Investment Company Act of 1940, as amended, and Section 302 of the Sarbanes-Oxley Act of 2002 are attached hereto as Exhibit 99.Cert. |
| (b) | The certifications by the registrant’s principal executive officer and principal financial officer, as required by Rule 30a-2(b) of the Investment Company Act of 1940, as amended, and Section 906 of the Sarbanes-Oxley Act of 2002 are attached hereto as Exhibit 99.906Cert. |
SIGNATURES
Pursuant to the requirements of the Securities Exchange Act of 1934 and the Investment Company Act of 1940, the Registrant has duly caused this report to be signed on its behalf by the undersigned, thereunto duly authorized.
CLOUGH FUNDS TRUST
| By: | /s/ Edmund J. Burke | |
| | Edmund J. Burke | |
| | President/Principal Executive Officer | |
| | | |
| Date: | January 8, 2018 | |
Pursuant to the requirements of the Securities Exchange Act of 1934 and the Investment Company Act of 1940, this report has been signed below by the following persons on behalf of the Registrant and in the capacities and on the dates indicated.
CLOUGH FUNDS TRUST
| By: | /s/ Edmund J. Burke | |
| | Edmund J. Burke | |
| | President/Principal Executive Officer | |
| | | |
| Date: | January 8, 2018 | |
| By: | /s/ Jill Kerschen | |
| | Jill Kerschen | |
| | Treasurer/Principal Financial Officer | |
| | | |
| Date: | January 8, 2018 | |