UNITED STATES
SECURITIES AND EXCHANGE COMMISSION
Washington, D.C. 20549
FORM N-CSR
CERTIFIED SHAREHOLDER REPORT OF REGISTERED
MANAGEMENT INVESTMENT COMPANIES
| | |
Investment Company Act file number | | 811-23051 |
Nuveen High Income 2020 Target Term Fund
(Exact name of registrant as specified in charter)
Nuveen Investments
333 West Wacker Drive
Chicago, IL 60606
(Address of principal executive offices) (Zip code)
Gifford R. Zimmerman
Nuveen Investments
333 West Wacker Drive
Chicago, IL 60606
(Name and address of agent for service)
Registrant’s telephone number, including area code: (312) 917-7700
Date of fiscal year end: December 31
Date of reporting period: December 31, 2016
Form N-CSR is to be used by management investment companies to file reports with the Commission not later than 10 days after the transmission to stockholders of any report that is required to be transmitted to stockholders under Rule 30e-1 under the Investment Company Act of 1940 (17 CFR 270.30e-1). The Commission may use the information provided on Form N-CSR in its regulatory, disclosure review, inspection, and policymaking roles.
A registrant is required to disclose the information specified by Form N-CSR, and the Commission will make this information public. A registrant is not required to respond to the collection of information contained in Form N-CSR unless the Form displays a currently valid Office of Management and Budget (“OMB”) control number. Please direct comments concerning the accuracy of the information collection burden estimate and any suggestions for reducing the burden to Secretary, Securities and Exchange Commission, 450 Fifth Street, NW, Washington, DC 20549-0609. The OMB has reviewed this collection of information under the clearance requirements of 44 U.S.C. ss. 3507.
ITEM 1. REPORTS TO STOCKHOLDERS.
| | |
| | |  |
| Closed-End Funds | |
| | | | | | |
| | | | | | | Annual Report December 31, 2016 |
| | | |
| | | | | | |
| | | | | | | |
| JHY | | | | | | |
| Nuveen High Income 2020 Target Term Fund | | |
| | | | | | | |
| JHD | | | | | | |
| Nuveen High Income December 2019 Target Term Fund | | |
| | | | | | | |
| JHA | | | | | | |
| Nuveen High Income December 2018 Target Term Fund | | |
| | | | | | | |
| JHB | | | | | | |
| Nuveen High Income November 2021 Target Term Fund | | |
| | | | | | | | | | | | |
| | | | |
| | | | |
| | | | | | | | |
| |
| | Life is Complex |
| |
| | Nuveen makes things e-simple. It only takes a minute to sign up for e-Reports. Once enrolled, you’ll receive an e-mail as soon as your Nuveen Fund information is ready – no more waiting for delivery by regular mail. Just click on the link within the e-mail to see the report and save it on your computer if you wish. |
| | |
| | Free e-Reports right to your e-mail! |
| |
| | www.investordelivery.com If you receive your Nuveen Fund distributions and statements from your financial advisor or brokerage account. |
| |
| or | | www.nuveen.com/accountaccess If you receive your Nuveen Fund distributions and statements directly from Nuveen. |
Table
of Contents
Chairman’s Letter
to Shareholders

Dear Shareholders,
The past year saw a striking shift in the markets’ tone. The start of 2016 was beset by China’s economic woes, growing recession fears in the U.S. and oil prices sinking to lows not seen in more than a decade. World stock markets plunged, while bonds and other safe-haven assets rallied. But, by the end of the year, optimism had taken root. Economic outlooks were more upbeat, commodity prices stabilized, equity markets rebounded and bonds retreated. Despite the initial shocks of the Brexit referendum in the U.K. and Donald Trump’s win in the U.S. presidential election, and the uncertainties posed by the implications of these votes, sentiment continued to swing toward the positive as 2016 ended.
In between the year’s turbulent start and exuberant end, markets were soothed by improving economic data out of China, as the government’s stimulus measures appeared to be working, and a recovery in the energy and commodity-related sectors. The U.S. Federal Reserve backed off its more aggressive projections from the beginning of the year, only raising the fed funds rate once during the year, in December. The central banks in Europe and Japan maintained their accommodative stances. Global economic growth remained lackluster overall, as the pace of U.S. growth remained consistently mediocre. China appeared to moderate its slowdown and low growth in Europe and Japan persisted.
Will 2017 be the year of accelerating global growth and rising inflation that the markets are expecting? President Trump’s business-friendly, pro-growth agenda has been well received by the markets, but the policy details and the timeline have yet to take shape. Furthermore, there could be potential downside risks if “Trumponomics” were to trigger a steeper rise in inflation or a trade war. Outside the U.S., political dynamics in Europe are also in flux this year, with Brexit negotiations ongoing and elections in Germany, France and the Netherlands, and possibly a snap election in Italy.
Given the slate of policy unknowns and the range of possible outcomes, we believe volatility will remain a fixture this year. In this environment, Nuveen remains committed to both managing downside risks and seeking upside potential. If you’re concerned about how resilient your investment portfolio might be, we encourage you to talk to your financial advisor. On behalf of the other members of the Nuveen Fund Board, we look forward to continuing to earn your trust in the months and years ahead.
Sincerely,

William J. Schneider
Chairman of the Board
February 23, 2017
Portfolio Managers’
Comments
Nuveen High Income 2020 Target Term Fund (JHY)
Nuveen High Income December 2019 Target Term Fund (JHD)
Nuveen High Income December 2018 Target Term Fund (JHA)
Nuveen High Income November 2021 Target Term Fund (JHB)
Nuveen High Income 2020 Target Term Fund (JHY), Nuveen High Income December 2019 Target Term Fund (JHD), Nuveen High Income December 2018 Target Term Fund (JHA), and Nuveen High Income November 2021 Target Term Fund (JHB) are closed-end funds that are advised by Nuveen Fund Advisors, LLC (NFAL) and feature portfolio management by Nuveen Asset Management, LLC (NAM). The Funds’ portfolio managers are John T. Fruit, CFA, and Jeffrey T. Schmitz, CFA.
Here they discuss economic and market conditions, key investment strategies and the Funds’ performance for the twelve-month reporting period through December 31, 2016 for JHY and JHA; for the abbreviated reporting period since the Fund’s inception on May 10, 2016 through December 31, 2016 for JHD; and for the abbreviated reporting period since the Fund’s inception on August 23, 2016 through December 31, 2016 for JHB.
What factors affected the U.S. economy and financial markets during the twelve-month reporting period ended December 31, 2016?
The restrained pace of growth that has defined the U.S. economic recovery since 2009 continued in the twelve-month reporting period. In the four calendar quarters of 2016, growth averaged below 2% (annualized), as measured by real gross domestic product (GDP), which is the value of goods and services produced by the nation’s economy less the value of the goods and services used up in production, adjusted for price changes. Weakness was more pronounced in the first half of the reporting period, as GDP growth averaged below 1.5% in the first two quarters. Although a short-term jump in exports contributed to a more robust gain of 3.5% in the third quarter, the drop in exports that followed widened the trade deficit, which dampened economic activity to a 1.9% annualized rate in the last three months of 2016, as reported by the “advance” estimate of the Bureau of Economic Analysis.
Consumers, whose purchases comprise the largest component of the U.S. economy, benefited from employment growth and firming wages over the twelve-month reporting period. As reported by the Bureau of Labor Statistics, the unemployment rate fell to 4.7% in December 2016 from 5.0% in December 2015 and job gains averaged slightly above 200,000 per month for the past twelve months. Consumer spending surged in the second quarter of 2016, then decelerated somewhat in the second half of the reporting period. Moreover, as the cost of gasoline and rents climbed over 2016, inflation ticked higher. The Consumer Price Index (CPI) rose 2.1% over the twelve-month reporting period ended
Certain statements in this report are forward-looking statements. Discussions of specific investments are for illustration only and are not intended as recommendations of individual investments. The forward-looking statements and other views expressed herein are those of the portfolio managers as of the date of this report. Actual future results or occurrences may differ significantly from those anticipated in any forward-looking statements and the views expressed herein are subject to change at any time, due to numerous market and other factors. The Funds disclaim any obligation to update publicly or revise any forward-looking statements or views expressed herein.
For financial reporting purposes, the ratings disclosed are the highest rating given by one of the following national rating agencies: Standard & Poor’s (S&P), Moody’s Investors Service, Inc. (Moody’s) or Fitch, Inc. (Fitch). This treatment of split-rated securities may differ from that used for other purposes, such as for Fund investment policies. Credit ratings are subject to change. AAA, AA, A and BBB are investment grade ratings; BB, B, CCC, CC, C and D are below investment grade ratings. Certain bonds backed by U.S. Government or agency securities are regarded as having an implied rating equal to the rating of such securities. Holdings designated N/R are not rated by these national rating agencies.
Refer to the Glossary of Terms Used in this Report for further definition of the terms used within this section.
Portfolio Managers’ Comments (continued)
December 2016 on a seasonally adjusted basis, as reported by the U.S. Bureau of Labor Statistics. The core CPI (which excludes food and energy) increased 2.2% during the same period, slightly above the Federal Reserve’s (Fed) unofficial longer term inflation objective of 2.0%.
The housing market was another bright spot in the economy. The S&P CoreLogic Case-Shiller U.S. National Home Price Index, which covers all nine U.S. census divisions, recorded a 5.6% annual gain in November 2016 (most recent data available at the time this report was prepared) (effective July 26, 2016, the S&P/Case-Shiller U.S. National Home Price Index was renamed the S&P CoreLogic Case-Shiller U.S. National Home Price Index). The 10-City and 20-City Composites reported year-over-year increases of 4.5% and 5.3%, respectively.
Business spending weakened in the first half of 2016 but modestly improved over the remainder of the year. Early in the reporting period, the energy sector’s slump, financial market turbulence and a murky outlook on U.S. and global growth weighed on business sentiment and dampened spending. However, business confidence improved in the second half of the year, as oil prices stabilized, recession fears diminished and the election of Donald Trump stoked expectations for new pro-growth fiscal policy.
Given the economy’s consistent expansion and the uptick in the inflation rate, the Fed raised one of its main interest rates in December for the second time in a year, to a range of 0.50% to 0.75%. Additionally at its December 2016 meeting, the Fed revised its forecast from two to three increases in 2017, signaling greater confidence in the economy and rising inflation expectations.
Other market-moving events during the reporting period included a spike in volatility in January and February 2016 triggered by deteriorating sentiment about China’s economy, another sharp downturn in oil prices and concerns about central bank policy both in the U.S. and around the world. The Brexit referendum in June 2016 also caught investors off guard. In response, U.K. sterling fell to 30-year lows and global equities tumbled while perceived safe-haven assets such as gold, the U.S. dollar and government bonds saw large inflows. However, the markets stabilized fairly quickly post-Brexit vote, buoyed by reassurances from global central banks and a perception that the temporary price rout presented an attractive buying opportunity. Following a relatively calm July and August 2016, volatility resumed in the final months of the reporting period. Investors worried whether central banks were reaching the limits of their effectiveness as global growth continues to stagnate. The health of the European banking sector came into question, renewing concerns about the potential to trigger a wider crisis. Political uncertainty increased leading up to the November U.S. presidential election, and Trump’s unexpected win contributed to an initial sell-off across global markets. However, after digesting the “shock,” U.S. equities rallied strongly and global developed market stocks pared their losses, while emerging markets, fixed income and gold remained lower through the end of the reporting period.
Nuveen High Income 2020 Target Term Fund (JHY)
What key strategies were used to manage the Fund during this twelve-month reporting period ended December 31, 2016?
The Fund has an objective to provide a high level of current income and to return the original $9.85 net asset value (NAV) per common share on or about November 1, 2020. The Fund seeks to achieve its investment objectives by investing primarily in shorter maturity, high yield (below investment grade) corporate debt securities. High yield bonds typically offer higher yields than investment grade bonds, in exchange for greater credit risk. Bonds with shorter maturities have lower duration (or interest rate sensitivity) than longer maturity bonds, which may help mitigate price declines if rates rise.
The Fund may invest in other types of securities including senior loans, convertible securities and other types of debt instruments and derivatives that provide comparable economic exposure to the corporate debt market. At least 80% of its managed assets will be in corporate debt securities and separately, at least 80% in securities that, at the time of investment, are rated below investment grade or are unrated but judged by the portfolio managers to be of
comparable quality. No more than 15% will be in securities rated CCC+/Caa1 or lower at the time of investment. Up to 30% may be in securities of non-U.S. issuers, including up to 20% in emerging market issuers, and up to 10% may be in non-U.S. dollar denominated securities.
The Fund seeks to identify securities across diverse sectors and industries that the managers believe are undervalued or mispriced. In seeking to return the original NAV on or about November 1, 2020, the Fund intends to utilize various portfolio and cash flow management techniques, including setting aside a portion of its net investment income, possibly retaining gains and limiting the longest maturity of any holding to no later than May 1, 2021. The Fund also uses leverage.
How did the Fund perform during this twelve-month reporting period ended December 31, 2016?
The table in the Performance Overview and Holding Summaries section of this report provides total return performance for the Fund for the twelve-month and since inception periods ended December 31, 2016. For the twelve-month reporting period ended December 31, 2016, the Fund outperformed the Barclays U.S. High Yield 1-5 Year Cash Pay 2% Issuer Capped Index based on the Fund’s total return at NAV.
High yield spreads compressed over the majority of the reporting period after reaching their widest point in mid-February of roughly 1000 basis points over Treasuries. By the end of 2016, spreads had narrowed to the tightest level the market has seen during this credit cycle at roughly 440 basis points over Treasuries. For several weeks in late October and early November 2016, a combination of mutual fund outflows and associated concerns about a discernable move in interest rates brought a lull to the “risk-on” rally that had characterized much of 2016. However, following the November elections, the high yield market continued its upward path and finished the reporting period on a high note, producing significantly stronger returns than most had predicted. The segment’s performance was even more impressive considering that high yield had its worst start to a year on record in the first six weeks of 2016. While the rally in the high yield market was broad based, the rebound in the oil markets was certainly a driving force during much of the reporting period. Improving oil prices helped fuel a recovery in energy bond prices, but also boosted confidence in the high yield market overall, given the large representation of energy and commodity credits within the major high yield indices. Lower quality, CCC rated bonds outperformed the broader market over the reporting period, as investors added risk to their portfolios in light of the strong high yield market conditions.
Credit performance within the Fund was strong and generally in line with the overall market, weakening during the first five weeks of 2016, but then rebounding strongly throughout the remainder of the reporting period. Overall, we saw little in the way of credit deterioration in our portfolio, although we did actively reduce a handful of credit exposures where we deemed the risk profile was no longer suitable for the Fund. Despite the increase of energy credit defaults in the broader market, commodity sectors continued their resurgence and handily outperformed the broader market during the reporting period. The Fund carries below-market exposures to energy as set forth at its inception; however, the credits we did hold in the sector benefited from the strong recovery in energy. Also, our Fund had no default activity within the energy sector and no defaults across its whole portfolio. The Fund’s outperformance of its benchmark was the result of a number of its legacy positions in energy and basic materials credits that enjoyed a strong rebound during the reporting period. As a result of tightening credit spreads in the high yield market, the Fund’s NAV continued to recover over the course of the reporting period, but ended 2016 trading slightly below the original NAV.
The Fund seeks to protect against credit losses to help ensure the goal of returning its original NAV. While the Fund is designed to own more or less a static portfolio of high yield bonds, at times we have to add new securities to replace ones that have been called away or tendered. As we replace these bonds, we seek to maximize the Fund’s yield within the maturity, diversification and credit quality constraints described at the outset of the strategy. We may also look to maximize the Fund’s yield through opportunistic sales of securities that we believe have reached their upside potential, investing the proceeds in other securities that have a more attractive yield or credit profile. The Fund has experienced
net realized losses and may incur future losses elsewhere in the portfolio, but the goal is to offset those losses with net
Portfolio Managers’ Comments (continued)
realized gains over time. The Fund has reduced the net realized loss over the past six months with realized gains, and intends to convert additional net unrealized portfolio gains to realized gains in the future. The Fund’s focus on shorter-dated maturities, coupled with limitations to CCC rated securities, should result in relatively lower volatility and help buffer its NAV performance during periods of weakness for the high yield market. We saw proof of this during the course of the reporting period as the market experienced distinct periods of strengths and weakness, while the Fund’s NAV performance was less volatile than the broader market.
Although the overall default rate ticked up steadily during the course of 2016, it was almost entirely due to lingering stresses in the energy and mining complexes, with little spillover to the rest of the high yield market. Our view of a contained default environment, which is also predicated on our belief that the U.S. will avoid a near-term recession, has us positively disposed toward the high yield market. For our part, we are less comfortable with a reliance on central banks to maintain low interest rates forever; however, under the easy monetary policies currently in place, we believe investors will continue to reach for yield. We believe current valuations, coupled with increasing interest rate risk, will steer more investors down in quality rather than toward extending duration, which could lead to an extension of the current credit cycle.
Nuveen High Income December 2019 Target Term Fund (JHD)
What key strategies were used to manage the Fund during this abbreviated reporting period since the Fund’s inception on May 10, 2016 through December 31, 2016?
The Fund launched on May 10, 2016 with an objective to provide a high level of current income and to return the original $9.86 net asset value (NAV) per common share on or about December 1, 2019. The Fund seeks to achieve its investment objectives by investing primarily in shorter maturity, high yield (below investment grade) corporate debt securities. High yield bonds typically offer higher yields than investment grade bonds, in exchange for greater credit risk. Bonds with shorter maturities have lower duration (or interest rate sensitivity) than longer maturity bonds, which may help mitigate price declines if rates rise.
The Fund may invest in other types of securities including senior loans, convertible securities and other types of debt instruments and derivatives that provide comparable economic exposure to the corporate debt market. At least 80% of its managed assets will be in corporate debt securities and separately, at least 80% in securities that, at the time of investment, are rated below investment grade or are unrated but judged by the portfolio managers to be of comparable quality. No more than 15% will be in securities rated CCC+/Caa1 or lower at the time of investment. Up to 30% may be in securities of non-U.S. issuers, including up to 20% in emerging market issuers, and up to 10% may be in non-U.S. dollar denominated securities.
The Fund seeks to identify securities across diverse sectors and industries that the managers believe are undervalued or mispriced. In seeking to return the original NAV on or about December 1, 2019, the Fund intends to utilize various portfolio and cash flow management techniques, including setting aside a portion of its net investment income, possibly retaining gains and limiting the longest maturity of any holding to no later than June 1, 2020. The Fund also uses leverage.
How did the Fund perform during the abbreviated reporting period since the Fund’s inception on May 10, 2016 through December 31, 2016?
The table in the Performance Overview and Holding Summaries section of this report provides total return performance for the Fund for the since inception period ended December 31, 2016. For the abbreviated reporting period ended December 31, 2016, the Fund underperformed the Barclays U.S. High Yield 1-5 Year Cash Pay 2% Issuer Capped Index based on the Fund’s total return at NAV.
The Fund was launched during a period of strong recovery for the high yield market, with spreads narrowing by the end of the year to the tightest level the market has seen during this credit cycle at roughly 440 basis points over Treasuries.
For several weeks in late October and early November 2016, a combination of mutual fund outflows and associated concerns about a discernable move in interest rates brought a lull to the “risk-on” rally that had characterized much of 2016. However, following the November elections, the high yield market continued its upward path and finished the reporting period on a high note, producing significantly stronger returns than most had predicted. The segment’s performance was even more impressive considering that high yield had its worst start to a year on record in the first six weeks of 2016. While the rally in the high yield market was broad based, the rebound in the oil markets was certainly a driving force during much of the reporting period. Improving oil prices helped fuel a recovery in energy bond prices, but also boosted confidence in the high yield market overall, given the large representation of energy and commodity credits within the major high yield indexes. Lower quality, CCC rated bonds outperformed the broader market over the reporting period, as investors added risk to their portfolios in light of the strong high yield market conditions.
Credit performance within the Fund was strong and generally in line with the overall market, which rebounded strongly for the majority of the reporting period. Overall, we saw little in the way of credit deterioration in our portfolio, although we did actively reduce a handful of credit exposures where we deemed the risk profile was no longer suitable for the Fund. Despite the increase of energy credit defaults in the broader market, commodity sectors continued their resurgence and handily outperformed the broader market during the reporting period. The Fund carries below-market exposures to energy as set forth at its inception; however, the credits we did hold in the sector benefited from the strong recovery in energy. Also, our Fund had no default activity within the energy sector and no defaults across its whole portfolio. The Fund’s lower exposure to energy, combined with its below-market weighting in CCC rated securities, contributed to its underperformance versus the benchmark. As a result of tightening credit spreads in the high yield market, the Fund’s NAV increased over the course of the reporting period and ended 2016 slightly above the original NAV.
The Fund seeks to protect against credit losses to help ensure the goal of returning its original NAV. While the Fund is designed to own more or less a static portfolio of high yield bonds, at times we have to add new securities to replace ones that have been called away or tendered. As we replace these bonds, we seek to maximize the Fund’s yield within the maturity, diversification and credit quality constraints described at the outset of the strategy. We may also look to maximize the Fund’s yield through opportunistic sales of securities that we believe have reached their upside potential, investing the proceeds in other securities that have a more attractive yield or credit profile. Our goal is to monetize some holdings at a gain, which should help to offset any realized or mark-to-market losses that may occur elsewhere in the portfolio. The Fund’s focus on shorter-dated maturities, coupled with limitations to CCC rated securities, should result in lower volatility and help buffer its NAV performance during periods of weakness for the high yield market. We saw proof of this during the course of 2016 as the market experienced distinct periods of strengths and weakness, while the Fund’s NAV performance was less volatile than the broader market.
Although the overall default rate ticked up steadily during the course of 2016, it was almost entirely due to lingering stresses in the energy and mining complexes, with little spillover to the rest of the high yield market. Our view of a contained default environment, which is also predicated on our belief that the U.S. will avoid a near-term recession, has us positively disposed toward the high yield market. For our part, we are less comfortable with a reliance on central banks to maintain low interest rates forever; however, under the easy monetary policies currently in place, we believe investors will continue to reach for yield. We believe current valuations, coupled with increasing interest rate risk, will steer more investors down in quality rather than toward extending duration, which could lead to an extension of the current credit cycle.
Portfolio Managers’ Comments (continued)
Nuveen High Income December 2018 Target Term Fund (JHA)
What key strategies were used to manage the Fund during this twelve-month reporting period ended December 31, 2016?
The Fund has an objective to provide a high level of current income and to return the original $9.86 net asset value (NAV) per common share on or about December 1, 2018. The Fund seeks to achieve its investment objectives by investing primarily in shorter maturity, high yield (below investment grade) corporate debt securities. High yield bonds typically offer higher yields than investment grade bonds, in exchange for greater credit risk. Bonds with shorter maturities have lower duration (or interest rate sensitivity) than longer maturity bonds, which may help mitigate price declines if rates rise.
The Fund may invest in other types of securities including senior loans, convertible securities and other types of debt instruments and derivatives that provide comparable economic exposure to the corporate debt market. At least 80% of its managed assets will be in corporate debt securities and separately, at least 80% in securities that, at the time of investment, are rated below investment grade or are unrated but judged by the portfolio managers to be of comparable quality. No more than 15% will be in securities rated CCC+/Caa1 or lower at the time of investment. Up to 30% may be in securities of non-U.S. issuers, including up to 20% in emerging market issuers, and up to 10% may be in non-U.S. dollar denominated securities.
The Fund seeks to identify securities across diverse sectors and industries that the managers believe are undervalued or mispriced. In seeking to return the original NAV on or about December 1, 2018, the Fund intends to utilize various portfolio and cash flow management techniques, including setting aside a portion of its net investment income, possibly retaining gains and limiting the longest maturity of any holding to no later than June 1, 2019. The Fund also uses leverage.
How did the Fund perform during this twelve-month reporting period ended December 31, 2016?
The table in the Performance Overview and Holding Summaries section of this report provides total return performance for the Fund for the twelve-month and since inception periods ended December 31, 2016. For the twelve-month reporting period ended December 31, 2016, the Fund underperformed the Barclays U.S. High Yield 1-5 Year Cash Pay 2% Issuer Capped Index based on the Fund’s total return at NAV.
High yield spreads compressed over the majority of the reporting period after reaching their widest point in mid-February of roughly 1000 basis points over Treasuries. By the end of 2016, spreads had narrowed to the tightest level the market has seen during this credit cycle at roughly 440 basis points over Treasuries. For several weeks in late October and early November 2016, a combination of mutual fund outflows and associated concerns about a discernable move in interest rates brought a lull to the “risk-on” rally that had characterized much of 2016. However, following the November elections, the high yield market continued its upward path and finished the year on a high note, producing significantly stronger returns than most had predicted. The segment’s performance was even more impressive considering that high yield had its worst start to a year on record in the first six weeks of 2016. While the rally in the high yield market was broad based, the rebound in the oil markets was certainly a driving force during much of the reporting period. Improving oil prices helped fuel a recovery in energy bond prices, but also boosted confidence in the high yield market overall, given the large representation of energy and commodity credits within the major high yield indices. Lower quality, CCC rated bonds outperformed the broader market over the reporting period, as investors added risk to their portfolios in light of the strong high yield market conditions.
Credit performance within the Fund was strong and generally in line with the overall market, weakening during the first five weeks of 2016, but then rebounding strongly throughout the remainder of the reporting period. Overall, we saw little in the way of credit deterioration in our portfolio, although we did actively reduce a handful of credit exposures where we deemed the risk profile was no longer suitable for the Fund. Despite the increase of energy credit defaults in
the broader market, commodity sectors continued their resurgence and handily outperformed the broader market during the reporting period. The Fund carries below-market exposures to energy as set forth at its inception; however, the credits we did hold in the sector benefited from the strong recovery in energy. Also, our Fund had no default activity within the energy sector and no defaults across its whole portfolio. The Fund’s lower exposure to energy, combined with its below-market weighting in CCC rated securities, contributed to its underperformance versus the benchmark. As a result of tightening credit spreads in the high yield market, the Fund’s NAV increased over the course of the reporting period and ended 2016 slightly above the original NAV.
The Fund seeks to protect against credit losses to help ensure the goal of returning its original NAV. While the Fund is designed to own more or less a static portfolio of high yield bonds, at times we have to add new securities to replace ones that have been called away or tendered. As we replace these bonds, we seek to maximize the Fund’s yield within the maturity, diversification and credit quality constraints described at the outset of the strategy. We may also look to maximize the Fund’s yield through opportunistic sales of securities that we believe have reached their upside potential, investing the proceeds in other securities that have a more attractive yield or credit profile. Our goal is to monetize some holdings at a gain, which should help to offset any realized or mark-to-market losses that may occur elsewhere in the portfolio. The Fund’s focus on shorter-dated maturities, coupled with limitations to CCC rated securities, should result in lower volatility and help buffer its NAV performance during periods of weakness for the high yield market. We saw proof of this during the course of 2016 as the market experienced distinct periods of strengths and weakness, while the Fund’s NAV performance was less volatile than the broader market.
Although the overall default rate ticked up steadily during the course of 2016, it was almost entirely due to lingering stresses in the energy and mining complexes, with little spillover to the rest of the high yield market. Our view of a contained default environment, which is also predicated on our belief that the U.S. will avoid a near-term recession, has us positively disposed toward the high yield market. For our part, we are less comfortable with a reliance on central banks to maintain low interest rates forever; however, under the easy monetary policies currently in place, we believe investors will continue to reach for yield. We believe current valuations, coupled with increasing interest rate risk, will steer more investors down in quality rather than toward extending duration, which could lead to an extension of the current credit cycle.
Nuveen High Income November 2021 Target Term Fund (JHB)
What key strategies were used to manage the Fund during this abbreviated reporting period since the Fund’s inception on August 23, 2016 through December 31, 2016?
The Fund launched on August 23, 2016 with an objective to provide a high level of current income and to return the original $9.85 net asset value (NAV) per common share on or about November 1, 2021. The Fund will seek to achieve its investment objectives by investing primarily in shorter maturity, high yield (below investment grade) corporate debt securities. High yield bonds typically offer higher yields than investment grade bonds, in exchange for greater credit risk. Bonds with shorter maturities have lower duration (or interest rate sensitivity) than longer maturity bonds, which may help mitigate price declines if rates rise.
The Fund may invest in other types of securities including senior loans, convertible securities and other types of debt instruments and derivatives that provide comparable economic exposure to the corporate debt market. At least 80% of its managed assets will be in corporate debt securities and separately, at least 80% in securities that, at the time of investment, are rated below investment grade or are unrated but judged by the portfolio managers to be of comparable quality. No more than 15% will be in securities rated CCC+/Caa1 or lower at the time of investment. Up to 30% may be in securities of non-U.S. issuers, including up to 20% in emerging market issuers, and up to 10% may be in non-U.S. dollar denominated securities.
Portfolio Managers’ Comments (continued)
The Fund seeks to identify securities across diverse sectors and industries that the managers believe are undervalued or mispriced. In seeking to return the original NAV on or about November 1, 2021, the Fund intends to utilize various portfolio and cash flow management techniques, including setting aside a portion of its net investment income, possibly retaining gains and limiting the longest maturity of any holding to no later than May 1, 2022. The Fund also uses leverage.
How did the Fund perform during the abbreviated reporting period ended December 31, 2016?
The table in the Performance Overview and Holding Summaries section of this report provides total return performance for the Fund for the August 23, 2016 since inception period through December 31, 2016. For the abbreviated reporting period ended December 31, 2016, the Fund underperformed the Barclays U.S. High Yield 1-5 Year Cash Pay 2% Issuer Capped Index based on the Fund’s total return at NAV. As noted, however, this reporting period was relatively short and the management team was in the process of investing the Fund’s assets; therefore, the comparison to the Fund’s benchmark is less meaningful.
The Fund was launched during a period of strong recovery for the high yield market, with spreads narrowing by the end of the year to the tightest level the market has seen during this credit cycle at roughly 440 basis points over Treasuries. For several weeks in late October and early November 2016, a combination of mutual fund outflows and associated concerns about a discernable move in interest rates brought a lull to the “risk-on” rally that had characterized much of 2016. However, following the November elections, the high yield market continued its upward path and finished the reporting period on a high note, producing significantly stronger returns than most had predicted. The segment’s performance was even more impressive considering that high yield had its worst start to a year on record in the first six weeks of 2016. While the rally in the high yield market was broad based, the rebound in the oil markets was certainly a driving force during much of the reporting period. Improving oil prices helped fuel a recovery in energy bond prices, but also boosted confidence in the high yield market overall, given the large representation of energy and commodity credits within the major high yield indices. Lower quality, CCC rated bonds outperformed the broader market over the reporting period, as investors added risk to their portfolios in light of the strong high yield market conditions.
Credit performance within the Fund was strong and generally in line with the overall market, which rebounded strongly for the majority of the reporting period. Overall, we saw little in the way of credit deterioration in our portfolio, although we did actively reduce a handful of credit exposures where we deemed the risk profile was no longer suitable for the Fund. Despite the increase of energy credit defaults in the broader market, commodity sectors continued their resurgence and handily outperformed the broader market during the reporting period. The Fund carries below-market exposures to energy as set forth at its inception; however, the credits we did hold in the sector benefited from the strong recovery in energy. Also, our Fund had no default activity within the energy sector, and no defaults across its whole portfolio. The Fund’s lower exposure to energy, combined with its below market weighting in CCC rated securities, contributed to its underperformance versus the benchmark. As a result of tightening credit spreads in the high yield market, the Fund’s NAV increased over the course of the reporting period and ended 2016 slightly above the original NAV.
The Fund seeks to protect against credit losses to help ensure the goal of returning its original NAV. While the Fund is designed to own more or less a static portfolio of high yield bonds, at times we have to add new securities to replace ones that have been called away or tendered. As we replace these bonds, we seek to maximize the Fund’s yield within the maturity, diversification and credit quality constraints described at the outset of the strategy. We may also look to maximize the Fund’s yield through opportunistic sales of securities that we believe have reached their upside potential, investing the proceeds in other securities that have a more attractive yield or credit profile. Our goal is to monetize some holdings at a gain, which should help to offset any realized or mark-to-market losses that may occur elsewhere in the portfolio. The Fund’s focus on shorter-dated maturities, coupled with limitations to CCC rated securities, should result in lower volatility and help buffer its NAV performance during periods of weakness for the high yield market. We
saw proof of this during the course of 2016 as the market experienced distinct periods of strengths and weakness, while the Fund’s NAV performance was less volatile than the broader market.
Although the overall default rate ticked up steadily during the course of 2016, it was almost entirely due to lingering stresses in the energy and mining complexes, with little spillover to the rest of the high yield market. Our view of a contained default environment, which is also predicated on our belief that the U.S. will avoid a near-term recession, has us positively disposed toward the high yield market. For our part, we are less comfortable with a reliance on central banks to maintain low interest rates forever; however, under the easy monetary policies currently in place, we believe investors will continue to reach for yield. We believe current valuations, coupled with increasing interest rate risk, will steer more investors down in quality rather than toward extending duration, which could lead to an extension of the current credit cycle.
Fund
Leverage
IMPACT OF THE FUNDS’ LEVERAGE STRATEGIES ON PERFORMANCE
One important factor impacting the returns of the Funds relative to their comparative benchmarks was the Funds’ use of leverage through the use of bank borrowings. The Funds use leverage because our research has shown that, over time, leveraging provides opportunities for additional income and total return for shareholders. However, use of leverage also can expose shareholders to additional volatility. For example, as the prices of securities held by a Fund decline, the negative impact of these valuation changes on NAV and shareholder total return is magnified by the use of leverage. Conversely, leverage may enhance returns during periods when the prices of securities held by a Fund generally are rising. The Funds’ use of leverage had a positive impact on performance in JHY, JHD and JHA and a negligible impact on JHB during this reporting period.
As of December 31, 2016, the Funds’ percentages of leverage are shown in the accompanying table.
| | | | | | | | | | | | | | | | |
| | | JHY | | | JHD | | | JHA | | | JHB | |
Effective Leverage* | | | 24.79 | % | | | 24.67 | % | | | 23.72 | % | | | 25.54 | % |
Regulatory Leverage* | | | 24.79 | % | | | 24.67 | % | | | 23.72 | % | | | 25.54 | % |
| * | Effective Leverage is a Fund’s effective economic leverage, and includes both regulatory leverage and the leverage effects of certain derivative and other investments in a Fund’s portfolio that increase the Fund’s investment exposure. Regulatory leverage consists of preferred shares issued or borrowings of a Fund. A Fund, however, may from time to time borrow on a typically transient basis in connection with its day-to-day operations, primarily in connection with the need to settle portfolio trades. Such incidental borrowings are excluded from the calculation of a Fund’s effective leverage ratio. Both of these are part of a Fund’s capital structure. Regulatory leverage is subject to asset coverage limits set forth in the Investment Company Act of 1940. |
THE FUNDS’ REGULATORY LEVERAGE
Bank Borrowings
As noted above, the Funds employ leverage through the use of bank borrowings. The Funds’ bank borrowing activities are as shown in the accompanying table.
| | | | | | | | | | | | | | | | | | | | | | | | | | | | | | | | |
| | | Current Reporting Period | | | Subsequent to the Close of
the Reporting Period | |
| Fund | | January 1,
2016 | | | Draws | | | Paydowns | | | December 31,
2016 | | | Average Balance
Outstanding | | | Draws | | | Paydowns | | | February 28,
2017 | |
JHY | | $ | 44,000,000 | | | $ | — | | | $ | — | | | $ | 44,000,000 | | | $ | 44,000,000 | | | $ | — | | | $ | — | | | $ | 44,000,000 | |
JHD | | $ | — | | | $ | 90,000,000 | | | $ | — | | | $ | 90,000,000 | | | $ | 86,044,776 | * | | $ | — | | | $ | — | | | $ | 90,000,000 | |
JHA | | $ | 25,000,000 | | | $ | 67,000,000 | | | $ | — | | | $ | 92,000,000 | | | $ | 87,213,115 | | | $ | — | | | $ | — | | | $ | 92,000,000 | |
JHB | | $ | — | | | $ | 190,000,000 | | | $ | — | | | $ | 190,000,000 | | | $ | 162,839,506 | ** | | $ | — | | | $ | — | | | $ | 190,000,000 | |
| * | For the period June 14, 2016 (initial draw on borrowings) through December 31, 2016. |
| ** | For the period October 12, 2016 (initial draw on borrowings) through December 31, 2016. |
Refer to Notes to Financial Statements, Note 8 – Borrowing Arrangements for further details.
Share
Information
DISTRIBUTION INFORMATION
The following information regarding the Funds’ distributions is current as of December 31, 2016. Each Fund’s distribution levels may vary over time based on each Fund’s investment activity and portfolio investment value changes.
During the current reporting period, the following Funds’ distributions to shareholders were as shown in the accompanying table.
| | | | | | | | | | | | | | | | |
| | | Per Share Amounts | |
| Monthly Distributions (Ex-Dividend Date) | | JHY | | | JHD | | | JHA | | | JHB | |
January 2016 | | $ | 0.0570 | | | $ | — | | | $ | 0.0505 | | | $ | — | |
February | | | 0.0570 | | | | — | | | | 0.0505 | | | | — | |
March | | | 0.0570 | | | | — | | | | 0.0505 | | | | — | |
April | | | 0.0570 | | | | — | | | | 0.0505 | | | | — | |
May | | | 0.0570 | | | | — | | | | 0.0505 | | | | — | |
June | | | 0.0570 | | | | — | | | | 0.0505 | | | | — | |
July | | | 0.0570 | | | | 0.0505 | | | | 0.0505 | | | | — | |
August | | | 0.0570 | | | | 0.0505 | | | | 0.0505 | | | | — | |
September | | | 0.0555 | | | | 0.0505 | | | | 0.0505 | | | | — | |
October | | | 0.0555 | | | | 0.0505 | | | | 0.0505 | | | | 0.0500 | |
November | | | 0.0555 | | | | 0.0505 | | | | 0.0505 | | | | 0.0500 | |
December 2016 | | | 0.0555 | | | | 0.0505 | | | | 0.0505 | | | | 0.0500 | |
Total Distributions | | $ | 0.6780 | | | $ | 0.3030 | | | $ | 0.6060 | | | $ | 0.1500 | |
| | | | |
Current Distribution Rate* | | | 6.52 | % | | | 6.00 | % | | | 6.02 | % | | | 6.07 | % |
| * | Current distribution rate is based on the Fund’s current annualized monthly distribution divided by the Fund’s current market price. The Fund’s monthly distributions to its shareholders may be comprised of ordinary income, net realized capital gains and, if at the end of the fiscal year the Fund’s cumulative net ordinary income and net realized gains are less than the amount of the Fund’s distributions, a return of capital for tax purposes. |
JHD declared its initial distribution of $0.0505 in July 2016 while JHB declared $0.0500 in October 2016.
Each Fund seeks to pay regular monthly dividends out of its net investment income at a rate that reflects its past and projected net income performance. To permit each Fund to maintain a more stable monthly dividend, the Fund may pay dividends at a rate that may be more or less than the amount of net income actually earned by the Fund during the period. If a Fund has cumulatively earned more than it has paid in dividends, it will hold the excess in reserve as undistributed net investment income (UNII) as part of the Fund’s net asset value. Conversely, if a Fund has cumulatively paid in dividends more than it has earned, the excess will constitute a negative UNII that will likewise be reflected in the Fund’s net asset value. Each Fund will, over time, pay all its net investment income as dividends to shareholders.
As of December 31, 2016, all the Funds had positive UNII balances for tax purposes and positive UNII balances for financial reporting purposes.
The monthly dividends paid by JHY during the reporting period were sourced entirely from net investment income. JHD, JHA, and JHB had net realized gains for the fiscal year ended 2016, and instead of declaring a separate capital gain for these funds, a portion of the monthly distributions were recharacterized as either long-term or short-term capital gains, as appropriate. The total monthly distributions for these funds, less the capital gain recharacterizations, were sourced from net investment income. For financial reporting purposes, the composition and per share amounts of each Fund’s dividends for the reporting period are presented in this report’s Statement of Changes in Net Assets and Financial Highlights, respectively. For income tax purposes, distribution information for each Fund as of its most recent tax year end is presented in Note 6 – Income Tax Information within the Notes to Financial Statements of this report.
Share Information (continued)
The following table presents the regular, monthly distributions for the following Fund for the current fiscal period. The final determination of the source and characteristics of all distributions will be made in early 2017 and reported to shareholders on Form 1099-DIV at that time.
| | | | | | | | | | | | | | | | |
| Fiscal Year (Calendar Year) Ended December 31, 2016 | | JHY | | | JHD | | | JHA | | | JHB | |
Regular monthly distribution per share | | | | | | | | | | | | | | | | |
From net investment income | | $ | 0.6780 | | | $ | 0.2674 | | | $ | 0.5513 | | | $ | 0.1444 | |
From long-term capital gains | | | — | | | | — | | | | 0.0132 | | | | — | |
From short-term capital gains | | | — | | | | 0.0356 | | | | 0.0415 | | | | 0.0056 | |
Total per share distribution | | $ | 0.6780 | | | $ | 0.3030 | | | $ | 0.6060 | | | $ | 0.1500 | |
EQUITY SHELF PROGRAM
During August 2016, JHY filed a registration statement with the Securities and Exchange Commission to issue additional shares through an equity shelf program, which became effective subsequent to the close of this reporting period. Under this program JHY, subject to market conditions, may raise additional capital from time to time in varying amounts and offering methods at a net price at or above the Fund’s NAV per share.
SHARE REPURCHASES
During August 2016, the Funds’ Board of Trustees reauthorized JHY and authorized both JHD and JHA to participate in Nuveen’s closed-end fund complex-wide share repurchase program, allowing each Fund to repurchase an aggregate of up to approximately 10% of its outstanding shares.
As of December 31, 2016, and since the inception of the Funds’ repurchase programs, the Funds have cumulatively repurchased and retired their outstanding shares as shown in the accompanying table.
| | | | | | | | | | | | |
| | | JHY | | | JHD | | | JHA | |
Shares cumulatively repurchased and retired | | | — | | | | — | | | | — | |
Shares authorized for repurchase | | | 1,370,000 | | | | 2,705,000 | | | | 2,930,000 | |
OTHER SHARE INFORMATION
As of December 31, 2016, and during the current reporting period, the Funds’ share prices were trading at premium/(discount) to their share NAVs as shown in the accompanying table.
| | | | | | | | | | | | | | | | |
| | | JHY | | | JHD | | | JHA | | | JHB | |
NAV | | $ | 9.75 | | | $ | 10.15 | | | $ | 10.08 | | | $ | 9.92 | |
Share price | | $ | 10.21 | | | $ | 10.10 | | | $ | 10.06 | | | $ | 9.88 | |
Premium/(Discount) to NAV | | | 4.72 | % | | | (0.49 | )% | | | (0.20 | )% | | | (0.40 | )% |
12-month average premium/(discount) to NAV | | | 11.56 | % | | | 1.06 | %* | | | 2.81 | % | | | 2.09 | %** |
| * | For the period May 10, 2016 (commencement of operations) through December 31, 2016. |
| ** | For the period August 23, 2016 (commencement of operations) through December 31, 2016. |
JHY, JHD, JHA and JHB each have an investment objective to return $9.85, $9.86, $9.86 and $9.85, respectively (the original net asset value following each Fund’s initial public offering (the “Original NAV”)) to shareholders on or about the end of the Fund’s term. There can be no assurance that the Funds will be able to return the Original NAV to shareholders, and such return is not backed or otherwise guaranteed by the Funds’ investment adviser, Nuveen Fund Advisors, LLC (the “Adviser”), or any other entity.
Each Fund’s ability to return Original NAV to common shareholders on or about the Termination Date will depend on market conditions and the success of various portfolio and cash flow management techniques. Each Fund currently intends to set aside and retain in its net assets a portion of its net investment income and possibly all or a portion of its
gains. This will reduce the amounts otherwise available for distribution prior to the liquidation of each Fund, and the Fund may incur taxes on such retained amount, which will reduce the overall amounts that the Fund would have otherwise been able to distribute. Such retained income or gains, net of any taxes, would constitute a portion of the liquidating distribution returned to investors at the end of each Fund’s term. In addition, each Fund’s investment in shorter term and lower yielding securities, especially as the Fund nears the end of its term, may reduce investment income and, therefore, the monthly dividends during the period prior to termination. Investors that purchase shares in the secondary market (particularly if their purchase price differs meaningfully from the Original NAV) may receive more or less than their original investment.
Risk
Considerations
Fund shares are not guaranteed or endorsed by any bank or other insured depository institution, and are not federally insured by the Federal Deposit Insurance Corporation.
Nuveen High Income 2020 Target Term Fund (JHY)
Investing in closed-end funds involves risk; principal loss is possible. There is no guarantee the Fund’s investment objectives will be achieved. Closed-end fund shares may frequently trade at a discount or premium to their net asset value. Debt or fixed income securities such as those held by the Fund, are subject to market risk, credit risk, interest rate risk, derivatives risk, liquidity risk, and income risk. As interest rates rise, bond prices fall. Lower credit debt securities may be more likely to fail to make timely interest or principal payments and may be subject to higher liquidity risk. Leverage increases return volatility and magnifies the Fund’s potential return and its risks; there is no guarantee a fund’s leverage strategy will be successful. Foreign investments involve additional risks, including currency fluctuation, political and economic instability, lack of liquidity and differing legal and accounting standards. The risks of foreign investments are magnified in emerging markets. These and other risk considerations including the Fund’s limited term and call risk are described in more detail on the Fund’s web page at www.nuveen.com/JHY.
Nuveen High Income December 2019 Target Term Fund (JHD)
Investing in closed-end funds involves risk; principal loss is possible. There is no guarantee the Fund’s investment objectives will be achieved. Closed-end fund shares may frequently trade at a discount or premium to their net asset value. Debt or fixed income securities such as those held by the Fund, are subject to market risk, credit risk, interest rate risk, derivatives risk, liquidity risk, and income risk. As interest rates rise, bond prices fall. Lower credit debt securities may be more likely to fail to make timely interest or principal payments and may be subject to higher liquidity risk. Leverage increases return volatility and magnifies the Fund’s potential return and its risks; there is no guarantee a fund’s leverage strategy will be successful. Foreign investments involve additional risks, including currency fluctuation, political and economic instability, lack of liquidity and differing legal and accounting standards. The risks of foreign investments are magnified in emerging markets. These and other risk considerations including the Fund’s limited term and call risk are described in more detail on the Fund’s web page at www.nuveen.com/JHD.
Nuveen High Income December 2018 Target Term Fund (JHA)
Investing in closed-end funds involves risk; principal loss is possible. There is no guarantee the Fund’s investment objectives will be achieved. Closed-end fund shares may frequently trade at a discount or premium to their net asset value. Debt or fixed income securities such as those held by the Fund, are subject to market risk, credit risk, interest rate risk, derivatives risk, liquidity risk, and income risk. As interest rates rise, bond prices fall. Lower credit debt securities may be more likely to fail to make timely interest or principal payments and may be subject to higher liquidity risk. Leverage increases return volatility and magnifies the Fund’s potential return and its risks; there is no guarantee a fund’s leverage strategy will be successful. Foreign investments involve additional risks, including currency fluctuation, political and economic instability, lack of liquidity and differing legal and accounting standards. The risks of foreign investments are magnified in emerging markets. These and other risk considerations including the Fund’s limited term and call risk are described in more detail on the Fund’s web page at nuveen.com/JHA.
Nuveen High Income November 2021 Target Term Fund (JHB)
Investing in closed-end funds involves risk; principal loss is possible. There is no guarantee the Fund’s investment objectives will be achieved. Closed-end fund shares may frequently trade at a discount or premium to their net asset value. Debt or fixed income securities such as those held by the Fund, are subject to market risk, credit risk, interest rate risk, derivatives risk, liquidity risk, and income risk. As interest rates rise, bond prices fall. Lower credit debt
securities may be more likely to fail to make timely interest or principal payments and may be subject to higher liquidity risk. Leverage increases return volatility and magnifies the Fund’s potential return and its risks; there is no guarantee a fund’s leverage strategy will be successful. Foreign investments involve additional risks, including currency fluctuation, political and economic instability, lack of liquidity and differing legal and accounting standards. The risks of foreign investments are magnified in emerging markets. These and other risk considerations including the Fund’s limited term and call risk are described in more detail on the Fund’s web page at www.nuveen.com/JHB.
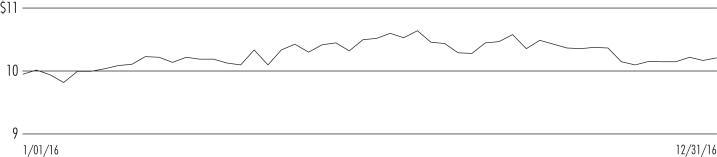
JHY
Nuveen High Income 2020 Target Term Fund
Performance Overview and Holding Summaries as of December 31, 2016
Refer to the Glossary of Terms Used in this Report for further definition of the terms used within this section.
Average Annual Total Returns as of December 31, 2016
| | | | | | | | |
| | | Average Annual | |
| | | 1-Year | | | Since
Inception | |
| JHY at NAV | | | 20.15% | | | | 6.78% | |
| JHY at Share Price | | | 9.94% | | | | 8.69% | |
| Bloomberg Barclays U.S. High Yield 1-5 Year Cash Pay 2% Issuer Capped Index | | | 16.19% | | | | 6.54% | |
Since inception returns are from 7/28/15. Past performance is not predictive of future results. Current performance may be higher or lower than the data shown. Returns do not reflect the deduction of taxes that shareholders may have to pay on Fund distributions or upon the sale of Fund shares. Returns at NAV are net of Fund expenses, and assume reinvestment of distributions. Comparative index return information is provided for the Fund’s shares at NAV only. Indexes are not available for direct investment.
Share Price Performance — Weekly Closing Price
This data relates to the securities held in the Fund’s portfolio of investments as of the end of the reporting period. It should not be construed as a measure of performance for the Fund itself. Holdings are subject to change.
For financial reporting purposes, the ratings disclosed are the highest rating given by one of the following national rating agencies: Standard & Poor’s Group, Moody’s Investors Service, Inc. or Fitch, Inc. This treatment of split-rated securities may differ from that used for other purposes, such as for Fund investment policies. Credit ratings are subject to change. AAA, AA, A and BBB are investment grade ratings; BB, B, CCC, CC, C and D are below-investment grade ratings. Certain bonds backed by U.S. Government or agency securities are regarded as having an implied rating equal to the rating of such securities. Holdings designated N/R are not rated by these national rating agencies.
Fund Allocation
(% of net assets)
| | | | |
| Corporate Bonds | | | 125.3% | |
| Convertible Bonds | | | 1.8% | |
| Sovereign Debt | | | 1.2% | |
| Repurchase Agreements | | | 1.4% | |
| Other Assets Less Liabilities | | | 3.2% | |
Net Assets Plus Borrowings | | | 132.9% | |
| Borrowings | | | (32.9)% | |
Net Assets | | | 100% | |
Country Allocation1
(% of total investments)
| | | | |
| United States | | | 71.0% | |
| Canada | | | 9.5% | |
| Luxembourg | | | 3.2% | |
| Brazil | | | 3.2% | |
| United Kingdom | | | 2.4% | |
| Netherlands | | | 1.8% | |
| Argentina | | | 1.6% | |
| Japan | | | 1.5% | |
| Bermuda | | | 1.2% | |
| Hong Kong | | | 0.9% | |
| Other | | | 3.7% | |
Total | | | 100% | |
Portfolio Composition
(% of total investments)
| | | | |
| Oil, Gas & Consumable Fuels | | | 11.1% | |
| Wireless Telecommunication Services | | | 6.6% | |
| Metals & Mining | | | 5.9% | |
| Diversified Financial Services | | | 5.6% | |
| Household Durables | | | 4.9% | |
| Commercial Services & Supplies | | | 4.5% | |
| Independent Power & Renewable Electricity Producers | | | 4.3% | |
| Diversified Telecommunication Services | | | 3.8% | |
| Equity Real Estate Investment Trusts | | | 3.6% | |
| Media | | | 3.5% | |
| Hotels, Restaurants & Leisure | | | 3.4% | |
| Specialty Retail | | | 3.3% | |
| Consumer Finance | | | 3.1% | |
| Chemicals | | | 2.7% | |
| Health Care Providers & Services | | | 2.3% | |
| Machinery | | | 2.2% | |
| Containers & Packaging | | | 1.8% | |
| Real Estate Management & Development | | | 1.8% | |
| Food Products | | | 1.8% | |
| Auto Components | | | 1.8% | |
| Other | | | 20.0% | |
| Sovereign Debt | | | 0.9% | |
| Repurchase Agreements | | | 1.1% | |
Total | | | 100% | |
Credit Quality
(% of total long-term investments)
| | | | |
| BBB | | | 3.6% | |
| BB or Lower | | | 94.6% | |
| N/R (not rated) | | | 1.8% | |
Total | | | 100% | |
Top Five Issuers
(% of total investments)
| | | | |
| Sprint Corporation | | | 2.1% | |
| iStar Inc. | | | 1.7% | |
| APX Group Holdings Inc. | | | 1.7% | |
| DPL Inc. | | | 1.6% | |
| Petroleo Brasileiro S.A. | | | 1.4% | |
| 1 | Includes 10.4% (as a percentage of total investments) in emerging markets countries. |
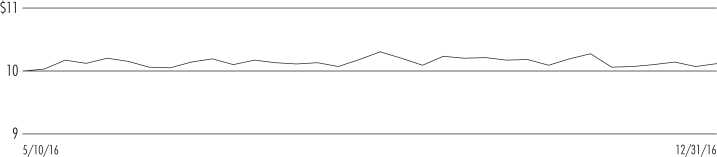
JHD
Nuveen High Income December 2019 Target Term Fund
Performance Overview and Holding Summaries as of December 31, 2016
Refer to the Glossary of Terms Used in this Report for further definition of the terms used within this section.
Cumulative Total Returns as of December 31, 2016
| | | | |
| | | Since
Inception | |
| JHD at NAV | | | 6.07% | |
| JHD at Share Price | | | 4.06% | |
| Bloomberg Barclays U.S. High Yield 1-5 Year Cash Pay 2% Issuer Capped Index | | | 10.18% | |
Since inception returns are from 5/10/16. Past performance is not predictive of future results. Current performance may be higher or lower than the data shown. Returns do not reflect the deduction of taxes that shareholders may have to pay on Fund distributions or upon the sale of Fund shares. Returns at NAV are net of Fund expenses, and assume reinvestment of distributions. Comparative index return information is provided for the Fund’s shares at NAV only. Indexes are not available for direct investment.
Share Price Performance — Weekly Closing Price
This data relates to the securities held in the Fund’s portfolio of investments as of the end of the reporting period. It should not be construed as a measure of performance for the Fund itself. Holdings are subject to change.
For financial reporting purposes, the ratings disclosed are the highest rating given by one of the following national rating agencies: Standard & Poor’s Group, Moody’s Investors Service, Inc. or Fitch, Inc. This treatment of split-rated securities may differ from that used for other purposes, such as for Fund investment policies. Credit ratings are subject to change. AAA, AA, A and BBB are investment grade ratings; BB, B, CCC, CC, C and D are below-investment grade ratings. Certain bonds backed by U.S. Government or agency securities are regarded as having an implied rating equal to the rating of such securities. Holdings designated N/R are not rated by these national rating agencies.
Fund Allocation
(% of net assets)
| | | | |
| Corporate Bonds | | | 126.6% | |
| Convertible Bonds | | | 2.7% | |
| Sovereign Debt | | | 1.5% | |
| Repurchase Agreements | | | 0.3% | |
| Other Assets Less Liabilities | | | 1.7% | |
Net Assets Plus Borrowings | | | 132.8% | |
| Borrowings | | | (32.8)% | |
Net Assets | | | 100% | |
Country Allocation
(% of total investments)1
| | | | |
| United States | | | 70.1% | |
| Canada | | | 7.1% | |
| Luxembourg | | | 4.4% | |
| United Kingdom | | | 4.3% | |
| Brazil | | | 3.3% | |
| Japan | | | 2.2% | |
| Ireland | | | 1.2% | |
| Mexico | | | 1.0% | |
| Netherlands | | | 1.0% | |
| Argentina | | | 0.9% | |
| Other | | | 4.5% | |
Total | | | 100% | |
Portfolio Composition
(% of total investments)
| | | | |
| Oil, Gas & Consumable Fuels | | | 8.9% | |
| Metals & Mining | | | 6.0% | |
| Independent Power & Renewable Electricity Producers | | | 4.9% | |
| Commercial Services & Supplies | | | 4.7% | |
| Wireless Telecommunication Services | | | 4.7% | |
| Household Durables | | | 4.4% | |
| Health Care Providers & Services | | | 3.7% | |
| Technology Hardware, Storage & Peripherals | | | 3.5% | |
| Media | | | 3.3% | |
| Equity Real Estate Investment Trusts | | | 3.3% | |
| Diversified Telecommunication Services | | | 3.3% | |
| Consumer Finance | | | 3.2% | |
| Diversified Financial Services | | | 3.2% | |
| Food Products | | | 2.6% | |
| Airlines | | | 2.6% | |
| Hotels, Restaurants & Leisure | | | 2.5% | |
| Banks | | | 2.4% | |
| Machinery | | | 2.3% | |
| Health Care Equipment & Supplies | | | 1.7% | |
| Automobiles | | | 1.7% | |
| Chemicals | | | 1.7% | |
| Road & Rail | | | 1.7% | |
| Electronic Equipment, Instruments & Components | | | 1.6% | |
| | | | |
| Containers & Packaging | | | 1.5% | |
| Other | | | 19.2% | |
| Sovereign Debt | | | 1.2% | |
| Repurchase Agreements | | | 0.2% | |
Total | | | 100% | |
Credit Quality
(% of total long-term investments)
| | | | |
| A | | | 0.1% | |
| BBB | | | 10.2% | |
| BB or Lower | | | 87.4% | |
| N/R (not rated) | | | 2.3% | |
Total | | | 100% | |
Top Five Issuers
(% of total investments)
| | | | |
| Tenet Healthcare Corporation | | | 1.7% | |
| Lennar Corporation | | | 1.5% | |
| DPL Inc. | | | 1.5% | |
| Bombardier Inc. | | | 1.4% | |
| APX Group Holdings Inc. | | | 1.4% | |
| 1 | Includes 10.9% (as a percentage of total investments) in emerging markets countries. |
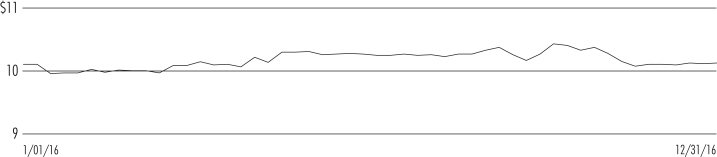
JHA
Nuveen High Income December 2018 Target Term Fund
Performance Overview and Holding Summaries as of December 31, 2016
Refer to the Glossary of Terms Used in this Report for further definition of the terms used within this section.
Average Annual Total Returns as of December 31, 2016
| | | | | | | | |
| | | Average Annual | |
| | | 1-Year | | | Since
Inception | |
| JHA at NAV | | | 11.25% | | | | 7.58% | |
| JHA at Share Price | | | 6.07% | | | | 6.06% | |
| Bloomberg Barclays U.S. High Yield 1-5 Year Cash Pay 2% Issuer Capped Index | | | 16.19% | | | | 11.91% | |
Since inception returns are from 11/12/15. Past performance is not predictive of future results. Current performance may be higher or lower than the data shown. Returns do not reflect the deduction of taxes that shareholders may have to pay on Fund distributions or upon the sale of Fund shares. Returns at NAV are net of Fund expenses, and assume reinvestment of distributions. Comparative index return information is provided for the Fund’s shares at NAV only. Indexes are not available for direct investment.
Share Price Performance — Weekly Closing Price
This data relates to the securities held in the Fund’s portfolio of investments as of the end of the reporting period. It should not be construed as a measure of performance for the Fund itself. Holdings are subject to change.
For financial reporting purposes, the ratings disclosed are the highest rating given by one of the following national rating agencies: Standard & Poor’s Group, Moody’s Investors Service, Inc. or Fitch, Inc. This treatment of split-rated securities may differ from that used for other purposes, such as for Fund investment policies. Credit ratings are subject to change. AAA, AA, A and BBB are investment grade ratings; BB, B, CCC, CC, C and D are below-investment grade ratings. Certain bonds backed by U.S. Government or agency securities are regarded as having an implied rating equal to the rating of such securities. Holdings designated N/R are not rated by these national rating agencies.
Fund Allocation
(% of net assets)
| | | | |
| Corporate Bonds | | | 122.4% | |
| Convertible Bonds | | | 3.9% | |
| Sovereign Debt | | | 2.2% | |
| Other Assets Less Liabilities | | | 2.6% | |
Net Assets Plus Borrowings | | | 131.1% | |
| Borrowings | | | (31.1)% | |
Net Assets | | | 100% | |
Country Allocation
(% of total investments)1
| | | | |
| United States | | | 72.6% | |
| United Kingdom | | | 4.5% | |
| Luxembourg | | | 4.4% | |
| Canada | | | 3.5% | |
| Brazil | | | 2.1% | |
| Japan | | | 2.0% | |
| Ireland | | | 1.9% | |
| South Africa | | | 1.8% | |
| Switzerland | | | 1.7% | |
| Netherlands | | | 1.3% | |
| Other | | | 4.2% | |
Total | | | 100% | |
Portfolio Composition
(% of total investments)
| | | | |
| Oil, Gas & Consumable Fuels | | | 8.3% | |
| Metals & Mining | | | 8.1% | |
| Household Durables | | | 5.5% | |
| Health Care Providers & Services | | | 5.3% | |
| Media | | | 3.7% | |
| Consumer Finance | | | 3.7% | |
| Equity Real Estate Investment Trusts | | | 3.5% | |
| Independent Power & Renewable Electricity Producers | | | 3.3% | |
| Machinery | | | 3.1% | |
| Commercial Services & Supplies | | | 3.0% | |
| Technology Hardware, Storage & Peripherals | | | 2.9% | |
| Food Products | | | 2.8% | |
| Automobiles | | | 2.7% | |
| Airlines | | | 2.6% | |
| Electronic Equipment, Instruments & Components | | | 2.5% | |
| Health Care Equipment & Supplies | | | 2.5% | |
| Road & Rail | | | 2.2% | |
| Diversified Telecommunication Services | | | 2.2% | |
| Chemicals | | | 2.1% | |
| Wireless Telecommunication Services | | | 2.0% | |
| Banks | | | 2.0% | |
| Energy Equipment & Services | | | 1.9% | |
| Containers & Packaging | | | 1.7% | |
| | | | |
| Thrifts & Mortgage Finance | | | 1.5% | |
| Other | | | 19.2% | |
| Sovereign Debt | | | 1.7% | |
Total | | | 100% | |
Credit Quality
(% of total long-term investments)
| | | | |
| BBB | | | 22.4% | |
| BB or Lower | | | 74.8% | |
| N/R (not rated) | | | 2.8% | |
Total | | | 100% | |
Top Five Issuers
(% of total investments)
| | | | |
| Tenet Healthcare Corporation | | | 2.5% | |
| Sprint Corporation | | | 2.0% | |
| HCA Holding Inc. | | | 2.0% | |
| AerCap Holdings NV | | | 1.9% | |
| CIT Group Inc. | | | 1.9% | |
| 1 | Includes 12.2% (as a percentage of total investments) in emerging markets countries. |
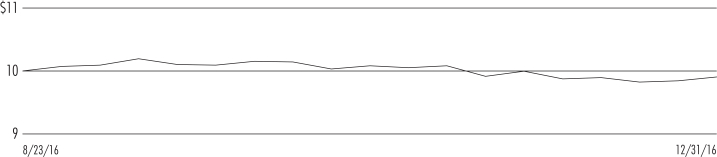
JHB
Nuveen High Income November 2021 Target Term Fund
Performance Overview and Holding Summaries as of December 31, 2016
Refer to the Glossary of Terms Used in this Report for further definition of the terms used within this section.
Cumulative Total Returns as of December 31, 2016
| | | | |
| | | Since
Inception | |
| JHB at NAV | | | 2.26% | |
| JHB at Share Price | | | 0.32% | |
| Bloomberg Barclays U.S. High Yield 1-5 Year Cash Pay 2% Issuer Capped Index | | | 3.54% | |
Since inception returns are from 8/23/16. Past performance is not predictive of future results. Current performance may be higher or lower than the data shown. Returns do not reflect the deduction of taxes that shareholders may have to pay on Fund distributions or upon the sale of Fund shares. Returns at NAV are net of Fund expenses, and assume reinvestment of distributions. Comparative index return information is provided for the Fund’s shares at NAV only. Indexes are not available for direct investment.
Share Price Performance — Weekly Closing Price
This data relates to the securities held in the Fund’s portfolio of investments as of the end of the reporting period. It should not be construed as a measure of performance for the Fund itself. Holdings are subject to change.
For financial reporting purposes, the ratings disclosed are the highest rating given by one of the following national rating agencies: Standard & Poor’s Group, Moody’s Investors Service, Inc. or Fitch, Inc. This treatment of split-rated securities may differ from that used for other purposes, such as for Fund investment policies. Credit ratings are subject to change. AAA, AA, A and BBB are investment grade ratings; BB, B, CCC, CC, C and D are below-investment grade ratings. Certain bonds backed by U.S. Government or agency securities are regarded as having an implied rating equal to the rating of such securities. Holdings designated N/R are not rated by these national rating agencies.
Fund Allocation
(% of net assets)
| | | | |
| Corporate Bonds | | | 129.7% | |
| Convertible Bonds | | | 0.9% | |
| Sovereign Debt | | | 0.6% | |
| Other Assets Less Liabilities | | | 3.1% | |
Net Assets Plus Borrowings | | | 134.3% | |
| Borrowings | | | (34.3)% | |
Net Assets | | | 100% | |
Country Allocation
(% of total investments)1
| | | | |
| United States | | | 71.9% | |
| Canada | | | 7.5% | |
| Luxembourg | | | 4.7% | |
| Netherlands | | | 2.9% | |
| United Kingdom | | | 2.2% | |
| Australia | | | 1.8% | |
| Japan | | | 1.7% | |
| Mexico | | | 1.2% | |
| Brazil | | | 1.1% | |
| Italy | | | 0.9% | |
| Other | | | 4.1% | |
Total | | | 100% | |
Portfolio Composition
(% of total investments)
| | | | |
| Metals & Mining | | | 12.3% | |
| Media | | | 8.7% | |
| Oil, Gas & Consumable Fuels | | | 8.2% | |
| Wireless Telecommunication Services | | | 5.5% | |
| Hotels, Restaurants & Leisure | | | 5.3% | |
| Health Care Providers & Services | | | 4.2% | |
| Consumer Finance | | | 4.0% | |
| Household Durables | | | 3.3% | |
| Diversified Financial Services | | | 3.3% | |
| Diversified Telecommunication Services | | | 3.2% | |
| Commercial Services & Supplies | | | 3.1% | |
| Independent Power & Renewable Electricity Producers | | | 3.0% | |
| Equity Real Estate Investment Trusts | | | 2.7% | |
| Real Estate Management & Development | | | 2.4% | |
| Chemicals | | | 2.1% | |
| Containers & Packaging | | | 1.9% | |
| Machinery | | | 1.8% | |
| Airlines | | | 1.7% | |
| Aerospace & Defense | | | 1.6% | |
| Specialty Retail | | | 1.4% | |
| Other | | | 19.9% | |
| Sovereign Debt | | | 0.4% | |
Total | | | 100% | |
Credit Quality
(% of total long-term investments)
| | | | |
| BBB | | | 3.5% | |
| BB or Lower | | | 94.6% | |
| N/R (not rated) | | | 1.9% | |
Total | | | 100% | |
Top Five Issuers
(% of total investments)
| | | | |
| Tenet Healthcare Corporation | | | 1.3% | |
| CenturyLink | | | 1.3% | |
| Wind Acquisition Holdings Finance SpA | | | 1.2% | |
| Sprint Corporation | | | 1.2% | |
| Time Inc. | | | 1.1% | |
| 1 | Includes 9.8% (as a percentage of total investments) in emerging markets countries. |
Shareholder
Meeting Report
The annual meeting of shareholders was held in the offices of Nuveen Investments on August 3, 2016 for JHA; at this meeting the shareholders were asked to elect Board Members.
| | | | |
| | | JHA | |
| | | Common
Shares | |
Approval of the Board Members was reached as follows: | | | | |
William C. Hunter | | | | |
For | | | 23,865,954 | |
Withhold | | | 397,142 | |
Total | | | 24,263,096 | |
Judith M. Stockdale | | | | |
For | | | 23,792,226 | |
Withhold | | | 470,870 | |
Total | | | 24,263,096 | |
Carole E. Stone | | | | |
For | | | 23,866,954 | |
Withhold | | | 396,142 | |
Total | | | 24,263,096 | |
Margaret L. Wolff | | | | |
For | | | 23,821,266 | |
Withhold | | | 441,830 | |
Total | | | 24,263,096 | |
Report of
Independent Registered Public Accounting Firm
To the Board of Trustees and Shareholders of
Nuveen High Income 2020 Target Term Fund
Nuveen High Income December 2019 Target Term Fund
Nuveen High Income December 2018 Target Term Fund
Nuveen High Income November 2021 Target Term Fund:
We have audited the accompanying statements of assets and liabilities, including the portfolios of investments, of Nuveen High Income 2020 Target Term Fund, Nuveen High Income December 2019 Target Term Fund, Nuveen High Income December 2018 Target Term Fund, and Nuveen High Income November 2021 Target Term Fund (the “Funds”) as of December 31, 2016, and the related statements of operations for the year or period then ended, the statements of changes in net assets for each of the years or periods in the two-year period then ended, the statements of cash flows for the year or period then ended, and the financial highlights for each of the years or periods in the two-year period then ended. These financial statements and financial highlights are the responsibility of the Funds’ management. Our responsibility is to express an opinion on these financial statements and financial highlights based on our audits.
We conducted our audits in accordance with the standards of the Public Company Accounting Oversight Board (United States). Those standards require that we plan and perform the audit to obtain reasonable assurance about whether the financial statements and financial highlights are free of material misstatement. An audit includes examining, on a test basis, evidence supporting the amounts and disclosures in the financial statements. Our procedures included confirmation of securities owned as of December 31, 2016, by correspondence with the custodian and brokers or other appropriate auditing procedures. An audit also includes assessing the accounting principles used and significant estimates made by management, as well as evaluating the overall financial statement presentation. We believe that our audits provide a reasonable basis for our opinion.
In our opinion, the financial statements and financial highlights referred to above present fairly, in all material respects, the financial position of the Funds as of December 31, 2016, the results of their operations for the year or period then ended, the changes in their net assets for each of the years or periods in the two-year period then ended, their cash flows for the year or period then ended, and the financial highlights for each of the years or periods in the two-year period then ended, in conformity with U.S. generally accepted accounting principles.
/s/ KPMG LLP
Chicago, Illinois
February 28, 2017
JHY
| | |
Nuveen High Income 2020 Target Term Fund | | |
Portfolio of Investments | | December 31, 2016 |
| | | | | | | | | | | | | | | | | | | | |
Principal
Amount (000) | | | Description (1) | | Coupon | | | Maturity | | | Ratings (2) | | | Value | |
| |
| | | | LONG-TERM INVESTMENTS ��� 128.3% (98.9% of Total Investments) | |
| |
| | | | CORPORATE BONDS – 125.3% (96.6% of Total Investments) | |
| | | | | |
| | | | Aerospace & Defense – 1.4% | | | | | | | | | | | | |
| | | | | |
| $ | 710 | | | Bombardier Inc., 144A | | | 4.750% | | | | 4/15/19 | | | | B | | | $ | 713,550 | |
| | 1,250 | | | Triumph Group Inc. | | | 4.875% | | | | 4/01/21 | | | | B1 | | | | 1,172,500 | |
| | 1,960 | | | Total Aerospace & Defense | | | | | | | | | | | | | | | 1,886,050 | |
| | | | | |
| | | | Airlines – 1.8% | | | | | | | | | | | | |
| | | | | |
| | 1,672 | | | Air Canada, 144A | | | 7.750% | | | | 4/15/21 | | | | BB– | | | | 1,868,460 | |
| | 765 | | | VistaJet Malta Finance PLC, 144A | | | 7.750% | | | | 6/01/20 | | | | B– | | | | 527,850 | |
| | 2,437 | | | Total Airlines | | | | | | | | | | | | | | | 2,396,310 | |
| | | | | |
| | | | Auto Components – 2.3% | | | | | | | | | | | | |
| | | | | |
| | 1,500 | | | Allied Specialty Vehicle Inc., 144A | | | 8.500% | | | | 11/01/19 | | | | BB– | | | | 1,541,250 | |
| | 1,500 | | | American & Axle Manufacturing Inc. | | | 6.250% | | | | 3/15/21 | | | | BB | | | | 1,548,750 | |
| | 3,000 | | | Total Auto Components | | | | | | | | | | | | | | | 3,090,000 | |
| | | | | |
| | | | Banks – 1.0% | | | | | | | | | | | | |
| | | | | |
| | 1,300 | | | Popular Inc. | | | 7.000% | | | | 7/01/19 | | | | BB– | | | | 1,340,625 | |
| | | | | |
| | | | Building Products – 1.4% | | | | | | | | | | | | |
| | | | | |
| | 1,750 | | | Taylor Morrison Monarch Communities, 144A | | | 5.250% | | | | 4/15/21 | | | | BB– | | | | 1,793,750 | |
| | | | | |
| | | | Capital Markets – 0.9% | | | | | | | | | | | | |
| | | | | |
| | 1,250 | | | KCG Holdings Inc., 144A | | | 6.875% | | | | 3/15/20 | | | | BB– | | | | 1,250,000 | |
| | | | | |
| | | | Chemicals – 3.5% | | | | | | | | | | | | |
| | | | | |
| | 1,000 | | | Hexion Inc. | | | 10.000% | | | | 4/15/20 | | | | B3 | | | | 995,000 | |
| | 1,800 | | | Koppers Inc. | | | 7.875% | | | | 12/01/19 | | | | Ba3 | | | | 1,824,750 | |
| | 1,250 | | | Platform Specialty Products Corporation, 144A | | | 10.375% | | | | 5/01/21 | | | | B+ | | | | 1,384,375 | |
| | 550 | | | Tronox Finance LLC | | | 6.375% | | | | 8/15/20 | | | | B | | | | 514,250 | |
| | 4,600 | | | Total Chemicals | | | | | | | | | | | | | | | 4,718,375 | |
| | | | | |
| | | | Commercial Services & Supplies – 5.9% | | | | | | | | | | | | |
| | | | | |
| | 1,500 | | | APX Group, Inc. | | | 6.375% | | | | 12/01/19 | | | | B1 | | | | 1,543,125 | |
| | 1,350 | | | APX Group, Inc. | | | 8.750% | | | | 12/01/20 | | | | CCC+ | | | | 1,360,125 | |
| | 1,750 | | | GFL Environmental Corporation, 144A | | | 7.875% | | | | 4/01/20 | | | | B– | | | | 1,835,313 | |
| | 500 | | | GFL Environmental Corporation, 144A | | | 9.875% | | | | 2/01/21 | | | | B– | | | | 550,000 | |
| | 1,000 | | | NES Rental Holdings Inc., 144A | | | 7.875% | | | | 5/01/18 | | | | B– | | | | 995,000 | |
| | 1,500 | | | R.R. Donnelley & Sons Company | | | 7.875% | | | | 3/15/21 | | | | B+ | | | | 1,545,000 | |
| | 7,600 | | | Total Commercial Services & Supplies | | | | | | | | | | | | | | | 7,828,563 | |
| | | | | |
| | | | Construction & Engineering – 1.0% | | | | | | | | | | | | |
| | | | | |
| | 1,290 | | | Michael Baker International LLC / CDL Acquisition Company Inc., 144A | | | 8.250% | | | | 10/15/18 | | | | B+ | | | | 1,270,650 | |
| | | | | |
| | | | Consumer Finance – 4.0% | | | | | | | | | | | | |
| | | | | |
| | 1,000 | | | Constellis Holdings LLC / Constellis Finance Corporation, 144A | | | 9.750% | | | | 5/15/20 | | | | B | | | | 1,025,000 | |
| | 920 | | | Covenant Surgical Partners Inc., 144A | | | 8.750% | | | | 8/01/19 | | | | B– | | | | 887,800 | |
| | 2,370 | | | Navient Corporation | | | 5.000% | | | | 10/26/20 | | | | BB | | | | 2,417,400 | |
| | 1,000 | | | OneMain Financial Holdings, Inc., 144A | | | 6.750% | | | | 12/15/19 | | | | B | | | | 1,042,500 | |
| | 5,290 | | | Total Consumer Finance | | | | | | | | | | | | | | | 5,372,700 | |
| | | | | |
| | | | Containers & Packaging – 2.4% | | | | | | | | | | | | |
| | | | | |
| | 1,350 | | | Ardagh Packaging Finance / MP HD USA, 144A | | | 6.750% | | | | 1/31/21 | | | | B3 | | | | 1,390,500 | |
| | 1,070 | | | Coveris Holdings SA, 144A | | | 7.875% | | | | 11/01/19 | | | | B– | | | | 1,061,975 | |
| | | | | | | | | | | | | | | | | | | | |
Principal
Amount (000) | | | Description (1) | | Coupon | | | Maturity | | | Ratings (2) | | | Value | |
| | | | | |
| | | | Containers & Packaging (continued) | | | | | | | | | | | | |
| | | | | |
| $ | 640 | | | PaperWorks Industries Inc., 144A | | | 9.500% | | | | 8/15/19 | | | | B– | | | $ | 553,600 | |
| | 173 | | | Reynolds Group | | | 8.250% | | | | 2/15/21 | | | | B– | | | | 179,032 | |
| | 3,233 | | | Total Containers & Packaging | | | | | | | | | | | | | | | 3,185,107 | |
| | | | | |
| | | | Diversified Financial Services – 7.3% | | | | | | | | | | | | |
| | | | | |
| | 1,350 | | | Fly Leasing Limited | | | 6.750% | | | | 12/15/20 | | | | BB– | | | | 1,410,750 | |
| | 1,000 | | | Jefferies Finance LLC Corporation, 144A | | | 7.375% | | | | 4/01/20 | | | | B1 | | | | 1,000,000 | |
| | 1,000 | | | Jefferies Finance LLC Corporation, 144A | | | 7.500% | | | | 4/15/21 | | | | B1 | | | | 990,000 | |
| | 1,500 | | | Lincoln Finance LTD, 144A | | | 7.375% | | | | 4/15/21 | | | | BB+ | | | | 1,597,500 | |
| | 1,660 | | | Nationstar Mortgage LLC Capital Corporation | | | 7.875% | | | | 10/01/20 | | | | B+ | | | | 1,718,100 | |
| | 2,000 | | | NewStar Financial, Inc. | | | 7.250% | | | | 5/01/20 | | | | BB– | | | | 1,990,000 | |
| | 1,000 | | | PHH Corporation | | | 7.375% | | | | 9/01/19 | | | | B1 | | | | 1,075,000 | |
| | 9,510 | | | Total Diversified Financial Services | | | | | | | | | | | | | | | 9,781,350 | |
| | | | | |
| | | | Diversified Telecommunication Services – 4.9% | | | | | | | | | | | | |
| | | | | |
| | 1,820 | | | CenturyLink Inc. | | | 5.625% | | | | 4/01/20 | | | | BB+ | | | | 1,924,650 | |
| | 1,000 | | | Frontier Communications Corporation | | | 8.500% | | | | 4/15/20 | | | | BB | | | | 1,050,000 | |
| | 1,000 | | | Frontier Communications Corporation | | | 8.875% | | | | 9/15/20 | | | | BB | | | | 1,065,000 | |
| | 1,100 | | | IntelSat Jackson Holdings | | | 7.250% | | | | 10/15/20 | | | | CCC | | | | 852,500 | |
| | 1,590 | | | Windstream Corporation | | | 7.750% | | | | 10/15/20 | | | | BB– | | | | 1,634,520 | |
| | 6,510 | | | Total Diversified Telecommunication Services | | | | | | | | | | | | | | | 6,526,670 | |
| | | | | |
| | | | Electric Utilities – 1.0% | | | | | | | | | | | | |
| | | | | |
| | 1,420 | | | RJS Power Holdings LLC, 144A | | | 4.625% | | | | 7/15/19 | | | | B+ | | | | 1,345,450 | |
| | | | | |
| | | | Energy Equipment & Services – 1.2% | | | | | | | | | | | | |
| | | | | |
| | 598 | | | Precision Drilling Corporation | | | 6.625% | | | | 11/15/20 | | | | BB | | | | 606,878 | |
| | 1,000 | | | SESI, LLC | | | 6.375% | | | | 5/01/19 | | | | BB– | | | | 1,000,000 | |
| | 1,598 | | | Total Energy Equipment & Services | | | | | | | | | | | | | | | 1,606,878 | |
| | | | | |
| | | | Equity Real Estate Investment Trusts – 4.7% | | | | | | | | | | | | |
| | | | | |
| | 1,000 | | | CoreCivic, Inc. | | | 4.125% | | | | 4/01/20 | | | | Ba1 | | | | 997,500 | |
| | 1,500 | | | Iron Mountain Inc., 144A | | | 6.000% | | | | 10/01/20 | | | | BB– | | | | 1,582,500 | |
| | 900 | | | iStar Inc. | | | 7.125% | | | | 2/15/18 | | | | B+ | | | | 927,000 | |
| | 2,000 | | | iStar Inc. | | | 5.000% | | | | 7/01/19 | | | | B+ | | | | 2,007,500 | |
| | 750 | | | Vereit Operating Partner | | | 3.000% | | | | 2/06/19 | | | | BBB– | | | | 748,125 | |
| | 6,150 | | | Total Equity Real Estate Investment Trusts | | | | | | | | | | | | | | | 6,262,625 | |
| | | | | |
| | | | Food & Staples Retailing – 0.8% | | | | | | | | | | | | |
| | | | | |
| | 1,260 | | | Bi-Lo LLC Finance Corporation, 144A | | | 9.250% | | | | 2/15/19 | | | | B | | | | 1,067,850 | |
| | | | | |
| | | | Food Products – 2.3% | | | | | | | | | | | | |
| | | | | |
| | 1,500 | | | JBS Investments GmbH, 144A | | | 7.750% | | | | 10/28/20 | | | | BB+ | | | | 1,591,950 | |
| | 1,490 | | | Marfrig Holding Europe BV, 144A | | | 6.875% | | | | 6/24/19 | | | | BB– | | | | 1,527,250 | |
| | 2,990 | | | Total Food Products | | | | | | | | | | | | | | | 3,119,200 | |
| | | | | |
| | | | Gas Utilities – 1.3% | | | | | | | | | | | | |
| | | | | |
| | 1,750 | | | Ferrellgas LP | | | 6.500% | | | | 5/01/21 | | | | B | | | | 1,732,500 | |
| | | | | |
| | | | Health Care Equipment & Supplies – 1.1% | | | | | | | | | | | | |
| | | | | |
| | 1,500 | | | Tenet Healthcare Corporation | | | 4.500% | | | | 4/01/21 | | | | BB– | | | | 1,492,500 | |
| | | | | |
| | | | Health Care Providers & Services – 3.0% | | | | | | | | | | | | |
| | | | | |
| | 285 | | | Acadia Healthcare | | | 6.125% | | | | 3/15/21 | | | | B | | | | 293,906 | |
| | 500 | | | Community Health Systems, Inc. | | | 7.125% | | | | 7/15/20 | | | | B | | | | 380,150 | |
| | 1,000 | | | HCA Inc. | | | 6.500% | | | | 2/15/20 | | | | BBB– | | | | 1,094,000 | |
| | 400 | | | Iasis Healthcare Capital Corporation | | | 8.375% | | | | 5/15/19 | | | | CCC+ | | | | 348,000 | |
| | 1,950 | | | Kindred Healthcare Inc. | | | 8.000% | | | | 1/15/20 | | | | B– | | | | 1,940,250 | |
| | 4,135 | | | Total Health Care Providers & Services | | | | | | | | | | | | | | | 4,056,306 | |
| | | | |
| JHY | | Nuveen High Income 2020 Target Term Fund | | |
| | Portfolio of Investments (continued) | | December 31, 2016 |
| | | | | | | | | | | | | | | | | | | | |
Principal
Amount (000) | | | Description (1) | | Coupon | | | Maturity | | | Ratings (2) | | | Value | |
| | | | | |
| | | | Hotels, Restaurants & Leisure – 4.4% | | | | | | | | | | | | |
| | | | | |
| $ | 750 | | | Caesars Entertainment Resort Properties LLC | | | 8.000% | | | | 10/01/20 | | | | B+ | | | $ | 785,625 | |
| | 1,270 | | | MGM Resorts International Inc. | | | 6.750% | | | | 10/01/20 | | | | BB | | | | 1,412,875 | |
| | 1,500 | | | Nathan’s Famous, Inc., 144A | | | 10.000% | | | | 3/15/20 | | | | B– | | | | 1,631,250 | |
| | 650 | | | Scientific Games International Inc. | | | 6.250% | | | | 9/01/20 | | | | CCC+ | | | | 552,500 | |
| | 1,500 | | | Studio City Co Ltd, 144A | | | 5.875% | | | | 11/30/19 | | | | BB– | | | | 1,541,250 | |
| | 5,670 | | | Total Hotels, Restaurants & Leisure | | | | | | | | | | | | | | | 5,923,500 | |
| | | | | |
| | | | Household Durables – 6.4% | | | | | | | | | | | | |
| | | | | |
| | 1,470 | | | Brookfield Residential Properties Inc., 144A | | | 6.500% | | | | 12/15/20 | | | | B+ | | | | 1,503,075 | |
| | 1,500 | | | KB Home | | | 8.000% | | | | 3/15/20 | | | | B+ | | | | 1,650,000 | |
| | 1,000 | | | M-I Homes Inc. | | | 6.750% | | | | 1/15/21 | | | | BB– | | | | 1,042,500 | |
| | 750 | | | PulteGroup Inc. | | | 4.250% | | | | 3/01/21 | | | | BB+ | | | | 766,875 | |
| | 1,500 | | | Rialto Holdings LLC-Rialto Corporation, 144A | | | 7.000% | | | | 12/01/18 | | | | B1 | | | | 1,518,750 | |
| | 1,990 | | | William Lyon Homes Incorporated | | | 8.500% | | | | 11/15/20 | | | | B– | | | | 2,079,550 | |
| | 8,210 | | | Total Household Durables | | | | | | | | | | | | | | | 8,560,750 | |
| | | | | |
| | | | Independent Power & Renewable Electricity Producers – 4.5% | | | | | | | | | | | | |
| | | | | |
| | 750 | | | Atlantica Yield PLC, 144A | | | 7.000% | | | | 11/15/19 | | | | B+ | | | | 765,000 | |
| | 2,750 | | | DPL, Inc. | | | 6.750% | | | | 10/01/19 | | | | BB | | | | 2,798,123 | |
| | 1,400 | | | Dynegy Inc. | | | 6.750% | | | | 11/01/19 | | | | B+ | | | | 1,424,500 | |
| | 1,500 | | | GenOn Energy Inc. | | | 9.875% | | | | 10/15/20 | | | | CCC+ | | | | 1,023,750 | |
| | 6,400 | | | Total Independent Power & Renewable Electricity Producers | | | | | | | | | | | | | | | 6,011,373 | |
| | | | | |
| | | | Industrial Conglomerates – 1.2% | | | | | | | | | | | | |
| | | | | |
| | 1,500 | | | Icahn Enterprises Finance | | | 6.000% | | | | 8/01/20 | | | | BB+ | | | | 1,531,875 | |
| | | | | |
| | | | Insurance – 1.1% | | | | | | | | | | | | |
| | | | | |
| | 1,500 | | | Genworth Financial Inc. | | | 7.700% | | | | 6/15/20 | | | | Ba3 | | | | 1,450,800 | |
| | | | | |
| | | | Internet & Direct Marketing Retail – 0.8% | | | | | | | | | | | | |
| | | | | |
| | 1,000 | | | Netflix Incorporated | | | 5.375% | | | | 2/01/21 | | | | B+ | | | | 1,075,000 | |
| | | | | |
| | | | Internet Software & Services – 1.6% | | | | | | | | | | | | |
| | | | | |
| | 2,001 | | | Earthlink Inc. | | | 7.375% | | | | 6/01/20 | | | | Ba3 | | | | 2,111,055 | |
| | | | | |
| | | | Machinery – 2.1% | | | | | | | | | | | | |
| | | | | |
| | 1,160 | | | BlueLine Rental Finance Corporation, 144A | | | 7.000% | | | | 2/01/19 | | | | B+ | | | | 1,131,000 | |
| | 1,250 | | | CNH Industrial Capital LLC | | | 4.375% | | | | 11/06/20 | | | | Ba1 | | | | 1,282,813 | |
| | 500 | | | CTP Transportation Products LLC-Finance Inc., 144A | | | 8.250% | | | | 12/15/19 | | | | B– | | | | 431,250 | |
| | 2,910 | | | Total Machinery | | | | | | | | | | | | | | | 2,845,063 | |
| | | | | |
| | | | Marine – 0.4% | | | | | | | | | | | | |
| | | | | |
| | 638 | | | Global Ship Lease Inc., 144A | | | 10.000% | | | | 4/01/19 | | | | B | | | | 583,770 | |
| | | | | |
| | | | Media – 4.6% | | | | | | | | | | | | |
| | | | | |
| | 1,425 | | | Cequel Communications Holding I LLC Capital, 144A | | | 6.375% | | | | 9/15/20 | | | | B– | | | | 1,467,750 | |
| | 1,790 | | | Clear Channel Worldwide | | | 7.625% | | | | 3/15/20 | | | | B– | | | | 1,788,872 | |
| | 2,000 | | | Dish DBS Corporation | | | 5.125% | | | | 5/01/20 | | | | Ba3 | | | | 2,070,000 | |
| | 780 | | | Mediacom Broadband LLC | | | 5.500% | | | | 4/15/21 | | | | B+ | | | | 797,550 | |
| | 5,995 | | | Total Media | | | | | | | | | | | | | | | 6,124,172 | |
| | | | | |
| | | | Metals & Mining – 7.7% | | | | | | | | | | | | |
| | | | | |
| | 1,775 | | | Aleris International Inc., 144A | | | 9.500% | | | | 4/01/21 | | | | B | | | | 1,903,688 | |
| | 1,250 | | | Allegheny Technologies Inc. | | | 5.950% | | | | 1/15/21 | | | | B | | | | 1,209,375 | |
| | 1,500 | | | Eldorado Gold Corporation, 144A | | | 6.125% | | | | 12/15/20 | | | | BB– | | | | 1,522,500 | |
| | 2,000 | | | First Quantum Minerals Limited, 144A | | | 6.750% | | | | 2/15/20 | | | | B | | | | 1,995,000 | |
| | 1,200 | | | Gold Fields Orogen Holdings BVI Limited, 144A | | | 4.875% | | | | 10/07/20 | | | | BB+ | | | | 1,179,600 | |
| | 1,750 | | | IAMGOLD Corporation, 144A | | | 6.750% | | | | 10/01/20 | | | | B+ | | | | 1,706,250 | |
| | 250 | | | United States Steel Corporation | | | 7.375% | | | | 4/01/20 | | | | B | | | | 268,125 | |
| | 500 | | | United States Steel Corporation | | | 6.875% | | | | 4/01/21 | | | | B | | | | 505,000 | |
| | 10,225 | | | Total Metals & Mining | | | | | | | | | | | | | | | 10,289,538 | |
| | | | | | | | | | | | | | | | | | | | |
Principal
Amount (000) | | | Description (1) | | Coupon | | | Maturity | | | Ratings (2) | | | Value | |
| | | | | |
| | | | Oil, Gas & Consumable Fuels – 14.5% | | | | | | | | | | | | |
| | | | | |
| $ | 750 | | | Bill Barrett Corporation | | | 7.625% | | | | 10/01/19 | | | | CCC | | | $ | 738,750 | |
| | 1,250 | | | Calumet Specialty Products | | | 6.500% | | | | 4/15/21 | | | | CCC+ | | | | 1,059,375 | |
| | 1,000 | | | Chesapeake Energy Corporation | | | 6.875% | | | | 11/15/20 | | | | B– | | | | 1,000,000 | |
| | 1,250 | | | Genesis Energy LP | | | 5.750% | | | | 2/15/21 | | | | B+ | | | | 1,262,500 | |
| | 1,650 | | | NGL Energy Partners LP/Fin Co | | | 5.125% | | | | 7/15/19 | | | | BB– | | | | 1,637,625 | |
| | 1,000 | | | Noble Energy Inc. | | | 5.625% | | | | 5/01/21 | | | | BBB | | | | 1,042,425 | |
| | 1,000 | | | Oasis Petroleum Inc. | | | 7.250% | | | | 2/01/19 | | | | B+ | | | | 1,000,000 | |
| | 2,480 | | | Petrobras International Finance Company | | | 5.375% | | | | 1/27/21 | | | | BB | | | | 2,425,440 | |
| | 1,000 | | | Seven Generations Energy Limited, 144A | | | 8.250% | | | | 5/15/20 | | | | Ba3 | | | | 1,060,000 | |
| | 1,000 | | | Southwestern Energy Company | | | 5.800% | | | | 1/23/20 | | | | BB | | | | 1,030,000 | |
| | 1,500 | | | Sunoco LP / Sunoco Finance Corp. | | | 5.500% | | | | 8/01/20 | | | | BB– | | | | 1,530,000 | |
| | 700 | | | Sunoco LP / Sunoco Finance Corp. | | | 6.250% | | | | 4/15/21 | | | | BB– | | | | 713,125 | |
| | 1,250 | | | Teekay Corporation | | | 8.500% | | | | 1/15/20 | | | | B+ | | | | 1,187,500 | |
| | 1,000 | | | Whiting Petroleum Corporation | | | 5.750% | | | | 3/15/21 | | | | BB– | | | | 995,840 | |
| | 1,325 | | | WPX Energy Inc. | | | 7.500% | | | | 8/01/20 | | | | B | | | | 1,424,375 | |
| | 1,125 | | | YPF Sociedad Anonima, 144A | | | 8.500% | | | | 3/23/21 | | | | B | | | | 1,206,675 | |
| | 19,280 | | | Total Oil, Gas & Consumable Fuels | | | | | | | | | | | | | | | 19,313,630 | |
| | | | | |
| | | | Paper & Forest Products – 1.9% | | | | | | | | | | | | |
| | | | | |
| | 1,500 | | | Mercer International Inc. | | | 7.000% | | | | 12/01/19 | | | | BB– | | | | 1,548,750 | |
| | 1,000 | | | Tembec Industries, Inc., 144A | | | 9.000% | | | | 12/15/19 | | | | B– | | | | 935,000 | |
| | 2,500 | | | Total Paper & Forest Products | | | | | | | | | | | | | | | 2,483,750 | |
| | | | | |
| | | | Personal Products – 1.5% | | | | | | | | | | | | |
| | | | | |
| | 1,970 | | | Albea Beauty Holdings SA, 144A | | | 8.375% | | | | 11/01/19 | | | | B | | | | 2,048,800 | |
| | | | | |
| | | | Pharmaceuticals – 0.6% | | | | | | | | | | | | |
| | | | | |
| | 1,000 | | | VRX Escrow Corp., 144A | | | 5.375% | | | | 3/15/20 | | | | B– | | | | 845,000 | |
| | | | | |
| | | | Real Estate Management & Development – 2.4% | | | | | | | | | | | | |
| | | | | |
| | 1,545 | | | Hunt Companies Inc., 144A | | | 9.625% | | | | 3/01/21 | | | | N/R | | | | 1,612,594 | |
| | 1,500 | | | Mattamy Group Corporation, 144A | | | 6.500% | | | | 11/15/20 | | | | BB | | | | 1,522,500 | |
| | 3,045 | | | Total Real Estate Management & Development | | | | | | | | | | | | | | | 3,135,094 | |
| | | | | |
| | | | Road & Rail – 1.5% | | | | | | | | | | | | |
| | | | | |
| | 2,000 | | | Hertz Corporation | | | 5.875% | | | | 10/15/20 | | | | B | | | | 1,955,000 | |
| | | | | |
| | | | Software – 0.4% | | | | | | | | | | | | |
| | | | | |
| | 500 | | | Infor Us Inc., 144A | | | 5.750% | | | | 8/15/20 | | | | BB | | | | 524,375 | |
| | | | | |
| | | | Specialty Retail – 4.2% | | | | | | | | | | | | |
| | | | | |
| | 1,500 | | | Best Buy Co., Inc. | | | 5.500% | | | | 3/15/21 | | | | Baa1 | | | | 1,644,720 | |
| | 1,500 | | | GameStop Corporation, 144A | | | 6.750% | | | | 3/15/21 | | | | BB+ | | | | 1,511,250 | |
| | 1,500 | | | Gap, Inc. | | | 5.950% | | | | 4/12/21 | | | | Baa2 | | | | 1,577,240 | |
| | 1,000 | | | Guitar Center Inc., 144A | | | 6.500% | | | | 4/15/19 | | | | B2 | | | | 907,500 | |
| | 5,500 | | | Total Specialty Retail | | | | | | | | | | | | | | | 5,640,710 | |
| | | | | |
| | | | Technology Hardware, Storage & Peripherals – 0.6% | | | | | | | | | | | | |
| | | | | |
| | 800 | | | NCR Corporation | | | 4.625% | | | | 2/15/21 | | | | BB | | | | 814,400 | |
| | | | | |
| | | | Trading Companies & Distributors – 1.1% | | | | | | | | | | | | |
| | | | | |
| | 1,500 | | | Avation Capital SA, 144A | | | 7.500% | | | | 5/27/20 | | | | B+ | | | | 1,485,000 | |
| | | | | |
| | | | Wireless Telecommunication Services – 8.6% | | | | | | | | | | | | |
| | | | | |
| | 1,100 | | | Digicel Group, Limited, 144A | | | 8.250% | | | | 9/30/20 | | | | B– | | | | 943,767 | |
| | 1,250 | | | FairPoint Communications Inc., 144A | | | 8.750% | | | | 8/15/19 | | | | B | | | | 1,304,688 | |
| | 1,620 | | | Millicom International Cellular SA, 144A | | | 4.750% | | | | 5/22/20 | | | | BB+ | | | | 1,640,250 | |
| | 1,000 | | | Softbank Corporation, 144A | | | 4.500% | | | | 4/15/20 | | | | BB+ | | | | 1,025,000 | |
| | 1,000 | | | Sprint Communications Inc., 144A | | | 7.000% | | | | 3/01/20 | | | | BB | | | | 1,085,000 | |
| | 475 | | | Sprint Communications Inc. | | | 8.375% | | | | 8/15/17 | | | | B+ | | | | 492,813 | |
| | | | |
| JHY | | Nuveen High Income 2020 Target Term Fund | | |
| | Portfolio of Investments (continued) | | December 31, 2016 |
| | | | | | | | | | | | | | | | | | | | |
Principal
Amount (000) | | | Description (1) | | Coupon | | | Maturity | | | Ratings (2) | | | Value | |
| | | | | |
| | | | Wireless Telecommunication Services (continued) | | | | | | | | | | | | |
| | | | | |
| $ | 2,000 | | | Sprint Communications Inc. | | | 7.000% | | | | 8/15/20 | | | | B+ | | | $ | 2,120,220 | |
| | 1,290 | | | T-Mobile USA Inc. | | | 6.250% | | | | 4/01/21 | | | | BB | | | | 1,341,600 | |
| | 1,500 | | | Wind Acquisition Finance SA, 144A | | | 4.750% | | | | 7/15/20 | | | | BB | | | | 1,511,250 | |
| | 11,235 | | | Total Wireless Telecommunication Services | | | | | | | | | | | | | | | 11,464,588 | |
| $ | 165,912 | | | Total Corporate Bonds (cost $166,525,286) | | | | | | | | | | | | | | | 167,340,702 | |
| | | | | |
Principal
Amount (000) | | | Description (1) | | Coupon | | | Maturity | | | Ratings (2) | | | Value | |
| | | | | |
| | | | CONVERTIBLE BONDS – 1.8% (1.4% of Total Investments) | | | | | | | | | | | | | | | | |
| | | | | |
| | | | Independent Power & Renewable Electricity Producers – 1.1% | | | | | | | | | | | | |
| | | | | |
| $ | 1,500 | | | NRG Yield Inc., 144A | | | 3.250% | | | | 6/01/20 | | | | N/R | | | $ | 1,440,000 | |
| | | | | |
| | | | Machinery – 0.7% | | | | | | | | | | | | |
| | | | | |
| | 1,000 | | | Navistar International Corporation | | | 4.750% | | | | 4/15/19 | | | | CCC– | | | | 987,500 | |
| $ | 2,500 | | | Total Convertible Bonds (cost $2,306,411) | | | | | | | | | | | | | | | 2,427,500 | |
| | | | | |
Principal
Amount (000) | | | Description (1) | | Coupon | | | Maturity | | | Ratings (2) | | | Value | |
| |
| | | | SOVEREIGN DEBT – 1.2% (0.9% of Total Investments) | |
| | | | | |
| | | | Argentina – 1.2% | | | | | | | | | | | | |
| | | | | |
| $ | 1,500 | | | Republic of Argentina, 144A | | | 6.875% | | | | 4/22/21 | | | | B | | | $ | 1,597,500 | |
| | | | Total Sovereign Debt (cost $1,562,777) | | | | | | | | 1,597,500 | |
| | | | Total Long-Term Investments (cost $170,394,474) | | | | | | | | | | | | | | | 171,365,702 | |
| | | | | |
Principal
Amount (000) | | | Description (1) | | Coupon | | | Maturity | | | | | | Value | |
| |
| | | | SHORT-TERM INVESTMENTS – 1.4% (1.1% of Total Investments) | |
| |
| | | | REPURCHASE AGREEMENTS – 1.4% (1.1% of Total Investments) | |
| | | | | |
| $ | 1,867 | | | Repurchase Agreement with Fixed Income Clearing Corporation,
dated 12/31/16, repurchase price $1,867,142,
collateralized by $2,035,000 U.S. Treasury Notes,
1.625%, due 2/15/26, value $1,905,953 | | | 0.030% | | | | 1/03/17 | | | | | | | $ | 1,867,136 | |
| | | | Total Short-Term Investments (cost $1,867,136) | | | | | | | | | | | | | | | 1,867,136 | |
| | | | Total Investments (cost $172,261,610) – 129.7% | | | | | | | | | | | | | | | 173,232,838 | |
| | | | Borrowings – (32.9)% (3), (4) | | | | | | | | | | | | | | | (44,000,000 | ) |
| | | | Other Assets Less Liabilities – 3.2% | | | | | | | | | | | | | | | 4,288,584 | |
| | | | Net Assets – 100% | | | | | | | | | | | | | | $ | 133,521,422 | |
For Fund portfolio compliance purposes, the Fund’s industry classifications refer to any one or more of the industry sub-classifications used by one or more widely recognized market indexes or ratings group indexes, and/or as defined by Fund management. This definition may not apply for purposes of this report, which may combine industry sub-classifications into sectors for reporting ease.
| (1) | All percentages shown in the Portfolio of Investments are based on net assets unless otherwise noted. |
| (2) | For financial reporting purposes, the ratings disclosed are the highest of Standard & Poor’s Group (“Standard & Poor’s”), Moody’s Investors Service, Inc. (“Moody’s”) or Fitch, Inc. (“Fitch”) rating. This treatment of split-rated securities may differ from that used for other purposes, such as for Fund investment policies. Ratings below BBB by Standard & Poor’s, Baa by Moody’s or BBB by Fitch are considered to be below investment grade. Holdings designated N/R are not rated by any of these national rating agencies. Ratings are not covered by the report of independent registered public accounting firm. |
| (3) | Borrowings as a percentage of Total Investments is 25.4%. |
| (4) | The Fund segregates 100% of its eligible investments (excluding any investments separately pledged as collateral for specific investments in derivatives, when applicable) in the Portfolio of Investments as collateral for Borrowings. |
| 144A | Investment is exempt from registration under Rule 144A of the Securities Act of 1933, as amended. These investments may only be resold in transactions exempt from registration, which are normally those transactions with qualified institutional buyers. |
See accompanying notes to financial statements.
JHD
| | |
Nuveen High Income December 2019 Target Term Fund | | |
Portfolio of Investments | | December 31, 2016 |
| | | | | | | | | | | | | | | | | | | | |
Principal
Amount (000) | | | Description (1) | | Coupon | | | Maturity | | | Ratings (2) | | | Value | |
| |
| | | | LONG-TERM INVESTMENTS – 130.8% (99.8% of Total Investments) | |
| |
| | | | CORPORATE BONDS – 126.6% (96.6% of Total Investments) | |
| | | | | |
| | | | Aerospace & Defense – 1.9% | | | | | | | | | | | | |
| | | | | |
| $ | 2,000 | | | Bombardier Inc., 144A | | | 4.750% | | | | 4/15/19 | | | | B | | | $ | 2,010,000 | |
| | 3,000 | | | Bombardier Inc., 144A | | | 7.750% | | | | 3/15/20 | | | | B | | | | 3,157,500 | |
| | 5,000 | | | Total Aerospace & Defense | | | | | | | | | | | | | | | 5,167,500 | |
| | | | | |
| | | | Airlines – 3.4% | | | | | | | | | | | | |
| | | | | |
| | 1,000 | | | Air Canada 2015-1C Pass Through Trust, 144A | | | 5.000% | | | | 3/15/20 | | | | BB | | | | 995,000 | |
| | 2,500 | | | American Airlines Group Inc., 144A | | | 5.500% | | | | 10/01/19 | | | | BB– | | | | 2,581,250 | |
| | 2,000 | | | American Airlines Group Inc., 144A | | | 4.625% | | | | 3/01/20 | | | | BB– | | | | 2,025,000 | |
| | 2,000 | | | United Continental Holdings Inc. | | | 6.375% | | | | 6/01/18 | | | | BB– | | | | 2,090,000 | |
| | 1,500 | | | Virgin Australia Holdings Limited, 144A | | | 8.500% | | | | 11/15/19 | | | | B– | | | | 1,556,250 | |
| | 9,000 | | | Total Airlines | | | | | | | | | | | | | | | 9,247,500 | |
| | | | | |
| | | | Auto Components – 0.8% | | | | | | | | | | | | |
| | | | | |
| | 2,250 | | | Allied Specialty Vehicle Inc., 144A | | | 8.500% | | | | 11/01/19 | | | | BB– | | | | 2,311,875 | |
| | | | | |
| | | | Automobiles – 2.2% | | | | | | | | | | | | |
| | | | | |
| | 4,050 | | | Fiat Chrysler Automobiles NV | | | 4.500% | | | | 4/15/20 | | | | BB | | | | 4,131,000 | |
| | 2,000 | | | Jaguar Land Rover Automotive PLC, 144A | | | 3.500% | | | | 3/15/20 | | | | BB+ | | | | 2,017,500 | |
| | 6,050 | | | Total Automobiles | | | | | | | | | | | | | | | 6,148,500 | |
| | | | | |
| | | | Banks – 3.2% | | | | | | | | | | | | |
| | | | | |
| | 4,500 | | | CIT Group Inc. | | | 5.375% | | | | 5/15/20 | | | | BB+ | | | | 4,781,250 | |
| | 3,897 | | | Popular Inc. | | | 7.000% | | | | 7/01/19 | | | | BB– | | | | 4,018,781 | |
| | 8,397 | | | Total Banks | | | | | | | | | | | | | | | 8,800,031 | |
| | | | | |
| | | | Beverages – 0.3% | | | | | | | | | | | | |
| | | | | |
| | 700 | | | Cott Beverages Inc. | | | 6.750% | | | | 1/01/20 | | | | B– | | | | 724,500 | |
| | | | | |
| | | | Capital Markets – 0.9% | | | | | | | | | | | | |
| | | | | |
| | 2,500 | | | KCG Holdings Inc., 144A | | | 6.875% | | | | 3/15/20 | | | | BB– | | | | 2,500,000 | |
| | | | | |
| | | | Chemicals – 2.2% | | | | | | | | | | | | |
| | | | | |
| | 2,000 | | | CF Industries Inc. | | | 7.125% | | | | 5/01/20 | | | | BB+ | | | | 2,180,000 | |
| | 1,000 | | | Hexion Inc. | | | 6.625% | | | | 4/15/20 | | | | B3 | | | | 885,000 | |
| | 500 | | | Hexion US Finance Corporation | | | 8.875% | | | | 2/01/18 | | | | CCC | | | | 497,500 | |
| | 2,000 | | | Ineos Group Holdings SA, 144A | | | 5.875% | | | | 2/15/19 | | | | B– | | | | 2,045,000 | |
| | 500 | | | INVISTA Finance LLC, 144A | | | 4.250% | | | | 10/15/19 | | | | BBB | | | | 494,772 | |
| | 6,000 | | | Total Chemicals | | | | | | | | | | | | | | | 6,102,272 | |
| | | | | |
| | | | Commercial Services & Supplies – 6.2% | | | | | | | | | | | | |
| | | | | |
| | 2,500 | | | AerCap Ireland Capital Limited / AerCap Global Aviation Trust | | | 3.750% | | | | 5/15/19 | | | | BBB– | | | | 2,546,875 | |
| | 4,995 | | | APX Group, Inc. | | | 6.375% | | | | 12/01/19 | | | | B1 | | | | 5,138,606 | |
| | 4,500 | | | GFL Environmental Corporation, 144A | | | 7.875% | | | | 4/01/20 | | | | B– | | | | 4,719,375 | |
| | 1,500 | | | International Lease Finance Corporation | | | 6.250% | | | | 5/15/19 | | | | BBB– | | | | 1,612,500 | |
| | 3,000 | | | NES Rental Holdings Inc., 144A | | | 7.875% | | | | 5/01/18 | | | | B– | | | | 2,985,000 | |
| | 16,495 | | | Total Commercial Services & Supplies | | | | | | | | | | | | | | | 17,002,356 | |
| | | | | |
| | | | Construction & Engineering – 0.9% | | | | | | | | | | | | |
| | | | | |
| | 2,500 | | | Michael Baker International LLC / CDL Acquisition Company Inc., 144A | | | 8.250% | | | | 10/15/18 | | | | B+ | | | | 2,462,500 | |
| | | | |
| JHD | | Nuveen High Income December 2019 Target Term Fund | | |
| | Portfolio of Investments (continued) | | December 31, 2016 |
| | | | | | | | | | | | | | | | | | | | |
Principal
Amount (000) | | | Description (1) | | Coupon | | | Maturity | | | Ratings (2) | | | Value | |
| | | | | |
| | | | Construction Materials – 1.4% | | | | | | | | | | | | |
| | | | | |
| $ | 3,500 | | | Cemex SAB de CV, 144A | | | 6.500% | | | | 12/10/19 | | | | BB– | | | $ | 3,701,250 | |
| | | | | |
| | | | Consumer Finance – 4.2% | | | | | | | | | | | | |
| | | | | |
| | 3,000 | | | Ally Financial Inc. | | | 4.125% | | | | 3/30/20 | | | | BB+ | | | | 3,060,000 | |
| | 1,500 | | | Constellis Holdings LLC / Constellis Finance Corporation, 144A | | | 9.750% | | | | 5/15/20 | | | | B | | | | 1,537,500 | |
| | 1,500 | | | Navient Corporation | | | 8.000% | | | | 3/25/20 | | | | BB | | | | 1,664,100 | |
| | 3,500 | | | OneMain Financial Holdings, Inc., 144A | | | 6.750% | | | | 12/15/19 | | | | B | | | | 3,648,750 | |
| | 1,725 | | | Springleaf Finance Corporation | | | 5.250% | | | | 12/15/19 | | | | B | | | | 1,737,938 | |
| | 11,225 | | | Total Consumer Finance | | | | | | | | | | | | | | | 11,648,288 | |
| | | | | |
| | | | Containers & Packaging – 2.0% | | | | | | | | | | | | |
| | | | | |
| | 3,000 | | | Ardagh Packaging Finance / MP HD USA, 144A | | | 6.250% | | | | 1/31/19 | | | | B3 | | | | 3,048,750 | |
| | 2,500 | | | Coveris Holdings SA, 144A | | | 7.875% | | | | 11/01/19 | | | | B– | | | | 2,481,250 | |
| | 5,500 | | | Total Containers & Packaging | | | | | | | | | | | | | | | 5,530,000 | |
| | | | | |
| | | | Diversified Financial Services – 4.2% | | | | | | | | | | | | |
| | | | | |
| | 2,250 | | | Jefferies Finance LLC Corporation, 144A | | | 7.375% | | | | 4/01/20 | | | | B1 | | | | 2,250,000 | |
| | 3,775 | | | Nationstar Mortgage LLC Capital Corporation | | | 9.625% | | | | 5/01/19 | | | | B+ | | | | 3,949,594 | |
| | 2,500 | | | NewStar Financial, Inc. | | | 7.250% | | | | 5/01/20 | | | | BB– | | | | 2,487,500 | |
| | 2,000 | | | Och-Ziff Finance Co LLC, 144A | | | 4.500% | | | | 11/20/19 | | | | BBB– | | | | 1,835,018 | |
| | 1,000 | | | PHH Corporation | | | 7.375% | | | | 9/01/19 | | | | B1 | | | | 1,075,000 | |
| | 11,525 | | | Total Diversified Financial Services | | | | | | | | | | | | | | | 11,597,112 | |
| | | | | |
| | | | Diversified Telecommunication Services – 4.3% | | | | | | | | | | | | |
| | | | | |
| | 4,600 | | | CenturyLink Inc. | | | 5.625% | | | | 4/01/20 | | | | BB+ | | | | 4,864,500 | |
| | 3,350 | | | Frontier Communications Corporation | | | 8.500% | | | | 4/15/20 | | | | BB | | | | 3,517,500 | |
| | 3,250 | | | WideOpenWest Finance Capital Corporation | | | 10.250% | | | | 7/15/19 | | | | CCC+ | | | | 3,428,750 | |
| | 11,200 | | | Total Diversified Telecommunication Services | | | | | | | | | | | | | | | 11,810,750 | |
| | | | | |
| | | | Electric Utilities – 1.2% | | | | | | | | | | | | |
| | | | | |
| | 3,400 | | | RJS Power Holdings LLC, 144A | | | 4.625% | | | | 7/15/19 | | | | B+ | | | | 3,221,500 | |
| | | | | |
| | | | Electronic Equipment, Instruments & Components – 2.1% | | | | | | | | | | | | |
| | | | | |
| | 3,945 | | | Anixter Inc. | | | 5.625% | | | | 5/01/19 | | | | BB+ | | | | 4,127,456 | |
| | 1,675 | | | Sanmina-SCI Corporation, 144A | | | 4.375% | | | | 6/01/19 | | | | BB+ | | | | 1,721,063 | |
| | 5,620 | | | Total Electronic Equipment, Instruments & Components | | | | | | | | | | | | | | | 5,848,519 | |
| | | | | |
| | | | Energy Equipment & Services – 1.5% | | | | | | | | | | | | |
| | | | | |
| | 1,000 | | | Noble Drilling Corporation | | | 7.500% | | | | 3/15/19 | | | | BB– | | | | 1,050,000 | |
| | 3,100 | | | SESI, LLC | | | 6.375% | | | | 5/01/19 | | | | BB– | | | | 3,100,000 | |
| | 4,100 | | | Total Energy Equipment & Services | | | | | | | | | | | | | | | 4,150,000 | |
| | | | | |
| | | | Equity Real Estate Investment Trusts – 4.4% | | | | | | | | | | | | |
| | | | | |
| | 2,840 | | | CoreCivic, Inc. | | | 4.125% | | | | 4/01/20 | | | | Ba1 | | | | 2,832,900 | |
| | 4,000 | | | iStar Inc. | | | 5.000% | | | | 7/01/19 | | | | B+ | | | | 4,015,000 | |
| | 3,000 | | | Realogy Group LLC / Realogy Co-Issuer Corporation, 144A | | | 4.500% | | | | 4/15/19 | | | | B+ | | | | 3,090,000 | |
| | 2,000 | | | Vereit Operating Partner | | | 3.000% | | | | 2/06/19 | | | | BBB– | | | | 1,995,000 | |
| | 11,840 | | | Total Equity Real Estate Investment Trusts | | | | | | | | | | | | | | | 11,932,900 | |
| | | | | |
| | | | Food & Staples Retailing – 0.5% | | | | | | | | | | | | |
| | | | | |
| | 1,500 | | | Bi-Lo LLC Finance Corporation, 144A | | | 9.250% | | | | 2/15/19 | | | | B | | | | 1,271,250 | |
| | | | | |
| | | | Food Products – 3.4% | | | | | | | | | | | | |
| | | | | |
| | 3,000 | | | Dole Food Company, 144A | | | 7.250% | | | | 5/01/19 | | | | B3 | | | | 3,060,000 | |
| | 2,500 | | | JBS USA LLC, 144A | | | 8.250% | | | | 2/01/20 | | | | BB+ | | | | 2,562,500 | |
| | 3,550 | | | Marfrig Holding Europe BV, 144A | | | 6.875% | | | | 6/24/19 | | | | BB– | | | | 3,638,750 | |
| | 9,050 | | | Total Food Products | | | | | | | | | | | | | | | 9,261,250 | |
| | | | | | | | | | | | | | | | | | | | |
Principal
Amount (000) | | | Description (1) | | Coupon | | | Maturity | | | Ratings (2) | | | Value | |
| | | | | |
| | | | Health Care Equipment & Supplies – 2.3% | | | | | | | | | | | | |
| | | | | |
| $ | 3,000 | | | Tenet Healthcare Corporation | | | 5.000% | | | | 3/01/19 | | | | B– | | | $ | 2,925,000 | |
| | 3,300 | | | Tenet Healthcare Corporation | | | 4.750% | | | | 6/01/20 | | | | BB– | | | | 3,316,500 | |
| | 6,300 | | | Total Health Care Equipment & Supplies | | | | | | | | | | | | | | | 6,241,500 | |
| | | | | |
| | | | Health Care Providers & Services – 4.8% | | | | | | | | | | | | |
| | | | | |
| | 2,500 | | | Community Health Systems, Inc. | | | 8.000% | | | | 11/15/19 | | | | B | | | | 2,075,000 | |
| | 3,000 | | | HCA Inc. | | | 6.500% | | | | 2/15/20 | | | | BBB– | | | | 3,282,000 | |
| | 3,650 | | | Iasis Healthcare Capital Corporation | | | 8.375% | | | | 5/15/19 | | | | CCC+ | | | | 3,175,500 | |
| | 4,770 | | | Kindred Healthcare Inc. | | | 8.000% | | | | 1/15/20 | | | | B– | | | | 4,746,150 | |
| | 13,920 | | | Total Health Care Providers & Services | | | | | | | | | | | | | | | 13,278,650 | |
| | | | | |
| | | | Hotels, Restaurants & Leisure – 3.3% | | | | | | | | | | | | |
| | | | | |
| | 2,700 | | | International Game Technology PLC, 144A | | | 5.625% | | | | 2/15/20 | | | | BB+ | | | | 2,848,500 | |
| | 4,000 | | | MGM Resorts International Inc. | | | 5.250% | | | | 3/31/20 | | | | BB | | | | 4,230,000 | |
| | 2,000 | | | Studio City Co Ltd, 144A | | | 5.875% | | | | 11/30/19 | | | | BB– | | | | 2,055,000 | |
| | 8,700 | | | Total Hotels, Restaurants & Leisure | | | | | | | | | | | | | | | 9,133,500 | |
| | | | | |
| | | | Household Durables – 5.8% | | | | | | | | | | | | |
| | | | | |
| | 2,000 | | | Beazer Homes USA, Inc. | | | 5.750% | | | | 6/15/19 | | | | B– | | | | 2,070,000 | |
| | 2,350 | | | KB Home | | | 4.750% | | | | 5/15/19 | | | | B+ | | | | 2,397,000 | |
| | 2,144 | | | KB Home | | | 8.000% | | | | 3/15/20 | | | | B+ | | | | 2,358,400 | |
| | 1,000 | | | Lennar Corporation | | | 4.500% | | | | 11/15/19 | | | | Ba1 | | | | 1,038,750 | |
| | 925 | | | Meritage Homes Corporation | | | 7.150% | | | | 4/15/20 | | | | Ba2 | | | | 1,003,625 | |
| | 4,400 | | | Rialto Holdings LLC-Rialto Corporation, 144A | | | 7.000% | | | | 12/01/18 | | | | B1 | | | | 4,455,000 | |
| | 2,550 | | | William Lyon Homes Incorporated | | | 5.750% | | | | 4/15/19 | | | | B– | | | | 2,575,500 | |
| | 15,369 | | | Total Household Durables | | | | | | | | | | | | | | | 15,898,275 | |
| | | | | |
| | | | Household Products – 0.7% | | | | | | | | | | | | |
| | | | | |
| | 1,790 | | | HRG Group, Inc. | | | 7.875% | | | | 7/15/19 | | | | BB– | | | | 1,866,075 | |
| | | | | |
| | | | Independent Power & Renewable Electricity Producers – 5.3% | | | | | | | | | | | | |
| | | | | |
| | 2,614 | | | Atlantica Yield PLC, 144A | | | 7.000% | | | | 11/15/19 | | | | B+ | | | | 2,666,280 | |
| | 5,152 | | | DPL, Inc. | | | 6.750% | | | | 10/01/19 | | | | BB | | | | 5,242,157 | |
| | 4,835 | | | Dynegy Inc. | | | 6.750% | | | | 11/01/19 | | | | B+ | | | | 4,919,613 | |
| | 2,500 | | | GenOn Energy Inc. | | | 9.500% | | | | 10/15/18 | | | | CCC+ | | | | 1,767,188 | |
| | 15,101 | | | Total Independent Power & Renewable Electricity Producers | | | | | | | | | | | | | | | 14,595,238 | |
| | | | | |
| | | | Industrial Conglomerates – 1.3% | | | | | | | | | | | | |
| | | | | |
| | 3,500 | | | Icahn Enterprises Finance | | | 4.875% | | | | 3/15/19 | | | | BB+ | | | | 3,535,000 | |
| | | | | |
| | | | Insurance – 0.8% | | | | | | | | | | | | |
| | | | | |
| | 2,293 | | | Genworth Financial Inc. | | | 6.515% | | | | 5/22/18 | | | | Ba3 | | | | 2,258,605 | |
| | | | | |
| | | | Internet Software & Services – 1.7% | | | | | | | | | | | | |
| | | | | |
| | 3,000 | | | Earthlink Inc. | | | 7.375% | | | | 6/01/20 | | | | Ba3 | | | | 3,165,000 | |
| | 1,350 | | | Equinix Inc. | | | 4.875% | | | | 4/01/20 | | | | BB+ | | | | 1,390,500 | |
| | 4,350 | | | Total Internet Software & Services | | | | | | | | | | | | | | | 4,555,500 | |
| | | | | |
| | | | IT Services – 1.2% | | | | | | | | | | | | |
| | | | | |
| | 3,275 | | | Alliance Data Systems Corporation, 144A | | | 6.375% | | | | 4/01/20 | | | | N/R | | | | 3,324,125 | |
| | | | | |
| | | | Machinery – 2.5% | | | | | | | | | | | | |
| | | | | |
| | 3,500 | | | CNH Industrial Capital LLC | | | 3.375% | | | | 7/15/19 | | | | Ba1 | | | | 3,508,750 | |
| | 3,250 | | | Terex Corporation | | | 6.500% | | | | 4/01/20 | | | | BB | | | | 3,315,000 | |
| | 6,750 | | | Total Machinery | | | | | | | | | | | | | | | 6,823,750 | |
| | | | | |
| | | | Media – 4.4% | | | | | | | | | | | | |
| | | | | |
| | 1,750 | | | Cablevision Systems Corporation | | | 8.000% | | | | 4/15/20 | | | | B3 | | | | 1,920,625 | |
| | 2,000 | | | Clear Channel Worldwide | | | 7.625% | | | | 3/15/20 | | | | B– | | | | 1,998,740 | |
| | | | |
| JHD | | Nuveen High Income December 2019 Target Term Fund | | |
| | Portfolio of Investments (continued) | | December 31, 2016 |
| | | | | | | | | | | | | | | | | | | | |
Principal
Amount (000) | | | Description (1) | | Coupon | | | Maturity | | | Ratings (2) | | | Value | |
| | | | | |
| | | | Media (continued) | | | | | | | | | | | | |
| | | | | |
| $ | 2,500 | | | Cogeco Communications Inc., 144A | | | 4.875% | | | | 5/01/20 | | | | BB+ | | | $ | 2,571,875 | |
| | 1,500 | | | CSC Holdings Inc. | | | 8.625% | | | | 2/15/19 | | | | B+ | | | | 1,657,500 | |
| | 3,750 | | | Dish DBS Corporation | | | 5.125% | | | | 5/01/20 | | | | Ba3 | | | | 3,881,250 | |
| | 11,500 | | | Total Media | | | | | | | | | | | | | | | 12,029,990 | |
| | | | | |
| | | | Metals & Mining – 7.8% | | | | | | | | | | | | |
| | | | | |
| | 3,000 | | | AK Steel Corporation | | | 7.625% | | | | 5/15/20 | | | | B– | | | | 3,060,000 | |
| | 2,180 | | | Allegheny Technologies Inc. | | | 9.375% | | | | 6/01/19 | | | | B | | | | 2,332,600 | |
| | 2,785 | | | Anglo American PLC, 144A | | | 3.625% | | | | 5/14/20 | | | | BB+ | | | | 2,816,192 | |
| | 2,500 | | | ArcelorMittal | | | 5.125% | | | | 6/01/20 | | | | BB+ | | | | 2,618,750 | |
| | 1,750 | | | Cliffs Natural Resources Inc., 144A | | | 8.250% | | | | 3/31/20 | | | | B | | | | 1,916,250 | |
| | 2,250 | | | New Gold Incorporated, 144A | | | 7.000% | | | | 4/15/20 | | | | B+ | | | | 2,306,250 | |
| | 3,000 | | | Teck Resources Limited | | | 3.000% | | | | 3/01/19 | | | | BB | | | | 3,000,000 | |
| | 1,750 | | | United States Steel Corporation | | | 7.375% | | | | 4/01/20 | | | | B | | | | 1,876,875 | |
| | 1,500 | | | Vale Overseas Limited | | | 5.625% | | | | 9/15/19 | | | | BBB | | | | 1,584,750 | |
| | 20,715 | | | Total Metals & Mining | | | | | | | | | | | | | | | 21,511,667 | |
| | | | | |
| | | | Multiline Retail – 1.5% | | | | | | | | | | | | |
| | | | | |
| | 2,000 | | | J.C. Penney Company Inc. | | | 8.125% | | | | 10/01/19 | | | | B+ | | | | 2,160,000 | |
| | 2,000 | | | J.C. Penney Corporation Inc. | | | 5.650% | | | | 6/01/20 | | | | B+ | | | | 1,972,500 | |
| | 4,000 | | | Total Multiline Retail | | | | | | | | | | | | | | | 4,132,500 | |
| | | | | |
| | | | Oil, Gas & Consumable Fuels – 11.7% | | | | | | | | | | | | |
| | | | | |
| | 470 | | | Canadian Oil Sands Trust, 144A | | | 7.750% | | | | 5/15/19 | | | | A– | | | | 518,309 | |
| | 2,750 | | | Cenovus Energy Inc. | | | 5.700% | | | | 10/15/19 | | | | BBB | | | | 2,940,435 | |
| | 1,500 | | | DCP Midstream LLC, 144A | | | 5.350% | | | | 3/15/20 | | | | BB+ | | | | 1,556,250 | |
| | 1,500 | | | EnLink Midstream Partners LP | | | 2.700% | | | | 4/01/19 | | | | BBB– | | | | 1,500,648 | |
| | 2,500 | | | Marathon Oil Corporation | | | 2.700% | | | | 6/01/20 | | | | BBB | | | | 2,501,920 | |
| | 2,395 | | | NGL Energy Partners LP/Fin Co | | | 5.125% | | | | 7/15/19 | | | | BB– | | | | 2,377,038 | |
| | 3,145 | | | PBF Holding Company LLC | | | 8.250% | | | | 2/15/20 | | | | BBB– | | | | 3,223,625 | |
| | 4,000 | | | Petrobras International Finance Company | | | 5.750% | | | | 1/20/20 | | | | BB | | | | 4,050,000 | |
| | 3,000 | | | Southwestern Energy Company | | | 5.800% | | | | 1/23/20 | | | | BB | | | | 3,090,000 | |
| | 3,000 | | | Targa Resources Inc. | | | 4.125% | | | | 11/15/19 | | | | BB– | | | | 3,037,500 | |
| | 2,000 | | | Tesoro Logistics LP Finance Corporation | | | 5.500% | | | | 10/15/19 | | | | BB+ | | | | 2,115,000 | |
| | 2,000 | | | Whiting Petroleum Corporation | | | 5.000% | | | | 3/15/19 | | | | BB– | | | | 2,007,820 | |
| | 3,000 | | | Williams Partners LP | | | 5.250% | | | | 3/15/20 | | | | BBB– | | | | 3,203,235 | |
| | 31,260 | | | Total Oil, Gas & Consumable Fuels | | | | | | | | | | | | | | | 32,121,780 | |
| | | | | |
| | | | Paper & Forest Products – 1.4% | | | | | | | | | | | | |
| | | | | |
| | 2,608 | | | Mercer International Inc. | | | 7.000% | | | | 12/01/19 | | | | BB– | | | | 2,692,760 | |
| | 1,350 | | | Tembec Industries, Inc., 144A | | | 9.000% | | | | 12/15/19 | | | | B– | | | | 1,262,250 | |
| | 3,958 | | | Total Paper & Forest Products | | | | | | | | | | | | | | | 3,955,010 | |
| | | | | |
| | | | Personal Products – 1.3% | | | | | | | | | | | | |
| | | | | |
| | 3,520 | | | Albea Beauty Holdings SA, 144A | | | 8.375% | | | | 11/01/19 | | | | B | | | | 3,660,800 | |
| | | | | |
| | | | Pharmaceuticals – 0.5% | | | | | | | | | | | | |
| | | | | |
| | 1,500 | | | VRX Escrow Corp., 144A | | | 5.375% | | | | 3/15/20 | | | | B– | | | | 1,267,500 | |
| | | | | |
| | | | Road & Rail – 2.2% | | | | | | | | | | | | |
| | | | | |
| | 2,395 | | | Con-Way, Inc. | | | 7.250% | | | | 1/15/18 | | | | B– | | | | 2,459,665 | |
| | 3,600 | | | Hertz Corporation | | | 6.750% | | | | 4/15/19 | | | | B | | | | 3,600,000 | |
| | 5,995 | | | Total Road & Rail | | | | | | | | | | | | | | | 6,059,665 | |
| | | | | |
| | | | Specialty Retail – 1.5% | | | | | | | | | | | | |
| | | | | |
| | 3,205 | | | GameStop Corporation, 144A | | | 5.500% | | | | 10/01/19 | | | | BB+ | | | | 3,281,119 | |
| | 1,000 | | | Guitar Center Inc., 144A | | | 6.500% | | | | 4/15/19 | | | | B2 | | | | 907,500 | |
| | 4,205 | | | Total Specialty Retail | | | | | | | | | | | | | | | 4,188,619 | |
| | | | | | | | | | | | | | | | | | | | |
Principal
Amount (000) | | | Description (1) | | Coupon | | | Maturity | | | Ratings (2) | | | Value | |
| | | | | |
| | | | Technology Hardware, Storage & Peripherals – 4.6% | | | | | | | | | | | | |
| | | | | |
| $ | 3,568 | | | Dell Inc. | | | 5.875% | | | | 6/15/19 | | | | Ba2 | | | $ | 3,764,240 | |
| | 3,000 | | | Diamond 1 Finance Corporation / Diamond 2 Finance Corporation, 144A | | | 3.480% | | | | 6/01/19 | | | | BBB– | | | | 3,061,644 | |
| | 2,000 | | | EMC Corporation | | | 2.650% | | | | 6/01/20 | | | | Ba2 | | | | 1,950,620 | |
| | 3,750 | | | Seagate HDD Cayman | | | 3.750% | | | | 11/15/18 | | | | BBB– | | | | 3,842,344 | |
| | 12,318 | | | Total Technology Hardware, Storage & Peripherals | | | | | | | | | | | | | | | 12,618,848 | |
| | | | | |
| | | | Thrifts & Mortgage Finance – 1.1% | | | | | | | | | | | | |
| | | | | |
| | 3,000 | | | Radian Group Inc. | | | 5.500% | | | | 6/01/19 | | | | BB | | | | 3,135,000 | |
| | | | | |
| | | | Trading Companies & Distributors – 0.8% | | | | | | | | | | | | |
| | | | | |
| | 2,110 | | | Avation Capital SA, 144A | | | 7.500% | | | | 5/27/20 | | | | B+ | | | | 2,088,900 | |
| | | | | |
| | | | Transportation Infrastructure – 0.7% | | | | | | | | | | | | |
| | | | | |
| | 2,000 | | | Navigator Holdings Limited, 144A, Reg S | | | 9.000% | | | | 12/18/17 | | | | N/R | | | | 2,030,352 | |
| | | | | |
| | | | Wireless Telecommunication Services – 6.2% | | | | | | | | | | | | |
| | | | | |
| | 500 | | | FairPoint Communications Inc., 144A | | | 8.750% | | | | 8/15/19 | | | | B | | | | 521,875 | |
| | 4,000 | | | Millicom International Cellular SA, 144A | | | 4.750% | | | | 5/22/20 | | | | BB+ | | | | 4,050,000 | |
| | 2,650 | | | Softbank Corporation, 144A | | | 4.500% | | | | 4/15/20 | | | | BB+ | | | | 2,716,250 | |
| | 2,500 | | | Sprint Capital Corporation | | | 6.900% | | | | 5/01/19 | | | | B+ | | | | 2,646,875 | |
| | 1,000 | | | Sprint Communications Inc., 144A | | | 9.000% | | | | 11/15/18 | | | | BB | | | | 1,102,500 | |
| | 1,205 | | | Sprint Communications Inc., 144A | | | 7.000% | | | | 3/01/20 | | | | BB | | | | 1,307,425 | |
| | 1,000 | | | T-Mobile USA Inc. | | | 6.542% | | | | 4/28/20 | | | | BB | | | | 1,030,000 | |
| | 3,438 | | | Wind Acquisition Finance SA, 144A | | | 6.500% | | | | 4/30/20 | | | | BB | | | | 3,575,520 | |
| | 16,293 | | | Total Wireless Telecommunication Services | | | | | | | | | | | | | | | 16,950,445 | |
| $ | 341,074 | | | Total Corporate Bonds (cost $342,346,072) | | | | | | | | | | | | | | | 347,701,147 | |
| | | | | |
Principal
Amount (000) | | | Description (1) | | Coupon | | | Maturity | | | Ratings (2) | | | Value | |
| |
| | | | CONVERTIBLE BONDS – 2.7% (2.0% of Total Investments) | |
| | | | | |
| | | | Capital Markets – 1.1% | | | | | | | | | | | | |
| | | | | |
| $ | 3,000 | | | Prospect Capital Corporation | | | 4.750% | | | | 4/15/20 | | | | BBB– | | | $ | 2,926,875 | |
| |
| | | | Independent Power & Renewable Electricity Producers – 1.1% | |
| | | | | |
| | 3,000 | | | NRG Yield Inc., 144A | | | 3.250% | | | | 6/01/20 | | | | N/R | | | | 2,880,000 | |
| | | | | |
| | | | Machinery – 0.5% | | | | | | | | | | | | |
| | | | | |
| | 1,500 | | | Navistar International Corporation | | | 4.750% | | | | 4/15/19 | | | | CCC– | | | | 1,481,250 | |
| $ | 7,500 | | | Total Convertible Bonds (cost $7,105,962) | | | | | | | | | | | | | | | 7,288,125 | |
| | | | | |
Principal
Amount (000) | | | Description (1) | | Coupon | | | Maturity | | | Ratings (2) | | | Value | |
| |
| | | | SOVEREIGN DEBT – 1.5% (1.2% of Total Investments) | |
| | | | | |
| | | | Argentina – 1.1% | | | | | | | | | | | | |
| | | | | |
| $ | 3,000 | | | Republic of Argentina, 144A | | | 6.250% | | | | 4/22/19 | | | | B | | | $ | 3,202,500 | |
| | | | | |
| | | | Sri Lanka – 0.4% | | | | | | | | | | | | |
| | | | | |
| | 1,000 | | | Republic of Sri Lanka, 144A | | | 6.000% | | | | 1/14/19 | | | | B+ | | | | 1,028,107 | |
| $ | 4,000 | | | Total Sovereign Debt (cost $4,144,726) | | | | | | | | 4,230,607 | |
| | | | Total Long-Term Investments (cost $353,596,760) | | | | | | | | | | | | | | | 359,219,879 | |
| | | | |
| JHD | | Nuveen High Income December 2019 Target Term Fund | | |
| | Portfolio of Investments (continued) | | December 31, 2016 |
| | | | | | | | | | | | | | | | | | | | |
Principal
Amount (000) | | | Description (1) | | Coupon | | | Maturity | | | | | | Value | |
| |
| | | | SHORT-TERM INVESTMENTS – 0.3% (0.2% of Total Investments) | |
| |
| | | | REPURCHASE AGREEMENTS – 0.3% (0.2% of Total Investments) | |
| | | | | |
| $ | 900 | | | Repurchase Agreement with Fixed Income Clearing Corporation,
dated 12/31/16, repurchase price $899,759,
collateralized by $910,000 U.S. Treasury Notes,
2.125%, due 6/30/22, value $920,784 | | | 0.030% | | | | 1/03/17 | | | | | | | $ | 899,756 | |
| | | | Total Short-Term Investments (cost $899,756) | | | | | | | | | | | | | | | 899,756 | |
| | | | Total Investments (cost $354,496,516) – 131.1% | | | | | | | | | | | | | | | 360,119,635 | |
| | | | Borrowings – (32.8)% (3), (4) | | | | | | | | | | | | | | | (90,000,000 | ) |
| | | | Other Assets Less Liabilities – 1.7% | | | | | | | | | | | | | | | 4,635,927 | |
| | | | Net Assets – 100% | | | | | | | | | | | | | | $ | 274,755,562 | |
For Fund portfolio compliance purposes, the Fund’s industry classifications refer to any one or more of the industry sub-classifications used by one or more widely recognized market indexes or ratings group indexes, and/or as defined by Fund management. This definition may not apply for purposes of this report, which may combine industry sub-classifications into sectors for reporting ease.
| (1) | All percentages shown in the Portfolio of Investments are based on net assets unless otherwise noted. |
| (2) | For financial reporting purposes, the ratings disclosed are the highest of Standard & Poor’s Group (“Standard & Poor’s”), Moody’s Investors Service, Inc. (“Moody’s”) or Fitch, Inc. (“Fitch”) rating. This treatment of split-rated securities may differ from that used for other purposes, such as for Fund investment policies. Ratings below BBB by Standard & Poor’s, Baa by Moody’s or BBB by Fitch are considered to be below investment grade. Holdings designated N/R are not rated by any of these national rating agencies. Ratings are not covered by the report of independent registered public accounting firm. |
| (3) | Borrowings as a percentage of Total Investments is 25.0%. |
| (4) | The Fund segregates 100% of its eligible investments (excluding any investments separately pledged as collateral for specific investments in derivatives, when applicable) in the Portfolio of Investments as collateral for Borrowings. |
| 144A | Investment is exempt from registration under Rule 144A of the Securities Act of 1933, as amended. These investments may only be resold in transactions exempt from registration, which are normally those transactions with qualified institutional buyers. |
| Reg S | Regulation S allows U.S. companies to sell securities to persons or entities located outside of the United States without registering those securities with the Securities and Exchange Commission. Specifically, Regulation S provides a safe harbor from the registration requirements of the Securities Act for the offers and sales of securities by both foreign and domestic issuers that are made outside the United States. |
See accompanying notes to financial statements.
JHA
| | |
Nuveen High Income December 2018 Target Term Fund | | |
Portfolio of Investments | | December 31, 2016 |
| | | | | | | | | | | | | | | | | | | | |
Principal
Amount (000) | | | Description (1) | | Coupon | | | Maturity | | | Ratings (2) | | | Value | |
| |
| | | | LONG-TERM INVESTMENTS – 128.5% (100.0% of Total Investments) | |
| |
| | | | CORPORATE BONDS – 122.4% (95.3% of Total Investments) | |
| | | | | |
| | | | Aerospace & Defense – 1.0% | | | | | | | | | | | | |
| | | | | |
| $ | 3,000 | | | Bombardier Inc., 144A | | | 4.750% | | | | 4/15/19 | | | | B | | | $ | 3,015,000 | |
| | | | | |
| | | | Airlines – 3.3% | | | | | | | | | | | | |
| | | | | |
| | 6,440 | | | American Airlines Group Inc. | | | 6.125% | | | | 6/01/18 | | | | BB– | | | | 6,705,650 | |
| | 2,869 | | | United Continental Holdings Inc. | | | 6.375% | | | | 6/01/18 | | | | BB– | | | | 2,998,105 | |
| | 9,309 | | | Total Airlines | | | | | | | | | | | | | | | 9,703,755 | |
| | | | | |
| | | | Automobiles – 3.4% | | | | | | | | | | | | |
| | | | | |
| | 3,000 | | | General Motors Corporation | | | 3.500% | | | | 10/02/18 | | | | BBB– | | | | 3,059,136 | |
| | 3,000 | | | General Motors Financial Company Inc. | | | 2.400% | | | | 5/09/19 | | | | BBB– | | | | 2,990,844 | |
| | 4,000 | | | Jaguar Land Rover Automotive PLC, 144A | | | 4.125% | | | | 12/15/18 | | | | BB+ | | | | 4,110,000 | |
| | 10,000 | | | Total Automobiles | | | | | | | | | | | | | | | 10,159,980 | |
| | | | | |
| | | | Banks – 2.6% | | | | | | | | | | | | |
| | | | | |
| | 4,000 | | | CIT Group Inc., 144A | | | 6.625% | | | | 4/01/18 | | | | BB+ | | | | 4,215,000 | |
| | 3,000 | | | CIT Group Inc. | | | 3.875% | | | | 2/19/19 | | | | BB+ | | | | 3,063,750 | |
| | 400 | | | UniCredito Luxembourg Finance SA, 144A | | | 6.000% | | | | 10/31/17 | | | | BBB | | | | 407,868 | |
| | 7,400 | | | Total Banks | | | | | | | | | | | | | | | 7,686,618 | |
| | | | | |
| | | | Beverages – 0.4% | | | | | | | | | | | | |
| | | | | |
| | 1,350 | | | Carolina Beverage Group LLC, 144A | | | 10.625% | | | | 8/01/18 | | | | B– | | | | 1,255,500 | |
| | | | | |
| | | | Building Products – 1.2% | | | | | | | | | | | | |
| | | | | |
| | 3,250 | | | USG Corporation | | | 9.750% | | | | 1/15/18 | | | | BB+ | | | | 3,440,938 | |
| | | | | |
| | | | Chemicals – 2.7% | | | | | | | | | | | | |
| | | | | |
| | 1,500 | | | Hexion US Finance Corporation | | | 8.875% | | | | 2/01/18 | | | | CCC | | | | 1,492,500 | |
| | 6,270 | | | Ineos Group Holdings SA, 144A | | | 5.875% | | | | 2/15/19 | | | | B– | | | | 6,411,075 | |
| | 7,770 | | | Total Chemicals | | | | | | | | | | | | | | | 7,903,575 | |
| | | | | |
| | | | Commercial Services & Supplies – 3.8% | | | | | | | | | | | | |
| | | | | |
| | 2,000 | | | AerCap Ireland Capital Limited / AerCap Global Aviation Trust | | | 3.750% | | | | 5/15/19 | | | | BBB– | | | | 2,037,500 | |
| | 3,000 | | | International Lease Finance Corporation | | | 5.875% | | | | 4/01/19 | | | | BBB– | | | | 3,185,940 | |
| | 2,000 | | | International Lease Finance Corporation | | | 6.250% | | | | 5/15/19 | | | | BBB– | | | | 2,150,000 | |
| | 3,900 | | | NES Rental Holdings Inc., 144A | | | 7.875% | | | | 5/01/18 | | | | B– | | | | 3,880,500 | |
| | 10,900 | | | Total Commercial Services & Supplies | | | | | | | | | | | | | | | 11,253,940 | |
| | | | | |
| | | | Construction & Engineering – 1.1% | | | | | | | | | | | | |
| | | | | |
| | 3,300 | | | Michael Baker International LLC / CDL Acquisition Company Inc., 144A | | | 8.250% | | | | 10/15/18 | | | | B+ | | | | 3,250,500 | |
| | | | | |
| | | | Consumer Finance – 4.7% | | | | | | | | | | | | |
| | | | | |
| | 5,805 | | | Ally Financial Inc. | | | 4.750% | | | | 9/10/18 | | | | BB+ | | | | 5,979,150 | |
| | 3,000 | | | Navient Corporation | | | 8.450% | | | | 6/15/18 | | | | BB | | | | 3,232,500 | |
| | 2,500 | | | Navient Corporation | | | 5.500% | | | | 1/15/19 | | | | BB | | | | 2,593,750 | |
| | 2,000 | | | Springleaf Finance Corporation | | | 6.900% | | | | 12/15/17 | | | | B | | | | 2,085,600 | |
| | 13,305 | | | Total Consumer Finance | | | | | | | | | | | | | | | 13,891,000 | |
| | | | | |
| | | | Containers & Packaging – 2.1% | | | | | | | | | | | | |
| | | | | |
| | 6,200 | | | Ardagh Packaging Finance / MP HD USA, 144A | | | 6.250% | | | | 1/31/19 | | | | B3 | | | | 6,300,750 | |
| | | | |
| JHA | | Nuveen High Income December 2018 Target Term Fund | | |
| | Portfolio of Investments (continued) | | December 31, 2016 |
| | | | | | | | | | | | | | | | | | | | |
Principal
Amount (000) | | | Description (1) | | Coupon | | | Maturity | | | Ratings (2) | | | Value | |
| | | | | |
| | | | Diversified Financial Services – 1.7% | | | | | | | | | | | | |
| | | | | |
| $ | 5,000 | | | Nationstar Mortgage LLC Capital Corporation | | | 6.500% | | | | 8/01/18 | | | | B+ | | | $ | 5,081,250 | |
| | | | | |
| | | | Diversified Telecommunication Services – 2.8% | | | | | | | | | | | | |
| | | | | |
| | 4,000 | | | Frontier Communications Corporation | | | 8.125% | | | | 10/01/18 | | | | BB | | | | 4,320,000 | |
| | 2,500 | | | Frontier Communications Corporation | | | 7.125% | | | | 3/15/19 | | | | BB | | | | 2,646,875 | |
| | 1,500 | | | IntelSat Jackson Holdings | | | 7.250% | | | | 4/01/19 | | | | CCC | | | | 1,260,000 | |
| | 8,000 | | | Total Diversified Telecommunication Services | | | | | | | | | | | | | | | 8,226,875 | |
| | | | | |
| | | | Electronic Equipment, Instruments & Components – 3.3% | | | | | | | | | | | | |
| | | | | |
| | 6,250 | | | Anixter Inc. | | | 5.625% | | | | 5/01/19 | | | | BB+ | | | | 6,539,063 | |
| | 3,045 | | | Sanmina-SCI Corporation, 144A | | | 4.375% | | | | 6/01/19 | | | | BB+ | | | | 3,128,738 | |
| | 9,295 | | | Total Electronic Equipment, Instruments & Components | | | | | | | | | | | | | | | 9,667,801 | |
| | | | | |
| | | | Energy Equipment & Services – 2.4% | | | | | | | | | | | | |
| | | | | |
| | 2,000 | | | Noble Holding International Limited | | | 5.250% | | | | 3/16/18 | | | | BB– | | | | 1,995,000 | |
| | 2,605 | | | Rockies Express Pipeline Company, 144A | | | 6.850% | | | | 7/15/18 | | | | BB+ | | | | 2,751,531 | |
| | 2,400 | | | SESI, LLC | | | 6.375% | | | | 5/01/19 | | | | BB– | | | | 2,400,000 | |
| | 7,005 | | | Total Energy Equipment & Services | | | | | | | | | | | | | | | 7,146,531 | |
| | | | | |
| | | | Equity Real Estate Investment Trusts – 4.5% | | | | | | | | | | | | |
| | | | | |
| | 5,500 | | | iStar Inc. | | | 7.125% | | | | 2/15/18 | | | | B+ | | | | 5,665,000 | |
| | 3,000 | | | Realogy Group LLC / Realogy Co-Issuer Corporation, 144A | | | 4.500% | | | | 4/15/19 | | | | B+ | | | | 3,090,000 | |
| | 4,500 | | | Vereit Operating Partner | | | 3.000% | | | | 2/06/19 | | | | BBB– | | | | 4,488,750 | |
| | 13,000 | | | Total Equity Real Estate Investment Trusts | | | | | | | | | | | | | | | 13,243,750 | |
| | | | | |
| | | | Food & Staples Retailing – 1.1% | | | | | | | | | | | | |
| | | | | |
| | 3,750 | | | Bi-Lo LLC Finance Corporation, 144A | | | 9.250% | | | | 2/15/19 | | | | B | | | | 3,178,125 | |
| | | | | |
| | | | Food Products – 3.6% | | | | | | | | | | | | |
| | | | | |
| | 3,470 | | | Bumble Bee Holdings Inc., 144A | | | 9.000% | | | | 12/15/17 | | | | B– | | | | 3,426,625 | |
| | 4,000 | | | Dole Food Company, 144A | | | 7.250% | | | | 5/01/19 | | | | B3 | | | | 4,080,000 | |
| | 3,000 | | | Marfrig Holding Europe BV, 144A | | | 8.375% | | | | 5/09/18 | | | | BB– | | | | 3,143,400 | |
| | 10,470 | | | Total Food Products | | | | | | | | | | | | | | | 10,650,025 | |
| | | | | |
| | | | Health Care Equipment & Supplies – 3.3% | | | | | | | | | | | | |
| | | | | |
| | 3,500 | | | Tenet Healthcare Corporation | | | 6.250% | | | | 11/01/18 | | | | BB– | | | | 3,692,500 | |
| | 6,120 | | | Tenet Healthcare Corporation | | | 5.000% | | | | 3/01/19 | | | | B– | | | | 5,967,000 | |
| | 9,620 | | | Total Health Care Equipment & Supplies | | | | | | | | | | | | | | | 9,659,500 | |
| | | | | |
| | | | Health Care Providers & Services – 6.8% | | | | | | | | | | | | |
| | | | | |
| | 6,500 | | | Community Health Systems, Inc. | | | 5.125% | | | | 8/15/18 | | | | BB– | | | | 6,386,250 | |
| | 7,500 | | | HCA Inc. | | | 3.750% | | | | 3/15/19 | | | | BBB– | | | | 7,706,250 | |
| | 4,350 | | | Iasis Healthcare Capital Corporation | | | 8.375% | | | | 5/15/19 | | | | CCC+ | | | | 3,784,500 | |
| | 2,300 | | | Mallinckrodt International Finance SA | | | 3.500% | | | | 4/15/18 | | | | B | | | | 2,297,125 | |
| | 20,650 | | | Total Health Care Providers & Services | | | | | | | | | | | | | | | 20,174,125 | |
| | | | | |
| | | | Hotels, Restaurants & Leisure – 1.9% | | | | | | | | | | | | |
| | | | | |
| | 5,010 | | | MGM Resorts International Inc. | | | 8.625% | | | | 2/01/19 | | | | BB | | | | 5,629,988 | |
| | | | | |
| | | | Household Durables – 7.1% | | | | | | | | | | | | |
| | | | | |
| | 5,000 | | | KB Home | | | 4.750% | | | | 5/15/19 | | | | B+ | | | | 5,100,000 | |
| | 4,250 | | | Meritage Homes Corporation | | | 4.500% | | | | 3/01/18 | | | | Ba2 | | | | 4,313,750 | |
| | 6,130 | | | Rialto Holdings LLC-Rialto Corporation, 144A | | | 7.000% | | | | 12/01/18 | | | | B1 | | | | 6,206,625 | |
| | 5,380 | | | William Lyon Homes Incorporated | | | 5.750% | | | | 4/15/19 | | | | B– | | | | 5,433,800 | |
| | 20,760 | | | Total Household Durables | | | | | | | | | | | | | | | 21,054,175 | |
| | | | | | | | | | | | | | | | | | | | |
Principal
Amount (000) | | | Description (1) | | Coupon | | | Maturity | | | Ratings (2) | | | Value | |
| | | | | |
| | | | Independent Power & Renewable Electricity Producers – 2.9% | | | | | | | | | | | | |
| | | | | |
| $ | 2,000 | | | GenOn Energy Inc. | | | 9.500% | | | | 10/15/18 | | | | CCC+ | | | $ | 1,413,750 | |
| | 4,000 | | | Talen Energy Supply LLC | | | 6.500% | | | | 5/01/18 | | | | B+ | | | | 4,130,000 | |
| | 2,958 | | | TransAlta Corporation | | | 6.900% | | | | 5/15/18 | | | | BBB– | | | | 3,080,940 | |
| | 8,958 | | | Total Independent Power & Renewable Electricity Producers | | | | | | | | | | | | | | | 8,624,690 | |
| | | | | |
| | | | Industrial Conglomerates – 1.7% | | | | | | | | | | | | |
| | | | | |
| | 5,000 | | | Icahn Enterprises Finance | | | 4.875% | | | | 3/15/19 | | | | BB+ | | | | 5,050,000 | |
| | | | | |
| | | | Insurance – 1.3% | | | | | | | | | | | | |
| | | | | |
| | 4,000 | | | Genworth Financial Inc. | | | 6.515% | | | | 5/22/18 | | | | Ba3 | | | | 3,940,000 | |
| | | | | |
| | | | IT Services – 1.7% | | | | | | | | | | | | |
| | | | | |
| | 2,855 | | | Alliance Data Systems Corporation, 144A | | | 5.250% | | | | 12/01/17 | | | | N/R | | | | 2,894,256 | |
| | 2,134 | | | Xerox Corporation | | | 6.350% | | | | 5/15/18 | | | | BBB– | | | | 2,249,501 | |
| | 4,989 | | | Total IT Services | | | | | | | | | | | | | | | 5,143,757 | |
| | | | | |
| | | | Machinery – 2.5% | | | | | | | | | | | | |
| | | | | |
| | 2,250 | | | BlueLine Rental Finance Corporation, 144A | | | 7.000% | | | | 2/01/19 | | | | B+ | | | | 2,193,750 | |
| | 5,160 | | | CNH Industrial Capital LLC | | | 3.875% | | | | 7/16/18 | | | | Ba1 | | | | 5,243,850 | |
| | 7,410 | | | Total Machinery | | | | | | | | | | | | | | | 7,437,600 | |
| | | | | |
| | | | Marine – 0.4% | | | | | | | | | | | | |
| | | | | |
| | 1,404 | | | Global Ship Lease Inc., 144A | | | 10.000% | | | | 4/01/19 | | | | B | | | | 1,284,660 | |
| | | | | |
| | | | Media – 4.8% | | | | | | | | | | | | |
| | | | | |
| | 2,000 | | | Cablevision Systems Corporation | | | 7.750% | | | | 4/15/18 | | | | B3 | | | | 2,110,000 | |
| | 5,000 | | | CSC Holdings Inc. | | | 8.625% | | | | 2/15/19 | | | | B+ | | | | 5,525,000 | |
| | 6,302 | | | Dish DBS Corporation | | | 4.250% | | | | 4/01/18 | | | | Ba3 | | | | 6,461,882 | |
| | 13,302 | | | Total Media | | | | | | | | | | | | | | | 14,096,882 | |
| | | | | |
| | | | Metals & Mining – 10.4% | | | | | | | | | | | | |
| | | | | |
| | 6,500 | | | Alcoa Inc. | | | 5.720% | | | | 2/23/19 | | | | BBB– | | | | 6,890,000 | |
| | 2,600 | | | Allegheny Technologies Inc. | | | 9.375% | | | | 6/01/19 | | | | B | | | | 2,782,000 | |
| | 2,425 | | | ArcelorMittal | | | 10.850% | | | | 6/01/19 | | | | BB+ | | | | 2,837,250 | |
| | 4,827 | | | Barrick Gold Corporation | | | 6.950% | | | | 4/01/19 | | | | BBB– | | | | 5,278,074 | |
| | 1,533 | | | Commercial Metals Inc. | | | 6.500% | | | | 7/15/17 | | | | BB+ | | | | 1,563,660 | |
| | 4,413 | | | Commercial Metals Inc. | | | 7.350% | | | | 8/15/18 | | | | BB+ | | | | 4,677,780 | |
| | 5,000 | | | Freeport McMoRan, Inc. | | | 2.375% | | | | 3/15/18 | | | | BBB– | | | | 4,962,500 | |
| | 1,500 | | | Imperial Metals Corporation, 144A | | | 7.000% | | | | 3/15/19 | | | | Caa2 | | | | 1,432,500 | |
| | 377 | | | Teck Resources Limited | | | 3.000% | | | | 3/01/19 | | | | BB | | | | 377,000 | |
| | 29,175 | | | Total Metals & Mining | | | | | | | | | | | | | | | 30,800,764 | |
| | | | | |
| | | | Multiline Retail – 1.7% | | | | | | | | | | | | |
| | | | | |
| | 4,889 | | | J.C. Penney Corporation Inc. | | | 5.750% | | | | 2/15/18 | | | | B+ | | | | 4,999,003 | |
| | | | | |
| | | | Oil, Gas & Consumable Fuels – 10.6% | | | | | | | | | | | | |
| | | | | |
| | 3,500 | | | DCP Midstream Operating LP | | | 2.700% | | | | 4/01/19 | | | | BB+ | | | | 3,456,250 | |
| | 2,795 | | | Energy Transfer Partners | | | 2.500% | | | | 6/15/18 | | | | BBB– | | | | 2,804,808 | |
| | 4,500 | | | Kinder Morgan Energy Partners, LP | | | 5.950% | | | | 2/15/18 | | | | BBB– | | | | 4,693,482 | |
| | 3,000 | | | Marathon Oil Corporation | | | 5.900% | | | | 3/15/18 | | | | BBB | | | | 3,132,090 | |
| | 1,755 | | | Noble Energy Inc. | | | 8.250% | | | | 3/01/19 | | | | BBB | | | | 1,970,554 | |
| | 2,000 | | | Oasis Petroleum Inc. | | | 7.250% | | | | 2/01/19 | | | | B+ | | | | 2,000,000 | |
| | 4,500 | | | Petrobras International Finance Company | | | 7.875% | | | | 3/15/19 | | | | BB | | | | 4,823,280 | |
| | 1,500 | | | Petroleos Mexicanos, 144A | | | 5.500% | | | | 2/04/19 | | | | BBB+ | | | | 1,553,835 | |
| | 1,066 | | | Petroleos Mexicanos | | | 8.000% | | | | 5/03/19 | | | | BBB+ | | | | 1,169,935 | |
| | 2,000 | | | Southwestern Energy Company | | | 7.500% | | | | 2/01/18 | | | | BB | | | | 2,080,000 | |
| | 3,750 | | | Whiting Petroleum Corporation | | | 5.000% | | | | 3/15/19 | | | | BB– | | | | 3,764,663 | |
| | 30,366 | | | Total Oil, Gas & Consumable Fuels | | | | | | | | | | | | | | | 31,448,897 | |
| | | | |
| JHA | | Nuveen High Income December 2018 Target Term Fund | | |
| | Portfolio of Investments (continued) | | December 31, 2016 |
| | | | | | | | | | | | | | | | | | | | |
Principal
Amount (000) | | | Description (1) | | Coupon | | | Maturity | | | Ratings (2) | | | Value | |
| | | | | |
| | | | Paper & Forest Products – 1.6% | | | | | | | | | | | | |
| | | | | |
| $ | 4,600 | | | Sappi Papier Holding GMBH, 144A | | | 7.750% | | | | 7/15/17 | | | | Ba2 | | | $ | 4,657,500 | |
| | | | | |
| | | | Pharmaceuticals – 0.7% | | | | | | | | | | | | |
| | | | | |
| | 2,000 | | | Valeant Pharmaceuticals International, 144A | | | 6.750% | | | | 8/15/18 | | | | B– | | | | 1,895,000 | |
| | | | | |
| | | | Real Estate Management & Development – 1.3% | | | | | | | | | | | | |
| | | | | |
| | 3,750 | | | Yuzhou Properties Co Limited, Reg S | | | 8.625% | | | | 1/24/19 | | | | BB– | | | | 3,919,485 | |
| | | | | |
| | | | Road & Rail – 2.8% | | | | | | | | | | | | |
| | | | | |
| | 4,000 | | | Con-Way, Inc. | | | 7.250% | | | | 1/15/18 | | | | B– | | | | 4,108,000 | |
| | 4,226 | | | Hertz Corporation | | | 6.750% | | | | 4/15/19 | | | | B | | | | 4,226,000 | |
| | 8,226 | | | Total Road & Rail | | | | | | | | | | | | | | | 8,334,000 | |
| | | | | |
| | | | Semiconductors & Semiconductor Equipment – 1.7% | | | | | | | | | | | | |
| | | | | |
| | 5,000 | | | NXP BV, 144A | | | 3.750% | | | | 6/01/18 | | | | BBB– | | | | 5,075,000 | |
| | | | | |
| | | | Specialty Retail – 1.8% | | | | | | | | | | | | |
| | | | | |
| | 3,250 | | | Best Buy Co., Inc. | | | 5.000% | | | | 8/01/18 | | | | Baa1 | | | | 3,399,143 | |
| | 2,000 | | | Guitar Center Inc., 144A | | | 6.500% | | | | 4/15/19 | | | | B2 | | | | 1,815,000 | |
| | 5,250 | | | Total Specialty Retail | | | | | | | | | | | | | | | 5,214,143 | |
| | | | | |
| | | | Technology Hardware, Storage & Peripherals – 3.8% | | | | | | | | | | | | |
| | | | | |
| | 4,000 | | | Dell Inc. | | | 5.650% | | | | 4/15/18 | | | | Ba2 | | | | 4,154,000 | |
| | 2,800 | | | Diamond 1 Finance Corporation / Diamond 2 Finance Corporation, 144A | | | 3.480% | | | | 6/01/19 | | | | BBB– | | | | 2,857,534 | |
| | 4,000 | | | Seagate HDD Cayman | | | 3.750% | | | | 11/15/18 | | | | BBB– | | | | 4,098,500 | |
| | 10,800 | | | Total Technology Hardware, Storage & Peripherals | | | | | | | | | | | | | | | 11,110,034 | |
| | | | | |
| | | | Thrifts & Mortgage Finance – 1.9% | | | | | | | | | | | | |
| | | | | |
| | 5,415 | | | Radian Group Inc. | | | 5.500% | | | | 6/01/19 | | | | BB | | | | 5,658,675 | |
| | | | | |
| | | | Transportation Infrastructure – 1.4% | | | | | | | | | | | | |
| | | | | |
| | 4,000 | | | Navigator Holdings Limited, 144A, Reg S | | | 9.000% | | | | 12/18/17 | | | | N/R | | | | 4,060,704 | |
| | | | | |
| | | | Wireless Telecommunication Services – 2.6% | | | | | | | | | | | | |
| | | | | |
| | 7,000 | | | Sprint Communications Inc., 144A | | | 9.000% | | | | 11/15/18 | | | | BB | | | | 7,717,496 | |
| $ | 353,878 | | | Total Corporate Bonds (cost $357,618,666) | | | | | | | | | | | | | | | 362,041,991 | |
| | | | | |
Principal
Amount (000) | | | Description (1) | | Coupon | | | Maturity | | | Ratings (2) | | | Value | |
| | | | | |
| | | | CONVERTIBLE BONDS – 3.9% (3.0% of Total Investments) | | | | | | | | | | | | | | | | |
| | | | | |
| | | | Capital Markets – 1.2% | | | | | | | | | | | | |
| | | | | |
| $ | 3,500 | | | Prospect Capital Corporation | | | 5.875% | | | | 1/15/19 | | | | BBB– | | | $ | 3,583,125 | |
| | | | | |
| | | | Independent Power & Renewable Electricity Producers – 1.3% | | | | | | | | | | | | |
| | | | | |
| | 3,800 | | | NRG Yield Inc., 144A | | | 3.500% | | | | 2/01/19 | | | | N/R | | | | 3,781,000 | |
| | | | | |
| | | | Machinery – 1.4% | | | | | | | | | | | | |
| | | | | |
| | 4,250 | | | Navistar International Corporation | | | 4.750% | | | | 4/15/19 | | | | CCC– | | | | 4,196,875 | |
| $ | 11,550 | | | Total Convertible Bonds (cost $11,114,385) | | | | | | | | | | | | | | | 11,561,000 | |
| | | | | | | | | | | | | | | | | | | | |
Principal
Amount (000) | | | Description (1) | | Coupon | | | Maturity | | | Ratings (2) | | | Value | |
| |
| | | | SOVEREIGN DEBT – 2.2% (1.7% of Total Investments) | |
| | | | | |
| | | | Argentina – 1.1% | | | | | | | | | | | | |
| | | | | |
| $ | 3,000 | | | Republic of Argentina, 144A | | | 6.250% | | | | 4/22/19 | | | | B | | | $ | 3,202,500 | |
| | | | | |
| | | | South Africa – 0.7% | | | | | | | | | | | | |
| | | | | |
| | 2,000 | | | Republic of South Africa | | | 6.875% | | | | 5/27/19 | | | | Baa2 | | | | 2,156,800 | |
| | | | | |
| | | | Sri Lanka – 0.4% | | | | | | | | | | | | |
| | | | | |
| | 1,000 | | | Republic of Sri Lanka, 144A | | | 6.000% | | | | 1/14/19 | | | | B+ | | | | 1,028,107 | |
| $ | 6,000 | | | Total Sovereign Debt (cost $6,216,824) | | | | | | | | | | | | 6,387,407 | |
| | | | Total Long-Term Investments (cost $374,949,875) | | | | | | | | | | | | | | | 379,990,398 | |
| | | | Borrowings – (31.1)% (3), (4) | | | | | | | | | | | | | | | (92,000,000 | ) |
| | | | Other Assets Less Liabilities – 2.6% | | | | | | | | | | | | | | | 7,795,884 | |
| | | | Net Assets – 100% | | | | | | | | | | | | | | $ | 295,786,282 | |
For Fund portfolio compliance purposes, the Fund’s industry classifications refer to any one or more of the industry sub-classifications used by one or more widely recognized market indexes or ratings group indexes, and/or as defined by Fund management. This definition may not apply for purposes of this report, which may combine industry sub-classifications into sectors for reporting ease.
| (1) | All percentages shown in the Portfolio of Investments are based on net assets unless otherwise noted. |
| (2) | For financial reporting purposes, the ratings disclosed are the highest of Standard & Poor’s Group (“Standard & Poor’s”), Moody’s Investors Service, Inc. (“Moody’s”) or Fitch, Inc. (“Fitch”) rating. This treatment of split-rated securities may differ from that used for other purposes, such as for Fund investment policies. Ratings below BBB by Standard & Poor’s, Baa by Moody’s or BBB by Fitch are considered to be below investment grade. Holdings designated N/R are not rated by any of these national rating agencies. Ratings are not covered by the report of independent registered public accounting firm. |
| (3) | Borrowings as a percentage of Total Investments is 24.2%. |
| (4) | The Fund segregates 100% of its eligible investments (excluding any investments separately pledged as collateral for specific investments in derivatives, when applicable) in the Portfolio of Investments as collateral for Borrowings. |
| 144A | Investment is exempt from registration under Rule 144A of the Securities Act of 1933, as amended. These investments may only be resold in transactions exempt from registration, which are normally those transactions with qualified institutional buyers. |
| Reg S | Regulation S allows U.S. companies to sell securities to persons or entities located outside of the United States without registering those securities with the Securities and Exchange Commission. Specifically, Regulation S provides a safe harbor from the registration requirements of the Securities Act for the offers and sales of securities by both foreign and domestic issuers that are made outside the United States. |
See accompanying notes to financial statements.
JHB
| | |
Nuveen High Income November 2021 Target Term Fund | | |
Portfolio of Investments | | December 31, 2016 |
| | | | | | | | | | | | | | | | | | | | |
Principal
Amount (000) | | | Description (1) | | Coupon | | | Maturity | | | Ratings (2) | | | Value | |
| |
| | | | LONG-TERM INVESTMENTS – 131.2% (100.0% of Total Investments) | |
| |
| | | | CORPORATE BONDS – 129.7% (98.9% of Total Investments) | |
| | | | | |
| | | | Aerospace & Defense – 2.1% | | | | | | | | | | | | |
| | | | | |
| $ | 1,000 | | | Bombardier Inc., 144A | | | 8.750% | | | | 12/01/21 | | | | B | | | $ | 1,061,250 | |
| | 5,750 | | | Bombardier Inc., 144A | | | 5.750% | | | | 3/15/22 | | | | B | | | | 5,405,000 | |
| | 5,293 | | | Triumph Group Inc. | | | 4.875% | | | | 4/01/21 | | | | B1 | | | | 4,964,834 | |
| | 12,043 | | | Total Aerospace & Defense | | | | | | | | | | | | | | | 11,431,084 | |
| | | | | |
| | | | Airlines – 2.2% | | | | | | | | | | | | |
| | | | | |
| | 2,250 | | | Air Canada, 144A | | | 7.750% | | | | 4/15/21 | | | | BB– | | | | 2,514,375 | |
| | 1,000 | | | American Airlines Group Inc., 144A | | | 5.500% | | | | 10/01/19 | | | | BB– | | | | 1,032,500 | |
| | 2,250 | | | American Airlines Group Inc., 144A | | | 4.625% | | | | 3/01/20 | | | | BB– | | | | 2,278,125 | |
| | 1,500 | | | United Continental Holdings Inc. | | | 6.000% | | | | 12/01/20 | | | | BB | | | | 1,593,750 | |
| | 4,950 | | | Virgin Australia Holdings Limited, 144A | | | 7.875% | | | | 10/15/21 | | | | B3 | | | | 4,974,750 | |
| | 11,950 | | | Total Airlines | | | | | | | | | | | | | | | 12,393,500 | |
| | | | | |
| | | | Auto Components – 0.1% | | | | | | | | | | | | |
| | | | | |
| | 765 | | | Allied Specialty Vehicle Inc., 144A | | | 8.500% | | | | 11/01/19 | | | | BB– | | | | 786,038 | |
| | | | | |
| | | | Automobiles – 0.6% | | | | | | | | | | | | |
| | | | | |
| | 3,350 | | | Fiat Chrysler Automobiles NV | | | 4.500% | | | | 4/15/20 | | | | BB | | | | 3,417,000 | |
| | | | | |
| | | | Banks – 1.4% | | | | | | | | | | | | |
| | | | | |
| | 3,000 | | | CIT Group Inc. | | | 5.375% | | | | 5/15/20 | | | | BB+ | | | | 3,187,500 | |
| | 4,500 | | | Popular Inc. | | | 7.000% | | | | 7/01/19 | | | | BB– | | | | 4,640,625 | |
| | 7,500 | | | Total Banks | | | | | | | | | | | | | | | 7,828,125 | |
| | | | | |
| | | | Building Products – 0.6% | | | | | | | | | | | | |
| | | | | |
| | 3,325 | | | Taylor Morrison Monarch Communities, 144A | | | 5.250% | | | | 4/15/21 | | | | BB– | | | | 3,408,125 | |
| | | | | |
| | | | Capital Markets – 0.8% | | | | | | | | | | | | |
| | | | | |
| | 4,550 | | | KCG Holdings Inc., 144A | | | 6.875% | | | | 3/15/20 | | | | BB– | | | | 4,550,000 | |
| | | | | |
| | | | Chemicals – 2.7% | | | | | | | | | | | | |
| | | | | |
| | 1,500 | | | CF Industries Inc. | | | 7.125% | | | | 5/01/20 | | | | BB+ | | | | 1,635,000 | |
| | 3,000 | | | Hexion Inc. | | | 6.625% | | | | 4/15/20 | | | | B3 | | | | 2,655,000 | |
| | 1,375 | | | Huntsman International LLC | | | 4.875% | | | | 11/15/20 | | | | B1 | | | | 1,424,844 | |
| | 500 | | | Momentive Performance Materials Inc. | | | 3.880% | | | | 10/24/21 | | | | B | | | | 470,000 | |
| | 6,130 | | | Platform Specialty Products Corporation, 144A | | | 6.500% | | | | 2/01/22 | | | | B+ | | | | 6,175,975 | |
| | 3,000 | | | Tronox Finance LLC, 144A | | | 7.500% | | | | 3/15/22 | | | | B | | | | 2,797,500 | |
| | 15,505 | | | Total Chemicals | | | | | | | | | | | | | | | 15,158,319 | |
| | | | | |
| | | | Commercial Services & Supplies – 4.1% | | | | | | | | | | | | |
| | | | | |
| | 5,345 | | | ADT Corporation | | | 6.250% | | | | 10/15/21 | | | | Ba2 | | | | 5,799,325 | |
| | 1,500 | | | APX Group, Inc. | | | 6.375% | | | | 12/01/19 | | | | B1 | | | | 1,543,125 | |
| | 3,967 | | | APX Group, Inc. | | | 8.750% | | | | 12/01/20 | | | | CCC+ | | | | 3,996,753 | |
| | 1,500 | | | GFL Environmental Corporation, 144A | | | 7.875% | | | | 4/01/20 | | | | B– | | | | 1,573,125 | |
| | 4,645 | | | GFL Environmental Corporation, 144A | | | 9.875% | | | | 2/01/21 | | | | B– | | | | 5,109,500 | |
| | 1,794 | | | NES Rental Holdings Inc., 144A | | | 7.875% | | | | 5/01/18 | | | | B– | | | | 1,785,030 | |
| | 2,500 | | | R.R. Donnelley & Sons Company | | | 7.875% | | | | 3/15/21 | | | | B+ | | | | 2,575,000 | |
| | 500 | | | R.R. Donnelley & Sons Company | | | 7.000% | | | | 2/15/22 | | | | B+ | | | | 502,500 | |
| | 21,751 | | | Total Commercial Services & Supplies | | | | | | | | | | | | | | | 22,884,358 | |
| | | | | | | | | | | | | | | | | | | | |
Principal
Amount (000) | | | Description (1) | | Coupon | | | Maturity | | | Ratings (2) | | | Value | |
| | | | | |
| | | | Construction & Engineering – 0.5% | | | | | | | | | | | | |
| | | | | |
| $ | 1,328 | | | AECOM Global II LLC / URS FOX US LP | | | 5.000% | | | | 4/01/22 | | | | BB– | | | $ | 1,334,640 | |
| | 1,500 | | | HC2 Holdings, Inc., 144A | | | 11.000% | | | | 12/01/19 | | | | B– | | | | 1,470,000 | |
| | 2,828 | | | Total Construction & Engineering | | | | | | | | | | | | | | | 2,804,640 | |
| | | | | |
| | | | Construction Materials – 0.6% | | | | | | | | | | | | |
| | | | | |
| | 3,000 | | | Cemex SAB de CV, 144A | | | 7.250% | | | | 1/15/21 | | | | BB– | | | | 3,195,000 | |
| | | | | |
| | | | Consumer Finance – 5.3% | | | | | | | | | | | | |
| | | | | |
| | 3,500 | | | Ally Financial Inc. | | | 4.125% | | | | 2/13/22 | | | | BB+ | | | | 3,469,375 | |
| | 3,000 | | | Constellis Holdings LLC / Constellis Finance Corporation, 144A | | | 9.750% | | | | 5/15/20 | | | | B | | | | 3,075,000 | |
| | 7,352 | | | Credit Acceptance Corporation | | | 6.125% | | | | 2/15/21 | | | | BB | | | | 7,425,519 | |
| | 1,000 | | | Enova International, Inc. | | | 9.750% | | | | 6/01/21 | | | | B– | | | | 997,500 | |
| | 2,000 | | | Navient Corporation | | | 6.625% | | | | 7/26/21 | | | | BB | | | | 2,115,000 | |
| | 7,568 | | | OneMain Financial Holdings, Inc., 144A | | | 7.250% | | | | 12/15/21 | | | | B | | | | 7,889,639 | |
| | 4,000 | | | SLM Corporation | | | 7.250% | | | | 1/25/22 | | | | BB | | | | 4,235,000 | |
| | 28,420 | | | Total Consumer Finance | | | | | | | | | | | | | | | 29,207,033 | |
| | | | | |
| | | | Containers & Packaging – 2.4% | | | | | | | | | | | | |
| | | | | |
| | 2,000 | | | Ardagh Packaging Finance / MP HD USA, 144A | | | 6.750% | | | | 1/31/21 | | | | B3 | | | | 2,060,000 | |
| | 3,650 | | | Ardagh Packaging Finance PLC and Ardagh MP Holdings USA, Inc., 144A | | | 6.000% | | | | 6/30/21 | | | | B3 | | | | 3,713,875 | |
| | 4,450 | | | Coveris Holdings SA, 144A | | | 7.875% | | | | 11/01/19 | | | | B– | | | | 4,416,625 | |
| | 3,235 | | | Owens-Brockway Glass Containers, 144A | | | 5.000% | | | | 1/15/22 | | | | BB– | | | | 3,307,788 | |
| | 13,335 | | | Total Containers & Packaging | | | | | | | | | | | | | | | 13,498,288 | |
| | | | | |
| | | | Diversified Financial Services – 4.3% | | | | | | | | | | | | |
| | | | | |
| | 4,875 | | | Fly Leasing Limited | | | 6.375% | | | | 10/15/21 | | | | BB– | | | | 5,070,000 | |
| | 4,500 | | | Jefferies Finance LLC Corporation, 144A | | | 7.500% | | | | 4/15/21 | | | | B1 | | | | 4,455,000 | |
| | 2,500 | | | Lincoln Finance LTD, 144A | | | 7.375% | | | | 4/15/21 | | | | BB+ | | | | 2,662,500 | |
| | 5,527 | | | Nationstar Mortgage LLC Capital Corporation | | | 6.500% | | | | 7/01/21 | | | | B+ | | | | 5,596,088 | |
| | 4,000 | | | NewStar Financial, Inc. | | | 7.250% | | | | 5/01/20 | | | | BB– | | | | 3,980,000 | |
| | 2,157 | | | PHH Corporation | | | 6.375% | | | | 8/15/21 | | | | B1 | | | | 2,157,000 | |
| | 23,559 | | | Total Diversified Financial Services | | | | | | | | | | | | | | | 23,920,588 | |
| | | | | |
| | | | Diversified Telecommunication Services – 4.2% | | | | | | | | | | | | |
| | | | | |
| | 9,000 | | | CenturyLink Inc. | | | 5.800% | | | | 3/15/22 | | | | BB+ | | | | 9,199,165 | |
| | 1,500 | | | Frontier Communications Corporation | | | 9.250% | | | | 7/01/21 | | | | BB | | | | 1,575,000 | |
| | 6,750 | | | Frontier Communications Corporation | | �� | 8.750% | | | | 4/15/22 | | | | BB | | | | 6,682,500 | |
| | 5,450 | | | Windstream Corporation | | | 7.750% | | | | 10/01/21 | | | | BB– | | | | 5,602,600 | |
| | 22,700 | | | Total Diversified Telecommunication Services | | | | | | | | | | | | | | | 23,059,265 | |
| | | | | |
| | | | Electric Utilities – 0.7% | | | | | | | | | | | | |
| | | | | |
| | 4,000 | | | RJS Power Holdings LLC, 144A | | | 4.625% | | | | 7/15/19 | | | | B+ | | | | 3,790,000 | |
| | | | | |
| | | | Electronic Equipment, Instruments & Components – 0.8% | | | | | | | | | | | | |
| | | | | |
| | 4,000 | | | Anixter Inc. | | | 5.125% | | | | 10/01/21 | | | | BB+ | | | | 4,160,000 | |
| | | | | |
| | | | Energy Equipment & Services – 0.9% | | | | | | | | | | | | |
| | | | | |
| | 1,987 | | | Precision Drilling Corporation | | | 6.625% | | | | 11/15/20 | | | | BB | | | | 2,016,657 | |
| | 3,000 | | | SESI, LLC | | | 7.125% | | | | 12/15/21 | | | | BB– | | | | 3,052,500 | |
| | 4,987 | | | Total Energy Equipment & Services | | | | | | | | | | | | | | | 5,069,157 | |
| | | | | |
| | | | Equity Real Estate Investment Trusts – 3.6% | | | | | | | | | | | | |
| | | | | |
| | 3,898 | | | CoreCivic, Inc. | | | 4.125% | | | | 4/01/20 | | | | Ba1 | | | | 3,888,255 | |
| | 3,604 | | | Geo Group Inc. | | | 5.875% | | | | 1/15/22 | | | | BB– | | | | 3,649,050 | |
| | 2,500 | | | Iron Mountain Inc., 144A | | | 4.375% | | | | 6/01/21 | | | | BB– | | | | 2,556,250 | |
| | 5,540 | | | iStar Inc. | | | 6.500% | | | | 7/01/21 | | | | B+ | | | | 5,706,200 | |
| | 3,847 | | | Realogy Group LLC / Realogy Co-Issuer Corporation, 144A | | | 5.250% | | | | 12/01/21 | | | | B+ | | | | 3,943,175 | |
| | 19,389 | | | Total Equity Real Estate Investment Trusts | | | | | | | | | | | | | | | 19,742,930 | |
| | | | |
| JHB | | Nuveen High Income November 2021 Target Term Fund | | |
| | Portfolio of Investments (continued) | | December 31, 2016 |
| | | | | | | | | | | | | | | | | | | | |
Principal
Amount (000) | | | Description (1) | | Coupon | | | Maturity | | | Ratings (2) | | | Value | |
| | | | | |
| | | | Food & Staples Retailing – 0.9% | | | | | | | | | | | | |
| | | | | |
| $ | 5,000 | | | Supervalu Inc. | | | 6.750% | | | | 6/01/21 | | | | B | | | $ | 5,050,000 | |
| | | | | |
| | | | Gas Utilities – 0.7% | | | | | | | | | | | | |
| | | | | |
| | 4,100 | | | Ferrellgas LP | | | 6.750% | | | | 1/15/22 | | | | B | | | | 4,059,000 | |
| | | | | |
| | | | Health Care Equipment & Supplies – 1.7% | | | | | | | | | | | | |
| | | | | |
| | 1,550 | | | Tenet Healthcare Corporation, 144A | | | 7.500% | | | | 1/01/22 | | | | Ba3 | | | | 1,615,875 | |
| | 5,030 | | | Tenet Healthcare Corporation | | | 4.375% | | | | 10/01/21 | | | | BB– | | | | 4,954,550 | |
| | 3,000 | | | Tenet Healthcare Corporation | | | 8.125% | | | | 4/01/22 | | | | B– | | | | 2,830,500 | |
| | 9,580 | | | Total Health Care Equipment & Supplies | | | | | | | | | | | | | | | 9,400,925 | |
| | | | | |
| | | | Health Care Providers & Services – 5.6% | | | | | | | | | | | | |
| | | | | |
| | 1,650 | | | Acadia Healthcare | | | 6.125% | | | | 3/15/21 | | | | B | | | | 1,701,563 | |
| | 500 | | | Community Health Systems, Inc. | | | 7.125% | | | | 7/15/20 | | | | B | | | | 380,150 | |
| | 7,000 | | | Community Health Systems, Inc. | | | 5.125% | | | | 8/01/21 | | | | BB– | | | | 6,492,500 | |
| | 7,000 | | | HCA Inc. | | | 7.500% | | | | 2/15/22 | | | | BB | | | | 7,944,999 | |
| | 6,509 | | | Kindred Healthcare Inc. | | | 6.375% | | | | 4/15/22 | | | | B– | | | | 5,809,283 | |
| | 3,886 | | | Lifepoint Health Inc. | | | 5.500% | | | | 12/01/21 | | | | Ba2 | | | | 4,041,440 | |
| | 4,500 | | | Select Medical Corporation | | | 6.375% | | | | 6/01/21 | | | | B– | | | | 4,500,000 | |
| | 31,045 | | | Total Health Care Providers & Services | | | | | | | | | | | | | | | 30,869,935 | |
| | | | | |
| | | | Hotels, Restaurants & Leisure – 7.0% | | | | | | | | | | | | |
| | | | | |
| | 4,075 | | | 1011778 BC ULC/New Red Finance Inc., 144A | | | 6.000% | | | | 4/01/22 | | | | B– | | | | 4,258,375 | |
| | 1,330 | | | Caesars Entertainment Resort Properties LLC | | | 8.000% | | | | 10/01/20 | | | | B+ | | | | 1,393,175 | |
| | 6,000 | | | International Game Technology PLC, 144A | | | 6.250% | | | | 2/15/22 | | | | BB+ | | | | 6,435,000 | |
| | 5,000 | | | MGM Resorts International Inc. | | | 6.625% | | | | 12/15/21 | | | | BB | | | | 5,587,500 | |
| | 3,000 | | | Norwegian Cruise Lines, 144A | | | 4.750% | | | | 12/15/21 | | | | BB | | | | 2,998,140 | |
| | 2,850 | | | Penn National Gaming Inc. | | | 5.875% | | | | 11/01/21 | | | | B+ | | | | 2,971,125 | |
| | 6,005 | | | Scientific Games Corporation, 144A | | | 7.000% | | | | 1/01/22 | | | | Ba3 | | | | 6,440,363 | |
| | 2,750 | | | Studio City Co Ltd, 144A | | | 7.250% | | | | 11/30/21 | | | | BB– | | | | 2,846,250 | |
| | 650 | | | Wynn Las Vegas LLC Corporation | | | 5.375% | | | | 3/15/22 | | | | BB | | | | 665,438 | |
| | 5,000 | | | Wynn Macau Limited, 144A | | | 5.250% | | | | 10/15/21 | | | | Ba3 | | | | 5,037,500 | |
| | 36,660 | | | Total Hotels, Restaurants & Leisure | | | | | | | | | | | | | | | 38,632,866 | |
| | | | | |
| | | | Household Durables – 4.4% | | | | | | | | | | | | |
| | | | | |
| | 6,000 | | | Beazer Homes USA, Inc., 144A | | | 8.750% | | | | 3/15/22 | | | | B– | | | | 6,480,000 | |
| | 3,510 | | | Brookfield Residential Properties Inc., 144A | | | 6.500% | | | | 12/15/20 | | | | B+ | | | | 3,588,975 | |
| | 1,150 | | | CalAtlantic Group Inc. | | | 6.250% | | | | 12/15/21 | | | | BB | | | | 1,239,125 | |
| | 3,960 | | | KB Home | | | 7.000% | | | | 12/15/21 | | | | B+ | | | | 4,177,800 | |
| | 2,500 | | | Lennar Corporation | | | 4.750% | | | | 4/01/21 | | | | Ba1 | | | | 2,581,250 | |
| | 3,045 | | | Meritage Homes Corporation | | | 7.000% | | | | 4/01/22 | | | | Ba2 | | | | 3,296,213 | |
| | 2,700 | | | M-I Homes Inc. | | | 6.750% | | | | 1/15/21 | | | | BB– | | | | 2,814,750 | |
| | 22,865 | | | Total Household Durables | | | | | | | | | | | | | | | 24,178,113 | |
| | | | | |
| | | | Household Products – 1.0% | | | | | | | | | | | | |
| | | | | |
| | 5,500 | | | HRG Group, Inc. | | | 7.750% | | | | 1/15/22 | | | | B | | | | 5,733,750 | |
| | | | | |
| | | | Independent Power & Renewable Electricity Producers – 3.2% | | | | | | | | | | | | |
| | | | | |
| | 3,300 | | | Atlantica Yield PLC, 144A | | | 7.000% | | | | 11/15/19 | | | | B+ | | | | 3,366,000 | |
| | 6,750 | | | DPL, Inc. | | | 7.250% | | | | 10/15/21 | | | | BB | | | | 6,885,000 | |
| | 7,250 | | | Dynegy Inc. | | | 6.750% | | | | 11/01/19 | | | | B+ | | | | 7,376,875 | |
| | 17,300 | | | Total Independent Power & Renewable Electricity Producers | | | | | | | | | | | | | | | 17,627,875 | |
| | | | | |
| | | | Industrial Conglomerates – 1.3% | | | | | | | | | | | | |
| | | | | |
| | 7,000 | | | Icahn Enterprises Finance | | | 5.875% | | | | 2/01/22 | | | | BB+ | | | | 6,947,500 | |
| | | | | |
| | | | Insurance – 0.8% | | | | | | | | | | | | |
| | | | | |
| | 4,897 | | | Genworth Financial Inc. | | | 7.625% | | | | 9/24/21 | | | | Ba3 | | | | 4,517,483 | |
| | | | | | | | | | | | | | | | | | | | |
Principal
Amount (000) | | | Description (1) | | Coupon | | | Maturity | | | Ratings (2) | | | Value | |
| | | | | |
| | | | Internet & Direct Marketing Retail – 0.8% | | | | | | | | | | | | |
| | | | | |
| $ | 4,230 | | | Netflix Incorporated | | | 5.500% | | | | 2/15/22 | | | | B+ | | | $ | 4,557,825 | |
| | | | | |
| | | | Internet Software & Services – 1.3% | | | | | | | | | | | | |
| | | | | |
| | 3,617 | | | Cimpress NV, 144A | | | 7.000% | | | | 4/01/22 | | | | Ba3 | | | | 3,689,340 | |
| | 3,491 | | | Earthlink Inc. | | | 7.375% | | | | 6/01/20 | | | | Ba3 | | | | 3,683,005 | |
| | 7,108 | | | Total Internet Software & Services | | | | | | | | | | | | | | | 7,372,345 | |
| | | | | |
| | | | IT Services – 0.8% | | | | | | | | | | | | |
| | | | | |
| | 4,500 | | | Alliance Data Systems Corporation, 144A | | | 5.875% | | | | 11/01/21 | | | | N/R | | | | 4,567,500 | |
| | | | | |
| | | | Machinery – 2.2% | | | | | | | | | | | | |
| | | | | |
| | 1,000 | | | CNH Industrial Capital LLC | | | 4.875% | | | | 4/01/21 | | | | Ba1 | | | | 1,040,000 | |
| | 1,500 | | | CNH Industrial Capital LLC | | | 3.875% | | | | 10/15/21 | | | | Ba1 | | | | 1,475,625 | |
| | 1,000 | | | Joy Global, Inc. | | | 5.125% | | | | 10/15/21 | | | | BB+ | | | | 1,086,833 | |
| | 3,000 | | | Navistar International Corporation | | | 8.250% | | | | 11/01/21 | | | | Caa1 | | | | 3,030,000 | |
| | 5,448 | | | Terex Corporation | | | 6.000% | | | | 5/15/21 | | | | BB | | | | 5,570,580 | |
| | 11,948 | | | Total Machinery | | | | | | | | | | | | | | | 12,203,038 | |
| | | | | |
| | | | Media – 11.5% | | | | | | | | | | | | |
| | | | | |
| | 3,379 | | | AMC Entertainment Inc. | | | 5.875% | | | | 2/15/22 | | | | B+ | | | | 3,535,279 | |
| | 2,500 | | | Cablevision Systems Corporation | | | 8.000% | | | | 4/15/20 | | | | B3 | | | | 2,743,750 | |
| | 5,325 | | | Cequel Communication Holdings I, 144A | | | 5.125% | | | | 12/15/21 | | | | B– | | | | 5,418,188 | |
| | 6,580 | | | Clear Channel International BV, 144A | | | 8.750% | | | | 12/15/20 | | | | BB– | | | | 6,925,450 | |
| | 5,000 | | | CSC Holdings Inc. | | | 6.750% | | | | 11/15/21 | | | | B+ | | | | 5,375,000 | |
| | 6,500 | | | Dish DBS Corporation | | | 6.750% | | | | 6/01/21 | | | | Ba3 | | | | 7,052,500 | |
| | 4,250 | | | Lee Enterprises Inc., 144A | | | 9.500% | | | | 3/15/22 | | | | B2 | | | | 4,505,000 | |
| | 5,000 | | | Nexstar Broadcasting Inc., 144A | | | 6.125% | | | | 2/15/22 | | | | B+ | | | | 5,175,000 | |
| | 6,425 | | | Radio One Inc., 144A | | | 7.375% | | | | 4/15/22 | | | | B | | | | 6,360,750 | |
| | 3,200 | | | Regal Entertainment Group | | | 5.750% | | | | 3/15/22 | | | | B+ | | | | 3,352,000 | |
| | 8,000 | | | Time Inc., 144A | | | 5.750% | | | | 4/15/22 | | | | B | | | | 8,279,999 | |
| | 4,585 | | | WMG Acquisition Group, 144A | | | 6.750% | | | | 4/15/22 | | | | B– | | | | 4,825,713 | |
| | 60,744 | | | Total Media | | | | | | | | | | | | | | | 63,548,629 | |
| | | | | |
| | | | Metals & Mining – 16.2% | | | | | | | | | | | | |
| | | | | |
| | 1,500 | | | AK Steel Corporation | | | 7.625% | | | | 5/15/20 | | | | B– | | | | 1,530,000 | |
| | 5,050 | | | AK Steel Corporation | | | 7.625% | | | | 10/01/21 | | | | B– | | | | 5,435,063 | |
| | 3,500 | | | Alcoa Inc. | | | 5.870% | | | | 2/23/22 | | | | BBB– | | | | 3,745,000 | |
| | 5,000 | | | Aleris International Inc., 144A | | | 9.500% | | | | 4/01/21 | | | | B | | | | 5,362,500 | |
| | 5,340 | | | Allegheny Technologies Inc. | | | 5.950% | | | | 1/15/21 | | | | B | | | | 5,166,450 | |
| | 2,500 | | | Anglo American Capital PLC, 144A | | | 4.125% | | | | 4/15/21 | | | | BB+ | | | | 2,543,750 | |
| | 2,000 | | | Anglo American PLC, 144A | | | 3.625% | | | | 5/14/20 | | | | BB+ | | | | 2,022,400 | |
| | 2,500 | | | ArcelorMittal | | | 7.250% | | | | 2/25/22 | | | | BB+ | | | | 2,818,750 | |
| | 2,970 | | | BlueScope Steel Limited Finance, 144A | | | 6.500% | | | | 5/15/21 | | | | BB+ | | | | 3,147,012 | |
| | 4,250 | | | Cliffs Natural Resources Inc., 144A | | | 8.250% | | | | 3/31/20 | | | | B | | | | 4,653,750 | |
| | 1,000 | | | Cliffs Natural Resources Inc. | | | 4.875% | | | | 4/01/21 | | | | Caa2 | | | | 930,000 | |
| | 5,645 | | | Constellium N.V, 144A | | | 7.875% | | | | 4/01/21 | | | | B+ | | | | 6,068,375 | |
| | 5,405 | | | Eldorado Gold Corporation, 144A | | | 6.125% | | | | 12/15/20 | | | | BB– | | | | 5,486,075 | |
| | 3,000 | | | First Quantum Minerals Limited, 144A | | | 6.750% | | | | 2/15/20 | | | | B | | | | 2,992,500 | |
| | 2,350 | | | First Quantum Minerals Limited, 144A | | | 7.000% | | | | 2/15/21 | | | | B | | | | 2,337,310 | |
| | 4,000 | | | FMG Resources, 144A | | | 9.750% | | | | 3/01/22 | | | | BBB– | | | | 4,640,280 | |
| | 2,000 | | | Freeport McMoRan, Inc., 144A | | | 6.750% | | | | 2/01/22 | | | | BBB– | | | | 2,055,000 | |
| | 1,665 | | | Freeport McMoRan, Inc. | | | 3.550% | | | | 3/01/22 | | | | BBB– | | | | 1,548,450 | |
| | 1,500 | | | Glencore Finance Canada, 144A | | | 4.950% | | | | 11/15/21 | | | | BBB– | | | | 1,605,000 | |
| | 4,000 | | | Gold Fields Orogen Holdings BVI Limited, 144A | | | 4.875% | | | | 10/07/20 | | | | BB+ | | | | 3,932,000 | |
| | 4,700 | | | IAMGOLD Corporation, 144A | | | 6.750% | | | | 10/01/20 | | | | B+ | | | | 4,582,500 | |
| | 2,500 | | | Lundin Mining Corporation, 144A | | | 7.500% | | | | 11/01/20 | | | | BB– | | | | 2,659,375 | |
| | 4,000 | | | Teck Resources Limited | | | 4.750% | | | | 1/15/22 | | | | BB | | | | 4,010,000 | |
| | 6,700 | | | United States Steel Corporation, 144A | | | 8.375% | | | | 7/01/21 | | | | BB | | | | 7,407,051 | |
| | 3,000 | | | Vale Overseas Limited | | | 4.375% | | | | 1/11/22 | | | | BBB | | | | 2,947,500 | |
| | 86,075 | | | Total Metals & Mining | | | | | | | | | | | | | | | 89,626,091 | |
| | | | |
| JHB | | Nuveen High Income November 2021 Target Term Fund | | |
| | Portfolio of Investments (continued) | | December 31, 2016 |
| | | | | | | | | | | | | | | | | | | | |
Principal
Amount (000) | | | Description (1) | | Coupon | | | Maturity | | | Ratings (2) | | | Value | |
| | | | | |
| | | | Mortgage Real Estate Investment Trusts – 0.6% | | | | | | | | | | | | |
| | | | | |
| $ | 3,500 | | | Starwood Property Trust, 144A | | | 5.000% | | | | 12/15/21 | | | | BB– | | | $ | 3,546,900 | |
| | | | | |
| | | | Multiline Retail – 1.2% | | | | | | | | | | | | |
| | | | | |
| | 6,918 | | | J.C. Penney Corporation Inc. | | | 5.650% | | | | 6/01/20 | | | | B+ | | | | 6,822,878 | |
| | | | | |
| | | | Oil, Gas & Consumable Fuels – 10.7% | | | | | | | | | | | | |
| | | | | |
| | 4,000 | | | Antero Resources Corporation | | | 5.375% | | | | 11/01/21 | | | | BB | | | | 4,090,000 | |
| | 7,000 | | | CONSOL Energy Inc. | | | 5.875% | | | | 4/15/22 | | | | B | | | | 6,860,000 | |
| | 2,500 | | | Crestwood Midstream Partners LP | | | 6.125% | | | | 3/01/22 | | | | BB– | | | | 2,562,500 | |
| | 1,000 | | | DCP Midstream LLC, 144A | | | 4.750% | | | | 9/30/21 | | | | BB+ | | | | 1,012,500 | |
| | 5,000 | | | Genesis Energy LP | | | 5.750% | | | | 2/15/21 | | | | B+ | | | | 5,050,000 | |
| | 2,910 | | | Martin Mid-Stream Partners LP Finance | | | 7.250% | | | | 2/15/21 | | | | B– | | | | 2,873,625 | |
| | 2,300 | | | NGL Energy Partners LP/Fin Co | | | 6.875% | | | | 10/15/21 | | | | BB– | | | | 2,351,750 | |
| | 3,504 | | | Oasis Petroleum Inc. | | | 6.875% | | | | 3/15/22 | | | | B+ | | | | 3,591,600 | |
| | 2,000 | | | Petrobras Global Finance BV | | | 8.375% | | | | 5/23/21 | | | | BB | | | | 2,155,000 | |
| | 3,000 | | | Petrobras International Finance Company | | | 5.375% | | | | 1/27/21 | | | | BB | | | | 2,934,000 | |
| | 1,450 | | | Range Resources Corporation, 144A | | | 5.750% | | | | 6/01/21 | | | | BB+ | | | | 1,518,875 | |
| | 4,059 | | | Sabine Pass Liquefaction LLC | | | 6.250% | | | | 3/15/22 | | | | BBB– | | | | 4,444,605 | |
| | 4,000 | | | Southwestern Energy Company | | | 4.100% | | | | 3/15/22 | | | | BB | | | | 3,779,200 | |
| | 2,500 | | | Sunoco LP / Sunoco Finance Corp. | | | 6.250% | | | | 4/15/21 | | | | BB– | | | | 2,546,875 | |
| | 1,500 | | | Transocean Inc. | | | 8.125% | | | | 12/15/21 | | | | BB– | | | | 1,500,000 | |
| | 3,000 | | | Western Refining Inc. | | | 6.250% | | | | 4/01/21 | | | | B | | | | 3,112,500 | |
| | 2,750 | | | Whiting Petroleum Corporation | | | 5.750% | | | | 3/15/21 | | | | BB– | | | | 2,738,560 | |
| | 500 | | | Williams Partners LP | | | 3.600% | | | | 3/15/22 | | | | BBB– | | | | 502,155 | |
| | 2,500 | | | WPX Energy Inc. | | | 6.000% | | | | 1/15/22 | | | | B | | | | 2,562,500 | |
| | 3,000 | | | YPF Sociedad Anonima, 144A | | | 8.500% | | | | 3/23/21 | | | | B | | | | 3,217,800 | |
| | 58,473 | | | Total Oil, Gas & Consumable Fuels | | | | | | | | | | | | | | | 59,404,045 | |
| | | | | |
| | | | Pharmaceuticals – 1.4% | | | | | | | | | | | | |
| | | | | |
| | 5,500 | | | Endo Finance LLC, 144A | | | 5.750% | | | | 1/15/22 | | | | B | | | | 4,895,000 | |
| | 3,801 | | | Valeant Pharmaceuticals International, 144A | | | 5.625% | | | | 12/01/21 | | | | B– | | | | 2,945,775 | |
| | 9,301 | | | Total Pharmaceuticals | | | | | | | | | | | | | | | 7,840,775 | |
| | | | | |
| | | | Professional Services – 0.6% | | | | | | | | | | | | |
| | | | | |
| | 3,000 | | | Nielsen Finance LLC Co, 144A | | | 5.000% | | | | 4/15/22 | | | | BB+ | | | | 3,052,500 | |
| | | | | |
| | | | Real Estate Management & Development – 3.1% | | | | | | | | | | | | |
| | | | | |
| | 4,750 | | | Crescent Communities LLC, 144A | | | 8.875% | | | | 10/15/21 | | | | B+ | | | | 4,785,625 | |
| | 5,200 | | | Hunt Companies Inc., 144A | | | 9.625% | | | | 3/01/21 | | | | N/R | | | | 5,427,500 | |
| | 7,000 | | | Mattamy Group Corporation, 144A | | | 6.500% | | | | 11/15/20 | | | | BB | | | | 7,105,000 | |
| | 16,950 | | | Total Real Estate Management & Development | | | | | | | | | | | | | | | 17,318,125 | |
| | | | | |
| | | | Road & Rail – 0.4% | | | | | | | | | | | | |
| | | | | |
| | 2,000 | | | Hertz Corporation | | | 7.375% | | | | 1/15/21 | | | | B | | | | 2,005,000 | |
| | | | | |
| | | | Semiconductors & Semiconductor Equipment – 1.0% | | | | | | | | | | | | |
| | | | | |
| | 5,000 | | | Micron Technology, Inc. | | | 5.875% | | | | 2/15/22 | | | | BB | | | | 5,212,500 | |
| | | | | |
| | | | Software – 0.9% | | | | | | | | | | | | |
| | | | | |
| | 5,500 | | | SixSigma Networks Mexico SA de CV, 144A | | | 8.250% | | | | 11/07/21 | | | | B+ | | | | 5,170,000 | |
| | | | | |
| | | | Specialty Retail – 1.8% | | | | | | | | | | | | |
| | | | | |
| | 6,335 | | | GameStop Corporation, 144A | | | 6.750% | | | | 3/15/21 | | | | BB+ | | | | 6,382,513 | |
| | 3,500 | | | Gap, Inc. | | | 5.950% | | | | 4/12/21 | | | | Baa2 | | | | 3,680,226 | |
| | 9,835 | | | Total Specialty Retail | | | | | | | | | | | | | | | 10,062,739 | |
| | | | | | | | | | | | | | | | | | | | |
Principal
Amount (000) | | | Description (1) | | Coupon | | | Maturity | | | Ratings (2) | | | Value | |
| | | | | |
| | | | Technology Hardware, Storage & Peripherals – 1.6% | | | | | | | | | | | | |
| | | | | |
| $ | 6,000 | | | Diamond 1 Finance Corporation / Diamond 2 Finance Corporation, 144A | | | 5.875% | | | | 6/15/21 | | | | BB+ | | | $ | 6,381,672 | |
| | 2,100 | | | NCR Corporation | | | 5.875% | | | | 12/15/21 | | | | BB | | | | 2,199,750 | |
| | 8,100 | | | Total Technology Hardware, Storage & Peripherals | | | | | | | | | | | | | | | 8,581,422 | |
| | | | | |
| | | | Thrifts & Mortgage Finance – 0.3% | | | | | | | | | | | | |
| | | | | |
| | 1,500 | | | Radian Group Inc. | | | 7.000% | | | | 3/15/21 | | | | BB | | | | 1,668,750 | |
| | | | | |
| | | | Trading Companies & Distributors – 1.6% | | | | | | | | | | | | |
| | | | | |
| | 3,328 | | | Aircastle Limited | | | 5.500% | | | | 2/15/22 | | | | BB+ | | | | 3,527,680 | |
| | 5,500 | | | Avation Capital SA, 144A | | | 7.500% | | | | 5/27/20 | | | | B+ | | | | 5,445,000 | |
| | 8,828 | | | Total Trading Companies & Distributors | | | | | | | | | | | | | | | 8,972,680 | |
| | | | | |
| | | | Wireless Telecommunication Services – 7.2% | | | | | | | | | | | | |
| | | | | |
| | 4,000 | | | Altice Financing SA, 144A | | | 6.500% | | | | 1/15/22 | | | | BB– | | | | 4,170,000 | |
| | 4,000 | | | Digicel Limited, 144A | | | 6.000% | | | | 4/15/21 | | | | B1 | | | | 3,616,840 | |
| | 6,675 | | | Hughes Satellite Systems Corporation | | | 7.625% | | | | 6/15/21 | | | | BB– | | | | 7,325,813 | |
| | 3,500 | | | Millicom International Cellular SA, 144A | | | 6.625% | | | | 10/15/21 | | | | BB+ | | | | 3,687,950 | |
| | 3,500 | | | Softbank Corporation, 144A | | | 4.500% | | | | 4/15/20 | | | | BB+ | | | | 3,587,500 | |
| | 3,000 | | | Sprint Communications Inc., 144A | | | 7.000% | | | | 3/01/20 | | | | BB | | | | 3,255,000 | |
| | 5,000 | | | Sprint Corporation | | | 7.250% | | | | 9/15/21 | | | | B+ | | | | 5,312,500 | |
| | 2,440 | | | Wind Acquisition Finance SA, 144A | | | 4.750% | | | | 7/15/20 | | | | BB | | | | 2,458,300 | |
| | 6,040 | | | Wind Acquisition Finance SA, 144A | | | 7.375% | | | | 4/23/21 | | | | B | | | | 6,281,600 | |
| | 38,155 | | | Total Wireless Telecommunication Services | | | | | | | | | | | | | | | 39,695,503 | |
| $ | 702,569 | | | Total Corporate Bonds (cost $714,919,566) | | | | | | | | | | | | | | | 718,550,142 | |
| | | | | |
Principal
Amount (000) | | | Description (1) | | Coupon | | | Maturity | | | Ratings (2) | | | Value | |
| |
| | | | CONVERTIBLE BONDS – 0.9% (0.7% of Total Investments) | |
| |
| | | | Independent Power & Renewable Electricity Producers – 0.7% | |
| | | | | |
| $ | 4,000 | | | NRG Yield Inc., 144A | | | 3.250% | | | | 6/01/20 | | | | N/R | | | $ | 3,840,000 | |
| | | | | |
| | | | Machinery – 0.2% | | | | | | | | | | | | |
| | | | | |
| | 1,000 | | | Navistar International Corporation | | | 4.750% | | | | 4/15/19 | | | | CCC– | | | | 987,500 | |
| $ | 5,000 | | | Total Convertible Bonds (cost $4,839,998) | | | | | | | | | | | | | | | 4,827,500 | |
| | | | | |
Principal
Amount (000) | | | Description (1) | | Coupon | | | Maturity | | | Ratings (2) | | | Value | |
| |
| | | | SOVEREIGN DEBT – 0.6% (0.4% of Total Investments) | |
| | | | | |
| | | | Argentina – 0.6% | | | | | | | | | | | | |
| | | | | |
| $ | 3,000 | | | Republic of Argentina, 144A | | | 6.875% | | | | 4/22/21 | | | | B | | | $ | 3,195,000 | |
| | | | Total Sovereign Debt (cost $3,267,471) | | | | 3,195,000 | |
| | | | Total Long-Term Investments (cost $723,027,035) | | | | | | | | | | | | | | | 726,572,642 | |
| | | | Borrowings – (34.3)% (3), (4) | | | | | | | | | | | | | | | (190,000,000 | ) |
| | | | Other Assets Less Liabilities – 3.1% | | | | | | | | | | | | | | | 17,338,979 | |
| | | | Net Assets – 100% | | | | | | | | | | | | | | $ | 553,911,621 | |
| | | | |
| JHB | | Nuveen High Income November 2021 Target Term Fund | | |
| | Portfolio of Investments (continued) | | December 31, 2016 |
For Fund portfolio compliance purposes, the Fund’s industry classifications refer to any one or more of the industry sub-classifications used by one or more widely recognized market indexes or ratings group indexes, and/or as defined by Fund management. This definition may not apply for purposes of this report, which may combine industry sub-classifications into sectors for reporting ease.
| (1) | All percentages shown in the Portfolio of Investments are based on net assets unless otherwise noted. |
| (2) | For financial reporting purposes, the ratings disclosed are the highest of Standard & Poor’s Group (“Standard & Poor’s”), Moody’s Investors Service, Inc. (“Moody’s”) or Fitch, Inc. (“Fitch”) rating. This treatment of split-rated securities may differ from that used for other purposes, such as for Fund investment policies. Ratings below BBB by Standard & Poor’s, Baa by Moody’s or BBB by Fitch are considered to be below investment grade. Holdings designated N/R are not rated by any of these national rating agencies. Ratings are not covered by the report of independent registered public accounting firm. |
| (3) | Borrowings as a percentage of Total Investments is 26.2%. |
| (4) | The Fund segregates 100% of its eligible investments (excluding any investments separately pledged as collateral for specific investments in derivatives, when applicable) in the Portfolio of Investments as collateral for Borrowings. |
| 144A | Investment is exempt from registration under Rule 144A of the Securities Act of 1933, as amended. These investments may only be resold in transactions exempt from registration, which are normally those transactions with qualified institutional buyers. |
See accompanying notes to financial statements.
| | | | | | |
Statement of Assets and Liabilities | | December 31, 2016 |
| | | | | | | | | | | | | | | | |
| | | JHY | | | JHD | | | JHA | | | JHB | |
Assets | | | | | | | | | | | | | | | | |
Long-term investments, at value (cost $170,394,474, $353,596,760, $374,949,875 and $723,027,035, respectively) | | $ | 171,365,702 | | | $ | 359,219,879 | | | $ | 379,990,398 | | | $ | 726,572,642 | |
Short-term investments, at value (cost approximates value) | | | 1,867,136 | | | | 899,756 | | | | — | | | | — | |
Cash | | | — | | | | — | | | | 2,299,150 | | | | 6,297,247 | |
Receivable for: | | | | | | | | | | | | | | | | |
Interest | | | 2,913,019 | | | | 4,888,322 | | | | 5,863,220 | | | | 11,646,781 | |
Investments sold | | | 1,545,000 | | | | — | | | | — | | | | — | |
Other assets | | | 1,200 | | | | 41,237 | | | | 5,329 | | | | 921 | |
Total assets | | | 177,692,057 | | | | 365,049,194 | | | | 388,158,097 | | | | 744,517,591 | |
Liabilities | | | | | | | | | | | | | | | | |
Borrowings | | | 44,000,000 | | | | 90,000,000 | | | | 92,000,000 | | | | 190,000,000 | |
Accrued expenses: | | | | | | | | | | | | | | | | |
Interest on borrowings | | | 3,380 | | | | 7,100 | | | | 67,467 | | | | 34,915 | |
Management fees | | | 99,146 | | | | 204,010 | | | | 217,178 | | | | 412,646 | |
Trustees fees | | | 1,002 | | | | 1,981 | | | | 5,662 | | | | 5,162 | |
Other | | | 67,107 | | | | 80,541 | | | | 81,508 | | | | 153,247 | |
Total liabilities | | | 44,170,635 | | | | 90,293,632 | | | | 92,371,815 | | | | 190,605,970 | |
Net assets | | $ | 133,521,422 | | | $ | 274,755,562 | | | $ | 295,786,282 | | | $ | 553,911,621 | |
Shares outstanding | | | 13,697,468 | | | | 27,060,083 | | | | 29,329,648 | | | | 55,854,637 | |
Net asset value (“NAV”) per share outstanding | | $ | 9.75 | | | $ | 10.15 | | | $ | 10.08 | | | $ | 9.92 | |
Net assets consist of: | | | | | | | | | | | | | | | | |
Shares, $.01 par value per share | | $ | 136,975 | | | $ | 270,601 | | | $ | 293,296 | | | $ | 558,546 | |
Paid-in surplus | | | 134,381,784 | | | | 266,003,633 | | | | 288,269,867 | | | | 548,829,361 | |
Undistributed (Over-distribution of) net investment income | | | 686,762 | | | | 2,859,851 | | | | 2,513,587 | | | | 1,000,546 | |
Accumulated net realized gain (loss) | | | (2,655,327 | ) | | | (1,642 | ) | | | (330,991 | ) | | | (22,439 | ) |
Net unrealized appreciation (depreciation) | | | 971,228 | | | | 5,623,119 | | | | 5,040,523 | | | | 3,545,607 | |
Net assets | | $ | 133,521,422 | | | $ | 274,755,562 | | | $ | 295,786,282 | | | $ | 553,911,621 | |
Authorized shares | | | Unlimited | | | | Unlimited | | | | Unlimited | | | | Unlimited | |
See accompanying notes to financial statements.
| | | | | | | | |
Statement of Operations | | | Year Ended December 31, 2016 | |
| | | | | | | | | | | | | | | | |
| | | JHY | | | JHD* | | | JHA | | | JHB** | |
Investment Income | | $ | 11,857,818 | | | $ | 12,353,960 | | | $ | 21,405,888 | | | $ | 11,282,774 | |
Expenses | | | | | | | | | | | | | | | | |
Management fees | | | 1,125,969 | | | | 1,434,922 | | | | 2,495,812 | | | | 1,450,501 | |
Interest expense on borrowings | | | 537,401 | | | | 617,766 | | | | 1,105,954 | | | | 472,580 | |
Custodian fees | | | 62,642 | | | | 45,386 | | | | 71,466 | | | | 32,035 | |
Trustees fees | | | 4,998 | | | | 8,131 | | | | 12,110 | | | | 7,237 | |
Professional fees | | | 65,161 | | | | 90,850 | | | | 69,616 | | | | 142,807 | |
Shareholder reporting expenses | | | 35,476 | | | | 35,617 | | | | 42,229 | | | | 48,862 | |
Shareholder servicing agent fees | | | 208 | | | | 79 | | | | 154 | | | | 20 | |
Stock exchange listing fees | | | 7,856 | | | | — | | | | 3,888 | | | | — | |
Investor relations expenses | | | 22,883 | | | | 17,529 | | | | 39,539 | | | | 26,048 | |
Other | | | 31,268 | | | | 9,795 | | | | 22,170 | | | | 35,146 | |
Total expenses | | | 1,893,862 | | | | 2,260,075 | | | | 3,862,938 | | | | 2,215,236 | |
Net investment income (loss) | | | 9,963,956 | | | | 10,093,885 | | | | 17,542,950 | | | | 9,067,538 | |
Realized and Unrealized Gain (Loss) | | | | | | | | | | | | | | | | |
Net realized gain (loss) from investments and foreign currency | | | (729,271 | ) | | | 961,623 | | | | 1,228,389 | | | | 288,517 | |
Change in net unrealized appreciation (depreciation) of investments and foreign currency | | | 13,893,773 | | | | 5,623,119 | | | | 12,427,241 | | | | 3,545,607 | |
Net realized and unrealized gain (loss) | | | 13,164,502 | | | | 6,584,742 | | | | 13,655,630 | | | | 3,834,124 | |
Net increase (decrease) in net assets from operations | | $ | 23,128,458 | | | $ | 16,678,627 | | | $ | 31,198,580 | | | $ | 12,901,662 | |
| * | For the period May 10, 2016 (commencement of operations) through December 31, 2016. |
| ** | For the period August 23, 2016 (commencement of operations) through December 31, 2016. |
See accompanying notes to financial statements.
| | | | | | |
Statement of Changes in Net Assets | | |
| | | | | | | | | | | | | | | | | | | | | | | | |
| | | JHY | | | JHD | | | JHA | | | JHB | |
| | | Year Ended
12/31/16 | | | Year Ended 12/31/15* | | | Year Ended 12/31/16** | | | Year Ended 12/31/16 | | | Year Ended 12/31/15*** | | | Year Ended 12/31/16**** | |
Operations | | | | | | | | | | | | | | | | | | | | | | | | |
Net investment income (loss) | | $ | 9,963,956 | | | $ | 3,769,859 | | | $ | 10,093,885 | | | $ | 17,542,950 | | | $ | 1,133,308 | | | $ | 9,067,538 | |
Net realized gain (loss) from investments and foreign currency | | | (729,271 | ) | | | (1,926,056 | ) | | | 961,623 | | | | 1,228,389 | | | | — | | | | 288,517 | |
Change in net unrealized appreciation (depreciation) of investments and foreign currency | | | 13,893,773 | | | | (12,922,545 | ) | | | 5,623,119 | | | | 12,427,241 | | | | (7,386,718 | ) | | | 3,545,607 | |
Net increase (decrease) in net assets from operations | | | 23,128,458 | | | | (11,078,742 | ) | | | 16,678,627 | | | | 31,198,580 | | | | (6,253,410 | ) | | | 12,901,662 | |
Distributions to Shareholders | | | | | | | | | | | | | | | | | | | | | | | | |
From net investment income | | | (9,277,194 | ) | | | (3,769,859 | ) | | | (7,234,034 | ) | | | (16,162,671 | ) | | | — | | | | (8,066,992 | ) |
From accumulated net realized gains | | | — | | | | — | | | | (963,265 | ) | | | (1,603,806 | ) | | | — | | | | (310,956 | ) |
Return of capital | | | — | | | | (123,922 | ) | | | — | | | | — | | | | — | | | | — | |
Decrease in net assets from distributions to shareholders | | | (9,277,194 | ) | | | (3,893,781 | ) | | | (8,197,299 | ) | | | (17,766,477 | ) | | | — | | | | (8,377,948 | ) |
Capital Share Transactions | | | | | | | | | | | | | | | | | | | | | | | | |
Proceeds from sale of shares, net of offering costs | | | — | | | | 134,179,500 | | | | 266,073,600 | | | | — | | | | 288,312,000 | | | | 549,262,636 | |
Proceeds from shares issued to shareholders due to reinvestment of distributions | | | 303,481 | | | | 59,427 | | | | 100,062 | | | | 195,017 | | | | — | | | | 24,998 | |
Net increase (decrease) in net assets from capital share transactions | | | 303,481 | | | | 134,238,927 | | | | 266,173,662 | | | | 195,017 | | | | 288,312,000 | | | | 549,287,634 | |
Net increase (decrease) in net assets | | | 14,154,745 | | | | 119,266,404 | | | | 274,654,990 | | | | 13,627,120 | | | | 282,058,590 | | | | 553,811,348 | |
Net assets at the beginning of period | | | 119,366,677 | | | | 100,273 | | | | 100,572 | | | | 282,159,162 | | | | 100,572 | | | | 100,273 | |
Net assets at the end of period | | $ | 133,521,422 | | | $ | 119,366,677 | | | $ | 274,755,562 | | | $ | 295,786,282 | | | $ | 282,159,162 | | | $ | 553,911,621 | |
Undistributed (Over-distribution of) net investment income at the end of period | | $ | 686,762 | | | $ | — | | | $ | 2,859,851 | | | $ | 2,513,587 | | | $ | 1,133,308 | | | $ | 1,000,546 | |
| * | For the period July 28, 2015 (commencement of operations) through December 31, 2015. |
| ** | For the period May 10, 2016 (commencement of operations) through December 31, 2016. |
| *** | For the period November 12, 2015 (commencement of operations) through December 31, 2015. |
| **** | For the period August 23, 2016 (commencement of operations) through December 31, 2016. |
See accompanying notes to financial statements.
| | | | | | |
Statement of Cash Flows | | Year Ended December 31, 2016 |
| | | | | | | | | | | | | | | | |
| | | JHY | | | JHD* | | | JHA | | | JHB** | |
Cash Flows from Operating Activities: | | | | | | | | | | | | | | | | |
Net Increase (Decrease) in Net Assets from Operations | | $ | 23,128,458 | | | $ | 16,678,627 | | | $ | 31,198,580 | | | $ | 12,901,662 | |
Adjustments to reconcile the net increase (decrease) in net assets from operations to net cash provided by (used in) operating activities: | | | | | | | | | | | | | | | | |
Purchases of investments | | | (86,078,308 | ) | | | (403,177,696 | ) | | | (214,214,162 | ) | | | (758,014,939 | ) |
Proceeds from sales and maturities of investments | | | 88,442,979 | | | | 50,362,736 | | | | 123,283,079 | | | | 34,601,054 | |
Proceeds from (Purchases of) short-term investments, net | | | (1,662,151 | ) | | | (899,756 | ) | | | — | | | | — | |
Taxes paid | | | — | | | | — | | | | (44,426 | ) | | | — | |
Amortization (Accretion) of premiums and discounts, net | | | (93,061 | ) | | | 179,823 | | | | 1,363,627 | | | | 675,367 | |
(Increase) Decrease in: | | | | | | | | | | | | | | | | |
Receivable for interest | | | (95,835 | ) | | | (4,888,322 | ) | | | (1,107,395 | ) | | | (11,646,781 | ) |
Receivable for investments sold | | | (1,545,000 | ) | | | — | | | | — | | | | — | |
Other assets | | | 29,801 | | | | (41,237 | ) | | | 89,671 | | | | (921 | ) |
Increase (Decrease) in: | | | | | | | | | | | | | | | | |
Accrued interest on borrowings | | | (8,385 | ) | | | 7,100 | | | | 55,779 | | | | 34,915 | |
Accrued management fees | | | 6,037 | | | | 204,010 | | | | 59,315 | | | | 412,646 | |
Accrued Trustees fees | | | 122 | | | | 1,981 | | | | 4,371 | | | | 5,162 | |
Accrued other expenses | | | 13,558 | | | | 80,541 | | | | 8,839 | | | | 153,247 | |
Net realized (gain) loss from investments and foreign currency | | | 729,271 | | | | (961,623 | ) | | | (1,228,389 | ) | | | (288,517 | ) |
Change in net unrealized (appreciation) depreciation of investments and foreign currency | | | (13,893,773 | ) | | | (5,623,119 | ) | | | (12,427,241 | ) | | | (3,545,607 | ) |
Net cash provided by (used in) operating activities | | | 8,973,713 | | | | (348,076,935 | ) | | | (72,958,352 | ) | | | (724,712,712 | ) |
Cash Flows from Financing Activities: | | | | | | | | | | | | | | | | |
Cash distributions paid to shareholders | | | (8,973,713 | ) | | | (8,097,237 | ) | | | (17,571,460 | ) | | | (8,352,950 | ) |
Proceeds from borrowings | | | — | | | | 90,000,000 | | | | 67,000,000 | | | | 190,000,000 | |
Proceeds from sale of shares, net of offering costs | | | — | | | | 266,073,600 | | | | — | | | | 549,262,636 | |
Net cash provided by (used in) financing activities | | | (8,973,713 | ) | | | 347,976,363 | | | | 49,428,540 | | | | 730,909,686 | |
Net Increase (Decrease) in Cash | | | — | | | | (100,572 | ) | | | (23,529,812 | ) | | | 6,196,974 | |
Cash at the beginning of period | | | — | | | | 100,572 | | | | 25,828,962 | | | | 100,273 | |
Cash at the end of period | | $ | — | | | $ | — | | | $ | 2,299,150 | | | $ | 6,297,247 | |
| | | | |
| Supplemental Disclosure of Cash Flow Information | | JHY | | | JHD* | | | JHA | | | JHB** | |
Cash paid for interest on borrowings (excluding borrowing costs) | | $ | 514,786 | | | $ | 560,119 | | | $ | 955,175 | | | $ | 247,665 | |
Non-cash financing activities not included herein consists of reinvestments of share distributions | | | 303,481 | | | | 100,062 | | | | 195,017 | | | | 24,998 | |
| * | For the period May 10, 2016 (commencement of operations) through December 31, 2016. |
| ** | For the period August 23, 2016 (commencement of operations) through December 31, 2016. |
See accompanying notes to financial statements.
THIS PAGE INTENTIONALLY LEFT BLANK
Financial
Highlights
Selected data for a share outstanding throughout each period:
| | | | | | | | | | | | | | | | | | | | | | | | | | | | | | | | | | | | | | | | | | | | |
| | | | | | | | | | | | | | | | | | | |
| | | | | | Investment Operations | | |
Less Distributions | | | | | | | | | | |
| | | Beginning
NAV | | | Net
Investment
Income
(Loss)(a) | | | Net
Realized/
Unrealized
Gain (Loss) | | | Total | | | From
Net
Investment
Income | | | From
Accumulated
Net
Realized
Gains | | | Return
of
Capital | | | Total | | | Offering
Costs | | | Ending
NAV | | | Ending
Share
Price | |
|
JHY | |
Year Ended 12/31: | | | | | | | | | | | | | | | | | | | | | | | | | | | | | | | | | | | | | |
2016 | | $ | 8.73 | | | $ | 0.73 | | | $ | 0.97 | | | $ | 1.70 | | | $ | (0.68 | ) | | $ | — | | | $ | — | | | $ | (0.68 | ) | | $ | — | | | $ | 9.75 | | | $ | 10.21 | |
2015(b) | | | 9.85 | | | | 0.28 | | | | (1.09 | ) | | | (0.81 | ) | | | (0.28 | ) | | | — | | | | (0.01 | ) | | | (0.29 | ) | | | (0.02 | ) | | | 8.73 | | | | 9.95 | |
|
JHD | |
Year Ended 12/31: | | | | | | | | | | | | | | | | | | | | | | | | | | | | | | | | | | | | | |
2016(c) | | | 9.86 | | | | 0.38 | | | | 0.23 | | | | 0.61 | | | | (0.27 | ) | | | (0.03 | ) | | | — | | | | (0.30 | ) | | | (0.02 | ) | | | 10.15 | | | | 10.10 | |
|
JHA | |
Year Ended 12/31: | | | | | | | | | | | | | | | | | | | | | | | | | | | | | | | | | | | | | |
2016 | | | 9.63 | | | | 0.60 | | | | 0.46 | | | | 1.06 | | | | (0.55 | ) | | | (0.06 | ) | | | — | | | | (0.61 | ) | | | — | | | | 10.08 | | | | 10.06 | |
2015(d) | | | 9.86 | | | | 0.04 | | | | (0.25 | ) | | | (0.21 | ) | | | — | | | | — | | | | — | | | | — | | | | (0.02 | ) | | | 9.63 | | | | 10.08 | |
|
JHB | |
Year Ended 12/31: | | | | | | | | | | | | | | | | | | | | | | | | | | | | | | | | | | | | | |
2016(e) | | | 9.85 | | | | 0.17 | | | | 0.06 | | | | 0.23 | | | | (0.14 | ) | | | (0.01 | ) | | | — | | | | (0.15 | ) | | | (0.01 | ) | | | 9.92 | | | | 9.88 | |
| | | | | | | | |
| | | Borrowings at the End of Period | |
| | | Aggregate
Amount
Outstanding
(000) | | | Asset
Coverage
Per $1,000 | |
|
JHY | |
Year Ended 12/31: | |
2016 | | $ | 44,000 | | | $ | 4,035 | |
2015(b) | | | 44,000 | | | | 3,713 | |
|
JHD | |
Year Ended 12/31: | | | | | | | | |
2016(c) | | | 90,000 | | | | 4,053 | |
|
JHA | |
Year Ended 12/31: | |
2016 | | | 92,000 | | | | 4,215 | |
2015(d) | | | 25,000 | | | | 12,286 | |
|
JHB | |
Year Ended 12/31: | |
2016(e) | | | 190,000 | | | | 3,915 | |
| | | | | | | | | | | | | | | | | | | | | | |
| | | | | | |
Ratios/Supplemental Data | |
| Total Returns | | | | | | Ratios to Average Net Assets(g) | | | | |
Based
on
NAV(f) | | | Based
on
Share
Price(f) | | | Ending
Net
Assets
(000) | | | Expenses | | | Net
Investment
Income (Loss) | | | Portfolio
Turnover
Rate(h) | |
| | | | | |
| | | | | | | | | | | | | | | | | | | | | | | |
| | | | | | | | | | | | | | | | | | | | | | |
| | 20.15 | % | | | 9.94 | % | | $ | 133,521 | | | | 1.50 | % | | | 7.91 | % | | | 53 | % |
| | (8.60 | ) | | | 2.42 | | | | 119,367 | | | | 1.34 | * | | | 6.97 | * | | | 11 | |
| | | | | |
| | | | | | | | | | | | | | | | | | | | | | | |
| | | | | | | | | | | | | | | | | | | | | | |
| | 6.07 | | | | 4.06 | | | | 274,756 | | | | 1.31 | * | | | 5.87 | * | | | 15 | |
| | | | | |
| | | | | | | | | | | | | | | | | | | | | | | |
| | | | | | | | | | | | | | | | | | | | | | |
| | 11.25 | | | | 6.07 | | | | 295,786 | | | | 1.33 | | | | 6.05 | | | | 34 | |
| | (2.33 | ) | | | 0.80 | | | | 282,159 | | | | 0.89 | * | | | 3.15 | * | | | 0 | |
| | | | | |
| | | | | | | | | | | | | | | | | | | | | | | |
| | | | | | | | | | | | | | | | | | | | | | |
| | 2.26 | | | | 0.32 | | | | 553,912 | | | | 1.17 | * | | | 4.79 | * | | | 6 | |
| (a) | Per share Net Investment Income (Loss) is calculated using the average daily shares method. |
| (b) | For the period July 28, 2015 (commencement of operations) through December 31, 2015. |
| (c) | For the period May 10, 2016 (commencement of operations) through December 31, 2016. |
| (d) | For the period November 12, 2015 (commencement of operations) through December 31, 2015. |
| (e) | For the period August 23, 2016 (commencement of operations) through December 31, 2016. |
| (f) | Total Return Based on NAV is the combination of changes in NAV, reinvested dividend income at NAV and reinvested capital gains distributions at NAV, if any. The last dividend declared in the period, which is typically paid on the first business day of the following month, is assumed to be reinvested at the ending NAV. The actual reinvest price for the last dividend declared in the period may often be based on the Fund’s market price (and not its NAV), and therefore may be different from the price used in the calculation. Total returns are not annualized. |
Total Return Based on Share Price is the combination of changes in the market price per share and the effect of reinvested dividend income and reinvested capital gains distributions, if any, at the average price paid per share at the time of reinvestment. The last dividend declared in the period, which is typically paid on the first business day of the following month, is assumed to be reinvested at the ending market price. The actual reinvestment for the last dividend declared in the period may take place over several days, and in some instances may not be based on the market price, so the actual reinvestment price may be different from the price used in the calculation. Total returns are not annualized.
| (g) • | Net Investment Income (Loss) ratios reflect income earned and expenses incurred on assets attributable to borrowings (as described in Note 8 – Borrowing Arrangements). |
| | • | Each ratio includes the effect of all interest expense paid and other costs related to borrowings, as follows: |
| | | | | | |
| | | Ratios of Borrowings
Interest Expense
to Average Net Assets | |
JHY | |
Year Ended 12/31: | |
2016 | | | 0.43 | % |
2015(b) | | | 0.27 | * |
| | | | | | |
| | | Ratios of Borrowings
Interest Expense
to Average Net Assets | |
JHD | |
Year Ended 12/31: | |
2016(c) | | | 0.36 | %* |
| | | | | | |
| | | Ratios of Borrowings
Interest Expense
to Average Net Assets | |
JHA | |
Year Ended 12/31: | |
2016 | | | 0.38 | % |
2015(d) | | | 0.03 | * |
| | | | | | |
| | | Ratios of Borrowings
Interest Expense
to Average Net Assets | |
JHB | |
Year Ended 12/31: | |
2016(e) | | | 0.25 | %* |
| (h) | Portfolio Turnover Rate is calculated based on the lesser of long-term purchases or sales (as disclosed in Note 5 – Investment Transactions) divided by the average long-term market value during the period. |
See accompanying notes to financial statements.
Notes to
Financial Statements
1. General Information and Significant Accounting Policies
General Information
Fund Information
The funds covered in this report and their corresponding New York Stock Exchange (“NYSE”) symbols are as follows (each a “Fund” and collectively, the “Funds”):
| | • | | Nuveen High Income 2020 Target Term Fund (JHY) |
| | • | | Nuveen High Income December 2019 Target Term Fund (JHD) |
| | • | | Nuveen High Income December 2018 Target Term Fund (JHA) |
| | • | | Nuveen High Income November 2021 Target Term Fund (JHB) |
The Funds are registered under the Investment Company Act of 1940, as amended, as diversified, closed-end management investment companies. JHY, JHD, JHA and JHB were each organized as a Massachusetts business trust on April 13, 2015, February 10, 2016, July 13, 2015 and July 13, 2015, respectively.
The end of the reporting period for the Funds is December 31, 2016, and the period covered by these Notes to Financial Statements is the fiscal year ended December 31, 2016 (“the current fiscal period”). The reporting period for JHD is the period May 10, 2016 (commencement of operations) through December 31, 2016. The reporting period for JHB is the period August 23, 2016 (commencement of operations) through December 31, 2016.
Investment Adviser
The Funds’ investment adviser is Nuveen Fund Advisors, LLC (the “Adviser”), a subsidiary of Nuveen, LLC. (“Nuveen”). Nuveen is the investment management arm of Teachers Insurance and Annuity Association of America (TIAA). The Adviser has overall responsibility for management of the Funds, oversees the management of the Funds’ portfolios, manages the Funds’ business affairs and provides certain clerical, bookkeeping and other administrative services, and, if necessary, asset allocation decisions. The Adviser has entered into sub-advisory agreements with Nuveen Asset Management, LLC, (the “Sub-Adviser”), a subsidiary of the Adviser, under which the Sub-Adviser manages the investment portfolios of the Funds.
Investment Objectives and Principal Investment Strategies
JHY seeks to provide a high level of current income and return the original $9.85 net asset value (“NAV”) per share on or about November 1, 2020 (the “Termination Date”). JHD seeks to provide a high level of current income and return the original $9.86 NAV per share on or about December 1, 2019 (the “Termination Date”). JHA seeks to provide a high level of current income and return the original $9.86 NAV per share on or about December 1, 2018 (the “Termination Date”). JHB seeks to provide a high level of current income and return the original $9.85 NAV per share on or about November 1, 2021. Under normal market conditions:
| | • | | The Funds invest in at least 80% of their managed assets (as defined in Note 7 – Management Fees and Other Transactions with Affiliates) in corporate debt securities. |
| | • | | The Funds will invest at least 80% of their managed assets in securities that, at the time of investment, are rated below investment grade (those rated BB/Ba or lower) or that are unrated but judged by the Sub-Adviser to be of comparable quality. These securities generally provide high income in an effort to compensate investors for their higher risk of default, which is the failure to make required interest or principal payments. |
| | • | | The Funds will invest no more than 15% of the Funds’ managed asset in securities that, at the time of investment, are rated CCC+/Caa1 or lower, or are unrated but judged by the Sub-Adviser to be of comparable quality. |
| | • | | The Funds may invest up to 30% of their managed assets in securities of non-U.S. issuers, including up to 20% in emerging market issuers. |
| | • | | The Funds may invest up to 10% of their managed assets in non-U.S. dollar denominated securities. |
Each Fund also may invest in certain derivative instruments in pursuit of their investment objectives. Such instruments include financial futures contracts and options thereon, swaps (including interest rate and currency swaps), options on swaps and other derivative instruments. The Sub-Adviser may use derivative instruments to attempt to hedge some of the risk of each Fund’s investments or as a substitute for a position in the underlying asset.
Organizational Expenses
Prior to the commencement of operations for JHD and JHB on May 10, 2016 and August 23, 2016, respectively, the Funds had no operations other than those related to organizational matters, JHD’s and JHB’s initial contribution of $100,572 and $100,273, respectively, by the Adviser, and the recording of each Fund’s organizational expenses ($11,000) and their reimbursements by the Adviser.
Significant Accounting Policies
Each Fund is an investment company and follows accounting and reporting guidance under Financial Accounting Standards Board (FASB) Accounting Standards Codification (ASC) Topic 946 “Financial Services – Investment Companies.” The following is a summary of significant accounting policies followed by the Funds in the preparation of their financial statements in accordance with U.S. generally accepted accounting principles (“U.S. GAAP”).
Investment Transactions
Investment transactions are recorded on a trade date basis. Realized gains and losses from investment transactions are determined on the specific identification method, which is the same basis used for federal income tax purposes. Investments purchased on a when-issued/delayed delivery basis may have extended settlement periods. Any investments so purchased are subject to market fluctuation during this period. The Funds have earmarked securities in their portfolios with a current value at least equal to the amount of the when-issued/delayed delivery purchase commitments.
As of the end of the reporting period, the Funds did not have any when-issued/delayed delivery purchase commitments.
Investment Income
Interest income, which reflects the amortization of premiums and includes accretion of discounts for financial reporting purposes, is recorded on an accrual basis. Interest income also reflects paydown gains and losses, if any.
Professional Fees
Professional fees presented on the Statement of Operations consist of legal fees incurred in the normal course of operations, audit fees, tax consulting fees and, in some cases, workout expenditures. Workout expenditures are incurred in an attempt to protect or enhance an investment or to pursue other claims or legal actions on behalf of Fund shareholders. If a refund is received for workout expenditures paid in a prior reporting period, such amounts will be recognized as “Legal fee refund” on the Statement of Operations.
Dividends and Distributions to Shareholders
Dividends to shareholders, if any, are declared monthly. Net realized capital gains from investment transactions, if any, are declared and distributed to shareholders at least annually. However, in seeking to achieve its investment objectives, each Fund currently intends to set aside and retain in its net assets (and therefore its NAV) a portion of its net investment income, and possibly all or a portion of its gains. This will reduce the amounts otherwise available for distribution prior to the liquidation of the Funds, and the Funds may incur taxes on such retained amount. Such retained income or gains, net of any taxes, would constitute a portion of the liquidating distribution returned to investors on or about the Termination Date. Furthermore, capital gains are distributed only to the extent they exceed available capital loss carryforwards.
Distributions to shareholders are recorded on the ex-dividend date. The amount and timing of distributions are determined in accordance with federal income tax regulations, which may differ from U.S. GAAP.
Indemnifications
Under the Funds’ organizational documents, their officers and trustees are indemnified against certain liabilities arising out of the performance of their duties to the Funds. In addition, in the normal course of business, the Funds enter into contracts that provide general indemnifications to other parties. The Funds’ maximum exposure under these arrangements is unknown as this would involve future claims that may be made against the Funds that have not yet occurred. However, the Funds have not had prior claims or losses pursuant to these contracts and expect the risk of loss to be remote.
Netting Agreements
In the ordinary course of business, the Funds may enter into transactions subject to enforceable master repurchase agreements, International Swaps and Derivative Association, Inc. (“ISDA”) master agreements or other similar arrangements (“netting agreements”). Generally, the right to offset in netting agreements allows each Fund to offset certain securities and derivatives with a specific counterparty, when applicable, as well as any collateral received or delivered to that counterparty based on the terms of the agreements. Generally, each Fund manages its cash collateral and securities collateral on a counterparty basis.
The Funds’ investments subject to netting agreements as of the end of the reporting period, if any, are further described in Note 3 – Portfolio Securities and Investments in Derivatives.
Notes to Financial Statements (continued)
Use of Estimates
The preparation of financial statements in conformity with U.S. GAAP requires management to make estimates and assumptions that affect the reported amounts of assets and liabilities at the date of the financial statements and the reported amounts of increases and decreases in net assets from operations during the current fiscal period. Actual results may differ from those estimates.
2. Investment Valuation and Fair Value Measurements
The fair valuation input levels as described below are for fair value measurement purposes.
Fair value is defined as the price that would be received upon selling an investment or transferring a liability in an orderly transaction to an independent buyer in the principal or most advantageous market for the investment. A three-tier hierarchy is used to maximize the use of observable market data and minimize the use of unobservable inputs and to establish classification of fair value measurements for disclosure purposes. Observable inputs reflect the assumptions market participants would use in pricing the asset or liability. Observable inputs are based on market data obtained from sources independent of the reporting entity. Unobservable inputs reflect the reporting entity’s own assumptions about the assumptions market participants would use in pricing the asset or liability. Unobservable inputs are based on the best information available in the circumstances. The following is a summary of the three-tiered hierarchy of valuation input levels.
| | |
| Level 1 – | | Inputs are unadjusted and prices are determined using quoted prices in active markets for identical securities. |
| Level 2 – | | Prices are determined using other significant observable inputs (including quoted prices for similar securities, interest rates, prepayment speeds, credit risk, etc.). |
| Level 3 – | | Prices are determined using significant unobservable inputs (including management’s assumptions in determining the fair value of investments). |
Prices of fixed-income securities are provided by an independent pricing service (“pricing service”) approved by the Funds’ Board of Trustees (the “Board”). The pricing service establishes a security’s fair value using methods that may include consideration of the following: yields or prices of investments of comparable quality, type of issue, coupon, maturity and rating, market quotes or indications of value from security dealers, evaluations of anticipated cash flows or collateral, general market conditions and other information and analysis, including the obligor’s credit characteristics considered relevant. These securities are generally classified as Level 2. In pricing certain securities, particularly less liquid and lower quality securities, the pricing service may consider information about a security, its issuer or market activity, provided by the Adviser. These securities are generally classified as Level 2 or Level 3 depending on the observability of the significant inputs.
Repurchase agreements are valued at contract amount plus accrued interest, which approximates market value. These securities are generally classified as Level 2.
Investments initially valued in currencies other than the U.S. dollar are converted to the U.S. dollar using exchange rates obtained from pricing services. As a result, the NAV of the Funds’ shares may be affected by changes in the value of currencies in relation to the U.S. dollar. The value of securities traded in markets outside the United States or denominated in currencies other than the U.S. dollar may be affected significantly on a day that the NYSE is closed and an investor is not able to purchase, redeem or exchange shares. If significant market events occur between the time of determination of the closing price of a foreign security on an exchange and the time that the Funds’ NAV is determined, or if under the Funds’ procedures, the closing price of a foreign security is not deemed to be reliable, the security would be valued at fair value as determined in accordance with procedures established in good faith by the Board. These securities are generally classified as Level 2 or Level 3 depending on the observability of the significant inputs.
Certain securities may not be able to be priced by the pre-established pricing methods as described above. Such securities may be valued by the Board and/or its appointee at fair value. These securities generally include, but are not limited to, restricted securities (securities which may not be publicly sold without registration under the Securities Act of 1933, as amended) for which a pricing service is unable to provide a market price; securities whose trading has been formally suspended; debt securities that have gone into default and for which there is no current market quotation; a security whose market price is not available from a pre-established pricing source; a security with respect to which an event has occurred that is likely to materially affect the value of the security after the market has closed but before the calculation of a Fund’s NAV (as may be the case in non-U.S. markets on which the security is primarily traded) or make it difficult or impossible to obtain a reliable market quotation; and a security whose price, as provided by the pricing service, is not deemed to reflect the security’s fair value. As a general principle, the fair value of a security would appear to be the amount that the owner might reasonably expect to receive for it in a current sale. A variety of factors may be considered in determining the fair value of such securities, which may include consideration of the following: yields or prices of investments of comparable quality, type of issue, coupon, maturity and rating, market quotes or indications of value from security dealers, evaluations of anticipated cash flows or collateral, general market conditions and other information and analysis, including the obligor’s credit characteristics considered relevant. These securities are generally classified as Level 2 or Level 3 depending on the observability of the significant inputs. Regardless of the method employed to value a particular security, all valuations are subject to review by the Board and/or its appointee.
The inputs or methodologies used for valuing securities are not an indication of the risks associated with investing in those securities. The following is a summary of each Fund’s fair value measurements as of the end of the reporting period:
| | | | | | | | | | | | | | | | |
JHY | | Level 1 | | | Level 2 | | | Level 3 | | | Total | |
Long-Term Investments*: | | | | | | | | | | | | | | | | |
Corporate Bonds | | $ | — | | | $ | 167,340,702 | | | $ | — | | | $ | 167,340,702 | |
Convertible Bonds | | | — | | | | 2,427,500 | | | | — | | | | 2,427,500 | |
Sovereign Debt | | | — | | | | 1,597,500 | | | | — | | | | 1,597,500 | |
Short-Term Investments: | | | | | | | | | | | | | | | | |
Repurchase Agreements | | | — | | | | 1,867,136 | | | | — | | | | 1,867,136 | |
Total | | $ | — | | | $ | 173,232,838 | | | $ | — | | | $ | 173,232,838 | |
JHD | | | | | | | | | | | | |
Long-Term Investments*: | | | | | | | | | | | | | | | | |
Corporate Bonds | | $ | — | | | $ | 347,701,147 | | | $ | — | | | $ | 347,701,147 | |
Convertible Bonds | | | — | | | | 7,288,125 | | | | — | | | | 7,288,125 | |
Sovereign Debt | | | — | | | | 4,230,607 | | | | — | | | | 4,230,607 | |
Short-Term Investments: | | | | | | | | | | | | | | | | |
Repurchase Agreements | | | — | | | | 899,756 | | | | — | | | | 899,756 | |
Total | | $ | — | | | $ | 360,119,635 | | | $ | — | | | $ | 360,119,635 | |
JHA | | | | | | | | | | | | |
Long-Term Investments*: | | | | | | | | | | | | | | | | |
Corporate Bonds | | $ | — | | | $ | 362,041,991 | | | $ | — | | | $ | 362,041,991 | |
Convertible Bonds | | | — | | | | 11,561,000 | | | | — | | | | 11,561,000 | |
Sovereign Debt | | | — | | | | 6,387,407 | | | | — | | | | 6,387,407 | |
Total | | $ | — | | | $ | 379,990,398 | | | $ | — | | | $ | 379,990,398 | |
JHB | | | | | | | | | | | | |
Long-Term Investments*: | | | | | | | | | | | | | | | | |
Corporate Bonds | | $ | — | | | $ | 718,550,142 | | | $ | — | | | $ | 718,550,142 | |
Convertible Bonds | | | — | | | | 4,827,500 | | | | — | | | | 4,827,500 | |
Sovereign Debt | | | — | | | | 3,195,000 | | | | — | | | | 3,195,000 | |
Total | | $ | — | | | $ | 726,572,642 | | | $ | — | | | $ | 726,572,642 | |
| * | Refer to the Fund’s Portfolio of Investments for industry and country classifications, when applicable. |
The Board is responsible for the valuation process and has appointed the oversight of the daily valuation process to the Adviser’s Valuation Committee. The Valuation Committee, pursuant to the valuation policies and procedures adopted by the Board, is responsible for making fair value determinations, evaluating the effectiveness of the Funds’ pricing policies and reporting to the Board. The Valuation Committee is aided in its efforts by the Adviser’s dedicated Securities Valuation Team, which is responsible for administering the daily valuation process and applying fair value methodologies as approved by the Valuation Committee. When determining the reliability of independent pricing services for investments owned by the Funds, the Valuation Committee, among other things, conducts due diligence reviews of the pricing services and monitors the quality of security prices received through various testing reports conducted by the Securities Valuation Team.
The Valuation Committee will consider pricing methodologies it deems relevant and appropriate when making a fair value determination, based on the facts and circumstances specific to the portfolio instrument. Fair value determinations generally will be derived as follows, using public or private market information:
| | (i) | If available, fair value determinations shall be derived by extrapolating from recent transactions or quoted prices for identical or comparable securities. |
| | (ii) | If such information is not available, an analytical valuation methodology may be used based on other available information including, but not limited to: analyst appraisals, research reports, corporate action information, issuer financial statements and shelf registration statements. Such analytical valuation methodologies may include, but are not limited to: multiple of earnings, discount from market value of a similar freely-traded security, discounted cash flow analysis, book value or a multiple thereof, risk premium/yield analysis, yield to maturity and/or fundamental investment analysis. |
The purchase price of a portfolio instrument will be used to fair value the instrument only if no other valuation methodology is available or deemed appropriate, and it is determined that the purchase price fairly reflects the instrument’s current value.
For each portfolio security that has been fair valued pursuant to the policies adopted by the Board, the fair value price is compared against the last available and next available market quotations. The Valuation Committee reviews the results of such testing and fair valuation occurrences are reported to the Board.
Notes to Financial Statements (continued)
3. Portfolio Securities and Investments in Derivatives
Portfolio Securities
Foreign Currency Transactions
To the extent that the Funds may invest in securities and/or contracts that are denominated in a currency other than U.S. dollars, the Funds will be subject to currency risk, which is the risk that an increase in the U.S. dollar relative to the foreign currency will reduce returns or portfolio value. Generally, when the U.S. dollar rises in value against a foreign currency, the Funds’ investments denominated in that currency will lose value because their currency is worth fewer U.S. dollars; the opposite effect occurs if the U.S. dollar falls in relative value. Investments and other assets and liabilities denominated in foreign currencies are converted into U.S. dollars on a spot (i.e. cash) basis at the spot rate prevailing in the foreign currency exchange market at the time of valuation. Purchases and sales of investments and income denominated in foreign currencies are translated into U.S. dollars on the respective dates of such transactions.
As of the end of the reporting period, the Funds’ investments in non-U.S. securities were as follows:
| | | | | | | | |
| JHY | | Value | | | % of Total
Investments | |
Country: | | | | | | | | |
Canada | | $ | 16,432,276 | | | | 9.5 | % |
Luxembourg | | | 5,560,475 | | | | 3.2 | |
Brazil | | | 5,544,640 | | | | 3.2 | |
United Kingdom | | | 4,204,082 | | | | 2.4 | |
Netherlands | | | 3,108,750 | | | | 1.8 | |
Argentina | | | 2,804,175 | | | | 1.6 | |
Japan | | | 2,602,813 | | | | 1.5 | |
Bermuda | | | 2,131,267 | | | | 1.2 | |
Hong Kong | | | 1,541,250 | | | | 0.9 | |
Other | | | 6,338,832 | | | | 3.7 | |
Total non-U.S. securities | | $ | 50,268,560 | | | | 29.0 | % |
| JHD | | | | | | |
Country: | | | | | | | | |
Canada | | $ | 25,636,004 | | | | 7.1 | % |
Luxembourg | | | 15,776,875 | | | | 4.4 | |
United Kingdom | | | 15,625,194 | | | | 4.3 | |
Brazil | | | 11,836,000 | | | | 3.3 | |
Japan | | | 7,773,050 | | | | 2.2 | |
Ireland | | | 4,159,375 | | | | 1.2 | |
Mexico | | | 3,701,250 | | | | 1.0 | |
Netherlands | | | 3,575,520 | | | | 1.0 | |
Argentina | | | 3,202,500 | | | | 0.9 | |
Other | | | 16,508,887 | | | | 4.5 | |
Total non-U.S. securities | | $ | 107,794,655 | | | | 29.9 | % |
| JHA | | | | | | |
Country: | | | | | | | | |
United Kingdom | | $ | 17,270,839 | | | | 4.5 | % |
Luxembourg | | | 16,773,000 | | | | 4.4 | |
Canada | | | 13,183,514 | | | | 3.5 | |
Brazil | | | 7,966,680 | | | | 2.1 | |
Japan | | | 7,717,500 | | | | 2.0 | |
Ireland | | | 7,373,440 | | | | 1.9 | |
South Africa | | | 6,814,300 | | | | 1.8 | |
Switzerland | | | 6,411,075 | | | | 1.7 | |
Netherlands | | | 5,075,000 | | | | 1.3 | |
Other | | | 15,391,730 | | | | 4.2 | |
Total non-U.S. securities | | $ | 103,977,078 | | | | 27.4 | % |
| | | | | | | | |
| JHB | | Value | | | % of Total
Investments | |
Country: | | | | | | | | |
Canada | | $ | 54,700,017 | | | | 7.5 | % |
Luxembourg | | | 34,404,137 | | | | 4.7 | |
Netherlands | | | 21,160,115 | | | | 2.9 | |
United Kingdom | | | 15,943,775 | | | | 2.2 | |
Australia | | | 12,762,042 | | | | 1.8 | |
Japan | | | 12,155,000 | | | | 1.7 | |
Mexico | | | 8,365,000 | | | | 1.2 | |
Brazil | | | 8,036,500 | | | | 1.1 | |
Italy | | | 6,435,000 | | | | 0.9 | |
Other | | | 30,384,169 | | | | 4.1 | |
Total non-U.S. securities | | $ | 204,345,755 | | | | 28.1 | % |
The books and records of the Funds are maintained in U.S. dollars. Foreign currencies, assets and liabilities are translated into U.S. dollars at 4:00 p.m. Eastern Time. Investment transactions, income and expenses are translated on the respective dates of such transactions. Net realized foreign currency gains and losses resulting from changes in exchange rates include foreign currency gains and losses between trade date and settlement date of the transactions, foreign currency transactions and the difference between the amounts of interest and dividends recorded on the books of a Fund and the amounts actually received.
The realized gains and losses resulting from changes in foreign currency exchange rates and changes in foreign exchange rates associated with (i) foreign currency, (ii) investments, (iii) investments in derivatives and (iv) other assets and liabilities are recognized as a component of “Net realized gain (loss) from investments and foreign currency” on the Statement of Operations, when applicable.
The unrealized gains and losses resulting from changes in foreign currency exchange rates and changes in foreign exchange rates associated with (i) investments and (ii) other assets and liabilities are recognized as a component of “Change in net unrealized appreciation (depreciation) of investments and foreign currency” on the Statement of Operations, when applicable. The unrealized gains and losses resulting from changes in foreign exchange rates associated with investments in derivatives are recognized as a component of the respective derivative’s related “Change in net unrealized appreciation (depreciation)” on the Statement of Operations, when applicable.
Repurchase Agreements
In connection with transactions in repurchase agreements, it is each Fund’s policy that its custodian take possession of the underlying collateral securities, the fair value of which exceeds the principal amount of the repurchase transaction, including accrued interest, at all times. If the counterparty defaults, and the fair value of the collateral declines, realization of the collateral may be delayed or limited.
The following table presents the repurchase agreements for the Funds that are subject to netting agreements as of the end of the reporting period, and the collateral delivered related to those repurchase agreements.
| | | | | | | | | | | | | | |
| Fund | | Counterparty | | Short-Term
Investments, at Value | | | Collateral
Pledged (From)
Counterparty* | | | Net
Exposure | |
JHY | | Fixed Income Clearing Corporation | | $ | 1,867,136 | | | $ | (1,867,136 | ) | | $ | — | |
JHD | | Fixed Income Clearing Corporation | | | 899,756 | | | | (899,756 | ) | | | — | |
| * | As of the end of the reporting period, the value of the collateral pledged from the counterparty exceeded the value of the repurchase agreements. Refer to the Fund’s Portfolio of Investments for details on the repurchase agreements. |
Zero Coupon Securities
A zero coupon security does not pay a regular interest coupon to its holders during the life of the security. Income to the holder of the security comes from accretion of the difference between the original purchase price of the security at issuance and the par value of the security at maturity and is effectively paid at maturity. The market prices of zero coupon securities generally are more volatile than the market prices of securities that pay interest periodically.
Investments in Derivatives
Each Fund is authorized to invest in certain derivative instruments such as futures, options and swap contracts. Each Fund limits its investments in futures, options on futures and swap contracts to the extent necessary for the Adviser to claim the exclusion from registration by the Commodity Futures Trading Commission as a commodity pool operator with respect to the Fund. The Funds record derivative instruments at fair value, with changes in fair value
Notes to Financial Statements (continued)
recognized on the Statement of Operations, when applicable. Even though the Funds’ investments in derivatives may represent economic hedges, they are not considered to be hedge transactions for financial reporting purposes.
Although the Funds are authorized to invest in derivative instruments, and may do so in the future, they did not make any such investments during the current fiscal period.
Market and Counterparty Credit Risk
In the normal course of business each Fund may invest in financial instruments and enter into financial transactions where risk of potential loss exists due to changes in the market (market risk) or failure of the other party to the transaction to perform (counterparty credit risk). The potential loss could exceed the value of the financial assets recorded on the financial statements. Financial assets, which potentially expose each Fund to counterparty credit risk, consist principally of cash due from counterparties on forward, option and swap transactions, when applicable. The extent of each Fund’s exposure to counterparty credit risk in respect to these financial assets approximates their carrying value as recorded on the Statement of Assets and Liabilities.
Each Fund helps manage counterparty credit risk by entering into agreements only with counterparties the Adviser believes have the financial resources to honor their obligations and by having the Adviser monitor the financial stability of the counterparties. Additionally, counterparties may be required to pledge collateral daily (based on the daily valuation of the financial asset) on behalf of each Fund with a value approximately equal to the amount of any unrealized gain above a pre-determined threshold. Reciprocally, when each Fund has an unrealized loss, the Funds have instructed the custodian to pledge assets of the Funds as collateral with a value approximately equal to the amount of the unrealized loss above a pre-determined threshold. Collateral pledges are monitored and subsequently adjusted if and when the valuations fluctuate, either up or down, by at least the pre-determined threshold amount.
4. Fund Shares
Share Transactions
Transactions in shares during the Funds’ current and prior fiscal periods were as follows:
| | | | | | | | | | | | | | | | | | | | | | | | |
| | | JHY* | | | JHD** | | | JHA** | | | JHB* | |
| | | Year
Ended
12/31/16 | | | For the
Period 7/28/15
(commencement
of operations)
through
12/31/15 | | | For the
Period 5/10/16
(commencement
of operations)
through
12/31/16 | | | Year
Ended
12/31/16 | | | For the
Period 11/12/15
(commencement
of operations)
through
12/31/15 | | | For the
Period 8/23/16
(commencement
of operations)
through
12/31/16 | |
Shares: | | | | | | | | | | | | | | | | | | | | | | | | |
Sold | | | — | | | | 13,650,000 | | | | 27,040,000 | | | | — | | | | 29,300,000 | | | | 55,841,892 | |
Issued to shareholders due to reinvestment of distributions | | | 31,152 | | | | 6,136 | | | | 9,883 | | | | 19,448 | | | | — | | | | 2,565 | |
Total | | | 31,152 | | | | 13,656,136 | | | | 27,049,883 | | | | 19,448 | | | | 29,300,000 | | | | 55,844,457 | |
| * | Prior to the commencement of operations, the Adviser purchased 10,180 shares, which are still held as of the end of the reporting period. |
| ** | Prior to the commencement of operations, the Adviser purchased 10,200 shares, which are still held as of the end of the reporting period. |
5. Investment Transactions
Long-term purchases and sales (including maturities) during the current fiscal period were as follows:
| | | | | | | | | | | | | | | | |
| | | JHY | | | JHD | | | JHA | | | JHB | |
Purchases | | $ | 86,078,308 | | | $ | 403,177,696 | | | $ | 214,214,162 | | | $ | 758,014,939 | |
Sales and maturities | | | 88,442,979 | | | | 50,362,736 | | | | 123,283,079 | | | | 34,601,054 | |
6. Income Tax Information
Each Fund is a separate taxpayer for federal income tax purposes. Each Fund intends to distribute substantially all of its net investment company taxable income to shareholders and to otherwise comply with the requirements of Subchapter M of the Internal Revenue Code applicable to regulated investment companies. In any year when the Funds realize net capital gains, the Funds may choose to distribute all or a portion of their net capital gains to shareholders, or alternatively, to retain all or a portion of their net capital gains and pay federal corporate income taxes on such retained gains.
For all open tax years and all major taxing jurisdictions, management of the Funds has concluded that there are no significant uncertain tax positions that would require recognition in the financial statements. Open tax years are those that are open for examination by taxing authorities (i.e., generally the last four tax year ends and the interim tax period since then). Furthermore, management of the Funds is also not aware of any tax positions for which it is reasonably possible that the total amounts of unrecognized tax benefits will significantly change in the next twelve months.
The following information is presented on an income tax basis. Differences between amounts for financial statement and federal income tax purposes are primarily due to timing differences in recognizing certain gains and losses on investment transactions. To the extent that differences arise that are permanent in nature, such amounts are reclassified within the capital accounts as detailed below. Temporary differences do not require reclassification. Temporary and permanent differences do not impact the NAVs of the Funds.
As of December 31, 2016, the cost and unrealized appreciation (depreciation) of investments, as determined on a federal income tax basis, were as follows:
| | | | | | | | | | | | | | | | |
| | | JHY | | | JHD | | | JHA | | | JHB | |
Cost of investments | | $ | 172,261,610 | | | $ | 354,498,158 | | | $ | 375,280,866 | | | $ | 723,049,474 | |
Gross unrealized: | | | | | | | | | | | | | | | | |
Appreciation | | $ | 3,794,388 | | | $ | 7,727,987 | | | $ | 7,523,289 | | | $ | 9,389,472 | |
Depreciation | | | (2,823,160 | ) | | | (2,106,510 | ) | | | (2,813,757 | ) | | | (5,866,304 | ) |
Net unrealized appreciation (depreciation) of investments | | $ | 971,228 | | | $ | 5,621,477 | | | $ | 4,709,532 | | | $ | 3,523,168 | |
Permanent differences, primarily due to federal taxes paid, resulted in reclassifications among the Funds’ components of net assets as of December 31, 2016, the Funds’ tax year end, as follows:
| | | | | | | | | | | | | | | | |
| | | JHY | | | JHD | | | JHA | | | JHB | |
Paid-in surplus | | $ | — | | | $ | — | | | $ | (44,426 | ) | | $ | — | |
Undistributed (Over-distribution of) net investment income | | | — | | | | — | | | | — | | | | — | |
Accumulated net realized gain (loss) | | | — | | | | — | | | | 44,426 | | | | — | |
The tax components of undistributed net ordinary income and net long-term capital gains as of December 31, 2016, the Funds’ tax year end, were as follows:
| | | | | | | | | | | | | | | | |
| | | JHY | | | JHD | | | JHA | | | JHB | |
Undistributed net ordinary income | | $ | 686,762 | | | $ | 2,860,662 | | | $ | 2,516,992 | | | $ | 1,001,467 | |
Undistributed net long-term capital gains | | | — | | | | — | | | | — | | | | — | |
The tax character of distributions paid during the Funds’ tax years ended December 31, 2016 and December 31, 2015, was designated for purposes of the dividends paid deduction as follows:
| | | | | | | | | | | | | | | | |
2016 | | JHY | | | JHD3 | | | JHA | | | JHB4 | |
Distributions from net ordinary income1 | | $ | 9,277,194 | | | $ | 8,197,299 | | | $ | 17,380,339 | | | $ | 8,377,948 | |
Distributions from net long-term capital gains2 | | | — | | | | — | | | | 386,138 | | | | — | |
Return of capital | | | — | | | | — | | | | — | | | | — | |
| | | | |
2015 | | | | | | | | JHY5 | | | JHA6 | |
Distributions from net ordinary income1 | | | | | | | | | | $ | 3,769,859 | | | $ | — | |
Distributions from net long-term capital gains | | | | | | | | | | | — | | | | — | |
Return of capital | | | | | | | | | | | 123,922 | | | | — | |
1 Net ordinary income consists of net taxable income derived from dividends and interest, and net short-term capital gains, if any. 2 The Funds hereby designate as long-term capital gain dividend, pursuant to the Internal Revenue Code Section 852(b)(3), the amount necessary to reduce earnings and profits of the Funds related to net capital gain to zero for the tax year ended December 31, 2016. 3 For the period May 10, 2016 (commencement of operations) through December 31, 2016. 4 For the period August 23, 2016 (commencement of operations) through December 31, 2016. 5 For the period July 28, 2015 (commencement of operations) through December 31, 2015. 6 For the period November 12, 2015 (commencement of operations) through December 31, 2015. | | | | | |
As of December 31, 2016, the Funds’ tax year end, the following Fund had unused capital losses carrying forward available for federal income tax purposes to be applied against future capital gains, if any. The capital losses are not subject to expiration.
| | | | |
| | | JHY | |
Capital losses to be carried forward – not subject to expiration | | $ | 2,655,327 | |
Notes to Financial Statements (continued)
7. Management Fees and Other Transactions with Affiliates
Management Fees
Each Fund’s management fee compensates the Adviser for overall investment advisory and administrative services and general office facilities. The Sub-Adviser is compensated for its services to the Funds from the management fees paid to the Adviser.
Each Fund’s management fee consists of two components – a fund-level fee, based only on the amount of assets within each individual Fund, and a complex-level fee, based on the aggregate amount of all eligible fund assets managed by the Adviser. This pricing structure enables Fund shareholders to benefit from growth in the assets within their respective Fund as well as from growth in the amount of complex-wide assets managed by the Adviser.
The annual Fund-level fee, payable monthly, for each Fund is calculated according to the following schedule:
| | | | |
| Average Daily Managed Assets* | | Fund-Level Fee | |
For the first $500 million | | | 0.5000 | % |
For the next $250 million | | | 0.4875 | |
For managed assets over $750 million | | | 0.4750 | |
The annual complex-level fee, payable monthly, for each Fund is calculated by multiplying the current complex-wide fee rate, determined according to the following schedule by the Funds’ daily managed assets:
| | | | |
| Complex-Level Managed Asset Breakpoint Level* | | Effective Rate at Breakpoint Level | |
$55 billion | | | 0.2000 | % |
$56 billion | | | 0.1996 | |
$57 billion | | | 0.1989 | |
$60 billion | | | 0.1961 | |
$63 billion | | | 0.1931 | |
$66 billion | | | 0.1900 | |
$71 billion | | | 0.1851 | |
$76 billion | | | 0.1806 | |
$80 billion | | | 0.1773 | |
$91 billion | | | 0.1691 | |
$125 billion | | | 0.1599 | |
$200 billion | | | 0.1505 | |
$250 billion | | | 0.1469 | |
$300 billion | | | 0.1445 | |
| * | For the complex-level fees, managed assets include closed-end fund assets managed by the Adviser that are attributable to certain types of leverage. For these purposes, leverage includes the funds’ use of preferred stock and borrowings and certain investments in the residual interest certificates (also called inverse floating rate securities) in tender option bond (TOB) trusts, including the portion of assets held by a TOB trust that has been effectively financed by the trust’s issuance of floating rate securities, subject to an agreement by the Adviser as to certain funds to limit the amount of such assets for determining managed assets in certain circumstances. The complex-level fee is calculated based upon the aggregate daily managed assets of all Nuveen funds that constitute “eligible assets.” Eligible assets do not include assets attributable to investments in other Nuveen funds or assets in excess of a determined amount (originally $2 billion) added to the Nuveen fund complex in connection with the Adviser’s assumption of the management of the former First American Funds effective January 1, 2011. As of December 31, 2016, the complex-level fee for each Fund was 0.1625%. |
Other Transactions with Affiliates
The Funds pay no compensation directly to those of its trustees who are affiliated with the Adviser or to its officers, all of whom receive remuneration for their services to the Funds from the Adviser or its affiliates. The Board has adopted a deferred compensation plan for independent trustees that enables trustees to elect to defer receipt of all or a portion of the annual compensation they are entitled to receive from certain Nuveen-advised funds. Under the plan, deferred amounts are treated as though equal dollar amounts had been invested in shares of select Nuveen-advised funds.
8. Borrowing Arrangements
Each Fund has entered into a borrowing arrangement (“Borrowings”) as a means of leverage.
The Funds have entered into a credit agreement with a bank and its affiliate. Each Fund’s maximum commitment amount under its Borrowings is as follows:
| | | | | | | | | | | | | | | | |
| | | JHY | | | JHD | | | JHA | | | JHB | |
Maximum commitment amount | | | $46,500,000 | | | | $90,000,000 | | | | $95,000,000 | | | | $190,000,000 | |
As of the end of the reporting period, each Fund’s outstanding balance on its Borrowings was as follows:
| | | | | | | | | | | | | | | | |
| | | JHY | | | JHD | | | JHA | | | JHB | |
Outstanding balance on Borrowings | | | $44,000,000 | | | | $90,000,000 | | | | $92,000,000 | | | | $190,000,000 | |
Interest is charged on these Borrowings for each Fund at the 1-Month LIBOR (London Inter-Bank Offered Rate) plus 0.65% per annum on the amounts borrowed. JHY, JHD and JHA are each charged a 0.125% per annum commitment fee on the undrawn portion of the Borrowings. JHB is charged a 0.25% per annum commitment fee on the undrawn portion of the Borrowings on any day that more than 10% of the maximum commitment amount is undrawn. JHD and JHB also accrued a one-time upfront fee of 0.10% per annum on the maximum commitment amount.
During the current fiscal period, the average daily balance outstanding and average annual interest rate on each Fund’s Borrowings were as follows:
| | | | | | | | | | | | | | | | |
| | | JHY | | | JHD* | | | JHA | | | JHB** | |
Average daily balance outstanding | | | $44,000,000 | | | | $86,044,776 | | | | $87,213,115 | | | | $162,839,506 | |
Average annual interest rate | | | 1.13 | % | | | 1.17 | % | | | 1.14 | % | | | 1.20 | % |
| * | For the period June 14, 2016 (initial draw on borrowings) through December 31, 2016. |
| ** | For the period October 12, 2016 (initial draw on borrowings through December 31, 2016. |
In order to maintain these Borrowings, the Funds must meet certain collateral, asset coverage and other requirements. Each Fund’s Borrowings outstanding are fully secured by eligible securities held in their Portfolio of Investments.
Each Fund’s Borrowings outstanding is recognized as “Borrowings” on the Statement of Assets and Liabilities. Interest expense incurred on the borrowed amount and undrawn balance and commitment fees are recognized as components of “Interest expense on borrowings” on the Statement of Operations.
Additional
Fund Information (Unaudited)
| | | | | | | | | | |
| Board of Trustees | | | | | | | | | | |
| William Adams IV* | | Margo Cook* | | Jack B. Evans | | William C. Hunter | | David J. Kundert | | Albin F. Moschner |
| John K. Nelson | | William J. Schneider | | Judith M. Stockdale | | Carole E. Stone | | Terence J. Toth | | Margaret L. Wolff |
| * | Interested Board Member. |
| | | | | | | | |
| | | | | |
Fund Manager Nuveen Fund Advisors, LLC 333 West Wacker Drive Chicago, IL 60606 | | Custodian State Street Bank
& Trust Company One Lincoln Street Boston, MA 02111 | | Legal Counsel Chapman and Cutler LLP Chicago, IL 60603 | | Independent Registered
Public Accounting Firm KPMG LLP 200 East Randolph Drive Chicago, IL 60601 | | Transfer Agent and
Shareholder Services State Street Bank
& Trust Company Nuveen Funds P.O. Box 43071 Providence, RI 02940-3071 (800) 257-8787 |
Quarterly Form N-Q Portfolio of Investments Information
The Fund is required to file its complete schedule of portfolio holdings with the Securities and Exchange Commission (SEC) for the first and third quarters of each fiscal year on Form N-Q. You may obtain this information directly from the SEC. Visit the SEC on-line at http://www.sec.gov or in person at the SEC’s Public Reference Room in Washington, D.C. Call the SEC toll-free at (800) SEC-0330 for room hours and operation.
Nuveen Funds’ Proxy Voting Information
You may obtain (i) information regarding how each fund voted proxies relating to portfolio securities held during the most recent twelve-month period ended June 30, without charge, upon request, by calling Nuveen toll-free at (800) 257-8787 or on Nuveen’s website at www.nuveen.com and (ii) a description of the policies and procedures that each fund used to determine how to vote proxies relating to portfolio securities without charge, upon request, by calling Nuveen toll free at (800) 257-8787. You may also obtain this information directly from the SEC. Visit the SEC on-line at http://www.sec.gov.
CEO Certification Disclosure
The Fund’s Chief Executive Officer (CEO) has submitted to the New York Stock Exchange (NYSE) the annual CEO certification as required by Section 303A.12(a) of the NYSE Listed Company Manual. The Fund has filed with the SEC the certification of its CEO and Chief Financial Officer required by Section 302 of the Sarbanes-Oxley Act.
Share Repurchases
JHY, JHD and JHA intends to repurchase, through its open-market share repurchase program, shares of its own common stock at such times and in such amounts as is deemed advisable. During the period covered by this report, the Fund repurchased shares of its common stock, as shown in the accompanying table. Any future repurchases will be reported to shareholders in the next annual or semi-annual report.
| | | | | | | | | | | | |
| | | JHY | | | JHD | | | JHA | |
Shares repurchased | | | — | | | | — | | | | — | |
FINRA BrokerCheck
The Financial Industry Regulatory Authority (FINRA) provides information regarding the disciplinary history of FINRA member firms and associated investment professionals. This information as well as an investor brochure describing FINRA BrokerCheck is available to the public by calling the FINRA BrokerCheck Hotline number at (800) 289-9999 or by visiting www.FINRA.org.
Glossary of Terms
Used in this Report (Unaudited)
| ∎ | | Average Annual Total Return: This is a commonly used method to express an investment’s performance over a particular, usually multi-year time period. It expresses the return that would have been necessary each year to equal the investment’s actual cumulative performance (including change in NAV or market price and reinvested dividends and capital gains distributions, if any) over the time period being considered. |
| ∎ | | Bloomberg Barclays U.S. High Yield 1-5 Year Cash Pay 2% Issuer Capped Index: An index that tracks the performance of U.S. non-investment grade bonds with maturities of one to 4.99 years and limits each issue to 2% of the index. Benchmark returns assume reinvestment of distributions, but do not reflect any applicable sales charges or management fees. |
| ∎ | | Duration: Duration is a measure of the expected period over which a bond’s principal and interest will be paid, and consequently is a measure of the sensitivity of a bond’s or bond fund’s value to changes when market interest rates change. Generally, the longer a bond’s or fund’s duration, the more the price of the bond or fund will change as interest rates change. |
| ∎ | | Effective Leverage: Effective leverage is a fund’s effective economic leverage, and includes both regulatory leverage (see below) and the leverage effects of certain derivative investments in the fund’s portfolio that increase the fund’s investment exposure. |
| ∎ | | Gross Domestic Product (GDP): The total market value of all final goods and services produced in a country/region in a given year, equal to total consumer, investment and government spending, plus the value of exports, minus the value of imports. |
| ∎ | | Leverage: Leverage is created whenever a fund has investment exposure (both reward and/or risk) equivalent to more than 100% of the investment capital. |
| ∎ | | Net Asset Value (NAV) Per Share: A fund’s Net Assets is equal to its total assets (securities, cash, accrued earnings and receivables) less its total liabilities. NAV per share is equal to the fund’s Net Assets divided by its number of shares outstanding. |
| ∎ | | Regulatory Leverage: Regulatory leverage consists of preferred shares issued by or borrowings of a fund. Both of these are part of a fund’s capital structure. Regulatory leverage is subject to asset coverage limits set in the Investment Company Act of 1940. |
Reinvest Automatically,
Easily and Conveniently
Nuveen makes reinvesting easy. A phone call is all it takes to set up your reinvestment account.
Nuveen Closed-End Funds Automatic Reinvestment Plan
Your Nuveen Closed-End Fund allows you to conveniently reinvest distributions in additional Fund shares.
By choosing to reinvest, you’ll be able to invest money regularly and automatically, and watch your investment grow through the power of compounding. Just like distributions in cash, there may be times when income or capital gains taxes may be payable on distributions that are reinvested.
It is important to note that an automatic reinvestment plan does not ensure a profit, nor does it protect you against loss in a declining market.
Easy and convenient
To make recordkeeping easy and convenient, each quarter you’ll receive a statement showing your total distributions, the date of investment, the shares acquired and the price per share, and the total number of shares you own.
How shares are purchased
The shares you acquire by reinvesting will either be purchased on the open market or newly issued by the Fund. If the shares are trading at or above net asset value at the time of valuation, the Fund will issue new shares at the greater of the net asset value or 95% of the then-current market price. If the shares are trading at less than net asset value, shares for your account will be purchased on the open market. If the Plan Agent begins purchasing Fund shares on the open market while shares are trading below net asset value, but the Fund’s shares subsequently trade at or above their net asset value before the Plan Agent is able to complete its purchases, the Plan Agent may cease open-market purchases and may invest the uninvested portion of the distribution in newly-issued Fund shares at a price equal to the greater of the shares’ net asset value or 95% of the shares’ market value on the last business day immediately prior to the purchase date. Distributions received to purchase shares in the open market will normally be invested shortly after the distribution payment date. No interest will be paid on distributions awaiting reinvestment. Because the market price of the shares may increase before purchases are completed, the average purchase price per share may exceed the market price at the time of valuation, resulting in the acquisition of fewer shares than if the distribution had been paid in shares issued by the Fund. A pro rata portion of any applicable brokerage commissions on open market purchases will be paid by Plan participants. These commissions usually will be lower than those charged on individual transactions.
Flexible
You may change your distribution option or withdraw from the Plan at any time, should your needs or situation change.
You can reinvest whether your shares are registered in your name, or in the name of a brokerage firm, bank, or other nominee. Ask your investment advisor if his or her firm will participate on your behalf. Participants whose shares are registered in the name of one firm may not be able to transfer the shares to another firm and continue to participate in the Plan.
The Fund reserves the right to amend or terminate the Plan at any time. Although the Fund reserves the right to amend the Plan to include a service charge payable by the participants, there is no direct service charge to participants in the Plan at this time.
Call today to start reinvesting distributions
For more information on the Nuveen Automatic Reinvestment Plan or to enroll in or withdraw from the Plan, speak with your financial advisor or call us at (800) 257-8787.
Annual Investment
Management Agreement Approval Process (Unaudited)
The Board of Trustees (each, a “Board” and each Trustee, a “Board Member”) of the Funds, including the Board Members who are not parties to the Funds’ advisory or sub-advisory agreements or “interested persons” of any such parties (the “Independent Board Members”), is responsible for approving the advisory agreements between each Fund and Nuveen Fund Advisors, LLC (the “Adviser”) and the sub-advisory agreements between the Adviser and Nuveen Asset Management, LLC (the “Sub-Adviser”) and their periodic continuation. Pursuant to the Investment Company Act of 1940, as amended (the “1940 Act”), after an initial term, the Board is required to consider the continuation of the advisory agreements and sub-advisory agreements on an annual basis. A discussion of the Board’s approval of the renewal of the advisory arrangements for the Nuveen High Income 2020 Target Term Fund is set forth in such Fund’s semi-annual report for the period ended June 30, 2016. The advisory arrangements for the Nuveen High Income December 2019 Target Term Fund (the “2019 Target Term Fund”) and the Nuveen High Income December 2018 Target Term Fund (the “2018 Target Term Fund”) have not yet been up for renewal. A discussion of the Board’s initial approval of the advisory arrangements for the 2018 Target Term Fund is set forth in such Fund’s annual report for the period ended December 31, 2015. A discussion of the Board’s initial approval of the advisory arrangements for the 2019 Target Term Fund is set forth such Fund’s semi-annual report for the period ended June 30, 2016.
The Nuveen High Income November 2021 Target Term Fund (the “2021 Target Term Fund”) is new. The initial advisory agreement between the Adviser and the 2021 Target Term Fund and the initial sub-advisory agreement between the Adviser and the Sub-Adviser, on behalf of the 2021 Target Term Fund, were approved at a meeting of the Board of the 2021 Target Term Fund held on August 2-4, 2016 (the “August Meeting”). The discussion of the approval at the August Meeting for the 2021 Target Term Fund is set forth below:
NUVEEN HIGH INCOME NOVEMBER 2021 TARGET TERM FUND
The Board Members are responsible for approving advisory arrangements for the 2021 Target Term Fund (for purposes of the discussion below, the “Fund”) and, at the August Meeting (for purposes of the discussion below, the “Meeting”), considered and approved the investment management agreement (for purposes of the discussion below, the “Investment Management Agreement”) between the Fund and the Adviser and the investment sub-advisory agreement (for purposes of the discussion below, the “Sub-Advisory Agreement”) between the Adviser and the Sub-Adviser. For purposes of the discussion below, the Adviser and the Sub-Adviser are each hereafter a “Fund Adviser” and the Investment Management Agreement and the Sub-Advisory Agreement are each hereafter an “Advisory Agreement.”
To assist the Board in its evaluation of an Advisory Agreement with a Fund Adviser at the Meeting, the Independent Board Members had received, in adequate time in advance of the Meeting or at prior meetings, materials which outlined, among other things:
| | • | | the nature, extent and quality of the services expected to be provided by the Fund Adviser; |
| | • | | the organization of the Fund Adviser, including the responsibilities of various departments and key personnel; |
| | • | | the expertise and background of the Fund Adviser with respect to the Fund’s investment strategy; |
| | • | | certain performance-related information (as described below); |
| | • | | the profitability of Nuveen and its affiliates for their advisory activities; |
| | • | | the proposed management fees of the Fund Adviser, including comparisons of such fees with the management fees of comparable funds; |
| | • | | the expected expenses of the Fund, including comparisons of the Fund’s expected expense ratio with the expense ratios of comparable funds; and |
| | • | | the soft dollar practices of the Fund Adviser, if any. |
Annual Investment Management Agreement Approval Process (Unaudited) (continued)
At the Meeting and/or prior meetings, the Adviser made presentations to and responded to questions from the Board. During the Meeting and/or prior meetings, the Independent Board Members also met privately with their legal counsel to, among other things, review the Board’s duties under the 1940 Act, the general principles of state law in reviewing and approving advisory contracts, the standards used by courts in determining whether investment company boards of directors have fulfilled their duties, factors to be considered in voting on advisory contracts and an adviser’s fiduciary duty with respect to advisory agreements and compensation. It is with this background that the Independent Board Members considered the Advisory Agreements. As outlined in more detail below, the Independent Board Members considered all factors they believed relevant with respect to the Fund, including, among other things: (a) the nature, extent and quality of the services expected to be provided by the Fund Advisers; (b) investment performance, as described below; (c) the advisory fees and costs of the services expected to be provided to the Fund and the profitability of the Fund Advisers; (d) the extent of any anticipated economies of scale; (e) any benefits expected to be derived by the Fund Advisers from their relationships with the Fund; and (f) other factors. Each Board Member may have accorded different weight to the various factors in reaching his or her conclusions with respect to the Fund’s Advisory Agreements.
| A. | | Nature, Extent and Quality of Services |
The Independent Board Members considered the nature, extent and quality of the respective Fund Adviser’s services, including portfolio management services and administrative services. Given that the Adviser and the Sub-Adviser already serve as adviser and sub-adviser, respectively, to other Nuveen funds overseen by the Board Members, the Board has a good understanding of each such Fund Adviser’s organization, operations, personnel and services. As the Independent Board Members meet regularly throughout the year to oversee the Nuveen funds, including funds currently advised by the Fund Advisers, the Independent Board Members have relied upon their knowledge from their meetings and any other interactions throughout the year with the respective Fund Adviser in evaluating the Advisory Agreements.
At the Meeting and/or at prior meetings, the Independent Board Members reviewed materials outlining, among other things, the respective Fund Adviser’s organization and business; the types of services that such Fund Adviser or its affiliates provide to the Nuveen funds (as applicable) and are expected to provide to the Fund; and the experience of the respective Fund Adviser with applicable investment strategies. Further, at the Meeting and/or at prior meetings, the Independent Board Members have evaluated the background and experience of the relevant investment personnel.
With respect to services, the Board noted that the Fund would be a registered investment company that would operate in a regulated industry. In considering the services that were expected to be provided by the Fund Advisers, the Board recognized that the Adviser provides a comprehensive set of services to manage and operate the Nuveen funds, including: (a) product management (such as setting dividends; positioning the product in the marketplace; maintaining and enhancing shareholder communications; and reporting to the Board); (b) investment services (such as overseeing sub-advisers and other service providers; analyzing investment performance and risks; overseeing risk management and disclosure; developing and interpreting investment policies; assisting in the development of products; helping to prepare financial statements and marketing disclosures; and overseeing trade execution); (c) fund administration (such as helping to prepare fund tax returns and complete other tax compliance matters; and helping to prepare regulatory filings and shareholder reports); (d) fund Board administration (such as preparing Board materials and organizing and providing assistance for Board meetings); (e) compliance (such as helping to devise and maintain the Nuveen funds’ compliance program and related testing); (f) legal support (such as helping to prepare registration statements and proxy statements; interpreting regulations and policies; and overseeing fund activities); and (g) with respect to certain closed-end funds, providing leverage management.
In addition, the Independent Board Members have considered the quality and breadth of Nuveen’s investment relations program through which Nuveen seeks to build awareness of, and educate investors and financial advisers with respect to, Nuveen closed-end funds which may help to build an active secondary market for the closed-end fund product line.
The Independent Board Members noted that the Adviser would oversee the Sub-Adviser, which was expected to primarily provide the portfolio advisory services to the Fund. In addition, the Board Members recognized the Sub-Adviser’s relevant experience and expertise.
Based on their review, the Independent Board Members found that, overall, the nature, extent and quality of services expected to be provided to the Fund under each Advisory Agreement were satisfactory.
| B. | | Investment Performance |
The Fund was new and, therefore, did not have its own performance history. The Independent Board Members, however, were familiar with the performance records of other Nuveen funds advised by the Adviser and sub-advised by the Sub-Adviser, including the Nuveen High Income Bond Fund (the “High Income Bond Fund”), a Nuveen open-end fund with certain similarities to the contemplated Fund. In this regard, the Independent Board Members reviewed certain performance information relating to the High Income Bond Fund for various time periods (i.e., 3 months, year-to-date, one year, three years, five years, ten years and since inception) as of June 30, 2016.
| C. | | Fees, Expenses and Profitability |
In evaluating the management fees and expenses that the Fund was expected to bear, the Independent Board Members considered, among other things, the Fund’s proposed management fee structure, the rationale for its proposed fee levels, and its expected expense ratio in absolute terms as well as compared with the fees and expense ratios of comparable funds. Accordingly, the Independent Board Members reviewed, among other things, the proposed advisory fee and estimated net total expense ratio for the Fund (based on both common assets and total managed assets), as well as comparative fee and expense data pertaining to the Fund’s peers in the Lipper category in which the Fund is expected to be classified. In considering the Fund’s advisory fees, the Board noted the differences between the Fund’s investment strategy and that of the High Income Bond Fund. Further, the Independent Board Members considered the proposed sub-advisory fee rate for the Fund and noted that the proposed management fee structure for the Fund was in-line with certain other recent Nuveen closed-end funds.
The Independent Board Members recognized that assets attributable to the Fund’s use of leverage would be included in the amount of assets upon which the advisory fee is calculated. In this regard, the Independent Board Members noted that the advisory fee is based on a percentage of average daily “Managed Assets.” “Managed Assets” generally means the total assets of the Fund, minus the sum of its accrued liabilities (other than Fund liabilities incurred for the express purpose of creating leverage). “Total assets” for this purpose includes assets attributable to the Fund’s use of leverage. The Independent Board Members recognized that the fact that a decision to employ or increase the Fund’s leverage will have the effect, all other things being equal, of increasing Managed Assets (and therefore increasing the Adviser’s and the Sub-Adviser’s fees), means that the Adviser may have a conflict of interest in determining whether to use or increase leverage. The Independent Board Members noted, however, that the Adviser would seek to manage that potential conflict by recommending to the Board to leverage the Fund (or increase such leverage) when it determines that such action would be in the best interests of the Fund, and by periodically reviewing the Fund’s performance and use of leverage with the Board.
The Independent Board Members considered the proposed management fee rate as a percentage of Managed Assets before any fund-level and complex-wide breakpoints. In addition, the Independent Board Members considered that the Fund would have a fund-level breakpoint schedule as well as the complex-wide breakpoint schedule (described in further detail below). Based on their review of the fee and expense information provided, the Independent Board Members determined that the Fund’s management fees (as applicable) to a Fund Adviser were reasonable in light of the nature, extent and quality of services to be provided to the Fund.
| | 2. | | Comparisons with the Fees of Other Clients |
At the Meeting and/or at prior meetings, the Board considered information regarding the fees that the Fund Advisers assess to the Nuveen funds compared to those of other clients, as described in further detail below. With respect to non-municipal funds, such other clients of the Adviser and/or its affiliated sub-advisers may include: separately managed accounts (such as retail, institutional or wrap accounts), hedge funds, other investment companies that are not offered by Nuveen but are sub-advised by one of Nuveen’s affiliated sub-advisers, foreign investment companies offered by Nuveen, and collective investment trusts.
The Board recognized that the Fund would have an affiliated sub-adviser. With respect to affiliated sub-advisers, the Board has previously reviewed, among other things, the range of advisory fee rates and average fee rate assessed for the different types of clients. The Board has also reviewed information regarding the different types of services expected to be provided to the Fund compared to those provided to these other clients which typically do not require the same breadth of day-to-day
Annual Investment Management Agreement Approval Process (Unaudited) (continued)
services required for registered funds. Further, the Board has previously considered information regarding the differences in, among other things, investment policies, investor profiles, and account sizes between the Nuveen funds and the other types of clients. In addition, the Independent Board Members have also previously recognized that the management fee rates of the foreign funds advised by the Adviser may also vary due to, among other things, differences in the client base, governing bodies, operational complexities and services covered by the management fee. The Independent Board Members have recognized that the foregoing variations result in different economics among the product structures and culminate in varying management fees among the types of clients and funds.
The Board also was aware that, since the Fund would have a sub-adviser, its management fee reflected two components, the fee that would be retained by the Adviser for its services and the fee the Adviser would pay to the Sub-Adviser. The Board noted that many of the administrative services that the Adviser was expected to provide to support the Fund may not be required to the same extent or at all for the institutional clients or other clients. In general, the Board has noted that higher fee levels reflect higher levels of service provided by the Fund Adviser, increased investment management complexity, greater product management requirements and higher levels of business risk or some combination of the foregoing. Given the inherent differences in the various products, particularly the extensive services expected to be provided to the Fund, the Independent Board Members concluded such facts justify the different levels of fees.
| | 3. | | Profitability of Fund Advisers |
In conjunction with their review of fees at the Meeting and/or at prior meetings, the Independent Board Members have considered the profitability of Nuveen for its advisory activities on an absolute basis and in comparison to other investment advisers. At the Meeting and/or at prior meetings, the Independent Board Members have reviewed, among other things, Nuveen’s adjusted operating margins, the gross and net revenue margins (pre-tax and after-tax) for advisory activities for the Nuveen funds, and the revenues, expenses, and net income (pre-tax and after-tax) of Nuveen. The Independent Board Members have also reviewed an analysis of the key drivers behind the changes in revenues and expenses that impacted profitability. Additionally, the Independent Board Members noted that the sub-advisory fee for the Fund would be paid by the Adviser, however, the Board recognized that the Sub-Adviser is affiliated with Nuveen. At the Meeting and/or at prior meetings, the Independent Board Members have recognized that profitability data is rather subjective as various allocation methodologies may be reasonable to employ but yet yield different results. The Board has also reviewed the results of certain alternative methodologies. The Board has considered the allocation methodology employed to prepare the profitability data as well as a summary of the refinements to the methodology that had been adopted over the years which may limit some of the comparability of Nuveen’s revenue margins over time. Two Independent Board Members have also served as point persons for the Board to review and discuss the methodology employed to develop the profitability analysis and any proposed changes thereto and to keep the Board apprised of such changes.
At the Meeting and/or at prior meetings, the Board has also considered Nuveen’s adjusted operating margins compared to that of other comparable investment advisers (based on asset size and composition) with publicly available data. The Independent Board Members have recognized, however, the limitations of the comparative data as the other advisers may have a different business mix, employ different allocation methodologies, have different capital structure and costs, may not be representative of the industry or other factors that limit the comparability of the profitability information. Nevertheless, the Independent Board Members have noted that Nuveen’s adjusted operating margins appeared comparable to the adjusted margins of the peers.
Further, as the Adviser is a wholly-owned subsidiary of Nuveen which in turn is an operating division of TIAA Global Asset Management, the investment management arm of Teachers Insurance and Annuity Association of America (“TIAA-CREF”), the Board has reviewed a balance sheet for TIAA-CREF reflecting its assets, liabilities and capital and contingency reserves to have a better understanding of the financial stability and strength of the TIAA-CREF complex, together with Nuveen.
Based on the information provided, the Independent Board Members have noted that the Adviser appeared to be sufficiently profitable to operate as a viable investment management firm and to honor its obligations as a sponsor of the Nuveen funds.
With respect to the Sub-Adviser, the Independent Board Members have also considered the profitability of the Sub-Adviser from its relationship with the Nuveen funds. The Independent Board Members have previously reviewed the Sub-Adviser’s
revenues, expenses and revenue margins (pre- and post-tax) for its advisory activities. The Independent Board Members have also reviewed profitability analysis reflecting the revenues, expenses and revenue margin (pre- and post-tax) by asset type for the Sub-Adviser.
In evaluating the reasonableness of the compensation, the Independent Board Members also considered other amounts expected to be paid to a Fund Adviser by the Fund as well as indirect benefits (such as soft dollar arrangements), if any, the Fund Adviser and its affiliates are expected to receive that would be directly attributable to the management of the Fund. See Section E below for additional information on indirect benefits a Fund Adviser may receive as a result of its relationship with the Fund.
Based on their review, the Independent Board Members have determined that the Adviser’s and the Sub-Adviser’s levels of profitability are reasonable in light of the respective services provided.
| D. | | Economies of Scale and Whether Fee Levels Reflect These Economies of Scale |
With respect to economies of scale, the Independent Board Members have recognized that, in general, as the assets of a particular fund or the Nuveen complex in the aggregate increase over time, economies of scale may be realized with respect to the management of the funds, although economies of scale are difficult to measure with precision. The Independent Board Members considered whether the Fund could be expected to benefit from any economies of scale. One method to help ensure that the shareholders share in these benefits is to include breakpoints in the management fee schedule. Subject to certain exceptions, the funds in the Nuveen complex pay a management fee to the Adviser which is generally comprised of a fund-level component and a complex-level component. Generally, the fund level fee component declines as the assets of a particular fund grow. Accordingly, the Independent Board Members reviewed and considered the proposed management fee for the Fund, taking into account that there would be fund-level breakpoints. In this regard, however, given that the Fund is a closed-end fund, the Independent Board Members recognized that although closed-end funds (such as the Fund) may from time to time make additional share offerings, the growth of their assets will occur primarily through the appreciation of such funds’ investment portfolios.
In addition, at the Meeting and/or at prior meetings, the Board has also considered the Nuveen funds’ complex-wide fee arrangement. Pursuant to the complex-wide fee arrangement, generally, the complex-level fee component declines when eligible assets of the funds in the Nuveen complex combined grow. In evaluating the complex-wide fee arrangement, the Independent Board Members have considered that such arrangement was designed to capture economies of scale achieved when total fund complex assets increase, even if the assets of a particular fund are unchanged or have decreased. The approach reflects the notion that some of Nuveen’s costs are attributable to services provided to all its funds in the complex, and therefore all funds should benefit if these costs are spread over a larger asset base.
Further, the Board has noted that economies of scale may be shared through the Adviser’s investment in its business and, at the Meeting and/or at prior meetings, the Independent Board Members have recognized the Adviser’s ongoing investment in its business to expand or enhance the services provided to the Nuveen funds. In this regard, the Independent Board Members have noted, among other things, the additions to groups who play a key role in supporting the funds including in closed-end funds/structured products, fund administration, operations, fund governance, investment services, compliance, product management, and technology. The Independent Board Members have also recognized the investments in systems necessary to manage the funds including in areas of risk oversight, information technology and compliance.
Based on their review, the Independent Board Members concluded that the proposed fee structure was acceptable and reflected economies of scale to be shared with the Fund’s shareholders when assets under management increase.
In evaluating fees, the Independent Board Members considered information received at the Meeting and/or at prior meetings regarding other additional benefits that a Fund Adviser or its affiliates may receive as a result of their relationship with the Fund, including compensation paid to affiliates and research received in connection with brokerage transactions (i.e., soft dollar arrangements). In this regard, with respect to closed-end funds, the Independent Board Members recognized that affiliates of the Adviser may receive revenues for serving as co-manager in an initial public offering of new closed-end funds as well as revenues received in connection with secondary offerings.
Annual Investment Management Agreement Approval Process (Unaudited) (continued)
In addition to the above, the Independent Board Members considered that the Fund’s portfolio transactions will be allocated by the Sub-Adviser and the Sub-Adviser may benefit from research received through soft dollar arrangements. The Board has noted, however, that with respect to transactions in fixed income securities, such securities generally trade on a principal basis and do not generate soft dollar credits. Although the Board recognized that the Sub-Adviser may benefit from a soft dollar arrangement if it does not have to pay for this research out of its own assets, the Board also recognized that any such research may benefit the Fund to the extent it enhances the ability of the Sub-Adviser to manage the Fund.
Based on their review, the Independent Board Members concluded that any indirect benefits expected to be received by a Fund Adviser as a result of its relationship with the Fund were reasonable and within acceptable parameters.
The Independent Board Members did not identify any single factor discussed previously as all-important or controlling. The Board Members, including a majority of the Independent Board Members, concluded that the terms of the Investment Management Agreement and the Sub-Advisory Agreement were fair and reasonable, that the respective Fund Adviser’s fees were reasonable in light of the services to be provided to the Fund and that the Investment Management Agreement and Sub-Advisory Agreement should be and were approved on behalf of the Fund.
Board
Members & Officers (Unaudited)
| | | | | | | | |
| | | | |
| | | | | | | | | |
Name,
Year of Birth
& Address | | Position(s) Held
with the Funds | | Year First
Elected or
Appointed
and Term(1) | | Principal
Occupation(s)
Including other
Directorships
During Past 5 Years | | Number
of Portfolios
in Fund Complex
Overseen by
Board Member |
| | | | |
| | | | | | | | | |
|
| Independent Board Members: |
| | | | |
∎ WILLIAM J. SCHNEIDER | | | | | | Chairman of Miller-Valentine Partners, a real estate investment company; Board Member of WDPR Public Radio station; formerly, Senior Partner and Chief Operating Officer (retired (2004) of Miller-Valentine Group; formerly, Board member, Business Advisory Council of the Cleveland Federal Reserve Bank and University of Dayton Business School Advisory Council; past Chair and Director, Dayton Development Coalition. | | |
1944 333 W. Wacker Drive Chicago, IL 60606 | | Chairman and Board Member | |
1996 Class III | | |
182 |
| | | | | | | |
| | | | | | | |
| | | | |
∎ JACK B. EVANS | | | | | | President, The Hall-Perrine Foundation, a private philanthropic corporation (since 1996); Director and Chairman, United Fire Group, a publicly held company; Director, The Gazette Company; Life Trustee of Coe College and the Iowa College Foundation; formerly, President Pro-Tem of the Board of Regents for the State of Iowa University System; formerly, Director, Alliant Energy; formerly, Director, Federal Reserve Bank of Chicago; formerly, President and Chief Operating Officer, SCI Financial Group, Inc., a regional financial services firm. | | |
1948 333 W. Wacker Drive Chicago, IL 60606 | |
Board Member | |
1999 Class III | | |
182 |
| | | | | | | |
| | | | | | | |
| | | | |
∎ WILLIAM C. HUNTER | | | | | | Dean Emeritus, formerly, Dean, Tippie College of Business, University of Iowa (2006-2012); Director (since 2004) of Xerox Corporation; past Director (2005-2015), and past President (2010-2014) Beta Gamma Sigma, Inc., The International Business Honor Society; Director of Wellmark, Inc. (since 2009); formerly, Dean and Distinguished Professor of Finance, School of Business at the University of Connecticut (2003-2006); previously, Senior Vice President and Director of Research at the Federal Reserve Bank of Chicago (1995-2003); formerly, Director (1997-2007), Credit Research Center at Georgetown University. | | |
1948 333 W. Wacker Drive Chicago, IL 60606 | |
Board Member | |
2003 Class I | | |
182 |
| | | | | | | |
| | | | | | | |
| | | | |
∎ DAVID J. KUNDERT | | | | | | Formerly, Director, Northwestern Mutual Wealth Management Company (2006-2013), retired (since 2004) as Chairman, JPMorgan Fleming Asset Management, President and CEO, Banc One Investment Advisors Corporation, and President, One Group Mutual Funds; prior thereto, Executive Vice President, Banc One Corporation and Chairman and CEO, Banc One Investment Management Group; Regent Emeritus, Member of Investment Committee, Luther College; member of the Wisconsin Bar Association; member of Board of Directors and Chair of Investment Committee, Greater Milwaukee Foundation; member of the Board of Directors (Milwaukee), College Possible; Board member of Milwaukee Repertory Theatre (since 2016). | | |
1942 333 W. Wacker Drive Chicago, IL 60606 | |
Board Member | |
2005 Class II | | |
182 |
| | | | | | | |
| | | | | | | |
| | | | | | | |
Board Members & Officers (Unaudited) (continued)
| | | | | | | | |
| | | | |
| | | | | | | | | |
Name,
Year of Birth
& Address | | Position(s) Held
with the Funds | | Year First
Elected or
Appointed
and Term(1) | | Principal
Occupation(s)
Including other
Directorships
During Past 5 Years | | Number
of Portfolios
in Fund Complex
Overseen by
Board Member |
| | | | |
| | | | | | | | | |
|
| Independent Board Members (continued): |
| | | |
∎ ALBIN F. MOSCHNER(2) | | | | Founder and Chief Executive Officer, Northcroft Partners, LLC, a management consulting firm (since 2012); previously, held positions at Leap Wireless International, Inc., including Consultant (2011-2012), Chief Operating Officer (2008-2011), and Chief Marketing Officer (2004-2008); formerly, President, Verizon Card Services division of Verizon Communications, Inc. (2000-2003); formerly, President, One Point Services at One Point Communications (1999-2000); formerly, Vice Chairman of the Board, Diba, Incorporated (1996-1997); formerly, various executive positions with Zenith Electronics Corporation (1991-1996). Director, USA Technologies, Inc., a provider of solutions and services to facilitate electronic payment transactions (since 2012); formerly, Director, Wintrust Financial Corporation (1996-2016). | | |
1952
333 W. Wacker Drive Chicago, IL 60606 | |
Board Member | |
2016 Class III | | |
182 |
| | | | | | | |
| | | | | | | |
| | | | | | | |
| | | |
∎ JOHN K. NELSON | | | | Member of Board of Directors of Core12 LLC (since 2008), a private firm which develops branding, marketing and communications strategies for clients; Director of The Curran Center for Catholic American Studies (since 2009) and The President’s Council, Fordham University (since 2010); formerly, senior external advisor to the financial services practice of Deloitte Consulting LLP (2012-2014): formerly, Chairman of the Board of Trustees of Marian University (2010 as trustee, 2011-2014 as Chairman); formerly, Chief Executive Officer of ABN AMRO N.V. North America, and Global Head of its Financial Markets Division (2007-2008); prior senior positions held at ABN AMRO include Corporate Executive Vice President and Head of Global Markets-the Americas (2006-2007), CEO of Wholesale Banking North America and Global Head of Foreign Exchange and Futures Markets (2001-2006), and Regional Commercial Treasurer and Senior Vice President Trading-North America (1996-2001); formerly, Trustee at St. Edmund Preparatory School in New York City. | | |
1962
333 W. Wacker Drive Chicago, IL 60606 | |
Board Member | |
2013 Class II | | |
182 |
| | | | | | | |
| | | | | | | |
| | | | | | | |
| | | | | | | |
| | | | | | | |
| | | |
∎ JUDITH M. STOCKDALE | | | | Board Member, Land Trust Alliance (since 2013) and U.S. Endowment for Forestry and Communities (since 2013); formerly, Executive Director (1994-2012), Gaylord and Dorothy Donnelley Foundation; prior thereto, Executive Director, Great Lakes Protection Fund (1990-1994). | | |
1947
333 W. Wacker Drive Chicago, IL 60606 | |
Board Member | |
1997 Class I | | |
182 |
| | | | |
∎ CAROLE E. STONE | | | | | | Director, Chicago Board Options Exchange, Inc. (since 2006); Director, C2 Options Exchange, Incorporated (since 2009); Director, CBOE Holdings, Inc. (since 2010); formerly, Commissioner, New York State Commission on Public Authority Reform (2005-2010). | | |
1947
333 W. Wacker Drive Chicago, IL 60606 | |
Board Member | |
2007 Class I | | |
182 |
| | | | |
∎ TERENCE J. TOTH | | | | | | Co-Founding Partner, Promus Capital (since 2008); Director, Fulcrum IT Service LLC (since 2010) and Quality Control Corporation (since 2012); member: Catalyst Schools of Chicago Board (since 2008) and Mather Foundation Board (since 2012), and chair of its Investment Committee; formerly, Director, Legal & General Investment Management America, Inc. (2008-2013); formerly, CEO and President, Northern Trust Global Investments (2004-2007): Executive Vice President, Quantitative Management & Securities Lending (2000-2004); prior thereto, various positions with Northern Trust Company (since 1994); formerly, Member, Northern Trust Mutual Funds Board (2005-2007), Northern Trust Global Investments Board (2004-2007), Northern Trust Japan Board (2004-2007), Northern Trust Securities Inc. Board (2003-2007) and Northern Trust Hong Kong Board (1997-2004). | | |
1959
333 W. Wacker Drive Chicago, IL 60606 | |
Board Member | |
2008 Class II | | |
182 |
| | | | | | | |
| | | | | | | |
| | | | | | | |
| | | | | | | | |
| | | | |
| | | | | | | | | |
Name,
Year of Birth
& Address | | Position(s) Held
with the Funds | | Year First
Elected or
Appointed
and Term(1) | | Principal
Occupation(s)
Including other
Directorships
During Past 5 Years | | Number
of Portfolios
in Fund Complex
Overseen by
Board Member |
| | | | |
| | | | | | | | | |
|
| Independent Board Members (continued): |
| | | |
∎ MARGARET L. WOLFF | | | | Member of the Board of Directors (since 2013) of Travelers Insurance Company of Canada and The Dominion of Canada General Insurance Company (each, a part of Travelers Canada, the Canadian operation of The Travelers Companies, Inc.); formerly, Of Counsel, Skadden, Arps, Slate, Meagher & Flom LLP (Mergers & Acquisitions Group) (2005-2014); Member of the Board of Trustees of New York-Presbyterian Hospital (since 2005); Member (since 2004) and Chair (since 2015) of the Board of Trustees of The John A. Hartford Foundation (a philanthropy dedicated to improving the care of older adults); formerly, Member (2005-2015) and Vice Chair (2011-2015) of the Board of Trustees of Mt. Holyoke College. | | |
1955
333 W. Wacker Drive Chicago, IL 60606 | |
Board Member | |
2016 Class I | | |
182 |
| | | | | | | |
| | | | | | | |
| | |
| Interested Board Members: | | | | |
| | | | |
∎ WILLIAM ADAMS IV(3) | | | | | | Co-Chief Executive Officer and Co-President (since March 2016), formerly, Senior Executive Vice President, Global Structured Products (2010-2016) of Nuveen Investments, Inc.; Executive Vice President (since February 2017) of Nuveen, LLC; Co-President of Nuveen Fund Advisors, LLC (since 2011); Co- Co-President, Global Products and Solutions (since January 2017), formerly, Chief Executive Officer (2016-2017), formerly, Senior Executive Vice President of Nuveen Securities, LLC; President (since 2011), of Nuveen Commodities Asset Management, LLC; Board Member of the Chicago Symphony Orchestra and of Gilda’s Club Chicago; formerly, Executive Vice President, U.S. Structured Products, of Nuveen Investments, Inc. (1999-2010). | | |
1955 333 W. Wacker Drive Chicago, IL 60606 | |
Board Member | |
2013 Class II | | |
182 |
| | | | | | | |
| | | | | | | |
| | | | | | | |
| | | | |
∎ MARGO L. COOK(2)(3) | | | | | | Co-Chief Executive Officer and Co-President (since March 2016), formerly, Senior Executive Vice President of Nuveen Investments, Inc.; Co-President, Global Products and Solutions (since January 2017), formerly, Co-Chief Executive Officer (2015-2016), formerly, Executive Vice President (2013-2015), of Nuveen Securities, LLC; Executive Vice President (since February 2017) of Nuveen, LLC; Co-President (since October 2016), formerly Senior Executive Vice President of Nuveen Fund Advisors, LLC (Executive Vice President since 2011); formerly, Managing Director of Nuveen Commodities Asset Management, LLC (2011-2016); Chartered Financial Analyst. | | |
1964 333 W. Wacker Drive Chicago, IL 60606 | |
Board Member | |
2016 Class III | | |
182 |
| | | | | | | |
| | | | | | | |
| | | | | | | | |
| | | | |
| | | | | | | | | |
Name,
Year of Birth
& Address | | Position(s) Held
with the Funds | | Year First
Elected or
Appointed(4) | | Principal
Occupation(s)
During Past 5 Years | | Number
of Portfolios
in Fund Complex
Overseen by
Officer |
| | | | |
| | | | | | | | | |
|
| Officers of the Funds: |
| | | |
∎ CEDRIC H. ANTOSIEWICZ | | | | Senior Managing Director (since January 2017), formerly, Managing Director (2004-2017) of Nuveen Securities, LLC; Senior Managing Director (since February 2017), formerly, Managing Director (2014-2017) of Nuveen Fund Advisors, LLC. | | |
1962
333 W. Wacker Drive Chicago, IL 60606 | | Chief Administrative Officer | |
2007 | | |
75 |
| | | |
∎ LORNA C. FERGUSON | | | | Managing Director (since 2004) of Nuveen. | | |
1945 333 W. Wacker Drive Chicago, IL 60606 | |
Vice President | |
1998 | | |
183 |
Board Members & Officers (Unaudited) (continued)
| | | | | | | | |
| | | | |
| | | | | | | | | |
Name,
Year of Birth
& Address | | Position(s) Held
with the Funds | | Year First
Elected or
Appointed(4) | | Principal
Occupation(s)
During Past 5 Years | | Number
of Portfolios
in Fund Complex
Overseen by
Officer |
| | | | |
| | | | | | | | | |
|
| Officers of the Funds (continued): |
| | | | |
∎ STEPHEN D. FOY | | | | | | Managing Director (since 2014), formerly, Senior Vice President (2013-2014) and Vice President (2005-2013) of Nuveen Fund Advisors, LLC; Chief Financial Officer of Nuveen Commodities Asset Management, LLC (since 2010); Managing Director (since 2016) of Nuveen Securities, LLC; Certified Public Accountant. | | |
1954
333 W. Wacker Drive Chicago, IL 60606 | | Vice President and Controller | |
1998 | | |
183 |
| | | | | | | |
| | | | |
∎ NATHANIEL T. JONES | | | | | | Managing Director (since January 2017), formerly, Senior Vice President (2016-2017), formerly, Vice President (2011-2016) of Nuveen.; Chartered Financial Analyst. | | |
1979
333 W. Wacker Drive Chicago, IL 60606 | | Vice President and Treasurer | |
2016 | | |
183 |
| | | | |
∎ WALTER M. KELLY | | | | | | Managing Director (since January 2017), formerly, Senior Vice President (2008-2017) of Nuveen. | | |
1970
333 W. Wacker Drive Chicago, IL 60606 | | Chief Compliance Officer and Vice President | | 2003 | | |
183 |
| | | | |
∎ DAVID J. LAMB | | | | | | Managing Director (since January 2017), formerly, Senior Vice President of Nuveen Investments Holdings, Inc. (since 2006), Vice President prior to 2006. | | |
1963
333 W. Wacker Drive Chicago, IL 60606 | |
Vice President | |
2015 | | |
75 |
| | | | |
∎ TINA M. LAZAR | | | | | | Managing Director (since January 2017), formerly, Senior Vice President (2014-2017)of Nuveen Securities, LLC. | | |
1961
333 W. Wacker Drive Chicago, IL 60606 | |
Vice President | |
2002 | | |
183 |
| | | | |
∎ KEVIN J. MCCARTHY | | | | | | Senior Managing Director (since February 2017), formerly, Executive Vice President (2016-2017), Secretary (since 2016) and General Counsel (since 2016), formerly, Managing Director and Assistant Secretary of Nuveen Investments, Inc.; Senior Managing Director (since January 2017), formerly, Executive Vice President (2016-2017), formerly, Managing Director (2008-2016), and Assistant Secretary (since 2008) of Nuveen Securities, LLC; Senior Managing Director (since February 2017), formerly, Executive Vice President (2016-2017), and Secretary (since 2016), formerly, Managing Director (2008-2016) and Assistant Secretary (2007-2016), and Co-General Counsel (since 2011) of Nuveen Fund Advisors, LLC; Senior Managing Director (since February 2017), formerly, Executive Vice President (2016-2017) and Secretary (since 2016), formerly, Managing Director, Assistant Secretary (2011-2016), and Associate General Counsel (since 2011) of Nuveen Asset Management, LLC; Senior Managing Director (since February 2017), formerly, Executive Vice President (2016-2017) and Secretary (since 2016) of Nuveen Investments Advisers, LLC; Vice President (since 2007) and Secretary (since 2016) of NWQ Investment Management Company, LLC, Symphony Asset Management LLC, Santa Barbara Asset Management, LLC and Winslow Capital Management, LLC (since 2010); Vice President (since 2010) and Secretary (since 2016), formerly, Assistant Secretary of Nuveen Commodities Asset Management, LLC. | | |
1966
333 W. Wacker Drive Chicago, IL 60606 | | Vice President and Assistant Secretary | |
2007 | | |
183 |
| | | | | | | |
| | | | | | | |
| | | | | | | |
| | | | | | | |
| | | | | | | |
| | | | | | | |
| | | | | | | |
| | | | | | | |
| | | | | | | |
| | | | |
∎ KATHLEEN L. PRUDHOMME | | | | | | Managing Director, Assistant Secretary and Co-General Counsel (since 2011) of Nuveen Fund Advisors, LLC; Managing Director, Assistant Secretary and Associate General Counsel (since 2011) of Nuveen Asset Management, LLC; Managing Director and Assistant Secretary (since 2011) of Nuveen Securities, LLC; formerly, Deputy General Counsel, FAF Advisors, Inc. (2004-2010). | | |
1953
901 Marquette Avenue Minneapolis, MN 55402 | | Vice President and Assistant Secretary | |
2011 | | | 183 |
| | | | | | | |
| | | | | | | | |
| | | | |
| | | | | | | | | |
Name,
Year of Birth
& Address | | Position(s) Held
with the Funds | | Year First
Elected or
Appointed(4)
| | Principal
Occupation(s)
During Past 5 Years | | Number
of Portfolios
in Fund Complex
Overseen by
Officer |
| | | | |
| | | | | | | | | |
|
| Officers of the Funds (continued): |
| | | |
∎ CHRISTOPHER M. ROHRBACHER | | | | Managing Director (since January 2017) of Nuveen Securities, LLC; Managing Director (since January 2017), formerly, Senior Vice President (2016-2017) and Assistant Secretary (since October 2016) of Nuveen Fund Advisors, LLC; Vice President and Assistant Secretary (since 2010) of Nuveen Commodities Asset Management, LLC. | | |
1971
333 West Wacker Drive Chicago, IL 60606 | | Vice President and Assistant Secretary | | 2008 | | | 183 |
| | | | |
∎ JOEL T. SLAGER | | | | | | Fund Tax Director for Nuveen Funds (since 2013); previously, Vice President of Morgan Stanley Investment Management, Inc., Assistant Treasurer of the Morgan Stanley Funds (from 2010 to 2013). | | |
1978
333 W. Wacker Drive Chicago, IL 60606 | | Vice President and Assistant Secretary | | 2013 | | | 183 |
| | | |
∎ GIFFORD R. ZIMMERMAN | | | | Managing Director (since 2002), and Assistant Secretary of Nuveen Securities, LLC; Managing Director (since 2004) and Assistant Secretary (since 1994) of Nuveen Investments, Inc.; Managing Director (since 2002), Assistant Secretary (since 1997) and Co-General Counsel (since 2011) of Nuveen Fund Advisors, LLC; Managing Director, Assistant Secretary and Associate General Counsel of Nuveen Asset Management, LLC (since 2011); Vice President (since February 2017), formerly, Managing Director (2003-2017) and Assistant Secretary (since 2003) of Symphony Asset Management LLC; Managing Director and Assistant Secretary (since 2002) of Nuveen Investments Advisers, LLC; Vice President and Assistant Secretary of NWQ Investment Management Company, LLC (since 2002), Santa Barbara Asset Management, LLC (since 2006), and of Winslow Capital Management, LLC, (since 2010); Chartered Financial Analyst. | | |
1956
333 W. Wacker Drive Chicago, IL 60606 | | Vice President and Secretary | |
1988 | | |
183 |
| | | | | | | |
| | | | | | | |
| | | | | | | |
| (1) | The Board Members serve three year terms. The Board of Trustees is divided into three classes. Class I, Class II, and Class III, with each being elected to serve until the third succeeding annual shareholders’ meeting subsequent to its election or thereafter in each case when its respective successors are duly elected or appointed. The first year elected or appointed represents the year in which the board member was first elected or appointed to any fund in the Nuveen Complex. |
| (2) | On June 22, 2016, Ms. Cook and Mr. Moschner were appointed as Board members, effective July 1, 2016. |
| (3) | “Interested person” as defined in the 1940 Act, by reason of his position with Nuveen Investments, Inc. and certain of its subsidiaries, which are affiliates of the Nuveen Funds. |
| (4) | Officers serve one year terms through August of each year. The year first elected or appointed represents the year in which the Officer was first elected or appointed to any fund in the Nuveen Complex. |
| | | | | | | | | | | | | | |
| | | | | | | | |
| | | | |
| | | | | | | | |
| | | | | | | | |
| | |
| | Nuveen: | | |
| | | | Serving Investors for Generations | | |
| | |
| | | | |
| | | | Since 1898, financial advisors and their clients have relied on Nuveen to provide dependable investment solutions through continued adherence to proven, long-term investing principles. Today, we offer a range of high quality equity and fixed-income solutions designed to be integral components of a well-diversified core portfolio. | | |
| | | |
| | | | | | |
| | | | | | Focused on meeting investor needs. Nuveen helps secure the long-term goals of individual investors and the advisors who serve them, providing access to investment expertise from leading asset managers and solutions across traditional and alternative asset classes. Built on more than a century of industry leadership, Nuveen’s teams of experts align with clients’ specific financial needs and goals, demonstrating commitment to advisors and investors through market perspectives and wealth management and portfolio advisory services. Nuveen manages $236 billion in assets as of December 31, 2016. | | |
| | | | |
| | | | | | | | |
| | | | | | Find out how we can help you. To learn more about how the products and services of Nuveen may be able to help you meet your financial goals, talk to your financial advisor, or call us at (800) 257-8787. Please read the information provided carefully before you invest. Investors should consider the investment objective and policies, risk considerations, charges and expenses of any investment carefully. Where applicable, be sure to obtain a prospectus, which contains this and other relevant information. To obtain a prospectus, please contact your securities representative or Nuveen, 333 W. Wacker Dr., Chicago, IL 60606. Please read the prospectus carefully before you invest or send money. Learn more about Nuveen Funds at: www.nuveen.com/cef | | |
| | | | | | |
| | | | | | | | | | | | |
Securities offered through Nuveen Securities, LLC, Member FINRA and SIPC | 333 West Wacker Drive | Chicago, IL 60606 | www.nuveen.com/cef
EAN-J-1216D 23210-INV-Y-03/18
ITEM 2. CODE OF ETHICS.
As of the end of the period covered by this report, the registrant has adopted a code of ethics that applies to the registrant’s principal executive officer, principal financial officer, principal accounting officer or controller, or persons performing similar functions. There were no amendments to or waivers from the Code during the period covered by this report. The registrant has posted the code of ethics on its website at www.nuveen.com/CEF/Shareholder/FundGovernance.aspx. (To view the code, click on Code of Conduct.)
ITEM 3. AUDIT COMMITTEE FINANCIAL EXPERT.
The registrant’s Board of Directors or Trustees (“Board”) determined that the registrant has at least one “audit committee financial expert” (as defined in Item 3 of Form N-CSR) serving on its Audit Committee. The registrant’s audit committee financial experts are Carole E. Stone and Jack B. Evans, who are “independent” for purposes of Item 3 of Form N-CSR.
Ms. Stone served for five years as Director of the New York State Division of the Budget. As part of her role as Director, Ms. Stone was actively involved in overseeing the development of the State’s operating, local assistance and capital budgets, its financial plan and related documents; overseeing the development of the State’s bond-related disclosure documents and certifying that they fairly presented the State’s financial position; reviewing audits of various State and local agencies and programs; and coordinating the State’s system of internal audit and control. Prior to serving as Director, Ms. Stone worked as a budget analyst/examiner with increasing levels of responsibility over a 30 year period, including approximately five years as Deputy Budget Director. Ms. Stone has also served as Chair of the New York State Racing Association Oversight Board, as Chair of the Public Authorities Control Board, as a Commissioner on the New York State Commission on Public Authority Reform and as a member of the Boards of Directors of several New York State public authorities. These positions have involved overseeing operations and finances of certain entities and assessing the adequacy of project/entity financing and financial reporting. Currently, Ms. Stone is on the Board of Directors of CBOE Holdings, Inc., of the Chicago Board Options Exchange, and of C2 Options Exchange. Ms. Stone’s position on the boards of these entities and as a member of both CBOE Holdings’ Audit Committee and its Finance Committee has involved, among other things, the oversight of audits, audit plans and preparation of financial statements.
Mr. Evans was formerly President and Chief Operating Officer of SCI Financial Group, Inc., a full service registered broker-dealer and registered investment adviser (“SCI”). As part of his role as President and Chief Operating Officer, Mr. Evans actively supervised the Chief Financial Officer (the “CFO”) and actively supervised the CFO’s preparation of financial statements and other filings with various regulatory authorities. In such capacity, Mr. Evans was actively involved in the preparation of SCI’s financial statements and the resolution of issues raised in connection therewith. Mr. Evans has also served on the audit committee of various reporting companies. At such companies, Mr. Evans was involved in the oversight of audits, audit plans, and the preparation of financial statements. Mr. Evans also formerly chaired the audit committee of the Federal Reserve Bank of Chicago.
ITEM 4. PRINCIPAL ACCOUNTANT FEES AND SERVICES.
Nuveen High Income 2020 Target Term Fund
The following tables show the amount of fees that KPMG LLP, the Funds’ auditor, billed to the Funds’ during the Funds’ last two full fiscal years. The Audit Committee approved in advance all audit services and non-audit services that KPMG LLP provided to the Funds, except for those non-audit services that were subject to the pre-approval exception under Rule 2-01 of Regulation S-X (the “pre-approval exception”). The preapproval exception for services provided directly to the Funds waives the pre-approval requirement for services other than audit, review or attest services if: (A) the aggregate amount of all such services provided constitutes no more than 5% of the total amount of revenues paid by the Funds during the fiscal year in which the services are provided; (B) the Funds did not recognize the services as non-audit services at the time of the engagement; and (C) the services are promptly brought to the Audit Committee’s attention, and the Committee (or its delegate) approves the services before the audit is completed.
The Audit Committee has delegated certain pre-approval responsibilities to its Chairman (or, in his absence, any other member of the Audit Committee).
SERVICES THAT THE FUND’S AUDITOR BILLED TO THE FUND
| | | | | | | | | | | | | | | | |
Fiscal Year Ended | | Audit Fees Billed
to Fund 1 | | | Audit-Related Fees
Billed to Fund 2 | | | Tax Fees
Billed to Fund 3 | | | All Other Fees
Billed to Fund 4 | |
December 31, 2016 | | $ | 30,500 | | | $ | 0 | | | $ | 0 | | | $ | 0 | |
| | | | | | | | | | | | | | | | |
| | | | | | | | | | | | | | | | |
Percentage approved pursuant to pre-approval exception | | | 0 | % | | | 0 | % | | | 0 | % | | | 0 | % |
| | | | | | | | | | | | | | | | |
| | | | | | | | | | | | | | | | |
December 31, 2015 | | $ | 30,500 | | | $ | 5,000 | | | $ | 0 | | | $ | 0 | |
| | | | | | | | | | | | | | | | |
| | | | | | | | | | | | | | | | |
Percentage approved pursuant to pre-approval exception | | | 0 | % | | | 0 | % | | | 0 | % | | | 0 | % |
| | | | | | | | | | | | | | | | |
1 “Audit Fees” are the aggregate fees billed for professional services for the audit of the Fund’s annual financial statements and services provided in connection with statutory and regulatory filings or engagements.
2 “Audit Related Fees” are the aggregate fees billed for assurance and related services reasonably related to the performance of the audit or review of financial statements that are not reported under “Audit Fees”. These fees include offerings related to the Fund’s common shares and leverage.
3 “Tax Fees” are the aggregate fees billed for professional services for tax advice, tax compliance, and tax planning. These fees include: all global withholding tax services; excise and state tax reviews; capital gain, tax equalization and taxable basis calculation performed by the principal accountant.
4 “All Other Fees” are the aggregate fees billed for products and services other than “Audit Fees”, “Audit-Related Fees” and “Tax Fees”. These fees represent all “Agreed-Upon Procedures” engagements pertaining to the Fund’s use of leverage.
SERVICES THAT THE FUND’S AUDITOR BILLED TO THE
ADVISER AND AFFILIATED FUND SERVICE PROVIDERS
The following tables show the amount of fees billed by KPMG LLP to Nuveen Fund Advisors, LLC (formerly Nuveen Fund Advisors, Inc.) (the “Adviser”), and any entity controlling, controlled by or under common control with the Adviser that provides ongoing services to the Fund (“Affiliated Fund Service Provider”), for engagements directly related to the Fund’s operations and financial reporting, during the Fund’s last two full fiscal years.
The tables also show the percentage of fees subject to the pre-approval exception. The pre-approval exception for services provided to the Adviser and any Affiliated Fund Service Provider (other than audit, review or attest services) waives the pre-approval requirement if: (A) the aggregate amount of all such services provided constitutes no more than 5% of the total amount of revenues paid to KPMG LLP by the Fund, the Adviser and Affiliated Fund Service Providers during the fiscal year in which the services are provided that would have to be pre-approved by the Audit Committee; (B) the Fund did not recognize the services as non-audit services at the time of the engagement; and (C) the services are promptly brought to the Audit Committee’s attention, and the Committee (or its delegate) approves the services before the Fund’s audit is completed.
| | | | | | | | | | | | |
Fiscal Year Ended | | Audit-Related Fees
Billed to Adviser and
Affiliated Fund Service
Providers | | | Tax Fees Billed to
Adviser and
Affiliated Fund
Service Providers | | | All Other Fees
Billed to Adviser
and Affiliated Fund
Service Providers | |
December 31, 2016 | | $ | 0 | | | $ | 0 | | | $ | 0 | |
| | | | | | | | | | | | |
| | | | | | | | | | | | |
Percentage approved pursuant to pre-approval exception | | | 0 | % | | | 0 | % | | | 0 | % |
| | | | | | | | | | | | |
| | | | | | | | | | | | |
December 31, 2015 | | $ | 0 | | | $ | 0 | | | $ | 0 | |
| | | | | | | | | | | | |
| | | | | | | | | | | | |
Percentage approved pursuant to pre-approval exception | | | 0 | % | | | 0 | % | | | 0 | % |
| | | | | | | | | | | | |
NON-AUDIT SERVICES
The following table shows the amount of fees that KPMG LLP billed during the Fund’s last two full fiscal years for non-audit services. The Audit Committee is required to pre-approve non-audit services that KPMG LLP provides to the Adviser and any Affiliated Fund Services Provider, if the engagement related directly to the Fund’s operations and financial reporting (except for those subject to the pre-approval exception described above). The Audit Committee requested and received information from KPMG LLP about any non-audit services that KPMG LLP rendered during the Fund’s last fiscal year to the Adviser and any Affiliated Fund Service Provider. The Committee considered this information in evaluating KPMG LLP’s independence.
| | | | | | | | | | | | | | | | |
Fiscal Year Ended | | Total Non-Audit Fees
Billed to Fund | | | Total Non-Audit Fees
billed to Adviser and
Affiliated Fund Service
Providers (engagements
related directly to the
operations and financial
reporting of the Fund) | | | Total Non-Audit Fees
billed to Adviser and
Affiliated Fund Service
Providers (all other
engagements) | | | Total | |
December 31, 2016 | | $ | 0 | | | $ | 0 | | | $ | 0 | | | $ | 0 | |
December 31, 2015 | | $ | 0 | | | $ | 0 | | | $ | 0 | | | $ | 0 | |
“Non-Audit Fees billed to Fund” for both fiscal year ends represent “Tax Fees” and “All Other Fees” billed to Fund in their respective amounts from the previous table.
Less than 50 percent of the hours expended on the principal accountant’s engagement to audit the registrant’s financial statements for the most recent fiscal year were attributed to work performed by persons other than the principal accountant’s full-time, permanent employees.
Audit Committee Pre-Approval Policies and Procedures. Generally, the Audit Committee must approve (i) all non-audit services to be performed for the Fund by the Fund’s independent accountants and (ii) all audit and non-audit services to be performed by the Fund’s independent accountants for the Affiliated Fund Service Providers with respect to operations and financial reporting of the Fund. Regarding tax and research projects conducted by the independent accountants for the Fund and Affiliated Fund Service Providers (with respect to operations and financial reports of the Fund) such engagements will be (i) pre-approved by the Audit Committee if they are expected to be for amounts greater than $10,000; (ii) reported to the Audit Committee chairman for his verbal approval prior to engagement if they are expected to be for amounts under $10,000 but greater than $5,000; and (iii) reported to the Audit Committee at the next Audit Committee meeting if they are expected to be for an amount under $5,000.
ITEM 5. AUDIT COMMITTEE OF LISTED REGISTRANTS.
The registrant’s Board has a separately designated Audit Committee established in accordance with Section 3(a)(58)(A) of the Securities Exchange Act of 1934, as amended (15 U.S.C. 78c(a)(58)(A)). The members of the audit committee are Jack B. Evans, David J. Kundert, John K. Nelson, Carole E. Stone and Terence J. Toth.
ITEM 6. SCHEDULE OF INVESTMENTS.
(a) See Portfolio of Investments in Item 1.
(b) Not applicable.
ITEM 7. DISCLOSURE OF PROXY VOTING POLICIES AND PROCEDURES FOR CLOSED-END MANAGEMENT INVESTMENT COMPANIES.
Nuveen Fund Advisors, LLC is the registrant’s investment adviser (also referred to as the “Adviser”). The Adviser is responsible for the on-going monitoring of the Fund’s investment portfolio, managing the Fund’s business affairs and providing certain clerical, bookkeeping and administrative services. The Adviser has engaged Nuveen Asset Management, LLC (“Sub-Adviser”) as Sub-Adviser to provide discretionary investment advisory services. As part of these services, the Adviser has delegated to the Sub-Adviser the full responsibility for proxy voting on securities held in the registrant’s portfolio and related duties in accordance with the Sub-Adviser’s policies and procedures. The Adviser periodically monitors the Sub-Adviser’s voting to ensure that it is carrying out its duties. The Sub-Adviser’s proxy voting policies and procedures are attached to this filing as an exhibit and incorporated herein by reference.
ITEM 8. PORTFOLIO MANAGERS OF CLOSED-END MANAGEMENT INVESTMENT COMPANIES.
Nuveen Fund Advisors (“NFALLC”) is the registrant’s investment adviser (NFALLC is also referred to as the “Adviser”). NFALLC is responsible for the selection and on-going monitoring of the Fund’s investment portfolio, managing the Fund’s business affairs and providing certain clerical, bookkeeping and administrative services. The Adviser has engaged Nuveen Asset Management, LLC (“Nuveen Asset Management” or “Sub-Adviser”), as Sub-Adviser to provide discretionary investment advisory services. The following section provides information on the portfolio managers at the Sub-Adviser:
Nuveen Asset Management
Item 8(a)(1). PORTFOLIO MANAGER BIOGRAPHIES
John T. Fruit, CFA, entered the financial services industry in 1988 and joined FAF Advisors in 2001 as a senior fixed-income research analyst. He became a portfolio manager in 2005 and most recently served as Senior Fixed-Income Portfolio Manager at FAF Advisors until joining Nuveen Asset Management. He joined Nuveen Asset Management as Senior Vice President, Portfolio Manager and Head of High-Yield Credit Sector Team on January 1, 2011 in connection with its acquisition of a portion of FAF’s asset management business.
Jeffrey T. Schmitz, CFA, entered the financial services industry in 1987 and joined FAF Advisors in 2006. He became a portfolio manager in 2008 and most recently served as Senior Credit Analyst and Portfolio Manager at FAF Advisors until joining Nuveen Asset Management. He joined Nuveen Asset Management as Vice President and Senior Research Analyst on January 1, 2011 in connection with its acquisition of a portion of FAF’s asset management business.
Item 8(a)(2). OTHER ACCOUNTS MANAGED BY PORTFOLIO MANAGERS
In addition to the Fund, as of December 31, 2016, the portfolio managers are also primarily responsible for the day-to-day portfolio management of the following accounts:
| | | | | | | | | | | | | | | | | | | | | | | | | | | | | | | | | | | | | | | | | | | | | | | | | | | | | | |
| | | (ii) Number of Other Accounts Managed and Assets by Account Type* | | | (iii) Number of Other Accounts and Assets for Which Advisory Fee is Performance-Based | |
(i) Name of Portfolio Manager | | Other
Registered
Investment
Companies | | | Other Pooled
Investment
Vehicles | | | Other
Accounts | | | Other
Registered
Investment
Companies | | | Other Pooled
Investment
Vehicles | | | Other
Accounts | |
John Fruit | | | 6 | | | $ | 2.64 billion | | | | 1 | | | $ | 7.3 million | | | | 4 | | | $ | 1.49 million | | | | 0 | | | | 0 | | | | 0 | | | | | | | | 0 | | | | 0 | | | | 0 | |
Jeffrey Schmitz | | | 8 | | | $ | 4.54 billion | | | | 4 | | | $ | 114 million | | | | 3 | | | $ | 1.002 billion | | | | 0 | | | | 0 | | | | 0 | | | | | | | | 0 | | | | 0 | | | | 0 | |
| * | Assets are as of December 31, 2016. |
POTENTIAL MATERIAL CONFLICTS OF INTEREST
Actual or apparent conflicts of interest may arise when a portfolio manager has day-to-day management responsibilities with respect to more than one account. More specifically, portfolio managers who manage multiple accounts are presented a number of potential conflicts, including, among others, those discussed below.
The management of multiple accounts may result in a portfolio manager devoting unequal time and attention to the management of each account. Nuveen Asset Management seeks to manage such competing interests for the time and attention of portfolio managers by having portfolio managers focus on a particular investment discipline. Most accounts managed by a portfolio manager in a particular investment strategy are managed using the same investment models.
If a portfolio manager identifies a limited investment opportunity which may be suitable for more than one account, an account may not be able to take full advantage of that opportunity due to an allocation of filled purchase or sale orders across all eligible accounts. To deal with these situations, Nuveen Asset Management has adopted procedures for allocating limited opportunities across multiple accounts.
With respect to many of its clients’ accounts, Nuveen Asset Management determines which broker to use to execute transaction orders, consistent with its duty to seek best execution of the transaction. However, with respect to certain other accounts, Nuveen Asset Management may be limited by the client with respect to the selection of brokers or may be instructed to direct trades through a particular broker. In these cases, Nuveen Asset Management may place separate, non-simultaneous, transactions for a Fund and other accounts which may temporarily affect the market price of the security or the execution of the transaction, or both, to the detriment of the Fund or the other accounts.
Some clients are subject to different regulations. As a consequence of this difference in regulatory requirements, some clients may not be permitted to engage in all the investment techniques or transactions or to engage in these transactions to the same extent as the other
accounts managed by the portfolio manager. Finally, the appearance of a conflict of interest may arise where Nuveen Asset Management has an incentive, such as a performance-based management fee, which relates to the management of some accounts, with respect to which a portfolio manager has day-to-day management responsibilities.
Nuveen Asset Management has adopted certain compliance procedures which are designed to address these types of conflicts common among investment managers. However, there is no guarantee that such procedures will detect each and every situation in which a conflict arises.
Item 8(a)(3). FUND MANAGER COMPENSATION
Portfolio manager compensation consists primarily of base pay, an annual cash bonus and long term incentive payments.
Base pay. Base pay is determined based upon an analysis of the portfolio manager’s general performance, experience, and market levels of base pay for such position.
Annual cash bonus. The Fund’s portfolio managers are eligible for an annual cash bonus based on investment performance, qualitative evaluation and financial performance of Nuveen Asset Management.
A portion of each portfolio manager’s annual cash bonus is based on the Fund’s pre-tax investment performance, generally measured over the past one- and three or five-year periods unless the portfolio manager’s tenure is shorter. Investment performance for the Fund generally is determined by evaluating the Fund’s performance relative to its benchmark(s) and/or Lipper industry peer group.
A portion of the cash bonus is based on a qualitative evaluation made by each portfolio manager’s supervisor taking into consideration a number of factors, including the portfolio manager’s team collaboration, expense management, support of personnel responsible for asset growth, and his or her compliance with Nuveen Asset Management‘s policies and procedures.
The final factor influencing a portfolio manager’s cash bonus is the financial performance of Nuveen Asset Management based on its operating earnings.
Long-term incentive compensation. Certain key employees of Nuveen Asset Management, including certain portfolio managers, have received profits interests in Nuveen Asset Management which entitle their holders to participate in the firm’s growth over time.
There are generally no differences between the methods used to determine compensation with respect to the Fund and the Other Accounts shown in the table above.
Item 8(a)(4). OWNERSHIP OF JHY SECURITIES AS OF DECEMBER 31, 2016
| | | | | | | | | | | | | | | | | | | | | | | | | | | | |
Name of Portfolio Manager | | None | | | $1 -
$10,000 | | | $10,001-
$50,000 | | | $50,001-
$100,000 | | | $100,001-
$500,000 | | | $500,001-
$1,000,000 | | | Over
$1,000,000 | |
John Fruit | | | X | | | | | | | | | | | | | | | | | | | | | | | | | |
Jeffrey Schmitz | | | X | | | | | | | | | | | | | | | | | | | | | | | | | |
ITEM 9. PURCHASES OF EQUITY SECURITIES BY CLOSED-END MANAGEMENT INVESTMENT COMPANY AND AFFILIATED PURCHASERS.
Not applicable.
ITEM 10. SUBMISSION OF MATTERS TO A VOTE OF SECURITY HOLDERS.
There have been no material changes to the procedures by which shareholders may recommend nominees to the registrant’s Board implemented after the registrant last provided disclosure in response to this Item.
ITEM 11. CONTROLS AND PROCEDURES.
| | (a) | The registrant’s principal executive and principal financial officers, or persons performing similar functions, have concluded that the registrant’s disclosure controls and procedures (as defined in Rule 30a-3(c) under the Investment Company Act of 1940, as amended (the “1940 Act”) (17 CFR 270.30a-3(c))) are effective, as of a date within 90 days of the filing date of this report that includes the disclosure required by this paragraph, based on their evaluation of the controls and procedures required by Rule 30a-3(b) under the 1940 Act (17 CFR 270.30a-3(b)) and Rules 13a-15(b) or 15d-15 (b) under the Securities Exchange Act of 1934, as amended (the “Exchange Act”) (17 CFR 240.13a-15(b) or 240.15d-15 (b)). |
| | (b) | There were no changes in the registrant’s internal control over financial reporting (as defined in Rule 30a-3(d) under the 1940 Act (17 CFR 270.30a-3(d)) that occurred during the second fiscal quarter of the period covered by this report that has materially affected, or is reasonably likely to materially affect, the registrant’s internal control over financial reporting. |
ITEM 12. EXHIBITS.
File the exhibits listed below as part of this Form.
(a)(1) Any code of ethics, or amendment thereto, that is the subject of the disclosure required by Item 2, to the extent that the registrant intends to satisfy the Item 2 requirements through filing of an exhibit: Not applicable because the code is posted on registrant’s website at www.nuveen.com/CEF/Shareholder/FundGovernance.aspx and there were no amendments during the period covered by this report. (To view the code, click on Code of Conduct.)
(a)(2) A separate certification for each principal executive officer and principal financial officer of the registrant as required by Rule 30a-2(a) under the 1940 Act (17 CFR 270.30a-2(a)) in the exact form set forth below: Ex-99.CERT Attached hereto.
(a)(3) Any written solicitation to purchase securities under Rule 23c-1 under the 1940 Act (17 CFR 270.23c-1) sent or given during the period covered by the report by or on behalf of the registrant to 10 or more persons. Not applicable.
(b) If the report is filed under Section 13(a) or 15(d) of the Exchange Act, provide the certifications required by Rule 30a-2(b) under the 1940 Act (17 CFR 270.30a-2(b)); Rule 13a-14(b) or Rule 15d-14(b) under the Exchange Act (17 CFR 240.13a-14(b) or 240.15d-14(b)), and Section 1350 of Chapter 63 of Title 18 of the United States Code (18 U.S.C. 1350) as an exhibit. A certification furnished pursuant to this paragraph will not be deemed “filed” for purposes of Section 18 of the Exchange Act (15 U.S.C. 78r), or otherwise subject to the liability of that section. Such certification will not be deemed to be incorporated by reference into any filing under the Securities Act of 1933 or the Exchange Act, except to the extent that the registrant specifically incorporates it by reference. Ex-99.906 CERT attached hereto.
SIGNATURES
Pursuant to the requirements of the Securities Exchange Act of 1934 and the Investment Company Act of 1940, the registrant has duly caused this report to be signed on its behalf by the undersigned, thereunto duly authorized.
(Registrant) Nuveen High Income 2020 Target Term Fund
| | | | |
| By (Signature and Title) | | /s/ Gifford R. Zimmerman | | |
| | Gifford R. Zimmerman | | |
| | Vice President and Secretary | | |
| |
| Date: March 9, 2017 | | |
Pursuant to the requirements of the Securities Exchange Act of 1934 and the Investment Company Act of 1940, this report has been signed below by the following persons on behalf of the registrant and in the capacities and on the dates indicated.
| | | | |
| By (Signature and Title) | | /s/ Cedric H. Antosiewicz | | |
| | Cedric H. Antosiewicz | | |
| | Chief Administrative Officer | | |
| | (principal executive officer) | | |
| |
| Date: March 9, 2017 | | |
| | |
| By (Signature and Title) | | /s/ Stephen D. Foy | | |
| | Stephen D. Foy | | |
| | Vice President and Controller | | |
| | (principal financial officer) | | |
| |
| Date: March 9, 2017 | | |