UNITED STATES
SECURITIES AND EXCHANGE COMMISSION
Washington, D.C. 20549
FORM N-CSR
CERTIFIED SHAREHOLDER REPORT OF REGISTERED
MANAGEMENT INVESTMENT COMPANIES
| | |
Investment Company Act file number | | 811-23051 |
Nuveen High Income 2020 Target Term Fund
(Exact name of registrant as specified in charter)
Nuveen Investments
333 West Wacker Drive
Chicago, IL 60606
(Address of principal executive offices) (Zip code)
Gifford R. Zimmerman
Nuveen Investments
333 West Wacker Drive
Chicago, IL 60606
(Name and address of agent for service)
Registrant’s telephone number, including area code: (312) 917-7700
Date of fiscal year end: December 31
Date of reporting period: December 31, 2019
Form N-CSR is to be used by management investment companies to file reports with the Commission not later than 10 days after the transmission to stockholders of any report that is required to be transmitted to stockholders under Rule 30e-1 under the Investment Company Act of 1940 (17 CFR 270.30e-1). The Commission may use the information provided on Form N-CSR in its regulatory, disclosure review, inspection, and policymaking roles.
A registrant is required to disclose the information specified by Form N-CSR, and the Commission will make this information public. A registrant is not required to respond to the collection of information contained in Form N-CSR unless the Form displays a currently valid Office of Management and Budget (“OMB”) control number. Please direct comments concerning the accuracy of the information collection burden estimate and any suggestions for reducing the burden to Secretary, Securities and Exchange Commission, 450 Fifth Street, NW, Washington, DC 20549-0609. The OMB has reviewed this collection of information under the clearance requirements of 44 U.S.C. ss. 3507.
ITEM 1. REPORTS TO STOCKHOLDERS.

Closed-End Funds
31 December
2019
Nuveen Closed-End Funds
| | |
| JHY | | Nuveen High Income 2020 Target Term Fund |
| JHB | | Nuveen High Income November 2021 Target Term Fund |
| JHAA | | Nuveen High Income 2023 Target Term Fund |
Beginning on January 1, 2021, as permitted by regulations adopted by the Securities and Exchange Commission, paper copies of the Funds’ annual and semi-annual shareholder reports will no longer be sent by mail, unless you specifically request paper copies of the reports. Instead, the reports will be made available on the Funds’ website (www.nuveen.com), and you will be notified by mail each time a report is posted and provided with a website link to access the report.
If you have already elected to receive shareholder reports electronically, you will not be affected by this change and you need not take any action. You may elect to receive shareholder reports and other communications from the Funds electronically anytime by contacting the financial intermediary (such as a broker-dealer or bank) through which you hold your Fund shares or, if you are a direct investor, by enrolling at www.nuveen.com/e-reports.
You may elect to receive all future shareholder reports in paper free of charge at any time by contacting your financial intermediary or, if you are a direct investor, (i) by calling 800-257-8787 and selecting option #2 or (ii) by logging into your Investor Center account at www.computershare.com/investor and clicking on “Communication Preferences.” Your election to receive reports in paper will apply to all funds held in your account with your financial intermediary or, if you are a direct investor, to all your directly held Nuveen Funds and any other directly held funds within the same group of related investment companies.
Annual Report
Life is Complex
Nuveen makes things e-simple.
It only takes a minute to sign up fore-Reports. Once enrolled, you’ll receive ane-mail as soon as your Nuveen Fund information is ready—no more waiting for delivery by regular mail. Just click on the link within thee-mail to see the report and save it on your computer if you wish.
Free e-Reports right to your email!
www.investordelivery.com
If you receive your Nuveen Fund dividends and statements from your financial advisor or brokerage account.
or
www.nuveen.com/client-access
If you receive your Nuveen Fund dividends and statements directly from Nuveen.
NOT FDIC INSURED MAY LOSE VALUE NO BANK GUARANTEE
Table of Contents
3
Chair’s Letter to Shareholders

Dear Shareholders,
Financial markets finished 2019 on a high note, despite the challenges of a weak start to the year, a slower global economy and heightened geopolitical risks. While global manufacturing languished, consumers remained resilient amid tight labor markets, growing wages and tame inflation. Global business sentiment, however, was less optimistic due to trade frictions and weaker global demand. Across advanced economies growth in corporate profits and earnings was subdued in 2019. Nevertheless, the Federal Reserve’s (Fed) pivot to easing monetary conditions, along with liquidity provided by other central banks around the world, provided confidence that the economic cycle could be extended. Additionally, the year ended with a reduction in trade tensions and Brexit uncertainty, although the next phase of U.S.-China trade negotiations are expected to be more challenging and the U.K. has a relatively short transition window in which to redefine its relationship with the European Union.
We continue to anticipate muted economic growth and increased market volatility this year. The U.S. economy held steady in the second half of 2019, although growth for the year overall moderated from 2018’s pace. Consumer confidence remains underpinned by low unemployment and modest wage growth. Looser financial conditions, in part driven by the Fed’s three interest rate cuts in 2019, have revived momentum in the housing market and should continue to encourage borrowing by consumers and businesses. Although consumer spending in Europe and Japan, like in the U.S., has remained supported by jobs growth and rising wages, economic growth there appears more fragile. The COVID-19 coronavirus outbreak poses a new downside risk to the global economy, as disruptions to both demand and production ripple through global supply chains. We are closely monitoring the situation.
At Nuveen, we still see investment opportunities in the maturing economic environment, but we are taking a selective approach. If you’re concerned about where the markets are headed from here, we encourage you to work with your financial advisor to review your time horizon, risk tolerance and investment goals. On behalf of the other members of the Nuveen Fund Board, we look forward to continuing to earn your trust in the months and years ahead.
Sincerely,

Terence J. Toth
Chair of the Board
February 21, 2020
4
Portfolio Managers’ Comments
Nuveen High Income 2020 Target Term Fund (JHY)
Nuveen High Income November 2021 Target Term Fund (JHB)
Nuveen High Income 2023 Target Term Fund (JHAA)
Nuveen High Income 2020 Target Term Fund (JHY), Nuveen High Income November 2021 Target Term Fund (JHB) and Nuveen High Income 2023 Target Term Fund (JHAA) are closed-end funds that are advised by Nuveen Fund Advisors, LLC (NFAL) and feature portfolio management by Nuveen Asset Management, LLC (NAM). Kevin Lorenz, CFA, (March 26, 2019), Anders Persson, CFA, and Michael Ainge, CFA, serve as the portfolio managers on the Funds.
Effective July 31, 2019, Timothy Palmer is no longer be a portfolio manager on the Fund.
Here the Funds’ portfolio management team discusses the economy and financial markets, key investment strategies and the Funds’ performance for the twelve-month reporting period ended December 31, 2019.
What factors affected the U.S. economy and financial markets during the twelve-month reporting period ended December 31, 2019?
The U.S. economy reached the tenth year of expansion since the previous recession ended in June 2009, marking the longest expansion in U.S. history. In the fourth quarter of 2019, gross domestic product (GDP) grew at an annualized rate of 2.1%, according to the “advance” estimate by the Bureau of Economic Analysis. GDP measures the value of goods and services produced by the nation’s economy less the value of the goods and services used up in production, adjusted for price changes. In the final months of the year, the economy was boosted by moderate consumer spending, along with positive contributions from government spending and trade, which offset weakness in business investment. For 2019 as a whole, U.S. GDP grew 2.3%, a decline from 2.9% in 2018 and the slowest pace since 2016.
Consumer spending, the largest driver of the economy, remained well supported by low unemployment, wage gains and tax cuts. As reported by the Bureau of Labor Statistics, the unemployment rate fell to 3.5% in December 2019 from 3.9% in December 2018 and job gains averaged around 176,000 per month for the past twelve months. As the jobs market has tightened, average hourly earnings grew at an annualized rate of 2.9% in December 2019. However, inflation remained subdued. The Bureau of Labor Statistics said the Consumer Price Index (CPI) increased 2.3% over the twelve-month reporting period ended December 31, 2019 before seasonal adjustment.
Low mortgage rates and low inventory drove home prices moderately higher in this reporting period, despite declining new home sales and housing starts. The S&P CoreLogic Case-Shiller U.S. National Home Price Index, which covers all
This material is not intended to be a recommendation or investment advice, does not constitute a solicitation to buy, sell or hold a security or an investment strategy and is not provided in a fiduciary capacity. The information provided does not take into account the specific objectives or circumstances of any particular investor, or suggest any specific course of action. Investment decisions should be made based on an investor’s objectives and circumstances and in consultation with his or her advisors.
Certain statements in this report are forward-looking statements. Discussions of specific investments are for illustration only and are not intended as recommendations of individual investments. The forward-looking statements and other views expressed herein are those of the portfolio managers as of the date of this report. Actual future results or occurrences may differ significantly from those anticipated in any forward-looking statements and the views expressed herein are subject to change at any time, due to numerous market and other factors. The Funds disclaim any obligation to update publicly or revise any forward-looking statements or views expressed herein.
For financial reporting purposes, the ratings disclosed are the highest rating given by one of the following national rating agencies: Standard & Poor’s (S&P), Moody’s Investors Service, Inc. (Moody’s) or Fitch, Inc. (Fitch). This treatment of split-rated securities may differ from that used for other purposes, such as for Fund investment policies. Credit ratings are subject to change. AAA, AA, A and BBB are investment grade ratings; BB, B, CCC, CC, C and D are below investment grade ratings. Holdings designated N/R are not rated by these national rating agencies.
Refer to the Glossary of Terms Used in this Report for further definition of the terms used within this section.
5
Portfolio Managers’ Comments(continued)
nine U.S. census divisions, was up 3.5% year-over-year in November 2019 (most recent data available at the time this report was prepared). The 10-City and 20-City Composites reported year-over-year increases of 2.0% and 2.6%, respectively.
As data pointed to slower momentum in the overall economy, the Federal Reserve (Fed) notably shifted its stance. Although the Fed had indicated in December 2018 that there could be two more rate hikes in 2019, global growth concerns kept the central bank on the sidelines. As expected by the markets, the Fed left rates unchanged throughout the first half of 2019 while speculation increased that the Fed’s next move would be a rate cut. At the July 2019, September 2019 and October 2019 policy committee meetings, the Fed announced a 0.25% cut to its main policy rate. Markets registered disappointment with the Fed’s explanation that the rate cuts were a “mid-cycle adjustment,” rather than a prolonged easing period, and its signal that there would be no additional rate cuts in 2019. Also in the latter half of 2019, the Fed announced it would stop shrinking its bond portfolio sooner than scheduled, as well as began buying short-term Treasury bills to help money markets operate smoothly and maintain short-term borrowing rates at low levels. Fed Chairman Powell emphasized that the Treasury bill purchases were not a form of quantitative easing.
During the twelve-month reporting period, geopolitical news remained a prominent market driver. Tariff and trade policy topped the list of concerns, most prominently the U.S.-China relations. After several rounds of talks, escalating rhetoric from both sides and a series of tariff increases, tensions appeared to ease in the later months of 2019. The U.S. and China signaled their agreement on a partial trade deal, which included rolling back some tariffs, increasing China’s purchases of U.S. agriculture products and the consideration of intellectual property, technology and financial services rights. (Subsequent to the close of the reporting period, the “phase one” deal was signed on January 15, 2020.) While much of the focus remained on the U.S.-China relationship, trade spats between the U.S. and Mexico, the European Union, Brazil and Argentina also arose throughout the reporting period. More than a year after the three countries signed onto the U.S., Mexico and Canada Agreement (USMCA) trade deal, which replaces the North American Free Trade Agreement, the U.S. House of Representatives approved the deal in December 2019 (and, subsequent to the close of the reporting period, the Senate voted in January 2020 to approve it). Global manufacturing and export data continued to show evidence of trade-related slumps, which increased worries that the slowdown would spread into other segments of the global economy.
The Brexit saga also appeared to make a breakthrough by the end of 2019. After former Prime Minister Theresa May was unable to secure a Brexit deal by the original March 29, 2019 deadline, she resigned as of June 7, 2019. When her successor, Boris Johnson, failed to meet the EU’s first deadline extension of October 31, 2019, the EU approved a “flextension” to January 31, 2020. A U.K. general election was scheduled for December 2019, wherein the Conservative Party won a large majority and bolstered Prime Minister Johnson’s mandate to get Brexit done. A few days later, the British Parliament passed the Brexit Bill. In Italy, investors worried about another potential budget clash between the eurosceptic coalition government and the EU. However, following the unexpected resignation of the prime minister in August 2019, the newly formed coalition government appeared to take a less antagonistic stance. Europe also contended with the “yellow vest” protests in France, immigration policy concerns, Russian sanctions and political risk in Turkey.
Elsewhere, anti-government protests erupted across Latin America, Hong Kong and Lebanon during 2019, and Venezuela’s economic and political crisis deepened. In Argentina, markets were shocked by the defeat of incumbent President Macri, prompting concerns about the economic policies favored by the incoming Fernandez administration. Brazil’s Bolsonaro administration achieved a legislative win on pension reform and kept the economy on a path of modest growth. Europe’s traditional centrist parties lost seats in the May 2019 Parliamentary elections and populist parties saw marginal gains. The ruling parties in India and South Africa maintained their majorities, where slower economic growth could complicate their respective reform mandates.
6
Nuveen High Income 2020 Target Term Fund (JHY)
What key strategies were used to manage the Fund during this twelve-month reporting period ended December 31, 2019?
The Fund has an objective to provide a high level of current income and to return the original $9.85 net asset value (NAV) per common share on or about November 1, 2020. The Fund will seek to achieve its investment objectives by investing primarily in shorter maturity, high yield (below investment grade) corporate debt securities. High yield bonds typically offer higher yields than investment grade bonds, in exchange for greater credit risk. Bonds with shorter maturities have lower duration (or interest rate sensitivity) than longer maturity bonds, which may help mitigate price declines if rates rise.
The Fund may invest in other types of securities including senior loans, convertible securities and other types of debt instruments and derivatives that provide comparable economic exposure to the corporate debt market. At least 80% of its managed assets will be in corporate debt securities and separately, at least 80% in securities that, at the time of investment, are rated below investment grade or are unrated but judged by the portfolio managers to be of comparable quality. No more than 15% will be in securities rated CCC+/Caa1 or lower at the time of investment. Up to 30% may be in securities of non-U.S. issuers, including up to 20% in emerging market issuers and up to 10% may be in non- U.S. dollar denominated securities.
The Fund seeks to identify securities across diverse sectors and industries that the managers believe are undervalued or mispriced. In seeking to return the original NAV on or about November 1, 2020, the Fund intends to utilize various portfolio and cash flow management techniques, including setting aside a portion of its net investment income, possibly retaining gains and limiting the longest maturity of any holding to no later than May 1, 2021. The Fund also uses leverage.
How did the Fund perform during this twelve-month reporting period ended December 31, 2019?
The table in the Performance Overview and Holding Summaries section of this report provides total return performance for the Fund for the one-year and since inception periods ended December 31, 2019. For the twelve-month reporting period ended December 31, 2019, the Fund underperformed the Bloomberg Barclays U.S. High Yield 1-5 Year Cash Pay 2% Issuer Capped Index based on the Fund’s total return at NAV.
Throughout the reporting period, the high yield market continued to be supported by dovish central banks and stable credit fundamentals. The technical backdrop was also strong as capital from around the globe continued to flow into the asset class in the hunt for yield in the ultra-low rate environment. Although earnings momentum moderated in the fourth quarter 2019, the supportive macro backdrop and more favorable business sentiment going into 2020 collapsed market volatility, providing a strong tailwind for valuations in the high yield market. Spreads tightened throughout the reporting period revisiting their post-crisis lows by the end of the reporting period, particularly in the higher quality segment of the market, and the high yield asset class produced strong returns. The spread of the Bloomberg Barclays U.S. High Yield 1-5 Year Index decreased 187 basis points during the reporting period to end at 376 basis points over Treasuries, taking the yield on the index from 8.26% to 5.40%.
The higher quality tiers of high yield outpaced lower quality bonds for the reporting period as a whole as they had since the beginning of the reporting period. However, in the final months of the reporting period, we saw a reversal and more volatile, lower quality credits outperformed higher quality issues within the asset class, despite various sorts of headline risk. The demand for riskier assets was generally aided by improved forward-looking sentiment and the energy sector, specifically, as oil prices rose. CCC rated credit handily outperformed both the BB and B segments during December 2019, but still registered the lowest return of the ratings categories during 2019. Nonetheless, the “risk-on” mentality in the final few months of the reporting period encouraged investors to put idle dollars to work. The increased demand for risk also allowed for high yield issuance to hit record levels as the reporting period came to a close.
7
Portfolio Managers’ Comments(continued)
The Fund underperformed the benchmark during the reporting period, which is to be expected as it approaches its termination date. The Fund’s duration decreased as its investments approached their maturities in late 2020. Also, portfolio holdings, which have a shorter maturity profile than the broad high yield universe, traded at or near their call prices over the course of the year, dampening further return potential. In addition, the opportunity set of investments has substantially decreased as the Fund approaches its maturity date and bonds continued to be tendered or called by issuers. Over the course of the reporting period, rates and spreads have decreased, while issuers continued to extend their maturity profiles. As all-in yields declined and issuers extended the maturity profile of new bond issues, there were fewer available opportunities in short-term securities for the Fund.
Also, the Fund’s higher cash position was a fairly significant drag on performance given the spread tightening in the high yield and leverage loan markets. In addition, the Fund was hindered by an underweight position in the consumer non-cyclical sector. Because the Fund is getting closer to its 2020 maturity date, we had to maintain underweight exposure to certain credits in the consumer non-cyclical sector that had extended the majority of their debt issues beyond 2020.
The Fund benefited from an underweight position in CCC rated bonds versus the benchmark, because higher quality credit rallied over the course of the reporting period while lower quality broadly lagged. Additionally, security selection within high yield credit was highly accretive to return. The Fund benefited from overweight positions in credits such as JC Penney and Eldorado Gold, which provided strong total returns in a comeback after these and many other high yield credits were broadly shunned in the late 2018 sell-off. Also, limited or no exposure to credits that became distressed, went into default or had significant balance sheet restructuring events throughout the year was also a large contributor. Performance also benefited from our selection within basic industry and underweight exposure to the energy sector. Within energy, the Fund benefited from successful industry weights, including an overweight to the best performing subsector, refining, and an underweight position in the lowest returning energy subsector, oil field services.
The Fund’s NAV rose fairly significantly along with the strong high yield market conditions, driven in part by a sharp decrease in yields during the reporting period. During the reporting period as a whole, Treasury yields fell, but more so at the front end of the yield curve driven by the Fed rate cuts. The yield on one-year Treasuries, for example, fell 101 basis points to end at 1.59%, while the yield on five-year Treasury securities ended the reporting period at 1.69%, which was 80 basis points lower than it was at the end of 2018. As a result, the Treasury yield curve re-steepened following the year’s earlier inversion, which happens when short-term interest rates are higher than longer-term rates. The Fund’s NAV increased by $0.31 per share during the reporting period and ended the reporting period close to its termination target at $9.79 per share.
As noted above, we saw little in the way of fundamental credit deterioration among portfolio credits and the Fund had no defaults. We continue to position the portfolio in high income-producing investments that will make timely interest and principal payments in order to meet the objective of returning the original NAV on the final term date of the Fund. While the global economy is on stable footing, spread tightening took valuations to near peak levels over the course of the reporting period, especially in the higher quality segment of the high yield market. We have adopted a cautious stance on valuations while maintaining diversification across credits. We are currently maintaining a cash balance, which gives our team the flexibility to conduct thorough, bottom-up research on each opportunity in terms of many risk factors, including current valuations, which remain at historically elevated levels. We have maintained overweights to higher quality assets with more stable free cash flow profiles (utilities and transportation infrastructure) and remain underweight in sectors with more volatile balance sheet characteristics (energy and cyclicals). We also continued to manage calls, maturities and the cash flow profile of the Fund with the target of managing yield in light of the Fund’s approaching termination date.
8
Nuveen High Income November 2021 Target Term Fund (JHB)
What key strategies were used to manage the Fund during this twelve-month reporting period ended December 31, 2019?
The Fund has an objective to provide a high level of current income and to return the original $9.85 net asset value (NAV) per common share on or about November 1, 2021. The Fund will seek to achieve its investment objectives by investing primarily in shorter maturity, high yield (below investment grade) corporate debt securities. High yield bonds typically offer higher yields than investment grade bonds, in exchange for greater credit risk. Bonds with shorter maturities have lower duration (or interest rate sensitivity) than longer maturity bonds, which may help mitigate price declines if rates rise.
The Fund may invest in other types of securities including senior loans, convertible securities and other types of debt instruments and derivatives that provide comparable economic exposure to the corporate debt market. At least 80% of its managed assets will be in corporate debt securities and separately, at least 80% in securities that, at the time of investment, are rated below investment grade or are unrated but judged by the portfolio managers to be of comparable quality. No more than 15% will be in securities rated CCC+/Caa1 or lower at the time of investment. Up to 30% may be in securities of non-U.S. issuers, including up to 20% in emerging market issuers and up to 10% may be in non- U.S. dollar denominated securities.
The Fund seeks to identify securities across diverse sectors and industries that the managers believe are undervalued or mispriced. In seeking to return the original NAV on or about November 1, 2021, the Fund intends to utilize various portfolio and cash flow management techniques, including setting aside a portion of its net investment income, possibly retaining gains and limiting the longest maturity of any holding to no later than May 1, 2022. The Fund also uses leverage.
How did the Fund perform during this twelve-month reporting period ended December 31, 2019?
The table in the Performance Overview and Holding Summaries section of this report provides total return performance for the Fund for the one-year and since inception periods ended December 31, 2019. For the twelve-month reporting period ended December 31, 2019, the Fund outperformed the Bloomberg Barclays U.S. High Yield 1-5 Year Cash Pay 2% Issuer Capped Index based on the Fund’s total return at NAV.
Throughout the reporting period, the high yield market continued to be supported by dovish central banks and stable credit fundamentals. The technical backdrop was also strong as capital from around the globe continued to flow into the asset class in the hunt for yield in the ultra-low rate environment. Although earnings momentum moderated in the fourth quarter 2019, the supportive macro backdrop and more favorable business sentiment going into 2020 collapsed market volatility, providing a strong tailwind for valuations in the high yield market. Spreads tightened throughout the reporting period revisiting their post-crisis lows by the end of the reporting period, particularly in the higher quality segment of the market, and the high yield asset class produced strong returns. The spread of the Bloomberg Barclays U.S. High Yield 1-5 Year Index decreased 187 basis points over the reporting period to end at 376 basis points over Treasuries, taking the yield on the index from 8.26% to 5.40%.
The higher quality tiers of high yield outpaced lower quality bonds for the reporting period as a whole as they had since the beginning of the reporting period. However, in the final months of the reporting period, we saw a reversal and more volatile, lower quality credits outperformed higher quality issues within the asset class, despite various sorts of headline risk. The demand for riskier assets was generally aided by improved forward-looking sentiment and the energy sector, specifically, as oil prices rose. CCC rated credit handily outperformed both the BB and B segments during December 2019, but still registered the lowest return of the ratings categories during 2019. Nonetheless, the “risk-on” mentality in the final few months of the reporting encouraged investors to put idle dollars to work. The increased demand for risk also allowed for high yield issuance to hit record levels as the came reporting period to a close.
9
Portfolio Managers’ Comments(continued)
The Fund outperformed the benchmark during the reporting period, driven in part by the positive impact from its various credit quality exposures. In particular, performance was enhanced by overweight positions in the BB and single B rating categories and an underweight position in CCC rated bonds versus the benchmark, because higher quality credit rallied over the course of the reporting period. Additionally, security selection within high yield credit was highly accretive to return. The Fund benefited from overweight positions in credits such as AK Steel, Owens & Minor and Springleaf Finance, which provided strong total returns after these and many other high yield credits were broadly shunned in the late 2018 sell-off. Also, limited or no exposure to credits that became distressed, went into default or had significant balance sheet restructuring events throughout the year was also a large contributor. Performance also benefited from our selection within basic industry and underweight exposure to the energy sector. Within energy, the Fund benefited from successful industry weights, including an overweight to the best performing subsector, refining, and an underweight position in the lowest returning energy subsector, oil field services.
On the other hand, the Fund’s shorter duration was a drag on performance. The Fund’s duration decreased as its investments got closer to their maturities in late 2021. Also, portfolio holdings, which have a shorter maturity profile than the broad high yield universe, traded at or near their call prices over the course of the reporting period, dampening further return potential. In addition, the opportunity set of investments has substantially decreased as the Fund approaches its maturity date and bonds continued to be tendered or called by issuers. Over the course of the reporting period, rates and spreads have decreased, while issuers continued to extend their maturity profiles. As all-in yields declined and issuers extended the maturity profile of new bond issues, there were fewer available opportunities in short-term securities for the Fund.
Also, the Fund’s higher cash position was a fairly significant drag on performance given the spread tightening in the high yield and leverage loan markets. In addition, the Fund was hindered by an underweight position in the consumer non-cyclical sector. Because the Fund is getting closer to its 2021 maturity date, it had to maintain underweight exposure to certain credits in the consumer non-cyclical sector that had extended the majority of their debt issues beyond 2021.
The Fund’s NAV rose fairly significantly along with the strong high yield market conditions, driven in part by a sharp decrease in yields during the reporting period. Over the reporting period as a whole, Treasury yields fell, but more so at the front end of the yield curve driven by the Fed rate cuts. The yield on one-year Treasuries, for example, fell 101 basis points to end at 1.59%, while the yield on five-year Treasury securities ended the reporting period at 1.69%, which was 80 basis points lower than it was at the end of 2018. As a result, the Treasury yield curve re-steepened following the year’s earlier inversion, which happens when short-term interest rates are higher than longer-term rates. The Fund’s NAV increased by $0.47 per share during the reporting period and ended the reporting period above its termination target at $9.97 per share.
As noted above, we saw little in the way of fundamental credit deterioration among portfolio credits and the Fund had no defaults. We continue to position the portfolio in high income-producing investments that will make timely interest and principal payments in order to meet the objective of returning the original NAV on the final term date of the Fund. While the global economy is on stable footing, spread tightening took valuations to near peak levels over the course of the year, especially in the higher quality segment of the high yield market. We have adopted a cautious stance on valuations while maintaining diversification across credits. We have also increased allocations to leveraged loans to protect against the risk that the interest rate outlook changes from the current dovish stance across global central banks. We are currently maintaining a cash balance, which gives our team the flexibility to conduct thorough, bottom-up research on each opportunity in terms of many risk factors, including current valuations, which remain at historically elevated levels. We have maintained overweights to higher quality assets with more stable free cash flow profiles (utilities and transportation infrastructure) and remain underweight in sectors with more volatile balance sheet characteristics (energy and cyclicals). We also continued to manage calls, maturities and the cash flow profile of the Fund with the target of managing yield in light of the Fund’s termination date.
10
Nuveen High Income 2023 Target Term Fund (JHAA)
What key strategies were used to manage the Fund during this twelve-month reporting period ended December 31, 2019?
The Fund has an objective to provide a high level of current income and to return the original $9.875 net asset value (NAV) per common share on or about December 1, 2023. The Fund seeks to protect against credit losses to help ensure the goal of returning its original NAV. While the Fund is designed to own more or less a static portfolio of high yield bonds, at times we have to add new securities to replace ones that have been called away or tendered. As we replace these bonds, we will seek to maximize the Fund’s yield within the maturity, diversification and credit quality constraints described at the outset of the strategy. We may also look to maximize the Fund’s yield through opportunistic sales of securities that we believe have reached their upside potential, investing the proceeds in other securities that have a more attractive yield or credit profile. Our goal is to monetize some holdings at a gain, which should help to offset any realized or mark-to-market losses that may occur elsewhere in the portfolio. We believe the Fund’s focus on shorter dated maturities, coupled with limitations to CCC rated securities, should result in lower volatility and help buffer its NAV performance during periods of weakness for the high yield market.
How did the Fund perform during this twelve-month reporting period ended December 31, 2019?
The table in the Performance Overview and Holding Summaries section of this report provides total return performance for the Fund for the one-year and since inception periods ended December 31, 2019. For the twelve-month reporting period ended December 31, 2019, the Fund outperformed the Bloomberg Barclays U.S. High Yield 1-5 Year Cash Pay 2% Issuer Capped Index based on the Fund’s total return at NAV.
Throughout the reporting period, high yield market continued to be supported by dovish central banks and stable credit fundamentals. The technical backdrop was also strong as capital from around the globe continued to flow into the asset class in the hunt for yield in the ultra-low rate environment. Although earnings momentum moderated in the fourth quarter 2019, the supportive macro backdrop and more favorable business sentiment going into 2020 collapsed market volatility, providing a strong tailwind for valuations in the high yield market. Spreads tightened throughout the reporting period revisiting their post-crisis lows by the end of the reporting period, particularly in the higher quality segment of the market, and the high yield asset class produced strong returns. The spread of the Bloomberg Barclays U.S. High Yield 1-5 Year Index decreased 187 basis points during the reporting period to end at 376 basis points over Treasuries, taking the yield on the index from 8.26% to 5.40%.
The higher quality tiers of high yield outpaced lower quality bonds for the reporting period as a whole as they had since the beginning of the reporting period. However, in the final months of the reporting period, we saw a reversal and more volatile, lower quality credits outperformed higher quality issues within the asset class, despite various sorts of headline risk. The demand for riskier assets was generally aided by improved forward-looking sentiment and the energy sector, specifically, as oil prices rose. CCC rated credit handily outperformed both the BB and B segments during December 2019, but still registered the lowest return of the ratings categories during 2019. Nonetheless, the “risk-on” mentality in the final few months of the reporting period encouraged investors to put idle dollars to work. The increased demand for risk also allowed for high yield issuance to hit record levels as the year came to a close.
The Fund outperformed the benchmark during the reporting period, driven in part by the positive impact from its various credit quality exposures. In particular, performance was enhanced by overweight positions in the BB and single B rating categories and an underweight position in CCC rated bonds versus the benchmark, because higher quality credit rallied over the course of the reporting period. Additionally, security selection within high yield credit was highly accretive to return. The Fund benefited from overweight positions in credits such as FMG Resources, Nova Chemicals and Springleaf Finance, which provided strong total returns in a comeback after these and many other high yield credits were broadly shunned in the late 2018 sell-off. Also, limited or no exposure to credits that became distressed was also a
11
Portfolio Managers’ Comments(continued)
large contributor. The Fund had no exposure to credits that went into default or had significant balance sheet restructuring events throughout the reporting period. Performance also benefited from our underweight exposure to the energy sector, but beneficial industry weights within the sector including an overweight and market weight to the two best performing subsectors, refining and midstream. The Fund was also rewarded for an underweight position in the lowest returning energy subsector, oil field services.
The Fund’s large exposure to leveraged loans was a detractor during the reporting period. The potential for further price appreciation in the loan asset class was limited as the interest rate outlook shifted over the course of the reporting period and the Fed cut rates. Loans are a floating-rate asset class and their coupons decrease as rates decrease. As a result, the segment underperformed the high yield market and therefore detracted on a relative basis versus the benchmark, which is comprised of all high yield securities.
The Fund’s NAV rose fairly significantly along with the strong high yield market conditions, driven in part by a sharp decrease in yields during the reporting period. Over the reporting period as a whole, Treasury yields fell, but more so at the front end of the yield curve driven by the Fed rate cuts. The yield on one-year Treasuries, for example, fell 101 basis points to end at 1.59%, while the yield on five-year Treasury securities ended the reporting period at 1.69%, which was 80 basis points lower than it was at the end of 2018. As a result, the Treasury yield curve re-steepened following the year’s earlier inversion, which happens when short-term interest rates are higher than longer-term rates. The Fund’s NAV increased by $0.51 per share during the reporting and ended the reporting period well above its termination target at $10.36 per share.
As noted above, we saw little in the way of fundamental credit deterioration among portfolio credits and the Fund had no defaults. We continue to position the portfolio in high income-producing investments that will make timely interest and principal payments in order to meet the objective of returning the original NAV on the final term date of the Fund. While the global economy is on stable footing, spread tightening took valuations to near peak levels over the course of the year, especially in the higher quality segment of the high yield market. We have adopted a cautious stance on valuations while maintaining diversification across BB and B rated credits. At the same time, we have increased allocations to leveraged loans and lower rated bonds where we believe our underwriting process has identified appropriately priced opportunities. We are currently maintaining a cash balance, which gives our team the flexibility to conduct thorough, bottom-up research on each opportunity in terms of many risk factors, including current valuations, which remain at historically elevated levels. We have maintained overweights to higher quality assets with more stable free cash flow profiles (utilities and transportation infrastructure) and remain underweight in sectors with more volatile balance sheet characteristics (energy). We also continued to manage calls, maturities and the cash flow profile of the Fund with the target of managing yield in light of the Fund’s termination date.
12
Fund Leverage
IMPACT OF THE FUNDS’ LEVERAGE STRATEGIES ON PERFORMANCE
One important factor impacting the returns of the Funds’ common shares relative to their comparative benchmarks was the Funds’ use of leverage through borrowings as well as the use of reverse repurchase agreements for JHAA. The Funds use leverage because our research has shown that, over time, leveraging provides opportunities for additional income. The opportunity arises when short-term rates that the Fund pays on its leveraging instruments are lower than the interest the Funds earn on its portfolio securities that it has bought with the proceeds of that leverage. This has been particularly true in the recent market environment where short-term rates have been low by historical standards.
However, use of leverage can expose Fund common shares to additional price volatility. When a Fund uses leverage, the Fund’s common shares will experience a greater increase in their net asset value if the securities acquired through the use of leverage increase in value, but will also experience a correspondingly larger decline in their net asset value if the securities acquired through leverage decline in value, which will make the shares’ net asset value more volatile, and total return performance more variable, over time.
In addition, common share income in levered funds will typically decrease in comparison to unlevered funds when short-term interest rates increase and increase when short-term interest rates decrease. In recent quarters, fund leverage expenses have generally tracked the overall movement of short-term tax-exempt interest rates. While fund leverage expenses are somewhat higher than their all-time lows after the 2007-2009 financial crisis, which has contributed to a reduction in common share net income and long-term total return potential, leverage nevertheless continues to provide the opportunity for incremental common share income. Management believes that the potential benefits from leverage continue to outweigh the associated increase in risk and volatility previously described.
The Funds’ use of leverage had a positive impact on total return performance during this reporting period.
As of December 31, 2019, the Funds’ percentages of leverage are shown in the accompanying table.
| | | | | | | | | | | | |
| | | JHY | | | JHB | | | JHAA | |
Effective Leverage* | | | 28.46 | % | | | 25.63 | % | | | 25.35 | % |
Regulatory Leverage* | | | 28.46 | % | | | 25.63 | % | | | 25.01 | % |
| * | Effective Leverage is a Fund’s effective economic leverage, and includes both regulatory leverage and the leverage effects of reverse repurchase agreements, certain derivative and other investments in a Fund’s portfolio that increase the Fund’s investment exposure. Regulatory leverage consists of preferred shares issued or borrowings of a Fund. Both of these are part of a Fund’s capital structure. A Fund, however, may from time to time borrow on a typically transient basis in connection with its day-to-day operations, primarily in connection with the need to settle portfolio trades. Such incidental borrowings are excluded from the calculation of a Fund’s effective leverage ratio. Regulatory leverage is subject to asset coverage limits set forth in the Investment Company Act of 1940. |
THE FUNDS’ REGULATORY LEVERAGE
Bank Borrowings
As noted above, the Funds employ leverage through the use of bank borrowings. The Funds’ bank borrowing activities are as shown in the accompanying table.
| | | | | | | | | | | | | | | | | | | | | | | | | | | | | | | | | | | | |
| | | Current Reporting Period | | | | | | Subsequent to the Close of
the Reporting Period | |
| Fund | | January 1, 2019 | | | Draws | | | Paydowns | | | December 31, 2019 | | | Average Balance
Outstanding | | | | | | Draws | | | Paydowns | | | February 27, 2020 | |
JHY | | $ | 61,500,000 | | | $ | — | | | $ | — | | | $ | 61,500,000 | | | $ | 61,500,000 | | | | | | | $ | — | | | $ | (42,000,000 | ) | | $ | 19,500,000 | |
JHB | | $ | 190,000,000 | | | $ | 17,000,000 | | | $ | (15,000,000 | ) | | $ | 192,000,000 | | | $ | 204,010,959 | | | | | | | $ | — | | | $ | (50,000,000 | ) | | $ | 142,000,000 | |
JHAA | | $ | — | | | $ | 28,025,000 | | | $ | (1,000,000 | ) | | $ | 27,025,000 | | | $ | 26,125,352 | | | | | | | $ | — | | | $ | — | | | $ | 27,025,000 | |
13
Fund Leverage(continued)
Refer to Notes to Financial Statements, Note 8 – Fund Leverage, Borrowings for further details.
Reverse Repurchase Agreements
As noted above, JHAA utilized reverse repurchase agreements, in which the Fund sells to a counterparty a security that it holds with a contemporaneous agreement to repurchase the same security at an agreed-upon price and date. The Fund’s transactions in reverse repurchase agreements are as shown in the accompanying table.
| | | | | | | | | | | | | | | | | | | | | | | | | | | | | | | | | | | | |
| | | Current Reporting Period | | | | | | Subsequent to the Close of
the Reporting Period | |
| Fund | | January 1, 2019 | | | Sales | | | Purchases | | | December 31, 2019 | | | Average Balance
Outstanding | | | | | | Sales | | | Purchases | | | February 27, 2020 | |
JHAA | | $ | — | | | $ | 2,000,000 | | | $ | (1,510,000 | ) | | $ | 490,000 | | | $ | 1,227,143 | | | | | | | $ | — | | | $ | — | | | $ | 490,000 | |
Refer to Notes to Financial Statements, Note 8 – Fund Leverage, Reverse Repurchase Agreements for further details.
14
Common Share Information
COMMON SHARE DISTRIBUTION INFORMATION
The following information regarding the Funds’ distributions is current as of December 31, 2019. Each Fund’s distribution levels may vary over time based on each Fund’s investment activity and portfolio investment value changes.
During the current reporting period, the Funds’ distributions to common shareholders were as shown in the accompanying table.
| | | | | | | | | | | | |
| | | Per Common Share Amounts | |
| Monthly Distributions(Ex-Dividend Date) | | JHY | | | JHB | | | JHAA | |
January 2019 | | $ | 0.0390 | | | $ | 0.0465 | | | $ | — | |
February | | | 0.0390 | | | | 0.0465 | | | | 0.0520 | |
March | | | 0.0350 | | | | 0.0415 | | | | 0.0520 | |
April | | | 0.0350 | | | | 0.0415 | | | | 0.0520 | |
May | | | 0.0350 | | | | 0.0415 | | | | 0.0520 | |
June | | | 0.0350 | | | | 0.0415 | | | | 0.0520 | |
July | | | 0.0350 | | | | 0.0415 | | | | 0.0520 | |
August | | | 0.0350 | | | | 0.0415 | | | | 0.0520 | |
September | | | 0.0263 | | | | 0.0415 | | | | 0.0520 | |
October | | | 0.0263 | | | | 0.0415 | | | | 0.0520 | |
November | | | 0.0263 | | | | 0.0415 | | | | 0.0520 | |
December 2019 | | | 0.0160 | | | | 0.0415 | | | | 0.0520 | |
Total Distributions from Net Investment Income | | | 0.3829 | | | | 0.5080 | | | | 0.5720 | |
| | | |
Current Distribution Rate* | | | 1.97 | % | | | 4.98 | % | | | 5.75 | % |
| * | Current distribution rate is based on the Fund’s current annualized monthly distribution divided by the Fund’s current market price. The Fund’s monthly distributions to its shareholders may be comprised of ordinary income, net realized capital gains and, if at the end of the fiscal year the Fund’s cumulative net ordinary income and net realized gains are less than the Fund’s distributions, a return of capital for tax purposes. |
Each Fund seeks to pay regular monthly dividends out of its net investment income at a rate that reflects its past and projected net income performance. To permit each Fund to maintain a more stable monthly dividend, the Fund may pay dividends at a rate that may be more or less than the amount of net income actually earned by the Fund during the period. Distributions to shareholders are determined on a tax basis, which may differ from amounts recorded in the accounting records. In instances where the monthly dividend exceeds the earned net investment income, the Fund would report a negative undistributed net ordinary income. Refer to Note 6 – Income Tax Information for additional information regarding the amounts of undistributed net ordinary income and undistributed net long-term capital gains and the character of the actual distributions paid by the Fund during the period.
All monthly dividends paid by JHY and JHAA during the current reporting period were paid from net investment income. If a portion of the Fund’s monthly distributions is sourced or comprised of elements other than net investment income, including capital gains and/or a return of capital, shareholders will be notified of those sources. For financial reporting purposes, the per share amounts of each Fund’s distributions for the reporting period are presented in this report’s Financial Highlights. For income tax purposes, distribution information for each Fund as of its most recent tax year end is presented in Note 6 – Income Tax Information within the Notes to Financial Statements of this report.
JHB pays a regular monthly distribution to shareholders based on dividends and interest received from portfolio securities, net of expense. During the current fiscal year, JHB realized long term gains on its investments. As a result, a portion of JHB’s fiscal year distributions have been deemed to be long term gains, which is identified in the following table.
15
Common Share Information(continued)
The amounts and sources of distributions reported in this notice are for financial reporting purposes and are not being provided for tax reporting purposes. The actual amounts and character of the distributions for tax reporting purposes is reported to shareholders on Form 1099-DIV which will be sent to shareholders shortly after calendar year-end. More details about the Fund’s distributions and the basis for these estimates are available on www.nuveen.com/closed-end-funds.
Data as of December 31, 2019
| | | | | | | | | | | | | | | | | | | | | | | | | | | | | | | | | | | | |
| | | | | | Fiscal Year Source of Distribution | | | | | | Fiscal Year Per Share Amounts | |
| Fund | | Per Share
Distribution | | | Net
Investment
Income | | | Realized
Gains | | | Return of
Capital | | | | | | Distributions | | | Net
Investment
Income | | | Realized
Gains | | | Return of
Capital | |
JHB (FYE 12/31) | | $ | 0.0415 | | | | 99.55 | % | | | 0.45 | % | | | 0.0 | % | | | | | | $ | 0.5080 | | | $ | 0.5057 | | | $ | 0.0023 | | | $ | — | |
CHANGE IN METHOD OF PUBLISHING NUVEEN CLOSED-END FUND DISTRIBUTION AMOUNTS
During November 2019, the Nuveen Closed-End Funds discounted the practice of announcing Fund distribution amounts and timing via press release. Instead, information about the Nuveen Closed-End Funds’ monthly and quarterly periodic distributions to shareholders are posted and can be found on Nuveen’s enhanced closed-end fund resource page, which is at www.nuveen.com/closed-end-fund-distributions, along with other Nuveen closed-end fund product updates. Shareholders can expect regular distribution information to be posted on www.nuveen.com on the first business day of each month. To ensure that our shareholders have timely access to the latest information, a subscribe function can be activated at this link here, or at this web page (www.nuveen.com/en-us/people/about-nuveen/for-the-media).
COMMON SHARE REPURCHASES
During August 2019, the Funds’ Board of Trustees reauthorized JHY and JHB and authorized JHAA to participate in Nuveen’s closed-end fund complex-wide share repurchase program, allowing each Fund to repurchase an aggregate of up to approximately 10% of its outstanding shares.
As of December 31, 2019, and since the inception of the Funds’ repurchase programs, the Funds have cumulatively repurchased and retired their outstanding common shares as shown in the accompanying table.
| | | | | | | | | | | | |
| | | JHY | | | JHB | | | JHAA | |
Common shares cumulatively repurchased and retired | | | — | | | | — | | | | — | |
Common shares authorized for repurchase | | | 1,580,000 | | | | 5,585,000 | | | | 780,000 | |
During the current reporting period, the Funds did not repurchase any of their outstanding common shares.
OTHER COMMON SHARE INFORMATION
As of December 31, 2019, and during the current reporting period, the Funds’ common share prices were trading at premium/(discount) to their common share NAVs as shown in the accompanying table.
| | | | | | | | | | | | |
| | | JHY | | | JHB | | | JHAA | |
Common share NAV | | $ | 9.79 | | | $ | 9.97 | | | $ | 10.36 | |
Common share price | | $ | 9.77 | | | $ | 10.01 | | | $ | 10.85 | |
Premium/(Discount) to NAV | | | (0.20 | )% | | | 0.40 | % | | | 4.73 | % |
12-month average premium/(discount) to NAV | | | 2.07 | % | | | (0.71 | )% | | | 1.85 | % |
JHY, JHB and JHAA each have an investment objective to return $9.85, $9.85 and $9.875, respectively (the original net asset value following each Fund’s initial public offering (the “Original NAV”)) to shareholders on or about the end of the Fund’s term. There can be no assurance that the Funds will be able to return the Original NAV to shareholders, and such return is not backed or otherwise guaranteed by the Funds’ investment adviser, Nuveen Fund Advisors, LLC (the “Adviser”), or any other entity.
16
Each Fund’s ability to return Original NAV to common shareholders on or about the termination date will depend on market conditions and the success of various portfolio and cash flow management techniques. Each Fund currently intends to set aside and retain in its net assets a portion of its net investment income and possibly all or a portion of its gains. This will reduce the amounts otherwise available for distribution prior to the liquidation of each Fund, and the Fund may incur taxes on such retained amount, which will reduce the overall amounts that the Fund would have otherwise been able to distribute. Such retained income or gains, net of any taxes, would constitute a portion of the liquidating distribution returned to investors at the end of each Fund’s term. In addition, each Fund’s investment in shorter term and lower yielding securities, especially as the Fund nears the end of its term, may reduce investment income and, therefore, the monthly dividends during the period prior to termination. Investors that purchase shares in the secondary market (particularly if their purchase price differs meaningfully from the Original NAV) may receive more or less than their original investment.
17
Risk Considerations and Investment Policy Updates
Risk Considerations
Fund shares are not guaranteed or endorsed by any bank or other insured depository institution, and are not federally insured by the Federal Deposit Insurance Corporation.
Nuveen High Income 2020 Target Term Fund (JHY)
Investing in closed-end funds involves risk; principal loss is possible. There is no guarantee the Fund’s investment objectives will be achieved. Closed-end fund shares may frequently trade at a discount or premium to their net asset value.Debt or fixed income securities such as those held by the Fund, are subject to market risk, credit risk, interest rate risk, derivatives risk, liquidity risk, and income risk. As interest rates rise, bond prices fall.Lower credit debt securities may be more likely to fail to make timely interest or principal payments and may be subject to higher liquidity risk.Leverage increases return volatility and magnifies the Fund’s potential return and its risks; there is no guarantee a fund’s leverage strategy will be successful.Foreign investments involve additional risks, including currency fluctuation, political and economic instability, lack of liquidity and differing legal and accounting standards. The risks of foreign investments are magnified in emerging markets. These and other risk considerations including the Fund’slimited term andcall risk are described in more detail on the Fund’s web page atwww.nuveen.com/JHY.
Nuveen High Income November 2021 Target Term Fund (JHB)
Investing in closed-end funds involves risk; principal loss is possible. There is no guarantee the Fund’s investment objectives will be achieved. Closed-end fund shares may frequently trade at a discount or premium to their net asset value.Debt or fixed income securities such as those held by the Fund, are subject to market risk, credit risk, interest rate risk, derivatives risk, liquidity risk, and income risk. As interest rates rise, bond prices fall.Lower credit debt securities may be more likely to fail to make timely interest or principal payments and may be subject to higher liquidity risk.Leverage increases return volatility and magnifies the Fund’s potential return and its risks; there is no guarantee a fund’s leverage strategy will be successful.Foreign investments involve additional risks, including currency fluctuation, political and economic instability, lack of liquidity and differing legal and accounting standards. The risks of foreign investments are magnified in emerging markets. These and other risk considerations including the Fund’slimited term andcall risk are described in more detail on the Fund’s web page atwww.nuveen.com/JHB.
Nuveen High Income 2023 Target Term Fund (JHAA)
Investing in closed-end funds involves risk; principal loss is possible. There is no guarantee the Fund’s investment objectives will be achieved. Closed-end fund shares may frequently trade at a discount or premium to their net asset value.Debt or fixed income securities such as those held by the Fund, are subject to market risk, credit risk, interest rate risk, derivatives risk, liquidity risk, and income risk. As interest rates rise, bond prices fall.Lower credit debt securities may be more likely to fail to make timely interest or principal payments and may be subject to higher liquidity risk.Adjustable Rate Senior Loans may not be fully secured by collateral, generally do not trade on exchanges, and are typically issued by unrated or below-investment grade companies, and therefore are subject to greater liquidity and credit risk.Leverage increases return volatility and magnifies the Fund’s potential return and its risks; there is no guarantee a fund’s leverage strategy will be successful.Foreign investments involve additional risks, including currency fluctuation, political and economic instability, lack of liquidity and differing legal and accounting standards. The risks of foreign investments are magnified in emerging markets. These and other risk considerations including the Fund’slimited term andcall risk are described in more detail on the Fund’s web page atwww.nuveen.com/JHAA.
18
Investment Policy Updates
Change in Investment Policy
Each of the Funds has recently adopted the following policy regarding limits to investments in illiquid securities:
While there are no such limits imposed by applicable regulations, certain NuveenClosed-End Funds formerly had investment policies that placed limits on a Fund’s ability to invest in illiquid securities. All exchange-listed NuveenClosed-End Funds now have no formal limit on their ability to invest in such illiquid securities, but each Fund’s portfolio management team will monitor such investments in the regular, overall management of the Fund’s portfolio securities.
19
| | |
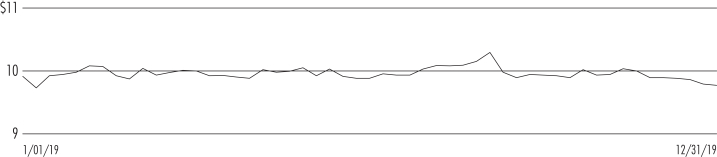
| JHY | | Nuveen High Income 2020 Target Term Fund Performance Overview and Holding Summaries as of December 31, 2019 |
Refer to the Glossary of Terms Used in this Report for further definition of the terms used within this section.
Average Annual Total Returns as of December 31, 2019
| | | | | | | | |
| | | Average Annual | |
| | | 1-Year | | | Since
Inception | |
| JHY at Common Share NAV | | | 7.39% | | | | 5.83% | |
| JHY at Common Share Price | | | 2.42% | | | | 5.30% | |
| Bloomberg Barclays U.S. High Yield 1-5 Year Cash Pay 2% Issuer Capped Index | | | 9.88% | | | | 5.76% | |
Since inception returns are from 7/28/15. Past performance is not predictive of future results. Current performance may be higher or lower than the data shown. Returns do not reflect the deduction of taxes that shareholders may have to pay on Fund distributions or upon the sale of Fund shares. Returns at NAV are net of Fund expenses, and assume reinvestment of distributions. Comparative index return information is provided for the Fund’s shares at NAV only. Indexes are not available for direct investment.
Common Share Price Performance —Weekly Closing Price
20
This data relates to the securities held in the Fund’s portfolio of investments as of the end of the reporting period. It should not be construed as a measure of performance for the Fund itself. Holdings are subject to change.
For financial reporting purposes, the ratings disclosed are the highest rating given by one of the following national rating agencies: Standard & Poor’s Group, Moody’s Investors Service, Inc. or Fitch, Inc. This treatment of split-rated securities may differ from that used for other purposes, such as for Fund investment policies. Credit ratings are subject to change. AAA, AA, A and BBB are investment grade ratings; BB, B, CCC, CC, C and D are below-investment grade ratings. Holdings designated N/R are not rated by these national rating agencies.
Fund Allocation
(% of net assets)
| | | | |
| Corporate Bonds | | | 111.8% | |
| Sovereign Debt | | | 5.4% | |
| Convertible Bonds | | | 2.6% | |
| $1,000 Par (or similar) Institutional Preferred | | | 0.7% | |
| Repurchase Agreements | | | 14.9% | |
| Other Assets Less Liabilities | | | 4.4% | |
Net Assets Plus Borrowings | | | 139.8% | |
| Borrowings | | | (39.8)% | |
Net Assets | | | 100% | |
Country Allocation
(% of total investments)1
| | | | |
| United States | | | 74.7% | |
| South Africa | | | 3.4% | |
| Turkey | | | 2.9% | |
| Israel | | | 2.2% | |
| Kazakhstan | | | 2.0% | |
| Japan | | | 2.0% | |
| Chile | | | 1.9% | |
| Egypt | | | 1.7% | |
| Canada | | | 1.6% | |
| Mexico | | | 1.3% | |
| Other | | | 6.3% | |
Total | | | 100% | |
Portfolio Composition
(% of total investments)
| | | | |
| Oil, Gas & Consumable Fuels | | | 8.6% | |
| Banks | | | 7.9% | |
| Airlines | | | 5.7% | |
| Household Durables | | | 5.4% | |
| Diversified Financial Services | | | 5.0% | |
| Consumer Finance | | | 4.6% | |
| Specialty Retail | | | 4.5% | |
| Wireless Telecommunication Services | | | 3.7% | |
| Metals & Mining | | | 3.7% | |
| Containers & Packaging | | | 3.2% | |
| Independent Power & Renewable Electricity Producers | | | 2.7% | |
| Electric Utilities | | | 2.6% | |
| Pharmaceuticals | | | 2.6% | |
| Media | | | 2.2% | |
| Health Care Providers & Services | | | 2.1% | |
| Energy Equipment & Services | | | 2.1% | |
| Other | | | 18.4% | |
| Sovereign Debt | | | 4.0% | |
| Repurchase Agreements | | | 11.0% | |
Total | | | 100% | |
Portfolio Credit Quality
(% of total long-term investments)
| | | | |
| A | | | 3.0% | |
| BBB | | | 29.7% | |
| BB or Lower | | | 65.5% | |
| N/R (not rated) | | | 1.8% | |
Total | | | 100% | |
Top Five Issuers
(% of total long-term investments)
| | | | |
| Teva Pharmaceutical Finance IV LLC | | | 2.4% | |
| Ford Motor Credit Co LLC | | | 2.4% | |
| Halyk Savings Bank of Kazakhstan JSC | | | 2.3% | |
| HCA Inc | | | 2.2% | |
| Sprint Communications Inc | | | 2.2% | |
| 1 | Includes 16.7% (as a percentage of total investments) in emerging markets countries. |
21
| | |
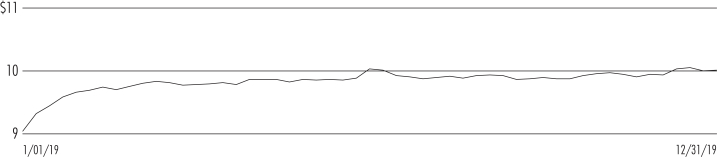
| JHB | | Nuveen High Income November 2021 Target Term Fund Performance Overview and Holding Summaries as of December 31, 2019 |
Refer to the Glossary of Terms Used in this Report for further definition of the terms used within this section.
Average Annual Total Returns as of December 31, 2019
| | | | | | | | |
| | | Average Annual | |
| | | 1-Year | | | Since
Inception | |
| JHB at Common Share NAV | | | 10.44% | | | | 6.02% | |
| JHB at Common Share Price | | | 18.39% | | | | 5.77% | |
| Bloomberg Barclays U.S. High Yield 1-5 Year Cash Pay 2% Issuer Capped Index | | | 9.88% | | | | 5.89% | |
Since inception returns are from 8/23/16. Past performance is not predictive of future results. Current performance may be higher or lower than the data shown. Returns do not reflect the deduction of taxes that shareholders may have to pay on Fund distributions or upon the sale of Fund shares. Returns at NAV are net of Fund expenses, and assume reinvestment of distributions. Comparative index return information is provided for the Fund’s shares at NAV only. Indexes are not available for direct investment.
Common Share Price Performance —Weekly Closing Price
22
This data relates to the securities held in the Fund’s portfolio of investments as of the end of the reporting period. It should not be construed as a measure of performance for the Fund itself. Holdings are subject to change.
For financial reporting purposes, the ratings disclosed are the highest rating given by one of the following national rating agencies: Standard & Poor’s Group, Moody’s Investors Service, Inc. or Fitch, Inc. This treatment of split-rated securities may differ from that used for other purposes, such as for Fund investment policies. Credit ratings are subject to change. AAA, AA, A and BBB are investment grade ratings; BB, B, CCC, CC, C and D are below-investment grade ratings. Holdings designated N/R are not rated by these national rating agencies.
Fund Allocation
(% of net assets)
| | | | |
| Corporate Bonds | | | 102.7% | |
| Variable Rate Senior Loan Interests | | | 6.1% | |
| Sovereign Debt | | | 3.4% | |
| Convertible Bonds | | | 1.6% | |
| Other Assets Less Liabilities | | | 20.7% | |
Net Assets Plus Borrowings | | | 134.5% | |
| Borrowings | | | (34.5)% | |
Net Assets | | | 100% | |
Country Allocation
(% of total investments)1
| | | | |
| United States | | | 72.2% | |
| Canada | | | 5.0% | |
| United Kingdom | | | 3.3% | |
| Japan | | | 2.4% | |
| South Africa | | | 1.9% | |
| Israel | | | 1.6% | |
| Italy | | | 1.5% | |
| China | | | 1.2% | |
| Mexico | | | 1.2% | |
| Egypt | | | 1.1% | |
| Other | | | 8.6% | |
Total | | | 100% | |
Portfolio Composition
(% of total investments)
| | | | |
| Oil, Gas & Consumable Fuels | | | 12.5% | |
| Media | | | 7.1% | |
| Commercial Services & Supplies | | | 5.8% | |
| Health Care Providers & Services | | | 5.3% | |
| Metals & Mining | | | 5.3% | |
| Household Durables | | | 5.0% | |
| Airlines | | | 4.3% | |
| Diversified Financial Services | | | 3.8% | |
| Wireless Telecommunication Services | | | 3.5% | |
| Pharmaceuticals | | | 3.1% | |
| Consumer Finance | | | 2.8% | |
| Specialty Retail | | | 2.8% | |
| Containers & Packaging | | | 2.8% | |
| Trading Companies & Distributors | | | 2.8% | |
| Diversified Telecommunication Services | | | 2.7% | |
| Thrifts & Mortgage Finance | | | 2.3% | |
| Technology Hardware, Storage & Peripherals | | | 2.3% | |
| Hotels, Restaurants & Leisure | | | 2.0% | |
| Auto Components | | | 1.8% | |
| Other | | | 19.1% | |
| Sovereign Debt | | | 2.9% | |
Total | | | 100% | |
Portfolio Credit Quality
(% of total long-term investments)
| | | | |
| BBB | | | 15.6% | |
| BB or Lower | | | 82.1% | |
| N/R (not rated) | | | 2.3% | |
Total | | | 100% | |
Top Five Issuers
(% of total long-term investments)
| | | | |
| CenturyLink Inc | | | 1.9% | |
| Owens-Brockway Glass Container Inc | | | 1.8% | |
| Nielsen Co BV | | | 1.7% | |
| American Airlines Inc | | | 1.7% | |
| TEGNA Inc | | | 1.6% | |
| 1 | Includes 10.4% (as a percentage of total investments) in emerging markets countries. |
23
| | |
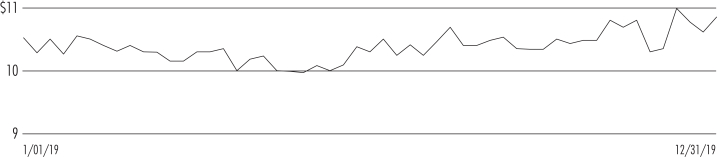
| JHAA | | Nuveen High Income 2023 Target Term Fund Performance Overview and Holding Summaries as of December 31, 2019 |
Refer to the Glossary of Terms Used in this Report for further definition of the terms used within this section.
Cumulative Total Returns as of December 31, 2019
| | | | | | | | |
| | | Average Annual | |
| | | 1-Year | | | Since
Inception | |
| JHAA at Common Share NAV | | | 11.20% | | | | 10.47% | |
| JHAA at Common Share Price | | | 5.71% | | | | 14.16% | |
| Bloomberg Barclays U.S. High Yield 1-5 Year Cash Pay 2% Issuer Capped Index | | | 9.88% | | | | 8.12% | |
Since inception returns are from 12/18/18. Past performance is not predictive of future results. Current performance may be higher or lower than the data shown. Returns do not reflect the deduction of taxes that shareholders may have to pay on Fund distributions or upon the sale of Fund shares. Returns at NAV are net of Fund expenses, and assume reinvestment of distributions. Comparative index return information is provided for the Fund’s shares at NAV only. Indexes are not available for direct investment.
Common Share Price Performance —Weekly Closing Price
24
This data relates to the securities held in the Fund’s portfolio of investments as of the end of the reporting period. It should not be construed as a measure of performance for the Fund itself. Holdings are subject to change.
For financial reporting purposes, the ratings disclosed are the highest rating given by one of the following national rating agencies: Standard & Poor’s Group, Moody’s Investors Service, Inc. or Fitch, Inc. This treatment of split-rated securities may differ from that used for other purposes, such as for Fund investment policies. Credit ratings are subject to change. AAA, AA, A and BBB are investment grade ratings; BB, B, CCC, CC, C and D are below-investment grade ratings. Holdings designated N/R are not rated by these national rating agencies.
Fund Allocation
(% of net assets)
| | | | |
| Corporate Bonds | | | 81.0% | |
| Variable Rate Senior Loan Interests | | | 42.0% | |
| Convertible Bonds | | | 2.1% | |
| Repurchase Agreements | | | 9.3% | |
| Other Assets Less Liabilities | | | (0.4)% | |
Net Assets Plus Borrowings and Reverse Repurchase Agreements | | | 134.0% | |
| Borrowings | | | (33.4)% | |
| Reverse Repurchase Agreements | | | (0.6)% | |
Net Assets | | | 100% | |
Country Allocation
(% of total investments)1
| | | | |
| United States | | | 83.8% | |
| Canada | | | 3.0% | |
| United Kingdom | | | 2.0% | |
| United Arab Emirates | | | 1.4% | |
| Israel | | | 1.2% | |
| Brazil | | | 1.2% | |
| Zambia | | | 1.2% | |
| Netherlands | | | 1.2% | |
| Australia | | | 1.1% | |
| Luxembourg | | | 1.1% | |
| Other | | | 2.8% | |
Total | | | 100% | |
Portfolio Composition
(% of total investments)
| | | | |
| Oil, Gas & Consumable Fuels | | | 6.8% | |
| Health Care Providers & Services | | | 6.2% | |
| Metals & Mining | | | 5.2% | |
| Media | | | 5.1% | |
| Household Durables | | | 4.4% | |
| Chemicals | | | 4.2% | |
| Commercial Services & Supplies | | | 3.7% | |
| Hotels, Restaurants & Leisure | | | 3.6% | |
| Containers & Packaging | | | 3.1% | |
| Pharmaceuticals | | | 3.1% | |
| Software | | | 2.7% | |
| Consumer Finance | | | 2.6% | |
| Diversified Financial Services | | | 2.6% | |
| Insurance | | | 2.5% | |
| Road & Rail | | | 2.3% | |
| Building Products | | | 2.2% | |
| Communications Equipment | | | 2.2% | |
| Airlines | | | 2.0% | |
| Energy Equipment & Services | | | 1.9% | |
| Gas Utilities | | | 1.7% | |
| Machinery | | | 1.6% | |
| Independent Power & Renewable Electricity Producers | | | 1.5% | |
| IT Services | | | 1.4% | |
| Real Estate Management & Development | | | 1.4% | |
| Other | | | 19.0% | |
| Repurchase Agreements | | | 7.0% | |
Total | | | 100% | |
Portfolio Credit Quality
(% of total long-term investments)
| | | | |
| BBB | | | 8.1% | |
| BB or Lower | | | 90.8% | |
| N/R (not rated) | | | 1.1% | |
Total | | | 100% | |
Top Five Issuers
(% of total long-term investments)
| | | | |
| NOVA Chemicals Corp | | | 1.6% | |
| ADT Security Corp | | | 1.5% | |
| Springleaf Finance Corp | | | 1.5% | |
| KB Home | | | 1.4% | |
| Teva Pharmaceutical Industries Ltd | | | 1.3% | |
| 1 | Includes 6.7% (as a percentage of total investments) in emerging markets countries. |
25
Report of Independent Registered Public Accounting Firm
To the Shareholders and Board of Trustees of
Nuveen High Income 2020 Target Term Fund
Nuveen High Income November 2021 Target Term Fund
Nuveen High Income 2023 Target Term Fund:
Opinion on the Financial Statements
We have audited the accompanying statements of assets and liabilities of Nuveen High Income 2020 Target Term Fund, Nuveen High Income November 2021 Target Term Fund, and Nuveen High Income 2023 Target Term Fund (the Funds), including the portfolios of investments, as of December 31, 2019, the related statements of operations and cash flows for the year then ended, the statements of changes in net assets for each of the years in thetwo-year period then ended (year then ended and period from December 18, 2018 (commencement of operations) to December 31, 2018 for Nuveen High Income 2023 Target Term Fund), and the related notes (collectively, the financial statements) and the financial highlights for each of the years in thefour-year period then ended and the period from July 28, 2015 (commencement of operations) to December 31, 2015 for Nuveen High Income 2020 Target Term Fund, each of the years in the three-year period then ended and the period from August 23, 2016 (commencement of operations) to December 31, 2016 for Nuveen High Income November 2021 Target Term Fund, and the year then ended and the period from December 18, 2018 to December 31, 2018 for Nuveen High Income 2023 Target Term Fund. In our opinion, the financial statements and financial highlights present fairly, in all material respects, the financial position of the Funds as of December 31, 2019, the results of their operations and cash flows for the year then ended, the changes in their net assets for each of the years in thetwo-year period then ended (year then ended and period from December 18, 2018 to December 31, 2018 for Nuveen High Income 2023 Target Term Fund), and the financial highlights for each of the years in thefour-year period then ended and the period from July 28, 2015 to December 31, 2015 for Nuveen High Income 2020 Target Term Fund, each of the years in the three-year period then ended and the period from August 23, 2016 to December 31, 2016 for Nuveen High Income November 2021 Target Term Fund, and the year then ended and the period from December 18, 2018 to December 31, 2018 for Nuveen High Income 2023 Target Term Fund, in conformity with U.S. generally accepted accounting principles.
Basis for Opinion
These financial statements and financial highlights are the responsibility of the Funds’ management. Our responsibility is to express an opinion on these financial statements and financial highlights based on our audits. We are a public accounting firm registered with the Public Company Accounting Oversight Board (United States) (PCAOB) and are required to be independent with respect to the Funds in accordance with the U.S. federal securities laws and the applicable rules and regulations of the Securities and Exchange Commission and the PCAOB.
We conducted our audits in accordance with the standards of the PCAOB. Those standards require that we plan and perform the audit to obtain reasonable assurance about whether the financial statements and financial highlights are free of material misstatement, whether due to error or fraud. Our audits included performing procedures to assess the risks of material misstatement of the financial statements and financial highlights, whether due to error or fraud, and performing procedures that respond to those risks. Such procedures included examining, on a test basis, evidence regarding the amounts and disclosures in the financial statements and financial highlights. Such procedures also included confirmation of securities owned as of December 31, 2019, by correspondence with custodians and brokers or other appropriate auditing procedures. Our audits also included evaluating the accounting principles used and significant estimates made by management, as well as evaluating the overall presentation of the financial statements and financial highlights. We believe that our audits provide a reasonable basis for our opinion.
/s/ KPMG LLP
We have served as the auditor of one or more Nuveen investment companies since 2014.
Chicago, Illinois
February 27, 2020
26
| | |
| JHY | | Nuveen High Income 2020 Target
Term Fund Portfolio of Investments December 31, 2019 |
| | | | | | | | | | | | | | | | | | | | |
Principal
Amount (000) | | | Description (1) | | Coupon | | | Maturity | | | Ratings (2) | | | Value | |
| |
| | | | LONG-TERM INVESTMENTS – 120.5% (89.0% of Total Investments) | |
| |
| | | | CORPORATE BONDS – 111.8% (82.6% of Total Investments) | |
| | | | | |
| | | | Airlines – 7.7% | | | | | | | | | | | | |
| | | | | |
| $ | 2,844 | | | Air Canada, 144A | | | 7.750% | | | | 4/15/21 | | | | BB+ | | | $ | 3,024,878 | |
| | 250 | | | Air Canada2015-1 Class C Pass Through Trust, 144A | | | 5.000% | | | | 3/15/20 | | | | BBB– | | | | 250,874 | |
| | 4,075 | | | American Airlines Group Inc, 144A | | | 4.625% | | | | 3/01/20 | | | | BB– | | | | 4,081,398 | |
| | 2,000 | | | Delta Air Lines Inc | | | 3.400% | | | | 4/19/21 | | | | Baa3 | | | | 2,027,292 | |
| | 2,500 | | | United Airlines Holdings Inc | | | 6.000% | | | | 12/01/20 | | | | BB | | | | 2,578,750 | |
| | 11,669 | | | Total Airlines | | | | | | | | | | | | | | | 11,963,192 | |
| | | | | |
| | | | Banks – 10.1% | | | | | | | | | | | | |
| | | | | |
| | 2,000 | | | Banco del Estado de Chile, 144A | | | 2.668% | | | | 1/08/21 | | | | A+ | | | | 2,000,921 | |
| | 2,000 | | | Banco del Estado de Chile, Reg S | | | 2.668% | | | | 1/08/21 | | | | A+ | | | | 2,000,921 | |
| | 1,900 | | | Banco Nacional de Costa Rica, 144A | | | 5.875% | | | | 4/25/21 | | | | B1 | | | | 1,942,769 | |
| | 3,415 | | | CIT Group Inc | | | 4.125% | | | | 3/09/21 | | | | BBB– | | | | 3,479,407 | |
| | 4,000 | | | Halyk Savings Bank of Kazakhstan JSC, 144A | | | 7.250% | | | | 1/28/21 | | | | BB+ | | | | 4,191,360 | |
| | 1,900 | | | Turkiye Garanti Bankasi AS, 144A | | | 6.250% | | | | 4/20/21 | | | | B+ | | | | 1,954,625 | |
| | 15,215 | | | Total Banks | | | | | | | | | | | | | | | 15,570,003 | |
| | | | | |
| | | | Building Products – 1.3% | | | | | | | | | | | | |
| | | | | |
| | 2,000 | | | Omnimax International Inc, 144A | | | 12.000% | | | | 8/15/20 | | | | Caa1 | | | | 1,980,000 | |
| | | | | |
| | | | Commercial Services & Supplies – 2.4% | | | | | | | | | | | | |
| | | | | |
| | 1,037 | | | APX Group Inc | | | 8.750% | | | | 12/01/20 | | | | CCC | | | | 1,037,000 | |
| | 2,645 | | | RR Donnelley & Sons Co | | | 7.875% | | | | 3/15/21 | | | | B– | | | | 2,737,575 | |
| | 3,682 | | | Total Commercial Services & Supplies | | | | | | | | | | | | | | | 3,774,575 | |
| | | | | |
| | | | Consumer Finance – 6.2% | | | | | | | | | | | | |
| | | | | |
| | 1,250 | | | Ally Financial Inc | | | 7.500% | | | | 9/15/20 | | | | BBB– | | | | 1,293,750 | |
| | 2,000 | | | Ally Financial Inc | | | 4.250% | | | | 4/15/21 | | | | BBB– | | | | 2,045,000 | |
| | 2,870 | | | Navient Corp | | | 5.000% | | | | 10/26/20 | | | | BB | | | | 2,912,189 | |
| | 3,250 | | | Springleaf Finance Corp | | | 8.250% | | | | 12/15/20 | | | | BB– | | | | 3,410,062 | |
| | 9,370 | | | Total Consumer Finance | | | | | | | | | | | | | | | 9,661,001 | |
| | | | | |
| | | | Containers & Packaging – 4.3% | | | | | | | | | | | | |
| | | | | |
| | 3,455 | | | Ball Corp | | | 4.375% | | | | 12/15/20 | | | | BB+ | | | | 3,527,521 | |
| | 300 | | | Graphic Packaging International LLC | | | 4.750% | | | | 4/15/21 | | | | BB+ | | | | 307,125 | |
| | 2,786 | | | Reynolds Group Issuer Inc / Reynolds Group Issuer LLC / Reynolds Group Issuer Lu | | | 5.750% | | | | 10/15/20 | | | | B+ | | | | 2,789,667 | |
| | 6,541 | | | Total Containers & Packaging | | | | | | | | | | | | | | | 6,624,313 | |
| | | | | |
| | | | Diversified Financial Services – 6.7% | | | | | | | | | | | | |
| | | | | |
| | 1,500 | | | Barclays Bank PLC | | | 5.140% | | | | 10/14/20 | | | | A– | | | | 1,531,310 | |
| | 2,000 | | | Deutsche Bank NY | | | 2.700% | | | | 7/13/20 | | | | BBB | | | | 2,001,377 | |
| | 4,500 | | | Ford Motor Credit Co LLC | | | 2.343% | | | | 11/02/20 | | | | BBB | | | | 4,491,508 | |
| | 2,375 | | | Park Aerospace Holdings Ltd, 144A | | | 3.625% | | | | 3/15/21 | | | | BBB– | | | | 2,407,205 | |
| | 10,375 | | | Total Diversified Financial Services | | | | | | | | | | | | | | | 10,431,400 | |
| | | | | |
| | | | Diversified Telecommunication Services – 0.2% | | | | | | | | | | | | |
| | | | | |
| | 350 | | | Cogent Communications Group Inc, 144A | | | 5.625% | | | | 4/15/21 | | | | B– | | | | 353,063 | |
| | | | | |
| | | | Electric Utilities – 3.6% | | | | | | | | | | | | |
| | | | | |
| | 2,000 | | | Eskom Holdings SOC Ltd, 144A | | | 5.750% | | | | 1/26/21 | | | | BBB+ | | | | 2,002,500 | |
| | 3,500 | | | Washington Prime Group LP | | | 3.850% | | | | 4/01/20 | | | | BB | | | | 3,500,000 | |
| | 5,500 | | | Total Electric Utilities | | | | | | | | | | | | | | | 5,502,500 | |
27
| | |
| |
| JHY | | Nuveen High Income 2020 Target Term Fund(continued) |
| | Portfolio of Investments December 31, 2019 |
| | | | | | | | | | | | | | | | | | | | |
Principal
Amount (000) | | | Description (1) | | Coupon | | | Maturity | | | Ratings (2) | | | Value | |
| | | | | |
| | | | Energy Equipment & Services – 2.8% | | | | | | | | | | | | |
| | | | | |
| $ | 2,950 | | | Nabors Industries Inc | | | 5.000% | | | | 9/15/20 | | | | BB– | | | $ | 2,957,375 | |
| | 1,500 | | | Pride International LLC | | | 6.875% | | | | 8/15/20 | | | | B– | | | | 1,402,500 | |
| | 4,450 | | | Total Energy Equipment & Services | | | | | | | | | | | | | | | 4,359,875 | |
| | | | | |
| | | | Equity Real Estate Investment Trust – 0.8% | | | | | | | | | | | | |
| | | | | |
| | 1,150 | | | GLP Capital LP / GLP Financing II Inc | | | 4.875% | | | | 11/01/20 | | | | BBB– | | | | 1,167,296 | |
| | | | | |
| | | | Health Care Providers & Services – 2.9% | | | | | | | | | | | | |
| | | | | |
| | 285 | | | Acadia Healthcare Co Inc | | | 6.125% | | | | 3/15/21 | | | | B– | | | | 285,356 | |
| | 4,000 | | | HCA Inc | | | 6.250% | | | | 2/15/21 | | | | Ba2 | | | | 4,170,000 | |
| | 4,285 | | | Total Health Care Providers & Services | | | | | | | | | | | | | | | 4,455,356 | |
| | | | | |
| | | | Hotels, Restaurants & Leisure – 1.3% | | | | | | | | | | | | |
| | | | | |
| | 2,050 | | | GLP Capital LP / GLP Financing II Inc | | | 4.375% | | | | 4/15/21 | | | | BBB– | | | | 2,089,811 | |
| | | | | |
| | | | Household Durables – 7.3% | | | | | | | | | | | | |
| | | | | |
| | 1,750 | | | Lennar Corp | | | 2.950% | | | | 11/29/20 | | | | BBB– | | | | 1,754,375 | |
| | 3,080 | | | Lennar Corp | | | 8.375% | | | | 1/15/21 | | | | BBB– | | | | 3,257,100 | |
| | 2,299 | | | M/I Homes Inc | | | 6.750% | | | | 1/15/21 | | | | BB– | | | | 2,301,874 | |
| | 1,500 | | | MDC Holdings Inc | | | 5.625% | | | | 2/01/20 | | | | BBB– | | | | 1,501,875 | |
| | 2,500 | | | PulteGroup Inc | | | 4.250% | | | | 3/01/21 | | | | BB+ | | | | 2,540,625 | |
| | 11,129 | | | Total Household Durables | | | | | | | | | | | | | | | 11,355,849 | |
| | | | | |
| | | | Independent Power & Renewable Electricity Producers – 2.6% | | | | | | | | | | | | |
| | | | | |
| | 4,000 | | | AES Corp | | | 4.000% | | | | 3/15/21 | | | | BBB– | | | | 4,055,000 | |
| | | | | |
| | | | Industrial Conglomerates – 1.0% | | | | | | | | | | | | |
| | | | | |
| | 1,500 | | | Turkiye Sise ve Cam Fabrikalari AS, 144A | | | 4.250% | | | | 5/09/20 | | | | BB– | | | | 1,500,435 | |
| | | | | |
| | | | Insurance – 1.7% | | | | | | | | | | | | |
| | | | | |
| | 1,500 | | | Genworth Holdings Inc | | | 7.700% | | | | 6/15/20 | | | | B | | | | 1,534,103 | |
| | 1,000 | | | Genworth Holdings Inc | | | 7.200% | | | | 2/15/21 | | | | B | | | | 1,030,000 | |
| | 2,500 | | | Total Insurance | | | | | | | | | | | | | | | 2,564,103 | |
| | | | | |
| | | | Internet & Direct Marketing Retail – 2.2% | | | | | | | | | | | | |
| | | | | |
| | 3,370 | | | Netflix Inc | | | 5.375% | | | | 2/01/21 | | | | BB– | | | | 3,475,312 | |
| | | | | |
| | | | IT Services – 1.6% | | | | | | | | | | | | |
| | | | | |
| | 2,528 | | | Xerox Corp | | | 2.750% | | | | 9/01/20 | | | | BB+ | | | | 2,520,277 | |
| | | | | |
| | | | Media – 3.0% | | | | | | | | | | | | |
| | | | | |
| | 3,000 | | | DISH DBS Corp | | | 5.125% | | | | 5/01/20 | | | | B1 | | | | 3,018,750 | |
| | 1,550 | | | TEGNA Inc | | | 5.125% | | | | 7/15/20 | | | | BB | | | | 1,553,875 | |
| | 4,550 | | | Total Media | | | | | | | | | | | | | | | 4,572,625 | |
| | | | | |
| | | | Metals & Mining – 5.0% | | | | | | | | | | | | |
| | | | | |
| | 4,000 | | | AngloGold Ashanti Holdings PLC | | | 5.375% | | | | 4/15/20 | | | | Baa3 | | | | 4,029,848 | |
| | 1,700 | | | Arconic Inc | | | 6.150% | | | | 8/15/20 | | | | BBB– | | | | 1,738,318 | |
| | 850 | | | Arconic Inc | | | 5.400% | | | | 4/15/21 | | | | BBB– | | | | 876,295 | |
| | 1,000 | | | Gold Fields Orogen Holdings BVI Ltd, 144A | | | 4.875% | | | | 10/07/20 | | | | Baa3 | | | | 1,015,040 | |
| | 7,550 | | | Total Metals & Mining | | | | | | | | | | | | | | | 7,659,501 | |
| | | | | |
| | | | Mortgage Real Estate Investment Trust – 2.0% | | | | | | | | | | | | |
| | | | | |
| | 3,000 | | | Starwood Property Trust Inc | | | 3.625% | | | | 2/01/21 | | | | BB– | | | | 3,018,750 | |
| | | | | |
| | | | Multiline Retail – 1.3% | | | | | | | | | | | | |
| | | | | |
| | 2,150 | | | JC Penney Corp Inc | | | 5.650% | | | | 6/01/20 | | | | CCC+ | | | | 2,021,000 | |
| | | | | |
| | | | Oil, Gas & Consumable Fuels – 11.6% | | | | | | | | | | | | |
| | | | | |
| | 2,250 | | | Buckeye Partners LP | | | 4.875% | | | | 2/01/21 | | | | BB | | | | 2,289,727 | |
| | 781 | | | Chesapeake Energy Corp | | | 6.625% | | | | 8/15/20 | | | | B+ | | | | 773,190 | |
28
| | | | | | | | | | | | | | | | | | | | |
Principal
Amount (000) | | | Description (1) | | Coupon | | | Maturity | | | Ratings (2) | | | Value | |
| | | | | |
| | | | Oil, Gas & Consumable Fuels(continued) | | | | | | | | | | | | |
| | | | | |
| $ | 226 | | | Chesapeake Energy Corp | | | 6.875% | | | | 11/15/20 | | | | B+ | | | $ | 219,220 | |
| | 2,500 | | | DCP Midstream Operating LP, 144A | | | 5.350% | | | | 3/15/20 | | | | BB+ | | | | 2,512,500 | |
| | 1,200 | | | Navigator Holdings Ltd, 144A, Reg S | | | 7.750% | | | | 2/10/21 | | | | N/R | | | | 1,208,438 | |
| | 1,740 | | | NuStar Logistics LP | | | 4.800% | | | | 9/01/20 | | | | Ba2 | | | | 1,761,750 | |
| | 1,865 | | | NuStar Logistics LP | | | 6.750% | | | | 2/01/21 | | | | Ba2 | | | | 1,934,937 | |
| | 980 | | | Petrobras Global Finance BV | | | 5.375% | | | | 1/27/21 | | | | Ba2 | | | | 1,010,968 | |
| | 2,250 | | | Petroleos Mexicanos | | | 5.500% | | | | 1/21/21 | | | | BBB+ | | | | 2,311,875 | |
| | 2,000 | | | QEP Resources Inc | | | 6.875% | | | | 3/01/21 | | | | BB– | | | | 2,070,000 | |
| | 2,000 | | | Whiting Petroleum Corp | | | 5.750% | | | | 3/15/21 | | | | BB– | | | | 1,892,000 | |
| | 17,792 | | | Total Oil, Gas & Consumable Fuels | | | | | | | | | | | | | | | 17,984,605 | |
| | | | | |
| | | | Pharmaceuticals – 3.5% | | | | | | | | | | | | |
| | | | | |
| | 1,250 | | | Mallinckrodt International Finance SA / Mallinckrodt CB LLC, 144A | | | 4.875% | | | | 4/15/20 | | | | CCC– | | | | 962,500 | |
| | 4,500 | | | Teva Pharmaceutical Finance IV LLC | | | 2.250% | | | | 3/18/20 | | | | BBB | | | | 4,502,655 | |
| | 5,750 | | | Total Pharmaceuticals | | | | | | | | | | | | | | | 5,465,155 | |
| | | | | |
| | | | Professional Services – 2.3% | | | | | | | | | | | | |
| | | | | |
| | 3,500 | | | Nielsen Finance LLC / Nielsen Finance Co | | | 4.500% | | | | 10/01/20 | | | | BB | | | | 3,504,375 | |
| | | | | |
| | | | Specialty Retail – 6.1% | | | | | | | | | | | | |
| | | | | |
| | 2,250 | | | Gap Inc | | | 5.950% | | | | 4/12/21 | | | | Baa2 | | | | 2,334,687 | |
| | 3,878 | | | L Brands Inc | | | 6.625% | | | | 4/01/21 | | | | Ba2 | | | | 4,062,205 | |
| | 2,990 | | | Penske Automotive Group Inc | | | 3.750% | | | | 8/15/20 | | | | Ba3 | | | | 3,019,900 | |
| | 9,118 | | | Total Specialty Retail | | | | | | | | | | | | | | | 9,416,792 | |
| | | | | |
| | | | Technology Hardware, Storage & Peripherals – 2.4% | | | | | | | | | | | | |
| | | | | |
| | 3,750 | | | EMC Corp | | | 2.650% | | | | 6/01/20 | | | | BB | | | | 3,750,675 | |
| | | | | |
| | | | Tobacco – 1.6% | | | | | | | | | | | | |
| | | | | |
| | 2,500 | | | Pyxus International Inc, 144A | | | 8.500% | | | | 4/15/21 | | | | B2 | | | | 2,412,500 | |
| | | | | |
| | | | Trading Companies & Distributors – 1.2% | | | | | | | | | | | | |
| | | | | |
| | 1,782 | | | Aircastle Ltd | | | 5.125% | | | | 3/15/21 | | | | BBB– | | | | 1,840,625 | |
| | | | | |
| | | | Wireless Telecommunication Services – 5.1% | | | | | | | | | | | | |
| | | | | |
| | 3,735 | | | CenturyLink Inc | | | 5.625% | | | | 4/01/20 | | | | BB | | | | 3,758,344 | |
| | 4,000 | | | Sprint Communications Inc | | | 7.000% | | | | 8/15/20 | | | | B+ | | | | 4,085,000 | |
| | 7,735 | | | Total Wireless Telecommunication Services | | | | | | | | | | | | | | | 7,843,344 | |
| $ | 170,841 | | | Total Corporate Bonds (cost $172,697,658) | | | | | | | | | | | | | | | 172,893,308 | |
| | | | | |
Principal
Amount (000) | | | Description (1) | | Coupon | | | Maturity | | | Ratings (2) | | | Value | |
| | | | | |
| | | | SOVEREIGN DEBT – 5.4% (4.0% of Total Investments) | | | | | | | | | | | | | | | | |
| | | | | |
| | | | Argentina – 0.3% | | | | | | | | | | | | |
| | | | | |
| $ | 800 | | | Argentine Republic Government International Bond | | | 6.875% | | | | 4/22/21 | | | | Caa2 | | | $ | 432,000 | |
| | | | | |
| | | | Egypt – 2.3% | | | | | | | | | | | | |
| | | | | |
| | 3,500 | | | Egypt Government International Bond, 144A | | | 5.750% | | | | 4/29/20 | | | | B+ | | | | 3,534,265 | |
| | | | | |
| | | | Honduras – 0.3% | | | | | | | | | | | | |
| | | | | |
| | 500 | | | Honduras Government International Bond, 144A | | | 8.750% | | | | 12/16/20 | | | | BB– | | | | 526,250 | |
| | | | | |
| | | | Nigeria – 0.8% | | | | | | | | | | | | |
| | | | | |
| | 1,250 | | | Nigeria Government International Bond, 144A | | | 6.750% | | | | 1/28/21 | | | | B+ | | | | 1,295,312 | |
| | | | | |
| | | | Turkey – 1.7% | | | | | | | | | | | | |
| | | | | |
| | 2,500 | | | Turkey Government International Bond | | | 5.625% | | | | 3/30/21 | | | | BB– | | | | 2,573,105 | |
| $ | 8,550 | | | Total Sovereign Debt (cost $8,667,027) | | | | | | | | | | | | | | | 8,360,932 | |
29
| | |
| |
| JHY | | Nuveen High Income 2020 Target Term Fund(continued) |
| | Portfolio of Investments December 31, 2019 |
| | | | | | | | | | | | | | | | | | | | |
Principal
Amount (000) | | | Description (1) | | Coupon | | | Maturity | | | Ratings (2) | | | Value | |
| | | | | |
| | | | CONVERTIBLE BONDS – 2.6% (1.9% of Total Investments) | | | | | | | | | | | | | | | | |
| | | | | |
| | | | Capital Markets – 1.2% | | | | | | | | | | | | |
| | | | | |
| $ | 1,780 | | | Prospect Capital Corp | | | 4.750% | | | | 4/15/20 | | | | BBB– | | | $ | 1,784,615 | |
| | | | | |
| | | | Construction Materials – 0.3% | | | | | | | | | | | | |
| | | | | |
| | 500 | | | Cemex SAB de CV | | | 3.720% | | | | 3/15/20 | | | | N/R | | | | 501,443 | |
| |
| | | | Independent Power & Renewable Electricity Producers – 1.0% | |
| | | | | |
| | 1,500 | | | Clearway Energy Inc, 144A | | | 3.250% | | | | 6/01/20 | | | | N/R | | | | 1,495,354 | |
| | | | | |
| | | | Mortgage Real Estate Investment Trust – 0.1% | | | | | | | | | | | | |
| | | | | |
| | 150 | | | Colony Capital Inc | | | 3.875% | | | | 1/15/21 | | | | N/R | | | | 147,750 | |
| $ | 3,930 | | | Total Convertible Bonds (cost $3,915,870) | | | | | | | | | | | | | | | 3,929,162 | |
| | | | | |
Principal
Amount (000) | | | Description (1) | | Coupon | | | Maturity | | | Ratings (2) | | | Value | |
| |
| | | | $1,000 PAR (OR SIMILAR) INSTITUTIONAL PREFERRED – 0.7% (0.5% of Total Investments) | |
| | | | | |
| | | | Banks – 0.7% | | | | | | | | | | | | |
| | | | | |
| $ | 1,000 | | | BBVA Bancomer SA/Texas, 144A | | | 7.250% | | | | 4/22/20 | | | | Baa3 | | | $ | 1,011,260 | |
| $ | 1,000 | | | Total $1,000 Par (or similar) Institutional Preferred (cost $1,013,465) | | | | | | | | | | | | | | | 1,011,260 | |
| | | | Total Long-Term Investments (cost $186,294,020) | | | | | | | | | | | | | | | 186,194,662 | |
| | | | | |
Principal
Amount (000) | | | Description (1) | | Coupon | | | Maturity | | | | | | Value | |
| |
| | | | SHORT-TERM INVESTMENTS – 14.9% (11.0% of Total Investments) | |
| |
| | | | REPURCHASE AGREEMENTS – 14.9% (11.0% of Total Investments) | |
| | | | | |
| $ | 23,084 | | | Repurchase Agreement with Fixed Income Clearing Corporation, dated 12/31/19, repurchase price $23,084,948, collateralized by $21,160,000 U.S. Treasury Bonds, 2.875%, due 8/15/45, value $23,549,154 | | | 0.650% | | | | 1/02/20 | | | | | | | $ | 23,084,114 | |
| | | | Total Short-Term Investments (cost $23,084,114) | | | | | | | | | | | | | | | 23,084,114 | |
| | | | Total Investments (cost $209,378,134) – 135.4% | | | | | | | | | | | | | | | 209,278,776 | |
| | | | Borrowings – (39.8)% (3), (4) | | | | | | | | | | | | | | | (61,500,000 | ) |
| | | | Other Assets Less Liabilities – 4.4% | | | | | | | | | | | | | | | 6,819,549 | |
| | | | Net Assets Applicable to Common Shares – 100% | | | | | | | | | | | | | | $ | 154,598,325 | |
For Fund portfolio compliance purposes, the Fund’s industry classifications refer to any one or more of the industrysub-classifications used by one or more widely recognized market indexes or ratings group indexes, and/or as defined by Fund management. This definition may not apply for purposes of this report, which may combine industrysub-classifications into sectors for reporting ease.
| (1) | All percentages shown in the Portfolio of Investments are based on net assets applicable to common shares unless otherwise noted. |
| (2) | For financial reporting purposes, the ratings disclosed are the highest of Standard & Poor’s Group (“Standard & Poor’s”), Moody’s Investors Service, Inc. (“Moody’s”) or Fitch, Inc. (“Fitch”) rating. This treatment of split-rated securities may differ from that used for other purposes, such as for Fund investment policies. Ratings below BBB by Standard & Poor’s, Baa by Moody’s or BBB by Fitch are considered to be below investment grade. Holdings designated N/R are not rated by any of these national rating agencies. Ratings are not covered by the report of independent registered public accounting firm. |
| (3) | Borrowings as a percentage of Total Investments is 29.4%. |
| (4) | The Fund may pledge up to 100% of its eligible investments (excluding any investments separately pledged as collateral for specific investments in derivatives) in the Portfolio of Investments as collateral for borrowings. |
| 144A | Investment is exempt from registration under Rule 144A of the Securities Act of 1933, as amended. These investments may only be resold in transactions exempt from registration, which are normally those transactions with qualified institutional buyers. |
| Reg S | Regulation S allows U.S. companies to sell securities to persons or entities located outside of the United States without registering those securities with the Securities and Exchange Commission. Specifically, Regulation S provides a safe harbor from the registration requirements of the Securities Act for the offers and sales of securities by both foreign and domestic issuers that are made outside the United States. |
See accompanying notes to financial statements.
30
| | |
| JHB | | Nuveen High Income November 2021
Target Term Fund Portfolio of Investments December 31, 2019 |
| | | | | | | | | | | | | | | | | | | | | | | | |
Principal
Amount (000) | | | Description (1) | | | | | | Coupon | | | Maturity | | | Ratings (2) | | | Value | |
| |
| | | | LONG-TERM INVESTMENTS – 113.8% (100.0% of Total Investments) | |
| |
| | | | CORPORATE BONDS – 102.7% (90.3% of Total Investments) | |
| |
| | | | Aerospace & Defense – 2.0% | |
| | | | | |
| $ | 4,875 | | | Bombardier Inc, 144A | | | 8.750% | | | | 12/01/21 | | | | B | | | $ | 5,341,172 | |
| | 5,750 | | | Bombardier Inc, 144A, (3) | | | 5.750% | | | | 3/15/22 | | | | B | | | | 5,938,672 | |
| | 10,625 | | | Total Aerospace & Defense | | | | | | | | | | | | | | | 11,279,844 | |
| | | | | |
| | | | Airlines – 2.9% | | | | | | | | | | | | |
| | | | | |
| | 5,675 | | | Air Canada, 144A, (3) | | | 7.750% | | | | 4/15/21 | | | | BB+ | | | | 6,035,930 | |
| | 783 | | | American Airlines2013-2 Class B Pass Through Trust, 144A | | | 5.600% | | | | 7/15/20 | | | | BBB– | | | | 796,379 | |
| | 1,675 | | | American Airlines Group Inc, 144A, (3) | | | 4.625% | | | | 3/01/20 | | | | BB– | | | | 1,677,630 | |
| | 24 | | | Continental Airlines2007-1 Class B Pass Through Trust | | | 6.903% | | | | 4/19/22 | | | | BBB– | | | | 25,002 | |
| | 500 | | | United Airlines Holdings Inc, (3) | | | 6.000% | | | | 12/01/20 | | | | BB | | | | 515,750 | |
| | 6,700 | | | Virgin Australia Holdings Ltd, 144A | | | 7.875% | | | | 10/15/21 | | | | B | | | | 6,914,132 | |
| | 15,357 | | | Total Airlines | | | | | | | | | | | | | | | 15,964,823 | |
| | | | | |
| | | | Auto Components – 2.0% | | | | | | | | | | | | |
| | | | | |
| | 9,250 | | | Icahn Enterprises LP / Icahn Enterprises Finance Corp | | | 5.875% | | | | 2/01/22 | | | | BB+ | | | | 9,261,563 | |
| | 2,000 | | | Icahn Enterprises LP / Icahn Enterprises Finance Corp, (3) | | | 6.250% | | | | 2/01/22 | | | | BB+ | | | | 2,038,000 | |
| | 11,250 | | | Total Auto Components | | | | | | | | | | | | | | | 11,299,563 | |
| | | | | |
| | | | Banks – 1.8% | | | | | | | | | | | | |
| | | | | |
| | 2,000 | | | Banco Nacional de Costa Rica, 144A | | | 5.875% | | | | 4/25/21 | | | | B1 | | | | 2,045,020 | |
| | 2,410 | | | CIT Group Inc | | | 4.125% | | | | 3/09/21 | | | | BBB– | | | | 2,455,453 | |
| | 2,000 | | | Turkiye Is Bankasi AS, 144A | | | 5.000% | | | | 4/30/20 | | | | B+ | | | | 2,010,600 | |
| | 1,375 | | | Ukreximbank Via Biz Finance PLC, 144A | | | 9.625% | | | | 4/27/22 | | | | B | | | | 1,440,257 | |
| | 1,844 | | | UniCredit SpA, 144A | | | 3.750% | | | | 4/12/22 | | | | Baa1 | | | | 1,888,919 | |
| | 9,629 | | | Total Banks | | | | | | | | | | | | | | | 9,840,249 | |
| | | | | |
| | | | Building Products – 0.5% | | | | | | | | | | | | |
| | | | | |
| | 2,750 | | | Omnimax International Inc, 144A | | | 12.000% | | | | 8/15/20 | | | | Caa1 | | | | 2,722,500 | |
| | | | | |
| | | | Chemicals – 1.4% | | | | | | | | | | | | |
| | | | | |
| | 1,353 | | | CF Industries Inc, 144A | | | 3.400% | | | | 12/01/21 | | | | Baa2 | | | | 1,387,136 | |
| | 2,475 | | | Methanex Corp | | | 5.250% | | | | 3/01/22 | | | | Baa3 | | | | 2,600,742 | |
| | 3,545 | | | WR Grace &Co-Conn, 144A | | | 5.125% | | | | 10/01/21 | | | | BB– | | | | 3,694,528 | |
| | 7,373 | | | Total Chemicals | | | | | | | | | | | | | | | 7,682,406 | |
| | | | | |
| | | | Commercial Services & Supplies – 4.4% | | | | | | | | | | | | |
| | | | | |
| | 7,025 | | | ADT Security Corp (3) | | | 6.250% | | | | 10/15/21 | | | | BB– | | | | 7,411,375 | |
| | 2,854 | | | APX Group Inc | | | 8.750% | | | | 12/01/20 | | | | CCC | | | | 2,854,000 | |
| | 6,250 | | | GFL Environmental Inc, 144A, (3) | | | 5.625% | | | | 5/01/22 | | | | CCC+ | | | | 6,359,375 | |
| | 2,000 | | | Pitney Bowes Inc | | | 4.125% | | | | 10/01/21 | | | | BB+ | | | | 2,027,500 | |
| | 5,450 | | | RR Donnelley & Sons Co, (3) | | | 7.875% | | | | 3/15/21 | | | | B– | | | | 5,640,750 | |
| | 500 | | | RR Donnelley & Sons Co | | | 7.000% | | | | 2/15/22 | | | | B– | | | | 517,500 | |
| | 24,079 | | | Total Commercial Services & Supplies | | | | | | | | | | | | | | | 24,810,500 | |
| | | | | |
| | | | Communications Equipment – 0.6% | | | | | | | | | | | | |
| | | | | |
| | 3,486 | | | CommScope Inc, 144A | | | 5.000% | | | | 6/15/21 | | | | B– | | | | 3,487,743 | |
| | | | | |
| | | | Construction & Engineering – 0.4% | | | | | | | | | | | | |
| | | | | |
| | 2,100 | | | AECOM Global II LLC / URS Fox US LP | | | 5.000% | | | | 4/01/22 | | | | B+ | | | | 2,170,875 | |
| | | | | |
| | | | Consumer Finance – 3.2% | | | | | | | | | | | | |
| | | | | |
| | 4,585 | | | Ally Financial Inc | | | 4.125% | | | | 2/13/22 | | | | BBB– | | | | 4,734,012 | |
| | 2,100 | | | Navient Corp | | | 6.625% | | | | 7/26/21 | | | | BB | | | | 2,220,750 | |
31
| | |
| |
| JHB | | Nuveen High Income November 2021 Target Term Fund(continued) |
| | Portfolio of Investments December 31, 2019 |
| | | | | | | | | | | | | | | | | | | | | | | | |
Principal
Amount (000) | | | Description (1) | | | | | | Coupon | | | Maturity | | | Ratings (2) | | | Value | |
| | | | | |
| | | | Consumer Finance(continued) | | | | | | | | | | | | |
| | | | | |
| $ | 6,225 | | | Navient Corp, (3) | | | 7.250% | | | | 1/25/22 | | | | BB | | | $ | 6,763,089 | |
| | 995 | | | SLM Corp | | | 5.125% | | | | 4/05/22 | | | | BB+ | | | | 1,029,825 | |
| | 3,000 | | | Springleaf Finance Corp | | | 7.750% | | | | 10/01/21 | | | | BB– | | | | 3,258,750 | |
| | 16,905 | | | Total Consumer Finance | | | | | | | | | | | | | | | 18,006,426 | |
| | | | | |
| | | | Containers & Packaging – 3.2% | | | | | | | | | | | | |
| | | | | |
| | 120 | | | Graphic Packaging International LLC | | | 4.750% | | | | 4/15/21 | | | | BB+ | | | | 122,850 | |
| | 10,870 | | | Owens-Brockway Glass Container Inc, 144A | | | 5.000% | | | | 1/15/22 | | | | B+ | | | | 11,282,951 | |
| | 6,420 | | | Reynolds Group Issuer Inc / Reynolds Group Issuer LLC / Reynolds Group Issuer Lu, 144A,(3-Month LIBOR reference rate + 3.500% spread), (4) | | | 5.501% | | | | 7/15/21 | | | | B+ | | | | 6,428,025 | |
| | 17,410 | | | Total Containers & Packaging | | | | | | | | | | | | | | | 17,833,826 | |
| | | | | |
| | | | Diversified Financial Services – 4.3% | | | | | | | | | | | | |
| | | | | |
| | 6,000 | | | Avation Capital SA, 144A | | | 6.500% | | | | 5/15/21 | | | | BB– | | | | 6,232,500 | |
| | 5,055 | | | Ford Motor Credit Co LLC | | | 3.339% | | | | 3/28/22 | | | | BBB | | | | 5,103,622 | |
| | 4,945 | | | Ford Motor Credit Co LLC,(3-Month LIBOR reference rate + 1.270% spread), (4) | | | 3.231% | | | | 3/28/22 | | | | BBB | | | | 4,908,740 | |
| | 2,798 | | | Park Aerospace Holdings Ltd, 144A | | | 3.625% | | | | 3/15/21 | | | | BBB– | | | | 2,835,941 | |
| | 4,280 | | | PHH Corp | | | 6.375% | | | | 8/15/21 | | | | N/R | | | | 2,798,050 | |
| | 2,000 | | | RKPF Overseas 2019 B Ltd, Reg S | | | 7.750% | | | | 4/18/21 | | | | BB– | | | | 2,079,380 | |
| | 25,078 | | | Total Diversified Financial Services | | | | | | | | | | | | | | | 23,958,233 | |
| | | | | |
| | | | Diversified Telecommunication Services – 3.1% | | | | | | | | | | | | |
| | | | | |
| | 11,195 | | | CenturyLink Inc | | | 5.800% | | | | 3/15/22 | | | | BB | | | | 11,768,968 | |
| | 4,250 | | | Cogent Communications Group Inc, 144A | | | 5.375% | | | | 3/01/22 | | | | Ba3 | | | | 4,441,250 | |
| | 1,030 | | | Virgin Media Finance PLC | | | 4.875% | | | | 2/15/22 | | | | B | | | | 1,040,300 | |
| | 16,475 | | | Total Diversified Telecommunication Services | | | | | | | | | | | | | | | 17,250,518 | |
| | | | | |
| | | | Electric Utilities – 1.0% | | | | | | | | | | | | |
| | | | | |
| | 3,625 | | | Eskom Holdings SOC Ltd, 144A | | | 5.750% | | | | 1/26/21 | | | | BBB+ | | | | 3,629,531 | |
| | 2,000 | | | Instituto Costarricense de Electricidad, 144A | | | 6.950% | | | | 11/10/21 | | | | B1 | | | | 2,085,020 | |
| | 5,625 | | | Total Electric Utilities | | | | | | | | | | | | | | | 5,714,551 | |
| |
| | | | Electronic Equipment, Instruments & Components – 1.2% | |
| | | | | |
| | 6,647 | | | Anixter Inc | | | 5.125% | | | | 10/01/21 | | | | BBB– | | | | 6,899,254 | |
| | | | | |
| | | | Energy Equipment & Services – 1.2% | | | | | | | | | | | | |
| | | | | |
| | 6,700 | | | Nabors Industries Inc | | | 4.625% | | | | 9/15/21 | | | | BB– | | | | 6,658,125 | |
| | | | | |
| | | | Equity Real Estate Investment Trust – 0.6% | | | | | | | | | | | | |
| | | | | |
| | 3,275 | | | Iron Mountain Inc, 144A, (3) | | | 4.375% | | | | 6/01/21 | | | | BB– | | | | 3,307,914 | |
| | | | | |
| | | | Food & Staples Retailing – 0.2% | | | | | | | | | | | | |
| | | | | |
| | 85 | | | Smithfield Foods Inc, 144A | | | 2.650% | | | | 10/03/21 | | | | BBB | | | | 84,485 | |
| | 1,010 | | | Smithfield Foods Inc, 144A | | | 3.350% | | | | 2/01/22 | | | | BBB | | | | 1,012,594 | |
| | 1,095 | | | Total Food & Staples Retailing | | | | | | | | | | | | | | | 1,097,079 | |
| | | | | |
| | | | Health Care Providers & Services – 5.5% | | | | | | | | | | | | |
| | | | | |
| | 1,900 | | | Acadia Healthcare Co Inc | | | 6.125% | | | | 3/15/21 | | | | B– | | | | 1,902,375 | |
| | 10,125 | | | CHS/Community Health Systems Inc, (3) | | | 5.125% | | | | 8/01/21 | | | | BB | | | | 10,125,000 | |
| | 310 | | | Fresenius Medical Care US Finance II Inc, 144A | | | 5.875% | | | | 1/31/22 | | | | BBB | | | | 331,600 | |
| | 8,000 | | | HCA Inc | | | 7.500% | | | | 2/15/22 | | | | Ba2 | | | | 8,840,000 | |
| | 4,325 | | | Owens & Minor Inc, (3) | | | 3.875% | | | | 9/15/21 | | | | B | | | | 4,162,812 | |
| | 5,000 | | | Tenet Healthcare Corp | | | 8.125% | | | | 4/01/22 | | | | B– | | | | 5,531,250 | |
| | 29,660 | | | Total Health Care Providers & Services | | | | | | | | | | | | | | | 30,893,037 | |
| | | | | |
| | | | Hotels, Restaurants & Leisure – 2.3% | | | | | | | | | | | | |
| | | | | |
| | 7,375 | | | International Game Technology PLC, 144A | | | 6.250% | | | | 2/15/22 | | | | BB+ | | | | 7,780,625 | |
| | 2,830 | | | Scientific Games International Inc | | | 6.625% | | | | 5/15/21 | | | | CCC+ | | | | 2,868,913 | |
| | 1,750 | | | Studio City Co Ltd, 144A | | | 7.250% | | | | 11/30/21 | | | | BB– | | | | 1,789,375 | |
| | 150 | | | Yum! Brands Inc | | | 3.750% | | | | 11/01/21 | | | | B+ | | | | 153,000 | |
| | 12,105 | | | Total Hotels, Restaurants & Leisure | | | | | | | | | | | | | | | 12,591,913 | |
32
| | | | | | | | | | | | | | | | | | | | | | | | |
Principal
Amount (000) | | | Description (1) | | | | | | Coupon | | | Maturity | | | Ratings (2) | | | Value | |
| | | | | |
| | | | Household Durables – 5.7% | | | | | | | | | | | | |
| | | | | |
| $ | 5,460 | | | KB Home | | | 7.000% | | | | 12/15/21 | | | | BB– | | | $ | 5,855,850 | |
| | 2,500 | | | Lennar Corp | | | 4.750% | | | | 4/01/21 | | | | BBB– | | | | 2,556,250 | |
| | 1,250 | | | Lennar Corp | | | 6.250% | | | | 12/15/21 | | | | BBB– | | | | 1,314,063 | |
| | 450 | | | Lennar Corp | | | 4.125% | | | | 1/15/22 | | | | BBB– | | | | 461,250 | |
| | 4,000 | | | M/I Homes Inc | | | 6.750% | | | | 1/15/21 | | | | BB– | | | | 4,005,000 | |
| | 5,205 | | | Meritage Homes Corp | | | 7.000% | | | | 4/01/22 | | | | BB | | | | 5,679,956 | |
| | 4,375 | | | New Home Co Inc, (3) | | | 7.250% | | | | 4/01/22 | | | | B– | | | | 4,243,750 | |
| | 4,525 | | | PulteGroup Inc | | | 4.250% | | | | 3/01/21 | | | | BB+ | | | | 4,598,531 | |
| | 500 | | | Toll Brothers Finance Corp | | | 5.875% | | | | 2/15/22 | | | | BBB– | | | | 528,750 | |
| | 2,250 | | | TRI Pointe Group Inc | | | 4.875% | | | | 7/01/21 | | | | BB– | | | | 2,306,250 | |
| | 30,515 | | | Total Household Durables | | | | | | | | | | | | | | | 31,549,650 | |
| |
| | | | Independent Power & Renewable Electricity Producers – 0.9% | |
| | | | | |
| | 1,000 | | | AES Corp | | | 4.000% | | | | 3/15/21 | | | | BBB– | | | | 1,013,750 | |
| | 3,604 | | | DPL Inc | | | 7.250% | | | | 10/15/21 | | | | Ba1 | | | | 3,784,200 | |
| | 4,604 | | | Total Independent Power & Renewable Electricity Producers | | | | | | | | | | | | | | | 4,797,950 | |
| | | | | |
| | | | Insurance – 1.1% | | | | | | | | | | | | |
| | | | | |
| | 5,897 | | | Genworth Holdings Inc | | | 7.625% | | | | 9/24/21 | | | | B | | | | 6,211,900 | |
| | | | | |
| | | | Internet & Direct Marketing Retail – 1.3% | | | | | | | | | | | | |
| | | | | |
| | 6,655 | | | Netflix Inc | | | 5.500% | | | | 2/15/22 | | | | BB– | | | | 7,045,981 | |
| | | | | |
| | | | Machinery – 0.9% | | | | | | | | | | | | |
| | | | | |
| | 1,850 | | | CNH Industrial Capital LLC | | | 3.875% | | | | 10/15/21 | | | | BBB | | | | 1,898,360 | |
| | 3,000 | | | Vertiv Intermediate Holding Corp, 144A | | | 12.000% | | | | 2/15/22 | | | | CCC+ | | | | 3,112,500 | |
| | 4,850 | | | Total Machinery | | | | | | | | | | | | | | | 5,010,860 | |
| | | | | |
| | | | Media – 8.1% | | | | | | | | | | | | |
| | | | | |
| | 5,770 | | | CSC Holdings LLC | | | 6.750% | | | | 11/15/21 | | | | B | | | | 6,209,963 | |
| | 6,985 | | | DISH DBS Corp, (3) | | | 6.750% | | | | 6/01/21 | | | | B1 | | | | 7,343,400 | |
| | 4,250 | | | Lee Enterprises Inc, 144A | | | 9.500% | | | | 3/15/22 | | | | B2 | | | | 3,952,500 | |
| | 11,000 | | | Nielsen Finance LLC / Nielsen Finance Co, 144A | | | 5.000% | | | | 4/15/22 | | | | BB | | | | 11,041,250 | |
| | 10,250 | | | TEGNA Inc, 144A | | | 4.875% | | | | 9/15/21 | | | | BB | | | | 10,275,625 | |
| | 6,425 | | | Urban One Inc, 144A | | | 7.375% | | | | 4/15/22 | | | | B2 | | | | 6,328,625 | |
| | 44,680 | | | Total Media | | | | | | | | | | | | | | | 45,151,363 | |
| | | | | |
| | | | Metals & Mining – 6.0% | | | | | | | | | | | | |
| | | | | |
| | 6,500 | | | AK Steel Corp | | | 7.625% | | | | 10/01/21 | | | | B– | | | | 6,548,750 | |
| | 2,000 | | | Anglo American Capital PLC, 144A | | | 4.125% | | | | 4/15/21 | | | | BBB | | | | 2,039,508 | |
| | 676 | | | Arconic Inc | | | 5.400% | | | | 4/15/21 | | | | BBB– | | | | 696,913 | |
| | 3,825 | | | Arconic Inc, (3) | | | 5.870% | | | | 2/23/22 | | | | BBB– | | | | 4,084,422 | |
| | 2,000 | | | Century Aluminum Co, 144A | | | 7.500% | | | | 6/01/21 | | | | B | | | | 1,960,000 | |
| | 5,534 | | | Freeport-McMoRan Inc | | | 3.550% | | | | 3/01/22 | | | | Ba1 | | | | 5,603,175 | |
| | 1,500 | | | Glencore Finance Canada Ltd, 144A | | | 4.950% | | | | 11/15/21 | | | | BBB+ | | | | 1,568,657 | |
| | 3,200 | | | Gold Fields Orogen Holdings BVI Ltd, 144A | | | 4.875% | | | | 10/07/20 | | | | Baa3 | | | | 3,248,128 | |
| | 3,250 | | | Petra Diamonds US Treasury PLC, 144A, (3) | | | 7.250% | | | | 5/01/22 | | | | CCC+ | | | | 2,051,562 | |
| | 5,324 | | | Teck Resources Ltd, (3) | | | 4.750% | | | | 1/15/22 | | | | BBB– | | | | 5,513,980 | |
| | 33,809 | | | Total Metals & Mining | | | | | | | | | | | | | | | 33,315,095 | |
| | | | | |
| | | | Mortgage Real Estate Investment Trust – 1.2% | | | | | | | | | | | | |
| | | | | |
| | 6,500 | | | Starwood Property Trust Inc | | | 5.000% | | | | 12/15/21 | | | | BB– | | | | 6,743,750 | |
| | | | | |
| | | | Multiline Retail – 0.0% | | | | | | | | | | | | |
| | | | | |
| | 37 | | | JC Penney Corp Inc | | | 5.650% | | | | 6/01/20 | | | | CCC+ | | | | 34,780 | |
| | | | | |
| | | | Oil, Gas & Consumable Fuels – 14.2% | | | | | | | | | | | | |
| | | | | |
| | 3,000 | | | Antero Resources Corp | | | 5.375% | | | | 11/01/21 | | | | BB+ | | | | 2,856,563 | |
| | 6,250 | | | Calumet Specialty Products Partners LP / Calumet Finance Corp | | | 7.625% | | | | 1/15/22 | | | | B– | | | | 6,250,000 | |
| | 3,000 | | | Chesapeake Energy Corp, (3) | | | 4.875% | | | | 4/15/22 | | | | Caa3 | | | | 2,370,000 | |
| | 1,020 | | | DCP Midstream Operating LP, 144A | | | 4.750% | | | | 9/30/21 | | | | BB+ | | | | 1,048,050 | |
| | 2,480 | | | DCP Midstream Operating LP | | | 4.950% | | | | 4/01/22 | | | | BB+ | | | | 2,573,000 | |
33
| | |
| |
| JHB | | Nuveen High Income November 2021 Target Term Fund(continued) |
| | Portfolio of Investments December 31, 2019 |
| | | | | | | | | | | | | | | | | | | | | | | | |
Principal
Amount (000) | | | Description (1) | | | | | | Coupon | | | Maturity | | | Ratings (2) | | | Value | |
| | | | | |
| | | | Oil, Gas & Consumable Fuels(continued) | | | | | | | | | | | | |
| | | | | |
| $ | 4,500 | | | Denbury Resources Inc, 144A, (3) | | | 9.000% | | | | 5/15/21 | | | | B | | | $ | 4,353,750 | |
| | 2,910 | | | Martin Midstream Partners LP / Martin Midstream Finance Corp | | | 7.250% | | | | 2/15/21 | | | | B– | | | | 2,648,100 | |
| | 3,000 | | | Navigator Holdings Ltd, 144A, Reg S | | | 7.750% | | | | 2/10/21 | | | �� | N/R | | | | 3,021,094 | |
| | 2,172 | | | Newfield Exploration Co | | | 5.750% | | | | 1/30/22 | | | | BBB | | | | 2,308,067 | |
| | 7,000 | | | NuStar Logistics LP | | | 4.750% | | | | 2/01/22 | | | | Ba2 | | | | 7,210,000 | |
| | 4,000 | | | Oasis Petroleum Inc | | | 6.875% | | | | 3/15/22 | | | | B+ | | | | 3,850,000 | |
| | 4,475 | | | Peabody Energy Corp, 144A | | | 6.000% | | | | 3/31/22 | | | | BB– | | | | 4,363,125 | |
| | 2,000 | | | Petrobras Global Finance BV | | | 5.375% | | | | 1/27/21 | | | | Ba2 | | | | 2,063,200 | |
| | 2,000 | | | Petrobras Global Finance BV | | | 8.375% | | | | 5/23/21 | | | | Ba2 | | | | 2,175,000 | |
| | 3,000 | | | Petroleos Mexicanos | | | 4.875% | | | | 1/24/22 | | | | BBB+ | | | | 3,102,000 | |
| | 4,000 | | | Petroleos Mexicanos | | | 5.375% | | | | 3/13/22 | | | | BBB+ | | | | 4,170,000 | |
| | 3,000 | | | QEP Resources Inc | | | 6.875% | | | | 3/01/21 | | | | BB– | | | | 3,105,000 | |
| | 4,483 | | | Range Resources Corp | | | 5.750% | | | | 6/01/21 | | | | BB | | | | 4,471,792 | |
| | 2,059 | | | Sabine Pass Liquefaction LLC | | | 6.250% | | | | 3/15/22 | | | | BBB– | | | | 2,211,452 | |
| | 4,000 | | | Southwestern Energy Co, (3) | | | 4.100% | | | | 3/15/22 | | | | BB | | | | 3,915,000 | |
| | 4,500 | | | Whiting Petroleum Corp, (3) | | | 5.750% | | | | 3/15/21 | | | | BB– | | | | 4,257,000 | |
| | 5,000 | | | WPX Energy Inc | | | 6.000% | | | | 1/15/22 | | | | BB | | | | 5,175,000 | |
| | 1,500 | | | YPF SA, 144A, (3) | | | 8.500% | | | | 3/23/21 | | | | Caa2 | | | | 1,485,015 | |
| | 79,349 | | | Total Oil, Gas & Consumable Fuels | | | | | | | | | | | | | | | 78,982,208 | |
| | | | | |
| | | | Pharmaceuticals – 3.5% | | | | | | | | | | | | |
| | | | | |
| | 9,750 | | | Bausch Health Cos Inc, 144A, (3) | | | 6.500% | | | | 3/15/22 | | | | BB | | | | 9,969,375 | |
| | 3,750 | | | Teva Pharmaceutical Finance Co BV | | | 3.650% | | | | 11/10/21 | | | | BB | | | | 3,670,313 | |
| | 6,199 | | | Teva Pharmaceutical Finance IV BV | | | 3.650% | | | | 11/10/21 | | | | BBB | | | | 6,067,271 | |
| | 19,699 | | | Total Pharmaceuticals | | | | | | | | | | | | | | | 19,706,959 | |
| | | | | |
| | | | Real Estate Management & Development – 1.6% | | | | | | | | | | | | |
| | | | | |
| | 2,900 | | | China Evergrande Group, Reg S | | | 8.250% | | | | 3/23/22 | | | | B2 | | | | 2,713,280 | |
| | 5,930 | | | Realogy Group LLC / RealogyCo-Issuer Corp, 144A, (3) | | | 5.250% | | | | 12/01/21 | | | | B | | | | 5,989,300 | |
| | 8,830 | | | Total Real Estate Management & Development | | | | | | | | | | | | | | | 8,702,580 | |
| | | | | |
| | | | Semiconductors & Semiconductor Equipment – 0.6% | | | | | | | | | | | | |
| | | | | |
| | 850 | | | Microchip Technology Inc | | | 3.922% | | | | 6/01/21 | | | | Baa3 | | | | 869,084 | |
| | 2,535 | | | NXP BV / NXP Funding LLC, 144A | | | 4.125% | | | | 6/01/21 | | | | BBB– | | | | 2,598,524 | |
| | 3,385 | | | Total Semiconductors & Semiconductor Equipment | | | | | | | | | | | | | | | 3,467,608 | |
| | | | | |
| | | | Specialty Retail – 2.5% | | | | | | | | | | | | |
| | | | | |
| | 7,000 | | | Foot Locker Inc | | | 8.500% | | | | 1/15/22 | | | | BB+ | | | | 7,752,500 | |
| | 2,000 | | | Gap Inc, (3) | | | 5.950% | | | | 4/12/21 | | | | Baa2 | | | | 2,075,278 | |
| | 3,755 | | | L Brands Inc | | | 6.625% | | | | 4/01/21 | | | | Ba2 | | | | 3,933,362 | |
| | 448 | | | L Brands Inc | | | 5.625% | | | | 2/15/22 | | | | Ba2 | | | | 471,520 | |
| | 13,203 | | | Total Specialty Retail | | | | | | | | | | | | | | | 14,232,660 | |
| | | | | |
| | | | Technology Hardware, Storage & Peripherals – 2.6% | | | | | | | | | | | | |
| | | | | |
| | 7,938 | | | Dell International LLC / EMC Corp, 144A | | | 5.875% | | | | 6/15/21 | | | | BB+ | | | | 8,062,071 | |
| | 6,085 | | | Seagate HDD Cayman | | | 4.250% | | | | 3/01/22 | | | | Baa3 | | | | 6,296,172 | |
| | 14,023 | | | Total Technology Hardware, Storage & Peripherals | | | | | | | | | | | | | | | 14,358,243 | |
| | | | | |
| | | | Thrifts & Mortgage Finance – 2.6% | | | | | | | | | | | | |
| | | | | |
| | 4,500 | | | Ladder Capital Finance Holdings LLLP / Ladder Capital Finance Corp, 144A | | | 5.875% | | | | 8/01/21 | | | | BB | | | | 4,561,875 | |
| | 3,280 | | | Ladder Capital Finance Holdings LLLP / Ladder Capital Finance Corp, 144A | | | 5.250% | | | | 3/15/22 | | | | BB | | | | 3,407,100 | |
| | 6,669 | | | Nationstar Mortgage LLC / Nationstar Capital Corp, (3) | | | 6.500% | | | | 7/01/21 | | | | B | | | | 6,685,672 | |
| | 14,449 | | | Total Thrifts & Mortgage Finance | | | | | | | | | | | | | | | 14,654,647 | |
| | | | | |
| | | | Tobacco – 0.9% | | | | | | | | | | | | |
| | | | | |
| | 5,320 | | | Pyxus International Inc, 144A | | | 8.500% | | | | 4/15/21 | | | | B2 | | | | 5,133,800 | |
| | | | | |
| | | | Trading Companies & Distributors – 3.2% | | | | | | | | | | | | |
| | | | | |
| | 5,000 | | | Aircastle Ltd | | | 5.500% | | | | 2/15/22 | | | | BBB– | | | | 5,317,088 | |
| | 6,475 | | | Fly Leasing Ltd | | | 6.375% | | | | 10/15/21 | | | | BB | | | | 6,596,406 | |
34
| | | | | | | | | | | | | | | | | | | | | | | | | | | | |
Principal
Amount (000) | | | Description (1) | | | | | | | | Coupon | | | Maturity | | | Ratings (2) | | | Value | |
| | | | | |
| | | | Trading Companies & Distributors(continued) | | | | | | | | | | | | | |
| | | | | |
| $ | 5,500 | | | Fortress Transportation & Infrastructure Investors LLC, 144A | | | | 6.750% | | | | 3/15/22 | | | | BB– | | | $ | 5,733,750 | |
| | 16,975 | | | Total Trading Companies & Distributors | | | | | | | | | | | | | | | | 17,647,244 | |
| | | | | |
| | | | Wireless Telecommunication Services – 4.0% | | | | | | | | | | | | | |
| | | | | |
| | 2,100 | | | CenturyLink Inc | | | | 5.625% | | | | 4/01/20 | | | | BB | | | | 2,113,125 | |
| | 6,675 | | | Hughes Satellite Systems Corp | | | | 7.625% | | | | 6/15/21 | | | | BB | | | | 7,131,904 | |
| | 3,000 | | | MTN Mauritius Investments Ltd, 144A | | | | 5.373% | | | | 2/13/22 | | | | BB+ | | | | 3,105,828 | |
| | 1,475 | | | Sprint Communications Inc | | | | 9.250% | | | | 4/15/22 | | | | Ba2 | | | | 1,685,188 | |
| | 6,375 | | | Sprint Corp | | | | 7.250% | | | | 9/15/21 | | | | B+ | | | | 6,741,562 | |
| | 1,429 | | | T-Mobile USA Inc | | | | 4.000% | | | | 4/15/22 | | | | BB+ | | | | 1,462,939 | |
| | 529 | | | T-Mobile USA Inc, (5), (6), (7) | | | | 4.000% | | | | 4/15/22 | | | | N/R | | | | — | |
| | 21,583 | | | Total Wireless Telecommunication Services | | | | | | | | | | | | | | | | 22,240,546 | |
| $ | 561,987 | | | Total Corporate Bonds (cost $566,712,371) | | | | | | | | | | | | | | | | 572,457,203 | |
| | | | | | | |
Principal
Amount (000) | | | Description (1) | | Coupon (8) | | | Reference
Rate (8) | | | Spread (8) | | | Maturity (9) | | | Ratings (2) | | | Value | |
| |
| | | | VARIABLE RATE SENIOR LOAN INTERESTS – 6.1% (5.4% of Total Investments) (7) | |
| |
| | | | Airlines – 2.0% | |
| | | | | | | |
| $ | 10,958 | | | American Airlines, Inc., Replacement Term Loan | | | 3.715% | | | | 1-Month LIBOR | | | | 2.000% | | | | 10/10/21 | | | | BB+ | | | $ | 11,012,358 | |
| |
| | | | Commercial Services & Supplies – 1.3% | |
| | | | | | | |
| | 6,959 | | | Granite Acquisition Inc | | | 5.445% | | | | 3-Month LIBOR | | | | 3.500% | | | | 12/17/21 | | | | B+ | | | | 6,999,091 | |
| |
| | | | Health Care Providers & Services – 0.4% | |
| | | | | | | |
| | 2,456 | | | Acadia Healthcare, Inc., Term Loan B3 | | | 4.299% | | | | 1-Month LIBOR | | | | 2.500% | | | | 2/11/22 | | | | Ba2 | | | | 2,465,385 | |
| | | |
| | | | Software – 1.7% | | | | | | | |
| | | | | | | |
| | 2,982 | | | Infor (US), Inc., Term Loan B | | | 4.695% | | | | 3-Month LIBOR | | | | 2.750% | | | | 2/01/22 | | | | Ba3 | | | | 2,999,623 | |
| | 6,708 | | | Micro Focus International PLC, Term Loan B2 | | | 4.049% | | | | 1-Month LIBOR | | | | 2.250% | | | | 11/30/21 | | | | BB+ | | | | 6,762,957 | |
| | 9,690 | | | Total Software | | | | | | | | | | | | | | | | | | | | | | | 9,762,580 | |
| | | | | | |
| | | | Specialty Retail – 0.7% | | | | | | | | | | | | | | | | |
| | | | | | | |
| | 3,750 | | | Petsmart Inc., Term Loan B, First Lien | | | 4.740% | | | | 1-Month LIBOR | | | | 4.000% | | | | 3/11/22 | | | | B | | | | 3,717,375 | |
| $ | 33,813 | | | Total Variable Rate Senior Loan Interests (cost $33,649,045) | | | | | | | | | | | | 33,956,789 | |
| | | | | | | |
Principal
Amount (000) | | | Description (1) | | | | | | | | Coupon | | | Maturity | | | Ratings (2) | | | Value | |
| |
| | | | SOVEREIGN DEBT – 3.4% (2.9% of Total Investments) | |
| | | | | |
| | | | Argentina – 0.2% | | | | | | | | | | | | | |
| | | | | |
| $ | 2,000 | | | Argentine Republic Government International Bond | | | | 6.875% | | | | 4/22/21 | | | | Caa2 | | | $ | 1,080,000 | |
| | | | | |
| | | | Egypt – 1.3% | | | | | | | | | | | | | |
| | | | | |
| | 6,750 | | | Egypt Government International Bond, 144A | | | | 6.125% | | | | 1/31/22 | | | | B+ | | | | 7,026,763 | |
| | | | | |
| | | | Honduras – 0.3% | | | | | | | | | | | | | |
| | | | | |
| | 1,500 | | | Honduras Government International Bond, 144A | | | | 8.750% | | | | 12/16/20 | | | | BB– | | | | 1,578,750 | |
| | | | | |
| | | | Nigeria – 0.3% | | | | | | | | | | | | | |
| | | | | |
| | 1,750 | | | Nigeria Government International Bond, 144A | | | | 6.750% | | | | 1/28/21 | | | | B+ | | | | 1,813,438 | |
| | | | | |
| | | | Sri Lanka – 0.6% | | | | | | | | | | | | | |
| | | | | |
| | 3,500 | | | Sri Lanka Government International Bond, 144A | | | | 5.750% | | | | 1/18/22 | | | | B | | | | 3,512,245 | |
35
| | |
| |
| JHB | | Nuveen High Income November 2021 Target Term Fund(continued) |
| | Portfolio of Investments December 31, 2019 |
| | | | | | | | | | | | | | | | | | | | | | | | |
Principal
Amount (000) | | | Description (1) | | | | | | Coupon | | | Maturity | | | Ratings (2) | | | Value | |
| | | | | |
| | | | Turkey – 0.7% | | | | | | | | | | | | |
| | | | | |
| $ | 3,625 | | | Turkey Government International Bond, (3) | | | 5.125% | | | | 3/25/22 | | | | BB– | | | $ | 3,709,927 | |
| $ | 19,125 | | | Total Sovereign Debt (cost $19,573,010) | | | | | | | | | | | | | | | 18,721,123 | |
| | | | | | | |
Principal
Amount (000) | | | Description (1) | | | | | | Coupon | | | Maturity | | | Ratings (2) | | | Value | |
| |
| | | | CONVERTIBLE BONDS – 1.6% (1.4% of Total Investments) | |
| |
| | | | Commercial Services & Supplies – 0.9% | |
| | | | | |
| $ | 5,000 | | | Twitter Inc | | | 1.000% | | | | 9/15/21 | | | | N/R | | | $ | 4,862,500 | |
| |
| | | | Independent Power & Renewable Electricity Producers – 0.7% | |
| | | | | |
| | 4,000 | | | Clearway Energy Inc, 144A | | | 3.250% | | | | 6/01/20 | | | | N/R | | | | 3,987,612 | |
| $ | 9,000 | | | Total Convertible Bonds (cost $8,851,447) | | | | | | | | | | | | | | | 8,850,112 | |
| | | | Total Long-Term Investments (cost $628,785,873) | | | | | | | | | | | | | | | 633,985,227 | |
| | | | Borrowings – (34.5)% (10), (11) | | | | | | | | | | | | | | | (192,000,000 | ) |
| | | | Other Assets Less Liabilities – 20.7% | | | | | | | | | | | | | | | 115,187,335 | |
| | | | Net Assets Applicable to Common Shares – 100% | | | | | | | | | | | | | | $ | 557,172,562 | |
For Fund portfolio compliance purposes, the Fund’s industry classifications refer to any one or more of the industrysub-classifications used by one or more widely recognized market indexes or ratings group indexes, and/or as defined by Fund management. This definition may not apply for purposes of this report, which may combine industrysub-classifications into sectors for reporting ease.
| (1) | All percentages shown in the Portfolio of Investments are based on net assets applicable to common shares unless otherwise noted. |
| (2) | For financial reporting purposes, the ratings disclosed are the highest of Standard & Poor’s Group (“Standard & Poor’s”), Moody’s Investors Service, Inc. (“Moody’s”) or Fitch, Inc. (“Fitch”) rating. This treatment of split-rated securities may differ from that used for other purposes, such as for Fund investment policies. Ratings below BBB by Standard & Poor’s, Baa by Moody’s or BBB by Fitch are considered to be below investment grade. Holdings designated N/R are not rated by any of these national rating agencies. Ratings are not covered by the report of independent registered public accounting firm. |
| (3) | Investment, or portion of investment, is hypothecated as described in Notes to Financial Statements, Note 8 – Fund Leverage, Rehypothecation. The total value of investments hypothecated as of the end of the reporting period was $86,545,482. |
| (4) | Variable rate security. The rate shown is the coupon as of the end of the reporting period. |
| (5) | Investment valued at fair value using methods determined in good faith by, or at the discretion of, the Board. For fair value measurement disclosure purposes, investment classified as Level 3. See Notes to Financial Statements, Note 3 – Investment Valuation and Fair Value Measurements for more information. |
| (6) | Defaulted security. A security whose issuer has failed to fully pay principal and/or interest when due, or is under the protection of bankruptcy. |
| (7) | Non-income producing; issuer has not declared a dividend within the past twelve months. |
| (8) | Senior loans generally pay interest at rates which are periodically adjusted by reference to a base short-term, floating lending rate (Reference Rate) plus an assigned fixed rate (Spread). These floating lending rates are generally (i) the lending rate referenced by the London Inter-Bank Offered Rate (“LIBOR”), or (ii) the prime rate offered by one or more major United States banks. Senior loans may be considered restricted in that the Fund ordinarily is contractually obligated to receive approval from the agent bank and/or borrower prior to the disposition of a senior loan. The rate shown is the coupon as of the end of the reporting period. |
| (9) | Senior loans generally are subject to mandatory and/or optional prepayment. Because of these mandatory prepayment conditions and because there may be significant economic incentives for a borrower to prepay, prepayments of senior loans may occur. As a result, the actual remaining maturity of senior loans held may be substantially less than the stated maturities shown. |
| (10) | Borrowings as a percentage of Total Investments is 30.3%. |
| (11) | The Fund may pledge up to 100% of its eligible investments (excluding any investments separately pledged as collateral for specific investments in derivatives) in the Portfolio of Investments as collateral for borrowings. |
| 144A | Investment is exempt from registration under Rule 144A of the Securities Act of 1933, as amended. These investments may only be resold in transactions exempt from registration, which are normally those transactions with qualified institutional buyers. |
| LIBOR | London Inter-Bank Offered Rate |
| Reg S | Regulation S allows U.S. companies to sell securities to persons or entities located outside of the United States without registering those securities with the Securities and Exchange Commission. Specifically, Regulation S provides a safe harbor from the registration requirements of the Securities Act for the offers and sales of securities by both foreign and domestic issuers that are made outside the United States. |
See accompanying notes to financial statements.
36
| | |
| JHAA | | Nuveen High Income 2023 Target
Term Fund Portfolio of Investments December 31, 2019 |
| | | | | | | | | | | | | | | | | | | | | | | | | | | | |
Principal
Amount (000) | | | Description (1) | | | | | | | | Coupon | | | Maturity | | | Ratings (2) | | | Value | |
| |
| | | | LONG-TERM INVESTMENTS – 125.1% (93.0% of Total Investments) | |
| |
| | | | CORPORATE BONDS – 81.0% (60.3% of Total Investments) | |
| | | | | | | |
| | | | Aerospace & Defense – 0.8% | | | | | | | | | | | | | | | | | | |
| | | | | | | |
| $ | 600 | | | Bombardier Inc, 144A | | | | | | | | | | | 6.125% | | | | 1/15/23 | | | | B | | | $ | 615,300 | |
| | | | | | | |
| | | | Air Freight & Logistics – 1.5% | | | | | | | | | | | | | | | | | | |
| | | | | | | |
| | 1,200 | | | XPO Logistics Inc, 144A | | | | | | | | | | | 6.125% | | | | 9/01/23 | | | | BB– | | | | 1,238,760 | |
| | | | | | | |
| | | | Airlines – 2.0% | | | | | | | | | | | | | | | | | | |
| | | | | | | |
| | 500 | | | American Airlines Group Inc, 144A | | | | | | | | | | | 5.000% | | | | 6/01/22 | | | | BB– | | | | 523,125 | |
| | 1,000 | | | United Airlines Holdings Inc | | | | | | | | | | | 5.000% | | | | 2/01/24 | | | | BB | | | | 1,067,300 | |
| | 1,500 | | | Total Airlines | | | | | | | | | | | | | | | | | | | | | | | 1,590,425 | |
| | | | | | | |
| | | | Auto Components – 1.2% | | | | | | | | | | | | | | | | | | |
| | | | | | | |
| | 975 | | | Icahn Enterprises LP / Icahn Enterprises Finance Corp | | | | | | | | | | | 6.750% | | | | 2/01/24 | | | | BB+ | | | | 1,011,563 | |
| | | | | | | |
| | | | Automobiles – 1.6% | | | | | | | | | | | | | | | | | | |
| | | | | | | |
| | 375 | | | Fiat Chrysler Automobiles NV | | | | | | | | | | | 5.250% | | | | 4/15/23 | | | | BBB– | | | | 400,781 | |
| | 800 | | | Ford Motor Credit Co LLC | | | | | | | | | | | 5.584% | | | | 3/18/24 | | | | BBB | | | | 865,367 | |
| | 1,175 | | | Total Automobiles | | | | | | | | | | | | | | | | | | | | | | | 1,266,148 | |
| | | | | | | |
| | | | Chemicals – 5.3% | | | | | | | | | | | | | | | | | | |
| | | | | | | |
| | 600 | | | Blue Cube Spinco LLC | | | | | | | | | | | 9.750% | | | | 10/15/23 | | | | BB+ | | | | 645,192 | |
| | 800 | | | Chemours Co | | | | | | | | | | | 6.625% | | | | 5/15/23 | | | | Ba3 | | | | 803,064 | |
| | 1,525 | | | NOVA Chemicals Corp, 144A | | | | | | | | | | | 4.875% | | | | 6/01/24 | | | | BB+ | | | | 1,574,562 | |
| | 1,200 | | | OCI NV, 144A | | | | | | | | | | | 6.625% | | | | 4/15/23 | | | | BB | | | | 1,251,000 | |
| | 4,125 | | | Total Chemicals | | | | | | | | | | | | | | | | | | | | | | | 4,273,818 | |
| | | | | | | |
| | | | Commercial Services & Supplies – 3.7% | | | | | | | | | | | | | | | | | | |
| | | | | | | |
| | 1,475 | | | ADT Security Corp | | | | | | | | | | | 4.125% | | | | 6/15/23 | | | | BB– | | | | 1,521,094 | |
| | 350 | | | APX Group Inc | | | | | | | | | | | 7.875% | | | | 12/01/22 | | | | B2 | | | | 353,062 | |
| | 600 | | | Covanta Holding Corp | | | | | | | | | | | 5.875% | | | | 3/01/24 | | | | B1 | | | | 617,250 | |
| | 525 | | | GFL Environmental Inc, 144A | | | | | | | | | | | 5.375% | | | | 3/01/23 | | | | CCC+ | | | | 540,750 | |
| | 2,950 | | | Total Commercial Services & Supplies | | | | | | | | | | | | | | | | | | | | | | | 3,032,156 | |
| | | | | | | |
| | | | Communications Equipment – 1.5% | | | | | | | | | | | | | | | | | | |
| | | | | | | |
| | 375 | | | Anixter Inc | | | | | | | | | | | 5.500% | | | | 3/01/23 | | | | BBB– | | | | 394,688 | |
| | 750 | | | CommScope Inc, 144A | | | | | | | | | | | 5.500% | | | | 3/01/24 | | | | Ba3 | | | | 781,875 | |
| | 1,125 | | | Total Communications Equipment | | | | | | | | | | | | | | | | | | | | | | | 1,176,563 | |
| | | | | | | |
| | | | Construction Materials – 0.5% | | | | | | | | | | | | | | | | | | |
| | | | | | | |
| | 422 | | | CEMEX Finance LLC, 144A | | | | | | | | | | | 6.000% | | | | 4/01/24 | | | | BB | | | | 433,820 | |
| | | | | | | |
| | | | Consumer Finance – 3.5% | | | | | | | | | | | | | | | | | | |
| | | | | | | |
| | 800 | | | Navient Corp | | | | | | | | | | | 7.250% | | | | 9/25/23 | | | | BB | | | | 904,024 | |
| | 1,300 | | | Springleaf Finance Corp | | | | | | | | | | | 8.250% | | | | 10/01/23 | | | | BB– | | | | 1,514,500 | |
| | 500 | | | TMX Finance LLC / TitleMax Finance Corp, 144A | | | | | | | | | | | 11.125% | | | | 4/01/23 | | | | B– | | | | 452,500 | |
| | 2,600 | | | Total Consumer Finance | | | | | | | | | | | | | | | | | | | | | | | 2,871,024 | |
| | | | | | | |
| | | | Containers & Packaging – 1.7% | | | | | | | | | | | | | | | | | | |
| | | | | | | |
| | 500 | | | OI European Group BV, 144A | | | | | | | | | | | 4.000% | | | | 3/15/23 | | | | BB– | | | | 503,750 | |
| | 850 | | | Sealed Air Corp, 144A | | | | | | | | | | | 5.250% | | | | 4/01/23 | | | | BB+ | | | | 905,250 | |
| | 1,350 | | | Total Containers & Packaging | | | | | | | | | | | | | | | | | | | | | | | 1,409,000 | |
37
| | |
| |
| JHAA | | Nuveen High Income 2023 Target Term Fund(continued) |
| | Portfolio of Investments December 31, 2019 |
| | | | | | | | | | | | | | | | | | | | | | | | | | | | |
Principal
Amount (000) | | | Description (1) | | | | | | | | Coupon | | | Maturity | | | Ratings (2) | | | Value | |
| | | | | | | |
| | | | Diversified Financial Services – 2.6% | | | | | | | | | | | | | | | | | | |
| | | | | | | |
| $ | 900 | | | Comunicaciones Celulares SA Via Comcel Trust, 144A | | | | | | | | | | | 6.875% | | | | 2/06/24 | | | | Ba1 | | | $ | 922,509 | |
| | 300 | | | Park Aerospace Holdings Ltd, 144A | | | | | | | | | | | 4.500% | | | | 3/15/23 | | | | BBB– | | | | 314,100 | |
| | 350 | | | Park Aerospace Holdings Ltd, 144A | | | | | | | | | | | 5.500% | | | | 2/15/24 | | | | BBB– | | | | 384,268 | |
| | 500 | | | PetSmart Inc, 144A | | | | | | | | | | | 7.125% | | | | 3/15/23 | | | | CCC+ | | | | 490,000 | |
| | 2,050 | | | Total Diversified Financial Services | | | | | | | | | | | | | | | | | | | | | | | 2,110,877 | |
| | | | | | | |
| | | | Diversified Telecommunication Services – 1.4% | | | | | | | | | | | | | | | | | | |
| | | | | | | |
| | 1,000 | | | CenturyLink Inc | | | | | | | | | | | 6.750% | | | | 12/01/23 | | | | BB | | | | 1,116,250 | |
| | | | | | | |
| | | | Electric Utilities – 0.8% | | | | | | | | | | | | | | | | | | |
| | | | | | | |
| | 600 | | | TerraForm Power Operating LLC, 144A | | | | | | | | | | | 4.250% | | | | 1/31/23 | | | | BB | | | | 617,682 | |
| | | | | | | |
| | | | Energy Equipment & Services – 2.6% | | | | | | | | | | | | | | | | | | |
| | | | | | | |
| | 250 | | | Archrock Partners LP / Archrock Partners Finance Corp | | | | | | | | | | | 6.000% | | | | 10/01/22 | | | | B+ | | | | 251,875 | |
| | 500 | | | Diamond Offshore Drilling Inc | | | | | | | | | | | 3.450% | | | | 11/01/23 | | | | B3 | | | | 425,000 | |
| | 1,000 | | | Nabors Industries Inc | | | | | | | | | | | 5.100% | | | | 9/15/23 | | | | BB– | | | | 897,900 | |
| | 500 | | | Transocean Sentry Ltd, 144A | | | | | | | | | | | 5.375% | | | | 5/15/23 | | | | B1 | | | | 508,750 | |
| | 2,250 | | | Total Energy Equipment & Services | | | | | | | | | | | | | | | | | | | | | | | 2,083,525 | |
| | | | | | | |
| | | | Equity Real Estate Investment Trust – 1.8% | | | | | | | | | | | | | | | | | | |
| | | | | | | |
| | 800 | | | iStar Inc | | | | | | | | | | | 5.250% | | | | 9/15/22 | | | | BB | | | | 821,000 | |
| | 600 | | | MPT Operating Partnership LP / MPT Finance Corp | | | | | | | | | | | 5.500% | | | | 5/01/24 | | | | BBB– | | | | 615,750 | |
| | 1,400 | | | Total Equity Real Estate Investment Trust | | | | | | | | | | | | | | | | | | | | | | | 1,436,750 | |
| | | | | | | |
| | | | Food Products – 1.6% | | | | | | | | | | | | | | | | | | |
| | | | | | | |
| | 1,250 | | | MARB BondCo PLC, 144A | | | | | | | | | | | 7.000% | | | | 3/15/24 | | | | BB– | | | | 1,303,125 | |
| | | | | | | |
| | | | Gas Utilities – 2.2% | | | | | | | | | | | | | | | | | | |
| | | | | | | |
| | 900 | | | AmeriGas Partners LP / AmeriGas Finance Corp | | | | | | | | | | | 5.625% | | | | 5/20/24 | | | | BB | | | | 972,000 | |
| | 825 | | | Suburban Propane Partners LP/Suburban Energy Finance Corp | | | | | | | | | | | 5.500% | | | | 6/01/24 | | | | BB– | | | | 847,688 | |
| | 1,725 | | | Total Gas Utilities | | | | | | | | | | | | | | | | | | | | | | | 1,819,688 | |
| | | | | | | |
| | | | Health Care Providers & Services – 4.8% | | | | | | | | | | | | | | | | | | |
| | | | | | | |
| | 500 | | | Centene Corp | | | | | | | | | | | 6.125% | | | | 2/15/24 | | | | BBB– | | | | 518,750 | |
| | 750 | | | CHS/Community Health Systems Inc, 144A | | | | | | | | | | | 8.625% | | | | 1/15/24 | | | | B– | | | | 795,000 | |
| | 850 | | | MEDNAX Inc, 144A | | | | | | | | | | | 5.250% | | | | 12/01/23 | | | | BB | | | | 869,125 | |
| | 1,000 | | | RegionalCare Hospital Partners Holdings Inc, 144A | | | | | | | | | | | 8.250% | | | | 5/01/23 | | | | B+ | | | | 1,057,500 | |
| | 600 | | | Tenet Healthcare Corp, (3) | | | | | | | | | | | 6.750% | | | | 6/15/23 | | | | B– | | | | 659,226 | |
| | 3,700 | | | Total Health Care Providers & Services | | | | | | | | | | | | | | | | | | | | | | | 3,899,601 | |
| | | | | | | |
| | | | Hotels, Restaurants & Leisure – 2.9% | | | | | | | | | | | | | | | | | | |
| | | | | | | |
| | 1,000 | | | MGM Resorts International | | | | | | | | | | | 6.000% | | | | 3/15/23 | | | | BB | | | | 1,097,500 | |
| | 600 | | | Scientific Games International Inc | | | | | | | | | | | 6.625% | | | | 5/15/21 | | | | CCC+ | | | | 608,250 | |
| | 600 | | | Wynn Las Vegas LLC / Wynn Las Vegas Capital Corp, 144A | | | | | | | | | | | 4.250% | | | | 5/30/23 | | | | BB | | | | 628,386 | |
| | 2,200 | | | Total Hotels, Restaurants & Leisure | | | | | | | | | | | | | | | | | | | | | | | 2,334,136 | |
| | | | | | | |
| | | | Household Durables – 5.2% | | | | | | | | | | | | | | | | | | |
| | | | | | | |
| | 1,250 | | | KB Home | | | | | | | | | | | 7.625% | | | | 5/15/23 | | | | BB– | | | | 1,400,000 | |
| | 650 | | | Lennar Corp | | | | | | | | | | | 4.875% | | | | 12/15/23 | | | | BBB– | | | | 694,687 | |
| | 250 | | | Shea Homes LP / Shea Homes Funding Corp, 144A | | | | | | | | | | | 5.875% | | | | 4/01/23 | | | | BB– | | | | 254,688 | |
| | 785 | | | Taylor Morrison Communities Inc / Taylor Morrison Holdings II Inc, 144A | | | | | | | | | | | 5.625% | | | | 3/01/24 | | | | BB | | | | 847,800 | |
| | 900 | | | Toll Brothers Finance Corp | | | | | | | | | | | 5.625% | | | | 1/15/24 | | | | BBB– | | | | 986,625 | |
| | 3,835 | | | Total Household Durables | | | | | | | | | | | | | | | | | | | | | | | 4,183,800 | |
| |
| | | | Independent Power & Renewable Electricity Producers – 1.7% | |
| | | | | | | |
| | 250 | | | AES Corp | | | | | | | | | | | 4.875% | | | | 5/15/23 | | | | BBB– | | | | 253,750 | |
| | 475 | | | Calpine Corp | | | | | | | | | | | 5.500% | | | | 2/01/24 | | | | BB– | | | | 482,125 | |
| | 600 | | | Vistra Energy Corp | | | | | | | | | | | 5.875% | | | | 6/01/23 | | | | BB | | | | 613,824 | |
| | 1,325 | | | Total Independent Power & Renewable Electricity Producers | | | | | | | | | | | | | | | | | | | | | | | 1,349,699 | |
38
| | | | | | | | | | | | | | | | | | | | | | | | | | | | |
Principal
Amount (000) | | | Description (1) | | | | | | | | Coupon | | | Maturity | | | Ratings (2) | | | Value | |
| | | | | | | |
| | | | Insurance – 0.6% | | | | | | | | | | | | | | | | | | |
| | | | | | | |
| $ | 500 | | | Genworth Holdings Inc | | | | | | | | | | | 4.900% | | | | 8/15/23 | | | | B | | | $ | 495,000 | |
| | | | | | | |
| | | | Leisure Products – 0.6% | | | | | | | | | | | | | | | | | | |
| | | | | | | |
| | 500 | | | Mattel Inc | | | | | | | | | | | 3.150% | | | | 3/15/23 | | | | B | | | | 492,500 | |
| | | | | | | |
| | | | Machinery – 0.8% | | | | | | | | | | | | | | | | | | |
| | | | | |
| | 750 | | | Apex Tool Group LLC / BC Mountain Finance Inc, 144A | | | | 9.000% | | | | 2/15/23 | | | | CCC+ | | | | 673,125 | |
| | | | | | | |
| | | | Media – 2.8% | | | | | | | | | | | | | | | | | | |
| | | | | | | |
| | 850 | | | AMC Networks Inc | | | | | | | | | | | 5.000% | | | | 4/01/24 | | | | BB | | | | 867,000 | |
| | 375 | | | CCO Holdings LLC / CCO Holdings Capital Corp, 144A | | | | 4.000% | | | | 3/01/23 | | | | BB+ | | | | 380,156 | |
| | 600 | | | CSC Holdings LLC | | | | | | | | | | | 5.250% | | | | 6/01/24 | | | | B | | | | 646,500 | |
| | 375 | | | Lamar Media Corp | | | | | | | | | | | 5.375% | | | | 1/15/24 | | | | BB | | | | 382,500 | |
| | 2,200 | | | Total Media | | | | | | | | | | | | | | | | | | | | | | | 2,276,156 | |
| | | | | | | |
| | | | Metals & Mining – 7.0% | | | | | | | | | | | | | | | | | | |
| | | | | | | |
| | 850 | | | Commercial Metals Co | | | | | | | | | | | 4.875% | | | | 5/15/23 | | | | BB+ | | | | 884,000 | |
| | 650 | | | Constellium SE, 144A | | | | | | | | | | | 5.750% | | | | 5/15/24 | | | | B | | | | 667,875 | |
| | 1,250 | | | First Quantum Minerals Ltd, 144A | | | | | | | | | | | 6.500% | | | | 3/01/24 | | | | B | | | | 1,253,125 | |
| | 1,125 | | | FMG Resources August 2006 Pty Ltd, 144A | | | | 5.125% | | | | 5/15/24 | | | | BB+ | | | | 1,195,313 | |
| | 500 | | | Freeport-McMoRan Inc | | | | | | | | | | | 3.875% | | | | 3/15/23 | | | | Ba1 | | | | 509,115 | |
| | 650 | | | Hudbay Minerals Inc, 144A | | | | | | | | | | | 7.250% | | | | 1/15/23 | | | | B | | | | 673,969 | |
| | 500 | | | Steel Dynamics Inc | | | | | | | | | | | 5.250% | | | | 4/15/23 | | | | BBB | | | | 509,713 | |
| | 5,525 | | | Total Metals & Mining | | | | | | | | | | | | | | | | | | | | | | | 5,693,110 | |
| | | | | | | |
| | | | Oil, Gas & Consumable Fuels – 8.2% | | | | | | | | | | | | | | | | | | |
| | | | | | | |
| | 300 | | | Buckeye Partners LP | | | | | | | | | | | 4.150% | | | | 7/01/23 | | | | BB | | | | 301,455 | |
| | 500 | | | Calumet Specialty Products Partners LP / Calumet Finance Corp | | | | 7.750% | | | | 4/15/23 | | | | B– | | | | 498,750 | |
| | 375 | | | Chesapeake Energy Corp | | | | 5.750% | | | | 3/15/23 | | | | Caa3 | | | | 253,830 | |
| | 455 | | | Denbury Resources Inc, 144A | | | | 7.750% | | | | 2/15/24 | | | | B | | | | 402,675 | |
| | 250 | | | Energy Transfer Operating LP | | | | 5.875% | | | | 1/15/24 | | | | BBB– | | | | 276,583 | |
| | 500 | | | EnLink Midstream Partners LP | | | | 4.400% | | | | 4/01/24 | | | | BBB– | | | | 485,050 | |
| | 1,000 | | | Genesis Energy LP / Genesis Energy Finance Corp | | | | 6.000% | | | | 5/15/23 | | | | B+ | | | | 990,000 | |
| | 250 | | | Oasis Petroleum Inc | | | | 6.875% | | | | 1/15/23 | | | | B+ | | | | 244,375 | |
| | 750 | | | PBF Holding Co LLC / PBF Finance Corp | | | | 7.000% | | | | 11/15/23 | | | | BB | | | | 778,125 | |
| | 375 | | | Range Resources Corp | | | | 5.000% | | | | 3/15/23 | | | | BB | | | | 344,933 | |
| | 1,000 | | | SM Energy Co | | | | 5.000% | | | | 1/15/24 | | | | BB– | | | | 952,500 | |
| | 1,100 | | | Sunoco LP / Sunoco Finance Corp | | | | | | | | | | | 4.875% | | | | 1/15/23 | | | | BB | | | | 1,124,772 | |
| | 6,855 | | | Total Oil, Gas & Consumable Fuels | | | | | | | | | | | | | | | | | | | | | | | 6,653,048 | |
| | | | | | | |
| | | | Pharmaceuticals – 3.1% | | | | | | | | | | | | | | | | | | |
| | | | | | | |
| | 1,125 | | | Bausch Health Cos Inc, 144A | | | | | | | | | | | 7.000% | | | | 3/15/24 | | | | BB | | | | 1,170,000 | |
| | 1,300 | | | Teva Pharmaceutical Finance Netherlands III BV | | | | 6.000% | | | | 4/15/24 | | | | BB | | | | 1,315,600 | |
| | 2,425 | | | Total Pharmaceuticals | | | | | | | | | | | | | | | | | | | | | | | 2,485,600 | |
| |
| | | | Real Estate Management & Development – 1.9% | |
| | | | | | | |
| | 650 | | | Kennedy-Wilson Inc | | | | | | | | | | | 5.875% | | | | 4/01/24 | | | | BB | | | | 666,250 | |
| | 850 | | | Realogy Group LLC / RealogyCo-Issuer Corp, 144A | | | | 4.875% | | | | 6/01/23 | | | | B | | | | 835,125 | |
| | 1,500 | | | Total Real Estate Management & Development | | | | | | | | | | | | | | | | 1,501,375 | |
| | | | | | | |
| | | | Road & Rail – 1.6% | | | | | | | | | | | | | | | | | | |
| | | | | |
| | 1,250 | | | Avis Budget Car Rental LLC / Avis Budget Finance Inc, 144A | | | | 6.375% | | | | 4/01/24 | | | | BB | | | | 1,296,875 | |
| | | | | | | |
| | | | Specialty Retail – 1.3% | | | | | | | | | | | | | | | | | | |
| | | | | | | |
| | 1,000 | | | L Brands Inc | | | | | | | | | | | 5.625% | | | | 10/15/23 | | | | Ba2 | | | | 1,078,750 | |
| |
| | | | Technology Hardware, Storage & Peripherals – 0.9% | |
| | | | | | | |
| | 375 | | | EMC Corp | | | | | | | | | | | 3.375% | | | | 6/01/23 | | | | BB | | | | 382,500 | |
| | 350 | | | NCR Corp | | | | | | | | | | | 6.375% | | | | 12/15/23 | | | | BB | | | | 358,750 | |
| | 725 | | | Total Technology Hardware, Storage & Peripherals | | | | | | | | | | | | 741,250 | |
39
| | |
| |
| JHAA | | Nuveen High Income 2023 Target Term Fund(continued) |
| | Portfolio of Investments December 31, 2019 |
| | | | | | | | | | | | | | | | | | | | | | | | | | | | |
Principal
Amount (000) | | | Description (1) | | | | | | | | Coupon | | | Maturity | | | Ratings (2) | | | Value | |
| |
| | | | Wireless Telecommunication Services – 1.3% | |
| | | | | | | |
| $ | 500 | | | Altice Financing SA, 144A | | | | | | | | | | | 6.625% | | | | 2/15/23 | | | | B+ | | | $ | 508,750 | |
| | 525 | | | Sprint Corp | | | | | | | | 7.875% | | | | 9/15/23 | | | | B+ | | | | 579,248 | |
| | 1,025 | | | Total Wireless Telecommunication Services | | | | | | | | | | | | | | | | | | | | 1,087,998 | |
| $ | 63,612 | | | Total Corporate Bonds (cost $62,363,385) | | | | | | | | | | | | | | | | | | | | 65,648,497 | |
| | | | | | | |
Principal
Amount (000) | | | Description (1) | | Coupon (4) | | | Reference
Rate (4) | | | Spread (4) | | | Maturity (5) | | | Ratings (2) | | | Value | |
| | |
| | | | VARIABLE RATE SENIOR LOAN INTERESTS – 42.0% (31.2% of Total Investments) (4) | | | | | |
| |
| | | | Aerospace & Defense – 0.7% | |
| | | | | | | |
| $ | 594 | | | Transdigm, Inc., Term Loan F | | | 4.299% | | | | 1-Month LIBOR | | | | 2.500% | | | | 6/09/23 | | | | Ba3 | | | $ | 596,862 | |
| |
| | | | Airlines – 0.7% | |
| | | | | | | |
| | 594 | | | American Airlines, Inc., Term Loan B | | | 3.740% | | | | 1-Month LIBOR | | | | 2.000% | | | | 12/14/23 | | | | BB+ | | | | 596,767 | |
| |
| | | | Auto Components – 0.4% | |
| | | | | | | |
| | 299 | | | Adient US LLC | | | 6.182% | | | | 3-Month LIBOR | | | | 4.250% | | | | 5/06/24 | | | | Ba2 | | | | 301,530 | |
| |
| | | | Beverages – 0.7% | |
| | | | | | | |
| | 620 | | | Chill Merger Sub Inc | | | 5.299% | | | | 1-Month LIBOR | | | | 3.500% | | | | 3/20/24 | | | | B– | | | | 600,310 | |
| |
| | | | Building Products – 3.0% | |
| | | | | | | |
| | 1,092 | | | CHI Doors Holdings Corp | | | 5.049% | | | | 1-Month LIBOR | | | | 3.250% | | | | 7/31/22 | | | | B | | | | 1,098,528 | |
| | 1,300 | | | Quikrete Holdings, Inc., Term Loan B | | | 4.549% | | | | 1-Month LIBOR | | | | 2.750% | | | | 11/15/23 | | | | BB– | | | | 1,307,540 | |
| | 2,392 | | | Total Building Products | | | | | | | | | | | | | | | | | | | | 2,406,068 | |
| |
| | | | Capital Markets – 0.4% | |
| | | | | | | |
| | 300 | | | Capital Automotive LP, Term Loan, First Lien | | | 4.300% | | | | 1-Month LIBOR | | | | 2.500% | | | | 3/24/24 | | | | B1 | | | | 301,477 | |
| |
| | | | Chemicals – 0.3% | |
| | | | | | | |
| | 249 | | | Ineos US Finance LLC, Term Loan | | | 3.799% | | | | 1-Month LIBOR | | | | 2.000% | | | | 3/31/24 | | | | BBB– | | | | 249,874 | |
| |
| | | | Commercial Services & Supplies – 1.3% | |
| | | | | | | |
| | 371 | | | Granite Acquisition Inc | | | 5.445% | | | | 3-Month LIBOR | | | | 3.500% | | | | 12/17/21 | | | | B+ | | | | 373,151 | |
| | 643 | | | RR Donnelley & Sons Co | | | 6.799% | | | | 1-Month LIBOR | | | | 5.000% | | | | 1/15/24 | | | | B+ | | | | 649,533 | |
| | 1,014 | | | Total Commercial Services & Supplies | | | | | | | | | | | | | | | | | | | | 1,022,684 | |
| |
| | | | Communications Equipment – 1.5% | |
| | | | | | | |
| | 248 | | | Cyxtera DC Holdings Inc | | | 4.740% | | | | 1-Month LIBOR | | | | 3.000% | | | | 5/01/24 | | | | B1 | | | | 220,497 | |
| | 973 | | | Univision Communications, Inc., Term Loan C5 | | | 4.549% | | | | 1-Month LIBOR | | | | 2.750% | | | | 3/15/24 | | | | B | | | | 962,538 | |
| | 1,221 | | | Total Communications Equipment | | | | | | | | | | | | | | | | | | | | 1,183,035 | |
| |
| | | | Containers & Packaging – 2.4% | |
| | | | | | | |
| | 748 | | | Berry Global Inc | | | 3.715% | | | | 1-Month LIBOR | | | | 2.000% | | | | 1/19/24 | | | | BBB– | | | | 751,787 | |
| | 584 | | | Flex Acquisition Co Inc | | | 5.091% | | | | 3-Month LIBOR | | | | 3.000% | | | | 12/31/23 | | | | B | | | | 580,621 | |
| | 643 | | | TricorBraun Inc | | | 5.698% | | | | 3-Month LIBOR | | | | 3.750% | | | | 11/30/23 | | | | B2 | | | | 638,707 | |
| | 1,975 | | | Total Containers & Packaging | | | | | | | | | | | | | | | | | | | | 1,971,115 | |
| |
| | | | Distributors – 1.1% | |
| | | | | | | |
| | 249 | | | Atotech Alpha 3 BV | | | 4.945% | | | | 3-Month LIBOR | | | | 3.000% | | | | 1/31/24 | | | | B1 | | | | 250,325 | |
| | 644 | | | Spin Holdco Inc | | | 5.251% | | | | 3-Month LIBOR | | | | 3.250% | | | | 11/14/22 | | | | B2 | | | | 639,496 | |
| | 893 | | | Total Distributors | | | | | | | | | | | | | | | | | | | | 889,821 | |
| |
| | | | Diversified Financial Services – 0.9% | |
| | | | | | | |
| | 643 | | | NFP Corp | | | 4.799% | | | | 1-Month LIBOR | | | | 3.000% | | | | 1/05/24 | | | | B | | | | 641,817 | |
| | 50 | | | NFP Corp, (WI/DD) | | | TBD | | | | TBD | | | | TBD | | | | TBD | | | | N/R | | | | 49,879 | |
| | 693 | | | Total Diversified Financial Services | | | | | | | | | | | | | | | | | | | | 691,696 | |
40
| | | | | | | | | | | | | | | | | | | | | | | | | | | | |
Principal
Amount (000) | | | Description (1) | | Coupon (4) | | | Reference
Rate (4) | | | Spread (4) | | | Maturity (5) | | | Ratings (2) | | | Value | |
| |
| | | | Food & Staples Retailing – 0.5% | |
| | | | | | | |
| $ | 399 | | | Give & Go Prepared Foods Corp. | | | 6.195% | | | | 3-Month LIBOR | | | | 4.250% | | | | 7/29/23 | | | | B– | | | $ | 381,524 | |
| |
| | | | Health Care Providers & Services – 3.6% | |
| | | | | | | |
| | 499 | | | ExamWorks Group Inc | | | 5.049% | | | | 1-Month LIBOR | | | | 3.250% | | | | 7/27/23 | | | | B1 | | | | 502,767 | |
| | 1,000 | | | Onex Schumacher Finance LP | | | 5.799% | | | | 1-Month LIBOR | | | | 4.000% | | | | 7/29/22 | | | | B1 | | | | 934,000 | |
| | 643 | | | Pharmaceutical Product Development, Inc., Term Loan B | | | 4.299% | | | | 1-Month LIBOR | | | | 2.500% | | | | 8/18/22 | | | | Ba3 | | | | 647,577 | |
| | 990 | | | Team Health, Initial Term Loan | | | 4.549% | | | | 1-Month LIBOR | | | | 2.750% | | | | 2/06/24 | | | | B+ | | | | 806,086 | |
| | 3,132 | | | Total Health Care Providers & Services | | | | | | | | | | | | | | | | | | | | 2,890,430 | |
| |
| | | | Health Care Technology – 0.6% | |
| | | | | | | |
| | 470 | | | Emdeon, Inc., Term Loan | | | 4.299% | | | | 1-Month LIBOR | | | | 2.500% | | | | 3/01/24 | | | | B+ | | | | 472,112 | |
| |
| | | | Hotels, Restaurants & Leisure – 1.9% | |
| | | | | | | |
| | 745 | | | Boyd Gaming Corporation, Refinancing Term Loan B | | | 3.853% | | | | 1-Week LIBOR | | | | 2.250% | | | | 9/15/23 | | | | BB | | | | 750,942 | |
| | 300 | | | CityCenter Holdings LLC, Term Loan B, (WI/DD) | | | TBD | | | | TBD | | | | TBD | | | | TBD | | | | BB– | | | | 301,664 | |
| | 495 | | | Travel Leaders Group LLC | | | 5.792% | | | | 1-Month LIBOR | | | | 4.000% | | | | 1/25/24 | | | | N/R | | | | 498,068 | |
| | 1,540 | | | Total Hotels, Restaurants & Leisure | | | | | | | | | | | | | | | | | | | | 1,550,674 | |
| |
| | | | Household Durables – 0.8% | |
| | | | | | | |
| | 643 | | | Wilsonart LLC | | | 5.200% | | | | 3-Month LIBOR | | | | 3.250% | | | | 12/19/23 | | | | B+ | | | | 646,216 | |
| |
| | | | Independent Power & Renewable Electricity Producers – 0.4% | |
| | | | | | | |
| | 297 | | | Calpine Corporation, Term Loan B5 | | | 4.200% | | | | 3-Month LIBOR | | | | 2.250% | | | | 1/15/24 | | | | BB+ | | | | 298,811 | |
| |
| | | | Insurance – 2.7% | |
| | | | | | | |
| | 643 | | | Acrisure LLC, Term Loan B | | | 6.195% | | | | 3-Month LIBOR | | | | 4.250% | | | | 11/22/23 | | | | B | | | | 646,233 | |
| | 399 | | | Asurion LLC, Term Loan B6 | | | 4.799% | | | | 1-Month LIBOR | | | | 3.000% | | | | 11/03/23 | | | | Ba3 | | | | 401,802 | |
| | 495 | | | BroadStreet Partners Inc | | | 5.049% | | | | 1-Month LIBOR | | | | 3.250% | | | | 11/08/23 | | | | B | | | | 497,684 | |
| | 644 | | | USI Holdings Corporation, Initial Term Loan | | | 4.945% | | | | 3-Month LIBOR | | | | 3.000% | | | | 5/16/24 | | | | B | | | | 644,302 | |
| | 2,181 | | | Total Insurance | | | | | | | | | | | | | | | | | | | | 2,190,021 | |
| |
| | | | Internet & Direct Marketing Retail – 1.2% | |
| | | | | | | |
| | 990 | | | CNT Holdings III Corp | | | 4.800% | | | | 1-Month LIBOR | | | | 3.000% | | | | 1/22/23 | | | | B1 | | | | 991,033 | |
| |
| | | | IT Services – 1.9% | |
| | | | | | | |
| | 990 | | | DTI Holdings, Inc., Replacement Term Loan B1 | | | 6.677% | | | | 3-Month LIBOR | | | | 4.750% | | | | 9/30/23 | | | | B– | | | | 929,755 | |
| | 643 | | | Tempo Acquisition LLC, Term Loan B | | | 4.549% | | | | 1-Month LIBOR | | | | 2.750% | | | | 5/01/24 | | | | B1 | | | | 648,361 | |
| | 1,633 | | | Total IT Services | | | | | | | | | | | | | | | | | | | | 1,578,116 | |
| |
| | | | Machinery – 1.3% | |
| | | | | | | |
| | 450 | | | Blount International Inc, (WI/DD) | | | TBD | | | | TBD | | | | TBD | | | | TBD | | | | B1 | | | | 451,593 | |
| | 594 | | | Gates Global LLC, Term Loan B | | | 4.549% | | | | 1-Month LIBOR | | | | 2.750% | | | | 4/01/24 | | | | B1 | | | | 595,341 | |
| | 1,044 | | | Total Machinery | | | | | | | | | | | | | | | | | | | | 1,046,934 | |
| |
| | | | Media – 2.6% | |
| | | | | | | |
| | 974 | | | Array Canada Inc | | | 6.945% | | | | 3-Month LIBOR | | | | 5.000% | | | | 2/10/23 | | | | B | | | | 799,400 | |
| | 247 | | | CDS US Intermediate Holdings Inc | | | 5.695% | | | | 3-Month LIBOR | | | | 3.750% | | | | 7/08/22 | | | | B+ | | | | 236,635 | |
| | 500 | | | Gray Television, Inc., Term Loan B2 | | | 3.947% | | | | 1-Month LIBOR | | | | 2.250% | | | | 2/07/24 | | | | BB+ | | | | 502,217 | |
| | 95 | | | Nexstar Broadcasting, Inc., Term Loan B3 | | | 3.941% | | | | 1-Month LIBOR | | | | 2.250% | | | | 1/17/24 | | | | BB | | | | 95,355 | |
| | 479 | | | Nexstar Broadcasting, Inc., Term Loan B3 | | | 4.055% | | | | 1-Month LIBOR | | | | 2.250% | | | | 1/17/24 | | | | BB | | | | 481,094 | |
| | 2,295 | | | Total Media | | | | | | | | | | | | | | | | | | | | 2,114,701 | |
41
| | |
| |
| JHAA | | Nuveen High Income 2023 Target Term Fund(continued) |
| | Portfolio of Investments December 31, 2019 |
| | | | | | | | | | | | | | | | | | | | | | | | | | | | |
Principal
Amount (000) | | | Description (1) | | Coupon (4) | | | Reference
Rate (4) | | | Spread (4) | | | Maturity (5) | | | Ratings (2) | | | Value | |
| |
| | | | Oil, Gas & Consumable Fuels – 1.0% | |
| | | | | | | |
| $ | 525 | | | California Resources Corporation, Term Loan B | | | 6.555% | | | | 1-Month LIBOR | | | | 4.750% | | | | 12/31/22 | | | | B | | | $ | 473,374 | |
| | 522 | | | Ultra Resources Inc, (cash 5.550%, PIK 0.250%) | | | 5.799% | | | | 1-Month LIBOR | | | | 4.000% | | | | 4/12/24 | | | | B | | | | 313,752 | |
| | 1,047 | | | Total Oil, Gas & Consumable Fuels | | | | | | | | | | | | | | | | | | | | 787,126 | |
| |
| | | | Pharmaceuticals – 1.0% | |
| | | | | | | |
| | 349 | | | Endo International PLC | | | 6.063% | | | | 1-Month LIBOR | | | | 4.250% | | | | 4/29/24 | | | | B+ | | | | 335,195 | |
| | 500 | | | IMS Health Inc, (WI/DD) | | | TBD | | | | TBD | | | | TBD | | | | TBD | | | | BBB– | | | | 503,335 | |
| | 849 | | | Total Pharmaceuticals | | | | | | | | | | | | | | | | | | | | 838,530 | |
| |
| | | | Professional Services – 1.4% | |
| | | | | | | |
| | 643 | | | AlixPartners LLP | | | 4.549% | | | | 1-Month LIBOR | | | | 2.750% | | | | 4/04/24 | | | | B+ | | | | 648,059 | |
| | 493 | | | CHG Healthcare Services Inc | | | 4.799% | | | | 1-Month LIBOR | | | | 3.000% | | | | 6/07/23 | | | | B | | | | 496,777 | |
| | 1,136 | | | Total Professional Services | | | | | | | | | | | | | | | | | | | | 1,144,836 | |
| |
| | | | Road & Rail – 1.5% | |
| | | | | | | |
| | 1,234 | | | Hertz Corp | | | 4.550% | | | | 1-Month LIBOR | | | | 2.750% | | | | 6/30/23 | | | | BB | | | | 1,243,564 | |
| |
| | | | Semiconductors & Semiconductor Equipment – 0.6% | |
| | | | | | | |
| | 452 | | | Xperi Corp | | | 4.299% | | | | 1-Month LIBOR | | | | 2.500% | | | | 12/01/23 | | | | BB– | | | | 453,906 | |
| |
| | | | Software – 3.7% | |
| | | | | | | |
| | 596 | | | Infor (US), Inc., Term Loan B | | | 4.695% | | | | 3-Month LIBOR | | | | 2.750% | | | | 2/01/22 | | | | Ba3 | | | | 599,925 | |
| | 767 | | | nThrive Inc | | | 6.299% | | | | 1-Month LIBOR | | | | 4.500% | | | | 10/20/22 | | | | B– | | | | 642,885 | |
| | 495 | | | RP Crown Parent LLC, Term Loan B | | | 4.555% | | | | 1-Month LIBOR | | | | 2.750% | | | | 10/12/23 | | | | B1 | | | | 498,921 | |
| | 246 | | | Sybil Software LLC | | | 4.195% | | | | 3-Month LIBOR | | | | 2.250% | | | | 9/30/23 | | | | Ba2 | | | | 248,440 | |
| | 1,000 | | | Vertiv Group Corp | | | 5.927% | | | | 3-Month LIBOR | | | | 4.000% | | | | 11/15/23 | | | | B | | | | 1,000,000 | |
| | 3,104 | | | Total Software | | | | | | | | | | | | | | | | | | | | 2,990,171 | |
| |
| | | | Textiles, Apparel & Luxury Goods – 0.5% | |
| | | | | | | |
| | 399 | | | Strategic Partners Acquisition Corp | | | 5.549% | | | | 1-Month LIBOR | | | | 3.750% | | | | 6/30/23 | | | | B | | | | 399,982 | |
| |
| | | | Transportation Infrastructure – 1.0% | |
| | | | | | | |
| | 990 | | | AI Mistral Luxembourg Subco Sarl | | | 4.799% | | | | 1-Month LIBOR | | | | 3.000% | | | | 3/11/24 | | | | B– | | | | 851,247 | |
| |
| | | | Wireless Telecommunication Services – 0.4% | |
| | 322 | | | Sprint Corporation, Term Loan, First Lien | | | 4.313% | | | | 1-Month LIBOR | | | | 2.500% | | | | 2/03/24 | | | | BB+ | | | | 319,440 | |
| $ | 35,001 | | | Total Variable Rate Senior Loan Interests (cost $34,293,276) | | | | | | | | 34,000,613 | |
| | | | | | | |
Principal
Amount (000) | | | Description (1) | | | | | | | | Coupon | | | Maturity | | | Ratings (2) | | | Value | |
| |
| | | | CONVERTIBLE BONDS – 2.1% (1.6% of Total Investments) | |
| | | | | | |
| | | | Media – 1.4% | | | | | | | | | | | | | | | | |
| | | | | | | |
| $ | 1,275 | | | DISH Network Corp | | | | | | | | | | | 2.375% | | | | 3/15/24 | | | | Ba3 | | | $ | 1,164,203 | |
| |
| | | | Mortgage Real Estate Investment Trust – 0.7% | |
| | | | | | | |
| | 500 | | | Blackstone Mortgage Trust Inc | | | | | | | | | | | 4.750% | | | | 3/15/23 | | | | N/R | | | | 534,765 | |
| $ | 1,775 | | | Total Convertible Bonds (cost $1,609,392) | | | | | | | | | | | | | | | | | | | | 1,698,968 | |
| | | | Total Long-Term Investments (cost $98,266,053) | | | | | | | | 101,348,078 | |
42
| | | | | | | | | | | | | | | | | | | | | | | | | | |
Principal
Amount (000) | | | Description (1) | | | | | | | | | | Coupon | | | Maturity | | | Value | |
| |
| | | | SHORT-TERM INVESTMENTS – 9.3% (6.9% of Total Investments) | |
| |
| | | | REPURCHASE AGREEMENTS – 9.3% (6.9% of Total Investments) | |
| | | | | | |
| $ | 7,550 | | | Repurchase Agreement with Fixed Income Clearing Corporation, dated 12/31/19, repurchase price $7,549,838, collateralized by $7,635,000 U.S. Treasury Notes, 2.125%, due 5/31/21, value $7,703,318 | | | | | | | | | | | 0.650% | | | | 1/02/20 | | | $ | 7,549,565 | |
| | | | Total Short-Term Investments (cost $7,549,565) | | | | | | | | | | | | | | | | 7,549,565 | |
| | | | Total Investments (cost $105,815,618) – 134.4% | | | | | | | | | | | | | | | | 108,897,643 | |
| | | | Borrowings – (33.4)% (6), (7) | | | | | | | | | | | | | | | | (27,025,000 | ) |
| | | | Reverse Repurchase Agreements – (0.6)% (8) | | | | | | | | | | | | | | | | (490,000 | ) |
| | | | Other Assets Less Liabilities – (0.4)% | | | | | | | | | | | | | | | | (354,512 | ) |
| | | | Net Assets Applicable to Common Shares – 100% | | | | | | | | | | | | | | | $ | 81,028,131 | |
For Fund portfolio compliance purposes, the Fund’s industry classifications refer to any one or more of the industrysub-classifications used by one or more widely recognized market indexes or ratings group indexes, and/or as defined by Fund management. This definition may not apply for purposes of this report, which may combine industrysub-classifications into sectors for reporting ease.
| (1) | All percentages shown in the Portfolio of Investments are based on net assets applicable to common shares unless otherwise noted. |
| (2) | For financial reporting purposes, the ratings disclosed are the highest of Standard & Poor’s Group (“Standard & Poor’s”), Moody’s Investors Service, Inc. (“Moody’s”) or Fitch, Inc. (“Fitch”) rating. This treatment of split-rated securities may differ from that used for other purposes, such as for Fund investment policies. Ratings below BBB by Standard & Poor’s, Baa by Moody’s or BBB by Fitch are considered to be below investment grade. Holdings designated N/R are not rated by any of these national rating agencies. Ratings are not covered by the report of independent registered public accounting firm. |
| (3) | Investment, or portion of investment, has been pledged to collateralize the net payment obligations for investments in reverse repurchase agreements. As of the end of the reporting period, investments with a value of $582,316 have been pledged as collateral for reverse repurchase agreements. |
| (4) | Senior loans generally pay interest at rates which are periodically adjusted by reference to a base short-term, floating lending rate (Reference Rate) plus an assigned fixed rate (Spread). These floating lending rates are generally (i) the lending rate referenced by the London Inter-Bank Offered Rate (“LIBOR”), or (ii) the prime rate offered by one or more major United States banks. Senior loans may be considered restricted in that the Fund ordinarily is contractually obligated to receive approval from the agent bank and/or borrower prior to the disposition of a senior loan. The rate shown is the coupon as of the end of the reporting period. |
| (5) | Senior loans generally are subject to mandatory and/or optional prepayment. Because of these mandatory prepayment conditions and because there may be significant economic incentives for a borrower to prepay, prepayments of senior loans may occur. As a result, the actual remaining maturity of senior loans held may be substantially less than the stated maturities shown. |
| (6) | Borrowings as a percentage of Total Investments is 24.8%. |
| (7) | The Fund may pledge up to 100% of its eligible investments (excluding any investments separately pledged as collateral for specific investments in derivatives, when applicable) in the Portfolio of Investments as collateral for borrowings. |
| (8) | Reverse Repurchase Agreements as a percentage of Total Investments is 0.4%. |
| 144A | Investment is exempt from registration under Rule 144A of the Securities Act of 1933, as amended. These investments may only be resold in transactions exempt from registration, which are normally those transactions with qualified institutional buyers. |
| LIBOR | London Inter-Bank Offered Rate |
| TBD | Senior Loan purchased on a when-issued or delayed-delivery basis. Certain details associated with this purchase are not known prior to the settlement date of the transaction. In addition, Senior Loans typically trade without accrued interest and therefore a coupon rate is not available prior to settlement. At settlement, if still unknown, the borrower or counterparty will provide the Fund with the final coupon rate and maturity date. |
| PIK | Payment-in-kind (“PIK”) security. Depending on the terms of the security, income may be received in the form of cash, securities, or a combination of both. The PIK rate shown, where applicable, represents the annualized rate of the last PIK payment made by the issuer as of the end of the reporting period. |
| WI/DD | Purchased on a when-issued or delayed delivery basis. |
See accompanying notes to financial statements.
43
Statement of Assets and Liabilities
December 31, 2019
| | | | | | | | | | | | |
| | | JHY | | | JHB | | | JHAA | |
Assets | | | | | | | | | | | | |
Long-term investments, at value (cost $186,294,020, $628,785,873 and $98,266,053, respectively) | | $ | 186,194,662 | | | $ | 633,985,227 | | | $ | 101,348,078 | |
Short-term investments, at value (cost approximates value) | | | 23,084,114 | | | | — | | | | 7,549,565 | |
Cash | | | — | | | | 78,959,758 | | | | — | |
Receivable for: | | | | | | | | | | | | |
Interest | | | 2,807,868 | | | | 9,677,162 | | | | 1,048,391 | |
Investments sold | | | 4,230,114 | | | | 28,204,426 | | | | 19,880 | |
Reclaims | | | — | | | | 3,945 | | | | — | |
Other assets | | | 107 | | | | 21,018 | | | | 36 | |
Total assets | | | 216,316,865 | | | | 750,851,536 | | | | 109,965,950 | |
Liabilities | | | | | | | | | | | | |
Borrowings | | | 61,500,000 | | | | 192,000,000 | | | | 27,025,000 | |
Reverse repurchase agreements | | | — | | | | — | | | | 490,000 | |
Payable for: | | | | | | | | | | | | |
Investments purchased – regular settlement | | | — | | | | 1,069,709 | | | | — | |
Investments purchased – when-issued/delayed-delivery settlement | | | — | | | | — | | | | 1,304,250 | |
Accrued expenses: | | | | | | | | | | | | |
Interest | | | 8,035 | | | | 9,264 | | | | 4,854 | |
Management fees | | | 120,208 | | | | 414,151 | | | | 60,223 | |
Trustees fees | | | 2,591 | | | | 28,639 | | | | 1,291 | |
Other | | | 87,706 | | | | 157,211 | | | | 52,201 | |
Total liabilities | | | 61,718,540 | | | | 193,678,974 | | | | 28,937,819 | |
Net assets applicable to common shares | | $ | 154,598,325 | | | $ | 557,172,562 | | | $ | 81,028,131 | |
Common shares outstanding | | | 15,799,123 | | | | 55,885,884 | | | | 7,818,233 | |
Net asset value (“NAV”) per common share outstanding | | $ | 9.79 | | | $ | 9.97 | | | $ | 10.36 | |
Net assets applicable to common shares consist of: | | | | | | | | | | | | |
Common shares, $0.01 par value per share | | $ | 157,991 | | | $ | 558,859 | | | $ | 78,182 | |
Paid-in surplus | | | 155,162,229 | | | | 548,756,305 | | | | 76,946,248 | |
Total distributable earnings | | | (721,895 | ) | | | 7,857,398 | | | | 4,003,701 | |
Net assets applicable to common shares | | $ | 154,598,325 | | | $ | 557,172,562 | | | $ | 81,028,131 | |
Authorized shares | | | Unlimited | | | | Unlimited | | | | Unlimited | |
See accompanying notes to financial statements.
44
Statement of Operations
Year Ended December 31, 2019
| | | | | | | | | | | | |
| | | JHY | | | JHB | | | JHAA | |
Interest Income | | $ | 9,604,695 | | | $ | 38,452,101 | | | $ | 6,452,136 | |
Tax withheld | | | 268 | | | | — | | | | — | |
Investment income | | | 9,604,963 | | | | 38,452,101 | | | | 6,452,136 | |
Expenses | | | | | | | | | | | | |
Management fees | | | 1,417,446 | | | | 4,951,129 | | | | 692,680 | |
Interest expense | | | 1,819,682 | | | | 5,609,681 | | | | 764,295 | |
Custodian fees | | | 63,641 | | | | 128,168 | | | | 36,700 | |
Trustees fees | | | 6,073 | | | | 21,417 | | | | 7,095 | |
Professional fees | | | 39,434 | | | | 123,850 | | | | 75,146 | |
Shareholder reporting expenses | | | 31,456 | | | | 70,706 | | | | 14,477 | |
Shareholder servicing agent fees | | | 145 | | | | 122 | | | | 124 | |
Stock exchange listing fees | | | 7,380 | | | | 15,720 | | | | — | |
Investor relations expenses | | | 10,509 | | | | 33,314 | | | | 7,244 | |
Other | | | 16,715 | | | | 25,812 | | | | 7,399 | |
Total expenses | | | 3,412,481 | | | | 10,979,919 | | | | 1,605,160 | |
Net investment income (loss) | | | 6,192,482 | | | | 27,472,182 | | | | 4,846,976 | |
Realized and Unrealized Gain (Loss) | | | | | | | | | | | | |
Net realized gain (loss) from investments and foreign currency | | | (701,736 | ) | | | (2,158,045 | ) | | | 544,376 | |
Change in net unrealized appreciation (depreciation) of investments and foreign currency | | | 5,431,542 | | | | 29,409,255 | | | | 3,082,025 | |
Net realized and unrealized gain (loss) | | | 4,729,806 | | | | 27,251,210 | | | | 3,626,401 | |
Net increase (decrease) in net assets applicable to common shares from operations | | $ | 10,922,288 | | | $ | 54,723,392 | | | $ | 8,473,377 | |
See accompanying notes to financial statements.
45
Statement of Changes in Net Assets
| | | | | | | | | | | | | | | | | | | | | | | | |
| | | JHY | | | JHB | | | JHAA | |
| | | Year
Ended
12/31/19 | | | Year
Ended
12/31/18 | | | Year
Ended
12/31/19 | | | Year
Ended
12/31/18 | | | Year
Ended
12/31/19 | | | For the period
December 18, 2018
(commencement
of operations)
through
December 31, 2018 | |
Operations | | | | | | | | | | | | | | | | | | | | | | | | |
Net investment income (loss) | | $ | 6,192,482 | | | $ | 7,901,868 | | | $ | 27,472,182 | | | $ | 32,982,574 | | | $ | 4,846,976 | | | $ | (42,844 | ) |
Net realized gain (loss) from investments and foreign currency | | | (701,736 | ) | | | (237,540 | ) | | | (2,158,045 | ) | | | 1,103,617 | | | | 544,376 | | | | — | |
Change in net unrealized appreciation (depreciation) of investments and foreign currency | | | 5,431,542 | | | | (6,325,661 | ) | | | 29,409,255 | | | | (36,099,694 | ) | | | 3,082,025 | | | | — | |
Net increase (decrease) in net assets applicable to common shares from operations | | | 10,922,288 | | | | 1,338,667 | | | | 54,723,392 | | | | (2,013,503 | ) | | | 8,473,377 | | | | (42,844 | ) |
Distributions to Common Shareholders | | | | | | | | | | | | | | | | | | | | | | | | |
Dividends | | | (6,045,634 | ) | | | (7,972,415 | ) | | | (28,383,686 | ) | | | (32,679,326 | ) | | | (4,469,676 | ) | | | — | |
Decrease in net assets applicable to common shares from distributions to common shareholders | | | (6,045,634 | ) | | | (7,972,415 | ) | | | (28,383,686 | ) | | | (32,679,326 | ) | | | (4,469,676 | ) | | | — | |
Capital Share Transactions | | | | | | | | | | | | | | | | | | | | | | | | |
Proceeds from sale of common shares, net of offering costs | | | — | | | | — | | | | — | | | | — | | | | 7,917,202 | | | | 68,985,000 | |
Proceeds from shelf offering, net of offering costs | | | — | | | | 1,270,140 | | | | — | | | | — | | | | — | | | | — | |
Net proceeds from common shares issued to shareholders due to reinvestment of distributions | | | 212,395 | | | | 277,604 | | | | 141,179 | | | | — | | | | 65,058 | | | | — | |
Net increase (decrease) in net assets applicable to common shares from capital share transactions | | | 212,395 | | | | 1,547,744 | | | | 141,179 | | | | — | | | | 7,982,260 | | | | 68,985,000 | |
Net increase (decrease) in net assets applicable to common shares | | | 5,089,049 | | | | (5,086,004 | ) | | | 26,480,885 | | | | (34,692,829 | ) | | | 11,985,961 | | | | 68,942,156 | |
Net assets applicable to common shares at the beginning of period | | | 149,509,276 | | | | 154,595,280 | | | | 530,691,677 | | | | 565,384,506 | | | | 69,042,170 | | | | 100,014 | |
Net assets applicable to common shares at the end of period | | $ | 154,598,325 | | | $ | 149,509,276 | | | $ | 557,172,562 | | | $ | 530,691,677 | | | $ | 81,028,131 | | | $ | 69,042,170 | |
See accompanying notes to financial statements.
46
Statement of Cash Flows
Year Ended December 31, 2019
| | | | | | | | | | | | |
| | | JHY | | | JHB | | | JHAA | |
Cash Flows from Operating Activities: | | | | | | | | | | | | |
Net Increase (Decrease) in Net Assets Applicable to Common Shares from Operations | | $ | 10,922,288 | | | $ | 54,723,392 | | | $ | 8,473,377 | |
Adjustments to reconcile the net increase (decrease) in net assets applicable to common shares from operations to net cash provided by (used in) operating activities: | | | | | | | | | | | | |
Purchases of investments | | | (120,156,798 | ) | | | (288,484,372 | ) | | | (129,588,621 | ) |
Proceeds from sales and maturities of investments | | | 142,441,309 | | | | 385,646,492 | | | | 32,523,076 | |
Proceeds from (Purchases of) short-term investments, net | | | (20,532,424 | ) | | | — | | | | (7,549,565 | ) |
Taxes paid | | | (22,566 | ) | | | (235,825 | ) | | | — | |
Amortization (Accretion) of premiums and discounts, net | | | 1,758,870 | | | | 4,502,046 | | | | (445,875 | ) |
(Increase) Decrease in: | | | | | | | | | | | | |
Receivable for interest | | | 403,687 | | | | 1,954,750 | | | | (1,048,391 | ) |
Receivable for investments sold | | | (4,230,114 | ) | | | (28,204,426 | ) | | | (19,880 | ) |
Other assets | | | 4,907 | | | | (2,335 | ) | | | (36 | ) |
Increase (Decrease) in: | | | | | | | | | | | | |
Payable for investments purchased – regular settlement | | | — | | | | 189,665 | | | | — | |
Payable for investments purchased – when-issued/delayed-delivery settlement | | | — | | | | — | | | | 1,304,250 | |
Accrued interest | | | (23,011 | ) | | | (423,241 | ) | | | 4,854 | |
Accrued management fees | | | 1,268 | | | | 8,365 | | | | 46,454 | |
Accrued Trustees fees | | | 1,241 | | | | 8,398 | | | | 1,205 | |
Accrued professional fees | | | 2,128 | | | | 7,388 | | | | 11,745 | |
Accrued shareholder reporting expenses | | | (1,619 | ) | | | (427 | ) | | | 1,544 | |
Accrued other expenses | | | 15,071 | | | | 23,488 | | | | 9,923 | |
Net realized (gain) loss from: | | | | | | | | | | | | |
Investments and foreign currency | | | 701,736 | | | | 2,158,045 | | | | (544,376 | ) |
Paydowns | | | (21,192 | ) | | | (105,186 | ) | | | (210,257 | ) |
Change in net unrealized (appreciation) depreciation of investments and foreign currency | | | (5,431,542 | ) | | | (29,409,255 | ) | | | (3,082,025 | ) |
Net cash provided by (used in) operating activities | | | 5,833,239 | | | | 102,356,962 | | | | (100,112,598 | ) |
Cash Flow from Financing Activities: | | | | | | | | | | | | |
Proceeds from reverse repurchase agreements | | | — | | | | — | | | | 2,000,000 | |
(Payments for) reverse repurchase agreements | | | — | | | | — | | | | (1,510,000 | ) |
Proceeds from borrowings | | | — | | | | 17,000,000 | | | | 28,025,000 | |
Repayments of borrowings | | | — | | | | (15,000,000 | ) | | | (1,000,000 | ) |
Cash distributions paid to common shareholders | | | (5,833,239 | ) | | | (28,242,507 | ) | | | (4,404,618 | ) |
Proceeds from sale of shares, net of offering costs | | | — | | | | — | | | | 7,917,202 | |
Net cash provided by (used in) financing activities | | | (5,833,239 | ) | | | (26,242,507 | ) | | | 31,027,584 | |
Net Increase (Decrease) in Cash | | | — | | | | 76,114,455 | | | | (69,085,014 | ) |
Cash at the beginning of period | | | — | | | | 2,845,303 | | | | 69,085,014 | |
Cash at the end of period | | | — | | | | 78,959,758 | | | | — | |
| | | |
| Supplemental Disclosure of Cash Flow Information | | JHY | | | JHB | | | JHAA | |
Cash paid for interest (excluding costs) | | $ | 1,842,693 | | | $ | 6,032,922 | | | $ | 759,441 | |
Non-cash financing activities not included herein consists of reinvestments of common
share distributions | | | 212,395 | | | | 141,179 | | | | 65,058 | |
See accompanying notes to financial statements.
47
Financial Highlights
Selected data for a common share outstanding throughout each period:
| | | | | | | | | | | | | | | | | | | | | | | | | | | | | | | | | | | | | | | | | | | | | | | | |
| | | | | | | | | | | | | | | | | | | | | | |
| | | | | | Investment Operations | | | Less Distributions to
Common Shareholders | | | Common Share | |
| | | Beginning
Common
Share
NAV | | | Net
Investment
Income
(Loss)(a) | | | Net
Realized/
Unrealized
Gain (Loss) | | | Total | | | From
Net
Investment
Income | | | From
Accumulated
Net
Realized
Gains | | | Return
of
Capital | | | Total | | | Offering
Costs | | | Premium from
Shares
Sold
through Shelf Offering | | | Ending
NAV | | | Ending
Share
Price | |
| |
JHY | | | | | |
Year Ended 12/31: | | | | | | | | | | | | | | | | | | | | | | | | | | | | | | | | | | | | | | | | | |
2019 | | $ | 9.48 | | | $ | 0.39 | | | $ | 0.30 | | | $ | 0.69 | | | $ | (0.38 | ) | | $ | — | | | $ | — | | | $ | (0.38 | ) | | $ | — | | | $ | — | | | $ | 9.79 | | | $ | 9.77 | |
2018 | | | 9.89 | | | | 0.50 | | | | (0.41 | ) | | | 0.09 | | | | (0.51 | ) | | | — | | | | — | | | | (0.51 | ) | | | 0.01 | | | | — | * | | | 9.48 | | | | 9.92 | |
2017 | | | 9.75 | | | | 0.62 | | | | 0.13 | | | | 0.75 | | | | (0.62 | ) | | | — | | | | — | | | | (0.62 | ) | | | (0.02 | ) | | | 0.03 | | | | 9.89 | | | | 9.91 | |
2016 | | | 8.73 | | | | 0.73 | | | | 0.97 | | | | 1.70 | | | | (0.68 | ) | | | — | | | | — | | | | (0.68 | ) | | | — | | | | — | | | | 9.75 | | | | 10.21 | |
2015(b) | | | 9.85 | | | | 0.28 | | | | (1.09 | ) | | | (0.81 | ) | | | (0.28 | ) | | | — | | | | (0.01 | ) | | | (0.29 | ) | | | (0.02 | ) | | | — | | | | 8.73 | | | | 9.95 | |
| |
JHB | | | | | |
Year Ended 12/31: | | | | | | | | | | | | | | | | | | | | | | | | | | | | | | | | | | | | | | | | | |
2019 | | | 9.50 | | | | 0.49 | | | | 0.49 | | | | 0.98 | | | | (0.51 | ) | | | — | * | | | — | | | | (0.51 | ) | | | — | | | | — | | | | 9.97 | | | | 10.01 | |
2018 | | | 10.12 | | | | 0.59 | | | | (0.62 | ) | | | (0.03 | ) | | | (0.57 | ) | | | (0.02 | ) | | | — | | | | (0.59 | ) | | | — | | | | — | | | | 9.50 | | | | 8.90 | |
2017 | | | 9.92 | | | | 0.64 | | | | 0.16 | | | | 0.80 | | | | (0.58 | ) | | | (0.02 | ) | | | — | | | | (0.60 | ) | | | — | | | | — | | | | 10.12 | | | | 9.96 | |
2016(c) | | | 9.85 | | | | 0.17 | | | | 0.06 | | | | 0.23 | | | | (0.14 | ) | | | (0.01 | ) | | | — | | | | (0.15 | ) | | | (0.01 | ) | | | — | | | | 9.92 | | | | 9.88 | |
| |
JHAA | | | | | |
Year Ended 12/31: | | | | | | | | | | | | | | | | | | | | | | | | | | | | | | | | | | | | | | | | | |
2019 | | | 9.85 | | | | 0.63 | | | | 0.45 | | | | 1.08 | | | | (0.57 | ) | | | — | | | | — | | | | (0.57 | ) | | | — | | | | — | | | | 10.36 | | | | 10.85 | |
2018(g) | | | 9.88 | | | | (0.01 | ) | | | — | | | | (0.01 | ) | | | — | | | | — | | | | — | | | | — | | | | (0.02 | ) | | | — | | | | 9.85 | | | | 10.85 | |
| | | | | | | | |
| | | Borrowings at the End of Period | |
| | | Aggregate
Amount
Outstanding
(000) | | | Asset
Coverage
Per $1,000 | |
|
JHY | |
Year Ended 12/31: | |
2019 | | $ | 61,500 | | | $ | 3,514 | |
2018 | | | 61,500 | | | | 3,431 | |
2017 | | | 44,000 | | | | 4,514 | |
2016 | | | 44,000 | | | | 4,035 | |
2015(b) | | | 44,000 | | | | 3,713 | |
|
JHB | |
Year Ended 12/31: | |
2019 | | | 192,000 | | | | 3,902 | |
2018 | | | 190,000 | | | | 3,793 | |
2017 | | | 190,000 | | | | 3,976 | |
2016(c) | | | 190,000 | | | | 3,915 | |
|
JHAA | |
Year Ended 12/31: | | | | | | | | |
2019 | | | 27,025 | | | | 3,998 | |
48
| | | | | | | | | | | | | | | | | | | | | | |
| | | | | | | Common Share Supplemental Data/
Ratios Applicable to Common Shares | |
Common Shares
Total Returns | | | | | | Ratios to Average Net Assets(e) | | | | |
Based
on
NAV(d) | | | Based
on
Share
Price(d) | | | Ending
Net Assets
(000) | | | Expenses | | | Net
Investment
Income (Loss) | | | Portfolio
Turnover
Rate(f) | |
| | | | | |
| | | | | | | | | | | | | | | | | | | | | | | |
| | | | | | | | | | | | | | | | | | | | | | |
| | 7.39 | % | | | 2.42 | % | | $ | 154,598 | | | | 2.22 | % | | | 4.02 | % | | | 61 | % |
| | 0.97 | | | | 5.42 | | | | 149,509 | | | | 2.14 | | | | 5.16 | | | | 32 | |
| | 7.94 | | | | 3.28 | | | | 154,595 | | | | 1.54 | | | | 6.29 | | | | 72 | |
| | 20.15 | | | | 9.94 | | | | 133,521 | | | | 1.50 | | | | 7.91 | | | | 53 | |
| | (8.60 | ) | | | 2.42 | | | | 119,367 | | | | 1.34 | ** | | | 6.97 | ** | | | 11 | |
| | | | | |
| | | | | | | | | | | | | | | | | | | | | | | |
| | | | | | | | | | | | | | | | | | | | | | |
| | 10.44 | | | | 18.39 | | | | 557,173 | | | | 1.98 | | | | 4.96 | | | | 41 | |
| | (0.43 | ) | | | (4.99 | ) | | | 530,692 | | | | 1.86 | | | | 5.94 | | | | 27 | |
| | 8.22 | | | | 6.98 | | | | 565,385 | | | | 1.57 | | | | 6.37 | | | | 37 | |
| | 2.26 | | | | 0.32 | | | | 553,912 | | | | 1.17 | ** | | | 4.79 | ** | | | 6 | |
| | | | | |
| | | | | | | | | | | | | | | | | | | | | | | |
| | | | | | | | | | | | | | | | | | | | | | |
| | 11.20 | | | | 5.71 | | | | 81,028 | | | | 2.03 | | | | 6.13 | | | | 34 | |
| | (0.30 | ) | | | 8.50 | | | | 69,042 | | | | 1.74 | ** | | | (1.74 | )** | | | — | |
| (a) | Per share Net Investment Income (Loss) is calculated using the average daily shares method. |
| (b) | For the period July 28, 2015 (commencement of operations) through December 31, 2015. |
| (c) | For the period August 23, 2016 (commencement of operations) through December 31, 2016. |
| (d) | Total Return Based on Common Share NAV is the combination of changes in common share NAV, reinvested dividend income at NAV and reinvested capital gains distributions at NAV, if any. The last dividend declared in the period, which is typically paid on the first business day of the following month, is assumed to be reinvested at the ending NAV. The actual reinvest price for the last dividend declared in the period may often be based on the Fund’s market price (and not its NAV), and therefore may be different from the price used in the calculation. Total returns are not annualized. |
Total Return Based on Common Share Price is the combination of changes in the market price per share and the effect of reinvested dividend income and reinvested capital gains distributions, if any, at the average price paid per share at the time of reinvestment. The last dividend declared in the period, which is typically paid on the first business day of the following month, is assumed to be reinvested at the ending market price. The actual reinvestment for the last dividend declared in the period may take place over several days, and in some instances may not be based on the market price, so the actual reinvestment price may be different from the price used in the calculation. Total returns are not annualized.
| | | | |
| (e) | | • | | Net Investment Income (Loss) ratios reflect income earned and expenses incurred on assets attributable to borrowings and/or reverse repurchase agreements, where applicable, (as described in Note 8 – Fund Leverage). |
| | • | | Each ratio includes the effect of all interest expense paid and other costs related to borrowings and/or reverse repurchase agreements, where applicable, as follows: |
| | | | | | | | |
Ratios of
Interest Expense
to Average Net Assets Applicable
to Common Shares | |
JHY | |
Year Ended 12/31: | |
2019 | | | | | | | 1.18 | % |
2018 | | | | | | | 1.01 | |
2017 | | | | 0.53 | |
2016 | | | | 0.43 | |
2015(b) | | | | 0.27 | ** |
| | | | | | | | |
| | | Ratios of
Interest Expense
to Average Net Assets Applicable
to Common Shares | |
JHB | |
Year Ended 12/31: | |
2019 | | | | | | | 1.01 | % |
2018 | | | | | | | 0.92 | |
2017 | | | | 0.62 | |
2016(c) | | | | 0.25 | ** |
| | | | | | |
| | | | | Ratios of Interest Expense
to Average Net Assets Applicable
to Common Shares | |
JHAA | |
Year Ended 12/31: | |
2019 | | | 0.99 | %** |
| (f) | Portfolio Turnover Rate is calculated based on the lesser of long-term purchases or sales (as disclosed in Note 4 – Portfolio Securities and Investments in Derivatives, Investment Transactions) divided by the average long-term market value during the period. |
| (g) | For the period December 18, 2018 (commencement of operations) through December 31, 2018. |
| * | Rounds to less than $0.01 per share. |
See accompanying notes to financial statements.
49
Notes to Financial Statements
1. General Information
Fund Information
The funds covered in this report and their corresponding New York Stock Exchange (“NYSE”) symbols are as follows (each a “Fund” and collectively, the “Funds”):
| | • | | Nuveen High Income 2020 Target Term Fund (JHY) |
| | • | | Nuveen High Income November 2021 Target Term Fund (JHB) |
| | • | | Nuveen High Income 2023 Target Term Fund (JHAA) |
The Funds are registered under the Investment Company Act of 1940 (the “1940 Act”), as amended, as diversified, closed-end management investment companies. JHY, JHB and JHAA were each organized as a Massachusetts business trust on April 13, 2015, July 13, 2015 and September 20, 2018, respectively.
Each Fund seeks to provide a high level of current income and return its original net asset value (“NAV”) per share on or about its termination date as noted in the following table.
| | | | | | | | |
| | | Original NAV
Per Share | | | Termination Date | |
JHY | | $ | 9.85 | | | | November 1, 2020 | |
JHB | | $ | 9.85 | | | | November 1, 2021 | |
JHAA | | $ | 9.88 | | | | December 1, 2023 | |
The end of the reporting period for the Funds is December 31, 2019, and the period covered by these Notes to Financial Statements is the fiscal year ended December 31, 2019 (the “current fiscal period”).
Investment Adviser and Sub-Adviser
The Funds’ investment adviser is Nuveen Fund Advisors, LLC (the “Adviser”), a subsidiary of Nuveen, LLC (“Nuveen”). Nuveen is the investment management arm of Teachers Insurance and Annuity Association of America (TIAA). The Adviser has overall responsibility for management of the Funds, oversees the management of the Funds’ portfolios, manages the Funds’ business affairs and provides certain clerical, bookkeeping and other administrative services, and, if necessary, asset allocation decisions. The Adviser has entered into sub-advisory agreements with Nuveen Asset Management, LLC, (the “Sub-Adviser”), a subsidiary of the Adviser, under which the Sub-Adviser manages the investment portfolios of the Funds.
2. Significant Accounting Policies
The accompanying financial statements were prepared in accordance with accounting principles generally accepted in the United States of America (“U.S. GAAP”), which may require the use of estimates made by management and the evaluation of subsequent events. Actual results may differ from those estimates. Each Fund is an investment company and follows the accounting guidance in the Financial Accounting Standards Board (“FASB”) Accounting Standards Codification 946, Financial Services – Investment Companies. The NAV for financial reporting purposes may differ from the NAV for processing security and common share transactions. The NAV for financial reporting purposes includes security and common share transactions through the date of the report. Total return is computed based on the NAV used for processing security and common share transactions. The following is a summary of the significant accounting policies consistently followed by the Funds.
Compensation
The Funds pay no compensation directly to those of its trustees who are affiliated with the Adviser or to its officers, all of whom receive remuneration for their services to the Funds from the Adviser or its affiliates. The Funds’ Board of Trustees (the “Board”) has adopted a deferred compensation plan for independent trustees that enables trustees to elect to defer receipt of all or a portion of the annual compensation they are entitled to receive from certain Nuveen-advised funds. Under the plan, deferred amounts are treated as though equal dollar amounts had been invested in shares of select Nuveen-advised funds.
Distributions to Common Shareholders
Distributions to common shareholders are recorded on theex-dividend date. The amount, character and timing of distributions are determined in accordance with federal income tax regulations, which may differ from U.S. GAAP.
In seeking to achieve its investment objectives, each Fund currently intends to set aside and retain in its net assets (and therefore its NAV) a portion of its net investment income, and possibly all or a portion of its gains. This will reduce the amounts otherwise available for distribution prior to the liquidation of
50
the Funds, and the Funds may incur taxes on such retained amounts. Such retained income or gains, net of any taxes, would constitute a portion of the liquidating distribution returned to investors on or about the Termination Date.
Foreign Currency Transactions and Translation
To the extent that the Funds invests in securities and/or contracts that are denominated in a currency other than U.S. dollars, the Funds will be subject to currency risk, which is the risk that an increase in the U.S. dollar relative to the foreign currency will reduce returns or portfolio value. Generally, when the U.S. dollar rises in value against a foreign currency, the Funds’ investments denominated in that currency will lose value because its currency is worth fewer U.S. dollars; the opposite effect occurs if the U.S. dollar falls in relative value. Investments and other assets and liabilities denominated in foreign currencies are converted into U.S. dollars on a spot (i.e. cash) basis at the spot rate prevailing in the foreign currency exchange market at the time of valuation. Purchases and sales of investments and income denominated in foreign currencies are translated into U.S. dollars on the respective dates of such transactions.
The books and records of the Funds are maintained in U.S. dollars. Assets, including investments, and liabilities denominated in foreign currencies are translated into U.S. dollars at the end of each day. Purchases and sales of securities, income and expenses are translated into U.S. dollars at the prevailing exchange rate on the respective dates of the transactions.
Net realized foreign currency gains and losses resulting from changes in exchange rates associated with (i) foreign currency, (ii) investments and (iii) derivatives include foreign currency gains and losses between trade date and settlement date of the transactions, foreign currency transactions, and the difference between the amounts of interest and dividends recorded on the books of the Fund and the amounts actually received are recognized as a component of “Net realized gain (loss) from investments and foreign currency” on the Statement of Operations, when applicable.
The unrealized gains and losses resulting from changes in foreign currency exchange rates and changes in foreign exchange rates associated with (i) investments and (ii) other assets and liabilities are recognized as a component of “Change in net unrealized appreciation (depreciation) of investments and foreign currency” on the Statement of Operations, when applicable. The unrealized gains and losses resulting from changes in foreign exchange rates associated with investments in derivatives are recognized as a component of the respective derivative’s related “Change in net unrealized appreciation (depreciation)” on the Statement of Operations, when applicable.
As of the end of the reporting period, the Funds’ investments in non-U.S. securities were as follows:
| | | | | | | | |
| JHY | | Value | | | % of Total
Investments | |
Country: | | | | | | | | |
South Africa | | $ | 7,047,387 | | | | 3.4 | % |
Turkey | | | 6,028,165 | | | | 2.9 | |
Israel | | | 4,502,655 | | | | 2.2 | |
Kazakhstan | | | 4,191,360 | | | | 2.0 | |
Japan | | | 4,085,000 | | | | 2.0 | |
Chile | | | 4,001,842 | | | | 1.9 | |
Egypt | | | 3,534,265 | | | | 1.7 | |
Canada | | | 3,275,753 | | | | 1.6 | |
Mexico | | | 2,813,318 | | | | 1.3 | |
Other | | | 13,366,889 | | | | 6.3 | |
Totalnon-U.S. securities | | $ | 52,846,634 | | | | 25.3 | % |
| | |
| JHB | | | | | | |
Country: | | | | | | | | |
Canada | | $ | 31,789,871 | | | | 5.0 | % |
United Kingdom | | | 20,994,719 | | | | 3.3 | |
Japan | | | 15,112,423 | | | | 2.4 | |
South Africa | | | 12,035,050 | | | | 1.9 | |
Israel | | | 9,737,584 | | | | 1.6 | |
Italy | | | 9,669,544 | | | | 1.5 | |
China | | | 7,628,601 | | | | 1.2 | |
Mexico | | | 7,272,000 | | | | 1.2 | |
Egypt | | | 7,026,764 | | | | 1.1 | |
Other | | | 53,567,146 | | | | 8.6 | |
Totalnon-U.S. securities | | $ | 174,833,702 | | | | 27.8 | % |
51
Notes to Financial Statements(continued)
| | | | | | | | |
| JHAA | | Value | | | % of Total
Investments | |
Country: | | | | | | | | |
Canada | | $ | 3,247,100 | | | | 3.0 | % |
United Kingdom | | | 2,139,963 | | | | 2.0 | |
United Arab Emirates | | | 1,574,563 | | | | 1.4 | |
Israel | | | 1,315,600 | | | | 1.2 | |
Brazil | | | 1,303,125 | | | | 1.2 | |
Zambia | | | 1,253,125 | | | | 1.2 | |
Netherlands | | | 1,251,000 | | | | 1.2 | |
Australia | | | 1,195,313 | | | | 1.1 | |
Luxembourg | | | 1,155,250 | | | | 1.1 | |
Other | | | 3,203,260 | | | | 2.8 | |
Totalnon-U.S. securities | | $ | 17,638,299 | | | | 16.2 | % |
Indemnifications
Under the Funds’ organizational documents, their officers and trustees are indemnified against certain liabilities arising out of the performance of their duties to the Funds. In addition, in the normal course of business, the Funds enter into contracts that provide general indemnifications to other parties. The Funds’ maximum exposure under these arrangements is unknown as this would involve future claims that may be made against the Funds that have not yet occurred. However, the Funds have not had prior claims or losses pursuant to these contracts and expect the risk of loss to be remote.
Investments and Investment Income
Securities transactions are accounted for as of the trade date for financial reporting purposes. Realized gains and losses on securities transactions are based upon the specific identification method. Investment income is comprised of interest income, which reflects the amortization of premiums and accretion of discounts for financial reporting purposes, and is recorded on an accrual basis. Investment income also reflectspayment-in-kind (“PIK”) interest and paydown gains and losses, if any. PIK interest represents income received in the form of securities in lieu of cash.
Netting Agreements
In the ordinary course of business, the Funds may enter into transactions subject to enforceable master repurchase agreements, International Swaps and Derivatives Association, Inc. (ISDA) master agreements or other similar arrangements (“netting agreements”). Generally, the right to offset in netting agreements allows each Fund to offset certain securities and derivatives with a specific counterparty, when applicable, as well as any collateral received or delivered to that counterparty based on the terms of the agreements. Generally, each Fund manages its cash collateral and securities collateral on a counterparty basis.
The Funds’ investments subject to netting agreements as of the end of the reporting period, if any, are further described in Note 4 – Portfolio Securities and Investments in Derivatives.
New Accounting Pronouncements and Rule Issuances
FASB Accounting Standards Update (“ASU”)2017-08 (“ASU2017-08”) Premium Amortization on Purchased Callable Debt Securities
The FASB has issued ASU2017-08, which shortens the premium amortization period for purchasednon-contingently callable debt securities. ASU2017-08 specifies that the premium amortization period ends at the earliest call date, for purchasednon-contingently callable debt securities. ASU2017-08 effective for fiscal years, and interim periods within those fiscal years, beginning after December 15, 2018. During the current fiscal period, ASU2017-08 became effective for the Funds and it did not have a material impact on the Funds’ financial statements.
Fair Value Measurement: Disclosure Framework
During August 2018, the FASB issued ASU2018-13 (“ASU 2018-13”), Fair Value Measurement: Disclosure Framework – Changes to the Disclosure Requirements for Fair Value Measurements. ASU2018-13 modifies the disclosures required by Topic 820, Fair Value Measurements. The amendments in ASU2018-13 are effective for all entities for fiscal years, and interim periods within those fiscal years, beginning after December 15, 2019. Management early implemented this guidance and it did not have a material impact on the Funds’ financial statements.
3. Investment Valuation and Fair Value Measurements
The fair valuation input levels as described below are for fair value measurement purposes.
The Fund’s investments in securities are recorded at their estimated fair value. Fair value is defined as the price that would be received upon selling an investment or transferring a liability in an orderly transaction to an independent buyer in the principal or most advantageous market for the investment. A three-tier hierarchy is used to maximize the use of observable market data and minimize the use of unobservable inputs and to establish classification of fair value measurements for disclosure purposes. Observable inputs reflect the assumptions market participants would use in pricing the asset or liability.
52
Observable inputs are based on market data obtained from sources independent of the reporting entity. Unobservable inputs reflect the reporting entity’s own assumptions about the assumptions market participants would use in pricing the asset or liability. Unobservable inputs are based on the best information available in the circumstances. The following is a summary of the three-tiered hierarchy of valuation input levels.
| | |
| Level 1 – | | Inputs are unadjusted and prices are determined using quoted prices in active markets for identical securities. |
| Level 2 – | | Prices are determined using other significant observable inputs (including quoted prices for similar securities, interest rates, credit spreads, etc.). |
| Level 3 – | | Prices are determined using significant unobservable inputs (including management’s assumptions in determining the fair value of investments). |
Prices of fixed-income securities are provided by an independent pricing service (“pricing service”) approved by the Board. The pricing service establishes a security’s fair value using methods that may include consideration of the following: yields or prices of investments of comparable quality, type of issue, coupon, maturity and rating, market quotes or indications of value from security dealers, evaluations of anticipated cash flows or collateral, general market conditions and other information and analysis, including the obligor’s credit characteristics considered relevant. These securities are generally classified as Level 2. In pricing certain securities, particularly less liquid and lower quality securities, the pricing service may consider information about a security, its issuer or market activity, provided by the Adviser. These securities are generally classified as Level 2 or Level 3 depending on the observability of the significant inputs.
Like most fixed-income securities, the senior and subordinated loans in which the Funds invest are not listed on an organized exchange. The secondary market of such investments may be less liquid relative to markets for other fixed-income securities. Consequently, the value of senior and subordinated loans, determined as described above, may differ significantly from the value that would have been determined had there been an active market for that senior loan. These securities are generally classified as Level 2.
Repurchase agreements are valued at contract amount plus accrued interest, which approximates market value. These securities are generally classified as Level 2.
Investments initially valued in currencies other than the U.S. dollar are converted to the U.S. dollar using exchange rates obtained from pricing services. As a result, the NAV of the Funds’ shares may be affected by changes in the value of currencies in relation to the U.S. dollar. The value of securities traded in markets outside the United States or denominated in currencies other than the U.S. dollar may be affected significantly on a day that the NYSE is closed and an investor is not able to purchase, redeem or exchange shares. If significant market events occur between the time of determination of the closing price of a foreign security on an exchange and the time that the Funds’ NAV is determined, or if under the Funds’ procedures, the closing price of a foreign security is not deemed to be reliable, the security would be valued at fair value as determined in accordance with procedures established in good faith by the Board. These securities are generally classified as Level 2 or Level 3 depending on the observability of the significant inputs.
Certain securities may not be able to be priced by the pre-established pricing methods as described above. Such securities may be valued by the Board and/or its appointee at fair value. These securities generally include, but are not limited to, restricted securities (securities which may not be publicly sold without registration under the Securities Act of 1933, as amended) for which a pricing service is unable to provide a market price; securities whose trading has been formally suspended; debt securities that have gone into default and for which there is no current market quotation; a security whose market price is not available from a pre-established pricing source; a security with respect to which an event has occurred that is likely to materially affect the value of the security after the market has closed but before the calculation of a Fund’s NAV (as may be the case in non-U.S. markets on which the security is primarily traded) or make it difficult or impossible to obtain a reliable market quotation; and a security whose price, as provided by the pricing service, is not deemed to reflect the security’s fair value. As a general principle, the fair value of a security would appear to be the amount that the owner might reasonably expect to receive for it in a current sale. A variety of factors may be considered in determining the fair value of such securities, which may include consideration of the following: yields or prices of investments of comparable quality, type of issue, coupon, maturity and rating, market quotes or indications of value from security dealers, evaluations of anticipated cash flows or collateral, general market conditions and other information and analysis, including the obligor’s credit characteristics considered relevant. These securities are generally classified as Level 2 or Level 3 depending on the observability of the significant inputs. Regardless of the method employed to value a particular security, all valuations are subject to review by the Board and/or its appointee.
The inputs or methodologies used for valuing securities are not an indication of the risks associated with investing in those securities. The following is a summary of each Fund’s fair value measurements as of the end of the reporting period:
| | | | | | | | | | | | | | | | |
| JHY | | Level 1 | | | Level 2 | | | Level 3 | | | Total | |
Long-Term Investments*: | | | | | | | | | | | | | | | | |
Corporate Bonds | | $ | — | | | $ | 172,893,308 | | | $ | — | | | $ | 172,893,308 | |
Sovereign Debt | | | — | | | | 8,360,932 | | | | — | | | | 8,360,932 | |
Convertible Bonds | | | — | | | | 3,929,162 | | | | — | | | | 3,929,162 | |
$1,000 Par (or similar) Institutional Preferred | | | — | | | | 1,011,260 | | | | — | | | | 1,011,260 | |
| | | | |
Short-Term Investments: | | | | | | | | | | | | | | | | |
Repurchase Agreements | | | — | | | | 23,084,114 | | | | — | | | | 23,084,114 | |
Total | | $ | — | | | $ | 209,278,776 | | | $ | — | | | $ | 209,278,776 | |
53
Notes to Financial Statements(continued)
| | | | | | | | | | | | | | | | |
| JHB | | Level 1 | | | Level 2 | | | Level 3 | | | Total | |
Long-Term Investments*: | | | | | | | | | | | | | | | | |
Corporate Bonds** | | $ | — | | | $ | 572,457,203 | | | $ | — | *** | | $ | 572,457,203 | |
Variable Rate Senior Loan Interests | | | — | | | | 33,956,789 | | | | — | | | | 33,956,789 | |
Sovereign Debt | | | — | | | | 18,721,123 | | | | — | | | | 18,721,123 | |
Convertible Bonds | | | — | | | | 8,850,112 | | | | — | | | | 8,850,112 | |
Total | | $ | — | | | $ | 633,985,227 | | | $ | — | | | $ | 633,985,227 | |
| | | | |
| JHAA | | | | | | | | | | | | |
Long-Term Investments*: | | | | | | | | | | | | | | | | |
Corporate Bonds | | $ | — | | | $ | 65,648,497 | | | $ | — | | | $ | 65,648,497 | |
Variable Rate Senior Loan Interests | | | — | | | | 34,000,613 | | | | — | | | | 34,000,613 | |
Convertible Bonds | | | — | | | | 1,698,968 | | | | — | | | | 1,698,968 | |
| | | | |
Short-Term Investments: | | | | | | | | | | | | | | | | |
Repurchase Agreements | | | — | | | | 7,549,565 | | | | — | | | | 7,549,565 | |
Total | | $ | — | | | $ | 108,897,643 | | | $ | — | | | $ | 108,897,643 | |
| * | Refer to the Fund’s Portfolio of Investments for industry and country classifications, where applicable. |
| ** | Refer to the Fund’s Portfolio of Investments for securities classified as Level 3. |
| *** | Value equals zero as of the end of the reporting period. |
4. Portfolio Securities and Investments in Derivatives
Portfolio Securities
Repurchase Agreements
In connection with transactions in repurchase agreements, it is each Fund’s policy that its custodian take possession of the underlying collateral securities, the fair value of which exceeds the principal amount of the repurchase transaction, including accrued interest, at all times. If the counterparty defaults, and the fair value of the collateral declines, realization of the collateral may be delayed or limited.
The following table presents the repurchase agreements for the Funds that are subject to netting agreements as of the end of the reporting period, and the collateral delivered related to those repurchase agreements.
| | | | | | | | | | | | | | |
| Fund | | Counterparty | | Short-Term
Investments, at Value | | | Collateral
Pledged (From)
Counterparty* | | | Net
Exposure | |
| JHY | | Fixed Income Clearing Corporation | | $ | 23,084,114 | | | $ | (23,084,114 | ) | | $ | — | |
| JHAA | | Fixed Income Clearing Corporation | | | 7,549,565 | | | | (7,549,565 | ) | | | — | |
| * | As of the end of the reporting period, the value of the collateral pledged from the counterparty exceeded the value of the repurchase agreements. Refer to the Fund’s Portfolio of Investments for details on the repurchase agreements. |
Zero Coupon Securities
A zero coupon security does not pay a regular interest coupon to its holders during the life of the security. Income to the holder of the security comes from accretion of the difference between the original purchase price of the security at issuance and the par value of the security at maturity and is effectively paid at maturity. The market prices of zero coupon securities generally are more volatile than the market prices of securities that pay interest periodically.
Investment Transactions
Long-term purchases and sales (including maturities) during the current fiscal period were as follows:
| | | | | | | | | | | | |
| | | JHY | | | JHB | | | JHAA | |
Purchases | | $ | 120,156,798 | | | $ | 288,484,372 | | | $ | 129,588,621 | |
Sales and maturities | | | 142,441,309 | | | | 385,646,492 | | | | 32,523,076 | |
The Funds may purchase securities on a when-issued or delayed-delivery basis. Securities purchased on a when-issued or delayed-delivery basis may have extended settlement periods; interest income is not accrued until settlement date. Any securities so purchased are subject to market fluctuation during this period. The Funds have earmarked securities in their portfolios with a current value at least equal to the amount of the when-issued/delayed-delivery purchase commitments. If a Fund has outstanding when-issued/delayed-delivery purchases commitments as of the end of the reporting period, such amounts are recognized on the Statement of Assets and Liabilities.
54
Investments in Derivatives
Each Fund is authorized to invest in certain derivative instruments such as futures, options and swap contracts. Each Fund limits its investments in futures, options on futures and swap contracts to the extent necessary for the Adviser to claim the exclusion from registration by the Commodity Futures Trading Commission as a commodity pool operator with respect to the Fund. The Funds record derivative instruments at fair value, with changes in fair value recognized on the Statement of Operations, when applicable. Even though the Funds’ investments in derivatives may represent economic hedges, they are not considered to be hedge transactions for financial reporting purposes.
Although the Funds are authorized to invest in derivative instruments, and may do so in the future, they did not make any such investments during the current fiscal period.
Market and Counterparty Credit Risk
In the normal course of business each Fund may invest in financial instruments and enter into financial transactions where risk of potential loss exists due to changes in the market (market risk) or failure of the other party to the transaction to perform (counterparty credit risk). The potential loss could exceed the value of the financial assets recorded on the financial statements. Financial assets, which potentially expose each Fund to counterparty credit risk, consist principally of cash due from counterparties on forward, option and swap transactions, when applicable. The extent of each Fund’s exposure to counterparty credit risk in respect to these financial assets approximates their carrying value as recorded on the Statement of Assets and Liabilities.
Each Fund helps manage counterparty credit risk by entering into agreements only with counterparties the Adviser believes have the financial resources to honor their obligations and by having the Adviser monitor the financial stability of the counterparties. Additionally, counterparties may be required to pledge collateral daily (based on the daily valuation of the financial asset) on behalf of each Fund with a value approximately equal to the amount of any unrealized gain above a pre-determined threshold. Reciprocally, when each Fund has an unrealized loss, the Funds have instructed the custodian to pledge assets of the Funds as collateral with a value approximately equal to the amount of the unrealized loss above a pre-determined threshold. Collateral pledges are monitored and subsequently adjusted if and when the valuations fluctuate, either up or down, by at least the pre-determined threshold amount.
5. Fund Shares
Common Shares
Common Shares Equity Shelf Programs and Offering Costs
JHY had filed a registration statement with the Securities and Exchange Commission (“SEC”) authorizing the Fund to issue additional common shares through one or more equity shelf programs (“Shelf Offering”), which became effective with the SEC during a prior fiscal period.
Under this Shelf Offering, the Fund, subject to market conditions, may raise additional equity capital by issuing additional common shares from time to time in varying amounts and by different offering methods at a net price at or above the Fund’s NAV per common share. In the event the Fund’s Shelf Offering registration statement is no longer current, the Fund may not issue additional common shares until a post-effective amendment to the registration statement has been filed with the SEC.
Additional authorized common shares, common shares sold and offering proceeds, net of offering costs under the Fund’s Shelf Offering during the Fund’s current and prior fiscal period were as follows:
| | | | | | | | |
| | | JHY | |
| | | Year Ended
12/31/19 | | | Year Ended
12/31/18* | |
Additional authorized common shares | | | — | | | | 3,400,000 | |
Common shares sold | | | — | | | | 119,829 | |
Offering proceeds, net of offering costs | | $ | — | | | $ | 1,270,140 | |
| * | Represents additional authorized shares for the period January 1, 2018 through October 31, 2018. |
Costs incurred by the Fund in connection with its initial shelf registrations were recorded as a prepaid expense and recognized as a component of
“Deferred offering costs” on the Statement of Assets and Liabilities. These costs are amortized pro rata as shares are sold and are recognized as a component of “Proceeds from shelf offering, net of offering costs” on the Statement of Changes in Net Assets. Any deferred offering costs remaining one year after the effectiveness of the initial shelf registration will be expensed. Costs incurred by the Fund to keep the shelf registration current are expensed as incurred and recognized as a component of “Other expenses” on the Statement of Operations.
55
Notes to Financial Statements(continued)
Common Share Transactions
Transactions in common shares during the Funds’ current and prior fiscal period were as follows:
| | | | | | | | | | | | | | | | |
| | | JHY | | | JHB | |
| | | Year Ended
12/31/19 | | | Year Ended
12/31/18 | | | Year Ended
12/31/19 | | | Year Ended
12/31/18 | |
Common shares: | | | | | | | | | | | | | | | | |
Sold through shelf offering | | | — | | | | 119,829 | | | | — | | | | — | |
Issued to shareholders due to reinvestment of distributions | | | 21,800 | | | | 28,375 | | | | 14,238 | | | | — | |
Total | | | 21,800 | | | | 148,204 | | | | 14,238 | | | | — | |
| | | | |
Weighted average common share: | | | | | | | | | | | | | | | | |
Premium to NAV per shelf offering share sold | | | — | % | | | 1.29 | % | | | — | % | | | — | % |
| | | | | | | | | | | | | | | | |
| | | |
| | | | | | | | | JHAA* | |
| | | | | | | | | Year Ended
12/31/19 | | | For the Period 12/18/18
(commencement of operations)
through 12/31/18 | |
Common shares: | | | | | | | | | | | | | | | | |
Sold | | | | | | | | | | | 801,742 | | | | 7,000,000 | |
Issued to shareholders due to reinvestment of distributions | | | | | | | | | | | 6,363 | | | | — | |
Total | | | | | | | | | | | 808,105 | | | | 7,000,000 | |
| * | Prior to the commencement of operations, the Adviser purchased 10,128 shares, which are still held as of the end of the reporting period. |
6. Income Tax Information
Each Fund is a separate taxpayer for federal income tax purposes. Each Fund intends to distribute substantially all of its net investment company taxable income to shareholders and to otherwise comply with the requirements of Subchapter M of the Internal Revenue Code applicable to regulated investment companies. In any year when the Funds realize net capital gains, the Funds may choose to distribute all or a portion of their net capital gains to shareholders, or alternatively, to retain all or a portion of their net capital gains and pay federal corporate income taxes on such retained gains.
For all open tax years and all major taxing jurisdictions, management of the Funds has concluded that there are no significant uncertain tax positions that would require recognition in the financial statements. Open tax years are those that are open for examination by taxing authorities (i.e., generally the last four tax year ends and the interim tax period since then). Furthermore, management of the Funds is also not aware of any tax positions for which it is reasonably possible that the total amounts of unrecognized tax benefits will significantly change in the next twelve months.
The following information is presented on an income tax basis. Differences between amounts for financial statement and federal income tax purposes are primarily due to timing differences in recognizing certain gains and losses on investment transactions. To the extent that differences arise that are permanent in nature, such amounts are reclassified within the capital accounts as detailed below. Temporary differences do not require reclassification. Temporary and permanent differences do not impact the NAVs of the Funds.
The table below presents the cost and unrealized appreciation (depreciation) of each Fund’s investment portfolio, as determined on a federal income tax basis, as of December 31, 2019.
| | | | | | | | | | | | |
| | | JHY | | | JHB | | | JHAA | |
Tax cost of investments | | $ | 209,484,889 | | | $ | 629,586,539 | | | $ | 105,866,160 | |
Gross unrealized: | | | | | | | | | | | | |
Appreciation | | $ | 1,155,390 | | | $ | 11,238,514 | | | $ | 4,014,632 | |
Depreciation | | | (1,361,503 | ) | | | (6,839,826 | ) | | | (983,149 | ) |
Net unrealized appreciation (depreciation) of investments | | $ | (206,113 | ) | | $ | 4,398,688 | | | $ | 3,031,483 | |
Permanent differences, primarily due to distribution reallocations and federal taxes paid, resulted in reclassifications among the Funds’ components of common share net assets as of December 31, 2019, the Funds’ tax year end.
56
The tax components of undistributed net ordinary income and net long-term capital gains as of December 31, 2019, the Funds’ tax year end, were as follows:
| | | | | | | | | | | | |
| | | JHY | | | JHB | | | JHAA | |
Undistributed net ordinary income1 | | $ | 995,772 | | | $ | 6,374,015 | | | $ | 972,214 | |
Undistributed net long-term capital gains | | | — | | | | — | | | | 4 | |
| 1 | Net ordinary income consists of net taxable income derived from dividends, interest, and net short-term capital gains, if any. |
The tax character of distributions paid during the Funds’ tax years ended December 31, 2019 and December 31, 2018 was designated for purposes of the dividends paid deduction as follows:
| | | | | | | | | | | | |
2019 | | JHY | | | JHB | | | JHAA | |
Distributions from net ordinary income1 | | $ | 6,045,634 | | | $ | 28,252,445 | | | $ | 4,469,676 | |
Distributions from net long-term capital gains2 | | | — | | | | 131,241 | | | | — | |
| | | |
| 2018 | | JHY | | | JHB | | | JHAA3 | |
Distributions from net ordinary income1 | | $ | 7,972,415 | | | $ | 31,567,480 | | | $ | — | |
Distributions from net long-term capital gains | | | — | | | | 1,111,846 | | | | — | |
| 1 | Net ordinary income consists of net taxable income derived from dividends, interest, and net short-term capital gains, if any. |
| 2 | The Funds hereby designate as long-term capital gain dividend, pursuant to Internal Revenue Code Section 852(b)(3), the amount necessary to reduce earnings and profits of the Funds related to net capital gain to zero for the tax year ended December 31, 2019. |
| 3 | For the period December 18, 2018 (commencement of operations) through December 31, 2018. |
As of December 31, 2019, the Funds’ tax year end, the following Funds had unused capital losses carrying forward available for federal income tax purposes to be applied against future capital gains, if any. The capital losses are not subject to expiration.
| | | | | | | | |
| | | JHY | | | JHB | |
Not subject to expiration: | | | | | | | | |
Short-term | | $ | 640,693 | | | $ | — | |
Long-term | | | 870,861 | | | | 2,894,665 | |
Total | | $ | 1,511,554 | | | | 2,894,665 | |
7. Management Fees
Management Fees
Each Fund’s management fee compensates the Adviser for overall investment advisory and administrative services and general office facilities. The Sub-Adviser is compensated for its services to the Funds from the management fees paid to the Adviser.
Each Fund’s management fee consists of two components – a fund-level fee, based only on the amount of assets within each individual Fund, and a complex-level fee, based on the aggregate amount of all eligible fund assets managed by the Adviser. This pricing structure enables Fund shareholders to benefit from growth in the assets within their respective Fund as well as from growth in the amount of complex-wide assets managed by the Adviser.
The annual fund-level fee, payable monthly, for each Fund is calculated according to the following schedule:
| | | | |
| Average Daily Managed Assets* | | Fund-Level Fee Rate | |
For the first $500 million | | | 0.5000 | % |
For the next $250 million | | | 0.4875 | |
For managed assets over $750 million | | | 0.4750 | |
57
Notes to Financial Statements(continued)
The annual complex-level fee, payable monthly, for each Fund is calculated by multiplying the current complex-wide fee rate, determined according to the following schedule by the Funds’ daily managed assets:
| | | | |
| Complex-Level Eligible Asset Breakpoint Level* | | Effective Complex-Level
Fee Rate at Breakpoint Level | |
$55 billion | | | 0.2000 | % |
$56 billion | | | 0.1996 | |
$57 billion | | | 0.1989 | |
$60 billion | | | 0.1961 | |
$63 billion | | | 0.1931 | |
$66 billion | | | 0.1900 | |
$71 billion | | | 0.1851 | |
$76 billion | | | 0.1806 | |
$80 billion | | | 0.1773 | |
$91 billion | | | 0.1691 | |
$125 billion | | | 0.1599 | |
$200 billion | | | 0.1505 | |
$250 billion | | | 0.1469 | |
$300 billion | | | 0.1445 | |
| * | For the complex-level fees, managed assets include closed-end fund assets managed by the Adviser that are attributable to certain types of leverage. For these purposes, leverage includes the funds’ use of preferred stock and borrowings and certain investments in the residual interest certificates (also called inverse floating rate securities) in tender option bond (TOB) trusts, including the portion of assets held by a TOB trust that has been effectively financed by the trust’s issuance of floating rate securities, subject to an agreement by the Adviser as to certain funds to limit the amount of such assets for determining managed assets in certain circumstances. The complex-level fee is calculated based upon the aggregate daily managed assets of all Nuveen open-end and closed-end Funds that constitute “eligible assets.” Eligible assets do not include assets attributable to investments in other Nuveen funds or assets in excess of a determined amount (originally $2 billion) added to the Nuveen fund complex in connection with the Adviser’s assumption of the management of the former First American Funds effective January 1, 2011, but do not include certain assets of certain Nuveen funds that were reorganized into funds advised by an affiliate of the Adviser during the 2019 calendar year. As of December 31, 2019, the complex-level fee for each Fund was 0.1562%. |
8. Fund Leverage
Borrowings
During the current fiscal period, the Funds entered into borrowing arrangements (“Borrowings”) as a means of leverage.
The Funds have entered into a credit agreement with a bank. As of the end of the reporting period each Fund’s maximum commitment amount under its Borrowings is as follows:
| | | | | | | | | | | | |
| | | JHY | | | JHB | | | JHAA | |
Maximum commitment amount | | | $61,500,000 | | | | $215,000,000 | | | | $27,500,000 | |
JHY renewed its Borrowings in April 2019 through April 2020, while JHB renewed its Borrowings in January 2019 through January 2020. In addition the interest charged on JHB’s Borrowings was changed from one-month LIBOR plus 0.40% to one-month LIBOR plus 0.45%. All other terms remained unchanged for each Fund.
As of the end of the reporting period, each Fund’s outstanding balance on its Borrowings was as follows:
| | | | | | | | | | | | |
| | | JHY | | | JHB | | | JHAA | |
Outstanding��balance on Borrowings | | | $61,500,000 | | | | $192,000,000 | | | | $27,025,000 | |
Interest is charged on these Borrowings for JHY at the 1-Month LIBOR (London Inter-Bank Offered Rate) plus 0.65% per annum on the amounts borrowed and a 0.125% per annum commitment fee on the undrawn portion of the Borrowings. JHB is charged at the 1-Month LIBOR plus 0.45% (0.40% prior to January 9, 2019) per annum and a 0.25% per annum commitment fee on the undrawn portion of the Borrowings on any day that more than 10% of the maximum commitment amount is undrawn. JHAA is charged at the1-Month LIBOR plus 0.60% per annum on the amounts borrowed and accrues a 0.125% per annum commitment fee on the undrawn portion of the Borrowings and aone-time upfront fee of 0.05% per annum on the maximum commitment amount.
During the current fiscal period, the average daily balance outstanding and average annual interest rate on each Fund’s Borrowings were as follows:
| | | | | | | | | | | | |
| | | JHY | | | JHB | | | JHAA* | |
Utilization period (days outstanding) | | | 365 | | | | 365 | | | | 355 | |
Average daily balance outstanding | | $ | 61,500,000 | | | $ | 204,010,959 | | | $ | 26,125,352 | |
Average annual interest rate | | | 2.91 | % | | | 2.71 | % | | | 2.85 | % |
| * | For the period January 8, 2019 (initial draw) through December 31, 2019. |
58
In order to maintain these Borrowings, the Funds must meet certain collateral, asset coverage and other requirements. Each Fund’s Borrowings outstanding are secured by assets in the Fund’s portfolio of investments.
Each Fund’s Borrowings outstanding is recognized as “Borrowings” on the Statement of Assets and Liabilities. Interest expense incurred on the borrowed amount and undrawn balance and amendment fees are recognized as components of “Interest expense” on the Statement of Operations.
Reverse Repurchase Agreements
During the current fiscal period, JHAA used reverse repurchase agreements as a means of leverage.
In a reverse repurchase agreement, the Fund sells to the counterparty a security that it holds with a contemporaneous agreement to repurchase the same security at an agreed-upon price and date, with the Fund retaining the risk of loss that is associated with that security. The Fund will pledge assets determined to be liquid by the Adviser to cover its obligations under reverse repurchase agreements. Securities sold under reverse repurchase agreements are recorded as a liability and recognized as “Reverse repurchase agreements” on the Statement of Assets and Liabilities.
Payments made on reverse repurchase agreements are recognized as a component of “Interest expense” on the Statement of Operations.
As of the end of the reporting period, the Fund’s outstanding balances on its reverse repurchase agreements were as follows:
| | | | | | | | | | | | | | | | | | |
| Counterparty | | Coupon | | Principal
Amount | | | Maturity | | | Value | | | Value and
Accrued Interest | |
RBC Capital Markets | | 1.50% | | $ | (490,000 | ) | | | N/A | | | $ | (490,000 | ) | | $ | (491,245 | ) |
| N/A – | Maturity is not applicable. The final repurchase date will be established followingpre-specified advance notice by the Fund or the counterparty to the reverse repurchase agreement. |
During the current fiscal period, the average daily balance outstanding and weighted average interest rate on the Fund’s reverse repurchase agreements were as follows:
| | | | |
Utilization period (days outstanding) | | | 287 | |
Average daily balance outstanding | | | $1,227,143 | * |
Weighted average interest rate | | | 1.59 | % |
| * | For the period March 20, 2019 (initial date of reverse repurchase transaction) through December 31, 2019. |
The following table presents the reverse repurchase agreements subject to netting agreements and the collateral delivered related to those reverse repurchase agreements.
| | | | | | | | | | | | |
| Counterparty | | Reverse Repurchase
Agreements** | | | Collateral
Pledged to
counterparty*** | | | Net
Exposure | |
RBC Capital Markets | | $ | (491,245 | ) | | $ | (491,245 | ) | | $ | — | |
| ** | Represents gross value and accrued interest for the counterparty as reported in the preceding table. |
| *** | As of the end of the reporting period, the value of the collateral pledged to the counterparty exceeded the value of the reverse repurchase agreements. |
Rehypothecation
JHB has entered into a Rehypothecation Side Letter (“Side Letter”) with its credit agreement lender, allowing it to re-register a portion of its collateral in its own name or in a name other than the Fund’s to pledge, repledge, hypothecate, rehyphothecate, sell, lend or otherwise transfer or use the collateral (the “Hypothecated Securities”) with all rights of ownership as described in the Side Letter. Subject to certain conditions, the total value of the outstanding Hypothecated Securities shall not exceed 98% of the outstanding balance on the Borrowings. The Fund may designate any collateral as ineligible for rehypothecation. The Fund may also recall Hypothecated Securities on demand.
The Fund also has the right to apply and set-off an amount equal to one-hundred percent (100%) of the then-current fair market value of such Hypothecated Securities against the current Borrowings under the Side Letter in the event that the lender fails to timely return the Hypothecated Securities and in certain other circumstances. In such circumstances, however, the Fund may not be able to obtain replacement financing required to purchase replacement securities and, consequently, the Fund’s income generating potential may decrease. Even if the Fund is able to obtain replacement financing, it might not be able to purchase replacement securities at favorable prices.
Upon execution of the Rehypothecation Side Letter, the Fund lowered the drawn rate on its credit agreement. The Fund will receive any principal, interest, dividends and other distributions paid on the Hypothecated Securities.
As of the end of the reporting period, the Fund had Hypothecated Securities totaling $86,545,482.
59
Notes to Financial Statements(continued)
9. Inter-Fund Lending
Inter-Fund Borrowing and Lending
The SEC has granted an exemptive order permitting registered open-end and closed-end Nuveen funds to participate in an inter-fund lending facility whereby the Nuveen funds may directly lend to and borrow money from each other for temporary purposes (e.g., to satisfy redemption requests or when a sale of securities “fails,” resulting in an unanticipated cash shortfall) (the “Inter-Fund Program”). The closed-end Nuveen funds, including the Funds covered by this shareholder report, will participate only as lenders, and not as borrowers, in the Inter-Fund Program because such closed-end funds rarely, if ever, need to borrow cash to meet redemptions. The Inter-Fund Program is subject to a number of conditions, including, among other things, the requirements that (1) no fund may borrow or lend money through the Inter-Fund Program unless it receives a more favorable interest rate than is typically available from a bank or other financial institution for a comparable transaction; (2) no fund may borrow on an unsecured basis through the Inter-Fund Program unless the fund’s outstanding borrowings from all sources immediately after the inter-fund borrowing total 10% or less of its total assets; provided that if the borrowing fund has a secured borrowing outstanding from any other lender, including but not limited to another fund, the inter-fund loan must be secured on at least an equal priority basis with at least an equivalent percentage of collateral to loan value; (3) if a fund’s total outstanding borrowings immediately after an inter-fund borrowing would be greater than 10% of its total assets, the fund may borrow through the inter-fund loan on a secured basis only; (4) no fund may lend money if the loan would cause its aggregate outstanding loans through the Inter-Fund Program to exceed 15% of its net assets at the time of the loan; (5) a fund’s inter-fund loans to any one fund shall not exceed 5% of the lending fund’s net assets; (6) the duration of inter-fund loans will be limited to the time required to receive payment for securities sold, but in no event more than seven days; and (7) each inter-fund loan may be called on one business day’s notice by a lending fund and may be repaid on any day by a borrowing fund. In addition, a Nuveen fund may participate in the Inter-Fund Program only if and to the extent that such participation is consistent with the fund’s investment objective and investment policies. The Board is responsible for overseeing the Inter-Fund Program.
The limitations detailed above and the other conditions of the SEC exemptive order permitting the Inter-Fund Program are designed to minimize the risks associated with Inter-Fund Program for both the lending fund and the borrowing fund. However, no borrowing or lending activity is without risk. When a fund borrows money from another fund, there is a risk that the loan could be called on one day’s notice or not renewed, in which case the fund may have to borrow from a bank at a higher rate or take other actions to payoff such loan if an inter-fund loan is not available from another fund. Any delay in repayment to a lending fund could result in a lost investment opportunity or additional borrowing costs.
During the current reporting period, none of the Funds covered by this shareholder report have entered into any inter-fund loan activity.
10. Subsequent Events
Borrowings
During January and February 2020, JHY decreased its maximum commitment amount and borrowings amount to $24,500,000 and $19,500,000, respectively.
During January 2020, JHB renewed its Borrowings and decreased its maximum commitment amount and borrowings amount to $175,000,000 and $142,000,000, respectively. In addition the Fund is charged a 0.25% per annum commitment fee on the undrawn portion of the Borrowings on any day that more than 20% of the maximum commitment amount is undrawn. All other terms of the Borrowings remain unchanged.
During January 2020, JHAA renewed its Borrowings through January 2021. All other terms of the Borrowings remain unchanged.
60
Additional Fund Information(Unaudited)
| | | | | | | | |
| Board of Trustees | | | | | | | | |
| Jack B. Evans | | William C. Hunter | | Albin F. Moschner | | John K. Nelson | | Judith M. Stockdale |
| Carole E. Stone | | Terence J. Toth | | Margaret L. Wolff | | Robert L. Young | | |
| | | | | | | | |
| | | | | |
Investment Adviser Nuveen Fund Advisors, LLC 333 West Wacker Drive Chicago, IL 60606 | | Custodian State Street Bank
& Trust Company One Lincoln Street Boston, MA 02111 | | Legal Counsel Chapman and Cutler LLP Chicago, IL 60603 | | Independent Registered
Public Accounting Firm KPMG LLP 200 East Randolph Street Chicago, IL 60601 | | Transfer Agent and
Shareholder Services Computershare Trust Company, N.A. 150 Royall Street Canton, MA 02021 (800) 257-8787 |
Distribution Information
The Funds hereby designate their percentages of dividends paid from net ordinary income as dividends qualifying as Interest-Related Dividends and/or short-term capital gain dividends as defined in Internal Revenue Code Section 871(k) for the taxable year ended December 31, 2019:
| | | | | | | | | | | | |
| | | JHY | | | JHB | | | JHAA | |
% of Interest-Related Dividends | | | 76.5 | % | | | 75.1 | % | | | 80.6 | % |
Portfolio of Investments Information
Each Fund is required to file its complete schedule of portfolio holdings with the Securities and Exchange Commission (SEC) for the first and third quarters of each fiscal year as an exhibit to its report on Form N-PORT. You may obtain this information on the SEC’s website at http://www.sec.gov.
Nuveen Funds’ Proxy Voting Information
You may obtain (i) information regarding how each fund voted proxies relating to portfolio securities held during the most recent twelve-month period ended June 30, without charge, upon request, by calling Nuveen toll-free at (800) 257-8787 or on Nuveen’s website at www.nuveen.com and (ii) a description of the policies and procedures that each fund used to determine how to vote proxies relating to portfolio securities without charge, upon request, by calling Nuveen toll free at (800) 257-8787. You may also obtain this information directly from the SEC. Visit the SEC on-line at http://www.sec.gov.
CEO Certification Disclosure
The Fund’s Chief Executive Officer (CEO) has submitted to the New York Stock Exchange (NYSE) the annual CEO certification as required by Section 303A.12(a) of the NYSE Listed Company Manual. The Fund has filed with the SEC the certification of its CEO and Chief Financial Officer required by Section 302 of the Sarbanes-Oxley Act.
Common Share Repurchases
The Funds intend to repurchase, through their open-market share repurchase program, shares of their own common stock at such times and in such amounts as is deemed advisable. During the period covered by this report, each Fund repurchased shares of its common stock, as shown in the accompanying table. Any future repurchases will be reported to shareholders in the next annual or semi-annual report.
| | | | | | | | | | | | |
| | | JHY | | | JHB | | | JHAA | |
Common shares repurchased | | | — | | | | — | | | | — | |
FINRA BrokerCheck
The Financial Industry Regulatory Authority (FINRA) provides information regarding the disciplinary history of FINRA member firms and associated investment professionals. This information as well as an investor brochure describing FINRA BrokerCheck is available to the public by calling the FINRA BrokerCheck Hotline number at (800) 289-9999 or by visiting www.FINRA.org.
61
Glossary of Terms Used in this Report
(Unaudited)
| ∎ | | Average Annual Total Return: This is a commonly used method to express an investment’s performance over a particular, usually multi-year time period. It expresses the return that would have been necessary each year to equal the investment’s actual cumulative performance (including change in NAV or market price and reinvested dividends and capital gains distributions, if any) over the time period being considered. |
| ∎ | | Bloomberg Barclays U.S. High Yield 1-5 Year Cash Pay 2% Issuer Capped Index: An index that tracks the performance of U.S. non-investment grade bonds with maturities of one to 4.99 years and limits each issue to 2% of the index. Benchmark returns assume reinvestment of distributions, but do not reflect any applicable sales charges or management fees. |
| ∎ | | Duration: Duration is a measure of the expected period over which a bond’s principal and interest will be paid, and consequently is a measure of the sensitivity of a bond’s or bond fund’s value to changes when market interest rates change. Generally, the longer a bond’s or fund’s duration, the more the price of the bond or fund will change as interest rates change. |
| ∎ | | Effective Leverage: Effective leverage is a fund’s effective economic leverage, and includes both regulatory leverage (see below) and the leverage effects of certain derivative investments in the fund’s portfolio. |
| ∎ | | Gross Domestic Product (GDP): The total market value of all final goods and services produced in a country/region in a given year, equal to total consumer, investment and government spending, plus the value of exports, minus the value of imports. |
| ∎ | | Leverage: Leverage is created whenever a fund has investment exposure (both reward and/or risk) equivalent to more than 100% of the investment capital. |
| ∎ | | Net Asset Value (NAV) Per Share: A fund’s Net Assets is equal to its total assets (securities, cash, accrued earnings and receivables) less its total liabilities. NAV per share is equal to the fund’s Net Assets divided by its number of shares outstanding. |
| ∎ | | Regulatory Leverage: Regulatory leverage consists of preferred shares issued by or borrowings of a fund. Both of these are part of a fund’s capital structure. Regulatory leverage is subject to asset coverage limits set in the Investment Company Act of 1940. |
62
Reinvest Automatically, Easily and Conveniently
Nuveen makes reinvesting easy. A phone call is all it takes to set up your reinvestment account.
Nuveen Closed-End Funds Automatic Reinvestment Plan
Your Nuveen Closed-End Fund allows you to conveniently reinvest distributions in additional Fund shares.
By choosing to reinvest, you’ll be able to invest money regularly and automatically, and watch your investment grow through the power of compounding. Just like distributions in cash, there may be times when income or capital gains taxes may be payable on distributions that are reinvested.
It is important to note that an automatic reinvestment plan does not ensure a profit, nor does it protect you against loss in a declining market.
Easy and convenient
To make recordkeeping easy and convenient, each quarter you’ll receive a statement showing your total distributions, the date of investment, the shares acquired and the price per share, and the total number of shares you own.
How shares are purchased
The shares you acquire by reinvesting will either be purchased on the open market or newly issued by the Fund. If the shares are trading at or above net asset value at the time of valuation, the Fund will issue new shares at the greater of the net asset value or 95% of the then-current market price. If the shares are trading at less than net asset value, shares for your account will be purchased on the open market. If the Plan Agent begins purchasing Fund shares on the open market while shares are trading below net asset value, but the Fund’s shares subsequently trade at or above their net asset value before the Plan Agent is able to complete its purchases, the Plan Agent may cease open-market purchases and may invest the uninvested portion of the distribution in newly-issued Fund shares at a price equal to the greater of the shares’ net asset value or 95% of the shares’ market value on the last business day immediately prior to the purchase date. Distributions received to purchase shares in the open market will normally be invested shortly after the distribution payment date. No interest will be paid on distributions awaiting reinvestment. Because the market price of the shares may increase before purchases are completed, the average purchase price per share may exceed the market price at the time of valuation, resulting in the acquisition of fewer shares than if the distribution had been paid in shares issued by the Fund. A pro rata portion of any applicable brokerage commissions on open market purchases will be paid by Plan participants. These commissions usually will be lower than those charged on individual transactions.
Flexible
You may change your distribution option or withdraw from the Plan at any time, should your needs or situation change.
You can reinvest whether your shares are registered in your name, or in the name of a brokerage firm, bank, or other nominee. Ask your investment advisor if his or her firm will participate on your behalf. Participants whose shares are registered in the name of one firm may not be able to transfer the shares to another firm and continue to participate in the Plan.
The Fund reserves the right to amend or terminate the Plan at any time. Although the Fund reserves the right to amend the Plan to include a service charge payable by the participants, there is no direct service charge to participants in the Plan at this time.
Call today to start reinvesting distributions
For more information on the Nuveen Automatic Reinvestment Plan or to enroll in or withdraw from the Plan, speak with your financial advisor or call us at (800) 257-8787.
63
Board Members & Officers
(Unaudited)
The management of the Funds, including general supervision of the duties performed for the Funds by the Adviser, is the responsibility of the Board of Trustees of the Funds. The number of trustees of the Funds is set at nine. None of the trustees who are not “interested” persons of the Funds (referred to herein as “independent board members”) has ever been a director or employee of, or consultant to, Nuveen or its affiliates. The names and business addresses of the trustees and officers of the Funds, their principal occupations and other affiliations during the past five years, the number of portfolios each Trustee oversees and other directorships they hold are set forth below.
| | | | | | | | |
| | | | |
| | | | | | | | | |
Name, Year of Birth & Address | | Position(s) Held with the Funds | | Year First Elected or Appointed and Term(1)
| | Principal Occupation(s) Including other Directorships During Past 5 Years | | Number of Portfolios in Fund Complex Overseen by Board Member |
| | | | |
| | | | | | | | | |
|
| Independent Board Members: |
| | | | |
∎ TERENCE J. TOTH | | | | | | Formerly, aCo-Founding Partner, Promus Capital (2008-2017); Director, Quality Control Corporation (since 2012); member: Catalyst Schools of Chicago Board (since 2008) and Mather Foundation Board (since 2012), and chair of its Investment Committee; formerly, Director, Fulcrum IT Services LLC (2010-2019); formerly, Director, Legal & General Investment Management America, Inc. (2008-2013); formerly, CEO and President, Northern Trust Global Investments (2004-2007): Executive Vice President, Quantitative Management & Securities Lending (2000-2004); prior thereto, various positions with Northern Trust Company (since 1994); formerly, Member, Northern Trust Mutual Funds Board (2005-2007), Northern Trust Global Investments Board (2004-2007), Northern Trust Japan Board (2004-2007), Northern Trust Securities Inc. Board (2003-2007) and Northern Trust Hong Kong Board (1997-2004). | | |
1959 333 W. Wacker Drive Chicago, IL 60606 | | Chairman and Board Member | | 2008 Class II | | 157 |
| | | | | | |
| | | | |
∎ JACK B. EVANS | | | | | | Chairman (since 2019), formerly, President (1996-2019), The Hall-Perrine Foundation, a private philanthropic corporation; Director and Chairman, United Fire Group, a publicly held company; Director, Public Member, American Board of Orthopaedic Surgery (since 2015); Life Trustee of Coe College and the Iowa College Foundation; formerly, PresidentPro-Tem of the Board of Regents for the State of Iowa University System; formerly, Director, Alliant Energy and The Gazette Company; formerly, Director, Federal Reserve Bank of Chicago; formerly, President and Chief Operating Officer, SCI Financial Group, Inc., a regional financial services firm. | | |
1948 333 W. Wacker Drive Chicago, IL 60606 | | Board Member | | 1999 Class III | | 157 |
| | | | | | |
| | | | |
∎ WILLIAM C. HUNTER | | | | | | Dean Emeritus, formerly, Dean, Tippie College of Business, University of Iowa (2006-2012); Director of Wellmark, Inc. (since 2009); past Director (2005-2015), and past President (2010-2014) Beta Gamma Sigma, Inc., The International Business Honor Society; formerly, Director (2004-2018) of Xerox Corporation; Dean and Distinguished Professor of Finance, School of Business at the University of Connecticut (2003-2006); previously, Senior Vice President and Director of Research at the Federal Reserve Bank of Chicago (1995-2003); formerly, Director (1997-2007), Credit Research Center at Georgetown University. | | |
1948 333 W. Wacker Drive Chicago, IL 60606 | | Board Member | | 2003 Class I | | 157 |
| | | | |
| | | | |
∎ ALBIN F. MOSCHNER | | | | | | Founder and Chief Executive Officer, Northcroft Partners, LLC, a management consulting firm (since 2012); formerly, Chairman (2019), and Director (2012-2019), USA Technologies, Inc., a provider of solutions and services to facilitate electronic payment transactions; formerly, Director, Wintrust Financial Corporation (1996-2016); previously, held positions at Leap Wireless International, Inc., including Consultant (2011-2012), Chief Operating Officer (2008-2011), and Chief Marketing Officer (2004-2008); formerly, President, Verizon Card Services division of Verizon Communications, Inc. (2000-2003); formerly, President, One Point Services at One Point Communications (1999-2000); formerly, Vice Chairman of the Board, Diba, Incorporated (1996-1997); formerly, various executive positions (1991-1996) and Chief Executive Officer (1995-1996) of Zenith Electronics Corporation. | | |
1952 333 W. Wacker Drive Chicago, IL 60606 | | Board Member | | 2016 Class III | | 157 |
| | | | | | |
64
| | | | | | | | |
| | | | |
| | | | | | | | | |
Name, Year of Birth & Address | | Position(s) Held with the Funds | | Year First Elected or Appointed and Term(1)
| | Principal Occupation(s) Including other Directorships During Past 5 Years | | Number of Portfolios in Fund Complex Overseen by Board Member |
| | | | |
| | | | | | | | | |
|
| Independent Board Members (continued): |
| | | | |
∎ JOHN K. NELSON | | | | | | Member of Board of Directors of Core12 LLC. (since 2008), a private firm which develops branding, marketing and communications strategies for clients; served The President’s Council of Fordham University (2010-2019) and previously a Director of the Curran Center for Catholic American Studies (2009-2018); formerly, senior external advisor to the Financial Services practice of Deloitte Consulting LLP. (2012-2014); former Chair of the Board of Trustees of Marian University (2010-2014 as trustee, 2011-2014 as Chair); formerly Chief Executive Officer of ABN AMRO Bank N.V., North America, and Global Head of the Financial Markets Division (2007-2008), with various executive leadership roles in ABN AMRO Bank N.V. between 1996 and 2007. | | |
1962 333 W. Wacker Drive Chicago, IL 60606 | | Board Member | | 2013 Class II | | 157 |
| | | | | | |
| | | | |
∎ JUDITH M. STOCKDALE | | | | | | Board Member, Land Trust Alliance (since 2013); formerly, Board Member, U.S. Endowment for Forestry and Communities (2013-2019); formerly, Executive Director(1994-2012), Gaylord and Dorothy Donnelley Foundation; prior thereto, Executive Director, Great Lakes Protection Fund (1990-1994). | | |
1947 333 W. Wacker Drive Chicago, IL 60606 | | Board Member | | 1997 Class I | | 157 |
| | | | |
∎ CAROLE E. STONE | | | | | | Former Director, Chicago Board Options Exchange, Inc. (2006-2017); and C2 Options Exchange, Incorporated (2009-2017); Director, Cboe, Global Markets, Inc., formerly, CBOE Holdings, Inc. (since 2010); formerly, Commissioner, New York State Commission on Public Authority Reform (2005-2010). | | |
1947 333 W. Wacker Drive Chicago, IL 60606 | | Board Member | | 2007 Class I | | 157 |
| | | | |
∎ MARGARET L. WOLFF | | | | | | Formerly, member of the Board of Directors (2013-2017) of Travelers Insurance Company of Canada and The Dominion of Canada General Insurance Company (each, a part of Travelers Canada, the Canadian operation of The Travelers Companies, Inc.); formerly, Of Counsel, Skadden, Arps, Slate, Meagher & Flom LLP (Mergers & Acquisitions Group) (2005-2014); Member of the Board of Trustees of New York-Presbyterian Hospital (since 2005); Member (since 2004) and Chair (since 2015) of the Board of Trustees of The John A. Hartford Foundation (a philanthropy dedicated to improving the care of older adults); formerly, Member (2005-2015) and Vice Chair (2011-2015) of the Board of Trustees of Mt. Holyoke College. | | |
1955 333 W. Wacker Drive Chicago, IL 60606 | | Board Member | | 2016 Class I | | 157 |
| | | | | | |
| | | | |
∎ ROBERT L. YOUNG(2) | | | | | | Formerly, Chief Operating Officer and Director, J.P.Morgan Investment Management Inc. (2010-2016); formerly, President and Principal Executive Officer (2013-2016), and Senior Vice President and Chief Operating Officer (2005-2010), of J.P.Morgan Funds; formerly, Director and various officer positions for J.P.Morgan Investment Management Inc. (formerly, JPMorgan Funds Management, Inc. and formerly, One Group Administrative Services) and JPMorgan Distribution Services, Inc. (formerly, One Group Dealer Services, Inc.) (1999-2017). | | |
1963 333 W. Wacker Drive Chicago, IL 60606 | | Board Member | | 2017 Class II | | 157 |
| | | | | | |
65
Board Members & Officers(continued)
(Unaudited)
| | | | | | | | |
| | | | |
| | | | | | | | | |
Name, Year of Birth & Address | | Position(s) Held
with the Funds | | Year First
Elected or
Appointed(3) | | Principal Occupation(s) During Past 5 Years | | |
| | | | |
| | | | | | | | | |
| | | | |
| Officers of the Funds: | | | | | | | | |
| | | | |
∎ CEDRIC H. ANTOSIEWICZ | | | | | | Senior Managing Director (since 2017), formerly, Managing Director (2004-2017) of Nuveen Securities, LLC; Senior Managing Director (since 2017), formerly, Managing Director (2014-2017) of Nuveen Fund Advisors, LLC. | | |
1962 333 W. Wacker Drive Chicago, IL 60606 | | Chief Administrative Officer | | 2007 | | |
| | | | |
∎ NATHANIEL T. JONES | | | | | | Managing Director (since 2017), formerly, Senior Vice President (2016-2017), formerly, Vice President (2011-2016) of Nuveen; Managing Director (since 2015) of Nuveen Fund Advisors, LLC; Chartered Financial Analyst. | | |
1979 333 W. Wacker Drive Chicago, IL 60606 | | Vice President and Treasurer | | 2016 | | |
| | | | |
∎ WALTER M. KELLY | | | | | | Managing Director (since 2017), formerly, Senior Vice President(2008-2017) of Nuveen. | | |
1970 333 W. Wacker Drive Chicago, IL 60606 | | Chief Compliance Officer and Vice President | | 2003 | | |
| | | | |
∎ DAVID J. LAMB | | | | | | Managing Director (since 2017), formerly, Senior Vice President of Nuveen (since 2006), Vice President prior to 2006. | | |
1963 333 W. Wacker Drive Chicago, IL 60606 | | Vice President | | 2015 | | |
| | | | |
∎ TINA M. LAZAR | | | | | | Managing Director (since 2017), formerly, Senior Vice President(2014-2017) of Nuveen Securities, LLC. | | |
1961 333 W. Wacker Drive Chicago, IL 60606 | | Vice President | | 2002 | | |
| | | | |
∎ BRIAN J. LOCKHART | | | | | | Managing Director (since 2019) of Nuveen Fund Advisors, LLC; Managing Director (since 2017), formerly, Vice President (2010-2017) of Nuveen; Head of Investment Oversight (since 2017), formerly, Team Leader of Manager Oversight (2015-2017); Chartered Financial Analyst and Certified Financial Risk Manager. | | |
1974 333 W. Wacker Drive Chicago, IL 60606 | | Vice President | | 2019 | | |
| | | | | | |
| | | | |
∎ JACQUES M. LONGERSTAEY | | | | | | Senior Managing Director, Chief Risk Officer, Nuveen, LLC (since May 2019); Senior Managing Director (since May 2019) of Nuveen Fund Advisors, LLC; formerly, Chief Investment and Model Risk Officer, Wealth & Investment Management Division, Wells Fargo Bank (NA) (from 2013-2019). | | |
1963 8500 Andrew Carnegie Blvd. Charlotte, NC 28262 | | Vice President | | 2019 | | |
| | | | | | |
66
| | | | | | | | |
| | | | |
| | | | | | | | | |
Name, Year of Birth & Address | | Position(s) Held with the Funds | | Year First Elected or Appointed(3) | | Principal Occupation(s) During Past 5 Years | | |
| | | | |
| | | | | | | | | |
| | |
| Officers of the Funds (continued): | | | | |
| | | | |
∎ KEVIN J. MCCARTHY | | | | | | Senior Managing Director (since 2017) and Secretary and General Counsel (since 2016) of Nuveen Investments, Inc., formerly, Executive Vice President (2016-2017) and Managing Director and Assistant Secretary (2008-2016); Senior Managing Director (since 2017) and Assistant Secretary (since 2008) of Nuveen Securities, LLC, formerly Executive Vice President (2016-2017) and Managing Director (2008-2016); Senior Managing Director (since 2017), Secretary (since 2016) andCo-General Counsel (since 2011) of Nuveen Fund Advisors, LLC, formerly, Executive Vice President (2016-2017), Managing Director (2008-2016) and Assistant Secretary (2007-2016); Senior Managing Director (since 2017), Secretary (since 2016) and Associate General Counsel (since 2011) of Nuveen Asset Management, LLC, formerly Executive Vice President (2016-2017) and Managing Director and Assistant Secretary (2011-2016); Senior Managing Director (since 2017) and Secretary (since 2016) of Nuveen Investments Advisers, LLC, formerly Executive Vice President (2016-2017); Vice President (since 2007) and Secretary (since 2016), formerly, Assistant Secretary, of NWQ Investment Management Company, LLC, Symphony Asset Management LLC, Santa Barbara Asset Management, LLC and Winslow Capital Management, LLC (since 2010). Senior Managing Director (since 2017) and Secretary (since 2016) of Nuveen Alternative Investments, LLC. | | |
1966 333 W. Wacker Drive Chicago, IL 60606 | | Vice President and Assistant Secretary | | 2007 | | |
| | | | | | |
| | | | |
∎ JON SCOTT MEISSNER | | | | | | Managing Director of Mutual Fund Tax and Financial Reporting groups at Nuveen (since 2017); Managing Director of Nuveen Fund Advisors, LLC (since 2019); Senior Director of Teachers Advisors, LLC and TIAA-CREF Investment Management, LLC (since 2016); Senior Director (since 2015) Mutual Fund Taxation to the TIAA-CREF Funds, the TIAA-CREF Life Funds, the TIAA Separate AccountVA-1 and the CREF Accounts; has held various positions with TIAA since 2004. | | |
1973 8500 Andrew Carnegie Blvd. Charlotte, NC 28262 | | Vice President | | 2019 | | |
| | | | | | |
| | | | |
∎ WILLIAM T. MEYERS | | | | | | Senior Managing Director (since 2017), formerly, Managing Director(2016-2017), Senior Vice President (2010-2016) of Nuveen Securities, LLC and Nuveen Fund Advisors, LLC; Senior Managing Director (since 2017), formerly, Managing Director (2016-2017), Senior Vice President (2010-2016) of Nuveen, has held various positions with Nuveen since 1991. | | |
1966 333 W. Wacker Drive Chicago, IL 60606 | | Vice President | | 2018 | | |
| | | | | | |
| | | | |
∎ MICHAEL A. PERRY | | | | | | Executive Vice President (since 2017), previously Managing Director (from 2016), of Nuveen Fund Advisors, LLC and Nuveen Alternative Investments, LLC; Executive Vice President (since 2017), formerly, Managing Director(2015-2017), of Nuveen Securities, LLC; formerly, Managing Director(2010-2015) of UBS Securities, LLC. | | |
1967 333 W. Wacker Drive Chicago, IL 60606 | | Vice President | | 2017 | | |
| | | | | | |
| | | |
∎ CHRISTOPHER M. ROHRBACHER | | | | Managing Director (since 2017) and Assistant Secretary of Nuveen Securities, LLC; Managing Director (since 2017), formerly, Senior Vice President(2016-2017),Co-General Counsel (since 2019) and Assistant Secretary (since 2016) of Nuveen Fund Advisors, LLC; Managing Director (since 2017), formerly, Senior Vice President (2012-2017) and Associate General Counsel (since 2016), formerly, Assistant General Counsel (2008-2016) of Nuveen. | | |
1971 333 W. Wacker Drive Chicago, IL 60606 | | Vice President and Assistant Secretary | | 2008 | | |
| | | | | | |
| | | | |
∎ WILLIAM A. SIFFERMANN | | | | | | Managing Director (since 2017), formerly Senior Vice President (2016-2017) and Vice President (2011-2016) of Nuveen. | | |
1975 333 W. Wacker Drive Chicago, IL 60606 | | Vice President | | 2017 | | |
67
Board Members & Officers(continued)
(Unaudited)
| | | | | | | | |
| | | | |
| | | | | | | | | |
Name, Year of Birth & Address | | Position(s) Held with the Funds | | Year First Elected or Appointed(3) | | Principal Occupation(s) During Past 5 Years | | |
| | | | |
| | | | | | | | | |
| | |
| Officers of the Funds (continued): | | | | |
| | | | |
∎ E. SCOTT WICKERHAM | | | | | | Senior Managing Director, Head of Fund Administration at Nuveen, LLC (since 2019), formerly, Managing Director; Senior Managing Director (since 2019), Nuveen Fund Advisers, LLC; Principal Financial Officer, Principal Accounting Officer and Treasurer (since 2017) to the TIAA-CREF Funds, the TIAA-CREF Life Funds, the TIAA Separate AccountVA-1 and the Treasurer (since 2017) to the CREF Accounts; Senior Director, TIAA-CREF Fund Administration (2014-2015); has held various positions with TIAA since 2006. | | |
1973 TIAA 730 Third Avenue New York, NY 10017 | | Vice President and Controller | | 2019 | | |
| | | | | | |
| | | | |
∎ MARK L. WINGET | | | | | | Vice President and Assistant Secretary of Nuveen Securities, LLC (since 2008); Vice President and Assistant Secretary of Nuveen Fund Advisors, LLC (since 2019); Vice President (since 2010) and Associate General Counsel (since 2016), formerly, Assistant General Counsel (2008-2016) of Nuveen. | | |
1968 333 W. Wacker Drive Chicago, IL 60606 | | Vice President and Assistant Secretary | | 2008 | | |
| | | | |
∎ GIFFORD R. ZIMMERMAN | | | | | | Managing Director (since 2002), and Assistant Secretary of Nuveen Securities, LLC; Managing Director (since 2004) and Assistant Secretary (since 1994) of Nuveen Investments, Inc.; Managing Director (since 2002), Assistant Secretary (since 1997) andCo-General Counsel (since 2011) of Nuveen Fund Advisors, LLC; Managing Director, Assistant Secretary and Associate General Counsel of Nuveen Asset Management, LLC (since 2011); Vice President (since 2017), formerly, Managing Director (2003-2017) and Assistant Secretary (since 2003) of Symphony Asset Management LLC; Managing Director and Assistant Secretary (since 2002) of Nuveen Investments Advisers, LLC; Vice President and Assistant Secretary of NWQ Investment Management Company, LLC (since 2002), Santa Barbara Asset Management, LLC (since 2006), and of Winslow Capital Management, LLC, (since 2010); Chartered Financial Analyst. | | |
1956 333 W. Wacker Drive Chicago, IL 60606 | | Vice President Secretary | | 1988 | | |
| | | | | | |
| (1) | The Board of Trustees is divided into three classes, Class I, Class II, and Class III, with each being elected to serve until the third succeeding annual shareholders’ meeting subsequent to its election or thereafter in each case when its respective successors are duly elected or appointed, except two board members are elected by the holders of Preferred Shares, when applicable, to serve until the next annual shareholders’ meeting subsequent to its election or thereafter in each case when its respective successors are duly elected or appointed. The year first elected or appointed represents the year in which the board member was first elected or appointed to any fund in the Nuveen complex. |
| (2) | Effective July 1, 2017, Mr. Young was appointed as a Board Member of each of the Nuveen Funds except Nuveen Diversified Dividend and Income Fund (JDD) and Nuveen Real Estate Income Fund (JRS). Effective February 27, 2020, Mr. Young was appointed as a Board Member of JDD and JRS. |
| (3) | Officers serve one year terms through August of each year. The year first elected or appointed represents the year in which the Officer was first elected or appointed to any fund in the Nuveen complex. |
68
Notes
69
Notes
70
Notes
71
Nuveen:
Serving Investors for Generations
Since 1898, financial advisors and their clients have relied on Nuveen to provide
dependable investment solutions through continued adherence to proven, long-term investing
principles. Today, we offer a range of high quality solutions designed to
be integral components of a well-diversified core portfolio.
Focused on meeting investor needs.
Nuveen is the investment manager of TIAA. We have grown into one of the world’s premier global asset managers, with specialist knowledge across all major asset classes and particular strength in solutions that provide income for investors and that draw on our expertise in alternatives and responsible investing. Nuveen is driven not only by the independent investment processes across the firm, but also the insights, risk management, analytics and other tools and resources that a truly world-class platform provides. As a global asset manager, our mission is to work in partnership with our clients to create solutions which help them secure their financial future.
Find out how we can help you.
To learn more about how the products and services of Nuveen may be able to help you meet your financial goals, talk to your financial advisor, or call us at(800) 257-8787. Please read the information provided carefully before you invest. Investors should consider the investment objective and policies, risk considerations, charges and expenses of any investment carefully. Where applicable, be sure to obtain a prospectus, which contains this and other relevant information. To obtain a prospectus, please contact your securities representative or Nuveen, 333 W. Wacker Dr., Chicago, IL 60606. Please read the prospectus carefully before you invest or send money.
Learn more about Nuveen Funds at:www.nuveen.com/closed-end-funds
| | | | |
| Nuveen Securities, LLC, member FINRA and SIPC | 333 West Wacker Drive Chicago, IL 60606 | www.nuveen.com | | | | EAN-J-1219D 1077295-INV-Y-02/21 |
ITEM 2. CODE OF ETHICS.
As of the end of the period covered by this report, the registrant has adopted a code of ethics that applies to the registrant’s principal executive officer, principal financial officer, principal accounting officer or controller, or persons performing similar functions. There were no amendments to or waivers from the Code during the period covered by this report. The registrant has posted the code of ethics on its website at www.nuveen.com/fund-governance. (To view the code, click on Code of Conduct.)
ITEM 3. AUDIT COMMITTEE FINANCIAL EXPERT.
As of the end of the period covered by this report, the registrant’s Board of Directors or Trustees (“Board”) determined that the registrant has at least one “audit committee financial expert” (as defined in Item 3 of Form N-CSR) serving on its Audit Committee. The registrant’s audit committee financial experts are Carole E. Stone, Jack B. Evans and William C. Hunter who are “independent” for purposes of Item 3 of Form N-CSR.
Ms. Stone served for five years as Director of the New York State Division of the Budget. As part of her role as Director, Ms. Stone was actively involved in overseeing the development of the State’s operating, local assistance and capital budgets, its financial plan and related documents; overseeing the development of the State’s bond-related disclosure documents and certifying that they fairly presented the State’s financial position; reviewing audits of various State and local agencies and programs; and coordinating the State’s system of internal audit and control. Prior to serving as Director, Ms. Stone worked as a budget analyst/examiner with increasing levels of responsibility over a 30 year period, including approximately five years as Deputy Budget Director. Ms. Stone has also served as Chair of the New York State Racing Association Oversight Board, as Chair of the Public Authorities Control Board, as a Commissioner on the New York State Commission on Public Authority Reform and as a member of the Boards of Directors of several New York State public authorities. These positions have involved overseeing operations and finances of certain entities and assessing the adequacy of project/entity financing and financial reporting. Currently, Ms. Stone is on the Board of Directors of CBOE Holdings, Inc., of the Chicago Board Options Exchange, and of C2 Options Exchange. Ms. Stone’s position on the boards of these entities and as a member of both CBOE Holdings’ Audit Committee and its Finance Committee has involved, among other things, the oversight of audits, audit plans and preparation of financial statements.
Mr. Evans was formerly President and Chief Operating Officer of SCI Financial Group, Inc., a full service registered broker-dealer and registered investment adviser (“SCI”). As part of his role as President and Chief Operating Officer, Mr. Evans actively supervised the Chief Financial Officer (the “CFO”) and actively supervised the CFO’s preparation of financial statements and other filings with various regulatory authorities. In such capacity, Mr. Evans was actively involved in the preparation of SCI’s financial statements and the resolution of issues raised in connection therewith. Mr. Evans has also served on the audit committee of various reporting companies. At such companies, Mr. Evans was involved in the oversight of audits, audit plans, and the preparation of financial statements. Mr. Evans also formerly chaired the audit committee of the Federal Reserve Bank of Chicago.
Mr. Hunter was formerly a Senior Vice President at the Federal Reserve Bank of Chicago. As part of his role as Senior Vice President, Mr. Hunter was the senior officer responsible for all operations of each of the Economic Research, Statistics, and Community and Consumer Affairs units at the Federal Reserve Bank of Chicago. In such capacity, Mr. Hunter oversaw the subunits of the Statistics and Community and Consumer Affairs divisions responsible for the analysis and evaluation of bank and bank holding company financial statements and financial filings. Prior to serving as Senior Vice President at the Federal Reserve Bank of Chicago, Mr. Hunter was the Vice President of the Financial Markets unit at the Federal Reserve Bank of Atlanta where he supervised financial staff and bank holding company analysts who analyzed and evaluated bank and bank holding company financial statements. Mr. Hunter also currently serves on the Boards of Directors of Xerox Corporation and Wellmark, Inc. as well as on the Audit Committees of such Boards. As an Audit Committee member, Mr. Hunter’s responsibilities include, among other things, reviewing financial statements, internal audits and internal controls over financial reporting. Mr. Hunter also formerly was a Professor of Finance at the University of Connecticut School of Business and has authored numerous scholarly articles on the topics of finance, accounting and economics.
ITEM 4. PRINCIPAL ACCOUNTANT FEES AND SERVICES.
The following tables show the amount of fees that KPMG LLP, the Funds’ auditor, billed to the Funds’ during the Funds’ last two full fiscal years. The Audit Committee approved in advance all audit services and non-audit services that KPMG LLP provided to the Funds, except for those non-audit services that were subject to the pre-approval exception under Rule 2-01 of Regulation S-X (the “pre-approval exception”). The preapproval exception for services provided directly to the Funds waives the pre-approval requirement for services other than audit, review or attest services if: (A) the aggregate amount of all such services provided constitutes no more than 5% of the total amount of revenues paid by the Funds during the fiscal year in which the services are provided; (B) the Funds did not recognize the services as non-audit services at the time of the engagement; and (C) the services are promptly brought to the Audit Committee’s attention, and the Committee (or its delegate) approves the services before the audit is completed.
The Audit Committee has delegated certain pre-approval responsibilities to its Chair (or, in her absence, any other member of the Audit Committee).
SERVICES THAT THE FUND’S AUDITOR BILLED TO THE FUND
| | | | | | | | | | | | | | | | |
Fiscal Year Ended | | Audit Fees Billed
to Fund1 | | | Audit-Related Fees
Billed to Fund2 | | | Tax Fees
Billed to Fund 3 | | | All Other Fees
Billed to Fund 4 | |
December 31, 2019 | | $ | 32,270 | | | $ | 0 | | | $ | 0 | | | $ | 0 | |
| | | | | | | | | | | | | | | | |
| | | | | | | | | | | | | | | | |
Percentage approved pursuant to pre-approval exception | | | 0 | % | | | 0 | % | | | 0 | % | | | 0 | % |
| | | | | | | | | | | | | | | | |
| | | | | | | | | | | | | | | | |
December 31, 2018 | | $ | 32,270 | | | $ | 5,000 | | | $ | 0 | | | $ | 0 | |
| | | | | | | | | | | | | | | | |
| | | | | | | | | | | | | | | | |
Percentage approved pursuant to pre-approval exception | | | 0 | % | | | 0 | % | | | 0 | % | | | 0 | % |
| | | | | | | | | | | | | | | | |
1 “Audit Fees” are the aggregate fees billed for professional services for the audit of the Fund’s annual financial statements and services provided in connection with statutory and regulatory filings or engagements.
2 “Audit Related Fees” are the aggregate fees billed for assurance and related services reasonably related to the performance of the audit or review of financial statements that are not reported under “Audit Fees”. These fees include offerings related to the Fund’s common shares and leverage.
3 “Tax Fees” are the aggregate fees billed for professional services for tax advice, tax compliance, and tax planning. These fees include: all global withholding tax services; excise and state tax reviews; capital gain, tax equalization and taxable basis calculation performed by the principal accountant.
4 “All Other Fees” are the aggregate fees billed for products and services other than “Audit Fees”, “Audit-Related Fees” and “Tax Fees”. These fees represent all “Agreed-Upon Procedures” engagements pertaining to the Fund’s use of leverage.
SERVICES THAT THE FUND’S AUDITOR BILLED TO THE
ADVISER AND AFFILIATED FUND SERVICE PROVIDERS
The following tables show the amount of fees billed by KPMG LLP to Nuveen Fund Advisors, LLC (formerly Nuveen Fund Advisors, Inc.) (the “Adviser”), and any entity controlling, controlled by or under common control with the Adviser that provides ongoing services to the Fund (“Affiliated Fund Service Provider”), for engagements directly related to the Fund’s operations and financial reporting, during the Fund’s last two full fiscal years.
The tables also show the percentage of fees subject to the pre-approval exception. The pre-approval exception for services provided to the Adviser and any Affiliated Fund Service Provider (other than audit, review or attest services) waives the pre-approval requirement if: (A) the aggregate amount of all such services provided constitutes no more than 5% of the total amount of revenues paid to KPMG LLP by the Fund, the Adviser and Affiliated Fund Service Providers during the fiscal year in which the services are provided that would have to be pre-approved by the Audit Committee; (B) the Fund did not recognize the services as non-audit services at the time of the engagement; and (C) the services are promptly brought to the Audit Committee’s attention, and the Committee (or its delegate) approves the services before the Fund’s audit is completed.
| | | | | | | | | | | | |
Fiscal Year Ended | | Audit-Related Fees
Billed to Adviser and
Affiliated Fund Service
Providers | | | Tax Fees Billed to
Adviser and
Affiliated Fund
Service Providers | | | All Other Fees
Billed to Adviser
and Affiliated Fund
Service Providers | |
December 31, 2019 | | $ | 0 | | | $ | 0 | | | $ | 0 | |
| | | | | | | | | | | | |
| | | | | | | | | | | | |
Percentage approved pursuant to
pre-approval exception | | | 0 | % | | | 0 | % | | | 0 | % |
| | | | | | | | | | | | |
| | | | | | | | | | | | |
December 31, 2018 | | $ | 0 | | | $ | 0 | | | $ | 0 | |
| | | | | | | | | | | | |
| | | | | | | | | | | | |
Percentage approved pursuant to
pre-approval exception | | | 0 | % | | | 0 | % | | | 0 | % |
| | | | | | | | | | | | |
NON-AUDIT SERVICES
The following table shows the amount of fees that KPMG LLP billed during the Fund’s last two full fiscal years for non-audit services. The Audit Committee is required to pre-approve non-audit services that KPMG LLP provides to the Adviser and any Affiliated Fund Services Provider, if the engagement related directly to the Fund’s operations and financial reporting (except for those subject to the pre-approval exception described above). The Audit Committee requested and received information from KPMG LLP about any non-audit services that KPMG LLP rendered during the Fund’s last fiscal year to the Adviser and any Affiliated Fund Service Provider. The Committee considered this information in evaluating KPMG LLP’s independence.
| | | | | | | | | | | | | | | | |
Fiscal Year Ended | | Total Non-Audit Fees
Billed to Fund | | | Total Non-Audit Fees
billed to Adviser and
Affiliated Fund Service
Providers (engagements
related directly to the
operations and financial
reporting of the Fund) | | | Total Non-Audit Fees
billed to Adviser and
Affiliated Fund Service
Providers (all other
engagements) | | | Total | |
December 31, 2019 | | $ | 0 | | | $ | 0 | | | $ | 0 | | | $ | 0 | |
December 31, 2018 | | $ | 0 | | | $ | 0 | | | $ | 0 | | | $ | 0 | |
“Non-Audit Fees billed to Fund” for both fiscal year ends represent “Tax Fees” and “All Other Fees” billed to Fund in their respective amounts from the previous table.
Less than 50 percent of the hours expended on the principal accountant’s engagement to audit the registrant’s financial statements for the most recent fiscal year were attributed to work performed by persons other than the principal accountant’s full-time, permanent employees.
Audit Committee Pre-Approval Policies and Procedures. Generally, the Audit Committee must approve (i) all non-audit services to be performed for the Fund by the Fund’s independent accountants and (ii) all audit and non-audit services to be performed by the Fund’s independent accountants for the Affiliated Fund Service Providers with respect to operations and financial reporting of the Fund. Regarding tax and research projects conducted by the independent accountants for the Fund and Affiliated Fund Service Providers (with respect to operations and financial reports of the Fund) such engagements will be (i) pre-approved by the Audit Committee if they are expected to be for amounts greater than $10,000; (ii) reported to the Audit Committee chair for her verbal approval prior to engagement if they are expected to be for amounts under $10,000 but greater than $5,000; and (iii) reported to the Audit Committee at the next Audit Committee meeting if they are expected to be for an amount under $5,000.
ITEM 5. AUDIT COMMITTEE OF LISTED REGISTRANTS.
The registrant’s Board has a separately designated Audit Committee established in accordance with Section 3(a)(58)(A) of the Securities Exchange Act of 1934, as amended (15 U.S.C. 78c(a)(58)(A)). As of the end of the period covered by this report, the members of the audit committee are Jack B. Evans, William C. Hunter, John K. Nelson, Judith M. Stockdale and Carole E. Stone, Chair.
ITEM 6. SCHEDULE OF INVESTMENTS.
(a) See Portfolio of Investments in Item 1.
(b) Not applicable.
ITEM 7. DISCLOSURE OF PROXY VOTING POLICIES AND PROCEDURES FOR CLOSED-END MANAGEMENT INVESTMENT COMPANIES.
Nuveen Fund Advisors, LLC is the registrant’s investment adviser (also referred to as the “Adviser”). The Adviser is responsible for the on-going monitoring of the Fund’s investment portfolio, managing the Fund’s business affairs and providing certain clerical, bookkeeping and administrative services. The Adviser has engaged Nuveen Asset Management, LLC (“Sub-Adviser”) as Sub-Adviser to provide discretionary investment advisory services. As part of these services, the Adviser has delegated to the Sub-Adviser the full responsibility for proxy voting on securities held in the registrant’s portfolio and related duties in accordance with the Sub-Adviser’s policies and procedures. The Adviser periodically monitors the Sub-Adviser’s voting to ensure that it is carrying out its duties. The Sub-Adviser’s proxy voting policies and procedures are attached to this filing as an exhibit.
ITEM 8. PORTFOLIO MANAGERS OFCLOSED-END MANAGEMENT INVESTMENT COMPANIES.
Nuveen Fund Advisors, LLC is the registrant’s investment adviser (also referred to as the “Adviser”). The Adviser is responsible for the selection andon-going monitoring of the Fund’s investment portfolio, managing the Fund’s business affairs and providing certain clerical, bookkeeping and administrative services. The Adviser has engaged Nuveen Asset Management, LLC (“Nuveen Asset Management” or“Sub-Adviser”) asSub-Adviser to provide discretionary investment advisory services. The following section provides information on the portfolio managers at theSub-Adviser:
Item 8(a)(1).PORTFOLIO MANAGER BIOGRAPHIES
As of the date of filing this report, the following individuals at theSub-Adviser have primary responsibility for theday-to-day implementation of the Fund’s investment strategy:
Michael Ainge, CFA, is a managing director and oversees the leveraged finance research for TIAA Investments. Michael is responsible for managing the organization’s global public fixed income leveraged finance credit research analysts. Additionally, he is responsible for covering the chemical, energy and utility sectors.
Previously, Michael served asco-head of structured product research. Prior to joining the leveraged finance team in 2000, he covered lease backed private placement securities and investment grade public corporate bonds in the consumer and industrial services, and aerospace and defense sectors. Michael joined TIAA Investments in 1998. He also worked at JP Morgan Investment Management and Segal Advisors as a performance analyst.
Kevin Lorenz, CFA, is a managing director and is a portfolio manager for Nuveen’s global fixed income team. He heads the leveraged finance sector team, which selects high yield and leveraged loan securities for all portfolios. He is also the lead portfolio manager for the High Yield strategies,co-manager of the Multi-Sector Bond strategy and a member of the Investment Committee, which establishes investment policy for all global fixed income products. Kevin has served in a variety of roles since joining the firm in 1987.
Anders Persson, CFA, oversees Nuveen’s global fixed income portfolio managers. His team supports sovereign, municipal, corporate credit and structured finance mandates. He is also a portfolio manager responsible for managing the organization’s leveraged loan portfolios. Prior to his current role, he was a senior research analyst for the leveraged finance team as an investment-grade research analyst. Prior to joining Nuveen/TIAA, he was a founding member of the team that established SG Cowen’s European high yield effort in London and later worked to establish the high yield research effort within Schroders Investment.
Item 8(a)(2).OTHER ACCOUNTS MANAGED BY PORTFOLIO MANAGERS
In addition to the Fund, as of December 31, 2019, the portfolio managers are also primarily responsible for theday-to-day portfolio management of the following accounts:
| | | | | | | | | | | | | | | | | | | | | | | | | | | | | | | | | | | | | | | | | | | | | | | | |
| | | (ii) Number of Other Accounts Managed and Assets by Account Type* | | | (iii) Number of Other Accounts and Assets for Which Advisory Fee is Performance-Based | |
(i) Name of Portfolio Manager | | Other
Registered
Investment
Companies | | | Other Pooled
Investment
Vehicles | | | Other
Accounts | | | Other
Registered
Investment
Companies | | | Other
Pooled
Investment
Vehicles | | | Other
Accounts | |
Michael Ainge | | | 3 | | | $ | 1.46 billion | | | | 0 | | | $ | 0 | | | | 0 | | | $ | 0 | | | | 0 | | | | 0 | | | | 0 | | | | 0 | | | | 0 | | | | 0 | |
Kevin Lorenz | | | 8 | | | $ | 11.29 billion | | | | 0 | | | $ | 0 | | | | 0 | | | $ | 0 | | | | 0 | | | | 0 | | | | 0 | | | | 0 | | | | 0 | | | | 0 | |
Anders Persson | | | 3 | | | $ | 1.46 billion | | | | 0 | | | $ | 0 | | | | 0 | | | $ | 0 | | | | 0 | | | | 0 | | | | 0 | | | | 0 | | | | 0 | | | | 0 | |
| * | Assets are as of December 31, 2019. |
POTENTIAL MATERIAL CONFLICTS OF INTEREST
Actual or apparent conflicts of interest may arise when a portfolio manager hasday-to-day management responsibilities with respect to more than one account. More specifically, portfolio managers who manage multiple accounts are presented a number of potential conflicts, including, among others, those discussed below.
The management of multiple accounts may result in a portfolio manager devoting unequal time and attention to the management of each account. Nuveen Asset Management seeks to manage such competing interests for the time and attention of portfolio managers by having portfolio managers focus on a particular investment discipline. Most accounts managed by a portfolio manager in a particular investment strategy are managed using the same investment models.
If a portfolio manager identifies a limited investment opportunity which may be suitable for more than one account, an account may not be able to take full advantage of that opportunity due to an allocation of filled purchase or sale orders across all eligible accounts. To deal with these situations, Nuveen Asset Management has adopted procedures for allocating limited opportunities across multiple accounts.
With respect to many of its clients’ accounts, Nuveen Asset Management determines which broker to use to execute transaction orders, consistent with its duty to seek best execution of the transaction. However, with respect to certain other accounts, Nuveen Asset Management may be limited by the client with respect to the selection of brokers or may be instructed to direct trades through a particular broker. In these cases, Nuveen Asset Management may place separate,non-simultaneous, transactions for a Fund and other accounts which may temporarily affect the market price of the security or the execution of the transaction, or both, to the detriment of the Fund or the other accounts.
Some clients are subject to different regulations. As a consequence of this difference in regulatory requirements, some clients may not be permitted to engage in all the investment
techniques or transactions or to engage in these transactions to the same extent as the other accounts managed by the portfolio manager. Finally, the appearance of a conflict of interest may arise where Nuveen Asset Management has an incentive, such as a performance-based management fee, which relates to the management of some accounts, with respect to which a portfolio manager hasday-to-day management responsibilities.
Conflicts of interest may also arise when theSub-Adviser invests one or more of its client accounts in different or multiple parts of the same issuer’s capital structure, including investments in public versus private securities, debt versus equity, or senior versus junior/subordinated debt, or otherwise where there are different or inconsistent rights or benefits. Decisions or actions such as investing, trading, proxy voting, exercising, waiving or amending rights or covenants, workout activity, or serving on a board, committee or other involvement in governance may result in conflicts of interest between clients holding different securities or investments. Generally, individual portfolio managers will seek to act in a manner that they believe serves the best interest of the accounts they manage. In cases where a portfolio manager or team faces a conflict among its client accounts, it will seek to act in a manner that it believes best reflects its overall fiduciary duty, which may result in relative advantages or disadvantages for particular accounts.
Nuveen Asset Management has adopted certain compliance procedures which are designed to address these types of conflicts common among investment managers. However, there is no guarantee that such procedures will detect each and every situation in which a conflict arises.
Item 8(a)(3).FUND MANAGER COMPENSATION
As of the most recently completed fiscal year end, the primary portfolio managers compensation is as follows:
Portfolio manager compensation consists primarily of base salary and variable components consisting of (i) a cash bonus; (ii) a long-term performance award; and (iii) participation in a profits interest plan.
Base salary. A portfolio manager’s base salary is determined based upon an analysis of the portfolio manager’s general performance, experience and market levels of base pay for such position.
Cash bonus. A portfolio manager is eligible to receive an annual cash bonus that is based on three variables: risk-adjusted investment performance relative to benchmark generally measured over the most recent three and five year periods (unless the portfolio manager’s tenure is shorter), ranking versus Morningstar peer funds generally measured over the most recent three and five year periods (unless the portfolio manager’s tenure is shorter), and management and peer reviews.
Long-term performance award. A portfolio manager is eligible to receive a long-term performance award that vests after three years. The amount of the award when granted is based on the same factors used in determining the cash bonus. The value of the award at the completion of the three-year vesting period is adjusted based on the risk-adjusted investment performance of Fund(s) managed by the portfolio manager during the vesting period and the performance of the TIAA organization as a whole.
Profits interest plan. Portfolio managers are eligible to receive profits interests in Nuveen Asset Management and its affiliate, Teachers Advisors, LLC, which vest over time and entitle their holders to a percentage of the firms’ annual profits. Profits interests are allocated to each portfolio manager based on such person’s overall contribution to the firms.
There are generally no differences between the methods used to determine compensation with respect to the Fund and the Other Accounts shown in the table above.
Item 8(a)(4). OWNERSHIP OF JHY SECURITIES AS OF DECEMBER 31, 2019
| | | | | | | | | | | | | | | | | | | | | | | | | | | | |
Name of Portfolio Manager | | None | | | $1 -
$10,000 | | | $10,001-
$50,000 | | | $50,001-
$100,000 | | | $100,001-
$500,000 | | | $500,001-
$1,000,000 | | | Over
$1,000,000 | |
Michael Ainge | | | X | | | | | | | | | | | | | | | | | | | | | | | | | |
Kevin Lorenz | | | X | | | | | | | | | | | | | | | | | | | | | | | | | |
Anders Persson | | | X | | | | | | | | | | | | | | | | | | | | | | | | | |
ITEM 9. PURCHASES OF EQUITY SECURITIES BY CLOSED-END MANAGEMENT INVESTMENT COMPANY AND AFFILIATED PURCHASERS.
Not applicable.
ITEM 10. SUBMISSION OF MATTERS TO A VOTE OF SECURITY HOLDERS.
There have been no material changes to the procedures by which shareholders may recommend nominees to the registrant’s Board implemented after the registrant last provided disclosure in response to this Item.
ITEM 11. CONTROLS AND PROCEDURES.
| | (a) | The registrant’s principal executive and principal financial officers, or persons performing similar functions, have concluded that the registrant’s disclosure controls and procedures (as defined in Rule 30a-3(c) under the Investment Company Act of 1940, as amended (the “1940 Act”) (17 CFR 270.30a-3(c))) are effective, as of a date within 90 days of the filing date of this report that includes the disclosure required by this paragraph, based on their evaluation of the controls and procedures required by Rule 30a-3(b) under the 1940 Act (17 CFR 270.30a-3(b)) and Rules 13a-15(b) or 15d-15 (b) under the Securities Exchange Act of 1934, as amended (the “Exchange Act”) (17 CFR 240.13a-15(b) or 240.15d-15 (b)). |
| | (b) | There were no changes in the registrant’s internal control over financial reporting (as defined in Rule 30a-3(d) under the 1940 Act (17 CFR 270.30a-3(d)) that occurred during the period covered by this report that has materially affected, or is reasonably likely to materially affect, the registrant’s internal control over financial reporting. |
ITEM 12. DISCLOSURE OF SECURITIES LENDING ACTIVITIES FOR CLOSED-END MANAGEMENT INVESTMENT COMPANIES.
Not applicable.
ITEM 13. EXHIBITS.
File the exhibits listed below as part of this Form.
(a)(1) Any code of ethics, or amendment thereto, that is the subject of the disclosure required by Item 2, to the extent that the registrant intends to satisfy the Item 2 requirements through filing of an exhibit: Not applicable because the code is posted on registrant’s website at www.nuveen.com/fund-governance and there were no amendments during the period covered by this report. (To view the code, click on Code of Conduct.)
(a)(2) A separate certification for each principal executive officer and principal financial officer of the registrant as required by Rule 30a-2(a) under the 1940 Act (17 CFR 270.30a-2(a)) in the exact form set forth below: Ex-99.CERT Attached hereto.
(a)(3) Any written solicitation to purchase securities under Rule 23c-1 under the 1940 Act (17 CFR 270.23c-1) sent or given during the period covered by the report by or on behalf of the registrant to 10 or more persons. Not applicable.
(a)(4) Change in registrant’s independent public accountant. Not applicable.
(b) If the report is filed under Section 13(a) or 15(d) of the Exchange Act, provide the certifications required by Rule 30a-2(b) under the 1940 Act (17 CFR 270.30a-2(b)); Rule 13a-14(b) or Rule 15d-14(b) under the Exchange Act (17 CFR 240.13a-14(b) or 240.15d-14(b)), and Section 1350 of Chapter 63 of Title 18 of the United States Code (18 U.S.C. 1350) as an exhibit. A certification furnished pursuant to this paragraph will not be deemed “filed” for purposes of Section 18 of the Exchange Act (15 U.S.C. 78r), or otherwise subject to the liability of that section. Such certification will not be deemed to be incorporated by reference into any filing under the Securities Act of 1933 or the Exchange Act, except to the extent that the registrant specifically incorporates it by reference. Ex-99.906 CERT attached hereto.
SIGNATURES
Pursuant to the requirements of the Securities Exchange Act of 1934 and the Investment Company Act of 1940, the registrant has duly caused this report to be signed on its behalf by the undersigned, thereunto duly authorized.
(Registrant) Nuveen High Income 2020 Target Term Fund
| | | | |
| By (Signature and Title) | | /s/ Gifford R. Zimmerman | | |
| | Gifford R. Zimmerman | | |
| | Vice President and Secretary | | |
| |
| Date: March 6, 2020 | | |
Pursuant to the requirements of the Securities Exchange Act of 1934 and the Investment Company Act of 1940, this report has been signed below by the following persons on behalf of the registrant and in the capacities and on the dates indicated.
| | | | |
| By (Signature and Title) | | /s/ Cedric H. Antosiewicz | | |
| | Cedric H. Antosiewicz | | |
| | Chief Administrative Officer | | |
| | (principal executive officer) | | |
| |
| Date: March 6, 2020 | | |
| | |
| By (Signature and Title) | | /s/ E. Scott Wickerham | | |
| | E. Scott Wickerham | | |
| | Vice President and Controller | | |
| | (principal financial officer) | | |
| |
| Date: March 6, 2020 | | |