SECURITIES AND EXCHANGE COMMISSION
WASHINGTON, D.C. 20549
FORM 6-K
REPORT OF FOREIGN PRIVATE ISSUER
Pursuant to Rule 13a-16 or 15d-16 under
the Securities Exchange Act of 1934
For the Month of May, 2017
Commission File Number: 001-37668
FERROGLOBE PLC
(Name of Registrant)
2nd Floor West Wing, Lansdowne House
57 Berkeley Square
London, W1J 6ER
(Address of Principal Executive Office)
Indicate by check mark whether the registrant files or will file annual reports under cover of Form 20-F or Form 40-F.
Form 20-F ☒ Form 40-F ☐
Indicate by check mark if the registrant is submitting the Form 6-K in paper as permitted by Regulation S-T Rule 101(b)(1): ☐
Indicate by check mark if the registrant is submitting the Form 6-K in paper as permitted by Regulation S-T Rule 101(b)(7): ☐
Indicate by check mark whether by furnishing the information contained in this Form, the registrant is also thereby furnishing the information to the Commission pursuant to Rule 12g3-2(b) under the Securities Exchange Act of 1934.
Yes ☐ No ☒
If “Yes” is marked, indicate below the file number assigned to the registrant in connection with Rule 12g3-2(b): N/A
This Form 6-K consists of the press release dated May 21, 2017, which appears immediately following this page.
Ferroglobe Reports Results for First Quarter 2017
| · | Q1 2017 revenue of $388.2 million, flat compared to $386.8 million in Q4 2016 | |
| · | Q1 2017 net loss of $(8.1) million, or $(0.04) on a fully diluted per share basis, up from $(246.3) million, or $(1.41) on a fully diluted per share basis, in the prior quarter | |
| · | Q1 2017 EBITDA1 of $26.6 million, which excludes the non-core Energy division that has been classified as “held for sale”. Q1 EBITDA is up 257% compared to $7.5 million adjusted EBITDA in the previous quarter | |
| · | Continued to reduce working capital, with $18 million achieved in Q1 2017 and $201 million since the closing of the business combination in December 2015 | |
| · | Maintained strong balance sheet with Q1 2017 net debt of $407 million compared to $405 in Q4 2016 |
LONDON, May 21, 2017 – Ferroglobe PLC (NASDAQ: GSM), the world’s leading producer of silicon metal, and a leading silicon- and manganese-based specialty alloys producer, announced today results for the first quarter of 2017.
Of note, the company’s non-core Energy division has been classified as “held for sale,” and its results are consolidated only at the net income level.2 There are no “non-recurring” items that require adjustments to net income or EBITDA for Q1 2017.
In Q1 2017, Ferroglobe posted a net loss of $(8.1) million, or $(0.04) per share on a fully diluted basis. Ferroglobe’s EBITDA of $26.6 million for Q1 2017, excluding the non-core Energy division, represents an increase of 257% compared to adjusted EBITDA of $7.5 million in Q4 2016. While this represents Ferroglobe’s strongest quarterly EBITDA performance in the last twelve months, the company is confident that improving prices and a continued reduction in operating costs will help ensure a return to Ferroglobe’s historic margins and performance. The company reported EBITDA margins of 6.8% for Q1 2017, compared to adjusted EBITDA margins of 1.9% for Q4 2016. If the non-core Energy division were to be included, EBITDA would have been $6.6 million in Q4 2016 and $30.9 million in Q1 2017.
Net sales in Q1 2017 totaled $388.2 million, flat from $386.8 million in Q4 2016. Selling prices for Ferroglobe’s key products continued to improve over the course of the quarter across both the U.S. and Europe:
| · | The average selling price for manganese alloys increased as much as 46% from Q4 2016. Taking into account the increase in manganese ore prices, the spread (average selling price of manganese alloys minus cost of manganese ore to produce those alloys) increased by 25% over that same period. | |
| · | The average selling price for silicon-based alloys increased 10% from Q4 2016. | |
| · | The average selling price for silicon metal remained flat from Q4 2016. A now-resolved strike at a large customer and rollover of below-market contract prices from Q4 2016 negatively impacted average selling prices in the quarter. Market prices have increased in North America, and the company is now starting to benefit from this improvement. | |
| · | We continue to realize average sales prices greater than index prices. |
In terms of sales volumes, silicon metal experienced an 8% decrease quarter-over-quarter, silicon alloys experienced a 4% decrease quarter-over-quarter, and manganese alloys experienced a 17% decrease quarter-over-quarter. Silicon metal sales volumes were affected by the aforementioned strike at a key customer’s facility, which has now been resolved. In order to preserve margins in manganese alloys, the company reduced production in response to a significant increase in the cost of manganese
1 In Q1 2017 reported and adjusted EBITDA are equal, given that there are no “non-recurring” items that require adjustments to net income or EBITDA.
2 Operating results exclude this division both for Q1 2017 and for any other comparable period.
1
ore at the end of 2016, which negatively impacted manganese alloy volumes in Q1 2017. These conditions were temporary and volume trends are expected to normalize in Q2 2017.
| Quarter Ended March 31, 2017 | Quarter Ended December 31, 2016 | Quarter Ended March 31, 2016 | Year Ended December 31, 2016 | |||||||||||||
| Shipments in metric tons: | ||||||||||||||||
| Silicon Metal | 75,753 | 82,372 | 90,105 | 341,388 | ||||||||||||
| Silicon Alloys | 75,386 | 78,698 | 73,473 | 297,669 | ||||||||||||
| Manganese Alloys | 63,700 | 76,445 | 63,575 | 270,430 | ||||||||||||
| Total shipments* | 214,839 | 237,515 | 227,153 | 909,487 | ||||||||||||
| Quarter Ended March 31, 2017 | Quarter Ended December 31, 2016 | Quarter Ended March 31, 2016 | Year Ended December 31, 2016 | |||||||||||||
| Average selling price ($/MT): | ||||||||||||||||
| Silicon Metal | $ | 2,080 | $ | 2,080 | $ | 2,387 | $ | 2,201 | ||||||||
| Silicon Alloys | $ | 1,473 | $ | 1,340 | $ | 1,433 | $ | 1,400 | ||||||||
| Manganese Alloys | $ | 1,298 | $ | 890 | $ | 764 | $ | 826 | ||||||||
| Total* | $ | 1,635 | $ | 1,452 | $ | 1,624 | $ | 1,530 | ||||||||
| Quarter Ended March 31, 2017 | Quarter Ended December 31, 2016 | Quarter Ended March 31, 2016 | Year Ended December 31, 2016 | |||||||||||||
| Average selling price ($/lb.): | ||||||||||||||||
| Silicon Metal | $ | 0.94 | $ | 0.94 | $ | 1.08 | $ | 1.00 | ||||||||
| Silicon Alloys | $ | 0.67 | $ | 0.61 | $ | 0.65 | $ | 0.64 | ||||||||
| Manganese Alloys | $ | 0.59 | $ | 0.40 | $ | 0.35 | $ | 0.37 | ||||||||
| Total* | $ | 0.74 | $ | 0.66 | $ | 0.74 | $ | 0.69 | ||||||||
| * Excludes by-products and other | ||||||||||||||||
“Ferroglobe experienced an improved start to the year, achieving EBITDA almost four times greater than the prior quarter. Despite a decrease in our shipments, the significant margin improvement reflects solid demand across end markets and a continued improvement in the overall pricing environment,” said CEO Pedro Larrea. “We are confident in the actions we took during the market downturn over the few past quarters: we moved aggressively to manage our cost structure and actively identified markets and products that were experiencing an improved supply and demand environment. This, combined with our strong diversified portfolio, enabled us to capture the benefits of these improving trends. We are still in a recovery period from the bottom of the cycle, but are confident that we have passed the inflection point and optimistic about the remainder of 2017 and beyond. Moving forward, we will remain focused on improving our volumes and margins.”
Continued focus on liquidity and cash-flow generation
Ferroglobe generated operating cash flows of $1.2 million in Q1 2017.3 Part of the operating cash flow comes from working capital improvements of $18 million during Q1 2017, which implies a total working capital reduction of more than $200 million since December 2015, more than double the initial target. Ferroglobe’s net debt was $407 million at the end of Q1 2017, compared to $405 million at the end of Q4 2016, despite a one-time disbursement of $24 million for an exceptional severance payment.
3 Operating cash flow and free cash flow include $(24) million of cash outflow for the actual disbursement of the severance payment occasioned by the departure of the company’s Executive Chairman in December 2016.
2
“We remain committed to generating cash flow and ensuring strict control in our operations. This financial discipline has allowed us to continue improving working capital in the beginning of this recovery period and to keep net debt constant, despite extraordinary cash outflows,” said CFO Joe Ragan.
Adjusted EBITDA:
| Quarter Ended March 31, 2017 | Quarter Ended December 31, 2016 | Quarter Ended March 31, 2016 | Year Ended December 31, 2016 | |||||||||||||
| Loss attributable to the parent | $ | (6,554 | ) | (241,964 | ) | (25,699 | ) | (338,427 | ) | |||||||
| Loss attributable to non-controlling interest | (1,561 | ) | (4,350 | ) | (6,211 | ) | (20,186 | ) | ||||||||
| (Profit) loss from discontinued operations | (2,494 | ) | 2,095 | (338 | ) | 3,065 | ||||||||||
| Income tax (benefit) expense | (2,167 | ) | (7,816 | ) | 455 | (46,609 | ) | |||||||||
| Net finance expense | 12,124 | 6,507 | 5,287 | 23,051 | ||||||||||||
| Exchange differences | 20 | 628 | 1,727 | 3,513 | ||||||||||||
| Depreciation and amortization charges, operating allowances and write-downs | 27,219 | 27,007 | 41,778 | 121,346 | ||||||||||||
| EBITDA | 26,587 | (217,893 | ) | 16,999 | (254,247 | ) | ||||||||||
| Transaction and due diligence expenses | - | - | 2,641 | 7,979 | ||||||||||||
| Impairment loss | - | 199,834 | - | 267,449 | ||||||||||||
| Globe purchase price allocation adjustments | - | - | 10,022 | 10,022 | ||||||||||||
| Business interruption | - | - | - | 2,532 | ||||||||||||
| Inventory impairment | - | 1,080 | - | 5,410 | ||||||||||||
| Executive severance | - | 24,430 | - | 24,430 | ||||||||||||
| Adjusted EBITDA, excluding above items | $ | 26,587 | 7,451 | 29,662 | 63,575 | |||||||||||
Adjusted diluted loss per share:
| Quarter Ended March 31, 2017 | Quarter Ended December 31, 2016 | Quarter Ended March 31, 2016 | Year Ended December 31, 2016 | |||||||||||||
| Diluted loss per ordinary share | (0.04 | ) | (1.41 | ) | (0.15 | ) | (1.97 | ) | ||||||||
| Tax rate adjustment | 0.01 | 0.42 | 0.06 | 0.48 | ||||||||||||
| Transaction and due diligence expenses | - | - | 0.01 | 0.03 | ||||||||||||
| Impairment loss | - | 0.79 | - | 1.06 | ||||||||||||
| Globe purchase price allocation adjustments | - | - | 0.04 | 0.04 | ||||||||||||
| Business interruption | - | - | - | 0.01 | ||||||||||||
| Inventory impairment | - | - | - | 0.02 | ||||||||||||
| Executive severance | - | 0.10 | - | 0.10 | ||||||||||||
| Adjusted diluted loss per ordinary share | (0.03 | ) | (0.10 | ) | (0.04 | ) | (0.23 | ) | ||||||||
Adjusted net loss attributable to Ferroglobe:
| Quarter Ended March 31, 2017 | Quarter Ended December 31, 2016 | Quarter Ended March 31, 2016 | Year Ended December 31, 2016 | |||||||||||||
| Loss attributable to the parent | $ | (6,554 | ) | (241,964 | ) | (25,699 | ) | (338,427 | ) | |||||||
| Tax rate adjustment | 1,921 | 72,835 | 10,629 | 82,081 | ||||||||||||
| Transaction and due diligence expenses | - | - | 1,796 | 5,426 | ||||||||||||
| Impairment loss | - | 135,887 | - | 181,865 | ||||||||||||
| Globe purchase price allocation adjustments | - | - | 6,815 | 6,815 | ||||||||||||
| Business interruption | - | - | - | 1,722 | ||||||||||||
| Inventory impairment | - | 734 | - | 3,679 | ||||||||||||
| Executive severance | - | 16,612 | - | 16,612 | ||||||||||||
| Adjusted loss attributable to the parent | $ | (4,633 | ) | (15,896 | ) | (6,459 | ) | (40,227 | ) | |||||||
Recent developments
As previously disclosed, on February 1, 2017, the company announced that it entered into a definitive agreement to sell the hydro-electric operations of its non-core Energy division in Spain for estimated gross cash proceeds of €255 million. The company made progress during Q1 2017 to gain further support, and during the month of May has filed all the formal requests with the relevant governmental authorities in order to obtain the necessary regulatory approvals.
Regarding the ongoing trade cases Ferroglobe filed in Canada and the U.S., the respective government agencies have decided to move forward with their investigations, as a result of favorable first milestones:
| ● | On May 16, 2017, the CBSA exercised an extension for 45 days to complete its review for this phase of the investigation. The preliminary determinations for anti-dumping and countervailing duties will now take effect on or around July 5, 2017. | |
| ● | The company expects that the U.S. Department of Commerce will make preliminary determinations on countervailing duties in the third quarter, and on anti-dumping duties early in the fourth quarter of 2017. |
3
Both timelines are subject to change as the respective agencies continue their investigations.
Conference Call
Ferroglobe will review the results for the first quarter of 2017 results during a conference call at 9:00 a.m. Eastern Time on May 22, 2017. The dial-in number for the call for participants in the United States is 877-293-5491 (conference ID 23656251). International callers should dial 914-495-8526 (conference ID 23656251). Please dial in at least five minutes prior to the call to register. The call may also be accessed via an audio webcast available at http://edge.media-server.com/m/p/bg28ifsu
About Ferroglobe
Ferroglobe PLC is one of the world’s leading suppliers of silicon metal, silicon-based specialty alloys, and ferroalloys serving a customer base across the globe in dynamic and fast-growing end markets, such as solar, automotive, consumer products, construction and energy. The company is based in London. For more information, visit http://investor.ferroglobe.com.
Forward-Looking Statements
This release contains “forward-looking statements” within the meaning of Section 27A of the United States Securities Act of 1933, as amended, and Section 21E of the United States Securities Exchange Act of 1934, as amended. Forward-looking statements are not historical facts but are based on certain assumptions of management and describe the company’s future plans, strategies and expectations. Forward-looking statements generally can be identified by the use of forward-looking terminology, including, but not limited to, “may,” “could,” “seek,” “guidance,” “predicts,” “potential,” “likely,” “believe,” “will,” “expect,” “anticipate," “estimate,” “plan,” “intends” or “forecast,” variations of these terms and similar expressions, or the negative of these terms or similar expressions.
Forward-looking statements contained in this press release are based on information presently available to the company and assumptions that we believe to be reasonable, but are inherently uncertain. As a result, Ferroglobe’s actual results, performance or achievements may differ materially from those expressed or implied by these forward-looking statements, which are not guarantees of future performance and involve known and unknown risks, uncertainties and other factors that are, in some cases, beyond the company’s control.
You are cautioned that all such statements involve risks and uncertainties, including, without limitation, risks that the legacy businesses of Globe and FerroAtlántica will not be integrated successfully or that we will not realize estimated cost savings, value of certain tax assets, synergies and growth, or that such benefits may take longer to realize than expected. Important factors that may cause actual results to differ include, but are not limited to: (i) risks relating to unanticipated costs of integration, including operating costs, customer loss and business disruption being greater than expected; (ii) Ferroglobe’s organizational and governance structure; (iii) the ability to hire and retain key personnel; (iv) regional, national or global political, economic, business, competitive, market and regulatory conditions including, among others, changes in metals prices; (v) increases in the cost of raw materials or energy; (vi) competition in the metals and foundry industries; (vii) environmental and regulatory risks; (viii) ability to identify liabilities associated with acquired properties prior to their acquisition; (ix) ability to manage price and operational risks including industrial accidents and natural disasters; (x) ability to manage foreign operations; (xi) changes in technology; (xii) ability to acquire or renew permits and approvals; (xiii) changes in legislation or governmental regulations affecting Ferroglobe; (xiv) conditions in the credit markets; (xv) risks associated with assumptions made in connection with critical accounting estimates and legal proceedings; (xvi) Ferroglobe’s international operations, which are subject to the risks of currency fluctuations and foreign exchange controls; and (xvii) the potential for international unrest, economic downturn or effects of currencies, tax assessments, tax adjustments, anticipated tax rates, raw material costs or availability or other regulatory compliance costs. The foregoing list is not exhaustive. You should carefully consider the foregoing factors and the other risks and uncertainties that affect our business, including those described in the “Risk Factors” section of our Annual Reports on Form 20-F, Current Reports on Form 6-K and other documents we file from time to time with the United States Securities and Exchange Commission. Ferroglobe does not give any assurance (1) that the company will achieve its expectations or (2) concerning any result or the timing thereof, in each case, with respect to any regulatory action, administrative proceedings, government investigations, litigation, warning letters, consent decree, cost reductions, business strategies, earnings or revenue trends or future financial results. Forward-looking financial information and other metrics presented herein represent the company’s goals and are not intended as guidance or projections for the periods presented herein or any future periods.
4
All information in this press release is as of the date of its release. Ferroglobe does not undertake or assume any obligation to update publicly any of the forward-looking statements in this press release to reflect actual results, new information or future events, changes in assumptions or changes in other factors affecting forward-looking statements. If the company updates one or more forward-looking statements, no inference should be drawn that it will make additional updates with respect to those or other forward-looking statements. The company cautions you not to place undue reliance on any forward-looking statements, which are made only as of the date of this press release.
Non-GAAP Measures
EBITDA, adjusted EBITDA, adjusted loss attributable to the Ferroglobe parent entity and adjusted diluted loss per ordinary share are pertinent non-GAAP financial metrics that Ferroglobe utilizes to measure its success.
Ferroglobe has included these financial metrics to provide supplemental measures of its performance. The company believes these metrics are important because they eliminate items that have less bearing on the company’s current and future operating performance and highlight trends in its core business that may not otherwise be apparent when relying solely on U.S. GAAP financial measures. Reconciliations of these measures to the comparable U.S. GAAP financial measures are provided above and in the attached financial statements.
* * *
INVESTOR CONTACT:
Ferroglobe PLC
Joe Ragan, US: +1 917 2098581, UK: +44 (0) 7827 227 688
Chief Financial Officer
Email: jragan@ferroglobe.com
5
Ferroglobe PLC and Subsidiaries
Unaudited Condensed Consolidated Income Statement
(in thousands of U.S. dollars, except per share amounts)
| Quarter Ended March 31, 2017 | Quarter Ended December 31, 2016 | Quarter Ended March 31, 2016 | Year Ended December 31, 2016 | |||||||||||||
| Sales | $ | 388,241 | $ | 386,833 | $ | 415,544 | $ | 1,555,657 | ||||||||
| Cost of sales | (241,074 | ) | (272,141 | ) | (281,479 | ) | (1,043,000 | ) | ||||||||
| Other operating income | 1,583 | 15,079 | 2,220 | 25,712 | ||||||||||||
| Staff costs | (65,818 | ) | (88,780 | ) | (66,368 | ) | (293,032 | ) | ||||||||
| Other operating expense | (57,309 | ) | (61,566 | ) | (52,281 | ) | (234,326 | ) | ||||||||
| Depreciation and amortization charges, operating allowances and write-downs | (27,219 | ) | (27,007 | ) | (41,778 | ) | (121,346 | ) | ||||||||
| Impairment losses | - | (199,834 | ) | - | (267,449 | ) | ||||||||||
| Other gain (loss) | 964 | 2,516 | (637 | ) | 2,191 | |||||||||||
| Operating loss | (632 | ) | (244,900 | ) | (24,779 | ) | (375,593 | ) | ||||||||
| Finance income | 377 | 321 | 243 | 1,534 | ||||||||||||
| Finance expense | (12,501 | ) | (6,828 | ) | (5,530 | ) | (24,585 | ) | ||||||||
| Exchange differences | (20 | ) | (628 | ) | (1,727 | ) | (3,513 | ) | ||||||||
| Loss before tax | (12,776 | ) | (252,035 | ) | (31,793 | ) | (402,157 | ) | ||||||||
| Income tax benefit (expense) | 2,167 | 7,816 | (455 | ) | 46,609 | |||||||||||
| Loss for the period from continuing operations | (10,609 | ) | (244,219 | ) | (32,248 | ) | (355,548 | ) | ||||||||
| Profit (loss) from discontinued operations | 2,494 | (2,095 | ) | 338 | (3,065 | ) | ||||||||||
| Loss for the period | (8,115 | ) | (246,314 | ) | (31,910 | ) | (358,613 | ) | ||||||||
| Loss attributable to non-controlling interest | 1,561 | 4,350 | 6,211 | 20,186 | ||||||||||||
| Loss attributable to the parent | $ | (6,554 | ) | $ | (241,964 | ) | $ | (25,699 | ) | $ | (338,427 | ) | ||||
| EBITDA | 26,587 | (217,893 | ) | 16,999 | (254,247 | ) | ||||||||||
| Adjusted EBITDA | 26,587 | 7,451 | 29,662 | 63,575 | ||||||||||||
| Weighted average shares outstanding | ||||||||||||||||
| Basic | 171,838 | 171,838 | 171,838 | 171,838 | ||||||||||||
| Diluted | 171,838 | 171,838 | 171,838 | 171,838 | ||||||||||||
| Loss per ordinary share | ||||||||||||||||
| Basic | (0.04 | ) | (1.41 | ) | (0.15 | ) | (1.97 | ) | ||||||||
| Diluted | (0.04 | ) | (1.41 | ) | (0.15 | ) | (1.97 | ) | ||||||||
6
Ferroglobe PLC and Subsidiaries
Unaudited Condensed Consolidated Statement of Financial Position
(in thousands of U.S. dollars)
| March 31, | December 31, | |||||||
| 2017 | 2016 | |||||||
| ASSETS | ||||||||
| Non-current assets | ||||||||
| Goodwill | $ | 230,733 | 230,210 | |||||
| Other intangible assets | 56,854 | 62,839 | ||||||
| Property, plant and equipment | 790,501 | 781,606 | ||||||
| Non-current financial assets | 5,967 | 5,823 | ||||||
| Non-current financial assets from related parties | - | 9,845 | ||||||
| Deferred tax assets | 47,768 | 44,950 | ||||||
| Non-current receivables from related parties | 2,139 | 2,108 | ||||||
| Other non-current assets | 20,892 | 20,245 | ||||||
| Total non-current assets | 1,154,854 | 1,157,626 | ||||||
| Current assets | ||||||||
| Inventories | 312,757 | 316,702 | ||||||
| Trade and other receivables | 214,738 | 209,406 | ||||||
| Current receivables from related parties | 5,576 | 11,971 | ||||||
| Current income tax assets | 16,614 | 19,869 | ||||||
| Current financial assets | 3,640 | 4,049 | ||||||
| Other current assets | 10,703 | 9,810 | ||||||
| Cash and cash equivalents | 172,647 | 196,931 | ||||||
| Assets and disposal groups classified as held for sale | 120,094 | 92,937 | ||||||
| Total current assets | 856,769 | 861,675 | ||||||
| Total assets | $ | 2,011,623 | 2,019,301 | |||||
| EQUITY AND LIABILITIES | ||||||||
| Equity | $ | 902,872 | 892,042 | |||||
| Non-current liabilities | ||||||||
| Deferred income | 3,656 | 3,949 | ||||||
| Provisions | 83,993 | 81,957 | ||||||
| Bank borrowings | 78,123 | 179,473 | ||||||
| Obligations under finance leases | 1,906 | 3,385 | ||||||
| Debt instruments | 339,693 | - | ||||||
| Other financial liabilities | 86,962 | 86,467 | ||||||
| Other non-current liabilities | 2,317 | 5,737 | ||||||
| Deferred tax liabilities | 132,753 | 139,535 | ||||||
| Total non-current liabilities | 729,403 | 500,503 | ||||||
| Current liabilities | ||||||||
| Provisions | 11,915 | 19,627 | ||||||
| Bank borrowings | 1,545 | 241,818 | ||||||
| Obligations under finance leases | 586 | 1,852 | ||||||
| Debt instruments | 4,156 | - | ||||||
| Other financial liabilities | 1,616 | 1,592 | ||||||
| Payables to related parties | 10,283 | 30,738 | ||||||
| Trade and other payables | 177,015 | 157,706 | ||||||
| Current income tax liabilities | 3,616 | 961 | ||||||
| Other current liabilities | 63,346 | 64,780 | ||||||
| Liabilities associated with assets classified as held for sale | 105,270 | 107,682 | ||||||
| Total current liabilities | 379,348 | 626,756 | ||||||
| Total equity and liabilities | $ | 2,011,623 | 2,019,301 | |||||
7
Ferroglobe PLC and Subsidiaries
Unaudited Condensed Consolidated Statement of Cash Flows
(in thousands of U.S. dollars)
| Quarter Ended March 31, 2017 | Quarter Ended December 31, 2016 | Quarter Ended March 31, 2016 | Year Ended December 31, 2016 | |||||||||||||
| CASH FLOWS FROM OPERATING ACTIVITIES: | ||||||||||||||||
| Loss for the period | $ | (8,115 | ) | $ | (246,314 | ) | $ | (31,910 | ) | (358,613 | ) | |||||
| Adjustments to reconcile net loss to net cash provided by operating activities: | ||||||||||||||||
| Income tax benefit | (1,214 | ) | (8,276 | ) | 777 | (46,695 | ) | |||||||||
| Depreciation and amortization charges, operating allowances and write-downs | 27,222 | 27,705 | 42,998 | 125,677 | ||||||||||||
| Finance income | (795 | ) | (321 | ) | (243 | ) | (1,554 | ) | ||||||||
| Finance expense | 13,765 | 7,820 | 7,858 | 30,269 | ||||||||||||
| Exchange differences | 20 | 633 | 1,728 | 3,513 | ||||||||||||
| Impairment losses | - | 200,458 | - | 268,089 | ||||||||||||
| Loss on disposals of non-current and financial assets | (558 | ) | (748 | ) | (51 | ) | (340 | ) | ||||||||
| Other adjustments | (406 | ) | (6,099 | ) | 688 | (1,851 | ) | |||||||||
| Changes in operating assets and liabilities | ||||||||||||||||
| Decrease in inventories | 7,108 | 48,376 | 43,349 | 108,207 | ||||||||||||
| Decrease (increase) in trade receivables | 3,765 | (15,486 | ) | 25,797 | 56,297 | |||||||||||
| Increase in trade payables | 17,085 | 27,479 | 1,910 | 28,572 | ||||||||||||
| Other* | (38,213 | ) | 9,500 | (42,851 | ) | (50,001 | ) | |||||||||
| Income taxes (paid) received | (1,825 | ) | 9,255 | (12,774 | ) | (10,933 | ) | |||||||||
| Interest paid | (16,651 | ) | (9,162 | ) | (7,702 | ) | (29,468 | ) | ||||||||
| Net cash provided by operating activities | 1,188 | 44,820 | 29,574 | 121,169 | ||||||||||||
| CASH FLOWS FROM INVESTING ACTIVITIES: | ||||||||||||||||
| Payments due to investments: | ||||||||||||||||
| Other intangible assets | (410 | ) | (2,371 | ) | (436 | ) | (4,914 | ) | ||||||||
| Property, plant and equipment | (12,362 | ) | (17,830 | ) | (26,808 | ) | (71,119 | ) | ||||||||
| Non-current financial assets | (14 | ) | (9,123 | ) | - | (9,807 | ) | |||||||||
| Current financial assets | - | 9,825 | (53 | ) | (105 | ) | ||||||||||
| Disposals: | ||||||||||||||||
| Intangible assets | - | - | 30 | - | ||||||||||||
| Property, plant and equipment | - | - | 104 | - | ||||||||||||
| Non-current financial assets | - | - | - | 11 | ||||||||||||
| Current financial assets | - | 99 | - | 99 | ||||||||||||
| Interest received | 1,005 | (483 | ) | 243 | 1,554 | |||||||||||
| Net cash used by investing activities | (11,781 | ) | (19,883 | ) | (26,920 | ) | (84,281 | ) | ||||||||
| CASH FLOWS FROM FINANCING ACTIVITIES: | ||||||||||||||||
| Dividends paid | - | (13,745 | ) | (13,747 | ) | (54,988 | ) | |||||||||
| Increase/(decrease) in bank borrowings: | ||||||||||||||||
| Borrowings | 31,425 | 19,053 | 56,991 | 124,384 | ||||||||||||
| Payments | (172,380 | ) | (23,539 | ) | (49,698 | ) | (81,237 | ) | ||||||||
| Other amounts paid due to financing activities | 144,111 | 70,071 | (712 | ) | 61,758 | |||||||||||
| Net cash provided (used) by financing activities | 3,156 | 51,840 | (7,166 | ) | 49,917 | |||||||||||
| TOTAL NET CASH FLOWS FOR THE PERIOD | (7,437 | ) | 76,777 | (4,512 | ) | 86,805 | ||||||||||
| Beginning balance of cash and cash equivalents | 196,982 | 119,166 | 116,666 | 116,666 | ||||||||||||
| Exchange differences on cash and cash equivalents in foreign currencies | 3,486 | 1,039 | 1,865 | (6,489 | ) | |||||||||||
| Ending balance of cash and cash equivalents | $ | 193,031 | $ | 196,982 | $ | 114,019 | 196,982 | |||||||||
| * Includes the cash outflow impact of the $32.5M shareholder settlement during the quarter ended March 31, 2016. | ||||||||||||||||
8
SIGNATURES
Pursuant to the requirements of the Securities Exchange Act of 1934, the registrant has duly caused this report to be signed on its behalf by the undersigned, thereunto duly authorized.
| Date: May 21, 2017 | |||
| FERROGLOBE PLC | |||
| By: | /s/ Nick Deeming | ||
| Name: Nick Deeming | |||
| Title: Corporate Secretary | |||
9

Advancing Materials Innovation NASDAQ: GSM First Quarter 2017

Forward-Looking Statement This presentation contains forward-looking statements within the meaning of Section 27A of the United States Securities Act of 1933, as amended, and Section 21E of the United States Securities Exchange Act of 1934, as amended. Forward-looking statements are not historical facts but are based on certain assumptions of management and describe our future plans, strategies and expectations. Forward-looking statements can generally be identified by the use of forward-looking terminology, including, but not limited to, "may," “could,” “seek,” “guidance,” “predict,” “potential,” “likely,” "believe," "will," "expect," "anticipate," "estimate," "plan," "intend," "forecast," or variations of these terms and similar expressions, or the negative of these terms or similar expressions. Forward-looking statements contained in this presentation are based on information presently available to us and assumptions that we believe to be reasonable, but are inherently uncertain. As a result, our actual results, performance or achievements may differ materially from those expressed or implied by these forward-looking statements, which are not guarantees of future performance and involve known and unknown risks, uncertainties and other factors that are, in some cases, beyond our control. You are cautioned that all such statements involve risks and uncertainties, including without limitation, risks that the businesses of Globe Specialty Metals Inc. and Grupo FerroAtlántica (together, “we,” “us,” “Ferroglobe,” the “Company”) will not be integrated successfully or that we will not realize estimated cost savings, value of certain tax assets, synergies and growth, or that such benefits may take longer to realize than expected. Important factors that may cause actual results to differ include, but are limited to: (i) risks relating to unanticipated costs of integration, including operating costs, customer loss and business disruption being greater than expected; (ii) our organizational and governance structure; (iii) the ability to hire and retain key personnel; (iv) regional, national or global political, economic, business, competitive, market and regulatory conditions including, among others, changes in metals prices; (v) increases in the cost of raw materials or energy; (vi) competition in the metals and foundry industries; (vii) environmental and regulatory risks; (viii) ability to identify liabilities associated with acquired properties prior to their acquisition; (ix) ability to manage price and operational risks including industrial accidents and natural disasters; (x) ability to manage foreign operations; (xi) changes in technology; (xii) ability to acquire or renew permits and approvals; (xiii) changes in legislation or governmental regulations affecting Ferroglobe; (xiv) conditions in the credit markets; (xv) risks associated with assumptions made in connection with critical accounting estimates and legal proceedings; (xvi) Ferroglobe's international operations, which are subject to the risks of currency fluctuations and foreign exchange controls; and (xvii) the potential of international unrest, economic downturn or effects of currencies, tax assessments, tax adjustments, anticipated tax rates, raw material costs or availability or other regulatory compliance costs. The foregoing list is not exhaustive. You should carefully consider the foregoing factors and the other risks and uncertainties that affect our business, including those described in the “Risk Factors” section of our Registration Statement on Form F-1, Annual Reports on Form 20-F, Current Reports on Form 6-K and other documents we file from time to time with the United States Securities and Exchange Commission. We do not give any assurance (1) that we will achieve our expectations or (2) concerning any result or the timing thereof, in each case, with respect to any regulatory action, administrative proceedings, government investigations, litigation, warning letters, consent decree, cost reductions, business strategies, earnings or revenue trends or future financial results. Forward- looking financial information and other metrics presented herein represent our key goals and are not intended as guidance or projections for the periods presented herein or any future periods. We do not undertake or assume any obligation to update publicly any of the forward- looking statements in this presentation to reflect actual results, new information or future events, changes in assumptions or changes in other factors affecting forward-looking statements. If we update one or more forward-looking statements, no inference should be drawn that we will make additional updates with respect to those or other forward-looking statements. We caution you not to place undue reliance on any forward-looking statements, which are made only as of the date of this presentation.
Table of Contents 1Q-2017 OverviewSelected Financial Highlights

Q1 Overview Pedro Larrea, Chief Executive Officer

First quarter of 2017 confirms expectations Actions taken delivering results Marketing focusFinancial disciplineProduction allocationSynergies Improving price environment & decisive market leadership (ASP increase vs Q4 2016)Mn alloys +46%Si alloys +10%SiM flat Leveraging diversified product and market portfolio Remarkable Mn alloys performanceIdentifying tight markets … EBITDA + 257% vs Q4 2016 EBITDA margin x3.6 Working capital reduction Net debt stable

Source: Company information Antidumping and Countervailing Duties Sale of Spanish Hydro-Electric Assets Internal control Update on corporate matters Favorable first milestones from both the U.S. and Canada cases. Respective government agencies have decided to move forward with their investigations Impact on market prices pending final determination Progress made during the quarter to gain further support Filed all necessary requests with relevant government bodiesStarted the required internal administrative procedures (i.e., corporate restructuring) Audit process has revealed material weaknesses in internal control proceduresRemediation is taking place with decisive action from management

Diversified product portfolio maximizes impact of recovery Silicon-BasedAlloys30% Mn-Based Alloys21% Other8% Aluminum Silicones Solar Foundry Specialty Steel Steel Qtr / Qtr Revenue Growth by Product Other Source: Company informationEnd market data reflects 2016 sales 2 Business benefits from a diversified portfolio, with various products at different stages of the recovery cycle Revenue Contribution by Product and Market (1Q-17) 5% 21% 1
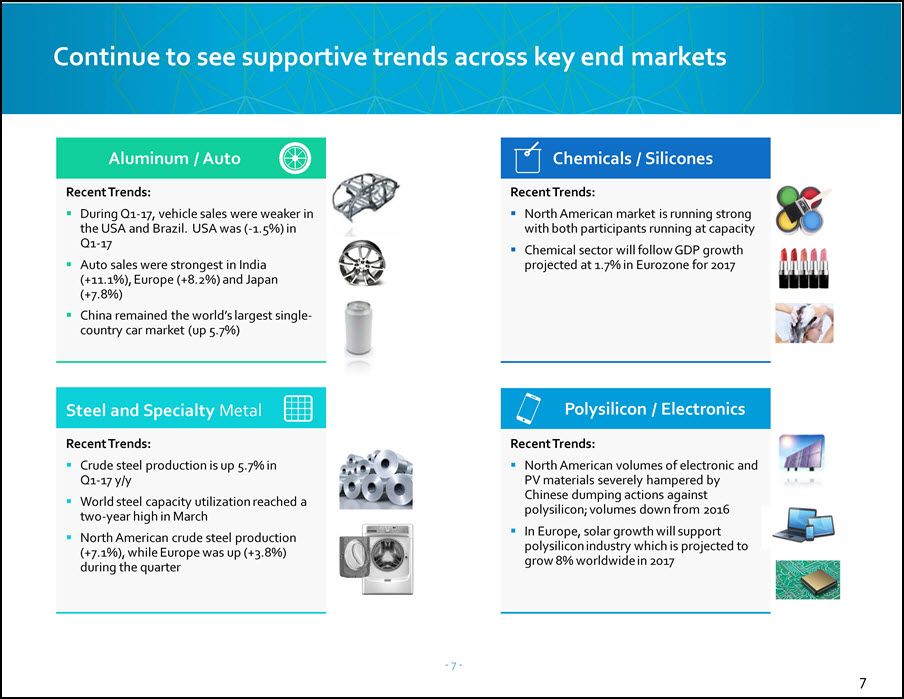
Continue to see supportive trends across key end markets 7 Recent Trends:Crude steel production is up 5.7% in Q1-17 y/yWorld steel capacity utilization reached a two-year high in MarchNorth American crude steel production (+7.1%), while Europe was up (+3.8%) during the quarter Polysilicon / Electronics Recent Trends:North American volumes of electronic and PV materials severely hampered by Chinese dumping actions against polysilicon; volumes down from 2016In Europe, solar growth will support polysilicon industry which is projected to grow 8% worldwide in 2017 Recent Trends:During Q1-17, vehicle sales were weaker in the USA and Brazil. USA was (-1.5%) in Q1-17Auto sales were strongest in India (+11.1%), Europe (+8.2%) and Japan (+7.8%)China remained the world’s largest single-country car market (up 5.7%) Aluminum / Auto Recent Trends:North American market is running strong with both participants running at capacityChemical sector will follow GDP growth projected at 1.7% in Eurozone for 2017 Chemicals / Silicones XX% XX% XX% Steel and Specialty Metal

Revenue level in Q1 2017 remains flat vs previous quarter Shipments volumes have been affected by “one-off” events, but the recovery in prices has helped maintain revenue levels

Silicon metal snapshot Pricing Trends Volume Trends Sequential Quarter Product EBITDA Contribution ($m) Commentary Now-resolved strike at one of the largest customers in U.S. resulting in reduced volumes and a delay in price rebound - expect to gradually recover sales volume in 2Q-17 and benefit from price reversion.European plants faced with increased costs, primarily driven by seasonally higher power rates. Improved plant utilization and increased efficiency helped reduce North American costs. US Index ($) EU Index($) Actual Realized Price ($)
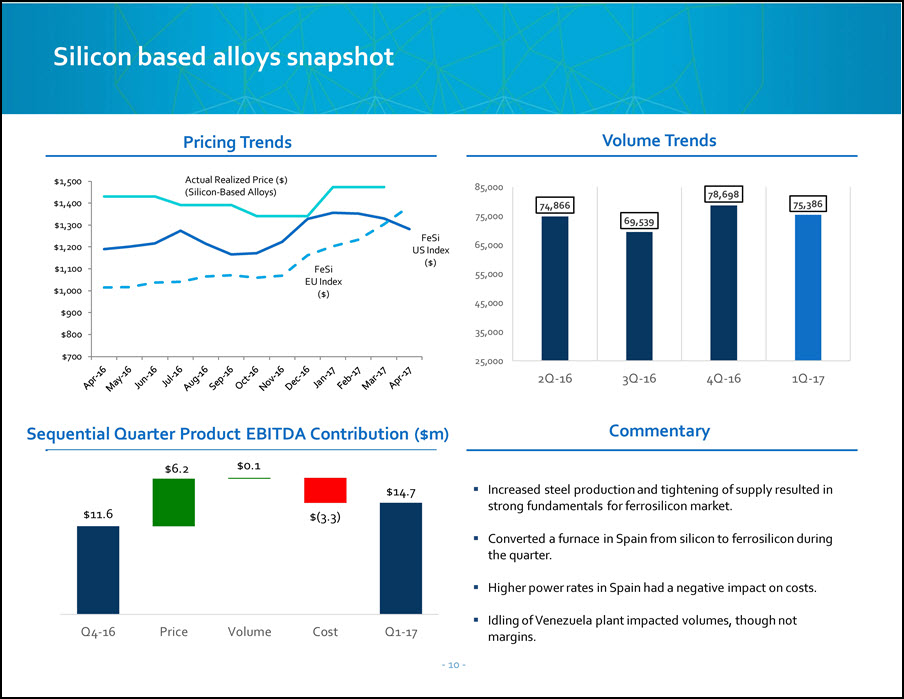
Silicon based alloys snapshot Pricing Trends Volume Trends Commentary Increased steel production and tightening of supply resulted in strong fundamentals for ferrosilicon market.Converted a furnace in Spain from silicon to ferrosilicon during the quarter. Higher power rates in Spain had a negative impact on costs.Idling of Venezuela plant impacted volumes, though not margins. Sequential Quarter Product EBITDA Contribution ($m) FeSi US Index ($) FeSi EU Index ($) Actual Realized Price ($) (Silicon-Based Alloys)

Manganese based alloys snapshot FeMn EU Index SiMnEU Index Commentary Volatility in manganese ore cost continued, spreads have increased and remain solid into Q2.Deliberate decision to avoid the purchase of high-priced ore in order to maintain margins: negative effect on volumes in Q1.Volume and price improvement in the higher grade products, resulting in higher margins. Sequential Quarter Product EBITDA Contribution ($m) Spread$13.6 Actual Realized Price (Mn-Based Alloys) Pricing Trends Volume Trends

Significant margin improvement has enhanced operating results Ferroglobe Actions Leading to Results Commercial strategy has captured the recovery of the market and should yield additional results in coming quartersFinancial discipline has focused the organization on productivity and cash managementRealizing benefits of synergies captured in 2016Business has normalizedIdling of certain facilities has been executedFinancial adjustments minimalized Streamlined production plans to optimize utilization rates; including the conversion of furnaces to optimize on market opportunitiesOverhead costs have leveled off Sequential Quarter EBITDA Contribution ($m) 1 1 Note:1 Net of $17.7mm manganese ore cost
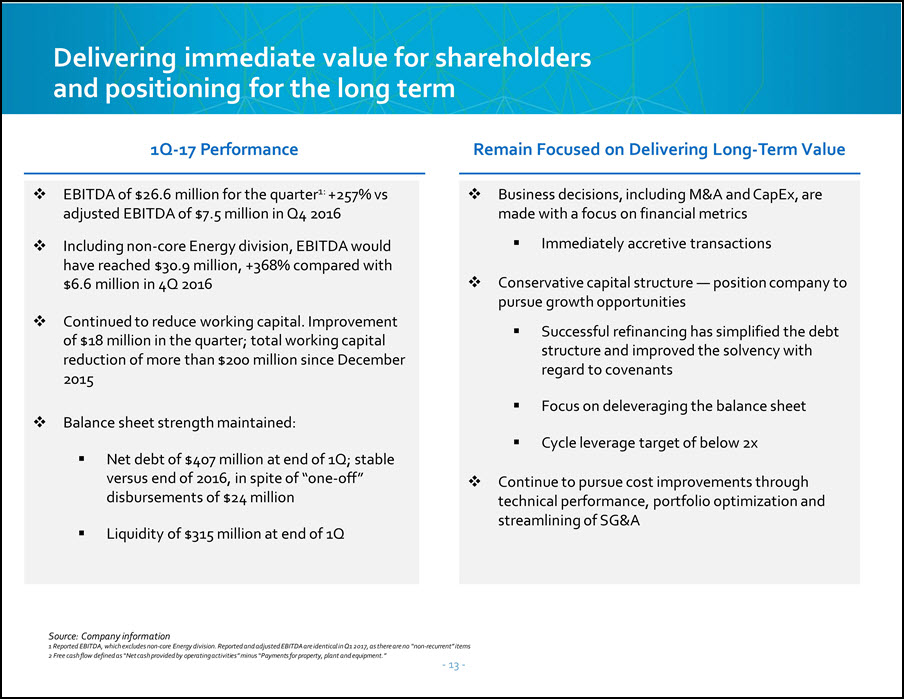
EBITDA of $26.6 million for the quarter1: +257% vs adjusted EBITDA of $7.5 million in Q4 2016 Including non-core Energy division, EBITDA would have reached $30.9 million, +368% compared with $6.6 million in 4Q 2016Continued to reduce working capital. Improvement of $18 million in the quarter; total working capital reduction of more than $200 million since December 2015Balance sheet strength maintained:Net debt of $407 million at end of 1Q; stable versus end of 2016, in spite of “one-off” disbursements of $24 millionLiquidity of $315 million at end of 1Q Source: Company information1 Reported EBITDA, which excludes non-core Energy division. Reported and adjusted EBITDA are identical in Q1 2017, as there are no “non-recurrent” items 2 Free cash flow defined as “Net cash provided by operating activities” minus “Payments for property, plant and equipment.” Business decisions, including M&A and CapEx, are made with a focus on financial metricsImmediately accretive transactionsConservative capital structure — position company to pursue growth opportunitiesSuccessful refinancing has simplified the debt structure and improved the solvency with regard to covenantsFocus on deleveraging the balance sheetCycle leverage target of below 2xContinue to pursue cost improvements through technical performance, portfolio optimization and streamlining of SG&A Delivering immediate value for shareholders and positioning for the long term 1Q-17 Performance Remain Focused on Delivering Long-Term Value

Selected Financial Highlights Joe Ragan, Chief Financial Officer
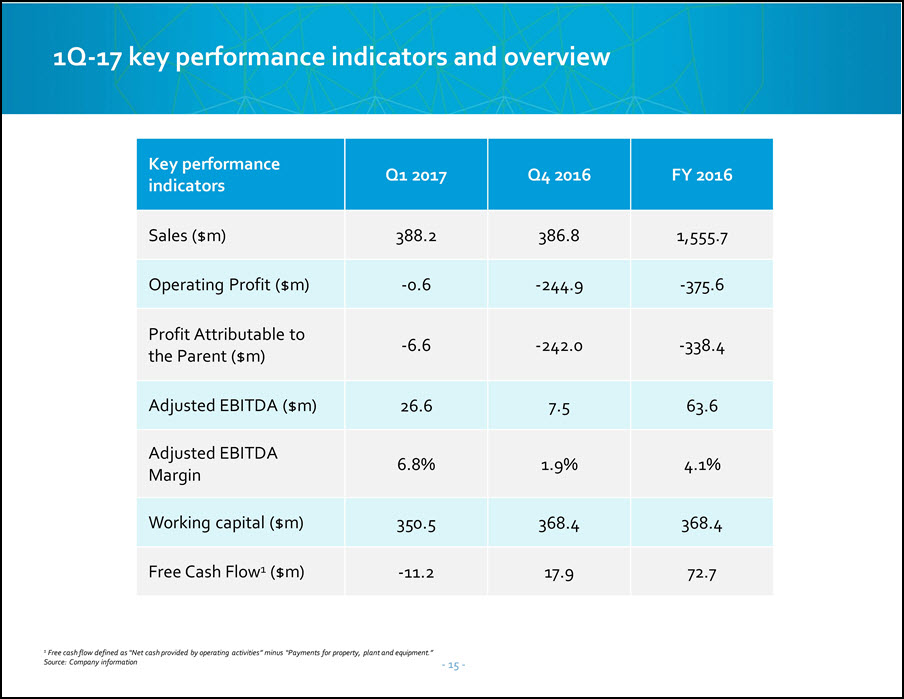
1Q-17 key performance indicators and overview 1 Free cash flow defined as “Net cash provided by operating activities” minus “Payments for property, plant and equipment.”Source: Company information Key performance indicators Q1 2017 Q4 2016 FY 2016 Sales ($m) 388.2 386.8 1,555.7 Operating Profit ($m) -0.6 -244.9 -375.6 Profit Attributable to the Parent ($m) -6.6 -242.0 -338.4 Adjusted EBITDA ($m) 26.6 7.5 63.6 Adjusted EBITDA Margin 6.8% 1.9% 4.1% Working capital ($m) 350.5 368.4 368.4 Free Cash Flow1 ($m) -11.2 17.9 72.7

Balance sheet summary ($mm) Q1 20171 12/31/2016 Total Assets 2,012 2,019 Net Debt2 407 405 Book Equity 903 892 Net Debt2 / Total Assets 20% 20% Net Debt2 / Capital3 31% 31% Financial results are unauditedNet Debt includes finance lease obligationsCapital is calculated as book equity plus net debt Notes
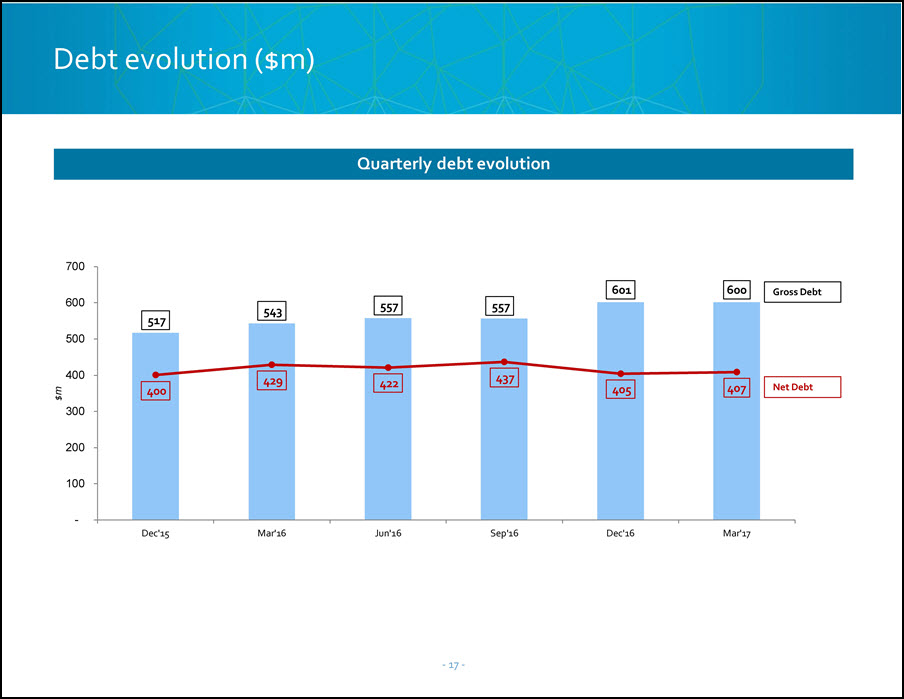
Debt evolution ($m) Quarterly debt evolution
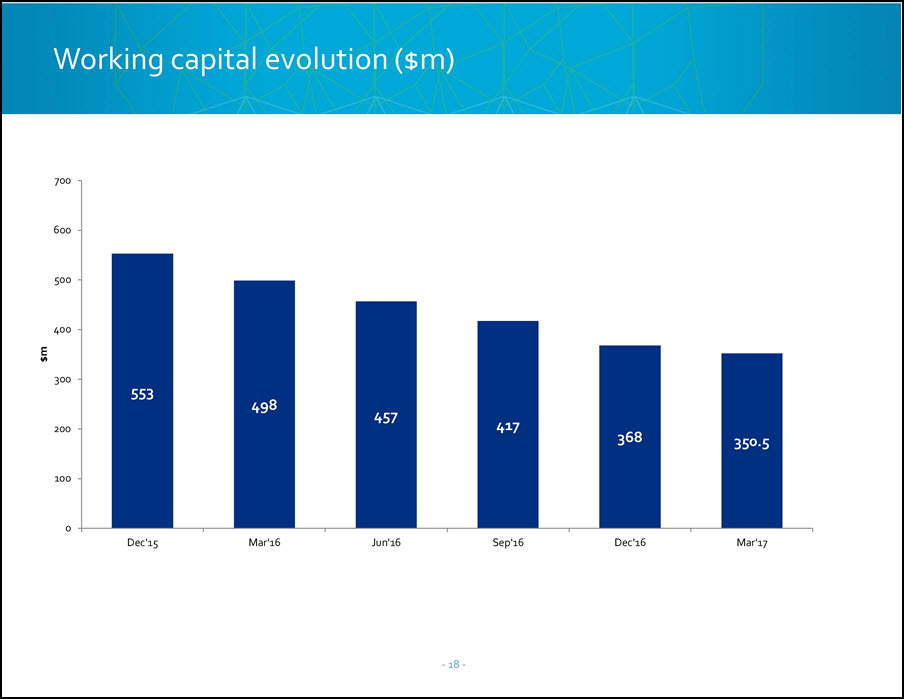
Working capital evolution ($m)

Liquidity $100m represents minimum cash required to operate given cash trapped in certain locations

Concluding Remarks Supportive market environment: past inflection Business well-positioned: cost structure and commercial strategy Positive outlook for remainder of 2017

Q&A

Advancing Materials Innovation NASDAQ: GSM First Quarter 2017