UNITED STATES
SECURITIES AND EXCHANGE COMMISSION
Washington, D.C. 20549
FORM 10-K
|
| | |
| (Mark One) | | |
| x | | ANNUAL REPORT PURSUANT TO SECTION 13 OR 15(d) OF THE SECURITIES EXCHANGE ACT OF 1934 |
| For the fiscal year ended December 31, 2015 |
| OR |
| ¨ | | TRANSITION REPORT PURSUANT TO SECTION 13 OR 15(d) OF THE SECURITIES EXCHANGE ACT OF 1934 |
| For the transition period from to |
Commission File Number 001-37356
CARE CAPITAL PROPERTIES, INC.
(Exact Name of Registrant as Specified in Its Charter)
|
| | |
Delaware (State or Other Jurisdiction of Incorporation or Organization) | | 37-1781195 (IRS Employer Identification No.) |
191 N. Wacker Dr., Suite 1200, Chicago, Illinois (Address of Principal Executive Offices) | | 60606 (Zip Code) |
(312) 881-4700
(Registrant’s Telephone Number, Including Area Code)
Securities registered pursuant to Section 12(b) of the Act: |
| | |
| Title of Each Class | | Name of Each Exchange on Which Registered |
| Common Stock, par value $0.01 per share | | New York Stock Exchange |
Securities registered pursuant to Section 12(g) of the Act: None
Indicate by check mark if the Registrant is a well-known seasoned issuer, as defined in Rule 405 of the Securities Act. Yes ¨ No x
Indicate by check mark if the Registrant is not required to file reports pursuant to Section 13 or Section 15(d) of the Act. Yes ¨ No x
Indicate by check mark whether the Registrant (1) has filed all reports required to be filed by Section 13 or 15(d) of the Securities Exchange Act during the preceding 12 months (or for such shorter period that the Registrant was required to file such reports), and (2) has been subject to such filing requirements for the past 90 days. Yes x No ¨
Indicate by check mark whether the Registrant has submitted electronically and posted on its corporate Web site, if any, every Interactive Data File required to be submitted and posted pursuant to Rule 405 of Regulation S-T (§232.405 of this chapter) during the preceding 12 months (or for such shorter period that the Registrant was required to submit and post such files). Yes x No ¨
Indicate by check mark if disclosure of delinquent filers pursuant to Item 405 of Regulation S-K is not contained herein, and will not be contained, to the best of Registrant’s knowledge, in definitive proxy or information statements incorporated by reference in Part III of this Form 10-K or any amendment to this Form 10-K. x
Indicate by check mark whether the Registrant is a large accelerated filer, an accelerated filer, a non-accelerated filer or a smaller reporting company. See the definitions of “large accelerated filer,” “accelerated filer” and “smaller reporting company” in Rule 12b-2 of the Exchange Act.
|
| | | | | | |
Large accelerated filer ¨ | | Accelerated filer ¨ | | Non-accelerated filer x (Do not check if a smaller reporting company) | | Smaller reporting company ¨ |
Indicate by check mark whether the registrant is a shell company (as defined in Rule 12b-2 of the Act). Yes ¨ No x
The aggregate market value of shares of the Registrant’s common stock held by non-affiliates of the Registrant, computed by reference to the closing price of the common stock as reported on the New York Stock Exchange as of June 30, 2015, was $0 due to the fact that the Registrant’s common stock was not publicly traded as of that date. For purposes of the foregoing calculation only, all directors, executive officers and 10% beneficial owners of the Registrant have been deemed affiliates.
As of March 7, 2016, 83,945,549 shares of the Registrant’s common stock were outstanding.
DOCUMENTS INCORPORATED BY REFERENCE
Portions of the Registrant’s definitive Proxy Statement for the Annual Meeting of Stockholders to be held on May 10, 2016 are incorporated by reference into Part III, Items 10 through 14 of this Annual Report on Form 10-K.
Unless the context otherwise requires or indicates, references in this Annual Report on Form 10-K to “we,” “us,” “our,” “our company,” and “CCP” generally mean Care Capital Properties, Inc. and its consolidated subsidiaries.
CAUTIONARY NOTE REGARDING FORWARD-LOOKING STATEMENTS
This Annual Report on Form 10-K includes forward-looking statements within the meaning of Section 27A of the Securities Act of 1933, as amended (the “Securities Act”), and Section 21E of the Securities Exchange Act of 1934, as amended (the “Exchange Act”). All statements regarding our or our tenants’ or borrowers’ expected future financial condition or performance, dividends or dividend plans, business strategies, acquisitions or other investment opportunities, dispositions, continued qualification as a real estate investment trust (“REIT”), and plans and objectives of management for future operations, and statements that include words such as “believe,” “expect,” “anticipate,” “intend,” “may,” “could,” “should,” “will,” and other similar expressions, are forward-looking statements. These forward-looking statements are inherently uncertain, and actual results may differ materially from our expectations. Except as required by law, we do not undertake a duty to update these forward-looking statements, which speak only as of the date on which they are made.
Factors that could cause our actual future results and trends to differ materially from those anticipated are discussed under “Risk Factors” in Part I, Item 1A of this Annual Report on Form 10-K and include, without limitation:
| |
| • | the ability and willingness of our tenants, borrowers and other counterparties to satisfy their obligations under their respective contractual arrangements with us, including, in some cases, their obligations to indemnify, defend and hold us harmless from and against various claims, litigation and liabilities; |
| |
| • | the ability of our tenants and borrowers to maintain the financial strength and liquidity necessary to satisfy their respective obligations and liabilities to third parties, including obligations under their existing credit facilities and other indebtedness; |
| |
| • | our success in executing our business strategy and our ability to identify, underwrite, finance, consummate and integrate suitable acquisitions and investments; |
| |
| • | macroeconomic conditions such as a disruption of or lack of access to the capital markets, changes in the debt rating on U.S. government securities, default or delay in payment by the United States of its obligations, and changes in the federal or state budgets resulting in the reduction or nonpayment of Medicare or Medicaid reimbursement rates; |
| |
| • | the nature and extent of competition in the markets in which our properties are located; |
| |
| • | the impact of pending and future healthcare reform and regulations, including cost containment measures, quality initiatives and changes in reimbursement methodologies, policies, procedures and rates; |
| |
| • | increases in our borrowing costs as a result of changes in interest rates and other factors; |
| |
| • | the ability of our tenants to operate our properties in compliance with applicable laws, rules and regulations, to deliver high-quality services, to hire and retain qualified personnel and to attract residents and patients; |
| |
| • | changes in general economic conditions or economic conditions in the markets in which we may, from time to time, compete for investments, capital and talent, and the effect of those changes on our earnings and financing sources; |
| |
| • | our ability to repay, refinance, restructure or extend our indebtedness as it becomes due; |
| |
| • | our ability and willingness to maintain qualification as a REIT in light of economic, market, legal, tax and other considerations; |
| |
| • | final determination of our taxable net income for the year ended December 31, 2015 and for current and future years; |
| |
| • | the ability and willingness of our tenants to renew their leases with us upon expiration of the leases, our ability to reposition our properties on the same or better terms in the event of non-renewal or in the event we exercise our right to replace an existing tenant, and obligations, including indemnification obligations, we may incur in connection with the replacement of an existing tenant; |
| |
| • | year-over-year changes in the Consumer Price Index (“CPI”) and the effect of those changes on the rent escalators contained in our leases and on our earnings; |
| |
| • | our ability and the ability of our tenants and borrowers to obtain and maintain adequate property, liability and other insurance from reputable, financially stable providers; |
| |
| • | the impact of increased operating costs and uninsured professional liability claims on our and our tenants’ and borrowers’ liquidity, financial condition and results of operations and our ability and the ability of our tenants and borrowers to accurately estimate the magnitude of those costs and claims; |
| |
| • | consolidation in the healthcare industry resulting in a change of control of, or a competitor’s investment in, any of our tenants or borrowers and significant changes in the senior management of any of our tenants or borrowers; |
| |
| • | the impact of litigation or any financial, accounting, legal or regulatory issues that may affect us or our tenants or borrowers; and |
| |
| • | changes in accounting principles, or their application or interpretation, and our ability to make estimates and the assumptions underlying the estimates, which could have an effect on our earnings. |
Many of these factors are beyond our control and the control of our management.
TENANT FINANCIAL INFORMATION
Our largest tenant, Senior Care Centers, LLC (together with its subsidiaries, “SCC”), is not currently subject to the reporting requirements of the Securities and Exchange Commission (“SEC”). The information related to SCC contained or referred to in this Annual Report on Form 10-K has been derived from publicly available information or was provided to us by SCC, and we have not verified this information through an independent investigation or otherwise. We have no reason to believe that this information is inaccurate in any material respect, but we cannot provide any assurance of its accuracy. We are providing this data for informational purposes only.
MARKET AND INDUSTRY INFORMATION
This Annual Report on Form 10-K contains industry, market and competitive position information that is based on industry publications and studies conducted by third parties. The industry publications and third‑party studies generally state that the information that they contain has been obtained from sources believed to be reliable, although they do not guarantee the accuracy or completeness of such information. While we believe the industry, market and competitive position information included in this Annual Report on Form 10-K is generally reliable, such information is inherently imprecise.
TABLE OF CONTENTS
PART I
ITEM 1. Business
BUSINESS
Overview
We are a self-administered, self-managed REIT with a diversified portfolio of skilled nursing facilities (“SNFs”) and other healthcare assets operated by private regional and local care providers. We primarily generate our revenues by leasing our properties to unaffiliated tenants under long-term triple-net leases, pursuant to which the tenants are obligated to pay all property-related expenses, including maintenance, utilities, repairs, taxes, insurance and capital expenditures. In addition, we originate and manage a small portfolio of secured and unsecured loans, made primarily to our SNF operators and other post-acute care providers.
As of December 31, 2015, our portfolio consisted of 358 properties operated by 39 private regional and local care providers, spread across 36 states, and containing a total of approximately 39,000 beds/units. We are one of only three publicly traded, SNF-focused REITs, and we conduct all of our operations through our wholly owned operating partnership, Care Capital Properties, LP (“Care Capital LP”), and its subsidiaries.
Prior to August 17, 2015, we were a wholly owned subsidiary of Ventas, Inc. (“Ventas”), created to hold Ventas’s post-acute/SNF portfolio operated by regional and local care providers (the “CCP Business”). Effective as of 11:59 p.m. on August 17, 2015, Ventas completed its spin-off of the CCP Business by distributing one share of our common stock for every four shares of Ventas common stock held as of the close of business on August 10, 2015. As a result, we began operating as an independent public company and our common stock commenced trading on the New York Stock Exchange (“NYSE”) under the symbol “CCP” as of August 18, 2015.
In connection with the spin-off, we entered into a separation and distribution agreement, as well as a transition services agreement, a tax matters agreement and an employee matters agreement, with Ventas. Under the transition services agreement, Ventas agreed to provide us with various accounting, tax and information technology services on a transitional basis until August 31, 2016, subject to extension upon mutual agreement.
Although we have limited history operating as a standalone company, we believe that we are well positioned for disciplined growth, with the ability to capitalize on attractive investment opportunities and favorable industry dynamics. With a strategy focused on our post-acute/SNF business, we expect to grow our portfolio through acquisitions and active asset management, including redevelopment. We believe that our strong balance sheet and independent access to multiple sources of capital support this strategy and will enable us to enhance value for our stockholders. In addition, we will also selectively dispose of non-strategic assets to improve the long-term value of our portfolio.
Our company is led by a highly experienced and dedicated management team comprised of former Ventas executives with knowledge of our industry, assets and customers, along with an independent board of directors. This well-seasoned team has extensive experience in the healthcare and commercial real estate industries. With an average tenure of approximately 10 years at Ventas, our top four executives have worked together for many years. Our non-executive chairman, Douglas Crocker II, who has been a director of Ventas since 1998 and has more than 40 years of experience as a real estate executive, has a comprehensive understanding of REIT operations and strategy, capital markets and corporate governance.
2015 Highlights and Other Recent Developments
| |
| • | In January 2015, Ventas completed the acquisition of American Realty Capital Healthcare Trust, Inc. (“HCT”) in a stock and cash transaction, which included 14 SNFs, two specialty hospitals and four seniors housing communities that were transferred to us in connection with the separation. |
| |
| • | Also in January 2015, Ventas completed the acquisition of 12 SNFs for an aggregate purchase price of $234.9 million, all of which were transferred to us in connection with the separation and are currently operated by SCC. |
| |
| • | In August 2015, we completed our previously disclosed acquisition of a specialty healthcare and seniors housing valuation firm for stock consideration valued at $11.5 million. |
| |
| • | Also in August 2015, we entered into a Credit and Guaranty Agreement (the “Credit Agreement”) with a syndicate of banks that provides for a $600 million unsecured revolving credit facility due 2019 (the “Revolver”), a $600 million unsecured term loan due 2017 (the “$600 million Term Loan”) and an $800 million unsecured term loan |
due 2020 (the “$800 million Term Loan” and collectively with the $600 million Term Loan, the “Original Term Loans” and together with the Revolver, the “Facility”). Pursuant to the separation and distribution agreement with Ventas, we transferred approximately $1.3 billion of the proceeds from borrowings under the Original Term Loans to Ventas.
| |
| • | On August 17, 2015, Ventas completed its spin-off of the CCP Business by distributing one share of our common stock for every four shares of Ventas common stock held as of the close of business on August 10, 2015. As a result, we began operating as an independent public company and our common stock commenced trading on the NYSE under the symbol “CCP” as of August 18, 2015. |
| |
| • | On September 1, 2015, we completed the acquisition of eight properties (seven SNFs and one campus with both skilled nursing and assisted living facilities) and simultaneously entered into a long-term master lease with SCC to operate the acquired portfolio. We purchased the assets for approximately $190 million in cash and made a $20 million five-year, fully amortizing loan to SCC, resulting in a total transaction value of approximately $210 million. |
| |
| • | On September 30, 2015, we paid a full third quarter cash dividend in the amount of $0.57 per share to the holders of record of our common stock as of September 14, 2015. On December 31, 2015, we paid a fourth quarter cash dividend in the amount of $0.57 per share to the holders of record of our common stock as of December 21, 2015. |
| |
| • | On December 1, 2015, Signature HealthCARE, LLC (together with its subsidiaries, “Signature”) acquired from Elmcroft Senior Living, Inc. (together with its subsidiaries, “Elmcroft”) the operations of 18 SNFs owned by us. In connection with the acquisition, we funded a total of $9 million to Signature, of which $8 million was added to the lease basis at an 8.5% return and $1 million was a four-year fully amortizing loan. We entered into a new master lease with Signature to operate the properties at the existing Elmcroft rent plus the additional rent described above. |
| |
| • | In December 2015, we acquired the noncontrolling interest in one of our former joint ventures for $3.1 million. |
| |
| • | During 2015, subsequent to the spin-off, we sold five SNFs, two of which were transferred to us in connection with the HCT acquisition, for aggregate proceeds of $6.0 million. |
| |
| • | In January 2016, we entered into a Term Loan and Guaranty Agreement (the “Term Loan Agreement”) with a syndicate of banks that provides for a $200 million unsecured term loan due 2023 (the “$200 million Term Loan”). We used the proceeds from borrowings under the $200 million Term Loan to repay a portion of the indebtedness outstanding under the $600 million Term Loan. Also in January 2016, we entered into agreements to swap a total of $600 million of debt, effectively converting the interest on that debt from floating rates to fixed rates. The swap agreements have terms of 4.6 years and seven years. |
Industry Opportunities
There are 17 publicly traded healthcare REITs representing an aggregate market capitalization of approximately $148 billion, based on publicly available data as of December 31, 2015. Most of these companies either specialize in healthcare properties other than SNFs or are large, diversified companies that focus on investing in healthcare properties other than SNFs. As a result, SNF operators, in general, and private regional and local operators, in particular, are being underserved. According to the American Health Care Association (“AHCA”), the SNF industry is comprised of approximately 15,600 facilities and 1.7 million beds, and according to the National Investment Center for the Seniors Housing & Care Industry (“NIC”), there are more than 2,500 SNF operators. With less than 20% of SNFs owned by publicly traded REITs, according to the AHCA, the large and highly fragmented market provides ample opportunities for consolidation. We believe that we are poised to take advantage of those opportunities.
The dynamics within the SNF industry may create an opportunity for attractive returns. The SNF industry is expected to benefit from current and projected near-term demographic, economic and regulatory trends driving demand for post-acute and long-term care services provided by SNFs. The demand for SNFs is based on the medical needs of residents who may have been discharged from a hospital and are in need of rehabilitation or restorative care and long-term residents who require assistance with numerous activities of daily living. SNFs provide comprehensive delivery of care to these residents at a relatively low cost. Moreover, while the supply of SNFs is constrained by obstacles, such as licensing, certificate of need (“CON”), and state regulatory requirements, the recent healthcare policy shift towards treating patients in the lowest, most clinically appropriate settings is expected to generate increased utilization of SNFs.
SNF operators generally receive revenue through reimbursement from the federally funded Medicare and federally and state funded Medicaid programs, as well as private insurers. Government reimbursement is a key source of the revenues and
profitability of SNF operators. From 2000 to 2014, despite significant volatility during the period, SNF Medicare reimbursement rates increased at a compound annual growth rate (“CAGR”) of 3.8% and SNF Medicaid reimbursement rates increased at a CAGR of 3.9%, according to Eljay LLC and the Centers for Medicare & Medicaid Services (“CMS”).
Our Strengths
Contractual Cash Flows Supported by Triple-Net Leases with Embedded Growth
We lease all of our real estate properties to third-party operators under triple-net leases, pursuant to which the tenants are obligated to pay all property-related expenses, including maintenance, utilities, repairs, taxes, insurance and capital expenditures. Our leases have a weighted average remaining term of approximately nine years.
Our tenants generally have strong cash flow-to-rent coverage, which is an indication of their ability to pay the rent due under our leases. In addition, our triple-net lease structure provides a measure of protection from variability in operator cash flows. We support our ability to generate attractive returns on a long-term basis by structuring our leases with a variety of favorable provisions. For instance, our leases typically have initial terms of ten years and include CPI-based annual rent escalators (with floors and caps) that are estimated to average approximately 2% per year. These escalator provisions help to support our cash rental stream.
We regularly enter into lease extensions during the terms of our leases in connection with additional acquisitions, reinvestment projects and other opportunities that arise from our close tenant relationships. Our leases also generally provide us with key credit support for our contractual rents through guarantees and/or security deposits, and we have strong structural protections by entering into master leases or leases with cross-default provisions. We typically require security deposits of several months’ rent.
Strong Balance Sheet with Investment Grade Ratings
We have a strong balance sheet characterized by low leverage, no secured debt and good liquidity. Our financial strength, along with our diversified portfolio and experienced management team, were the primary reasons that we received corporate investment grade ratings from two major ratings agencies. We believe that having a strong balance sheet with financial flexibility is an important component of our strategy that allows us to take advantage of opportunities as they are presented and to weather any potential economic downturns.
Quality Portfolio with Strong Diversification across Markets and Tenants
The geographic and operator diversification of our portfolio not only reduces our exposure to any single market or tenant, but also helps us to expand our operating expertise and provides us with numerous relationships upon which to grow. We expect to capitalize on our relationships and experience to enhance our future growth profile.
Specifically, we pursue a strategy of leasing properties to multiple tenants across our markets and leasing multiple properties to each of our tenants, which helps us to expand our expertise and relationships in a given market, while also helping us to diversify and mitigate risk. As leases expire, we often re-lease properties to new tenants. Over the last three years, we re-leased properties accounting for approximately 30% of our net operating income (“NOI”). The result is that properties that were once concentrated with larger public operators were re-leased to new regional and local operators with lower cost structures and greater knowledge of their particular markets, broadening our tenant base and expanding our pipeline of new investment opportunities.
Strong Relationships with Operators
Our management team has built an extensive network of relationships with qualified local, regional and national operators of SNFs across the U.S. based on over 95 years of collective experience in the REIT, real estate, healthcare assets and finance industries. Through involvement in industry organizations, our management team has also developed strong relationships with customers, lenders and investors within the post-acute/SNF sector. We work collaboratively with our operators, selectively investing capital to help them achieve their growth and business objectives. We believe these strong relationships with operators help us to source investment opportunities and give us a key competitive advantage in objectively evaluating an operator’s financial position, quality of care and operating efficiency.
Constructive Reimbursement Landscape
Our portfolio consists primarily of properties leased to operators that receive a majority of their revenue through reimbursement from the federal and state funded Medicare and Medicaid programs. While SNF operators’ dependence on government reimbursement is not without certain challenges, our management’s experience and relationships with these operators enable us to evaluate their ability to navigate these challenges. Moreover, growing reimbursement expenditures and a recent healthcare policy shift towards providing care in the lowest cost, most clinically appropriate settings may provide cash flow growth for SNF operators who operate efficiently and effectively, which in turn may provide additional support for the rent coverages on our leases. According to Eljay LLC and CMS, average Medicare reimbursement rates increased from $408 per day to an estimated $484 per day from 2008 to 2014, a CAGR of 2.9%, despite a decline in fiscal year 2012 to adjust for overpayments made in the prior year under the RUG-IV classification model. Average Medicaid reimbursement rates increased from $164 per day to an estimated $186 per day from 2008 to 2014, a CAGR of 2.1%. Since the inception of the Medicare and Medicaid programs in 1965, the federal and state governments have supported care for the U.S. elderly population, and we expect that they will continue to provide funding for healthcare facilities in the future.
Experienced, Dedicated and Disciplined Management Team
Our company is led by a highly experienced and dedicated executive management team comprised of individuals who were previously employed by Ventas. Our management team has an accomplished record of successfully identifying and executing acquisition opportunities and possesses the knowledge and experience that we believe puts us in an excellent position to participate as a consolidator in the fragmented SNF industry. In addition, through years of public company experience, our management team has extensive experience accessing both debt and equity capital markets to fund disciplined growth and maintain a flexible capital structure. With its focus exclusively on developing our portfolio, our management team will use this expertise to create a capital structure tailored to our asset base and investment opportunities.
In addition, many former Ventas employees who managed the SNF portfolio became employees of CCP in connection with the separation, providing continuity in the day-to-day asset management of our portfolio following the separation. These individuals have extensive experience working together in the SNF business and longstanding relationships with our tenants. We believe that the combination of former Ventas colleagues and externally recruited employees provides continuity to our business and customers, as well as new perspectives on driving future growth for the benefit of stakeholders.
Flexible UPREIT Structure
We operate through an umbrella partnership, commonly referred to as an UPREIT structure, in which substantially all of our properties and assets are held by Care Capital LP, the general partner of which is an entity owned by us, or by Care Capital LP’s subsidiaries. Conducting business through Care Capital LP allows us flexibility in the manner in which we structure and acquire properties. In particular, an UPREIT structure enables us to acquire additional properties from sellers in exchange for limited partnership units, which provides property owners the opportunity to defer the tax consequences that would otherwise arise from a sale of their real properties and other assets to us. As a result, this structure may facilitate our acquisition of assets in a more efficient manner or allow us to acquire assets that the owner would otherwise be unwilling to sell because of tax considerations. We believe that the flexibility to use limited partnership units in Care Capital LP as consideration for properties we acquire in the future gives us an advantage in making acquisitions.
Business Strategy
We aim to drive growth and create value by:
Maintaining a Strong Balance Sheet with Access to Multiple Sources of Capital
We expect to maintain a strong balance sheet and conservative capital structure, providing the flexibility to deploy our resources effectively. We intend to actively manage our leverage and interest rate risk by replacing our short-term floating rate debt with long-term fixed rate financing, entering into hedging arrangements, lengthening and staggering our debt maturities and maintaining our access to multiple sources of liquidity. We believe that the Facility, as well as our access to the debt and equity capital markets, will be sufficient to meet our business’ financing needs.
Carefully Evaluating Investment Opportunities with Existing Operators
Our tenants represent many of the most experienced regional and local operators of SNFs in the U.S. Many of these operators have a demonstrated desire and ability to grow, which will require capital, and we expect our strong relationships with these operators to sustain our operating results and business prospects.
Many of these operators own a number of the facilities they operate, which creates opportunities for us to grow our portfolio through sale-leaseback transactions that are attractive to the operators because they provide liquidity to grow their businesses. We believe we can develop and expand our relationships with certain of our existing tenants, who collectively operate properties throughout the U.S., as well as expand our network of relationships with new operators. We focus on operator relationships that meet our investment criteria, and we believe our management team’s experience in the industry helps us to identify attractive acquisition, sale-leaseback, reinvestment, new construction and other investment opportunities. We expect that our size and market focus allows us to generate a significant pipeline of unique and attractive opportunities to grow our portfolio.
Driving Returns on Existing Properties through Incremental Investments and Operator Transitions
Our management team has significant experience evaluating the operational and financial performance of SNF operators. We expect to leverage this expertise to drive controlled growth at our existing properties. Over time, we expect to work closely with certain of our operators to identify and capitalize on opportunities to enhance the operations of our facilities through capital investment. When the opportunities are attractive, we may finance the redevelopment or expansion of our properties, generating higher lease rates while improving the quality of our assets and enhancing the profitability of our operators.
We will continue to work to improve our portfolio by transitioning properties to operators who we believe will achieve long-term success by effectively navigating the changing healthcare environment. Whenever possible, we will look to execute transitions without materially altering the economics of the leases we are replacing. However, in certain circumstances we may need to reduce rent, invest capital, or make other structural or economic accommodations to the lease with the new operator to preserve the economic viability and long-term value of the asset.
Utilizing a Disciplined Underwriting Approach to Opportunistically Expand our Business
Data from the NIC indicates that there is a high degree of fragmentation among SNF owners and operators, with many privately held regional and local players controlling a high percentage of markets, and over 75% of SNF operators owning 25 or fewer properties. We believe that many of these owners are too small to attract interest from larger REITs and other institutional investors, affording us the opportunity to acquire their properties at attractive prices in a less competitive environment. As a more flexible, SNF-focused REIT, we intend to capitalize on this opportunity by actively participating as a consolidator in this fragmented industry. We believe that our size, relationships and investment expertise enables us to identify and consummate value-enhancing acquisitions that will expand and further diversify our portfolio.
Strategically Disposing of Assets to Optimize Our Portfolio for Long-Term Investment and Growth
We are likely to dispose of non-strategic assets, including those post-acute/SNF assets that were transferred to us in the separation that do not meet our investment criteria, and redeploy the proceeds into new investments, including acquisitions and redevelopment, renovation and expansion opportunities that align with our strategies. Any such dispositions would be subject to REIT qualification and prohibited transaction rules under the Internal Revenue Code of 1986, as amended (the “Code”).
Strategically Pursuing Opportunities to Invest in Complementary Healthcare Properties
Over time, we may capitalize on our management team’s extensive knowledge of healthcare properties, as well as our strong relationships with certain of our tenants, to supplement our core strategy of acquiring and investing in SNFs by opportunistically acquiring complementary healthcare properties. We may also pursue forms of investment in addition to triple-net leases, including joint ventures or other structures for our healthcare properties, as well as senior, mezzanine, secured and unsecured debt investments that are consistent with our investment objectives.
Portfolio Summary
The following table summarizes our portfolio of properties and other real estate investments as of and for the year ended December 31, 2015:
|
| | | | | | | | | | | | | | | | | | | | | | | | |
| | | | | | | Real Estate Investments (1) | | Revenues |
| Asset Type | | # of Properties | | # of Units/ Beds (2) | | Real Estate Investment, at Cost | | Percent of Total Real Estate Investments (3) | | Real Estate Investment Per Unit/Bed | | Revenue | | Percent of Total Revenues (3) |
| | | (Dollars in thousands, except per unit/bed data) |
| SNFs | | 318 |
| | 36,693 |
| | $ | 2,917,910 |
| | 88.3 | % | | $ | 79,522 |
| | $ | 292,561 |
| | 89.2 | % |
| Specialty hospitals and healthcare assets | | 15 |
| | 373 |
| | 147,126 |
| | 4.4 |
| | 394,440 |
| | 14,127 |
| | 4.3 |
|
| Seniors housing communities and campuses (4) | | 15 |
| | 1,443 |
| | 240,060 |
| | 7.3 |
| | 166,362 |
| | 15,097 |
| | 4.6 |
|
| Total properties | | 348 |
| | | | 3,305,096 |
| | 100.0 | % | | | | 321,785 |
| | 98.1 |
|
| Net investment in direct financing lease | | | | | | 22,075 |
| | | | | | 2,456 |
| | 0.8 |
|
| Total | | |
| | |
| | $ | 3,327,171 |
| | | | |
| | $ | 324,241 |
| | 98.9 | % |
| |
| (1) | Based on gross book value of tangible real estate property. |
| |
| (2) | Seniors housing communities and campuses are measured in units and SNFs and specialty hospitals and healthcare assets are measured by bed count. |
| |
| (3) | Total real estate investments at cost exclude amounts attributable to properties classified as held for sale as of December 31, 2015, whereas total revenues include amounts attributable to properties classified as held for sale as of December 31, 2015. The remainder of total revenues consists of income from investment in loans, real estate services fee income and interest and other income. |
| |
| (4) | Campuses are defined as multi-level properties. |
SNFs
Our SNFs provide rehabilitative, restorative, skilled nursing and medical treatment for patients and residents who do not require the high technology, care-intensive, high-cost setting of an acute care or rehabilitation hospital. Patients and residents generally come to SNFs to receive post-acute care to recover from an illness or surgery or long-term care with skilled nursing assistance to aid with numerous daily living activities. Treatment programs include physical, occupational, speech, respiratory and other therapies, including sub-acute clinical protocols such as wound care and intravenous drug treatment. SNF operators receive payment for these services through a combination of government reimbursement, including Medicare and Medicaid and private sources.
Specialty Hospitals and Healthcare Assets
Our specialty hospitals and healthcare assets include hospitals focused on providing children’s care, inpatient rehabilitation facilities, long-term acute care hospitals and personal care facilities. Our inpatient rehabilitation facilities are devoted to the rehabilitation of patients with various neurological, musculoskeletal, orthopedic and other medical conditions following stabilization of their acute medical issues. Our two long-term acute care hospitals serve medically-complex, chronically-ill patients who require high levels of monitoring and specialized care, but whose conditions do not necessitate the continued services of an intensive care unit. Our two long-term acute care hospitals are freestanding facilities, and we do not own any “hospitals within hospitals.” Our personal care facilities provide specialized care, including supported living services, neurorehabilitation, neurobehavioral management and vocational programs, for persons with acquired or traumatic brain injury.
Seniors Housing Communities and Campuses
Our seniors housing communities and campuses, which are leased under master lease agreements with certain of our SNFs, include independent and assisted living communities, continuing care retirement communities and communities providing care for individuals with Alzheimer’s disease and other forms of dementia or memory loss. These communities offer studio, one bedroom and two bedroom residential units on a month-to-month basis primarily to elderly individuals requiring various levels of assistance. Basic services for residents of these communities include housekeeping, meals in a central dining area and group activities organized by the staff with input from the residents. More extensive care and personal supervision, at additional fees, are also available for such needs as eating, bathing, grooming, transportation, limited therapeutic programs and medication administration, which allow residents certain conveniences and enable them to live as independently as possible according to their abilities. These services are often met by home health providers, close coordination with the resident’s physician and SNFs. Charges for room, board and services are generally paid from private sources.
Geographic Diversification of Properties
As of December 31, 2015, our properties were located in 36 states, with rental income from properties in only one state (Texas) accounting for more than 10% of our total revenues for the year then ended.
The following table summarizes the geographic diversification of our portfolio for the year ended December 31, 2015:
|
| | | | | | | |
| | Rental Income | | Percent of Total Revenues (1) | |
| | (Dollars in thousands) | |
| Texas | $ | 72,710 |
| | 22.2 | % | |
| Massachusetts | 28,110 |
| | 8.6 |
| |
| Indiana | 26,249 |
| | 8.0 |
| |
| Kentucky | 24,142 |
| | 7.4 |
| |
| Oregon | 18,068 |
| | 5.5 |
| |
| New York | 17,491 |
| | 5.3 |
| |
| Washington | 12,636 |
| | 3.8 |
| |
| North Carolina | 11,023 |
| | 3.4 |
| |
| Wisconsin | 9,041 |
| | 2.7 |
| |
| Ohio | 8,960 |
| | 2.7 |
| |
| Other (26 states) | 93,355 |
| | 28.5 |
| |
| Total | $ | 321,785 |
| | 98.1 | % | (1) |
| |
| (1) | The remainder of total revenues consists of income from net investment in direct financing lease, income from investment in loans, real estate services fee income and interest and other income. |
Certificates of Need
Our SNFs, specialty hospitals and healthcare assets are generally subject to federal, state and local licensure statutes and statutes that may impose building moratoriums or require regulatory approval, in the form of a CON, or variations thereof, issued by a governmental agency with jurisdiction over healthcare facilities or otherwise, prior to the expansion of existing facilities, construction of new facilities, addition of beds, acquisition of major equipment or introduction of new services. CON and similar requirements, which are not uniform throughout the United States, may provide some protection against competition, but also may restrict our or our operators’ ability to expand our properties in certain circumstances.
The following table summarizes the amount of our rental income derived by properties located in states with and without CON requirements (including variations thereof and building moratoriums) (excluding properties classified as held for sale) for the year ended December 31, 2015:
|
| | | | | | | | |
| | Percent of Rental Income |
| | SNFs | | Specialty Hospitals and Healthcare Assets | | Total |
| States with CON (or similar) requirements | 71.3 | % | | 11.4 | % | | 68.6 | % |
| States without CON (or similar) requirements | 28.7 |
| | 88.6 |
| | 31.4 |
|
| Total | 100.0 | % | | 100.0 | % | | 100.0 | % |
Net Investment in Direct Financing Lease
We own one SNF under a lease agreement that is classified as a direct financing lease, as the tenant has a purchase obligation at the end of the lease term. The net investment in direct financing lease is recorded as a receivable of $22.1 million on our combined consolidated balance sheets and represents the total undiscounted rental payments (including the tenant's purchase obligation), plus the estimated unguaranteed residual value, less the unearned lease income. Unearned lease income represents the excess of the minimum lease payments and residual values over the cost of the investment. Unearned lease income is deferred and amortized to income over the lease term to provide a constant yield when collectibility of the lease
payments is reasonably assured. See “Note 2—Accounting Policies” of the Notes to Combined Consolidated Financial Statements included in Part II, Item 8 of this Annual Report on Form 10-K.
Secured and Unsecured Loans Receivable, Net
As of December 31, 2015, we had $29.7 million of net loans receivable relating to SNFs and other healthcare properties or operators. Our loans receivable provide us with interest income, principal amortization and transaction fees and generally are secured by mortgage liens on the underlying properties, or other security, as well as corporate or personal guarantees by affiliates of the borrowing entity. In some cases, the loans are secured by a pledge of ownership interests in the entities that own the related properties. See “Note 5—Secured and Unsecured Loans Receivable, Net” of the Notes to Combined Consolidated Financial Statements included in Part II, Item 8 of this Annual Report on Form 10-K.
Segment Information
We evaluate our operating performance and allocate resources based on a single reportable business segment: triple-net leased properties.
Significant Tenants
The following table summarizes our tenant concentration (excluding properties classified as held for sale) as of and for the year ended December 31, 2015: |
| | | | | | | | |
| | Number of Properties Leased from CCP | | Percent of Total Real Estate Investments (1) | | Percent of Total Revenues |
| Senior Care Centers, LLC | 37 |
| | 19.2 | % | | 11.7 | % |
| Signature HealthCARE, LLC | 49 |
| | 8.5 |
| | 10.1 |
|
| Avamere Group, LLC | 29 |
| | 10.0 |
| | 10.2 |
|
| |
| (1) | Based on gross book value of tangible real estate property. |
Each of our leases with SCC, Signature and Avamere Group, LLC (together with its subsidiaries, “Avamere”) is a triple-net lease that obligates the tenant to pay all property-related expenses, including maintenance, utilities, repairs, taxes, insurance and capital expenditures.
Because our three largest tenants account for a meaningful portion of our total revenues, the failure or unwillingness of any of these tenants to satisfy its obligations to us or to renew its leases with us upon expiration of the terms thereof could have a material adverse effect on our business, financial condition, results of operations and liquidity. We cannot provide any assurances that SCC, Signature and Avamere and/or their respective subsidiaries or affiliates will have sufficient assets, income, access to financing and insurance coverage to enable them to satisfy their respective lease and other obligations to us. We also cannot provide any assurances that SCC, Signature or Avamere will elect to renew its leases with us upon expiration of the leases or that we will be able to reposition any non-renewed properties on a timely basis or on the same or better economic and other terms, if at all.
Competition
We generally compete for investments in SNFs and other healthcare assets with publicly traded, private and non-listed healthcare REITs, real estate partnerships, healthcare providers, healthcare lenders and other investors, including developers, banks, insurance companies, pension funds, government-sponsored entities and private equity firms, some of which have greater financial resources and lower costs of capital than we do. Increased competition challenges our ability to identify and successfully capitalize on opportunities that meet our objectives, which is affected by, among other factors, the availability of suitable acquisition or investment targets, our ability to negotiate acceptable transaction terms and our access to and cost of capital. See “Risk Factors—Risks Related to Our Business and Operations—We may not be successful in identifying and consummating suitable acquisitions or investment opportunities, which may impede our growth and negatively affect our results of operations and may result in the use of a significant amount of management resources” included in Item 1A of this Annual Report on Form 10-K and “Note 8—Borrowing Arrangements” of the Notes to Combined Consolidated Financial Statements included in Part II, Item 8 of this Annual Report on Form 10-K.
Our tenants also compete on a local and regional basis with other healthcare operating companies that provide comparable services. These operators compete to attract and retain residents and patients based on their hospital and managed
care relationships, scope and quality of care, reputation and financial condition, price, location and physical appearance of the properties, services offered, qualified personnel, physician referrals and family preferences. The ability of our tenants to compete successfully could be affected by private, federal and state reimbursement programs and other laws and regulations. See “Risk Factors—Risks Related to Our Business and Operations—Our operators may be adversely affected by increasing healthcare regulation and enforcement” and “—Our operators depend on reimbursement from government and other third-party payors; reductions in federal or state government spending, tax reform initiatives or other legislation to address projected operating deficits could have a material adverse effect on our operators’ liquidity, financial condition or results of operations, which could affect their ability to meet their obligations to us” included in Item 1A of this Annual Report on Form 10-K.
Employees
As of December 31, 2015, we had 56 employees, including 30 employees associated with our specialty healthcare and seniors housing valuation firm. None of our employees is subject to a collective bargaining agreement.
Insurance
We maintain or require in our leases and other agreements that our tenants maintain all applicable lines of insurance on our properties and their operations. We believe that the amount and scope of insurance coverage provided by our policies and the policies required to be maintained by our tenants are customary for similarly situated companies in our industry. Although we regularly monitor our tenants’ compliance with their respective insurance requirements, we cannot provide any assurances that they will maintain the required insurance coverages, and their failure, inability or unwillingness to do so could have a material adverse effect on our business, financial condition, results of operations and liquidity. We also cannot provide any assurances that we will continue to require the same levels of insurance coverage under our leases and other agreements, that such insurance coverage will be available at a reasonable cost in the future or that the policies maintained will fully cover all losses related to our properties upon the occurrence of a catastrophic event, nor can we provide any assurances as to the future financial viability of the insurers.
Additionally, we maintain a comprehensive corporate insurance program, including general liability, directors’ and officers’ liability and workers’ compensation policies, among others, to protect us, our directors, officers and certain employees against various liabilities in the ordinary course of our business. We obtain such policies in amounts and with the coverage and deductibles that we believe are adequate based on the nature and risks of our business, historical experience and industry standards.
For various reasons, including to reduce and manage costs, many healthcare companies utilize different organizational and corporate structures coupled with self-insurance trusts or captive programs that may provide less coverage than a traditional insurance policy. As a result, companies that self-insure could incur large funded and unfunded general and professional liability expenses, which could have a material adverse effect on their liquidity, financial condition and results of operations. The implementation of a trust or captive by any of our tenants could adversely affect its ability to comply with and satisfy its obligations under its leases and other agreements with us.
Emerging Growth Company Status
We are an “emerging growth company” as defined in the Jumpstart Our Business Startups Act (the “JOBS Act”). As such, we are eligible to take advantage of certain exemptions from various reporting requirements that apply to other public companies that are not emerging growth companies, including, but not limited to, compliance with the auditor attestation requirements of Section 404 of the Sarbanes-Oxley Act and the requirements to hold a non-binding advisory vote on executive compensation and any golden parachute payments not previously approved. If we do take advantage of some or all of these exemptions, some investors may find our common stock less attractive. The result may be a less active trading market for our common stock and our stock price may be more volatile.
In addition, Section 107 of the JOBS Act provides that an emerging growth company may take advantage of the extended transition period provided in Section 13(a) of the Exchange Act for complying with new or revised accounting standards. In other words, an emerging growth company can delay the adoption of certain accounting standards until those standards would otherwise apply to private companies. We have elected not to take advantage of the benefits of this extended transition period and, therefore, will be subject to the same new or revised accounting standards as other public companies that are not emerging growth companies. This election is irrevocable.
We will remain an emerging growth company until the earliest of (a) the last day of the first fiscal year in which our annual gross revenues exceed $1 billion, (b) December 31, 2020, which is the last day of the fiscal year following the fifth
anniversary of the date of the first sale of our common equity securities pursuant to an effective registration statement under the Securities Act, (c) the date that we become a “large accelerated filer” as defined in Rule 12b-2 under the Exchange Act, which would occur on the last day of the fiscal year in which the market value of our common stock that is held by non-affiliates exceeds $700 million as of the last business day of our most recently completed second fiscal quarter, or (d) the date on which we have issued more than $1 billion in non-convertible debt during the preceding three-year period.
Additional Information
CCP was incorporated in Delaware on April 2, 2015 for the purpose of holding the assets and liabilities associated with most of Ventas’s post-acute/SNF portfolio. The address of our principal executive offices is 191 North Wacker Drive, Suite 1200, Chicago, Illinois 60606. Our telephone number is (312) 881-4700.
We maintain a website at www.carecapitalproperties.com. Our website and the information contained therein or connected thereto shall not be deemed to be incorporated in this Annual Report on Form 10-K.
We make available, free of charge, through our website our Annual Report on Form 10-K, Quarterly Reports on Form 10-Q, Current Reports on Form 8-K and amendments to those reports filed or furnished pursuant to Section 13 or 15(d) of the Exchange Act as soon as reasonably practicable after we electronically file such material with, or furnish it to, the SEC. In addition, our Guidelines on Governance, our Global Code of Ethics and Business Conduct (including waivers from and amendments to that document) and the charters for each of our Audit and Compliance, Compensation, and Nominating and Governance Committees are available on our website, and we will mail copies of the foregoing documents to stockholders, free of charge, upon request to our Corporate Secretary at Care Capital Properties, Inc., 191 North Wacker Drive, Suite 1200, Chicago, Illinois 60606.
GOVERNMENTAL REGULATION
Overview
More than 95% of our rental income is attributable to properties in which our tenants receive reimbursement for their services under governmental healthcare programs, such as Medicare and Medicaid. We are neither a participant in, nor a direct recipient of, any reimbursement under these programs with respect to those facilities.
Although the properties within our portfolio may be subject to varying levels of governmental scrutiny, we expect that the healthcare industry, in general, will continue to face increased regulation and pressure in the areas of fraud, waste and abuse, cost control, healthcare management and provision of services, among others. We also expect that efforts by the federal Medicare program, state Medicaid programs and non-governmental third-party payors (including health maintenance organizations (“HMOs”) and other private insurance carriers), to impose greater discounts and more stringent cost controls upon operators (through changes in reimbursement rates and methodologies including the switch from fee-for-service to value-based payments, discounted fee structures, and accountable care organizations (“ACOs”) in which healthcare providers assume all or a portion of the financial risk or otherwise) will intensify and continue. A significant expansion of applicable federal, state or local laws and regulations, existing or future healthcare reform measures, new interpretations of existing laws and regulations, changes in enforcement priorities, or significant limits on the scope of services reimbursed or reductions in reimbursement rates could have a material adverse effect on certain of our operators’ liquidity, financial condition and results of operations and, in turn, their ability to satisfy their contractual obligations, including making rental payments under and otherwise complying with the terms of our leases.
Licensure, Certification and CONs
In general, the operators of our SNFs must be licensed on an annual or biannual basis and certified annually through various regulatory agencies that determine compliance with federal, state and local laws to participate in the Medicare and Medicaid programs. Legal requirements pertaining to such licensure and certification relate to the quality of nursing care provided by the operator, qualifications of the operator’s administrative personnel and nursing staff, adequacy of the physical plant and equipment and continuing compliance with laws and regulations governing the operation of SNFs. Similarly, the operators of our specialty hospitals must meet the applicable conditions of participation established by the U.S. Department of Health and Human Services (“HHS”) and comply with state and local laws and regulations in order to receive Medicare and Medicaid reimbursement. The failure to maintain or renew any required license or regulatory approval or to correct serious deficiencies identified in a compliance survey could prevent an operator from continuing operations at a property, and a loss of licensure or certification could adversely affect an operator’s ability to receive payments from the Medicare and Medicaid programs, which, in turn, could adversely affect its ability to satisfy its contractual obligations, including making rental
payments under and otherwise complying with the terms of our leases. This could also adversely affect the value of our properties, making them harder to transfer and/or increasing the need for additional capital expenditures.
In addition, many of our SNFs and specialty hospitals are subject to state CON laws that require governmental approval prior to the development or expansion of healthcare facilities and services. The approval process in these states generally requires a facility to demonstrate the need for additional or expanded healthcare facilities or services. CONs, where applicable, are also sometimes necessary for changes in ownership or control of licensed facilities, addition of beds, investment in major capital equipment, introduction of new services or termination of services previously approved through the CON process. CON laws and regulations may provide some protection against competition, but also may restrict an operator’s ability to expand our properties and grow its business in certain circumstances.
In contrast, seniors housing communities are subject to relatively few, if any, federal regulations. To the extent it exists, such regulation consists primarily of state and local laws governing licensure, provision of services, staffing requirements and other operational matters, which vary greatly from one jurisdiction to another.
Fraud and Abuse Enforcement
Federal and state laws and regulations prohibit a wide variety of fraud and abuse by healthcare providers who participate in, receive payments from or make or receive referrals for work in connection with government-funded healthcare programs, including Medicare and Medicaid. These federal laws include, among others:
| |
| • | the anti-kickback statute (Section 1128B(b) of the Social Security Act), which prohibits the payment, receipt or solicitation of any remuneration to induce a referral of any patient or service or item covered by a federal or state healthcare program; |
| |
| • | the physician self-referral prohibition (Ethics in Patient Referrals Act of 1989, commonly referred to as the “Stark Law”), which prohibits referrals by physicians of Medicare or Medicaid patients to healthcare providers with which the physicians (or their immediate family members) have ownership interests or certain other financial arrangements; |
| |
| • | the False Claims Act, which prohibits any person from knowingly presenting false or fraudulent claims for payment by the federal government (including the Medicare and Medicaid programs); |
| |
| • | the Civil Monetary Penalties Law, which authorizes HHS to impose civil penalties administratively for fraudulent acts; and |
| |
| • | the Health Insurance Portability and Accountability Act of 1996 (commonly referred to as “HIPAA”), which protects the privacy and security of personally identifiable health information by limiting its use and disclosure. |
Sanctions for violating these federal laws include criminal and civil penalties, such as punitive sanctions, damage assessments, monetary penalties, imprisonment, denial of Medicare and Medicaid payments, and exclusion from the Medicare and Medicaid programs. These laws also impose an affirmative duty on operators to ensure that they do not employ or contract with persons excluded from Medicare and other governmental healthcare programs.
Many states have adopted or are considering legislative proposals similar to the federal anti-fraud and abuse laws, some of which extend beyond the Medicare and Medicaid programs, to prohibit the payment or receipt of remuneration for the referral of patients and physician self-referrals, regardless of whether the service was reimbursed by Medicare or Medicaid. Many states have also adopted or are considering legislative proposals to increase patient protections, such as minimum staffing levels, criminal background checks and limiting the use and disclosure of patient specific health information. These state laws impose criminal and civil penalties similar to the federal laws.
In the ordinary course of their business, the operators of our properties have been and are subject regularly to inquiries, investigations and audits by federal and state agencies that oversee applicable laws and regulations. Increased funding through recent federal and state legislation and the creation of a series of new healthcare crimes by HIPAA have led to a significant expansion in the number and scope of investigations and enforcement actions over the past several years. As federal and state budget pressures persist, administrative agencies may continue to escalate their investigation and enforcement efforts to eliminate waste and control fraud and abuse in governmental healthcare programs. Private enforcement of healthcare fraud has also increased, due in large part to amendments to the civil False Claims Act in 1986 that were designed to encourage private individuals to sue on behalf of the government. These whistleblower suits by private individuals, known as qui tam suits, may
be filed by almost anyone, including present and former patients or nurses and other employees. A violation of federal or state anti-fraud and abuse laws or regulations by an operator of our properties could have a material adverse effect on the operator’s liquidity, financial condition or results of operations, which could adversely affect its ability to satisfy its contractual obligations, including making rental payments under and otherwise complying with the terms of our leases. We are not currently aware of any material pending investigations involving any of our operators.
Reimbursement
Sources of revenue for the majority of our operators include, among others, the federal Medicare program, state Medicaid programs and non-governmental third-party payors, such as HMOs and other private insurance carriers. As the U.S. Congress and state legislatures focus on healthcare reform initiatives, and as federal and state governments face significant current and future budget deficits, efforts to reduce costs by these payors are likely to continue beyond those already outlined in the Patient Protection and Affordable Care Act (together with its reconciliation measure, the Health Care and Education Reconciliation Act of 2010, the “Affordable Care Act”) and the Budget Control Act of 2011. New and evolving payor and provider programs in the United States, including Medicare Advantage, dual eligible demonstrations, ACOs and bundled payment programs, could result in reduced or slower growth in reimbursement for certain services provided by our operators. We cannot provide any assurances that existing or future healthcare reform legislation or changes in the administration or implementation of governmental and non-governmental healthcare reimbursement programs will not have a material adverse effect on our operators’ liquidity, financial condition or results of operations or on their ability to satisfy their obligations to us.
For example, the Medicare Access and CHIP Reauthorization Act of 2015 (“MACRA”), enacted in April 2015, permanently repeals the Sustainable Growth Rate payment formula for Medicare reimbursement rates on physician services and requires that Medicare payment rates for post-acute care providers will increase by no more than 1% for fiscal year 2018, after application of the productivity adjustment mandated by the Affordable Care Act. The full impact of MACRA on our operators is not yet known. Similarly, in an effort to reduce cost and enhance quality of care, on July 16, 2015, CMS published a proposed rule that would revise the requirements that long-term care facilities, including long-term acute care hospitals and SNFs, must meet to participate in the Medicare and Medicaid programs. The proposed rule outlines new quality and ethics requirements for facilities participating in Medicare and Medicaid, including, among other things, requirements for training staff, comprehensive person-centered care planning and the addition of behavioral health requirements. If the provisions in the proposed rule are finalized, they would require SNFs to: allow residents to choose their own roommates; offer visitation periods; limit bedrooms to no more than two residents; include a toilet, sink and shower in each room; and accommodate residents’ food allergies and religious and cultural preferences. This is a proposed rule and is not final. We are currently analyzing the financial implications of this proposed rule on our operators. The comment period has ended, but the final rule has not yet been issued. We cannot provide any assurances that the final rule issued by CMS will not materially adversely affect our operators.
SNF Medicare Reimbursement
For nearly 30 years, SNF operators have received payment from Medicare for their services under a fee-for-service reimbursement model, or prospective payment system known as “SNF PPS.” Under SNF PPS, payment amounts are based upon classifications determined through assessments of individual Medicare patients in the SNF, rather than on the facility’s reasonable costs. SNF PPS payments, which are made on a per diem basis for each resident, are generally intended to cover all inpatient services for Medicare patients, including routine nursing care, most capital-related costs associated with the inpatient stay and ancillary services, such as respiratory therapy, occupational and physical therapy, speech therapy and certain covered drugs, without regard to quality of care or patient outcome. Updates to SNF PPS payment rates are established by CMS and published annually for the federal fiscal year (October 1 through September 30).
On August 4, 2015, CMS published its final rule updating SNF PPS for the 2016 fiscal year (October 1, 2015 through September 30, 2016). Under the final rule, the SNF PPS standard federal payment rate would increase by 1.2% in fiscal year 2016, reflecting a 2.3% increase in the market basket index, less a 0.5% productivity adjustment and a 0.6% forecast error adjustment mandated by the Affordable Care Act. CMS estimates that net payments to SNFs as a result of the final rule will increase by approximately $430 million in fiscal year 2016. On October 5, 2015, CMS published a correction to the final rule correcting the calculations of certain wage rates in selected areas for SNFs and typographical errors. The overall rate increase of 1.2% remains unchanged. We regularly assess the financial implications of CMS’s rules and other federal legislation on our SNF operators, but we cannot provide any assurances that current rules or future updates to SNF PPS or Medicare reimbursement for SNFs will not have a material adverse effect on our operators’ liquidity, financial condition or results of operations or on their ability to satisfy their obligations to us.
Over the last several years, many public and private payors and healthcare providers have experimented with alternative payment models to address widespread concerns about increasing costs and care inefficiencies created by traditional
fee-for-service reimbursement methodologies. Some of the more prevalent alternative payment models include ACOs (in which a network of providers share responsibility for coordinating care within a defined expenditure limit), bundled payment arrangements (under which payors compensate providers with a single payment for an episode of care), pay for performance (through which providers are reimbursed based on the achievement of pre-determined quality measures), and patient centered medical homes (in which care is coordinated through a patient’s primary care physician). CMS is targeting 30% of all Medicare reimbursements to be made through alternative payment models by the end of 2016 and 50% of all Medicare reimbursements to be made through alternative payment models by the end of 2018. While still in their infancy, these alternative payment models evidence a gradual shift in the nation’s healthcare delivery and payment systems from volume-based to value-based care. We cannot provide any assurances as to the impact that this shift will ultimately have on our SNF operators.
SNF Medicaid Reimbursement
A significant portion of all SNF residents are dependent on Medicaid. Medicaid reimbursement rates, however, typically are less than the amounts charged by the operators of our SNFs. Although the federal government and states share responsibility for financing Medicaid, states have a wide range of discretion, within certain federal guidelines, to determine eligibility and reimbursement methodology. In addition, federal legislation limits an operator’s ability to withdraw from the Medicaid program by restricting the eviction or transfer of Medicaid residents. When state budget pressures escalate, in an effort to address actual or potential budget shortfalls, many state legislatures enact or propose reductions to Medicaid expenditures by implementing “freezes” or cuts in Medicaid rates paid to providers, including hospitals and SNFs, or by restricting eligibility and benefits.
We expect more states to adopt significant Medicaid rate freezes or cuts or other program changes as their reimbursement methodologies continue to evolve. Examples of these changes are Medicaid managed care, which deliver health benefits and additional services through contracted arrangements between state Medicaid agencies and managed care organizations that accept a set capitation payment for those services, and dual eligible demonstrations, which seek to coordinate care for individuals covered by both Medicare and Medicaid. In addition, the U.S. government may revoke, reduce or stop approving “provider taxes” or intergovernmental transfer payment programs that have the effect of increasing Medicaid payments within the states. We cannot predict the impact that any such actions would have on our SNF operators, nor can we provide any assurances that payments under Medicaid are now or in the future will be sufficient to fully reimburse those operators for the cost of providing skilled nursing services. Severe and widespread Medicaid rate cuts or freezes could materially adversely affect our SNF operators, which, in turn, could adversely affect their ability to satisfy their contractual obligations, including making rental payments under and otherwise complying with the terms of our leases.
State Medicaid Reimbursement: Texas
Our largest state, Texas, accounted for 22.2% of our revenues for the year ended December 31, 2015. In August 2015, CMS and the Texas Health and Human Services Commission (“THHC”) began a three-year federal/state partnership to better serve individuals eligible for both Medicare and Medicaid (“Dual Eligible”). THHC entered into agreements with several Medicaid-Medicare Plans (“MMPs”) with the following goals: minimize cost sharing; align incentives; streamline the process for providers; and improve the quality of care. The program, which commenced in August 2015, covers Dual Eligible individuals located in six of Texas’ most populous counties, and two to three MMPs are assigned to each county. Eligible individuals will be passively enrolled and assigned to an MMP, unless they opt out.
Notably, under the terms of the agreements with the MMPs, skilled nursing services may be provided without a preceding stay in an acute care hospital as long as the stay was authorized by the MMP prior to the stay and the care is clinically appropriate. In addition, patients can be moved from Medicaid to Medicare without sending the patient to an acute care hospital. Potential risks of this program, however, are disruptions in reimbursement payments, complex billing procedures, greater negotiation of service rates that currently mirror resource utilization groups (“RUGs”) levels and reduced length of stays for skilled nursing services over time.
While we regularly assess the ability of our operators in Texas and elsewhere to be able to operate profitably under these and other new rules, we cannot provide any assurances that the current rules or future changes to state Medicaid programs will not materially adversely affect our operators in Texas.
Environmental Regulation
As an owner of real property, we are subject to various federal, state and local environmental and health and safety laws and regulations. These laws and regulations address various matters, including asbestos, fuel oil management, wastewater
discharges, air emissions, medical wastes and hazardous wastes. The costs of complying with these laws and regulations and the penalties for non-compliance can be substantial. For example, although we do not operate or manage our properties, we may be held primarily or jointly and severally liable for costs relating to the investigation and clean-up of any property from which there has been a release or threatened release of a regulated material as well as other affected properties, regardless of whether we knew of or caused the release. In addition to these costs, which are typically not limited by law or regulation and could exceed the property’s value, we could be liable for certain other costs, including governmental fines and injuries to persons, property or natural resources.
Under the terms of our lease agreements, we generally have a right to indemnification by the tenants of our properties for any contamination caused by them. However, we cannot provide any assurances that our tenants will have the financial capability or willingness to satisfy their respective indemnification obligations to us, and any failure, inability or unwillingness to do so may require us to satisfy the underlying environmental claims.
In some cases, we have agreed to indemnify our tenants against any environmental claims (including penalties and clean-up costs) resulting from any condition arising in, on or under, or relating to, the leased properties at any time before the applicable lease commencement date, unless the tenant or operator contributed to the condition.
CERTAIN U.S. FEDERAL INCOME TAX CONSIDERATIONS
The following is a summary of certain U.S. federal income tax considerations that may be relevant to you as a holder of our common stock. This summary is based on the Internal Revenue Code of 1986, as amended (the “Code”), U.S. Department of the Treasury (the “Treasury”) regulations promulgated thereunder, rulings and other administrative pronouncements issued by the Internal Revenue Service (“IRS”), and judicial decisions, all as in effect on the date of this Annual Report on Form 10-K, all of which are subject to change or different interpretation, possibly with retroactive effect. The laws governing the U.S. federal income tax treatment of REITs and their stockholders are highly technical and complex, and this summary is qualified in its entirety by the authorities listed above. We cannot provide any assurances that the IRS would not assert, or that a court would not sustain, a position to the contrary to any of the tax consequences described below. We have not sought and do not intend to seek a ruling from the IRS regarding any matter discussed in this Annual Report on Form 10-K. This summary is also based upon the assumption that we and our subsidiaries and affiliated entities will operate in accordance with our and their applicable organizational documents or partnership agreements. This summary is for general information only and is not tax advice. It does not purport to discuss all aspects of U.S. federal income taxation that may be relevant to a particular investor in light of its particular investment or tax circumstances or to investors subject to special rules under the Code, including but not limited to:
| |
| • | regulated investment companies and REITs; |
| |
| • | foreign sovereigns and their controlled entities; |
| |
| • | partnerships and trusts; |
| |
| • | partners in partnerships that hold our common stock; |
| |
| • | persons who hold our shares on behalf of other persons as nominees; |
| |
| • | individuals who receive our common stock upon the exercise of employee stock options or otherwise as compensation; |
| |
| • | stockholders who hold our common stock as part of a “hedge,” “straddle,” “conversion,” “synthetic security,” “integrated investment” or “constructive sale transaction”; |
| |
| • | tax-exempt organizations; |
| |
| • | pass-through entities and persons holding our common stock through a partnership or other pass-through entity; |
| |
| • | traders in securities who elect to apply a mark-to-market method of accounting; and |
| |
| • | stockholders who are subject to alternative minimum tax. |
Finally, this summary does not address the U.S. federal income tax consequences to investors who will not hold our common stock as a capital asset within the meaning of Section 1221 of the Code (generally, property held for investment).
The U.S. federal income tax treatment of holders of our common stock depends in some instances on determinations of fact and interpretations of complex provisions of U.S. federal income tax law for which no clear precedent or authority may be available. In addition, the tax consequences to any particular stockholder of holding our common stock will depend on the stockholder’s particular tax circumstances. You are urged to consult your tax advisor regarding the U.S. federal, state, local, and foreign income and other tax consequences to you in light of your particular investment or tax circumstances of acquiring, holding, exchanging, or otherwise disposing of our common stock.
Taxation of CCP
We intend to elect to be taxed as a REIT under Sections 856 through 860 of the Code, commencing with our taxable year ended December 31, 2015. We believe that we will be organized, and we expect to operate, in such a manner as to qualify for taxation as a REIT under the applicable provisions of the Code.
Qualification and taxation as a REIT depends on our ability to meet on a continuing basis, through actual operating results, distribution levels and diversity of share and asset ownership, various qualification requirements imposed upon REITs by the Code. Our ability to qualify to be taxed as a REIT also requires that we satisfy certain tests, some of which depend upon the fair market values of assets that we own directly or indirectly. Such values may not be susceptible to a precise determination. Accordingly, we cannot provide any assurances that the actual results of our operations for any taxable year will satisfy such requirements for qualification and taxation as a REIT.
Taxation of REITs in General
As indicated above, our qualification and taxation as a REIT depends upon our ability to meet, on a continuing basis, various qualification requirements imposed upon REITs by the Code. The material qualification requirements are summarized below under “—Requirements for Qualification—General.” While we intend to operate so that we qualify and continue to qualify to be taxed as a REIT, no assurance can be given that the IRS will not challenge our qualification, or that we will be able to operate in accordance with the REIT requirements in the future. Please refer to “—Failure to Qualify.”
Provided that we qualify to be taxed as a REIT, generally we will be entitled to a deduction for dividends that we pay and therefore will not be subject to U.S. federal corporate income tax on our net REIT taxable income that is currently distributed to our stockholders. This treatment substantially eliminates the “double taxation” at the corporate and stockholder levels that generally results from an investment in a C corporation. A “C corporation” is a corporation that generally is required to pay tax at the corporate level. “Double taxation” means taxation once at the corporate level when income is earned and once again at the stockholder level when the income is distributed. In general, the income that we generate is taxed only at the stockholder level upon a distribution of dividends to our stockholders.
Under current law, most U.S. stockholders that are individuals, trusts or estates are taxed on corporate dividends at a maximum U.S. federal income tax rate of 23.8% (the same as the current rate for long-term capital gains), including the 3.8% Medicare tax described below. With limited exceptions, however, dividends from us or from other entities that are taxed as REITs are generally not eligible for this rate and will continue to be taxed at rates applicable to ordinary income. Presently, the highest marginal non-corporate U.S. federal income tax rate applicable to ordinary income is 39.6%. Please refer to “—Taxation of Stockholders—Distributions.”
Any net operating losses, foreign tax credits and other tax attributes generally do not pass through to our stockholders, subject to special rules for certain items such as the capital gains that we recognize. Please refer to “—Taxation of Stockholders-Distributions.”
If we qualify to be taxed as a REIT, we will nonetheless be subject to U.S. federal tax in the following circumstances:
| |
| • | We will be taxed at regular corporate rates on any undistributed net taxable income, including undistributed net capital gains; |
| |
| • | We may be subject to the “alternative minimum tax” on our items of tax preference, including any deductions of net operating losses; |
| |
| • | If we have net income from prohibited transactions, which are, in general, sales or other dispositions of inventory or property held primarily for sale to customers in the ordinary course of business, other than foreclosure property, such income will be subject to a 100% tax. Please refer to “—Prohibited Transactions” and “—Foreclosure Property” below; |
| |
| • | If we elect to treat property that we acquire in connection with a foreclosure of a mortgage loan or certain leasehold terminations as “foreclosure property,” we may thereby avoid the 100% tax on gain from a resale of that property (if the sale would otherwise constitute a prohibited transaction), but the income from the sale or operation of the property may be subject to corporate income tax at the highest applicable rate (currently 35%); |
| |
| • | If we fail to satisfy the 75% gross income test and/or the 95% gross income test, as discussed below, but nonetheless maintain our qualification as a REIT because we satisfy certain other requirements, we may be subject to a penalty tax. In that case, the amount of the penalty tax will be (1) the greater of (A) the amount by which we fail to satisfy the 75% gross income test and (B) the amount by which we fail to satisfy the 95% gross income test, multiplied by (2) a fraction intended to reflect our profitability; |
| |
| • | If we violate the asset tests (other than certain de minimis violations) or other requirements applicable to REITs, as described below, and yet maintain our qualification as a REIT because there is reasonable cause for the failure and other applicable requirements are met, we may be subject to a penalty tax. In that case, the amount of the penalty tax will be at least $50,000 per failure, and, in the case of certain asset test failures, will be determined as the amount of net income generated by the non-qualifying assets in question multiplied by the highest corporate tax rate (currently 35%) if that amount exceeds $50,000 per failure; |
| |
| • | If we fail to distribute during each calendar year at least the sum of (i) 85% of our ordinary income for such year, (ii) 95% of our REIT capital gain net income for such year and (iii) any undistributed net taxable income from prior periods, we will be subject to a non-deductible 4% excise tax on the excess of the required distribution over the sum of (a) the amounts that we actually distributed and (b) the amounts we retained and upon which we paid income tax at the corporate level; |
| |
| • | We may be required to pay monetary penalties to the IRS in certain circumstances, including if we fail to meet record-keeping requirements intended to monitor our compliance with rules relating to the composition of a REIT’s stockholders, as described below in “—Requirements for Qualification—General;” |
| |
| • | A 100% tax may be imposed on transactions between us and a taxable REIT subsidiary (“TRS”) that do not reflect arm’s-length terms; |
| |
| • | If we acquire appreciated assets from a corporation that is not a REIT (i.e., a corporation taxable under subchapter C of the Code) in a transaction in which the adjusted tax basis of the assets in our hands is determined by reference to the adjusted tax basis of the assets in the hands of the subchapter C corporation, we may be subject to tax on such appreciation at the highest corporate income tax rate then applicable if we subsequently recognize gain on a disposition of any such assets during the five-year period following their acquisition from the subchapter C corporation; and |
| |
| • | The earnings of any subsidiaries that are subchapter C corporations, including any TRSs, will generally be subject to U.S. federal corporate income tax. |
In addition, we and our subsidiaries may be subject to a variety of taxes, including payroll taxes and state, local, and foreign income, property, gross receipts and other taxes on our assets and operations. We could also be subject to tax in situations and on transactions not presently contemplated.
Requirements for Qualification—General
The Code defines a REIT as a corporation, trust or association:
| |
| (1) | that is managed by one or more trustees or directors; |
| |
| (2) | the beneficial ownership of which is evidenced by transferable shares, or by transferable certificates of beneficial interest; |
| |
| (3) | that would be taxable as a domestic corporation but for its election to be subject to tax as a REIT; |
| |
| (4) | that is neither a financial institution nor an insurance company subject to specific provisions of the Code; |
| |
| (5) | the beneficial ownership of which is held by 100 or more persons; |
| |
| (6) | in which, during the last half of each taxable year, not more than 50% in value of the outstanding equity is owned, directly or indirectly, by five or fewer “individuals” (as defined in the Code to include specified tax-exempt entities); and |
| |
| (7) | that meets other tests described below, including with respect to the nature of its income and assets. |
The Code provides that conditions (1) through (4) must be met during the entire taxable year, and that condition (5) must be met during at least 335 days of a taxable year of 12 months, or during a proportionate part of a shorter taxable year. Conditions (5) and (6) need not be met during a corporation’s initial tax year as a REIT (which, in our case, will be the taxable year ended December 31, 2015). Our certificate of incorporation includes restrictions regarding the ownership and transfers of our shares, which are intended to assist us in satisfying the share ownership requirements described in conditions (5) and (6) above. These restrictions, however, may not ensure that we will, in all cases, be able to satisfy the share ownership requirements described in conditions (5) and (6) above. If we fail to satisfy these share ownership requirements, except as provided in the next sentence, our status as a REIT will terminate. If, however, we comply with the rules contained in applicable Treasury regulations that require us to ascertain the actual ownership of our shares and we do not know, or would not have known through the exercise of reasonable diligence, that we failed to meet the requirements described in condition (6) above, we will be treated as having met this requirement.
To monitor compliance with the share ownership requirements, we generally are required to maintain records regarding the actual ownership of our shares. To do so, we must demand written statements each year from the record holders of significant percentages of our shares pursuant to which the record holders must disclose the actual owners of the shares (i.e., the persons required to include our dividends in their gross income). We must maintain a list of those persons failing or refusing to comply with this demand as part of our records. We could be subject to monetary penalties if we fail to comply with these record-keeping requirements. If you fail or refuse to comply with the demands, you will be required by Treasury regulations to submit a statement with your tax return disclosing your actual ownership of our shares and other information.
In addition, a corporation generally may not elect to become a REIT unless its taxable year is the calendar year. We intend to adopt December 31 as our year-end, and thereby satisfy this requirement.
Effect of Subsidiary Entities
Ownership of Partnership Interests
If we are a partner in an entity that is treated as a partnership for U.S. federal income tax purposes, Treasury regulations provide that we are deemed to own our proportionate share of the partnership’s assets, and to earn our proportionate share of the partnership’s income, without regard to whether the partners received a distribution from the partnership, for purposes of the asset and gross income tests applicable to REITs. Our proportionate share of a partnership’s assets and income is based on our capital interest in the partnership (except that for purposes of the 10% asset test, described below, our proportionate share of the partnership’s assets is based on our proportionate interest in the equity and certain debt securities issued by the partnership). In addition, the assets and gross income of the partnership are deemed to retain the same character in our hands. Thus, our proportionate share of the assets and income of any of our subsidiary partnerships will be treated as our assets and items of income for purposes of applying the REIT requirements. In addition, any change in the status of any partnership for tax purposes might be treated as a taxable event, in which case we could have taxable income that is subject to REIT distribution requirements without receiving any cash.
If we become a limited partner or non-managing member in any partnership or limited liability company and such entity takes or expects to take actions that could jeopardize our status as a REIT or require us to pay tax, we may be forced to dispose of our interest in such entity. In addition, it is possible that a partnership or limited liability company could take an action which could cause us to fail a gross income or asset test, and that we would not become aware of such action in time to dispose of our interest in the partnership or limited liability company or take otherwise corrective action on a timely basis. In that case, we could fail to qualify to be taxed as a REIT unless we were entitled to relief, as described below.
Under the Code and the Treasury regulations, income, gain, loss and deduction attributable to appreciated or depreciated property that is contributed to a partnership in exchange for an interest in the partnership must be allocated for tax purposes so that the contributing partner is charged with, or benefits from, the unrealized gain or unrealized loss associated with the property at the time of the contribution. The amount of the unrealized gain or unrealized loss is generally equal to the difference between the fair market value of the contributed property at the time of contribution, and the adjusted tax basis of such property at the time of contribution, or a book-tax difference. Such allocations are solely for federal income tax purposes and do not affect the book capital accounts or other economic or legal arrangements among the partners.
To the extent that any of our subsidiary partnerships acquires appreciated (or depreciated) properties by way of capital contributions from its partners, allocations would need to be made in a manner consistent with these requirements. Where a partner contributes cash to a partnership at a time that the partnership holds appreciated (or depreciated) property, the Treasury regulations provide for a similar allocation of these items to the other (i.e., non-contributing) partners. These rules may apply to a contribution that we make to any subsidiary partnerships of the cash proceeds received in offerings of our shares. As a result, the partners of our subsidiary partnerships, including us, could be allocated greater or lesser amounts of depreciation and taxable income in respect of a partnership’s properties than would be the case if all of the partnership’s assets (including any contributed assets) had a tax basis equal to their fair market values at the time of any contributions to that partnership. This could cause us to recognize, over a period of time, taxable income in excess of cash flow from the partnership, which might adversely affect our ability to comply with the REIT distribution requirements discussed above.
Disregarded Subsidiaries
If we own a corporate subsidiary that is a “qualified REIT subsidiary,” that subsidiary is generally disregarded as a separate entity for U.S. federal income tax purposes, and all of the subsidiary’s assets, liabilities and items of income, deduction and credit are treated as our assets, liabilities and items of income, deduction and credit, including for purposes of the gross income and asset tests applicable to REITs. A qualified REIT subsidiary is any corporation, other than a TRS (as described below), that is directly or indirectly wholly owned by a REIT. Other entities that are wholly owned by us, including single member limited liability companies that have not elected to be taxed as corporations for U.S. federal income tax purposes, are also generally disregarded as separate entities for U.S. federal income tax purposes, including for purposes of the REIT income and asset tests. Disregarded subsidiaries, along with any partnerships in which we hold an equity interest, are sometimes referred to herein as “pass-through subsidiaries.”
In the event that a disregarded subsidiary of ours ceases to be wholly owned—for example, if any equity interest in the subsidiary is acquired by a person other than us or another disregarded subsidiary of ours—the subsidiary’s separate existence would no longer be disregarded for U.S. federal income tax purposes. Instead, the subsidiary would have multiple owners and would be treated as either a partnership or a taxable corporation. Such an event could, depending on the circumstances, adversely affect our ability to satisfy the various asset and gross income requirements applicable to REITs, including the requirement that the REITs generally may not own, directly or indirectly, more than 10% of the securities of another corporation. Please refer to “—Asset Tests” and “—Income Tests.”
Taxable REIT Subsidiaries
In general, we may jointly elect with a subsidiary corporation, whether or not wholly owned, to treat such subsidiary corporation as a TRS. We generally may not own more than 10% of the securities of a taxable corporation, as measured by voting power or value, unless we and such corporation elect to treat such corporation as a TRS. The separate existence of a TRS or other taxable corporation is not ignored for U.S. federal income tax purposes. Accordingly, a TRS or other taxable subsidiary corporation generally is subject to corporate income tax on its earnings, which may reduce the cash flow that we and our subsidiaries generate in the aggregate and may reduce our ability to make distributions to our stockholders.
A TRS may not directly or indirectly operate or manage any healthcare facilities or lodging facilities or provide rights to any brand name under which any healthcare facility or lodging facility is operated. A TRS may provide rights to any brand name under which any healthcare facility or lodging facility is operated if such rights are provided to an “eligible independent contractor” (as described below) to operate or manage a healthcare facility or lodging facility if such rights are held by the TRS
as a franchisee, licensee or in a similar capacity and such healthcare facility or lodging facility is owned by the TRS or leased to the TRS by its parent REIT. A TRS will not be treated as operating or managing a “qualified healthcare property” or a “qualified lodging facility” solely because the TRS directly or indirectly possesses a license, permit or similar instrument enabling it to do so.
We are not treated as holding the assets of a TRS or other taxable subsidiary corporation or as receiving any income that the subsidiary earns. Rather, the stock issued by a taxable subsidiary corporation to us is an asset in our hands, and we treat the dividends paid to us from such taxable subsidiary corporation, if any, as income. This treatment can affect our income and asset test calculations, as described below. Because we do not include the assets and income of TRSs or other taxable subsidiary corporations on a look-through basis in determining our compliance with the REIT requirements, we may use such entities to undertake indirectly activities that the REIT rules might otherwise preclude us from doing directly or through pass-through subsidiaries. For example, we may use TRSs or other taxable subsidiary corporations to perform services or conduct activities that give rise to certain categories of income or to conduct activities that, if conducted by us directly, would be treated in our hands as prohibited transactions.
The “earnings stripping” rules of Section 163(j) of the Code may limit the deductibility of interest paid or accrued by a TRS to its parent REIT to assure that the TRS is subject to an appropriate level of corporate taxation. Accordingly, if we lend money to a TRS, the TRS may be unable to deduct all or a part of the interest paid on that loan, and the lack of an interest deduction could result in a material increase in the amount of tax paid by the TRS. Further, the TRS rules impose a 100% excise tax on transactions between a TRS and its parent REIT or the REIT’s tenants that are not conducted on an arm’s-length basis. We intend that all of our transactions with our TRS, if any, will be conducted on an arm’s-length basis.
We may hold a significant amount of assets in one or more TRSs, subject to the limitation that securities in TRSs may not represent more than 25% (20% for taxable years beginning after December 31, 2017) of our assets.
Income Tests
In order to qualify to be taxed as a REIT, we must satisfy two gross income requirements on an annual basis. First, at least 75% of our gross income for each taxable year, excluding gross income from sales of inventory or dealer property in “prohibited transactions,” discharge of indebtedness and certain hedging transactions, generally must be derived from “rents from real property,” gains from the sale of real estate assets, interest income derived from mortgage loans secured by real property (including certain types of mortgage-backed securities), dividends received from other REITs, and specified income from temporary investments. Second, at least 95% of our gross income in each taxable year, excluding gross income from prohibited transactions, discharge of indebtedness and certain hedging transactions, must be derived from some combination of income that qualifies under the 75% gross income test described above, as well as other dividends, interest, and gain from the sale or disposition of equity or securities, which need not have any relation to real property. Income and gain from certain hedging transactions will be excluded from both the numerator and the denominator for purposes of both the 75% and 95% gross income tests.
Rents from Real Property
Rents we receive from a tenant will qualify as “rents from real property” for the purpose of satisfying the gross income requirements for a REIT described above only if all of the conditions described below are met.
| |
| • | The amount of rent is not based in whole or in part on the income or profits of any person. However, an amount we receive or accrue generally will not be excluded from the term “rents from real property” solely because it is based on a fixed percentage or percentages of receipts or sales; |
| |
| • | Neither we nor an actual or constructive owner of 10% or more of our shares actually or constructively owns 10% or more of a tenant from whom we receive rent, other than a TRS. Rents we receive from a TRS will qualify as “rents from real property” as long as the “qualified healthcare property” is operated on behalf of the TRS by an “independent contractor” who is adequately compensated, who does not, directly or through its stockholders, own more than 35% of our shares, taking into account certain ownership attribution rules, and who is, or is related to a person who is, actively engaged in the trade or business of operating “qualified healthcare properties” for any person unrelated to us and our TRS lessee (an “eligible independent contractor”). A “qualified healthcare property” includes any real property and any personal property that is, or is necessary or incidental to the use of, a hospital, nursing facility, assisted living facility, congregate care facility, qualified continuing care facility or other licensed facility which extends medical or nursing or ancillary services to patients and which is operated by a provider of such services which is eligible for participation in the Medicare program with respect to such facility; |
| |
| • | Rent attributable to personal property that is leased in connection with a lease of real property is not greater than 15% of the total rent received under the lease. If this condition is not met, then the portion of the rent attributable to personal property will not qualify as “rents from real property”; and |
| |
| • | We generally are not permitted to furnish or render services to our tenants, other than through an “independent contractor” who is adequately compensated and from whom we do not derive revenue. However, we need not provide services through an “independent contractor,” but instead may provide services directly to our tenants, if the services are “usually or customarily rendered” in connection with the rental of space for occupancy only and are not considered to be provided for the tenants’ convenience. In addition, we may provide a minimal amount of “non-customary” services to the tenants of a property, other than through an independent contractor, as long as our income from the services (valued at not less than 150% of our direct cost of performing such services) does not exceed 1% of our income from the related property. Further, we may own up to 100% of the stock of a TRS, which may provide customary and non-customary services to our tenants without tainting our rental income for the related properties. See “—Taxable REIT Subsidiaries.” |
Interest Income
Interest income constitutes qualifying mortgage interest for purposes of the 75% gross income test (as described above) to the extent that the obligation upon which such interest is paid is secured by a mortgage on real property. If we receive interest income with respect to a mortgage loan that is secured by both real property and other property, and the highest principal amount of the loan outstanding during a taxable year exceeds the fair market value of the real property on the date that we acquired or originated the mortgage loan, the interest income will be apportioned between the real property and the other collateral, and our income from the arrangement will qualify for purposes of the 75% gross income test only to the extent that the interest is allocable to the real property. Even if a loan is not secured by real property, or is undersecured, the income that it generates may nonetheless qualify for purposes of the 95% gross income test. For these purposes, the term “interest” generally does not include any amount received or accrued, directly or indirectly, if the determination of all or some of the amount depends in any way on the income or profits of any person. However, an amount received or accrued generally will not be excluded from the term “interest” solely by reason of being based on a fixed percentage or percentages of receipts or sales.
Dividend Income
We may directly or indirectly receive distributions from TRSs or other corporations that are not REITs or qualified REIT subsidiaries. These distributions generally are treated as dividend income to the extent of the current and accumulated earnings and profits of the distributing corporation. Such distributions will generally constitute qualifying income for purposes of the 95% gross income test, but not for purposes of the 75% gross income test. Any dividends that we receive from another REIT, however, will be qualifying income for purposes of both the 95% and 75% gross income tests. We will monitor the amount of the dividend and other income from our TRSs and will take actions intended to keep this income, and any other non-qualifying income, within the limitations of the gross income tests. Although we expect these actions will be sufficient to prevent a violation of the gross income tests, we cannot guarantee that such actions will in all cases prevent such a violation.
Fee Income
Any fee income that we earn will generally not be qualifying income for purposes of either gross income test. Any fees earned by a TRS, however, will not be included for purposes of our gross income tests.
Failure to Satisfy the Gross Income Tests
If we fail to satisfy one or both of the 75% or 95% gross income tests for any taxable year, we may still qualify to be taxed as a REIT for such year if we are entitled to relief under applicable provisions of the Code. These relief provisions will be generally available if (i) our failure to meet these tests was due to reasonable cause and not due to willful neglect and (ii) following our identification of the failure to meet the 75% or 95% gross income test for any taxable year, we file a schedule with the IRS setting forth each item of our gross income for purposes of the 75% or 95% gross income test for such taxable year in accordance with Treasury regulations, which have not yet been issued. It is not possible to state whether we would be entitled to the benefit of these relief provisions in all circumstances. If these relief provisions are inapplicable to a particular set of circumstances, we will not qualify to be taxed as a REIT. Even if these relief provisions apply and we retain our status as a REIT, the Code imposes a tax based upon the amount by which we fail to satisfy the particular gross income test. We may not always be able to comply with the gross income tests for REIT qualification despite periodic monitoring of our income.
The Secretary of the Treasury has been given broad authority to determine whether particular items of gain or income qualify or not under the 75% and 95% gross income tests, or are to be excluded from the measure of gross income for such purposes.
Asset Tests
At the close of each calendar quarter, we must also satisfy four tests relating to the nature of our assets. First, at least 75% of the value of our total assets must be represented by some combination of “real estate assets,” cash, cash items, U.S. government securities, and, under some circumstances, debt or equity instruments purchased with new capital. For this purpose, real estate assets include interests in real property and shares of other corporations that qualify as REITs, as well as some kinds of mortgage-backed securities and mortgage loans. For taxable years beginning after December 31, 2015, the term “real estate assets” also includes (i) personal property securing a mortgage secured by both real property and personal property if the fair market value of such personal property does not exceed 15% of the total fair market value of all such property and (ii) personal property leased in connection with a lease of real property for which the rent attributable to personal property is not greater than 15% of the total rent received under the lease. In addition, for taxable years beginning after December 31, 2015, if not more than 25% of the value of our total assets is represented by debt instruments of publicly offered REITs, such debt instruments will be treated as real estate assets. Assets that do not qualify for purposes of the 75% asset test are subject to the additional asset tests described below.
Second, the value of any one issuer’s securities that we own may not exceed 5% of the value of our total assets.
Third, we may not own more than 10% of any one issuer’s outstanding securities, as measured by either voting power or value. The 5% and 10% asset tests do not apply to securities of TRSs and qualified REIT subsidiaries and the 10% asset test does not apply to “straight debt” having specified characteristics and to certain other securities described below. Solely for purposes of the 10% asset test, the determination of our interest in the assets of a partnership or limited liability company in which we own an interest will be based on our proportionate interest in any securities issued by the partnership or limited liability company, excluding for this purpose certain securities described in the Code.
Fourth, the aggregate value of all securities of TRSs that we hold, together with other non-qualified assets (such as furniture and equipment or other tangible personal property, or non-real estate securities) may not, in the aggregate, exceed 25% (20% for taxable years beginning after December 31, 2017) of the value of our total assets.
Notwithstanding the general rule, as noted above, that for purposes of the REIT income and asset tests we are treated as owning our proportionate share of the underlying assets of a subsidiary partnership, if we hold indebtedness issued by a partnership, the indebtedness will be subject to, and may cause a violation of, the asset tests unless the indebtedness is a qualifying mortgage asset or other conditions are met. Similarly, although shares of another REIT are qualifying assets for purposes of the REIT asset tests, any non-mortgage debt that is issued by another REIT may not so qualify (although such debt will not be treated as “securities” for purposes of the 10% asset test, as explained below).
Certain securities will not cause a violation of the 10% asset test (for purposes of value) described above. Such securities include instruments that constitute “straight debt,” which term includes, among other things, securities having certain contingency features. A security does not qualify as “straight debt” where a REIT (or a controlled TRS of the REIT) owns other securities of the same issuer which do not qualify as straight debt, unless the value of those other securities constitute, in the aggregate, 1% or less of the total value of that issuer’s outstanding securities. In addition to straight debt, the Code provides that certain other securities will not violate the 10% asset test. Such securities include (i) any loan made to an individual or an estate, (ii) certain rental agreements pursuant to which one or more payments are to be made in subsequent years (other than agreements between a REIT and certain persons related to the REIT under attribution rules), (iii) any obligation to pay rents from real property, (iv) securities issued by governmental entities that are not dependent in whole or in part on the profits of (or payments made by) a non-governmental entity, (v) any security (including debt securities) issued by another REIT and (vi) any debt instrument issued by a partnership if the partnership’s income is of a nature that it would satisfy the 75% gross income test described above under “—Income Tests.” In applying the 10% asset test, a debt security issued by a partnership is not taken into account to the extent, if any, of the REIT’s proportionate interest in the equity and certain debt securities issued by that partnership.
No independent appraisals have been obtained to support our conclusions as to the value of our total assets or the value of any particular security or securities. Moreover, the values of some assets may not be susceptible to a precise determination, and values are subject to change in the future. Furthermore, the proper classification of an instrument as debt or equity for U.S. federal income tax purposes may be uncertain in some circumstances, which could affect the application of the REIT asset
requirements. Accordingly, there can be no assurance that the IRS will not contend that our interests in our subsidiaries or in the securities of other issuers will not cause a violation of the REIT asset tests.
However, certain relief provisions are available to allow REITs to satisfy the asset requirements or to maintain REIT qualification notwithstanding certain violations of the asset and other requirements. For example, if we should fail to satisfy the asset tests at the end of a calendar quarter such a failure would not cause us to lose our REIT qualification if we (i) satisfied the asset tests at the close of the preceding calendar quarter and (ii) the discrepancy between the value of our assets and the asset requirements was not wholly or partially caused by an acquisition of non-qualifying assets, but instead arose from changes in the relative market values of our assets. If the condition described in (ii) were not satisfied, we still could avoid disqualification by eliminating any discrepancy within 30 days after the close of the calendar quarter in which it arose or by making use of the relief provisions described above.
In the case of de minimis violations of the 10% and 5% asset tests, a REIT may maintain its qualification despite a violation of such requirements if (i) the value of the assets causing the violation does not exceed the lesser of 1% of the REIT’s total assets and $10,000,000 and (ii) the REIT either disposes of the assets causing the failure within six months after the last day of the quarter in which it identifies the failure, or the relevant tests are otherwise satisfied within that time frame.
Even if we did not qualify for the foregoing relief provisions, one additional provision allows a REIT that fails one or more of the asset requirements to nevertheless maintain its REIT qualification if (i) the REIT provides the IRS with a description of each asset causing the failure, (ii) the failure is due to reasonable cause and not willful neglect, (iii) the REIT pays a tax equal to the greater of (a) $50,000 per failure and (b) the product of the net income generated by the assets that caused the failure multiplied by the highest applicable corporate tax rate (currently 35%) and (iv) the REIT either disposes of the assets causing the failure within six months after the last day of the quarter in which it identifies the failure, or otherwise satisfies the relevant asset tests within that time frame.
Annual Distribution Requirements
In order to qualify to be taxed as a REIT, we are required to distribute dividends, other than capital gain dividends, to our stockholders in an amount at least equal to: (i) the sum of (a) 90% of our REIT taxable income, computed without regard to our net capital gains and the deduction for dividends paid; and (b) 90% of our after-tax net income, if any, from foreclosure property (as described below); minus (ii) the excess of the sum of specified items of non-cash income over 5% of our REIT taxable income, computed without regard to our net capital gain and the deduction for dividends paid.
We generally must make these distributions in the taxable year to which they relate, or in the following taxable year if declared before we timely file our tax return for the year and if paid with or before the first regular dividend payment after such declaration. These distributions will be treated as received by our stockholders in the year in which paid.
To the extent that we distribute at least 90%, but less than 100%, of our REIT taxable income, as adjusted, we will be subject to tax at ordinary corporate tax rates on the retained portion. We may elect to retain, rather than distribute, some or all of our net long-term capital gains and pay tax on such gains. In this case, we could elect for our stockholders to include their proportionate shares of such undistributed long-term capital gains in income, and to receive a corresponding credit for their share of the tax that we paid. Our stockholders would then increase the adjusted basis of their shares by the difference between (i) the amounts of capital gain dividends that we designated and that they include in their taxable income, minus (ii) the tax that we paid on their behalf with respect to that income.
To the extent that in the future we may have available net operating losses carried forward from prior tax years, such losses may reduce the amount of distributions that we must make in order to comply with the REIT distribution requirements. Such losses, however, will generally not affect the tax treatment to our stockholders of any distributions that are actually made. Please refer to “—Taxation of Stockholders—Distributions.”
If we fail to distribute during each calendar year at least the sum of (i) 85% of our ordinary income for such year, (ii) 95% of our capital gain net income for such year and (iii) any undistributed net taxable income from prior periods, we will be subject to a non-deductible 4% excise tax on the excess of such required distribution over the sum of (a) the amounts actually distributed, plus (b) the amounts of income we retained and on which we have paid corporate income tax.
We expect that our REIT taxable income will be less than our cash flow because of depreciation and other non-cash charges included in computing REIT taxable income. Accordingly, we anticipate that we generally will have sufficient cash or liquid assets to enable us to satisfy the distribution requirements described above. However, from time to time, we may not have sufficient cash or other liquid assets to meet these distribution requirements due to timing differences between the actual
receipt of income and actual payment of deductible expenses, and the inclusion of income and deduction of expenses in determining our taxable income. In addition, we may decide to retain our cash, rather than distribute it, in order to repay debt, acquire assets, or for other reasons. If these timing differences occur, we may borrow funds to pay dividends or pay dividends through the distribution of other property (including our shares) in order to meet the distribution requirements, while preserving our cash.
If our taxable income for a particular year is subsequently determined to have been understated, we may be able to rectify a resultant failure to meet the distribution requirements for a year by paying “deficiency dividends” to stockholders in a later year, which may be included in our deduction for dividends paid for the earlier year but treated as an additional distribution to our stockholders in the year such dividends are paid. In this case, we may be able to avoid losing REIT qualification or being taxed on amounts distributed as deficiency dividends, subject to the 4% excise tax described above. We will be required to pay interest based on the amount of any deduction taken for deficiency dividends.
For purposes of the 90% distribution requirement and excise tax described above, any dividend that we declare in October, November or December of any year and that is payable to a stockholder of record on a specified date in any such month will be treated as both paid by us and received by the stockholder on December 31 of such year, provided that we actually pay the dividend before the end of January of the following calendar year.
Prohibited Transactions
Net income that we derive from a prohibited transaction is subject to a 100% tax. The term “prohibited transaction” generally includes a sale or other disposition of property (other than foreclosure property, as discussed below) that is held as inventory or primarily for sale to customers in the ordinary course of a trade or business. We intend to conduct our operations so that no asset that we own (or are treated as owning) will be treated as, or having been, held as inventory or for sale to customers, and that a sale of any such asset will not be treated as having been in the ordinary course of our business. Whether property is held as inventory or “primarily for sale to customers in the ordinary course of a trade or business” depends on the particular facts and circumstances. No assurance can be given that any property that we sell will not be treated as inventory or property held for sale to customers, or that we can comply with certain safe harbor provisions of the Code that would prevent such treatment. The 100% tax does not apply to gains from the sale of property that is held through a TRS or other taxable corporation, although such income will be subject to tax in the hands of the corporation at regular corporate rates. We intend to structure our activities to avoid prohibited transaction characterization.
Like-Kind Exchanges
We may dispose of properties in transactions intended to qualify as like-kind exchanges under the Code. Such like-kind exchanges are intended to result in the deferral of gain for U.S. federal income tax purposes. The failure of any such transaction to qualify as a like-kind exchange could require us to pay federal income tax, possibly including the 100% prohibited transaction tax, depending on the facts and circumstances surrounding the particular transactions.
Derivatives and Hedging Transactions
We may enter into hedging transactions with respect to interest rate exposure on one or more of our assets or liabilities. Any such hedging transactions could take a variety of forms, including the use of derivative instruments such as interest rate swap contracts, interest rate cap or floor contracts, futures or forward contracts, and options. Except to the extent provided by Treasury regulations, any income from a hedging transaction we enter into (i) in the ordinary course of our business primarily to manage risk of interest rate or price changes or currency fluctuations with respect to borrowings made or to be made, or ordinary obligations incurred or to be incurred, to acquire or carry “real estate assets” (as described above under “—Asset Tests”), which is clearly identified as specified in Treasury regulations before the close of the day on which it was acquired, originated, or entered into, including gain from the sale or disposition of a position in such a transaction, (ii) primarily to manage risk of currency fluctuations with respect to any item of income or gain that would be qualifying income under the 75% or 95% income tests (or any asset that produces such income) which is clearly identified as such before the close of the day on which it was acquired, originated, or entered into and (iii) for taxable years after December 31, 2015, to hedge the income or loss from prior hedging transactions, where the property or indebtedness which was the subject of the prior hedging transaction was extinguished or disposed of, will not constitute gross income for purposes of the 75% or 95% gross income test. To the extent that we enter into hedging transactions that are not described in the preceding clauses (i), (ii) or (iii), the income from these transactions is likely to be treated as non-qualifying income for purposes of both the 75% and 95% gross income tests. Moreover, to the extent that a position in a hedging transaction has positive value at any particular point in time, it may be treated as an asset that does not qualify for purposes of the REIT asset tests. We intend to structure any hedging transactions in a manner that does not jeopardize our qualification as a REIT. We may conduct some or all of our hedging activities (including
hedging activities relating to currency risk) through a TRS or other corporate entity, the income from which may be subject to U.S. federal income tax, rather than by participating in the arrangements directly or through pass-through subsidiaries. No assurance can be given, however, that our hedging activities will not give rise to income or assets that do not qualify for purposes of the REIT tests, or that our hedging activities will not adversely affect our ability to satisfy the REIT qualification requirements.
Foreclosure Property
Foreclosure property is real property and any personal property incident to such real property (i) that we acquire as the result of having bid in the property at foreclosure, or having otherwise reduced the property to ownership or possession by agreement or process of law, after a default (or upon imminent default) on a lease of the property or a mortgage loan held by us and secured by the property, (ii) for which we acquired the related loan or lease at a time when default was not imminent or anticipated and (iii) with respect to which we made a proper election to treat the property as foreclosure property. We generally will be subject to tax at the maximum corporate rate (currently 35%) on any net income from foreclosure property, including any gain from the disposition of the foreclosure property, other than income that would otherwise be qualifying income for purposes of the 75% gross income test. Any gain from the sale of property for which a foreclosure property election has been made will not be subject to the 100% tax on gains from prohibited transactions described above, even if the property would otherwise constitute inventory or dealer property. We do not anticipate receiving any income from foreclosure property that does not qualify for purposes of the 75% gross income test.
Penalty Tax
Any re-determined rents, re-determined TRS service income (for taxable years beginning after December 31, 2015), re-determined deductions or excess interest we generate will be subject to a 100% penalty tax. In general, re-determined rents are rents from real property that are overstated as a result of any services furnished to any of our tenants by a TRS, re-determined TRS service income represents income of a TRS that is understated as a result of services provided to us or on our behalf and re-determined deductions and excess interest represent any amounts that are deducted by a TRS for amounts paid to us that are in excess of the amounts that would have been deducted based on arm’s-length negotiations or if the interest payments were at a commercially reasonable rate. Rents that we receive will not constitute re-determined rents if they qualify for certain safe harbor provisions contained in the Code.
Failure to Qualify
If we fail to satisfy one or more requirements for REIT qualification other than the income or asset tests, we could avoid disqualification as a REIT if our failure is due to reasonable cause and not to willful neglect and we pay a penalty of $50,000 for each such failure. Relief provisions are also available for failures of the income tests and asset tests, as described above in “—Income Tests” and “—Asset Tests.”
If we fail to qualify for taxation as a REIT in any taxable year, and the relief provisions described above do not apply, we would be subject to tax, including any applicable alternative minimum tax, on our taxable income at regular corporate rates. We cannot deduct distributions to stockholders in any year in which we are not a REIT, nor would we be required to make distributions in such a year. In this situation, to the extent of current and accumulated earnings and profits (as determined for U.S. federal income tax purposes), distributions to stockholders would be taxable as regular corporate dividends. Such dividends paid to U.S. stockholders that are individuals, trusts and estates may be taxable at the preferential income tax rates (i.e., the 20% maximum U.S. federal rate) for qualified dividends. In addition, subject to the limitations of the Code, corporate distributees may be eligible for the dividends received deduction. Unless we are entitled to relief under specific statutory provisions, we would also be disqualified from re-electing to be taxed as a REIT for the four taxable years following the year during which we lost our qualification. It is not possible to state whether, in all circumstances, we would be entitled to this statutory relief.
Taxation of Stockholders
Taxation of Taxable U.S. Stockholders
The following is a summary of certain U.S. federal income tax consequences of the ownership and disposition of our shares applicable to taxable U.S. stockholders. A “U.S. stockholder” is any holder of our shares of common stock that is, for U.S. federal income tax purposes:
| |
| • | An individual who is a citizen or resident of the United States; |
| |
| • | A corporation (or entity treated as a corporation for U.S. federal income tax purposes) created or organized in the United States or under the laws of the United States, or of any state thereof, or the District of Columbia; |
| |
| • | An estate, the income of which is includible in gross income for U.S. federal income tax purposes regardless of its source; or |
| |
| • | A trust if a U.S. court is able to exercise primary supervision over the administration of such trust and one or more U.S. fiduciaries have the authority to control all substantial decisions of the trust. |
If a partnership, including for this purpose any entity that is treated as a partnership for U.S. federal income tax purposes, holds our common equity, the tax treatment of a partner in the partnership will generally depend upon the status of the partner and the activities of the partnership.
An investor that is a partnership and the partners in such partnership should consult their tax advisors about the U.S. federal income tax consequences of the acquisition, ownership and disposition of our shares of common stock.
Distributions
So long as we qualify to be taxed as a REIT, the distributions that we make to our taxable U.S. stockholders out of current or accumulated earnings and profits (as determined for U.S. federal income tax purposes) that we do not designate as capital gain dividends will generally be taken into account by such stockholders as ordinary income and will not be eligible for the dividends received deduction for corporations. With limited exceptions, our dividends are not eligible for taxation at the preferential income tax rates (i.e., the 23.8% maximum U.S. federal income tax rate, including the 3.8% Medicare tax described below) for qualified dividends received by most U.S. stockholders that are individuals, trusts and estates from taxable C corporations. Such stockholders, however, are taxed at the preferential rates on dividends designated by and received from REITs to the extent that certain holding period requirements have been met and the dividends are attributable to:
| |
| • | income retained by the REIT in the prior taxable year on which the REIT was subject to corporate-level income tax (less the amount of tax); |
| |
| • | dividends received by the REIT from TRSs or other taxable C corporations; or |
| |
| • | income in the prior taxable year from the sales of “built-in gain” property acquired by the REIT from C corporations in carryover basis transactions (less the amount of corporate tax on such income). |
Distributions that we designate as capital gain dividends will generally be taxed to our U.S. stockholders as long-term capital gains, to the extent that such distributions do not exceed our actual net capital gain for the taxable year, without regard to the period for which the stockholder that receives such distribution has held its shares, and for taxable years beginning after December 31, 2015, may not exceed our dividends paid for the taxable year, including dividends paid the following year that are treated as paid in the current year. We may elect to retain and pay taxes on some or all of our net long-term capital gains, in which case we may elect to apply provisions of the Code that treat our U.S. stockholders as having received, solely for tax purposes, our undistributed capital gains, and the stockholders as receiving a corresponding credit for taxes that we paid on such undistributed capital gains. Please refer to “—Annual Distribution Requirements.” Corporate stockholders may be required to treat up to 20% of some capital gain dividends as ordinary income. Long-term capital gains are generally taxable at maximum U.S. federal rates of 23.8% in the case of U.S. stockholders that are individuals, trusts and estates, including the 3.8% Medicare tax described below, and 35% in the case of U.S. stockholders that are corporations. Capital gains attributable to the sale of depreciable real property held for more than 12 months are subject to a 25% maximum U.S. federal income tax rate for taxpayers who are taxed as individuals, to the extent of certain previously claimed depreciation deductions.
Distributions in excess of our current and accumulated earnings and profits (as determined for U.S. federal income tax purposes) will generally represent a return of capital and will not be taxable to a stockholder to the extent that the amount of such distributions does not exceed the adjusted basis of the stockholder’s shares in respect of which the distributions were made. Rather, the distribution will reduce the adjusted basis of the stockholder’s shares. To the extent that such distributions exceed the adjusted basis of a stockholder’s shares, the stockholder generally must include such distributions in income as long-term capital gain if the shares have been held for more than one year, or short-term capital gain if the shares have been held for one year or less. In addition, any dividend that we declare in October, November or December of any year and that is payable to a stockholder of record on a specified date in any such month will be treated as both paid by us and received by the stockholder on December 31 of such year, provided that we actually pay the dividend before the end of January of the following calendar year.
To the extent that we have available net operating losses and capital losses carried forward from prior tax years, such losses may reduce the amount of distributions that we must make in order to comply with the REIT distribution requirements. Please refer to “—Annual Distribution Requirements.” Such losses, however, are not passed through to stockholders and do not offset income of stockholders from other sources, nor would such losses affect the character of any distributions that we make, which are generally subject to tax in the hands of stockholders to the extent that we have current or accumulated earnings and profits (as determined for U.S. federal income tax purposes).
Dispositions of Our Shares
If a U.S. stockholder sells or disposes of our shares, it will generally recognize gain or loss for U.S. federal income tax purposes in an amount equal to the difference between the amount of cash and the fair market value of any property received on the sale or other disposition and the stockholder’s adjusted tax basis in the shares. In general, capital gains recognized by individuals, trusts and estates upon the sale or disposition of our shares will be subject to a maximum U.S. federal income tax rate of 20% if the shares are held for more than one year, and will be taxed at ordinary income rates (of up to 39.6%) if the shares are held for one year or less. Gains recognized by stockholders that are corporations are subject to U.S. federal income tax at a maximum rate of 35%, whether or not such gains are classified as long-term capital gains. Capital losses recognized by a U.S. stockholder upon the disposition of our shares that were held for more than one year at the time of disposition will be considered long-term capital losses, and are generally available only to offset capital gain income of the stockholder but not ordinary income (except in the case of individuals, who may also offset up to $3,000 of ordinary income each year). In addition, any loss upon a sale or exchange of our shares by a U.S. stockholder who has held the shares for six months or less, after applying holding period rules, will be treated as a long-term capital loss to the extent of actual or deemed distributions that we make that are required to be treated by the stockholder as long-term capital gain.
If a U.S. stockholder recognizes a loss upon a subsequent disposition of our shares or other securities in an amount that exceeds a prescribed threshold, it is possible that the provisions of Treasury regulations involving “reportable transactions” could apply, with a resulting requirement to separately disclose the loss-generating transaction to the IRS. These regulations, though directed towards “tax shelters,” are broadly written and apply to transactions that would not typically be considered tax shelters. The Code imposes significant penalties for failure to comply with these requirements. You should consult your tax advisor concerning any possible disclosure obligation with respect to the receipt or disposition of our shares or securities or transactions that we might undertake directly or indirectly. Moreover, you should be aware that we and other participants in the transactions in which we are involved (including their advisors) might be subject to disclosure or other requirements pursuant to these regulations.
Information Reporting and Backup Withholding
A U.S. stockholder may be subject, under certain circumstances, to information reporting and/or backup withholding (currently at a rate of 28%) with respect to distributions on our shares, and depending on the circumstances, the proceeds of a sale or other taxable disposition of our shares. Under the backup withholding rules, you may be subject to backup withholding at a current rate of 28% with respect to distributions unless you: (1) are a corporation or come within certain other exempt categories and, when required, demonstrate this fact; or (2) provide a taxpayer identification number, certify as to no loss of exemption from backup withholding, and otherwise comply with the applicable requirements of the backup withholding rules. Backup withholding is not an additional tax. Any amount withheld under these rules will be refunded or credited against your federal income tax liability, provided that you timely furnish the IRS with certain required information.
Passive Activity Losses and Investment Interest Limitations
Distributions that we make and gains arising from the sale or exchange by a U.S. stockholder of our shares will not be treated as passive activity income. As a result, stockholder will not be able to apply any “passive losses” against income or gain relating to our shares. To the extent that distributions we make do not constitute a return of capital, they will be treated as investment income for purposes of computing the investment interest limitation.
Taxation of Non-U.S. Stockholders
The following is a summary of certain U.S. federal income and estate tax consequences of the ownership and disposition of our shares applicable to non-U.S. stockholders. A “non-U.S. stockholder” is any holder of our common equity other than a partnership or U.S. stockholder. The following discussion is based on current law, and is for general information only. It addresses only selected, and not all, aspects of U.S. federal income taxation.
Ordinary Dividends
Distributions received by non-U.S. stockholders that are (i) payable out of our earnings and profits, (ii) not attributable to capital gains that we recognize and (iii) not effectively connected with a U.S. trade or business of the non-U.S. stockholder, will be dividends that are subject to U.S. withholding tax at the rate of 30%, unless that rate is reduced or eliminated by an applicable income tax treaty or such dividends are paid to a foreign government or an integral part or controlled entity (other than a controlled commercial entity) thereof (“Foreign Government”).
Because in general we will not know whether a distribution at any particular time will be from our earning and profits and will therefore be treated as a dividend, we expect to withhold federal income tax at the rate of 30% on any distributions made to a non-U.S. stockholder unless:
| |
| • | a lower treaty rate applies and the non-U.S. stockholder provides an IRS Form W-8BEN or W-BEN-E (or applicable successor form) evidencing eligibility for that reduced treaty rate; |
| |
| • | the non-U.S. stockholder is a Foreign Government and provides an IRS Form W-8EXP (or applicable successor form) to that effect; or |
| |
| • | the non-U.S. stockholder provides an IRS Form W-8ECI with us claiming that the distribution is income effectively connected with the non-U.S. stockholder’s trade or business. |
In general, non-U.S. stockholders will not be considered to be engaged in a U.S. trade or business solely as a result of their ownership of our shares. In cases where the dividend income from a non-U.S. stockholder’s investment in our shares is, or is treated as, effectively connected with the non-U.S. stockholder’s conduct of a U.S. trade or business, the non-U.S. stockholder generally will be subject to U.S. federal income tax at graduated rates, in the same manner as U.S. stockholders are taxed with respect to such dividends. Such effectively connected income must generally be reported on a U.S. income tax return filed by or on behalf of the non-U.S. stockholder. The income may also be subject to a branch profits tax at the rate of 30% (unless reduced or eliminated by an applicable income tax treaty) in the case of a non-U.S. stockholder that is a corporation.
Treatment of Our Shares as United States Real Property Interests; Exceptions
We expect that more than 50% of our assets will consist of “United States real property interests” (“USRPIs”) and that we will accordingly meet the general definition of a “United States real property holding company” (“USRPHC”) under the Foreign Investment in Real Property Tax Act of 1980 (“FIRPTA”). The general rule is that shares of a USRPHC are themselves USRPIs and that gains realized with respect to such shares by non-U.S. stockholders are therefore subject to taxation under FIRPTA.
However, so long as we continue to qualify as a REIT our shares will not be treated as USRPIs if we are “domestically controlled.” We will be “domestically controlled” if less than 50% of the value of our stock is held by foreign persons during the shorter of the preceding five years or the period of our existence (“FIRPTA Testing Period”). For purposes of determining whether a REIT is a “domestically controlled,” a person who at all applicable times holds less than 5% of a class of stock that is “regularly traded” will be treated as a U.S. person unless the REIT has actual knowledge that such person is not a U.S. person. We believe that we are currently “domestically controlled.” However, no assurance can be given that we will remain so.
In addition, even if we are not “domestically controlled,” any of our shares in a class that is “regularly traded on an established securities market” will not constitute USRPIs in the hands of any foreign person that owns 10% or less of such class during the FIRPTA Testing Period.
Non-Dividend Distributions
Unless our shares constitute USRPIs as to a particular non-U.S. stockholder, distributions that we make that are not dividends (because they exceed our earnings and profits) will not be subject to U.S. income tax. If we nevertheless withhold tax from such distributions, a non-U.S. stockholder may seek a refund from the IRS of any amounts withheld. If our shares constitute a USRPI because they are not within one of the exceptions to such treatment described above, distributions that we make in excess of the sum of (i) the stockholder’s proportionate share of our earnings and profits, plus (ii) the stockholder’s basis in its stock, will be taxed under FIRPTA, at the applicable capital gains tax rate that would apply to a U.S. stockholder of the same type (i.e., an individual or a corporation, as the case may be).
USRPI Gains; Distributions
We may realize gains from the sale of real property (“USRPI Gains”) that are taxable to non-U.S. stockholders under FIRPTA upon their distribution. To the extent that we make a distribution to a non-U.S. stockholder that is attributable to USRPI Gains, that distribution will, except as described below, be treated as effectively connected with a U.S. trade or business of the non-U.S. stockholder and will be subject to U.S. income tax at the same rates applicable to U.S. taxpayers.
In addition, we may be required to withhold tax equal to 35% of any distribution to a non-U.S. stockholder to the extent that distribution is attributable to USRPI Gains. Distributions subject to FIRPTA may also be subject to a branch profits tax at the rate of 30% (unless reduced or eliminated by an applicable income tax treaty) if they are made to a non-U.S. stockholder that is a corporation.
The foregoing rules are subject to a significant exception. A distribution that would otherwise have been treated as attributable to USRPI Gains will not be so treated or be subject to FIRPTA, and generally will be treated in the same manner as an ordinary dividend would be treated (please refer to “—Ordinary Dividends,” above), if (i) the distribution is received with respect to a class of stock that is regularly traded on an established securities market located in the United States and (ii) the recipient non-U.S. stockholder does not own more than 10% of that class of stock at any time during the year ending on the date on which the distribution is received. Furthermore, distributions to “qualified foreign pension funds” generally will be exempt from FIRPTA. Non-U.S. stockholders should consult their tax advisors regarding the application of these rules.
Dispositions of Our Shares
Unless our shares constitute USRPIs, a sale of our shares by a non-U.S. stockholder generally will not be subject to U.S. taxation under FIRPTA. See “—Treatment of Our Shares as United States Real Property Interests; Exceptions,” above, for a description of the circumstances in which our shares will constitute USRPIs. If gain on the sale of our shares were subject to taxation under FIRPTA, the non-U.S. stockholder would be required to file a U.S. federal income tax return and would be subject to the same treatment as a U.S. stockholder with respect to such gain, subject to applicable alternative minimum tax and a special alternative minimum tax in the case of non-resident alien individuals. Moreover, in order to enforce the collection of the tax, the purchaser of the shares could be required to withhold 10% (15% for dispositions occurring on or after December 18, 2015) of the purchase price and remit such amount to the IRS.
Gain from the sale of our shares that would not otherwise be subject to FIRPTA will nonetheless be taxable in the United States to a non-U.S. stockholder in two cases: (i) if the non-U.S. stockholder’s investment in our shares is effectively connected with a U.S. trade or business conducted by such non-U.S. stockholder, the non-U.S. stockholder will be subject to the same treatment as a U.S. stockholder with respect to such gain, except that a non-U.S. stockholder that is a corporation may also be subject to a branch profits tax at a rate of 30% (unless reduced or eliminated by an applicable income tax treaty), or (ii) if the non-U.S. stockholder is a non-resident alien individual who was present in the United States for 183 days or more during the taxable year and has a “tax home” in the United States, the non-resident alien individual will be subject to a 30% tax on the individual’s capital gain.
Qualified Foreign Pension Funds
Gains derived from USRPIs held by “qualified foreign pension funds” or entities all of the interests of which are held by “qualified foreign pension funds,” and distributions attributable to USRPI Gains that we make to such stockholders will be exempt from FIRPTA. However, such shareholders will remain subject to withholding on ordinary dividends. See “—Ordinary Dividends.”
Non-U.S. stockholders are urged to consult their tax advisors regarding the U.S. federal, state, local and foreign income and other tax consequences of owning our shares.
Taxation of Tax-Exempt Stockholders
Tax-exempt entities, including qualified employee pension and profit sharing trusts and individual retirement accounts, generally are exempt from U.S. federal income taxation. However, they may be subject to taxation on their unrelated business taxable income (“UBTI”). While some investments in real estate may generate UBTI, the IRS has ruled that dividend distributions from a REIT to a tax-exempt entity do not constitute UBTI. Based on that ruling, and provided that (i) a tax-exempt stockholder has not held our shares as “debt financed property” within the meaning of the Code (i.e., where the acquisition or holding of the property is financed through a borrowing by the tax-exempt stockholder) and (ii) our shares are not otherwise used in an unrelated trade or business, distributions that we make and income from the sale of our shares generally should not give rise to UBTI to a tax-exempt stockholder.
Tax-exempt stockholders that are social clubs, voluntary employee benefit associations, supplemental unemployment benefit trusts, and qualified group legal services plans exempt from U.S. federal income taxation under Sections 501(c)(7), (c)(9), (c)(17) and (c)(20) of the Code are subject to different UBTI rules, which generally require such stockholders to characterize distributions that we make as UBTI.
In certain circumstances, a pension trust that owns more than 10% of our shares could be required to treat a percentage of any dividends received from us as UBTI if we are a “pension-held REIT.” We will not be a pension-held REIT unless (i) we are required to “look through” one or more of our pension trust stockholders in order to satisfy the REIT “closely held” test and (ii) either (a) one pension trust owns more than 25% of the value of our shares or (b) one or more pension trusts, each individually holding more than 10% of the value of our shares, collectively own more than 50% of the value of our shares. Certain restrictions on ownership and transfer of our shares generally should prevent a tax-exempt entity from owning more than 10% of the value of our shares and generally should prevent us from becoming a pension-held REIT.
Tax-exempt stockholders are urged to consult their tax advisors regarding the U.S. federal, state, local and foreign income and other tax consequences of owning our shares.
Other Tax Considerations
Legislative or Other Actions Affecting REITs
The present U.S. federal income tax treatment of REITs may be modified, possibly with retroactive effect, by legislative, judicial or administrative action at any time. The REIT rules are constantly under review by persons involved in the legislative process and by the IRS and the Treasury which may result in statutory changes as well as revisions to regulations and interpretations. Changes to the U.S. federal tax laws and interpretations thereof could adversely affect an investment in our common equity.
Medicare 3.8% Tax on Investment Income
Certain U.S. stockholders who are individuals, estates or trusts and whose income exceeds certain thresholds will be required to pay a 3.8% Medicare tax on dividends and certain other investment income, including capital gains from the sale or other disposition of our common equity.
Foreign Account Tax Compliance Act
Withholding taxes may be imposed under Sections 1471 through 1474 of the Code and the Treasury Regulations promulgated thereunder (“FATCA”) on certain types of payments made to non-U.S. financial institutions and certain other non-U.S. entities. Specifically, a 30% withholding tax may be imposed on dividends on, or (after December 31, 2018) gross proceeds from the sale or other disposition of, our common equity paid to a “foreign financial institution” or a “non-financial foreign entity” (each as defined in the Code), unless (i) the foreign financial institution undertakes certain diligence and reporting obligations, (ii) the non-financial foreign entity either certifies it does not have any “substantial United States owners” (as defined in the Code) or furnishes identifying information regarding each substantial United States owner, or (iii) the foreign financial institution or non-financial foreign entity otherwise qualifies for an exemption from these rules. If the payee is a foreign financial institution and is subject to the diligence and reporting requirements in (i) above, it must enter into an agreement with the U.S. Department of the Treasury requiring that it undertake to identify accounts held by certain “specified United States persons” or “United States-owned foreign entities” (each as defined in the Code), annually report
certain information about such accounts, and withhold 30% on payments to non-compliant foreign financial institutions and certain other account holders. Foreign financial institutions located in jurisdictions that have an intergovernmental agreement with the United States governing FATCA may be subject to different rules.
We will not pay any additional amounts to stockholders in respect of any amounts withheld. Non-U.S. stockholders are encouraged to consult their tax advisors regarding the possible implications of FATCA on their investment in our common equity.
State, Local and Foreign Taxes
We and our subsidiaries and stockholders may be subject to state, local or foreign taxation in various jurisdictions including those in which we or they transact business, own property or reside, and we or they may be required to file tax returns in some or all of those jurisdictions. Our state, local or foreign tax treatment and that of our stockholders may not conform to the U.S. federal income tax treatment discussed above. Any foreign taxes that we incur do not pass through to stockholders as a credit against their U.S. federal income tax liability. Prospective investors should consult their tax advisors regarding the application and effect of state, local and foreign income and other tax laws on an investment in our shares.
ITEM 1A. Risk Factors
You should carefully consider the following risks and other information contained in this Annual Report on Form 10-K in evaluating our company and our common stock. If any of the matters highlighted by the risks discussed below occur, a material adverse effect on our business, financial condition, results of operations or liquidity, stock price, and ability to service our indebtedness and to make distributions to stockholders, as required for us to continue to qualify as a REIT (a “Material Adverse Effect”) could occur, and you could lose all or a part of your investment. Additional risks and uncertainties not presently known to us or that we currently deem immaterial may also harm our business. Some statements in this Annual Report on Form 10-K, including statements in the following risk factors, constitute forward-looking statements. Please refer to “Cautionary Note Regarding Forward-Looking Statements.”
Risks Related to Our Business and Operations
Our business is dependent upon our operators successfully operating their businesses, and their failure to do so could have a Material Adverse Effect.
We depend on our operators to operate the properties we own in a manner that generates revenues sufficient to allow them to meet their obligations to us, including their requirements to pay rent, maintain certain insurance coverage, pay real estate taxes and maintain the properties in a manner so as not to jeopardize their operating licenses or regulatory status. The ability of our operators to fulfill their obligations under our leases may depend, in part, upon the overall profitability of their operations, including any other SNFs or other properties or businesses they may acquire or operate. Although most of our properties are leased pursuant to master lease arrangements, cash flow generated by certain individual properties may not be sufficient for an operator to meet its obligations to us. Our revenues could be reduced, our financial position could be weakened and our ability to fulfill our obligations under our indebtedness could be limited if any of our major operators were unable to meet their obligations to us or failed to renew or extend their relationship with us as their lease terms expire, or if we were unable to lease or re-lease our properties on economically favorable terms. We cannot provide any assurances that we will be able to identify and successfully transition underperforming properties.
Our portfolio is predominantly comprised of SNFs. As a result of our focus on SNFs, any changes affecting SNFs or SNF operators, including changes in governmental rules and regulations, particularly with respect to Medicare and Medicaid reimbursement, could have an adverse impact on our operators’ revenues, costs and results of operations, which may affect their ability to meet their obligations to us. Additionally, if conditions in the SNF industry decline, we may be required to evaluate our properties for impairments, which could result in charges that might be significant.
We may not be successful in identifying and consummating suitable acquisitions or investment opportunities, which may impede our growth and negatively affect our results of operations and may result in the use of a significant amount of management resources.
Our ability to expand through acquisitions is integral to our business strategy and requires us to identify suitable acquisition or investment opportunities that meet our criteria and are compatible with our growth strategy. We may not be successful in identifying suitable properties or other assets that meet our acquisition criteria or in consummating acquisitions or
investments on satisfactory terms or at all. In addition, our cost of capital may hinder our ability to make profitable acquisitions. Failure to identify or consummate acquisitions or investment opportunities, or to integrate successfully any acquired properties without substantial expense, delay or other operational or financial problems, would slow our growth, which could in turn adversely affect our stock price.
Our ability to acquire properties successfully may be constrained by the following significant risks:
| |
| • | competition from other real estate investors with significant capital, including publicly traded REITs and institutional investment funds; |
| |
| • | unsatisfactory results of our due diligence investigations or failure to meet closing conditions; and |
| |
| • | failure to finance an acquisition on favorable terms or at all. |
The realization of any of these risks could have a Material Adverse Effect.
Our three largest operators account for a meaningful portion of our total revenues, and the failure of any of these operators to meet their obligations to us could materially reduce our revenues and net income.
Our largest operator, SCC, individually accounted for approximately 12% of our total revenues and collectively with our next two largest operators, Signature and Avamere, accounted for approximately 32% of our total revenues for the year ended December 31, 2015. This concentration of credit risk in three tenants makes us more vulnerable economically. We cannot provide any assurances that SCC, Signature and Avamere and/or their respective subsidiaries or affiliates will have sufficient assets, income, access to financing and insurance coverage to enable them to satisfy their respective lease and other obligations to us. The failure or inability of any of these operators, or of other operators that account for a meaningful portion of our rental income, to meet their obligations to us could materially reduce our revenues and net income, which could have a Material Adverse Effect.
The bankruptcy, insolvency or financial deterioration of our operators could delay or prevent our ability to collect unpaid rents or require us to find new operators.
We receive substantially all of our income as rent payments under leases of our properties. We have very limited control over the success or failure of our operators’ businesses and, at any time, any of our operators may experience a downturn in its business that may weaken its financial condition. As a result, our operators may fail to make rent payments when due or declare bankruptcy. Any operator failures to make rent payments when due or operator bankruptcies could result in the termination of the operator’s lease and could have a Material Adverse Effect. This risk is magnified in situations where we lease multiple properties to a single operator under a master lease, as an operator failure or default under a master lease could reduce or eliminate rental revenue from multiple properties.
If operators are unable to comply with the terms of their leases, we may be forced to modify the leases in ways that are unfavorable to us. Alternatively, the failure of an operator to perform under a lease could require us to declare a default, repossess the property, find a suitable replacement operator, operate the property or sell the property. We cannot provide any assurances that we would be able to lease a property on substantially equivalent or better terms than the prior lease, or at all, find another qualified operator, successfully reposition the property for other uses or sell the property on terms that are favorable to us. It may be more difficult to find a replacement operator for a SNF property than it would be to find a replacement tenant for a general commercial property due to the specialized nature of the business. Even if we are able to find a suitable replacement operator for a property, transfers of operations of SNFs and other healthcare facilities are subject to regulatory approvals not required for transfers of other types of commercial operations, which may affect our ability to successfully transition a property.
Any bankruptcy filing by or relating to one of our operators could bar all efforts by us to collect pre-bankruptcy debts from that operator or seize its property. An operator bankruptcy could also delay our efforts to collect past due balances under the leases and could ultimately preclude collection of all or a portion of these sums. It is possible that we may recover substantially less than the full value of any unsecured claims we hold, if any, which could have a Material Adverse Effect. Furthermore, dealing with an operator’s bankruptcy or other default may divert management’s attention and cause us to incur substantial legal and other costs.
If one or more of our operators files for bankruptcy relief, the U.S. federal Bankruptcy Code provides that a debtor has the option to assume or reject the unexpired lease within a certain period of time. However, our leases with operators that lease
more than one of our properties are generally made pursuant to a single master lease covering all of that operator’s properties leased from us, or are cross-defaulted with other leases, and consequently there is uncertainty about how such arrangements may be treated in a bankruptcy. In bankruptcy, the debtor-operator may be required to assume or reject the master lease or cross-defaulted leases as a whole, rather than making the decision on a property-by-property basis, thereby preventing the debtor-operator from assuming the better performing properties and terminating the master lease or cross-defaulted leases with respect to the poorer performing properties.
The geographic concentration of our properties in Texas could leave us vulnerable to regulatory changes, an economic downturn or acts of nature in that state, which could materially reduce our revenues and net income.
Our properties were located in 36 states as of December 31, 2015, with properties in one state (Texas) accounting for 22% of our total revenues for the year then ended. In August 2015, CMS and the THHC began a three-year federal/state partnership to better serve Dual Eligible individuals. THHC entered into agreements with several MMPs with the following goals: minimize cost sharing; align incentives; streamline the process for providers; and improve the quality of care. The program covers Dual Eligible individuals located in six of Texas’ most populous counties, and two to three MMPs are assigned to each county. Eligible individuals will be passively enrolled and assigned to an MMP, unless they opt out.
Notably, under the terms of the agreements with the MMPs, skilled nursing services may be provided without a preceding stay in an acute care hospital as long as the stay was authorized by the MMP prior to the stay and the care is clinically appropriate. In addition, patients can be moved from Medicaid to Medicare without sending the patient to an acute care hospital. Potential risks of this program, however, are disruptions or delays in reimbursement payments, complex billing procedures, greater negotiation of service rates that currently mirror RUGs levels and reductions in patient volumes and length of stays for skilled nursing services over time.
While we regularly assess the ability of our operators in Texas (including SCC, which conducts substantially all of its operations in Texas) to operate profitably under these and other new rules, we cannot provide any assurances that the current rules or future changes to state Medicaid programs will not materially adversely affect our operators in Texas, which, in turn, could have a Material Adverse Effect.
In addition, the conditions of the state budget, local economies and real estate markets, acts of nature and other factors that may result in a decrease in demand for long-term care services in Texas could have an adverse impact on our operators’ ability to meet their obligations to us, which could materially reduce our revenues and net income, which could have a Material Adverse Effect.
If we must replace any of our tenants or operators, we might be unable to reposition the properties on as favorable terms, or at all, and we could be subject to delays, limitations and expenses, which could have a Material Adverse Effect.
We cannot predict whether our tenants will fulfill all of their obligations under the leases or renew existing leases beyond their current term. If our leases with our tenants are not renewed or if there are defaults resulting in terminations, we would attempt to reposition those properties with another tenant or operator. In case of non-renewal, we generally have one year prior to expiration of the lease term to arrange for repositioning of the properties and our tenants are required to continue to perform all of their obligations (including the payment of all rental amounts) for the non-renewed assets until such expiration. However, following expiration of a lease term or if we exercise our right to replace a tenant or operator in default, rental payments on the related properties could decline or cease altogether while we reposition the properties with a suitable replacement tenant or operator. We also might not be successful in identifying suitable replacements or entering into leases or other arrangements with new tenants or operators on a timely basis or on terms as favorable to us as our current leases, if at all, and we may be required to fund certain expenses and obligations (e.g., real estate taxes, property-level debt costs and maintenance expenses) to preserve the value of, and avoid the imposition of liens on, our properties while they are being repositioned. In addition, we may incur certain obligations and liabilities, including obligations to indemnify the replacement tenant or operator, which could have a Material Adverse Effect.
In the event of non-renewal or a tenant default, our ability to reposition our properties with a suitable replacement tenant or operator could be significantly delayed or limited by state licensing, receivership, CON or other laws, as well as by the Medicare and Medicaid change-of-ownership rules, and we could incur substantial additional expenses in connection with any licensing, receivership or change-of-ownership proceedings. In addition, we may need to provide working capital to replacement operators as they work through regulatory and other change-of-ownership requirements. Our ability to locate and attract suitable replacement tenants could also be impaired by the specialized healthcare uses or contractual restrictions on use of the properties, and we may be forced to spend substantial amounts to adapt the properties to other uses. Any such delays,
limitations and expenses could adversely impact our ability to collect rent, obtain possession of leased properties or otherwise exercise remedies for tenant default and could have a Material Adverse Effect.
Moreover, in connection with certain of our properties, we have entered into intercreditor agreements with the tenants’ lenders. Our ability to exercise remedies under the applicable leases or to reposition the applicable properties may be significantly delayed or limited by the terms of the intercreditor agreement. Any such delay or limit on our rights and remedies could adversely affect our ability to mitigate our losses and could have a Material Adverse Effect.
Our acquisition, investment and divestiture activity could present certain risks to our business and operations.
We expect to make significant acquisitions and investments as part of our overall business strategy. We also intend to dispose of non-strategic assets that do not align with our investment objectives. Our acquisition, investment and divestiture activity could present certain risks to our business and operations, including, among other things, that:
| |
| • | we may be unable to successfully integrate acquired properties, maintain consistent standards, controls, policies and procedures, or realize the anticipated benefits of acquisitions and other investments within the anticipated time frame or at all; |
| |
| • | we may be unable to effectively monitor and manage our expanded portfolio of properties, retain key employees or attract highly qualified new employees; |
| |
| • | projections of estimated future revenues, costs savings or operating metrics that we develop during the due diligence and integration planning process might be inaccurate; |
| |
| • | we may be unable to successfully execute our strategic dispositions at attractive prices or at all, and we may dispose of non-strategic assets to enhance the long-term value of our portfolio, but which would reduce our cash flow; |
| |
| • | our leverage could increase or our per share financial results could decline if we incur additional debt or issue equity securities to finance acquisitions and investments; |
| |
| • | acquisitions and other new investments could divert management’s attention from our existing assets; and |
| |
| • | the value of acquired assets or the market price of our common stock may decline. |
We cannot provide any assurances that we will be able to integrate acquisitions and investments without encountering difficulties or that any such difficulties will not have a Material Adverse Effect.
We have now, and may have in the future, exposure to contingent rent escalators, which could hinder our growth and profitability.
We receive substantially all of our revenues by leasing assets under long-term triple-net leases that generally provide for fixed rental rates subject to annual escalations. The annual escalations in certain of our leases may be contingent upon the achievement of specified revenue parameters or based on changes in CPI, with floors and ceilings. If, as a result of weak economic conditions or other factors, the properties subject to these leases do not generate sufficient revenue to achieve the specified rent escalation parameters or CPI does not increase, our growth and profitability may be hindered by these leases. In addition, if strong economic conditions result in significant increases in CPI, but the escalations under our leases are capped, our growth and profitability may be limited.
We rely on external sources of capital to fund future capital needs, and if we encounter difficulty in obtaining such capital, we may not be able to make future investments necessary to grow our business or meet maturing commitments.
In order to qualify and maintain our qualification as a REIT each year, we will be required to distribute at least 90% of our REIT taxable income, excluding net capital gains, to our stockholders. As a result, our retained earnings available to fund acquisitions, redevelopment or other capital expenditures are nominal, and we rely, to a significant extent, on external sources of capital, including debt and equity financing, to fund our capital needs. If we are unable to obtain needed capital at all or only on unfavorable terms from these sources, we might not be able to grow through acquisitions or redevelopment, which is an important component of our strategy, or to meet our obligations and commitments as they mature. Our access to capital will depend upon a number of factors over which we have little or no control, including general market conditions, the market’s
perception of our current and potential future earnings and cash distributions and the market price of the shares of our capital stock. We may not be in position to take advantage of attractive investment opportunities for growth in the event that we are unable to access the capital markets on a timely basis or we are only able to obtain capital on unfavorable terms.
Our level and type of indebtedness could adversely affect our financial condition and, as a result, our operations.
Our $1.5 billion of indebtedness outstanding as of December 31, 2015 has maturities of five years or less, and we may increase our indebtedness in the future. Our level and type of indebtedness could have important consequences for our stockholders. For example, it could:
| |
| • | increase our vulnerability to general adverse economic and industry conditions; |
| |
| • | limit our ability to obtain additional financing to fund future working capital, capital expenditures and other general corporate requirements, or to carry out other aspects of our business; |
| |
| • | increase our cost of borrowing; |
| |
| • | require us to dedicate a substantial portion of our cash flow from operations to payments on indebtedness, thereby reducing the availability of such cash flow to fund working capital, capital expenditures and other general corporate requirements, or to carry out other aspects of our business; |
| |
| • | limit our ability to make material acquisitions or take advantage of business opportunities that may arise; |
| |
| • | limit our ability to make distributions to our stockholders, which may cause us to lose our qualification as a REIT under the Code or to become subject to federal corporate income tax on any REIT taxable income that we do not distribute; and |
| |
| • | place us at a potential competitive disadvantage compared to our competitors that have less debt. |
Further, we have the ability to incur substantial additional debt, including secured debt. If we incur additional debt, the related risks described above could intensify. Because all of our indebtedness outstanding as of December 31, 2015 was floating rate debt, our interest expense will increase as we refinance into fixed rate, longer term maturities. If we are unable to refinance our debt, we would continue to be subject to interest rate risk. The short-term nature of some of our debt also subjects us to the risk that market conditions may be unfavorable or may prevent us from refinancing our debt at or prior to their existing maturities. In addition, our cash flow from operations may not be sufficient to repay all of our outstanding debt as it becomes due, and we may not be able to borrow money, sell assets or otherwise raise funds on acceptable terms, if at all, to refinance our debt.
Adverse changes in our credit ratings could affect our borrowing capacity and borrowing terms.
There can be no assurance that we will be able to maintain our current credit ratings. Any downgrades in our credit ratings or outlook by any or all of the rating agencies could have a material adverse impact on our cost and availability of capital, which could in turn have a Material Adverse Effect.
Covenants in our debt agreements may limit our operational flexibility, and a covenant breach or default could have a Material Adverse Effect.
The terms of our credit agreements will require us to comply with a number of customary financial and other covenants which may limit our management’s discretion by restricting our ability to, among other things, incur additional debt, redeem our capital stock, enter into certain transactions with affiliates, pay dividends and make other distributions, make investments and other restricted payments, and create liens. Any additional financing we may obtain could contain similar or more restrictive covenants. Our continued ability to incur indebtedness and conduct our operations will be subject to compliance with these financial and other covenants. Breaches of these covenants could result in defaults under the instruments governing the applicable indebtedness, in addition to any other indebtedness cross-defaulted against such instruments. Any such breach could have a Material Adverse Effect.
Because real estate investments are relatively illiquid, our ability to promptly sell properties in our portfolio is limited.
Because real estate investments are relatively illiquid, our ability to promptly sell one or more properties in our portfolio is limited. The real estate market is affected by many factors, such as general economic conditions, availability of financing, interest rates and supply and demand, that are beyond our control. In addition, our properties are special purpose properties that could not be readily converted to general residential, retail or office use. Transfers of operations of SNFs and other healthcare properties are subject to regulatory approvals not required for transfers of other types of commercial operations and other types of real estate. We cannot predict whether we will be able to sell any property for the price or on the terms set by us or whether any price or other terms offered by a prospective purchaser would be acceptable to us. We also cannot predict the length of time needed to find a willing purchaser and to close the sale of a property. To the extent we are unable to sell any properties for our book value, we may be required to take a non-cash impairment charge or loss on the sale, either of which would reduce our net income.
We may be required to expend funds to correct defects or to make improvements before a property can be sold. We may not have funds available to correct those defects or to make those improvements. We may agree to transfer restrictions that materially restrict us from selling that property for a period of time or impose other restrictions, such as a limitation on the amount of debt that can be placed or repaid on that property. These transfer restrictions would impede our ability to sell a property even if we deem it necessary or appropriate. These facts and any others that would impede our ability to respond to adverse changes in the performance of our properties may have a Material Adverse Effect.
The amount and scope of insurance coverage provided by our policies and policies maintained by our tenants may not adequately insure against losses.
We maintain or require in our leases and other agreements that our tenants maintain, all applicable lines of insurance on our properties and their operations. Although we regularly review the amount and scope of insurance provided by our policies and required to be maintained by our tenants and believe the coverage provided to be customary for similarly situated companies in our industry, we cannot provide any assurances that we or our tenants will continue to be able to maintain adequate levels of insurance. We also cannot provide any assurances that we or our tenants will maintain the required coverages, that we will continue to require the same levels of insurance under our lease agreements, that such insurance will be available at a reasonable cost in the future or that the policies maintained will fully cover all losses on our properties upon the occurrence of a catastrophic event, nor can we make any guaranty as to the future financial viability of the insurers that underwrite our policies and the policies maintained by our tenants.
For various reasons, including to reduce and manage costs, many healthcare companies utilize different organizational and corporate structures coupled with self-insurance trusts or captive programs that may provide less insurance coverage than a traditional insurance policy. Companies that insure any part of their general and professional liability risks through their own captive limited purpose entities generally estimate the future cost of general and professional liability through actuarial studies that rely primarily on historical data. However, due to the rise in the number and severity of professional claims against healthcare providers, these actuarial studies may underestimate the future cost of claims, and reserves for future claims may not be adequate to cover the actual cost of those claims. As a result, the tenants and operators of our properties who self-insure could incur large funded and unfunded general and professional liability expenses, which could materially adversely affect their liquidity, financial condition and results of operations and, in turn, their ability to satisfy their obligations to us. If our operators decide to implement a captive or self-insurance program, any large funded and unfunded general and professional liability expenses incurred could have a Material Adverse Effect.
Should an uninsured loss or a loss in excess of insured limits occur, we could incur substantial liability or lose all or a portion of the capital we have invested in a property, as well as the anticipated future revenues from the property. Following the occurrence of such an event, we might nevertheless remain obligated for any mortgage debt or other financial obligations related to the property. We cannot provide any assurances that material uninsured losses, or losses in excess of insurance proceeds, will not occur in the future.
As an owner of real property, we may be exposed to environmental liabilities.
Under various federal, state and local environmental laws, ordinances and regulations, a current or previous owner of real property may be liable in certain circumstances for the costs of investigation, removal, remediation or release of hazardous or toxic substances (including materials containing asbestos) at, under or disposed of in connection with such property, as well as certain other potential costs relating to hazardous or toxic substances, including government fines and damages for injuries to persons or adjacent property. Such laws often impose liability without regard to whether the owner knew of, or was responsible for, the presence or disposal of such substances and liability may be imposed on the owner in connection with the activities of
an operator at the property. The cost of any required investigation, remediation, removal, fines or personal or property damages and the owner’s liability therefore could exceed the value of the property and/or the assets of the owner. In addition, the presence of such substances, or the failure to properly dispose of or remediate such substances, may adversely affect our operators’ ability to attract additional patients or residents, our ability to sell or lease such property or to borrow using such property as collateral which, in turn, could reduce our revenues.
Although our leases require the operator to indemnify us for certain environmental liabilities, the scope of such obligations may be limited. For instance, some of our leases do not require the operator to indemnify us for environmental liabilities arising before the operator took possession of the premises. Further, we cannot provide any assurances that any such operator would be able to fulfill its indemnification obligations. If we were to be liable for any such environmental liabilities and were unable to seek recovery against our operators, this could have a Material Adverse Effect.
Our success depends, in part, on our ability to attract and retain talented employees, and the loss of any one of our key personnel could adversely impact our business.
The success of our business depends, in part, on the leadership and performance of our executive management team and key employees, and our ability to attract, retain and motivate talented employees could significantly impact our future performance. Competition for these individuals is intense, and we cannot provide any assurances that we will retain our key officers and employees or that we will be able to attract and retain other highly qualified individuals in the future. Losing any one or more of these persons could have a Material Adverse Effect.
Our operators may be adversely affected by increasing healthcare regulation and enforcement.
Over the last several years, the regulatory environment of the long-term healthcare industry has intensified both in the amount and type of regulations and in the efforts to enforce those regulations. The extensive federal, state and local laws and regulations affecting the healthcare industry include those relating to, among other things, licensure, conduct of operations, ownership of facilities, addition of facilities and equipment, allowable costs, services, prices for services, qualified beneficiaries, quality of care, patient rights, fraudulent or abusive behavior and financial and other arrangements that may be entered into by healthcare providers. Changes in enforcement policies by federal and state governments have resulted in a significant increase in the number of inspections, citations of regulatory deficiencies and other regulatory sanctions, including terminations from the Medicare and Medicaid programs, bars on Medicare and Medicaid payments for new admissions, civil monetary penalties and even criminal penalties.
If our operators fail to comply with the extensive laws, regulations and other requirements applicable to their businesses and the operation of our properties, they could become ineligible to receive reimbursement from governmental and private third-party payor programs, face bans on admissions of new patients or residents, suffer civil or criminal penalties or be required to make significant changes to their operations. Our operators also could be forced to expend considerable resources responding to an investigation or other enforcement action under applicable laws or regulations. In such event, the results of operations and financial condition of our operators and the results of operations of our properties operated by those entities could be adversely affected, which, in turn, could have a Material Adverse Effect. We are unable to predict future federal, state and local regulations and legislation, including the Medicare and Medicaid statutes and regulations, or the intensity of enforcement efforts with respect to such regulations and legislation, and any changes in the regulatory framework could have a material adverse effect on our operators, which, in turn, could have a Material Adverse Effect.
Our operators depend on reimbursement from government and other third-party payors; reductions in federal or state government spending, tax reform initiatives or other legislation to address projected operating deficits could have a material adverse effect on our operators’ liquidity, financial condition or results of operations, which could affect their ability to meet their obligations to us.
Many of our operators depend on third-party payors, including Medicare, Medicaid or private insurance carriers, for significant portions of their revenue. The reduction in reimbursement rates from third-party payors, including Medicare and Medicaid programs, changes in policy or other measures reducing reimbursements or altering payment methodologies for services provided by our operators may result in a reduction in their revenues and operating margins.
While reimbursement rates have generally increased over the past few years, President Obama and members of the U.S. Congress have approved or proposed various spending cuts and tax reform initiatives that have resulted or could result in changes (including substantial reductions in funding) to Medicare, Medicaid or Medicare Advantage Plans. In addition, a number of states are currently managing budget deficits, which may put pressure on states to decrease reimbursement rates for our operators with a goal of decreasing state expenditures under their state Medicaid programs. Any such existing or future
federal or state legislation relating to deficit reduction that reduces reimbursement payments to healthcare providers could have a material adverse effect on certain of our operators’ liquidity, financial condition or results of operations, which could adversely affect their ability to satisfy their obligations to us and could have a Material Adverse Effect.
Potential increases in patient or resident acuity, as well as changes in payor mix and payment methodologies, may significantly affect the profitability of our operators.
The ability of our operators to generate earnings is impacted by a number of factors, including licensed bed capacity, occupancy, the healthcare needs of residents and the rate of reimbursement. Increases in the acuity of their patients and residents, as well as changes in the payor mix among private pay, Medicare and Medicaid, could significantly affect our operators’ profitability, which may affect their ability to meet their obligations to us.
Our operators may be subject to significant legal actions that could subject them to increased operating costs and substantial uninsured liabilities, which may affect their ability to meet their obligations to us.
Our operators may be subject to claims that their services have resulted in resident injury or other adverse effects. The insurance coverage maintained by our operators, whether through commercial insurance or self-insurance, may not cover all claims made against them or continue to be available at a reasonable cost, if at all. In some states, insurance coverage for the risk of punitive damages arising from professional liability and general liability claims and/or litigation may not, in certain cases, be available to our operators due to state law prohibitions or limitations of availability. As a result, our operators operating in these states may be liable for punitive damage awards that are either not covered or are in excess of their insurance policy limits. From time to time, there may also be increases in government investigations of long-term care providers, particularly in the area of Medicare/Medicaid false claims, as well as increases in enforcement actions resulting from these investigations. Insurance is not available to cover such losses. Any adverse determination in a legal proceeding or government investigation, whether currently asserted or arising in the future, could lead to potential termination from government programs, large penalties and fines and otherwise have a material adverse effect on an operator’s financial condition. If an operator is unable to obtain or maintain insurance coverage, if judgments are obtained in excess of the insurance coverage, if an operator is required to pay uninsured punitive damages or if an operator is subject to an uninsurable government enforcement action, the operator could be exposed to substantial additional liabilities, which could result in its bankruptcy or insolvency or have a material adverse effect on the operator’s business and its ability to meet its obligations to us.
Increased competition may affect the ability of our operators to meet their obligations to us.
The healthcare industry is highly competitive. Our operators are competing with numerous other companies providing similar healthcare services or alternatives such as long-term acute care hospitals, inpatient rehabilitation facilities, home health agencies, hospices, life care at home, community-based service programs, retirement communities and convalescent centers. Our operators may not be able to achieve performance levels that will enable them to meet their obligations to us.
Real estate is a competitive business and this competition may make it difficult for us to identify and purchase suitable healthcare properties.
We operate in a highly competitive industry and face competition from other REITs, investment companies, private equity and hedge fund investors, sovereign funds, healthcare operators, lenders and other investors, some of whom are significantly larger than us and have greater resources and lower costs of capital than we do. This competition makes it more challenging to identify and successfully capitalize on acquisition opportunities that meet our investment objectives. An inability to identify and acquire a sufficient quantity of healthcare properties at favorable prices or to finance acquisitions on commercially favorable terms could have a Material Adverse Effect.
Market conditions, including, but not limited to, interest rates and credit spreads, the availability of credit, the actual and perceived state of the real estate markets and public capital markets generally, and unemployment rates, could negatively impact our business, results of operations and financial condition.
The markets in which we operate are affected by a number of factors that are largely beyond our control but may nevertheless have a significant negative impact on us. These factors include, but are not limited to:
| |
| • | interest rates and credit spreads; |
| |
| • | the availability of credit, including the price, terms and conditions under which it can be obtained; |
| |
| • | the actual and perceived state of the real estate market, the market for dividend-paying stocks and public capital markets in general; and |
| |
| • | unemployment rates, both nationwide and within the primary markets in which we operate. |
In addition, increased inflation may have a pronounced negative impact on the interest expense we pay in connection with our outstanding indebtedness and our general and administrative expenses, as these costs could increase at a rate higher than our rents. Also, inflation may adversely affect tenant leases with fixed escalations, which could be lower than the increase in inflation at any given time.
Deflation may result in a decline in general price levels, often caused by a decrease in the supply of money or credit. The predominant effects of deflation are high unemployment, credit contraction and weakened consumer demand. Restricted lending practices may impact our ability to obtain financing for our properties and may also negatively impact our tenants’ ability to obtain credit.
Risks Related to the Separation
Prior to the separation, we had not previously operated as a standalone company, and our historical financial information is not necessarily representative of the results that we would have achieved as a separate, publicly traded company and may not be a reliable indicator of our future results.
Some of the financial information about us in this Annual Report on Form 10-K refers to our business as operated by and integrated with Ventas and is derived from the consolidated financial statements and accounting records of Ventas. Accordingly, such information does not necessarily reflect the financial condition, results of operations or cash flows that we would have achieved as a separate, publicly traded company during the full periods presented or those that we will achieve in the future. Factors which could cause our results to differ from those reflected in such financial information and which may adversely impact our ability to receive similar results in the future may include, but are not limited to, the following:
| |
| • | Prior to the separation, our business had been operated by Ventas as part of its broader corporate organization, rather than as an independent company. Ventas or one of its affiliates performed various corporate functions for us, such as accounting, treasury, tax, information technology and finance. Following the separation, Ventas has continued to provide some of these functions to us on a transitional basis pursuant to a transition services agreement. Some of our historical financial results reflect allocations of corporate expenses from Ventas for such functions and are likely to be less than the expenses we would have incurred had we operated as a separate, publicly traded company. We will need to continue to make significant investments to replicate or outsource from other providers certain facilities, systems, infrastructure and personnel to which we no longer have access as a result of the separation. Developing our ability to operate without access to Ventas’s operational and administrative infrastructure will be costly and may prove difficult. We may not be able to operate our business efficiently or at comparable costs, and our profitability may decline; |
| |
| • | Historically, our business was integrated with the other businesses of Ventas, and we were able to use Ventas’s size and purchasing power in procuring various goods and services and shared economies of scope and scale in costs, employees, vendor relationships and operator relationships. For example, we have historically been able to take advantage of Ventas’s purchasing power in technology and services, including information technology, marketing, insurance, treasury services, property support and the procurement of goods. Although we have entered into certain transition and other separation-related agreements with Ventas, these arrangements may not fully capture the benefits we have enjoyed as a result of being integrated with Ventas and may result in us paying higher charges than in the past for these services. In addition, services provided to us under the transition services agreement will generally only be provided until August 31, 2016, and this may not be sufficient to meet our needs. As a separate, independent company, we may be unable to obtain goods and services at the prices and terms obtained prior to the separation, which could decrease our overall profitability; |
| |
| • | Generally, our working capital requirements and capital for our general corporate purposes, including acquisitions, redevelopment and capital expenditures, have historically been satisfied as part of the corporation-wide cash management policies of Ventas. As a result of the separation, any additional financing obtained from banks, through public offerings or private placements of debt or equity securities, strategic relationships or other arrangements, may not be on terms as favorable as those obtained by Ventas, and the cost of capital for our business may be higher as a standalone entity; |
| |
| • | Our historical financial information prior to August 17, 2015 does not reflect the debt incurred in connection with the separation or our receipt of certain operations and assets in connection with the separation or the assumption of the corresponding liabilities of our business after the separation; and |
| |
| • | As a public company, as modified by our status as an emerging growth company, we are subject to the reporting requirements of the Exchange Act, the Sarbanes-Oxley Act and the Dodd-Frank Act and are required to prepare our financial statements according to the rules and regulations required by the SEC. Complying with these requirements could result in significant costs to us and require us to divert substantial resources, including management time, from other activities. |
Other significant changes may occur in our cost structure, management, financing and business operations as a result of operating as an independent company. For additional information about the past financial performance of our business and the basis of presentation of our combined consolidated financial statements, please refer to “Selected Financial Data,” “Management’s Discussion and Analysis of Financial Condition and Results of Operations” and our combined consolidated financial statements and accompanying notes thereto included in Part II, Items 6, 7 and 8 of this Annual Report on Form 10-K.
If the distribution of shares of CCP common stock owned by Ventas to its stockholders (the “distribution”), together with certain related transactions, does not qualify as a transaction that is generally tax-free for U.S. federal income tax purposes, we could be subject to significant tax liabilities and, in certain circumstances, we could be required to indemnify Ventas for material taxes and related amounts pursuant to indemnification obligations under the tax matters agreement.
In connection with the distribution, Ventas received an opinion of counsel regarding qualification of the distribution, together with certain related transactions, under Sections 355 and 368(a)(1)(D) of the Code. The opinion of counsel was based and relied on, among other things, certain facts and assumptions, as well as certain representations, statements and undertakings, including those relating to the past and future conduct of Ventas and us. If any of these representations, statements or undertakings were, or become, inaccurate or incomplete, or if any covenants in the separation documents are breached, the ruling or the opinion of counsel may be invalid and the conclusions reached therein could be jeopardized. The provisions of the Protecting Americans from Tax Hikes Act of 2015 enacted on December 18, 2015 (the “PATH Act”) restricting REIT spinoffs do not apply to the distribution by Ventas.
Notwithstanding the receipt of the opinion of counsel, the IRS could determine that the distribution, together with certain related transactions, should be treated as a taxable transaction if it determines that any of the representations, assumptions or undertakings are false or have been violated, or if it disagrees with the conclusions in the opinion of counsel. The opinion of counsel is not binding on the IRS and there can be no assurance that the IRS will not take a contrary position.
If the distribution, together with certain related transactions, fails to qualify for tax-free treatment, in general, Ventas would recognize taxable gain as if it had sold the CCP common stock in a taxable sale for its fair market value (unless a joint election is made under Section 336(e) of the Code with respect to the distribution, in which case, in general, we would (i) recognize taxable gain as if we had sold all of our assets in a taxable sale in exchange for an amount equal to the fair market value of the CCP common stock and the assumption of all of our liabilities and (ii) obtain a related step up in the basis of its assets).
Under the tax matters agreement that we entered into with Ventas, we may be required to indemnify Ventas against any additional taxes and related amounts resulting from (i) an acquisition of all or a portion of our equity securities or assets, whether by merger or otherwise, (ii) other actions or failures to act by us or (iii) any of our representations or undertakings being incorrect or violated.
We could be liable for adverse tax consequences resulting from engaging in significant strategic or capital-raising transactions.
To preserve the tax-free treatment of the separation, for the two-year period following the separation, we may be prohibited, except in specific circumstances, from (i) entering into any transaction pursuant to which all or a portion of our shares would be acquired, whether by merger or otherwise, (ii) issuing equity securities beyond certain thresholds, (iii) repurchasing our common stock, (iv) ceasing to actively conduct certain of our businesses, or (v) taking or failing to take any other action that prevents the distribution and related transactions from being tax-free. These restrictions may limit our ability to pursue strategic transactions or engage in new business or other transactions that may maximize the value of our business.
Potential indemnification liabilities pursuant to the separation and distribution agreement could have a Material Adverse Effect.
The separation and distribution agreement includes provisions governing our relationship with Ventas with respect to and following the separation and distribution. Among other things, the separation and distribution agreement provides for indemnification obligations designed to make us financially responsible for substantially all liabilities that may exist relating to our business activities, whether incurred prior to or after the separation and distribution, as well as those obligations of Ventas that we assumed pursuant to the separation and distribution agreement. If we are required to indemnify Ventas under the circumstances set forth in the separation and distribution agreement, we may be subject to substantial liabilities.
We may have received more favorable terms from unaffiliated third parties than the terms we received in our agreements with Ventas.
The agreements we entered into in connection with the separation were prepared while we were still a wholly owned subsidiary of Ventas. Accordingly, during the period in which the terms of these agreements were prepared, we did not have an independent board of directors or management team that was independent of Ventas. As a result, although the parties attempted to include arm’s-length terms in these agreements, the terms of these agreements may not reflect terms that would have resulted from arm’s-length negotiations between unaffiliated third parties. Arm’s-length negotiations between Ventas and an unaffiliated third party in another form of transaction, such as a buyer in a sale of a business transaction, may have resulted in more favorable terms to the unaffiliated third party.
Certain of our directors and executive officers may have actual or potential conflicts of interest because of their previous or continuing equity interest in, or positions at, Ventas, and any of our directors who is also a director, officer or employee of Ventas may in certain circumstances direct investment opportunities away from our company.
Even though our board of directors consists of a majority of directors who are independent, some of our directors and executive officers are persons who are or have been directors or employees of Ventas. Because of their former positions with Ventas, certain of our directors and executive officers may own or have financial interests in Ventas common stock. In addition, our independent, non-executive chairman, Douglas Crocker II, is continuing to serve on the board of directors of Ventas for a limited period following the separation. Continued ownership of Ventas common stock or, in the case of Mr. Crocker, service as a director at both companies could create, or appear to create, potential conflicts of interest.
Our Guidelines on Governance provide that if any of our directors who is also a director, officer or employee of Ventas acquires knowledge of a corporate opportunity or is otherwise offered a corporate opportunity (provided that this knowledge was not acquired solely in such person’s capacity as a director of our company), then to the fullest extent permitted by law, such person is deemed to have fully satisfied such person’s fiduciary duties owed to us and is not liable to us if Ventas, or its affiliates, pursues or acquires the corporate opportunity, or if such person did not present the corporate opportunity to us. Accordingly, while Mr. Crocker is the only director who also serves as a director of Ventas (and is expected to continue to so serve for a limited period following the separation), any of our directors who is also a director of Ventas may, in certain circumstances, direct investment opportunities away from our company.
We may not achieve some or all of the expected benefits of the separation, and the separation may adversely affect our business.
We may not be able to achieve the full strategic and financial benefits expected to result from the separation, or such benefits may be delayed due to a variety of circumstances, not all of which may be under our control. We may not achieve these and other anticipated benefits for a variety of reasons, including, among others, that we may be more susceptible to market fluctuations and other adverse events than if we were still a part of Ventas, our business will be less diversified than Ventas’s business prior to the separation or the post-acute sector may be viewed less favorably than Ventas’s diversified business. If we fail to achieve some or all of the benefits expected to result from the separation, or if such benefits are delayed, this could have a Material Adverse Effect.
Ventas may fail to perform under various transaction agreements that were executed as part of the separation or we may fail to have necessary systems and services in place when certain of the transaction agreements expire.
Certain of the agreements we entered into with Ventas in connection with the separation provide for the performance of services by each company for the benefit of the other for a period of time after the separation. We rely on Ventas to satisfy its performance and payment obligations under these agreements. If Ventas is unable or unwilling to satisfy its obligations under these agreements, including its indemnification obligations, we could incur operational difficulties or losses.
If we do not have in place all of our own systems and services, or if we do not have agreements with other providers of these services when the transaction or long-term agreements terminate, we may not be able to operate our business effectively and our profitability may decline.
Ventas has agreed to indemnify us for certain pre-distribution liabilities and liabilities related to Ventas assets; however, these indemnities may be insufficient to protect us against the full amount of such liabilities.
Pursuant to the separation and distribution agreement, Ventas agreed to indemnify us for certain liabilities. However, third parties could seek to hold us responsible for any of the liabilities that Ventas agreed to retain, and there can be no assurance that Ventas will be able or willing to fully satisfy its indemnification obligations. Moreover, even if we ultimately succeed in recovering from Ventas any amounts for which we are held liable, such indemnification may be insufficient to fully offset the financial impact of such liabilities and/or we may be temporarily required to bear these losses while seeking recovery from Ventas.
Failure to maintain effective internal control over financial reporting in accordance with Section 404 of the Sarbanes-Oxley Act could have a Material Adverse Effect.
As a public company, we are subject to the reporting requirements of the Exchange Act, the Sarbanes-Oxley Act and the Dodd-Frank Act and will be required to prepare our financial statements according to the rules and regulations required by the SEC. In addition, the Exchange Act requires that we file annual, quarterly and current reports. Our failure to prepare and disclose this information in a timely manner or to otherwise comply with applicable law could subject us to penalties under federal securities laws, expose us to lawsuits and restrict our ability to access financing.
In addition, the Sarbanes-Oxley Act requires that we, among other things, establish and maintain effective internal controls and procedures for financial reporting and disclosure purposes. Internal control over financial reporting is complex and may be revised over time to adapt to changes in our business, or changes in applicable accounting rules. We cannot provide any assurances that our internal control over financial reporting will be effective in the future or that a material weakness will not be discovered with respect to a prior period for which we had previously believed that internal controls were effective. If we are not able to maintain or document effective internal control over financial reporting, our independent registered public accounting firm will not be able to certify as to the effectiveness of our internal control over financial reporting.
Matters impacting our internal controls may cause us to be unable to report our financial information on a timely basis, or may cause our company to restate previously issued financial information, and thereby subject us to adverse regulatory consequences, including sanctions or investigations by the SEC, or violations of applicable stock exchange listing rules. There could also be a negative reaction in the financial markets due to a loss of investor confidence in our company and the reliability of our financial statements. Confidence in the reliability of our financial statements is also likely to suffer if we or our independent registered public accounting firm report a material weakness in our internal control over financial reporting. This could have a Material Adverse Effect by, for example, leading to a decline in our share price and impairing our ability to raise additional capital.
For as long as we are an emerging growth company under the JOBS Act, our independent registered public accounting firm will not be required to attest to the effectiveness of our internal control over financial reporting pursuant to Section 404(b). An independent assessment of the effectiveness of our internal controls could detect problems that our management’s assessment might not. Undetected material weaknesses in our internal controls could lead to financial statement restatements and require us to incur the expense of remediation.
Risks Related to Our Status as a REIT
If we do not qualify to be taxed as a REIT, or if we fail to remain qualified as a REIT, we will be subject to U.S. federal income tax as a regular corporation and could face substantial tax liability, which would substantially reduce funds available for distribution to our stockholders.
Our qualification as a REIT will depend on our satisfaction of certain asset, income, organizational, distribution, stockholder ownership and other requirements on a continuing basis. Our ability to satisfy the asset tests depends upon our analysis of the characterization and fair market values of our assets, some of which are not susceptible to a precise determination, and for which we will not obtain independent appraisals. Our compliance with the REIT income and quarterly asset requirements also depends upon our ability to successfully manage the composition of our income and assets on an ongoing basis. Moreover, the proper classification of one or more of our investments may be uncertain in some circumstances,
which could affect the application of the REIT qualification requirements. Accordingly, there can be no assurance that the IRS will not contend that our investments violate the REIT requirements.
If we were to fail to qualify as a REIT in any taxable year, we would be subject to U.S. federal income tax, including any applicable alternative minimum tax, and possibly state and local tax, on our taxable income at regular corporate rates, and distributions to our stockholders would not be deductible by us in computing our taxable income. Any such corporate tax liability could be substantial and would reduce the amount of cash available for distribution to our stockholders, which in turn could have an adverse effect on the value of, and trading prices for, our common stock. Unless we are deemed to be entitled to relief under certain provisions of the Code, we would also be disqualified from taxation as a REIT for the four taxable years following the year during which we initially ceased to qualify as a REIT.
Our failure to qualify as a REIT could cause our shares to be delisted from the NYSE.
The NYSE requires, as a condition to the listing of our common stock, that we maintain our REIT status. Consequently, if we fail to maintain our REIT status, our common stock could promptly be delisted from the NYSE, which would decrease the trading activity of such common stock, making the sale of such common stock difficult.
If we were delisted as a result of losing our REIT status and wished to relist our shares on the NYSE, we would be required to reapply to the NYSE to be listed as a non-REIT corporation. As the NYSE’s listing standards for REITs are less burdensome than its standards for non-REIT corporations, it would be more difficult for us to become a listed company under these heightened standards. We may not be able to satisfy the NYSE’s listing standards for non-REIT corporations. As a result, if we were delisted from the NYSE, we may not be able to relist as a non-REIT corporation, in which case our shares could not trade on the NYSE.
Our ownership of and relationship with any current or future TRSs will be limited and a failure to comply with the limits would jeopardize our REIT status and may result in the application of a 100% excise tax.
A REIT may own up to 100% of the stock of one or more TRSs. A TRS may earn income that would not be qualifying income if earned directly by the parent REIT. Both the subsidiary and the REIT must jointly elect to treat the subsidiary as a TRS. A corporation (other than a REIT) of which a TRS directly or indirectly owns securities possessing more than 35% of the total voting power or total value of the outstanding securities of such corporation will automatically be treated as a TRS. Overall, no more than 25% (20% for taxable years beginning after December 31, 2017) of the value of a REIT’s total assets may consist of stock or securities of one or more TRSs. A domestic TRS will pay U.S. federal, state and local income tax at regular corporate rates on any income that it earns. In addition, the TRS rules limit the deductibility of interest paid or accrued by a TRS to its parent REIT to assure that the TRS is subject to an appropriate level of corporate taxation. The rules also impose a 100% excise tax on certain transactions between a TRS and its parent REIT that are not conducted on an arm’s-length basis. Any domestic TRS that we own or form will pay U.S. federal, state and local income tax on its taxable income, and its after-tax net income will be available for distribution to us but is not required to be distributed to us unless necessary to maintain our REIT qualification.
Dividends payable by REITs do not qualify for the reduced tax rates available for some dividends.
Dividends payable by non-REIT corporations to non-REIT stockholders that are individuals, trusts and estates are generally taxed at reduced tax rates. Dividends payable by REITs, however, generally are not eligible for the reduced rates. The more favorable rates applicable to regular corporate dividends could cause investors who are individuals, trusts and estates to perceive investments in REITs to be relatively less attractive than investments in the shares of non-REIT corporations that pay dividends, which could adversely affect the value of the shares of REITs, including shares of our common stock.
Qualifying as a REIT involves highly technical and complex provisions of the Code.
Qualifying as a REIT involves the application of highly technical and complex provisions of the Code for which only limited judicial and administrative authorities exist. Even a technical or inadvertent violation could jeopardize our REIT qualification. Our qualification as a REIT will depend on our satisfaction of certain asset, income, organizational, distribution, stockholder ownership and other requirements on a continuing basis. Compliance with these requirements must be carefully monitored on a continuing basis, and there can be no assurance that our personnel responsible for doing so will be able to successfully monitor our compliance. In addition, our ability to satisfy the requirements to qualify to be taxed as a REIT may depend, in part, on the actions of third parties over which we have either no control or only limited influence.
Legislative, administrative, regulatory or other actions affecting REITs, including positions taken by the IRS, could have an adverse impact on our investors or us.
The rules dealing with U.S. federal income taxation are constantly under review by persons involved in the legislative process, and by the IRS and the Treasury. Changes to the tax laws, such as the PATH Act enacted on December 18, 2015, or interpretations thereof by the IRS and the Treasury, with or without retroactive application, could materially and adversely affect our investors or our company. We cannot predict how changes in the tax laws might affect our investors or us. New legislation, Treasury regulations, administrative interpretations or court decisions could significantly and negatively affect our ability to qualify to be taxed as a REIT and/or the U.S. federal income tax consequences to our investors and our company of such qualification.
REIT distribution requirements could adversely affect our liquidity and our ability to execute our business plan.
In order for us to qualify to be taxed as a REIT, and assuming that certain other requirements are also satisfied, we generally must distribute at least 90% of our REIT taxable income, determined without regard to the dividends paid deduction and excluding any net capital gains, to our stockholders each year, so that U.S. federal corporate income tax does not apply to earnings that we distribute. To the extent that we satisfy this distribution requirement and qualify for taxation as a REIT, but distribute less than 100% of our REIT taxable income, determined without regard to the dividends paid deduction and including any net capital gains, we will be subject to U.S. federal corporate income tax on our undistributed net taxable income. In addition, we will be subject to a 4% non-deductible excise tax if the actual amount that we distribute to our stockholders in a calendar year is less than a minimum amount specified under U.S. federal income tax laws. We intend to make distributions to our stockholders to comply with the REIT requirements of the Code.
From time to time, we may generate taxable income greater than our cash flow as a result of differences in timing between the recognition of taxable income and the actual receipt of cash or the effect of non-deductible capital expenditures, the creation of reserves or required debt or amortization payments. If we do not have other funds available in these situations, we could be required to borrow funds on unfavorable terms, sell assets at disadvantageous prices, distribute amounts that would otherwise be invested in future acquisitions, capital expenditures or repayment of debt, or make taxable distributions of our capital stock or debt securities to make distributions sufficient to enable us to pay out enough of our taxable income to satisfy the REIT distribution requirement and avoid corporate income tax and the 4% excise tax in a particular year. These alternatives could increase our costs or reduce our equity. Further, amounts distributed will not be available to fund investment activities. Thus, compliance with the REIT requirements may hinder our ability to grow, which could adversely affect the value of our shares. Any restrictions on our ability to incur additional indebtedness or make certain distributions could preclude us from meeting the 90% distribution requirement. Decreases in FFO due to unfinanced expenditures for acquisitions of properties or increases in the number of shares outstanding without commensurate increases in FFO each would adversely affect our ability to maintain distributions to our stockholders. Consequently, there can be no assurance that we will be able to make distributions at the anticipated distribution rate or any other rate. Please refer to “Dividends and Distributions” included in Part II, Item 5 of this Annual Report on Form 10-K.
Complying with REIT requirements may cause us to forego otherwise attractive acquisition opportunities or liquidate otherwise attractive investments.
To qualify to be taxed as a REIT for U.S. federal income tax purposes, we must ensure that, at the end of each calendar quarter, at least 75% of the value of our assets consist of cash, cash items, government securities and “real estate assets” (as defined in the Code), including certain mortgage loans and securities. The remainder of our investments (other than government securities, qualified real estate assets and securities issued by a TRS) generally cannot include more than 10% of the outstanding voting securities of any one issuer or more than 10% of the total value of the outstanding securities of any one issuer.
Additionally, in general, no more than 5% of the value of our total assets (other than government securities, qualified real estate assets and securities issued by a TRS) can consist of the securities of any one issuer, and no more than 25% (20% for taxable years beginning after December 31, 2017) of the value of our total assets can be represented by securities of one or more TRSs. Please refer to “Certain U.S. Federal Income Tax Considerations” included in Item 1 of this Annual Report on Form 10-K. If we fail to comply with these requirements at the end of any calendar quarter, we must correct the failure within 30 days after the end of the calendar quarter or qualify for certain statutory relief provisions to avoid losing our REIT qualification and suffering adverse tax consequences. As a result, we may be required to liquidate or forego otherwise attractive investments. These actions could have the effect of reducing our income and amounts available for distribution to our stockholders.
In addition to the asset tests set forth above, to qualify to be taxed as a REIT, we must continually satisfy tests concerning, among other things, the sources of our income, the amounts we distribute to our stockholders and the ownership of our shares. We may be unable to pursue investments that would be otherwise advantageous to us in order to satisfy the source-of-income or asset-diversification requirements for qualifying as a REIT. Thus, compliance with the REIT requirements may hinder our ability to make certain attractive investments.
Complying with REIT requirements may limit our ability to hedge effectively and may cause us to incur tax liabilities.
The REIT provisions of the Code substantially limit our ability to hedge our assets and liabilities. Income from certain potential hedging transactions that we may enter into to manage risk of interest rate changes with respect to borrowings made or to be made to acquire or carry real estate assets or from transactions to manage risk of currency fluctuations with respect to any item of income or gain that satisfy the REIT gross income tests (including gain from the termination of such a transaction) does not constitute “gross income” for purposes of the 75% or 95% gross income tests that apply to REITs, provided that certain identification requirements are met. To the extent that we enter into other types of hedging transactions or fail to properly identify such transaction as a hedge, the income is likely to be treated as non-qualifying income for purposes of both of the gross income tests. Please refer to “Certain U.S. Federal Income Tax Considerations” included in Item 1 of this Annual Report on Form 10-K.
As a result of these rules, we may be required to limit our use of advantageous hedging techniques or implement those hedges through a total return swap. This could increase the cost of our hedging activities because the total return swap may be subject to tax on gains or expose us to greater risks associated with changes in interest rates than we would otherwise want to bear. In addition, losses in the total return swap will generally not provide any tax benefit, except that such losses could theoretically be carried back or forward against past or future taxable income in the total return swap.
The share ownership limit imposed by the Code for REITs, and our certificate of incorporation, may inhibit market activity in our shares and restrict our business combination opportunities.
In order for us to maintain our qualification as a REIT under the Code, not more than 50% in value of our outstanding shares may be owned, directly or indirectly, by five or fewer individuals (as defined in the Code to include certain entities) at any time during the last half of each taxable year after our first taxable year. Our certificate of incorporation, with certain exceptions, will authorize our board of directors to take the actions that are necessary and desirable to preserve our qualification as a REIT. Unless exempted by our board of directors, no person may beneficially own more than 9.0% of our outstanding common stock or more than 9.0% of any outstanding class or series of our preferred stock, as determined by value or number, whichever is more restrictive. The board of directors may exempt a person from the ownership limit if the board of directors receives a ruling from the IRS or an opinion of tax counsel that such ownership will not jeopardize our status as a REIT or such other documents the board deems appropriate. These ownership limits could delay or prevent a transaction or a change in our control that might involve a premium price for our common stock or otherwise be in the best interest of our stockholders.
Risks Related to Ownership of Our Common Stock
The share price and trading volume of our stock may fluctuate significantly.
We have been a public company for less than a year, and thus there is a limited trading history in our common stock, which has been traded on the NYSE under the symbol “CCP” since August 18, 2015. The market price of our common stock may fluctuate significantly due to a number of factors, some of which may be beyond our control, including:
| |
| • | actual or anticipated variations in our quarterly operating results; |
| |
| • | changes in our FFO or earnings estimates; |
| |
| • | increases in market interest rates, which may lead purchasers of our shares to demand a higher yield; |
| |
| • | changes in market valuations of similar companies; |
| |
| • | adverse market reaction to any increased indebtedness we incur in the future; |
| |
| • | additions or departures of key personnel; |
| |
| • | actions by stockholders; |
| |
| • | speculation in the press or investment community; |
| |
| • | general market, economic and political conditions; |
| |
| • | our operating performance and the performance of other similar companies; |
| |
| • | changes in accounting principles; |
| |
| • | passage of legislation or other regulatory developments that adversely affect us or our industry; and |
| |
| • | the potential impact of governmental budgets and healthcare reimbursement expenditures. |
In addition, when the market price of a company’s shares of common stock drops significantly, stockholders often institute securities class action lawsuits against the company. A lawsuit against us could cause us to incur substantial costs and could divert the time and attention of our management and other resources.
We cannot guarantee the timing, amount or payment of dividends on our common stock.
Although we expect to continue to pay regular cash distributions, the timing, declaration, amount and payment of future distributions to stockholders will fall within the discretion of our board of directors. Our board of directors’ decisions regarding the payment of distributions will depend on many factors, such as our financial condition, earnings, capital requirements, debt service obligations, limitations under our financing arrangements, industry practice, legal requirements, regulatory constraints and other factors that it deems relevant. Our ability to pay distributions will depend on our ongoing ability to generate cash from operations and access capital markets. We cannot guarantee that we will pay any distributions in the future or continue to pay such distributions.
Your ownership percentage in our company may be diluted in the future.
In the future, your percentage ownership in us may be diluted because of equity issuances for acquisitions, capital market transactions or otherwise. We also anticipate that we will grant future compensatory equity-based incentive awards to directors, officers and employees who provide services to us. Such awards will have a dilutive effect on our earnings per share, which could adversely affect the market price of our common stock.
In addition, our certificate of incorporation authorizes us to issue, without the approval of our stockholders, one or more classes or series of preferred stock having such designation, powers, preferences and relative, participating, optional and other special rights, including preferences over our common stock respecting dividends and distributions, as our board of directors generally may determine. The terms of one or more classes or series of preferred stock could dilute the voting power or reduce the value of our common stock. For example, we could grant the holders of preferred stock the right to elect some number of our directors in all events or on the occurrence of specified events, or the right to veto specified transactions. Similarly, the repurchase or redemption rights or liquidation preferences we could assign to shares of preferred stock could affect the residual value of the common stock.
Certain provisions in our certificate of incorporation and bylaws, and provisions of Delaware law, may prevent or delay an acquisition of our company, which could decrease the trading price of shares of our common stock.
Our certificate of incorporation and bylaws contain, and Delaware law contains, provisions that are intended to deter coercive takeover practices and inadequate takeover bids by making such practices or bids unacceptably expensive to the bidder and to encourage prospective acquirers to negotiate with our board of directors rather than to attempt a hostile takeover. These provisions include, among others:
| |
| • | the inability of our stockholders to call a special meeting; |
| |
| • | advance notice requirements and other limitations on the ability of stockholders to present proposals or nominate directors for election at stockholder meetings; |
| |
| • | the right of our board of directors to issue preferred shares without stockholder approval; |
| |
| • | the ability of our directors, and not stockholders, to fill vacancies on our board of directors; |
| |
| • | restrictions on the number of shares of capital stock that individual stockholders may own; |
| |
| • | supermajority vote requirements for stockholders to amend certain provisions of our certificate of incorporation and bylaws; and |
| |
| • | restrictions on an “interested stockholder” to engage in certain business combinations with us for a three-year period following the date the interested stockholder became such. |
We believe these provisions will protect our stockholders from coercive or otherwise unfair takeover tactics by requiring potential acquirers to negotiate with our board of directors and by providing our board of directors with more time to assess any acquisition proposal. These provisions are not intended to make the company immune from takeovers. However, these provisions will apply even if the offer may be considered beneficial by some stockholders and could delay or prevent an acquisition that our board of directors determines is not in the best interests of our stockholders and us. These provisions may also prevent or discourage attempts to remove and replace incumbent directors.
Several of our agreements with Ventas entered into in connection with the separation may require Ventas’s consent to any assignment by us of our rights and obligations under the agreements. These agreements will generally expire within two years of the separation, except for certain agreements that will continue for longer terms. The consent and termination rights set forth in these agreements might discourage, delay or prevent a change of control that you may consider favorable.
In addition, an acquisition or further issuance of our common stock could trigger the application of Section 355(e) of the Code. Please refer to the discussion of Section 355(e) of the Code in “—Risks Related to the Separation” above. Under the tax matters agreement, we would be required to indemnify Ventas for any resulting taxes and related amounts, and this indemnity obligation might discourage, delay or prevent a change of control that you may consider favorable. Please refer to “Management’s Discussion and Analysis of Financial Condition and Results of Operations” included in Part II, Item 7 for a more detailed description of these agreements and provisions.
Future offerings of debt, which would be senior to our common stock upon liquidation, or preferred equity securities that may be senior to our common stock for purposes of distributions or upon liquidation may have an adverse effect on the per share trading price of our common stock.
In the future, we may attempt to increase our capital resources by making additional offerings of debt or equity securities (or causing Care Capital LP to issue debt securities), including medium-term notes, senior or subordinated notes and classes or series of preferred shares. Upon liquidation, holders of our debt securities and preferred shares and lenders with respect to other borrowings may be entitled to receive our available assets prior to distribution to the holders of our common stock. Additionally, any convertible or exchangeable securities that we issue in the future may have rights, preferences and privileges more favorable than those of our common stock and may result in dilution to owners of our common stock. Holders of our common stock are not entitled to preemptive rights or other protections against dilution. Our preferred shares, if issued, could have a preference on liquidating distributions or a preference on dividend payments that could limit our ability pay dividends or other distributions to the holders of our common stock. Because our decision to issue securities in any future offering will depend on market conditions and other factors beyond our control, we cannot predict or estimate the amount, timing or nature of our future offerings. Thus, our stockholders bear the risk that our future offerings could reduce the per share trading price of our common stock and dilute their interest in us.
If securities analysts do not continue to publish research or reports about our industry or if they downgrade our common stock or the healthcare-related real estate sector, the market price of our common stock could decline.
The trading market for our common stock is impacted in part by the research and reports that industry or financial analysts publish about us or our industry. We have no control over these analysts. Furthermore, if one or more of the analysts who do cover us downgrades our shares or our industry, or the stock of any of our competitors, the price of our common stock could decline. If one or more of these analysts ceases coverage of our company, we could lose attention in the market, which in turn could cause the market price of our common stock to decline.
ITEM 1B. Unresolved Staff Comments
None.
ITEM 2. Properties
As of December 31, 2015, our portfolio of properties consisted of 318 SNFs, 15 specialty hospitals and healthcare assets and 15 seniors housing communities and campuses containing approximately 39,000 beds/units. The following table provides additional information regarding the locations of properties (excluding properties classified as held for sale) as of December 31, 2015:
|
| | | | | | | | | | | | | | | | | |
| | SNFs | | Specialty Hospitals and Healthcare Assets | | Seniors Housing Communities and Campuses |
| | Number of Properties | | Licensed
Beds | | Number of Properties | | Units | | Number of Properties | | Licensed Beds |
| Alabama | 2 |
| | 329 |
| | — |
| | — |
| | — |
| | — |
|
| Arizona | 3 |
| | 263 |
| | — |
| | — |
| | — |
| | — |
|
| Arkansas | 8 |
| | 875 |
| | — |
| | — |
| | — |
| | — |
|
| California | 6 |
| | 538 |
| | 1 |
| | 27 |
| | — |
| | — |
|
| Colorado | 2 |
| | 270 |
| | — |
| | — |
| | — |
| | — |
|
| Connecticut | 3 |
| | 324 |
| | — |
| | — |
| | — |
| | — |
|
| Florida | 1 |
| | 171 |
| | — |
| | — |
| | — |
| | — |
|
| Georgia | 4 |
| | 458 |
| | — |
| | — |
| | — |
| | — |
|
| Idaho | 1 |
| | 111 |
| | — |
| | — |
| | — |
| | — |
|
| Indiana | 26 |
| | 2,673 |
| | — |
| | — |
| | 5 |
| | 265 |
|
| Kansas | 3 |
| | 232 |
| | — |
| | — |
| | 3 |
| | 183 |
|
| Kentucky | 26 |
| | 2,896 |
| | 1 |
| | 40 |
| | — |
| | — |
|
| Louisiana | 7 |
| | 958 |
| | — |
| | — |
| | 1 |
| | 160 |
|
| Maine | 8 |
| | 654 |
| | — |
| | — |
| | — |
| | — |
|
| Maryland | 3 |
| | 445 |
| | — |
| | — |
| | — |
| | — |
|
| Massachusetts | 31 |
| | 3,659 |
| | — |
| | — |
| | 1 |
| | 98 |
|
| Michigan | 1 |
| | 330 |
| | — |
| | — |
| | — |
| | — |
|
| Minnesota | 3 |
| | 466 |
| | — |
| | — |
| | — |
| | — |
|
| Missouri | 14 |
| | 1,392 |
| | — |
| | — |
| | — |
| | — |
|
| Nevada | 3 |
| | 299 |
| | — |
| | — |
| | — |
| | — |
|
| New Hampshire | 2 |
| | 212 |
| | — |
| | — |
| | — |
| | — |
|
| New York | 9 |
| | 1,566 |
| | — |
| | — |
| | — |
| | — |
|
| North Carolina | 14 |
| | 1,567 |
| | — |
| | — |
| | — |
| | — |
|
| Ohio | 13 |
| | 1,442 |
| | — |
| | — |
| | — |
| | — |
|
| Oregon | 14 |
| | 1,112 |
| | — |
| | — |
| | 3 |
| | 491 |
|
| Pennsylvania | 3 |
| | 306 |
| | — |
| | — |
| | — |
| | — |
|
| Rhode Island | 3 |
| | 447 |
| | — |
| | — |
| | — |
| | — |
|
| South Carolina | 4 |
| | 602 |
| | — |
| | — |
| | — |
| | — |
|
| South Dakota | 2 |
| | 246 |
| | — |
| | — |
| | — |
| | — |
|
| Tennessee | 5 |
| | 601 |
| | — |
| | — |
| | — |
| | — |
|
| Texas | 55 |
| | 6,766 |
| | 13 |
| | 306 |
| | 2 |
| | 246 |
|
| Virginia | 6 |
| | 891 |
| | — |
| | — |
| | — |
| | — |
|
| Washington | 10 |
| | 1,051 |
| | — |
| | — |
| | — |
| | — |
|
| West Virginia | 2 |
| | 202 |
| | — |
| | — |
| | — |
| | — |
|
| Wisconsin | 17 |
| | 1,968 |
| | — |
| | — |
| | — |
| | — |
|
| Wyoming | 4 |
| | 371 |
| | — |
| | — |
| | — |
| | — |
|
| Total | 318 |
| | 36,693 |
| | 15 |
| | 373 |
| | 15 |
| | 1,443 |
|
Corporate Offices
We lease our corporate headquarters in Chicago, Illinois. Our specialty healthcare and seniors housing valuation firm also leases its corporate offices in Sarasota, Florida; Birmingham, Alabama; Boston, Massachusetts; and Los Angeles, California.
ITEM 3. Legal Proceedings
The information contained in “Note 14—Litigation” of the Notes to Combined Consolidated Financial Statements included in Part II, Item 8 of this Annual Report on Form 10-K is incorporated by reference in this Item 3. Except as set forth therein, we are not a party to, nor is any of our property the subject of, any material pending legal proceedings.
ITEM 4. Mine Safety Disclosures
Not applicable.
PART II
ITEM 5. Market for Registrant’s Common Equity, Related Stockholder Matters and Issuer Purchases of Equity Securities
Market Information
Our common stock, par value $0.01 per share, has been listed and traded on the NYSE under the symbol “CCP” since August 18, 2015. Prior to that time, there was no public market for our common stock. The following table sets forth, for the periods indicated, the high and low sales prices of our common stock, as reported on the NYSE, and the cash dividends declared per share.
|
| | | | | | | | | | | |
| | Sales Price of Common Stock | | Dividends Declared |
| | High | | Low | |
| 2015 | | | | | |
| Third Quarter (from August 18, 2015) | $ | 35.61 |
| | $ | 30.14 |
| | $ | 0.57 |
|
| Fourth Quarter | 34.32 |
| | 29.91 |
| | 0.57 |
|
As of March 7, 2016, we had 83,945,549 shares of our common stock outstanding held by approximately 3,961 stockholders of record. The number of record holders does not include stockholders who are beneficial owners, but whose shares are held in street name by brokers and other nominees.
Dividends and Distributions
During 2015, we paid cash distributions to our common stockholders totaling $1.14 per share. On March 9, 2016, our board of directors declared the first quarterly installment of our 2016 dividend on our common stock in the amount of $0.57 per share, payable in cash on March 31, 2016 to stockholders of record on March 21, 2016. We expect to distribute at least 100% of our taxable net income to our stockholders for 2016.
To qualify as a REIT, we must distribute to our stockholders an amount at least equal to:
| |
| • | 90% of our REIT taxable income, determined before the deduction for dividends paid and excluding any net capital gain (which does not necessarily equal net income as calculated in accordance with U.S. generally accepted accounting principles (“GAAP”)); plus |
| |
| • | 90% of the excess of our net income from foreclosure property over the tax imposed on such income by the Code; less |
| |
| • | Any excess non-cash income (as determined under the Code). |
We cannot provide any assurances that our dividend policy will remain the same in the future, or that any estimated distributions would be made or sustained. Distributions made by us will be authorized and determined by our board of directors, in its sole discretion, out of legally available funds, and will depend upon a number of factors, including restrictions under applicable law, our actual and projected financial condition, liquidity, funds from operations (“FFO”) and results of operations, the revenue we actually receive from our properties, our operating expenses, our debt service requirements, our capital expenditures, prohibitions and other limitations under the arrangements governing our indebtedness, the annual REIT distribution requirements and such other factors as our board of directors deems relevant. For more information regarding risks that could materially adversely affect our ability to make distributions, see “Risk Factors” included in Part I, Item 1A of this Annual Report on Form 10-K.
Our distributions may be funded from a variety of sources. To the extent that our cash available for distribution is less than 90% of our taxable income, we may consider various means to cover any such shortfall, including borrowing under a revolving credit facility or other loans, selling certain of our assets or using a portion of the net proceeds we receive from future offerings of equity or debt securities or declaring taxable share dividends. In addition, our certificate of incorporation allows us to issue shares of preferred stock that could have a preference on distributions, and if we do, the distribution preference on the preferred stock could limit our ability to make distributions to the holders of our common stock.
For a discussion of the tax treatment of distributions to holders of our shares of common stock, see “Certain U.S. Federal Income Tax Considerations” included in Part I, Item 1 of this Annual Report on Form 10-K.
Director and Employee Stock Sales
Our directors, executive officers and other employees may adopt, from time to time, non-discretionary, written trading plans that comply with Rule 10b5-1 under the Exchange Act, or otherwise monetize, gift or transfer their equity-based compensation. Any such transactions typically would be conducted for estate, tax and financial planning purposes and are subject to compliance with our Securities Trading Policy, the minimum stock ownership requirements contained in our Guidelines on Governance and all applicable laws and regulations.
Our Securities Trading Policy expressly prohibits our directors, executive officers and employees from buying or selling derivatives with respect to our securities or other financial instruments that are designed to hedge or offset a decrease in the market value of our securities and from engaging in short sales with respect to our securities. In addition, our Securities Trading Policy prohibits our directors and executive officers from holding our securities in margin accounts or pledging our securities to secure loans without the prior approval of our Audit and Compliance Committee. Each of our directors and executive officers has advised us that he or she is in compliance with the Securities Trading Policy and has not pledged any of our equity securities to secure margin or other loans.
Stock Repurchases
During the quarter ended December 31, 2015, we did not repurchase any shares of our common stock.
Stock Performance Graph
The following performance graph compares the cumulative total return (including dividends) to the holders of our common stock from August 18, 2015 (the date our common stock began trading on the NYSE) through December 31, 2015, with the cumulative total returns of the NYSE Composite Index, the FTSE NAREIT Composite REIT Index (the “Composite REIT Index”) and the S&P 500 Index over the same period. The comparison assumes $100 was invested on August 18, 2015 in our common stock and in each of the foregoing indexes and assumes reinvestment of dividends, as applicable. We have included the NYSE Composite Index in the performance graph because our common stock is listed on the NYSE. We have included the Composite REIT Index because we believe that it is most representative of the industries in which we compete, or otherwise provides a fair basis for comparison with us, and is therefore particularly relevant to an assessment of our performance. The figures in the table below are rounded to the nearest dollar. |
| | | | | | | | |
| | | 8/18/15 | | 12/31/15 |
| CCP | | $ | 100 |
| | $ | 89 |
|
| NYSE Composite Index | | 100 |
| | 95 |
|
| Composite REIT Index | | 100 |
| | 101 |
|
| S&P 1500 Healthcare REIT Composite Index | | 100 |
| | 97 |
|
| S&P 500 Index | | 100 |
| | 98 |
|
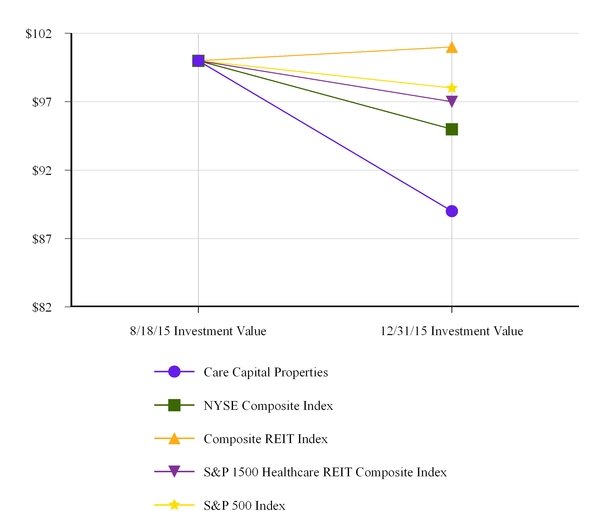
ITEM 6. Selected Financial Data
The following table sets forth our selected financial data, some of which was carved out from the financial information of Ventas, as described below. Prior to the separation, we did not conduct any business operations other than those incidental to our formation and in connection with the transactions related to the separation and distribution.
Our combined consolidated financial statements for periods prior to the separation were carved out from the financial information of Ventas at a carrying value reflective of historical cost in Ventas’s records. Such combined consolidated financial statements include an allocation of expenses related to certain Ventas corporate functions, including executive oversight, treasury, finance, legal, human resources, tax planning, internal audit, financial reporting, information technology and investor relations. These expenses have been allocated to us based on direct usage or benefit where specifically identifiable, with the remainder allocated primarily on a pro rata basis of revenue, headcount or other measures. We consider the expense methodology and results to be reasonable for all periods presented. However, the allocations may not be indicative of the actual expense that would have been incurred had we operated as an independent, publicly traded company for the full periods presented. In connection with the separation, we entered into a transition services agreement with Ventas to receive certain support services from Ventas on a transitional basis until August 31, 2016, subject to extension upon mutual agreement. The historical combined consolidated financial information presented may not be indicative of the results of operations, financial position or cash flows that would have been obtained if we had been an independent, standalone entity during the full periods shown.
You should read the following selected financial data in conjunction with our combined consolidated financial statements and the notes thereto included in Item 8 of this Annual Report on Form 10-K, as well as “Management’s Discussion and Analysis of Financial Condition and Results of Operations” included in Item 7 of this Annual Report on Form 10-K, as acquisitions, dispositions, changes in accounting policies and other items may impact the comparability of the financial data.
|
| | | | | | | | | | | | | | | |
| | As of and For the Years Ended December 31, |
| | 2015 | | 2014 | | 2013 | | 2012 |
| | (In thousands, except per share data) |
| Operating Data | | | | | | | |
| Rental income | $ | 321,785 |
| | $ | 291,962 |
| | $ | 287,794 |
| | $ | 285,998 |
|
| General, administrative and professional fees | 29,222 |
| | 22,412 |
| | 22,552 |
| | 18,643 |
|
| Total expenses | 184,280 |
| | 137,523 |
| | 117,107 |
| | 117,769 |
|
| Net income attributable to CCP | 143,166 |
| | 157,595 |
| | 174,290 |
| | 172,421 |
|
| Per Share Data | | | | | | | |
Net income attributable to CCP per common share (1) | | | | | | | |
| Basic | $ | 1.71 |
| | $ | 1.89 |
| | $ | 2.09 |
| | $ | 2.07 |
|
| Diluted | $ | 1.71 |
| | $ | 1.88 |
| | $ | 2.08 |
| | $ | 2.06 |
|
| Dividends declared per common share | $ | 1.14 |
| | $ | — |
| | $ | — |
| | $ | — |
|
| Other Data | | | | | | | |
| Weighted average shares, basic | 83,488 |
| | 83,488 |
| | 83,488 |
| | 83,488 |
|
| Weighted average shares, diluted | 83,607 |
| | 83,658 |
| | 83,658 |
| | 83,658 |
|
| Net cash provided by operating activities | $ | 267,174 |
| | $ | 255,082 |
| | $ | 249,727 |
| | $ | 251,556 |
|
| Net cash used in investing activities | (507,111 | ) | | (28,977 | ) | | (4,505 | ) | | (21,899 | ) |
| Net cash provided by (used in) financing activities | 254,508 |
| | (225,848 | ) | | (249,800 | ) | | (231,240 | ) |
NAREIT FFO attributable to CCP (2) | 276,645 |
| | 257,197 |
| | 266,651 |
| | 269,968 |
|
Normalized FFO attributable to CCP (2) | 286,348 |
| | 258,744 |
| | 266,651 |
| | 270,533 |
|
Normalized FAD attributable to CCP (2) | 257,050 |
| | 236,019 |
| | 251,052 |
| | 259,377 |
|
| Balance Sheet Data | | | | | | | |
| Real estate investments, at gross cost | $ | 3,406,965 |
| | $ | 2,793,819 |
| | $ | 2,780,878 |
| | $ | 2,760,989 |
|
| Cash | 16,995 |
| | 2,424 |
| | 2,167 |
| | 6,745 |
|
| Total assets | 2,954,969 |
| | 2,331,750 |
| | 2,405,764 |
| | 2,499,879 |
|
| Term loans and other debt | 1,524,863 |
| | — |
| | — |
| | — |
|
| Total equity | 1,215,847 |
| | 2,123,079 |
| | 2,191,300 |
| | 2,265,524 |
|
| |
| (1) | Basic and diluted earnings per share for the periods prior to our separation from Ventas were retroactively restated for the number of basic and diluted shares outstanding immediately following the separation. |
| |
| (2) | For a discussion of NAREIT FFO attributable to CCP, normalized FFO attributable to CCP and normalized FAD attributable to CCP, and a reconciliation of such measures to our net income attributable to CCP, please see “Management’s Discussion and Analysis of Financial Condition and Results of Operations—Non-GAAP Financial Measures” included in Item 7 of this Annual Report on Form 10-K. |
ITEM 7. Management’s Discussion and Analysis of Financial Condition and Results of Operations
The following discussion provides information that management believes is relevant to an understanding and assessment of the financial condition and results of operations of Care Capital Properties, Inc. (together with its consolidated subsidiaries, unless the context otherwise requires or indicates, “we,” “us,” “our,” “our company” or “CCP”). You should read this discussion in conjunction with our combined consolidated financial statements and the notes thereto included in Item 8 of this Annual Report on Form 10-K, as it will help you understand:
| |
| • | Our company and the environment in which we operate; |
| |
| • | Highlights and recent developments; |
| |
| • | Our critical accounting policies and estimates; |
| |
| • | Our results of operations for the last three years; |
| |
| • | How we manage our assets and liabilities; |
| |
| • | Our liquidity and capital resources; and |
Company Overview
CCP is a Delaware corporation formed in April 2015 to hold the post-acute/skilled nursing facility (“SNF”) portfolio of Ventas, Inc. (“Ventas”) and its subsidiaries operated by regional and local care providers (the “CCP Business”). Effective as of 11:59 p.m. on August 17, 2015, Ventas completed its spin-off of the CCP Business by distributing one share of our common stock for every four shares of Ventas common stock held as of the close of business on August 10, 2015. As a result, we began operating as an independent public company and our common stock commenced trading on the New York Stock Exchange (“NYSE”) under the symbol “CCP” as of August 18, 2015.
Prior to the separation, CCP was a wholly owned subsidiary of Ventas. Prior to or concurrently with the separation, Ventas engaged in certain reorganization transactions that were designed to consolidate the ownership of its interests in 355 properties and certain loans receivable that comprised the CCP Business and transfer those interests to us. For periods prior to the separation, references in this discussion to “we,” “us,” or “our” refer to the CCP Business after giving effect to the transfer of the assets and liabilities from Ventas in connection with the separation.
In connection with the spin-off, we entered into a separation and distribution agreement, as well as a transition services agreement, a tax matters agreement and an employee matters agreement, with Ventas. Under the transition services agreement, Ventas agreed to provide us with various accounting, tax and information technology services on a transitional basis until August 31, 2016, subject to extension upon mutual agreement, in exchange for a fee of $2.5 million, payable in four quarterly installments.
At the time of the separation and distribution, we had not conducted any business as a separate company and had no material assets or liabilities. We intend to elect to be treated as a real estate investment trust (“REIT”), and, therefore, subsequent to the distribution, we are operating in a manner consistent with a REIT with a diversified portfolio of SNFs and other healthcare properties located throughout the United States. The operations of the CCP Business transferred to us by Ventas are presented herein as if the transferred business was our business for all historical periods described and at the carrying value of those assets and liabilities reflected in Ventas’s books and records.
Subject to the limitation under the REIT asset test rules, we are permitted to own up to 100% of the stock of one or more taxable REIT subsidiaries (“TRSs”). We have elected for one of our subsidiaries to be treated as a TRS, which is subject to federal, state and local income taxes.
For periods prior to our separation from Ventas, our combined consolidated financial statements included in this Annual Report on Form 10-K reflect Ventas’s interests in 358 properties (including two properties that were not transferred to us as part of the separation, one property that was sold during the second quarter of 2015, five properties that were sold subsequent to the separation and five additional properties that were classified as held for sale of August 18, 2015). For periods
subsequent to the separation, the combined consolidated financial statements in this Annual Report on Form 10-K reflect our interest in 358 properties (including ten properties that were classified as held for sale as of December 31, 2015).
The combined consolidated financial statements for periods prior to the separation have been prepared on a standalone basis from Ventas’s consolidated financial statements and accounting records and reflect the financial position, results of operations and cash flows of the CCP Business as it was operated as part of Ventas prior to the distribution, in conformity with U.S. generally accepted accounting principles (“GAAP”). The combined consolidated financial statements for periods subsequent to the separation reflect our financial position, results of operations and cash flows in conformity with GAAP.
For periods prior to our separation from Ventas, our equity balance (net parent investment) in the combined consolidated financial statements represents the excess of total assets over total liabilities, including the intercompany balances between us and Ventas. Net parent investment is primarily impacted by contributions from Ventas, which are the result of treasury activities and net funding provided by or distributed to Ventas prior to the separation. For periods subsequent to our separation from Ventas, our equity balance in the combined consolidated financial statements represents our equity activity starting August 18, 2015.
Corporate and Operating Environment
We evaluate our operating performance and allocate resources based on a single reportable business segment: triple-net leased properties. We primarily generate our revenues by leasing our properties to unaffiliated tenants under long-term triple‑net leases, pursuant to which the tenants are obligated to pay all property‑related expenses, including maintenance, utilities, repairs, taxes, insurance and capital expenditures. In addition, we originate and manage a small portfolio of secured and unsecured loans made primarily to our SNF operators and other post-acute providers.
As of December 31, 2015, our portfolio consisted of 358 properties operated by 39 private regional and local care providers, spread across 36 states, and containing a total of approximately 39,000 beds/units. We are currently one of only three publicly traded, SNF-focused REITs, and we conduct all of our operations through our wholly owned operating partnership, Care Capital Properties, LP (“Care Capital LP”), and its subsidiaries.
2015 Highlights and Other Recent Developments
| |
| • | In January 2015, Ventas completed the acquisition of American Realty Capital Healthcare Trust, Inc. (“HCT”) in a stock and cash transaction, which included 14 SNFs, two specialty hospitals and four seniors housing communities that were transferred to us in connection with the separation. During 2015, eight HCT properties were classified as held for sale, two of which were sold as of December 31, 2015. In addition, we restructured the lease terms and reduced the rent on 12 HCT properties, including those sold or classified as held for sale, in an aggregate amount of $5.7 million after the application of security deposits. |
| |
| • | Also in January 2015, Ventas completed the acquisition of 12 SNFs for an aggregate purchase price of $234.9 million, all of which were transferred to us in connection with the separation and are currently operated by Senior Care Centers, LLC (together with its subsidiaries, “SCC”). |
| |
| • | In August 2015, we completed our previously disclosed acquisition of a specialty healthcare and seniors housing valuation firm for stock consideration valued at $11.5 million. |
| |
| • | Also in August 2015, we entered into a Credit and Guaranty Agreement (the “Credit Agreement”) with a syndicate of banks that provides for a $600 million unsecured revolving credit facility due 2019 (the “Revolver”), a $600 million unsecured term loan due 2017 (the “$600 million Term Loan”) and an $800 million unsecured term loan due 2020 (the “$800 million Term Loan” and collectively with the $600 million Term Loan, the “Original Term Loans” and together with the Revolver, the “Facility”). Pursuant to the separation and distribution agreement with Ventas, we transferred approximately $1.3 billion of the proceeds from borrowings under the Original Term Loans to Ventas. |
| |
| • | On August 17, 2015, Ventas completed its spin-off of the CCP Business by distributing one share of our common stock for every four shares of Ventas common stock held as of the close of business on August 10, 2015. As a result, we began operating as an independent public company and our common stock commenced trading on the NYSE under the symbol “CCP” as of August 18, 2015. |
| |
| • | On September 1, 2015, we completed the acquisition of eight properties (seven SNFs and one campus with both skilled nursing and assisted living facilities) and simultaneously entered into a long-term master lease with SCC to operate the acquired portfolio. We purchased the assets for approximately $190 million in cash and made a $20 |
million five-year, fully amortizing loan to SCC, resulting in a total transaction value of approximately $210 million.
| |
| • | On September 30, 2015, we paid a full third quarter cash dividend in the amount of $0.57 per share to the holders of record of our common stock as of September 14, 2015. On December 31, 2015, we paid a fourth quarter cash dividend in the amount of $0.57 per share to the holders of record of our common stock as of December 21, 2015. |
| |
| • | On December 1, 2015, Signature HealthCARE, LLC (together with its subsidiaries, “Signature”) acquired from Elmcroft Senior Living, Inc. (together with its subsidiaries, “Elmcroft”) the operations of 18 SNFs owned by us. In connection with the acquisition, we funded a total of $9 million to Signature, of which $8 million was added to the lease basis at an 8.5% return and $1 million was a four-year fully amortizing loan. We entered into a new master lease with Signature to operate the properties at the existing Elmcroft rent plus the additional rent described above. |
| |
| • | In December 2015, we acquired the noncontrolling interest in one of our former joint ventures for $3.1 million. |
| |
| • | During 2015, subsequent to the spin-off, we sold five SNFs, two of which were transferred to us in connection with the HCT acquisition, for aggregate proceeds of $6.0 million. |
| |
| • | In January 2016, we entered into a Term Loan and Guaranty Agreement (the “Term Loan Agreement”) with a syndicate of banks that provides for a $200 million unsecured term loan due 2023 (the “$200 million Term Loan”). We used the proceeds from borrowings under the $200 million Term Loan to repay a portion of the indebtedness outstanding under the $600 million Term Loan. Also in January 2016, we entered into agreements to swap a total of $600 million of debt, effectively converting the interest on that debt from floating rates to fixed rates. The swap agreements have terms of 4.6 years and seven years. |
Critical Accounting Policies and Estimates
Our historical combined consolidated financial statements included herein have been prepared in accordance with U.S. GAAP set forth in the Accounting Standards Codification (“ASC”), as published by the Financial Accounting Standards Board (“FASB”). GAAP requires us to make estimates and assumptions regarding future events that affect the reported amounts of assets and liabilities, the disclosure of contingent assets and liabilities at the date of the financial statements and the reported amounts of revenues and expenses during the reporting periods. We base these estimates on our experience and assumptions we believe to be reasonable under the circumstances. However, if our judgment or interpretation of the facts and circumstances relating to various transactions or other matters had been different, we may have applied a different accounting treatment, resulting in a different presentation of our financial statements. We periodically reevaluate our estimates and assumptions, and in the event they prove to be different from actual results, we make adjustments in subsequent periods to reflect more current estimates and assumptions about matters that are inherently uncertain. We believe that the critical accounting policies described below, among others, affect our more significant estimates and judgments used in the preparation of our financial statements. For more information regarding our critical accounting policies, see “Note 2—Accounting Policies” of the Notes to Combined Consolidated Financial Statements included in Item 8 of this Annual Report on Form 10-K.
Business Combinations
We account for acquisitions using the acquisition method and record the cost of our acquisitions among tangible and recognized intangible assets and liabilities based upon their estimated fair values as of the acquisition date. Recognized intangibles primarily include the value of in-place leases, acquired lease contracts and goodwill. We do not amortize goodwill, which represents the excess of the purchase price paid over the fair value of the acquired net assets.
Our method for recording the purchase price to acquired investments in real estate requires us to make subjective assessments for determining fair value of the assets acquired and liabilities assumed. These estimates require significant judgment and in some cases involve complex calculations. These assessments directly impact our results of operations, as amounts estimated for certain assets and liabilities have different depreciation or amortization lives. In addition, we amortize the value assigned to above and/or below market leases as a component of revenue, unlike in-place leases and other intangibles, which we include in depreciation and amortization in our combined consolidated statements of income.
We estimate the fair value of buildings acquired on an as-if-vacant basis, or replacement cost basis, and depreciate the building value over the estimated remaining life of the building, generally not to exceed 35 years. We determine the fair value of other fixed assets, such as site improvements and furniture, fixtures and equipment, based upon the replacement cost and depreciate such value over the assets’ estimated remaining useful lives as determined at the applicable acquisition date. We determine the value of land by considering the sales prices of similar properties in recent transactions.
The fair value of acquired lease-related intangibles, if any, reflects: (i) the estimated value of any above and/or below market leases, determined by discounting the difference between the estimated market rent and in-place lease rent; and (ii) the estimated value of in-place leases related to the cost to obtain tenants, including leasing commissions, and an estimated value of the absorption period to reflect the value of the rent and recovery costs foregone during a reasonable lease-up period as if the acquired space was vacant. We amortize any acquired lease-related intangibles to revenue or amortization expense over the remaining life of the associated lease plus any assumed bargain renewal periods. If a lease is terminated prior to its stated expiration or not renewed upon expiration, we recognize all unamortized lease-related intangibles associated with that lease in operations at that time.
Impairment of Long-Lived and Intangible Assets and Goodwill
We periodically evaluate our long-lived assets, primarily consisting of investments in real estate, for impairment indicators. If indicators of impairment are present, we evaluate the carrying value of the related real estate investments in relation to the future undiscounted cash flows of the underlying operations. In performing this evaluation, we consider market conditions and our current intentions with respect to the retention or disposition of the asset. We adjust the net book value of leased properties and other long-lived assets to fair value if the sum of the expected future undiscounted cash flows, including sales proceeds, is less than book value. When our long-lived assets qualify as held for sale, we adjust the net book value of leased properties and other long-lived assets to the lower of fair value less costs to sell or their net book value. We recognize any shortfall from carrying value as an impairment loss in the current period.
If impairment indicators arise with respect to intangible assets with finite useful lives, we evaluate impairment by comparing the carrying amount of the asset to the estimated future undiscounted net cash flows expected to be generated by the asset. If estimated future undiscounted net cash flows are less than the carrying amount of the asset, then we estimate the fair value of the asset and compare the estimated fair value to the intangible asset’s carrying value. We recognize any shortfall from carrying value as an impairment loss in the current period.
We test goodwill for impairment at least annually, and more frequently if indicators arise. We assess qualitative factors, such as current macroeconomic conditions, the state of capital markets and our overall financial and operating performance, to determine the likelihood that the fair value of the reporting unit is less than its carrying amount. If we determine it is more likely than not that the fair value of the reporting unit is less than its carrying amount, we proceed with the two-step approach to evaluating impairment. First, we estimate the fair value of the reporting unit and compare it to the reporting unit’s carrying value. If the carrying value exceeds fair value, we proceed with the second step, which requires us to assign the fair value of the reporting unit to all of the assets and liabilities of the reporting unit as if it had been acquired in a business combination at the date of the impairment test. The excess fair value of the reporting unit over the amounts assigned to the assets and liabilities is the implied value of goodwill and is used to determine the amount of impairment. We recognize an impairment loss to the extent the carrying value of goodwill exceeds the implied value in the current period.
Estimates of fair value used in our evaluation of goodwill, investments in real estate and intangible assets are based upon discounted future cash flow projections or other acceptable valuation techniques that are based, in turn, upon level three inputs in the fair value hierarchy, such as revenue and expense growth rates, capitalization rates, discount rates or other available market data. Our ability to accurately predict future operating results and cash flows and to estimate and allocate fair values impacts the timing and recognition of impairments. While we believe our assumptions are reasonable, changes in these assumptions may have a material impact on our financial results.
Revenue Recognition
Triple-Net Leased Properties
Certain of our triple-net leases provide for periodic and determinable increases in base rent. We recognize base rental revenues under these leases on a straight-line basis over the applicable lease term when collectibility is reasonably assured. Recognizing rental income on a straight-line basis generally results in recognized revenues during the first half of a lease term exceeding the cash amounts contractually due from our tenants, creating a straight-line rent receivable that is included in other assets on our combined consolidated balance sheets.
Our remaining leases provide for periodic increases in base rent only if certain revenue parameters or other substantive contingencies are met. We recognize the increased rental revenue under these leases as the related parameters or contingencies are met, rather than on a straight-line basis over the applicable lease term.
Other
We recognize income from rent, lease termination fees and all other income when all of the following criteria are met in accordance with SEC Staff Accounting Bulletin 104: (i) the applicable agreement has been fully executed and delivered; (ii) services have been rendered; (iii) the amount is fixed or determinable; and (iv) collectibility is reasonably assured.
Allowances
We assess our rent receivables, including straight-line rent receivables, to determine whether an allowance is appropriate. We base our assessment of rent receivables (other than straight-line rent receivables) on several factors, including, among other things, payment history, the financial strength of the tenant and any guarantors, the value of the underlying collateral, if any, and current economic conditions, including government reimbursement. If our evaluation of these factors indicates that we may not be able to recover the full value of the receivable, we provide an allowance against the portion of the receivable that we estimate may not be recovered. We also base our assessment of straight-line rent receivables on several factors, including, among other things, the financial strength of the tenant and any guarantors, the historical operations and operating trends of the property, the historical payment pattern of the tenant and the type of property. If our evaluation of these factors indicates that we may not be able to receive the rent payments due in the future, we provide an allowance against the recognized straight-line rent receivable asset for the portion, up to its full value, that we estimate may not be recovered. If we change our assumptions or estimates regarding the collectibility of future rent payments required by a lease, we may adjust the allowance to increase or reduce the rental revenue recognized in the period in which we make such change in our assumptions or estimates.
Loans
We recognize interest income from loans, including discounts and premiums, using the effective interest method when collectibility is reasonably assured. We apply the effective interest method on a loan-by-loan basis and recognize discounts and premiums as yield adjustments over the related loan term. We recognize interest income on an impaired loan to the extent our estimate of the fair value of the collateral is sufficient to support the balance of the loan, other receivables and all related accrued interest. When the balance of the loan, other receivables and all related accrued interest is equal to or less than our estimate of the fair value of the collateral, we recognize interest income on a cash basis. We provide a reserve against an impaired loan to the extent our total investment in the loan exceeds our estimate of the fair value of the loan collateral.
Federal Income Tax
Ventas elected to be treated as a REIT under the applicable provisions of the Internal Revenue Code of 1986, as amended (the “Code”), for every year beginning with the year ended December 31, 1999. Accordingly, with respect to periods prior to our separation from Ventas, Ventas generally was not subject to federal income tax. We intend to elect to be treated as a REIT under the applicable provisions of the Code, beginning with the year ended December 31, 2015.
Recently Issued or Adopted Relevant Accounting Standards
In 2014, the FASB issued ASU No. 2014-09, Revenue From Contracts With Customers (“ASU 2014-09”), which outlines a comprehensive model for entities to use in accounting for revenue arising from contracts with customers. ASU 2014-09 states that “an entity recognizes revenue to depict the transfer of promised goods or services to customers in an amount that reflects the consideration to which the entity expects to be entitled in exchange for those goods or services.” While ASU 2014-09 specifically references contracts with customers, it may apply to certain other transactions such as the sale of real estate or equipment. In July 2015, the FASB provided for a one-year deferral of the effective date for ASU 2014-09, which is now effective for us beginning January 1, 2018. We are continuing to evaluate this guidance; however, we do not expect its adoption to have a significant impact on our combined consolidated financial statements, as substantially all of our revenue consists of rental income from leasing arrangements, which are specifically excluded from ASU 2014-09.
In February 2015, the FASB issued ASU No. 2015-02, Consolidation (Topic 810): Amendments to the Consolidation Analysis (“ASU 2015-02”), which makes certain changes to both the variable interest model and the voting model, including changes to (1) the identification of variable interests (fees paid to a decision maker or service provider), (2) the variable interest entity characteristics for a limited partnership or similar entity and (3) the primary beneficiary determination. ASU 2015-02 is effective for us beginning January 1, 2016. We are continuing to evaluate this guidance; however, we do not expect its adoption to have an impact on our combined consolidated financial statements.
In April 2015, the FASB issued ASU No. 2015-03, Interest—Imputation of Interest (Subtopic 835-30): Simplifying the Presentation of Debt Issuance Costs, which requires debt issuance costs to be presented in the balance sheet as a direct reduction from the carrying value of the associated debt liability, consistent with the presentation of a debt discount. We
elected to adopt this new guidance as of August 18, 2015. As a result, our term loans and other debt is presented net of $18.1 million of unamortized debt issuance costs.
In April 2015, the FASB issued ASU 2015-05, Intangibles—Goodwill and Other-Internal—Use Software (Subtopic 350-40): Customer's Accounting for Fees Paid in a Cloud Computing Arrangement (“ASU 2015-05”), which provides explicit guidance to help companies evaluate the accounting for fees paid by a customer in a cloud computing arrangement. The new guidance clarifies that if a cloud computing arrangement includes a software license, the customer should account for the license consistent with its accounting for other software licenses. If the arrangement does not include a software license, the customer should account for the arrangement as a service contract. ASU 2015-05 is effective for us beginning January 1, 2016, and we are continuing to evaluate this guidance.
In September 2015, the FASB issued ASU 2015-16, Business Combinations (Topic 805): Simplifying the Accounting for Measurement-Period Adjustments (“ASU 2015-16”), which simplifies the accounting for business combinations, specifically as it relates to measurement-period adjustments. Acquiring entities in a business combination must recognize measurement-period adjustments in the reporting period in which the adjustment amounts are determined. Also, ASU 2015-16 requires entities to present separately on the face of the income statement (or disclose in the notes to the financial statements) the portion of the amount recorded in the current period earnings, by line item, that would have been recorded in previous reporting periods if the adjustment to the provisional amounts had been recognized as of the acquisition date. ASU 2015-16 is effective for us beginning January 1, 2016 and is to be applied prospectively to measurement-period adjustments that occur after the effective date. We are continuing to evaluate this guidance.
In addition, Section 107 of the Jumpstart Our Business Startups Act (the “JOBS Act”) provides that an “emerging growth company” can take advantage of the extended transition period provided in Section 13(a) of the Securities Exchange Act of 1934, as amended, for complying with new or revised accounting standards. In other words, an emerging growth company can delay the adoption of certain accounting standards until those standards would otherwise apply to private companies. We have elected not to take advantage of the benefits of this extended transition period and, therefore, will be subject to the same new or revised accounting standards as other public companies that are not emerging growth companies. This election is irrevocable.
Components of Revenues and Expenses Following the Spin-Off
Rental Income, Net
Our revenues are primarily attributable to rental income earned in connection with the leasing of our SNFs and other healthcare properties to unaffiliated tenants under long-term triple-net leases. We generally do not expect to incur direct operating expenses in connection with these leases, as they obligate the tenant to pay all property-related expenses, including maintenance, utilities, repairs, taxes, insurance and capital expenditures. However, from time to time, we may fund expenses during an operator transition or enter into agreements with our tenants to fund certain capital expenditures.
Our revenues generally consist of fixed rental amounts (subject to annual contractual escalations) received from our tenants in accordance with the applicable lease terms and do not vary based on the underlying operating performance of the properties. Therefore, while occupancy rates may affect the profitability of our tenants’ operations, they do not directly impact our revenues or financial results.
The following table sets forth average occupancy rates related to the properties we owned at December 31, 2015 (excluding properties classified as held for sale) for the trailing 12 months ended September 30, 2015 (which is the most recent information available to us from our tenants).
|
| | | | | |
| | Number of Properties Owned at December 31, 2015 | | Average Occupancy For the Trailing 12 Months Ended September 30, 2015 (1) |
| SNFs | 318 |
| | 78.4 | % |
| Specialty hospitals and healthcare assets | 15 |
| | 81.9 |
|
Seniors housing communities and campuses (2) | 15 |
| | 82.1 |
|
| |
| (1) | Excludes certain properties for which we do not receive occupancy information. |
| |
| (2) | Campuses are defined as multi-level properties. |
The information in the table above has been derived from occupancy data provided to us by multiple third-party operators who may perform such computations using different methodologies and/or on an inconsistent basis from period to period. Furthermore, the occupancy rates shown in the table above are based primarily on licensed beds, which may differ from beds in operation at any point in time, and are generally lower than occupancy rates based on operational beds. While we have no reason to believe that the information we receive from our operators is inaccurate in any material respect, we cannot and do not verify this information either through an independent investigation or otherwise.
Real Estate Services Fee Income
Our real estate services fee income is derived from the operations of our specialty valuation firm subsidiary and represents revenue resulting from the provision of services such as appraisal reports, preliminary market studies, market studies, self-contained appraisal reports for in-court tax appeals and in-court expert testimonials.
Interest Expense
Commencing August 17, 2015, we have incurred interest expense in connection with borrowings under our Credit Agreement, and we amortize debt issuance costs related to that indebtedness. Borrowings under the Facility bear interest at a fluctuating rate per annum equal to LIBOR plus an applicable margin based on our leverage or, if applicable, unsecured long-term debt ratings. At closing of the Facility, borrowings were based on our leverage and the applicable margin was 1.70% for Revolver borrowings and 1.60% for Original Term Loan borrowings. As of December 31, 2015, borrowings were based on our unsecured long-term debt ratings and the applicable margin was 1.30% for Revolver borrowings and 1.50% for Original Term Loan borrowings. Interest expense is inclusive of our interest costs, as well as amortization of our debt issuance costs.
General, Administrative and Professional Fees
For periods prior to our separation from Ventas, the combined consolidated financial statements included in Item 8 of this Annual Report on Form 10-K reflect the operating results and financial position of the CCP Business as it was operated by Ventas, rather than as an independent company. We have incurred and expect to incur additional expenses to operate as an independent company, including costs for various corporate headquarters functions and incremental costs to operate a standalone support services infrastructure.
Under our transition services agreement with Ventas, Ventas has agreed to provide certain corporate support services for us on a transitional basis until August 31, 2016, subject to extension upon mutual agreement, for a fee of $2.5 million, payable in four quarterly installments. The services provided under the transition services agreement are services that we have historically received from Ventas and will allow us to operate independently prior to fully establishing a standalone support services infrastructure.
Commencing August 18, 2015, our general administrative and professional fee expenses are direct expenses attributable to our operations. These expenses also include costs incurred under the transition services agreement with Ventas, as well as the general, administrative and professional fee expenses incurred by our specialty healthcare and seniors housing valuation firm subsidiary. During the transition period, we expect to incur non-recurring expenses to expand our infrastructure, some of which may be redundant with costs incurred under the transition services agreement with Ventas.
Results of Operations
Years Ended December 31, 2015 and 2014
The table below shows our results of operations for the years ended December 31, 2015 and 2014 and the effect of changes in those results from period to period on our net income attributable to CCP.
|
| | | | | | | | | | | | | | |
| | For the Year Ended December 31, | | Increase (Decrease) to Net Income |
| | 2015 | | 2014 | | $ | | % |
| | (Dollars in thousands) |
| Revenues: | | | | | | | |
| Rental income, net | $ | 321,785 |
| | $ | 291,962 |
| | $ | 29,823 |
| | 10.2 | % |
| Income from investments in direct financing lease and loans | 3,818 |
| | 3,400 |
| | 418 |
| | 12.3 |
|
| Real estate services fee income | 2,247 |
| | — |
| | 2,247 |
| | nm |
|
| Interest and other income | 91 |
| | 2 |
| | 89 |
| | nm |
|
| Total revenues | 327,941 |
| | 295,364 |
| | 32,577 |
| | 11.0 |
|
| Expenses: | | | | | | | |
| Interest | 12,347 |
| | — |
| | (12,347 | ) | | nm |
|
| Depreciation and amortization | 111,752 |
| | 91,612 |
| | (20,140 | ) | | (22.0 | ) |
| Impairment on real estate investments | 23,139 |
| | 8,769 |
| | (14,370 | ) | | (163.9 | ) |
| General, administrative and professional fees | 29,222 |
| | 22,412 |
| | (6,810 | ) | | (30.4 | ) |
| Merger-related expenses and deal costs | 6,354 |
| | 1,547 |
| | (4,807 | ) | | nm |
|
| Other | 1,466 |
| | 13,183 |
| | 11,717 |
| | 88.9 |
|
| Total expenses | 184,280 |
| | 137,523 |
| | (46,757 | ) | | (34.0 | ) |
| Income before income taxes, real estate dispositions and noncontrolling interests | 143,661 |
| | 157,841 |
| | (14,180 | ) | | (9.0 | ) |
| Income tax expense | (938 | ) | | — |
| | (938 | ) | | nm |
|
| Gain (loss) on real estate dispositions | 632 |
| | (61 | ) | | 693 |
| | nm |
|
| Net income | 143,355 |
| | 157,780 |
| | (14,425 | ) | | (9.1 | ) |
| Net income attributable to noncontrolling interests | 189 |
| | 185 |
| | (4 | ) | | (2.2 | ) |
| Net income attributable to CCP | $ | 143,166 |
| | $ | 157,595 |
| | (14,429 | ) | | (9.2 | ) |
nm - not meaningful
Rental Income, Net
Rental income increased during the year ended December 31, 2015 over the prior year primarily due to rent attributable to properties acquired in 2015 and contractual rent escalations pursuant to the terms of our existing leases, partially offset by reduced rents arising from the re-leasing of certain properties in 2014 and 2015 (including those properties that were formerly leased to Kindred Healthcare, Inc. and were re-leased by Ventas) and the restructuring of lease terms related to certain properties acquired in the HCT transaction in 2015.
The following tables compare results of continuing operations for our 313 same-store properties. Same-store refers to properties owned by us for the full period in each comparison period, excluding properties classified as assets held for sale.
|
| | | | | | | | | | | | | | |
| | For the Year Ended December 31, | | Increase (Decrease)
to Rental Income, Net |
| | 2015 | | 2014 | | $ | | % |
| | (Dollars in thousands) |
| Rental income | $ | 277,663 |
| | $ | 285,584 |
| | $ | (7,921 | ) | | (2.8 | )% |
|
| | | | | | | | | | | | | | |
| | For the Quarter Ended December 31, | | Increase (Decrease)
to Rental Income, Net |
| | 2015 | | 2014 | | $ | | % |
| | (Dollars in thousands) |
| Rental income | $ | 70,324 |
| | $ | 68,369 |
| | $ | 1,955 |
| | 2.9 | % |
Same-store rental income decreased during the year ended December 31, 2015 over the prior year primarily as a result of the re-leasing described above and the restructuring of certain properties from the HCT acquisition in 2015. Same-store rental income increased during the quarter ended December 31, 2015 compared to the quarter ended December 31, 2014 due to contractual rent escalations pursuant to the terms of our existing leases, partially offset by the re-leasing described above.
Income from Investments in Direct Financing Lease and Loans
Income from investments in direct financing lease and loans, which represents the income from our direct financing lease and our secured and unsecured loans receivable, increased in 2015 over the prior year due to the loans we made to SCC and Signature in 2015.
Real Estate Services Fee Income
Real estate services fee income represents revenue generated by our specialty valuation firm, which we acquired in August 2015, for services such as appraisal reports, preliminary market studies, market studies, self-contained appraisal reports for in-court tax appeals and in-court expert testimonials.
Interest
Interest for 2015 represents interest expense and the amortization of debt issuance costs incurred in connection with borrowings under our Credit Agreement.
Depreciation and Amortization
Depreciation and amortization expense increased during the year ended December 31, 2015 compared to the same period in 2014 primarily due to the properties acquired during 2015.
Impairment on Real Estate Investments
We recognized $23.1 million of impairments on real estate assets during the year ended December 31, 2015, compared to $8.8 million during the same period in 2014. The increase in 2015 can be attributed primarily to our decision to pursue the sale or transition of certain properties in our portfolio.
General, Administrative and Professional Fees
General, administrative and professional fees for the year ended December 31, 2015 included an allocation of expenses related to certain Ventas corporate functions prior to August 18, 2015, including executive oversight, treasury, finance, legal, human resources, tax planning, internal audit, financial reporting, information technology and investor relations. Subsequent to our separation from Ventas, our general and administrative and professional fee expenses are direct expenses attributable to our operations, including expenses incurred by our specialty valuation firm subsidiary in the amount of $2.0 million. The period subsequent to our separation from Ventas also includes one-time costs of $0.5 million associated with debt rating agency fees, $0.5 million of stock-based compensation expense associated with the one-time conversion of outstanding Ventas equity awards to awards in respect of our common stock, and $0.9 million of expenses under the transition services agreement with Ventas.
Merger-Related Expenses and Deal Costs
Merger-related expenses and deal costs for both periods consist of transition, integration and deal expenses primarily related to completed and pending transactions. The increase for the year ended December 31, 2015 over the prior year is primarily due to costs allocated to us in connection with the HCT acquisition, costs incurred in connection with our September 1, 2015 acquisition of eight properties and costs associated with completed and in-progress transitions of properties.
Other
Other consists primarily of certain unreimbursable expenses arising from the management of our portfolio.
Gain on Real Estate Dispositions
Our aggregate gain on real estate dispositions during 2015 was $0.6 million, relating to the sale of five SNFs, two of which were originally acquired as part of the HCT transaction and transferred to us in connection with the separation.
Years Ended December 31, 2014 and 2013
The table below shows our results of operations for the years ended December 31, 2014 and 2013 and the effect of changes in those results from period to period on our net income attributable to CCP.
|
| | | | | | | | | | | | | | |
| | For the Year Ended
December 31, | | Increase (Decrease) to Net Income |
| | 2014 | | 2013 | | $ | | % |
| | (Dollars in thousands) |
| Revenues: | | | | | | | |
| Rental income, net | $ | 291,962 |
| | $ | 287,794 |
| | $ | 4,168 |
| | 1.4 | % |
| Income from investments in direct financing lease and loans | 3,400 |
| | 3,813 |
| | (413 | ) | | (10.8 | ) |
| Interest and other income | 2 |
| | 25 |
| | (23 | ) | | (92.0 | ) |
| Total revenues | 295,364 |
| | 291,632 |
| | 3,732 |
| | 1.3 |
|
| Expenses: | | | | | | | |
| Depreciation and amortization | 91,612 |
| | 87,586 |
| | (4,026 | ) | | (4.6 | ) |
| Impairment on real estate investments | 8,769 |
| | 5,601 |
| | (3,168 | ) | | (56.6 | ) |
| General, administrative and professional fees | 22,412 |
| | 22,552 |
| | 140 |
| | 0.6 |
|
| Merger-related expenses and deal costs | 1,547 |
| | — |
| | (1,547 | ) | | nm |
|
| Other | 13,183 |
| | 1,368 |
| | (11,815 | ) | | nm |
|
| Total expenses | 137,523 |
| | 117,107 |
| | (20,416 | ) | | (17.4 | ) |
| Income before real estate dispositions and noncontrolling interest | 157,841 |
| | 174,525 |
| | (16,684 | ) | | (9.6 | ) |
| Loss on real estate dispositions | (61 | ) | | (15 | ) | | (46 | ) | | nm |
|
| Net income | 157,780 |
| | 174,510 |
| | (16,730 | ) | | (9.6 | ) |
| Net income attributable to noncontrolling interest | 185 |
| | 220 |
| | 35 |
| | 15.9 |
|
| Net income attributable to CCP | $ | 157,595 |
| | $ | 174,290 |
| | (16,695 | ) | | (9.6 | ) |
nm—not meaningful
Rental Income, Net
Rental income increased in 2014 over the prior year primarily due to contractual escalations in rent pursuant to the terms of our leases, and net increases in base and other rent under certain of our leases.
The following table compares results of continuing operations for our 321 same-store properties. |
| | | | | | | | | | | | | | |
| | For the Year Ended
December 31, | | Increase (Decrease)
to Rental Income, Net |
| | 2014 | | 2013 | | $ | | % |
| | (Dollars in thousands) |
| Rental income | $ | 290,582 |
| | $ | 286,136 |
| | $ | 4,446 |
| | 1.6 | % |
Same-store rental income increased during the year ended December 31, 2014 over the prior year primarily as a result of contractual rent escalations, partially offset by property transitions.
Income from Investments in Direct Financing Lease and Loans
Income from investments in direct financing lease and loans decreased in 2014 over the prior year due primarily to the repayment of two secured loans receivable in 2013.
Depreciation and Amortization
Depreciation and amortization expense increased in 2014 primarily due to real estate impairments recorded in 2014.
Merger-Related Expenses and Deal Costs
Merger-related expenses and deal costs in 2014 consist of transition, integration and deal expenses primarily related to the HCT acquisition and other consummated transactions. No similar transactions occurred in 2013.
Other
Other primarily includes certain unreimbursable expenses related to our triple-net leased portfolio. In 2014, this includes a $10.0 million payment made in relation to the transfer of certain properties to a replacement operator.
Non-GAAP Financial Measures
We believe that net income, as defined by GAAP, is the most appropriate earnings measurement. However, we consider certain non-GAAP financial measures to be useful supplemental measures of our operating performance. A non-GAAP financial measure is a measure of historical or future financial performance, financial position or cash flows that excludes or includes amounts that are not excluded from or included in the most directly comparable measure calculated and presented in accordance with GAAP. Described below are the non-GAAP financial measures used by management to evaluate our operating performance and that we consider most useful to investors, together with reconciliations of these measures to the most directly comparable GAAP measures.
The non-GAAP financial measures we present herein may not be comparable to those presented by other real estate companies due to the fact that not all real estate companies use the same definitions. You should not consider these measures as alternatives to net income (determined in accordance with GAAP) as indicators of our financial performance or as alternatives to cash flow from operating activities (determined in accordance with GAAP) as measures of our liquidity, nor are these measures necessarily indicative of sufficient cash flow to fund all of our needs. In order to facilitate a clear understanding of our combined consolidated historical operating results, you should examine these measures in conjunction with net income as presented in our combined consolidated financial statements and other financial data included elsewhere in this Annual Report on Form 10-K.
Funds From Operations, Normalized Funds From Operations and Normalized Funds Available for Distribution
Historical cost accounting for real estate assets implicitly assumes that the value of real estate assets diminishes predictably over time. However, since real estate values historically have risen or fallen with market conditions, many industry investors deem presentations of operating results for real estate companies that use historical cost accounting to be insufficient by themselves. For that reason, we consider the National Association of Real Estate Investment Trusts (“NAREIT”) Funds From Operations (“FFO”), normalized FFO and Normalized Funds Available for Distribution (“FAD”) to be appropriate measures of operating performance of an equity REIT. In particular, we believe that normalized FFO is useful because it allows investors, analysts and our management to compare our operating performance to the operating performance of other real estate companies and between periods on a consistent basis without having to account for differences caused by unanticipated items and other events such as transactions.
NAREIT defines FFO as net income (computed in accordance with GAAP), excluding gains (or losses) from sales of real estate property and impairment write-downs of depreciable real estate, plus real estate depreciation and amortization, and after adjustments for joint ventures. Adjustments for joint ventures will be calculated to reflect FFO on the same basis. We define normalized FFO as FFO excluding income taxes, stock-based compensation expense associated with the spin-related conversion of awards, transition services fee expense, merger-related expenses and deal costs, initial debt rating agency costs and initial stock exchange fee and amortization of other intangibles (which may be recurring in nature). Normalized FAD represents normalized FFO excluding amortization of above and below market lease intangibles, accretion of direct financing lease, other amortization, straight-line rental adjustments, non-revenue enhancing capital expenditures and stock-based compensation, but including merger-related expenses and deal costs.
The following table summarizes our FFO, normalized FFO and normalized FAD for each of the periods presented.
|
| | | | | | | | | | | | | | | |
| | For the Year Ended December 31, |
| | 2015 | | 2014 | | 2013 | | 2012 |
| | (In thousands) |
| Net income attributable to CCP | $ | 143,166 |
| | $ | 157,595 |
| | $ | 174,290 |
| | $ | 172,421 |
|
| Adjustments: | | | | | | | |
| Real estate depreciation and amortization | 111,242 |
| | 91,199 |
| | 87,216 |
| | 85,047 |
|
| Real estate depreciation related to noncontrolling interests | (270 | ) | | (427 | ) | | (471 | ) | | (573 | ) |
| Impairment on real estate investments | 23,139 |
| | 8,769 |
| | 5,601 |
| | 13,045 |
|
| (Gain) loss on real estate dispositions | (632 | ) | | 61 |
| | 15 |
| | 28 |
|
| NAREIT FFO attributable to CCP | 276,645 |
| | 257,197 |
| | 266,651 |
| | 269,968 |
|
| Adjustments: | | | | | | | |
| Income tax expense | 938 |
| | — |
| | — |
| | — |
|
| Stock-based compensation expense associated with spin-related conversion of awards | 542 |
| | — |
| | — |
| | — |
|
| Transition services fee expense | 895 |
| | — |
| | — |
| | — |
|
| Merger-related expenses and deal costs | 6,354 |
| | 1,547 |
| | — |
| | 565 |
|
| Initial debt rating agency costs | 477 |
| | — |
| | — |
| | — |
|
| Amortization of other intangibles | 261 |
| | — |
| | — |
| | — |
|
| Initial stock exchange fee | 236 |
| | — |
| | — |
| | — |
|
| Normalized FFO attributable to CCP | 286,348 |
| | 258,744 |
| | 266,651 |
| | 270,533 |
|
| Amortization of above and below market lease intangibles, net | (8,968 | ) | | (11,184 | ) | | (10,979 | ) | | (9,227 | ) |
| Accretion of direct financing lease | (1,351 | ) | | (1,207 | ) | | (1,078 | ) | | (1,140 | ) |
| Other amortization | (298 | ) | | 36 |
| | (37 | ) | | (120 | ) |
| Straight-lining of rental income, net | (163 | ) | | (294 | ) | | (252 | ) | | (104 | ) |
| Other adjustments: | | | | | | | |
Capital expenditures (1) | (15,888 | ) | | (8,529 | ) | | (3,253 | ) | | — |
|
| Stock-based compensation | 2,647 |
| | — |
| | — |
| | — |
|
| Merger-related expenses and deal costs | (5,277 | ) | | (1,547 | ) | | — |
| | (565 | ) |
| Normalized FAD attributable to CCP | $ | 257,050 |
| | $ | 236,019 |
| | $ | 251,052 |
| | $ | 259,377 |
|
| |
| (1) | Capital expenditures for the year ended December 31, 2015 include amounts related to properties that transitioned operators during 2014 and 2015 and, as a result, were significantly higher than historical levels. |
Adjusted EBITDA
We consider Adjusted EBITDA an important supplemental measure to net income because it provides an additional manner in which to evaluate our operating performance. We define Adjusted EBITDA as earnings before interest, taxes, depreciation and amortization, excluding stock-based compensation, merger-related expenses and deal costs, gains (or losses) from sales of real estate property, transition services fee expense and initial debt rating agency costs and initial stock exchange fee. The following table sets forth a reconciliation of our Adjusted EBITDA to net income for the years ended December 31, 2015, 2014 and 2013: |
| | | | | | | | | | | |
| | For the Year Ended December 31, |
| | 2015 | | 2014 | | 2013 |
| | (In thousands) |
| Net income | $ | 143,355 |
| | $ | 157,780 |
| | $ | 174,510 |
|
| Adjustments: | | | | | |
| Interest | 12,347 |
| | — |
| | — |
|
| Income tax expense | 938 |
| | — |
| | — |
|
| Depreciation and amortization | 111,752 |
| | 91,612 |
| | 87,586 |
|
| Impairment on real estate investments | 23,139 |
| | 8,769 |
| | 5,601 |
|
| Stock-based compensation | 3,189 |
| | — |
| | — |
|
| Merger-related expenses and deal costs | 6,354 |
| | 1,547 |
| | — |
|
| (Gain) loss on real estate dispositions | (632 | ) | | 61 |
| | 15 |
|
| Transition services fee expense | 895 |
| | — |
| | — |
|
| Initial debt rating agency costs | 477 |
| | — |
| | — |
|
| Initial stock exchange fee | 236 |
| | — |
| | — |
|
| Adjusted EBITDA | $ | 302,050 |
| | $ | 259,769 |
| | $ | 267,712 |
|
NOI
We also consider NOI an important supplemental measure to net income because it enables investors, analysts and our management to assess our unlevered property-level operating results and to compare our operating results with the operating results of other real estate companies and between periods on a consistent basis. We define NOI as total revenues, less interest and other income. Cash receipts may differ due to straight-line recognition of certain rental income and the application of other GAAP policies. The following table sets forth a reconciliation of our NOI to net income for the years ended December 31, 2015, 2014 and 2013:
|
| | | | | | | | | | | |
| | For the Year Ended December 31, |
| | 2015 | | 2014 | | 2013 |
| | (In thousands) |
| Net income | $ | 143,355 |
| | $ | 157,780 |
| | $ | 174,510 |
|
| Adjustments: | | | | | |
| Interest and other income | (91 | ) | | (2 | ) | | (25 | ) |
| Interest | 12,347 |
| | — |
| | — |
|
| Depreciation and amortization | 111,752 |
| | 91,612 |
| | 87,586 |
|
| Impairment on real estate investments | 23,139 |
| | 8,769 |
| | 5,601 |
|
| General, administrative and professional fees | 29,222 |
| | 22,412 |
| | 22,552 |
|
| Merger-related expenses and deal costs | 6,354 |
| | 1,547 |
| | — |
|
| Other | 1,466 |
| | 13,183 |
| | 1,368 |
|
| Income tax expense | 938 |
| | — |
| | — |
|
| (Gain) loss from real estate dispositions | (632 | ) | | 61 |
| | 15 |
|
| NOI | $ | 327,850 |
| | $ | 295,362 |
| | $ | 291,607 |
|
Asset/Liability Management
Asset/liability management, a key element of enterprise risk management, is designed to support the achievement of our business strategy, while ensuring that we maintain appropriate and tolerable levels of market risk (primarily interest rate risk) and credit risk. Effective management of these risks is a contributing factor to the absolute levels and variability of our FFO and net worth. The following discussion addresses our integrated management of assets and liabilities.
Market Risk
As of December 31, 2015 and 2014, the fair value of our secured and unsecured loans receivable, based on our estimates of currently prevailing rates for comparable loans, was $28.7 million and $9.3 million, respectively. See “Note 5—Secured and Unsecured Loans Receivable, Net” of the Notes to Combined Consolidated Financial Statements included in Item 8 of this Annual Report on Form 10-K.
Market risk related to changes in interest rates, such as LIBOR or prime rates, has a direct impact on borrowings under our Credit Agreement. As we establish our permanent capital structure, we intend to continuously monitor our level of floating rate debt with respect to total debt and other factors, including our expectations regarding current and future economic conditions.
At December 31, 2015, all of our outstanding indebtedness was variable rate debt. Assuming no change in the principal amount, if the weighted average interest rate related to our variable rate debt were to increase 100 basis points, interest expense for 2016 would increase by approximately $15.2 million, or $0.18 per diluted common share.
To mitigate our interest rate risk, in January 2016, we entered into various agreements to swap $400 million of our $800 million Term Loan from LIBOR plus 1.50% into an all-in fixed interest rate of 2.73% and to swap the full notional amount of our $200 million Term Loan from LIBOR plus 1.80% into an all-in fixed interest rate of 3.25%.
Concentration and Credit Risk
We use concentration ratios to identify, understand and evaluate the potential impact of economic downturns and other adverse events that may affect our asset types and tenants. We evaluate concentration risk in terms of real estate investment mix and operations mix. Investment mix measures the percentage of our investments that is concentrated in a specific asset type or is operated by a particular tenant. Operations mix measures the percentage of our operating results that is attributable to a specific asset type or a particular tenant. The following tables reflect our concentration risk as of the dates and for the periods presented: |
| | | | | |
| | As of December 31, |
| | 2015 | | 2014 |
Investment mix by asset type (1): | | | |
| SNFs | 88.3 | % | | 91.1 | % |
Seniors housing communities and campuses (2) | 7.3 |
| | 4.6 |
|
| Specialty hospitals and healthcare assets | 4.4 |
| | 4.3 |
|
Investment mix by tenant (1): | | | |
| Senior Care Centers, LLC | 19.2 | % | | 2.0 | % |
| Signature HealthCARE, LLC | 8.5 |
| | 5.2 |
|
| Avamere Group, LLC | 10.0 |
| | 8.2 |
|
| All others | 62.3 |
| | 84.6 |
|
| |
| (1) | Ratios are based on the gross book value of tangible real estate property (excluding properties classified as held for sale) as of each reporting date. |
| |
| (2) | Campuses are defined as multi-level properties. |
|
| | | | | | | | |
| | For the Year Ended December 31, |
| | 2015 | | 2014 | | 2013 |
| Operations mix by asset type (1): | | | | | |
| SNFs | 89.2 | % | | 92.3 | % | | 92.5 | % |
| Seniors housing communities and campuses (2) | 4.6 |
| | 3.1 |
| | 2.9 |
|
| Specialty hospitals and healthcare assets | 4.3 |
| | 3.5 |
| | 3.3 |
|
| All others | 1.9 |
| | 1.1 |
| | 1.3 |
|
| Operations mix by tenant (1): | | | | | |
| Senior Care Centers, LLC | 11.7 | % | | 1.5 | % | | 1.5 | % |
| Avamere Group, LLC | 10.2 |
| | 8.8 |
| | 8.4 |
|
| Signature HealthCARE, LLC | 10.1 |
| | 7.6 |
| | 3.4 |
|
| All others | 68.0 |
| | 82.1 |
| | 86.7 |
|
| |
| (1) | Ratios are based on revenues for each period presented. |
| |
| (2) | Campuses are defined as multi-level properties. |
We derive substantially all of our revenues by leasing assets under long-term triple-net leases with annual escalators, subject to certain limitations. Some of these escalators are contingent upon the satisfaction of specified facility revenue parameters or based on increases in the Consumer Price Index (“CPI”), with caps, floors or collars.
Our three largest operators collectively accounted for approximately 32.0% of our total revenues for the year ended December 31, 2015. This concentration of credit risk in three tenants makes us more vulnerable economically. The failure or unwillingness of any of these tenants to satisfy its obligations to us or to renew its leases with us upon expiration of the terms thereof could have a material adverse effect on our business, financial condition, results of operations and liquidity. We cannot provide any assurances that these tenants and/or their respective subsidiaries or affiliates will have sufficient assets, income, access to financing and insurance coverage to enable them to satisfy their respective lease and other obligations to us. We also cannot provide any assurances that any of our tenants, and in particular our three largest operators, will elect to renew its leases with us upon expiration of the leases or that we will be able to reposition any non-renewed properties on a timely basis or on the same or better economic and other terms, if at all.
We regularly monitor and assess any changes in the relative credit risk of all of our tenants and related guarantors, although we pay particular attention to those tenants that we deem to present higher credit risks due to performance, concentration of our revenues, or recourse provisions contained in our leases. The ratios and metrics we use to evaluate a tenant’s liquidity and creditworthiness depend on facts and circumstances specific to that tenant, including without limitation the tenant’s credit history and economic conditions related to the tenant, its operations and the markets and industries in which the tenant operates. Such facts and circumstances may vary over time. Among other things, we may (i) review and analyze information regarding the real estate, post-acute and healthcare industries generally, publicly available information regarding the tenant, and information required to be provided by the tenant under the terms of its lease agreements with us, including covenant calculations required to be provided to us by the tenant, (ii) examine monthly and/or quarterly financial statements of the tenant to the extent publicly available or otherwise provided under the terms of our lease agreements, and (iii) participate in periodic discussions and in-person meetings with representatives of the tenant. Using this information, we calculate multiple financial ratios (which may, but do not necessarily, include net debt to EBITDAR (earnings before interest, taxes, depreciation, amortization and rent) or EBITDARM (earnings before interest, taxes, depreciation, amortization, rent and management fees), fixed charge coverage and tangible net worth), after making certain adjustments based on our judgment, and assess other metrics we deem relevant to an understanding of the tenant’s credit risk.
Triple-Net Lease Expirations
The following table summarizes our triple-net lease expirations currently scheduled to occur over the next ten years (excluding leases related to properties classified as held for sale as of December 31, 2015): |
| | | | | | | | | |
| | Number of Properties | | 2015 Rental Income | | % of 2015 Rental Income |
| | (Dollars in thousands) |
| 2016 | 11 |
| | $ | 6,582 |
| | 2.0 | % |
| 2017 | 4 |
| | 2,612 |
| | 0.8 |
|
| 2018 | 10 |
| | 6,553 |
| | 2.0 |
|
| 2019 | 1 |
| | 661 |
| | 0.2 |
|
| 2020 | 74 |
| | 62,931 |
| | 19.6 |
|
| 2021 | 1 |
| | 986 |
| | 0.3 |
|
| 2022 | 14 |
| | 14,027 |
| | 4.4 |
|
| 2023 | 46 |
| | 52,408 |
| | 16.3 |
|
| 2024 | 1 |
| | 704 |
| | 0.2 |
|
| 2025 | 12 |
| | 9,797 |
| | 3.0 |
|
Liquidity and Capital Resources
For periods prior to our separation from Ventas, we and our wholly owned subsidiaries were subject to Ventas’s centralized cash management system. All payments were controlled and made by Ventas, resulting in intercompany transactions between us and Ventas that did not settle in cash.
For periods subsequent to our separation from Ventas, we maintained our own centralized cash management system in addition to the separate cash accounts associated with our joint venture entities.
As of December 31, 2015 and 2014, we had a total of $17.0 million and $2.4 million, respectively, of unrestricted cash. The cash balance at December 31, 2014 relates to our joint venture entities that did not participate in the centralized cash management system of Ventas.
During 2015, our principal sources of liquidity were cash flows from operations, cash on hand, borrowings under the Facility and contributions from Ventas (which are the result of treasury activities and net funding provided by Ventas prior to the separation).
For the next 12 months, our principal liquidity needs are to: (i) fund operating expenses; (ii) meet our debt service requirements; (iii) fund acquisitions, investments and commitments, including redevelopment activities; and (iv) make distributions to our stockholders, as required for us to qualify as a REIT. We expect that these liquidity needs generally will be satisfied by a combination of cash flows from operations, borrowings under our Revolver, dispositions of assets, and issuances of debt and equity securities. However, an inability to access liquidity through one or any combination of these capital sources concurrently could have an adverse effect on us.
We funded our acquisition of the specialty valuation firm in August 2015 through the issuance of 339,602 shares of CCP common stock. In February 2016, we issued an additional 56,377 shares to the sellers pursuant to the post-closing adjustment provisions of the purchase agreement. We funded our September 1, 2015 acquisition of eight properties through cash on hand, as well as borrowings under our Revolver and Original Term Loans.
Unsecured Revolving Credit Facility and Term Loans
In August 2015, Care Capital LP, as borrower, and CCP, Care Capital Properties GP, LLC and certain subsidiaries of Care Capital LP, as guarantors, entered into the Credit Agreement, which provides for the Revolver and Original Term Loans. The Revolver has an initial term of four years, but may be extended, at Care Capital LP’s option subject to compliance with the terms of the Credit Agreement and payment of a customary fee, for two additional six-month periods. The $600 million Term Loan and $800 million Term Loan mature in August 2017 and August 2020, respectively. The Credit Agreement also includes an accordion feature that permits Care Capital LP to increase the aggregate borrowing capacity under the Facility to an amount not exceeding $2.5 billion.
In September 2015, the subsidiary guarantees were released in accordance with the terms of the Credit Agreement.
Borrowings under the Facility currently bear interest at a fluctuating rate per annum equal to LIBOR plus an applicable margin based on Care Capital LP’s unsecured long-term debt ratings. At December 31, 2015, the applicable margin was 1.30% for Revolver borrowings and 1.50% for Original Term Loan borrowings, and we had $457 million of unused borrowing capacity available under our Revolver.
In January 2016, Care Capital LP, as borrower, and CCP and Care Capital Properties GP, LLC, as guarantors, entered into the Term Loan Agreement, which provides for the $200 million Term Loan that matures in January 2023. The Term Loan Agreement also includes an accordion feature that permits Care Capital LP to increase the aggregate borrowing capacity under the $200 million Term Loan to up to an amount not exceeding $400 million. We used the proceeds from borrowings under the $200 million Term Loan to repay a portion of the indebtedness outstanding under the $600 million Term Loan.
Borrowings under the $200 million Term Loan bear interest at a fluctuating rate per annum equal to the applicable LIBOR for LIBOR rate loans and the higher of (i) the federal funds rate plus ½ of 1%, (ii) the Administrative Agent’s prime rate and (iii) LIBOR for a one-month interest period plus, in each case, an applicable margin based on Care Capital LP’s senior unsecured long-term debt ratings. At closing, the applicable margin on the $200 million Term Loan was 1.80%.
Also in January 2016, we entered into agreements to swap a total of $600 million of debt, effectively converting the interest on that debt from floating rates to fixed rates. The swap agreements, which have terms of 4.6 years and seven years, hedge $400 million of the $800 million Term Loan and the full notional amount of the $200 million Term Loan. The all-in fixed interest rate on the $400 million swap is 2.73% and the all-in fixed interest rate on the $200 million swap is 3.25%.
Equity
In August 2015, we adopted the Care Capital Properties, Inc. 2015 Incentive Plan (the “Plan”), pursuant to which options to purchase common stock, shares of restricted stock or restricted stock units and other equity awards may be granted to our employees, directors and consultants. A total of 7,000,000 shares of our common stock was reserved initially for issuance under the Plan and, as of December 31, 2015, 190,471 shares had been granted under the Plan.
Dividends
Ventas elected to be treated as a REIT under the applicable provisions of the Code for every year beginning with the year ended December 31, 1999. Accordingly, with respect to periods prior to our separation from Ventas, Ventas generally was not subject to federal income tax. We intend to elect to be treated as a REIT under the applicable provisions of the Code, beginning with the year ended December 31, 2015. By qualifying for taxation as a REIT, we generally will not be subject to federal income tax on net income that we currently distribute to stockholders, which substantially eliminates the “double taxation” (i.e., taxation at both the corporate and stockholder levels) that results from investment in a C corporation (i.e., a corporation generally subject to full corporate-level tax).
We expect that our cash flows after the spin-off will exceed our REIT taxable income due to depreciation and other non-cash deductions in computing REIT taxable income and that we will be able to satisfy the 90% distribution requirement. However, from time to time, we may not have sufficient cash on hand or other liquid assets to meet this requirement or we may decide to retain cash or distribute such greater amount as may be necessary to avoid income and excise taxation. If we do not have sufficient cash on hand or other liquid assets to enable us to satisfy the 90% distribution requirement, or if we desire to retain cash, we may borrow funds, issue equity securities, pay taxable stock dividends, if possible, distribute other property or securities or engage in a transaction intended to enable us to meet the REIT distribution requirements or any combination of the foregoing.
On September 30, 2015, we paid a full third quarter cash dividend in the amount of $0.57 per share to the holders of record of our common stock as of September 14, 2015. On December 31, 2015, we paid a fourth quarter cash dividend in the amount of $0.57 per share to the holders of record of our common stock as of December 21, 2015.
Capital Expenditures
The terms of our triple-net leases generally obligate our tenants to pay all capital expenditures necessary to maintain and improve our triple-net leased properties. However, from time to time, we may fund the capital expenditures for our triple-net leased properties through loans to the tenants or advances, which may increase the amount of rent payable with respect to the properties in certain cases. In addition, from time to time, we may enter into agreements with our tenants to fund capital expenditures without reimbursement. We expect to fund any capital expenditures for which we may become responsible upon expiration of our triple-net leases or in the event that our tenants are unable or unwilling to meet their obligations under those leases with cash flows from operations or through borrowings under our Revolver.
Cash Flows
The following table sets forth our sources and uses of cash flows for the years ended December 31, 2015 and 2014:
|
| | | | | | | | | | | | | | |
| | For the Year Ended December 31, | | Increase (Decrease) to Cash |
| | 2015 | | 2014 | | $ | | % |
| | (Dollars in thousands) |
| Cash at beginning of period | $ | 2,424 |
| | $ | 2,167 |
| | $ | 257 |
| | 11.9 | % |
| Net cash provided by operating activities | 267,174 |
| | 255,082 |
| | 12,092 |
| | 4.7 |
|
| Net cash used in investing activities | (507,111 | ) | | (28,977 | ) | | (478,134 | ) | | nm |
|
| Net cash provided by (used in) financing activities | 254,508 |
| | (225,848 | ) | | 480,356 |
| | nm |
|
| Cash at end of period | $ | 16,995 |
| | $ | 2,424 |
| | 14,571 |
| | nm |
nm—not meaningful
Cash Flows from Operating Activities
Cash flows from operating activities increased in 2015 over the prior year primarily due to our 2015 acquisitions.
Cash Flows from Investing Activities
Cash used in investing activities during 2015 and 2014 consisted primarily of cash paid for our investments in real estate ($455.5 million and $13.2 million in 2015 and 2014, respectively), investment in loans receivable ($21.5 million and $0.8 million in 2015 and 2014, respectively), development project expenditures ($22.9 million and $11.2 million in 2015 and 2014, respectively) and capital expenditures ($15.7 million and $6.0 million in 2015 and 2014, respectively).
Cash Flows from Financing Activities
Cash provided by financing activities during 2015 consisted primarily of net borrowings under the Facility ($1.5 billion) and net contribution from parent prior to the separation ($103.7 million), partially offset by distribution to parent ($1.3 billion), payment of deferred financing costs ($20.2 million) and cash distribution to common stockholders ($95.5 million). Cash used in financing activities during 2014 consisted of net distribution to parent ($225.4 million).
Contractual Obligations
The following table summarizes the effect that debt and other material noncancelable commitments are expected to have on our cash flow in future periods as of December 31, 2015 (in thousands):
|
| | | | | | | | | | | | | | | | | | | |
| | Payments Due By Period |
| Contractual Obligations | Total | | Less than 1 year | | 1 - 3 years | | 3 - 5 years | | More than 5 years |
| Long-term debt obligations | $ | 1,543,000 |
| | $ | — |
| | $ | 600,000 |
| | $ | 943,000 |
| | $ | — |
|
| Operating lease obligations | 612 |
| | 252 |
| | 360 |
| | — |
| | — |
|
| Total | $ | 1,543,612 |
| | $ | 252 |
| | $ | 600,360 |
| | $ | 943,000 |
| | $ | — |
|
ITEM 7A. Quantitative and Qualitative Disclosures About Market Risk
The information set forth in Item 7 of this Annual Report on Form 10-K under “Management’s Discussion and Analysis of Financial Condition and Results of Operations—Asset/Liability Management” is incorporated by reference into this Item 7A.
ITEM 8. Financial Statements and Supplementary Data
Care Capital Properties, Inc. and Predecessors
Index to Combined Consolidated Financial Statements and Financial Statement Schedules
|
| |
| Management Report on Internal Control over Financial Reporting | |
| |
| Combined Consolidated Balance Sheets as of December 31, 2015 and 2014 | |
| Combined Consolidated Statements of Income for the Years Ended December 31, 2015, 2014 and 2013 | |
| Combined Consolidated Statements of Equity for the Years Ended December 31, 2015, 2014 and 2013 | |
| Combined Consolidated Statements of Cash Flows for the Years Ended December 31, 2015, 2014 and 2013 | |
| Notes to Combined Consolidated Financial Statements | |
| |
| Schedule II—Valuation and Qualifying Accounts | |
| |
MANAGEMENT REPORT ON INTERNAL CONTROL OVER FINANCIAL REPORTING
This Annual Report on Form 10-K does not include a report of management’s assessment regarding internal control over financial reporting or an attestation report of our independent registered public accounting firm due to a transition period established by rules of the Securities and Exchange Commission for newly public companies.
Report of Independent Registered Public Accounting Firm
The Board of Directors and Stockholders
Care Capital Properties, Inc.:
We have audited the accompanying combined consolidated balance sheets of Care Capital Properties, Inc. and Predecessors (the Company) as of December 31, 2015 and 2014, and the related combined consolidated statements of income, equity, and cash flows for each of the years in the three-year period ended December 31, 2015. In connection with our audits of the combined consolidated financial statements, we have also audited the information in financial statement schedules II and III. These combined consolidated financial statements and financial statement schedules are the responsibility of the Company’s management. Our responsibility is to express an opinion on these combined consolidated financial statements and financial statement schedules based on our audits.
We conducted our audits in accordance with the standards of the Public Company Accounting Oversight Board (United States). Those standards require that we plan and perform the audit to obtain reasonable assurance about whether the financial statements are free of material misstatement. An audit includes examining, on a test basis, evidence supporting the amounts and disclosures in the financial statements. An audit also includes assessing the accounting principles used and significant estimates made by management, as well as evaluating the overall financial statement presentation. We believe that our audits provide a reasonable basis for our opinion.
In our opinion, the combined consolidated financial statements referred to above present fairly, in all material respects, the financial position of Care Capital Properties, Inc. and Predecessors as of December 31, 2015 and 2014, and the results of their operations and their cash flows for each of the years in the three-year period ended December 31, 2015, in conformity with U.S. generally accepted accounting principles. Also, in our opinion, the related financial statement schedules II and III, when considered in relation to the basic combined consolidated financial statements taken as a whole, present fairly, in all material respects, the information set forth therein.
As discussed in Note 2 to the combined consolidated financial statements, the combined consolidated financial statements of Care Capital Properties, Inc. and Predecessors prior to the separation represent a combination of entities under common control of Ventas, Inc. and have been “carved out” of Ventas, Inc.’s consolidated financial statements and reflect significant assumptions and allocations. The combined consolidated financial statements prior to the separation include allocations of certain operating expenses from Ventas, Inc. These costs may not be reflective of the actual costs which would have been incurred had the predecessors operated as an independent, stand-alone entity separate from Ventas, Inc.
/s/ KPMG LLP
Chicago, Illinois
March 10, 2016
CARE CAPITAL PROPERTIES, INC. AND PREDECESSORS
COMBINED CONSOLIDATED BALANCE SHEETS
As of December 31, 2015 and 2014
(In thousands, except per share amounts)
|
| | | | | | | |
| | 2015 | | 2014 |
| Assets | | | |
| Real estate investments: | | | |
| Land and improvements | $ | 287,193 |
| | $ | 249,504 |
|
| Buildings and improvements | 2,984,257 |
| | 2,446,688 |
|
| Construction in progress | 33,646 |
| | 10,433 |
|
| Acquired lease intangibles | 101,869 |
| | 87,194 |
|
| | 3,406,965 |
| | 2,793,819 |
|
| Accumulated depreciation and amortization | (704,210 | ) | | (602,578 | ) |
| Net real estate property | 2,702,755 |
| | 2,191,241 |
|
| Net investment in direct financing lease | 22,075 |
| | 21,626 |
|
| Net real estate investments | 2,724,830 |
| | 2,212,867 |
|
| Secured and unsecured loans receivable, net | 29,727 |
| | 9,491 |
|
| Cash | 16,995 |
| | 2,424 |
|
| Goodwill | 145,374 |
| | 88,959 |
|
| Other assets | 38,043 |
| | 18,009 |
|
| Total assets | $ | 2,954,969 |
| | $ | 2,331,750 |
|
| Liabilities and equity | | | |
| Liabilities: | | | |
| Term loans and other debt | $ | 1,524,863 |
| | $ | — |
|
| Tenant deposits | 57,974 |
| | 50,168 |
|
| Lease intangible liabilities, net | 130,348 |
| | 145,640 |
|
| Accounts payable and other liabilities | 24,048 |
| | 12,863 |
|
| Deferred income taxes | 1,889 |
| | — |
|
| Total liabilities | 1,739,122 |
| | 208,671 |
|
| Commitments and contingencies |
| |
|
| Equity: | | | |
| Preferred stock, $0.01 par value; 10,000 shares authorized, unissued at December 31, 2015 | — |
| | — |
|
| Common stock, $0.01 par value; 300,000 shares authorized, 83,803 shares issued at December 31, 2015 | 838 |
| | — |
|
| Additional paid-in capital | 1,264,650 |
| | — |
|
Dividends in excess of net income
| (51,056 | ) | | — |
|
| Net parent investment | — |
| | 2,118,216 |
|
| Total CCP equity | 1,214,432 |
| | 2,118,216 |
|
| Noncontrolling interest | 1,415 |
| | 4,863 |
|
| Total equity | 1,215,847 |
| | 2,123,079 |
|
| Total liabilities and equity | $ | 2,954,969 |
| | $ | 2,331,750 |
|
See accompanying notes to the combined consolidated financial statements.
CARE CAPITAL PROPERTIES, INC. AND PREDECESSORS
COMBINED CONSOLIDATED STATEMENTS OF INCOME
For the Years Ended December 31, 2015, 2014 and 2013
(In thousands, except per share amounts) |
| | | | | | | | | | | |
| | 2015 | | 2014 | | 2013 |
| Revenues: | | | | | |
| Rental income, net | $ | 321,785 |
| | $ | 291,962 |
| | $ | 287,794 |
|
| Income from investments in direct financing lease and loans | 3,818 |
| | 3,400 |
| | 3,813 |
|
| Real estate services fee income | 2,247 |
| | — |
| | — |
|
| Interest and other income | 91 |
| | 2 |
| | 25 |
|
| Total revenues | 327,941 |
| | 295,364 |
| | 291,632 |
|
| Expenses: | | | | | |
| Interest | 12,347 |
| | — |
| | — |
|
| Depreciation and amortization | 111,752 |
| | 91,612 |
| | 87,586 |
|
| Impairment on real estate investments | 23,139 |
| | 8,769 |
| | 5,601 |
|
| General, administrative and professional fees | 29,222 |
| | 22,412 |
| | 22,552 |
|
| Merger-related expenses and deal costs | 6,354 |
| | 1,547 |
| | — |
|
| Other | 1,466 |
| | 13,183 |
| | 1,368 |
|
| Total expenses | 184,280 |
| | 137,523 |
| | 117,107 |
|
| Income before income taxes, real estate dispositions and noncontrolling interests | 143,661 |
| | 157,841 |
| | 174,525 |
|
| Income tax expense | (938 | ) | | — |
| | — |
|
| Gain (loss) on real estate dispositions | 632 |
| | (61 | ) | | (15 | ) |
| Net income | 143,355 |
| | 157,780 |
| | 174,510 |
|
| Net income attributable to noncontrolling interests | 189 |
| | 185 |
| | 220 |
|
| Net income attributable to CCP | $ | 143,166 |
| | $ | 157,595 |
| | $ | 174,290 |
|
| Earnings per common share: | |
| | |
| | |
|
| Basic: | |
| | | | |
|
| Net income attributable to CCP | $ | 1.71 |
| | $ | 1.89 |
| | $ | 2.09 |
|
| Diluted: | |
| | |
| | |
|
| Net income attributable to CCP | $ | 1.71 |
| | $ | 1.88 |
| | $ | 2.08 |
|
| Weighted average shares used in computing earnings per common share: | |
| | | | |
|
| Basic | 83,488 |
| | 83,488 |
| | 83,488 |
|
| Diluted | 83,607 |
| | 83,658 |
| | 83,658 |
|
See accompanying notes to the combined consolidated financial statements.
CARE CAPITAL PROPERTIES, INC. AND PREDECESSORS
COMBINED CONSOLIDATED STATEMENTS OF EQUITY
For the Years Ended December 31, 2015, 2014 and 2013
(In thousands, except per share amounts)
|
| | | | | | | | | | | | | | | | | | | | | | | | | | | |
| | Net Parent Investment | | Common Stock Par Value | | Additional Paid-In Capital | | Dividends in Excess of Net Income | | Total CCP Equity | | Noncontrolling Interests | | Total Equity |
| Balance, January 1, 2013 | $ | 2,260,183 |
| | $ | — |
| | $ | — |
| | $ | — |
| | $ | 2,260,183 |
| | $ | 5,341 |
| | $ | 2,265,524 |
|
| Net income attributable to CCP | 174,290 |
| | — |
| | — |
| | — |
| | 174,290 |
| | — |
| | 174,290 |
|
| Net change in noncontrolling interests | — |
| | — |
| | — |
| | — |
| | — |
| | (242 | ) | | (242 | ) |
| Net distribution to parent | (248,272 | ) | | — |
| | — |
| | — |
| | (248,272 | ) | | — |
| | (248,272 | ) |
| Balance, January 1, 2014 | 2,186,201 |
| | — |
| | — |
| | — |
| | 2,186,201 |
| | 5,099 |
| | 2,191,300 |
|
| Net income attributable to CCP | 157,595 |
| | — |
| | — |
| | — |
| | 157,595 |
| | — |
| | 157,595 |
|
| Net change in noncontrolling interests | — |
| | — |
| | — |
| | — |
| | — |
| | (236 | ) | | (236 | ) |
| Net distribution to parent | (225,580 | ) | | — |
| | — |
| | — |
| | (225,580 | ) | | — |
| | (225,580 | ) |
| Balance, December 31, 2014 | 2,118,216 |
| | — |
| | — |
| | — |
| | 2,118,216 |
| | 4,863 |
| | 2,123,079 |
|
| Net income attributable to CCP | 98,700 |
| | — |
| | — |
| | 44,466 |
| | 143,166 |
| | — |
| | 143,166 |
|
| Net change in noncontrolling interests | — |
| | — |
| | — |
| | — |
| | — |
| | (225 | ) | | (225 | ) |
| Acquisition of noncontrolling interests | — |
| | — |
| | 123 |
| | — |
| | 123 |
| | (3,223 | ) | | (3,100 | ) |
| Net contribution from parent prior to separation | 306,629 |
| | — |
| | — |
| | — |
| | 306,629 |
| | — |
| | 306,629 |
|
| Distribution to parent | (1,273,000 | ) | | — |
| | — |
| | — |
| | (1,273,000 | ) | | — |
| | (1,273,000 | ) |
| Issuance of common stock at separation | — |
| | 835 |
| | — |
| | — |
| | 835 |
| | — |
| | 835 |
|
| Issuance of common stock for acquisition | — |
| | 3 |
| | 11,543 |
| | — |
| | 11,546 |
| | — |
| | 11,546 |
|
| Transfer of remaining net parent investment to additional paid-in capital | (1,250,545 | ) | | — |
| | 1,250,545 |
| | — |
| | — |
| | — |
| | — |
|
| Stock-based compensation | — |
| | — |
| | 2,439 |
| | — |
| | 2,439 |
| | — |
| | 2,439 |
|
| Dividends to common stockholders - $1.14 per share | — |
| | — |
| | — |
| | (95,522 | ) | | (95,522 | ) | | — |
| | (95,522 | ) |
| Balance, December 31, 2015 | $ | — |
| | $ | 838 |
| | $ | 1,264,650 |
| | $ | (51,056 | ) | | $ | 1,214,432 |
| | $ | 1,415 |
| | $ | 1,215,847 |
|
See accompanying notes to the combined consolidated financial statements.
CARE CAPITAL PROPERTIES, INC. AND PREDECESSORS
COMBINED CONSOLIDATED STATEMENTS OF CASH FLOWS
For the Years Ended December 31, 2015, 2014 and 2013
(In thousands)
|
| | | | | | | | | | | |
| | 2015 | | 2014 | | 2013 |
| Cash flows from operating activities: | | | | | |
| Net income | $ | 143,355 |
| | $ | 157,780 |
| | $ | 174,510 |
|
| Adjustments to reconcile net income to net cash provided by operating activities: | | | | | |
| Depreciation, amortization and impairment on real estate investments | 128,372 |
| | 95,522 |
| | 89,563 |
|
| Amortization of above and below market lease intangibles, net | (8,968 | ) | | (11,184 | ) | | (10,979 | ) |
| Amortization of deferred financing fees | 2,072 |
| | — |
| | — |
|
| Accretion of direct financing lease | (1,351 | ) | | (1,207 | ) | | (1,078 | ) |
| Amortization of leasing costs and other intangibles | 6,519 |
| | 4,859 |
| | 3,624 |
|
| Stock-based compensation | 2,439 |
| | — |
| | — |
|
| Straight-lining of rental income, net | (163 | ) | | (294 | ) | | (252 | ) |
| (Gain) loss on real estate dispositions | (632 | ) | | 61 |
| | 15 |
|
| Income tax benefit | (370 | ) | | — |
| | — |
|
| Other | (298 | ) | | 36 |
| | (37 | ) |
| Changes in operating assets and liabilities, net of effects of the September acquisition: | | | | | |
| Increase in other assets | (11,085 | ) | | (4,832 | ) | | (6,885 | ) |
| Decrease in restricted cash | — |
| | — |
| | 518 |
|
| Increase in tenant deposits | 5,627 |
| | 15,466 |
| | 7,021 |
|
| Increase (decrease) in accounts payable and other liabilities | 1,657 |
| | (1,125 | ) | | (6,293 | ) |
| Net cash provided by operating activities | 267,174 |
| | 255,082 |
| | 249,727 |
|
| Cash flows from investing activities: | | | | | |
| Net investment in real estate property | (455,498 | ) | | (13,194 | ) | | (11,791 | ) |
| Investment in loans receivable | (21,463 | ) | | (799 | ) | | (450 | ) |
| Proceeds from real estate disposals | 6,020 |
| | 975 |
| | 10,350 |
|
| Proceeds from loans receivable | 2,422 |
| | 1,226 |
| | 10,535 |
|
| Development project expenditures | (22,854 | ) | | (11,163 | ) | | (8,792 | ) |
| Capital expenditures | (15,738 | ) | | (6,022 | ) | | (1,407 | ) |
| Purchase of redeemable noncontrolling interest | — |
| | — |
| | (2,950 | ) |
| Net cash used in investing activities | (507,111 | ) | | (28,977 | ) | | (4,505 | ) |
| Cash flows from financing activities: | | | | | |
| Net change in borrowings under credit facility | 1,543,000 |
| | — |
| | — |
|
| Payment of deferred financing costs | (20,209 | ) | | — |
| | — |
|
| Purchase of noncontrolling interest | (3,100 | ) | | — |
| | — |
|
| Distributions to noncontrolling interest | (375 | ) | | (420 | ) | | (482 | ) |
| Net contribution from (distribution to) parent prior to separation | 103,714 |
| | (225,428 | ) | | (249,318 | ) |
| Distribution to parent | (1,273,000 | ) | | — |
| | — |
|
| Cash distribution to common stockholders | (95,522 | ) | | — |
| | — |
|
| Net cash provided by (used in) financing activities | 254,508 |
| | (225,848 | ) | | (249,800 | ) |
| Net increase (decrease) in cash | 14,571 |
| | 257 |
| | (4,578 | ) |
| Cash at beginning of period | 2,424 |
| | 2,167 |
| | 6,745 |
|
| Cash at end of period | $ | 16,995 |
| | $ | 2,424 |
| | $ | 2,167 |
|
| | | | | | |
| Supplemental disclosure of cash flow information: | | | | | |
| Interest paid | $ | 10,105 |
| | $ | — |
| | $ | — |
|
| Income taxes paid | 55 |
| | — |
| | — |
|
| Supplemental schedule of non-cash activities: | | | | | |
| Issuance of common stock for acquisition of specialty valuation firm | 11,546 |
| | — |
| | — |
|
| Other acquisition-related investing activities | 151,511 |
| | — |
| | — |
|
| Transfer of remaining net parent investment to additional paid-in capital | 1,250,545 |
| | — |
| | — |
|
| Change in accrued capital expenditures | 3,771 |
| | — |
| | — |
|
See accompanying notes to the combined consolidated financial statements.
CARE CAPITAL PROPERTIES, INC. AND PREDECESSORS
NOTES TO COMBINED CONSOLIDATED FINANCIAL STATEMENTS
Note 1—Description of Business
Care Capital Properties, Inc. (together with its consolidated subsidiaries, unless the context otherwise requires or indicates, “we,” “us,” “our,” “our company” or “CCP”) is a Delaware corporation formed in April 2015 to hold the post-acute/skilled nursing facility (“SNF”) portfolio of Ventas, Inc. (“Ventas”) and its subsidiaries operated by regional and local care providers (the “CCP Business”). Effective as of 11:59 p.m. on August 17, 2015, Ventas completed its spin-off of the CCP Business by distributing one share of our common stock for every four shares of Ventas common stock held as of the close of business on August 10, 2015. As a result, we began operating as an independent public company and our common stock commenced trading on the New York Stock Exchange under the symbol “CCP” as of August 18, 2015.
Prior to the separation, CCP was a wholly owned subsidiary of Ventas. Prior to or concurrently with the separation, Ventas engaged in certain reorganization transactions that were designed to consolidate the ownership of its interests in 355 properties and certain loans receivable that comprised the CCP Business and transfer those interests to us. For periods prior to the separation, references in this discussion to “we,” “us,” or “our” refer to the CCP Business after giving effect to the transfer of the assets and liabilities from Ventas in connection with the separation.
In connection with the spin-off, we entered into a separation and distribution agreement, as well as a transition services agreement, a tax matters agreement and an employee matters agreement, with Ventas. Under the transition services agreement, Ventas agreed to provide us with various accounting, tax and information technology services on a transitional basis until August 31, 2016, subject to extension upon mutual agreement, in exchange for a fee of $2.5 million, payable in four quarterly installments.
At the time of the separation and distribution, we had not conducted any business as a separate company and had no material assets or liabilities. We intend to elect to be treated as a real estate investment trust (“REIT”), and, therefore, subsequent to the distribution, we are operating in a manner consistent with a REIT with a diversified portfolio of SNFs and other healthcare properties located throughout the United States. The operations of the CCP Business transferred to us by Ventas are presented herein as if the transferred business was our business for all historical periods described and at the carrying value of such assets and liabilities reflected in Ventas’s books and records.
Subject to the limitation under the REIT asset test rules, we are permitted to own up to 100% of the stock of one or more taxable REIT subsidiaries (“TRSs”). We have elected for one of our subsidiaries to be treated as a TRS, which is subject to federal, state and local income taxes.
For periods prior to our separation from Ventas, our combined consolidated financial statements included in this Annual Report on Form 10-K reflect Ventas’s interests in 358 properties (including two properties that were not transferred to us as part of the separation, one property that was sold during the second quarter of 2015, five properties that were sold subsequent to the separation and five additional properties that were classified as held for sale of August 18, 2015). For periods subsequent to the separation, the combined consolidated financial statements in this Annual Report on Form 10-K reflect our interest in 358 properties (including ten properties that were classified as held for sale as of December 31, 2015).
The combined consolidated financial statements for periods prior to the separation have been prepared on a standalone basis from Ventas’s consolidated financial statements and accounting records and reflect the financial position, results of operations and cash flows of the CCP Business as it was operated as part of Ventas prior to the distribution, in conformity with U.S. generally accepted accounting principles (“GAAP”). The combined consolidated financial statements for periods subsequent to the separation reflect our financial position, results of operations and cash flows in conformity with GAAP.
For periods prior to our separation from Ventas, our equity balance (net parent investment) in the combined consolidated financial statements represents the excess of total assets over total liabilities, including the intercompany balances between us and Ventas. Net parent investment is primarily impacted by contributions from Ventas, which are the result of treasury activities and net funding provided by or distributed to Ventas prior to the separation. For periods subsequent to our separation from Ventas, our equity balance in the combined consolidated financial statements represents our equity activity starting August 18, 2015.
CARE CAPITAL PROPERTIES, INC. AND PREDECESSORS
NOTES TO COMBINED CONSOLIDATED FINANCIAL STATEMENTS (Continued)
The following is a summary of net income for the year ended December 31, 2015 on a disaggregated basis to show the respective amounts attributed to the periods prior and subsequent to our separation from Ventas:
|
| | | | | | | | | | | |
| | January 1, 2015 through August 17, 2015 | | August 18, 2015 through December 31, 2015 | | For the Year Ended December 31, 2015 |
| | (In thousands) |
| Revenues: | | | | | |
| Rental income, net | $ | 197,275 |
| | $ | 124,510 |
| | $ | 321,785 |
|
| Income from investments in direct financing lease and loans | 2,175 |
| | 1,643 |
| | 3,818 |
|
| Real estate services fee income | — |
| | 2,247 |
| | 2,247 |
|
| Interest and other income | 63 |
| | 28 |
| | 91 |
|
| Total revenues | 199,513 |
| | 128,428 |
| | 327,941 |
|
| Expenses: | | | | | |
| Interest | 22 |
| | 12,325 |
| | 12,347 |
|
| Depreciation and amortization | 66,988 |
| | 44,764 |
| | 111,752 |
|
| Impairment on real estate investments | 12,898 |
| | 10,241 |
| | 23,139 |
|
| General, administrative and professional fees | 15,585 |
| | 13,637 |
| | 29,222 |
|
| Merger-related expenses and deal costs | 3,933 |
| | 2,421 |
| | 6,354 |
|
| Other | 1,267 |
| | 199 |
| | 1,466 |
|
| Total expenses | 100,693 |
| | 83,587 |
| | 184,280 |
|
| Income before income taxes, real estate dispositions and noncontrolling interests | 98,820 |
| | 44,841 |
| | 143,661 |
|
| Income tax (expense) benefit | (1,004 | ) | | 66 |
| | (938 | ) |
| Gain on real estate dispositions | — |
| | 632 |
| | 632 |
|
| Net income | 97,816 |
| | 45,539 |
| | 143,355 |
|
| Net income attributable to noncontrolling interests | 120 |
| | 69 |
| | 189 |
|
| Net income attributable to CCP | $ | 97,696 |
| | | | |
| Net income attributable to common stockholders | | | $ | 45,470 |
| | |
Note 2—Accounting Policies
Principles of Combination and Consolidation and Basis of Presentation
Our combined consolidated financial statements for periods prior to our separation from Ventas do not represent the financial position and results of operations of a legal entity, but rather a combination of entities under common control that have been “carved out” of Ventas’s consolidated financial statements and reflect significant assumptions and allocations. All intercompany transactions and balances have been eliminated in consolidation, and our net income is reduced by the portion of net income attributable to noncontrolling interests.
For periods prior to the separation, the combined consolidated financial statements include the attribution of certain assets and liabilities that were historically held at the Ventas corporate level, but which were specifically identifiable or attributable to us. All transactions between us and Ventas were considered to be effectively settled in the combined consolidated financial statements at the time the transaction was recorded. The total net effect of the settlement of these intercompany transactions is reflected as net contribution from or distribution to parent in the combined consolidated statements of cash flows as a financing activity and in the combined consolidated balance sheet as net parent investment. No other related party transactions or relationships are reflected in the combined consolidated financial statements for those periods.
For periods prior to the separation, the combined consolidated financial statements also include an allocation of expenses related to certain Ventas corporate functions, including executive oversight, treasury, finance, legal, human resources, tax planning, internal audit, financial reporting, information technology and investor relations. These expenses have been allocated to us based on direct usage or benefit where specifically identifiable, with the remainder allocated pro rata primarily on the basis of revenue, headcount or other measures. We consider the expense methodology and results to be reasonable for all periods presented. However, the allocations may not be indicative of the actual expense that would have been incurred had we operated as an independent, publicly traded company for those periods. We believe that the assumptions and estimates used in preparation of the underlying combined consolidated financial statements are reasonable. However, the combined consolidated financial statements herein do not necessarily reflect what our financial position, results of operations or cash flows would have been if we had been a standalone company during the full periods presented, nor are they necessarily indicative of our future results of operations, financial position or cash flows.
CARE CAPITAL PROPERTIES, INC. AND PREDECESSORS
NOTES TO COMBINED CONSOLIDATED FINANCIAL STATEMENTS (Continued)
For periods subsequent to our separation from Ventas, the accompanying consolidated financial statements include our accounts and the accounts of our wholly owned subsidiaries and the joint venture entities over which we have control. All intercompany transactions and balances have been eliminated in consolidation, and our net income is reduced by the portion of net income attributable to noncontrolling interests.
Noncontrolling Interests
We present the portion of any equity that we do not own in entities that we control (and thus consolidate) as noncontrolling interests and classify this interest as a component of consolidated equity, separate from total CCP equity, on our combined consolidated balance sheets. For consolidated joint ventures with pro rata distribution allocations, net income or loss is allocated between the joint venture partners based on their respective stated ownership percentages. We account for purchases or sales of equity interests that do not result in a change of control as equity transactions, through net parent investment for periods prior to our separation from Ventas and additional paid-in capital for periods subsequent to our separation from Ventas. In addition, we include net income attributable to the noncontrolling interests in net income in our combined consolidated statements of income.
As of December 31, 2015, we had a controlling interest in one joint venture entity that owned one SNF (after acquiring the noncontrolling 6.82% interest in our other joint venture in December 2015). The noncontrolling interest percentage for this joint venture was 49.0% at December 31, 2015. As of December 31, 2014, we had a controlling interest in two joint venture entities that owned a total of six SNFs. The noncontrolling interest percentage for these joint ventures were 6.82% and 49.0%, respectively, at December 31, 2014.
Accounting Estimates
The preparation of financial statements in accordance with GAAP requires us to make estimates and assumptions regarding future events that affect the reported amounts of assets and liabilities, the disclosure of contingent assets and liabilities at the date of the financial statements and the reported amounts of revenues and expenses during the reporting period. We base these estimates on our experience and assumptions we believe to be reasonable under the circumstances. However, if our judgment or interpretation of the facts and circumstances relating to various transactions or other matters had been different, we may have applied a different accounting treatment, resulting in a different presentation of our financial statements. We periodically reevaluate our estimates and assumptions, and in the event they prove to be different from actual results, we make adjustments in subsequent periods to reflect more current estimates and assumptions about matters that are inherently uncertain.
Net Real Estate Property
Our investment in net real estate property is recorded on our combined consolidated balance sheets at historical cost, less accumulated depreciation and amortization. These real estate assets are initially measured upon their acquisition. We account for acquisitions using the acquisition method and record the cost of the businesses acquired among tangible and recognized intangible assets and liabilities based upon their estimated fair values as of the acquisition date.
| |
| • | Land—We determine the fair value of land either by considering the sales prices of similar properties in recent transactions or based on internal analyses of recently acquired and existing comparable properties within our portfolio. |
| |
| • | Buildings—We estimate the fair value of buildings acquired on an as-if-vacant basis and depreciate the building value over the estimated remaining life of the building, generally not to exceed 35 years. |
| |
| • | Other tangible fixed assets—We determine the fair value of other fixed assets, such as site improvements and furniture, fixtures and equipment, based upon the replacement cost and depreciate such value over the assets' estimated remaining useful lives as determined at the applicable acquisition date. |
| |
| • | In-place lease intangibles—The fair value of in-place leases reflects our estimate of the cost to obtain tenants and an estimated value of the absorption period to reflect the value of the rent and recovery costs foregone during a reasonable lease-up period as if the acquired space was vacant. We amortize these intangibles through amortization expense over the remaining life of the associated lease plus assumed bargain renewal periods, if any. |
| |
| • | Market lease intangibles—We estimate the fair value of any above and/or below market leases by discounting the difference between the estimated market rent and in-place lease rent. We amortize these intangibles to revenue over the remaining life of the associated lease plus any assumed bargain renewal periods, if any. If a lease is terminated prior to its stated expiration or not renewed upon expiration, we recognize all unamortized amounts of lease-related intangibles associated with that lease in operations at that time. |
CARE CAPITAL PROPERTIES, INC. AND PREDECESSORS
NOTES TO COMBINED CONSOLIDATED FINANCIAL STATEMENTS (Continued)
| |
| • | Purchase option intangibles—We estimate the fair value of purchase option intangible liabilities by discounting the difference between the applicable property's acquisition date fair value and an estimate of its future option price. We do not amortize the resulting intangible liability over the term of the lease, but rather adjust the recognized value of the asset or liability upon sale. |
| |
| • | Goodwill—Goodwill represents the excess of the purchase price paid over the fair value of the net assets of the acquired business. We do not amortize goodwill. |
Impairment of Long-Lived and Intangible Assets and Goodwill
We periodically evaluate our long-lived assets, primarily consisting of investments in real estate, for impairment indicators. If indicators of impairment are present, we evaluate the carrying value of the related real estate investments in relation to the future undiscounted cash flows of the underlying operations. In performing this evaluation, we consider market conditions and our current intentions with respect to the retention or disposition of the asset. We adjust the net book value of leased properties and other long-lived assets to fair value if the sum of the expected future undiscounted cash flows, including sales proceeds, is less than book value. When our long-lived assets qualify as assets held for sale, we adjust the net book value of leased properties and other long-lived assets to the lower of fair value less costs to sell or their net book value. We recognize any shortfall from carrying value as an impairment loss in the current period.
If impairment indicators arise with respect to intangible assets with finite useful lives, we evaluate impairment by comparing the carrying amount of the asset to the estimated future undiscounted net cash flows expected to be generated by the asset. If estimated future undiscounted net cash flows are less than the carrying amount of the asset, then we estimate the fair value of the asset and compare the estimated fair value to the intangible asset's carrying value. We recognize any shortfall from carrying value as an impairment loss in the current period.
We test goodwill for impairment at least annually, and more frequently if indicators arise. We assess qualitative factors, such as current macroeconomic conditions, the state of capital markets and our overall financial and operating performance, to determine the likelihood that the fair value of the reporting unit is less than its carrying amount. If we determine it is more likely than not that the fair value of the reporting unit is less than its carrying amount, we proceed with the two-step approach to evaluating impairment. First, we estimate the fair value of the reporting unit and compare it to the reporting unit's carrying value. If the carrying value exceeds fair value, we proceed with the second step, which requires us to assign the fair value of the reporting unit to all of the assets and liabilities of the reporting unit as if it had been acquired in a business combination at the date of the impairment test. The excess fair value of the reporting unit over the amounts assigned to the assets and liabilities is the implied value of goodwill and is used to determine the amount of impairment. We recognize an impairment loss to the extent the carrying value of goodwill exceeds the implied value in the current period. We did not recognize any impairment of goodwill for the years ended December 31, 2015, 2014 and 2013.
Estimates of fair value used in our evaluation of goodwill, investments in real estate and intangible assets are based upon discounted future cash flow projections or other acceptable valuation techniques that are based, in turn, upon level three inputs in the fair value hierarchy (as described below), such as revenue and expense growth rates, capitalization rates, discount rates or other available market data. Our ability to accurately predict future operating results and cash flows and to estimate and allocate fair values impacts the timing and recognition of impairments. While we believe our assumptions are reasonable, changes in these assumptions may have a material impact on our financial results.
Assets Held for Sale and Discontinued Operations
We expect to sell properties from time to time for various reasons, including favorable market conditions or the exercise of purchase options by tenants. We classify certain long-lived assets as held for sale once the criteria, as defined by GAAP, have been met. Long-lived assets to be disposed of are reported at the lower of their carrying amount or fair value minus cost to sell and are no longer depreciated.
In 2014, the Financial Accounting Standards Board (“FASB”) issued Accounting Standards Update 2014-08, Reporting Discontinued Operations and Disclosures of Disposals of Components of an Entity (“ASU 2014-08”), which raises the threshold for disposals to qualify as discontinued operations. A discontinued operation is defined as: (1) a component of an entity or group of components that has been disposed of or classified as held for sale and represents a strategic shift that has or will have a major effect on an entity’s operations and financial results; or (2) an acquired business that is classified as held for sale on the acquisition date. ASU 2014-08 also requires additional disclosures regarding discontinued operations, as well as material disposals that do not meet the definition of discontinued operations. Our combined consolidated financial statements reflect the adoption of ASU 2014-08 as of January 1, 2013. There were no properties that met the definition of discontinued operations for any of the periods presented.
CARE CAPITAL PROPERTIES, INC. AND PREDECESSORS
NOTES TO COMBINED CONSOLIDATED FINANCIAL STATEMENTS (Continued)
Net Investment in Direct Financing Lease
We own one SNF under a lease agreement that is classified as a direct financing lease, as the tenant has a purchase obligation at the end of the lease term. The net investment in direct financing lease is recorded as a receivable on our combined consolidated balance sheets and represents the total undiscounted rental payments (including the tenant's purchase obligation), plus the estimated unguaranteed residual value, less the unearned lease income. Unearned lease income represents the excess of the minimum lease payments and residual values over the cost of the investment. Unearned lease income is deferred and amortized to income over the lease term to provide a constant yield when collectibility of the lease payments is reasonably assured. Income from our net investment in direct financing lease was $2.4 million, $2.4 million and $2.4 million for the years ended December 31, 2015, 2014 and 2013, respectively. Future minimum lease payments contractually due under direct financing lease at December 31, 2015, were as follows: 2016 - $2.1 million; 2017 - $2.1 million; 2018 - $2.2 million; 2019 - $2.2 million; 2020 - $2.3 million; thereafter - $26.8 million.
Loans Receivable
We determine the fair value of loans receivable acquired in connection with a business combination by discounting the estimated future cash flows using current interest rates at which similar loans with the same terms and length to maturity would be made to borrowers with similar credit ratings. We do not establish a valuation allowance at the acquisition date, as the amount of estimated future cash flows reflects our judgment regarding their uncertainty. We recognize the difference between the acquisition date fair value and the total expected cash flows as interest income using the effective interest method over the life of the applicable loan. We immediately recognize in income any unamortized balances if the loan is repaid before its contractual maturity.
Subsequent to the acquisition date, we evaluate changes regarding the uncertainty of future cash flows and the need for a valuation allowance, as appropriate. We regularly evaluate the collectibility of loans receivable based on factors such as corporate and facility-level financial and operational reports, compliance with financial covenants set forth in the applicable loan agreement, the financial strength of the borrower and any guarantors, the payment history of the borrower and current economic conditions. If our evaluation of these factors indicates it is probable that we will not be able to collect all amounts due under the terms of the applicable loan agreement, we provide a reserve against the portion of the receivable that we estimate may not be collected.
Centralized Cash Management
For periods prior to our separation from Ventas, we and our wholly owned subsidiaries were subject to Ventas’s centralized cash management system. All payments were controlled and made by Ventas, resulting in intercompany transactions between us and Ventas that did not settle in cash. The net effect of these intercompany transactions is reflected in net contribution from or net distribution to parent on our combined consolidated statements of cash flows and combined consolidated statements of equity.
For periods prior to our separation from Ventas, the cash balances contained in our combined consolidated balance sheets relate to our joint venture entities that did not participate in the centralized cash management system. For periods subsequent to our separation from Ventas, we maintain our own centralized cash management system, in addition to the separate cash account associated with our joint venture.
Tenant Deposits
Tenant deposits consist of security deposits and amounts provided by our tenants for future real estate taxes, insurance expenditures and tenant improvements related to our properties and operations.
Fair Values of Financial Instruments
Fair value is a market-based measurement, not an entity-specific measurement, and we determine fair value based on the assumptions that we expect market participants would use in pricing the asset or liability. As a basis for considering market participant assumptions in fair value measurements, GAAP establishes a fair value hierarchy that distinguishes between market participant assumptions based on market data obtained from sources independent of the reporting entity (observable inputs that are classified within levels one and two of the hierarchy) and the reporting entity's own assumptions about market participant assumptions (unobservable inputs classified within level three of the hierarchy).
Level one inputs utilize unadjusted quoted prices for identical assets or liabilities in active markets that we have the ability to access. Level two inputs are inputs other than quoted prices included in level one that are directly or indirectly observable for the asset or liability. Level two inputs may include quoted prices for similar assets and liabilities in active markets and other inputs for the asset or liability that are observable at commonly quoted intervals, such as interest rates and
CARE CAPITAL PROPERTIES, INC. AND PREDECESSORS
NOTES TO COMBINED CONSOLIDATED FINANCIAL STATEMENTS (Continued)
yield curves. Level three inputs are unobservable inputs for the asset or liability, which typically are based on our own assumptions, because there is little, if any, related market activity. If the determination of the fair value measurement is based on inputs from different levels of the hierarchy, the level within which the entire fair value measurement falls is the lowest level input that is significant to the fair value measurement in its entirety. If the volume and level of market activity for an asset or liability has decreased significantly relative to the normal market activity for such asset or liability (or similar assets or liabilities), then transactions or quoted prices may not accurately reflect fair value. In addition, if there is evidence that a transaction for an asset or liability is not orderly, little, if any, weight is placed on that transaction price as an indicator of fair value. Our assessment of the significance of a particular input to the fair value measurement in its entirety requires judgment and considers factors specific to the asset or liability.
We use the following methods and assumptions in estimating the fair value of our financial instruments.
| |
| • | Cash—The carrying amount of cash reported on our combined consolidated balance sheets approximates fair value. |
| |
| • | Loans receivable—We estimate the fair value of loans receivable using level two and level three inputs: we discount future cash flows using current interest rates at which similar loans with the same terms and length to maturity would be made to borrowers with similar credit ratings. |
Revenue Recognition
Triple-Net Leased Properties
Certain of our triple-net leases provide for periodic and determinable increases in base rent. We recognize base rental revenues under these leases on a straight-line basis over the applicable lease term when collectibility is reasonably assured. Recognizing rental income on a straight-line basis generally results in recognized revenues during the first half of a lease term exceeding the cash amounts contractually due from our tenants, creating a straight-line rent receivable that is included in other assets on our combined consolidated balance sheets.
Our remaining leases provide for periodic increases in base rent only if certain revenue parameters or other substantive contingencies are met. We recognize the increased rental revenue under these leases as the related parameters or contingencies are met, rather than on a straight-line basis over the applicable lease term.
Other
We recognize income from rent, lease termination fees and all other income when all of the following criteria are met in accordance with Securities and Exchange Commission (“SEC”) Staff Accounting Bulletin 104: (i) the applicable agreement has been fully executed and delivered; (ii) services have been rendered; (iii) the amount is fixed or determinable; and (iv) collectibility is reasonably assured.
Allowances
We assess our rent receivables, including straight-line rent receivables, to determine whether an allowance is appropriate. We base our assessment of rent receivables (other than straight-line rent receivables) on several factors, including, among other things, payment history, the financial strength of the tenant and any guarantors, the value of the underlying collateral, if any, and current economic conditions, including government reimbursement. If our evaluation of these factors indicates that we may not be able to recover the full value of the receivable, we provide an allowance against the portion of the receivable that we estimate may not be recovered. We also base our assessment of straight-line rent receivables on several factors, including, among other things, current economic conditions, including government reimbursement, the financial strength of the tenant and any guarantors, the historical operations and operating trends of the property, the historical payment pattern of the tenant and the type of property. If our evaluation of these factors indicates that we may not be able to receive the rent payments due in the future, we provide an allowance against the recognized straight-line rent receivable asset for the portion, up to its full value, that we estimate may not be recovered. If we change our assumptions or estimates regarding the collectibility of future rent payments required by a lease, we may adjust the allowance to increase or reduce the rental revenue recognized in the period in which we make such change in our assumptions or estimates.
Loans
We recognize interest income from loans, including discounts and premiums, using the effective interest method when collectibility is reasonably assured. We apply the effective interest method on a loan-by-loan basis and recognize discounts and premiums as yield adjustments over the related loan term. We recognize interest income on an impaired loan to the extent our estimate of the fair value of the collateral is sufficient to support the balance of the loan, other receivables and all related
CARE CAPITAL PROPERTIES, INC. AND PREDECESSORS
NOTES TO COMBINED CONSOLIDATED FINANCIAL STATEMENTS (Continued)
accrued interest. When the balance of the loan, other receivables and all related accrued interest is equal to or less than our estimate of the fair value of the collateral, we recognize interest income on a cash basis. We provide a reserve against an impaired loan to the extent our total investment in the loan exceeds our estimate of the fair value of the loan collateral.
Federal Income Tax
Ventas elected to be treated as a REIT under the applicable provisions of the Internal Revenue Code of 1986, as amended (the “Code”), for every year beginning with the year ended December 31, 1999. Accordingly, with respect to periods prior to our separation from Ventas, Ventas generally was not subject to federal income tax. We intend to elect to be treated as a REIT under the applicable provisions of the Code, beginning with the year ended December 31, 2015.
Segment Reporting
As of December 31, 2015, 2014 and 2013, we operated through a single reportable business segment: triple-net leased properties. We primarily invest in SNFs and other healthcare properties throughout the United States and lease those properties to healthcare operating companies under “triple-net” or “absolute-net” leases that obligate the tenants to pay all property-related expenses.
Recently Issued or Adopted Relevant Accounting Standards
In 2014, the FASB issued ASU No. 2014-09, Revenue From Contracts With Customers (“ASU 2014-09”), which outlines a comprehensive model for entities to use in accounting for revenue arising from contracts with customers. ASU 2014-09 states that “an entity recognizes revenue to depict the transfer of promised goods or services to customers in an amount that reflects the consideration to which the entity expects to be entitled in exchange for those goods or services.” While ASU 2014-09 specifically references contracts with customers, it may apply to certain other transactions such as the sale of real estate or equipment. In July 2015, the FASB provided for a one-year deferral of the effective date for ASU 2014-09, which is now effective for us beginning January 1, 2018. We are continuing to evaluate this guidance; however, we do not expect its adoption to have a significant impact on our combined consolidated financial statements, as substantially all of our revenue consists of rental income from leasing arrangements, which are specifically excluded from ASU 2014-09.
In February 2015, the FASB issued ASU No. 2015-02, Consolidation (Topic 810): Amendments to the Consolidation Analysis (“ASU 2015-02”), which makes certain changes to both the variable interest model and the voting model, including changes to (1) the identification of variable interests (fees paid to a decision maker or service provider), (2) the variable interest entity characteristics for a limited partnership or similar entity and (3) the primary beneficiary determination. ASU 2015-02 is effective for us beginning January 1, 2016. We are continuing to evaluate this guidance; however, we do not expect its adoption to have an impact on our combined consolidated financial statements.
In April 2015, the FASB issued ASU No. 2015-03, Interest—Imputation of Interest (Subtopic 835-30): Simplifying the Presentation of Debt Issuance Costs, which requires debt issuance costs to be presented in the balance sheet as a direct reduction from the carrying value of the associated debt liability, consistent with the presentation of a debt discount. We elected to adopt this new guidance as of August 18, 2015. As a result, our term loans and other debt is presented net of $18.1 million of unamortized debt issuance costs.
In April 2015, the FASB issued ASU 2015-05, Intangibles—Goodwill and Other—Internal-Use Software (Subtopic 350-40): Customer's Accounting for Fees Paid in a Cloud Computing Arrangement (“ASU 2015-05”), which provides explicit guidance to help companies evaluate the accounting for fees paid by a customer in a cloud computing arrangement. The new guidance clarifies that if a cloud computing arrangement includes a software license, the customer should account for the license consistent with its accounting for other software licenses. If the arrangement does not include a software license, the customer should account for the arrangement as a service contract. ASU 2015-05 is effective for us beginning January 1, 2016, and we are continuing to evaluate this guidance.
In September 2015, the FASB issued ASU 2015-16, Business Combinations (Topic 805): Simplifying the Accounting for Measurement-Period Adjustments (“ASU 2015-16”), which simplifies the accounting for business combinations, specifically as it relates to measurement-period adjustments. Acquiring entities in a business combination must recognize measurement-period adjustments in the reporting period in which the adjustment amounts are determined. Also, ASU 2015-16 requires entities to present separately on the face of the income statement (or disclose in the notes to the financial statements) the portion of the amount recorded in the current period earnings, by line item, that would have been recorded in previous reporting periods if the adjustment to the provisional amounts had been recognized as of the acquisition date. ASU 2015-16 is effective for us beginning January 1, 2016 and is to be applied prospectively to measurement-period adjustments that occur after the effective date. We are continuing to evaluate this guidance.
CARE CAPITAL PROPERTIES, INC. AND PREDECESSORS
NOTES TO COMBINED CONSOLIDATED FINANCIAL STATEMENTS (Continued)
In addition, Section 107 of the Jumpstart our Business Startups Act (the “JOBS Act”) provides that an “emerging growth company” can take advantage of the extended transition period provided in Section 13(a) of the Securities Exchange Act of 1934, as amended, for complying with new or revised accounting standards. In other words, an emerging growth company can delay the adoption of certain accounting standards until those standards would otherwise apply to private companies. We have elected not to take advantage of the benefits of this extended transition period and, therefore, will be subject to the same new or revised accounting standards as other public companies that are not emerging growth companies. This election is irrevocable.
Reclassifications
Certain prior year amounts have been reclassified to conform to the current year presentation.
Note 3—Triple-Net Lease Arrangements
As of December 31, 2015, Senior Care Centers, LLC (together with its subsidiaries, “SCC”) and Avamere Group, LLC (together with its subsidiaries, “Avamere”) operated approximately 19.2% and 10.0% respectively, of our real estate investments based on gross book value. Our properties were located in 36 states as of December 31, 2015, with properties in one state (Texas) accounting for more than 10% of our total revenues for the year then ended.
For the years ended December 31, 2015, 2014 and 2013, approximately 11.7%, 1.5% and 1.5%, respectively, of our total revenues were derived from our lease agreements with SCC, approximately 10.2%, 8.8% and 8.4%, respectively, of our total revenues were derived from our lease agreements with Avamere, and approximately 10.1%, 7.6% and 3.4%, respectively, of our total revenues were derived from our lease agreements with Signature HealthCARE, LLC (together with its subsidiaries, “Signature”). Each of our leases with SCC, Avamere and Signature is a triple-net lease that obligates the tenant to pay all property-related expenses, including maintenance, utilities, repairs, taxes, insurance and capital expenditures.
If SCC, Avamere or Signature becomes unable or unwilling to satisfy its obligations to us or to renew its leases with us upon expiration of the terms thereof, our financial condition and results of operations could decline. We cannot assure you that SCC, Avamere or Signature will have sufficient assets, income and access to financing to enable it to satisfy its respective obligations to us, and any failure, inability or unwillingness by SCC, Avamere or Signature to do so could have a material adverse effect on our business, financial condition, results of operations and liquidity. We also cannot assure you that SCC, Avamere or Signature will elect to renew its respective leases with us upon expiration of the leases or that we will be able to reposition any non-renewed properties on a timely basis or on the same or better economic or other terms, if at all.
The following table sets forth the future contracted minimum rentals, excluding contingent rent escalations, but including straight-line rent adjustments where applicable, for all of our triple-net leases as of December 31, 2015 (excluding properties classified as held for sale as of December 31, 2015 and rents from direct financing lease) (in thousands):
|
| | | |
| 2016 | $ | 328,315 |
|
| 2017 | 325,260 |
|
| 2018 | 330,646 |
|
| 2019 | 333,489 |
|
| 2020 | 306,100 |
|
| Thereafter | 1,847,749 |
|
| Total | $ | 3,471,559 |
|
Our straight-line rent receivable balance was $0.6 million and $0.8 million, net of allowances of $87.4 million and $58.0 million, as of December 31, 2015 and 2014, respectively. We recognized charges for straight-line rent allowances within rental income on our combined consolidated statements of income of $25.8 million, $21.4 million and $16.1 million for the years ended December 31, 2015, 2014 and 2013, respectively.
In July 2015, one of our operators notified us of its intention to exercise its purchase options with respect to seven properties. We expect these transactions, if completed, to occur in 2016, although they remain subject to various closing conditions.
On December 1, 2015, Signature acquired from Elmcroft Senior Living, Inc. (together with its subsidiaries, “Elmcroft”) the operations of 18 SNFs owned by us. In connection with the acquisition, we funded a total of $9 million to Signature, of which $8 million was added to the lease basis at an 8.5% return and $1 million was a four-year fully amortizing loan. We entered into a new master lease with Signature to operate the properties at the existing Elmcroft rent plus the additional rent described above.
CARE CAPITAL PROPERTIES, INC. AND PREDECESSORS
NOTES TO COMBINED CONSOLIDATED FINANCIAL STATEMENTS (Continued)
In December 2014, we paid $10.0 million in full settlement of a certain loan guarantee that had been provided to a third-party lender to a former tenant of ours, which is recorded in other expense in our combined consolidated statements of income.
Note 4—Acquisitions and Dispositions of Real Estate Property
Acquisitions
On December 31, 2015, we completed the acquisition of the 6.82% noncontrolling interest in one of our former joint ventures for $3.1 million.
On September 1, 2015, we completed the acquisition of eight properties (seven SNFs and one campus with both skilled nursing and assisted living facilities) and simultaneously entered into a long-term master lease with SCC to operate the acquired portfolio. We purchased the assets for approximately $190 million in cash and made a $20 million five-year, fully amortizing loan to SCC, resulting in a total transaction value of approximately $210 million. We funded this transaction through cash on hand and borrowings under our unsecured revolving credit facility and term loans (see “Note 8—Borrowing Arrangements”).
On August 14, 2015, we completed the acquisition of a specialty healthcare and seniors housing valuation firm in exchange for the issuance of 339,602 shares of our common stock valued at $11.5 million. This specialty valuation firm subsidiary represents our TRS. Pursuant to the purchase agreement, we agreed to issue additional shares to the sellers to the extent that the value of the common stock issued to the sellers based on the volume-weighted average price (“VWAP”) of the common stock over the 30 days immediately prior to the six-month anniversary of the closing of the acquisition was less than approximately $11.5 million. As of December 31, 2015, we recognized a $1.1 million liability and expense reflecting the potential issuance of additional shares to the sellers (see “Note 16—Subsequent Events”).
In January 2015, Ventas completed the acquisition of American Realty Capital Healthcare Trust, Inc. (“HCT”) in a stock and cash transaction, which included 14 SNFs, two specialty hospitals and four seniors housing properties that were transferred to us at a value of $139.7 million in connection with the separation. Also in January 2015, Ventas completed the acquisition of 12 SNFs for an aggregate purchase price of $234.9 million, all of which were transferred to us in connection with the separation and are currently operated by SCC.
Estimated Fair Value
We are accounting for our 2015 acquisitions under the acquisition method in accordance with ASC 805. Our initial accounting for acquisitions completed during the year ended December 31, 2015 remains subject to further adjustment. The following table summarizes the acquisition date fair values of the assets acquired and liabilities assumed, which we determined using level two and level three inputs (in thousands):
|
| | | | |
| Land and improvements | | $ | 38,361 |
|
| Buildings and improvements | | 515,620 |
|
| Acquired lease intangibles | | 14,138 |
|
| Goodwill (1) | | 56,275 |
|
| Other assets | | 8,034 |
|
| Total assets acquired | | 632,428 |
|
| Tenant deposits | | 8,801 |
|
| Lease intangible liabilities | | 3,729 |
|
| Accounts payable and other liabilities | | 1,343 |
|
| Total liabilities assumed | | 13,873 |
|
| Net assets acquired | | $ | 618,555 |
|
| | | |
| |
| (1) | As it relates to the HCT acquisition, goodwill was allocated to us on a relative fair value basis from total goodwill recognized by Ventas. A $1.8 million reduction of the original amount of goodwill due to HCT was completed in 2015. |
As it relates to the HCT acquisition, the estimated fair values of the assets acquired and liabilities assumed has changed and is different from the amounts reported in ‘‘Note 4—Acquisitions of Real Estate Property’’ of the Notes to Combined Consolidated Financial Statements included in our Quarterly Report on Form 10-Q for the quarter ended September 30, 2015, filed with the SEC on November 12, 2015. Such changes are due primarily to reclassification adjustments
CARE CAPITAL PROPERTIES, INC. AND PREDECESSORS
NOTES TO COMBINED CONSOLIDATED FINANCIAL STATEMENTS (Continued)
for presentation and adjustments to our preliminary valuation assumptions that are based on more accurate information concerning the subject assets and liabilities.
Transaction Costs
As of December 31, 2015, we had incurred a cumulative total of $7.3 million of acquisition-related costs related to the acquisitions completed during the year ended December 31, 2015. All of these costs were expensed as incurred and included in merger-related expenses and deal costs in our combined consolidated statements of income for the applicable periods. For the years ended December 31, 2015 and 2014, we expensed $5.9 million and $1.4 million, respectively, of these acquisition-related costs related to the acquisitions completed during the year ended December 31, 2015. Transaction costs incurred by Ventas relating to the HCT acquisition were allocated to us based on relative property net operating income (“NOI”).
Aggregate Revenue and NOI
For the year ended December 31, 2015, aggregate revenues and NOI derived from our 2015 real estate acquisitions during our period of ownership were both $34.8 million. During 2015, we restructured the lease terms and reduced the rent on 12 HCT properties, including those sold or classified as held for sale, in an aggregate amount of $5.7 million after the application of security deposits.
Unaudited Pro Forma
The following table illustrates the effect on revenues and net income attributable to CCP as if we had consummated the acquisitions completed during the year ended December 31, 2015 as of January 1, 2014.
|
| | | | | | | |
| | For the Years Ended December 31, |
| | 2015 | | 2014 |
| | (Unaudited) |
| | (In thousands, except per share amounts) |
| Revenues | $ | 345,015 |
| | $ | 348,906 |
|
| Net income attributable to CCP | 148,392 |
| | 180,152 |
|
| Net income attributable to CCP, per basic share | $ | 1.78 |
| | $ | 2.16 |
|
| Net income attributable to CCP, per diluted share | 1.77 |
| | 2.15 |
|
Acquisition-related costs related to our completed 2015 acquisitions are not expected to have a continuing impact and, therefore, have been excluded from these pro forma results. The pro forma results also do not include the impact of any synergies that may be achieved in the acquisitions, any reduction in our borrowing costs resulting from the acquisitions or any strategies that management may consider in order to continue to efficiently manage our operations, nor do they give pro forma effect to any dispositions that we completed during the periods presented. These pro forma results are not necessarily indicative of the operating results that would have been obtained had the acquisitions occurred at the beginning of the periods presented, nor are they necessarily indicative of future operating results.
Summary Specialty Valuation Firm Statement of Income
Below is a summary of the statement of income for the specialty valuation firm we acquired in August 2015 for the period from acquisition through December 31, 2015 (in thousands):
|
| | | |
| Revenues: | |
| Real estate services fee income | $ | 2,247 |
|
| Total revenues | 2,247 |
|
| Expenses: | |
| Depreciation and amortization | 278 |
|
| General, administrative and professional fees | 2,048 |
|
| Other expenses | 16 |
|
| Total expenses | 2,342 |
|
| Loss before income taxes | (95 | ) |
| Income tax benefit | 23 |
|
| Net income | $ | (72 | ) |
CARE CAPITAL PROPERTIES, INC. AND PREDECESSORS
NOTES TO COMBINED CONSOLIDATED FINANCIAL STATEMENTS (Continued)
Dispositions
During the fourth quarter of 2015, we sold four SNFs, which were classified as held for sale, for aggregate proceeds of $4.5 million. We recognized a loss of $0.2 million in connection with those sales. Of the properties sold in the quarter, two were acquired in the HCT transaction and transferred to us in connection with the separation. Six properties acquired in the HCT transaction were classified as held for sale as of December 31, 2015. In August 2015, we sold one SNF for proceeds of $1.5 million and recognized a gain on the sale of $0.9 million. In June 2015, we sold one SNF at its carrying value, resulting in neither a gain nor a loss. During 2014, we sold one SNF for proceeds of $0.9 million.
Note 5—Secured and Unsecured Loans Receivable, Net
Below is a summary of our loans receivable as of December 31, 2015 and 2014 (in thousands):
|
| | | | | | | | | | | | | | | | |
| | | 2015 | | 2014 |
| | | Carrying Value | | Fair Value | | Carrying Value | | Fair Value |
| Secured loans receivable, net | | $ | 5,255 |
| | $ | 4,494 |
| | $ | 5,249 |
| | $ | 5,174 |
|
| Unsecured loans receivable, net | | 24,472 |
| | 24,188 |
| | 4,242 |
| | 4,106 |
|
| Total secured and unsecured loans receivable, net | | $ | 29,727 |
|
| $ | 28,682 |
|
| $ | 9,491 |
|
| $ | 9,280 |
|
Secured loans receivable, net represents one loan that has a stated interest rate of 9.75%, matures in 2018 and is secured by one SNF located in Florida.
In September 2015, we made a $20 million five-year, fully amortizing loan to SCC. The loan bears interest at an annual rate of LIBOR plus 5%, which is subject to periodic increase over the term of the loan.
On December 1, 2015, we made a $1 million four-year, fully amortizing loan to Signature in connection with its acquisition from Elmcroft of the operations of 18 SNFs owned by us.
Fair value estimates as reflected in the table above are subjective in nature and based upon several important assumptions, including estimates of future cash flows, risks, discount rates and relevant comparable market information associated with each financial instrument. The use of different market assumptions and estimation methodologies may have a material effect on the reported estimated fair value amounts. Accordingly, the estimates presented above are not necessarily indicative of the amounts we would realize in a current market exchange.
CARE CAPITAL PROPERTIES, INC. AND PREDECESSORS
NOTES TO COMBINED CONSOLIDATED FINANCIAL STATEMENTS (Continued)
Note 6—Goodwill and Intangible Assets
The following is a summary of our intangibles as of December 31, 2015 and 2014:
|
| | | | | | | | | | | |
| | December 31, 2015 | | December 31, 2014 |
| | Balance | | Remaining Weighted Average Amortization Period in Years | | Balance | | Remaining Weighted Average Amortization Period in Years |
| | (Dollars in thousands) |
| Intangible assets: | | | | | | | |
| Above market lease intangibles | $ | 64,516 |
| | 11.4 | | $ | 60,251 |
| | 11.1 |
| In-place lease intangibles | 37,353 |
| | 13.4 | | 26,943 |
| | 12.9 |
| Tradename, technology and customer relationships | 2,950 |
| | 4.5 | | — |
| | N/A |
| Accumulated amortization | (45,390 | ) | | N/A | | (35,221 | ) | | N/A |
| Goodwill | 145,374 |
| | N/A | | 88,959 |
| | N/A |
| Net intangible assets | $ | 204,803 |
| | 12.3 | | $ | 140,932 |
| | 11.7 |
| Intangible liabilities: | | | | | | | |
| Below market lease intangibles | $ | 194,141 |
| | 14.9 | | $ | 198,170 |
| | 15.2 |
| Above market ground lease intangibles | 1,907 |
| | 52.9 | | — |
| | N/A |
| Accumulated amortization | (75,052 | ) | | N/A | | (61,882 | ) | | N/A |
| Purchase option intangibles | 9,352 |
| | N/A | | 9,352 |
| | N/A |
| Net intangible liabilities | $ | 130,348 |
| | 15.5 | | $ | 145,640 |
| | 15.2 |
________
N/A—Not Applicable
Above market lease intangibles and in-place lease intangibles are included in acquired lease intangibles within real estate investments on our combined consolidated balance sheets. Below market lease intangibles, above market ground lease intangibles and purchase option intangibles are included in lease intangible liabilities, net on our combined consolidated balance sheets. Tradename, technology and customer relationships are associated with our specialty valuation firm subsidiary and included in other assets on our combined consolidated balance sheets. For the years ended December 31, 2015, 2014 and 2013, our net amortization related to these intangibles was $5.9 million, $8.3 million and $8.1 million, respectively. The estimated net amortization related to these intangibles for each of the next five years is as follows: 2016—$5.0 million; 2017—$4.8 million; 2018—$4.6 million; 2019—$5.0 million; and 2020—$4.9 million.
The following table displays a rollforward of the carrying amount of goodwill from January 1, 2014 to December 31, 2015 (in thousands):
|
| | | |
| Balance as of January 1, 2014 | $ | 88,989 |
|
| Additions | — |
|
| Disposals | (30 | ) |
| Balance as of December 31, 2014 | 88,959 |
|
| Additions | 56,992 |
|
| Disposals | (577 | ) |
| Balance as of December 31, 2015 | $ | 145,374 |
|
CARE CAPITAL PROPERTIES, INC. AND PREDECESSORS
NOTES TO COMBINED CONSOLIDATED FINANCIAL STATEMENTS (Continued)
Note 7—Other Assets
The following is a summary of our other assets as of December 31, 2015 and 2014:
|
| | | | | | | |
| | 2015 | | 2014 |
| | (In thousands) |
| Straight-line rent receivables, net | $ | 579 |
| | $ | 766 |
|
| Deferred lease costs | 6,895 |
| | 9,970 |
|
| Assets held for sale | 15,035 |
| | 5,229 |
|
| Other, net | 15,534 |
| | 2,044 |
|
| Total other assets | $ | 38,043 |
| | $ | 18,009 |
|
Note 8—Borrowing Arrangements
The following is a summary of our term loans and other debt as of December 31, 2015 (in thousands):
|
| | | | |
| Unsecured revolving credit facility | | $ | 143,000 |
|
| Unsecured term loan due 2017 | | 600,000 |
|
| Unsecured term loan due 2020 | | 800,000 |
|
| Total | | 1,543,000 |
|
| Unamortized debt issuance costs | | 18,137 |
|
| Term loans and other debt | | $ | 1,524,863 |
|
| | | |
On August 17, 2015, Care Capital Properties, LP, our wholly owned subsidiary (“Care Capital LP”), as borrower, and CCP, Care Capital Properties GP, LLC and certain subsidiaries of Care Capital LP, as guarantors, entered into a Credit and Guaranty Agreement (the “Credit Agreement”) with a syndicate of banks that provides for a $600 million unsecured revolving credit facility (the “Revolver”), a $600 million unsecured term loan (the “$600 million Term Loan”) and an $800 million unsecured term loan (the “$800 million Term Loan” and collectively with the $600 million Term Loan, the “Original Term Loans” and together with the Revolver, the “Facility”). The Revolver has an initial term of four years, but may be extended, at Care Capital LP’s option subject to compliance with the terms of the Credit Agreement and payment of a customary fee, for two additional six-month periods. The $600 million and $800 million Term Loans mature in August 2017 and August 2020, respectively. The Credit Agreement also includes an accordion feature that permits Care Capital LP to increase the aggregate borrowing capacity under the Facility to $2.5 billion. Based on the recent issuance of our debt, as well as the related terms and conditions of our debt, we consider the carrying value of our term loans and other debt to be consistent with fair value.
Borrowings under the Facility bear interest at a fluctuating rate per annum equal to LIBOR plus an applicable margin based on Care Capital LP’s leverage or, if applicable, unsecured long-term debt ratings. At December 31, 2015, the applicable margin was 1.30% for Revolver borrowings and 1.50% for Original Term Loan borrowings, and we had approximately $457 million of unused borrowing capacity available under the Revolver.
In September 2015, subsidiaries of Care Capital LP were released as guarantors under the Credit Agreement.
Note 9—Income Taxes
We intend to elect to be taxed as, and operate in a manner that will allow us to qualify as, a REIT under the Code, for federal income tax purposes, beginning with our tax year ended December 31, 2015. If we qualify for taxation as a REIT, we generally will not be subject to U.S. federal corporate income tax on our net taxable income that is currently distributed to our stockholders. A REIT is subject to a number of organizational and operational requirements, including a requirement that it currently distributes at least 90% of its REIT taxable income (subject to certain adjustments) to its stockholders. If we fail to qualify as a REIT in any taxable year, without the benefit of certain relief provisions, we will be subject to federal and state income tax on our taxable income at regular corporate tax rates. Even if we qualify for taxation as a REIT, we also may be subject to certain federal, state, and local taxes on our income and assets, including (1) taxes on any undistributed income, (2) taxes related to our TRSs and (3) certain state or local income taxes.
CARE CAPITAL PROPERTIES, INC. AND PREDECESSORS
NOTES TO COMBINED CONSOLIDATED FINANCIAL STATEMENTS (Continued)
We elected for one of our subsidiaries to be treated, and may in the future elect to treat newly formed subsidiaries, as TRSs pursuant to the Code. TRSs may participate in non-real estate related activities and/or perform non-customary services for tenants and are subject to federal and state income tax at regular corporate tax rates.
All entities other than our TRS are collectively referred to as the “REIT” within this Note 9.
During the year ended December 31, 2015, our tax treatment of distributions per common share was as follows:
|
| | | |
| | 2015 |
| Tax treatment of distributions: | |
| Ordinary income | $ | 1.105160 |
|
| Qualified ordinary income | — |
|
| Long-term capital gain | — |
|
| Unrecaptured Section 1250 gain | — |
|
| Return of capital | 0.034840 |
|
| Distribution reported for 1099-DIV purposes | $ | 1.140000 |
|
We believe we have met the annual REIT distribution requirement by payment of at least 90% of our estimated taxable income for 2015. The provision for income taxes related to continuing operations consists of the following (in thousands):
|
| | | |
| | Year Ended December 31, |
| | 2015 |
| Current: |
|
|
| Federal | $ | (91 | ) |
| State | (213 | ) |
| Total current | (304 | ) |
| Deferred: |
|
|
| Federal | 114 |
|
| State | (748 | ) |
| Total deferred | (634 | ) |
| Total income tax (provision) | $ | (938 | ) |
There was no benefit (provision) for income taxes related to continuing operations for the years ended December 31, 2014 and 2013.
Below is a reconciliation between the provision for income taxes and the amount computed by applying the federal statutory income tax rate to the income or loss for continuing operations before income taxes (in thousands):
|
| | | | | |
| | Year Ended December 31, |
| | 2015 |
| Provision for income taxes at statutory rate | $ | (49,528 | ) | 35.00 | % |
| Tax at statutory rate on earnings not subject to federal income taxes | 49,561 |
| (35.02 | ) |
| Income for which no book expense was recognized | — |
| 0.00 |
|
| Valuation allowances | — |
| 0.00 |
|
| State tax (provision) benefit, net of federal | (960 | ) | 0.68 |
|
| Other | (11 | ) | 0.01 |
|
Total income tax (provision)
| $ | (938 | ) | 0.67 | % |
CARE CAPITAL PROPERTIES, INC. AND PREDECESSORS
NOTES TO COMBINED CONSOLIDATED FINANCIAL STATEMENTS (Continued)
Deferred tax assets and liabilities are included within deferred costs and other assets and other liabilities in the combined consolidated balance sheets, respectively, and are mainly attributable to the activity of our taxable REIT subsidiary. The components of the deferred tax liability at December 31, 2015 were as follows (in thousands):
|
| | | |
| | Year Ended December 31, |
| | 2015 |
| Deferred income | $ | (138 | ) |
| Basis difference on tangible property | (804 | ) |
| Basis difference on intangible property | (947 | ) |
| Total | (1,889 | ) |
| Valuation adjustment | — |
|
| Total net deferred tax liability | $ | (1,889 | ) |
The REIT made minimal state income tax payments and no federal income tax payments for the year ended December 31, 2015. There were no deferred tax assets or liabilities at December 31, 2014 and 2013.
For the year ended December 31, 2015, the net difference between tax basis and the reported amount of REIT assets and liabilities for federal income tax purposes was approximately $607 million, respectively, less than the book basis of those assets and liabilities for financial reporting purposes.
Generally, we are subject to audit under the statute of limitations by the Internal Revenue Service (“IRS”) for the year ended December 31, 2015 and are subject to audit by state taxation authorities for the year ended December 31, 2015.
We had no uncertain tax positions which would require us to record a tax exposure liability.
Note 10—Compensation
Certain of our employees participated in stock-based compensation plans administered by Ventas. In connection with the spin-off, outstanding Ventas equity awards held by our employees were converted into awards in respect of our common stock. As a result of the conversion mechanics, the fair value of the converted awards exceeded the fair value of the Ventas awards from which they were converted by $1.0 million, of which $0.5 million related to vested, unexercised options. For the year ended December 31, 2015, we recognized $1.4 million of expense associated with these converted awards, including the $0.5 million expense associated with vested, unexercised options recognized on August 17, 2015. The remaining $2.2 million of expense associated with the converted awards will be amortized as stock-based compensation over the respective vesting terms of the converted awards. The fair value of the converted stock option awards was determined using the Black-Scholes option pricing model with the following assumptions: risk-free interest rate of 0.21% - 1.31%, dividend yield of 6.3%, volatility factors of the expected market price for our common stock of 25% - 27%, and a weighted average expected life of options of 0.4 years - 3.82 years.
In August 2015, we adopted the Care Capital Properties, Inc. 2015 Incentive Plan (the “Plan”), pursuant to which options to purchase common stock, shares of restricted stock or restricted stock units and other equity awards may be granted to our employees, directors and consultants. A total of 7,000,000 shares of our common stock was reserved initially for issuance under the Plan. During the year ended December 31, 2015, we granted 190,471 shares of restricted stock to employees and directors under the Plan having a value of $6.5 million. The value of these shares is the closing price of our common stock on the date of grant. These shares generally vest on the third anniversary of the date of grant or in three equal annual installments beginning on the first anniversary of the date of grant. For shares with a graded vesting schedule that only require service, we recognize stock-based compensation expense on a straight-line basis over the requisite service period of the last separately vesting portion of the award.
For the year ended December 31, 2015, we recognized $3.2 million of stock-based compensation expense included in general, administrative and professional fees.
CARE CAPITAL PROPERTIES, INC. AND PREDECESSORS
NOTES TO COMBINED CONSOLIDATED FINANCIAL STATEMENTS (Continued)
Stock Options
The following is a summary of stock option activity in 2015:
|
| | | | | | | | | | | | |
| | Shares | | Weighted Average Exercise Price | | Weighted Average Remaining Contractual Life (years) | | Intrinsic Value ($000s) |
| Outstanding as of December 31, 2014 |
|
| |
|
| | | | |
| Converted options | 1,047,501 |
| | $ | 32.01 |
| | | | |
| Options exercised | — |
| | — |
| | | | |
| Options forfeited | — |
| | — |
| | | | |
| Options expired | — |
| | — |
| | | | |
| Outstanding as of December 31, 2015 | 1,047,501 |
|
| 32.01 |
|
| 7.8 |
| $ | 835,098 |
|
| Exercisable as of December 31, 2015 | 646,158 |
| | $ | 30.82 |
| | 7.3 | | $ | 732,994 |
|
As of December 31, 2015, we had $0.7 million of total unrecognized compensation cost related to nonvested stock options. We expect to recognize that cost over a weighted average period of 1.45 years.
Restricted Stock
A summary of the status of our nonvested restricted stock as of December 31, 2015, and changes during the year ended December 31, 2015 follows:
|
| | | | | | | |
| | | Shares | | Weighted Average Grant Date Fair Value |
| Nonvested at beginning of year | | — |
| | $ | — |
|
| Converted | | 125,183 |
| | 16.98 |
|
| Granted | | 190,471 |
| | 34.01 |
|
| Vested | | — |
| | — |
|
| Forfeited | | — |
| | — |
|
| Nonvested at end of year | | 315,654 |
| | $ | 27.26 |
|
As of December 31, 2015, we had $7.0 million of total unrecognized compensation cost related to nonvested restricted stock. We expect to recognize that cost over a weighted average period of 2.3 years.
Employee Benefit Plan
We maintain a 401(k) plan that allows eligible employees to defer compensation subject to certain limitations imposed by the Code. In 2015, we made contributions for each qualifying employee of 100% of the first 1% and 50% of the next 1% to 5% of eligible compensation contributed, subject to certain limitations. During 2015, our aggregate contributions were less than $0.1 million.
Note 11—Commitments and Contingencies
Certain Obligations, Liabilities and Litigation
We may be subject to various obligations, liabilities and litigation assumed in connection with or arising out of our acquisitions or otherwise arising in connection with our business, some of which may be indemnifiable by third parties. If these liabilities are greater than expected or were not known to us at the time of acquisition, if we are not entitled to indemnification, or if the responsible third party fails to indemnify us, such obligations, liabilities and litigation could have a material adverse effect on our business, financial condition, results of operations and liquidity. In addition, in connection with the sale or leasing of our properties, we may incur various obligations and liabilities, including indemnification obligations to the buyer or tenant, relating to the operations of those properties, which could have a material adverse effect on our business, financial condition, results of operations and liquidity.
Note 12—Earnings Per Share
Basic and diluted earnings per share for the periods prior to our separation from Ventas were retroactively restated for the number of basic and diluted shares outstanding immediately following the separation. The following table shows the amounts used in computing our basic and diluted earnings per common share:
|
| | | | | | | | | | | |
| | For the Year Ended December 31, |
| | 2015 | | 2014 | | 2013 |
| | (In thousands, except per share amounts) |
| Numerator for basic and diluted earnings per share: | | | | | |
| Net income attributable to CCP | $ | 143,166 |
| | $ | 157,595 |
| | $ | 174,290 |
|
| Denominator: | | | | | |
| Denominator for basic earnings per share—weighted average shares | 83,488 |
| | 83,488 |
| | 83,488 |
|
| Effect of dilutive securities: | | | | | |
| Stock options | 45 |
| | 82 |
| | 82 |
|
| Restricted stock | 74 |
| | 88 |
| | 88 |
|
| Denominator for diluted earnings per share—adjusted weighted average shares | 83,607 |
| | 83,658 |
| | 83,658 |
|
| Basic earnings per share: | | | | | |
| Net income attributable to CCP | $ | 1.71 |
| | $ | 1.89 |
| | $ | 2.09 |
|
| Diluted earnings per share: | | | | | |
| Net income attributable to CCP | $ | 1.71 |
| | $ | 1.88 |
| | $ | 2.08 |
|
Note 13—Stockholders’ Equity
Equity
Effective as of 11:59 p.m. on August 17, 2015, Ventas completed its spin-off of the CCP Business by distributing one share of our common stock for every four shares of Ventas common stock held as of the close of business on August 10, 2015. As a result, we began operating as an independent public company and our common stock commenced trading on the New York Stock Exchange under the symbol “CCP” as of August 18, 2015.
On August 14, 2015, we completed the acquisition of a specialty healthcare and seniors housing valuation firm in exchange for the issuance of 339,602 shares of our common stock. Pursuant to the purchase agreement, we agreed to issue additional shares to the sellers to the extent the value of the common stock issued to the sellers based on the VWAP of the common stock over the 30 days immediately prior to the six-month anniversary of the closing of the acquisition was less than approximately $11.5 million (see “Note 16—Subsequent Events”).
Dividends
On September 30, 2015, we paid a full third quarter cash dividend in the amount of $0.57 per share to the holders of record of our common stock as of September 14, 2015. On December 31, 2015, we paid a fourth quarter cash dividend in the amount of $0.57 per share to the holders of record of our common stock as of December 21, 2015.
Note 14—Litigation
We are involved from time to time in various legal proceedings that arise in the ordinary course of our business, including, but not limited to, commercial disputes, environmental matters and litigation in connection with transactions including acquisitions and divestitures. We believe that such litigation, claims and administrative proceedings will not have a material adverse impact on our financial position or our results of operations. We record a liability when a loss is considered probable and the amount can be reasonably estimated.
Our tenants and, in some cases, their affiliates may be required by the terms of their leases and other agreements with us to indemnify, defend and hold us harmless against certain actions, investigations and claims arising in the ordinary course of their business and related to the operations of our properties. In addition, third parties from whom we acquired certain of our assets and, in some cases, their affiliates may be required by the terms of the related conveyance documents to indemnify,
defend and hold us harmless against certain actions, investigations and claims related to the acquired assets and arising prior to our ownership or related to excluded assets and liabilities. In some cases, a portion of the purchase price consideration is held in escrow for a specified period of time as collateral for these indemnification obligations. We cannot provide any assurance that our tenants, their affiliates or other obligated third parties will defend us in any such matters, that our tenants, their affiliates or other obligated third parties will have sufficient assets, income and access to financing to enable them to satisfy their defense and indemnification obligations to us or that any purchase price consideration held in escrow will be sufficient to satisfy claims for which we are entitled to indemnification.
Note 15—Quarterly Financial Information (Unaudited)
Summarized unaudited combined consolidated quarterly information for the years ended December 31, 2015 and 2014 is provided below.
|
| | | | | | | | | | | | | | | |
| | For the Year Ended December 31, 2015 |
| | First Quarter | | Second Quarter | | Third Quarter | | Fourth Quarter |
| | (In thousands, except per share amounts) |
| Revenues | $ | 78,573 |
| | $ | 79,720 |
| | $ | 82,317 |
| | $ | 87,331 |
|
| Net income attributable to CCP | $ | 37,221 |
| | $ | 37,983 |
| | $ | 36,166 |
| | $ | 31,796 |
|
| Earnings per share: | | | | | | | |
| Basic: | | | | | | | |
| Net income attributable to CCP | $ | 0.45 |
| | $ | 0.45 |
| | $ | 0.43 |
| | $ | 0.38 |
|
| Diluted: | | | | | |
| | |
|
| Net income attributable to CCP | $ | 0.44 |
| | $ | 0.45 |
| | $ | 0.43 |
| | $ | 0.38 |
|
| Dividends declared per share | N/A |
| | N/A |
| | $ | 0.57 |
| | $ | 0.57 |
|
|
| | | | | | | | | | | | | | | |
| | For the Year Ended December 31, 2014 |
| | First Quarter | | Second Quarter | | Third Quarter | | Fourth Quarter |
| | (In thousands, except per share amounts) |
| Revenues | $ | 75,249 |
| | $ | 75,866 |
| | $ | 73,278 |
| | $ | 70,971 |
|
| Net income attributable to CCP | $ | 41,365 |
| | $ | 45,607 |
| | $ | 33,202 |
| | $ | 37,421 |
|
| Earnings per share: | | | | | | | |
| Basic: | | | | | | | |
| Net income attributable to CCP | $ | 0.50 |
| | $ | 0.55 |
| | $ | 0.40 |
| | $ | 0.45 |
|
| Diluted: | | | | | |
| | |
|
| Net income attributable to CCP | $ | 0.49 |
| | $ | 0.55 |
| | $ | 0.40 |
| | $ | 0.45 |
|
| Dividends declared per share | N/A |
| | N/A |
| | N/A |
| | N/A |
|
Note 16—Subsequent Events
In January 2016, we entered into a Term Loan and Guaranty Agreement (the “Term Loan Agreement”) with a syndicate of banks that provides for a $200 million unsecured term loan due 2023 (the “$200 million Term Loan”). We used the proceeds from borrowings under the $200 million Term Loan to repay a portion of the indebtedness outstanding under the $600 million Term Loan. Also in January 2016, we entered into agreements to swap a total of $600 million of debt, effectively converting the interest on that debt from floating rates to fixed rates. The swap agreements have terms of 4.6 years and seven years.
Beginning in January 2016, the tenant in 14 of our SNFs located in five states ceased paying rent to us pursuant to the terms of our non-recourse triple-net master lease with that tenant. As of December 31, 2015, annualized rent under the master lease was $11.5 million. On March 1, 2016, we entered into a transition and settlement agreement with the tenant that provides for, among other things, a consensual transition of the affected properties to two replacement operators. Also on March 1, 2016, we entered into separate master leases with the replacement operators to operate the 14 SNFs at combined rent of $7
CARE CAPITAL PROPERTIES, INC. AND PREDECESSORS
NOTES TO COMBINED CONSOLIDATED FINANCIAL STATEMENTS (Continued)
million in the first lease year, $8.5 million in the second lease year and $9.5 million in the third lease year, subject thereafter to escalations based on CPI. The master leases will become effective upon receipt of the required state regulatory approvals. While the state regulatory approvals are pending, the replacement operators assumed management of the properties beginning on March 1, 2016 pursuant to management agreements with the existing tenant. In connection with these transitions, we have agreed to make working capital loans up to an amount of $13.0 million to the replacement operators. In addition, we purchased a $7.3 million self-liquidating working capital loan secured by accounts receivable of the former tenant. Although we expect the replacement operators to receive the required state regulatory approvals in the second quarter of 2016, we cannot provide any assurances as to whether or when they will be granted and the new master leases will commence.
In February 2016, we issued 56,377 shares of our common stock valued at $1.4 million to the sellers as additional consideration for the acquisition of our specialty healthcare and seniors housing valuation firm pursuant to the post-closing adjustment provisions of the purchase agreement.
In February 2016, we transitioned three SNFs to a new operator under the same rental terms.
In February 2016, we sold six SNFs for aggregate proceeds of $5.4 million. We also sold one SNF to the existing operator for $4.5 million. As consideration for this property, we received a promissory note from the purchaser in the amount of $4.5 million that has a term of 18 months. All seven SNFs sold were classified as held for sale as of December 31, 2015.
On March 9, 2016, our board of directors declared the first quarterly installment of our 2016 dividend on our common stock in the amount of $0.57 per share, payable in cash on March 31, 2016 to stockholders of record on March 21, 2016.
CARE CAPITAL PROPERTIES, INC.
SCHEDULE II
VALUATION AND QUALIFYING ACCOUNTS
December 31, 2015
(In Thousands)
|
| | | | | | | | | | | | | | | | | | | | |
| Allowance Accounts | | | | Additions | | Deductions | | |
| | | | | | | | | | | |
| Year Ended December 31, | | Balance at Beginning of Year | | Charged to Earnings | | Uncollectible Accounts Written-off | | Disposed Properties | | Balance at End of Year |
| | | | | | | | | | | |
| 2015 | | | | | | | | | | |
| Allowance for doubtful accounts | | $ | (3,147 | ) | | $ | (4,691 | ) | | $ | 2,538 |
| | $ | 622 |
| | $ | (4,678 | ) |
| Straight-line rent receivable allowance | | (58,001 | ) | | (25,828 | ) | | — |
| | (3,573 | ) | | (87,402 | ) |
| | | $ | (61,148 | ) | | $ | (30,519 | ) | | $ | 2,538 |
| | $ | (2,951 | ) | | $ | (92,080 | ) |
| | | | | | | | | | | |
| 2014 | | | | | | | | | | |
| Allowance for doubtful accounts | | $ | (1,467 | ) | | (3,004 | ) | | 1,167 |
| | 157 |
| | $ | (3,147 | ) |
| Straight-line rent receivable allowance | | (37,807 | ) | | (21,299 | ) | | — |
| | 1,105 |
| | (58,001 | ) |
| | | $ | (39,274 | ) | | $ | (24,303 | ) | | $ | 1,167 |
| | $ | 1,262 |
| | $ | (61,148 | ) |
| | | | | | | | | | | |
| 2013 | | | | | | | | | | |
| Allowance for doubtful accounts | | $ | (683 | ) | | (1,697 | ) | | 913 |
| | — |
| | $ | (1,467 | ) |
| Straight-line rent receivable allowance | | (22,337 | ) | | (16,049 | ) | | — |
| | 579 |
| | (37,807 | ) |
| | | $ | (23,020 | ) | | $ | (17,746 | ) | | $ | 913 |
| | $ | 579 |
| | $ | (39,274 | ) |
CARE CAPITAL PROPERTIES, INC. AND PREDECESSORS
SCHEDULE III
REAL ESTATE AND ACCUMULATED DEPRECIATION
December 31, 2015
(In Thousands)
|
| | | | | | | | | | | |
| | For the Years Ended December 31, |
| | 2015 | | 2014 | | 2013 |
| Reconciliation of real estate: | | | | | |
| Carrying cost: | | | | | |
| Balance at beginning of period | $ | 2,706,625 |
| | $ | 2,692,498 |
| | $ | 2,672,101 |
|
| Additions during period: | | | | | |
| Acquisitions | 553,981 |
| | 13,194 |
| | 11,791 |
|
| Capital expenditures | 38,592 |
| | 16,426 |
| | 11,550 |
|
| Other | 59,688 |
| | — |
| | — |
|
| Deletions during period: | | | | | |
| Sales and/or transfers to assets held for sale | (53,790 | ) | | (15,493 | ) | | (2,944 | ) |
| Balance at end of period | $ | 3,305,096 |
| | $ | 2,706,625 |
| | $ | 2,692,498 |
|
| | | | | | |
| Accumulated depreciation: | | | | | |
| Balance at beginning of period | $ | 567,353 |
| | $ | 483,017 |
| | $ | 396,401 |
|
| Additions during period: | | | | | |
| Depreciation and impairment expense | 128,138 |
| | 95,058 |
| | 89,193 |
|
| Deletions during period: | | | | | |
| Sales and/or transfers to assets held for sale | (30,692 | ) | | (10,722 | ) | | (2,577 | ) |
| Other | (5,711 | ) | | — |
| | — |
|
| Balance at end of period | $ | 659,088 |
| | $ | 567,353 |
| | $ | 483,017 |
|
CARE CAPITAL PROPERTIES, INC. AND PREDECESSORS
SCHEDULE III
REAL ESTATE AND ACCUMULATED DEPRECIATION
December 31, 2015
(Dollars in Thousands)
|
| | | | | | | | | | | | | | | | | | | | | | | | | | | | | | | | |
| | Location | | Initial Cost to Company | | Gross Amount Carried at Close of Period | | | | | | |
| Property Name | City | State | Encumbrances | Land and Improvements | Buildings and Improvements | Costs Capitalized Subsequent to Acquisition | Land and Improvements | Buildings and Improvements | Total | Accumulated Depreciation | NBV | Year of Construction | Year Acquired | Life on Which Depreciation in Income Statement is Computed |
| SKILLED NURSING FACILITIES | | | |
| |
| |
| |
| |
| |
| |
| |
| |
| | | |
| Whitesburg Gardens Health Care Center | Huntsville | AL | $ | — |
| $ | 534 |
| $ | 4,216 |
| $ | 333 |
| $ | 534 |
| $ | 4,549 |
| $ | 5,083 |
| $ | 4,249 |
| $ | 834 |
| 1968 | 1991 | 25 years |
| Azalea Gardens of Mobile | Mobile | AL | — |
| 5 |
| 2,981 |
| 319 |
| 8 |
| 3,297 |
| 3,305 |
| 2,578 |
| 727 |
| 1967 | 1992 | 29 years |
| Heartland | Benton | AR | — |
| 650 |
| 13,540 |
| 647 |
| 650 |
| 14,187 |
| 14,837 |
| 2,088 |
| 12,749 |
| 1992 | 2011 | 35 years |
| Southern Trace | Bryant | AR | — |
| 480 |
| 12,455 |
| — |
| 480 |
| 12,455 |
| 12,935 |
| 1,879 |
| 11,056 |
| 1989 | 2011 | 35 years |
| Beverly Health Care Golflinks | Hot Springs | AR | — |
| 500 |
| 11,311 |
| (3,786 | ) | 483 |
| 7,542 |
| 8,025 |
| 1,783 |
| 6,242 |
| 1978 | 2011 | 35 years |
| Lake Village | Lake Village | AR | — |
| 560 |
| 8,594 |
| 23 |
| 560 |
| 8,617 |
| 9,177 |
| 1,378 |
| 7,799 |
| 1998 | 2011 | 35 years |
| Belle View | Monticello | AR | — |
| 260 |
| 9,542 |
| 168 |
| 260 |
| 9,710 |
| 9,970 |
| 1,446 |
| 8,524 |
| 1995 | 2011 | 35 years |
| River Chase | Morrilton | AR | — |
| 240 |
| 9,476 |
| — |
| 240 |
| 9,476 |
| 9,716 |
| 1,429 |
| 8,287 |
| 1988 | 2011 | 35 years |
| Brookridge Cove | Morrilton | AR | — |
| 410 |
| 11,069 |
| 4 |
| 410 |
| 11,073 |
| 11,483 |
| 1,701 |
| 9,782 |
| 1996 | 2011 | 35 years |
| River Ridge | Wynne | AR | — |
| 290 |
| 10,763 |
| 1 |
| 290 |
| 10,764 |
| 11,054 |
| 1,609 |
| 9,445 |
| 1990 | 2011 | 35 years |
| CareMeridian Phoenix | Phoenix | AZ | — |
| 1,040 |
| 6,541 |
| — |
| 1,040 |
| 6,541 |
| 7,581 |
| 225 |
| 7,356 |
| 2008 | 2015 | 35 years |
| Kachina Point Health Care and Rehabilitation Center | Sedona | AZ | — |
| 364 |
| 4,179 |
| 197 |
| 364 |
| 4,376 |
| 4,740 |
| 3,355 |
| 1,385 |
| 1983 | 1984 | 45 years |
| Villa Campana Health Care Center | Tucson | AZ | — |
| 533 |
| 2,201 |
| 395 |
| 533 |
| 2,596 |
| 3,129 |
| 1,725 |
| 1,404 |
| 1983 | 1993 | 35 years |
| Bay View Nursing and Rehabilitation Center | Alameda | CA | — |
| 1,462 |
| 5,981 |
| 282 |
| 1,462 |
| 6,263 |
| 7,725 |
| 5,128 |
| 2,597 |
| 1967 | 1993 | 45 years |
| Chowchilla Convalescent Center | Chowchilla | CA | — |
| 1,780 |
| 5,097 |
| — |
| 1,780 |
| 5,097 |
| 6,877 |
| 815 |
| 6,062 |
| 1965 | 2011 | 35 years |
| Driftwood Gilroy | Gilroy | CA | — |
| 3,330 |
| 13,665 |
| — |
| 3,330 |
| 13,665 |
| 16,995 |
| 2,106 |
| 14,889 |
| 1968 | 2011 | 35 years |
| CareMeridian La Mesa | LaMesa | CA | — |
| 1,374 |
| 2,653 |
| — |
| 1,374 |
| 2,653 |
| 4,027 |
| 122 |
| 3,905 |
| 2012 | 2015 | 35 years |
| Orange Hills Convalescent Hospital | Orange | CA | — |
| 960 |
| 20,968 |
| — |
| 960 |
| 20,968 |
| 21,928 |
| 3,046 |
| 18,882 |
| 1987 | 2011 | 35 years |
| CareMeridian Cowan Heights | Santa Ana | CA | — |
| 1,912 |
| 4,889 |
| — |
| 1,912 |
| 4,889 |
| 6,801 |
| 164 |
| 6,637 |
| 2003 | 2015 | 35 years |
| Brighton Care Center | Brighton | CO | — |
| 282 |
| 3,377 |
| 468 |
| 282 |
| 3,845 |
| 4,127 |
| 2,936 |
| 1,191 |
| 1969 | 1992 | 30 years |
| Malley Healthcare and Rehabilitation Center | Northglenn | CO | — |
| 501 |
| 8,294 |
| 1,597 |
| 501 |
| 9,891 |
| 10,392 |
| 6,495 |
| 3,897 |
| 1971 | 1993 | 29 years |
| Parkway Pavilion Healthcare | Enfield | CT | — |
| 337 |
| 3,607 |
| 1,079 |
| 337 |
| 4,686 |
| 5,023 |
| 3,245 |
| 1,778 |
| 1968 | 1994 | 28 years |
| The Crossings West Campus | New London | CT | — |
| 202 |
| 2,363 |
| 998 |
| 202 |
| 3,361 |
| 3,563 |
| 1,992 |
| 1,571 |
| 1969 | 1994 | 28 years |
| The Crossings East Campus | New London | CT | — |
| 401 |
| 2,776 |
| 1,252 |
| 401 |
| 4,028 |
| 4,429 |
| 2,521 |
| 1,908 |
| 1968 | 1992 | 29 years |
| Beverly Health - Ft. Pierce | Fort Pierce | FL | — |
| 840 |
| 16,318 |
| — |
| 840 |
| 16,318 |
| 17,158 |
| 2,493 |
| 14,665 |
| 1960 | 2011 | 35 years |
| Willowwood Health & Rehab Center | Flowery Branch | GA | — |
| 1,130 |
| 9,219 |
| — |
| 1,130 |
| 9,219 |
| 10,349 |
| 1,414 |
| 8,935 |
| 1970 | 2011 | 35 years |
| Specialty Care of Marietta | Marietta | GA | — |
| 241 |
| 2,782 |
| 2,311 |
| 241 |
| 5,093 |
| 5,334 |
| 2,419 |
| 2,915 |
| 1968 | 1993 | 28.5 years |
|
| | | | | | | | | | | | | | | | | | | | | | | | | | | | | | | | |
| | Location | | Initial Cost to Company | | Gross Amount Carried at Close of Period | | | | | | |
| Property Name | City | State | Encumbrances | Land and Improvements | Buildings and Improvements | Costs Capitalized Subsequent to Acquisition | Land and Improvements | Buildings and Improvements | Total | Accumulated Depreciation | NBV | Year of Construction | Year Acquired | Life on Which Depreciation in Income Statement is Computed |
| Savannah Rehabilitation & Nursing Center | Savannah | GA | — |
| 213 |
| 2,772 |
| 1,213 |
| 213 |
| 3,985 |
| 4,198 |
| 2,342 |
| 1,856 |
| 1968 | 1993 | 28.5 years |
| Savannah Specialty Care Center | Savannah | GA | — |
| 157 |
| 2,219 |
| 307 |
| 191 |
| 2,492 |
| 2,683 |
| 2,155 |
| 528 |
| 1972 | 1991 | 26 years |
| Boise Health and Rehabilitation Center | Boise | ID | — |
| 256 |
| 3,593 |
| 281 |
| 256 |
| 3,874 |
| 4,130 |
| 1,807 |
| 2,323 |
| 1977 | 1998 | 45 years |
| Meadowbrooke Rehab Centre & Suites | Anderson | IN | — |
| 1,600 |
| 6,710 |
| — |
| 1,600 |
| 6,710 |
| 8,310 |
| 1,111 |
| 7,199 |
| 1967 | 2011 | 35 years |
| Chalet Village | Berne | IN | — |
| 590 |
| 1,654 |
| — |
| 590 |
| 1,654 |
| 2,244 |
| 412 |
| 1,832 |
| 1986 | 2011 | 35 years |
| Meadowvale Health and Rehabilitation Center | Bluffton | IN | — |
| 7 |
| 787 |
| 895 |
| 37 |
| 1,652 |
| 1,689 |
| 779 |
| 910 |
| 1962 | 1995 | 22 years |
| Bremen Health Care Center | Bremen | IN | — |
| 109 |
| 3,354 |
| 943 |
| 109 |
| 4,297 |
| 4,406 |
| 2,388 |
| 2,018 |
| 1982 | 1996 | 45 years |
| Vermillion Convalescent Center | Clinton | IN | — |
| 700 |
| 11,057 |
| — |
| 700 |
| 11,057 |
| 11,757 |
| 1,707 |
| 10,050 |
| 1971 | 2011 | 35 years |
| Willow Crossing Health & Rehab Center | Columbus | IN | — |
| 880 |
| 4,963 |
| — |
| 880 |
| 4,963 |
| 5,843 |
| 864 |
| 4,979 |
| 1988 | 2011 | 35 years |
| Greenhill Manor | Fowler | IN | — |
| 380 |
| 7,659 |
| — |
| 380 |
| 7,659 |
| 8,039 |
| 1,152 |
| 6,887 |
| 1973 | 2011 | 35 years |
| Twin City Healthcare | Gas City | IN | — |
| 350 |
| 3,012 |
| — |
| 350 |
| 3,012 |
| 3,362 |
| 556 |
| 2,806 |
| 1974 | 2011 | 35 years |
| Hanover Nursing Center | Hanover | IN | — |
| 1,070 |
| 3,903 |
| — |
| 1,070 |
| 3,903 |
| 4,973 |
| 824 |
| 4,149 |
| 1975 | 2011 | 35 years |
| Bridgewater Center for Health & Rehab | Hartford City | IN | — |
| 470 |
| 1,855 |
| — |
| 470 |
| 1,855 |
| 2,325 |
| 433 |
| 1,892 |
| 1988 | 2011 | 35 years |
| Oakbrook Village | Huntington | IN | — |
| 600 |
| 1,950 |
| — |
| 600 |
| 1,950 |
| 2,550 |
| 390 |
| 2,160 |
| 1987 | 2011 | 35 years |
| Lakeview Manor | Indianapolis | IN | — |
| 2,780 |
| 7,927 |
| — |
| 2,780 |
| 7,927 |
| 10,707 |
| 1,451 |
| 9,256 |
| 1968 | 2011 | 35 years |
| Wintersong Village | Knox | IN | — |
| 420 |
| 2,019 |
| — |
| 420 |
| 2,019 |
| 2,439 |
| 375 |
| 2,064 |
| 1984 | 2011 | 35 years |
| Woodland Hills Care Center | Lawrenceburg | IN | — |
| 340 |
| 3,757 |
| — |
| 340 |
| 3,757 |
| 4,097 |
| 734 |
| 3,363 |
| 1966 | 2011 | 35 years |
| Parkwood Health Care Center | Lebanon | IN | — |
| 121 |
| 4,512 |
| 1,310 |
| 128 |
| 5,815 |
| 5,943 |
| 4,376 |
| 1,567 |
| 1977 | 1993 | 25 years |
| Whispering Pines | Monticello | IN | — |
| 460 |
| 8,461 |
| — |
| 460 |
| 8,461 |
| 8,921 |
| 1,287 |
| 7,634 |
| 1988 | 2011 | 35 years |
| Muncie Health & Rehabilitation Center | Muncie | IN | — |
| 108 |
| 4,202 |
| 1,263 |
| 170 |
| 5,403 |
| 5,573 |
| 4,143 |
| 1,430 |
| 1980 | 1993 | 25 years |
| Willow Bend Living Center | Muncie | IN | — |
| 1,080 |
| 4,026 |
| — |
| 1,080 |
| 4,026 |
| 5,106 |
| 674 |
| 4,432 |
| 1976 | 2011 | 35 years |
| Liberty Village | Muncie | IN | — |
| 1,520 |
| 7,542 |
| — |
| 1,520 |
| 7,542 |
| 9,062 |
| 1,197 |
| 7,865 |
| 2001 | 2011 | 35 years |
| Petersburg Health Care Center | Petersburg | IN | — |
| 310 |
| 8,443 |
| — |
| 310 |
| 8,443 |
| 8,753 |
| 1,318 |
| 7,435 |
| 1970 | 2011 | 35 years |
| Persimmon Ridge Center | Portland | IN | — |
| 400 |
| 9,597 |
| — |
| 400 |
| 9,597 |
| 9,997 |
| 1,495 |
| 8,502 |
| 1964 | 2011 | 35 years |
| Oakridge Convalescent Center | Richmond | IN | — |
| 640 |
| 11,128 |
| — |
| 640 |
| 11,128 |
| 11,768 |
| 1,742 |
| 10,026 |
| 1975 | 2011 | 35 years |
| Royal Oaks Health Care and Rehabilitation Center | Terre Haute | IN | — |
| 418 |
| 5,779 |
| 1,254 |
| 428 |
| 7,023 |
| 7,451 |
| 3,184 |
| 4,267 |
| 1995 | 1995 | 45 years |
| Westridge Healthcare Center | Terre Haute | IN | — |
| 690 |
| 5,384 |
| — |
| 690 |
| 5,384 |
| 6,074 |
| 868 |
| 5,206 |
| 1965 | 2011 | 35 years |
| Washington Nursing Center | Washington | IN | — |
| 220 |
| 10,054 |
| — |
| 220 |
| 10,054 |
| 10,274 |
| 1,594 |
| 8,680 |
| 1968 | 2011 | 35 years |
| Pine Knoll Rehabilitation Center | Winchester | IN | — |
| 730 |
| 6,039 |
| — |
| 730 |
| 6,039 |
| 6,769 |
| 928 |
| 5,841 |
| 1986 | 2011 | 35 years |
| Belleville Health Care Center | Belleville | KS | — |
| 590 |
| 4,170 |
| — |
| 590 |
| 4,170 |
| 4,760 |
| 717 |
| 4,043 |
| 1977 | 2011 | 35 years |
| Smokey Hill Rehab Center | Salina | KS | — |
| 360 |
| 3,705 |
| — |
| 360 |
| 3,705 |
| 4,065 |
| 739 |
| 3,326 |
| 1981 | 2011 | 35 years |
| Westwood Manor | Topeka | KS | — |
| 250 |
| 3,735 |
| 381 |
| 250 |
| 4,116 |
| 4,366 |
| 647 |
| 3,719 |
| 1973 | 2011 | 35 years |
| Jackson Manor | Annville | KY | — |
| 131 |
| 4,442 |
| — |
| 131 |
| 4,442 |
| 4,573 |
| 1,163 |
| 3,410 |
| 1989 | 2006 | 35 years |
| Colonial Health & Rehabilitation Center | Bardstown | KY | — |
| 38 |
| 2,829 |
| — |
| 38 |
| 2,829 |
| 2,867 |
| 741 |
| 2,126 |
| 1968 | 2006 | 35 years |
|
| | | | | | | | | | | | | | | | | | | | | | | | | | | | | | | | |
| | Location | | Initial Cost to Company | | Gross Amount Carried at Close of Period | | | | | | |
| Property Name | City | State | Encumbrances | Land and Improvements | Buildings and Improvements | Costs Capitalized Subsequent to Acquisition | Land and Improvements | Buildings and Improvements | Total | Accumulated Depreciation | NBV | Year of Construction | Year Acquired | Life on Which Depreciation in Income Statement is Computed |
| Rosewood Health Care Center | Bowling Green | KY | — |
| 248 |
| 5,371 |
| 1,452 |
| 251 |
| 6,820 |
| 7,071 |
| 4,723 |
| 2,348 |
| 1970 | 1990 | 30 years |
| Riverside Manor Healthcare Center | Calhoun | KY | — |
| 103 |
| 2,119 |
| 454 |
| 103 |
| 2,573 |
| 2,676 |
| 1,879 |
| 797 |
| 1963 | 1990 | 30 years |
| Oakview Nursing and Rehabilitation Center | Calvert City | KY | — |
| 124 |
| 2,882 |
| 1,217 |
| 124 |
| 4,099 |
| 4,223 |
| 2,704 |
| 1,519 |
| 1967 | 1990 | 30 years |
| Green Valley Health & Rehabilitation Center | Carrollton | KY | — |
| 29 |
| 2,325 |
| — |
| 29 |
| 2,325 |
| 2,354 |
| 609 |
| 1,745 |
| 1978 | 2006 | 35 years |
| Summit Manor Health & Rehabilitation Center | Columbia | KY | — |
| 38 |
| 12,510 |
| — |
| 38 |
| 12,510 |
| 12,548 |
| 3,277 |
| 9,271 |
| 1965 | 2006 | 35 years |
| Danville Centre for Health and Rehabilitation | Danville | KY | — |
| 322 |
| 3,538 |
| 1,727 |
| 322 |
| 5,265 |
| 5,587 |
| 2,770 |
| 2,817 |
| 1962 | 1995 | 30 years |
| Woodland Terrace Health Care Facility | Elizabethtown | KY | — |
| 216 |
| 1,795 |
| 390 |
| 216 |
| 2,185 |
| 2,401 |
| 1,988 |
| 413 |
| 1969 | 1982 | 26 years |
| Glasgow Health & Rehabilitation Center | Glasgow | KY | — |
| 21 |
| 2,997 |
| — |
| 21 |
| 2,997 |
| 3,018 |
| 785 |
| 2,233 |
| 1968 | 2006 | 35 years |
| Harrodsburg Health Care Center | Harrodsburg | KY | — |
| 137 |
| 1,830 |
| 990 |
| 137 |
| 2,820 |
| 2,957 |
| 1,834 |
| 1,123 |
| 1974 | 1985 | 35 years |
| Professional Care Health & Rehabilitation Center | Hartford | KY | — |
| 22 |
| 7,905 |
| — |
| 22 |
| 7,905 |
| 7,927 |
| 2,070 |
| 5,857 |
| 1967 | 2006 | 35 years |
| Hart County Health Center | Horse Cave | KY | — |
| 68 |
| 6,059 |
| — |
| 68 |
| 6,059 |
| 6,127 |
| 1,587 |
| 4,540 |
| 1993 | 2006 | 35 years |
| Heritage Hall Health & Rehabilitation Center | Lawrenceburg | KY | — |
| 38 |
| 3,920 |
| — |
| 38 |
| 3,920 |
| 3,958 |
| 1,027 |
| 2,931 |
| 1973 | 2006 | 35 years |
| Tanbark Health & Rehabilitation Center | Lexington | KY | — |
| 868 |
| 6,061 |
| — |
| 868 |
| 6,061 |
| 6,929 |
| 1,587 |
| 5,342 |
| 1989 | 2006 | 35 years |
| Northfield Centre for Health and Rehabilitation | Louisville | KY | — |
| 285 |
| 1,555 |
| 760 |
| 285 |
| 2,315 |
| 2,600 |
| 1,637 |
| 963 |
| 1969 | 1985 | 30 years |
| Jefferson Manor | Louisville | KY | — |
| 2,169 |
| 4,075 |
| — |
| 2,169 |
| 4,075 |
| 6,244 |
| 1,067 |
| 5,177 |
| 1982 | 2006 | 35 years |
| Jefferson Place | Louisville | KY | — |
| 1,307 |
| 9,175 |
| — |
| 1,307 |
| 9,175 |
| 10,482 |
| 2,403 |
| 8,079 |
| 1991 | 2006 | 35 years |
| Meadowview Health & Rehabilitation Center | Louisville | KY | — |
| 317 |
| 4,666 |
| — |
| 317 |
| 4,666 |
| 4,983 |
| 1,222 |
| 3,761 |
| 1973 | 2006 | 35 years |
| Rockford Health & Rehabilitation Center | Louisville | KY | — |
| 364 |
| 9,568 |
| — |
| 364 |
| 9,568 |
| 9,932 |
| 2,506 |
| 7,426 |
| 1975 | 2006 | 35 years |
| Summerfield Health & Rehabilitation Center | Louisville | KY | — |
| 1,089 |
| 10,756 |
| — |
| 1,089 |
| 10,756 |
| 11,845 |
| 2,817 |
| 9,028 |
| 1979 | 2006 | 35 years |
| Hillcrest Health Care Center | Owensboro | KY | — |
| 544 |
| 2,619 |
| 1,267 |
| 565 |
| 3,865 |
| 4,430 |
| 2,887 |
| 1,543 |
| 1963 | 1982 | 22 years |
| McCreary Health & Rehabilitation Center | Pine Knot | KY | — |
| 73 |
| 2,443 |
| — |
| 73 |
| 2,443 |
| 2,516 |
| 640 |
| 1,876 |
| 1990 | 2006 | 35 years |
| North Hardin Health & Rehabilitation Center | Radcliff | KY | — |
| 218 |
| 11,944 |
| — |
| 218 |
| 11,944 |
| 12,162 |
| 3,128 |
| 9,034 |
| 1986 | 2006 | 35 years |
| Monroe Health & Rehabilitation Center | Tompkinsville | KY | — |
| 32 |
| 8,756 |
| — |
| 32 |
| 8,756 |
| 8,788 |
| 2,293 |
| 6,495 |
| 1969 | 2006 | 35 years |
| Fountain Circle Health and Rehabilitation | Winchester | KY | — |
| 137 |
| 6,120 |
| 1,518 |
| 137 |
| 7,638 |
| 7,775 |
| 5,528 |
| 2,247 |
| 1967 | 1990 | 30 years |
| The Guest House | Baton Rouge | LA | — |
| 1,421 |
| 21,339 |
| — |
| 1,421 |
| 21,339 |
| 22,760 |
| 337 |
| 22,423 |
| 1964 | 2015 | 35 years |
| Pilgrim Manor | Bossier City | LA | — |
| 990 |
| 27,604 |
| — |
| 990 |
| 27,604 |
| 28,594 |
| 379 |
| 28,215 |
| 1973 | 2015 | 35 years |
| Colonial Oaks | Metairie | LA | — |
| 654 |
| 21,523 |
| — |
| 654 |
| 21,523 |
| 22,177 |
| 296 |
| 21,881 |
| 2001 | 2015 | 35 years |
| Alpine | Ruston | LA | — |
| 1,400 |
| 27,018 |
| — |
| 1,400 |
| 27,018 |
| 28,418 |
| 414 |
| 28,004 |
| 1969 | 2015 | 35 years |
|
| | | | | | | | | | | | | | | | | | | | | | | | | | | | | | | | |
| | Location | | Initial Cost to Company | | Gross Amount Carried at Close of Period | | | | | | |
| Property Name | City | State | Encumbrances | Land and Improvements | Buildings and Improvements | Costs Capitalized Subsequent to Acquisition | Land and Improvements | Buildings and Improvements | Total | Accumulated Depreciation | NBV | Year of Construction | Year Acquired | Life on Which Depreciation in Income Statement is Computed |
| Booker T. Washington | Shreveport | LA | — |
| 1,792 |
| 22,719 |
| — |
| 1,792 |
| 22,719 |
| 24,511 |
| 334 |
| 24,177 |
| 2001 | 2015 | 35 years |
| Shreveport Manor | Shreveport | LA | — |
| 516 |
| 13,882 |
| — |
| 516 |
| 13,882 |
| 14,398 |
| 226 |
| 14,172 |
| 1969 | 2015 | 35 years |
| The Bradford | Shreveport | LA | — |
| 1,133 |
| 8,889 |
| — |
| 1,133 |
| 8,889 |
| 10,022 |
| 156 |
| 9,866 |
| 1980 | 2015 | 35 years |
| Colony House Nursing and Rehabilitation Center | Abington | MA | — |
| 132 |
| 999 |
| 194 |
| 132 |
| 1,193 |
| 1,325 |
| 1,196 |
| 129 |
| 1965 | 1969 | 40 years |
| Wingate at Andover | Andover | MA | — |
| 1,450 |
| 14,798 |
| — |
| 1,450 |
| 14,798 |
| 16,248 |
| 2,318 |
| 13,930 |
| 1992 | 2011 | 35 years |
|
| | | | | | | | | | | | | | | | | | | | | | | |
| Blueberry Hill Skilled Nursing & Rehabilitation Center | Beverly | MA | — |
| 129 |
| 4,290 |
| 1,311 |
| 129 |
| 5,601 |
| 5,730 |
| 3,689 |
| 2,041 |
| 1965 | 1968 | 40 years |
| Wingate at Brighton | Brighton | MA | — |
| 1,070 |
| 7,383 |
| — |
| 1,070 |
| 7,383 |
| 8,453 |
| 1,319 |
| 7,134 |
| 1995 | 2011 | 35 years |
| Walden Rehabilitation and Nursing Center | Concord | MA | — |
| 181 |
| 1,347 |
| 178 |
| 181 |
| 1,525 |
| 1,706 |
| 1,441 |
| 265 |
| 1969 | 1968 | 40 years |
| Sachem Skilled Nursing & Rehabilitation Center | East Bridgewater | MA | — |
| 529 |
| 1,238 |
| 232 |
| 529 |
| 1,470 |
| 1,999 |
| 1,718 |
| 281 |
| 1968 | 1982 | 27 years |
| Chestnut Hill Rehab & Nursing | East Longmeadow | MA | — |
| 3,050 |
| 5,392 |
| — |
| 3,050 |
| 5,392 |
| 8,442 |
| 1,036 |
| 7,406 |
| 1985 | 2011 | 35 years |
| Crawford Skilled Nursing and Rehabilitation Center | Fall River | MA | — |
| 127 |
| 1,109 |
| 312 |
| 127 |
| 1,421 |
| 1,548 |
| 1,207 |
| 341 |
| 1968 | 1982 | 29 years |
| Franklin Skilled Nursing and Rehabilitation Center | Franklin | MA | — |
| 156 |
| 757 |
| 158 |
| 156 |
| 915 |
| 1,071 |
| 847 |
| 224 |
| 1967 | 1969 | 40 years |
| Wingate at Haverhill | Haverhill | MA | — |
| 810 |
| 9,288 |
| — |
| 810 |
| 9,288 |
| 10,098 |
| 1,592 |
| 8,506 |
| 1973 | 2011 | 35 years |
| Skilled Care Center at Silver Lake | Kingston | MA | — |
| 3,230 |
| 19,870 |
| — |
| 3,230 |
| 19,870 |
| 23,100 |
| 3,356 |
| 19,744 |
| 1992 | 2011 | 35 years |
| River Terrace Healthcare | Lancaster | MA | — |
| 268 |
| 957 |
| 212 |
| 268 |
| 1,169 |
| 1,437 |
| 1,177 |
| 260 |
| 1969 | 1969 | 40 years |
| Wentworth Skilled Care Center | Lowell | MA | — |
| 820 |
| 11,220 |
| — |
| 820 |
| 11,220 |
| 12,040 |
| 1,738 |
| 10,302 |
| 1966 | 2011 | 35 years |
| Bolton Manor Nursing and Rehabilitation Center | Marlborough | MA | — |
| 222 |
| 2,431 |
| 300 |
| 222 |
| 2,731 |
| 2,953 |
| 2,352 |
| 601 |
| 1973 | 1984 | 34.5 years |
| The Eliot Healthcare Center | Natick | MA | — |
| 249 |
| 1,328 |
| 500 |
| 249 |
| 1,828 |
| 2,077 |
| 1,505 |
| 572 |
| 1996 | 1982 | 31 years |
| Wingate at Needham | Needham Heights | MA | — |
| 920 |
| 9,236 |
| — |
| 920 |
| 9,236 |
| 10,156 |
| 1,587 |
| 8,569 |
| 1996 | 2011 | 35 years |
| Brigham Manor Nursing and Rehabilitation Center | Newburyport | MA | — |
| 126 |
| 1,708 |
| 134 |
| 126 |
| 1,842 |
| 1,968 |
| 1,735 |
| 233 |
| 1806 | 1982 | 27 years |
| Country Rehabilitation and Nursing Center | Newburyport | MA | — |
| 199 |
| 3,004 |
| 378 |
| 199 |
| 3,382 |
| 3,581 |
| 3,109 |
| 472 |
| 1968 | 1982 | 27 years |
| Quincy Rehabilitation and Nursing Center | Quincy | MA | — |
| 216 |
| 2,911 |
| 204 |
| 216 |
| 3,115 |
| 3,331 |
| 2,968 |
| 363 |
| 1965 | 1984 | 24 years |
| Wingate at Reading | Reading | MA | — |
| 920 |
| 7,499 |
| — |
| 920 |
| 7,499 |
| 8,419 |
| 1,307 |
| 7,112 |
| 1988 | 2011 | 35 years |
| Den-Mar Rehabilitation and Nursing Center | Rockport | MA | — |
| 23 |
| 1,560 |
| 187 |
| 23 |
| 1,747 |
| 1,770 |
| 1,581 |
| 189 |
| 1963 | 1985 | 30 years |
| Wingate at South Hadley | South Hadley | MA | — |
| 1,870 |
| 15,572 |
| — |
| 1,870 |
| 15,572 |
| 17,442 |
| 2,396 |
| 15,046 |
| 1988 | 2011 | 35 years |
| Ring East | Springfield | MA | — |
| 1,250 |
| 13,561 |
| — |
| 1,250 |
| 13,561 |
| 14,811 |
| 2,182 |
| 12,629 |
| 1987 | 2011 | 35 years |
| Blue Hills Alzheimer's Care Center | Stoughton | MA | — |
| 511 |
| 1,026 |
| 175 |
| 511 |
| 1,201 |
| 1,712 |
| 1,472 |
| 240 |
| 1965 | 1982 | 28 years |
| Wingate at Sudbury | Sudbury | MA | — |
| 1,540 |
| 8,100 |
| — |
| 1,540 |
| 8,100 |
| 9,640 |
| 1,489 |
| 8,151 |
| 1997 | 2011 | 35 years |
| Country Gardens Skilled Nursing & Rehabilitation Center | Swansea | MA | — |
| 415 |
| 2,675 |
| 180 |
| 415 |
| 2,855 |
| 3,270 |
| 2,691 |
| 579 |
| 1969 | 1984 | 27 years |
|
| | | | | | | | | | | | | | | | | | | | | | | |
| | Location | | Initial Cost to Company | | Gross Amount Carried at Close of Period | | | | | | |
| Property Name | City | State | Encumbrances | Land and Improvements | Buildings and Improvements | Costs Capitalized Subsequent to Acquisition | Land and Improvements | Buildings and Improvements | Total | Accumulated Depreciation | NBV | Year of Construction | Year Acquired | Life on Which Depreciation in Income Statement is Computed |
| Brookside Rehabilitation and Nursing Center | Webster | MA | — |
| 102 |
| 1,154 |
| 173 |
| 102 |
| 1,327 |
| 1,429 |
| 1,228 |
| 201 |
| 1967 | 1982 | 31 years |
| Newton and Wellesley Alzheimer Center | Wellesley | MA | — |
| 297 |
| 3,250 |
| 275 |
| 297 |
| 3,525 |
| 3,822 |
| 3,057 |
| 765 |
| 1971 | 1984 | 30 years |
| Riverdale Gardens Rehab & Nursing | West Springfield | MA | — |
| 2,140 |
| 6,997 |
| 107 |
| 2,140 |
| 7,104 |
| 9,244 |
| 1,529 |
| 7,715 |
| 1960 | 2011 | 35 years |
| Wingate at Wilbraham | Wilbraham | MA | — |
| 4,070 |
| 10,777 |
| — |
| 4,070 |
| 10,777 |
| 14,847 |
| 1,814 |
| 13,033 |
| 1988 | 2011 | 35 years |
| Worcester Skilled Care Center | Worcester | MA | — |
| 620 |
| 10,958 |
| — |
| 620 |
| 10,958 |
| 11,578 |
| 1,879 |
| 9,699 |
| 1970 | 2011 | 35 years |
| Cumberland Villa Nursing Center | Cumberland | MD | — |
| 660 |
| 23,970 |
| — |
| 660 |
| 23,970 |
| 24,630 |
| 3,430 |
| 21,200 |
| 1968 | 2011 | 35 years |
| Colton Villa | Hagerstown | MD | — |
| 1,550 |
| 16,973 |
| — |
| 1,550 |
| 16,973 |
| 18,523 |
| 2,585 |
| 15,938 |
| 1971 | 2011 | 35 years |
| Westminster Nursing & Convalescent Center | Westminster | MD | — |
| 2,160 |
| 15,931 |
| — |
| 2,160 |
| 15,931 |
| 18,091 |
| 2,425 |
| 15,666 |
| 1973 | 2011 | 35 years |
| Augusta Rehabilitation Center | Augusta | ME | — |
| 152 |
| 1,074 |
| 146 |
| 152 |
| 1,220 |
| 1,372 |
| 1,174 |
| 198 |
| 1968 | 1985 | 30 years |
| Eastside Rehabilitation and Living Center | Bangor | ME | — |
| 316 |
| 1,349 |
| 134 |
| 316 |
| 1,483 |
| 1,799 |
| 1,423 |
| 376 |
| 1967 | 1985 | 30 years |
| Westgate Manor | Bangor | ME | — |
| 287 |
| 2,718 |
| 151 |
| 287 |
| 2,869 |
| 3,156 |
| 2,730 |
| 426 |
| 1969 | 1985 | 31 years |
| Winship Green Nursing Center | Bath | ME | — |
| 110 |
| 1,455 |
| 128 |
| 110 |
| 1,583 |
| 1,693 |
| 1,384 |
| 309 |
| 1974 | 1985 | 35 years |
| Brewer Rehabilitation and Living Center | Brewer | ME | — |
| 228 |
| 2,737 |
| 304 |
| 228 |
| 3,041 |
| 3,269 |
| 2,548 |
| 721 |
| 1974 | 1985 | 33 years |
| Kennebunk Nursing and Rehabilitation Center | Kennebunk | ME | — |
| 99 |
| 1,898 |
| 161 |
| 99 |
| 2,059 |
| 2,158 |
| 1,684 |
| 474 |
| 1977 | 1985 | 35 years |
| Norway Rehabilitation & Living Center | Norway | ME | — |
| 133 |
| 1,658 |
| 118 |
| 133 |
| 1,776 |
| 1,909 |
| 1,440 |
| 469 |
| 1972 | 1985 | 39 years |
| Brentwood Rehabilitation and Nursing Center | Yarmouth | ME | — |
| 181 |
| 2,789 |
| 146 |
| 181 |
| 2,935 |
| 3,116 |
| 2,419 |
| 697 |
| 1945 | 1985 | 45 years |
| Autumn Woods Residential Health Care Facility | Warren | MI | — |
| 747 |
| 26,763 |
| — |
| 747 |
| 26,763 |
| 27,510 |
| 3,380 |
| 24,130 |
| 2012 | 2012 | 35 years |
| Hopkins Healthcare | Hopkins | MN | — |
| 4,470 |
| 21,409 |
| — |
| 4,470 |
| 21,409 |
| 25,879 |
| 3,140 |
| 22,739 |
| 1961 | 2011 | 35 years |
| Andrew Care Home | Minneapolis | MN | — |
| 3,280 |
| 5,083 |
| 351 |
| 3,282 |
| 5,432 |
| 8,714 |
| 1,373 |
| 7,341 |
| 1941 | 2011 | 35 years |
| Golden Living Center - Rochester East | Rochester | MN | — |
| 639 |
| 3,497 |
| — |
| 639 |
| 3,497 |
| 4,136 |
| 3,564 |
| 572 |
| 1967 | 1982 | 28 years |
| Ashland Healthcare | Ashland | MO | — |
| 770 |
| 4,400 |
| — |
| 770 |
| 4,400 |
| 5,170 |
| 713 |
| 4,457 |
| 1993 | 2011 | 35 years |
| South Hampton Place | Columbia | MO | — |
| 710 |
| 11,279 |
| — |
| 710 |
| 11,279 |
| 11,989 |
| 1,697 |
| 10,292 |
| 1994 | 2011 | 35 years |
| Dixon Nursing & Rehab | Dixon | MO | — |
| 570 |
| 3,342 |
| — |
| 570 |
| 3,342 |
| 3,912 |
| 577 |
| 3,335 |
| 1989 | 2011 | 35 years |
| Current River Nursing | Doniphan | MO | — |
| 450 |
| 7,703 |
| — |
| 450 |
| 7,703 |
| 8,153 |
| 1,276 |
| 6,877 |
| 1991 | 2011 | 35 years |
| Forsyth Care Center | Forsyth | MO | — |
| 710 |
| 6,731 |
| — |
| 710 |
| 6,731 |
| 7,441 |
| 1,160 |
| 6,281 |
| 1993 | 2011 | 35 years |
| Cherry Hills Nursing and Rehab Center - Kansas City MO | Kansas City | MO | — |
| 1,040 |
| 7,560 |
| — |
| 1,040 |
| 7,560 |
| 8,600 |
| 506 |
| 8,094 |
| 1983 | 2015 | 35 years |
| Garden Valley Nursing and Rehabilitation - Kansas City MO | Kansas City | MO | — |
| 720 |
| 3,590 |
| — |
| 720 |
| 3,590 |
| 4,310 |
| 417 |
| 3,893 |
| 1983 | 2015 | 35 years |
| Maryville Health Care Center | Maryville | MO | — |
| 630 |
| 5,825 |
| — |
| 630 |
| 5,825 |
| 6,455 |
| 1,016 |
| 5,439 |
| 1972 | 2011 | 35 years |
| Glenwood Healthcare | Seymour | MO | — |
| 670 |
| 3,737 |
| — |
| 670 |
| 3,737 |
| 4,407 |
| 628 |
| 3,779 |
| 1990 | 2011 | 35 years |
| Silex Community Care | Silex | MO | — |
| 730 |
| 2,689 |
| — |
| 730 |
| 2,689 |
| 3,419 |
| 497 |
| 2,922 |
| 1991 | 2011 | 35 years |
| Gravios Nursing Center | St. Louis | MO | — |
| 1,560 |
| 10,582 |
| 966 |
| 1,560 |
| 11,548 |
| 13,108 |
| 1,793 |
| 11,315 |
| 1954 | 2011 | 35 years |
|
| | | | | | | | | | | | | | | | | | | | | | | |
| | Location | | Initial Cost to Company | | Gross Amount Carried at Close of Period | | | | | | |
| Property Name | City | State | Encumbrances | Land and Improvements | Buildings and Improvements | Costs Capitalized Subsequent to Acquisition | Land and Improvements | Buildings and Improvements | Total | Accumulated Depreciation | NBV | Year of Construction | Year Acquired | Life on Which Depreciation in Income Statement is Computed |
| Bellefontaine Gardens | St. Louis | MO | — |
| 1,610 |
| 4,314 |
| — |
| 1,610 |
| 4,314 |
| 5,924 |
| 812 |
| 5,112 |
| 1988 | 2011 | 35 years |
| Strafford Care Center | Strafford | MO | — |
| 1,670 |
| 8,251 |
| — |
| 1,670 |
| 8,251 |
| 9,921 |
| 1,260 |
| 8,661 |
| 1995 | 2011 | 35 years |
| Windsor Healthcare | Windsor | MO | — |
| 510 |
| 3,345 |
| — |
| 510 |
| 3,345 |
| 3,855 |
| 577 |
| 3,278 |
| 1996 | 2011 | 35 years |
| Chapel Hill Rehabilitation and Healthcare Center | Chapel Hill | NC | — |
| 347 |
| 3,029 |
| 1,034 |
| 347 |
| 4,063 |
| 4,410 |
| 2,625 |
| 1,785 |
| 1984 | 1993 | 28 years |
| Pettigrew Rehabilitation and Healthcare Center | Durham | NC | — |
| 101 |
| 2,889 |
| 251 |
| 129 |
| 3,112 |
| 3,241 |
| 2,482 |
| 759 |
| 1969 | 1993 | 28 years |
| Rehabilitation and Health Center of Gastonia | Gastonia | NC | — |
| 158 |
| 2,359 |
| 1,032 |
| 158 |
| 3,391 |
| 3,549 |
| 2,122 |
| 1,427 |
| 1968 | 1992 | 29 years |
| Lakewood Manor | Hendersonville | NC | — |
| 1,610 |
| 7,759 |
| — |
| 1,610 |
| 7,759 |
| 9,369 |
| 1,336 |
| 8,033 |
| 1979 | 2011 | 35 years |
| Kinston Rehabilitation and Healthcare Center | Kinston | NC | — |
| 186 |
| 3,038 |
| 1,065 |
| 186 |
| 4,103 |
| 4,289 |
| 2,516 |
| 1,773 |
| 1961 | 1993 | 29 years |
| Lincoln Nursing Center | Lincolnton | NC | — |
| 39 |
| 3,309 |
| 197 |
| 39 |
| 3,506 |
| 3,545 |
| 2,879 |
| 666 |
| 1976 | 1986 | 35 years |
| Rehabilitation and Nursing Center of Monroe | Monroe | NC | — |
| 185 |
| 2,654 |
| 380 |
| 190 |
| 3,029 |
| 3,219 |
| 2,341 |
| 878 |
| 1963 | 1993 | 28 years |
| Sunnybrook Healthcare and Rehabilitation Specialists | Raleigh | NC | — |
| 187 |
| 3,409 |
| 372 |
| 191 |
| 3,777 |
| 3,968 |
| 3,445 |
| 523 |
| 1971 | 1991 | 25 years |
| Raleigh Rehabilitation & Healthcare Center | Raleigh | NC | — |
| 316 |
| 5,470 |
| 601 |
| 336 |
| 6,051 |
| 6,387 |
| 5,516 |
| 871 |
| 1969 | 1991 | 25 years |
| Guardian Care of Roanoke Rapids | Roanoke Rapids | NC | — |
| 339 |
| 4,132 |
| 1,290 |
| 339 |
| 5,422 |
| 5,761 |
| 4,152 |
| 1,609 |
| 1967 | 1991 | 25 years |
| Guardian Care of Rocky Mount | Rocky Mount | NC | — |
| 240 |
| 1,732 |
| 316 |
| 240 |
| 2,048 |
| 2,288 |
| 1,680 |
| 608 |
| 1975 | 1997 | 28.5 years |
| Cypress Pointe Rehabilitation and Health Care Centre | Wilmington | NC | — |
| 233 |
| 3,710 |
| 280 |
| 243 |
| 3,980 |
| 4,223 |
| 3,169 |
| 1,054 |
| 1966 | 1993 | 25 years |
| Silas Creek Manor | Winston-Salem | NC | — |
| 211 |
| 1,893 |
| 415 |
| 211 |
| 2,308 |
| 2,519 |
| 1,659 |
| 860 |
| 1966 | 1993 | 28.5 years |
| Guardian Care of Zebulon | Zebulon | NC | — |
| 179 |
| 1,933 |
| 181 |
| 201 |
| 2,092 |
| 2,293 |
| 1,597 |
| 696 |
| 1973 | 1993 | 29 years |
| Dover Rehabilitation and Living Center | Dover | NH | — |
| 355 |
| 3,797 |
| 382 |
| 355 |
| 4,179 |
| 4,534 |
| 3,960 |
| 574 |
| 1969 | 1990 | 25 years |
| Hanover Terrace Healthcare | Hanover | NH | — |
| 326 |
| 1,825 |
| 254 |
| 328 |
| 2,077 |
| 2,405 |
| 1,522 |
| 883 |
| 1969 | 1993 | 29 years |
| Las Vegas Healthcare and Rehabilitation Center | Las Vegas | NV | — |
| 454 |
| 1,018 |
| 187 |
| 454 |
| 1,205 |
| 1,659 |
| 818 |
| 841 |
| 1940 | 1992 | 30 years |
| Torrey Pines Care Center | Las Vegas | NV | — |
| 256 |
| 1,324 |
| 270 |
| 256 |
| 1,594 |
| 1,850 |
| 1,302 |
| 548 |
| 1971 | 1992 | 29 years |
| Hearthstone of Northern Nevada | Sparks | NV | — |
| 1,400 |
| 9,365 |
| — |
| 1,400 |
| 9,365 |
| 10,765 |
| 1,555 |
| 9,210 |
| 1988 | 2011 | 35 years |
| Wingate at St. Francis | Beacon | NY | — |
| 1,900 |
| 18,115 |
| — |
| 1,900 |
| 18,115 |
| 20,015 |
| 2,795 |
| 17,220 |
| 2002 | 2011 | 35 years |
| Garden Gate | Cheektowaga | NY | — |
| 760 |
| 15,643 |
| 30 |
| 760 |
| 15,673 |
| 16,433 |
| 2,483 |
| 13,950 |
| 1979 | 2011 | 35 years |
| Brookhaven | East Patchogue | NY | — |
| 1,100 |
| 25,840 |
| 30 |
| 1,100 |
| 25,870 |
| 26,970 |
| 3,725 |
| 23,245 |
| 1988 | 2011 | 35 years |
| Wingate at Dutchess | Fishkill | NY | — |
| 1,300 |
| 19,685 |
| — |
| 1,300 |
| 19,685 |
| 20,985 |
| 3,006 |
| 17,979 |
| 1996 | 2011 | 35 years |
| Autumn View | Hamburg | NY | — |
| 1,190 |
| 24,687 |
| 34 |
| 1,190 |
| 24,721 |
| 25,911 |
| 3,732 |
| 22,179 |
| 1983 | 2011 | 35 years |
| Wingate at Ulster | Highland | NY | — |
| 1,500 |
| 18,223 |
| — |
| 1,500 |
| 18,223 |
| 19,723 |
| 2,678 |
| 17,045 |
| 1998 | 2011 | 35 years |
| North Gate | North Tonawanda | NY | — |
| 1,010 |
| 14,801 |
| 40 |
| 1,010 |
| 14,841 |
| 15,851 |
| 2,406 |
| 13,445 |
| 1982 | 2011 | 35 years |
| Seneca | West Seneca | NY | — |
| 1,400 |
| 13,491 |
| 5 |
| 1,400 |
| 13,496 |
| 14,896 |
| 2,126 |
| 12,770 |
| 1974 | 2011 | 35 years |
| Harris Hill | Williamsville | NY | — |
| 1,240 |
| 33,574 |
| 33 |
| 1,240 |
| 33,607 |
| 34,847 |
| 4,815 |
| 30,032 |
| 1992 | 2011 | 35 years |
|
| | | | | | | | | | | | | | | | | | | | | | | |
| | Location | | Initial Cost to Company | | Gross Amount Carried at Close of Period | | | | | | |
| Property Name | City | State | Encumbrances | Land and Improvements | Buildings and Improvements | Costs Capitalized Subsequent to Acquisition | Land and Improvements | Buildings and Improvements | Total | Accumulated Depreciation | NBV | Year of Construction | Year Acquired | Life on Which Depreciation in Income Statement is Computed |
| Cambridge Health & Rehabilitation Center | Cambridge | OH | — |
| 108 |
| 2,642 |
| 304 |
| 108 |
| 2,946 |
| 3,054 |
| 2,483 |
| 571 |
| 1975 | 1993 | 25 years |
| Winchester Place Nursing and Rehabilitation Center | Canal Winchester | OH | — |
| 454 |
| 7,149 |
| 316 |
| 454 |
| 7,465 |
| 7,919 |
| 6,276 |
| 1,643 |
| 1974 | 1993 | 28 years |
| Chillicothe Nursing & Rehabilitation Center | Chillicothe | OH | — |
| 128 |
| 3,481 |
| 1,615 |
| 128 |
| 5,096 |
| 5,224 |
| 3,280 |
| 1,944 |
| 1976 | 1985 | 34 years |
| Burlington House | Cincinnati | OH | — |
| 918 |
| 5,087 |
| 4,309 |
| 974 |
| 9,340 |
| 10,314 |
| 1,984 |
| 8,330 |
| 1989 | 2004 | 35 years |
| Franklin Woods Nursing and Rehabilitation Center | Columbus | OH | — |
| 190 |
| 4,712 |
| 240 |
| 190 |
| 4,952 |
| 5,142 |
| 3,050 |
| 2,092 |
| 1986 | 1992 | 38 years |
| Minerva Park Nursing and Rehabilitation Center | Columbus | OH | — |
| 210 |
| 3,684 |
| (1,513 | ) | 107 |
| 2,274 |
| 2,381 |
| 1,888 |
| 493 |
| 1973 | 1997 | 45 years |
|
| | | | | | | | | | | | | | | | | | | | | | | |
| Coshocton Health & Rehabilitation Center | Coshocton | OH | — |
| 203 |
| 1,979 |
| 1,203 |
| 203 |
| 3,182 |
| 3,385 |
| 1,917 |
| 1,468 |
| 1974 | 1993 | 25 years |
| Olentangy Woods | Galion | OH | — |
| 540 |
| 6,324 |
| (1,223 | ) | 573 |
| 5,068 |
| 5,641 |
| 807 |
| 4,834 |
| 1967 | 2011 | 35 years |
| Lebanon Country Manor | Lebanon | OH | — |
| 105 |
| 3,617 |
| 140 |
| 105 |
| 3,757 |
| 3,862 |
| 2,687 |
| 1,175 |
| 1984 | 1986 | 43 years |
| Logan Health Care Center | Logan | OH | — |
| 169 |
| 3,750 |
| 403 |
| 169 |
| 4,153 |
| 4,322 |
| 3,175 |
| 1,147 |
| 1979 | 1991 | 30 years |
| Pickerington Nursing & Rehabilitation Center | Pickerington | OH | — |
| 312 |
| 4,382 |
| 374 |
| 312 |
| 4,756 |
| 5,068 |
| 2,942 |
| 2,126 |
| 1984 | 1992 | 37 years |
| Renaissance North | Warren | OH | — |
| 1,100 |
| 8,196 |
| (1,520 | ) | 1,116 |
| 6,660 |
| 7,776 |
| 4,641 |
| 3,135 |
| 1967 | 2011 | 35 years |
| Country Glenn | Washington Court House | OH | — |
| 490 |
| 13,460 |
| (585 | ) | 677 |
| 12,688 |
| 13,365 |
| 1,782 |
| 11,583 |
| 1984 | 2011 | 35 years |
| Avamere Rehab of Coos Bay | Coos Bay | OR | — |
| 1,920 |
| 3,394 |
| — |
| 1,920 |
| 3,394 |
| 5,314 |
| 597 |
| 4,717 |
| 1968 | 2011 | 35 years |
| Avamere Riverpark of Eugene | Eugene | OR | — |
| 1,960 |
| 17,622 |
| 502 |
| 1,960 |
| 18,124 |
| 20,084 |
| 2,587 |
| 17,497 |
| 1988 | 2011 | 35 years |
| Avamere Rehab of Eugene | Eugene | OR | — |
| 1,080 |
| 7,257 |
| 489 |
| 1,080 |
| 7,746 |
| 8,826 |
| 1,163 |
| 7,663 |
| 1966 | 2011 | 35 years |
| Avamere Rehab of Clackamas | Gladstone | OR | — |
| 820 |
| 3,844 |
| — |
| 820 |
| 3,844 |
| 4,664 |
| 652 |
| 4,012 |
| 1961 | 2011 | 35 years |
| Avamere Rehab of Hillsboro | Hillsboro | OR | — |
| 1,390 |
| 8,628 |
| — |
| 1,390 |
| 8,628 |
| 10,018 |
| 1,358 |
| 8,660 |
| 1973 | 2011 | 35 years |
| Avamere Rehab of Junction City | Junction City | OR | — |
| 590 |
| 5,583 |
| 269 |
| 590 |
| 5,852 |
| 6,442 |
| 863 |
| 5,579 |
| 1966 | 2011 | 35 years |
| Avamere Rehab of King City | King City | OR | — |
| 1,290 |
| 10,646 |
| — |
| 1,290 |
| 10,646 |
| 11,936 |
| 1,606 |
| 10,330 |
| 1975 | 2011 | 35 years |
| Avamere Rehab of Lebanon | Lebanon | OR | — |
| 980 |
| 12,954 |
| — |
| 980 |
| 12,954 |
| 13,934 |
| 1,891 |
| 12,043 |
| 1974 | 2011 | 35 years |
| Medford Rehabilitation and Healthcare Center | Medford | OR | — |
| 362 |
| 4,610 |
| 1,298 |
| 362 |
| 5,908 |
| 6,270 |
| 3,883 |
| 2,387 |
| 1961 | 1991 | 34 years |
| Newport Rehabilitation & Specialty Care Center | Newport | OR | — |
| 380 |
| 3,420 |
| 813 |
| 380 |
| 4,233 |
| 4,613 |
| 698 |
| 3,915 |
| 1997 | 2011 | 35 years |
| Mountain View | Oregon City | OR | — |
| 1,056 |
| 6,831 |
| — |
| 1,056 |
| 6,831 |
| 7,887 |
| 784 |
| 7,103 |
| 1977 | 2012 | 35 years |
| Avamere Crestview of Portland | Portland | OR | — |
| 1,610 |
| 13,942 |
| 1,288 |
| 1,610 |
| 15,230 |
| 16,840 |
| 2,074 |
| 14,766 |
| 1964 | 2011 | 35 years |
| Sunnyside Care Center | Salem | OR | — |
| 1,512 |
| 2,249 |
| 442 |
| 1,512 |
| 2,691 |
| 4,203 |
| 1,723 |
| 2,480 |
| 1981 | 1991 | 30 years |
| Avamere Twin Oaks of Sweet Home | Sweet Home | OR | — |
| 290 |
| 4,536 |
| — |
| 290 |
| 4,536 |
| 4,826 |
| 695 |
| 4,131 |
| 1972 | 2011 | 35 years |
| Balanced Care at Bloomsburg | Bloomsburg | PA | — |
| 621 |
| 1,371 |
| — |
| 621 |
| 1,371 |
| 1,992 |
| 359 |
| 1,633 |
| 1997 | 2006 | 35 years |
| Mountain View Nursing Home | Greensburg | PA | — |
| 580 |
| 12,817 |
| 1,124 |
| 580 |
| 13,941 |
| 14,521 |
| 2,009 |
| 12,512 |
| 1971 | 2011 | 35 years |
| Wyomissing Nursing and Rehabilitation Center | Reading | PA | — |
| 61 |
| 5,095 |
| 312 |
| 61 |
| 5,407 |
| 5,468 |
| 2,622 |
| 2,846 |
| 1966 | 1993 | 45 years |
|
| | | | | | | | | | | | | | | | | | | | | | | |
| | Location | | Initial Cost to Company | | Gross Amount Carried at Close of Period | | | | | | |
| Property Name | City | State | Encumbrances | Land and Improvements | Buildings and Improvements | Costs Capitalized Subsequent to Acquisition | Land and Improvements | Buildings and Improvements | Total | Accumulated Depreciation | NBV | Year of Construction | Year Acquired | Life on Which Depreciation in Income Statement is Computed |
| Oak Hill Nursing and Rehabilitation Center | Pawtucket | RI | — |
| 91 |
| 6,724 |
| 335 |
| 91 |
| 7,059 |
| 7,150 |
| 3,491 |
| 3,659 |
| 1966 | 1990 | 45 years |
| Hebert Nursing Home | Smithfield | RI | — |
| 1,939 |
| 6,621 |
| — |
| 1,939 |
| 6,621 |
| 8,560 |
| 527 |
| 8,033 |
| 1990 | 2015 | 35 years |
| Trinity Health and Rehabilitation Center | Woonsocket | RI | — |
| 1,771 |
| 14,959 |
| — |
| 1,771 |
| 14,959 |
| 16,730 |
| 710 |
| 16,020 |
| 1984 | 2015 | 35 years |
| Epic-Bayview | Beaufort | SC | — |
| 890 |
| 14,311 |
| — |
| 890 |
| 14,311 |
| 15,201 |
| 2,280 |
| 12,921 |
| 1970 | 2011 | 35 years |
| Dundee Nursing Home | Bennettsville | SC | — |
| 320 |
| 8,693 |
| — |
| 320 |
| 8,693 |
| 9,013 |
| 1,383 |
| 7,630 |
| 1958 | 2011 | 35 years |
| Epic-Conway | Conway | SC | — |
| 1,090 |
| 16,880 |
| — |
| 1,090 |
| 16,880 |
| 17,970 |
| 2,626 |
| 15,344 |
| 1975 | 2011 | 35 years |
| Mt. Pleasant Nursing Center | Mount Pleasant | SC | — |
| 1,810 |
| 9,079 |
| — |
| 1,810 |
| 9,079 |
| 10,889 |
| 1,489 |
| 9,400 |
| 1977 | 2011 | 35 years |
| Firesteel | Mitchell | SD | — |
| 690 |
| 15,360 |
| 411 |
| 690 |
| 15,771 |
| 16,461 |
| 2,346 |
| 14,115 |
| 1966 | 2011 | 35 years |
| Fountain Springs Healthcare Center | Rapid City | SD | — |
| 940 |
| 28,647 |
| 106 |
| 940 |
| 28,753 |
| 29,693 |
| 3,957 |
| 25,736 |
| 1989 | 2011 | 35 years |
| Masters Health Care Center | Algood | TN | — |
| 524 |
| 4,370 |
| 1,084 |
| 537 |
| 5,441 |
| 5,978 |
| 3,613 |
| 2,365 |
| 1981 | 1987 | 38 years |
| Brookewood Health Care Center | Decatur | TN | — |
| 470 |
| 4,617 |
| — |
| 470 |
| 4,617 |
| 5,087 |
| 804 |
| 4,283 |
| 1981 | 2011 | 35 years |
| Tri-State Comp Care Center | Harrogate | TN | — |
| 1,520 |
| 11,515 |
| — |
| 1,520 |
| 11,515 |
| 13,035 |
| 1,754 |
| 11,281 |
| 1990 | 2011 | 35 years |
| Madison Healthcare and Rehabilitation Center | Madison | TN | — |
| 168 |
| 1,445 |
| 516 |
| 168 |
| 1,961 |
| 2,129 |
| 1,344 |
| 785 |
| 1968 | 1992 | 29 years |
| Primacy Healthcare and Rehabilitation Center | Memphis | TN | — |
| 1,222 |
| 8,344 |
| 1,550 |
| 1,222 |
| 9,894 |
| 11,116 |
| 6,164 |
| 4,952 |
| 1980 | 1990 | 37 years |
| Brodie Ranch Rehab & Healthcare Center | Austin | TX | — |
| 570 |
| 10,552 |
| — |
| 570 |
| 10,552 |
| 11,122 |
| 323 |
| 10,799 |
| 2010 | 2015 | 35 years |
| Riverside Rehabilitation & Healthcare Center | Austin | TX | — |
| 764 |
| 6,567 |
| — |
| 764 |
| 6,567 |
| 7,331 |
| 203 |
| 7,128 |
| 2010 | 2015 | 35 years |
| West Oaks Rehabilitation and Healthcare Center - Austin | Austin | TX | — |
| 891 |
| 12,930 |
| — |
| 891 |
| 12,930 |
| 13,821 |
| 397 |
| 13,424 |
| 2006 | 2015 | 35 years |
| Bandera Rehabilitation and Healthcare Center | Bandera | TX | — |
| 742 |
| 5,376 |
| — |
| 742 |
| 5,376 |
| 6,118 |
| 167 |
| 5,951 |
| 2009 | 2015 | 35 years |
| Green Acres - Baytown | Baytown | TX | — |
| 490 |
| 9,104 |
| — |
| 490 |
| 9,104 |
| 9,594 |
| 1,376 |
| 8,218 |
| 1970 | 2011 | 35 years |
| Allenbrook Healthcare | Baytown | TX | — |
| 470 |
| 11,304 |
| — |
| 470 |
| 11,304 |
| 11,774 |
| 1,730 |
| 10,044 |
| 1975 | 2011 | 35 years |
| Rehabilitation and Healthcare Center at Baytown | Baytown | TX | — |
| 787 |
| 22,986 |
| — |
| 787 |
| 22,986 |
| 23,773 |
| 702 |
| 23,071 |
| 2000 | 2015 | 35 years |
| Cedar Bayou Rehabilitation and Healthcare Center | Baytown | TX | — |
| 1,035 |
| 28,958 |
| — |
| 1,035 |
| 28,958 |
| 29,993 |
| 884 |
| 29,109 |
| 2008 | 2015 | 35 years |
| Summer Place Nursing and Rehab | Beaumont | TX | — |
| 1,160 |
| 15,934 |
| — |
| 1,160 |
| 15,934 |
| 17,094 |
| 2,407 |
| 14,687 |
| 2009 | 2011 | 35 years |
| Green Acres - Center | Center | TX | — |
| 200 |
| 5,446 |
| — |
| 200 |
| 5,446 |
| 5,646 |
| 918 |
| 4,728 |
| 1972 | 2011 | 35 years |
| Regency Nursing Home | Clarksville | TX | — |
| 380 |
| 8,711 |
| — |
| 380 |
| 8,711 |
| 9,091 |
| 1,405 |
| 7,686 |
| 1989 | 2011 | 35 years |
| Park Manor - Conroe | Conroe | TX | — |
| 1,310 |
| 22,318 |
| — |
| 1,310 |
| 22,318 |
| 23,628 |
| 3,167 |
| 20,461 |
| 2001 | 2011 | 35 years |
| Trisun Care Center Westwood | Corpus Christi | TX | — |
| 440 |
| 8,624 |
| — |
| 440 |
| 8,624 |
| 9,064 |
| 1,335 |
| 7,729 |
| 1973 | 2011 | 35 years |
| Trisun Care Center River Ridge | Corpus Christi | TX | — |
| 890 |
| 7,695 |
| — |
| 890 |
| 7,695 |
| 8,585 |
| 1,270 |
| 7,315 |
| 1994 | 2011 | 35 years |
| Heritage Oaks West | Corsicana | TX | — |
| 510 |
| 15,806 |
| — |
| 510 |
| 15,806 |
| 16,316 |
| 2,376 |
| 13,940 |
| 1995 | 2011 | 35 years |
| Park Manor | DeSoto | TX | — |
| 1,080 |
| 14,484 |
| — |
| 1,080 |
| 14,484 |
| 15,564 |
| 2,232 |
| 13,332 |
| 1987 | 2011 | 35 years |
| Hill Country Care | Dripping Springs | TX | — |
| 740 |
| 3,973 |
| 16 |
| 756 |
| 3,973 |
| 4,729 |
| 670 |
| 4,059 |
| 1986 | 2011 | 35 years |
| Sandstone Ranch | El Paso | TX | — |
| 1,580 |
| 8,396 |
| — |
| 1,580 |
| 8,396 |
| 9,976 |
| 1,918 |
| 8,058 |
| 2010 | 2011 | 35 years |
|
| | | | | | | | | | | | | | | | | | | | | | | |
| | Location | | Initial Cost to Company | | Gross Amount Carried at Close of Period | | | | | | |
| Property Name | City | State | Encumbrances | Land and Improvements | Buildings and Improvements | Costs Capitalized Subsequent to Acquisition | Land and Improvements | Buildings and Improvements | Total | Accumulated Depreciation | NBV | Year of Construction | Year Acquired | Life on Which Depreciation in Income Statement is Computed |
| Pecan Tree Rehab & Healthcare | Gainesville | TX | — |
| 430 |
| 11,499 |
| — |
| 430 |
| 11,499 |
| 11,929 |
| 1,772 |
| 10,157 |
| 1990 | 2011 | 35 years |
| Pleasant Valley Health & Rehab | Garland | TX | — |
| 1,040 |
| 9,383 |
| — |
| 1,040 |
| 9,383 |
| 10,423 |
| 1,540 |
| 8,883 |
| 2008 | 2011 | 35 years |
| Upshur Manor | Gilmer | TX | — |
| 770 |
| 8,126 |
| — |
| 770 |
| 8,126 |
| 8,896 |
| 1,310 |
| 7,586 |
| 1990 | 2011 | 35 years |
| Beechnut Manor | Houston | TX | — |
| 1,080 |
| 12,030 |
| — |
| 1,080 |
| 12,030 |
| 13,110 |
| 1,895 |
| 11,215 |
| 1982 | 2011 | 35 years |
| Park Manor - Cypress Station | Houston | TX | — |
| 1,450 |
| 19,542 |
| — |
| 1,450 |
| 19,542 |
| 20,992 |
| 2,824 |
| 18,168 |
| 2003 | 2011 | 35 years |
| Park Manor of Westchase | Houston | TX | — |
| 2,760 |
| 16,715 |
| — |
| 2,760 |
| 16,715 |
| 19,475 |
| 2,465 |
| 17,010 |
| 2005 | 2011 | 35 years |
| Park Manor - Cyfair | Houston | TX | — |
| 1,720 |
| 14,717 |
| — |
| 1,720 |
| 14,717 |
| 16,437 |
| 2,182 |
| 14,255 |
| 1999 | 2011 | 35 years |
| West Oaks Rehabilitation and Health Care Center - Houston | Houston | TX | — |
| 1,225 |
| 25,507 |
| — |
| 1,225 |
| 25,507 |
| 26,732 |
| 780 |
| 25,952 |
| 1994 | 2015 | 35 years |
| Westwood Rehabilitation and Health Care Center | Houston | TX | — |
| 1,335 |
| 21,052 |
| — |
| 1,335 |
| 21,052 |
| 22,387 |
| 645 |
| 21,742 |
| 2006 | 2015 | 35 years |
| Green Acres - Humble | Humble | TX | — |
| 2,060 |
| 6,738 |
| — |
| 2,060 |
| 6,738 |
| 8,798 |
| 1,157 |
| 7,641 |
| 1972 | 2011 | 35 years |
| Park Manor - Humble | Humble | TX | — |
| 1,650 |
| 17,257 |
| — |
| 1,650 |
| 17,257 |
| 18,907 |
| 2,530 |
| 16,377 |
| 2003 | 2011 | 35 years |
| Green Acres - Huntsville | Huntsville | TX | — |
| 290 |
| 2,568 |
| — |
| 290 |
| 2,568 |
| 2,858 |
| 533 |
| 2,325 |
| 1968 | 2011 | 35 years |
| Legend Oaks Healthcare | Jacksonville | TX | — |
| 760 |
| 9,639 |
| — |
| 760 |
| 9,639 |
| 10,399 |
| 1,522 |
| 8,877 |
| 2006 | 2011 | 35 years |
| Avalon Kirbyville | Kirbyville | TX | — |
| 260 |
| 7,713 |
| — |
| 260 |
| 7,713 |
| 7,973 |
| 1,260 |
| 6,713 |
| 1987 | 2011 | 35 years |
| Millbrook Healthcare | Lancaster | TX | — |
| 750 |
| 7,480 |
| — |
| 750 |
| 7,480 |
| 8,230 |
| 1,300 |
| 6,930 |
| 2008 | 2011 | 35 years |
| Nexion Health at Linden | Linden | TX | — |
| 680 |
| 3,495 |
| — |
| 680 |
| 3,495 |
| 4,175 |
| 723 |
| 3,452 |
| 1968 | 2011 | 35 years |
| SWLTC Marshall Conroe | Marshall | TX | — |
| 810 |
| 10,093 |
| — |
| 810 |
| 10,093 |
| 10,903 |
| 1,636 |
| 9,267 |
| 2008 | 2011 | 35 years |
| McKinney Healthcare & Rehab | McKinney | TX | — |
| 1,450 |
| 10,345 |
| — |
| 1,450 |
| 10,345 |
| 11,795 |
| 1,668 |
| 10,127 |
| 2006 | 2011 | 35 years |
| Park Manor of McKinney | McKinney | TX | — |
| 1,540 |
| 11,049 |
| (2,345 | ) | 1,540 |
| 8,704 |
| 10,244 |
| 1,463 |
| 8,781 |
| 1993 | 2011 | 35 years |
| Midland Nursing Center | Midland | TX | — |
| 530 |
| 13,311 |
| — |
| 530 |
| 13,311 |
| 13,841 |
| 1,978 |
| 11,863 |
| 2008 | 2011 | 35 years |
| Park Manor of Quail Valley | Missouri City | TX | — |
| 1,920 |
| 16,841 |
| — |
| 1,920 |
| 16,841 |
| 18,761 |
| 2,476 |
| 16,285 |
| 2005 | 2011 | 35 years |
|
| | | | | | | | | | | | | | | | | | | | | | | | | | | | | | | | |
| Nexion Health at Mt. Pleasant | Mount Pleasant | TX | — |
| 520 |
| 5,050 |
| — |
| 520 |
| 5,050 |
| 5,570 |
| 946 |
| 4,624 |
| 1970 | 2011 | 35 years |
| The Meadows Nursing and Rehab | Orange | TX | — |
| 380 |
| 10,777 |
| — |
| 380 |
| 10,777 |
| 11,157 |
| 1,698 |
| 9,459 |
| 2006 | 2011 | 35 years |
| Paramount Rehabilitation and Health Care Center - Pasadena | Pasadena | TX | — |
| 1,539 |
| 26,585 |
| — |
| 1,539 |
| 26,585 |
| 28,124 |
| 814 |
| 27,310 |
| 2004 | 2015 | 35 years |
| Cypress Glen Nursing and Rehab | Port Arthur | TX | — |
| 1,340 |
| 14,142 |
| — |
| 1,340 |
| 14,142 |
| 15,482 |
| 2,248 |
| 13,234 |
| 2000 | 2011 | 35 years |
| Cypress Glen East | Port Arthur | TX | — |
| 490 |
| 10,663 |
| — |
| 490 |
| 10,663 |
| 11,153 |
| 1,663 |
| 9,490 |
| 1986 | 2011 | 35 years |
| Trisun Care Center Coastal Palms | Portland | TX | — |
| 390 |
| 8,548 |
| — |
| 390 |
| 8,548 |
| 8,938 |
| 1,334 |
| 7,604 |
| 1998 | 2011 | 35 years |
| Legend Oaks Healthcare San Angelo | San Angelo | TX | — |
| 870 |
| 12,282 |
| — |
| 870 |
| 12,282 |
| 13,152 |
| 1,886 |
| 11,266 |
| 2006 | 2011 | 35 years |
| Lakeside SNF | San Antonio | TX | — |
| 1,865 |
| 6,812 |
| — |
| 1,865 |
| 6,812 |
| 8,677 |
| 449 |
| 8,228 |
| 2012 | 2015 | 35 years |
| Mystic Park Rehabilitation Center | San Antonio | TX | — |
| 566 |
| 14,574 |
| — |
| 566 |
| 14,574 |
| 15,140 |
| 445 |
| 14,695 |
| 2004 | 2015 | 35 years |
| Paramount Rehabilitation and Health Care Center - San Antonio | San Antonio | TX | — |
| 808 |
| 24,951 |
| — |
| 808 |
| 24,951 |
| 25,759 |
| 762 |
| 24,997 |
| 2000 | 2015 | 35 years |
| San Pedro Manor | San Antonio | TX | — |
| 740 |
| 11,498 |
| (2,768 | ) | 740 |
| 8,730 |
| 9,470 |
| 1,456 |
| 8,014 |
| 1986 | 2011 | 35 years |
| Nexion Health at Sherman | Sherman | TX | — |
| 250 |
| 6,636 |
| — |
| 250 |
| 6,636 |
| 6,886 |
| 1,125 |
| 5,761 |
| 1971 | 2011 | 35 years |
| Avalon Trinity | Trinity | TX | — |
| 330 |
| 9,413 |
| — |
| 330 |
| 9,413 |
| 9,743 |
| 1,487 |
| 8,256 |
| 1985 | 2011 | 35 years |
| Renfro Nursing Home | Waxahachie | TX | — |
| 510 |
| 7,602 |
| — |
| 510 |
| 7,602 |
| 8,112 |
| 1,328 |
| 6,784 |
| 1976 | 2011 | 35 years |
|
| | | | | | | | | | | | | | | | | | | | | | | | | | | | | | | | |
| | Location | | Initial Cost to Company | | Gross Amount Carried at Close of Period | | | | | | |
| Property Name | City | State | Encumbrances | Land and Improvements | Buildings and Improvements | Costs Capitalized Subsequent to Acquisition | Land and Improvements | Buildings and Improvements | Total | Accumulated Depreciation | NBV | Year of Construction | Year Acquired | Life on Which Depreciation in Income Statement is Computed |
| Pointe Rehabilitation and Healthcare Center | Webster | TX | — |
| 1,194 |
| 20,176 |
| — |
| 1,194 |
| 20,176 |
| 21,370 |
| 618 |
| 20,752 |
| 2000 | 2015 | 35 years |
| Avalon Wharton | Wharton | TX | — |
| 270 |
| 5,107 |
| — |
| 270 |
| 5,107 |
| 5,377 |
| 938 |
| 4,439 |
| 1988 | 2011 | 35 years |
| Sleepy Hollow Manor | Annandale | VA | — |
| 7,210 |
| 13,562 |
| — |
| 7,210 |
| 13,562 |
| 20,772 |
| 2,315 |
| 18,457 |
| 1963 | 2011 | 35 years |
| The Cedars Nursing Home | Charlottesville | VA | — |
| 2,810 |
| 10,763 |
| — |
| 2,810 |
| 10,763 |
| 13,573 |
| 1,752 |
| 11,821 |
| 1964 | 2011 | 35 years |
| Emporia Manor | Emporia | VA | — |
| 620 |
| 7,492 |
| 15 |
| 635 |
| 7,492 |
| 8,127 |
| 1,261 |
| 6,866 |
| 1971 | 2011 | 35 years |
| Harbour Pointe Medical and Rehabilitation Center | Norfolk | VA | — |
| 427 |
| 4,441 |
| 2,399 |
| 427 |
| 6,840 |
| 7,267 |
| 4,004 |
| 3,263 |
| 1969 | 1993 | 28 years |
| Walnut Hill Convalescent Center | Petersburg | VA | — |
| 930 |
| 11,597 |
| — |
| 930 |
| 11,597 |
| 12,527 |
| 1,772 |
| 10,755 |
| 1972 | 2011 | 35 years |
| Battlefield Park Convalescent Center | Petersburg | VA | — |
| 1,010 |
| 12,489 |
| — |
| 1,010 |
| 12,489 |
| 13,499 |
| 1,887 |
| 11,612 |
| 1976 | 2011 | 35 years |
| Bellingham Health Care and Rehabilitation Services | Bellingham | WA | — |
| 441 |
| 3,824 |
| 308 |
| 441 |
| 4,132 |
| 4,573 |
| 3,178 |
| 1,395 |
| 1972 | 1993 | 28.5 years |
| St. Francis of Bellingham | Bellingham | WA | — |
| 1,740 |
| 23,581 |
| 1,975 |
| 1,740 |
| 25,556 |
| 27,296 |
| 3,340 |
| 23,956 |
| 1984 | 2011 | 35 years |
| Evergreen North Cascades | Bellingham | WA | — |
| 1,220 |
| 7,554 |
| — |
| 1,220 |
| 7,554 |
| 8,774 |
| 1,323 |
| 7,451 |
| 1999 | 2011 | 35 years |
| Queen Anne Healthcare | Seattle | WA | — |
| 570 |
| 2,750 |
| 228 |
| 570 |
| 2,978 |
| 3,548 |
| 2,398 |
| 1,150 |
| 1970 | 1993 | 29 years |
| Richmond Beach Rehab | Seattle | WA | — |
| 2,930 |
| 16,199 |
| 231 |
| 2,930 |
| 16,430 |
| 19,360 |
| 2,499 |
| 16,861 |
| 1993 | 2011 | 35 years |
| Avamere Olympic Rehab of Sequim | Sequim | WA | — |
| 590 |
| 16,896 |
| — |
| 590 |
| 16,896 |
| 17,486 |
| 2,488 |
| 14,998 |
| 1974 | 2011 | 35 years |
| Shelton Nursing Home | Shelton | WA | — |
| 510 |
| 8,570 |
| — |
| 510 |
| 8,570 |
| 9,080 |
| 1,302 |
| 7,778 |
| 1998 | 2011 | 35 years |
| Avamere Heritage Rehab of Tacoma | Tacoma | WA | — |
| 1,760 |
| 4,616 |
| — |
| 1,760 |
| 4,616 |
| 6,376 |
| 817 |
| 5,559 |
| 1968 | 2011 | 35 years |
| Avamere Skilled Nursing Tacoma | Tacoma | WA | — |
| 1,320 |
| 1,544 |
| 2,277 |
| 1,320 |
| 3,821 |
| 5,141 |
| 706 |
| 4,435 |
| 1972 | 2011 | 35 years |
| Avamere Transitional Care of Tacoma | Tacoma | WA | — |
| — |
| 2,313 |
| — |
| — |
| 2,313 |
| 2,313 |
| — |
| 2,313 |
| CIP | CIP | CIP (1) |
| Cascade Park Care Center | Vancouver | WA | — |
| 1,860 |
| 14,854 |
| 530 |
| 1,860 |
| 15,384 |
| 17,244 |
| 2,186 |
| 15,058 |
| 1991 | 2011 | 35 years |
| Eastview Medical and Rehabilitation Center | Antigo | WI | — |
| 200 |
| 4,047 |
| 380 |
| 200 |
| 4,427 |
| 4,627 |
| 3,929 |
| 698 |
| 1962 | 1991 | 28 years |
| Colony Oaks Care Center | Appleton | WI | — |
| 353 |
| 3,571 |
| 280 |
| 353 |
| 3,851 |
| 4,204 |
| 3,127 |
| 1,077 |
| 1967 | 1993 | 29 years |
| Mount Carmel Medical and Rehabilitation Center | Burlington | WI | — |
| 274 |
| 7,205 |
| 405 |
| 274 |
| 7,610 |
| 7,884 |
| 5,401 |
| 2,483 |
| 1971 | 1991 | 30 years |
| Chilton Health and Rehab | Chilton | WI | — |
| 440 |
| 6,114 |
| — |
| 440 |
| 6,114 |
| 6,554 |
| 3,162 |
| 3,392 |
| 1963 | 2011 | 35 years |
| Florence Villa | Florence | WI | — |
| 340 |
| 5,631 |
| — |
| 340 |
| 5,631 |
| 5,971 |
| 925 |
| 5,046 |
| 1970 | 2011 | 35 years |
| San Luis Medical and Rehabilitation Center | Green Bay | WI | — |
| 259 |
| 5,299 |
| 318 |
| 259 |
| 5,617 |
| 5,876 |
| 4,762 |
| 1,114 |
| 1968 | 1996 | 25 years |
| Western Village | Green Bay | WI | — |
| 1,310 |
| 4,882 |
| — |
| 1,310 |
| 4,882 |
| 6,192 |
| 921 |
| 5,271 |
| 1965 | 2011 | 35 years |
| Sheridan Medical Complex | Kenosha | WI | — |
| 282 |
| 4,910 |
| 225 |
| 282 |
| 5,135 |
| 5,417 |
| 4,756 |
| 661 |
| 1964 | 1991 | 25 years |
| Woodstock Health and Rehabilitation Center | Kenosha | WI | — |
| 562 |
| 7,424 |
| 458 |
| 562 |
| 7,882 |
| 8,444 |
| 7,450 |
| 994 |
| 1970 | 1991 | 25 years |
| North Ridge Medical and Rehabilitation Center | Manitowoc | WI | — |
| 206 |
| 3,785 |
| 190 |
| 206 |
| 3,975 |
| 4,181 |
| 3,212 |
| 969 |
| 1964 | 1992 | 29 years |
| Vallhaven Care Center | Neenah | WI | — |
| 337 |
| 5,125 |
| 368 |
| 337 |
| 5,493 |
| 5,830 |
| 4,418 |
| 1,412 |
| 1966 | 1993 | 28 years |
| Kennedy Park Medical & Rehabilitation Center | Schofield | WI | — |
| 301 |
| 3,596 |
| 399 |
| 301 |
| 3,995 |
| 4,296 |
| 3,823 |
| 473 |
| 1966 | 1982 | 29 years |
|
| | | | | | | | | | | | | | | | | | | | | | | | | | | | | | | | |
| | Location | | Initial Cost to Company | | Gross Amount Carried at Close of Period | | | | | | |
| Property Name | City | State | Encumbrances | Land and Improvements | Buildings and Improvements | Costs Capitalized Subsequent to Acquisition | Land and Improvements | Buildings and Improvements | Total | Accumulated Depreciation | NBV | Year of Construction | Year Acquired | Life on Which Depreciation in Income Statement is Computed |
| Greendale Health & Rehab | Sheboygan | WI | — |
| 880 |
| 1,941 |
| — |
| 880 |
| 1,941 |
| 2,821 |
| 418 |
| 2,403 |
| 1967 | 2011 | 35 years |
| South Shore Manor | St. Francis | WI | — |
| 630 |
| 2,300 |
| — |
| 630 |
| 2,300 |
| 2,930 |
| 397 |
| 2,533 |
| 1960 | 2011 | 35 years |
| Waukesha Springs (Westmoreland) | Waukesha | WI | — |
| 1,380 |
| 16,205 |
| — |
| 1,380 |
| 16,205 |
| 17,585 |
| 2,664 |
| 14,921 |
| 1973 | 2011 | 35 years |
| Colonial Manor Medical and Rehabilitation Center | Wausau | WI | — |
| 169 |
| 3,370 |
| 211 |
| 169 |
| 3,581 |
| 3,750 |
| 2,548 |
| 1,202 |
| 1964 | 1995 | 30 years |
| Wisconsin Dells Health & Rehab | Wisconsin Dells | WI | — |
| 730 |
| 18,994 |
| — |
| 730 |
| 18,994 |
| 19,724 |
| 2,683 |
| 17,041 |
| 1972 | 2011 | 35 years |
| Worthington Nursing and Rehab Center - Parkersburg WV | Parkersburg | WV | — |
| 870 |
| 7,460 |
| — |
| 870 |
| 7,460 |
| 8,330 |
| 393 |
| 7,937 |
| 1999 | 2015 | 35 years |
| Nicholas County Nursing and Rehabilitation - Richwood WV | Richwood | WV | — |
| 220 |
| 6,300 |
| — |
| 220 |
| 6,300 |
| 6,520 |
| 368 |
| 6,152 |
| 1980 | 2015 | 35 years |
| Mountain Towers Healthcare and Rehabilitation Center | Cheyenne | WY | — |
| 342 |
| 3,468 |
| 288 |
| 342 |
| 3,756 |
| 4,098 |
| 2,738 |
| 1,360 |
| 1964 | 1992 | 29 years |
| South Central Wyoming Healthcare and Rehabilitation | Rawlins | WY | — |
| 151 |
| 1,738 |
| 163 |
| 151 |
| 1,901 |
| 2,052 |
| 1,390 |
| 662 |
| 1955 | 1993 | 29 years |
| Wind River Healthcare and Rehabilitation Center | Riverton | WY | — |
| 179 |
| 1,559 |
| 175 |
| 179 |
| 1,734 |
| 1,913 |
| 1,223 |
| 690 |
| 1967 | 1992 | 29 years |
| Sage View Care Center | Rock Springs | WY | — |
| 287 |
| 2,392 |
| 158 |
| 287 |
| 2,550 |
| 2,837 |
| 2,292 |
| 545 |
| 1964 | 1993 | 30 years |
| TOTAL FOR SKILLED NURSING FACILITIES | | | — |
| 251,942 |
| 2,604,078 |
| 61,890 |
| 252,421 |
| 2,665,489 |
| 2,917,910 |
| 609,857 |
| 2,308,053 |
| | | |
| SPECIALTY HOSPITALS AND HEALTHCARE ASSETS | | | | | | | | | |
| | |
| | | |
| HealthBridge Children's Hospital | Orange | CA | — |
| 1,330 |
| 9,317 |
| — |
| 1,330 |
| 9,317 |
| 10,647 |
| 1,288 |
| 9,359 |
| 2000 | 2011 | 35 years |
| Gateway Rehabilitation Hospital at Florence | Florence | KY | — |
| 3,600 |
| 4,924 |
| — |
| 3,600 |
| 4,924 |
| 8,524 |
| 1,290 |
| 7,234 |
| 2001 | 2006 | 35 years |
| Baylor Orthopedic & Spine - Arlington TX | Arlington | TX | — |
| 349 |
| 29,408 |
| 814 |
| 349 |
| 30,222 |
| 30,571 |
| 839 |
| 29,732 |
| 2009 | 2015 | 35 years |
| The Ranch/Touchstone | Conroe | TX | — |
| 2,710 |
| 28,428 |
| 8,500 |
| 2,710 |
| 36,928 |
| 39,638 |
| 4,104 |
| 35,534 |
| 1992 | 2011 | 35 years |
| Highlands Regional Rehabilitation Hospital | El Paso | TX | — |
| 1,900 |
| 23,616 |
| — |
| 1,900 |
| 23,616 |
| 25,516 |
| 6,185 |
| 19,331 |
| 1999 | 2006 | 35 years |
| Houston Children's Hospital | Houston | TX | — |
| 1,800 |
| 15,770 |
| — |
| 1,800 |
| 15,770 |
| 17,570 |
| 2,154 |
| 15,416 |
| 1999 | 2011 | 35 years |
| Beacon Specialty Hospital | Spring | TX | — |
| 960 |
| 6,498 |
| — |
| 960 |
| 6,498 |
| 7,458 |
| 910 |
| 6,548 |
| 1995 | 2011 | 35 years |
| ResCare Tangram - Hacienda | Kingsbury | TX | — |
| 31 |
| 841 |
| 84 |
| 78 |
| 878 |
| 956 |
| 742 |
| 214 |
| N/A | 1998 | 20 years |
| ResCare Tangram - Texas Hill Country School | Maxwell | TX | — |
| 54 |
| 934 |
| 8 |
| 62 |
| 934 |
| 996 |
| 807 |
| 189 |
| N/A | 1998 | 20 years |
| ResCare Tangram - Chaparral | Maxwell | TX | — |
| 82 |
| 552 |
| 150 |
| 82 |
| 702 |
| 784 |
| 525 |
| 259 |
| N/A | 1998 | 20 years |
| ResCare Tangram - Sierra Verde & Roca Vista | Maxwell | TX | — |
| 20 |
| 910 |
| 56 |
| 20 |
| 966 |
| 986 |
| 801 |
| 185 |
| N/A | 1998 | 20 years |
| ResCare Tangram - 618 W. Hutchinson | San Marcos | TX | — |
| 32 |
| 95 |
| 794 |
| 126 |
| 795 |
| 921 |
| 686 |
| 235 |
| N/A | 1998 | 20 years |
| ResCare Tangram - Ranch | Seguin | TX | — |
| 147 |
| 806 |
| 113 |
| 147 |
| 919 |
| 1,066 |
| 724 |
| 342 |
| N/A | 1998 | 20 years |
| ResCare Tangram - Mesquite | Seguin | TX | — |
| 15 |
| 1,078 |
| 140 |
| 15 |
| 1,218 |
| 1,233 |
| 940 |
| 293 |
| N/A | 1998 | 20 years |
| ResCare Tangram - Loma Linda | Seguin | TX | — |
| 40 |
| 220 |
| — |
| 40 |
| 220 |
| 260 |
| 190 |
| 70 |
| N/A | 1998 | 20 years |
| TOTAL FOR SPECIALTY HOSPITALS AND HEALTHCARE ASSETS | | | — |
| 13,070 |
| 123,397 |
| 10,659 |
| 13,219 |
| 133,907 |
| 147,126 |
| 22,185 |
| 124,941 |
| | | |
|
| | | | | | | | | | | | | | | | | | | | | | | | | | | | | | | | |
| | Location | | Initial Cost to Company | | Gross Amount Carried at Close of Period | | | | | | |
| Property Name | City | State | Encumbrances | Land and Improvements | Buildings and Improvements | Costs Capitalized Subsequent to Acquisition | Land and Improvements | Buildings and Improvements | Total | Accumulated Depreciation | NBV | Year of Construction | Year Acquired | Life on Which Depreciation in Income Statement is Computed |
| SENIORS HOUSING COMMUNITIES AND CAMPUSES | | | | | | | | | |
| | |
| | | |
| Crownpointe of Carmel | Carmel | IN | — |
| 1,110 |
| 1,933 |
| — |
| 1,110 |
| 1,933 |
| 3,043 |
| 416 |
| 2,627 |
| 1998 | 2011 | 35 years |
| Azalea Hills | Floyds Knobs | IN | — |
| 2,370 |
| 8,708 |
| — |
| 2,370 |
| 8,708 |
| 11,078 |
| 1,330 |
| 9,748 |
| 2008 | 2011 | 35 years |
| Crown Pointe Senior Living Community | Greensburg | IN | — |
| 420 |
| 1,764 |
| — |
| 420 |
| 1,764 |
| 2,184 |
| 339 |
| 1,845 |
| 1999 | 2011 | 35 years |
| Summit West | Indianapolis | IN | — |
| 1,240 |
| 7,922 |
| — |
| 1,240 |
| 7,922 |
| 9,162 |
| 1,276 |
| 7,886 |
| 1998 | 2011 | 35 years |
| Lakeview Commons Assisted Living | Monticello | IN | — |
| 250 |
| 5,263 |
| — |
| 250 |
| 5,263 |
| 5,513 |
| 756 |
| 4,757 |
| 1999 | 2011 | 35 years |
| Drury Place at Alvamar | Lawrence | KS | — |
| 1,700 |
| 9,156 |
| 129 |
| 1,700 |
| 9,285 |
| 10,985 |
| 1,448 |
| 9,537 |
| 1995 | 2011 | 35 years |
| Drury Place at Salina | Salina | KS | — |
| 1,300 |
| 1,738 |
| 101 |
| 1,302 |
| 1,837 |
| 3,139 |
| 457 |
| 2,682 |
| 1989 | 2011 | 35 years |
| Drury Place Retirement Apartments | Topeka | KS | — |
| 390 |
| 6,217 |
| 104 |
| 394 |
| 6,317 |
| 6,711 |
| 966 |
| 5,745 |
| 1986 | 2011 | 35 years |
| Spring Lake | Shreveport | LA | — |
| 1,283 |
| 32,754 |
| — |
| 1,283 |
| 32,754 |
| 34,037 |
| 510 |
| 33,527 |
| 1984 | 2015 | 35 years |
| Wingate at Silver Lake | Kingston | MA | — |
| 3,330 |
| 20,624 |
| — |
| 3,330 |
| 20,624 |
| 23,954 |
| 3,371 |
| 20,583 |
| 1996 | 2011 | 35 years |
| Avamere court at Keizer | Keizer | OR | — |
| 1,260 |
| 30,183 |
| — |
| 1,260 |
| 30,183 |
| 31,443 |
| 4,482 |
| 26,961 |
| 1970 | 2011 | 35 years |
| The Pearl at Kruse Way | Lake Oswego | OR | — |
| 2,000 |
| 12,880 |
| 211 |
| 2,000 |
| 13,091 |
| 15,091 |
| 1,929 |
| 13,162 |
| 2005 | 2011 | 35 years |
| Avamere at Three Fountains | Medford | OR | — |
| 2,340 |
| 33,187 |
| 1,638 |
| 2,340 |
| 34,825 |
| 37,165 |
| 4,869 |
| 32,296 |
| 1974 | 2011 | 35 years |
| Heritage Oaks Retirement Village | Corsicana | TX | — |
| 790 |
| 30,636 |
| — |
| 790 |
| 30,636 |
| 31,426 |
| 4,403 |
| 27,023 |
| 1996 | 2011 | 35 years |
| Lakeside ALF | San Antonio | TX | — |
| 1,764 |
| 13,365 |
| — |
| 1,764 |
| 13,365 |
| 15,129 |
| 494 |
| 14,635 |
| 2013 | 2015 | 35 years |
| TOTAL FOR SENIORS HOUSING COMMUNITIES AND CAMPUSES | | | — |
| 21,547 |
| 216,330 |
| 2,183 |
| 21,553 |
| 218,507 |
| 240,060 |
| 27,046 |
| 213,014 |
| | | |
| TOTAL FOR ALL PROPERTIES | | | $ | — |
| $ | 286,559 |
| $ | 2,943,805 |
| $ | 74,732 |
| $ | 287,193 |
| $ | 3,017,903 |
| $ | 3,305,096 |
| $ | 659,088 |
| $ | 2,646,008 |
| | | |
(1) Represents a property under construction.
ITEM 9. Changes in and Disagreements with Accountants on Accounting and Financial Disclosure
None.
ITEM 9A. Controls and Procedures
Evaluation of Disclosure Controls and Procedures
As required by Rules 13a-15(b) and 15d-15(b) of the Exchange Act, our management, with the participation of our Chief Executive Officer and Chief Financial Officer, has evaluated the effectiveness of our disclosure controls and procedures as of December 31, 2015. Based on that evaluation, our Chief Executive Officer and Chief Financial Officer concluded that our disclosure controls and procedures (as defined in Rules 13a-15(e) and 15d-15(e) under the Exchange Act) were effective as of December 31, 2015.
Internal Control over Financial Reporting
The information set forth under “Management Report on Internal Control over Financial Reporting” included in Part II, Item 8 of this Annual Report on Form 10-K is incorporated by reference into this Item 9A.
Internal Control Changes
During the fourth quarter of 2015, there were no changes in our internal control over financial reporting (as defined in Rules 13a-15(f) and 15d-15(f) under the Exchange Act) that have materially affected, or are reasonably likely to materially affect, our internal control over financial reporting.
ITEM 9B. Other Information
Not applicable.
PART III
ITEM 10. Directors, Executive Officers and Corporate Governance
The information required by this Item 10 is incorporated by reference to the material under the headings “Corporate Governance—Proposal No. 1: Election of Directors,” “Executive Compensation—Executive Officers,” “Stock Ownership—Section 16(a) Beneficial Ownership Reporting Compliance,” “Corporate Governance—The Board’s Role and Responsibilities—Governance Policies” and “Corporate Governance—Committees—Audit and Compliance Committee” in our definitive Proxy Statement for the 2016 Annual Meeting of Stockholders, which we will file with the SEC not later than April 30, 2016.
ITEM 11. Executive Compensation
The information required by this Item 11 is incorporated by reference to the material under the headings “Executive Compensation,” “Corporate Governance—Director Compensation,” “Corporate Governance—The Board’s Roles and Responsibilities—Compensation Risk Assessment,” “Corporate Governance—Board Structure and Processes—Compensation Committee Interlocks and Insider Participation,” and “Corporate Governance—Committees—Compensation Committee” in our definitive Proxy Statement for the 2016 Annual Meeting of Stockholders, which we will file with the SEC not later than April 30, 2016.
ITEM 12. Security Ownership of Certain Beneficial Owners and Management and Related Stockholder Matters
The information required by this Item 12 is incorporated by reference to the material under the headings “Equity Compensation Plan Information” and “Stock Ownership” in our definitive Proxy Statement for the 2016 Annual Meeting of Stockholders, which we will file with the SEC not later than April 30, 2016.
ITEM 13. Certain Relationships and Related Transactions, and Director Independence
The information required by this Item 13 is incorporated by reference to the material under the headings “Corporate Governance—The Board’s Role and Responsibilities—Transactions with Related Persons,” “Corporate Governance—Proposal No. 1: Election of Directors—Director Independence,” “Corporate Governance—Committees—Audit and Compliance
Committee,” “Corporate Governance—Committees—Compensation Committee” and “Corporate Governance—Committees—Nominating and Governance Committee” in our definitive Proxy Statement for the 2016 Annual Meeting of Stockholders, which we will file with the SEC not later than April 30, 2016.
ITEM 14. Principal Accountant Fees and Services
The information required by this Item 14 is incorporated by reference to the material under the heading “Audit Committee Matters—Audit and Non-Audit Fees” in our definitive Proxy Statement for the 2016 Annual Meeting of Stockholders, which we will file with the SEC not later than April 30, 2016.
PART IV
ITEM 15. Exhibits and Financial Statement Schedules
Financial Statements and Financial Statement Schedules
The following documents have been included in Part II, Item 8 of this Annual Report on Form 10-K:
|
| |
| | Page |
| Management Report on Internal Control over Financial Reporting | |
| Report of Independent Registered Public Accounting Firm | |
| Combined Consolidated Balance Sheets as of December 31, 2015 and 2014 | |
| Combined Consolidated Statements of Income for the years ended December 31, 2015, 2014 and 2013 | |
| Combined Consolidated Statements of Equity for the years ended December 31, 2015, 2014 and 2013 | |
| Combined Consolidated Statements of Cash Flows for the years ended December 31, 2015, 2014 and 2013 | |
| Notes to Combined Consolidated Financial Statements | |
| Combined Consolidated Financial Statement Schedules | |
| Schedule II—Valuation and Qualifying Accounts | |
| Schedule III—Real Estate and Accumulated Depreciation | |
All other schedules have been omitted because they are inapplicable, not required or the information is included elsewhere in the combined consolidated financial statements or notes thereto.
Exhibits
|
| | | | |
Exhibit Number | | Description of Document | | Location of Document |
| | | | | |
| 2.1 | | Separation and Distribution Agreement, dated as of August 17, 2015, by and between Ventas, Inc. and Care Capital Properties, Inc. | | Incorporated by reference to Exhibit 2.1 to our Current Report on Form 8-K, filed on August 21, 2015. |
| | | | | |
| 3.1 | | Amended and Restated Certificate of Incorporation of Care Capital Properties, Inc. | | Incorporated by reference to Exhibit 3.1 to our Current Report on Form 8-K, filed on August 21, 2015. |
| | | | | |
| 3.2 | | Amended and Restated Bylaws of Care Capital Properties, Inc. | | Incorporated by reference to Exhibit 3.2 to our Current Report on Form 8-K, filed on August 21, 2015. |
| | | | | |
| 4.1 | | Specimen common stock certificate. | | Incorporated by reference to Exhibit 4.1 to our Registration Statement on Form S-8 filed on August 17, 2015 (File No. 333-206433). |
| | | | | |
| 10.1 | | Second Amended and Restated Agreement of Limited Partnership of Care Capital Properties, LP. | | Filed herewith. |
| | | | | |
| 10.2 | | Transition Services Agreement, dated as of August 17, 2015, by and between Ventas, Inc. and Care Capital Properties, Inc. | | Incorporated by reference to Exhibit 10.1 to our Current Report on Form 8-K, filed on August 21, 2015. |
| | | | | |
| 10.3 | | Tax Matters Agreement, dated as of August 17, 2015, by and between Ventas, Inc. and Care Capital Properties, Inc. | | Incorporated by reference to Exhibit 10.2 to our Current Report on Form 8-K, filed on August 21, 2015. |
| | | | | |
| 10.4 | | Employee Matters Agreement, dated as of August 17, 2015, by and between Ventas, Inc. and Care Capital Properties, Inc. | | Incorporated by reference to Exhibit 10.3 to our Current Report on Form 8-K, filed on August 21, 2015. |
| | | | | |
| 10.5 | | Credit and Guaranty Agreement, dated as of August 17, 2015, by and among Care Capital Properties, LP, as Borrower, Care Capital Properties, Inc., as Guarantor, the Lenders identified therein, and Bank of America, N.A., as Administrative Agent, Swing Line Lender, L/C Issuer and Alternative Currency Fronting Lender. | | Incorporated by reference to Exhibit 10.4 to our Current Report on Form 8-K, filed on August 21, 2015. |
| | | | | |
| 10.6 | | Term Loan and Guaranty Agreement, dated as of January 29, 2016, by and among Care Capital Properties, LP, as Borrower, Care Capital Properties, Inc., as Guarantor, the Lenders identified therein, and Bank of America, N.A., as Administrative Agent, Swing Line Lender, L/C Issuer and Alternative Currency Fronting Lender. | | Incorporated by reference to Exhibit 10.1 to our Current Report on Form 8-K, filed on February 2, 2016. |
| | | | | |
| 10.7.1* | | Care Capital Properties, Inc. 2015 Incentive Plan. | | Incorporated by reference to Exhibit 10.6 to our Current Report on Form 8-K, filed on August 21, 2015. |
| | | | | |
| 10.7.2* | | Form of Stock Option Agreement (Employee) under the Care Capital Properties, Inc. 2015 Incentive Plan. | | Filed herewith. |
| | | | | |
| 10.7.3* | | Form of Restricted Stock Agreement (Employee) under the Care Capital Properties, Inc. 2015 Incentive Plan. | | Filed herewith. |
| | | | | |
| 10.7.4* | | Form of Performance Restricted Stock Unit Agreement (Employee) under the Care Capital Properties, Inc. 2015 Incentive Plan. | | Filed herewith. |
| | | | | |
| 10.7.5* | | Form of Restricted Stock Agreement (Director) under the Care Capital Properties, Inc. 2015 Incentive Plan. | | Filed herewith. |
|
| | | | |
Exhibit Number | | Description of Document | | Location of Document |
| | | | | |
| 10.7.6* | | Form of Restricted Stock Unit Agreement (Director) under the Care Capital Properties, Inc. 2015 Incentive Plan. | | Filed herewith. |
| | | | | |
| 10.8.1* | | Care Capital Properties, Inc. Non-Employee Directors Deferred Stock Compensation Plan. | | Incorporated by reference to Exhibit 10.3.1 to our Registration Statement on Form S-8 filed on August 17, 2015 (File No. 333-206433). |
| | | | | |
| 10.8.2* | | Deferral Election Form under the Care Capital Properties, Inc. Non-Employee Directors Deferred Stock Compensation Plan. | | Incorporated by reference to Exhibit 10.3.2 to our Registration Statement on Form S-8 filed on August 17, 2015 (File No. 333-206433). |
| | | | | |
| 10.9* | | Employment Agreement dated as of August 17, 2015 between Care Capital Properties, Inc. and Raymond J. Lewis. | | Incorporated by reference to Exhibit 10.7 to our Current Report on Form 8-K, filed on August 21, 2015. |
| | | | | |
| 10.10* | | Form of Employee Protection and Noncompetition Agreement dated as of August 17, 2015 between Care Capital Properties, Inc. and each of Timothy A. Doman, Lori B. Wittman and Kristen M. Benson. | | Incorporated by reference to Exhibit 10.8 to our Current Report on Form 8-K, filed on August 21, 2015. |
| | | | | |
| 10.11* | | Care Capital Properties, Inc. Employee and Director Stock Purchase Plan. | | Incorporated by reference to Exhibit 10.2 to our Registration Statement on Form S-8 filed on August 17, 2015 (File No. 333-206433). |
| | | | | |
| 21 |
| Subsidiaries of Care Capital Properties, Inc. |
| Filed herewith. |
|
| |
| |
| 23.1 |
| Consent of KPMG LLP. |
| Filed herewith. |
| | | | | |
| 23.2 | | Consent of BKD, LLP. | | Filed herewith. |
|
|
|
|
|
| 31.1 |
| Certification of Raymond J. Lewis, Chief Executive Officer, pursuant to Rule 13a-14(a) under the Exchange Act. |
| Filed herewith. |
|
|
|
|
|
| 31.2 |
| Certification of Lori B. Wittman, Executive Vice President and Chief Financial Officer, pursuant to Rule 13a-14(a) under the Exchange Act. |
| Filed herewith. |
|
|
|
|
|
| 32.1 |
| Certification of Raymond J. Lewis, Chief Executive Officer, pursuant to Rule 13a-14(b) under the Exchange Act and 18 U.S.C. 1350. |
| Filed herewith. |
|
|
|
|
|
| 32.2 |
| Certification of Lori B. Wittman, Executive Vice President and Chief Financial Officer, pursuant to Rule 13a-14(b) under the Exchange Act and 18 U.S.C. 1350. |
| Filed herewith. |
|
|
|
|
|
| 99.1 | | Audited Consolidated Financial Statements of Senior Care Centers, LLC as of and for the years ended December 31, 2015, 2014 and 2013. | | Filed herewith. |
| | | | | |
| 101 |
| Interactive Data File. |
| Filed herewith. |
| |
| * | Management contract or compensatory plan or arrangement required to be filed as an exhibit pursuant to Item 15(b) of Form 10-K. |
SIGNATURES
Pursuant to the requirements of Section 13 or 15(d) of the Securities Exchange Act of 1934, the Registrant has duly caused this Report to be signed on its behalf by the undersigned, thereunto duly authorized.
Date: March 10, 2016
|
| | | |
| | | CARE CAPITAL PROPERTIES, INC. |
| | | | |
| | | By: | /s/ Raymond J. Lewis |
| | | | Raymond J. Lewis
Chief Executive Officer |
Pursuant to the requirements of the Securities Exchange Act of 1934, this Report has been signed below by the following persons on behalf of the Registrant and in the capacities and on the dates indicated.
|
| | |
| Signature | Title | Date |
| | | |
| /s/ Raymond J. Lewis | Chief Executive Officer (Principal Executive Officer) | March 10, 2016 |
| Raymond J. Lewis | | |
| | | |
| /s/ Lori B. Wittman | Executive Vice President and Chief Financial Officer (Principal Financial Officer) | March 10, 2016 |
| Lori B. Wittman | | |
| | | |
| /s/ James L. Majernik | Vice President, Accounting (Principal Accounting Officer) | March 10, 2016 |
| James L. Majernik | | |
| | | |
| /s/ Douglas Crocker II | Director | March 10, 2016 |
| Douglas Crocker II | | |
| | | |
| /s/ John S. Gates, Jr. | Director | March 10, 2016 |
| John S. Gates, Jr. | | |
| | | |
| /s/ Ronald G. Geary | Director | March 10, 2016 |
| Ronald G. Geary | | |
| | | |
| /s/ Jeffrey A. Malehorn | Director | March 10, 2016 |
| Jeffrey A. Malehorn | | |
| | | |
| /s/ Dale A. Reiss | Director | March 10, 2016 |
| Dale A. Reiss | | |
| | | |
| /s/ John L. Workman | Director | March 10, 2016 |
| John L. Workman | | |
| | | |
EXHIBIT INDEX
|
| | | | |
Exhibit Number | | Description of Document | | Location of Document |
| | | | | |
| 2.1 | | Separation and Distribution Agreement, dated as of August 17, 2015, by and between Ventas, Inc. and Care Capital Properties, Inc. | | Incorporated by reference to Exhibit 2.1 to our Current Report on Form 8-K, filed on August 21, 2015. |
| | | | | |
| 3.1 | | Amended and Restated Certificate of Incorporation of Care Capital Properties, Inc. | | Incorporated by reference to Exhibit 3.1 to our Current Report on Form 8-K, filed on August 21, 2015. |
| | | | | |
| 3.2 | | Amended and Restated Bylaws of Care Capital Properties, Inc. | | Incorporated by reference to Exhibit 3.2 to our Current Report on Form 8-K, filed on August 21, 2015. |
| | | | | |
| 4.1 | | Specimen common stock certificate. | | Incorporated by reference to Exhibit 4.1 to our Registration Statement on Form S-8 filed on August 17, 2015 (File No. 333-206433). |
| | | | | |
| 10.1 | | Second Amended and Restated Agreement of Limited Partnership of Care Capital Properties, LP. | | Filed herewith. |
| | | | | |
| 10.2 | | Transition Services Agreement, dated as of August 17, 2015, by and between Ventas, Inc. and Care Capital Properties, Inc. | | Incorporated by reference to Exhibit 10.1 to our Current Report on Form 8-K, filed on August 21, 2015. |
| | | | | |
| 10.3 | | Tax Matters Agreement, dated as of August 17, 2015, by and between Ventas, Inc. and Care Capital Properties, Inc. | | Incorporated by reference to Exhibit 10.2 to our Current Report on Form 8-K, filed on August 21, 2015. |
| | | | | |
| 10.4 | | Employee Matters Agreement, dated as of August 17, 2015, by and between Ventas, Inc. and Care Capital Properties, Inc. | | Incorporated by reference to Exhibit 10.3 to our Current Report on Form 8-K, filed on August 21, 2015. |
| | | | | |
| 10.5 | | Credit and Guaranty Agreement, dated as of August 17, 2015, by and among Care Capital Properties, LP, as Borrower, Care Capital Properties, Inc., as Guarantor, the Lenders identified therein, and Bank of America, N.A., as Administrative Agent, Swing Line Lender, L/C Issuer and Alternative Currency Fronting Lender. | | Incorporated by reference to Exhibit 10.4 to our Current Report on Form 8-K, filed on August 21, 2015. |
| | | | | |
| 10.6 | | Term Loan and Guaranty Agreement, dated as of January 29, 2016, by and among Care Capital Properties, LP, as Borrower, Care Capital Properties, Inc., as Guarantor, the Lenders identified therein, and Bank of America, N.A., as Administrative Agent, Swing Line Lender, L/C Issuer and Alternative Currency Fronting Lender. | | Incorporated by reference to Exhibit 10.1 to our Current Report on Form 8-K, filed on February 2, 2016. |
| | | | | |
| 10.7.1* | | Care Capital Properties, Inc. 2015 Incentive Plan. | | Incorporated by reference to Exhibit 10.6 to our Current Report on Form 8-K, filed on August 21, 2015. |
| | | | | |
| 10.7.2* | | Form of Stock Option Agreement (Employee) under the Care Capital Properties, Inc. 2015 Incentive Plan. | | Filed herewith. |
| | | | | |
| 10.7.3* | | Form of Restricted Stock Agreement (Employee) under the Care Capital Properties, Inc. 2015 Incentive Plan. | | Filed herewith. |
| | | | | |
| 10.7.4* | | Form of Performance Restricted Stock Unit Agreement (Employee) under the Care Capital Properties, Inc. 2015 Incentive Plan. | | Filed herewith. |
| | | | | |
| 10.7.5* | | Form of Restricted Stock Agreement (Director) under the Care Capital Properties, Inc. 2015 Incentive Plan. | | Filed herewith. |
| | | | | |
|
| | | | |
Exhibit Number | | Description of Document | | Location of Document |
| 10.7.6* | | Form of Restricted Stock Unit Agreement (Director) under the Care Capital Properties, Inc. 2015 Incentive Plan. | | Filed herewith. |
| | | | | |
| 10.8.1* | | Care Capital Properties, Inc. Non-Employee Directors Deferred Stock Compensation Plan. | | Incorporated by reference to Exhibit 10.3.1 to our Registration Statement on Form S-8 filed on August 17, 2015 (File No. 333-206433). |
| | | | | |
| 10.8.2* | | Deferral Election Form under the Care Capital Properties, Inc. Non-Employee Directors Deferred Stock Compensation Plan. | | Incorporated by reference to Exhibit 10.3.2 to our Registration Statement on Form S-8 filed on August 17, 2015 (File No. 333-206433). |
| | | | | |
| 10.9* | | Employment Agreement dated as of August 17, 2015 between Care Capital Properties, Inc. and Raymond J. Lewis. | | Incorporated by reference to Exhibit 10.7 to our Current Report on Form 8-K, filed on August 21, 2015. |
| | | | | |
| 10.10* | | Form of Employee Protection and Noncompetition Agreement dated as of August 17, 2015 between Care Capital Properties, Inc. and each of Timothy A. Doman, Lori B. Wittman and Kristen M. Benson. | | Incorporated by reference to Exhibit 10.8 to our Current Report on Form 8-K, filed on August 21, 2015. |
| | | | | |
| 10.11* | | Care Capital Properties, Inc. Employee and Director Stock Purchase Plan. | | Incorporated by reference to Exhibit 10.2 to our Registration Statement on Form S-8 filed on August 17, 2015 (File No. 333-206433). |
| | | | | |
| 21 |
| Subsidiaries of Care Capital Properties, Inc. |
| Filed herewith. |
|
| |
| |
| 23.1 |
| Consent of KPMG LLP. |
| Filed herewith. |
| | | | | |
| 23.2 | | Consent of BKD, LLP. | | Filed herewith. |
|
|
|
|
|
| 31.1 |
| Certification of Raymond J. Lewis, Chief Executive Officer, pursuant to Rule 13a-14(a) under the Exchange Act. |
| Filed herewith. |
|
|
|
|
|
| 31.2 |
| Certification of Lori B. Wittman, Executive Vice President and Chief Financial Officer, pursuant to Rule 13a-14(a) under the Exchange Act. |
| Filed herewith. |
|
|
|
|
|
| 32.1 |
| Certification of Raymond J. Lewis, Chief Executive Officer, pursuant to Rule 13a-14(b) under the Exchange Act and 18 U.S.C. 1350. |
| Filed herewith. |
|
|
|
|
|
| 32.2 |
| Certification of Lori B. Wittman, Executive Vice President and Chief Financial Officer, pursuant to Rule 13a-14(b) under the Exchange Act and 18 U.S.C. 1350. |
| Filed herewith. |
| | | | | |
| 99.1 | | Audited Consolidated Financial Statements of Senior Care Centers, LLC as of and for the years ended December 31, 2015, 2014 and 2013. | | Filed herewith. |
|
|
|
|
|
| 101 |
| Interactive Data File. |
| Filed herewith. |
| |
| * | Management contract or compensatory plan or arrangement required to be filed as an exhibit pursuant to Item 15(b) of Form 10-K. |