Filed Pursuant to Rule 253(g)(2)
File No. 024-10659
RISE COMPANIES CORP.
SUPPLEMENT NO. 3 DATED JANUARY 16, 2020
TO THE OFFERING CIRCULAR DATED JULY 24, 2019
This document supplements, and should be read in conjunction with, the offering circular of Rise Companies Corp. (the “Company”, “we”, “our” or “us”), dated July 24, 2019 and filed by us with the Securities and Exchange Commission (the “Commission”) on July 25, 2019 (the “Offering Circular”). Unless otherwise defined in this supplement, capitalized terms used in this supplement shall have the same meanings as set forth in the Offering Circular.
The purpose of this supplement is to:
| · | Disclose the letter to investors dated January 16, 2020 and corresponding blog post |
Shareholder Letter dated January 16, 2020
2019 year-end letter to investors
One year ago, we began ourannual letter noting the relative strength of our 2018 Fundrise overall platform performance of 9.11%¹ versus that of the broader stock market at -5.13%² (as measured by the Vanguard Total Stock Market ETF) and public REITs at -5.95%² (as measured by the Vanguard Real Estate ETF).
We discussed our concerns around the stability of the economy and the potential headwinds that would result from the Fed’s determination to normalize monetary policy by unloading its balance sheet while simultaneously raising interest rates. Consequently, we outlined our intentions to deploy into what we felt were more conservative investment assets with better intrinsic value.
As is often the case, the future can be surprising.
Not only did the Fed not raise rates in 2019, they instead made a sharp 180-degree course change, lowering the target Fed funds rate three times and re-initiating a new form of quantitative easing by providing their balance sheet liquidity directly into the financial system’s repurchase (repo) markets.
The result… the stock market was up a whopping 30.80%² over the last year, reaching all-time record highs, with similar performance from public REITs. At the same time, Fundrise ended 2019 with an overall net return of 9.47%¹.
Of course 9.47% is not 30.80%. And that, in many ways, is the point.
In 2018, stocks produced an approximate -5% return while Fundrise returned just over 9%. Last year the stock market produced an approximate 31% return while Fundrise returned over 9% again.
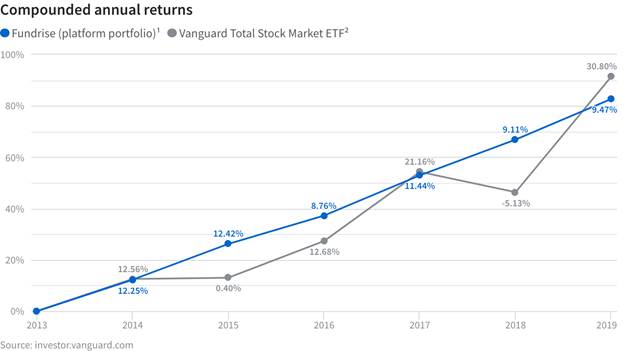
| Year | Fundrise (platform portfolio)¹ | Vanguard Total Stock Market ETF² | Vanguard Real Estate ETF² |
| 2014 | 12.25% | 12.56% | 30.29% |
| 2015 | 12.42% | 0.40% | 2.37% |
| 2016 | 8.76% | 12.68% | 8.53% |
| 2017 | 11.44% | 21.16% | 4.95% |
| 2018 | 9.11% | -5.13% | -5.95% |
| 2019 | 9.47% | 30.80% | 28.91% |
| 6-yr average | 10.57% | 11.43% | 10.72% |
To be clear, the overall return across the Fundrise platform is not necessarily representative of any individual investor’s performance. The performance of your account is likely to vary depending on when you invested and the allocation of your portfolio (learn more abouthow returns work on Fundrise).
From the beginning, we’ve sought to provide investors with better, more consistent returns over the long term, so we structure our investments with the intention to do just that. In fact, it’s highly unlikely that the way in which we invest would return 30% in a single year. To achieve such short-term returns in real estate would require taking on what we believe to be an unadvisable level of risk. So, while the investments we pursue are unlikely to return 30% annually, we believe that even in a downturn they are just as unlikely to risk a comparable principal loss by swinging wildly in the opposite direction.
More consistent over the long term. That’s the operating principle.
Because our goal is long-term consistency, we devote a considerable amount of time and energy to identifying and understanding the macroeconomic drivers that have the greatest probability of impacting the broader real estate market for the next several years to a decade.
Our view: consensus-driven asset now priced even further out of line with economic fundamentals
Looking ahead, we continue to have a very similar outlook as we’ve had in years past. Asset prices, by almost any measure, are more expensive today than they were 12 months ago. To use the stock market as a convenient example, you’d be hard pressed to ignore the fact that prices were up nearly 30% in 2019, while earnings remained essentially flat.
We were hesitant to be a long-term buyer of consensus-driven assets at last year’s prices. Now we’re only that much more resistant to pay a 30% higher price for the same assets today.
Some may call this approach too conservative, but our belief is that the investors who have achieved consistent success spanning multiple decades tend to spend more time protecting against the downside than they do regretting the upside they may have missed.
As those who have been with us over the years have undoubtedly heard us say before:
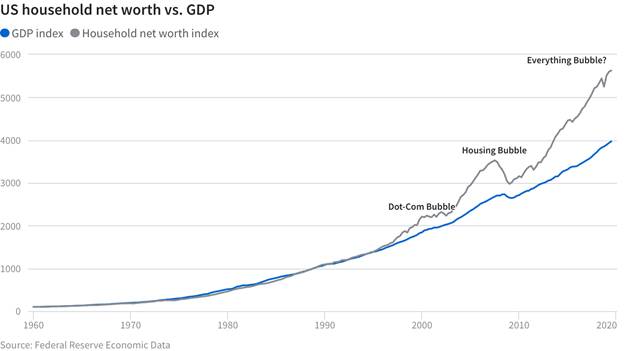
We are wary when broader market sentiment is overwhelmingly positive and caution against assuming current trends cannot reverse unexpectedly, especially when everyone starts to believe they won’t.
It’s entirely reasonable that prices may remain elevated for an extended period of time due to a permanently low interest rate environment (or at least that's now the popular viewpoint). While there are good arguments for this belief, it sounds suspiciously like the “this time is different” refrain from bubbles past.
So how then do we think about where to invest?
As we’ve stated previously, we believe that:
| 1. | Major macro trends are the primary drivers of long-term real estate returns. |
| 2. | By identifying these fundamental drivers, we can capture opportunities that will produce reliable, strong returns that are less correlated to public stocks and bonds. |
What then will be the predominant drivers of the new decade? Though we can’t be certain, it’s reasonable to assume that what mattered most in the 2010s will be different in the 2020s. Decades seem to develop their own narratives that define each era — the tech bubble and globalization in the 1990s, the housing bubble and radical fundamentalism in the 2000s, and the long economic recovery and populism of the 2010s.
In translating these powerful movements into actionable strategies, we tend to rely on a fairly basic framework of “who, what, where”.
| · | Who, meaning specific, observable segments of the population that will be driving increased demand. |
| · | What, meaning for what type of real estate will they be driving demand. |
| · | Where, simply meaning where will they be driving demand for this type of real estate. |
To illustrate the point, let’s look at the 2010s. Almost inarguably the most successful real estate investment of this period was: millennials (who), multifamily (what), major metro markets (where) — in other words, apartments geared towards young adults in big cities and close-in suburbs was (from a risk/return standpoint) the best investment one could have made. In retrospect, this should have been obvious when looking at demographics, as the millennial “echo boom” was graduating from college and wanted to live in vibrant urban environments, but could not afford to buy.
A close second for best strategy was: tech companies (who), industrial or data centers (what), and major metro markets (where) — this strategy leveraged technology’s transformation of the rising generation’s consumer preferences that reshaped retail and media distribution over the past decade.
One of the worst strategies was likely: Baby Boomers (who), traditional retail (what) — think dead malls with aging brands and outmoded shopping patterns, in distant suburbs (where).
The question then is “who, what, where” for the 2020s.
In spending time analyzing and debating, we’ve determined that sharing the entirety of our thinking on the subject is simply not feasible in a single letter — however, we believe that doing so is important not only because we think many investors will find it interesting, but because it is in line with our values as a company.
So, over the coming months, we intend to share a multi-part series of letters that will delve into the major macroeconomic drivers we believe are important. The goal being to both share our views and, equally as important, to gather yours, as we seek to craft the best strategies for the coming decade.
Below are three of the dominant drivers we believe will have a major impact in the coming decade:
| 1. | Aging and declining populations |
| 2. | Regional and economic disparity |
| 3. | Aggressive monetary reflation |
What is your perspective for the “who, what, where” of the 2020s?
In closing
We deeply appreciate your investment and continued support as we work to transform the investment industry. Our goal has and will continue to be to build a better financial system for the individual investor �� one that is simpler, more reliable, lower cost and transparent. We’ve made a great deal of progress towards that end, surpassing 100,000 active investors over the summer and $1 billion in equity under management just after the turn of the new year. So, on behalf of the entire Fundrise team, thank you.
Onward,
The Fundrise Team
P.S., As we contemplate and prepare for a potential downturn, we want to reiterate to every investor that real estate (and therefore Fundrise) is inherently a long-term, illiquid investment. While our programs strive to provide early liquidity to investors who need it, we expect that we may limit or suspend redemptions in certain scenarios, such as during a financial crisis. In such a scenario, we must first consider the interests of all investors, and therefore may determine it is prudent to hold a higher level of liquidity given the uncertainty. Similarly, it would likely take additional time to reset net asset values (NAVs) if market conditions were to vary rapidly.
As always, please don’t hesitate to reach out toinvestments@fundrise.com with any questions or comments.
——
| 1. | Fundrise platform performance for each calendar year consists of the time-weighted, weighted-average returns of the real estate investing programs sponsored by Rise Companies Corp., and is not representative of the performance of any individual Fundrise investor. 6-year average performance is the compounded annual growth rate (CAGR) across each calendar year of performance from 2014 to 2019. Individual investment results may vary depending on the mix of investments owned by any investor on the Fundrise platform. Fundrise platform performance does not include investments in Rise Companies Corp itself (The Fundrise iPO) or the Fundrise Opportunity Fund, the inclusion of either of which could potentially have a negative effect on the total performance of the Fundrise platform. Past performance is not indicative of future results, and all investments may result in total or partial loss. All prospective investors should consult their personal tax and investment advisors before making any investment on the Fundrise platform. All estimated performance figures presented are net of fees and inclusive of dividend reinvestment. For more information, please see our full performance disclosure, as well as the offering circulars available at fundrise.com/oc. |
| 1. | Annual performance of the Vanguard Total Stock Market ETF and Vanguard Real Estate ETF specifically refers to the Total return by NAV of each ETF, and was sourced from vanguard.com on January 14, 2020. 6-year average performance is the compounded annual growth rate (CAGR) across each calendar year of performance from 2014 to 2019. |
Blog Post: Understanding Fundrise historical returns
Understanding Fundrise historical returns
We often talk about how Fundrise is a long-term investment. We aren’t just referring to liquidity, though — we’re also referring to the shape of your overall return profile.
In 2019, Fundrise produced a total net platform return of approximately 9.47%. But in many ways using a singular weighted average figure to represent the entirety of the platform’s performance oversimplifies the actual diverse experience of our investors on Fundrise, as well as the fundamentals of how investing in real estate actually works.
At the end of 2019, Fundrise had more than 120,000 active investors. Those investors ranged from having spent as little as one day on the platform to more than five years. Collectively, they invested in portfolios composed of as many as 16 different eREITs and eFunds, as well as many project dependent notes (the predecessor of the eREITs), with investment objectives ranging from generating consistent income, to maximizing long-term growth, to a balanced blend of each. As a result, nearly everyone of our investors had a unique return for their Fundrise portfolio based on their specific set of individual circumstances.
While 9.47% was the net overall platform return, only a few investors earned exactly 9.47% — most earned either a little more or a little less, and some earned a lot more or a lot less.
What nearly all 120,000 investors had in common was this:
An investor’s unique return for the year was highly correlated to the amount of time they’d been investing with Fundrise.
Historically, the less time you’d been investing the lower your likely return, while the more time you’d been investing, the higher your likely return. We highlight this not because we believe it will always hold true in all circumstances, but because generally speaking we believe it can help investors understand what makes investing on Fundrise different from investing in the stock market (Of course, it is important to always remember that past performance cannot and does not predict future outcomes, which may vary greatly from what has occurred previously).
Put another way, on average, the historical rate of return for Fundrise investments has generally started out lower and increased over time.
Why does this occur? Though there are multiple factors involved, a primary reason is that investing in real estate (by which we mean owning actual physical properties, not public REIT stock traded on an exchange) tends to follow what is called a “J” curve return profile.
Understanding the J-Curve
A “J” curve investment is an investment that follows a pattern where realized returns tend to be lower — or even negative — in the early period of the investment, often as a result of both money and time being invested into creating value, with the majority of the return on that capital and work realized towards the later portion of the investment period.
In terms of real estate specifically, it’s easy to imagine buying an old, run-down apartment building with many vacant units and low relative rents as a result of its poor condition. After purchasing the property, you may invest significant capital into making improvements; adding HVAC, hardwood floors, new kitchen cabinets and countertops, stainless steel appliances, fresh carpets and paint, and maybe a nice community fitness center and pool.
Between obtaining permits, negotiating with contractors, and performing the work, improvements may take several months or even a couple of years to complete. Once finished, however, the property begins to lease up as a result of the renovations, with most tenants (including many of the existing ones) willing to pay more in rent because the property is now much more comparable to other significantly newer and nicer apartments. Over the next 12‒24 months, you’d expect the income from the property to increase dramatically. And eventually, you may choose to sell the asset at a premium to an investor who is pleased to own a recently renovated property that is fully leased at top of market rents.
In this scenario (a strategy we’ve deployed often across our portfolio), you’d likely experience little to no return for the first couple years, with cash flow from rent only picking up well after the renovations are completed. The bigger “pop” in your returns may ultimately not be realized until even later, when you either sell or refinance the asset. Such value-creation business plans, or variations on it, are at the core of most private real estate investing and central to the way investing with Fundrise works.
This general phenomenon can be seen in practice simply by looking at the performance of the Fundrise Growth eREIT, again emphasizing that past performance is not necessarily indicative of future results:
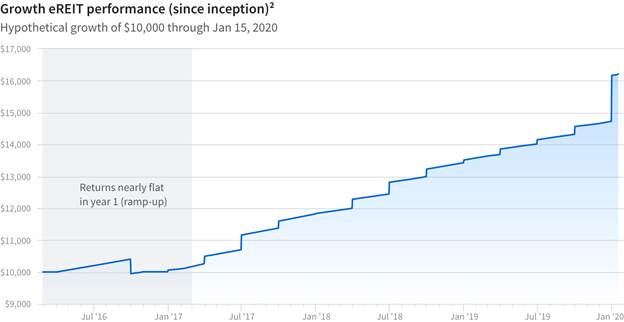
When looking at the lifetime performance since inception, at first glance it may appear as a steady upward trend since the fund first began accepting investments in February 2016. However, when you look closer at the first year, you can see that returns were nearly flat during this ramp-up period:
By combining an understanding of the nature of a J-curve return profile with the previous data around returns by time on platform, you can start to recognize that investors who have been investing on the platform longer will naturally have a larger portion of their portfolio in properties that are further along in the maturity of their business plans and therefore are starting to capture a greater return. In contrast, newer investors, typically having a portfolio with a greater portion of assets that are still early in their business plans, would not yet have realized a substantial return.
Although not immediately intuitive to all, portfolios with a majority of their assets in “ramp-up” (i.e., earlier in their business plan) are likely to have a higher potential return going forward over the next several years, than portfolios with a majority of their assets in the stabilized phase (and having already captured high returns in the previous few years).
What about income-focused investments?
The J-curve principle also applies to real estate investments focused on generating income, though generally to a lesser extent. In real estate, income-focused investment strategies typically consist of either buying already-stabilized properties which generate regular income through rent, or by providing financing via a loan or other debt-like structures to the developer of a property, who then pays regular fixed interest payments.
Once the capital has been deployed, you would expect an income-focused investment to earn returns in a more or less straight line compared with a growth-focused investment. The important part to note is that, like a growth-focused investment, deploying the capital does not happen overnight. It takes time to identify the right investment, perform due diligence, and close. In the case of investments in construction, they are typically funded in draws, meaning that a portion of the capital is not deployed until certain construction milestones are reached.
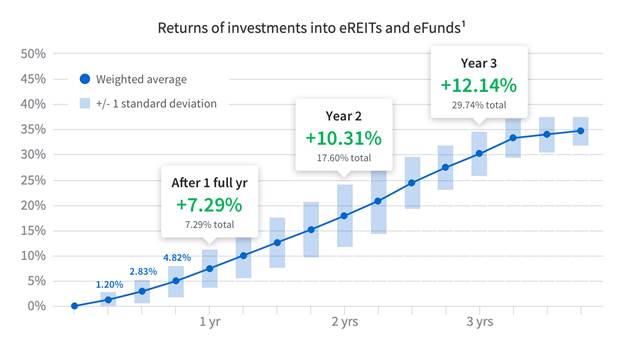
You can see the J-curve manifested in the relative performance of investments in income-focused vs. growth-focused portfolios.
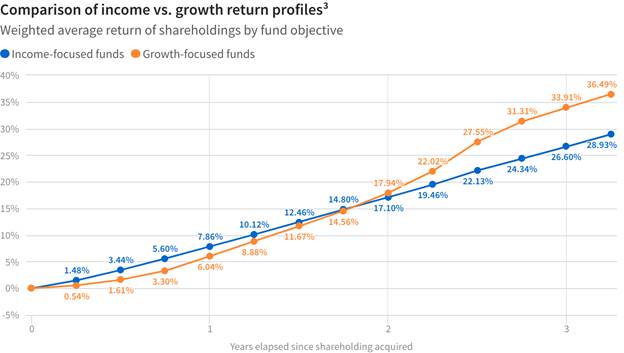
The first year returns for the income investments are higher than the growth investments. After the end of the second year though, the growth investments have “caught up”. By the end of the third year, the growth investments have begun to see a “pop” in their value while the income investments have leveled out into a straighter line, resulting in the growth investments earning a greater total return over the life of the investment.
The bottom line
Investing in real estate on Fundrise is a lot more like investing into a portfolio of companies that are still in their high-growth pre-IPO phase, than it is like owning an index of mature, publicly traded companies.
A large portion of any returns comes directly from the value added to the property. Because performance is so much more closely tied to the properties and execution of their business plans, it follows a natural trajectory in the form of a J-curve that takes time to play out: an initial period of low expected returns as properties are acquired and business plans put into action, with a potential harvesting of the value creation in the form of higher returns in the later portion of the investment period.
Therefore, as an investor you should not only expect for returns to be lower than the platform average if you’re in your first year or two of your journey with us, but if you’re like us and like to think long-term, you might actually get excited about owning a portfolio that is heavily weighted towards properties that are in this early “incubation period” where we are building up the potential for higher returns in the future.
We hope you find this helpful, and as always, please don’t hesitate to reach out toinvestments@fundrise.com with any questions or comments.
——
| 1. | Data set consists of the weighted-average cumulative return over time of shareholdings acquired in each of the eREIT and eFund programs from December 5, 2015 through January 13, 2020. Estimated returns presented do not assume dividend reinvestment, and are net of fees. |
| 2. | This chart shows the hypothetical growth of a $10,000 investment in the Growth eREIT over the period indicated, assuming dividend reinvestment, and net of fees. Similar performance information for each eREIT and eFund is available on each fund’s individual offering page, which may be found at https://fundrise.com/offerings |
| 3. | Data set includes all shares issued by the eREIT and eFund programs listed below from December 5, 2015 through January 13, 2020. “Income funds” include the Income eREIT, Income eREIT II, Income eREIT III, Income eREIT 2019, and Income eREIT V. “Growth funds” include the Growth eREIT, Growth eREIT II, Growth eREIT III, Growth eREIT 2019, Growth eREIT V, Growth eREIT VI, Washington DC eFund, Los Angeles eFund, and National eFund. Estimated returns presented do not assume dividend reinvestment, and are net of fees. As each of East Coast eREIT, West Coast eREIT, Heartland eREIT, and Balanced eREIT do not primarily focus on either an income or growth strategy, such funds are not included in this performance data. |