Item 1. Reports to Stockholders.
The registrant's semi-annual report transmitted to shareholders pursuant to Rule 30e-1 under the Investment Company Act of 1940, as amended (the “Investment Company Act”), is as follows:
GUGGENHEIMINVESTMENTS.COM/XGEIX
...YOUR WINDOW TO THE LATEST, MOST UP-TO-DATE INFORMATION ABOUT GUGGENHEIM ENERGY & INCOME FUND
The shareholder report you are reading right now is just the beginning of the story.
Online at guggenheiminvestments.com/xgeix, you will find:
| · | Daily, weekly and monthly data on NAV, distributions and more |
| · | Portfolio overviews and performance analyses |
| · | Announcements, press releases and special notices and tax characteristics |
Guggenheim Partners Investment Management, LLC and Guggenheim Funds Investment Advisors, LLC are continually updating and expanding shareholder information services on the Fund’s website in an ongoing effort to provide you with the most current information about how your Fund’s assets are managed and the results of our efforts. It is just one more way we are working to keep you better informed about your investment in the Fund.
(Unaudited) | March 31, 2016 |
DEAR SHAREHOLDER
We thank you for your investment in the Guggenheim Energy & Income Fund (the “Fund”). This report covers the Fund’s performance for the six-month period ended March 31, 2016.
The Fund’s investment objective is to provide high income. As a secondary investment objective, the Fund seeks capital appreciation. There can be no assurance the Fund will achieve its investment objectives.
Under normal market conditions, the Fund invests at least 80% of its managed assets (net assets plus financial leverage) in securities of energy companies and income-producing securities of other issuers. The Fund intends to focus its energy company investments in debt securities, including bonds, debentures, notes, loans and loan participations, mezzanine and preferred securities, convertible securities, and structured products.
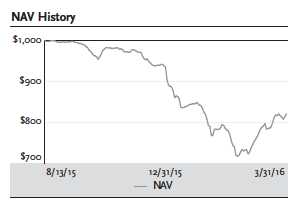
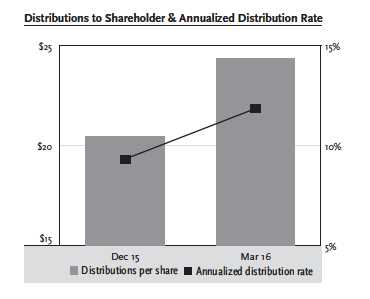
As a non-listed Fund, the Fund does not have a market price or market price return. For the semiannual fiscal period ended March 31, 2016, the Fund provided a total return based on net asset value (NAV) of -10.07%. The NAV return includes the deduction of management fees, operating expenses, and all other Fund expenses. As of March 31, 2016, the Fund’s NAV was $821.33 per share, compared with $962.31 per share on September 30, 2015. The Fund also made two distributions in the period: $20.48 on December 11, 2015, and $24.375 on March 31, 2016. The distribution rate at the end of the period, based on the closing NAV, was 11.87%. The Fund’s distribution rate is not constant and the amount of distributions, when declared by the Fund’s Board of Trustees, is subject to change based on the performance of the Fund. Please see Note 2(e) on page 30 for more information on distributions for the period.
Guggenheim Funds Investment Advisors, LLC (the “Adviser”) serves as the investment adviser to the Fund. Guggenheim Partners Investment Management, LLC (“GPIM” or the “Sub-Adviser”) serves as the Fund’s investment sub-adviser and is responsible for the management of the Fund’s portfolio of investments. Each of the Adviser and the Sub-Adviser is an affiliate of Guggenheim Partners, LLC (“Guggenheim”), a global diversified financial services firm. Guggenheim Funds Distributors, LLC serves as the distributor to the Fund and is an affiliate of Guggenheim.
To learn more about the Fund, we encourage you to read the Questions & Answers section of this report, which begins on page 5. You’ll find information on GPIM’s investment philosophy, views on the economy and market environment, and information about the Fund’s performance.
GEI l GUGGENHEIM ENERGY & INCOME FUND SEMIANNUAL REPORT l 3
(Unaudited) continued | March 31, 2016 |
We appreciate your investment and look forward to serving your investment needs in the future. For the most up-to-date information on your investment, please visit the Fund’s website at guggenheiminvestments.com/xgeix.
Sincerely,
Donald C. Cacciapaglia
President and Chief Executive Officer
Guggenheim Energy & Income Fund
April 30, 2016
4 l GEI l GUGGENHEIM ENERGY & INCOME FUND SEMIANNUAL REPORT| | |
QUESTIONS & ANSWERS (Unaudited) | March 31, 2016 |
Guggenheim Energy & Income Fund (the “Fund”) is managed by a team of seasoned professionals at Guggenheim Partners Investment Management, LLC (“GPIM”). This team includes Thomas Hauser, Managing Director and Portfolio Manager; James W. Michal, Senior Managing Director and Portfolio Manager; Adam Bloch, Director and Portfolio Manager; and Richard de Wet, Vice President and Portfolio Manager. In the following interview, the investment team discusses the market environment and the Fund’s performance for the six-month period ended March 31, 2016.
What is the Fund’s investment objective and how is it pursued?
The Fund’s investment objective is to provide high income. As a secondary investment objective, the Fund seeks capital appreciation. There can be no assurance the Fund will achieve its investment objectives.
Under normal market conditions, the Fund invests at least 80% of its managed assets (net assets plus financial leverage) in securities of energy companies and income-producing securities of other issuers. Energy companies include those that have at least 50% of their assets, income, sales, or profits committed to, or derived from:
| · | production, exploration, development, mining, extraction, transportation (including marine transportation), refining, processing, storage, distribution, management, marketing, and/or trading of oil, natural gas, natural gas liquids, refined petroleum products, coal, biofuels, or other natural resources used to produce energy, or ethanol; |
| · | generation, transmission, distribution, marketing, sale, and/or trading of all forms of electrical power (including through clean and renewable resources, such as solar energy, wind energy, geothermal energy, or hydropower) or gas; |
| · | manufacturing, marketing, management, sale, and/or trading of equipment, products or other supplies predominantly used by entities engaged in such businesses; and |
| · | provision of services to entities engaged in such businesses. |
Under normal market conditions, the Fund invests at least 70% of its managed assets in securities of energy companies. The Fund intends to focus its energy company investments in debt securities, including bonds, debentures, notes, loans and loan participations, mezzanine and preferred securities, convertible securities, and structured products. Other income-producing securities in which the Fund may invest include corporate bonds, debentures, notes, loans and loan participations, mezzanine and preferred securities, convertible securities, asset-backed securities, commercial paper, U.S. government securities, sovereign government and supranational debt securities, structured products, and dividend-paying common equity securities.
The Fund may invest in debt securities of any credit quality, and may invest without limitation in securities of below-investment-grade quality (also known as high yield securities or junk bonds). Securities of below-investment-grade quality are considered predominantly speculative with respect to the issuer’s capacity to pay interest and repay principal when due. Securities of below-investment-grade quality involve special risks as compared to investment-grade-quality securities.
GEI l GUGGENHEIM ENERGY & INCOME FUND SEMIANNUAL REPORT l 5
| | |
QUESTIONS & ANSWERS (Unaudited) continued | March 31, 2016 |
The Fund may use financial leverage (borrowing) to finance the purchase of additional securities. Although financial leverage may create an opportunity for increased return for shareholders, it also results in additional risks and can magnify the effect of any losses. There is no assurance that the strategy will be successful. If income and gains earned on securities purchased with the financial leverage proceeds are greater than the cost of the financial leverage, common shareholders’ return will be greater than if financial leverage had not been used. Conversely, if the income or gains from the securities purchased with the proceeds of financial leverage are less than the cost of the financial leverage, common shareholders’ return will be less than if financial leverage had not been used.
What were macroeconomic conditions over the period?
The highlight was the 25-basis-point increase in the federal funds target rate by the U.S. Federal Reserve (the Fed) in December 2015. While the direct impact of the move was fairly insignificant, the decision to begin normalization of interest rates after seven years of unprecedented liquidity provision was not. Indeed, in 2015, risk assets posted their worst annual performance since the 2008 financial crisis, as market participants’ expectations for the start of rate hikes collided with concern about plunging commodity prices, and slowing economic growth in China and other emerging market economies. Among the events that fueled a risk-off sentiment in the fourth quarter of last year were strong U.S. employment reports, European Central Bank (ECB) stimulus measures that were below market expectations, and the December announcement by Oil Petroleum Exporting Countries (OPEC) that its members would maintain production, defending market share by squeezing out higher-cost producers, including U.S. shale. Oil prices tumbled below $35 a barrel in December, reaching their lowest price since 2008.
As 2016 began, forecasts for U.S. and global economic growth were downgraded, and recession fears surged along with market volatility. Estimates for 1Q gross domestic product (GDP) in the U.S. were marked down, even though Q1 GDP has undershot full-year growth rates in six out of the last seven years. Risk assets rallied in the last half of the first quarter, led by a dovish pivot in the Fed’s communication that spurred a rally in crude oil and a reversal of dollar strength. The weaker dollar, along with optimism that a group of major oil producing countries might agree to a production freeze, helped oil to rebound. After falling in the early weeks of the year to a cycle low of $26 per barrel on February 11, the front-month West Texas Intermediate (WTI) oil futures contract rallied as high as $40 per barrel before closing the quarter at $38 per barrel. The rebound in risk assets in the second half of the quarter may also reflect diminished U.S. recession risks in the eyes of many market participants.
The outlook for economic growth outside the U.S. softened in 1Q. A further deterioration in the euro zone inflation outlook prompted the ECB to announce an increase in the size of its monthly asset purchases and reduce its deposit rate to -40 basis points. European government bonds rallied following the announcement, with the 10-year German bund ending the first quarter with a yield of just 16 basis points.
6 l GEI l GUGGENHEIM ENERGY & INCOME FUND SEMIANNUAL REPORT| | |
QUESTIONS & ANSWERS (Unaudited) continued | March 31, 2016 |
Ongoing stimulus efforts in Asia also appeared likely to contribute to low U.S. rates. Chinese industrial production growth continued to slow in early 2016, prompting the People’s Bank of China (PBOC) to stimulate credit growth by allowing banks to hold fewer reserves against deposits. And after years of struggling with stagnant growth and low inflation, the Bank of Japan (BOJ) surprised markets by cutting its key interest rate to -10 basis points in January. The negative rates pushed a considerable amount of Japanese savings into foreign markets.
The influence of global factors on U.S. monetary policy has clearly grown. The Fed kept rates unchanged at the January and March Federal Open Market Committee (FOMC) meetings, citing concerns about potential downside risks to the U.S. economy posed by weaker global growth and market volatility. Despite evidence of higher inflation and a stronger labor market, the median FOMC participant at period end was projecting two hikes in 2016, down from a forecast of four as recently as December 2015.
In an environment where global rates are moving lower and markets are already starved for yield, foreign investors began looking to the U.S. Guggenheim expects that U.S. Treasury yields will fall further as the gravitational pull of global yields gets stronger, and does not discount the possibility of 10-year U.S. Treasury yields declining to closer to 1% before the end of the year.
How did the Fund perform for the period?
For the six-month period ended March 31, 2016, the Fund provided a total return based on net asset value (NAV) of -10.07%. The NAV return includes the deduction of management fees, operating expenses, and all other Fund expenses. As of March 31, 2016, the Fund’s NAV was $821.33. That compared with $962.31 per share on September 30, 2015, and $1,000.00 on August 13, 2015, the Fund’s inception date.
What were the Fund’s distributions for the period?
The Fund declared its initial distribution in November 2015, $20.48 per share. On March 1, 2016, it declared another distribution of $24.375, which equates to 9.75% on the initial offering yield. The distribution rate at the end of the period based on NAV was 11.87%. The Fund’s distribution rate is not constant and the amount of distributions, when declared by the Fund’s Board of Trustees, is subject to change based on the performance of the Fund. Please see Note 2(e) on page 30 for more information on distributions for the period.
Why is there no market price for the Fund?
The Fund is a non-listed closed-end fund. It is designed for long-term investors and an investment in the common shares should be considered illiquid. An investment in the common shares is not suitable for investors who need access to the money they invest. Unlike shares of open-end funds (commonly known as mutual funds), which generally are redeemable on a daily basis, the common shares are not redeemable at an investor’s option, and unlike traditional listed closed-end funds, the common shares are not listed on any securities exchange.
GEI l GUGGENHEIM ENERGY & INCOME FUND SEMIANNUAL REPORT l 7| | |
QUESTIONS & ANSWERS (Unaudited) continued | March 31, 2016 |
Investors should not expect to be able to sell their common shares, regardless of how the Fund performs. Investors may not have access to the money invested until a shareholder liquidity event occurs.
What is a shareholder liquidity event?
The Fund intends to complete an event intended to provide liquidity on or before July 28, 2023 (liquidity event date). The Fund’s Board of Trustees may extend the liquidity event date for one year, to July 28, 2024, without a shareholder vote. The liquidity event date can be further extended beyond July 28, 2024, if approved by 75% of the Board of Trustees followed by approval by 75% of the outstanding voting securities of the Fund. A shareholder liquidity event will consist of either: termination and liquidation of the Fund, or a tender offer to repurchase 100% of the Fund’s outstanding common shares at a price equal to the then-current NAV.
The Fund’s investment objectives and policies are not designed to seek to return to investors who purchased common shares in the initial offering their initial investment on the liquidity event date or any other date. Such initial investors and any investors who purchase common shares after the completion of the offering may receive less than their original investment through any shareholder liquidity event.
Will the Fund provide any liquidity for shareholders prior to the liquidity event date?
Beginning 18 months after completion of the offering (the offering was completed August 13, 2015), the Fund intends, but is not obligated, to conduct quarterly tender offers for up to 2.5% of the common shares then outstanding in the sole discretion of the Board of Trustees. In a tender offer, the Fund will offer to repurchase outstanding common shares at the Fund’s NAV or a percentage of the Fund’s NAV per share on the last day of the offer. In any given quarter, the Adviser may or may not recommend to the Board of Trustees that the Fund conduct a tender offer. Accordingly, there may be periods during which no tender offer is made, and it is possible that no tender offers will be conducted during the term of the Fund. If a tender offer is not made, shareholders may not be able to sell their common shares as it is unlikely that a secondary market for the common shares will develop or, if a secondary market does develop, shareholders may be able to sell their common shares only at substantial discounts from NAV.
How did the high yield energy market perform in this environment?
For the six-month period ended March 31, 2016, the Energy sector of the Barclays U.S. Corporate High Yield Index returned -10.5%, as declining oil prices continued to weigh on the sector. However, with the price of oil stabilizing at the end of the period, the Energy sector rallied by 27.0% from February 11 to March 31, after being down by as much as -29.5% for the period in mid-February. The more commodity price-sensitive exploration and production (E&P) and Oil Field Services sub-sectors were the worst-performing sectors in the Energy Index, with returns of -20.3% and -10.4% respectively for the period, while Midstream was the best-performing sector, returning 1.0%. The average yield-to-worst of 13.5% for the Energy sector of the High Yield Index at period end continues to look attractive at a 5.3% premium to yield-to-worst of the overall High Yield Index.
8 l GEI l GUGGENHEIM ENERGY & INCOME FUND SEMIANNUAL REPORT
| | |
QUESTIONS & ANSWERS (Unaudited) continued | March 31, 2016 |
Discuss sentiment about the oil market over the period.
One event that changed sentiment over the period was a possible coordinated freeze of output among OPEC and non-OPEC members that are large producers of oil. Another was moves among issuers, mostly in the U.S., to reduce capital spending, which ultimately could affect production. Capital budgets announced in the fourth quarter 2015 earnings season were significantly below expectations and indicate severe cuts in capital spending. Of the oil producers Guggenheim tracks, for example, average capex cuts for 2016 were expected to be about 50%. That includes investment-grade companies that make up the greatest part of the overall production in the U.S., so the cuts would be material.
Based on our estimates of capex budgets and our modeling of underlying issuers, we think 800,000 to one million barrels a day could come out of U.S. production by the end of 2016—or about 8-10% of the total production of about 9.3 million barrels a day as of the end of 2015. That should have a meaningful impact on the global supply-demand imbalance. It also is a promising sign for normalization of supply for what many regard as the marginal producer—U.S. shale—even though cost there has come down materially. Also on the natural gas side, a warm winter resulted in significantly below-normal withdrawals from inventories, which has had a negative effect on the spot gas price. So there are similar capex cuts among natural gas producers, perhaps leading to a 5-6% reduction in year-over-year production on the natural gas side, plus what everyone hopes will be a more promising demand environment in 2016.
Capex cuts and their effect on production have resulted in energy credits being fairly closely correlated to oil prices. As the energy sector of the high yield index traded down through the middle of February, at its low point, the average dollar price of high yield energy debt was about 50 cents on the dollar. Fortunately, that rallied to closer to 66 cents on the dollar, but still near the end of the period energy credits were trading generally in distressed territory with spreads more than 900 basis points higher than Treasuries and a total yield of just below 15%. That’s on average across all the industries that make up the energy high yield corporate sector and the subsectors of that. So there was a huge level of distress and also significant dispersion of performance among issuers, as some appeared to head toward restructuring or into bankruptcies in some cases, and others have enough liquidity to survive, thus providing a longer runway and more time to ride out the low prices the market experienced.
The primary driver of wider spreads in the high-yield market continued to persist, however; the oil market remains characterized by a significant supply-demand imbalance. Near-term risks include further weakness in oil, the impact of a potential Fed hike over the summer, and the meaningful wave of downgrades that lie ahead in oil and basic materials. The late-period rebound in risk assets, in conjunction with rising oil prices, supports our view that the decline in leveraged credit has been largely tied to the commodity bear market and a sentiment-driven spillover into credits tied to other industries. Our concern is that the rebound in oil prices is not yet supported by a turnaround in the dynamics that initially caused prices to fall. Our analysis of inventory trends and production levels suggests that the oil market will remain oversupplied until the second half of 2016. Leveraged credit
GEI l GUGGENHEIM ENERGY & INCOME FUND SEMIANNUAL REPORT l 9
| | |
QUESTIONS & ANSWERS (Unaudited) continued | March 31, 2016 |
must also contend with two important headwinds between now and the second half of the year: a rise in credit defaults in the energy and metals sectors, and a likely wave of ratings downgrades in both markets.
How were the Fund’s investments allocated at period end?
GPIM divides the energy sector into five subsectors: upstream (exploration and production companies or E&P); energy services (providers of equipment and services to energy companies); midstream (pipeline companies); downstream (refiners); and power (companies that produce and distribute power to end users).
At the time of launch, we mentioned that we were patient in deploying capital in the energy sector, as we thought the prospects were significant for commodity prices to stay depressed, or be volatile, or both. We expected it to be a longer downturn in the energy market, and wanted to take our time deploying capital at the outset. We also kept a portion of the portfolio in non-energy related investments, which can be rotated out of as opportunities within the energy sector present themselves in the months ahead.
As of the end of the period, the Fund was fully invested, with about 78% exposure to energy and 22% non-energy. The Fund was more conservatively positioned in major sectors relative to the broad market: 26% of the Fund in E&P companies (Index 34%), 20% in midstream companies (Index 25%), and 26% in power generation companies (Index 20%). The Fund also had 2% in providers of oil field services, and 1% in coal miners and other securitized energy holdings. The 22% non-energy portion was composed of higher-yielding, deep-conviction names among corporate credit.
The allocation reflects our current view, which, with the significantly depressed drilling environment, for example, services companies are the first to feel the effects and may stay depressed the longest relative to other subsectors. So, we remain underweight in that category, and also heavily weighted away from traditional mainstream gathering and processing companies. We do have some exposure to the traditional gathering and processing companies, but the rest is propane distributors, global tank storage businesses and long-haul natural gas pipelines, which are supplying natural gas to individual markets for local distribution companies to then provide to customers’ homes. We favor midstream businesses exposed to many different customers and multiple basins, so that they are not overly exposed to one area or beholden to one customer—this latter point could be important if the customer has the upper hand to renegotiate a contract.
We’ve also seen opportunity to put capital to work in the power generation business. As natural gas prices have traded off, we’ve seen companies in energy generation trade off in tandem. But we think that might have been overdone, since these power businesses often have long-term contracts in place, thus preserving for now their revenue stream.
Also a part of our overweight relative to the index in power were opportunities in the bank loan universe. As natural gas prices came down early in the period we saw an opportunity to buy those loans at attractive discounts and yields.
10 l GEI l GUGGENHEIM ENERGY & INCOME FUND SEMIANNUAL REPORT| | |
QUESTIONS & ANSWERS (Unaudited) continued | March 31, 2016 |
The Fund was invested in a mix of high yield bonds (~68% of net assets), bank loans (~24%), investment grade bonds (~6%), and asset backed securities (~2%).
Will oil start climbing back to $100 per barrel?
Shale drilling in the U.S. was an extraordinary technological advancement that significantly lowered the break-even price of oil and natural gas in this country. The price at which producers need to turn a profit today is a lot lower than in 2008. Where wells come back on and when people start drilling again will be determined by the economics of the underlying wells and each producer’s balance sheet. Producers will have constraints put on them by, in some cases, new owners who limit the amount of capital spending. Still, we think there are wells in the U.S. that are still being drilled economically today at the well level and turning a profit, excluding interest expense.
On the other hand, a lot of what was drilled in the 2012-2014 timeframe wouldn’t be profitable today, but will become more so as the spot price of oil crosses $50 or $60. It’s not our view that we’re getting back to $100 any time soon, because there is a lot of inventory sitting there to be drilled at that price and even lower profitably.
But at today’s price, with capital budgets being set that we think will reduce supply by almost 10% in the U.S., producers do not have the incentive to drill enough to hold production even. Plus, there are producers over the rest of the world that can’t make money at $35 to $40 oil. So, picking the perfect equilibrium price is clearly what everyone’s trying to do, but we believe that what’s happening in the U.S. and elsewhere illustrates that it’s meaningfully higher than where the spot price was for most of the first quarter of 2016.
What is the Fund’s leverage strategy?
The Fund may use financial leverage (borrowing) to finance the purchase of additional securities. As of March 31, 2016, the Fund’s leverage was 22%. The purpose of leverage (borrowing) is to fund the purchase of additional securities that provide increased income and potentially greater appreciation to common shareholders than could be achieved from an unlevered portfolio. Leverage results in greater NAV volatility and entails more downside risk than an unleveraged portfolio. The Fund expects to employ leverage primarily through indebtedness and engaging in reverse repurchase agreements. The Fund is permitted to issue preferred shares but has no current intention to do so. There is no guarantee that the Fund’s leverage strategy will be successful. The Fund’s use of leverage may cause the Fund’s NAV of common shares to be more volatile and can magnify the effect of any losses.
GEI l GUGGENHEIM ENERGY & INCOME FUND SEMIANNUAL REPORT l 11| | |
QUESTIONS & ANSWERS (Unaudited) continued | March 31, 2016 |
Index Definitions
Indices are unmanaged and reflect no expenses. It is not possible to invest directly in an index.
Barclays U.S. Corporate High Yield Index measures the market of USD-denominated, noninvestment grade, fixed-rate, taxable corporate bonds. Securities are classified as high yield if the middle rating of Moody’s, Fitch, and S&P is Ba1/BB+/BB+ or below, respectively.
Risks and Other Considerations
The views expressed in this report reflect those of the portfolio managers only through the report period as stated on the cover. These views are subject to change at any time, based on market and other conditions and should not be construed as a recommendation of any kind. The material may also include forward looking statements that involve risk and uncertainty, and there is no guarantee that any predictions will come to pass.
There can be no assurance that the Fund will achieve its investment objectives. The value of the Fund will fluctuate with the value of the underlying securities. Historically, closed-end funds often trade at a discount to their net asset value. Risk is inherent in all investing, including the loss of your entire principal. Therefore, before investing you should consider the risks carefully. Please see guggenheiminvestments.com/xgeix for a more detailed discussion of the Fund’s risks and considerations.
12 l GEI l GUGGENHEIM ENERGY & INCOME FUND SEMIANNUAL REPORT
PERFORMANCE REPORT AND FUND PROFILE (Unaudited) | | March 31, 2016 |
| |
Fund Statistics | | |
| Net Asset Value | | $821.33 |
| Net Assets ($000) | | $65,082 |
| |
TOTAL RETURNS FOR THE | | |
PERIOD ENDED MARCH 31, 2016 (non-annualized) | | |
| | | Since |
| | | Inception |
| | Six Month | (08/13/15) |
| Guggenheim Energy & Income Fund | | |
| NAV | -10.07% | -13.46% |
Performance data quoted represents past performance, which is no guarantee of future results and current performance may be lower or higher than the figures shown. NAV performance data reflects fees and expenses of the Fund. The deduction of taxes that a shareholder would pay on Fund distributions or the sale of Fund shares is not reflected in the total returns. For the most recent month-end performance figures, please visit guggenheiminvestments.com/xgeix. The investment return and principal value of an investment will fluctuate with changes in market conditions and other factors so that an investor’s shares, when sold, may be worth more or less than their original cost.
Portfolio Breakdown | % of Net Assets |
| Corporate Bonds | 96.5% |
| Senior Floating Rate Interests | 31.6% |
| Asset Backed Securities | 1.9% |
Total Investments | 130.0% |
Other Assets & Liabilities, net | -30.0% |
Net Assets | 100.0% |
GEI l GUGGENHEIM ENERGY & INCOME FUND SEMIANNUAL REPORT l 13
| | |
PERFORMANCE REPORT AND FUND PROFILE (Unaudited) continued | March 31, 2016 |
14 l GEI l GUGGENHEIM ENERGY & INCOME FUND SEMIANNUAL REPORT| | |
PERFORMANCE REPORT AND FUND PROFILE (Unaudited) continued | March 31, 2016 |
| |
Ten Largest Holdings | % of Total Net Assets |
| TPF II Power LLC, 5.50%, 10/02/21 | 3.6% |
| Panda Power, 7.50%, 08/21/20 | 2.8% |
| Panda Moxie Patriot, 6.75%, 12/19/20 | 2.7% |
| DCP Midstream LLC, 5.35%, 03/15/20 | 2.6% |
| Jonah Energy LLC, 7.50%, 05/12/21 | 2.5% |
| Unit Corp, 6.63%, 05/15/21 | 2.5% |
| Invenergy Thermal Operating I LLC, 6.50%, 10/19/22 | 2.5% |
| Ferrellgas Partners LP, 8.63%, 06/15/20 | 2.4% |
| LBC Tank Terminals Holdings Netherlands BV, 6.88%, 05/15/23 | 2.4% |
| AmeriGas Finance LLC/AmeriGas Finance Corp, 7.00%, 05/20/22 | 2.4% |
| Top Ten Total | 26.4% |
“Ten Largest Holdings” exclude any temporary cash or derivative investments.
Portfolio breakdown and holdings are subject to change daily. For more information, please visit guggenheiminvestments.com/xgeix. The above summaries are provided for informational purposes only and should not be viewed as recommendations. Past performance does not guarantee future results.
Portfolio Composition by Quality Rating* | |
Rating | % of Total Investments |
Fixed Income Instruments | |
| A | 0.5% |
| BBB | 9.5% |
| BB | 35.2% |
| B | 43.1% |
| CCC | 8.2% |
| C | 2.0% |
| NR | 1.5% |
Total Investments | 100.0% |
* Source: BlackRock Solutions. Credit quality ratings are measured on a scale that generally ranges from AAA (highest) to D (lowest). All securities except for those labeled “NR” have been rated by Moody’s, Standard & Poor’s (“S&P”), or Fitch, which are all a Nationally Recognized Statistical Rating Organization (“NRSRO”). For purposes of this presentation, when ratings are available from more than one agency, the highest rating is used. Guggenheim Investments has converted Moody’s and Fitch ratings to the equivalent S&P rating. Security ratings are determined at the time of purchase and may change thereafter.
GEI l GUGGENHEIM ENERGY & INCOME FUND SEMIANNUAL REPORT l 15| | | |
SCHEDULE OF INVESTMENTS (Unaudited) | | March 31, 2016 |
| |
| |
| |
| | Face | |
| | Amount~ | Value |
CORPORATE BONDS†† – 96.5% | | |
Energy – 57.0% | | |
| Whiting Petroleum Corp. | | |
5.75% due 03/15/211 | $2,050,000 | $ 1,363,250 |
6.50% due 10/01/181 | 2,000,000 | 1,360,000 |
| DCP Midstream LLC | | |
5.35% due 03/15/202 | 2,000,000 | 1,721,067 |
| Unit Corp. | | |
6.63% due 05/15/211 | 3,250,000 | 1,633,125 |
| Sabine Pass Liquefaction LLC | | |
| 5.63% due 02/01/21 | 850,000 | 817,063 |
| 5.63% due 04/15/23 | 750,000 | 712,500 |
| Sunoco Logistics Partners Operations, LP | | |
| 5.95% due 12/01/25 | 1,500,000 | 1,507,035 |
| ContourGlobal Power Holdings S.A. | | |
7.13% due 06/01/192 | 1,550,000 | 1,505,438 |
| PDC Energy, Inc. | | |
| 7.75% due 10/15/22 | 1,500,000 | 1,496,249 |
| Halcon Resources Corp. | | |
8.63% due 02/01/202 | 2,100,000 | 1,491,000 |
| Marathon Petroleum Corp. | | |
| 3.40% due 12/15/20 | 1,500,000 | 1,475,372 |
| Gulfstream Natural Gas System LLC | | |
4.60% due 09/15/252 | 1,500,000 | 1,468,085 |
| Approach Resources, Inc. | | |
| 7.00% due 06/15/21 | 3,050,000 | 1,456,375 |
| Gibson Energy, Inc. | | |
6.75% due 07/15/212 | 1,550,000 | 1,426,000 |
| Antero Resources Corp. | | |
| 6.00% due 12/01/20 | 1,500,000 | 1,425,000 |
| CONSOL Energy, Inc. | | |
8.00% due 04/01/231 | 1,900,000 | 1,419,680 |
| Newfield Exploration Co. | | |
| 5.38% due 01/01/26 | 1,550,000 | 1,410,500 |
| Comstock Resources, Inc. | | |
10.00% due 03/15/202 | 2,850,000 | 1,403,625 |
| Carrizo Oil & Gas, Inc. | | |
| 7.50% due 09/15/20 | 1,500,000 | 1,398,750 |
| QEP Resources, Inc. | | |
| 6.88% due 03/01/21 | 1,500,000 | 1,376,250 |
| FTS International, Inc. | | |
8.13% due 06/15/202,3 | 2,000,000 | 1,348,978 |
| Summit Midstream Holdings LLC / Summit Midstream Finance Corp. | | |
7.50% due 07/01/211 | 1,500,000 | 1,177,500 |
See notes to financial statements.
16 l GEI l GUGGENHEIM ENERGY & INCOME FUND SEMIANNUAL REPORT| | | |
SCHEDULE OF INVESTMENTS (Unaudited) continued | | March 31, 2016 |
| |
| |
| |
| | Face | |
| | Amount~ | Value |
CORPORATE BONDS†† – 96.5% (continued) | | |
Energy – 57.0% (continued) | | |
| Crestwood Midstream Partners Limited Partnership / | | |
| Crestwood Midstream Finance Corp. | | |
6.25% due 04/01/232 | $800,000 | $ 592,000 |
| 6.13% due 03/01/22 | 750,000 | 562,500 |
| SM Energy Co. | | |
6.50% due 01/01/231 | 1,500,000 | 1,057,500 |
| Hess Corp. | | |
| 8.13% due 02/15/19 | 750,000 | 824,022 |
| TerraForm Power Operating LLC | | |
6.13% due 06/15/252 | 1,000,000 | 780,000 |
| EP Energy LLC / Everest Acquisition Finance, Inc. | | |
| 9.38% due 05/01/20 | 1,500,000 | 756,563 |
| Linn Energy LLC / Linn Energy Finance Corp. | | |
12.00% due 12/15/20*,1,2 | 4,750,000 | 653,125 |
| Atlas Energy Holdings Operating Company LLC / Atlas Resource Finance Corp. | | |
| 9.25% due 08/15/21 | 3,500,000 | 542,500 |
| SandRidge Energy, Inc. | | |
8.75% due 06/01/202,4 | 1,825,000 | 442,563 |
| BreitBurn Energy Partners Limited Partnership / BreitBurn Finance Corp. | | |
7.88% due 04/15/224 | 3,500,000 | 350,000 |
| Ultra Petroleum Corp. | | |
5.75% due 12/15/181,2 | 1,900,000 | 133,000 |
Total Energy | | 37,086,615 |
Utilities – 10.8% | | |
| LBC Tank Terminals Holding Netherlands BV | | |
6.88% due 05/15/232 | 1,680,000 | 1,562,400 |
| NRG Energy, Inc. | | |
8.25% due 09/01/201 | 1,500,000 | 1,511,250 |
| AES Corp. | | |
| 5.50% due 04/15/25 | 1,000,000 | 965,000 |
| 7.38% due 07/01/21 | 250,000 | 280,000 |
| 4.88% due 05/15/23 | 250,000 | 240,625 |
| Terraform Global Operating LLC | | |
9.75% due 08/15/222 | 1,750,000 | 1,312,500 |
| Viridian Group Fundco II | | |
| 7.50% due 03/01/20 | 950,000 EUR | 1,135,006 |
Total Utilities | | 7,006,781 |
Consumer, Cyclical – 9.4% | | |
| Ferrellgas Partners, LP | | |
| 8.63% due 06/15/20 | 1,665,000 | 1,581,750 |
| AmeriGas Finance LLC / AmeriGas Finance Corp. | | |
| 7.00% due 05/20/22 | 1,500,000 | 1,537,500 |
See notes to financial statements.
GEI l GUGGENHEIM ENERGY & INCOME FUND SEMIANNUAL REPORT l 17| | | |
SCHEDULE OF INVESTMENTS (Unaudited) continued | | March 31, 2016 |
| |
| |
| | Face | |
| | Amount~ | Value |
CORPORATE BONDS†† – 96.5% (continued) | | |
Consumer, Cyclical – 9.4% (continued) | | |
| WMG Acquisition Corp. | | |
6.75% due 04/15/221,2 | $1,325,000 | $ 1,311,750 |
| Suburban Propane Partners LP / Suburban Energy Finance Corp. | | |
| 7.38% due 08/01/21 | 950,000 | 966,625 |
| Nathan’s Famous, Inc. | | |
10.00% due 03/15/202 | 400,000 | 421,000 |
| NPC International Incorporated / NPC Operating Company A Inc / NPC Operating Co B Inc | | |
| 10.50% due 01/15/20 | 300,000 | 309,750 |
Total Consumer, Cyclical | | 6,128,375 |
Industrial – 5.2% | | |
| Dynagas LNG Partners Limited Partnership / Dynagas Finance, Inc. | | |
6.25% due 10/30/191 | 1,850,000 | 1,239,500 |
| Novelis, Inc. | | |
| 8.75% due 12/15/20 | 700,000 | 706,510 |
| 8.38% due 12/15/17 | 150,000 | 152,550 |
| StandardAero Aviation Holdings, Inc. | | |
10.00% due 07/15/232 | 575,000 | 549,125 |
| LMI Aerospace, Inc. | | |
| 7.38% due 07/15/19 | 300,000 | 282,000 |
| CNH Industrial Capital LLC | | |
| 4.38% due 11/06/20 | 200,000 | 196,500 |
| Coveris Holdings S.A. | | |
7.88% due 11/01/192 | 200,000 | 179,000 |
| GCP Applied Technologies, Inc. | | |
9.50% due 02/01/232 | 75,000 | 81,375 |
Total Industrial | | 3,386,560 |
Financial – 4.4% | | |
| Jefferies Finance LLC / JFIN Company-Issuer Corp. | | |
7.38% due 04/01/202 | 800,000 | 692,000 |
7.50% due 04/15/212 | 450,000 | 387,000 |
| National Financial Partners Corp. | | |
9.00% due 07/15/212 | 850,000 | 816,000 |
| NewStar Financial, Inc. | | |
| 7.25% due 05/01/20 | 350,000 | 315,000 |
| Lincoln Finance Ltd. | | |
| 6.88% due 04/15/21 | 250,000 EUR | 295,841 |
| Garfunkelux Holding Co. 3 S.A. | | |
| 8.50% due 11/01/22 | 200,000 GBP | 284,645 |
| HUB International Ltd. | | |
9.25% due 02/15/212 | 100,000 | 103,750 |
Total Financial | | 2,894,236 |
| |
| |
| | |
See notes to financial statements.
18 l GEI l GUGGENHEIM ENERGY & INCOME FUND SEMIANNUAL REPORT| | | |
SCHEDULE OF INVESTMENTS (Unaudited) continued | | March 31, 2016 |
| |
| |
| | Face | |
| | Amount~ | Value |
CORPORATE BONDS†† – 96.5% (continued) | | |
Communications – 3.7% | | |
| TIBCO Software, Inc. | | |
11.38% due 12/01/212 | $750,000 | $ 656,249 |
| Interoute Finco plc | | |
| 7.38% due 10/15/20 | 500,000 EUR | 617,284 |
| Neptune Finco Corp. | | |
6.63% due 10/15/252 | 350,000 | 378,403 |
| CSC Holdings LLC | | |
| 6.75% due 11/15/21 | 250,000 | 256,750 |
| MDC Partners, Inc. | | |
6.50% due 05/01/242 | 200,000 | 204,250 |
| Sprint Corp. | | |
| 7.88% due 09/15/23 | 250,000 | 191,197 |
| Sprint Communications, Inc. | | |
| 6.00% due 11/15/22 | 150,000 | 109,688 |
Total Communications | | 2,413,821 |
Consumer, Non-cyclical – 3.4% | | |
| Bumble Bee Holdings, Inc. | | |
9.00% due 12/15/171,2 | 1,100,000 | 1,102,750 |
| Midas Intermediate Holdco II LLC / Midas Intermediate Holdco II Finance, Inc. | | |
7.88% due 10/01/222 | 700,000 | 651,000 |
| Central Garden & Pet Co. | | |
| 6.13% due 11/15/23 | 350,000 | 364,000 |
| Opal Acquisition, Inc. | | |
8.88% due 12/15/212 | 100,000 | 69,750 |
Total Consumer, Non-cyclical | | 2,187,500 |
Basic Materials – 2.6% | | |
| TPC Group, Inc. | | |
8.75% due 12/15/201,2 | 1,535,000 | 1,074,500 |
| Eldorado Gold Corp. | | |
6.13% due 12/15/202 | 680,000 | 620,500 |
Total Basic Materials | | 1,695,000 |
Total Corporate Bonds | | |
| (Cost $73,580,410) | | 62,798,888 |
SENIOR FLOATING RATE INTERESTS††,3 – 31.6% | | |
Electric – 18.8% | | |
| TPF II Power LLC | | |
5.50% due 10/02/211 | 2,398,485 | 2,338,522 |
| Invenergy Thermal Operating I LLC | | |
6.50% due 10/19/221 | 1,695,750 | 1,594,005 |
| Texas Competitive Electric Holdings Company LLC | | |
3.75% due 11/07/161 | 1,500,000 | 1,492,500 |
See notes to financial statements.
GEI l GUGGENHEIM ENERGY & INCOME FUND SEMIANNUAL REPORT l 19| | | |
SCHEDULE OF INVESTMENTS (Unaudited) continued | | March 31, 2016 |
| |
| |
| |
| | Face | |
| | Amount~ | Value |
SENIOR FLOATING RATE INTERESTS††,3 – 31.6% (continued) | | |
Electric – 18.8% (continued) | | |
| Panda Hummel | | |
7.00% due 10/27/221 | $1,400,000 | $ 1,288,000 |
| Panda Sherman | | |
9.00% due 09/14/181 | 1,496,204 | 1,271,773 |
| Terraform AP Acquisition Holdings LLC | | |
5.00% due 06/26/221 | 1,397,024 | 1,257,322 |
| Panda Temple II Power | | |
7.25% due 04/03/191 | 1,496,250 | 1,249,369 |
| Stonewall (Green Energy) | | |
6.50% due 11/12/211 | 1,200,000 | 1,116,000 |
| Lone Star Energy | | |
| 5.25% due 02/22/21 | 1,000,000 | 635,000 |
Total Utilities | | 12,242,491 |
Energy – 3.6% | | |
| Jonah Energy LLC | | |
7.50% due 05/12/211 | 3,328,180 | 1,647,449 |
| Cactus Wellhead | | |
7.00% due 07/31/201 | 2,027,105 | 709,487 |
Total Energy | | 2,356,936 |
Industrial – 3.1% | | |
| Panda Power | | |
7.50% due 08/21/201 | 2,000,000 | 1,810,000 |
| LSF9 Cypress Holdings LLC | | |
7.25% due 10/09/221 | 199,500 | 188,861 |
Total Industrial | | 1,998,861 |
Utilities – 2.7% | | |
| Panda Moxie Patriot | | |
6.75% due 12/19/201 | 1,950,000 | 1,750,125 |
Communications – 1.4% | | |
| Cengage Learning Acquisitions, Inc. | | |
7.00% due 03/31/201 | 499,702 | 496,849 |
| Gogo LLC | | |
11.25% due 03/21/181 | 331,329 | 332,986 |
7.50% due 03/21/181 | 95,473 | 91,654 |
| Total Communications | | 921,489 |
Communications – 1.3% | | |
| Arch Coal, Inc. | | |
6.25% due 05/16/181 | 2,487,143 | 877,763 |
See notes to financial statements.
20 l GEI l GUGGENHEIM ENERGY & INCOME FUND SEMIANNUAL REPORT| | | |
SCHEDULE OF INVESTMENTS (Unaudited) continued | | March 31, 2016 |
| |
| |
| | Face | |
| | Amount~ | Value |
SENIOR FLOATING RATE INTERESTS††,3 – 31.6% (continued) | | |
Consumer, Cyclical – 0.7% | | |
| PETCO Animal Supplies, Inc. | | |
5.75% due 01/26/231 | $350,000 | $ 349,464 |
5.62% due 01/26/231 | 100,000 | 99,850 |
Total Consumer, Cyclical | | 449,314 |
Total Senior Floating Rate Interests | | |
| (Cost $22,992,948) | | 20,596,979 |
ASSET BACKED SECURITIES†† – 1.9% | | |
Collateralized Loan Obligation – 1.9% | | |
| TCW Global Project Fund II Ltd. | | |
2004-1A, 2.57% due 06/24/161,2,3 | 932,065 | 778,740 |
| Silver Spring CLO Ltd. | | |
3.62% due 10/15/263 | 500,000 | 422,194 |
Total Collateralized Loan Obligation | | 1,200,934 |
Total Asset Backed Securities | | |
| (Cost $1,365,764) | | 1,200,934 |
Total Investments – 130.0% | | |
| (Cost $97,939,122) | | $ 84,596,801 |
Other Assets & Liabilities, net – (30.0)% | | (19,514,899) |
Total Net Assets – 100.0% | | $ 65,081,902 |
| ~ | The face amount is denominated in U.S. Dollars, unless otherwise noted. |
| * | Security is not accruing income. |
| †† | Value determined based on Level 2 inputs – See Note 4. |
| 1 | All or a portion of these securities have been physically segregated or earmarked in connection with |
| | reverse repurchase agreements and unfunded loan commitments. As of March 31, 2016, the total |
| | market value of the segregated or earmarked securities was $35,514,799. |
| 2 | Security is a 144A or Section 4(a)(2) security. The total market value of 144A or Section 4(a)(2) |
| | securities is $25,916,923 (cost $30,982,415), or 39.8% of total net assets. These securities have been |
| | determined to be liquid under guidelines established by the Board of Trustees. |
| 3 | Variable rate security. Rate indicated is rate effective at March 31, 2016. |
| 4 | Security is in default of interest and/or principal obligations. |
| BV | Limited Liability Company |
| CLO | Collateralized Loan Obligation |
| EUR | Euro |
| GBP | British Pound |
| LLC | Limited Liability Company |
| LP | Limited Partnership |
| plc | Public Limited Company |
| S.A. | Corporation |
See Sector Classification in Supplemental Information section.
GEI l GUGGENHEIM ENERGY & INCOME FUND SEMIANNUAL REPORT l 21| | |
SCHEDULE OF INVESTMENTS (Unaudited) continued | March 31, 2016 |
The following table summarizes the inputs used to value the Fund’s investments at March 31, 2016 (see Note 4 in the Notes to Financial Statements):
| | | | | | | | | | | | | |
| | | | | | Level 2 | | | Level 3 | | | | |
| | | | | | Significant | | | Significant | | | | |
| | | Level 1 | | | Observable | | | Unobservable | | | | |
| | | Quoted Prices | | | Inputs | | | Inputs | | | Total | |
Assets: | | | | | | | | | | | | |
| Corporate Bonds | | $ | – | | | $ | 62,798,888 | | | $ | – | | | $ | 62,798,888 | |
| Senior Floating Rate Interests | | | – | | | | 20,596,979 | | | | – | | | | 20,596,979 | |
| Asset Backed Securities | | | – | | | | 1,200,934 | | | | – | | | | 1,200,934 | |
| Total Assets | | $ | – | | | $ | 84,596,801 | | | $ | – | | | $ | 84,596,801 | |
Liabilities: | | | | | | | | | | | | | | | | |
| Unfunded Commitments | | $ | – | | | $ | 22,470 | | | $ | – | | | $ | 22,470 | |
| Forward Foreign Currency Exchange Contracts | | | – | | | | 65,603 | | | | – | | | | 65,603 | |
| Total Liabilities | | $ | – | | | $ | 88,073 | | | $ | – | | | $ | 88,073 | |
Transfers between investment levels may occur as the markets fluctuate and/or the availability of data used in an investment’s valuation changes. Transfers between valuation levels, if any, are in comparison to the valuation levels at the end of the previous fiscal year, and are effective using the fair value as of the end of the current fiscal period.
As of March 31, 2016, there were no transfers between levels.
22 l GEI l GUGGENHEIM ENERGY & INCOME FUND SEMIANNUAL REPORT| | | | |
STATEMENT OF ASSETS AND LIABILITIES (Unaudited) | | March 31, 2016 |
| | |
| | |
ASSETS: | | | |
| Investments, at value (cost $97,939,122) | | $ | 84,596,801 | |
| Cash | | | 258,683 | |
| Receivables: | | | | |
| Interest | | | 1,780,227 | |
| Tax reclaims | | | 2,202 | |
| Other assets | | | 6,681 | |
Total assets | | | 86,644,594 | |
LIABILITIES: | | | | |
| Reverse repurchase agreements | | | 18,424,532 | |
| Unfunded loan commitments, at value (Note 10) (commitment fees | | | | |
| received $28,088) | | | 22,470 | |
| Unrealized depreciation on forward foreign currency exchange contracts | | | 65,603 | |
| Interest payable on borrowings | | | 13,981 | |
| Payable for: | | | | |
| Investments purchased | | | 2,708,569 | |
| Offering costs | | | 158,044 | |
| Investment advisory fees | | | 83,966 | |
| Fund accounting fees | | | 11,459 | |
| Trustees’ fees and expenses* | | | 7,832 | |
| Administration fees | | | 1,847 | |
| Accrued expenses and other liabilities | | | 64,389 | |
Total liabilities | | | 21,562,692 | |
NET ASSETS | | $ | 65,081,902 | |
NET ASSETS CONSIST OF: | | | | |
| Common stock, $.01 par value per share; unlimited number of shares | | | | |
| authorized, 79,240 shares issued and outstanding | | $ | 792 | |
| Additional paid-in capital | | | 79,063,522 | |
| Undistributed net investment income | | | 456,570 | |
| Accumulated net realized loss on investments | | | (1,031,591 | ) |
| Net unrealized depreciation on investments | | | (13,407,391 | ) |
NET ASSETS | | $ | 65,081,902 | |
| Net asset value | | $ | 821.33 | |
* Relates to Trustees not deemed “interested persons” within the meaning of Section 2(a)(19) of the 1940 Act.
See notes to financial statements.
GEI l GUGGENHEIM ENERGY & INCOME FUND SEMIANNUAL REPORT l 23| | | | |
STATEMENT OF OPERATIONS (Unaudited) | | March 31, 2016 |
| For the Six Months Ended March 31, 2016 | | | |
| | | | |
| | | | |
INVESTMENT INCOME: | | | |
| Interest | | $ | 4,536,846 | |
| Total investment income | | | 4,536,846 | |
EXPENSES: | | | | |
| Investment advisory fees | | | 474,989 | |
| Professional fees | | | 35,081 | |
| Fund accounting fees | | | 30,345 | |
| Trustees’ fees and expenses* | | | 29,862 | |
| Interest expense | | | 29,489 | |
| Transfer agent fees | | | 15,131 | |
| Registration and filings | | | 11,895 | |
| Administration fees | | | 10,450 | |
| Printing fees | | | 7,154 | |
| Custodian fees | | | 3,863 | |
| Other expenses | | | 1,069 | |
| Total expenses | | | 649,328 | |
| Net investment income | | | 3,887,518 | |
NET REALIZED AND UNREALIZED GAIN (LOSS): | | | | |
| Net realized gain (loss) on: | | | | |
| Investments | | | (1,072,115 | ) |
| Foreign currency transactions | | | 19,726 | |
| Net realized loss | | | (1,052,389 | ) |
| Net change in unrealized appreciation (depreciation) on: | | | | |
| Investments | | | (10,376,478 | ) |
| Foreign currency translations | | | (66,573 | ) |
| Net change in unrealized appreciation (depreciation) | | | (10,443,051 | ) |
| Net realized and unrealized loss | | | (11,495,440 | ) |
Net decrease in net assets resulting from operations | | $ | (7,607,922 | ) |
* Relates to Trustees not deemed “interested persons” within the meaning of Section 2(a)(19) of the 1940 Act.
See notes to financial statements.
24 l GEI l GUGGENHEIM ENERGY & INCOME FUND SEMIANNUAL REPORT| | | | | | | |
STATEMENTS OF CHANGES IN NET ASSETS | | | | | March 31, 2016 |
| | |
| | |
| | | | | | Period from | |
| | | Period Ended | | | August 13, 2015a | |
| | | March 31, 2016 | | | to | |
| | | (Unaudited) | | | September 30, 2015 | |
INCREASE (DECREASE) IN NET ASSETS FROM OPERATIONS: | | | | | | |
| Net investment income | | $ | 3,887,518 | | | $ | 119,483 | |
| Net realized gain (loss) on investments | | | (1,052,389 | ) | | | 20,798 | |
| Net change in unrealized appreciation (depreciation) on investments | | | (10,443,051 | ) | | | (2,964,340 | ) |
| Net decrease in net assets resulting from operations | | | (7,607,922 | ) | | | (2,824,059 | ) |
DISTRIBUTIONS TO SHAREHOLDERS FROM: | | | | | | | | |
| Net investment income | | | (3,550,431 | ) | | | – | |
SHAREHOLDER TRANSACTIONS: | | | | | | | | |
| Net proceeds from the issuance of common shares | | | – | | | | 79,122,000 | |
| Reinvestments | | | 100,358 | | | | – | |
| Common share offering costs charged to paid-in capital | | | – | | | | (158,044 | ) |
| Net increase in net assets resulting from shareholder transactions | | | 100,358 | | | | 78,963,956 | |
| Net increase (decrease) in net assets | | | (11,057,995 | ) | | | 76,139,897 | |
NET ASSETS: | | | | | | | | |
| Beginning of period | | | 76,139,897 | | | | – | |
| End of period | | $ | 65,081,902 | | | $ | 76,139,897 | |
| Undistributed net investment income at end of period | | $ | 456,570 | | | $ | 119,483 | |
a Commencement of operations | | | | | | | | |
See notes to financial statements.
GEI l GUGGENHEIM ENERGY & INCOME FUND SEMIANNUAL REPORT l 25| | | | |
STATEMENT OF CASH FLOWS (Unaudited) | | March 31, 2016 |
| For the Six Months Ended March 31, 2016 | | | |
| | | | |
| | | | |
Cash Flows from Operating Activities: | | | |
Net Decrease in net assets resulting from operations | | $ | (7,607,922 | ) |
Adjustments to Reconcile Net Increase in Net Assets Resulting from Operations to | | | | |
Net Cash Used In Operating and Investing Activities: | | | | |
| Net change in unrealized depreciation on investments | | | 10,376,478 | |
| Net change in unrealized depreciation on foreign currency translations | | | 66,573 | |
| Net realized loss on investments | | | 1,072,115 | |
| Net accretion of bond discount and amortization of bond premium | | | (991,813 | ) |
| Purchase of long-term investments | | | (50,172,097 | ) |
| Paydowns received on asset backed securities | | | 150,913 | |
| Proceeds from sale of long-term investments | | | 10,632,487 | |
| Net sales of short-term investments | | | 30,122,413 | |
| Increase in unfunded loan commitments, at value | | | 22,470 | |
| Increase in interest receivable | | | (625,046 | ) |
| Decrease in investments sold receivable | | | 46,828 | |
| Increase in tax reclaims receivable | | | (2,202 | ) |
| Increase in other assets | | | (6,681 | ) |
| Decrease in investments purchased payable | | | (8,357,997 | ) |
| Increase in investment advisory fees payable | | | 3,518 | |
| Increase in fund accounting fees payable | | | 5,413 | |
| Increase in interest payable on borrowings | | | 13,981 | |
| Increase in administration fees payable | | | 77 | |
| Increase in trustees’ fees and expenses payable | | | 7,832 | |
| Increase in accrued expenses and other liabilities | | | 11,477 | |
Net Cash Used In Operating and Investing Activities | | | (15,231,183 | ) |
Cash Flows From Financing Activities: | | | | |
| Distributions to common shareholders | | | (3,450,073 | ) |
| Increase in reverse repurchase agreements | | | 18,424,532 | |
Net Cash Provided in Financing Activities | | | 14,974,459 | |
| Net decrease in cash | | | (256,724 | ) |
Cash at Beginning of Period | | | 515,407 | |
Cash at End of Period | | $ | 258,683 | |
Supplemental Disclosure of Cash Flow Information: | | | | |
Cash paid during the period for interest | | $ | 15,508 | |
Supplemental Disclosure of Non Cash Financing Activity: | | | | |
Dividend reinvestment | | $ | 100,358 | |
See notes to financial statements.
26 l GEI l GUGGENHEIM ENERGY & INCOME FUND SEMIANNUAL REPORT| | | | | | | |
FINANCIAL HIGHLIGHTS | | | | | March 31, 2016 |
| | |
| | |
| | | Period Ended | | | | |
| | | March 31, | | | Period Ended | |
| | | 2016 | | | September 30, | |
| | | (Unaudited) | | | 2015(a) | |
Per Share Data: | | | | | | |
| Net asset value, beginning of period | | $ | 962.31 | | | $ | 1,000.00 | |
| Income from investment operations: | | | | | | | | |
Net investment income(b) | | | 49.11 | | | | 1.51 | |
| Net loss on investments (realized and unrealized) | | | (145.24 | ) | | | (37.20 | ) |
| Total from investment operations | | | (96.13 | ) | | | (35.69 | ) |
| Less distributions from: | | | | | | | | |
| Net investment income | | | (44.85 | ) | | | — | |
| Total distributions to shareholders | | | (44.85 | ) | | | — | |
| Common shares’ offering expenses | | | | | | | | |
| charged to paid-in capital | | | — | | | | (2.00 | ) |
| Net asset value, end of period | | $ | 821.33 | | | $ | 962.31 | |
Total Return(c) | | | | | | | | |
| Net asset value | | | -10.07 | % | | | -3.77 | % |
Ratios/Supplemental Data: | | | | | | | | |
| Net assets, end of period (in thousands) | | $ | 65,082 | | | $ | 76,140 | |
| Ratio to average net assets of: | | | | | | | | |
| Net investment income, including interest expense | | | 11.42 | %(e) | | | 1.26 | % |
Total expenses, including interest expense(d) | | | 1.91 | %(e) | | | 1.69 | % |
| Portfolio turnover rate | | | 15 | % | | | 65 | % |
| Senior Indebtedness | | | | | | | | |
| Total Borrowings outstanding (in thousands) | | $ | 18,425 | | | $ | — | |
Asset Coverage per $1,000 of indebtedness(f) | | $ | 4,532 | | | $ | — | |
| (a) | Since commencement of operations: August 13, 2015. Percentage amounts for the period, except total return and portfolio turnover rate, have been annualized. |
| (b) | Based on average shares outstanding. |
| (c) | Total investment return is calculated assuming an initial investment made at the net asset value at the beginning of the period, reinvestment of all dividends and distribution at net asset value during the period, if any. Total investment return does not reflect brokerage commissions. |
| (d) | Excluding interest expense, the operating expense ratio would be 1.82% for the period ended March 31, 2016. |
| (e) | Annualized. |
| (f) | Calculated by subtracting the Fund’s total liabilities (not including borrowings) from the Fund’s total assets and dividing by the total borrowings. |
See notes to financial statements.
GEI l GUGGENHEIM ENERGY & INCOME FUND SEMIANNUAL REPORT l 27| | |
NOTES TO FINANCIAL STATEMENTS (Unaudited) | March 31, 2016 |
Note 1 – Organization:
Guggenheim Energy & Income Fund (the “Fund”) was organized as a Delaware statutory trust on April 28, 2015, and commenced investment operations on August 13, 2015. The Fund is registered as a non-diversified, non-traded, closed-end management investment company under the Investment Company Act of 1940, as amended (the “1940 Act”).
The Fund’s primary investment objective is to provide high income. As a secondary investment objective, the Fund will seek capital appreciation.
Note 2 – Accounting Policies:
The Fund operates as an investment company and accordingly follows the investment company accounting and reporting guidance of the Financial Accounting Standards Board (“FASB”) Accounting Standards Codification Topic 946 Financial Services – Investment Companies.
The following significant accounting policies are in conformity with U.S. generally accepted accounting principles (“GAAP”) and are consistently followed by the Fund. This requires management to make estimates and assumptions that affect the reported amount of assets and liabilities and disclosure of contingent assets and liabilities at the date of the financial statements and the reported amounts of revenues and expenses during the reporting period. Actual results could differ from these estimates. All time references are based on Eastern Time.
(a) Valuation of Investments
The Board of Trustees of the Fund (the “Board”) has adopted policies and procedures for the valuation of the Fund’s investments (the “Valuation Procedures”). Pursuant to the Valuation Procedures, the Board has delegated to a valuation committee, consisting of representatives from Guggenheim’s investment management, fund administration, legal and compliance departments (the “Valuation Committee”), the day-to-day responsibility for implementing the Valuation Procedures, including, under most circumstances, the responsibility for determining the fair value of the Fund’s securities or other assets.
Valuations of the Fund’s securities are supplied primarily by pricing services appointed pursuant to the processes set forth in the Valuation Procedures. The Valuation Committee convenes monthly, or more frequently as needed and will review the valuation of all assets which have been fair valued for reasonableness. The Fund’s officers, through the Valuation Committee and consistent with the monitoring and review responsibilities set forth in the Valuation Procedures, regularly review procedures used by, and valuations provided by, the pricing services.
If the pricing service cannot or does not provide a valuation for a particular investment or such valuation is deemed unreliable, such investment is fair valued by the Valuation Committee.
Equity securities listed on an exchange (New York Stock Exchange (“NYSE”) or American Stock Exchange) are valued at the last quoted sales price as of the close of business on the NYSE, usually 4:00 p.m. on the valuation date. Equity securities listed on the NASDAQ market system are valued at the NASDAQ Official Closing Price on the valuation date, which may not necessarily represent the last sale price. If there has been no sale on such exchange or NASDAQ on such day, the security is valued at the mean of the most recent bid and ask prices on such day.
28 l GEI l GUGGENHEIM ENERGY & INCOME FUND SEMIANNUAL REPORT| | |
NOTES TO FINANCIAL STATEMENTS (Unaudited) continued | March 31, 2016 |
Open-end investment companies (“Mutual Funds”) are valued at their NAV as of the close of business on the valuation date.
Debt securities with a maturity of greater than 60 days at acquisition are valued at prices that reflect broker/dealer supplied valuations or are obtained from independent pricing services, which may consider the trade activity, treasury spreads, yields or price of bonds of comparable quality, coupon, maturity, and type, as well as prices quoted by dealers who make markets in such securities. Short-term debt securities with a maturity of 60 days or less at acquisition and repurchase agreements are valued at amortized cost, provided such amount approximates market value.
Typically loans are valued using information provided by an independent third party pricing service which uses broker quotes in a non-active market.
Generally, trading in foreign securities markets is substantially completed each day at various times prior to the close of the NYSE. The values of foreign securities are determined as of the close of such foreign markets or the close of the NYSE, if earlier. All investments quoted in foreign currency are valued in U.S. dollars on the basis of the foreign currency exchange rates prevailing at the close of U.S. business at 4:00 p.m. Investments in foreign securities may involve risks not present in domestic investments. The Valuation Committee will determine the current value of such foreign securities by taking into consideration certain factors which may include those discussed above, as well as the following factors, among others: the value of the securities traded on other foreign markets, ADR trading, closed-end fund trading, foreign currency exchange activity, and the trading prices of financial products that are tied to foreign securities such as World Equity Benchmark Securities. In addition, under the Valuation Procedures, the Valuation Committee and Guggenheim Funds Investment Advisors, LLC (“GFIA or the “Adviser”) are authorized to use prices and other information supplied by a third party pricing vendor in valuing foreign securities.
Investments for which market quotations are not readily available are fair valued as determined in good faith by the Adviser, subject to review by the Valuation Committee, pursuant to methods established or ratified by the Board. Valuations in accordance with these methods are intended to reflect each security’s (or asset’s) “fair value.” Each such determination is based on a consideration of all relevant factors, which are likely to vary from one pricing context to another. Examples of such factors may include, but are not limited to: (i) the type of security, (ii) the initial cost of the security, (iii) the existence of any contractual restrictions on the security’s disposition, (iv) the price and extent of public trading in similar securities of the issuer or of comparable companies, (v) quotations or evaluated prices from broker-dealers and/or pricing services, (vi) information obtained from the issuer, analysts, and/or the appropriate stock exchange (for exchange traded securities), (vii) an analysis of the company’s financial statements, and (viii) an evaluation of the forces that influence the issuer and the market(s) in which the security is purchased and sold (e.g. the existence of pending merger activity, public offerings or tender offers that might affect the value of the security).
(b) Investment Transactions and Investment Income
Investment transactions are accounted for on the trade date. Realized gains and losses on investments are determined on the identified cost basis. Interest income is recorded on an accrual basis. Discounts or premiums on debt securities purchased are accreted or amortized to interest income over the lives of the respective securities using the effective interest method. Interest income
GEI l GUGGENHEIM ENERGY & INCOME FUND SEMIANNUAL REPORT l 29| | |
NOTES TO FINANCIAL STATEMENTS (Unaudited) continued | March 31, 2016 |
also includes paydown gains and losses on mortgage-backed and asset-backed securities and senior and subordinated loans. Amendment fees are earned as compensation for evaluating and accepting changes to the original loan agreement and are recognized as interest income when received.
(c) Currency Translation
The accounting records of the Fund are maintained in U.S. dollars. All assets and liabilities initially expressed in foreign currencies are converted into U.S. dollars at prevailing exchange rates. Purchases and sales of investment securities, dividend and interest income, and certain expenses are translated at the rates of exchange prevailing on the respective dates of such transactions. Changes in the relationship of these foreign currencies to the U.S. dollar can significantly affect the value of the investments and earnings of the Funds. Foreign investments may also subject the Funds to foreign government exchange restrictions, expropriation, taxation or other political, social or economic developments, all of which could affect the market and/or credit risk of the investments.
The Funds do not isolate that portion of the results of operations resulting from changes in the foreign exchange rates on investments from the fluctuations arising from changes in the market prices of securities held. Such fluctuations are included with the net realized and unrealized gain or loss on investments.
Reported net realized foreign exchange gains and losses arise from sales of foreign currencies and currency gains or losses realized between the trade and settlement dates on investment transactions. Net unrealized exchange gains and losses arise from changes in the fair values of assets and liabilities other than investments in securities at the fiscal period end, resulting from changes in exchange rates.
(d) Forward Foreign Currency Exchange Contracts
Forward foreign currency exchange contracts are agreements between two parties to buy and sell currencies at a set price on a future date. Fluctuations in the value of open forward foreign currency exchange contracts are recorded for financial reporting purposes as unrealized appreciation and depreciation by the Fund until the contracts are closed. When the contracts are closed, realized gains and losses are recorded, and included on the Statement of Operations in foreign currency transactions.
(e) Distributions to Shareholders
The Fund intends to pay substantially all of its net investment income, if any, to Common Shareholders through quarterly distributions. These distributions will consist of investment company taxable income, which generally includes qualified dividend income, ordinary income and short-term capital gains. Any net realized long-term capital gains are distributed annually to Common Shareholders. To the extent distributions exceed taxable income, the excess will be deemed a return of capital.
Distributions to shareholders are recorded on the ex-dividend date. The amount and timing of distributions are determined in accordance with federal income tax regulations, which may differ from GAAP.
30 l GEI l GUGGENHEIM ENERGY & INCOME FUND SEMIANNUAL REPORT| | |
NOTES TO FINANCIAL STATEMENTS (Unaudited) continued | March 31, 2016 |
(f) Senior Loans
Senior loans in which the Fund invests generally pay interest rates which are periodically adjusted by reference to a base short-term, floating rate plus a premium. These base lending rates are generally (i) the lending rate offered by one or more major European banks, such as the one-month or three-month London Inter-Bank Offered Rate (LIBOR), (ii) the prime rate offered by one or more major United States banks, or (iii) the bank’s certificate of deposit rate. Senior floating rate interests often require prepayments from excess cash flows or permit the borrower to repay at its election. The rate at which the borrower repays cannot be predicted with accuracy. As a result, the actual remaining maturity may be substantially less than the stated maturities shown. The interest rate indicated on the Schedule of Investments is the rate in effect at March 31, 2016.
(g) When Issued
The Fund may purchase and sell interests in securities on a when-issued and delayed delivery basis, with payment and delivery scheduled for a future date. No income accrues to the Fund on such interests or securities in connection with such transactions prior to the date the Fund actually take delivery of such interests or securities. These transactions are subject to market fluctuations and are subject to the risk that the value at delivery may be more or less than the trade date purchase price. Although the Fund will generally purchase these securities with the intention of acquiring such securities, they may sell such securities before the settlement date.
(h) Indemnifications
Under the Fund’s organizational documents, its Trustees and Officers are indemnified against certain liabilities arising out of the performance of their duties to the Fund. In addition, throughout the normal course of business, the Fund enters into contracts that contain a variety of representations and warranties which provide general indemnifications. The Fund’s maximum exposure under these arrangements is unknown, as this would involve future claims that may be made against the Fund and/or its affiliates that have not yet occurred. However, based on experience, the Fund expects the risk of loss to be remote.
Note 3 – Investment Advisory Agreement, Sub-Advisory Agreement and Other Agreements:
Pursuant to an Investment Advisory Agreement (the “Agreement”) between the Fund and the Adviser, the Adviser furnishes offices, necessary facilities and equipment, provides administrative services, oversees the activities of Guggenheim Partners Investment Management, LLC (“GPIM” or the “Sub-Adviser”), provides personnel including certain officers required for the Fund’s administrative management and compensates the officers or trustees of the Fund who are affiliates of the Adviser. As compensation for these services, the Fund pays the Adviser a fee, payable monthly, in an amount equal to 1.25% of the Fund’s average daily managed assets.
Pursuant to a Sub-Advisory Agreement (the “Sub-Advisory Agreement”) among the Fund, the Adviser and the Sub-Adviser, GPIM provides a continuous investment program for the Fund’s portfolio; provides investment research, makes and executes recommendations for the purchase and sale of securities; and provides certain facilities and personnel, including certain officers required for its administrative management and pays the compensation of all officers and trustees of the Fund who are GPIM’s affiliates. As compensation for its services, the Adviser pays GPIM a fee, payable monthly, in an annual amount equal to 0.625% of the Fund’s average daily managed assets.
GEI l GUGGENHEIM ENERGY & INCOME FUND SEMIANNUAL REPORT l 31| | |
NOTES TO FINANCIAL STATEMENTS (Unaudited) continued | March 31, 2016 |
Certain officers and trustees of the Fund may also be officers, directors and/or employees of the Adviser or GPIM. The Fund does not compensate its officers or trustees who are officers, directors and/or employees of the aforementioned firms.
Rydex Fund Services, LLC (“RFS”), an affiliate of the Adviser and the Sub-Adviser, provides fund administration services to the Fund. As compensation for these services, RFS receives a fund administration fee payable monthly at the annual rate set forth below as a percentage of the average daily managed assets of the Fund.
| | |
Managed Assets | Rate |
| First $200,000,000 | 0.0275% |
| Next $300,000,000 | 0.0200% |
| Next $500,000,000 | 0.0150% |
| Over $1,000,000,000 | 0.0100% |
RFS acts as the Fund’s accounting agent. As accounting agent, RFS is responsible for maintaining the books and records of the Fund’s securities and cash. RFS receives a fund accounting fee payable monthly at the annual rate set forth below as a percentage of the average daily managed assets of the Fund.
| | |
Managed Assets | Rate |
| First $200,000,000 | 0.0300% |
| Next $300,000,000 | 0.0150% |
| Next $500,000,000 | 0.0100% |
| Over $1,000,000,000 | 0.0075% |
| Minimum annual charge | $50,000 |
| Certain out-of-pocket charges | Varies |
For purposes of calculating the fees payable under the foregoing agreements, “average daily managed assets” means the average daily value of the Fund’s total assets minus the sum of its accrued liabilities. “Total assets” means all of the Fund’s assets and is not limited to its investment securities. “Accrued liabilities” means all of the Fund’s liabilities other than borrowings for investment purposes.
The Bank of New York Mellon (“BNY”) acts as the Fund’s custodian. As custodian, BNY is responsible for the custody of the Fund’s assets.
Note 4 – Fair Value Measurement:
In accordance with GAAP, fair value is defined as the price that the Fund would receive to sell an investment or pay to transfer a liability in an orderly transaction with an independent buyer in the principal market, or in the absence of a principal market, the most advantageous market for the investment or liability. GAAP establishes a three-tier fair value hierarchy based on the types of inputs used to value assets and liabilities and requires corresponding disclosure. The hierarchy and the corresponding inputs are summarized below:
Level 1 — quoted prices in active markets for identical assets or liabilities.
Level 2 — significant other observable inputs (for example quoted prices for securities that are similar based on characteristics such as interest rates, prepayment speeds, credit risk, etc.).
32 l GEI l GUGGENHEIM ENERGY & INCOME FUND SEMIANNUAL REPORT| | |
NOTES TO FINANCIAL STATEMENTS (Unaudited) continued | March 31, 2016 |
Level 3 — significant unobservable inputs based on the best information available under the circumstances, to the extent observable inputs are not available, which may include assumptions.
The types of inputs available depend on a variety of factors, such as the type of security and the characteristics of the markets in which it trades, if any. Fair valuation determinations that rely on fewer or no observable inputs require greater judgment. Accordingly, fair value determinations for Level 3 securities require the greatest amount of judgment.
Independent pricing services are used to value a majority of the Fund’s investments. When values are not available from a pricing service, they will be determined under the valuation policies that have been reviewed and approved by the Board. In any event, values are determined using a variety of sources and techniques, including: market prices; broker quotes; and models which derive prices based on inputs such as prices of securities with comparable maturities and characteristics or based on inputs such as anticipated cash flows or collateral, spread over Treasuries, and other information and analysis. A significant portion of the Funds’ assets are categorized as Level 2, as indicated in this report.
Indicative quotes from broker-dealers, adjusted for fluctuations in criteria such as credit spreads and interest rates, may also be used to value the Fund’s assets and liabilities, i.e. prices provided by a broker-dealer or other market participant who has not committed to trade at that price. Although indicative quotes are typically received from established market participants, the Fund may not have the transparency to view the underlying inputs which support the market quotations.
Certain fixed income securities are valued by obtaining a monthly indicative quote from a broker-dealer, adjusted for fluctuations in criteria such as credit spreads and interest rates.
The inputs or methodologies used for valuing securities are not necessarily an indication of the risk associated with investing in those securities. The suitability of the techniques and sources employed to determine fair valuation are regularly monitored and subject to change.
Note 5 – Federal Income Taxes:
The Fund intends to continue to comply with the requirements of Subchapter M of the Internal Revenue Code of 1986, as amended (the “Internal Revenue Code”), applicable to regulated investment companies.
As of March 31, 2016, the cost of investments and accumulated unrealized appreciation (depreciation) on investments for federal income tax purposes were as follows:
| | | | | |
| | Gross Tax | Gross Tax | Net Tax Unrealized | Net Unrealized |
Cost of Investments | Unrealized | Unrealized | Depreciation on | Depreciation on |
for Tax Purposes | Appreciation | Depreciation | Investments | Foreign Currency |
| $97,939,122 | $610,624 | $(13,952,945) | $(13,342,321) | $(65,603) |
GEI l GUGGENHEIM ENERGY & INCOME FUND SEMIANNUAL REPORT l 33| | |
NOTES TO FINANCIAL STATEMENTS (Unaudited) continued | March 31, 2016 |
The net tax unrealized appreciation on unfunded commitments is $5,618.
As of September 30, 2015 (the most recent fiscal year end for federal income tax purposes), the components of accumulated earnings/(losses) (excluding paid-in capital) on a tax basis were as follows:
| | | |
Undistributed | Accumulated Long-Term | Net Unrealized |
Ordinary Income | Gains/(Accumulated Capital Loss) | Appreciation/(Depreciation) |
| $140,281 | $0 | $(2,964,340) |
For Federal income tax purposes, capital loss carryforwards represent realized losses of the Fund that may be carried forward and applied against future capital gains. Under the RIC Modernization Act of 2010, the Fund is permitted to carry forward capital losses for an unlimited period and such capital loss carryforwards will retain their character as either short-term or long-term capital losses. As of September 30, 2015, the Fund had no capital loss carryforward.
For all open tax years and all major jurisdictions, management of the Fund has concluded that there are no significant uncertain tax positions that would require recognition in the financial statements. Uncertain tax positions are tax positions taken or expected to be taken in the course of preparing the Fund’s tax returns that would not meet a more-likely-than not threshold of being sustained by the applicable tax authority and would be recorded as a tax expense in the current year. Open tax years are those that are open for examination by taxing authorities (i.e. generally the last four tax year ends and the interim tax period since then).
Note 6 – Investments in Securities:
For the period ended March 31, 2016, the cost of purchases and proceeds from sales of investments, excluding short-term investments, were $50,172,097 and $10,632,487, respectively.
Note 7 – Derivatives:
The Fund is required by GAAP to disclose: a) how and why a fund uses derivative instruments, b) how derivative instruments and related hedge fund items are accounted for, and c) how derivative instruments and related hedge items affect a fund’s financial position, results of operations and cash flows.
(a) Forward Foreign Currency Exchange Contracts
The Fund enters into forward foreign currency exchange contracts in order to hedge its exposure to changes in foreign currency exchange rates on its foreign portfolio holdings, to hedge certain firm purchases and sales commitments denominated in foreign currencies and for investment purposes.
A forward foreign currency exchange contract is a commitment to purchase or sell a foreign currency on a future date at a negotiated forward rate. Forward foreign currency exchange contracts involve elements of both market and credit risk in excess of the amounts reflected on the Statement of Assets and Liabilities. Risk may arise from the potential inability of a counterparty to meet the terms of a contract and from unanticipated movements in the value of a foreign currency relative to the U.S. dollar. The face or contract amount, in U.S. dollars, reflects the total exposure the Fund has in that particular currency contract.
34 l GEI l GUGGENHEIM ENERGY & INCOME FUND SEMIANNUAL REPORT| | |
NOTES TO FINANCIAL STATEMENTS (Unaudited) continued | March 31, 2016 |
At March 31, 2016, the following forward foreign currency exchange contracts were outstanding:
| | | | | | | | |
| | | | | | | | Net |
| | | | | | | | Unrealized |
| | | | | Settlement | Settlement | Value at | Appreciation |
Contracts to Sell | | Counterparty | Date | Value | 3/31/16 | (Depreciation) |
| EUR | 1,532,000 | | | | | | |
| for USD | 1,686,349 | | The Bank of New York Mellon | 04/11/2016 | $1,686,349 | $1,743,669 | $(57,320) |
| EUR | 269,000 | | | | | | |
| for USD | 300,882 | | The Bank of New York Mellon | 04/11/2016 | 300,882 | 306,167 | (5,285) |
| GBP | 201,000 | | | | | | |
| for USD | 285,718 | | The Bank of New York Mellon | 04/11/2016 | 285,718 | 288,716 | (2,998) |
| Total unrealized depreciation for forward foreign currency exchange contracts | | | $(65,603) |
(b) Summary of Derivatives Information
The following table presents the types of derivatives in the Fund by location as presented on the Statement of Assets Liabilities at March 31, 2016.
| | | | | | |
| Statement of Asset and Liabilities |
| Presentation of Fair Values of Derivative Instruments ($000s): |
| | Asset Derivatives | | | Liability Derivatives | |
| | Statement of Assets | | | Statement of Assets | |
Primary Risk Exposure | and Liabilities Location | Fair Value | | and Liabilities Location | Fair Value |
| Foreign exchange risk | Unrealized appreciation on | | | Unrealized depreciation on | |
| | forward foreign currency | | | forward foreign currency | |
| | exchange contracts | $— | | exchange contracts | $66 |
The following table presents the effect of derivatives instruments on the Statement of Operations for the six months ended March 31, 2016.
| | | |
| Effect of Derivative Instruments on the Statement of Operations: |
| Amount of Realized Gain (Loss) on Derivatives (value in $000s) |
Primary Risk | | Foreign Currency |
Exposure | | Transactions |
| Foreign exchange risk | | $9 |
| Change in Unrealized Appreciation/(Depreciation) on Derivatives (value in $000s) |
Primary Risk | | Foreign Currency |
Exposure | | Translations |
| Foreign exchange risk | | ($67) |
Derivative Volume
Forward Foreign Currency Exchange Contracts:
The Fund had the following activity in forward foreign currency exchange contracts during the six months ended March 31, 2016:
| | |
| Average Settlement Value Purchased | $ 726,727 |
| Average Settlement Value Sold | 674,282 |
GEI l GUGGENHEIM ENERGY & INCOME FUND SEMIANNUAL REPORT l 35| | |
NOTES TO FINANCIAL STATEMENTS (Unaudited) continued | March 31, 2016 |
Note 8 – Offsetting:
In the normal course of business, the Fund enters into transactions subject to enforceable master netting arrangements or other similar arrangements. Generally, the right to offset in those agreements allows the Fund to counteract the exposure to a specific counterparty with collateral received or delivered to that counterparty based on the terms of the arrangements. These arrangements provide for the right to liquidate upon the occurrence of an event of default, credit event upon merger or additional termination event.
In order to better define their contractual rights and to secure rights that will help the Fund mitigate their counterparty risk, the Fund may enter into an International Swaps and Derivatives Association, Inc. Master Agreement (“ISDA Master Agreement”) or similar agreement with their derivative contract counterparties. An ISDA Master Agreement is a bilateral agreement between a Fund and a counterparty that governs OTC derivatives, including foreign exchange contracts, and typically contains, among other things, collateral posting terms and netting provisions in the event of a default and/or termination event. The provisions of the ISDA Master Agreement typically permit a single net payment in the event of a default (close-out netting) or similar event, including the bankruptcy or insolvency of the counterparty.
For derivatives traded under an ISDA Master Agreement, the collateral requirements are typically calculated by netting the mark to market amount for each transaction under such agreement and comparing that amount to the value of any collateral currently pledged by the Funds and the counterparty. For financial reporting purposes, cash collateral that has been pledged to cover obligations of the Funds and cash collateral received from the counterparty, if any, is reported separately on the Statement of Assets and Liabilities as segregated cash with broker/ receivable for variation margin, or payable for swap settlement/variation margin. Generally, the amount of collateral due from or to a counter party must exceed a minimum transfer amount threshold (e.g., $300,000) before a transfer is required to be made. To the extent amounts due to the Funds from their counterparties are not fully collateralized, contractually or otherwise, the Funds bear the risk of loss from counterparty nonperformance. The Funds attempt to mitigate counterparty risk by only entering into agreements with counterparties that they believe to be of good standing and by monitoring the financial stability of those counterparties.
For financial reporting purposes, the Fund does not offset derivative assets and derivative liabilities that are subject to netting arrangements in the Statement of Assets and Liabilities.
The following tables present derivative financial instruments and secured financing transactions that are subject to enforceable netting arrangements and offset in the Statement of Assets and Liabilities in conformity with GAAP.
36 l GEI l GUGGENHEIM ENERGY & INCOME FUND SEMIANNUAL REPORT| | | | | | | | | | | | | | | | |
NOTES TO FINANCIAL STATEMENTS (Unaudited) continued | | | March 31, 2016 |
| | |
| | |
| | | | | | | | | Net Amounts | | | | | | | |
| | | | | | Gross Amounts | | | of Liabilities | | | Gross Amounts Not | | | | |
| | | Gross | | | Offset in the | | | Presented in the | | | Offset in the Statement | | | | |
| | | Amounts of | | | Statement of | | | Statement of | | | of Assets and Liabilities | | | | |
| | | Recognized | | | Assets and | | | Assets and | | | Financial | | | | |
Description | | Liabilities | | | Liabilities | | | Liabilities | | | Instruments | | | Net Amount | |
| Reverse Repurchase | | | | | | | | | | | | | | | |
| Agreements | | $ | 18,424,532 | | | $ | – | | | $ | 18,424,532 | | | $ | (18,424,532 | ) | | $ | – | |
| Forward Foreign | | | | | | | | | | | | | | | | | | | | |
| Currency Exchange | | | | | | | | | | | | | | | | | | | | |
| Contracts | | | 65,603 | | | | – | | | | 65,603 | | | | – | | | | (65,603 | ) |
Note 9 – Leverage:
Reverse Repurchase Agreements
The Fund may enter into reverse repurchase agreements as part of its financial leverage strategy. Under a reverse repurchase agreement, the Fund temporarily transfers possession of a portfolio instrument to another party, such as a bank or broker-dealer, in return for cash. At the same time, the Fund agrees to repurchase the instrument at an agreed upon time and price, which reflects an interest payment. Such agreements have the economic effect of borrowings. The Fund may enter into such agreements when it is able to invest the cash acquired at a rate higher than the cost of the agreement, which would increase earned income. When the Fund enters into a reverse repurchase agreement, any fluctuations in the market value of either the instruments transferred to another party or the instruments in which the proceeds may be invested would affect the market value of the Fund’s assets. As a result, such transactions may increase fluctuations in the market value of the Fund’s assets. For the six months ended March 31, 2016, the average daily balance for which reverse repurchase agreements were outstanding amounted to $11,281,364. The weighted average interest rate was 0.75%. At March 31, 2016, there was $18,424,532 in reverse repurchase agreements outstanding.
At March 31, 2016, the Fund had outstanding reverse repurchase agreements with various counterparties. Details of the reverse repurchase agreements by counterparty are as follows:
| | | | |
Counterparty | Interest Rates | Maturity Dates | Face Value |
| Barclays Capital, Inc. | 0.50% - 0.80% | 04/04/16 – 06/01/16 | $ 4,115,777 |
| Barclays Capital, Inc. | 0.75% - 0.90% | Open Maturity | 1,401,937 |
| Bank of America | 0.75% | 4/29/16 | 2,265,368 |
| Citigroup, Inc. | 0.80% | Open Maturity | 602,000 |
| Deutsche Bank | 0.80% | 04/08/16 – 04/28/16 | 2,322,000 |
| Deutsche Bank | 0.80% | Open Maturity | 2,504,700 |
| Royal Bank of Canada | 0.80% - 0.90% | 04/28/16 – 06/27/16 | 4,035,875 |
| Royal Bank of Canada | 0.95% | Open Maturity | 1,176,875 |
| | | | $ 18,424,532 |
GEI l GUGGENHEIM ENERGY & INCOME FUND SEMIANNUAL REPORT l 37| | |
NOTES TO FINANCIAL STATEMENTS (Unaudited) continued | March 31, 2016 |
The following is a summary of the remaining contractual maturities of the reverse repurchase agreements outstanding as of March 31, 2016, aggregated by asset class of the related collateral pledged by the Fund:
| | | | | | |
| | Overnight and | Up to | 31 – 90 | Greater than | |
| | Continuous | 30 days | days | 90 days | Total |
| Corporate Bonds | $ 5,685,512 | $ 6,145,632 | $ 6,593,388 | $ – | $ 18,424,532 |
| Gross amount of recognized liabilities | | | | | |
| for reverse repurchase agreements | $ 5,685,512 | $ 6,145,632 | $ 6,593,388 | $ – | $ 18,424,532 |
There is no guarantee that the Fund’s leverage strategy will be successful. The Fund’s use of leverage may cause the Fund’s NAV to be more volatile and can magnify the effect of any losses.
Note 10 – Loan Commitments:
Pursuant to the terms of certain Term Loan agreements, the Fund held unfunded loan commitments as of March 31, 2016. The Fund is obligated to fund these loan commitments at the borrower’s discretion. The Fund reserves against such contingent obligations by designating cash, liquid securities, and liquid term loans as a reserve. As of March 31, 2016, the total amount segregated in connection with reverse repurchase agreements and unfunded commitments was $35,514,799.
| | | | | |
At March 31, 2016, the Fund had the following unfunded loan commitments which could be extended at the option of the borrower: | |
| | | |
Borrower | Maturity Date | Face Amount | | Value |
| Arch Coal, Inc. | 01/31/17 | $ 561,753 | $ 22,470 |
| Lincoln Finance Limited | 12/31/15 | 850,000 | | – |
| | | $1,411,753 | $ 22,470 |
Note 11 – Capital:
In connection with its organization process, the Fund sold 100 shares of beneficial interest to Guggenheim Funds Distributors, LLC, an affiliate of the Adviser, for consideration of $100,000 at a price of $1,000 per share. The Fund issued 79,022 shares of common stock in its initial public offering. These shares were issued at $1,000 per share.
Beginning 18 months after completion of the offering, the Fund intends, but is not obligated, to conduct quarterly tender offers for up to 2.5% of the common shares then outstanding in the sole discretion of the Board. In a tender offer, the Fund will offer to repurchase outstanding common shares at the Fund’s NAV or a percentage of the Fund’s NAV per share on the last day of the offer.
Offering costs of $158,044 or $2.00 per share, in connection with the issuance of common shares were borne by the Fund and were charged to paid-in capital. The Adviser and GPIM agreed to pay offering expenses (other than sales load, but including reimbursement of expenses to the underwriters) in excess of $2.00 per common share.
38 l GEI l GUGGENHEIM ENERGY & INCOME FUND SEMIANNUAL REPORT| | |
NOTES TO FINANCIAL STATEMENTS (Unaudited) continued | March 31, 2016 |
Common Shares
The Fund has an unlimited amount of common shares, $0.01 par value, authorized and 79,240 issued and outstanding. Transactions in common shares were as follows:
| | | |
| | Six Months Ended | Period Ended |
| | March 31, 2016 | September 30, 2015 |
| Beginning Shares | 79,122 | – |
| Common shares issued through organization process | – | 100 |
| Common shares issued through underwritten offering | – | 79,022 |
| Common shares issued through dividend reinvestment | 118 | – |
| Ending shares | 79,240 | 79,122 |
Note 12 – Subsequent Event:
The Fund evaluated subsequent events through the date the financial statements were available for issue and determined there were no additional material events that would require adjustment to or disclosure in the Fund’s financial statements.
GEI l GUGGENHEIM ENERGY & INCOME FUND SEMIANNUAL REPORT l 39
| | |
SUPPLEMENTAL INFORMATION (Unaudited) | March 31, 2016 |
Federal Income Tax Information
In January 2017, you will be advised on IRS Form 1099 DIV or substitute 1099 DIV as to the federal tax status of the distributions received by you in the calendar year 2016.
Sector Classification
Information in the “Schedule of Investments” is categorized by sectors using sector-level classifications used by Bloomberg Industry Classification System, a widely recognized industry classification system provider. In the Fund’s registration statement, the Fund has investment policies relating to concentration in specific industries. For purposes of these investment policies, the Fund usually classifies industries based on industry-level classifications used by widely recognized industry classification system providers such as Bloomberg Industry Classification System, Global Industry Classification Standards and Barclays Global Classification Scheme.
Trustees
The Trustees of the Guggenheim Energy & Income Fund and their principal occupations during the past five years:
| | | | | | |
| | Position(s) | Term of Office | | Number of | |
| | Held | and Length | | Portfolios in | |
Name, Address* | with | of Time | Principal Occupation(s) | Fund Complex | Other Directorships |
and Year of Birth | Trust | Served** | During Past Five Years | Overseen | Held by Trustees |
Independent Trustees: | | | | |
Randall C. Barnes | Trustee | Since 2015 | Current: Private Investor (2001-present). | 103 | Current: Trustee, Purpose |
| (1951) | | | | | Investments Funds (2014- |
| | | | Former: Senior Vice President and Treasurer, | | present). |
| PepsiCo, Inc. (1993-1997); President, Pizza | | |
| | Hut International (1991-1993); Senior Vice | | |
| | President, Strategic Planning and New | | |
| | Business Development, PepsiCo, Inc. | | |
| | | | (1987-1990). | | |
| Donald A. Chubb, Jr. | Trustee | Since 2015 | Current: Business broker and manager of | 99 | Current: Midland Care, Inc. |
| (1946 ) | | | commercial real estate, Griffith & Blair, Inc. | | (2011-present). |
| | | | (1997-present). | | |
Jerry B. Farley | Trustee | Since 2015 | Current: President, Washburn University | 99 | Current: Westar Energy, Inc. |
| (1946) | | | (1997-present). | | (2004-present); CoreFirst Bank |
| | | | | | & Trust (2000-present). |
Roman Friedrich III | Trustee and | Since 2015 | Current: Founder and Managing Partner, | 99 | Current: Zincore Metals, Inc. |
| (1946) | Chairman of | | Roman Friedrich & Company (1998-present). | | (2009-present). |
| | the Contracts | | | | |
| | Review | | Former: Senior Managing Director, MLV & Co. | | Former: Axiom Gold and Silver |
| | Committee | | LLC (2010-2011). | | Corp. (2011-2012). |
40 l GEI l GUGGENHEIM ENERGY & INCOME FUND SEMIANNUAL REPORT| | | | | | |
SUPPLEMENTAL INFORMATION (Unaudited) continued | | March 31, 2016 |
| | | | | | |
| | Position(s) | Term of Office | | Number of | |
| | Held | and Length | | Portfolios in | |
Name, Address* | with | of Time | Principal Occupation(s) | Fund Complex | Other Directorships |
and Year of Birth | Trust | Served** | During Past Five Years | Overseen | Held by Trustees |
Independent Trustees continued: | | | | |
Robert B. Karn III | Trustee and | Since 2015 | Current: Consultant (1998-present). | 99 | Current: Peabody Energy |
| (1942) | Chairman of | | | | Company (2003-present); |
| | the Audit | | Former: Arthur Andersen LLP (1965-1997) and | | GP Natural Resource |
| | Committee | | Managing Partner, Financial and Economic | | Partners, LLC (2002- present). |
| | | | Consulting, St. Louis office (1987-1997). | | |
Ronald A. Nyberg | Trustee and | Since 2015 | Current: Partner, Nyberg & Cassioppi, LLC (2000- | 105 | Current: Edward-Elmhurst |
| (1953) | Chairman of | | present). | | Healthcare System (2012- |
| | the Nominating | | | | present). |
| | and Governance | | Former: Executive Vice President, General | | |
| | Committee | | Counsel, and Corporate Secretary, Van Kampen | | |
| | | | Investments (1982-1999). | | |
| | | | | | |
MaynardF.Oliverius | Trustee | Since 2015 | Current: Retired. | 99 | Current: Fort Hays State |
| (1943) | | | | | University Foundation |
| | | | Former: President and CEO, Stormont-Vail | | (1999-present); Stormont- |
| | | | HealthCare (1996-2012). | | Vail Foundation (2013- |
| | | | | | present); University of |
| | | | | | Minnesota MHA Alumni |
| | | | | | Philanthropy Committee |
| | | | | | (2009-present). |
| |
| | | | | | Former: Topeka |
| | | | | | Community Foundation |
| | | | | | (2009-2014). |
Ronald E. Toupin, Jr. | Trustee and | Since 2015 | Current: Portfolio Consultant (2010-present). | 102 | Former: Bennett Group |
| (1958) | Chairman of | | | | of Funds (2011-2013). |
| | the Board | | Former: Vice President, Manager and Portfolio | | |
| | Manager, Nuveen Asset Management (1998- | | |
| 1999); Vice President, Nuveen Investment | | |
| | | | Advisory Corp. (1992-1999); Vice President | | |
| | | | and Manager, Nuveen Unit Investment Trusts | | |
| | | | (1991-1999); and Assistant Vice President and | | |
| | | | Portfolio Manager, Nuveen Unit Investment | | |
| | | | Trusts (1988-1999), each of John Nuveen & | | |
| | | | Co., Inc. (1982-1999). | | |
GEI l GUGGENHEIM ENERGY & INCOME FUND SEMIANNUAL REPORT l 41| | |
SUPPLEMENTAL INFORMATION (Unaudited) continued | March 31, 2016 |
| | | | | | |
| | Position(s) | Term of Office | | Number of | |
| | Held | and Length | | Portfolios in | |
Name, Address* | with | of Time | Principal Occupation(s) | Fund Complex | Other Directorships |
and Year of Birth | Trust | Served** | During Past Five Years | Overseen | Held by Trustees |
Interested Trustee: | | | | | |
Donald C. | President, | Since 2015 | Current: President and CEO, certain other funds | 234 | Current: Clear Spring Life |
Cacciapaglia*** | Chief | | in the Fund Complex (2012-present); Vice | | Insurance Company (2015- |
| (1951) | Executive | | Chairman, Guggenheim Investments (2010- | | present); Guggenheim |
| Officer and | | present). | | Partners Japan, Ltd. (2014- |
| | Trustee | | | | present); Delaware Life |
| | | | Former: Chairman and CEO, Channel Capital | | (2013-present); Guggenheim |
| | | | Group, Inc. (2002-2010). | | Life and Annuity Company |
| | | | | | (2011-present); Paragon Life |
| | | | | | Insurance Company of |
| | | | | | Indiana (2011-present). |
* The business address of each Trustee is c/o Guggenheim Investments, 227 West Monroe Street, Chicago, IL 60606.
** Each Trustee serves an indefinite term, until his successor is elected and qualified.
*** This Trustee is deemed to be an “interested person” of the Fund under the 1940 Act by reason of his position with the Funds’ Adviser and/or the parent of the Adviser.
42 l GEI l GUGGENHEIM ENERGY & INCOME FUND SEMIANNUAL REPORT| | |
SUPPLEMENTAL INFORMATION (Unaudited) continued | March 31, 2016 |
Officers
The Principal Executive Officers of the Trust, who are not trustees, and their principal occupations during the past five years:
| | | | |
| | Position(s) | | |
| | held | Term of Office | |
Name, Address* | with the | and Length of | |
and Year of Birth | Trust | Time Served** | Principal Occupations During Past Five Years |
Officers: | | | |
Joseph M. Arruda | Assistant | Since 2015 | Current: Assistant Treasurer, certain other funds in the Fund Complex (2006-present); Vice President, |
| (1966) | Treasurer | | Security Investors, LLC (2010-present); CFO and Manager, Guggenheim Specialized Products, LLC |
| | | | (2009-present). |
| |
| | | | Former: Vice President, Security Global Investors, LLC (2010-2011); Vice President, Rydex Advisors, LLC |
| | | | (2010); Vice President, Rydex Advisors II, LLC (2010). |
William H. | Vice President | Since 2015 | Current: Vice President, certain other funds in the Fund Complex (2006-present); Managing Director, |
Belden, III | | | Guggenheim Funds Investment Advisors, LLC (2005-present). |
| (1965) | | | |
| | | | Former: Vice President of Management, Northern Trust Global Investments (1999-2005). |
Joanna M. | Chief | Since 2015 | Current: Chief Compliance Officer, certain funds in the Fund Complex (2012-present); Senior Managing |
Catalucci | Compliance | | Director, Guggenheim Investments (2012-present). |
| (1966) | Officer | | |
| | | | Former: Chief Compliance Officer and Secretary, certain other funds in the Fund Complex (2008-2012); |
| | | | Senior Vice President & Chief Compliance Officer, Security Investors, LLC and certain affiliates (2010- |
| | | | 2012); Chief Compliance Officer and Senior Vice President, Rydex Advisors, LLC and certain affiliates |
| | | | (2010-2011). |
James M. Howley | Assistant | Since 2015 | Current: Director, Guggenheim Investments (2004-present); Assistant Treasurer, certain other funds in |
| (1972) | Treasurer | | the Fund Complex (2006-present). |
| | | | |
| | | | Former: Manager of Mutual Fund Administration, Van Kampen Investments, Inc. (1996-2004). |
GEI l GUGGENHEIM ENERGY & INCOME FUND SEMIANNUAL REPORT l 43
| | |
SUPPLEMENTAL INFORMATION (Unaudited) continued | March 31, 2016 |
| | | | |
| | Position(s) | | |
| | held | Term of Office | |
Name, Address* | with the | and Length of | |
and Year of Birth | Trust | Time Served** | Principal Occupations During Past Five Years |
Officers continued: | | | |
Amy J. Lee | Chief Legal | Since 2015 | Current: Chief Legal Officer, certain other funds in the Fund Complex (2013-present); Senior Managing |
| (1961) | Officer | | Director, Guggenheim Investments (2012-present). |
| |
| | | | Former: Vice President, Associate General Counsel and Assistant Secretary, Security Benefit Life |
| | | | Insurance Company and Security Benefit Corporation (2004-2012). |
Mark E. | Secretary | Since 2015 | Current: Secretary, certain other funds in the Fund Complex (2007-present); Managing Director, |
Mathiasen | | | Guggenheim Investments (2007-present). |
| (1978) | | | |
Michael P. | Assistant | Since 2015 | Current: Assistant Secretary, certain other funds in the Fund Complex (2014-present); Vice President, |
Megaris | Secretary | | Guggenheim Investments (2012-present). |
| (1984) | | | |
| | | Former: J.D., University of Kansas School of Law (2009-2012). |
Adam Nelson | Assistant | Since 2015 | Current: Vice President, Guggenheim Investments (2015-present); Assistant Treasurer, certain other |
| (1979) | Treasurer | | funds in the Fund Complex (2015-present). |
| | | |
| | | | Former: Assistant Vice President and Fund Administration Director, State Street Corporation (2013- |
| | | | 2015); Fund Administration Assistant Director, State Street (2011-2013); Fund Administration Manager, |
| | | | State Street (2009-2011). |
Kimberly J. Scott | Assistant | Since 2015 | Current: Vice President, Guggenheim Investments (2012-present); Assistant Treasurer, certain other |
| (1974) | Treasurer | | funds in the Fund Complex (2012-present). |
| | | |
| | | | Former: Financial Reporting Manager, Invesco, Ltd. (2010-2011); Vice President/Assistant Treasurer, |
| | | | Mutual Fund Administration for Van Kampen Investments, Inc./Morgan Stanley Investment |
| | | | Management (2009-2010); Manager of Mutual Fund Administration, Van Kampen Investments, |
| | | | Inc./Morgan Stanley Investment Management (2005-2009). |
Bryan Stone | Vice | Since 2015 | Current: Vice President, certain other funds in the Fund Complex (2014-present); Managing Director, |
| (1979) | President | | Guggenheim Investments (2013-present). |
| | | |
| | | | Former: Senior Vice President, Neuberger Berman Group LLC (2009-2013); Vice President, Morgan |
| | | | Stanley (2002-2009). |
44 l GEI l GUGGENHEIM ENERGY & INCOME FUND SEMIANNUAL REPORT| | |
SUPPLEMENTAL INFORMATION (Unaudited) continued | March 31, 2016 |
| | | | |
| | Position(s) | | |
| | held | Term of Office | |
Name, Address* | with the | and Length of | |
and Year of Birth | Trust | Time Served** | Principal Occupations During Past Five Years |
Officers continued: | | | |
John L. Sullivan | Chief Financial | Since 2015 | Current: CFO, Chief Accounting Officer and Treasurer, certain other funds in the Fund Complex (2010- |
| (1955) | Officer, Chief | | present); Senior Managing Director, Guggenheim Investments (2010-present). |
| | Accounting | | |
| | Officer and | | Former: Managing Director and CCO, each of the funds in the Van Kampen Investments fund complex |
| | Treasurer | | (2004-2010); Managing Director and Head of Fund Accounting and Administration, Morgan Stanley |
| | | | Investment Management (2002-2004); CFO and Treasurer, Van Kampen Funds (1996-2004). |
* The business address of each officer is c/o Guggenheim Investments, 227 West Monroe Street, Chicago, IL 60606.
** Each officer serves an indefinite term, until his or her successor is duly elected and qualified. The date reflects the commencement date upon which the officer held any officer position with the Fund.
GEI l GUGGENHEIM ENERGY & INCOME FUND SEMIANNUAL REPORT l 45| | |
DIVIDEND REINVESTMENT PLAN (Unaudited) | March 31, 2016 |
Under the Fund’s dividend reinvestment plan (the “Plan”), a Common Shareholder whose Common Shares are registered in his or her own name will have all distributions reinvested automatically by Computershare Trust Company, N.A., which is agent under the Plan (the “Plan Agent”), unless the Common Shareholder elects to receive cash.
Distributions with respect to Common Shares registered in the name of a broker-dealer or other nominee (that is, in “street name”) will be reinvested in additional Common Shares under the Plan, unless the broker or nominee does not participate in the Plan or the Common Shareholder elects to receive distributions in cash. Investors who own Common Shares registered in street name should consult their broker-dealers for details regarding reinvestment. All distributions to investors who do not participate in the Plan will be paid by check mailed directly to the record holder by Computershare Trust Company, N.A., as dividend disbursing agent. A participant in the Plan who wishes to opt out of the Plan and elect to receive distributions in cash should contact Computershare Trust Company, N.A. through the Internet as specified below, in writing at the address specified below or by calling the telephone number specified below.
Under the Plan, distributors, including any capital gain distributions, will be automatically reinvested in additional Common Shares at the net asset value determined on the reinvestment date.
The Plan Agent maintains all shareholder accounts in the Plan and furnishes written confirmations of all transactions in the account, including information needed by shareholders for personal and tax records. Common Shares in the account of each Plan participant will be held by the Plan Agent in non-certificated form in the name of the participant.
In the case of shareholders such as banks, brokers or nominees, which hold Common Shares for others who are the beneficial owners, and participate in the Plan, the Plan Agent will administer the Plan on the basis of the number of Common Shares certified from time to time by the Common Shareholder as representing the total amount registered in the shareholder’s name and held for the account of beneficial owners who participate in the Plan.
The automatic reinvestment of dividends and other distributions will not relieve participants of any income tax that may be payable or required to be withheld on such dividends or distributions.
Experience under the Plan may indicate that changes are desirable. Accordingly, the Fund reserves the right to amend or terminate its Plan as applied to any voluntary cash payments made and any dividend or distribution paid subsequent to written notice of the change sent to the members of such Plan at least 90 days before the record date for such dividend or distribution. The Plan also may be amended or terminated by the Plan Agent on at least 90 days’ prior written notice to the participants in such Plan. All correspondence concerning the Plan should be directed to Computershare Trust Company, N.A., P.O. Box 30170, College Station, Texas 77842, Attention: Shareholder Services Department. Participants may also contact Computershare Trust Company, N.A. online at www.computershare.com/investor or by telephone at 1-866-488-3559.
46 l GEI l GUGGENHEIM ENERGY & INCOME FUND SEMIANNUAL REPORT| | |
FUND INFORMATION (Unaudited) | March 31, 2016 |
| | |
Board of Trustees | Investment Adviser |
| Randall C. Barnes | Guggenheim Funds Investment |
| | Advisors, LLC |
| Donald C. Cacciapaglia* | Chicago, IL |
| | |
| Donald A. Chubb, Jr. | Investment Sub-Adviser |
| | Guggenheim Partners Investment |
| Jerry B. Farley | Management, LLC |
| | Santa Monica, CA |
| Roman Friedrich III | |
| | Administrator and Accounting Agent |
| Robert B. Karn III | Rydex Fund Services, LLC |
| | Rockville, MD |
| Ronald A. Nyberg | |
| | Custodian |
| Maynard F. Oliverius | The Bank of New York Mellon |
| | New York, NY |
| Ronald E. Toupin, Jr., | |
Chairman | Legal Counsel |
| | Skadden, Arps, Slate, Meagher & |
| * Trustee is an “interested person” (as defined | Flom LLP |
| in section 2(a)(19) of the 1940 Act) | New York, NY |
| (“Interested Trustee”) of the Trust because of | |
| his position as the President and CEO of the | Independent Registered Public |
| Investment Adviser and Sub-Adviser. | Accounting Firm |
| | Ernst & Young LLP |
Principal Executive Officers | McLean, VA |
| Donald C. Cacciapaglia | |
President and Chief Executive Officer | |
| | |
| Joanna M. Catalucci | |
Chief Compliance Officer | |
| | |
| Amy J. Lee | |
Chief Legal Officer | |
| |
| Mark E. Mathiasen | |
Secretary | |
| |
| John L. Sullivan | |
Chief Financial Officer, | |
Chief Accounting Officer and Treasurer | |
GEI l GUGGENHEIM ENERGY & INCOME FUND SEMIANNUAL REPORT l 47| | |
FUND INFORMATION (Unaudited) continued | March 31, 2016 |
Privacy Principles of the Fund
The Fund is committed to maintaining the privacy of its shareholders and to safeguarding its non-public personal information. The following information is provided to help you understand what personal information the Fund collects, how the Fund protects that information and why, in certain cases, the Fund may share information with select other parties.
Generally, the Fund does not receive any non-public personal information relating to its shareholders, although certain non-public personal information of its shareholders may become available to the Fund. The Fund does not disclose any non-public personal information about its shareholders or former shareholders to anyone, except as permitted by law or as is necessary in order to service shareholder accounts (for example, to a transfer agent or third party administrator).
The Fund restricts access to non-public personal information about its shareholders to employees of the Fund’s investment advisor and its affiliates with a legitimate business need for the information. The Fund maintains physical, electronic and procedural safeguards designed to protect the non-public personal information of its shareholders.
Questions concerning your shares of Guggenheim Energy & Income Fund?
| · | If your shares are held in a Brokerage Account, contact your Broker. |
| · | If you have physical possession of your shares in certificate form, contact the Fund’s Transfer Agent:
Computershare Trust Company, N.A., P.O. Box 30170 College Station, TX 77842-3170; (866) 488-3559 or online at www.computershare.com/investor. |
This report is sent to shareholders of Guggenheim Energy & Income Fund for their information. It is not a Prospectus, circular or representation intended for use in the purchase or sale of shares of the Fund or of any securities mentioned in this report.
A description of the Fund’s proxy voting policies and procedures related to portfolio securities is available without charge, upon request, by calling the Fund at (800) 345-7999.
Information regarding how the Fund voted proxies for portfolio securities, if applicable, during the most recent 12-month period ended December 31, is also available, without charge and upon request by calling (800) 345-7999, by visiting the Fund’s website at guggenheiminvestments.com/xgeix or by accessing the Fund’s Form N-PX on the U.S. Securities and Exchange Commission’s (SEC) website at www.sec.gov.
The Fund files its complete schedule of portfolio holdings with the SEC for the first and third quarters of each fiscal year on Form N-Q. The Fund’s Form N-Q is available on the SEC website at www.sec.gov or by visiting the Fund’s website at guggenheiminvestments.com/xgeix. The Fund’s Form N-Q may also be viewed and copied at the SEC’s Public Reference Room in Washington, DC; information on the operation of the Public Reference Room may be obtained by calling (800) SEC-0330 or at www.sec.gov.
48 l GEI l GUGGENHEIM ENERGY & INCOME FUND SEMIANNUAL REPORTABOUT THE FUND MANAGER
Guggenheim Partners Investment Management, LLC
Guggenheim Partners Investment Management, LLC (“GPIM”) is an indirect subsidiary of Guggenheim Partners, LLC, a diversified financial services firm. The firm provides capital markets services, portfolio and risk management expertise, wealth management, and investment advisory services. Clients of Guggenheim Partners, LLC subsidiaries are an elite mix of individuals, family offices, endowments, foundations, insurance companies and other institutions.
Investment Philosophy
GPIM’s investment philosophy is predicated upon the belief that thorough research and independent thought are rewarded with performance that has the potential to outperform benchmark indexes with both lower volatility and lower correlation of returns over time as compared to such benchmark indexes.
Investment Process
GPIM’s investment process is a collaborative effort between various groups including the Portfolio Construction Group, which utilize proprietary portfolio construction and risk modeling tools to determine allocation of assets among a variety of sectors, and its Sector Specialists, who are responsible for security selection within these sectors and for implementing securities transactions, including the structuring of certain securities directly with the issuers or with investment banks and dealers involved in the origination of such securities.
| |
Guggenheim Funds Distributors, LLC |
| 227 West Monroe Street |
| Chicago, IL 60606 |
| Member FINRA/SIPC |
| (03/16) |
NOT FDIC-INSURED l NOT BANK-GUARANTEED l MAY LOSE VALUE
CEF-GEI-SAR-0316
Item 2. Code of Ethics.