| |
(Unaudited) | March 29, 2018 |
DEAR SHAREHOLDER
We thank you for your investment in the Guggenheim Energy & Income Fund (the “Fund”). This report covers the Fund’s performance for the six-month period ended March 29, 2018.
The Fund’s investment objective is to provide high income. As a secondary investment objective, the Fund seeks capital appreciation. There can be no assurance the Fund will achieve its investment objectives.
Under normal market conditions, the Fund invests at least 80% of its managed assets (net assets plus financial leverage) in securities of energy companies and income-producing securities of other issuers. The Fund intends to focus its energy company investments in debt securities, including bonds, debentures, notes, loans and loan participations, mezzanine and preferred securities, convertible securities, and structured products.
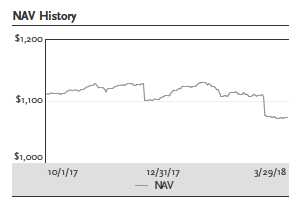
As a non-listed Fund, the Fund does not have a market price or market price return. For the semiannual fiscal period ended March 29, 2018, the Fund provided a total return based on net asset value (NAV) of 1.32%. The NAV return includes the deduction of management fees, operating expenses, and all other Fund expenses. As of March 29, 2018, the Fund’s NAV was $1,072.87 per share, compared with $1,112.09 per share on September 30, 2017.
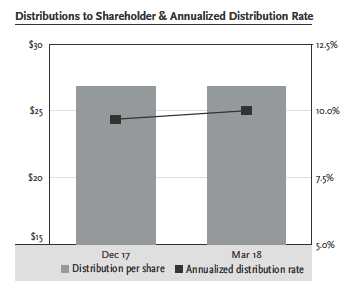
The Fund made two distributions in the period: $26.8125 on December 29, 2017, and $26.8125 on March 29, 2018. The distribution rate at the end of the period, based on the closing NAV, was 10.00%. The Fund’s distribution rate is not constant and the amount of distributions, when declared by the Fund’s Board of Trustees, is subject to change based on the performance of the Fund. Please see Note 1(d) on page 31 for more information on distributions for the period.
During the period, the Board of Trustees approved two tender offers, each to purchase for cash up to 2.5% of the Fund’s outstanding shares of common stock. Both were successfully completed, the most recent on April 6, 2018. The tender offers are discussed in more detail elsewhere in this report.
Guggenheim Funds Investment Advisors, LLC (the “Adviser”) serves as the investment adviser to the Fund. Guggenheim Partners Investment Management, LLC (“GPIM” or the “Sub-Adviser”) serves as the Fund’s investment sub-adviser and is responsible for the management of the Fund’s portfolio of investments. The Adviser and the Sub-Adviser are affiliates of Guggenheim Partners, LLC (“Guggenheim”), a global diversified financial services firm. Guggenheim Funds Distributors, LLC serves as the distributor to the Fund and is also an affiliate of Guggenheim.
GEI l GUGGENHEIM ENERGY & INCOME FUND SEMIANNUAL REPORT l 3| | |
(Unaudited) continued | March 29, 2018 |
To learn more about the Fund, we encourage you to read the Questions & Answers section of this report, which begins on page 5. You’ll find information on GPIM’s investment philosophy, views on the economy and market environment, and information about the Fund’s performance.
We appreciate your investment and look forward to serving your investment needs in the future. For the most up-to-date information on your investment, please visit the Fund’s website at guggenheiminvestments.com/xgeix.
Sincerely,
Brian E. Binder
President and Chief Executive Officer
Guggenheim Energy & Income Fund
April 30, 2018
4 l GEI l GUGGENHEIM ENERGY & INCOME FUND SEMIANNUAL REPORT| | |
QUESTIONS & ANSWERS (Unaudited) | March 29, 2018 |
Guggenheim Energy & Income Fund (the “Fund”) is managed by a team of seasoned professionals at Guggenheim Partners Investment Management, LLC (“GPIM”). This team includes Thomas Hauser, Senior Managing Director and Portfolio Manager; Steven Brown, Managing Director and Portfolio Manager; Adam Bloch, Director and Portfolio Manager; and Richard de Wet, Director and Portfolio Manager. In the following interview, the investment team discusses the market environment and the Fund’s performance for the six-month period ended March 29, 2018.
What is the Fund’s investment objective and how is it pursued?
The Fund’s investment objective is to provide high income. As a secondary investment objective, the Fund seeks capital appreciation. There can be no assurance the Fund will achieve its investment objectives.
Under normal market conditions, the Fund invests at least 80% of its managed assets (net assets plus financial leverage) in securities of energy companies and income-producing securities of other issuers. Energy companies include those that have at least 50% of their assets, income, sales, or profits committed to, or derived from:
| · | production, exploration, development, mining, extraction, transportation (including marine transportation), refining, processing, storage, distribution, management, marketing, and/or trading of oil, natural gas, natural gas liquids, refined petroleum products, coal, biofuels, or other natural resources used to produce energy, or ethanol; |
| · | generation, transmission, distribution, marketing, sale, and/or trading of all forms of electrical power (including through clean and renewable resources, such as solar energy, wind energy, geothermal energy, or hydropower) or gas; |
| · | manufacturing, marketing, management, sale, and/or trading of equipment, products or other supplies predominantly used by entities engaged in such businesses; and |
| · | provision of services to entities engaged in such businesses. |
Under normal market conditions, the Fund invests at least 70% of its managed assets in securities of energy companies. The Fund intends to focus its energy company investments in debt securities, including bonds, debentures, notes, loans and loan participations, mezzanine and preferred securities, convertible securities, and structured products. Other income-producing securities in which the Fund may invest include corporate bonds, debentures, notes, loans and loan participations, mezzanine and preferred securities, convertible securities, asset-backed securities, commercial paper, U.S. government securities, sovereign government and supranational debt securities, structured products, and dividend-paying common equity securities.
The Fund may invest in debt securities of any credit quality, and may invest without limitation in securities of below-investment-grade quality (also known as high yield securities or junk bonds). Securities of below-investment-grade quality are considered predominantly speculative with respect to the issuer’s capacity to pay interest and repay principal when due. Securities of below-investment-grade quality involve special risks as compared to investment-grade-quality securities.
GEI l GUGGENHEIM ENERGY & INCOME FUND SEMIANNUAL REPORT l 5| | |
QUESTIONS & ANSWERS (Unaudited) continued | March 29, 2018 |
The Fund may use financial leverage (borrowing) to finance the purchase of additional securities. Although financial leverage may create an opportunity for increased return for shareholders, it also results in additional risks and can magnify the effect of any losses. There is no assurance that the strategy will be successful. If income and gains earned on securities purchased with the financial leverage proceeds are greater than the cost of the financial leverage, common shareholders’ return will be greater than if financial leverage had not been used. Conversely, if the income or gains from the securities purchased with the proceeds of financial leverage are less than the cost of the financial leverage, common shareholders’ return will be less than if financial leverage had not been used.
How did the Fund perform for the period?
For the semiannual fiscal period ended March 29, 2018, the Fund provided a total return based on net asset value (NAV) of 1.32%. The NAV return includes the deduction of management fees, operating expenses, and all other Fund expenses. As of March 29, 2018, the Fund’s NAV was $1,072.87 per share, compared with $1,112.09 on September 30, 2017.
What were the Fund’s distributions for the period?
The Fund made two distributions in the period: $26.8125 on December 29, 2017, and $26.8125 on March 29, 2018. The distribution made on December 29, 2017 was characterized as a long-term capital gain distribution. The distribution rate at the end of the period, based on the closing NAV, was 10.00%. The Fund’s distribution rate is not constant and the amount of distributions, when declared by the Fund’s Board of Trustees, is subject to change based on the performance of the Fund. Please see Note 1(d) on page 31 for more information on distributions for the period.
Why did the Fund accrue excise tax during the period?
As a registered investment company, the Fund is subject to a 4% excise tax that is imposed if the Fund does not distribute by the end of any calendar year at least the sum of (i) 98% of its ordinary income (not taking into account any capital gain or loss) for the calendar year and (ii) 98.2% of its capital gain in excess of its capital loss (adjusted for certain ordinary losses) for a one-year period generally ending on October 31 of the calendar year (unless an election is made to use the fund’s fiscal year). The Fund generally intends to distribute income and capital gains in the manner necessary to minimize (but not necessarily eliminate) the imposition of such excise tax. While the Fund’s income and capital gains can vary significantly from year to year, the Fund seeks to maintain more stable monthly distributions over time. The Fund may retain income or capital gains and pay excise tax when it is determined that doing so is in the best interest of shareholders. Management, in consultation with the Board of Trustees, evaluates the costs of the excise tax relative to the benefits of retaining income and capital gains, including that such undistributed amounts (net of the excise tax paid) remain available for investment by the Fund and are available to supplement future distributions, which may facilitate the payment of more stable monthly distributions year over year.
6 l GEI l GUGGENHEIM ENERGY & INCOME FUND SEMIANNUAL REPORT| | |
QUESTIONS & ANSWERS (Unaudited) continued | March 29, 2018 |
Why is there no market price for the Fund?
The Fund is a non-listed closed-end fund. It is designed for long-term investors and an investment in the common shares should be considered illiquid. An investment in the common shares is not suitable for investors who need access to the money they invest. Unlike shares of open-end funds (commonly known as mutual funds), which generally are redeemable on a daily basis, the common shares are not redeemable at an investor’s option, and unlike traditional listed closed-end funds, the common shares are not listed on any securities exchange. Investors should not expect to be able to sell their common shares, regardless of how the Fund performs. Investors may not have access to the money invested until a shareholder liquidity event occurs.
What is a shareholder liquidity event?
The Fund intends to complete an event intended to provide liquidity on or before July 28, 2023 (liquidity event date). The Fund’s Board of Trustees may extend the liquidity event date for one year, to July 28, 2024, without a shareholder vote. The liquidity event date can be further extended beyond July 28, 2024, if approved by 75% of the Board of Trustees followed by approval by 75% of the outstanding voting securities of the Fund. A shareholder liquidity event will consist of either: termination and liquidation of the Fund, or a tender offer to repurchase 100% of the Fund’s outstanding common shares at a price equal to the then-current NAV. The Fund’s investment objectives and policies are not designed to seek to return to investors who purchased common shares in the initial offering their initial investment on the liquidity event date or any other date. Such initial investors and any investors who purchase common shares after the completion of the offering may receive less than their original investment through any shareholder liquidity event.
Did the Fund provide any liquidity for shareholders during the period?
During the period, the Board of Trustees approved two tender offers. Each being oversubscribed, in accordance with the terms and conditions specified in the tender offer, the Fund purchased shares from all tendering shareholders on a pro rata basis. Shares that were tendered but not accepted for purchase and shares that were not tendered remain outstanding.
| | | | |
| | Tender Offer | | |
Tender Expiration | (2.5% of outstanding | Shares | Purchase Price |
Dates | shares as of expiration) | Tendered | (NAV on expiration) |
| January 5, 2018 | 1,849 | 15,451 | $1,118.05 |
| April 6, 2018 | 1,806 | 14,634 | $1,072.58 |
GEI l GUGGENHEIM ENERGY & INCOME FUND SEMIANNUAL REPORT l 7| | |
QUESTIONS & ANSWERS (Unaudited) continued | March 29, 2018 |
In any given quarter, the Adviser may or may not recommend to the Board of Trustees that the Fund conduct a tender offer. Accordingly, there may be periods during which no tender offer is made, and it is therefore possible that no further tender offers will be conducted during the term of the Fund.
If no other tender offer is made, shareholders may not be able to sell their common shares as it is unlikely that a secondary market for the common shares will develop or, if a secondary market does develop, shareholders may be able to sell their common shares only at substantial discounts from NAV.
What were macroeconomic conditions over the period?
As we enter the ninth year of the current expansion, one of the most important new developments to evaluate is the impact of the corporate tax cuts passed into law at the end of 2017. Substantial late-cycle fiscal easing in the pipeline will prompt more restrictive monetary policy, which increases the risk that the economy will experience a boom-bust cycle that ends in a recession.
With the unemployment rate at 4.1% and core inflation rising, fiscal policy should be leaning against the economy to prevent overheating, rather than providing further stimulus. Faster wage growth, rising core inflation, and a low unemployment rate underpin our longstanding view that the U.S. Federal Reserve (the “Fed”) will raise interest rates four times in 2018. The number of rate hikes the market is pricing in, as reflected in Fed funds futures, rose from two to three in the early part of 2018.
High-yield corporate bonds saw an increase in volatility over the last six months. Macroeconomic factors became more visible, including geopolitical concerns, the introduction of tariffs on certain foreign goods, and the possibility of a trade war with large trading partners. However, fundamental factors underlying the corporate sector continue to remain supportive of high-yield bonds. Average leverage and interest coverage ratios continued to improve on the back of strong earnings growth.
How did the high yield energy market perform in this environment?
For the period, the energy sector of the Bloomberg Barclays U.S. Corporate High Yield Index returned 0.93%. Rising oil prices helped all subsections within Energy to contribute to performance, with exploration & production (E&P) the best-performer.
By comparison, the Bloomberg Barclays U.S. Corporate High Yield Index returned -0.39% and the Credit Suisse Leveraged Loan Index returned 2.77%. High-yield bonds outperformed the Bloomberg Barclays U.S. Aggregate Index for the period, which returned -1.08%.
What happened to the price of oil over the period?
Oil prices as measured by West Texas Intermediate rose steadily for the six-month period ended March 29, 2018, increasing from about $52 to $64 per barrel. Supporting the rise was the ongoing production cut by OPEC and Russia. That agreement began in 2017, was renewed in November, and is now expected to continue through the end of 2018. The cut has been responsible for diminishing supply globally by up to an estimated one million barrels a day.
8 l GEI l GUGGENHEIM ENERGY & INCOME FUND SEMIANNUAL REPORT| | |
QUESTIONS & ANSWERS (Unaudited) continued | March 29, 2018 |
The restriction in supply, along with strong global demand and a weaker dollar helped push the price of West Texas Intermediate in late January to its highest level in three years and spiked U.S. production, largely shale, to 10 million barrels per day, a level last seen in 1970. The stronger global economy has increased demand, which has helped clear the backlog of supply. In February, the U.S. Energy Information Agency said crude oil in storage fell below its five year average for the first time in four years. Other factors in the price action of oil over the period include unrest in key producing countries like Iran and Venezuela, and disruption caused by Hurricane Harvey.
Oil prices remain in line with GPIM’s expectations. The fundamentals continue to suggest a gradual normalization of supply in the market, as cuts in other parts of the world are offset by increases in U.S. shale production. Oil is expected to stay in the current range, despite the potential for slippage in the agreement of OPEC members as prices continue to rise.
Describe the environment for high yield bonds.
The high yield bond market, and specifically high yield energy, has benefited from the improvement in the price of oil, even though the pace of interest rate hikes has pressured prices in general. While 2018 is likely to be a year of coupon-like returns in high-yield, there is still some room for spread compression. As of March 29, 2018, high yield spreads were 127 basis points above the spreads historically experienced at this stage of the credit cycle.
New high yield supply in the first quarter of 2018 is $68 billion, about 22% below the same period last year. The diminished issuance has supported secondary prices even as high yield funds have experienced outflows from the asset class.
Despite increasing volatility in the equity market, corporate bond yield spreads have remained steady, anchored by a declining high-yield default rate. Moody’s predicts that the high-yield default rate could drop to 2.0% in January 2019, from 3.2% in January 2018. Real growth in the U.S. economy is expected to average about 3% in 2018 and 2019, which should support corporate fundamentals. Though difficult to foresee, a major industry-specific crisis is not expected. The risk of retail posing a large economic drag is much smaller than the risk posed by commodity industries in 2015 and 2016.
The Fund’s focus remains on credit selection and we continue to avoid highly levered industries and companies with heavy capital expenditure needs that can impair cash flow generation. Companies with strong cash flows, recurring revenue streams, and high-quality margins remain attractive in the later stages of the credit cycle.
How is the portfolio positioned at the end of the period?
The Fund is constructed to generate strong yield and to mitigate downside risk. GPIM has addressed this through focusing on secured bank loans along with bonds. In addition, the Fund has large exposures to midstream assets that face less downside commodity price risk and have significant asset coverage.
GEI l GUGGENHEIM ENERGY & INCOME FUND SEMIANNUAL REPORT l 9| | |
QUESTIONS & ANSWERS (Unaudited) continued | March 29, 2018 |
The Fund’s portfolio consists of about 40% secured paper, which we believe is more defensive as it places the Fund higher up in the capital structure and protects collateral. The majority of assets are trading above book price, and this increases our confidence that the Fund can continue to deliver on its dividend. The portfolio has about 70% energy exposure with some exposure to strong credits in other industries that present good relative value opportunities. The Fund is overweight midstream, equal weight E&P, and underweight oil field services and refining relative to issuance available in the high yield credit universe. GPIM does not expect a significant shift in the strategy or how the Fund is positioned.
What is the Fund’s leverage strategy?
The Fund may use financial leverage (borrowing) to finance the purchase of additional securities. As of March 29, 2018, the Fund’s leverage was approximately 19%. The purpose of leverage (borrowing) is to fund the purchase of additional securities that provide increased income and potentially greater appreciation to common shareholders than could be achieved from an unlevered portfolio.
Leverage results in greater NAV volatility and entails more downside risk than an unleveraged portfolio. The Fund expects to employ leverage primarily through indebtedness and engaging in reverse repurchase agreements. The Fund is permitted to issue preferred shares but has no current intention to do so. There is no guarantee that the Fund’s leverage strategy will be successful.
Index Definitions
Indices are unmanaged and reflect no expenses. It is not possible to invest directly in an index.
Bloomberg Barclays U.S. Corporate High Yield Index measures the U.S. dollar-denominated, high yield, fixed-rate corporate bond market. Securities are classified as high yield if the middle rating of Moody’s, Fitch, and S&P is Ba1/BB +/BB + or below.
Credit Suisse Leveraged Loan Index tracks the investable market of the U.S. dollar denominated leveraged loan market. It consists of issues rated “5B” or lower, meaning that the highest rated issues included in this index are Moody’s/S&P ratings of Baa1/BB+ or Ba1/BBB+. All loans are funded term loans with a tenor of at least one year and are made by issuers domiciled in developed countries.
10 l GEI l GUGGENHEIM ENERGY & INCOME FUND SEMIANNUAL REPORT| | |
QUESTIONS & ANSWERS (Unaudited) continued | March 29, 2018 |
Risks and Other Considerations
The views expressed in this report reflect those of the portfolio managers only through the report period as stated on the cover. These views are subject to change at any time, based on market and other conditions and should not be construed as a recommendation of any kind. The material may also include forward looking statements that involve risk and uncertainty, and there is no guarantee that any predictions will come to pass.
There can be no assurance that the Fund will achieve its investment objectives. The value of the Fund will fluctuate with the value of the underlying securities. Risk is inherent in all investing, including the loss of your entire principal. Therefore, before investing you should consider the risks carefully.
Please see guggenheiminvestments.com/xgeix for a more detailed discussion of the Fund’s risks and considerations.
This material is not intended as a recommendation or as investment advice of any kind, including in connection with rollovers, transfers, and distributions. Such material is not provided in a fiduciary capacity, may not be relied upon for or in connection with the making of investment decisions, and does not constitute a solicitation of an offer to buy or sell securities. All content has been provided for informational or educational purposes only and is not intended to be and should not be construed as legal or tax advice and/or a legal opinion. Always consult a financial, tax and/or legal professional regarding your specific situation.
GEI l GUGGENHEIM ENERGY & INCOME FUND SEMIANNUAL REPORT l 11| | |
PERFORMANCE REPORT AND FUND PROFILE (Unaudited) | March 29, 2018 |
| |
Fund Statistics | | | |
| Net Asset Value | | | $1,072.87 |
| Net Assets ($000) | | | $77,597 |
| |
AVERAGE ANNUAL TOTAL RETURNS | | | |
FOR THE PERIOD ENDED MARCH 29, 2018 | | | |
| | | | Since |
| | Six Month | One | Inception |
| | (non-annualized) | Year | (08/13/15) |
| Guggenheim Energy & Income Fund | | | |
| NAV | 1.32% | 2.98% | 12.34% |
Performance data quoted represents past performance, which is no guarantee of future results and current performance may be lower or higher than the figures shown. All NAV returns include the deduction of management fees, operating expenses and all other Fund expenses. The deduction of taxes that a shareholder would pay on Fund distributions or the redemption of Fund shares is not reflected in the total returns. For the most recent month-end performance figures, please visit guggenheiminvestments.com/xgeix. The investment return and principal value of an investment will fluctuate with changes in market conditions and other factors so that an investor’s shares, when redeemed, may be worth more or less than their original cost.
| | |
Portfolio Breakdown | % of Net Assets |
| Corporate Bonds | 96.8% |
| Senior Floating Rate Interests | 25.2% |
| Common Stocks | 1.3% |
| Asset Backed Securities | 0.6% |
Total Investments | 123.9% |
Other Assets & Liabilities, net | (23.9)% |
Net Assets | 100.0% |
12 l GEI l GUGGENHEIM ENERGY & INCOME FUND SEMIANNUAL REPORT| | |
PERFORMANCE REPORT AND FUND PROFILE (Unaudited) continued | March 29, 2018 |
GEI l GUGGENHEIM ENERGY & INCOME FUND SEMIANNUAL REPORT l 13| | |
PERFORMANCE REPORT AND FUND PROFILE (Unaudited) continued | March 29, 2018 |
| |
Ten Largest Holdings | % of Total Net Assets |
| Unit Corp., 6.63%, 05/15/21 | 4.2% |
| Exterran Energy Solutions Limited Partnership / EES Finance Corp., 8.13%, 05/01/25 | 3.2% |
| American Midstream Partners Limited Partnership / | |
| American Midstream Finance Corp., 8.50%, 12/15/21 | 3.0% |
| LBC Tank Terminals Holding Netherlands B.V., 6.88%, 05/15/23 | 2.8% |
| Summit Midstream Holdings LLC / Summit Midstream Finance Corp., 5.75%, 04/15/25 | 2.7% |
| Whiting Petroleum Corp., 5.75%, 03/15/21 | 2.7% |
| CNX Resources Corp., 8.00%, 04/01/23 | 2.6% |
| Arctic Long Carriers, 6.38%, 05/18/23 | 2.6% |
| Covey Park Energy LLC / Covey Park Finance Corp., 7.50%, 05/18/23 | 2.6% |
| MRP Generation Holding, 9.30%, 10/18/22 | 2.5% |
| Top Ten Total | 28.9% |
“Ten Largest Holdings” excludes any temporary cash or derivative investments.
Portfolio breakdown and holdings are subject to change daily. For more information, please visit guggenheiminvestments.com/xgeix. The above summaries are provided for informational purposes only and should not be viewed as recommendations. Past performance does not guarantee future results.
| | |
Portfolio Composition by Quality Rating* | |
Rating | % of Total Investments |
Fixed Income Instruments | |
| BBB | 8.3% |
| BB | 41.7% |
| B | 36.0% |
| CCC | 7.4% |
| NR** | 5.6% |
Other Instruments | 1.0% |
Total Investments | 100.0% |
| * | Source: Black Rock Solutions. Credit quality ratings are measured on a scale that generally ranges from AAA (highest) to D (lowest). All rated securities have been rated by Moody’s, Standard & Poor’s (“S&P”), or Fitch, which are all a Nationally Recognized Statistical Rating Organization (“NRSRO ”). For purposes of this presentation, when ratings are available from more than one agency, the highest rating is used. Guggenheim Investments has converted Moody’s and Fitch ratings to the equivalent S&P rating. Unrated securities do not necessarily indicate low credit quality. Security ratings are determined at the time of purchase and may change thereafter. |
| ** | NR securities do not necessarily indicate low credit quality. |
14 l GEI l GUGGENHEIM ENERGY & INCOME FUND SEMIANNUAL REPORT| | |
SCHEDULE OF INVESTMENTS (Unaudited) | March 29, 2018 |
| | | Shares | | | Value | |
| | |
COMMON STOCKS† – 1.3% | | | | | | |
Energy – 1.3% | | | | | | |
| SandRidge Energy, Inc.* | | | 39,465 | | | $ | 572,637 | |
| Approach Resources, Inc.* | | | 143,360 | | | | 374,170 | |
| Titan Energy LLC* | | | 23,593 | | | | 25,952 | |
| Comstock Resources, Inc.* | | | 1 | | | | 8 | |
Total Energy | | | | | | | 972,767 | |
Total Common Stocks | | | | | | | | |
| (Cost $2,039,326) | | | | | | | 972,767 | |
| | |
| | | Face | | | | | |
| | | Amount~ | | | Value | |
| | |
CORPORATE BONDS†† – 96.8% | | | | | | | | |
Energy – 59.2% | | | | | | | | |
| Unit Corp. | | | | | | | | |
| 6.63% due 05/15/21 | | | 3,250,000 | | | | 3,250,000 | |
| Exterran Energy Solutions Limited Partnership / EES Finance Corp. | | | | | | | | |
8.13% due 05/01/251 | | | 2,350,000 | | | | 2,491,000 | |
| American Midstream Partners Limited Partnership / American Midstream Finance Corp. | | | | | | | | |
| 8.50% due 12/15/21 | | | 2,345,000 | | | | 2,362,588 | |
| Summit Midstream Holdings LLC / Summit Midstream Finance Corp. | | | | | | | | |
5.75% due 04/15/251 | | | 2,200,000 | | | | 2,095,500 | |
| Whiting Petroleum Corp. | | | | | | | | |
5.75% due 03/15/211 | | | 2,050,000 | | | | 2,070,459 | |
| CNX Resources Corp. | | | | | | | | |
| 8.00% due 04/01/23 | | | 1,900,000 | | | | 2,014,000 | |
| Covey Park Energy LLC / Covey Park Finance Corp. | | | | | | | | |
7.50% due 05/15/251,2 | | | 2,000,000 | | | | 1,980,000 | |
| PDC Energy, Inc. | | | | | | | | |
| 5.75% due 05/15/26 | | | 1,500,000 | | | | 1,473,750 | |
| 6.13% due 09/15/24 | | | 450,000 | | | | 459,000 | |
| Sabine Pass Liquefaction LLC | | | | | | | | |
5.63% due 02/01/211 | | | 850,000 | | | | 893,690 | |
| 5.63% due 04/15/23 | | | 750,000 | | | | 800,986 | |
| Sunoco Logistics Partners Operations, LP | | | | | | | | |
5.95% due 12/01/251 | | | 1,500,000 | | | | 1,623,600 | |
| Newfield Exploration Co. | | | | | | | | |
| 5.38% due 01/01/26 | | | 1,550,000 | | | | 1,600,375 | |
| Gulfstream Natural Gas System LLC | | | | | | | | |
4.60% due 09/15/251,2 | | | 1,500,000 | | | | 1,571,740 | |
| Moss Creek Resources Holdings, Inc. | | | | | | | | |
7.50% due 01/15/262 | | | 1,500,000 | | | | 1,512,675 | |
| Crestwood Midstream Partners Limited Partnership / Crestwood Midstream Finance Corp. | | | | | | | | |
| 6.25% due 04/01/23 | | | 1,300,000 | | | | 1,309,750 | |
| 5.75% due 04/01/25 | | | 200,000 | | | | 198,250 | |
See notes to financial statements.
GEI l GUGGENHEIM ENERGY & INCOME FUND SEMIANNUAL REPORT l 15
| | |
SCHEDULE OF INVESTMENTS (Unaudited) continued | March 29, 2018 |
| | | Face | | | | |
| | | Amount~ | | | Value | |
| | |
CORPORATE BONDS†† – 96.8% (continued) | | | | | | |
Energy – 59.2% (continued) | | | | | | |
| Antero Resources Corp. | | | | | | |
| 5.00% due 03/01/25 | | | 1,500,000 | | | $ | 1,503,750 | |
| Hess Corp. | | | | | | | | |
| 4.30% due 04/01/27 | | | 1,200,000 | | | | 1,174,472 | |
| 7.88% due 10/01/29 | | | 200,000 | | | | 244,999 | |
| Parkland Fuel Corp. | | | | | | | | |
6.00% due 04/01/262 | | | 1,400,000 | | | | 1,407,000 | |
| Alta Mesa Holdings Limited Partnership / Alta Mesa Finance Services Corp. | | | | | | | | |
| 7.88% due 12/15/24 | | | 1,338,000 | | | | 1,393,192 | |
| Trinidad Drilling Ltd. | | | | | | | | |
6.63% due 02/15/252 | | | 1,450,000 | | | | 1,352,125 | |
| Indigo Natural Resources LLC | | | | | | | | |
6.88% due 02/15/262 | | | 1,300,000 | | | | 1,225,250 | |
| TerraForm Power Operating LLC | | | | | | | | |
6.62% due 06/15/251,2,3 | | | 1,000,000 | | | | 1,075,000 | |
| DCP Midstream Operating, LP | | | | | | | | |
5.35% due 03/15/202 | | | 1,025,000 | | | | 1,053,188 | |
| SRC Energy, Inc. | | | | | | | | |
| 6.25% due 12/01/25 | | | 1,050,000 | | | | 1,052,625 | |
| MPLX, LP | | | | | | | | |
4.88% due 12/01/241 | | | 1,000,000 | | | | 1,048,568 | |
| Callon Petroleum Co. | | | | | | | | |
| 6.13% due 10/01/24 | | | 1,000,000 | | | | 1,022,800 | |
| Pattern Energy Group, Inc. | | | | | | | | |
5.88% due 02/01/242 | | | 1,000,000 | | | | 1,022,500 | |
| Cheniere Corpus Christi Holdings LLC | | | | | | | | |
| 5.88% due 03/31/25 | | | 600,000 | | | | 627,750 | |
| 5.13% due 06/30/27 | | | 175,000 | | | | 173,688 | |
| Comstock Resources, Inc. | | | | | | | | |
| 10.00% due 03/15/20 | | | 700,000 | | | | 719,250 | |
| Gibson Energy, Inc. | | | | | | | | |
5.25% due 07/15/242 | | CAD 700,000 | | | | 544,723 | |
| Phillips 66 Partners, LP | | | | | | | | |
| 3.55% due 10/01/26 | | | 500,000 | | | | 475,814 | |
| TransMontaigne Partners Limited Partnership / TLP Finance Corp. | | | | | | | | |
| 6.13% due 02/15/26 | | | 400,000 | | | | 401,000 | |
| Carrizo Oil & Gas, Inc. | | | | | | | | |
| 7.50% due 09/15/20 | | | 323,000 | | | | 327,845 | |
| EP Energy LLC / Everest Acquisition Finance, Inc. | | | | | | | | |
8.00% due 02/15/252 | | | 410,000 | | | | 273,675 | |
| Murphy Oil Corp. | | | | | | | | |
| 5.75% due 08/15/25 | | | 100,000 | | | | 98,500 | |
See notes to financial statements.
16 l GEI l GUGGENHEIM ENERGY & INCOME FUND SEMIANNUAL REPORT| | |
SCHEDULE OF INVESTMENTS (Unaudited) continued | March 29, 2018 |
| | | Face | | | | |
| | | Amount~ | | | Value | |
| | |
CORPORATE BONDS†† – 96.8% (continued) | | | | | | |
Energy – 59.2% (continued) | | | | | | |
| BreitBurn Energy Partners Limited Partnership / BreitBurn Finance Corp. | | | | | | |
7.88% due 04/15/224 | | | 3,500,000 | | | $ | 21,875 | |
Total Energy | | | | | | | 45,946,952 | |
| | |
Communications – 8.0% | | | | | | | | |
| MDC Partners, Inc. | | | | | | | | |
6.50% due 05/01/242 | | | 1,775,000 | | | | 1,726,188 | |
| McGraw-Hill Global Education Holdings LLC / McGraw-Hill Global Education Finance | | | | | | | | |
7.88% due 05/15/242 | | | 1,475,000 | | | | 1,410,130 | |
| EIG Investors Corp. | | | | | | | | |
| 10.88% due 02/01/24 | | | 1,050,000 | | | | 1,145,372 | |
| Cengage Learning, Inc. | | | | | | | | |
9.50% due 06/15/241,2 | | | 1,125,000 | | | | 863,437 | |
| SFR Group S.A. | | | | | | | | |
7.38% due 05/01/262 | | | 700,000 | | | | 666,750 | |
| DISH DBS Corp. | | | | | | | | |
| 7.75% due 07/01/26 | | | 450,000 | | | | 421,987 | |
Total Communications | | | | | | | 6,233,864 | |
| | |
Utilities – 7.6% | | | | | | | | |
| LBC Tank Terminals Holding Netherlands B.V. | | | | | | | | |
6.88% due 05/15/231,2 | | | 2,080,000 | | | | 2,137,200 | |
| AES Corp. | | | | | | | | |
5.50% due 04/15/251 | | | 1,000,000 | | | | 1,033,750 | |
| 5.13% due 09/01/27 | | | 150,000 | | | | 152,625 | |
| Terraform Global Operating LLC | | | | | | | | |
6.13% due 03/01/262 | | | 1,025,000 | | | | 1,032,687 | |
| AmeriGas Partners Limited Partnership / AmeriGas Finance Corp. | | | | | | | | |
5.50% due 05/20/251 | | | 850,000 | | | | 820,250 | |
| AmeriGas Partners, LP / AmeriGas Finance Corp. | | | | | | | | |
| 5.75% due 05/20/27 | | | 775,000 | | | | 741,094 | |
Total Utilities | | | | | | | 5,917,606 | |
| | |
Consumer, Cyclical – 7.1% | | | | | | | | |
| Ferrellgas Partners Limited Partnership / Ferrellgas Partners Finance Corp. | | | | | | | | |
8.63% due 06/15/201 | | | 1,665,000 | | | | 1,527,637 | |
| Suburban Propane Partners Limited Partnership/Suburban Energy Finance Corp. | | | | | | | | |
| 5.88% due 03/01/27 | | | 1,200,000 | | | | 1,137,000 | |
| Titan International, Inc. | | | | | | | | |
| 6.50% due 11/30/23 | | | 1,050,000 | | | | 1,081,500 | |
| L Brands, Inc. | | | | | | | | |
| 7.60% due 07/15/37 | | | 500,000 | | | | 498,750 | |
| Ferrellgas, LP / Ferrellgas Finance Corp. | | | | | | | | |
| 6.75% due 01/15/22 | | | 450,000 | | | | 426,375 | |
See notes to financial statements.
GEI l GUGGENHEIM ENERGY & INCOME FUND SEMIANNUAL REPORT l 17| | |
SCHEDULE OF INVESTMENTS (Unaudited) continued | March 29, 2018 |
| | | Face | | | | |
| | | Amount~ | | | Value | |
| | |
CORPORATE BONDS†† – 96.8% (continued) | | | | | | |
Consumer, Cyclical – 7.1% (continued) | | | | | | |
| TVL Finance plc | | | | | | |
| 8.50% due 05/15/23 | | GBP 160,000 | | | $ | 241,875 | |
| Tesla, Inc. | | | | | | | |
5.30% due 08/15/252 | | | 225,000 | | | | 196,312 | |
| Williams Scotsman International, Inc. | | | | | | | | |
7.88% due 12/15/222 | | | 175,000 | | | | 181,016 | |
| PetSmart, Inc. | | | | | | | | |
5.88% due 06/01/252 | | | 250,000 | | | | 180,625 | |
Total Consumer, Cyclical | | | | | | | 5,471,090 | |
| | |
Financial – 4.7% | | | | | | | | |
| Jefferies Finance LLC / JFIN Company-Issuer Corp. | | | | | | | | |
7.25% due 08/15/242 | | | 450,000 | | | | 444,105 | |
7.50% due 04/15/212 | | | 400,000 | | | | 404,500 | |
7.38% due 04/01/202 | | | 400,000 | | | | 404,000 | |
6.88% due 04/15/222 | | | 350,000 | | | | 346,500 | |
| FBM Finance, Inc. | | | | | | | | |
8.25% due 08/15/212 | | | 700,000 | | | | 731,500 | |
| Hunt Companies, Inc. | | | | | | | | |
6.25% due 02/15/262 | | | 550,000 | | | | 530,953 | |
| Lincoln Finance Ltd. | | | | | | | | |
| 6.87% due 04/15/21 | | EUR 250,000 | | | | 318,628 | |
| NFP Corp. | | | | | | | | |
6.88% due 07/15/252 | | | 250,000 | | | | 248,125 | |
| USIS Merger Sub, Inc. | | | | | | | | |
6.88% due 05/01/252 | | | 200,000 | | | | 200,000 | |
Total Financial | | | | | | | 3,628,311 | |
| | |
Consumer, Non-cyclical – 4.4% | | | | | | | | |
| Great Lakes Dredge & Dock Corp. | | | | | | | | |
| 8.00% due 05/15/22 | | | 1,200,000 | | | | 1,230,000 | |
| Midas Intermediate Holdco II LLC | | | | | | | | |
7.88% due 10/01/222 | | | 825,000 | | | | 827,063 | |
| Valeant Pharmaceuticals International, Inc. | | | | | | | | |
7.00% due 03/15/242 | | | 575,000 | | | | 599,438 | |
| Flexi-Van Leasing, Inc. | | | | | | | | |
10.00% due 02/15/232 | | | 325,000 | | | | 322,562 | |
| Endo Finance LLC / Endo Finco, Inc. | | | | | | | | |
| 5.38% due 01/15/23 | | | 175,000 | | | | 132,562 | |
7.25% due 01/15/222 | | | 125,000 | | | | 108,437 | |
| Beverages & More, Inc. | | | | | | | | |
11.50% due 06/15/222 | | | 200,000 | | | | 184,000 | |
Total Consumer, Non-cyclical | | | | | | | 3,404,062 | |
See notes to financial statements.
18 l GEI l GUGGENHEIM ENERGY & INCOME FUND SEMIANNUAL REPORT| | |
SCHEDULE OF INVESTMENTS (Unaudited) continued | March 29, 2018 |
| | | Face | | | | |
| | | Amount~ | | | Value | |
| | |
CORPORATE BONDS†† – 96.8% (continued) | | | | | | |
Industrial – 3.5% | | | | | | |
| Dynagas LNG Partners Limited Partnership / Dynagas Finance, Inc. | | | | | | |
| 6.25% due 10/30/19 | | | 1,850,000 | | | $ | 1,859,250 | |
| Grinding Media Inc. / MC Grinding Media Canada Inc. | | | | | | | | |
7.38% due 12/15/232 | | | 500,000 | | | | 525,000 | |
| StandardAero Aviation Holdings, Inc. | | | | | | | | |
10.00% due 07/15/232 | | | 275,000 | | | | 298,719 | |
Total Industrial | | | | | | | 2,682,969 | |
| | |
Basic Materials – 2.3% | | | | | | | | |
| Alcoa Nederland Holding B.V. | | | | | | | | |
7.00% due 09/30/262 | | | 800,000 | | | | 862,000 | |
| Eldorado Gold Corp. | | | | | | | | |
6.13% due 12/15/202 | | | 680,000 | | | | 646,000 | |
| Big River Steel LLC / BRS Finance Corp. | | | | | | | | |
7.25% due 09/01/252 | | | 225,000 | | | | 233,437 | |
| GCP Applied Technologies, Inc. | | | | | | | | |
9.50% due 02/01/232 | | | 75,000 | | | | 82,568 | |
Total Basic Materials | | | | | | | 1,824,005 | |
Total Corporate Bonds | | | | | | | | |
| (Cost $74,259,874) | | | | | | | 75,108,859 | |
| | |
SENIOR FLOATING RATE INTERESTS††,1,7 – 25.2% | | | | | | | | |
Utilities – 12.8% | | | | | | | | |
| MRP Generation Holding | | | | | | | | |
| 9.30% (3 Month USD LIBOR + 7.00%) due 10/18/22 | | | 1,975,000 | | | | 1,903,406 | |
| Panda Power | | | | | | | | |
| 8.80% (3 Month USD LIBOR + 6.50%) due 08/21/20 | | | 1,958,003 | | | | 1,819,474 | |
| Invenergy Thermal Operating I, LLC | | | | | | | | |
| 7.80% (3 Month USD LIBOR + 5.50%) due 10/19/22 | | | 1,551,882 | | | | 1,470,408 | |
| Exgen Texas Power LLC | | | | | | | | |
due 09/18/215 | | | 1,989,444 | | | | 1,212,726 | |
| Panda Temple II Power | | | | | | | | |
| 8.30% (3 Month USD LIBOR + 6.00%) due 04/03/19 | | | 1,242,963 | | | | 1,143,526 | |
| Panda Moxie Patriot | | | | | | | | |
| 8.05% (3 Month USD LIBOR + 5.75%) due 12/19/20 | | | 1,101,806 | | | | 1,084,596 | |
| Stonewall | | | | | | | | |
| 7.80% (1 Month USD LIBOR + 5.50%) due 11/13/21 | | | 874,802 | | | | 856,212 | |
| Viva Alamo LLC | | | | | | | | |
due 02/22/215 | | | 436,068 | | | | 432,118 | |
Total Utilities | | | | | | | 9,922,466 | |
| | |
Energy – 3.7% | | | | | | | | |
| Penn Virginia Holding Corp. | | | | | | | | |
8.88% (3 Month USD LIBOR + 7.00%) due 09/29/22†††,6 | | | 1,275,000 | | | | 1,252,065 | |
See notes to financial statements.
GEI l GUGGENHEIM ENERGY & INCOME FUND SEMIANNUAL REPORT l 19| | |
SCHEDULE OF INVESTMENTS (Unaudited) continued | March 29, 2018 |
| | | Face | | | | |
| | | Amount~ | | | Value | |
| | |
SENIOR FLOATING RATE INTERESTS††,1,7 – 25.2% (continued) | | | | | | |
Energy – 3.7% (continued) | | | | | | |
| Summit Midstream Partners, LP | | | | | | |
| 7.88% (1 Month USD LIBOR + 6.00%) due 05/13/22 | | | 880,000 | | | $ | 888,800 | |
| Ultra Petroleum, Inc. | | | | | | | | |
| 4.76% (3 Month USD LIBOR + 3.00%) due 04/12/24 | | | 500,000 | | | | 494,375 | |
| PSS Companies | | | | | | | | |
| 6.34% (1 Month USD LIBOR + 4.50%) due 01/28/20 | | | 221,551 | | | | 214,351 | |
Total Energy | | | | | | | 2,849,591 | |
| | |
Consumer, Cyclical – 3.4% | | | | | | | | |
| Accuride Corp. | | | | | | | | |
| 7.55% (3 Month USD LIBOR + 5.25%) due 11/17/23 | | | 1,882,841 | | | | 1,901,670 | |
| Mavis Tire Express Services Corp. | | | | | | | | |
| 5.07% (3 Month USD LIBOR + 3.25%) due 02/28/25 | | | 474,101 | | | | 474,101 | |
| Blue Nile, Inc. | | | | | | | | |
| 8.80% (1 Month USD LIBOR + 6.50%) due 02/17/23 | | | 264,688 | | | | 266,011 | |
Total Consumer, Cyclical | | | | | | | 2,641,782 | |
| | |
Industrial – 3.2% | | | | | | | | |
| Arctic Long Carriers | | | | | | | | |
| 6.38% (3 Month USD LIBOR + 4.50%) due 05/18/23 | | | 1,985,000 | | | | 1,999,888 | |
| Diversitech Holdings, Inc. | | | | | | | | |
| 9.81% (3 Month USD LIBOR + 7.50%) due 06/02/25 | | | 500,000 | | | | 503,750 | |
Total Industrial | | | | | | | 2,503,638 | |
| | |
Technology – 1.7% | | | | | | | | |
| Planview, Inc. | | | | | | | | |
11.63% (3 Month USD LIBOR + 9.75%) due 07/27/23†††,6 | | | 1,000,000 | | | | 987,740 | |
| Advanced Computer Software | | | | | | | | |
| 11.37% (3 Month USD LIBOR + 9.50%) due 01/31/23 | | | 350,000 | | | | 343,000 | |
Total Technology | | | | | | | 1,330,740 | |
| | |
Communications – 0.4% | | | | | | | | |
| Cengage Learning Acquisitions, Inc. | | | | | | | | |
| 6.04% (3 Month USD LIBOR + 4.25%) due 06/07/23 | | | 311,907 | | | | 283,268 | |
Total Senior Floating Rate Interests | | | | | | | | |
| (Cost $19,826,192) | | | | | | | 19,531,485 | |
| | |
ASSET-BACKED SECURITIES†† – 0.6% | | | | | | | | |
Collateralized Loan Obligations – 0.6% | | | | | | | | |
| Jamestown CLO V Ltd. | | | | | | | | |
2014-5A, 6.83% (3 Month USD LIBOR + 5.10%) due 01/17/272,7 | | | 500,000 | | | | 498,491 | |
Total Asset-Backed Securities | | | | | | | | |
| (Cost $417,972) | | | | | | | 498,491 | |
See notes to financial statements.
20 l GEI l GUGGENHEIM ENERGY & INCOME FUND SEMIANNUAL REPORT| | |
SCHEDULE OF INVESTMENTS (Unaudited) continued | March 29, 2018 |
Face | | | |
Amount~ | | Value | |
| | |
Total Investments – 123.9% | | | |
| (Cost $96,543,364) | | $ | 96,111,602 | |
Other Assets & Liabilities, net – (23.9)% | | | (18,515,023 | ) |
Total Net Assets – 100.0% | | $ | 77,596,579 | |
| | |
FORWARD FOREIGN CURRENCY EXCHANGE CONTRACTS†† | | | | | | | | | |
| | | | | | | | | | | Value at | | | Net Unrealized | |
| | | Contracts to | | | Settlement | | Settlement | | | March 29, | | | Appreciation/ | |
Counterparty | | Sell | | Currency | Date | | Value | | | 2018 | | | (Depreciation) | |
| Bank of America | | | | | | | | | | | | | | |
| Merrill Lynch | | | 267,000 | | EUR | 04/10/18 | | $ | 329,593 | | | $ | 328,719 | | | $ | 874 | |
| J.P. Morgan | | | 708,000 | | CAD | 04/10/18 | | | 547,198 | | | | 549,688 | | | | (2,490 | ) |
| Citigroup | | | 177,000 | | GBP | 04/10/18 | | | 244,897 | | | | 248,427 | | | | (3,530 | ) |
| | | | | | | | | | | | | | | | | $ | (5,146 | ) |
~ | The face amount is denominated in U.S. dollars unless otherwise indicated. |
* | Non-income producing security. |
† | Value determined based on Level 1 inputs — See Note 4. |
†† | Value determined based on Level 2 inputs, unless otherwise noted — See Note 4. |
††† | Value determined based on Level 3 inputs — See Note 4. |
1 | All or a portion of these securities have been physically segregated or earmarked in connection with reverse repurchase agreement and unfunded loan commitments. As of March 29, 2018, the total market value of segregated or earmarked securities was $37,255,831. |
2 | Security is a 144A or Section 4(a)(2) security. These securities have been determined to be liquid under guidelines established by the Board of Trustees. The total market value of 144A or Section 4(a)(2) securities is $38,503,644 (cost $38,293,102), or 49.6% of total net assets. |
3 | Security is a step up/step down bond. The coupon increases or decreases at regular intervals until the bond reaches full maturity. |
4 | Security is in default of interest and/or principal obligations. |
5 | Term loan interests in the Fund's portfolio generally have variable rates. All or a portion of this security represents unsettled loan positions and may not have a stated coupon rate. |
6 | Security was fair valued by the Valuation Committee at March 29, 2018. The total market value of fair valued securities amounts to $2,239,805, (cost $2,239,574) or 2.9% of total net assets. |
7 | Variable rate security. Rate indicated is the rate effective at March 29, 2018. In some instances, the underlying reference rate shown was below the minimum rate earned by the security or has been adjusted by a predetermined factor. The settlement status of a position may also impact the effective rate indicated. In instances where multiple underlying reference rates and spread amounts are shown, the effective rate is based on a weighted average. |
| | |
| B.V. | Limited Liability Company |
| CAD | Canadian Dollar |
| CLO | Collateralized Loan Obligation |
| EUR | Euro |
See notes to financial statements.
GEI l GUGGENHEIM ENERGY & INCOME FUND SEMIANNUAL REPORT l 21| | |
SCHEDULE OF INVESTMENTS (Unaudited) continued | March 29, 2018 |
| GBP | British Pound |
| LIBOR | London Interbank Offered Rate |
| LLC | Limited Liability Company |
| plc | Public Limited Company |
| | |
| See Sector Classification in Supplemental Information section. |
The following table summarizes the inputs used to value the Fund’s investments at March 29, 2018 (See Note 4 in the Notes to Financial Statements):
| | | | | | | | | | | | | | | | |
| | | | | | Level 2 | | | | | | Level 3 | | | | |
| | | Level 1 | | | Significant | | | | | | Significant | | | | |
Investments in | | Quoted | | | Observable | | | Level 2 - | | | Unobservable | | | | |
Securities (Assets) | | Prices | | | Inputs | | | Other* | | | Inputs | | | Total | |
| Asset Backed Securities | | $ | — | | | $ | 498,491 | | | $ | — | | | $ | — | | | $ | 498,491 | |
| Common Stocks | | | 972,767 | | | | — | | | | — | | | | — | | | | 972,767 | |
| Corporate Bonds | | | — | | | | 75,108,859 | | | | — | | | | — | | | | 75,108,859 | |
| Forward Foreign Currency | | | | | | | | | | | | | | | | | | | | |
| Exchange Contracts | | | — | | | | — | | | | 874 | | | | — | | | | 874 | |
| Senior Floating Rate Interests | | | — | | | | 17,291,680 | | | | — | | | | 2,239,805 | | | | 19,531,485 | |
| Total Assets | | $ | 972,767 | | | $ | 92,899,030 | | | $ | 874 | | | $ | 2,239,805 | | | $ | 96,112,476 | |
| | | | | | | | | | | | | | | | | | | | | |
| | | | | | | Level 2 | | | | | | | Level 3 | | | | | |
| | | Level 1 | | | Significant | | | | | | | Significant | | | | | |
Investments in | | Quoted | | | Observable | | | Level 2 - | | | Unobservable | | | | | |
Securities (Liabilities) | | Prices | | | Inputs | | | Other* | | | Inputs | | | Total | |
| Forward Foreign Currency | | | | | | | | | | | | | | | | | | | | |
| Exchange Contracts | | $ | — | | | $ | — | | | $ | 6,020 | | | $ | — | | | $ | 6,020 | |
| Unfunded Loan Commitments | | | — | | | | — | | | | — | | | | — | ** | | | — | ** |
| Total Liabilities | | $ | — | | | $ | — | | | $ | 6,020 | | | $ | — | | | $ | 6,020 | |
| * | Other financial instruments include forward foreign currency exchange contracts, which are reported as unrealized gain/loss at period end. |
| ** | Market value is less than $1. |
The Fund may hold assets and/or liabilities in which the fair value approximates the carrying amount for financial statement purposes. As of period end, reverse repurchase agreements of $17,834,232 are categorized as Level 2 within the disclosure hierarchy.
The following is a summary of significant unobservable inputs used in the fair valuation of assets and liabilities categorized within Level 3 of the fair value hierarchy:
| | | | | | | | | | | |
| | | Ending Balance at | | Valuation | Unobservable | | Input | | Weighted | |
Category | | March 29,2018 | | Technique | Inputs | | Range | | Average | |
| Senior Floating Rate Interests | | $ | 2,239,805 | | Yield Analysis | Yield | | | 8.5%–11.1% | | | 9.6 | % |
Transfers between investment levels may occur as the markets fluctuate and/or the availability of data used in an investment’s valuation changes. Transfers between valuation levels, if any, are in comparison to the valuation levels at the end of the previous fiscal year, and are effective using the fair value as of the end of the current fiscal period.
For the period ended March 29, 2018, the Fund had securities with a total value of $1,249,500 transferred into Level 3 from Level 2 due to lack of observable inputs.
22 l GEI l GUGGENHEIM ENERGY & INCOME FUND SEMIANNUAL REPORT| | |
SCHEDULE OF INVESTMENTS (Unaudited) continued | March 29, 2018 |
Summary of Fair Value Level 3 Activity
Following is a reconciliation of Level 3 assets for which significant unobservable inputs were used to determine fair value for the year ended March 29, 2018:
| | | | | | | |
Level 3 — Fair value measurement using significant unobservable inputs | | | | | | |
| | | Assets | | | Liabilities | |
| | | Senior Floating | | | Unfunded Loan | |
| | | Rate Interests | | | Commitments | |
| Beginning Balance | | $ | 3,098,752 | | | $ | (— | )* |
| (Sales, maturities and paydowns)/Fundings | | | (2,138,889 | ) | | | — | |
| Corporate actions | | | 110,472 | | | | — | |
| Total realized gains or losses included in earnings | | | (1,067,770 | ) | | | — | |
| Total change in unrealized gains or | | | 987,740 | | | | | |
| losses included in earnings | | | — | | | | (— | )* |
| Transfers into Level 3 | | | 1,249,500 | | | | — | |
| Ending Balance | | $ | 2,239,805 | | | $ | (— | )* |
| Net change in unrealized appreciation (depreciation) | | | | | | | | |
| for investments in securities still held at March 29,2018 | | $ | 232 | | | $ | (— | )* |
| * | Market value is less than $1. |
GEI l GUGGENHEIM ENERGY & INCOME FUND SEMIANNUAL REPORT l 23| | |
STATEMENT OF ASSETS AND LIABILITIES (Unaudited) | March 29, 2018 |
ASSETS: | | | |
| Investments, at value (cost $96,543,364) | | $ | 96,111,602 | |
| Unrealized appreciation on forward foreign currency exchange contracts | | | 874 | |
| Receivables: | | | | |
| Interest | | | 1,510,591 | |
| Investments sold | | | 92,895 | |
| Other assets | | | 1,289 | |
Total assets | | | 97,717,251 | |
LIABILITIES: | | | | |
| Unfunded loan commitments, at value (Note 8) | | | — | |
| Reverse repurchase agreements | | | 17,834,232 | |
| Unrealized depreciation on forward foreign currency exchange contracts | | | 6,020 | |
| Segregated cash for reverse repurchase agreements due to broker | | | 214,000 | |
| Due to custodian | | | 1,456,431 | |
| Payable for: | | | | |
| Investments purchased | | | 460,000 | |
| Investment advisory fees | | | 102,577 | |
| Professional fees | | | 18,224 | |
| Other liabilities | | | 29,188 | |
Total liabilities | | | 20,120,672 | |
NET ASSETS | | $ | 77,596,579 | |
NET ASSETS CONSIST OF: | | | | |
| Common stock, $0.01 par value per share; unlimited number of shares | | | | |
| authorized, 72,326 shares issued and outstanding | | $ | 723 | |
| Additional paid-in capital | | | 71,283,764 | |
| Undistributed net investment income | | | 1,756,845 | |
| Accumulated net realized gain on investments | | | 4,991,895 | |
| Net unrealized depreciation on investments | | | (436,648 | ) |
NET ASSETS | | $ | 77,596,579 | |
| Net asset value | | $ | 1,072.87 | |
See notes to financial statements.
24 l GEI l GUGGENHEIM ENERGY & INCOME FUND SEMIANNUAL REPORT| | |
STATEMENT OF OPERATIONS (Unaudited) | March 29, 2018 |
| For the Six Months Ended March 29, 2018 | |
INVESTMENT INCOME: | | | |
| Interest | | $ | 5,029,517 | |
| Total investment income | | | 5,029,517 | |
EXPENSES: | | | | |
| Investment Advisory Fees | | | 674,119 | |
| Interest expense | | | 217,818 | |
| Excise tax expense | | | 206,556 | |
| Professional fees | | | 63,923 | |
| Printing fees | | | 54,484 | |
| Trustees’ fees and expenses* | | | 38,948 | |
| Fund accounting fees | | | 29,239 | |
| Administration fees | | | 14,831 | |
| Transfer agent fees | | | 9,873 | |
| Custodian fees | | | 5,938 | |
| Insurance | | | 3,054 | |
| Other expenses | | | 1,832 | |
| Total expenses | | | 1,320,615 | |
| Net investment income | | | 3,708,902 | |
NET REALIZED AND UNREALIZED GAIN (LOSS): | | | | |
| Net realized gain (loss) on: | | | | |
| Investments | | | 1,462,989 | |
| Foreign currency transactions | | | (653 | ) |
| Forward foreign currency exchange contracts | | | 21,923 | |
| Net realized gain | | | 1,484,259 | |
| Net change in unrealized appreciation (depreciation) on: | | | | |
| Investments | | | (4,072,492 | ) |
| Foreign currency translations | | | (484 | ) |
| Forward foreign currency exchange contracts | | | (20,670 | ) |
| Net change in unrealized appreciation (depreciation) | | | (4,093,646 | ) |
| Net realized and unrealized loss | | | (2,609,387 | ) |
Net increase in net assets resulting from operations | | $ | 1,099,515 | |
* Relates to Trustees not deemed "interested persons" within the meaning of Section 2(a)(19) of the 1940 Act.
See notes to financial statements.
GEI l GUGGENHEIM ENERGY & INCOME FUND SEMIANNUAL REPORT l 25| | |
STATEMENTS OF CHANGES IN NET ASSETS | March 29, 2018 |
| | | Period Ended | | | Year Ended | |
| | | March 29, 2018 | | | September 30, | |
| | | (Unaudited) | | | 2017 | |
INCREASE (DECREASE) IN NET ASSETS FROM OPERATIONS: | | | | | | |
| Net investment income | | $ | 3,708,902 | | | $ | 7,414,093 | |
| Net realized gain on investments | | | 1,484,259 | | | | 8,415,732 | |
| Net change in unrealized appreciation (depreciation) on investments | | | (4,093,646 | ) | | | (4,539,528 | ) |
| Net increase in net assets resulting from operations | | | 1,099,515 | | | | 11,290,297 | |
DISTRIBUTIONS TO SHAREHOLDERS FROM: | | | | | | | | |
| Net investment income | | | (1,936,533 | ) | | | (7,794,552 | ) |
| Capital gains | | | (1,983,079 | ) | | | — | |
| Total distributions to shareholders | | | (3,919,612 | ) | | | (7,794,552 | ) |
SHAREHOLDER TRANSACTIONS: | | | | | | | | |
| Reinvestments | | | 234,014 | | | | 441,267 | |
| Common shares redeemed through tender offers | | | (4,174,974 | ) | | | (4,429,638 | ) |
| Net decrease in net assets resulting from shareholder transactions | | | (3,940,960 | ) | | | (3,988,371 | ) |
| Net decrease in net assets | | | (6,761,057 | ) | | | (492,626 | ) |
NET ASSETS: | | | | | | | | |
| Beginning of period | | | 84,357,636 | | | | 84,850,262 | |
| End of period | | $ | 77,596,579 | | | $ | 84,357,636 | |
| Undistributed (distributions in excess of) net investment | | | | | | | | |
| income at end of period | | $ | 1,756,845 | | | $ | (15,524 | ) |
See notes to financial statements.
26 l GEI l GUGGENHEIM ENERGY & INCOME FUND SEMIANNUAL REPORT| | |
STATEMENT OF CASH FLOWS (Unaudited) | March 29, 2018 |
| For the Six Months Ended March 29, 2018 |
Cash Flows from Operating Activities: | | | |
| Net Increase in Net Assets Resulting from Operations | | $ | 1,099,515 | |
Adjustments to Reconcile Net Increase in Net Assets Resulting from Operations to | | | | |
Net Cash Provided by Operating and Investing Activities: | | | | |
| Net change in unrealized depreciation on investments | | | 4,072,492 | |
| Net change in unrealized depreciation on foreign currency translations | | | 484 | |
| Net change in unrealized depreciation on forward foreign currency exchange contracts | | | 20,670 | |
| Net realized gain on investments | | | (1,462,989 | ) |
| Net accretion of bond discount and amortization of bond premium | | | (1,448,714 | ) |
| Purchase of long-term investments | | | (12,706,418 | ) |
| Proceeds from sale of long-term investments | | | 21,691,901 | |
| Paydowns received on asset backed securities | | | 6,323,454 | |
| Net purchase of short-term investments | | | 1,870,312 | |
| Decrease in interest receivable | | | 163,348 | |
| Increase in investments sold receivable | | | (84,631 | ) |
| Decrease in other assets | | | 3,054 | |
| Decrease in investments purchased payable | | | (1,243,438 | ) |
| Decrease in investment advisory fees payable | | | (18,166 | ) |
| Decrease in professional fees payable | | | (45,887 | ) |
| Increase in other liabilities | | | 18,805 | |
| Net Cash Provided by Operating and Investing Activities | | | 18,253,792 | |
Cash Flows From Financing Activities: | | | | |
| Distributions to common shareholders | | | (3,685,598 | ) |
| Proceeds from reverse repurchase agreements | | | 72,824,608 | |
| Payments made on reverse repurchase agreements | | | (85,053,371 | ) |
| Payments for common shares redeemed for tender offers | | | (4,174,974 | ) |
| Due to custodian | | | 1,456,431 | |
| Net Cash Provided in Financing Activities | | | (18,632,904 | ) |
| Net increase in cash | | | (379,112 | ) |
Cash at Beginning of Period (including foreign currency) | | | 379,112 | |
Cash at End of Period | | $ | — | |
Supplemental Disclosure of Cash Flow Information: | | | | |
Cash paid during the period for interest | | $ | 185,614 | |
Supplemental Disclosure of Non Cash Financing Activity: Dividend reinvestment | | $ | 234,014 | |
See notes to financial statements.
GEI l GUGGENHEIM ENERGY & INCOME FUND SEMIANNUAL REPORT l 27| | |
FINANCIAL HIGHLIGHTS | March 29, 2018 |
This table is presented to show selected data for a share outstanding throughout each period and to assist shareholders in evaluating the Fund’s performance for the periods presented. |
| | | Period | | | | | | | | | | |
| | | Ended | | | Year Ended | | | Year Ended | | | Period Ended | |
| | | March 29, 2018 | | | September 30, | | | September 30, | | | September 30, | |
| | | (Unaudited) | | | 2017 | | | 2016 | | | 2015(a) | |
Per Share Data: | | | | | | | | | | | | |
| Net asset value, beginning of period | | $ | 1,112.09 | | | $ | 1,068.74 | | | $ | 962.31 | | | $ | 1,000.00 | |
| Income from investment operations: | | | | | | | | | | | | | | | | |
Net investment income(b) | | | 50.23 | | | | 94.86 | | | | 93.30 | | | | 1.51 | |
| Net gain (loss) on investments (realized and unrealized) | | | (35.82 | ) | | | 48.43 | | | | 106.74 | | | | (37.20 | ) |
| Total from investment operations | | | 14.41 | | | | 143.29 | | | | 200.04 | | | | (35.69 | ) |
| Less distributions from: | | | | | | | | | | | | | | | | |
| Net investment income | | | (26.81 | ) | | | (99.94 | ) | | | (93.61 | ) | | | — | |
| Capital gains | | | (26.82 | ) | | | — | | | | — | | | | — | |
| Total distributions to shareholders | | | (53.63 | ) | | | (99.94 | ) | | | (93.61 | ) | | | — | |
| Common shares’ offering expenses charged to paid-in capital | | | — | | | | — | | | | — | | | | (2.00 | ) |
| Net asset value, end of period | | $ | 1,072.87 | | | $ | 1,112.09 | | | $ | 1,068.74 | | | $ | 962.31 | |
Total Return(c) | | | 1.32 | % | | | 13.60 | % | | | 22.66 | % | | | (3.77 | %) |
| Net asset value | | | | | | | | | | | | | | | | |
Ratios/Supplemental Data: | | | | | | | | | | | | | | | | |
| Net assets, end of period (in thousands) | | $ | 77,597 | | | $ | 84,358 | | | $ | 84,850 | | | $ | 76,140 | |
| Ratio to average net assets of: | | | | | | | | | | | | | | | | |
| Net investment income, including interest expense | | | 9.37 | % | | | 8.35 | % | | | 10.18 | % | | | 1.26 | % |
Total expenses, including interest expense(d) | | | 2.99 | % | | | 2.64 | % | | | 2.09 | % | | | 1.69 | % |
| Portfolio turnover rate | | | 12 | % | | | 53 | % | | | 27 | % | | | 65 | % |
| Total Borrowings outstanding (in thousands) | | $ | 17,834 | | | $ | 29,985 | | | $ | 27,931 | | | $ | — | |
Asset Coverage per $1,000 of indebtedness(e) | | $ | 5,351 | | | $ | 3,813 | | | $ | 4,038 | | | $ | — | |
(a) | Since commencement of operations: August 13, 2015. Percentage amounts for the period, except total return and portfolio turnover rate, have been annualized. |
(b) | Based on average shares outstanding. |
(c) | Total return is calculated assuming a purchase of a common share at the beginning of the period and a sale on the last day of the period reported at net asset value (“NAV”). Dividends and distributions are assumed to be reinvested at NAV. Total return does not reflect brokerage commissions. A return calculated for a period of less than one year is not annualized. |
(d) | Excluding interest expense, the operating expense ratio would be 2.46% for the period ended March 29, 2018, 2.11% for the year ended September 30, 2017 and 1.95% for the year ended September 30, 2016. |
(e) | Calculated by subtracting the Fund’s total liabilities(not including borrowings) from the Fund’s total assets and dividing by the total borrowings. |
See notes to financial statements.
28 l GEI l GUGGENHEIM ENERGY & INCOME FUND SEMIANNUAL REPORT| | |
NOTES TO FINANCIAL STATEMENTS (Unaudited) | March 29, 2018 |
Note 1 – Organization and Significant Accounting Policies
Organization
Guggenheim Energy & Income Fund (the “Fund”) was organized as a Delaware statutory Fund on April 28, 2015, and commenced investment operations on August 13, 2015. The Fund is registered as a non-diversified, non-traded, closed-end management investment company under the Investment Company Act of 1940, as amended (the “1940 Act”).
The Fund’s primary investment objective is to provide high income. As a secondary investment objective, the Fund will seek capital appreciation.
Guggenheim Funds Investment Advisors, LLC (“GFIA” or the “Adviser”) provides advisory services. Guggenheim Funds Distributors, LLC (“GFD”) acts as principal underwriter for the Fund. GFIA and GFD are affiliated entities.
Significant Accounting Policies
March 29, 2018 represents the last day during the Fund’s semi-annual period on which the New York Stock Exchange (“NYSE”) was open for trading. The Fund’s financial statements have been presented through that date to maintain consistency with the Fund’s net asset value calculations used for shareholder transactions.
The Fund operates as an investment company and, accordingly, follows the investment company accounting and reporting guidance of the Financial Accounting Standards Board (“FASB”) Accounting Standards Codification Topic 946 Financial Services – Investment Companies.
The following significant accounting policies are in conformity with U.S. generally accepted accounting principles ("U.S. GAAP") and are consistently followed by the Fund. This requires management to make estimates and assumptions that affect the reported amount of assets and liabilities, contingent assets and liabilities at the date of the financial statements, and the reported amounts of revenues and expenses during the reporting period. Actual results could differ from these estimates. All time references are based on Eastern Time.
(a) Valuation of Investments
The Board of Trustees of the Fund (the “Board”) has adopted policies and procedures for the valuation of the Fund's investments (the “Valuation Procedures”). Pursuant to the Valuation Procedures, the Board has delegated to a valuation committee, consisting of representatives from Guggenheim’s investment management, fund administration, legal and compliance departments (the “Valuation Committee”), the day-to-day responsibility for implementing the Valuation Procedures, including, under most circumstances, the responsibility for determining the fair value of the Fund’s securities and/or other assets.
Valuations of the Fund's securities are supplied primarily by pricing services appointed pursuant to the processes set forth in the Valuation Procedures. The Valuation Committee convenes monthly, or more frequently as needed, to review the valuation of all assets which have been fair valued for reasonableness. The Fund's officers, through the Valuation Committee and consistent with the monitoring and review responsibilities set forth in the Valuation Procedures, regularly review procedures used and valuations provided by the pricing services.
GEI l GUGGENHEIM ENERGY & INCOME FUND SEMIANNUAL REPORT l 29| | |
NOTES TO FINANCIAL STATEMENTS (Unaudited) continued | March 29, 2018 |
If the pricing service cannot or does not provide a valuation for a particular investment or such valuation is deemed unreliable, such investment is fair valued by the Valuation Committee.
Equity securities listed on an exchange (NYSE or American Stock Exchange) are valued at the last quoted sales price as of the close of business on the NYSE, usually 4:00 p.m. on the valuation date. Equity securities listed on the NASDAQ market system are valued at the NASDAQ Official Closing Price on the valuation date, which may not necessarily represent the last sale price. If there has been no sale on such exchange or NASDAQ on a given day, the security is valued at the closing bid price on that day.
Open-end investment companies (“mutual funds”) are valued at their NAV as of the close of business, on the valuation date.
Generally, trading in foreign securities markets is substantially completed each day at various times prior to the close of the NYSE. The values of foreign securities are determined as of the close of such foreign markets or the close of the NYSE, if earlier. All investments quoted in foreign currencies are valued in U.S. dollars on the basis of the foreign currency exchange rates prevailing at the close of U.S. business at 4:00 p.m. Investments in foreign securities may involve risks not present in domestic investments. The Valuation Committee will determine the current value of such foreign securities by taking into consideration certain factors which may include those discussed above, as well as the following factors, among others: the value of the securities traded on other foreign markets, ADR trading, closed-end fund trading, foreign currency exchange activity, and the trading prices of financial products that are tied to foreign securities, such as World Equity Benchmark Securities. In addition, under the Valuation Procedures, the Valuation Committee and GFIA are authorized to use prices and other information supplied by a third party pricing vendor in valuing foreign securities.
Debt securities with a maturity of greater than 60 days at acquisition are valued at prices that reflect broker-dealer supplied valuations or are obtained from independent pricing services, which may consider the trade activity, treasury spreads, yields or price of bonds of comparable quality, coupon, maturity, and type, as well as prices quoted by dealers who make markets in such securities. Short-term debt securities with a maturity of 60 days or less at acquisition are valued at amortized cost, provided such amount approximates market value. Money market funds are valued at their NAV.
Typically, loans are valued using information provided by an independent third party pricing service which uses broker quotes. If the pricing service cannot or does not provide a valuation for a particular investment or such valuation is deemed unreliable, such investment is fair valued by the Valuation Committee.
Investments for which market quotations are not readily available are fair-valued as determined in good faith by GFIA subject to review and approval by the Valuation Committee, pursuant to methods established or ratified by the Board. Valuations in accordance with these methods are intended to reflect each security’s (or asset’s or liability’s) “fair value". Each such determination is based on a consideration of all relevant factors, which are likely to vary from one pricing context to another. Examples of such factors may include, but are not limited to market prices; sale prices; broker quotes; and models which derive prices based on inputs such as prices of securities with comparable maturities and characteristics, or based on inputs such as anticipated cash flows or collateral, spread over Treasuries, and other information analysis.
30 l GEI l GUGGENHEIM ENERGY & INCOME FUND SEMIANNUAL REPORT| | |
NOTES TO FINANCIAL STATEMENTS (Unaudited) continued | March 29, 2018 |
(b) Investment Transactions and Investment Income
Investment transactions are accounted for on the trade date. Realized gains and losses on investments are determined on the identified cost basis. Interest income is recorded on an accrual basis. Discounts or premiums on debt securities purchased are accreted or amortized to interest income over the lives of the respective securities using the effective interest method. Interest income also includes paydown gains and losses on mortgage-backed and asset-backed securities and senior and subordinated loans. Amendment fees are earned as compensation for evaluating and accepting changes to the original loan agreement and are recognized as interest income when received.
(c) Forward Foreign Currency Exchange Contracts
Forward foreign currency exchange contracts are agreements between two parties to buy and sell currencies at a set price on a future date. Fluctuations in the value of open forward foreign currency exchange contracts are recorded for financial reporting purposes as unrealized appreciation and depreciation by the Fund until the contracts are closed. When the contracts are closed, realized gains and losses are recorded, and included on the Statement of Operations in foreign currency transactions.
(d) Distributions to Shareholders
The Fund intends to pay substantially all of its net investment income, if any, to common shareholders through quarterly distributions. These distributions will consist of investment company taxable income, which generally includes qualified dividend income, ordinary income and short-term capital gains. Any net realized long-term capital gains are distributed annually to common shareholders. To the extent distributions exceed taxable income, the excess will be deemed a return of capital.
Distributions to shareholders are recorded on the ex-dividend date. The amount and timing of distributions are determined in accordance with federal income tax regulations, which may differ from U.S. GAAP.
(e) Senior Loans
Senior loans in which the Fund invests generally pay interest rates which are periodically adjusted by reference to a base short-term floating rate, plus a premium. These base lending rates are generally (i) the lending rate offered by one or more major European banks, such as the one-month or three-month London Inter-Bank Offered Rate (LIBOR), (ii) the prime rate offered by one or more major United States banks, or (iii) the bank’s certificate of deposit rate. Senior floating rate interests often require prepayments from excess cash flows or permit the borrower to repay at its election. The rate at which the borrower repays cannot be predicted with accuracy. As a result, the actual remaining maturity may be substantially less than the stated maturities shown. The interest rate indicated is the rate in effect at March 29, 2018.
(f) Interests in Securities
The Fund may purchase and sell interests in securities on a when-issued and delayed delivery basis, with payment and delivery scheduled for a future date. No income accrues to the Fund on such interests or securities in connection with such transactions prior to the date the Fund actually takes delivery of such interests or securities. These transactions are subject to market fluctuations and are subject to the risk that the value at delivery may be more or less than the trade date purchase price.
GEI l GUGGENHEIM ENERGY & INCOME FUND SEMIANNUAL REPORT l 31| | |
NOTES TO FINANCIAL STATEMENTS (Unaudited) continued | March 29, 2018 |
Although the Fund will generally purchase these securities with the intention of acquiring such securities, it may sell such securities before the settlement date.
(g) Currency Translation
The accounting records of the Fund are maintained in U.S. dollars. All assets and liabilities initially expressed in foreign currencies are converted into U.S. dollars at prevailing exchange rates. Purchases and sales of investment securities, dividend and interest income, and certain expenses are translated at the rates of exchange prevailing on the respective dates of such transactions.
Changes in the relationship of these foreign currencies to the U.S. dollar can significantly affect the value of the investments and earnings of the Fund. Foreign investments may also subject the Fund to foreign government exchange restrictions, expropriation, taxation, or other political, social or economic developments, all of which could affect the market and/or credit risk of the investments.
The Fund does not isolate that portion of the results of operations resulting from changes in the foreign exchange rates on investments from the fluctuations arising from changes in the market prices of securities held. Such fluctuations are included with the net realized and unrealized gain or loss on investments.
Reported net realized foreign exchange gains and losses arise from sales of foreign currencies and currency gains or losses realized between the trade and settlement dates on investment transactions. Net unrealized exchange gains and losses arise from changes in the fair values of assets and liabilities other than investments in securities at the fiscal period end, resulting from changes in exchange rates.
(h) Indemnifications
Under the Fund’s organizational documents, its Officers and Directors are indemnified against certain liabilities arising out of the performance of their duties to the Fund. In addition, throughout the normal course of business, the Fund enters into contracts that contain a variety of representations and warranties which provide general indemnifications. The Fund’s maximum exposure under these arrangements is unknown, as this would involve future claims that may be made against the Fund and/or its affiliates that have not yet occurred. However, based on experience, the Fund expects the risk of loss to be remote.
Note 2 – Financial Instruments and Derivatives
As part of its investment strategy, the Fund utilizes derivative instruments. These investments involve, to varying degrees, elements of market risk and risks in excess of the amounts recognized in the Statement of Assets and Liabilities. Valuation and accounting treatment of these instruments can be found under Significant Accounting Policies in Note 1 of these Notes to Financial Statements.
Derivatives
Derivatives are instruments whose values depend on, or are derived from, in whole or in part, the value of one or more other assets, such as securities, currencies, commodities or indices. Derivative instruments may be used to increase investment flexibility (including to maintain cash reserves while maintaining exposure to certain other assets), for risk management (hedging) purposes, to facilitate trading, to reduce transaction costs and to pursue higher investment returns. Derivative
32 l GEI l GUGGENHEIM ENERGY & INCOME FUND SEMIANNUAL REPORT| | |
NOTES TO FINANCIAL STATEMENTS (Unaudited) continued | March 29, 2018 |
instruments may also be used to mitigate certain investment risks, such as foreign currency exchange rate risk, interest rate risk and credit risk. U.S. GAAP requires disclosures to enable investors to better understand how and why a Fund uses derivative instruments, how these derivative instruments are accounted for and their effects on the Fund’s financial position and results of operations.
The Fund may utilize derivatives for the following purposes:
Hedge: an investment made in order to reduce the risk of adverse price movements in a security, by taking an offsetting position to protect against broad market moves.
Forward Foreign Currency Exchange Contracts
A forward foreign currency exchange contract is an agreement between two parties to exchange two designated currencies at a specific time in the future. Certain types of contracts may be cash settled, in an amount equal to the change in exchange rates during the term of the contract. The contracts can be used to hedge or manage exposure to foreign currency risks with portfolio investments or to gain exposure to foreign currencies.
The market value of a forward foreign currency exchange contract changes with fluctuations in foreign currency exchange rates. Furthermore, the Fund may be exposed to risk if the counterparties cannot meet the contract terms or if the currency value changes unfavorably as compared to the U.S. dollar.
The following table represents the Fund’s use, and volume of forward foreign currency exchange contracts on a quarterly basis as of March 29, 2018:
| | | | | | | |
| | | Average Value | |
Use | | Purchased | | | Sold | |
| Hedge | | $ | 1,142,170 | | | $ | — | |
Derivative Investment Holdings Categorized by Risk Exposure
The following is a summary of the location of derivative investments on the Fund's Statement of Assets and Liabilities as of March 29, 2018:
| | | |
Derivative Investment Type | Asset Derivatives | Liability Derivatives |
| Currency contracts | Unrealized appreciation on forward foreign | Unrealized depreciation on forward foreign |
| | currency exchange contracts | currency exchange contracts |
The following table sets forth the fair value of the Fund's derivative investments categorized by primary risk exposure at March 29, 2018:
| | | Forward Foreign |
| | | Currency Exchange |
| | Primary Risk Exposure | Contracts |
Asset Derivative Investments Value | Foreign exchange risk | $ 874 |
Liability Derivative Investments Value | Foreign exchange risk | $6,020 |
GEI l GUGGENHEIM ENERGY & INCOME FUND SEMIANNUAL REPORT l 33| | |
NOTES TO FINANCIAL STATEMENTS (Unaudited) continued | March 29, 2018 |
The following is a summary of the location of derivative investments on the Fund's Statement of Operations for the period ended March 29, 2018:
| | |
Derivative Investment Type | Location of Gain (Loss) on Derivatives |
| Currency contracts | Net realized gain (loss) on forward foreign currency exchange contracts |
| | Net change in unrealized appreciation (depreciation) on |
| | forward foreign currency exchange contracts |
The following is a summary of the Fund's realized gain (loss) and change in unrealized appreciation (depreciation) on derivative investments recognized on the Statement of Operations categorized by primary risk exposure for the period ended March 29, 2018:
| | |
| Realized Gain on Derivative Investments Recognized on the Statements of Operations |
| | Forward Foreign |
| | Currency Exchange |
Primary Risk Exposure | Contracts |
| Foreign exchange risk | $21,923 |
Change in Unrealized Appreciation (Depreciation) on Derivative Investments Recognized on the Statement of Operations |
| | Forward Foreign |
| | Currency Exchange |
Primary Risk Exposure | Contracts |
| Foreign exchange risk | $(20,670) |
In conjunction with the use of derivative instruments, the Fund is required to maintain collateral in various forms. The Fund uses, where appropriate, depending on the financial instrument utilized and the broker involved, margin deposits at the broker, cash and/or securities segregated at the custodian bank, discount notes or repurchase agreements allocated to the Fund.
The Fund has established counterparty credit guidelines and enters into transactions only with financial institutions of investment grade or better. The Fund monitors the counterparty credit risk.
Note 3 – Offsetting
In the normal course of business, the Fund enters into transactions subject to enforceable master netting arrangements or other similar arrangements. Generally, the right to offset in those agreements allows the Fund to counteract the exposure to a specific counterparty with collateral received from or delivered to that counterparty based on the terms of the arrangements. These arrangements provide for the right to liquidate upon the occurrence of an event of default, credit event upon merger or additional termination event.
In order to better define their contractual rights and to secure rights that will help the Fund mitigate its counterparty risk, the Fund may enter into an International Swaps and Derivatives Association, Inc. Master Agreement (“ISDA Master Agreement”) or similar agreement with its derivative contract counterparties. An ISDA Master Agreement is a bilateral agreement between a fund and a counterparty that governs OTC derivatives, including foreign exchange contracts, and typically contains, among other things, collateral posting terms and netting provisions in the event of a default and/or termination event. The provisions of the ISDA Master Agreement typically permit a
34 l GEI l GUGGENHEIM ENERGY & INCOME FUND SEMIANNUAL REPORT| | |
NOTES TO FINANCIAL STATEMENTS (Unaudited) continued | March 29, 2018 |
single net payment in the event of a default (close-out netting) or similar event, including the bankruptcy or insolvency of the counterparty.
For derivatives traded under an ISDA Master Agreement, the collateral requirements are typically calculated by netting the mark-to-market amount for each transaction under such agreement and comparing that amount to the value of any collateral currently pledged by the Fund and the counterparty. For financial reporting purposes, cash collateral that has been pledged to cover obligations of the Fund and cash collateral received from the counterparty, if any, are reported separately on the Statement of Assets and Liabilities as segregated cash with broker/receivable for variation margin, or payable for swap settlement/variation margin. Cash and/or securities pledged or received as collateral by the Fund in connection with an OTC derivative subject to an ISDA Master Agreement generally may not be invested, sold or rehypotheticated by the counterparty or the Fund, as applicable, absent an event of default under such agreement, in which case such collateral generally may be applied towards obligations due to and payable by such counterparty or the Fund, as applicable. Generally, the amount of collateral due from or to a counterparty must exceed a minimum transfer amount threshold (e.g., $300,000) before a transfer is required to be made. To the extent amounts due to the Fund from its counterparties are not fully collateralized, contractually or otherwise, the Fund bears the risk of loss from counterparty nonperformance. The Fund attempts to mitigate counterparty risk by only entering into agreements with counterparties that they believe to be of good standing and by monitoring the financial stability of those counterparties.
For financial reporting purposes, the Fund does not offset derivative assets and derivative liabilities that are subject to netting arrangements in the Statement of Assets and Liabilities.
The following tables present derivative financial instruments and secured financing transactions that are subject to enforceable netting arrangements and offset in the Statement of Assets and Liabilities in conformity with U.S. GAAP:
| | | | | | | |
| | | | Net | | | |
| | | | Amount | Gross Amounts | |
| | | Gross | of Assets | Not Offset in the | |
| | | Amounts | Presented | Statement of Assets | |
| | Gross | Offset In the | on the | and Liabilities | |
| | Amounts of | Statements of | Statements of | | Cash | |
| | Recognized | Assets and | Assets and | Financial | Collateral | Net |
Instrument | Assets | Liabilities | Liabilities | Instruments | Received | Amount |
| Forward foreign currency | $874 | $— | $874 | $874 | $— | $— |
| exchange contracts | | | | | | |
| | | | Net Amount | Gross Amounts | |
| | | | of Liabilities | Not Offset in the | |
| | | Gross Amounts | Presented | Statement of Assets | |
| | Gross | Offset In the | on the | and Liabilities | |
| | Amounts of | Statements of | Statement of | | Cash | |
| | Recognized | Assets and | Assets and | Financial | Collateral | Net |
Instrument | Liabilities | Liabilities | Liabilities | Instruments | Pledged | Amount |
| Reverse repurchase | $17,834,232 | $— | $17,834,232 | $17,834,232 | $— | $— |
| agreements | | | | | | |
| Forward foreign currency | $6,020 | $— | $6,020 | $— | $— | $6,020 |
| exchange contracts | | | | | | |
GEI l GUGGENHEIM ENERGY & INCOME FUND SEMIANNUAL REPORT l 35| | |
NOTES TO FINANCIAL STATEMENTS (Unaudited) continued | March 29, 2018 |
The following table presents deposits held by others in connection with reverse repurchase agreements as of March 29, 2018. The Fund has the right to offset these deposits against any related liabilities outstanding with each counterparty.
| | | | |
Counterparty | Asset Type | Cash Pledged | Cash Received |
| Citigroup, Inc. | Reverse | $— | $214,000 |
| | Repurchase | | |
| | Agreements | | |
Note 4 – Fair Value Measurement
In accordance with U.S. GAAP, fair value is defined as the price that the Fund would receive to sell an investment or pay to transfer a liability in an orderly transaction with an independent buyer in the principal market, or in the absence of a principal market, the most advantageous market for the investment or liability. U.S. GAAP establishes a three-tier fair value hierarchy based on the types of inputs used to value assets and liabilities and requires corresponding disclosure. The hierarchy and the corresponding inputs are summarized below:
Level 1 – quoted prices in active markets for identical assets or liabilities.
Level 2 – significant other observable inputs (for example quoted prices for securities that are similar based on characteristics such as interest rates, prepayment speeds, credit risk, etc.).
Level 3 – significant unobservable inputs based on the best information available under the circumstances, to the extent observable inputs are not available, which may include assumptions.
The types of inputs available depend on a variety of factors, such as the type of security and the characteristics of the markets in which it trades, if any. Fair valuation determinations that rely on fewer or no observable inputs require greater judgment. Accordingly, fair value determinations for Level 3 securities require the greatest amount of judgment.
Independent pricing services are used to value a majority of the Fund’s investments. When values are not available from a pricing service, they will be determined using a variety of sources and techniques, including: market prices; broker quotes; and models which derive prices based on inputs such as prices of securities with comparable maturities and characteristics or based on inputs such as anticipated cash flows or collateral, spread over Treasuries, and other information and analysis. A significant portion of the Fund’s assets and liabilities are categorized as Level 2, as indicated in this report.
Indicative quotes from broker-dealers, adjusted for fluctuations in criteria such as credit spreads and interest rates, may be also used to value the Fund’s assets and liabilities, i.e. prices provided by a broker-dealer or other market participant who has not committed to trade at that price. Although indicative quotes are typically received from established market participants, the Fund may not have the transparency to view the underlying inputs which support the market quotations. Significant changes in an indicative quote would generally result in significant changes in the fair value of the security.
Certain fixed income securities are valued by obtaining a monthly indicative quote from a broker-dealer, adjusted for fluctuations in criteria such as credit spreads and interest rates. The Fund’s fair valuation guidelines categorize these securities as Level 3.
36 l GEI l GUGGENHEIM ENERGY & INCOME FUND SEMIANNUAL REPORT| | |
NOTES TO FINANCIAL STATEMENTS (Unaudited) continued | March 29, 2018 |
The inputs or methodologies used for valuing securities are not necessarily an indication of the risk associated with investing in those securities. The suitability of the techniques and sources employed to determine fair valuation are regularly monitored and subject to change.
Note 5 – Fees and Other Transactions with Affiliates
Pursuant to an Investment Advisory Agreement between the Fund and the Adviser, the Adviser furnishes offices, necessary facilities and equipment, provides administrative services, oversees the activities of Guggenheim Partners Investment Management, LLC (“GPIM” or “Sub-Adviser”), provides personnel including certain officers required for the Fund’s administrative management and compensates the officers and Trustees of the Fund who are affiliates of the Adviser. As compensation for these services, the Fund pays the Adviser a fee, payable monthly, in an amount equal to 1.25% of the Fund’s average daily managed assets.
Pursuant to a Sub-Advisory Agreement (the “Sub-Advisory Agreement”) among the Fund, the Adviser and the Sub-Adviser, GPIM provides a continuous investment program for the Fund’s portfolio; provides investment research, makes and executes recommendations for the purchase and sale of securities; and provides personnel, including certain officers required for its administrative management and pays the compensation of all officers and trustees of the Fund who are GPIM’s affiliates. As compensation for its services, the Adviser pays GPIM a fee, payable monthly, in an annual amount equal to 0.625% of the Fund’s average daily managed assets.
GFIA engages external service providers to perform other necessary services for the Fund, such as audit and accounting related services, legal services, custody, printing and mailing, licensing, etc., on a pass-through basis. Such expenses are allocated to various Funds within the complex based on relative net assets.
Certain officers and trustees of the Fund may also be officers, directors and/or employees of the Adviser or GPIM. The Fund does not compensate its officers or trustees who are officers, directors and/or employees of the aforementioned firms.
MUFG Investor Services (US), LLC (“MUIS”) acts as the Fund’s administrator and accounting agent. As administrator and accounting agent, MUIS is responsible for maintaining the books and records of the Fund’s securities and cash. The Bank of New York (“BNY”) acts as the Fund’s custodian. As custodian, BNY is responsible for the custody of the Fund’s assets. For providing the aforementioned services, MUIS and BNY are entitled to receive a monthly fee equal to an annual percentage of the Fund’s average daily managed assets subject to certain minimum monthly fees and out of pocket expenses.
Note 6 – Federal Income Tax Information
The Fund intends to comply with the provisions of Subchapter M of the Internal Revenue Code applicable to regulated investment companies and will distribute substantially all taxable net investment income and capital gains sufficient to relieve the Fund from all, or substantially all, federal income, excise and state income taxes.
The Fund is subject to an excise tax of 4% of the amount by which 98% of the Fund’s annual taxable income and 98.2% of net realized gains exceed the distributions from such taxable income and realized gains for the calendar year.
GEI l GUGGENHEIM ENERGY & INCOME FUND SEMIANNUAL REPORT l 37| | |
NOTES TO FINANCIAL STATEMENTS (Unaudited) continued | March 29, 2018 |
Tax positions taken or expected to be taken in the course of preparing the Fund’s tax returns are evaluated to determine whether the tax positions are “more-likely-than-not” of being sustained by the applicable tax authority. Tax positions not deemed to meet the more-likely-than-not threshold would be recorded as a tax benefit or expense in the current year. Management has analyzed the Fund’s tax positions taken, or to be taken, on federal income tax returns for all open tax years, and has concluded that no provision for income tax is required in the Fund’s financial statements. The Fund’s federal tax returns are subject to examination by the Internal Revenue Service for a period of three years after they are filed.
At March 29, 2018, the cost of securities for federal income tax purposes, the aggregate gross unrealized gain for all securities for which there was an excess of value over tax cost, and the aggregate gross unrealized loss for all securities for which there was an excess of tax cost over value were as follows:
| | | | |
| | Tax Unrealized | Tax Unrealized | Net Unrealized |
Tax Cost | Gain | Loss | Gain (Loss) |
| $ 96,636,705 | $ 4,246,849 | $ (4,777,098) | $ (530,249) |
Note 7 – Securities Transactions
For the period ended March 29, 2018, the cost of purchases and proceeds from sales of investment securities, excluding short-term investments were as follows:
| | |
Purchases | Sales |
| $ 12,706,418 | $ 21,581,912 |
The Fund is permitted to purchase or sell securities from or to certain affiliated funds under specified conditions outlined in procedures adopted by the Board. The procedures have been designed to ensure that any purchase or sale of securities by a Fund from or to another fund or portfolio that is or could be considered an affiliate by virtue of having a common investment adviser (or affiliated investment advisers), common Fundees and/or common officers complies with Rule 17a-7 of the 1940 Act. Further, as defined under these procedures, each transaction is effected at the current market price to save costs, where permissible. For the period March 29, 2018, the Fund engaged in purchases and sales of securities, pursuant to Rule 17a-7 of the 1940 Act, as follows:
| | | |
Purchases | Sales | Realized Gain |
| $ 2,039,188 | $ 751,281 | $ 26,281 |
Note 8 – Unfunded Loan Commitments
Pursuant to the terms of certain loan agreements, the Fund held unfunded loan commitments as of March 29, 2018. The Fund is obligated to fund these loan commitments at the borrower’s discretion.
The Fund reserves against such contingent obligations by designating cash, liquid securities, and liquid term loans as a reserve. As of March 29, 2018, the total amount segregated in connection with reverse repurchase agreements and unfunded loan commitments was $37,255,831.
38 l GEI l GUGGENHEIM ENERGY & INCOME FUND SEMIANNUAL REPORT| | |
NOTES TO FINANCIAL STATEMENTS (Unaudited) continued | March 29, 2018 |
The unfunded loan commitments as of March 29, 2018, were as follows:
| | | | | | | | |
Borrower | Maturity Date | | Face Amount* | | | Value | |
| Boyne USA, Inc. | 03/13/19 | | $ | 350,000 | | | $ | — | |
| Mavis Tire Express Services Corp. | 02/28/25 | | | 75,899 | | | | — | |
| | | | $ | 425,899 | | | $ | — | |
* The face amount is denominated in U.S. dollars unless otherwise indicated.
Note 9 – Leverage – Reverse Repurchase Agreements
The Fund may enter into reverse repurchase agreements as part of its financial leverage strategy. Under a reverse repurchase agreement, the Fund temporarily transfers possession of a portfolio instrument to another party, such as a bank or broker-dealer, in return for cash. At the same time, the Fund agrees to repurchase the instrument at an agreed upon time and price, which reflects an interest payment. Such agreements have the economic effect of borrowings. The Fund may enter into such agreements when it is able to invest the cash acquired at a rate higher than the cost of the agreement, which would increase earned income. When the Fund enters into a reverse repurchase agreement, any fluctuations in the market value of either the instruments transferred to another party or the instruments in which the proceeds may be invested would affect the market value of the Fund’s assets. As a result, such transactions may increase fluctuations in the market value of the Fund’s assets. For the period ended March 29, 2018, the average daily balance for which reverse repurchase agreements were outstanding amounted to $26,376,202. The weighted average interest rate was 1.66%. At March 29, 2018, there was $17,834,232 in reverse repurchase agreements outstanding.
As of March 29, 2018, the Fund had outstanding reverse repurchase agreements with various counterparties. Details of the reverse repurchase agreements by counterparty are as follows:
| | | | |
Counterparty | Interest Rates | Maturity Dates | Face Value |
| Bank of America | 2.17% | 04/20/2018 | $ 1,576,263 |
| Barclays Capital, Inc. | (0.75)%-(1.50)%* | Open Maturity | 1,983,450 |
| Citigroup, Inc. | 0.50%* | Open Maturity | 1,567,001 |
| Royal Bank of Canada | 2.22% | 04/16/2018 | 1,486,465 |
| Royal Bank of Canada | 2.47% | 04/16/2018 | 880,966 |
| Royal Bank of Canada | 2.28% | 04/26/2018 | 1,864,959 |
| Societe Generale | 2.25% | 04/12/2018 | 8,475,128 |
| | | | $17,834,232 |
| * Variable rate security. Rate indicated is rate effective at March 29, 2018. | | |
GEI l GUGGENHEIM ENERGY & INCOME FUND SEMIANNUAL REPORT l 39| | |
NOTES TO FINANCIAL STATEMENTS (Unaudited) continued | March 29, 2018 |
The following is a summary of the remaining contractual maturities of the reverse repurchase agreements outstanding as of March 29, 2018, aggregated by asset class of the related collateral pledged by the Fund:
| | | | | | | | | | |
| | | Overnight and | | | Up to | | | | |
| | | Continuous | | | 30 days | | | Total | |
| Corporate Bonds | | $ | 3,550,451 | | | $ | 14,283,781 | | | $ | 17,834,232 | |
| Total Reverse Repurchase Agreements | | $ | 3,550,451 | | | $ | 14,283,781 | | | $ | 17,834,232 | |
| Gross amount of recognized liabilities | | | | | | | | | | | | |
| for reverse repurchase agreements | | $ | 3,550,451 | | | $ | 14,283,781 | | | $ | 17,834,232 | |
There is no guarantee that the Fund’s leverage strategy will be successful. The Fund’s use of leverage may cause the Fund’s NAV and market price of common shares to be more volatile and can magnify the effect of any losses.
Note 10 – Capital
Common Shares
The Fund has an unlimited amount of common shares, $0.01 par value, authorized and 72,326 issued and outstanding. Transactions in common shares were as follows:
| | | | | | | |
| | | Period Ended | | | Year Ended | |
| | | March 29, 2018 | | | September 30, 2017 | |
| Beginning Shares | | | 75,855 | | | | 79,393 | |
| Common shares redeemed through tender offer | | | (3,743 | ) | | | (3,928 | ) |
| Common shares issued through dividend reinvestment | | | 214 | | | | 390 | |
| Ending shares | | | 72,326 | | | | 75,855 | |
Tender Offer
During the period, the Board approved two tender offers. Each being oversubscribed, in accordance with the terms and conditions specified in the tender offer, the Fund purchased shares from all tendering shareholders on a pro rata basis. Shares that were tendered but not accepted for purchase and shares that were not tendered remain outstanding.
| | | | |
| | Tender Offer | | |
Tender Expiration | (2.5% of outstanding | Shares | Purchase Price |
Dates | shares as of expiration) | Tendered | (NAV on expiration) |
| January 5, 2018 | 1,849 | 15,451 | $1,118.05 |
| April 6, 2018 | 1,806 | 14,634 | $1,072.58 |
In any given quarter, the Adviser may or may not recommend to the Board that the Fund conduct a tender offer. Accordingly, there may be periods during which no tender offer is made, and it is possible that no other tender offers will be conducted during the term of the Fund.
40 l GEI l GUGGENHEIM ENERGY & INCOME FUND SEMIANNUAL REPORT| | |
NOTES TO FINANCIAL STATEMENTS (Unaudited) continued | March 29, 2018 |
Note 11 – Subsequent Events
The Fund evaluated subsequent events through the date the financial statements were available for issue and determined there were no additional material events that would require adjustment to or disclosure in the Fund’s financial statements.
GEI l GUGGENHEIM ENERGY & INCOME FUND SEMIANNUAL REPORT l 41| | |
SUPPLEMENTAL INFORMATION (Unaudited) | March 29, 2018 |
Federal Income Tax Information
In January 2019, you will be advised on IRS Form 1099 DIV or substitute 1099 DIV as to the federal tax status of the distributions received by you in the calendar year 2018.
Sector Classification
Information in the “Schedule of Investments” is categorized by sectors using sector-level classifications used by Bloomberg Industry Classification System, a widely recognized industry classification system provider. In the Fund’s registration statement, the Fund has investment policies relating to concentration in specific industries. For purposes of these investment policies, the Fund usually classifies industries based on industry-level classifications used by widely recognized industry classification system providers such as Bloomberg Industry Classification System, Global Industry Classification Standards and Barclays Global Classification Scheme.
Trustees
The Trustees of the Guggenheim Energy & Income Fund and their principal occupations during the past five years:
| | | | | | |
| | Position(s) | Term of Office | | Number of | |
| | Held | and Length | | Portfolios in | |
Name, Address* | with the | of Time | Principal Occupation(s) | Fund Complex | Other Directorships |
and Year of Birth | Trust | Served** | During Past Five Years | Overseen | Held by Trustees |
Independent Trustees | | | | |
Randall C. Barnes (1951) | Trustee | Since 2015 | Current: Private Investor (2001-present). Former: Senior Vice President and Treasurer, PepsiCo, Inc. (1993-1997); President, Pizza Hut International (1991-1993); Senior Vice President, Strategic Planning and New Business Development, PepsiCo, Inc. (1987-1990). | 51 | Current: Trustee, Purpose Investments Funds (2014-Present). |
Donald A. Chubb, Jr. (1946 ) | Trustee and Chairman of the Valuation Oversight Committee | Since 2015 | Current: Retired. Former: Business broker and manager of commercial real estate, Griffith & Blair, Inc. (1997-2017). | 48 | Former: Midland Care, Inc. (2011-2016). |
Jerry B. Farley (1946) | Trustee and Chair of the Audit Committee | Since 2015 | Current: President, Washburn University (1997-present). | 48 | Current: Westar Energy, Inc. (2004-present); CoreFirst Bank & Trust (2000-present). |
42 l GEI l GUGGENHEIM ENERGY & INCOME FUND SEMIANNUAL REPORT| | |
SUPPLEMENTAL INFORMATION (Unaudited) continued | March 29, 2018 |
| | Position(s) | Term of Office | | Number of | |
| | Held | and Length | | Portfolios in | |
Name, Address* | with the | of Time | Principal Occupation(s) | Fund Complex | Other Directorships |
and Year of Birth | Trust | Served** | During Past Five Years | Overseen | Held by Trustees |
| Independent Trustees continued | | | |
Roman Friedrich III (1946) | Trustee and Chairman of the Contracts Review Committee | Since 2015 | Current: Founder and Managing Partner, Roman Friedrich & Company (1998-present). Former: Senior Managing Director, MLV & Co. LLC (2010-2011). | 48 | Current: Zincore Metals, Inc. (2009-present). Former: Axiom Gold and Silver Corp. (2011-2012). |
Ronald A. Nyberg (1953) | Trustee and Chairman of the Nominating and Governance Committee | Since 2015 | Current: Partner, Momkus McCluskey LLC (2016-present). Former: Partner, Nyberg & Cassioppi, LLC (2000-2016); Executive Vice President, General Counsel, and Corporate Secretary, Van Kampen Investments (1982-1999). | 51 | Current: PPM Funds (February 2018 - present); Edward-Elmhurst Healthcare System (2012-present); Western Asset Inflation-Linked Opportunities & Income Fund (2004 -present); Western Asset Inflation-Linked Income Fund (2003-present). |
Maynard F. Oliverius (1943) | Trustee | Since 2015 | Current: Retired. Former: President and CEO, Stormont-Vail HealthCare (1996-2012). | 48 | Current: Robert J. Dole Institute of Politics (2016-present); Stormont-Vail Foundation (2013-present); University of Minnesota MHA Alumni Philanthropy Committee (2009-present); Fort Hays State University Foundation (1999-present). Former: Topeka Community Foundation (2009-2014). |
Ronald E. Toupin, Jr. (1958) | Trustee and Chairman of the Board | Since 2015 (Trustee) Since 2014 (Chief Legal Officer) Since 2007 (Vice President) | Current: Portfolio Consultant (2010-present). Member, Governing Council (2003-present) and Executive Committee (2016-present), Independent Directors Council. Former: Vice President, Manager and Portfolio Manager, Nuveen Asset Management (1998-1999); Vice President, Nuveen Investment Advisory Corp. (1992-1999); Vice President and Manager, Nuveen Unit Investment Trusts (1991-1999); and Assistant Vice President and Portfolio Manager, Nuveen Unit Investment Trusts (1988-1999), each of John Nuveen & Co., Inc. (1982-1999). | 48 | Current: Western Asset Inflation-Linked Opportunities & Income Fund (2004 - present); Western Asset Inflation-Linked Income Fund (2003-present). Former: Bennett Group of Funds (2011-2013) |
GEI l GUGGENHEIM ENERGY & INCOME FUND SEMIANNUAL REPORT l 43| | |
SUPPLEMENTAL INFORMATION (Unaudited) continued | March 29, 2018 |
| | | | | | |
| | Position(s) | Term of Office | | Number of | |
| | Held | and Length | | Portfolios in | |
Name, Address* | with the | of Time | Principal Occupation(s) | Fund Complex | Other Directorships |
and Year of Birth | Trust | Served** | During Past Five Years | Overseen | Held by Trustees |
| Interested Trustee: | | | | |
Amy J. Lee*** (1961) | Trustee, Vice President and Chief Legal Officer | Since February 2018 (Trustee) Since 2015 (Vice President) Since 2015 (Chief Legal Officer) | Current: Interested Trustee, certain other funds in the Fund Complex (February 2018-present); President, certain other funds in the Fund Complex (2017-present); Chief Legal Officer, certain other funds in the Fund Complex Former: President and Chief Executive Officer (2017-February 2018); Vice President, Associate General Counsel and Assistant Secretary, Security Benefit Life Insurance Company and Security Benefit Corporation (2004-2012). | 158 | None |
| * | The business address of each Trustee is c/o Guggenheim Investments, 227 West Monroe Street, Chicago, Illinois 60606. |
| ** | Each Trustee serves an indefinite term, until his or her successor is elected and qualified. |
| *** | This Trustee is deemed to be an "interested person" of the Fund under the 1940 Act by reason of her position with the Fund's Investment Adviser and/or the parent of the Investment Adviser. |
44 l GEI l GUGGENHEIM ENERGY & INCOME FUND SEMIANNUAL REPORT| | |
SUPPLEMENTAL INFORMATION (Unaudited) continued | March 29, 2018 |
OFFICERS | | | |
| | Position(s) | | |
| | held | Term of Office | |
Name, Address* | with the | and Length of | |
and Year of Birth | Trust | Time Served** | Principal Occupations During Past Five Years |
Brian E. Binder (1972) | President and Chief Executive Officer | Since February 2018 | Current: Current: President and Chief Executive Officer, certain other funds in the Fund Complex (February 2018-present); President and Chief Executive Officer, Guggenheim Funds Investment Advisors, LLC and Security Investors, LLC (January 2018-present); Senior Managing Director and Chief Administrative Officer, Guggenheim Investments (January 2018-present). Former: Managing Director and President, Deutsche Funds, and Head of US Product, Trading and Fund Administration, Deutsche Asset Management (2013-January 2018); Managing Director, Head of Business Management and Consulting, Invesco Ltd. (2010-2012). |
Joanna M. Catalucci (1966) | Chief Compliance Officer | Since 2015 | Current: Chief Compliance Officer, certain funds in the Fund Complex (2012-present); Senior Managing Director, Guggenheim Investments (2014-present). Former: Chief Compliance Officer and Secretary, certain other funds in the Fund Complex (2008-2012); Senior Vice President & Chief Compliance Officer, Security Investors, LLC and certain affiliates (2010-2012); Chief Compliance Officer and Senior Vice President, Rydex Advisors, LLC and certain affiliates (2010-2011); AML Officer, certain funds in the Fund Complex (2016-2017). |
James M. Howley (1972) | Assistant Treasurer | Since 2015 | Current: Managing Director, Guggenheim Investments (2004-present) ; Assistant Treasurer, certain other funds in the Fund Complex (2006-present). Former: Manager of Mutual Fund Administration, Van Kampen Investments, Inc. (1996-2004). |
Keith D. Kemp (1960) | Assistant Treasurer | Since 2016 | Current: Treasurer and Assistant Treasurer, certain other funds in the Fund Complex (2010-present); Managing Director of Guggenheim Partners Investment Management, LLC (2015-present); Chief Financial Officer, Guggenheim Specialized Products, LLC (2016-present). Former: Managing Director and Director, Transparent Value, LLC (2010-2016); Director, Guggenheim Partners Investment Management, LLC (2010-2015); Chief Operating Officer, Macquarie Capital Investment Management (2007-2009). |
Mark E. Mathiasen (1978) | Secretary | Since 2015 | Current: Secretary, certain other funds in the Fund Complex (2007-present); Managing Director, Guggenheim Investments (2007-present). |
Glenn McWhinnie (1969) | Assistant Treasurer | Since 2016 | Current: Vice President, Guggenheim Investments (2009-present); Assistant Treasurer certain Funds in the Fund Complex (2016-present). |
GEI l GUGGENHEIM ENERGY & INCOME FUND SEMIANNUAL REPORT l 45| | |
SUPPLEMENTAL INFORMATION (Unaudited) continued | March 29, 2018 |
| | Position(s) | | |
| | held | Term of Office | |
Name, Address* | with the | and Length of | |
and Year of Birth | Trust | Time Served** | Principal Occupations During Past Five Years |
Michael P. Megaris (1984) | Assistant Secretary | Since 2015 | Current: Assistant Secretary, certain other funds in the Fund Complex (2014-present); Director, Guggenheim Investments (2012-present). |
Adam J. Nelson (1979) | Assistant Treasurer | Since 2015 | Current: Vice President, Guggenheim Investments (2015-present); Assistant Treasurer, certain other funds in the Fund Complex (2015-present). Former: Assistant Vice President and Fund Administration Director, State Street Corporation (2013-2015); Fund Administration Assistant Director, State Street (2011-2013); Fund Administration Manager, State Street (2009-2011). |
Kimberly J. Scott (1974) | Assistant Treasurer | Since 2015 | Current: Director, Guggenheim Investments (2012-present) ; Assistant Treasurer, certain other funds in the Fund Complex (2012-present). Former: Financial Reporting Manager, Invesco, Ltd. (2010-2011); Vice President/Assistant Treasurer, Mutual Fund Administration, Van Kampen Investments, Inc./Morgan Stanley Investment Management (2009-2010); Manager of Mutual Fund Administration, Van Kampen Investments, Inc./Morgan Stanley Investment Management (2005-2009). |
Bryan Stone (1979) | Vice President | Since 2015 | Current: Vice President, certain other funds in the Fund Complex (2014-present); Managing Director, Guggenheim Investments (2013-present). Former: Senior Vice President, Neuberger Berman Group LLC (2009-2013); Vice President, Morgan Stanley (2002-2009). |
John L. Sullivan (1955) | Chief Financial Officer, Chief Accounting Officer and Treasurer | Since 2015 | Current: CFO, Chief Accounting Officer and Treasurer, certain other funds in the Fund Complex (2010-present); Senior Managing Director, Guggenheim Investments (2010-present). Former: Managing Director and CCO, each of the funds in the Van Kampen Investments fund complex (2004-2010); Managing Director and Head of Fund Accounting and Administration, Morgan Stanley Investment Management (2002-2004); CFO and Treasurer, Van Kampen Funds (1996-2004). |
Jon Szafran (1989) | Assistant Treasurer | Since 2017 | Current: Vice President, Guggenheim Investments (2017-present); Assistant Treasurer, certain other funds in the Fund Complex (2017-present). Former: Assistant Treasurer of Henderson Global Funds and Manager of US Fund Administration, Henderson Global Investors (North America) Inc. ("HGINA"), (2017); Senior Analyst of US Fund Administration, HGINA (2014 – 2017); Senior Associate of Fund Administration, Cortland Capital Market Services, LLC (2013-2014); Experienced Associate, PricewaterhouseCoopers LLP (2012-2013). |
| * | The business address of each officer is c/o Guggenheim Investments, 227 West Monroe Street, Chicago, Illinois 60606. |
| ** | Each officer serves an indefinite term, until his or her successor is duly elected and qualified. The date reflects the commencement date upon which the officer held any officer position with the Fund. |
46 l GEI l GUGGENHEIM ENERGY & INCOME FUND SEMIANNUAL REPORT| | |
DIVIDEND REINVESTMENT PLAN (Unaudited) | March 29, 2018 |
Under the Fund’s dividend reinvestment plan (the “Plan”), a Common Shareholder whose Common Shares are registered in his or her own name will have all distributions reinvested automatically by Computershare Trust Company, N.A., which is agent under the Plan (the “Plan Agent”), unless the Common Shareholder elects to receive cash.
Distributions with respect to Common Shares registered in the name of a broker-dealer or other nominee (that is, in “street name”) will be reinvested in additional Common Shares under the Plan, unless the broker or nominee does not participate in the Plan or the Common Shareholder elects to receive distributions in cash. Investors who own Common Shares registered in street name should consult their broker-dealers for details regarding reinvestment. All distributions to investors who do not participate in the Plan will be paid by check mailed directly to the record holder by Computershare Trust Company, N.A., as dividend disbursing agent. A participant in the Plan who wishes to opt out of the Plan and elect to receive distributions in cash should contact Computershare Trust Company, N.A. through the Internet as specified below, in writing at the address specified below or by calling the telephone number specified below.
Under the Plan, distributors, including any capital gain distributions, will be automatically reinvested in additional Common Shares at the net asset value determined on the reinvestment date.
The Plan Agent maintains all shareholder accounts in the Plan and furnishes written confirmations of all transactions in the account, including information needed by shareholders for personal and tax records. Common Shares in the account of each Plan participant will be held by the Plan Agent in non-certificated form in the name of the participant.
In the case of shareholders such as banks, brokers or nominees, which hold Common Shares for others who are the beneficial owners, and participate in the Plan, the Plan Agent will administer the Plan on the basis of the number of Common Shares certified from time to time by the Common Shareholder as representing the total amount registered in the shareholder’s name and held for the account of beneficial owners who participate in the Plan.
The automatic reinvestment of dividends and other distributions will not relieve participants of any income tax that may be payable or required to be withheld on such dividends or distributions.
Experience under the Plan may indicate that changes are desirable. Accordingly, the Fund reserves the right to amend or terminate its Plan as applied to any voluntary cash payments made and any dividend or distribution paid subsequent to written notice of the change sent to the members of such Plan at least 90 days before the record date for such dividend or distribution. The Plan also may be amended or terminated by the Plan Agent on at least 90 days’ prior written notice to the participants in such Plan. All correspondence concerning the Plan should be directed to Computershare Trust Company, N.A., P.O. Box 30170, College Station, Texas 77842, Attention: Shareholder Services Department. Participants may also contact Computershare Trust Company, N.A. online at www.computershare.com/investor or by telephone at (866)-488-3559.
GEI l GUGGENHEIM ENERGY & INCOME FUND SEMIANNUAL REPORT l 47| | |
FUND INFORMATION (Unaudited) | March 29, 2018 |
Board of Trustees | Investment Adviser |
| | Guggenheim Funds Investment |
| Randall C. Barnes | Advisors, LLC |
| | Chicago, IL |
| Donald A. Chubb, Jr. | |
| | Investment Sub-Adviser |
| Jerry B. Farley | Guggenheim Partners Investment |
| | Management, LLC |
| Roman Friedrich III | Santa Monica, CA |
| | |
| Amy J. Lee* | Administrator and Accounting Agent |
| | MUFG Investor Services (US), LLC |
| Ronald A. Nyberg | Rockville, MD |
| | |
| Maynard F. Oliverius | Custodian |
| | The Bank of New York Mellon |
| Ronald E. Toupin, Jr., | New York, NY |
Chairman | |
| | Legal Counsel |
| * Trustee is an “interested person” (as defined | Skadden, Arps, Slate, Meagher & |
| in section 2(a)(19) of the 1940 Act) | Flom LLP |
| (“Interested Trustee”) of the Fund because of | New York, NY |
| her affiliation with Guggenheim Investments. | |
| | Independent Registered Public |
Principal Executive Officers | Accounting Firm |
| | Ernst & Young LLP |
| Brian E. Binder | Tysons, VA |
President and Chief Executive Officer | |
| | |
| Joanna M. Catalucci | |
Chief Compliance Officer | |
| | |
| Amy J. Lee | |
Chief Legal Officer | |
| | |
| Mark E. Mathiasen | |
Secretary | |
| | |
| John L. Sullivan | |
Chief Financial Officer, | |
Chief Accounting Officer | |
and Treasurer | |
48 l GEI l GUGGENHEIM ENERGY & INCOME FUND SEMIANNUAL REPORT| | |
FUND INFORMATION (Unaudited) continued | March 29, 2018 |
Privacy Principles of the Fund
The Fund is committed to maintaining the privacy of its shareholders and to safeguarding its non-public personal information. The following information is provided to help you understand what personal information the Fund collects, how the Fund protects that information and why, in certain cases, the Fund may share information with select other parties.
Generally, the Fund does not receive any non-public personal information relating to its shareholders, although certain non-public personal information of its shareholders may become available to the Fund. The Fund does not disclose any non-public personal information about its shareholders or former shareholders to anyone, except as permitted by law or as is necessary in order to service shareholder accounts (for example, to a transfer agent or third party administrator).
The Fund restricts access to non-public personal information about its shareholders to employees of the Fund’s investment advisor and its affiliates with a legitimate business need for the information. The Fund maintains physical, electronic and procedural safeguards designed to protect the non-public personal information of its shareholders.
Questions concerning your shares of Guggenheim Energy & Income Fund?
| | • | If your shares are held in a Brokerage Account, contact your Broker. |
| | • | If you have physical possession of your shares in certificate form, contact the Fund’s Transfer Agent:
Computershare Trust Company, N.A., P.O. Box 30170 College Station, TX 77842-3170; (866) 488-3559 or online at computershare.com/investor. |
This report is sent to shareholders of Guggenheim Energy & Income Fund for their information. It is not a Prospectus, circular or representation intended for use in the purchase or sale of shares of the Fund or of any securities mentioned in this report.
A description of the Fund’s proxy voting policies and procedures related to portfolio securities is available without charge, upon request, by calling the Fund at (800) 345-7999.
Information regarding how the Fund voted proxies for portfolio securities, if applicable, during the most recent 12-month period ended December 31, is also available, without charge and upon request by calling (800) 345-7999, by visiting the Fund’s website at guggenheiminvestments.com/xgeix or by accessing the Fund’s Form N-PX on the U.S. Securities and Exchange Commission’s (SEC) website at www.sec.gov.
The Fund files its complete schedule of portfolio holdings with the SEC for the first and third quarters of each fiscal year on Form N-Q. The Fund’s Form N-Q is available on the SEC website at www.sec.gov or by visiting the Fund’s website at guggenheiminvestments.com/xgeix. The Fund’s Form N-Q may also be viewed and copied at the SEC’s Public Reference Room in Washington, DC; information on the operation of the Public Reference Room may be obtained by calling (800) SEC-0330 or at www.sec.gov.
GEI l GUGGENHEIM ENERGY & INCOME FUND SEMIANNUAL REPORT l 49
This Page Intentionally Left Blank
This Page Intentionally Left Blank
ABOUT THE FUND MANAGER
Guggenheim Partners Investment Management, LLC
Guggenheim Partners Investment Management, LLC (“GPIM”) is an indirect subsidiary of Guggenheim Partners, LLC, a diversified financial services firm. The firm provides capital markets services, portfolio and risk management expertise, wealth management, and investment advisory services. Clients of Guggenheim Partners, LLC subsidiaries are an elite mix of individuals, family offices, endowments, foundations, insurance companies and other institutions.
Investment Philosophy
GPIM’s investment philosophy is predicated upon the belief that thorough research and independent thought are rewarded with performance that has the potential to outperform benchmark indexes with both lower volatility and lower correlation of returns over time as compared to such benchmark indexes.
Investment Process
GPIM’s investment process is a collaborative effort between various groups including the Portfolio Construction Group, which utilize proprietary portfolio construction and risk modeling tools to determine allocation of assets among a variety of sectors, and its Sector Specialists, who are responsible for security selection within these sectors and for implementing securities transactions, including the structuring of certain securities directly with the issuers or with investment banks and dealers involved in the origination of such securities.
| |
Guggenheim Funds Distributors, LLC |
| 227 West Monroe Street |
| Chicago, IL 60606 |
| Member FINRA/SIPC |
| (05/18) |
NOT FDIC-INSURED l NOT BANK-GUARANTEED l MAY LOSE VALUE
CEF-GEI-SAR-0318