UNITED STATES
SECURITIES AND EXCHANGE COMMISSION
Washington, D.C. 20549
FORM N-CSR
CERTIFIED SHAREHOLDER REPORT OF REGISTERED
MANAGEMENT INVESTMENT COMPANIES
Investment Company Act file number 811-23063
Horizon Funds
(Exact name of registrant as specified in charter)
13024 Ballantyne Corporate Place, Suite 225
Charlotte, North Carolina 28277
(Address of principal executive offices) (Zip code)
Matthew Chambers
Horizon Funds
13024 Ballantyne Corporate Place, Suite 225
Charlotte, North Carolina 28277
(Name and address of agent for service)
(866) 371-2399
Registrant’s telephone number, including area code
Date of fiscal year end: November 30, 2017
Date of reporting period: May 31, 2017
Item 1. Reports to Stockholders.
| HORIZON FUNDS | Semi-Annual Report | |
Horizon Active Asset Allocation Fund
Advisor Class | Shares | HASAX | ||||
Institutional Class | Shares | HASIX | ||||
Investor Class | Shares | AAANX | ||||
Horizon Active Risk Assist® Fund
Advisor Class | Shares | ARAAX | ||||
Institutional Class | Shares | ACRIX | ||||
| Investor Class | Shares | ARANX | ||||
Horizon Active Income Fund
Advisor Class | Shares | AIHAX | ||||
Institutional Class | Shares | AIRIX | ||||
Investor Class | Shares | AIMNX | ||||
Horizon Active Dividend Fund
| Investor Class | Shares | HNDDX | ||||
| May 31, 2017 |
Investor Information: 1-855-754-7932
This report and the financial statements contained herein are submitted for the general information of shareholders and are not authorized for distribution to prospective investors unless preceded or accompanied by an effective prospectus. Nothing herein contained is to be considered an offer of sale or solicitation of an offer to buy shares of HORIZON ACTIVE ASSET ALLOCATION FUND, HORIZON ACTIVE RISK ASSIST® FUND, HORIZON ACTIVE INCOME FUND and HORIZON ACTIVE DIVIDEND FUND. Such offering is made only by prospectus, which includes details as to offering price and other material information.
Member FINRA
Horizon Active Asset Allocation Fund
PORTFOLIO REVIEW (Unaudited)
May 31, 2017
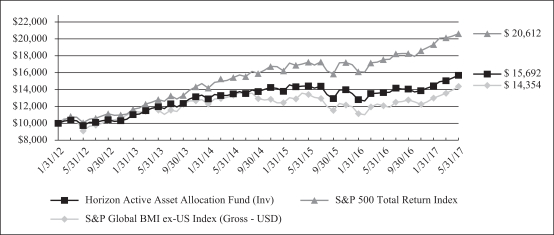
The Fund’s performance figures * for the periods ended May 31, 2017, compared to its benchmarks:
| Annualized Total Returns | One Year | Three Year (Annualized) | Five Year (Annualized) | Since Commencement of Operations (Cumulative) (1) | Since Commencement of Operations (Annualized) (2) | |||||||||||||||
Horizon Active Asset Allocation Fund Advisor Class | 14.86% | N/A | N/A | N/A | 11.11% | |||||||||||||||
Horizon Active Asset Allocation Fund Investor Class | 14.91% | 5.21% | 10.03% | N/A | 8.82% | |||||||||||||||
Horizon Active Asset Allocation Fund Institutional Class | N/A | N/A | N/A | 13.59% | N/A | |||||||||||||||
S&P 500 Total Return Index | 17.47% | 10.14% | 15.42% | 15.08% | 14.53% | (3) | ||||||||||||||
S&P Global BMI ex-US Index (Gross - USD) | 18.62% | 2.43% | 9.45% | 12.44% | 7.01% | (3) | ||||||||||||||
(1) Inception date is September 9, 2016 for Institutional Class Shares.
(2) Inception date is September 4, 2015 for Advisor Class Shares and January 31, 2012 for Investor Class Shares.
(3) The Since Commencement of Operations returns shown are from the commencement date of Horizon Active Asset Allocation Fund – Investor Class. The returns for the S&P 500 Total Return Index and S&P Global BMI ex-US Index (Gross – USD) since the commencement date of the Horizon Active Asset Allocation Fund – Advisor Class are 16.45% and 13.00%, respectively.
* The Performance data quoted is historical. Past performance is no guarantee of future results. Current performance may be higher or lower than the performance data quoted. The principal value and investment return of an investment will fluctuate so that your shares, when redeemed, may be worth more or less than their original cost. The returns shown do not reflect the deduction of taxes that a shareholder would pay on Fund distributions or on the redemptions of Fund shares. Performance figures for periods greater than one year are annualized. The total operating expense ratio (including indirect expenses), as stated in the Fund’s latest Prospectus, is 1.49% for Investor Class shares, 1.64% for Advisor Class shares and 1.39% for Institutional Class shares. For performance information current to the most recent month-end, please call 1-855-754-7932.
The S&P 500 Total Return Index is an unmanaged market capitalization-weighted index which is comprised of the largest U.S. domiciled companies and includes the reinvestment of all dividends. Investors cannot invest directly in an index or benchmark.
The S&P Global BMI ex-US Index is a comprehensive, rules-based index that represents the composition of global stock markets. Investors cannot invest directly in an index or benchmark.
1
Horizon Active Risk Assist Fund
PORTFOLIO REVIEW (Unaudited)
May 31, 2017

The Fund’s performance figures * for the periods ended May 31, 2017, compared to its benchmarks:
| One Year | Since Commencement of Operations (Cumulative) (1) | Since Commencement of Operations (Annualized) (2) | ||||||||||
Horizon Active Risk Assist Fund Advisor Class | 14.06% | N/A | 7.78% | |||||||||
Horizon Active Risk Assist Fund Investor Class | 14.09% | N/A | 2.87% | |||||||||
Horizon Active Risk Assist Fund Institutional Class | N/A | 11.74% | N/A | |||||||||
Bloomberg Barclays Aggregate Bond Index | 1.58% | -0.20% | 2.43% | (3) | ||||||||
S&P 500 Total Return Index | 17.47% | 15.08% | 9.26% | (3) | ||||||||
S&P Global BMI ex-US Index (Gross - USD) | 18.62% | 12.44% | 2.09% | (3) | ||||||||
(1) Inception date is September 9, 2016 for Institutional Shares.
(2) Inception date is September 4, 2015 for Advisor Class Shares and August 28, 2014 for Investor Class Shares.
(3) The Since Commencement of Operations returns shown are from the commencement date of Horizon Active Risk Assist Fund – Investor Class. The returns for the Bloomberg Barclays Aggregate Bond Index, S&P 500 Total Return Index and S&P Global BMI ex-US Index (Gross – USD) since the commencement date of the Horizon Active Risk Assist Fund – Advisor Class are 2.76%, 16.45% and 13.00%, respectively.
* The Performance data quoted is historical. Past performance is no guarantee of future results. Current performance may be higher or lower than the performance data quoted. The principal value and investment return of an investment will fluctuate so that your shares, when redeemed, may be worth more or less than their original cost. The returns shown do not reflect the deduction of taxes that a shareholder would pay on Fund distributions or on the redemptions of Fund shares. Performance figures for periods greater than one year are annualized. The estimated total operating expense ratio (including indirect expenses), as stated in the Fund’s latest Prospectus, is 1.50% for Investor Class shares, 1.65% for Advisor Class shares and 1.40% for Institutional Class shares. For performance information current to the most recent month-end, please call 1-855-754-7932.
The S&P 500 Total Return Index is an unmanaged market capitalization-weighted index which is comprised of the largest U.S. domiciled companies and includes the reinvestment of all dividends. Investors cannot invest directly in an index or benchmark.
The Bloomberg Barclays Aggregate Bond Index is a market-capitalization-weighted index that covers the USD denominated, investment-grade (rated Baa3 or above by Moody’s), fixed-rate, and taxable areas of the bond market. Investors cannot invest directly in an index or benchmark.
The S&P Global BMI ex-US Index is a comprehensive, rules-based index that represents the composition of global stock markets. Investors cannot invest directly in an index or benchmark.
2
Horizon Active Income Fund
PORTFOLIO REVIEW (Unaudited)
May 31, 2017
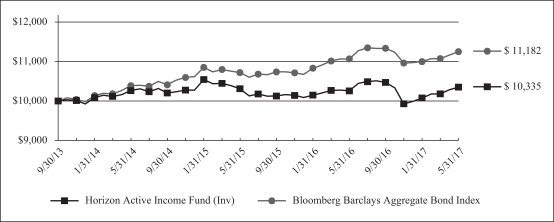
The Fund’s performance figures * for the periods ended May 31, 2017, compared to its benchmarks:
| One Year | Three Year (Annualized) | Since Commencement of Operations (Cumulative) (1) | Since Commencement of Operations (Annualized) (2) | |||||||||||||
Horizon Active Income Fund Advisor Class | 1.48% | N/A | N/A | 1.73% | ||||||||||||
Horizon Active Income Fund Investor Class | 0.84% | 0.25% | N/A | 0.90% | ||||||||||||
Horizon Active Income Fund Institutional Class | N/A | N/A | -0.35% | N/A | ||||||||||||
Bloomberg Barclays Aggregate Bond Index | 1.58% | 2.53% | -0.20% | 3.09% | (3) | |||||||||||
(1) Inception date is September 9, 2016 for Institutional Shares.
(2) Inception date is February 8, 2016 for Advisor Class Shares and September 30, 2013 for Investor Class Shares.
(3) The Since Commencement of Operations returns shown are from the commencement date of Horizon Active Income Fund – Investor Class. The returns for the Bloomberg Barclays Aggregate Bond Index since the commencement date of the Horizon Active Income Fund – Advisor Class is 2.27%.
* The Performance data quoted is historical. Past performance is no guarantee of future results. Current performance may be higher or lower than the performance data quoted. The principal value and investment return of an investment will fluctuate so that your shares, when redeemed, may be worth more or less than their original cost. The returns shown do not reflect the deduction of taxes that a shareholder would pay on Fund distributions or on the redemptions of Fund shares. Performance figures for periods greater than one year are annualized. The total operating expense ratio (including indirect expenses), as stated in the Fund’s latest Prospectus, is 1.32% for Investor Class shares, 1.47% for Advisor Class shares and 1.22% for Institutional Class shares. For performance information current to the most recent month-end, please call 1-855-754-7932.
The Bloomberg Barclays Aggregate Bond Index is a market-capitalization-weighted index that covers the USD denominated, investment-grade (rated Baa3 or above by Moody’s), fixed-rate, and taxable areas of the bond market. Investors cannot invest directly in an index or benchmark.
3
Horizon Active Dividend Fund
PORTFOLIO REVIEW (Unaudited)
May 31, 2017
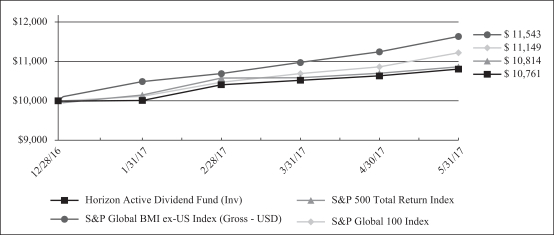
The Fund’s performance figures * for the periods ended May 31, 2017, compared to its benchmarks:
| Since Commencement of Operations (Cumulative) (1) | ||||
Horizon Active Dividend Fund Investor Class | 7.61% | |||
S&P 500 Total Return Index | 8.14% | |||
S&P Global 100 Index | 11.49% | |||
S&P Global BMI ex-US Index (Gross - USD) | 15.43% | |||
(1) Inception date is December 28, 2016 for Investor Class Shares.
* The Performance data quoted is historical. Past performance is no guarantee of future results. Current performance may be higher or lower than the performance data quoted. The principal value and investment return of an investment will fluctuate so that your shares, when redeemed, may be worth more or less than their original cost. The returns shown do not reflect the deduction of taxes that a shareholder would pay on Fund distributions or on the redemptions of Fund shares. Performance figures for periods greater than one year are annualized. The total operating expense ratio (including indirect expenses), as stated in the Fund’s latest Prospectus, is 1.24% for Investor Class shares. For performance information current to the most recent month-end, please call 1-855-754-7932.
The S&P 500 Total Return Index is an unmanaged market capitalization-weighted index which is comprised of the largest U.S. domiciled companies and includes the reinvestment of all dividends. Investors cannot invest directly in an index or benchmark.
The S&P Global 100 Index measures the performance of multi-national, blue chip companies of major importance in the global equity markets.
The S&P Global BMI ex-US Index is a comprehensive, rules-based index that represents the composition of global stock markets. Investors cannot invest directly in an index or benchmark.
4
Horizon Funds
PORTFOLIO COMPOSITION (Unaudited)
May 31, 2017
Horizon Active Asset Allocation Fund Portfolio Composition as of May 31, 2017:
| % of Net Assets | ||||
Equity Funds | 98.3% | |||
Purchased Call Options | 0.5% | |||
Purchased Put Options | 0.0% | ^ | ||
Short-Term Investments | 1.2% | |||
Liabilities in Excess of Other Assets | 0.0% | ^ | ||
|
| |||
| 100.0% | ||||
|
| |||
Horizon Active Risk Assist Fund Portfolio Composition as of May 31, 2017:
| % of Net Assets | ||||
Equity Funds | 98.3% | |||
Purchased Call Options | 0.1% | |||
Purchased Put Options | 0.5% | |||
Short-Term Investments | 1.2% | |||
Liabilities in Excess of Other Assets | -0.1% | |||
|
| |||
| 100.0% | ||||
|
| |||
Horizon Active Income Fund Portfolio Composition as of May 31, 2017:
| % of Net Assets | ||||
Bond Funds | 88.0% | |||
Equity Funds | 11.0% | |||
Purchased Call Options | 0.0% | ^ | ||
Short-Term Investments | 1.0% | |||
Other Assets in Excess of Liabilities | 0.0% | ^ | ||
|
| |||
| 100.0% | ||||
|
| |||
Horizon Active Dividend Fund Portfolio Composition as of May 31, 2017:
| % of Net Assets | ||||
Common Stocks | 98.0% | |||
Short-Term Investments | 33.7% | |||
Liabilities in Excess of Other Assets | -31.7% | |||
|
| |||
| 100.0% | ||||
|
| |||
Please refer to the Portfolio of Investments in this semi-annual report for a detailed analysis of the Funds’ holdings.
^ Less than 0.1%
5
Horizon Active Asset Allocation Fund
PORTFOLIO OF INVESTMENTS (Unaudited)
May 31, 2017
| Shares | Value | |||||||
EXCHANGE TRADED FUNDS - 98.3% | ||||||||
Equity Funds - 98.3% | ||||||||
| 932,773 | Deutsche X-trackers MSCI Europe Hedged Equity ETF | $ | 26,406,804 | |||||
| 754,841 | Financial Select Sector SPDR Fund | 17,550,053 | ||||||
| 605,349 | iShares Exponential Technologies ETF | 19,207,724 | ||||||
| 286,622 | iShares MSCI EAFE ETF | 18,934,249 | ||||||
| 1,352,115 | iShares MSCI Emerging Markets ETF | 55,707,138 | ||||||
| 546,862 | iShares S&P 500 Growth ETF | 75,406,801 | ||||||
| 118,542 | iShares U.S. Medical Devices ETF | 19,061,554 | ||||||
| 272,600 | PowerShares QQQ Trust Series 1 | 38,515,654 | ||||||
| 785,663 | SPDR EURO STOXX 50 ETF | 31,065,115 | ||||||
| 136,176 | Vanguard Small-Cap ETF | 18,101,876 | ||||||
| 565,120 | Vanguard Value ETF | 53,912,448 | ||||||
|
| |||||||
TOTAL EXCHANGE TRADED FUNDS (Cost - $339,119,608) | 373,869,416 | |||||||
|
| |||||||
| Contracts | ||||||||
PURCHASED OPTIONS - 0.5% * | ||||||||
PURCHASED CALL OPTIONS - 0.5% * | ||||||||
CBOE S&P 500 Index | ||||||||
| 100 | Expiration: December 2017, Exercise Price $2,600 ** | 103,000 | ||||||
| 300 | Expiration: December 2017, Exercise Price $2,700 ** | 68,250 | ||||||
| 250 | Expiration: December 2018, Exercise Price $3,000 ** | 193,750 | ||||||
| 800 | Expiration: June 2017, Exercise Price $2,425 | 80,000 | ||||||
Consumer Staples Select Sector SPDR Fund | ||||||||
| 4,000 | Expiration: September 2017, Exercise Price $58 ** | 216,000 | ||||||
Health Care Select Sector SPDR Fund | ||||||||
| 1,000 | Expiration: June 2017, Exercise Price $76 ** | 69,500 | ||||||
iShares MSCI EAFE ETF | ||||||||
| 4,500 | Expiration: July 2017, Exercise Price $67 ** | 112,500 | ||||||
iShares MSCI Europe Financials ETF | ||||||||
| 1,926 | Expiration: October 2017, Exercise Price $22 ** | 139,635 | ||||||
PowerShares DB US Dollar Index Bullish Fund | ||||||||
| 4,000 | Expiration: December 2017, Exercise Price $26 ** | 108,000 | ||||||
SPDR EURO STOXX 50 ETF | ||||||||
| 6,000 | Expiration: August 2017, Exercise Price $39 ** | 615,000 | ||||||
| 500 | Expiration: June 2017, Exercise Price $40 ** | 10,000 | ||||||
WisdomTree Japan Hedged Equity Fund | ||||||||
| 3,000 | Expiration: August 2017, Exercise Price $53 ** | 160,500 | ||||||
|
| |||||||
TOTAL PURCHASED CALL OPTIONS (Cost - $2,148,275) | 1,876,135 | |||||||
|
| |||||||
| PURCHASED PUT OPTIONS - 0.0% * ^ | ||||||||
CurrencyShares Japanese Yen Trust | ||||||||
| 250 | Expiration: June 2017, Exercise Price $75 ** | 625 | ||||||
The accompanying notes are an integral part of these financial statements.
6
Horizon Active Asset Allocation Fund
PORTFOLIO OF INVESTMENTS (Unaudited) (Continued)
May 31, 2017
| Contracts | Value | |||||||
SPDR EURO STOXX 50 ETF | ||||||||
| 1,250 | Expiration: August 2017, Exercise Price $36 ** | $ | 37,500 | |||||
|
| |||||||
TOTAL PURCHASED PUT OPTIONS (Cost - $60,954) | 38,125 | |||||||
|
| |||||||
| TOTAL PURCHASED OPTIONS (Cost - $2,209,229) | 1,914,260 | |||||||
|
| |||||||
| Shares | ||||||||
SHORT-TERM INVESTMENTS - 1.2% | ||||||||
| 4,496,428 | Invesco Advisers, Inc. STIT - Liquid Assets Portfolio - Institutional Class, 0.67% + (a) | 4,496,428 | ||||||
|
| |||||||
TOTAL SHORT-TERM INVESTMENTS (Cost - $4,496,428) | 4,496,428 | |||||||
|
| |||||||
| TOTAL INVESTMENTS - 100.0% (Cost - $345,825,265) (b) | 380,280,104 | |||||||
Liabilities in Excess of Other Assets - (0.0)% | (146,964 | ) | ||||||
|
| |||||||
NET ASSETS - 100.0% | $ | 380,133,140 | ||||||
|
| |||||||
| Contracts | ||||||||
SCHEDULE OF OPTIONS WRITTEN - 0.0% * ^ | ||||||||
SCHEDULE OF PUT OPTIONS WRITTEN - 0.0% * ^ | ||||||||
Health Care Select Sector SPDR Fund | ||||||||
| 1,000 | Expiration: June 2017, Exercise Price $71 ** | 3,000 | ||||||
PowerShares DB US Dollar Index Bullish Fund | ||||||||
| 8,000 | Expiration: December 2017, Exercise Price $24 ** | 112,000 | ||||||
SPDR EURO STOXX 50 ETF | ||||||||
| 5,000 | Expiration: August 2017, Exercise Price $33 ** | 50,000 | ||||||
|
| |||||||
TOTAL PUT OPTIONS WRITTEN (Premiums Received $686,312) | 165,000 | |||||||
|
| |||||||
| TOTAL OPTIONS WRITTEN (Premiums Received $686,312) | $ | 165,000 | ||||||
|
| |||||||
| * | Each Option is equivalent to 100 shares of the underlying security. |
| ** | Non-income producing security. |
| + | Money Market Fund; interest rate reflects seven-day yield on May 31, 2017. |
| ^ | Less than 0.1% |
(a) All or a portion of the security is segregated as collateral for options written.
(b) Represents cost for financial reporting purposes. Aggregate cost for federal tax purposes, excluding options written, is $346,515,251 and differs from fair value by net unrealized appreciation (depreciation) of securities as follows:
| Unrealized appreciation | $ | 35,480,620 | ||
| Unrealized depreciation | (1,715,767) | |||
|
| |||
| Net unrealized appreciation | $ | 33,764,853 | ||
|
|
The accompanying notes are an integral part of these financial statements.
7
Horizon Active Risk Assist Fund
PORTFOLIO OF INVESTMENTS (Unaudited)
May 31, 2017
| Shares | Value | |||||||
EXCHANGE TRADED FUNDS - 98.3% | ||||||||
Equity Funds - 98.3% | ||||||||
| 825,787 | Deutsche X-trackers MSCI Europe Hedged Equity ETF | $ | 23,378,030 | |||||
| 252,409 | iShares MSCI EAFE ETF | 16,674,139 | ||||||
| 1,216,535 | iShares MSCI Emerging Markets ETF | 50,121,242 | ||||||
| 493,473 | iShares S&P 500 Growth ETF | 68,044,992 | ||||||
| 363,177 | PowerShares QQQ Trust Series 1 | 51,313,278 | ||||||
| 702,564 | SPDR EURO STOXX 50 ETF | 27,779,381 | ||||||
| 115,215 | Vanguard Small-Cap Growth ETF | 16,484,962 | ||||||
| 132,263 | Vanguard Small-Cap Value ETF | 15,923,143 | ||||||
| 705,498 | Vanguard Value ETF | 67,304,509 | ||||||
|
| |||||||
TOTAL EXCHANGE TRADED FUNDS (Cost - $302,367,387) | 337,023,676 | |||||||
|
| |||||||
| Contracts | ||||||||
PURCHASED OPTIONS - 0.6% * | ||||||||
PURCHASED CALL OPTIONS - 0.1% * | ||||||||
CBOE S&P 500 Index | ||||||||
| 350 | Expiration: June 2017, Exercise Price $2,425 ** | 35,000 | ||||||
| 100 | Expiration: December 2017, Exercise Price $2,700 ** | 22,750 | ||||||
| 150 | Expiration: December 2018, Exercise Price $3,000** | 116,250 | ||||||
Consumer Staples Select Sector SPDR Fund | ||||||||
| 3,500 | Expiration: September 2017, Exercise Price $58 ** | 189,000 | ||||||
iShares MSCI EAFE ETF | ||||||||
| 3,000 | Expiration: July 2017, Exercise Price $67 ** | 75,000 | ||||||
SPDR EURO STOXX 50 ETF | ||||||||
| 1,718 | Expiration: June 2017, Exercise Price $40 ** | 34,360 | ||||||
|
| |||||||
| TOTAL PURCHASED CALL OPTIONS (Cost - $520,213) | 472,360 | |||||||
|
| |||||||
| PURCHASED PUT OPTIONS - 0.5% * | ||||||||
CurrencyShares Japanese Yen Trust | ||||||||
| 250 | Expiration: June 2017, Exercise Price $75 ** | 625 | ||||||
iShares MSCI Emerging Markets ETF | ||||||||
| 5,000 | Expiration: July 2017, Exercise Price $41 ** | 457,500 | ||||||
| 6,000 | Expiration: July 2017, Exercise Price $39 ** | 198,000 | ||||||
PowerShares QQQ Trust Series 1 | ||||||||
| 3,500 | Expiration: July 2017, Exercise Price $139 ** | 596,750 | ||||||
SPDR S&P500 ETF Trust | ||||||||
| 2,000 | Expiration: July 2017, Exercise Price $235 ** | 326,000 | ||||||
|
| |||||||
TOTAL PURCHASED PUT OPTIONS (Cost - $2,219,566) | 1,578,875 | |||||||
|
| |||||||
| TOTAL PURCHASED OPTIONS (Cost - $2,739,779) | 2,051,235 | |||||||
|
| |||||||
The accompanying notes are an integral part of these financial statements.
8
Horizon Active Risk Assist Fund
PORTFOLIO OF INVESTMENTS (Unaudited) (Continued)
May 31, 2017
| Shares | Value | |||||||
SHORT-TERM INVESTMENTS - 1.2% | ||||||||
| 4,096,076 | Invesco Advisers, Inc. STIT - Liquid Assets Portfolio - Institutional Class, 0.67% + (a) | $ | 4,096,076 | |||||
|
| |||||||
TOTAL SHORT-TERM INVESTMENTS (Cost - $4,096,076) | 4,096,076 | |||||||
|
| |||||||
| TOTAL INVESTMENTS - 100.1% (Cost - $309,203,242) (b) | 343,170,987 | |||||||
Liabilities in Excess of Other Assets - (0.1)% | (424,336 | ) | ||||||
|
| |||||||
NET ASSETS - 100.0% | $ | 342,746,651 | ||||||
|
| |||||||
| Contracts | ||||||||
SCHEDULE OF OPTIONS WRITTEN - (0.1)% * | ||||||||
SCHEDULE OF PUT OPTIONS WRITTEN - (0.1)% * | ||||||||
iShares MSCI Emerging Markets ETF | ||||||||
| 6,000 | Expiration: July 2017, Exercise Price $35 ** | 51,000 | ||||||
| 5,000 | Expiration: July 2017, Exercise Price $37 ** | 67,500 | ||||||
PowerShares QQQ Trust Series 1 | ||||||||
| 3,500 | Expiration: July 2017, Exercise Price $131 ** | 162,750 | ||||||
SPDR S&P500 ETF Trust | ||||||||
| 2,000 | Expiration: July 2017, Exercise Price $235 ** | 64,000 | ||||||
|
| |||||||
TOTAL PUT OPTIONS WRITTEN (Premiums Received $505,927) | 345,250 | |||||||
|
| |||||||
| TOTAL OPTIONS WRITTEN (Premiums Received $505,927) | $ | 345,250 | ||||||
|
| |||||||
| * | Each Option is equivalent to 100 shares of the underlying security |
| ** | Non-income producing security. |
| + | Money Market Fund; interest rate reflects seven-day yield on May 31, 2017. |
(a) All or a portion of the security is segregated as collateral for options written.
(b) Represents cost for financial reporting purposes. Aggregate cost for federal tax purposes, including options written, is $309,891,453 and differs from fair value by net unrealized appreciation (depreciation) of securities as follows:
| Unrealized appreciation | $ | 34,132,211 | ||
| Unrealized depreciation | (852,677) | |||
|
| |||
| Net unrealized appreciation | $ | 33,279,534 | ||
|
|
The accompanying notes are an integral part of these financial statements.
9
Horizon Active Income Fund
PORTFOLIO OF INVESTMENTS (Unaudited)
May 31, 2017
| Shares | Value | |||||||
EXCHANGE TRADED FUNDS - 99.0% | ||||||||
Bond Funds - 88.0% | ||||||||
| 331,496 | Deutsche X-Trackers USD High Yield Corporate Bond ETF | $ | 17,045,524 | |||||
| 141,933 | iShares 7-10 Year Treasury Bond ETF | 15,232,250 | ||||||
| 190,582 | iShares iBoxx $ Investment Grade Corporate Bond ETF | 22,917,485 | ||||||
| 164,449 | iShares JP Morgan USD Emerging Markets Bond ETF | 19,015,238 | ||||||
| 512,656 | SPDR Blackstone / GSO Senior Loan ETF | 24,397,299 | ||||||
| 312,776 | SPDR Bloomberg Barclays Convertible Securities ETF | 15,366,685 | ||||||
| 536,851 | SPDR Bloomberg Barclays Short Term High Yield Bond ETF | 15,106,987 | ||||||
| 803,561 | SPDR Doubleline Total Return Tactical ETF | 39,703,949 | ||||||
|
| |||||||
| 168,785,417 | ||||||||
|
| |||||||
Equity Funds - 11.0% | ||||||||
| 1,105,688 | PowerShares Financial Preferred Portfolio | 21,019,129 | ||||||
|
| |||||||
TOTAL EXCHANGE TRADED FUNDS (Cost - $187,378,843) | 189,804,546 | |||||||
|
| |||||||
| Contracts | ||||||||
PURCHASED CALL OPTIONS - 0.0% * ^ | ||||||||
CBOE S&P 500 Index | ||||||||
| 100 | Expiration: June 2017, Exercise Price $2,425 ** | 10,000 | ||||||
iShares U.S. Preferred Stock ETF | ||||||||
| 470 | Expiration: October 2017, Exercise Price $40 ** | 1,175 | ||||||
| 10 | Expiration: October 2017, Exercise Price $39 ** | 175 | ||||||
|
| |||||||
TOTAL PURCHASED CALL OPTIONS (Cost - $22,325) | 11,350 | |||||||
|
| |||||||
| Shares | ||||||||
SHORT-TERM INVESTMENTS - 1.0% | ||||||||
| 1,844,392 | Invesco Advisers, Inc. STIT - Liquid Assets Portfolio - Institutional Class, 0.67% + (a) | 1,844,392 | ||||||
|
| |||||||
TOTAL SHORT-TERM INVESTMENTS (Cost - $1,844,392) | 1,844,392 | |||||||
|
| |||||||
| TOTAL INVESTMENTS - 100.0% (Cost $189,245,560) (b) | 191,660,288 | |||||||
Other Assets in Excess of Liabilities - 0.0% | 19,656 | |||||||
|
| |||||||
NET ASSETS - 100.0% | $ | 191,679,944 | ||||||
|
| |||||||
| * | Each Option is equivalent to 100 shares of the underlying security |
| ** | Non-income producing security. |
| + | Money Market Fund; interest rate reflects seven-day yield on May 31, 2017. |
| ^ | Less than 0.1% |
(a) All or a portion of the security is segregated as collateral for options written.
The accompanying notes are an integral part of these financial statements.
10
Horizon Active Income Fund
PORTFOLIO OF INVESTMENTS (Unaudited) (Continued)
May 31, 2017
(b) Represents cost for financial reporting purposes. Aggregate cost for federal tax purposes, including options written, is $189,245,584 and differs from fair value by net unrealized appreciation (depreciation) of securities as follows:
| Unrealized appreciation | $ | 2,927,930 | ||
| Unrealized depreciation | (513,226) | |||
|
| |||
| Net unrealized depreciation | $ | 2,414,704 | ||
|
|
The accompanying notes are an integral part of these financial statements.
11
Horizon Active Dividend Fund
PORTFOLIO OF INVESTMENTS (Unaudited)
May 31, 2017
| Shares | Value | |||||||
COMMON STOCKS - 98.0% | ||||||||
Advertising - 1.8% | ||||||||
| 13 | Omnicom Group, Inc. | $ | 1,088 | |||||
|
| |||||||
| Aerospace/Defense - 5.0% | ||||||||
| 6 | The Boeing Co. | 1,126 | ||||||
| 15 | United Technologies Corp. | 1,819 | ||||||
|
| |||||||
| 2,945 | ||||||||
|
| |||||||
Apparel - 1.9% | ||||||||
| 54 | Hanesbrands, Inc. | 1,115 | ||||||
|
| |||||||
| Auto Manufacturers - 3.9% | ||||||||
| 34 | General Motors Co. | 1,154 | ||||||
| 40 | Honda Motor Co. Ltd. | 1,117 | ||||||
|
| |||||||
| 2,271 | ||||||||
|
| |||||||
Banks - 3.9% | ||||||||
| 15 | Canadian Imperial Bank of Commerce | 1,171 | ||||||
| 26 | HSBC Holdings PLC | 1,131 | ||||||
|
| |||||||
| 2,302 | ||||||||
|
| |||||||
Beverages - 9.4% | ||||||||
| 65 | The Coca-Cola Co. | 2,956 | ||||||
| 21 | Diageo PLC | 2,560 | ||||||
|
| |||||||
| 5,516 | ||||||||
|
| |||||||
Biotechnology - 4.0% | ||||||||
| 36 | Gilead Sciences, Inc. | 2,336 | ||||||
|
| |||||||
| Computers - 2.1% | ||||||||
| 8 | International Business Machines Corp. | 1,221 | ||||||
|
| |||||||
| Cosmetics/Personal Care - 1.9% | ||||||||
| 13 | The Procter & Gamble Co. | 1,145 | ||||||
|
| |||||||
| Electronics - 2.0% | ||||||||
| 9 | Honeywell International, Inc. | 1,197 | ||||||
|
| |||||||
| Food - 2.1% | ||||||||
| 36 | Whole Foods Market, Inc. | 1,260 | ||||||
|
| |||||||
| Insurance - 1.9% | ||||||||
| 64 | Manulife Financial Corp. | 1,103 | ||||||
|
| |||||||
| Lodging - 3.0% | ||||||||
| 30 | Las Vegas Sands Corp. | 1,774 | ||||||
|
| |||||||
The accompanying notes are an integral part of these financial statements.
12
Horizon Active Dividend Fund
PORTFOLIO OF INVESTMENTS (Unaudited) (Continued)
May 31, 2017
| Shares | Value | |||||||
| Mining - 2.7% | ||||||||
| 40 | Rio Tinto PLC | $ | 1,612 | |||||
|
| |||||||
| Miscellaneous Manufacturing - 4.0% | ||||||||
| 6 | 3M Co. | 1,227 | ||||||
| 16 | Siemens AG | 1,144 | ||||||
|
| |||||||
| 2,371 | ||||||||
|
| |||||||
Office/Business Equipment - 2.0% | ||||||||
| 34 | Canon, Inc. | 1,184 | ||||||
|
| |||||||
| Oil & Gas - 2.0% | ||||||||
| 22 | TOTAL SA | 1,151 | ||||||
|
| |||||||
| Pharmaceuticals - 12.6% | ||||||||
| 26 | Bayer AG | 3,451 | ||||||
| 67 | Novo Nordisk A/S | 2,839 | ||||||
| 23 | Sanofi | 1,141 | ||||||
|
| |||||||
| 7,431 | ||||||||
|
| |||||||
Real Estate Investment Trusts - 1.9% | ||||||||
| 9 | Ventas, Inc. | 598 | ||||||
| 7 | Welltower, Inc. | 508 | ||||||
|
| |||||||
| 1,106 | ||||||||
|
| |||||||
Retail - 20.2% | ||||||||
| 45 | Coach, Inc. | 2,079 | ||||||
| 36 | CVS Health Corp. | 2,766 | ||||||
| 7 | The Home Depot, Inc. | 1,074 | ||||||
| 57 | Kohl’s Corp. | 2,190 | ||||||
| 48 | Wal-Mart Stores, Inc. | 3,773 | ||||||
|
| |||||||
| 11,882 | ||||||||
|
| |||||||
Semiconductors - 5.0% | ||||||||
| 51 | QUALCOMM, Inc. | 2,921 | ||||||
|
| |||||||
| Telecommunications - 4.7% | ||||||||
| 87 | Cisco Systems, Inc. | 2,743 | ||||||
|
| |||||||
TOTAL COMMON STOCKS (Cost - $55,221) | 57,674 | |||||||
|
| |||||||
The accompanying notes are an integral part of these financial statements.
13
Horizon Active Dividend Fund
PORTFOLIO OF INVESTMENTS (Unaudited) (Continued)
May 31, 2017
| Shares | Value | |||||||
| SHORT-TERM INVESTMENTS - 33.7% | ||||||||
| 19,797 | Invesco Advisers, Inc. STIT - Liquid Assets Portfolio - Institutional Class, 0.67% + | $ | 19,797 | |||||
|
| |||||||
TOTAL SHORT-TERM INVESTMENTS (Cost - $19,797) | 19,797 | |||||||
|
| |||||||
| TOTAL INVESTMENTS - 131.7% (Cost - $75,018) (a) | 77,471 | |||||||
Liabilities in Excess of Other Assets - (31.7)% | (18,640 | ) | ||||||
|
| |||||||
NET ASSETS - 100.0% | $ | 58,831 | ||||||
|
| |||||||
| + | Money Market Fund; interest rate reflects seven-day yield on May 31, 2017. |
(a) Represents cost for financial reporting purposes. Aggregate cost for federal tax purposes is $75,018 and differs from fair value by net unrealized appreciation (depreciation) of securities as follows:
| Unrealized appreciation | $ | 3,465 | ||
| Unrealized depreciation | (1,012) | |||
|
| |||
| Net unrealized appreciation | $ | 2,453 | ||
|
|
The accompanying notes are an integral part of these financial statements.
14
Horizon Funds
STATEMENTS OF ASSETS AND LIABILITIES (Unaudited)
May 31, 2017
| Horizon Active Asset Allocation Fund | Horizon Active Risk Assist Fund | Horizon Active Income Fund | Horizon Active Dividend Fund | |||||||||||||
Assets: | ||||||||||||||||
Investments in Securities, at Cost | $ | 345,825,265 | $ | 309,203,242 | $ | 189,245,560 | $ | 75,018 | ||||||||
|
|
|
|
|
|
|
| |||||||||
Investments in Securities, at Value | $ | 380,280,104 | $ | 343,170,987 | $ | 191,660,288 | $ | 77,471 | ||||||||
Cash Held at Broker | 168 | 1 | - | - | ||||||||||||
Receivable for Fund Shares Sold | 695,056 | 795,285 | 381,897 | - | ||||||||||||
Dividends and Interest Receivable | 2,399 | 3,700 | 1,357 | 162 | ||||||||||||
Prepaid Expenses and Other Assets | 51,184 | 40,557 | 31,131 | 5,472 | ||||||||||||
|
|
|
|
|
|
|
| |||||||||
Total Assets | 381,028,911 | 344,010,530 | 192,074,673 | 83,105 | ||||||||||||
|
|
|
|
|
|
|
| |||||||||
Liabilities: | ||||||||||||||||
Options written, at value (Premiums received $686,312, $505,927, $0 and $0) | 165,000 | 345,250 | - | - | ||||||||||||
Payable for Fund Shares Redeemed | 75,152 | 348,901 | 43,429 | - | ||||||||||||
Accrued Advisory Fees | 318,117 | 288,914 | 147,734 | 68 | ||||||||||||
Accrued Distribution (12b-1) Fees | 1,127 | 113 | 25 | 55 | ||||||||||||
Accrued Shareholder Servicing Fees | 253,355 | 228,724 | 126,654 | - | ||||||||||||
Accrued Expenses and Other Liabilities | 83,020 | 51,977 | 76,887 | 24,151 | ||||||||||||
|
|
|
|
|
|
|
| |||||||||
Total Liabilities | 895,771 | 1,263,879 | 394,729 | 24,274 | ||||||||||||
|
|
|
|
|
|
|
| |||||||||
Net Assets | $ | 380,133,140 | $ | 342,746,651 | $ | 191,679,944 | $ | 58,831 | ||||||||
|
|
|
|
|
|
|
| |||||||||
Composition of Net Assets: | ||||||||||||||||
Net assets consisted of: | ||||||||||||||||
Paid in Capital | $ | 339,800,213 | $ | 325,357,048 | $ | 196,901,527 | $ | 55,373 | ||||||||
Undistributed Net Investment Income (Loss) | (2,241,330 | ) | (985,630 | ) | (22,748 | ) | 25 | |||||||||
Accumulated Net Realized Gain (Loss) on Investments, Purchased Options and Options Written | 7,598,106 | (15,753,189 | ) | (7,613,563 | ) | 980 | ||||||||||
Net Unrealized Appreciation (Depreciation) on Investments Purchased Options and Options Written | 34,976,151 | 34,128,422 | 2,414,728 | 2,453 | ||||||||||||
|
|
|
|
|
|
|
| |||||||||
Net Assets | $ | 380,133,140 | $ | 342,746,651 | $ | 191,679,944 | $ | 58,831 | ||||||||
|
|
|
|
|
|
|
| |||||||||
Advisor Class Shares: | ||||||||||||||||
Net Asset Value Per Share: | ||||||||||||||||
Net Assets | $ | 3,589,095 | $ | 339,306 | $ | 47,462 | $ | - | ||||||||
Shares of Beneficial Interest Outstanding | 277,836 | 16,002 | 4,845 | - | ||||||||||||
|
|
|
|
|
|
|
| |||||||||
Net Asset Value, (Net Assets / Shares Outstanding) Offering and Redemption Price Per Share | $ | 12.92 | $ | 21.20 | $ | 9.80 | $ | - | ||||||||
|
|
|
|
|
|
|
| |||||||||
Investor Class Shares: | ||||||||||||||||
Net Assets | $ | 364,507,785 | $ | 341,924,159 | $ | 188,439,731 | $ | 58,831 | ||||||||
Shares of Beneficial Interest Outstanding | 28,151,571 | 16,117,771 | 19,305,699 | 1,101 | ||||||||||||
|
|
|
|
|
|
|
| |||||||||
Net Asset Value, (Net Assets / Shares Outstanding) | ||||||||||||||||
Offering and Redemption Price Per Share | $ | 12.95 | $ | 21.21 | $ | 9.76 | $ | 53.46 | ||||||||
|
|
|
|
|
|
|
| |||||||||
Institutional Class Shares: | ||||||||||||||||
Net Assets | $ | 12,036,260 | $ | 483,186 | $ | 3,192,751 | $ | - | ||||||||
Shares of Beneficial Interest Outstanding | 928,935 | 22,752 | 327,225 | - | ||||||||||||
|
|
|
|
|
|
|
| |||||||||
Net Asset Value, (Net Assets / Shares Outstanding) Offering and Redemption Price Per Share | $ | 12.96 | $ | 21.24 | $ | 9.76 | $ | - | ||||||||
|
|
|
|
|
|
|
| |||||||||
The accompanying notes are an integral part of these financial statements.
15
Horizon Funds
STATEMENTS OF OPERATIONS (Unaudited)
For the Period Ended May 31, 2017
| Horizon Active Asset Allocation Fund | Horizon Active Risk Assist Fund | Horizon Active Income Fund | Horizon Active Dividend Fund* | |||||||||||||
Investment Income: | ||||||||||||||||
Dividend Income | $ | 3,523,181 | $ | 3,184,923 | $ | 3,653,672 | $ | 633 | ||||||||
Interest Income | 46,968 | 12,409 | 6,512 | 39 | ||||||||||||
|
|
|
|
|
|
|
| |||||||||
Total Investment Income | 3,570,149 | 3,197,332 | 3,660,184 | 672 | ||||||||||||
|
|
|
|
|
|
|
| |||||||||
Expenses: | ||||||||||||||||
Investment Advisory Fees | 2,026,430 | 1,792,924 | 726,699 | 166 | ||||||||||||
Shareholder Servicing Fees - Investor Class | 443,726 | 407,032 | 232,261 | - | ||||||||||||
Distribution Fees (12b-1) - Advisor Class | 3,774 | 422 | 31 | - | ||||||||||||
Distribution Fees (12b-1) - Investor Class | - | - | - | 55 | ||||||||||||
Administrative Service Fees | 117,824 | 106,246 | 61,138 | 2,464 | ||||||||||||
Transfer Agent Fees | 63,574 | 55,160 | 67,928 | 14,588 | ||||||||||||
Accounting Service Fees | 1,358 | 2,450 | 98 | 154 | ||||||||||||
Registration Fees | 44,815 | 44,125 | 31,324 | 70 | ||||||||||||
Custodian Fees | 12,054 | 8,918 | 4,914 | 2,772 | ||||||||||||
Printing and Postage Expenses | 9,660 | 7,966 | 5,488 | 616 | ||||||||||||
Chief Compliance Officer Fees | 22,512 | 20,328 | 14,868 | 1,644 | ||||||||||||
Trustees’ Fees and Expenses | 18,004 | 14,028 | 11,172 | - | ||||||||||||
Insurance Fees | 5,656 | 4,592 | 2,408 | - | ||||||||||||
Audit Fees | 8,666 | 8,666 | 8,666 | 7,700 | ||||||||||||
Legal Fees | 10,906 | 9,982 | 7,294 | 1,274 | ||||||||||||
Offering Costs | 6,419 | 4,290 | 4,485 | - | ||||||||||||
Miscellaneous Expenses | 16,982 | 13,944 | 10,094 | - | ||||||||||||
|
|
|
|
|
|
|
| |||||||||
Total Expenses | 2,812,360 | 2,501,073 | 1,188,868 | 31,503 | ||||||||||||
Less: Fees Waived by the Adviser | (209,476 | ) | (186,497 | ) | (22,234 | ) | (31,229 | ) | ||||||||
|
|
|
|
|
|
|
| |||||||||
Net Expenses | 2,602,884 | 2,314,576 | 1,166,634 | 274 | ||||||||||||
|
|
|
|
|
|
|
| |||||||||
Net Investment Income | 967,265 | 882,756 | 2,493,550 | 398 | ||||||||||||
|
|
|
|
|
|
|
| |||||||||
Net Realized and Unrealized Gain (Loss) on Investments: | ||||||||||||||||
Net Realized Gain (Loss) on: | ||||||||||||||||
Investments | 16,226,887 | 8,702,311 | (6,275,519 | ) | 980 | |||||||||||
Purchased Options | 1,043,431 | (4,225,280 | ) | 44,830 | - | |||||||||||
Written Options | 797,790 | 913,543 | 139,385 | - | ||||||||||||
Net Change in Unrealized Appreciation (Depreciation) on: | ||||||||||||||||
Investments | 25,685,938 | 27,645,599 | 11,052,496 | 2,453 | ||||||||||||
Purchased Options | 53,070 | (365,267 | ) | (10,975 | ) | - | ||||||||||
Written Options | 180,222 | (24,731 | ) | - | - | |||||||||||
|
|
|
|
|
|
|
| |||||||||
Net Realized and Unrealized Gain (Loss) on Investments | 43,987,338 | 32,646,175 | 4,950,217 | 3,433 | ||||||||||||
|
|
|
|
|
|
|
| |||||||||
Net Increase in Net Assets Resulting From Operations | $ | 44,954,603 | $ | 33,528,931 | $ | 7,443,767 | $ | 3,831 | ||||||||
|
|
|
|
|
|
|
| |||||||||
| * | Horizon Active Dividend Fund commenced operations on December 28, 2016. |
The accompanying notes are an integral part of these financial statements.
16
Horizon Active Asset Allocation Fund
STATEMENTS OF CHANGES IN NET ASSETS
| For the Six Months Ended May 31, 2017 | For the Year Ended November 30, 2016 | |||||||
| (Unaudited) | ||||||||
Operations: | ||||||||
Net Investment Income | $ | 967,265 | $ | 3,944,221 | ||||
Net Realized Gain (Loss) on Investments, Purchased Options and Written Options | 18,068,108 | (12,103,131) | ||||||
Distributions of Long-Term Capital Gains by Underlying Investment Companies | - | 1,887,142 | ||||||
Net Change in Unrealized Appreciation (Depreciation) on | ||||||||
Investments, Purchased Options and Written Options | 25,919,230 | 4,736,359 | ||||||
|
|
|
| |||||
Net Increase (Decrease) in Net Assets Resulting From Operations | 44,954,603 | (1,535,409) | ||||||
|
|
|
| |||||
Distributions to Shareholders From: | ||||||||
From net investment income | ||||||||
Advisor Class | (24,872) | (491) | ||||||
Institutional Class | (103,172) | - | ||||||
Investor Class | (3,160,658) | (6,245,756) | ||||||
From net realized gains | ||||||||
Advisor Class | - | (375) | ||||||
Institutional Class | - | - | ||||||
Investor Class | - | (4,774,700) | ||||||
|
|
|
| |||||
Total Distributions to Shareholders | (3,288,702) | (11,021,322) | ||||||
|
|
|
| |||||
Capital Share Transactions: | ||||||||
Proceeds from Shares Issued | ||||||||
Advisor Class | 1,229,597 | 2,332,928 | ||||||
Investor Class | 45,479,254 | 131,399,465 | ||||||
Institutional Class | 2,975,115 | 9,047,406 | ||||||
Distributions Reinvested | ||||||||
Advisor Class | 18,935 | 866 | ||||||
Investor Class | 3,134,834 | 10,592,482 | ||||||
Institutional Class | 103,172 | - | ||||||
Cost of Share Redeemed | ||||||||
Advisor Class | (246,437) | (100,915) | ||||||
Investor Class | (78,540,094) | (141,520,139) | ||||||
Institutional Class | (1,023,809) | (255,960) | ||||||
|
|
|
| |||||
Net Increase (Decrease) in Net Assets Resulting From Beneficial Interest Transactions | (26,869,433) | 11,496,133 | ||||||
|
|
|
| |||||
Increase in Net Assets | 14,796,468 | (1,060,598) | ||||||
|
|
|
| |||||
Net Assets: | ||||||||
Beginning of Year | 365,336,672 | 366,397,270 | ||||||
|
|
|
| |||||
End of Year* | $ | 380,133,140 | 365,336,672 | |||||
|
|
|
| |||||
* Includes Undistributed Net Investment Income (Loss) of: | $ | (2,241,330) | 80,107 | |||||
|
|
|
| |||||
Share Activity: | ||||||||
Advisor Class: | ||||||||
Shares Issued | 101,779 | 200,877 | ||||||
Shares Reinvested | 1,621 | 76 | ||||||
Shares Redeemed | (20,131) | (8,837) | ||||||
|
|
|
| |||||
Net Increase (Decrease) | 83,269 | 192,116 | ||||||
|
|
|
| |||||
Investor Class: | ||||||||
Shares Issued | 3,722,728 | 11,674,072 | ||||||
Shares Reinvested | 267,935 | 930,798 | ||||||
Shares Redeemed | (6,473,268) | (12,519,818) | ||||||
|
|
|
| |||||
Net Increase (Decrease) | (2,482,605) | 85,052 | ||||||
|
|
|
| |||||
Institutional Class: | ||||||||
Shares Issued | 243,586 | 782,370 | ||||||
Shares Reinvested | 8,818 | - | ||||||
Shares Redeemed | (83,657) | (22,182) | ||||||
|
|
|
| |||||
Net Increase (Decrease) | 168,747 | 760,188 | ||||||
|
|
|
| |||||
The accompanying notes are an integral part of these financial statements.
17
Horizon Active Risk Assist Fund
STATEMENTS OF CHANGES IN NET ASSETS (Continued)
| For the Six Months Ended May 31, 2017 | For the Year Ended November 30, 2016 | |||||||
| (Unaudited) | ||||||||
Operations: | ||||||||
Net Investment Income | $ | 882,756 | $ | 2,278,015 | ||||
Net Realized Gain (Loss) on Investments, Purchased Options and Written Options | 5,390,574 | (11,278,700) | ||||||
Distributions of Long-Term Capital Gains by Underlying Investment Companies | - | 944,697 | ||||||
Net Change in Unrealized Appreciation on Investments, Purchased Options and Written Options | 27,255,601 | 6,054,651 | ||||||
|
|
|
| |||||
Net Increase (Decrease) in Net Assets Resulting From Operations | 33,528,931 | (2,001,337) | ||||||
|
|
| �� | |||||
Distributions to Shareholders From: | ||||||||
From net investment income | ||||||||
Advisor Class | (2,886) | — | ||||||
Investor Class | (2,743,024) | (2,312,701) | ||||||
Institutional Class | (70) | — | ||||||
|
|
|
| |||||
Total Distributions to Shareholders | (2,745,980) | (2,312,701) | ||||||
|
|
|
| |||||
Capital Share Transactions: | ||||||||
Proceeds from Shares Issued | ||||||||
Advisor Class | 17,071 | 345,159 | ||||||
Investor Class | 53,700,467 | 251,445,897 | ||||||
Institutional Class | 475,708 | 6,519 | ||||||
Distributions Reinvested | ||||||||
Advisor Class | 2,886 | - | ||||||
Investor Class | 2,685,810 | 2,163,075 | ||||||
Institutional Class | 70 | - | ||||||
Cost of Share Redeemed | ||||||||
Advisor Class | (25,007) | (50,686) | ||||||
Investor Class | (64,597,514) | (152,313,227) | ||||||
Institutional Class | - | - | ||||||
|
|
|
| |||||
Net Increase (Decrease) in Net Assets Resulting From Beneficial Interest Transactions | (7,740,509) | 101,596,737 | ||||||
|
|
|
| |||||
Increase in Net Assets | 23,042,442 | 97,282,699 | ||||||
|
|
|
| |||||
Net Assets: | ||||||||
Beginning of Year | 319,704,209 | 222,421,510 | ||||||
|
|
|
| |||||
End of Year* | $ | 342,746,651 | $ | 319,704,209 | ||||
|
|
|
| |||||
* Includes Undistributed Net Investment Income (Loss) of: | $ | (985,630) | $ | 877,594 | ||||
|
|
|
| |||||
Share Activity: | ||||||||
Advisor Class: | ||||||||
Shares Issued | 856 | 18,827 | ||||||
Shares Reinvested | 149 | - | ||||||
Shares Redeemed | (1,200) | (2,631) | ||||||
|
|
|
| |||||
Net Increase (Decrease) | (195) | 16,196 | ||||||
|
|
|
| |||||
Investor Class: | ||||||||
Shares Issued | 2,643,089 | 13,357,582 | ||||||
Shares Reinvested | 138,230 | 113,073 | ||||||
Shares Redeemed | (3,207,317) | (8,262,233) | ||||||
|
|
|
| |||||
Net Increase (Decrease) | (425,998) | 5,208,422 | ||||||
|
|
|
| |||||
Institutional Class: | ||||||||
Shares Issued | 22,407 | 341 | ||||||
Shares Reinvested | 4 | - | ||||||
|
|
|
| |||||
Net Increase (Decrease) | 22,411 | 341 | ||||||
|
|
|
| |||||
The accompanying notes are an integral part of these financial statements.
18
Horizon Active Income Fund
STATEMENTS OF CHANGES IN NET ASSETS (Continued)
| For the Six Months Ended May 31, 2017 | For the Year Ended November 30, 2016 | |||||||
| (Unaudited) | ||||||||
Operations: | ||||||||
Net Investment Income | $ | 2,493,550 | $ | 2,929,083 | ||||
Net Realized Gain (Loss) on Investments, Purchased Options and Written Options | (6,091,304) | 1,097,254 | ||||||
Distributions of Long-Term Capital Gains by Underlying Investment Companies | - | 100,576 | ||||||
Net Change in Unrealized Appreciation (Depreciation) on Investments, Purchased Options and Written Options | 11,041,521 | (8,332,485) | ||||||
|
|
|
| |||||
Net Increase (Decrease) in Net Assets Resulting From Operations | 7,443,767 | (4,205,572) | ||||||
|
|
|
| |||||
Distributions to Shareholders From: | ||||||||
From net investment income | ||||||||
Advisor Class | (397) | - | ||||||
Investor Class | (3,505,512) | (1,904,275) | ||||||
Institutional Class | (59,132) | - | ||||||
|
|
|
| |||||
Total Distributions to Shareholders | (3,565,041) | (1,904,275) | ||||||
|
|
|
| |||||
Capital Share Transactions: | ||||||||
Proceeds from Shares Issued | ||||||||
Advisor Class | 39,600 | 6,510 | ||||||
Investor Class | 31,809,148 | 133,141,592 | ||||||
Institutional Class | 761,145 | 2,832,604 | ||||||
Distributions Reinvested | ||||||||
Advisor Class | 397 | - | ||||||
Investor Class | 3,440,294 | 1,850,120 | ||||||
Institutional Class | 59,132 | - | ||||||
Cost of Share Redeemed | ||||||||
Advisor Class | - | - | ||||||
Investor Class | (38,325,703) | (111,019,291) | ||||||
Institutional Class | (258,955) | (150,752) | ||||||
|
|
|
| |||||
Net Increase (Decrease) in Net Assets Resulting From Beneficial Interest Transactions | (2,474,942) | 26,660,783 | ||||||
|
|
|
| |||||
Increase in Net Assets | 1,403,784 | 20,550,936 | ||||||
|
|
|
| |||||
Net Assets: | ||||||||
Beginning of Year | 190,276,160 | 169,725,224 | ||||||
|
|
|
| |||||
End of Year* | $ | 191,679,944 | $ | 190,276,160 | ||||
|
|
|
| |||||
* Includes Undistributed Net Investment Income (Loss) of: | $ | (22,748) | $ | 1,048,743 | ||||
|
|
|
| |||||
Share Activity: | ||||||||
Advisor Class: | ||||||||
Shares Issued | 4,129 | 675 | ||||||
Shares Reinvested | 41 | - | ||||||
Shares Redeemed | - | - | ||||||
|
|
|
| |||||
Net Increase (Decrease) | 4,170 | 675 | ||||||
|
|
|
| |||||
Investor Class: | ||||||||
Shares Issued | 3,301,553 | 13,436,874 | ||||||
Shares Reinvested | 357,926 | 186,431 | ||||||
Shares Redeemed | (3,979,954) | (11,217,899) | ||||||
|
|
|
| |||||
Net Increase (Decrease) | (320,475) | 2,405,406 | ||||||
|
|
|
| |||||
Institutional Class: | ||||||||
Shares Issued | 79,012 | 283,991 | ||||||
Shares Reinvested | 6,147 | - | ||||||
Shares Redeemed | (26,775) | (15,150) | ||||||
|
|
|
| |||||
Net Increase (Decrease) | 58,384 | 268,841 | ||||||
|
|
|
| |||||
The accompanying notes are an integral part of these financial statements.
19
Horizon Active Dividend Fund
STATEMENTS OF CHANGES IN NET ASSETS (Continued)
| For the Period Ended May 31, 2017 * | ||||
| (Unaudited) | ||||
Operations: | ||||
Net Investment Income | $ | 398 | ||
Net Realized Gain (Loss) on Investments, Purchased Options and Written Options | 980 | |||
Distributions of Long-Term Capital Gains by Underlying Investment Companies | - | |||
Net Change in Unrealized Appreciation (Depreciation) on | ||||
Investments, Purchased Options and Written Options | 2,453 | |||
|
| |||
Net Increase in Net Assets Resulting From Operations | 3,831 | |||
|
| |||
Distributions to Shareholders From: | ||||
From net investment income | ||||
Institutional Class | (373) | |||
|
| |||
Total Distributions to Shareholders | (373) | |||
|
| |||
Capital Share Transactions: | ||||
Proceeds from Shares Issued | ||||
Institutional Class | 55,000 | |||
Distributions Reinvested | ||||
Institutional Class | 373 | |||
Cost of Share Redeemed | ||||
Institutional Class | - | |||
|
| |||
Net Increase in Net Assets Resulting From Beneficial Interest Transactions | 55,373 | |||
|
| |||
Increase in Net Assets | 58,831 | |||
|
| |||
Net Assets: | ||||
Beginning of Year | - | |||
|
| |||
End of Year* | $ | 58,831 | ||
|
| |||
* Includes Undistributed Net Investment Income of: | $ | 25 | ||
|
| |||
Share Activity: | ||||
Institutional Class: | ||||
Shares Issued | 1,094 | |||
Shares Reinvested | 7 | |||
Shares Redeemed | - | |||
|
| |||
Net Increase | 1,101 | |||
|
| |||
| * | Since December 28, 2016 (Commencement of Operations) |
The accompanying notes are an integral part of these financial statements.
20
Horizon Active Asset Allocation Fund
FINANCIAL HIGHLIGHTS
The table below sets forth financial data for one share of beneficial interest outstanding throughout each period.
| Investor Class | ||||||||||||||||||||||||
| For the Six Months Ended May 31, 2017 | For the Year Ended November 30, 2016 | For the Year Ended November 30, 2015 | For the Year Ended November 30, 2014 | For the Year Ended November 30, 2013 | For the Period Ended November 30, 2012 ** | |||||||||||||||||||
| (Unaudited) | ||||||||||||||||||||||||
Net Asset Value, Beginning of Period | $ | 11.56 | $ | 11.99 | $ | 12.67 | $ | 12.76 | $ | 10.31 | $ | 10.00 | ||||||||||||
|
|
|
|
|
|
|
|
|
|
|
| |||||||||||||
Increase From Operations: | ||||||||||||||||||||||||
Net investment income (a,g) | 0.03 | 0.12 | 0.13 | 0.04 | 0.03 | 0.02 | ||||||||||||||||||
Net gain (loss) from investments (both realized and unrealized) | 1.46 | (0.20) | (0.37) | 0.95 | 2.74 | 0.29 | ||||||||||||||||||
|
|
|
|
|
|
|
|
|
|
|
| |||||||||||||
Total from operations | 1.49 | (0.08) | (0.24) | 0.99 | 2.77 | 0.31 | ||||||||||||||||||
|
|
|
|
|
|
|
|
|
|
|
| |||||||||||||
Less Distributions: | ||||||||||||||||||||||||
From net investment income | (0.10) | (0.20) | (0.02) | (0.03) | (0.09) | - | ||||||||||||||||||
From net realized gains | - | (0.15) | (0.42) | (1.05) | (0.23) | - | ||||||||||||||||||
|
|
|
|
|
|
|
|
|
|
|
| |||||||||||||
Total Distributions | (0.10) | (0.35) | (0.44) | (1.08) | (0.32) | - | ||||||||||||||||||
|
|
|
|
|
|
|
|
|
|
|
| |||||||||||||
Net Asset Value, End of Period | $ | 12.95 | $ | 11.56 | $ | 11.99 | $ | 12.67 | $ | 12.76 | $ | 10.31 | ||||||||||||
|
|
|
|
|
|
|
|
|
|
|
| |||||||||||||
Total Return (b) | 13.02% | (f) | (0.59)% | (2.01)% | 8.33% | 27.63% | 3.10% | (f) | ||||||||||||||||
Ratios/Supplemental Data | ||||||||||||||||||||||||
Net assets, end of period (in 000’s) | $ | 364,508 | $ | 354,279 | $ | 366,368 | $ | 418,274 | $ | 238,963 | $ | 53,817 | ||||||||||||
Ratio to average net assets: | ||||||||||||||||||||||||
Gross Expenses (d,e) | 1.54% | (c) | 1.54% | 1.54% | 1.54% | 1.63% | 2.12% | (c) | ||||||||||||||||
Net Expenses (d) ^ | 1.42% | (c) | 1.43% | 1.42% | 1.42% | 1.42% | 1.42% | (c) | ||||||||||||||||
Net investment income (loss) | 0.52% | (c) | 1.09% | 1.06% | 0.35% | 0.25% | (0.48)% | (c) | ||||||||||||||||
Portfolio turnover rate | 66% | (f) | 406% | 472% | 591% | 975% | 820% | (f) | ||||||||||||||||
| ** | Since January 31, 2012 (Commencement of Operations). |
| ^ | The ratio of expenses to average net assets includes interest expense which was 0.00%, 0.01%, 0.00%, 0.00%, 0.00% and 0.00%, respectively. |
| (a) | Per share amount are calculated using the average shares method. |
| (b) | Total returns are historical in nature and assume changes in share price, reinvestment of dividends and capital gains distributions, and assume no sales charge. Had the Adviser not absorbed a portion of the expenses, total returns would have been lower. |
| (c) | Annualized. |
| (d) | Does not reflect the expenses of the underlying funds in which the Fund invests. |
| (e) | Represents the ratio of expenses to average net assets absent fee waivers and/or expense reimbursements by the Adviser. |
| (f) | Not annualized. |
| (g) | Recognition of net investment income by the Fund is affected by the timing of the declaration of dividends by the underlying investment companies in which the Fund invests. The ratio does not include net investment income of the investment companies in which the Fund invests. |
The accompanying notes are an integral part of these financial statements.
21
Horizon Active Asset Allocation Fund
FINANCIAL HIGHLIGHTS
The table below sets forth financial data for one share of beneficial interest outstanding throughout each period.
| Advisor Class | ||||||||||||
| For the Six Months Ended May 31, 2017 | For the Year Ended November 30, 2016 | For the Period Ended November 30, 2015 ** | ||||||||||
| (Unaudited) | ||||||||||||
Net Asset Value, Beginning of Period | $ | 11.56 | $ | 11.99 | $ | 11.21 | ||||||
|
|
|
|
|
| |||||||
Increase From Operations: | ||||||||||||
Net investment income (loss) (a,h) | 0.03 | 0.12 | (0.03) | (g) | ||||||||
Net gain (loss) from investments | 1.46 | (0.20) | 0.81 | (g) | ||||||||
|
|
|
|
|
| |||||||
Total from operations | 1.49 | (0.08) | 0.78 | |||||||||
|
|
|
|
|
| |||||||
Less Distributions: | ||||||||||||
From net investment income | (0.13) | (0.20) | - | |||||||||
From net realized gains | - | (0.15) | - | |||||||||
|
|
|
|
|
| |||||||
Total Distributions | (0.13) | (0.35) | - | |||||||||
|
|
|
|
|
| |||||||
Net Asset Value, End of Period | $ | 12.92 | $ | 11.56 | $ | 11.99 | ||||||
|
|
|
|
|
| |||||||
Total Return (b) | 12.98% | (f) | (0.59)% | 6.96% | (f) | |||||||
Ratios/Supplemental Data | ||||||||||||
Net assets, end of period (in 000’s) | $ | 3,589 | $ | 2,249 | $ | 29 | ||||||
Ratio to average net assets: | ||||||||||||
Gross Expenses (d,e) | 1.54% | (c) | 1.55% | 1.54% | (c) | |||||||
Net Expenses (d) ^ | 1.42% | (c) | 1.44% | 1.42% | (c) | |||||||
Net investment income (loss) | 0.52% | (c) | 1.06% | (0.88)% | (c) (g) | |||||||
Portfolio turnover rate | 66% | (f) | 406% | 472% | (f) | |||||||
| ** | Since September 4, 2015 (Commencement of Operations). |
| ^ | The ratio of expenses to average net assets includes interest expense which was 0.00%, 0.02% and 0.00%, respectively. |
| (a) | Per share amount are calculated using the average shares method. |
| (b) | Total returns are historical in nature and assume changes in share price, reinvestment of dividends and capital gains distributions, and assume no sales charge. Had the Adviser not absorbed a portion of the expenses, total returns would have been lower. |
| (c) | Annualized. |
| (d) | Does not reflect the expenses of the underlying funds in which the Fund invests. |
| (e) | Represents the ratio of expenses to average net assets absent fee waivers and/or expense reimbursements by the Adviser. |
| (f) | Not annualized. |
| (g) | Due to timing of shareholder transactions, and allocations of expenses among share classes, the per unit amounts presented may not coincide with the aggregate presentation on the Statement of Operations. |
| (h) | Recognition of net investment income by the Fund is affected by the timing of the declaration of dividends by the underlying investment companies in which the Fund invests. The ratio does not include net investment income of the investment companies in which the Fund invests. |
The accompanying notes are an integral part of these financial statements.
22
Horizon Active Asset Allocation Fund
FINANCIAL HIGHLIGHTS
The table below sets forth financial data for one share of beneficial interest outstanding throughout each period.
| Institutional Class | ||||||||
|
| |||||||
| For the Six Months Ended May 31, 2017 | For the Period Ended November 30, 2016 * | |||||||
| (Unaudited) | ||||||||
Net Asset Value, Beginning of Period | $ | 11.59 | $ | 11.54 | ||||
|
|
|
| |||||
Increase From Operations: | ||||||||
Net investment income (a) (h) | 0.05 | 0.03 | ||||||
Net gain (loss) from investments | 1.45 | 0.02 | (g) | |||||
|
|
|
| |||||
Total from operations | 1.50 | 0.05 | ||||||
|
|
|
| |||||
Less Distributions: | ||||||||
From net investment income | (0.13) | - | ||||||
From net realized gains | - | - | ||||||
|
|
|
| |||||
Total Distributions | (0.13) | - | ||||||
|
|
|
| |||||
Net Asset Value, End of Period | $ | 12.96 | $ | 11.59 | ||||
|
|
|
| |||||
Total Return (b) | 13.10% | (f) | 0.43% | (f) | ||||
Ratios/Supplemental Data | ||||||||
Net assets, end of period (in 000’s) | $ | 12,036 | $ | 8,809 | ||||
Ratio to average net assets: | ||||||||
Gross Expenses (d) (e) | 1.29% | (c) | 1.30% | (c) | ||||
Net Expenses (d) ^ | 1.17% | (c) | 1.19% | (c) | ||||
Net investment income (loss) | 0.77% | (c) | 1.28% | (c) | ||||
Portfolio turnover rate | 66% | (f) | 406% | (f) | ||||
| * | Since September 9, 2016 (Commencement of Operations). |
| ^ | The ratio of expenses to average net assets includes interest expense which was 0.00% and 0.02%, respectively. |
| (a) | Per share amount are calculated using the average shares method. |
| (b) | Total returns are historical in nature and assume changes in share price, reinvestment of dividends and capital gains distributions, and assume no sales charge. Had the Adviser not absorbed a portion of the expenses, total returns would have been lower. |
| (c) | Annualized. |
| (d) | Does not reflect the expenses of the underlying funds in which the Fund invests. |
| (e) | Represents the ratio of expenses to average net assets absent fee waivers and/or expense reimbursements by the Adviser. |
| (f) | Not annualized. |
| (g) | Net realized and unrealized gain (loss) per share in this caption is a balancing amount necessary to reconcile the change in net asset value per share for the period, and may not reconcile with the aggregate gain (loss) on the Statement of Operations due to share transactions for the period. |
| (h) | Recognition of net investment income by the Fund is affected by the timing of the declaration of dividends by the underlying investment companies in which the Fund invests. The ratio does not include net investment income of the investment companies in which the Fund invests. |
The accompanying notes are an integral part of these financial statements.
23
Horizon Active Risk Assist Fund
FINANCIAL HIGHLIGHTS
The table below sets forth financial data for one share of beneficial interest outstanding throughout each period.
| Investor Class | ||||||||||||||||
| For the Six Months Ended May 31, 2017 | For the Year Ended November 30, 2016 * | For the Year Ended November 30, 2015 | For the Period Ended November 30, 2014 ** | |||||||||||||
| (Unaudited) | ||||||||||||||||
Net Asset Value, Beginning of Period | $ | 19.31 | $ | 19.62 | $ | 20.50 | $ | 20.00 | ||||||||
|
|
|
|
|
|
|
| |||||||||
Increase From Operations: | ||||||||||||||||
Net investment income (loss) (a,h) | 0.05 | 0.18 | 0.12 | (0.05) | ||||||||||||
Net gain (loss) from investments | 2.02 | (0.29) | (1.00) | 0.55 | ||||||||||||
|
|
|
|
|
|
|
| |||||||||
Total from operations | 2.07 | (0.11) | (0.88) | 0.50 | ||||||||||||
|
|
|
|
|
|
|
| |||||||||
Less Distributions: | ||||||||||||||||
From net investment income | (0.17) | (0.20) | - | - | ||||||||||||
From net realized gains | - | - | (0.00) | (g) | - | |||||||||||
|
|
|
|
|
|
|
| |||||||||
Total Distributions | (0.17) | (0.20) | - | - | ||||||||||||
|
|
|
|
|
|
|
| |||||||||
Net Asset Value, End of Period | $ | 21.21 | $ | 19.31 | $ | 19.62 | $ | 20.50 | ||||||||
|
|
|
|
|
|
|
| |||||||||
Total Return (b) | 10.84% | (f) | (0.54)% | (4.29)% | 2.50% | (f) | ||||||||||
Ratios/Supplemental Data | ||||||||||||||||
Net assets, end of period (in 000’s) | $ | 341,924 | $ | 319,385 | $ | 222,421 | $ | 300 | ||||||||
Ratio to average net assets: | ||||||||||||||||
Gross Expenses (d,e) | 1.53% | (c) | 1.55% | 1.54% | 50.52% | (c) | ||||||||||
Net Expenses (d) ^ | 1.42% | (c) | 1.42% | 1.42% | 1.42% | (c) | ||||||||||
Net investment income (loss) | 0.54% | (c) | 0.92% | 0.57% | (1.06)% | (c) | ||||||||||
Portfolio turnover rate | 43% | (f) | 563% | 541% | 55% | (f) | ||||||||||
| * | In 2016, 0.02% of the Fund’s total return consists of a voluntary reimbursement by the Adviser for losses on investment transactions. Excluding this item the total return would have been (0.56%) |
| ** | Since August 28, 2014 (Commencement of Operations). |
| ^ | The ratio of expenses to average net assets includes interest expense which was 0.00%, 0.01%, 0.00% and 0.00%, respectively. |
| (a) | Per share amount are calculated using the average shares method. |
| (b) | Total returns are historical and assume changes in share price, reinvestment of dividends and capital gains distributions, and assume no sales charge. Had the Adviser not absorbed a portion of the expenses, total returns would have been lower. |
| (c) | Annualized. |
| (d) | Does not reflect the expenses of the underlying funds in which the Fund invests. |
| (e) | Represents the ratio of expenses to average net assets absent fee waivers and/or expense reimbursements by the Adviser. |
| (f) | Not annualized. |
| (g) | Per Share Amount is less than $0.01 |
| (h) | Recognition of net investment income by the Fund is affected by the timing of the declaration of dividends by the underlying investment companies in which the Fund invests. The ratio does not include net investment income of the investment companies in which the Fund invests. |
The accompanying notes are an integral part of these financial statements.
24
Horizon Active Risk Assist Fund
FINANCIAL HIGHLIGHTS
The table below sets forth financial data for one share of beneficial interest outstanding throughout each period.
| Advisor Class | ||||||||||||
| For the Six Months Ended May 31, 2017 | For the Year Ended November 30, 2016 * | For the Period Ended November 30, 2015 ** | ||||||||||
| (Unaudited) | ||||||||||||
Net Asset Value, Beginning of Period | $ | 19.30 | $ | 19.62 | $ | 18.97 | ||||||
|
|
|
|
|
| |||||||
Increase From Operations: | ||||||||||||
Net investment income (a,h) | 0.05 | 0.17 | 0.07 | |||||||||
Net gain (loss) from investments | 2.02 | (0.29) | 0.58 | (g) | ||||||||
|
|
|
|
|
| |||||||
Total from operations | 2.07 | (0.12) | 0.65 | |||||||||
|
|
|
|
|
| |||||||
Less Distributions: | ||||||||||||
From net investment income | (0.17) | (0.20) | - | |||||||||
|
|
|
|
|
| |||||||
Total Distributions | (0.17) | (0.20) | - | |||||||||
|
|
|
|
|
| |||||||
Net Asset Value, End of Period | $ | 21.20 | $ | 19.30 | $ | 19.62 | ||||||
|
|
|
|
|
| |||||||
Total Return (b) | 10.87% | (f) | (0.59)% | 3.43% | (f) | |||||||
Ratios/Supplemental Data | ||||||||||||
Net assets, end of period (in 000’s) | $ | 339 | $ | 313 | $ | 19 | ||||||
Ratio to average net assets: | ||||||||||||
Gross Expenses (d,e) | 1.53% | (c) | 1.51% | 1.54% | (c) | |||||||
Net Expenses (d) ^ | 1.42% | (c) | 1.42% | 1.42% | (c) | |||||||
Net investment income (loss) | 0.54% | (c) | 0.92% | 1.52% | (c) | |||||||
Portfolio turnover rate | 43% | (f) | 563% | 541% | (f) | |||||||
| * | In 2016, 0.02% of the Fund’s total return consists of a voluntary reimbursement by the Adviser for losses on investment transactions. Excluding this item the total return would have been (0.61%) |
| ** | Since September 4, 2015 (Commencement of Operations). |
| ^ | The ratio of expenses to average net assets includes interest expense which was 0.00%, 0.01% and 0.00%, respectively. |
| (a) | Per share amount are calculated using the average shares method. |
| (b) | Total returns are historical in nature and assume changes in share price, reinvestment of dividends and capital gains distributions, and assume no sales charge. Had the Adviser not absorbed a portion of the expenses, total returns would have been lower. |
| (c) | Annualized. |
| (d) | Does not reflect the expenses of the underlying funds in which the Fund invests. |
| (e) | Represents the ratio of expenses to average net assets absent fee waivers and/or expense reimbursements by the Adviser. |
| (f) | Not annualized. |
| (g) | Net realized and unrealized gain (loss) per share in this caption is a balancing amount necessary to reconcile the change in net asset value per share for the period, and may not reconcile with the aggregate gain (loss) on the Statement of Operations due to share transactions for the period. |
| (h) | Recognition of net investment income by the Fund is affected by the timing of the declaration of dividends by the underlying investment companies in which the Fund invests. The ratio does not include net investment income of the investment companies in which the Fund invests. |
The accompanying notes are an integral part of these financial statements.
25
Horizon Active Risk Assist Fund
FINANCIAL HIGHLIGHTS
The table below sets forth financial data for one share of beneficial interest outstanding throughout each period.
| Institutional Class | ||||||||
| For the Six Months Ended May 31, 2017 | For the Period Ended November 30, 2016 * | |||||||
| (Unaudited) | ||||||||
Net Asset Value, Beginning of Period | $ | 19.33 | $ | 19.21 | ||||
|
|
|
| |||||
Increase From Operations: | ||||||||
Net investment income (a) (h) | 0.08 | 0.05 | ||||||
Net gain (loss) from investments | 2.04 | 0.07 | (g) | |||||
|
|
|
| |||||
Total from operations | 2.12 | 0.12 | ||||||
|
|
|
| |||||
Less Distributions: | ||||||||
From net investment income | (0.21) | - | ||||||
From net realized gains | - | - | ||||||
|
|
|
| |||||
Total Distributions | (0.21) | - | ||||||
|
|
|
| |||||
Net Asset Value, End of Period | $ | 21.24 | $ | 19.33 | ||||
|
|
|
| |||||
Total Return (b) | 11.05% | (f) | 0.62% | (f) | ||||
Ratios/Supplemental Data | ||||||||
Net assets, end of period (in 000’s) | $ | 483 | $ | 7 | ||||
Ratio to average net assets: | ||||||||
Gross Expenses (d,e) | 1.28% | (c) | 1.31% | (c) | ||||
Net Expenses (d) | 1.17% | (c) | 1.17% | (c) | ||||
Net investment income (loss) | 0.73% | (c) | 1.09% | (c) | ||||
Portfolio turnover rate | 43% | (f) | 563% | (f) | ||||
| * | Since September 9, 2016 (Commencement of Operations). |
| (a) | Per share amount are calculated using the average shares method. |
| (b) | Total returns are historical in nature and assume changes in share price, reinvestment of dividends and capital gains distributions, and assume no sales charge. Had the Adviser not absorbed a portion of the expenses, total returns would have been lower. |
| (c) | Annualized. |
| (d) | Does not reflect the expenses of the underlying funds in which the Fund invests. |
| (e) | Represents the ratio of expenses to average net assets absent fee waivers and/or expense reimbursements by the Adviser. |
| (f) | Not annualized. |
| (g) | Net realized and unrealized gain (loss) per share in this caption is a balancing amount necessary to reconcile the change in net asset value per share for the period, and may not reconcile with the aggregate gain (loss) on the Statement of Operations due to share transactions for the period. |
| (h) | Recognition of net investment income by the Fund is affected by the timing of the declaration of dividends by the underlying investment companies in which the Fund invests. The ratio does not include net investment income of the investment companies in which the Fund invests. |
The accompanying notes are an integral part of these financial statements.
26
Horizon Active Income Fund
FINANCIAL HIGHLIGHTS
The table below sets forth financial data for one share of beneficial interest outstanding throughout each period.
| Investor Class | ||||||||||||||||||||
| For the Six Months Ended May 31, 2017 | For the Year Ended November 30, 2016 | For the Year Ended November 30, 2015 | For the Year Ended November 30, 2014 | For the Period Ended November 30, 2013 ** | ||||||||||||||||
| (Unaudited) | ||||||||||||||||||||
Net Asset Value, Beginning of Period | $ | 9.56 | $ | 9.86 | $ | 10.11 | $ | 10.01 | $ | 10.00 | ||||||||||
|
|
|
|
|
|
|
|
|
| |||||||||||
Increase From Operations: | ||||||||||||||||||||
Net investment income (a,g) | 0.13 | 0.16 | 0.13 | 0.15 | 0.02 | |||||||||||||||
Net gain (loss) from investments | 0.25 | (0.36) | (0.25) | 0.10 | (0.01) | |||||||||||||||
|
|
|
|
|
|
|
|
|
| |||||||||||
Total from operations | 0.38 | (0.20) | (0.12) | 0.25 | 0.01 | |||||||||||||||
|
|
|
|
|
|
|
|
|
| |||||||||||
Less Distributions: | ||||||||||||||||||||
From net investment income | (0.18) | (0.10) | (0.13) | (0.13) | - | |||||||||||||||
Return of capital | - | - | - | (0.02) | - | |||||||||||||||
|
|
|
|
|
|
|
|
|
| |||||||||||
Total Distributions | (0.18) | (0.10) | (0.13) | (0.15) | - | |||||||||||||||
|
|
|
|
|
|
|
|
|
| |||||||||||
Net Asset Value, End of Period | $ | 9.76 | $ | 9.56 | $ | 9.86 | $ | 10.11 | $ | 10.01 | ||||||||||
|
|
|
|
|
|
|
|
|
| |||||||||||
Total Return (b) | 4.04% | (f) | (2.03)% | (1.18)% | 2.50% | 0.10% | (f) | |||||||||||||
Ratios/Supplemental Data | ||||||||||||||||||||
Net assets, end of period (in 000’s) | $ | 188,440 | $ | 187,698 | $ | 169,725 | $ | 129,340 | $ | 70,951 | ||||||||||
Ratio to average net assets: | ||||||||||||||||||||
Gross Expenses (d,e) | 1.26% | (c) | 1.28% | 1.28% | 1.30% | 1.72% | (c) | |||||||||||||
Net Expenses (d) | 1.24% | (c) | 1.24% | 1.24% | 1.24% | 1.24% | (c) | |||||||||||||
Net investment income (loss) | 2.64% | (c) | 1.58% | 1.25% | 1.47% | 1.00% | (c) | |||||||||||||
Portfolio turnover rate | 129% | (f) | 205% | 324% | 280% | 71% | (f) | |||||||||||||
| ** | Since September 30, 2013 (Commencement of Operations). |
| (a) | Per share amount are calculated using the average shares method. |
| (b) | Total returns are historical in nature and assume changes in share price, reinvestment of dividends and capital gains distributions, and assume no sales charge. Had the Adviser not absorbed a portion of the expenses, total returns would have been lower. |
| (c) | Annualized. |
| (d) | Does not reflect the expenses of the underlying funds in which the Fund invests. |
| (e) | Represents the ratio of expenses to average net assets absent fee waivers and/or expense reimbursements by the Adviser. |
| (f) | Not annualized. |
| (g) | Recognition of net investment income by the Fund is affected by the timing of the declaration of dividends by the underlying investment companies in which the Fund invests. The ratio does not include net investment income of the investment companies in which the Fund invests. |
The accompanying notes are an integral part of these financial statements.
27
Horizon Active Income Fund
FINANCIAL HIGHLIGHTS
The table below sets forth financial data for one share of beneficial interest outstanding throughout each period.
| Advisor Class | ||||||||
| For the Six Months Ended May 31, 2017 | For the Period Ended November 30, 2016 * | |||||||
| (Unaudited) | ||||||||
Net Asset Value, Beginning of Period | $ | 9.60 | $ | 9.84 | ||||
|
|
|
| |||||
Increase From Operations: | ||||||||
Net investment income (a,g) | 0.13 | 0.13 | ||||||
Net gain (loss) from investments | 0.26 | (0.30) | ||||||
|
|
|
| |||||
Total from operations | 0.39 | (0.17) | ||||||
|
|
|
| |||||
Less Distributions: | ||||||||
From net investment income | (0.19) | (0.07) | ||||||
|
|
|
| |||||
Total Distributions | (0.19) | (0.07) | ||||||
|
|
|
| |||||
Net Asset Value, End of Period | $ | 9.80 | $ | 9.60 | ||||
|
|
|
| |||||
Total Return (b) | 4.09% | (f) | (1.74)% | (f) | ||||
Ratios/Supplemental Data | ||||||||
Net assets, end of period (in 000’s) | $ | 47 | $ | 6 | ||||
Ratio to average net assets: | ||||||||
Gross Expenses (d,e) | 1.26% | (c) | 1.35% | (c) | ||||
Net Expenses (d) ^ | 1.24% | (c) | 1.25% | (c) | ||||
Net investment income (loss) | 2.64% | (c) | 1.70% | (c) | ||||
Portfolio turnover rate | 129% | (f) | 205% | (f) | ||||
| * | Since February 8, 2016 (Commencement of Operations). |
| ^ | The ratio of expenses to average net assets includes interest expense which was 0.00% and 0.01%, respectively. |
| (a) | Per share amount are calculated using the average shares method. |
| (b) | Total returns are historical in nature and assume changes in share price, reinvestment of dividends and capital gains distributions, and assume no sales charge. Had the Adviser not absorbed a portion of the expenses, total returns would have been lower. |
| (c) | Annualized. |
| (d) | Does not reflect the expenses of the underlying funds in which the Fund invests. |
| (e) | Represents the ratio of expenses to average net assets absent fee waivers and/or expense reimbursements by the Adviser. |
| (f) | Not annualized. |
| (g) | Recognition of net investment income by the Fund is affected by the timing of the declaration of dividends by the underlying investment companies in which the Fund invests. The ratio does not include net investment income of the investment companies in which the Fund invests. |
The accompanying notes are an integral part of these financial statements.
28
Horizon Active Income Fund
FINANCIAL HIGHLIGHTS
The table below sets forth financial data for one share of beneficial interest outstanding throughout each period.
| Institutional Class | ||||||||
|
| |||||||
| For the Six Months Ended May 31, 2017 | For the Period Ended November 30, 2016 * | |||||||
| (Unaudited) | ||||||||
Net Asset Value, Beginning of Period | $ | 9.57 | $ | 10.00 | ||||
|
|
|
| |||||
Increase From Operations: | ||||||||
Net investment income (a,g) | 0.14 | 0.04 | ||||||
Net gain (loss) from investments | 0.25 | (0.47) | ||||||
|
|
|
| |||||
Total from operations | 0.39 | (0.43) | ||||||
|
|
|
| |||||
Less Distributions: | ||||||||
From net investment income | (0.20) | - | ||||||
From net realized gains | - | - | ||||||
|
|
|
| |||||
Total Distributions | (0.20) | - | ||||||
|
|
|
| |||||
Net Asset Value, End of Period | $ | 9.76 | $ | 9.57 | ||||
|
|
|
| |||||
Total Return (b) | 4.13% | (f) | (4.30)% | (f) | ||||
Ratios/Supplemental Data | ||||||||
Net assets, end of period (in 000’s) | $ | 3,193 | $ | 2,572 | ||||
Ratio to average net assets: | ||||||||
Gross Expenses (d,e) | 1.01% | (c) | 1.09% | (c) | ||||
Net Expenses (d) | 0.99% | (c) | 0.99% | (c) | ||||
Net investment income (loss) | 2.89% | (c) | 1.84% | (c) | ||||
Portfolio turnover rate | 129% | (f) | 205% | (f) | ||||
| * | Since September 9, 2016 (Commencement of Operations). |
| (a) | Per share amount are calculated using the average shares method. |
| (b) | Total returns are historical in nature and assume changes in share price, reinvestment of dividends and capital gains distributions, and assume no sales charge. Had the Adviser not absorbed a portion of the expenses, total returns would have been lower. |
| (c) | Annualized. |
| (d) | Does not reflect the expenses of the underlying funds in which the Fund invests. |
| (e) | Represents the ratio of expenses to average net assets absent fee waivers and/or expense reimbursements by the Adviser. |
| (f) | Not annualized. |
| (g) | Recognition of net investment income by the Fund is affected by the timing of the declaration of dividends by the underlying investment companies in which the Fund invests. The ratio does not include net investment income of the investment companies in which the Fund invests. |
The accompanying notes are an integral part of these financial statements.
29
Horizon Active Dividend Fund
FINANCIAL HIGHLIGHTS
The table below sets forth financial data for one share of beneficial interest outstanding throughout each period.
| Investor Class | ||||
|
| |||
| For the Period Ended May 31, 2017 * | ||||
| (Unaudited) | ||||
Net Asset Value, Beginning of Period | $ | 50.00 | ||
|
| |||
Increase From Operations: | ||||
Net investment income (a,g) | 0.39 | |||
Net gain (loss) from investments (both realized and unrealized) | 3.41 | |||
|
| |||
Total from operations | 3.80 | |||
|
| |||
Less Distributions: | ||||
From net investment income | (0.34) | |||
|
| |||
Total Distributions | (0.34) | |||
|
| |||
Net Asset Value, End of Period | $ | 53.46 | ||
|
| |||
Total Return (b) | 7.61% | (f) | ||
Ratios/Supplemental Data | ||||
Net assets, end of period (in 000’s) | $ | 59 | ||
Ratio to average net assets: | ||||
Gross Expenses (d,e) | 142.31% | (c) | ||
Net Expenses (d) | 1.24% | (c) | ||
Net investment income (loss) | 1.80% | (c) | ||
Portfolio turnover rate | 91% | (f) | ||
| * | Since December 28, 2016 (Commencement of Operations). |
| (a) | Per share amount are calculated using the average shares method. |
| (b) | Total returns are historical in nature and assume changes in share price, reinvestment of dividends and capital gains distributions, and assume no sales charge. Had the Adviser not absorbed a portion of the expenses, total returns would have been lower. |
| (c) | Annualized. |
| (d) | Does not reflect the expenses of the underlying funds in which the Fund invests. |
| (e) | Represents the ratio of expenses to average net assets absent fee waivers and/or expense reimbursements by the Adviser. |
| (f) | Not annualized. |
| (g) | Recognition of net investment income by the Fund is affected by the timing of the declaration of dividends by the underlying investment companies in which the Fund invests. The ratio does not include net investment income of the investment companies in which the Fund invests. |
The accompanying notes are an integral part of these financial statements.
30
Horizon Funds
NOTES TO FINANCIAL STATEMENTS (Unaudited)
May 31, 2017
| 1. | ORGANIZATION |
The Horizon Active Asset Allocation Fund, Horizon Active Risk Assist Fund, Horizon Active Income Fund, and Horizon Active Dividend Fund (each a “Fund” and together the “Funds”) are each a series of shares of beneficial interest of Horizon Funds (the “Trust”), a Delaware business trust organized on May 21, 2015. Each Fund is registered under the Investment Company Act of 1940, as amended (the “1940 Act”), as a diversified, open-end management investment company. The investment objective of the Horizon Active Asset Allocation Fund is capital appreciation. The Horizon Active Asset Allocation Fund presently offers Advisor Class shares, Investor Class shares and Institutional Class shares, which commenced operations on September 4, 2015, January 31, 2012 and September 9, 2016, respectively. The investment objective of the Horizon Active Risk Assist Fund is to capture the majority of the returns associated with equity market investments, while mitigating downside risk through use of a risk overlay strategy. The Horizon Active Risk Assist Fund presently offers Advisor Class shares, Investor Class shares and Institutional Class shares, which commenced operations on September 4, 2015, August 28, 2014 and September 9, 2016, respectively. The investment objective of the Horizon Active Income Fund is income. The Horizon Active Income Fund presently offers Advisor Class shares, Investor Class shares and Institutional Class shares, which commenced operations on February 8, 2016, September 30, 2013 and September 9, 2016, respectively. The investment objective of the Horizon Active Dividend Fund is capital appreciation and current income. The Horizon Active Dividend Fund presently offers Investor Class shares which commenced operations on December 28, 2016.
Each Fund is an investment company and accordingly follows the investment company accounting and reporting guidance of the Financial Accounting Standards Board (FASB) Accounting Standards Codification Topic 946 “Financial Services – Investment Companies”.
| 2. | SUMMARY OF SIGNIFICANT ACCOUNTING POLICIES |
The following is a summary of significant accounting policies followed by the Funds in the preparation of their financial statements. These policies are in conformity with accounting principles generally accepted in the United States of America (“GAAP”). The preparation of financial statements requires management to make estimates and assumptions that affect the reported amounts of assets and liabilities and disclosure of contingent assets and liabilities at the date of the financial statements and the reported amounts of income and expenses for the period. Actual results could differ from those estimates.
In determining a Fund’s NAV per share, equity securities, including common stocks and exchange traded funds, for which market quotations are readily available are valued at current market value using the last reported sales price. NASDAQ traded securities are valued using the NASDAQ official closing price (NOCP). If the NOCP or other last reported sales price is not available, such securities shall be valued at the mean between the current bid and ask prices on the day of valuation, or if there has been no sale on such day, at the mean between the current bid and ask prices on the primary exchange. When market quotations received are from an active market, the securities will be classified within Level 1 of the fair value hierarchy. If market quotations are not readily available, then securities are valued at fair value as determined by the Board of Trustees (or its delegate). Short-term debt instruments with a remaining maturity of more than 60 days, intermediate and long-term bonds, convertible bonds, and other debt securities are generally valued on the basis of dealer supplied quotations or by a pricing system selected by the Adviser and approved by the Board of Trustees of the Trust. Where such prices are not available, valuations will be obtained from brokers who are market makers for such securities. However, in circumstances where the Adviser deems it appropriate to do so, the mean of the bid and asked prices for over-the-counter securities or the last available sale price for exchange-traded debt securities may be used. Where no last sale price for exchange traded debt securities is available, the mean of the bid and asked prices may be used. Short-term debt securities with a remaining maturity of 60 days or less are amortized to maturity, provided such valuations represent par value. Purchased and written options are valued at the mean of the bid and the ask.
31
Horizon Funds
NOTES TO FINANCIAL STATEMENTS (Unaudited) (Continued)
May 31, 2017
Other securities and assets for which market quotations are not readily available or for which valuation cannot be provided, as described above, are valued as determined in good faith in accordance with procedures approved by the Board of Trustees of the Trust.
The Funds utilize various methods to measure the fair value of all of their investments on a recurring basis. GAAP establishes a hierarchy that prioritizes inputs to valuation methods. The three levels of input are:
Level 1 – Unadjusted quoted prices in active markets for identical assets and liabilities that the Funds have the ability to access.
Level 2 – Observable inputs other than quoted prices included in Level 1 that are observable for the asset or liability, either directly or indirectly. These inputs may include quoted prices for the identical instrument in an inactive market, prices for similar instruments, interest rates, prepayment speeds, credit risk, yield curves, default rates and similar data.
Level 3 – Unobservable inputs for the asset or liability, to the extent relevant observable inputs are not available, representing the Funds’ own assumptions about the assumptions a market participant would use in valuing the asset or liability, and would be based on the best information available.
The availability of observable inputs can vary from security to security and is affected by a wide variety of factors, including, for example, the type of security, whether the security is new and not yet established in the marketplace, the liquidity of markets, and other characteristics particular to the security. To the extent that valuation is based on models or inputs that are less observable or unobservable in the market, the determination of fair value requires more judgment. Accordingly, the degree of judgment exercised in determining fair value is greatest for instruments categorized in Level 3.
The inputs used to measure fair value may fall into different levels of the fair value hierarchy. In such cases, for disclosure purposes, the level in the fair value hierarchy within which the fair value measurement falls in its entirety, is determined based on the lowest level input that is significant to the fair value measurement in its entirety.
The inputs or methodology used for valuing securities are not necessarily an indication of the risk associated with investing in those securities. The following tables summarize the inputs used as of May 31, 2017, for the Funds’ investments measured at fair value:
| Horizon Active Asset Allocation Fund | ||||||||||||||||
| Assets * | Level 1 | Level 2 | Level 3 | Total | ||||||||||||
Exchange Traded Funds | $ | 373,869,416 | $ | - | $ | - | $ | 373,869,416 | ||||||||
Purchased Call Options | - | 1,876,135 | - | 1,876,135 | ||||||||||||
Purchased Put Options | - | 38,125 | - | 38,125 | ||||||||||||
Short-Term Investments | 4,496,428 | - | - | 4,496,428 | ||||||||||||
Total | $ | 378,365,844 | $ | 1,914,260 | $ | - | $ | 380,280,104 | ||||||||
| Liabilities * | Level 1 | Level 2 | Level 3 | Total | ||||||||||||
Written Call Options | $ | - | $ | - | $ | - | $ | - | ||||||||
Written Put Options | - | 165,000 | - | 165,000 | ||||||||||||
Total | $ | - | $ | 165,000 | $ | - | $ | 165,000 | ||||||||
32
Horizon Funds
NOTES TO FINANCIAL STATEMENTS (Unaudited) (Continued)
May 31, 2017
| Horizon Active Risk Assist Fund | ||||||||||||||||
| Assets * | Level 1 | Level 2 | Level 3 | Total | ||||||||||||
Exchange Traded Funds | $ | 337,023,676 | $ | - | $ | - | $ | 337,023,676 | ||||||||
Purchased Call Options | - | 472,360 | - | 472,360 | ||||||||||||
Purchased Put Options | - | 1,578,875 | - | 1,578,875 | ||||||||||||
Short-Term Investments | 4,096,076 | - | - | 4,096,076 | ||||||||||||
Total | $ | 341,119,752 | $ | 2,051,235 | $ | - | $ | 343,170,987 | ||||||||
| Liabilities * | Level 1 | Level 2 | Level 3 | Total | ||||||||||||
Written Put Options | - | 345,250 | - | 345,250 | ||||||||||||
Total | $ | - | $ | 345,250 | $ | - | $ | 345,250 | ||||||||
| Horizon Active Income Fund | ||||||||||||||||
| Assets * | Level 1 | Level 2 | Level 3 | Total | ||||||||||||
Exchange Traded Funds | $ | 189,804,546 | $ | - | $ | - | $ | 189,804,546 | ||||||||
Purchased Call Options | 11,350 | 11,350 | ||||||||||||||
Short-Term Investments | 1,844,392 | - | - | 1,844,392 | ||||||||||||
Total | $ | 191,648,938 | $ | 11,350 | $ | - | $ | 191,660,288 | ||||||||
| Horizon Active Dividend Fund | ||||||||||||||||
| Assets * | Level 1 | Level 2 | Level 3 | Total | ||||||||||||
Common Stock | $ | 57,674 | $ | - | $ | - | $ | 57,674 | ||||||||
Short-Term Investments | 19,797 | - | - | 19,797 | ||||||||||||
Total | $ | 77,471 | $ | - | $ | - | $ | 77,471 | ||||||||
| * | Refer to the Portfolios of Investments and Schedules of Options Written for security classifications. |
Transfers between levels are determined as of the end of the reporting period. There were no transfers between Levels 1 and 2 for the Funds. There were no Level 3 securities held by the Funds during the period ended May 31, 2017.
Exchange Traded Funds – The Funds may invest in exchange traded funds (“ETFs”). ETFs are a type of registered investment company that is typically purchased and redeemed at net asset value (“NAV”) in large blocks of shares called “Creation Units”, and bought and sold in secondary markets on a securities exchange, where its shares trade like common stock. An index-based ETF represents a fixed portfolio of securities designed to track the performance and dividend yield of a particular domestic or foreign market index. Alternatively, ETFs may be actively managed in accordance with a particular investment strategy. The risks of owning an ETF generally reflect the risks of owning the underlying securities they hold, although the lack of liquidity of an ETF could result in it being more volatile.
Option Transactions – Options are derivative financial instruments that give the buyer, in exchange for a premium payment, the right, but typically not the obligation, to either purchase from (call option) or sell to (put option) the writer a specified underlying instrument at a specified price on or before a specified date. Each of the Funds, other than the Horizon Active Dividend Fund, enter into option contracts to meet the requirements of their trading activities. The risk in writing a call option is that a Fund may incur a loss if the market price of the
33
Horizon Funds
NOTES TO FINANCIAL STATEMENTS (Unaudited) (Continued)
May 31, 2017
security increases and the option is exercised. The risk in writing a put option is that a Fund may incur a loss if the market price of the security decreases and the option is exercised. The risk in buying an option is that a Fund pays a premium whether or not the option is exercised. Funds that purchase options also have the additional risk of not being able to enter into a closing transaction if a liquid secondary market does not exist.
When a Fund writes a call or put option, an amount equal to the premium received is included in the statement of assets and liabilities as a liability. The amount of the liability is subsequently marked-to-market to reflect the current fair value of the option. If an option expires on its stipulated expiration date or if the Fund enters into a closing purchase transaction, a gain or loss is realized. If a written call or put option is exercised, a gain or loss is realized for the sale of the underlying security and the proceeds from the sale are increased by the premium originally received. As the writer of an option, the Fund has no control over whether the option will be exercised and, as a result, retains the market risk of an unfavorable change in price of the security underlying the written option.
Each of the Horizon Active Asset Allocation Fund, Horizon Active Risk Assist Fund and Horizon Active Income Fund may purchase put and call options. These Funds engage in options transactions on individual securities, ETFs, or indices to hedge against market declines or generate returns from falling asset prices. If such a decline occurs, the put options will permit the Fund to sell the securities underlying such options at the exercise price, or to close out the options at a profit. The premium paid for a put or call option plus any transaction costs will reduce the benefit, if any, realized by the Fund upon exercise of the option, and, unless the price of the underlying security rises or declines sufficiently, the option may expire worthless to the Fund. In addition, in the event that the price of the security in connection with which an option was purchased moves in a direction favorable to the Fund, the benefits realized by the Fund as a result of such favorable movement will be reduced by the amount of the premium paid for the option and related transaction costs. Written and purchased options are non-income producing securities. When a Fund purchases an exchange traded option, there is minimal counterparty risk to the Fund because the exchange’s clearinghouse, as counterparty to all exchange traded options, guarantees against a possible default.
The average quarterly value outstanding of purchased and written options during the period ended May 31, 2017, were as follows:
| Horizon Active Asset Allocation Fund | Horizon Active Risk Assist Fund | Horizon Active Income Fund | ||||||||||
Purchased Options | $ | 1,191,457 | $ | 2,656,430 | $ | 23,550 | ||||||
Written Options | $ | 349,000 | $ | 666,000 | $ | - | ||||||
The Horizon Active Dividend Fund did not invest in purchased or written options during the period ended May 31, 2017.
The following is a summary of the location of derivative investments on the Horizon Active Asset Allocation Fund, Horizon Active Risk Assist Fund and Horizon Active Income Fund’s Statements of Assets and Liabilities as of May 31, 2017 respectively:
Active Asset Allocation Fund
| Location on the Statement of Assets and Liabilities | ||||
| Derivatives Investment Type | Asset Derivatives | Liability Derivatives | ||
| Equity Risk Contracts | Investments in securities, at value | Options written, at value | ||
34
Horizon Funds
NOTES TO FINANCIAL STATEMENTS (Unaudited) (Continued)
May 31, 2017
Active Asset Allocation Fund
| Derivatives Investment Value | ||||
Purchased Options | $ | 1,914,260 | ||
Written Options | $ | 165,000 | ||
Active Risk Assist Fund
| Location on the Statement of Assets and Liabilities | ||||
| Derivatives Investment Type | Asset Derivatives | Liability Derivatives | ||
| Equity Risk Contracts | Investments in securities, at value | Options written, at value | ||
Active Risk Assist Fund
| Derivatives Investment Value | ||||
Purchased Options | $ | 2,051,235 | ||
Written Options | $ | 345,250 | ||
Active Income Fund
| Location on the Statement of Assets and Liabilities | ||||
| Derivatives Investment Type | Asset Derivatives | Liability Derivatives | ||
| Equity Risk Contracts | Investments in securities, at value | Options written, at value | ||
Active Income Fund
| Derivatives Investment Value | ||||
Purchased Options | $ | 11,350 | ||
Active Asset Allocation Fund
The following is a summary of the location of derivative investments on the Horizon Active Asset Allocation Fund’s Statement of Operations for the period ended May 31, 2017:
| Derivative Investment Type | Location of Gain (Loss) on Derivatives in the Statement of Operations | |
| Equity Risk contracts | Net realized gain (loss) from purchased options | |
| Net realized gain (loss) from written options | ||
| Net change in unrealized appreciation (depreciation) on purchased options | ||
| Net change in unrealized appreciation (depreciation) on written options |
35
Horizon Funds
NOTES TO FINANCIAL STATEMENTS (Unaudited) (Continued)
May 31, 2017
| Realized gain/(loss) on derivatives recognized in the Statement of Operations | ||||||||
| Derivative Investment Type | ||||||||
| Purchased Options | $ | 1,043,431 | ||||||
| Written Options | 797,790 | |||||||
| $ | 1,841,221 | |||||||
| Changes in unrealized appreciation/(depreciation) on derivatives recognized in the Statement of Operations | ||||||||
| Purchased Options | $ | 53,070 | ||||||
| Written Options | 180,222 | |||||||
| $ | 233,292 | |||||||
Active Risk Assist Fund
The following is a summary of the location of derivative investments on the Horizon Active Risk Assist Fund’s Statement of Operations for the period ended May 31, 2017:
| Derivative Investment Type | Location of Gain (Loss) on Derivatives in the Statement of Operations | |
| Equity contracts | Net realized gain (loss) from purchased options | |
| Net realized gain (loss) from written options | ||
| Net change in unrealized appreciation (depreciation) on purchased options | ||
| Net change in unrealized appreciation (depreciation) on written options |
| Realized gain/(loss) on derivatives recognized in the Statement of Operations | ||||
| Derivative Investment Type | ||||
| Purchased Options | $ | (4,225,280 | ) | |
| Written Options | 913,543 | |||
| $ | (3,311,737 | ) | ||
| Changes in unrealized appreciation/(depreciation) on derivatives recognized in the Statement of Operations | ||||
| Purchased Options | $ | (365,267 | ) | |
| Written Options | (24,731 | ) | ||
| $ | (389,998 | ) | ||
Active Income Fund
The following is a summary of the location of derivative investments on the Horizon Active Income Fund’s Statement of Operations for the period ended May 31, 2017:
| Derivative Investment Type | Location of Gain (Loss) on Derivatives in the Statement of Operations | |
| Equity contracts | Net realized gain (loss) from purchased options | |
| Net realized gain (loss) from written options | ||
| Net change in unrealized appreciation (depreciation) on purchased options | ||
| Net change in unrealized appreciation (depreciation) on written options |
36
Horizon Funds
NOTES TO FINANCIAL STATEMENTS (Unaudited) (Continued)
May 31, 2017
| Realized gain/(loss) on derivatives recognized in the Statement of Operations | ||||||||
| Derivative Investment Type | ||||||||
| Purchased Options | $ | 44,830 | ||||||
| Written Options | 139,385 | |||||||
| $ | 184,215 | |||||||
| Changes in unrealized appreciation/(depreciation) on derivatives recognized in the Statement of Operations | ||||||||
| Purchased Options | $ | (10,975 | ) | |||||
| Written Options | - | |||||||
| $ | (10,975 | ) | ||||||
Offsetting of Financial Assets and Derivative Liabilities
The following table presents the Funds’ liability derivatives available for offset under a master netting arrangement net of collateral pledged for the Horizon Active Asset Allocation Fund and the Horizon Active Risk Assist Fund respectively, as of May 31, 2017.
| Horizon Active Asset Allocation Fund | ||||||||||||||||||||||||
Liabilities: | Gross Amounts Not Offset in the Statement of Assets & Liabilities | |||||||||||||||||||||||
| Description | Gross Amounts of Recognized Liabilities | Gross Amounts Offset in the Statement of Assets & Liabilities | Net Amounts Presented in the Statement of Assets & Liabilities | Financial Instruments | Collateral Pledged/ Received | Net Amount | ||||||||||||||||||
Written Options | $ | 165,000 | (1) | $ | - | $ | 165,000 | $ | - | $ | (165,000 | ) (2) | $ | - | ||||||||||
|
|
|
|
|
|
|
|
|
|
|
| |||||||||||||
Total | $ | 165,000 | $ | - | $ | 165,000 | $ | - | $ | (165,000 | ) | $ | - | |||||||||||
|
|
|
|
|
|
|
|
|
|
|
| |||||||||||||
| Horizon Active Risk Assist Fund | ||||||||||||||||||||||||
Liabilities: | Gross Amounts Not Offset in the Statement of Assets & Liabilities | |||||||||||||||||||||||
| Description | Gross Amounts of Recognized Liabilities | Gross Amounts Offset in the Statement of Assets & Liabilities | Net Amounts Presented in the Statement of Assets & Liabilities | Financial Instruments | Collateral Pledged/ Received | Net Amount | ||||||||||||||||||
Written Options | $ | 345,250 | (1) | $ | - | $ | 345,250 | $ | - | $ | (345,250 | ) (2) | $ | - | ||||||||||
|
|
|
|
|
|
|
|
|
|
|
| |||||||||||||
Total | $ | 345,250 | $ | - | $ | 345,250 | $ | - | $ | (345,250 | ) | $ | - | |||||||||||
|
|
|
|
|
|
|
|
|
|
|
| |||||||||||||
| (1) | Written options at value as presented in the Schedule of Options Written. |
| (2) | The amount is limited to the derivative liability balance and, accordingly, does not include excess collateral pledged. |
37
Horizon Funds
NOTES TO FINANCIAL STATEMENTS (Unaudited) (Continued)
May 31, 2017
The number of option contracts written and the premiums received during the period ended May 31, 2017, were as follows:
| Horizon Active Asset Allocation | ||||||||
| Written Options | ||||||||
| Number of Contracts | Premiums Received | |||||||
Options outstanding, beginning of period | 20,975 | $ | 1,133,903 | |||||
Options written | 43,350 | 2,706,024 | ||||||
Options closed | (25,350 | ) | (2,104,360 | ) | ||||
Options exercised | - | - | ||||||
Options expired | (24,975 | ) | (1,049,255 | ) | ||||
|
|
|
| |||||
Options outstanding, end of period | 14,000 | $ | 686,312 | |||||
|
|
|
| |||||
| Horizon Active Risk Assist Fund | ||||||||
| Written Options | ||||||||
| Number of Contracts | Premiums Received | |||||||
Options outstanding, beginning of period | 16,100 | $ | 584,158 | |||||
Options written | 39,650 | 1,767,291 | ||||||
Options closed | (7,250 | ) | (393,676 | ) | ||||
Options exercised | - | - | ||||||
Options expired | (32,000 | ) | (1,451,846 | ) | ||||
|
|
|
| |||||
Options outstanding, end of period | 16,500 | $ | 505,927 | |||||
|
|
|
| |||||
| Horizon Active Income Fund | ||||||||
| Written Options | ||||||||
| Number of Contracts | Premiums Received | |||||||
Options outstanding, beginning of period | - | $ | - | |||||
Options written | 2,000 | 151,807 | ||||||
Options closed | (750 | ) | (37,829 | ) | ||||
Options exercised | - | - | ||||||
Options expired | (1,250 | ) | (113,978 | ) | ||||
|
|
|
| |||||
Options outstanding, end of period | - | $ | - | |||||
|
|
|
| |||||
The Horizon Active Dividend Fund did not write options during the period ended May 31, 2017.
Security Transactions and Investment Income – Investment security transactions are accounted for on a trade date basis. Cost is determined and gains and losses are based upon the specific identification method for both financial statement and federal income tax purposes. Dividend income and expense is recorded on the ex-dividend date and interest income is recorded on the accrual basis. Long-term capital gain distributions from investment companies are recorded separately from dividend income. Purchase discounts and premiums on securities are accreted and amortized over the life of the respective securities.
38
Horizon Funds
NOTES TO FINANCIAL STATEMENTS (Unaudited) (Continued)
May 31, 2017
Expenses – Expenses of the Trust that are directly identifiable to a specific Fund are charged to that Fund. Expenses, which are not readily identifiable to a specific Fund, are allocated in such a manner as deemed equitable, taking into consideration the nature and type of expense and the relative sizes of the Funds in the Trust. Income, other non-class-specific expenses, and realized and unrealized gains and losses on investments are allocated to each class of shares based on its relative net assets.
Federal Income Taxes – It is each Fund’s policy to comply with all sections of the Internal Revenue Code applicable to regulated investment companies and to distribute all of its taxable income and gains to its shareholders and therefore, no provision for federal income tax has been made. Each Fund is treated as a separate taxpayer for federal income tax purposes.
The Funds recognize the tax benefits of uncertain tax positions only where the position is “more likely than not” to be sustained assuming examination by tax authorities. Management has analyzed the Funds’ tax positions, and has concluded that no liability for unrecognized tax benefits should be recorded related to uncertain tax positions taken on returns filed for open tax years 2013 - 2015, or expected to be taken in the Funds’ 2016 tax returns. The Funds identified their major tax jurisdictions as U.S. Federal, North Carolina State and Delaware State; however, the Funds are not aware of any tax positions for which it is reasonably possible that the total amounts of unrecognized tax benefits will change materially in the next twelve months.
Distributions to Shareholders – Distributions from investment income, if any, are declared and paid at least annually for the Horizon Active Asset Allocation Fund, Horizon Active Risk Assist Fund, and for the Horizon Active Dividend Fund and quarterly for the Horizon Active Income Fund and are recorded on the ex-dividend date. The Funds will declare and pay net realized capital gains, if any, annually. The character of income and gains to be distributed is determined in accordance with income tax regulations, which may differ from GAAP.
Indemnification – The Trust indemnifies its officers and trustees for certain liabilities that may arise from the performance of their duties to the Trust. Additionally, in the normal course of business, the Funds enter into contracts that contain a variety of representations and warranties and which provide general indemnities. A Fund’s maximum exposure under these arrangements is unknown, as this would involve future claims that may be made against the Fund that have not yet occurred. However, based on experience, the Trust expects the risk of loss due to these warranties and indemnities to be remote.
| 3. | ADVISORY FEE AND OTHER RELATED PARTY TRANSACTIONS |
Pursuant to an Investment Advisory Agreement with each Fund (the “Advisory Agreements”), investment advisory services are provided to the Funds by Horizon Investments, LLC (the “Adviser”). Under the terms of the Advisory Agreements, the Adviser receives monthly fees calculated at an annual rate of 1.10% of the average daily net assets of the Horizon Active Asset Allocation Fund, 1.10% of the average daily net assets of the Horizon Active Risk Assist Fund, 0.77% of the average daily net assets of the Horizon Active Income Fund, and 0.75% of the average daily net assets of the Horizon Active Dividend Fund. For the period ended May 31, 2017, the Adviser earned advisory fees of:
| Fund | Advisory Fee | |||
Horizon Active Asset Allocation Fund | $ | 2,026,430 | ||
Horizon Active Risk Assist Fund | 1,792,924 | |||
Horizon Active Income Fund | 726,699 | |||
Horizon Active Dividend Fund | 166 | |||
39
Horizon Funds
NOTES TO FINANCIAL STATEMENTS (Unaudited) (Continued)
May 31, 2017
Pursuant to the Fee Waiver Agreement (the “Waiver Agreement”), the Adviser has agreed, at least until December 31, 2018, for each Fund, to waive a portion of the Fund’s advisory fee and has agreed to reimburse the Fund for other expenses to the extent necessary so that the total expenses incurred by the Fund (exclusive of front-end or contingent deferred loads, brokerage fees and commissions, acquired fund fees and expenses, borrowing costs (such as interest and dividend expense on securities sold short), taxes and extraordinary expenses (such as litigation)) do not exceed the values in the below table.
| Fund | Advisor | Investor | Institutional | |||||||||
Horizon Active Asset Allocation Fund | 1.42 | % | 1.42 | % | 1.17 | % | ||||||
Horizon Active Risk Assist Fund | 1.42 | % | 1.42 | % | 1.17 | % | ||||||
Horizon Active Income Fund | 1.24 | % | 1.24 | % | 0.99 | % | ||||||
Horizon Dividend Fund | n/a | 1.24 | % | n/a | ||||||||
If the Adviser waives any fee or reimburses any expense pursuant to the Waiver Agreement, and a Fund’s Operating Expenses are subsequently less than its respective limit described in the Waiver Agreement, the Adviser shall be entitled to reimbursement by that Fund. If the Funds’ Operating Expenses subsequently exceed the figures in the above table, the reimbursements shall be suspended. The Adviser may seek reimbursement only for expenses waived or paid by it during the three fiscal years prior to such reimbursement; provided, however, that such expenses may only be reimbursed to the extent they were waived or paid after the date of the Waiver Agreement (or any similar agreement). No amounts will be paid to the Adviser in any fiscal quarter unless the Board determines that reimbursement is in the best interests of the Fund and its shareholders. For the period ended May 31, 2017, the Adviser waived fees and other expenses in excess of the Adviser’s fee in the amount of:
| Fund | Waived Fee | Recaptured Fee | Net | |||||||||
Horizon Active Asset Allocation Fund | $ | (209,476 | ) | $ | - | $ | (209,476 | ) | ||||
Horizon Active Risk Assist Fund | (186,497 | ) | - | (186,497 | ) | |||||||
Horizon Active Income Fund | (22,234 | ) | - | (22,234 | ) | |||||||
Horizon Active Dividend Fund | (31,229 | ) | - | (31,229 | ) | |||||||
The table below contains the amounts of fee waivers and expense reimbursements subject to recapture by the Adviser through May 31 of the year indicated. The fee waivers and expense reimbursements incurred by the Predecessor funds are subject to recapture.
| Fund | 2017 | 2018 | 2019 | 2020 | Total | |||||||||||||||
Horizon Active Asset Allocation Fund | $ | 215,194 | $ | 392,881 | $ | 409,448 | 209,476 | $ | 1,226,999 | |||||||||||
Horizon Active Risk Assist Fund | 15,007 | 189,924 | 310,900 | 186,497 | 702,328 | |||||||||||||||
Horizon Active Income Fund | 33,108 | 52,219 | 94,696 | 22,234 | 202,257 | |||||||||||||||
Horizon Active Dividend Fund | - | - | - | 31,229 | 31,229 | |||||||||||||||
Shareholder Services Plan – The Board of Trustees has adopted a shareholder serving plan for Investor Class Shares of the Horizon Active Asset Allocation Fund, Horizon Active Risk Assist Fund and Horizon Active Income Fund (the “Plan”). The Plan allows these Funds to use part of their assets for shareholder servicing expenses. For these services, the Funds pay a fee up to 0.25% of average net assets attributable to Investor Class Shares of the Funds on an annualized basis. Payments under the Plan are made for the provision of support services to shareholders, including administrative or other shareholder support services such as responding to customer inquiries or assisting the Funds in establishing or maintaining shareholder accounts and records. The entities providing shareholder services may provide such services directly, or may arrange for such services to be provided by another entity that has a servicing relationship with one or more shareholders. However, payments
40
Horizon Funds
NOTES TO FINANCIAL STATEMENTS (Unaudited) (Continued)
May 31, 2017
under the Plan are an operating expense of each Fund that is subject to the expense limitation provided by Horizon. Payments under the Plan may vary and are determined by the respective Fund in its sole discretion, in amounts up to 0.25% of the Fund’s average daily net assets attributable to Investor Class Shares of the Fund on an annualized basis.
Rule 12b-1 – The Trust, with respect to the Funds, has adopted a Distribution Plan for each Fund’s Advisor Class shares and for Investor Class shares of the Horizon Active Dividend Fund pursuant to Rule 12b-1 under the 1940 Act (the “12b-1 Plan”). However, payments under the 12b-1 Plan are an operating expense of each Fund that is subject to the expense limitation provided by Horizon. The 12b-1 Plan provides for the payment of a distribution fee to Quasar Distributors, LLC (the “Distributor”) at an annualized rate of 0.25% of the average daily net assets attributable to Advisor Class shares. During the period ended May 31, 2017, the Horizon Active Asset Allocation, Horizon Active Risk Assist Fund and Horizon Active Income Fund Advisor Class shares, and Horizon Active Dividend Fund Investor Class shares incurred $3,774, $422, $31 and $55, respectively, pursuant to the plan. Investor Class shares of the Horizon Active Asset Allocation Fund, Horizon Active Risk Assist Fund and Horizon Active Income Fund, and Institutional Class Shares of the Funds do not pay any 12b-1 distribution fees.
Trustees – The Trust pays each Trustee of the Trust who is not an interested person an annual retainer of $9,000 for each fiscal year plus $3,000 for attendance at an in-person board meeting or $1,000 for attendance by telephone. In every instance, the cost of the fees are to be allocated among the participating Funds in accordance with a formula that takes into account the overall asset size of each affected Fund. The Trust also reimburses the Trustees for travel and other expenses incurred in attending meetings of the Board. Officers of the Trust and Trustees who are interested persons of the Trust do not receive any direct compensation from the Trust.
In addition, certain affiliates of the Distributor provide services to the Funds as follows:
Administration, Fund Accounting, Transfer Agent Fees – U.S. Bancorp Fund Services, LLC (“USBFS”), an affiliate of the Distributor, provides administration, fund accounting, and transfer agent services to the Trust. Pursuant to separate servicing agreements with USBFS, the Funds pay USBFS customary fees for providing administration, fund accounting and transfer agency services to the Funds.
Custody Fees – U.S. Bank, N.A., an affiliate of the Distributor, acts as custodian for the Funds. Pursuant to a Custody Agreement, the Funds pay U.S. Bank, N.A. customary fees for providing custody services to the Funds.
| 4. | INVESTMENT TRANSACTIONS |
The cost of purchases and proceeds from the sale of securities, other than short-term securities, for the period ended May 31, 2017, were as follows:
| Fund | Purchases | Sales | ||||||
Horizon Active Asset Allocation Fund | $ | 241,231,380 | $ | 271,895,871 | ||||
Horizon Active Risk Assist Fund | 137,268,258 | 148,589,953 | ||||||
Horizon Active Income Fund | 240,469,195 | 241,650,483 | ||||||
Horizon Active Dividend Fund | 98,641 | 44,399 | ||||||
41
Horizon Funds
NOTES TO FINANCIAL STATEMENTS (Unaudited) (Continued)
May 31, 2017
| 5. | DISTRIBUTIONS TO SHAREHOLDERS AND TAX COMPONENTS OF CAPITAL |
The tax character of fund distributions paid for the years ended November 30, 2016 and November 30, 2015 was as follows:
| For the year ended November 30, 2016 | ||||||||||||||||
| Fund | Ordinary Income | Long-Term Capital Gains | Return of Capital | Total | ||||||||||||
Horizon Active Asset Allocation Fund | $ | 9,451,702 | $ | 1,569,620 | $ | - | $ | 11,021,322 | ||||||||
Horizon Active Risk Assist Fund | 2,312,701 | - | - | 2,312,701 | ||||||||||||
Horizon Active Income Fund | 1,904,275 | - | - | 1,904,275 | ||||||||||||
| For the year ended November 30, 2015 | ||||||||||||||||
| Fund | Ordinary Income | Long-Term Capital Gains | Return of Capital | Total | ||||||||||||
Horizon Active Asset Allocation Fund | $ | 14,576,411 | $ | - | $ | - | $ | 14,576,411 | ||||||||
Horizon Active Risk Assist Fund | 1,129 | - | - | 1,129 | ||||||||||||
Horizon Active Income Fund | 1,900,316 | - | - | 1,900,316 | ||||||||||||
On December 28, 2016, the Funds paid the following income distributions:
| Fund | Advisor Class | Investor Class | Institutional Class | |||||||||
Horizon Active Asset Allocation Fund | 0.12665239 | 0.10430375 | 0.13398492 | |||||||||
Horizon Active Risk Assist Fund | 0.17064350 | 0.16696953 | 0.20585144 | |||||||||
Horizon Active Income Fund | 0.08941359 | 0.08341415 | 0.09187182 | |||||||||
On December 30, 2016, the Fund paid the following income distribution:
| Fund | Advisor Class | Investor Class | Institutional Class | |||||||||
Horizon Active Income Fund | 0.01683778 | 0.01681323 | 0.01707252 | |||||||||
As of November 30, 2016, the components of accumulated earnings/(deficit) on a tax basis were as follows:
| Fund | Undistributed Ordinary Income | Undistributed Long-Term Capital Gains | Capital Loss Carry Forwards | Other Book/Tax Differences | Post October Loss and Late Year Loss | Unrealized Appreciation/ (Depreciation) | Total Accumulated Earnings/ (Deficits) | |||||||||||||||||||||
Horizon Active Asset Allocation Fund | $ | 80,107 | $ | - | $ | (9,981,683 | ) | $ | 542,757 | $ | - | $ | 8,025,845 | $ | (1,332,974 | ) | ||||||||||||
Horizon Active Risk Assist Fund | 877,594 | - | (20,674,864 | ) | 404,720 | - | 5,999,202 | (13,393,348 | ) | |||||||||||||||||||
Horizon Active Income Fund | 1,048,743 | - | (1,522,235 | ) | - | - | (8,626,817 | ) | (9,100,309 | ) | ||||||||||||||||||
The difference between book and tax basis, unrealized appreciation/depreciation, and accumulated net realized gain/(loss) from investments is attributable to the tax deferral of losses on wash sales as well as the tax treatment of partnerships and options contracts.
42
Horizon Funds
NOTES TO FINANCIAL STATEMENTS (Unaudited) (Continued)
May 31, 2017
At November 30, 2016, the Funds had capital loss carry forwards for federal income tax purposes available to offset future capital gains as follows:
| Non-Expiring | ||||||||||||
| Fund | Short-Term | Long-Term | Total | |||||||||
Horizon Active Asset Allocation Fund | $ | 9,981,683 | $ | - | $ | 9,981,683 | ||||||
Horizon Active Risk Assist Fund | 20,674,864 | - | 20,674,864 | |||||||||
Horizon Active Income Fund | 1,522,235 | - | 1,522,235 | |||||||||
Additionally, U.S. generally accepted accounting principles require that certain components of net assets relating to permanent differences be reclassified between financial and tax reporting. These reclassifications have no effect on net assets or net asset value per share. For the year ended November 30, 2016, the following table shows the reclassifications made:
| Undistributed Net Investment Income/(Loss) | Accumulated Net Realized Gain/(Loss) | Paid In Capital | ||||||||||
Horizon Active Asset Allocation Fund | $ | (1,082,996 | ) | $ | 1,082,996 | $ | - | |||||
Horizon Risk Assist Fund | 2,352 | - | (2,352 | ) | ||||||||
Horizon Active Income Fund | - | - | - | |||||||||
| 6. | BENEFICIAL OWNERSHIP |
The beneficial ownership, either directly or indirectly, of more than 25% of voting securities of a fund creates a presumption of control of that fund, under Section 2(a)(9) of the 1940 Act. As of May 31, 2017, Pershing LLC and National Financial Services held the following voting securities for the sole benefit of customers and may be deemed to control the Funds:
| Pershing LLC | National Financial Services | Trust Company of America | ||||||||||
Horizon Active Asset Allocation Fund | ||||||||||||
Advisor Class | N/A | 93.81 | % | N/A | ||||||||
Investor Class | 58.53 | % | 28.33 | % | N/A | |||||||
Institutional Class | N/A | N/A | 99.99 | % | ||||||||
Horizon Active Risk Assist Fund | ||||||||||||
Advisor Class | 89.51 | % | N/A | N/A | ||||||||
Investor Class | 45.54 | % | 31.88 | % | N/A | |||||||
Institutional Class | N/A | N/A | 94.49 | % | ||||||||
Horizon Active Income Fund | ||||||||||||
Advisor Class | 85.79 | % | N/A | N/A | ||||||||
Investor Class | 59.24 | % | 29.95 | % | N/A | |||||||
Institutional Class | N/A | N/A | 99.82 | % | ||||||||
Horizon Active Dividend Fund | ||||||||||||
Investor Class | N/A | N/A | N/A | |||||||||
Additionally, an affiliate of the Adviser owns 91.45% of the Investor Class shares of the Horizon Active Dividend Fund.
43
Horizon Funds
NOTES TO FINANCIAL STATEMENTS (Unaudited) (Continued)
May 31, 2017
| 7. | SUBSEQUENT EVENTS |
Subsequent events after the date of the Statements of Assets and Liabilities have been evaluated through the date the financial statements were issued. Management has concluded that there is no impact requiring adjustment or disclosure in the financial statements, other than the following and the distributions noted in Note 5.
Horizon Active Dividend Fund Advisor Class shares commenced operations on June 20, 2017.
Effective as of July 1, 2017, the Adviser has agreed to waive its advisory fee and reimburse expenses to limit total operating expenses of the Investor Class shares of the Horizon Active Asset Allocation Fund, Horizon Active Risk Assist Fund and Horizon Active Income Fund so that direct expenses (not including front-end or contingent deferred loads, brokerage fees and commissions, acquired fund fees and expenses, borrowing costs (such as interest and dividend expense on securities sold short), taxes and extraordinary expenses such as litigation) of the Investor Class shares of each Fund do not exceed 1.27%, 1.27%, and 1.09%, respectively. Prior to July 1, 2017, the Adviser had agreed to waive its advisory fee and/or reimburse expenses to 1.42%, 1.42% and 1.24% of the average daily net assets of the Investor Class shares of each Fund, respectively. This contractual limitation is in effect until December 31, 2018.
In addition, effective as of July 1, 2017 the Shareholder Servicing Expenses for the Investor Class shares of each Fund is decreased from 0.25% to 0.10% of average daily net assets through December 31, 2018.
44
Horizon Funds
DISCLOSURE OF FUND EXPENSES (Unaudited)
May 31, 2017
As a shareholder of the Fund you incur ongoing costs, including management fees, sales charges, and other Fund operating expenses. This example is intended to help you understand your ongoing costs (in dollars) of investing in the Fund and to compare these costs with the ongoing costs of investing in other mutual funds. Please note, the expenses shown in the tables are meant to highlight ongoing costs only and do not reflect any transactional costs.
This example is based on an investment of $1,000 invested for the period of time as indicated in the table below.
Actual Expenses: The column labeled “Actual” of the table provides information about actual account values and actual expenses. You may use the information in this line, together with the amount you invested, to estimate the expenses that you paid over the period. Simply divide your account value by $1,000 (for example, an $8,600 account value divided by $1,000 = 8.6), then multiply the result by the number in the first line under the heading entitled “Expenses Paid During Period” to estimate the expenses you paid on your account during the period.
Hypothetical Examples for Comparison Purposes: The column labeled “Hypothetical” of the table below provides information about hypothetical account values and hypothetical expenses based on the Fund’s actual expense ratio and an assumed rate of return of 5% per year before expenses, which is not the Fund’s actual return. The hypothetical account values and expenses may not be used to estimate the actual ending account balance or expenses you paid for the period. You may use this information to compare the ongoing costs of investing in the Fund and other funds. To do so, compare this 5% hypothetical example with the 5% hypothetical examples that appear in the shareholder reports of the other funds.
Please note that the expenses shown in the table are meant to highlight your ongoing costs only and do not reflect any transactional costs which may be applicable to your account. Therefore, the second line of the table is useful in comparing ongoing costs only, and will not help you determine the relative total costs of owning different funds. In addition, if these transactional costs were included, your costs would have been higher.
| Actual | Hypothetical (5% return before expenses) | |||||||||||||||||||||||
| | Fund’s Annualized Expense Ratio | | | Beginning Account Value 12/1/2016 | | | Ending Account Value 5/31/2017 | | | Expenses Paid During Period | | | Ending Account Value 5/31/2017 | | | Expenses Paid During Period | | |||||||
Horizon Active Asset Allocation - Advisor Class * | 1.42% | $ | 1,000.00 | $ | 1,129.80 | $ | 7.54 | $ | 1,017.95 | $ | 7.14 | |||||||||||||
Horizon Active Asset Allocation - Investor Class * | 1.42% | $ | 1,000.00 | $ | 1,130.20 | $ | 7.54 | $ | 1,017.95 | $ | 7.14 | |||||||||||||
Horizon Active Asset Allocation - Institutional Class * | 1.17% | $ | 1,000.00 | $ | 1,131.00 | $ | 6.22 | $ | 1,019.20 | $ | 5.89 | |||||||||||||
Horizon Active Risk Assist - | 1.42% | $ | 1,000.00 | $ | 1,108.70 | $ | 7.47 | $ | 1,017.85 | $ | 7.14 | |||||||||||||
Horizon Active Risk Assist - | 1.42% | $ | 1,000.00 | $ | 1,108.40 | $ | 7.46 | $ | 1,017.85 | $ | 7.14 | |||||||||||||
Horizon Active Risk Assist - Institutional Class * | 1.17% | $ | 1,000.00 | $ | 1,110.50 | $ | 6.16 | $ | 1,019.10 | $ | 5.89 | |||||||||||||
Horizon Active Income - | 1.24% | $ | 1,000.00 | $ | 1,040.90 | $ | 6.31 | $ | 1,018.75 | $ | 6.24 | |||||||||||||
Horizon Active Income - | 1.24% | $ | 1,000.00 | $ | 1,040.40 | $ | 6.31 | $ | 1,018.75 | $ | 6.24 | |||||||||||||
Horizon Active Income - | 0.99% | $ | 1,000.00 | $ | 1,041.30 | $ | 5.04 | $ | 1,020.00 | $ | 4.99 | |||||||||||||
Horizon Active Dividend - | 1.24% | $ | 1,000.00 | $ | 1,076.10 | $ | 5.43 | $ | 1,018.75 | $ | 6.24 | |||||||||||||
* Expenses Paid During the Period are equal to the Funds’ annualized expense ratio, multiplied by the average account value over the period, multiplied by 182 days, and divided by 365 (to reflect the number of days in the period).
** This Fund commenced operations on December 28, 2016. Expenses Paid During the Period are equal to the Fund’s annualized expense ratio, multiplied by the average account value over the period, multiplied by 154 days, and divided by 365 (to reflect the number of days in the period).
45
Horizon Funds
APPROVAL OF THE MANAGEMENT AGREEMENTS (Unaudited)
May 31, 2017
At an in-person meeting held on July 19, 2016, at which all of the Trustees were present, the Board of Trustees (the “Board”), including the Trustees who are not “interested persons,” as defined by the Investment Company Act of 1940 (the “1940 Act”), of the Trust (the “Independent Trustees”), voting separately, reviewed and approved the initial Investment Advisory Agreements (the “Advisory Agreements”) with the Adviser for the Horizon Defined Risk Fund (formerly the Horizon Collar Fund) and Horizon Active Dividend Fund (formerly the Horizon Dynamic Dividend Fund) (each a “New Fund” and together the “New Funds”). In the course of their deliberations, the Board was advised by legal counsel. The Board received and reviewed a substantial amount of information provided by the Adviser in response to requests of the Board and counsel.
In considering the approval of the Advisory Agreements and reaching their conclusions with respect thereto, the Board reviewed a memorandum, provided by Fund counsel, which summarized the Board’s fiduciary duties and responsibilities in reviewing and approving the Advisory Agreements and other matters to be considered by the Board at the Meeting and the types of information that should be reviewed by them and their responsibilities in making an informed decision regarding the approval of the Advisory Agreements. The Board also reviewed and analyzed various factors that they determined were relevant, including: (i) the nature, extent and quality of the services to be provided by the Adviser to the Fund; (ii) the costs of the services to be provided and the profits to be realized by the Adviser and its affiliates from the relationship with the Fund; (iii) the extent to which economies of scale will be realized as the Fund grows; and (iv) whether the fee levels reflect these economies of scale to the benefit of shareholders, including the following:
| • | Nature, extent and quality of the services to be provided by the Adviser to the Fund. The Board considered information regarding the services to be provided to the New Funds, the experience, qualifications and key personnel of the Adviser, the Adviser’s sales force, the Adviser’s assets under management and relationships with other registered investment advisers for distribution purposes. The Board reviewed the Adviser’s financial statements and considered the Adviser’s financial condition. The Board also considered the performance of other accounts managed by the Adviser. |
| • | Costs of the services to be provided and the profits to be realized by the Adviser and its affiliates from the relationship with the Fund. The Board considered the management fees proposed to be charged to each Fund, and each Fund’s total expense ratios, each as compared to each Fund’s peer group, and took into account the differences in managing the New Funds compared to other products that the Adviser offers, as well as the fees charged by Horizon to its separately managed accounts. The Board considered the terms and conditions of the Advisory Agreement, including the management fee and the services to be provided by the Adviser thereunder. The Board also considered the indirect benefits that the Adviser receives through soft dollars, cross sales of other products the Adviser sells and third-party marketing materials. |
| • | The extent to which economies of scale will be realized as the Fund grows and whether the fee levels reflect these economies of scale to the benefit of shareholders. The Board considered the details of the proposed expense limitation agreement for each Fund, the fact that the Adviser had agreed to continue the expense limitation agreements through at least December 31, 2019, and noted that the expense waivers and reimbursements were subject to recoupment during a three-year look-back window. The Board also considered that the Adviser agreed to consider implementing breakpoints in its management fee after such time as the Fund’s grow to a size that the Adviser is receiving its full fee. |
After full consideration of the above factors as well as other factors, the Board unanimously concluded that the terms of each proposed Advisory Agreement between each of the New Funds and the Adviser was fair and reasonable and approved the Advisory Agreements.
46
Horizon Funds
ADDITIONAL INFORMATION (Unaudited)
May 31, 2017
Independent Trustees
| Name, Address* and Year of Birth | Position/Term of Office | Principal Occupation During the Past Five Years | Number of Portfolios in Fund Complex Overseen by Trustee | Other Directorships held by Trustee During the Past Five Years | ||||
John W. Davidson Year of Birth: 1946 | Trustee; Indefinite Term of Office (since 2015) | Director, President & Chief Economist of PartnerRe Asset Management Corporation; Chief Investment Officer of Partner Reinsurance Company of the US (2001-2008); Creator, author and founder of John Davidson’s Economic Comments (2009-Present). | 3 | Trustee, AdvisorOne Funds (7 portfolios). | ||||
Todd W. Gaylord Year of Birth: 1975 | Trustee; Indefinite Term of Office (since 2015) | Consultant (financial services) since 2012; Owner, McCauley Street Partners, Inc. (real estate brokerage firm) (2009-2014); Vice President, Corporate Bond, Syndicated Loan, and Credit Default Swap Trader, Wachovia Securities (2005-2008). | 3 | None | ||||
Thomas W. Okel Year of Birth: 1962 | Trustee; Indefinite Term of Office (since 2015) | Executive Director (since 2011), Catawba Lands Conservancy; Global Head of Syndicated Capital Markets (1998-2010), Bank of America Merrill Lynch. | 3 | Trustee, Babson Capital Funds Trust (8 portfolios); Trustee, Babson Capital Global Short Duration High Yield Fund (1 portfolio). |
47
Horizon Funds
ADDITIONAL INFORMATION (Unaudited) (Continued)
May 31, 2017
Interested Trustees and Officers
Name, Address* Year of Birth | Position/Term of Office | Principal Occupation During the Past Five Years | Number of Portfolios Complex Overseen | Other Directorships held by Trustee During the Past Five Years | ||||
Robert J. Cannon** Year of Birth: 1972 | Interested Trustee; Indefinite Term of Office (since 2015) and President; Indefinite Term of Office (since 2015) | President and Chief Executive Officer of the Adviser since 2005; member since 1999. | 3 | None | ||||
Matthew Chambers Year of Birth: 1976 | Vice President, Chief Compliance Officer and Secretary; Indefinite Term of Office (since 2015) | General Counsel and Chief Compliance Officer of the Adviser since 2014; Attorney with Kilpatrick Townsend & Stockton LLP (2008-2014). | Not Applicable | Not Applicable | ||||
Benjamin Johnson Year of Birth: 1978 | Treasurer; Indefinite Term of Office (since 2015) | Managing Director of Operations and Finance of the Adviser since 2008. | Not Applicable | Not Applicable |
| * | The address for each Trustee and officer is 13024 Ballantyne Corporate Place, Suite 225, Charlotte, North Carolina 28277. |
| ** | Mr. Cannon is considered an “interested person” of the Trust, as defined in the 1940 Act, because of his current position with the Adviser. |
48
Investment Adviser
Horizon Investments, LLC
13024 Ballantyne Corporate Place, Suite 225
Charlotte, NC 28277
Distributor
Quasar Distributors, LLC
615 East Michigan Street
Milwaukee, WI 53202
Custodian
U.S. Bank N.A.
Custody Operations
1555 N. RiverCenter Drive, Suite 302
Milwaukee, WI 53212
Transfer Agent, Fund Accountant and Fund Administrator
U.S. Bancorp Fund Services, LLC
615 East Michigan Street
Milwaukee, WI 53202
Independent Registered Public Accounting Firm
Cohen & Company, Ltd.
1350 Euclid Avenue, Suite 800
Cleveland, OH 44115
Legal Counsel
Kilpatrick Townsend & Stockton LLP
1001 West Fourth Street
Winston-Salem, NC 27101
How to Obtain Proxy Voting Information
Information regarding how the Fund votes proxies relating to portfolio securities for the 12 month period ended June 30th as well as a description of the policies and procedures that the Fund used to determine how to vote proxies is available without charge, upon request, by calling l-855-754-7932 or by referring to the Securities and Exchange Commission’s (“SEC”) website at http://www.sec.gov.
How to Obtain 1st and 3rd Fiscal Quarter Portfolio Holdings
The Fund files its complete schedule of portfolio holdings with the SEC for the first and third quarters of each fiscal year on Form N-Q. Form N-Q is available on the SEC’s website at http://www.sec.gov and may be reviewed and copied at the SEC’s Public Reference Room in Washington, DC (1-800-SEC-0330). The information on Form N-Q is available without charge, upon request, by calling 1-855-754-7932.
Item 2. Code of Ethics.
Not applicable for semi-annual reports.
Item 3. Audit Committee Financial Expert.
Not applicable for semi-annual reports.
Item 4. Principal Accountant Fees and Services.
Not applicable for semi-annual reports.
Item 5. Audit Committee of Listed Registrants.
Not applicable to registrants who are not listed issuers (as defined in Rule 10A-3 under the Securities Exchange Act of 1934).
Item 6. Investments.
| (a) | Schedule of Investments is included as part of the report to shareholders filed under Item 1 of this Form. |
| (b) | Not Applicable. |
Item 7. Disclosure of Proxy Voting Policies and Procedures for Closed-End Management Investment Companies.
Not applicable to open-end investment companies.
Item 8. Portfolio Managers of Closed-End Management Investment Companies.
Not applicable to open-end investment companies.
Item 9. Purchases of Equity Securities by Closed-End Management Investment Company and Affiliated Purchasers.
Not applicable to open-end investment companies.
Item 10. Submission of Matters to a Vote of Security Holders.
The registrant has not adopted any procedure by which shareholders may recommend nominees to the registrant’s board of directors.
1
Item 11. Controls and Procedures.
| (a) | The registrant’s principal executive officer and principal financial officer have concluded, based on an evaluation of the registrant’s disclosure controls and procedures (as defined in Rule 30a-3(c) under the Investment Company Act of 1940, as amended) as of a date within 90 days prior to the filing date of this Form N-CSR, that the disclosure controls and procedures are effectively designed to ensure that information required to be disclosed by the registrant in this Form N-CSR is recorded, processed, summarized and reported by the filing date, including ensuring that information required to be disclosed in this Form N-CSR is accumulated and communicated to the registrant’s management, including the registrant’s principal executive officer and principal financial officer, as appropriate, to allow timely decisions regarding required disclosure. |
| (b) | There were no significant changes in the registrant’s internal control over financial reporting (as defined in Rule 30a-3(d) under the Investment Company Act of 1940, as amended) that occurred during the second fiscal quarter covered by this report that have materially affected, or are reasonably likely to materially affect, the registrant’s internal control over financial reporting. |
Item 12. Exhibits.
| (a) | (1) Any code of ethics or amendment thereto, that is the subject of the disclosure required by Item 2, to the extent that the registrant intends to satisfy Item 2 requirements through filing an exhibit. Not applicable for semi-annual reports. |
(2) A separate certification for each principal executive and principal financial officer pursuant to Section 302 of the Sarbanes-Oxley Act of 2002. Filed herewith.
(3) Any written solicitation to purchase securities under Rule 23c-1 under the Act sent or given during the period covered by the report by or on behalf of the registrant to 10 or more persons. Not applicable to open-end investment companies.
| (b) | Certifications pursuant to Section 906 of the Sarbanes-Oxley Act of 2002. Furnished herewith. |
2
SIGNATURES
Pursuant to the requirements of the Securities Exchange Act of 1934 and the Investment Company Act of 1940, the registrant has duly caused this report to be signed on its behalf by the undersigned, thereunto duly authorized.
| (Registrant) | Horizon Funds | |||
| By (Signature and Title)* | /s/ Robert Cannon | |||
| Robert Cannon, President and Principal Executive Officer | ||||
| Date 8/8/17 | ||||
Pursuant to the requirements of the Securities Exchange Act of 1934 and the Investment Company Act of 1940, this report has been signed below by the following persons on behalf of the registrant and in the capacities and on the dates indicated.
| By (Signature and Title)* | /s/ Robert Cannon | |
| Robert Cannon, President and Principal Executive Officer | ||
| Date 8/8/17 | ||
| By (Signature and Title)* | /s/ Benjamin Johnson | |
| Benjamin Johnson, Treasurer and Principal Financial Officer | ||
| Date 8/8/17 | ||
| * | Print the name and title of each signing officer under his or her signature. |
3