UNITED STATES
SECURITIES AND EXCHANGE COMMISSION
Washington, D.C. 20549
FORM N-CSR
CERTIFIED SHAREHOLDER REPORT OF REGISTERED
MANAGEMENT INVESTMENT COMPANIES
Investment Company Act file number811-23063
Horizon Funds
(Exact name of registrant as specified in charter)
6210 Ardrey Kell Road, Suite 300
Charlotte, North Carolina 28277
(Address of principal executive offices) (Zip code)
Matthew Chambers
Horizon Funds
6210 Ardrey Kell Road, Suite 300
Charlotte, North Carolina 28277
(Name and address of agent for service)
(866) 371-2399
Registrant's telephone number, including area code
Date of fiscal year end:November 30, 2019
Date of reporting period:December 1, 2018 through May 31, 2019
Item 1. Reports to Stockholders.
HORIZON FUNDS | Semi-Annual Report |
Horizon Active Asset Allocation Fund |
Investor Class | Shares | AAANX |
Advisor Class | Shares | HASAX |
Institutional Class | Shares | HASIX |
Horizon Active Risk Assist® Fund |
Investor Class | Shares | ARANX |
Advisor Class | Shares | ARAAX |
Institutional Class | Shares | ACRIX |
Horizon Active Income Fund |
Investor Class | Shares | AIMNX |
Advisor Class | Shares | AIHAX |
Institutional Class | Shares | AIRIX |
Horizon Active Dividend Fund |
Investor Class | Shares | HNDDX |
Advisor Class | Shares | HADUX |
Horizon Defined Risk Fund |
Investor Class | Shares | HNDRX |
Advisor Class | Shares | HADRX |
Investor Information: 1-855-754-7932
This report and the financial statements contained herein are submitted for the general information of shareholders and are not authorized for distribution to prospective investors unless preceded or accompanied by an effective prospectus. Nothing herein contained is to be considered an offer of sale or solicitation of an offer to buy shares of HORIZON ACTIVE ASSET ALLOCATION FUND, HORIZON ACTIVE RISK ASSIST® FUND, HORIZON ACTIVE INCOME FUND, HORIZON ACTIVE DIVIDEND FUND, and HORIZON DEFINED RISK FUND. Such offering is made only by prospectus, which includes details as to offering price and other material information.
Beginning on January 1, 2021, as permitted by regulations adopted by the Securities and Exchange Commission, paper copies of the Funds shareholder reports will no longer be sent by mail, unless you specifically request paper copies of the reports from the Funds or from your financial intermediary, such as a broker-dealer or bank. Instead, the reports will be made available on a website, and you will be notified by mail each time a report is posted and provided with a website link to access the report.
If you already elected to receive shareholder reports electronically, you will not be affected by this change and you need not take any action. You may elect to receive shareholder reports and other communications electronically from the Funds by calling 1-855-754-7932 or by contacting your financial intermediary (such as a broker-dealer or bank).
You may elect to receive all future reports in paper free of charge. You can request to continue receiving paper copies of your shareholder reports by contacting your financial intermediary or, if you invest directly with a Fund, calling 1-855-754-7932 to let the Fund know of your request. Your election to receive in paper will apply to all funds held in your account.
Table of Contents | |
Portfolio Review | 1 |
Portfolio Composition | 6 |
Portfolio of Investments | 8 |
Statements of Assets and Liabilities | 50 |
Statements of Operations | 52 |
Statements of Changes in Net Assets | 54 |
Financial Highlights | 59 |
Notes to Financial Statements | 72 |
Disclosure of Fund Expenses | 90 |
Approval of the Management Agreements | 91 |
Additional Information | 94 |
Horizon Active Asset Allocation Fund Portfolio Review (Unaudited)
May 31, 2019 |

The chart above assumes an initial gross investment of $10,000 made on January 31, 2012. The Fund’s performance figures are for the periods ended May 31, 2019. The Performance data quoted is historical. Past performance is no guarantee of future results. Current performance may be higher or lower than the performance data quoted. The principal value and investment return of an investment will fluctuate so that your shares, when redeemed, may be worth more or less than their original cost. The returns shown do not reflect the deduction of taxes that a shareholder would pay on Fund distributions or on the redemptions of Fund shares. In the absence of fee waivers and reimbursements, when they are necessary to keep expenses at the expense cap, total return would be reduced. Performance figures for periods greater than one year are annualized.
Average Annual Total Returns | One Year | Five Year | Since
Commencement
of Operations (1) |
Horizon Active Asset Allocation Fund - Investor Class | -5.73% | 4.45% | 7.29% |
Horizon Active Asset Allocation Fund - Advisor Class | -5.87% | N/A | 6.79% |
Horizon Active Asset Allocation Fund - Institutional Class | -5.69% | N/A | 7.40% |
S&P 500 Total Return Index | 3.78% | 9.66% | 12.98%(2) |
S&P Global BMI ex-US Index | -7.09% | 1.71% | 5.07%(2) |
(1) | Inception date is January 31, 2012 for Investor Class Shares, September 4, 2015 for Advisor Class Shares and September 9, 2016 for Institutional Class Shares. |
(2) | The Since Commencement of Operations returns shown are from the commencement date of Horizon Active Asset Allocation Fund - Investor Class. The returns for the S&P 500 Total Return Index and S&P Global BMI ex-US Index since the commencement date of the Horizon Active Asset Allocation Fund - Advisor Class are 12.38% and 6.35%, respectively. The returns for the S&P 500 Total Return Index and S&P Global BMI ex-US Index since the commencement date of the Horizon Active Asset Allocation Fund - Institutional Class are 12.14% and 5.26%, respectively. |
The S&P 500 Total Return Index is an unmanaged market capitalization-weighted index which is comprised of the largest U.S. domiciled companies and includes the reinvestment of all dividends. Index returns do not reflect the effects of fees or expenses. Investors cannot invest directly in an index or benchmark.
The S&P Global BMI ex-US Index is a comprehensive, rules-based index that represents the composition of global stock markets. Index returns do not reflect the effects of fees or expenses. Investors cannot invest directly in an index or benchmark.
1
Horizon Active Risk Assist® Fund
PORTFOLIO REVIEW (Unaudited)
May 31, 2019 |

The chart above assumes an initial gross investment of $10,000 made on August 28, 2014. The Fund’s performance figures are for the periods ended May 31, 2019. The Performance data quoted is historical. Past performance is no guarantee of future results. Current performance may be higher or lower than the performance data quoted. The principal value and investment return of an investment will fluctuate so that your shares, when redeemed, may be worth more or less than their original cost. The returns shown do not reflect the deduction of taxes that a shareholder would pay on Fund distributions or on the redemptions of Fund shares. In the absence of fee waivers and reimbursements, when they are necessary to keep expenses at the expense cap, total return would be reduced. Performance figures for periods greater than one year are annualized.
Average Annual Total Returns | One Year | Since
Commencement
of Operations (1) |
Horizon Active Risk Assist® Fund - Investor Class | -8.60% | 1.92% |
Horizon Active Risk Assist® Fund - Advisor Class | -8.74% | 3.81% |
Horizon Active Risk Assist® Fund - Institutional Class | -8.43% | 4.72% |
Bloomberg Barclays Aggregate Bond Index | 6.40% | 2.65%(2) |
S&P 500 Total Return Index | 3.78% | 9.13%(2) |
S&P Global BMI ex-US Index | -7.09% | 1.49%(2) |
(1) | Inception date is August 28, 2014 for Investor Class Shares, September 4, 2015 for Advisor Class Shares and September 9, 2016 for Institutional Class Shares. |
(2) | The Since Commencement of Operations returns shown are from the commencement date of Horizon Active Risk Assist® Fund - Investor Class. The returns for the Bloomberg Barclays Aggregate Bond Index, S&P 500 Total Return Index, and S&P Global BMI ex-US Index since the commencement date of the Horizon Active Risk Assist® Fund - Advisor Class are 2.86%, 12.38%, and 6.35%, respectively. The returns for the Bloomberg Barclays Aggregate Bond Index, S&P 500 Total Return Index, and S&P Global BMI ex-US Index since the commencement date of the Horizon Active Risk Assist® Fund - Institutional Class are 2.09%, 12.14%, and 5.26%, respectively. |
The Bloomberg Barclays Aggregate Bond Index is a market-capitalization-weighted index that covers the USD denominated, investment-grade (rated Baa3 or above by Moody’s), fixed-rate, and taxable areas of the bond market. Index returns do not reflect the effects of fees or expenses. Investors cannot invest directly in an index or benchmark.
The S&P 500 Total Return Index is an unmanaged market capitalization-weighted index which is comprised of the largest U.S. domiciled companies and includes the reinvestment of all dividends. Index returns do not reflect the effects of fees or expenses. Investors cannot invest directly in an index or benchmark.
The S&P Global BMI ex-US Index is a comprehensive, rules-based index that represents the composition of global stock markets. Index returns do not reflect the effects of fees or expenses. Investors cannot invest directly in an index or benchmark.
2
Horizon Active Income Fund
PORTFOLIO REVIEW (Unaudited)
May 31, 2019 |

The chart above assumes an initial gross investment of $10,000 made on September 30, 2013. The Fund’s performance figures are for the periods ended May 31, 2019. The Performance data quoted is historical. Past performance is no guarantee of future results. Current performance may be higher or lower than the performance data quoted. The principal value and investment return of an investment will fluctuate so that your shares, when redeemed, may be worth more or less than their original cost. The returns shown do not reflect the deduction of taxes that a shareholder would pay on Fund distributions or on the redemptions of Fund shares. In the absence of fee waivers and reimbursements, when they are necessary to keep expenses at the expense cap, total return would be reduced. Performance figures for periods greater than one year are annualized.
Average Annual Total Returns | One Year | Five Year | Since
Commencement
of Operations (1) |
Horizon Active Income Fund - Investor Class | 2.60% | 0.29% | 0.71% |
Horizon Active Income Fund - Advisor Class | 2.45% | N/A | 0.80% |
Horizon Active Income Fund - Institutional Class | 2.69% | N/A | 0.17% |
Bloomberg Barclays Aggregate Bond Index | 6.40% | 2.70% | 3.05%(2) |
(1) | Inception date is September 30, 2013 for Investor Class Shares, February 8, 2016 for Advisor Class Shares and September 9, 2016 for Institutional Class Shares. |
(2) | The Since Commencement of Operations returns shown are from the commencement date of Horizon Active Income Fund - Investor Class. The returns for the Bloomberg Barclays Aggregate Bond Index since the commencement date of the Horizon Active Income Fund - Advisor Class and the Horizon Active Income Fund - Institutional Class are 2.68% and 2.09%, respectively. |
The Bloomberg Barclays Aggregate Bond Index is a market-capitalization-weighted index that covers the USD denominated, investment-grade (rated Baa3 or above by Moody’s), fixed-rate, and taxable areas of the bond market. Index returns do not reflect the effects of fees or expenses. Investors cannot invest directly in an index or benchmark.
3
Horizon Active Dividend Fund
PORTFOLIO REVIEW (Unaudited)
May 31, 2019 |

The chart above assumes an initial gross investment of $10,000 made on December 28, 2016. The Fund’s performance figures are for the periods ended May 31, 2019. The Performance data quoted is historical. Past performance is no guarantee of future results. Current performance may be higher or lower than the performance data quoted. The principal value and investment return of an investment will fluctuate so that your shares, when redeemed, may be worth more or less than their original cost. The returns shown do not reflect the deduction of taxes that a shareholder would pay on Fund distributions or on the redemptions of Fund shares. In the absence of fee waivers and reimbursements, when they are necessary to keep expenses at the expense cap, total return would be reduced. Performance figures for periods greater than one year are annualized.
Average Annual Total Returns | One Year | Since
Commencement
of Operations (1) |
Horizon Active Dividend Fund - Investor Class | -3.10% | 7.62% |
Horizon Active Dividend Fund - Advisor Class | -3.23% | 4.55% |
S&P Global 100 Index | 2.16% | 10.02%(2) |
(1) | Inception date is December 28, 2016 for Investor Class Shares and June 20, 2017 for Advisor Class Shares. |
(2) | The Since Commencement of Operations returns shown are from the commencement date of Horizon Active Dividend Fund - Investor Class. The return for the S&P Global 100 Index since the commencement date of the Horizon Active Dividend Fund - Advisor Class is 6.50%. |
The S&P Global 100 Index measures the performance of multi-national, blue chip companies of major importance in the global equity markets. Index returns do not reflect the effects of fees or expenses. Investors cannot invest directly in an index or benchmark.
4
Horizon Defined Risk Fund
PORTFOLIO REVIEW (Unaudited)
May 31, 2019 |
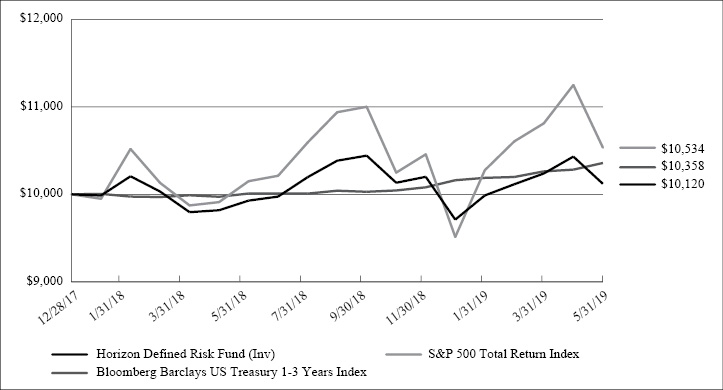
The chart above assumes an initial gross investment of $10,000 made on December 28, 2017. The Fund’s performance figures are for the periods ended May 31, 2019. The Performance data quoted is historical. Past performance is no guarantee of future results. Current performance may be higher or lower than the performance data quoted. The principal value and investment return of an investment will fluctuate so that your shares, when redeemed, may be worth more or less than their original cost. The returns shown do not reflect the deduction of taxes that a shareholder would pay on Fund distributions or on the redemptions of Fund shares. In the absence of fee waivers and reimbursements, when they are necessary to keep expenses at the expense cap, total return would be reduced. Performance figures for periods greater than one year are annualized.
Average Annual Total Returns | One Year | Since
Commencement
of Operations (1) |
Horizon Defined Risk Fund - Investor Class | 1.93% | 0.84% |
Horizon Defined Risk Fund - Advisor Class | 1.78% | -0.09% |
Bloomberg Barclays US Treasury 1-3 Years Index | 3.49% | 2.51%(2) |
S&P 500 Total Return Index | 3.78% | 3.72%(2) |
(1) | Inception date is December 28, 2017 for Investor Class Shares and February 2, 2018 for Advisor Class Shares. |
(2) | The Since Commencement of Operations returns shown are from the commencement date of Horizon Defined Risk Fund - Investor Class. The returns for the Bloomberg Barclays US Treasury 1-3 Years Index and the S&P 500 Total Return Index since the commencement date of the Horizon Defined Risk Fund - Advisor Class are 2.92%, and 1.78%, respectively. |
The Bloomberg Barclays U S Treasury 1-3 Years Index measures the performance of the US government bond market and includes public obligations of the U.S. Treasury with a maturity between 1 and up to (but not including) 3 years. Index returns do not reflect the effects of fees or expenses. Investors cannot invest directly in an index or benchmark.
The S&P 500 Total Return Index is an unmanaged market capitalization-weighted index which is comprised of the largest U.S. domiciled companies and includes the reinvestment of all dividends. Index returns do not reflect the effects of fees or expenses. Investors cannot invest directly in an index or benchmark.
5
Horizon Funds Portfolio Composition (Unaudited)
May 31, 2019 |
Horizon Active Asset Allocation Fund Portfolio Composition as of May 31, 2019:
| | % of Net Assets |
Investment Companies | 93.7% |
Common Stocks | 5.0% |
Purchased Call Options | 0.2% |
Purchased Put Options | 0.6% |
Short-Term Investments | 0.1% |
Investments Purchased With Proceeds From Securities Lending | 13.9% |
Liabilities in Excess of Other Assets | -13.5% |
| | 100.0% |
Horizon Active Risk Assist® Fund Portfolio Composition as of May 31, 2019:
| | % of Net Assets |
Investment Companies | 84.5% |
Common Stocks | 13.8% |
Purchased Call Options | 0.1% |
Purchased Put Options | 0.6% |
Short-Term Investments | 1.0% |
Investments Purchased With Proceeds From Securities Lending | 7.9% |
Liabilities in Excess of Other Assets | -7.9% |
| | 100.0% |
Horizon Active Income Fund Portfolio Composition as of May 31, 2019:
| | % of Net Assets |
Investment Companies | 98.8% |
Purchased Call Options | 0.0%(a) |
Purchased Put Options | 0.1% |
Short-Term Investments | 1.1% |
Investments Purchased With Proceeds From Securities Lending | 21.2% |
Liabilities in Excess of Other Assets | -21.2% |
| | 100.0% |
6
Horizon Funds
PORTFOLIO COMPOSITION (Unaudited) (Continued)
May 31, 2019 |
Horizon Active Dividend Fund Portfolio Composition as of May 31, 2019:
| | % of Net Assets |
Common Stocks | 89.1% |
Preferred Stocks | 0.2% |
Purchased Put Options | 0.2% |
Short-Term Investments | 11.1% |
Investments Purchased With Proceeds From Securities Lending | 0.1% |
Other Assets in Excess of Liabilities | -0.7% |
| | 100.0% |
Horizon Defined Risk Fund Portfolio Composition as of May 31, 2019:
| | % of Net Assets |
Common Stocks | 95.8% |
Purchased Call Options | 0.0%(a) |
Purchased Put Options | 4.7% |
Short-Term Investments | 2.2% |
Investments Purchased With Proceeds From Securities Lending | 0.0%(a) |
Other Assets in Excess of Liabilities | -2.7% |
| | 100.0% |
Please refer to the Portfolio of Investments in this semi-annual report for a detailed analysis of the Funds’ holdings.
7
Horizon Active Asset Allocation Fund Portfolio of Investments (Unaudited)
May 31, 2019 |
| |
Shares
| | | | | | | | Value | |
| | | | | INVESTMENT COMPANIES - 93.7% | | | | | | | | |
| | | | | Exchange Traded Funds - 93.7% | | | | | | | | |
| | | 289,253 | | Health Care Select Sector SPDR Fund | | | | | | $ | 25,246,002 | |
| | | 288,597 | | Invesco QQQ Trust Series 1 (f) | | | | | | | 50,201,448 | |
| | | 918,009 | | Invesco S&P MidCap Low Volatility ETF | | | | | | | 45,542,426 | |
| | | 1,694,807 | | iShares China Large-Cap ETF (f) | | | | | | | 68,419,359 | |
| | | 1,400,341 | | iShares Core Dividend Growth ETF | | | | | | | 50,314,252 | |
| | | 224,621 | | iShares Edge MSCI USA Momentum Factor ETF | | | | | | | 25,200,230 | |
| | | 586,234 | | iShares Edge MSCI USA Quality Factor ETF | | | | | | | 50,334,051 | |
| | | 123,153 | | Janus Henderson Small/Mid Cap Growth Alpha ETF (h) | | | | | | | 5,120,702 | |
| | | 2,744,889 | | SPDR Portfolio S&P 500 Growth ETF (e) | | | | | | | 100,572,733 | |
| | | 1,727,744 | | SPDR Portfolio S&P 500 Value ETF | | | | | | | 50,311,905 | |
| | | 291,024 | | X-Trackers Harvest CSI 300 China A-Shares ETF (f) | | | | | | | 7,601,547 | |
| | | | | TOTAL EXCHANGE TRADED FUNDS (Cost - $490,006,362) | | | | | | | 478,864,655 | |
| | | | | | | | | | | | | |
| | | | | COMMON STOCKS - 5.0% | | | | | | | | |
| | | | | Aerospace/Defense - 0.1% | | | | | | | | |
| | | 1,088 | | Harris Corp. | | | | | | | 203,663 | |
| | | 649 | | TransDigm Group, Inc. (a) | | | | | | | 286,176 | |
| | | | | | | | | | | | 489,839 | |
| | | | | Beverages - 0.0% (b) | | | | | | | | |
| | | 1,774 | | PepsiCo, Inc. | | | | | | | 227,072 | |
| | | | | | | | | | | | | |
| | | | | Biotechnology - 0.0% (b) | | | | | | | | |
| | | 2,206 | | Incyte Corp. (a) | | | | | | | 173,458 | |
| | | | | | | | | | | | | |
| | | | | Building Materials - 0.0% (b) | | | | | | | | |
| | | 354 | | Martin Marietta Materials, Inc. | | | | | | | 74,517 | |
| | | 1,122 | | Vulcan Materials Co. | | | | | | | 140,149 | |
| | | | | | | | | | | | 214,666 | |
| | | | | Chemicals - 0.1% | | | | | | | | |
| | | 1,481 | | Air Products & Chemicals, Inc. | | | | | | | 301,517 | |
| | | 1,464 | | Linde PLC | | | | | | | 264,325 | |
| | | | | | | | | | | | 565,842 | |
| | | | | Commercial Services - 0.4% | | | | | | | | |
| | | 803 | | Cintas Corp. | | | | | | | 178,129 | |
| | | 1,491 | | Ecolab, Inc. | | | | | | | 274,478 | |
| | | 558 | | Equifax, Inc. | | | | | | | 67,462 | |
| | | 937 | | FleetCor Technologies, Inc. (a) | | | | | | | 241,943 | |
| | | 1,501 | | Global Payments, Inc. (f) | | | | | | | 231,214 | |
| | | 858 | | Moody’s Corp. | | | | | | | 156,911 | |
| | | 2,612 | | PayPal Holdings, Inc. (a) | | | | | | | 286,667 | |
| | | 995 | | S&P Global, Inc. | | | | | | | 212,811 | |
| | | 1,520 | | Verisk Analytics, Inc. | | | | | | | 212,800 | |
| | | | | | | | | | | | 1,862,415 | |
See accompanying notes to financial statements.
8
Horizon Active Asset Allocation Fund
PORTFOLIO OF INVESTMENTS (Unaudited) (Continued)
May 31, 2019 |
| |
Shares
| | | | | | | | Value | |
| | | | | Cosmetics/Personal Care - 0.1% | | | | | | | | |
| | | 4,140 | | Procter & Gamble Co. | | | | | | $ | 426,047 | |
| | | | | | | | | | | | | |
| | | | | Distribution/Wholesale - 0.1% | | | | | | | | |
| | | 3,471 | | Copart, Inc. (a) | | | | | | | 248,107 | |
| | | | | | | | | | | | | |
| | | | | Diversified Financial Services - 0.1% | | | | | | | | |
| | | 1,158 | | American Express Co. | | | | | | | 132,834 | |
| | | 796 | | MasterCard, Inc. | | | | | | | 200,186 | |
| | | 3,879 | | Synchrony Financial | | | | | | | 130,451 | |
| | | | | | | | | | | | 463,471 | |
| | | | | Electric - 0.3% | | | | | | | | |
| | | 2,186 | | American Electric Power Co., Inc. | | | | | | | 188,258 | |
| | | 2,215 | | Entergy Corp. | | | | | | | 215,010 | |
| | | 2,402 | | FirstEnergy Corp. | | | | | | | 99,059 | |
| | | 2,182 | | Sempra Energy | | | | | | | 286,824 | |
| | | 5,966 | | Southern Co. | | | | | | | 319,181 | |
| | | 1,661 | | WEC Energy Group, Inc. | | | | | | | 133,794 | |
| | | 3,560 | | Xcel Energy, Inc. | | | | | | | 204,130 | |
| | | | | | | | | | | | 1,446,256 | |
| | | | | Electrical Components & Equipment - 0.0% (b) | | | | | | | | |
| | | 1,052 | | AMETEK, Inc. | | | | | | | 86,148 | |
| | | | | | | | | | | | | |
| | | | | Electronics - 0.2% | | | | | | | | |
| | | 831 | | Allegion PLC | | | | | | | 80,649 | |
| | | 3,107 | | Garmin Ltd. | | | | | | | 237,623 | |
| | | 1,289 | | Honeywell International, Inc. | | | | | | | 211,796 | |
| | | 3,262 | | Keysight Technologies, Inc. (a) | | | | | | | 245,074 | |
| | | 355 | | Mettler-Toledo International, Inc. (a) | | | | | | | 256,697 | |
| | | | | | | | | | | | 1,031,839 | |
| | | | | Engineering & Construction - 0.0% (b) | | | | | | | | |
| | | 1,369 | | Jacobs Engineering Group, Inc. | | | | | | | 103,072 | |
| | | | | | | | | | | | | |
| | | | | Environmental Control - 0.1% | | | | | | | | |
| | | 2,058 | | Republic Services, Inc. | | | | | | | 174,086 | |
| | | 2,794 | | Waste Management, Inc. | | | | | | | 305,524 | |
| | | | | | | | | | | | 479,610 | |
| | | | | Food - 0.2% | | | | | | | | |
| | | 4,423 | | General Mills, Inc. | | | | | | | 218,673 | |
| | | 2,378 | | Hershey Co. | | | | | | | 313,801 | |
| | | 6,996 | | Mondelez International, Inc., Class A | | | | | | | 355,747 | |
| | | 1,672 | | Sysco Corp. | | | | | | | 115,067 | |
| | | 2,113 | | Tyson Foods, Inc., Class A | | | | | | | 160,355 | |
| | | | | | | | | | | | 1,163,643 | |
See accompanying notes to financial statements.
9
Horizon Active Asset Allocation Fund
PORTFOLIO OF INVESTMENTS (Unaudited) (Continued)
May 31, 2019 |
| |
Shares
| | | | | | | | Value | |
| | | | | Healthcare Products - 0.3% | | | | | | | | |
| | | 2,143 | | Abbott Laboratories | | | | | | $ | 163,146 | |
| | | 399 | | Align Technology, Inc. (a) | | | | | | | 113,456 | |
| | | 287 | | Cooper Cos., Inc. | | | | | | | 85,466 | |
| | | 3,206 | | Danaher Corp. | | | | | | | 423,224 | |
| | | 3,714 | | Dentsply Sirona, Inc. | | | | | | | 200,073 | |
| | | 1,019 | | IDEXX Laboratories, Inc. (a) | | | | | | | 254,516 | |
| | | 752 | | Thermo Fisher Scientific, Inc. | | | | | | | 200,769 | |
| | | | | | | | | | | | 1,440,650 | |
| | | | | Healthcare Services - 0.0% (b) | | | | | | | | |
| | | 1,551 | | IQVIA Holdings, Inc. (a) | | | | | | | 210,703 | |
| | | | | | | | | | | | | |
| | | | | Home Builders - 0.0% (b) | | | | | | | | |
| | | 1,848 | | DR Horton, Inc. | | | | | | | 79,020 | |
| | | 2,455 | | PulteGroup, Inc. | | | | | | | 76,105 | |
| | | | | | | | | | | | 155,125 | |
| | | | | Household Products/Wares - 0.1% | | | | | | | | |
| | | 2,378 | | Church & Dwight Co., Inc. | | | | | | | 176,947 | |
| | | 728 | | Kimberly-Clark Corp. | | | | | | | 93,104 | |
| | | | | | | | | | | | 270,051 | |
| | | | | Insurance - 0.4% | | | | | | | | |
| | | 5,487 | | Aflac, Inc. | | | | | | | 281,483 | |
| | | 1,848 | | American International Group, Inc. | | | | | | | 94,377 | |
| | | 1,398 | | Aon PLC, Class A | | | | | | | 251,738 | |
| | | 2,587 | | Arthur J Gallagher & Co. | | | | | | | 217,825 | |
| | | 958 | | Chubb Ltd. | | | | | | | 139,935 | |
| | | 2,564 | | Cincinnati Financial Corp. | | | | | | | 251,887 | |
| | | 739 | | Everest Re Group Ltd. | | | | | | | 183,021 | |
| | | 2,176 | | Hartford Financial Services Group, Inc. | | | | | | | 114,588 | |
| | | 2,343 | | Marsh & McLennan Cos., Inc. | | | | | | | 223,991 | |
| | | 4,009 | | Progressive Corp. | | | | | | | 317,834 | |
| | | 1,222 | | Travelers Cos., Inc. | | | | | | | 177,887 | |
| | | | | | | | | | | | 2,254,566 | |
| | | | | Internet - 0.2% | | | | | | | | |
| | | 1,516 | | Facebook, Inc. (a) | | | | | | | 269,045 | |
| | | 761 | | Netflix, Inc. (a) | | | | | | | 261,236 | |
| | | 1,428 | | VeriSign, Inc. (a) | | | | | | | 278,431 | |
| | | | | | | | | | | | 808,712 | |
| | | | | Lodging - 0.0% (b) | | | | | | | | |
| | | 1,788 | | Hilton Worldwide Holdings, Inc. | | | | | | | 159,919 | |
| | | | | | | | | | | | | |
| | | | | Machinery - Diversified - 0.0% (b) | | | | | | | | |
| | | 622 | | Roper Technologies, Inc. | | | | | | | 213,918 | |
| | | | | | | | | | | | | |
See accompanying notes to financial statements.
10
Horizon Active Asset Allocation Fund
PORTFOLIO OF INVESTMENTS (Unaudited) (Continued)
May 31, 2019 |
| |
Shares
| | | | | | | | Value | |
| | | | | Media - 0.2% | | | | | | | | |
| | | 910 | | Charter Communications, Inc. (a) | | | | | | $ | 342,888 | |
| | | 11,969 | | Comcast Corp. | | | | | | | 490,729 | |
| | | 2,818 | | Walt Disney Co. | | | | | | | 372,089 | |
| | | | | | | | | | | | 1,205,706 | |
| | | | | Miscellaneous Manufacturing - 0.1% | | | | | | | | |
| | | 2,517 | | Ingersoll-Rand PLC | | | | | | | 297,862 | |
| | | | | | | | | | | | | |
| | | | | Oil & Gas - 0.1% | | | | | | | | |
| | | 5,614 | | Cabot Oil & Gas Corp. | | | | | | | 140,462 | |
| | | 2,162 | | Chevron Corp. | | | | | | | 246,144 | |
| | | 2,195 | | Exxon Mobil Corp. | | | | | | | 155,340 | |
| | | 1,804 | | Hess Corp. | | | | | | | 100,772 | |
| | | | | | | | | | | | 642,718 | |
| | | | | Packaging & Containers - 0.1% | | | | | | | | |
| | | 4,786 | | Ball Corp. | | | | | | | 293,813 | |
| | | 2,065 | | Sealed Air Corp. | | | | | | | 86,523 | |
| | | | | | | | | | | | 380,336 | |
| | | | | Pharmaceuticals - 0.1% | | | | | | | | |
| | | 1,001 | | Eli Lilly & Co. | | | | | | | 116,056 | |
| | | 3,839 | | Merck & Co., Inc. | | | | | | | 304,087 | |
| | | 1,954 | | Zoetis, Inc., Class A | | | | | | | 197,452 | |
| | | | | | | | | | | | 617,595 | |
| | | | | Pipelines - 0.2% | | | | | | | | |
| | | 17,333 | | Kinder Morgan, Inc. | | | | | | | 345,793 | |
| | | 3,217 | | ONEOK, Inc. | | | | | | | 204,666 | |
| | | 9,417 | | Williams Cos., Inc. | | | | | | | 248,420 | |
| | | | | | | | | | | | 798,879 | |
| | | | | Real Estate Investment Trusts - 0.4% | | | | | | | | |
| | | 825 | | Alexandria Real Estate Equities, Inc. | | | | | | | 120,788 | |
| | | 1,991 | | American Tower Corp. | | | | | | | 415,661 | |
| | | 2,026 | | Crown Castle International Corp. | | | | | | | 263,400 | |
| | | 553 | | Equinix, Inc. | | | | | | | 268,642 | |
| | | 1,027 | | Equity Residential | | | | | | | 78,637 | |
| | | 512 | | Essex Property Trust, Inc. | | | | | | | 149,371 | |
| | | 792 | | Mid-America Apartment Communities, Inc. | | | | | | | 90,431 | |
| | | 1,287 | | SBA Communications Corp. (a) | | | | | | | 278,520 | |
| | | 2,459 | | Welltower, Inc. | | | | | | | 199,720 | |
| | | | | | | | | | | | 1,865,170 | |
| | | | | Retail - 0.4% | | | | | | | | |
| | | 2,035 | | CarMax, Inc. (a) | | | | | | | 159,300 | |
| | | 389 | | Chipotle Mexican Grill, Inc. (a) | | | | | | | 256,728 | |
| | | 1,558 | | Darden Restaurants, Inc. | | | | | | | 181,227 | |
See accompanying notes to financial statements.
11
Horizon Active Asset Allocation Fund
PORTFOLIO OF INVESTMENTS (Unaudited) (Continued)
May 31, 2019 |
| |
Shares
| | | | | | | | Value | |
| | | 1,273 | | Dollar General Corp. | | | | | | $ | 162,028 | |
| | | 1,316 | | Dollar Tree, Inc. (a) | | | | | | | 133,692 | |
| | | 1,591 | | McDonald’s Corp. | | | | | | | 315,448 | |
| | | 4,632 | | Starbucks Corp. | | | | | | | 352,310 | |
| | | 2,890 | | TJX Cos., Inc. | | | | | | | 145,338 | |
| | | 1,881 | | Tractor Supply Co. | | | | | | | 189,567 | |
| | | 2,521 | | Yum! Brands, Inc. | | | | | | | 258,024 | |
| | | | | | | | | | | | 2,153,662 | |
| | | | | Semiconductors - 0.1% | | | | | | | | |
| | | 7,468 | | Advanced Micro Devices, Inc. (a) | | | | | | | 204,698 | |
| | | 3,689 | | QUALCOMM, Inc. | | | | | | | 246,499 | |
| | | 1,279 | | Xilinx, Inc. | | | | | | | 130,854 | |
| | | | | | | | | | | | 582,051 | |
| | | | | Software - 0.3% | | | | | | | | |
| | | 4,270 | | Cadence Design Systems, Inc. (a) | | | | | | | 271,444 | |
| | | 3,118 | | Cerner Corp. | | | | | | | 218,167 | |
| | | 702 | | Intuit, Inc. | | | | | | | 171,885 | |
| | | 1,218 | | MSCI, Inc. | | | | | | | 267,972 | |
| | | 3,014 | | Paychex, Inc. | | | | | | | 258,571 | |
| | | 1,712 | | Synopsys, Inc. (a) | | | | | | | 199,345 | |
| | | | | | | | | | | | 1,387,384 | |
| | | | | Telecommunications - 0.1% | | | | | | | | |
| | | 2,855 | | Cisco Systems, Inc. | | | | | | | 148,545 | |
| | | 1,002 | | Motorola Solutions, Inc. | | | | | | | 150,250 | |
| | | 2,765 | | Verizon Communications, Inc. | | | | | | | 150,278 | |
| | | | | | | | | | | | 449,073 | |
| | | | | Transportation - 0.1% | | | | | | | | |
| | | 821 | | Kansas City Southern | | | | | | | 93,003 | |
| | | 1,419 | | Norfolk Southern Corp. | | | | | | | 276,904 | |
| | | 1,334 | | Union Pacific Corp. | | | | | | | 222,484 | |
| | | | | | | | | | | | 592,391 | |
| | | | | Water - 0.1% | | | | | | | | |
| | | 2,429 | | American Water Works Co., Inc. | | | | | | | 274,525 | |
| | | | | | | | | | | | | |
| | | | | TOTAL COMMON STOCKS (Cost - $26,140,574) | | | | | | | 25,742,481 | |
| | | | | | | | | | | | | |
| |
Contracts
| | | | Notional
Amount | | | | | |
| | | | | PURCHASED OPTIONS - 0.8% (c) | | | | | | | | |
| | | | | PURCHASED CALL OPTIONS - 0.2% | | | | | | | | |
| | | | | Communication Services Select Sector SPDR Fund (a) | | | | | | | | |
| | | 4,000 | | Expiration: June 2019, Exercise Price: $52 | | $ | 18,836,000 | | | | 10,000 | |
| | | | | Deutsche Bank AG (a) | | | | | | | | |
| | | 4,000 | | Expiration: July 2019, Exercise Price: $12 | | | 2,708,000 | | | | 4,000 | |
See accompanying notes to financial statements.
12
Horizon Active Asset Allocation Fund
PORTFOLIO OF INVESTMENTS (Unaudited) (Continued)
May 31, 2019 |
| |
Contracts
| | | | Notional
Amount | | |
Value
| |
| | | | | iPath Series B S&P 500 VIX Short-Term Futures ETN (a)(g) | | | | | | | | |
| | | 2,000 | | Expiration: July 2019, Exercise Price: $36 | | $ | 6,084,000 | | | $ | 347,000 | |
| | | | | iShares China Large-Cap ETF (a) | | | | | | | | |
| | | 7,500 | | Expiration: June 2019, Exercise Price: $42 | | | 30,277,500 | | | | 135,000 | |
| | | 2,000 | | Expiration: July 2019, Exercise Price: $42 | | | 8,074,000 | | | | 100,000 | |
| | | 2,000 | | Expiration: July 2019, Exercise Price: $43 | | | 8,074,000 | | | | 57,000 | |
| | | | | iShares MSCI Emerging Markets ETF (a) | | | | | | | | |
| | | 6,000 | | Expiration: June 2019, Exercise Price: $46.50 | | | 24,426,000 | | | | 27,000 | |
| | | 10,000 | | Expiration: June 2019, Exercise Price: $47.50 | | | 40,710,000 | | | | 5,000 | |
| | | 6,000 | | Expiration: September 2019, Exercise Price: $49 | | | 24,426,000 | | | | 21,000 | |
| | | | | iShares Russell 2000 ETF (a) | | | | | | | | |
| | | 2,500 | | Expiration: June 2019, Exercise Price: $167 | | | 36,465,000 | | | | 3,750 | |
| | | | | S&P 500 Index (a) | | | | | | | | |
| | | 1,100 | | Expiration: June 2019, Exercise Price: $3,100 | | | 302,726,600 | | | | 2,750 | |
| | | | | SPDR S&P 500 ETF Trust (a)(g) | | | | | | | | |
| | | 2,000 | | Expiration: June 2019, Exercise Price: $284 | | | 55,054,000 | | | | 197,000 | |
| | | 2,000 | | Expiration: June 2019, Exercise Price: $289 | | | 55,054,000 | | | | 47,000 | |
| | | | | SPDR S&P Homebuilders ETF (a) | | | | | | | | |
| | | 3,000 | | Expiration: July 2019, Exercise Price: $41 | | | 11,508,000 | | | | 57,000 | |
| | | | | Technology Select Sector SPDR Fund (a) | | | | | | | | |
| | | 7,000 | | Expiration: June 2019, Exercise Price: $80 | | | 50,323,000 | | | | 28,000 | |
| | | | | TOTAL PURCHASED CALL OPTIONS (Cost - $5,088,448) | | | | | | | 1,041,500 | |
| | | | | | | | | | | | | |
| | | | | PURCHASED PUT OPTIONS - 0.6% | | | | | | | | |
| | | | | CBOE Volatility Index (a)(g) | | | | | | | | |
| | | 3,000 | | Expiration: June 2019, Exercise Price $16 | | | 5,613,000 | | | | 172,500 | |
| | | | | Communication Services Select Sector SPDR Fund (a)(g) | | | | | | | | |
| | | 992 | | Expiration: June 2019, Exercise Price: $44 | | | 4,671,328 | | | | 22,320 | |
| | | | | Consumer Discretionary Select Sector SPDR Fund (a)(g) | | | | | | | | |
| | | 1,500 | | Expiration: June 2019, Exercise Price: $106 | | | 16,641,000 | | | | 102,000 | |
| | | | | Invesco QQQ Trust Series 1 (a)(g) | | | | | | | | |
| | | 3,000 | | Expiration: July 2019, Exercise Price: $172 | | | 52,185,000 | | | | 1,206,000 | |
| | | | | iShares China Large-Cap ETF (a) | | | | | | | | |
| | | 3,000 | | Expiration: June 2019, Exercise Price: $39.50 | | | 12,111,000 | | | | 51,000 | |
| | | 3,000 | | Expiration: June 2019, Exercise Price: $40 | | | 12,111,000 | | | | 88,500 | |
| | | | | iShares MSCI Emerging Markets ETF (a)(g) | | | | | | | | |
| | | 10,000 | | Expiration: July 2019, Exercise Price: $38 | | | 40,710,000 | | | | 410,000 | |
| | | | | iShares MSCI Mexico ETF (a) | | | | | | | | |
| | | 8,000 | | Expiration: June 2019, Exercise Price: $41.50 | | | 34,336,000 | | | | 248,000 | |
| | | | | SPDR S&P 500 ETF Trust (a)(g) | | | | | | | | |
| | | 1,500 | | Expiration: June 2019, Exercise Price: $270 | | | 41,290,500 | | | | 160,500 | |
See accompanying notes to financial statements.
13
Horizon Active Asset Allocation Fund
PORTFOLIO OF INVESTMENTS (Unaudited) (Continued)
May 31, 2019 |
| |
Contracts
| | | | Notional
Amount | | |
Value
| |
| | | | | Utilities Select Sector SPDR Fund (a) | | | | | | | | |
| | | 4,700 | | Expiration: July 2019, Exercise Price: $57 | | $ | 27,377,500 | | | $ | 357,200 | |
| | | | | TOTAL PURCHASED PUT OPTIONS (Cost - $3,092,957) | | | | | | | 2,818,020 | |
| | | | | | | | | | | | | |
| | | | | TOTAL PURCHASED OPTIONS (Cost - $8,181,405) | | | | | | | 3,859,520 | |
| | | | | | | | | | | | | |
| | Shares | | | | | | | | | | |
| | | | | SHORT-TERM INVESTMENTS - 0.1% | | | | | | | | |
| | | | | Money Market Funds - 0.1% | | | | | | | | |
| | | 428,525 | | First American Treasury Obligations Fund, Class X, 2.30% (d) | | | | | | | 428,525 | |
| | | | | TOTAL SHORT-TERM INVESTMENTS (Cost - $428,525) | | | | | | | 428,525 | |
| | | | | | | | | | | | | |
| | | | | INVESTMENTS PURCHASED WITH PROCEEDS FROM SECURITIES LENDING - 13.9% | | | | | | | | |
| | | | | Money Market Funds - 13.9% | | | | | | | | |
| | | 70,882,042 | | First American Government Obligations Fund, Class Z, 2.26% (d) | | | | | | | 70,882,042 | |
| | | | | TOTAL INVESTMENTS PURCHASED WITH PROCEEDS FROM SECURITIES LENDING (Cost - $70,882,042) | | | | | | | 70,882,042 | |
| | | | | | | | | | | | | |
| | | | | TOTAL INVESTMENTS - 113.5% (Cost - $595,638,907) | | | | | | | 579,777,223 | |
| | | | | Liabilities in Excess of Other Assets - (13.5)% | | | | | | | (68,734,021 | ) |
| | | | | NET ASSETS - 100.0% | | | | | | $ | 511,043,202 | |
| | | | | | | | | | | | | |
| | Contracts | | | | | | | | | | |
| | | | | SCHEDULE OF WRITTEN OPTIONS - (0.5)% (c) | | | | | | | | |
| | | | | SCHEDULE OF WRITTEN CALL OPTIONS - (0.1)% | | | | | | | | |
| | | | | iPath Series B S&P 500 VIX Short-Term Futures ETN (a) | | | | | | | | |
| | | 2,000 | | Expiration: June 2019, Exercise Price $36 | | | 6,084,000 | | | | 208,000 | |
| | | | | SPDR S&P 500 ETF Trust (a) | | | | | | | | |
| | | 1,500 | | Expiration: June 2019, Exercise Price $280 | | | 41,290,500 | | | | 142,500 | |
| | | 4,000 | | Expiration: June 2019, Exercise Price $288 | | | 110,108,000 | | | | 128,000 | |
| | | | | TOTAL WRITTEN CALL OPTIONS (Premiums Received - $1,059,892) | | | | | | | 478,500 | |
| | | | | | | | | | | | | |
See accompanying notes to financial statements.
14
Horizon Active Asset Allocation Fund
PORTFOLIO OF INVESTMENTS (Unaudited) (Continued)
May 31, 2019 |
| |
Contracts
| | | | Notional
Amount | | |
Value
| |
| | | | | SCHEDULE OF WRITTEN PUT OPTIONS - (0.4)% | | | | | | | | |
| | | | | CBOE Volatility Index (a) | | | | | | | | |
| | | 1,000 | | Expiration: June 2019, Exercise Price $14.50 | | $ | 1,871,000 | | | $ | 17,500 | |
| | | | | Communication Services Select Sector SPDR Fund (a) | | | | | | | | |
| | | 1,000 | | Expiration: June 2019, Exercise Price $43 | | | 4,709,000 | | | | 15,000 | |
| | | | | Consumer Discretionary Select Sector SPDR Fund (a) | | | | | | | | |
| | | 1,500 | | Expiration: June 2019, Exercise Price $104 | | | 16,641,000 | | | | 57,000 | |
| | | | | Invesco QQQ Trust Series 1 (a) | | | | | | | | |
| | | 4,500 | | Expiration: July 2019, Exercise Price $166 | | | 78,277,500 | | | | 985,500 | |
| | | | | iShares MSCI Emerging Markets ETF (a) | | | | | | | | |
| | | 10,000 | | Expiration: June 2019, Exercise Price $38 | | | 40,710,000 | | | | 235,000 | |
| | | | | SPDR S&P 500 ETF Trust (a) | | | | | | | | |
| | | 1,000 | | Expiration: July 2019, Exercise Price $270 | | | 27,527,000 | | | | 505,500 | |
| | | | | TOTAL WRITTEN PUT OPTIONS (Premiums Received - $1,695,375) | | | | | | | 1,815,500 | |
| | | | | | | | | | | | | |
| | | | | TOTAL WRITTEN OPTIONS (Premiums Received - $2,755,267) | | | | | | $ | 2,294,000 | |
Percentages are stated as a percent of net assets.
(a) | Non-income producing security. |
(c) | Each Option is exercisable into 100 shares of the underlying security. |
(d) | Money Market Fund; interest rate reflects seven-day yield on May 31, 2019. |
(e) | All or a portion of the security is segregated as collateral for written options. The value of the securities segregated as collateral for written options is $64,120,000. |
(f) | All or a portion of this security is out on loan as of May 31, 2019. |
(g) | Held in connection with a written option, see Schedule of Written Options for more details. |
(h) | Affiliated Security. Please refer to Note 9 of the Notes to Financial Statements. |
See accompanying notes to financial statements.
15
Horizon Active Risk Assist® Fund
PORTFOLIO OF INVESTMENTS (Unaudited)
May 31, 2019 |
| |
Shares
| | | | | | | | Value | |
| | | | | INVESTMENT COMPANIES - 84.5% | | | | | | | | |
| | | | | Exchange Traded Funds - 84.5% | | | | | | | | |
| | | 298,289 | | Invesco QQQ Trust Series 1 (f) | | | | | | $ | 51,887,372 | |
| | | 1,451,161 | | Invesco S&P SmallCap Low Volatility ETF (f) | | | | | | | 66,927,545 | |
| | | 2,549,462 | | iShares China Large-Cap ETF (f) | | | | | | | 102,921,781 | |
| | | 2,681,009 | | iShares Core Dividend Growth ETF (f) | | | | | | | 96,328,654 | |
| | | 267,032 | | iShares Edge MSCI USA Momentum Factor ETF | | | | | | | 29,958,320 | |
| | | 691,130 | | iShares Edge MSCI USA Quality Factor ETF (f) | | | | | | | 59,340,422 | |
| | | 945,655 | | SPDR Bloomberg Barclays 1-3 Month T-Bill ETF | | | | | | | 86,640,911 | |
| | | 3,139,728 | | SPDR Portfolio S&P 500 Growth ETF | | | | | | | 115,039,634 | |
| | | 1,780,173 | | SPDR Portfolio S&P 500 Value ETF (e) | | | | | | | 51,838,638 | |
| | | 290,919 | | X-Trackers Harvest CSI 300 China A-Shares ETF (f) | | | | | | | 7,598,804 | |
| | | 121,276 | | X-Trackers MSCI All China Equity ETF | | | | | | | 3,764,031 | |
| | | 1,051,629 | | X-Trackers Russell 1000 Comprehensive Factor ETF (h) | | | | | | | 33,504,900 | |
| | | 876,246 | | X-Trackers Russell 1000 US QARP ETF (h) | | | | | | | 22,204,073 | |
| | | | | TOTAL EXCHANGE TRADED FUNDS (Cost - $746,482,506) | | | | | | | 727,955,085 | |
| | | | | | | | | | | | | |
| | | | | COMMON STOCKS - 13.8% | | | | | | | | |
| | | | | Advertising - 0.1% | | | | | | | | |
| | | 31,166 | | Interpublic Group of Cos., Inc. | | | | | | | 661,343 | |
| | | 4,517 | | Omnicom Group, Inc. | | | | | | | 349,435 | |
| | | | | | | | | | | | 1,010,778 | |
| | | | | Aerospace/Defense - 0.2% | | | | | | | | |
| | | 14,202 | | Arconic, Inc. | | | | | | | 311,024 | |
| | | 370 | | General Dynamics Corp. | | | | | | | 59,503 | |
| | | 2,251 | | Harris Corp. | | | | | | | 421,365 | |
| | | 205 | | Northrop Grumman Corp. | | | | | | | 62,166 | |
| | | 348 | | Raytheon Co. | | | | | | | 60,726 | |
| | | 1,130 | | TransDigm Group, Inc. (a) | | | | | | | 498,274 | |
| | | | | | | | | | | | 1,413,058 | |
| | | | | Agriculture - 0.0% (b) | | | | | | | | |
| | | 3,234 | | Archer-Daniels-Midland Co. | | | | | | | 123,927 | |
| | | | | | | | | | | | | |
| | | | | Airlines - 0.1% | | | | | | | | |
| | | 6,804 | | Alaska Air Group, Inc. | | | | | | | 395,993 | |
| | | 6,438 | | American Airlines Group, Inc. | | | | | | | 175,307 | |
| | | 1,534 | | Delta Air Lines, Inc. | | | | | | | 79,001 | |
| | | 1,704 | | United Continental Holdings, Inc. (a) | | | | | | | 132,315 | |
| | | | | | | | | | | | 782,616 | |
| | | | | Apparel - 0.2% | | | | | | | | |
| | | 11,392 | | Capri Holdings Ltd. (a) | | | | | | | 370,012 | |
| | | 30,057 | | Hanesbrands, Inc. | | | | | | | 446,346 | |
| | | 129 | | Kontoor Brands, Inc. (a) | | | | | | | 3,776 | |
| | | 2,968 | | PVH Corp. | | | | | | | 252,844 | |
See accompanying notes to financial statements.
16
Horizon Active Risk Assist® Fund
PORTFOLIO OF INVESTMENTS (Unaudited) (Continued)
May 31, 2019 |
| |
Shares
| | | | | | | | Value | |
| | | 2,766 | | Ralph Lauren Corp., Class A | | | | | | $ | 290,790 | |
| | | 15,164 | | Under Armour, Inc., Class A (a) | | | | | | | 345,739 | |
| | | 902 | | VF Corp. | | | | | | | 73,856 | |
| | | | | | | | | | | | 1,783,363 | |
| | | | | Auto Manufacturers - 0.0% (b) | | | | | | | | |
| | | 7,072 | | Ford Motor Co. | | | | | | | 67,325 | |
| | | 1,907 | | PACCAR, Inc. | | | | | | | 125,519 | |
| | | | | | | | | | | | 192,844 | |
| | | | | Auto Parts & Equipment - 0.1% | | | | | | | | |
| | | 2,019 | | Aptiv PLC | | | | | | | 129,297 | |
| | | 10,217 | | BorgWarner, Inc. | | | | | | | 362,499 | |
| | | | | | | | | | | | 491,796 | |
| | | | | Banks - 0.3% | | | | | | | | |
| | | 1,449 | | Bank of New York Mellon Corp. | | | | | | | 61,858 | |
| | | 1,700 | | BB&T Corp. | | | | | | | 79,475 | |
| | | 827 | | Capital One Financial Corp. | | | | | | | 71,014 | |
| | | 5,425 | | Citizens Financial Group, Inc. | | | | | | | 176,746 | |
| | | 3,552 | | Comerica, Inc. | | | | | | | 244,449 | |
| | | 5,494 | | Fifth Third Bancorp | | | | | | | 145,591 | |
| | | 16,598 | | Huntington Bancshares, Inc. | | | | | | | 209,965 | |
| | | 10,647 | | KeyCorp | | | | | | | 170,032 | |
| | | 838 | | M&T Bank Corp. | | | | | | | 133,745 | |
| | | 1,561 | | Northern Trust Corp. | | | | | | | 133,497 | |
| | | 14,143 | | Regions Financial Corp. | | | | | | | 195,598 | |
| | | 2,047 | | State Street Corp. | | | | | | | 113,097 | |
| | | 1,021 | | SVB Financial Group (a) | | | | | | | 205,629 | |
| | | 7,580 | | Zions Bancorp NA | | | | | | | 326,471 | |
| | | | | | | | | | | | 2,267,167 | |
| | | | | Beverages - 0.1% | | | | | | | | |
| | | 394 | | Constellation Brands, Inc., Class A | | | | | | | 69,522 | |
| | | 4,243 | | Molson Coors Brewing Co., Class B | | | | | | | 233,280 | |
| | | 1,463 | | Monster Beverage Corp. (a) | | | | | | | 90,501 | |
| | | 2,382 | | PepsiCo, Inc. | | | | | | | 304,896 | |
| | | | | | | | | | | | 698,199 | |
| | | | | Biotechnology - 0.1% | | | | | | | | |
| | | 829 | | Alexion Pharmaceuticals, Inc. (a) | | | | | | | 94,241 | |
| | | 314 | | Biogen, Inc. (a) | | | | | | | 68,857 | |
| | | 222 | | Illumina, Inc. (a) | | | | | | | 68,134 | |
| | | 5,330 | | Incyte Corp. (a) | | | | | | | 419,098 | |
| | | 300 | | Regeneron Pharmaceuticals, Inc. (a) | | | | | | | 90,516 | |
| | | 436 | | Vertex Pharmaceuticals, Inc. (a) | | | | | | | 72,454 | |
| | | | | | | | | | | | 813,300 | |
See accompanying notes to financial statements.
17
Horizon Active Risk Assist® Fund
PORTFOLIO OF INVESTMENTS (Unaudited) (Continued)
May 31, 2019 |
| |
Shares
| | | | | | | | Value | |
| | | | | Building Materials - 0.2% | | | | | | | | |
| | | 7,858 | | Fortune Brands Home & Security, Inc. | | | | | | $ | 377,656 | |
| | | 2,229 | | Johnson Controls International PLC | | | | | | | 85,861 | |
| | | 1,546 | | Martin Marietta Materials, Inc. | | | | | | | 325,433 | |
| | | 7,545 | | Masco Corp. | | | | | | | 263,471 | |
| | | 2,916 | | Vulcan Materials Co. | | | | | | | 364,238 | |
| | | | | | | | | | | | 1,416,659 | |
| | | | | Chemicals - 0.4% | | | | | | | | |
| | | 2,318 | | Air Products & Chemicals, Inc. | | | | | | | 471,922 | |
| | | 5,844 | | Albemarle Corp. | | | | | | | 369,925 | |
| | | 2,375 | | Celanese Corp. | | | | | | | 225,459 | |
| | | 8,297 | | CF Industries Holdings, Inc. | | | | | | | 333,871 | |
| | | 1,507 | | Dow, Inc. | | | | | | | 70,467 | |
| | | 1,864 | | DowDuPont, Inc. | | | | | | | 56,889 | |
| | | 4,058 | | Eastman Chemical Co. | | | | | | | 263,446 | |
| | | 3,953 | | FMC Corp. | | | | | | | 290,348 | |
| | | 1,488 | | International Flavors & Fragrances, Inc. | | | | | | | 201,505 | |
| | | 2,284 | | Linde PLC | | | | | | | 412,376 | |
| | | 1,263 | | LyondellBasell Industries NV, Class A | | | | | | | 93,778 | |
| | | 14,824 | | Mosaic Co. | | | | | | | 318,271 | |
| | | 1,052 | | PPG Industries, Inc. | | | | | | | 110,092 | |
| | | 176 | | Sherwin-Williams Co. | | | | | | | 73,823 | |
| | | | | | | | | | | | 3,292,172 | |
| | | | | Commercial Services - 0.9% | | | | | | | | |
| | | 412 | | Automatic Data Processing, Inc. | | | | | | | 65,969 | |
| | | 1,687 | | Cintas Corp. | | | | | | | 374,227 | |
| | | 2,328 | | Ecolab, Inc. | | | | | | | 428,561 | |
| | | 2,568 | | Equifax, Inc. | | | | | | | 310,471 | |
| | | 2,023 | | FleetCor Technologies, Inc. (a) | | | | | | | 522,359 | |
| | | 2,182 | | Gartner, Inc. (a) | | | | | | | 330,137 | |
| | | 3,382 | | Global Payments, Inc. | | | | | | | 520,963 | |
| | | 19,696 | | H&R Block, Inc. | | | | | | | 517,020 | |
| | | 2,492 | | IHS Markit Ltd. (a) | | | | | | | 143,016 | |
| | | 1,616 | | Moody’s Corp. | | | | | | | 295,534 | |
| | | 15,036 | | Nielsen Holdings PLC | | | | | | | 341,768 | |
| | | 3,497 | | PayPal Holdings, Inc. (a) | | | | | | | 383,796 | |
| | | 16,489 | | Quanta Services, Inc. | | | | | | | 573,158 | |
| | | 8,206 | | Robert Half International, Inc. | | | | | | | 440,334 | |
| | | 7,239 | | Rollins, Inc. | | | | | | | 271,969 | |
| | | 1,607 | | S&P Global, Inc. | | | | | | | 343,705 | |
| | | 2,630 | | Total System Services, Inc. | | | | | | | 324,884 | |
| | | 2,367 | | United Rentals, Inc. (a) | | | | | | | 260,607 | |
| | | 3,012 | | Verisk Analytics, Inc. | | | | | | | 421,680 | |
| | | 28,482 | | Western Union Co. | | | | | | | 552,551 | |
| | | | | | | | | | | | 7,422,709 | |
See accompanying notes to financial statements.
18
Horizon Active Risk Assist® Fund
PORTFOLIO OF INVESTMENTS (Unaudited) (Continued)
May 31, 2019 |
| |
Shares
| | | | | | | | Value | |
| | | | | Computers - 0.2% | | | | | | | | |
| | | 2,350 | | Cognizant Technology Solutions Corp., Class A | | | | | | $ | 145,536 | |
| | | 5,112 | | DXC Technology Co. | | | | | | | 243,024 | |
| | | 4,012 | | Fortinet, Inc. (a) | | | | | | | 290,790 | |
| | | 15,896 | | Hewlett Packard Enterprise Co. | | | | | | | 218,093 | |
| | | 8,512 | | HP, Inc. | | | | | | | 159,004 | |
| | | 4,022 | | NetApp, Inc. | | | | | | | 238,102 | |
| | | 7,847 | | Seagate Technology PLC | | | | | | | 328,397 | |
| | | 7,718 | | Western Digital Corp. | | | | | | | 287,264 | |
| | | | | | | | | | | | 1,910,210 | |
| | | | | Cosmetics/Personal Care - 0.1% | | | | | | | | |
| | | 5,584 | | Procter & Gamble Co. | | | | | | | 574,649 | |
| | | | | | | | | | | | | |
| | | | | Distribution/Wholesale - 0.1% | | | | | | | | |
| | | 7,737 | | Copart, Inc. (a) | | | | | | | 553,041 | |
| | | 5,196 | | Fastenal Co. | | | | | | | 158,946 | |
| | | 12,790 | | LKQ Corp. (a) | | | | | | | 328,063 | |
| | | 809 | | WW Grainger, Inc. | | | | | | | 211,707 | |
| | | | | | | | | | | | 1,251,757 | |
| | | | | Diversified Financial Services - 0.5% | | | | | | | | |
| | | 7,086 | | Affiliated Managers Group, Inc. | | | | | | | 593,949 | |
| | | 4,080 | | Alliance Data Systems Corp. | | | | | | | 561,000 | |
| | | 1,551 | | American Express Co. | | | | | | | 177,915 | |
| | | 1,139 | | Ameriprise Financial, Inc. | | | | | | | 157,444 | |
| | | 2,582 | | CBOE Global Markets, Inc. | | | | | | | 280,250 | |
| | | 1,573 | | Discover Financial Services | | | | | | | 117,267 | |
| | | 5,339 | | E*TRADE Financial Corp. | | | | | | | 239,187 | |
| | | 5,410 | | Franklin Resources, Inc. | | | | | | | 172,146 | |
| | | 838 | | Intercontinental Exchange, Inc. | | | | | | | 68,892 | |
| | | 17,986 | | Invesco, Ltd. | | | | | | | 351,447 | |
| | | 28,233 | | Jefferies Financial Group, Inc. | | | | | | | 498,877 | |
| | | 1,068 | | MasterCard, Inc., Class A | | | | | | | 268,591 | |
| | | 2,236 | | Nasdaq, Inc. | | | | | | | 202,671 | |
| | | 3,014 | | Raymond James Financial, Inc. | | | | | | | 248,896 | |
| | | 8,952 | | Synchrony Financial | | | | | | | 301,056 | |
| | | 1,217 | | T. Rowe Price Group, Inc. | | | | | | | 123,088 | |
| | | | | | | | | | | | 4,362,676 | |
| | | | | Electric - 0.7% | | | | | | | | |
| | | 17,744 | | AES Corp. | | | | | | | 280,355 | |
| | | 5,823 | | Alliant Energy Corp. | | | | | | | 276,360 | |
| | | 2,317 | | Ameren Corp. | | | | | | | 169,929 | |
| | | 3,803 | | American Electric Power Co., Inc. | | | | | | | 327,514 | |
| | | 6,952 | | CenterPoint Energy, Inc. | | | | | | | 197,715 | |
| | | 3,498 | | CMS Energy Corp. | | | | | | | 196,273 | |
See accompanying notes to financial statements.
19
Horizon Active Risk Assist® Fund
PORTFOLIO OF INVESTMENTS (Unaudited) (Continued)
May 31, 2019 |
| |
Shares
| | | | | | | | Value | |
| | | 1,280 | | Consolidated Edison, Inc. | | | | | | $ | 110,464 | |
| | | 751 | | Dominion Energy, Inc. | | | | | | | 56,460 | |
| | | 1,058 | | DTE Energy Co. | | | | | | | 132,747 | |
| | | 649 | | Duke Energy Corp. | | | | | | | 55,561 | |
| | | 2,670 | | Edison International | | | | | | | 158,518 | |
| | | 4,718 | | Entergy Corp. | | | | | | | 457,976 | |
| | | 3,759 | | Evergy, Inc. | | | | | | | 218,548 | |
| | | 1,865 | | Eversource Energy | | | | | | | 137,712 | |
| | | 1,313 | | Exelon Corp. | | | | | | | 63,129 | |
| | | 6,513 | | FirstEnergy Corp. | | | | | | | 268,596 | |
| | | 290 | | NextEra Energy, Inc. | | | | | | | 57,481 | |
| | | 8,603 | | NRG Energy, Inc. | | | | | | | 292,846 | |
| | | 3,043 | | Pinnacle West Capital Corp. | | | | | | | 285,768 | |
| | | 4,438 | | PPL Corp. | | | | | | | 132,075 | |
| | | 1,731 | | Public Service Enterprise Group, Inc. | | | | | | | 101,714 | |
| | | 3,601 | | Sempra Energy | | | | | | | 473,351 | |
| | | 9,082 | | Southern Co. | | | | | | | 485,887 | |
| | | 3,786 | | WEC Energy Group, Inc. | | | | | | | 304,962 | |
| | | 6,612 | | Xcel Energy, Inc. | | | | | | | 379,132 | |
| | | | | | | | | | | | 5,621,073 | |
| | | | | Electrical Components & Equipment - 0.0% (b) | | | | | | | | |
| | | 3,286 | | AMETEK, Inc. | | | | | | | 269,090 | |
| | | 1,165 | | Emerson Electric Co. | | | | | | | 70,180 | |
| | | | | | | | | | | | 339,270 | |
| | | | | Electronics - 0.5% | | | | | | | | |
| | | 1,691 | | Agilent Technologies, Inc. | | | | | | | 113,382 | |
| | | 4,453 | | Allegion PLC | | | | | | | 432,164 | |
| | | 1,745 | | Amphenol Corp., Class A | | | | | | | 151,815 | |
| | | 6,317 | | Corning, Inc. | | | | | | | 182,182 | |
| | | 13,207 | | FLIR Systems, Inc. | | | | | | | 638,294 | |
| | | 1,388 | | Fortive Corp. | | | | | | | 105,696 | |
| | | 6,610 | | Garmin Ltd. | | | | | | | 505,533 | |
| | | 1,727 | | Honeywell International, Inc. | | | | | | | 283,763 | |
| | | 7,775 | | Keysight Technologies, Inc. (a) | | | | | | | 584,136 | |
| | | 719 | | Mettler-Toledo International, Inc. (a) | | | | | | | 519,902 | |
| | | 3,419 | | PerkinElmer, Inc. | | | | | | | 295,196 | |
| | | 1,681 | | TE Connectivity Ltd. | | | | | | | 141,591 | |
| | | 981 | | Waters Corp. (a) | | | | | | | 196,896 | |
| | | | | | | | | | | | 4,150,550 | |
| | | | | Engineering & Construction - 0.1% | | | | | | | | |
| | | 24,204 | | Fluor Corp. | | | | | | | 670,935 | |
| | | 5,640 | | Jacobs Engineering Group, Inc. | | | | | | | 424,635 | |
| | | | | | | | | | | | 1,095,570 | |
See accompanying notes to financial statements.
20
Horizon Active Risk Assist® Fund
PORTFOLIO OF INVESTMENTS (Unaudited) (Continued)
May 31, 2019 |
| |
Shares
| | | | | | | | Value | |
| | | | | Environmental Control - 0.2% | | | | | | | | |
| | | 13,033 | | Pentair PLC | | | | | | $ | 453,809 | |
| | | 4,143 | | Republic Services, Inc. | | | | | | | 350,456 | |
| | | 4,400 | | Waste Management, Inc. | | | | | | | 481,140 | |
| | | | | | | | | | | | 1,285,405 | |
| | | | | Finance and Insurance - 0.0% (b) | | | | | | | | |
| | | 1,843 | | First Republic Bank | | | | | | | 178,808 | |
| | | | | | | | | | | | | |
| | | | | Food - 0.4% | | | | | | | | |
| | | 7,902 | | Conagra Brands, Inc. | | | | | | | 211,536 | |
| | | 7,930 | | General Mills, Inc. | | | | | | | 392,059 | |
| | | 4,129 | | Hershey Co. | | | | | | | 544,863 | |
| | | 3,698 | | Hormel Foods Corp. | | | | | | | 146,034 | |
| | | 1,714 | | J.M. Smucker Co. | | | | | | | 208,354 | |
| | | 2,739 | | Kellogg Co. | | | | | | | 143,962 | |
| | | 2,446 | | Kraft Heinz Co. | | | | | | | 67,632 | |
| | | 4,700 | | Lamb Weston Holdings, Inc. | | | | | | | 278,475 | |
| | | 9,394 | | Mondelez International, Inc., Class A | | | | | | | 477,685 | |
| | | 3,355 | | Sysco Corp. | | | | | | | 230,891 | |
| | | 4,162 | | Tyson Foods, Inc., Class A | | | | | | | 315,854 | |
| | | | | | | | | | | | 3,017,345 | |
| | | | | Forest Products & Paper - 0.0% (b) | | | | | | | | |
| | | 3,807 | | International Paper Co. | | | | | | | 157,876 | |
| | | | | | | | | | | | | |
| | | | | Gas - 0.1% | | | | | | | | |
| | | 2,547 | | Atmos Energy Corp. | | | | | | | 259,284 | |
| | | 10,481 | | NiSource, Inc. | | | | | | | 291,896 | |
| | | | | | | | | | | | 551,180 | |
| | | | | Hand/Machine Tools - 0.1% | | | | | | | | |
| | | 2,068 | | Snap-on, Inc. | | | | | | | 322,442 | |
| | | 1,071 | | Stanley Black & Decker, Inc. | | | | | | | 136,253 | |
| | | | | | | | | | | | 458,695 | |
| | | | | Healthcare Products - 0.5% | | | | | | | | |
| | | 2,872 | | Abbott Laboratories | | | | | | | 218,645 | |
| | | 1,056 | | ABIOMED, Inc. (a) | | | | | | | 276,588 | |
| | | 913 | | Align Technology, Inc. (a) | | | | | | | 259,612 | |
| | | 1,066 | | Baxter International, Inc. | | | | | | | 78,287 | |
| | | 1,138 | | Cooper Cos., Inc. | | | | | | | 338,885 | |
| | | 4,300 | | Danaher Corp. | | | | | | | 567,643 | |
| | | 9,409 | | Dentsply Sirona, Inc. | | | | | | | 506,863 | |
| | | 462 | | Edwards Lifesciences Corp. (a) | | | | | | | 78,864 | |
| | | 4,530 | | Henry Schein, Inc. (a) | | | | | | | 292,004 | |
| | | 5,240 | | Hologic, Inc. (a) | | | | | | | 230,612 | |
| | | 1,966 | | IDEXX Laboratories, Inc. (a) | | | | | | | 491,048 | |
See accompanying notes to financial statements.
21
Horizon Active Risk Assist® Fund
PORTFOLIO OF INVESTMENTS (Unaudited) (Continued)
May 31, 2019 |
| |
Shares
| | | | | | | | Value | |
| | | 1,735 | | ResMed, Inc. | | | | | | $ | 197,998 | |
| | | 754 | | Teleflex, Inc. | | | | | | | 217,378 | |
| | | 1,007 | | Thermo Fisher Scientific, Inc. | | | | | | | 268,849 | |
| | | 1,959 | | Varian Medical Systems, Inc. (a) | | | | | | | 247,343 | |
| | | 1,054 | | Zimmer Biomet Holdings, Inc. | | | | | | | 120,082 | |
| | | | | | | | | | | | 4,390,701 | |
| | | | | Healthcare Services - 0.2% | | | | | | | | |
| | | 2,528 | | Centene Corp. (a) | | | | | | | 145,992 | |
| | | 7,018 | | DaVita, Inc. (a) | | | | | | | 304,722 | |
| | | 602 | | HCA Healthcare, Inc. | | | | | | | 72,818 | |
| | | 403 | | Humana, Inc. | | | | | | | 98,679 | |
| | | 2,957 | | IQVIA Holdings, Inc. (a) | | | | | | | 401,708 | |
| | | 1,168 | | Laboratory Corp. of America Holdings (a) | | | | | | | 189,928 | |
| | | 2,417 | | Quest Diagnostics, Inc. | | | | | | | 231,814 | |
| | | 2,303 | | Universal Health Services, Inc., Class B | | | | | | | 275,324 | |
| | | | | | | | | | | | 1,720,985 | |
| | | | | Home Builders - 0.1% | | | | | | | | |
| | | 6,694 | | DR Horton, Inc. | | | | | | | 286,235 | |
| | | 3,478 | | Lennar Corp., Class A | | | | | | | 172,718 | |
| | | 14,110 | | PulteGroup, Inc. | | | | | | | 437,410 | |
| | | | | | | | | | | | 896,363 | |
| | | | | Home Furnishings - 0.1% | | | | | | | | |
| | | 15,729 | | Leggett & Platt, Inc. | | | | | | | 558,537 | |
| | | 2,735 | | Whirlpool Corp. | | | | | | | 314,197 | |
| | | | | | | | | | | | 872,734 | |
| | | | | Household Products/Wares - 0.1% | | | | | | | | |
| | | 3,331 | | Avery Dennison Corp. | | | | | | | 346,624 | |
| | | 5,553 | | Church & Dwight Co., Inc. | | | | | | | 413,199 | |
| | | 1,113 | | Clorox Co. | | | | | | | 165,625 | |
| | | 1,537 | | Kimberly-Clark Corp. | | | | | | | 196,567 | |
| | | | | | | | | | | | 1,122,015 | |
| | | | | Housewares - 0.0% (b) | | | | | | | | |
| | | 29,954 | | Newell Brands, Inc. (f) | | | | | | | 401,983 | |
| | | | | | | | | | | | | |
| | | | | Insurance - 0.7% | | | | | | | | |
| | | 8,950 | | Aflac, Inc. | | | | | | | 459,135 | |
| | | 1,025 | | Allstate Corp. | | | | | | | 97,898 | |
| | | 3,837 | | American International Group, Inc. | | | | | | | 195,956 | |
| | | 2,285 | | Aon PLC, Class A | | | | | | | 411,460 | |
| | | 5,920 | | Arthur J Gallagher & Co. | | | | | | | 498,464 | |
| | | 5,488 | | Assurant, Inc. | | | | | | | 548,580 | |
| | | 1,287 | | Chubb Ltd. | | | | | | | 187,992 | |
| | | 5,510 | | Cincinnati Financial Corp. | | | | | | | 541,302 | |
See accompanying notes to financial statements.
22
Horizon Active Risk Assist® Fund
PORTFOLIO OF INVESTMENTS (Unaudited) (Continued)
May 31, 2019 |
| |
Shares
| | | | | | | | Value | |
| | | 2,236 | | Everest Re Group Ltd. | | | | | | $ | 553,768 | |
| | | 6,021 | | Hartford Financial Services Group, Inc. | | | | | | | 317,066 | |
| | | 3,728 | | Lincoln National Corp. | | | | | | | 221,630 | |
| | | 3,919 | | Loews Corp. | | | | | | | 201,280 | |
| | | 3,814 | | Marsh & McLennan Cos., Inc. | | | | | | | 364,618 | |
| | | 1,449 | | MetLife, Inc. | | | | | | | 66,958 | |
| | | 3,607 | | Principal Financial Group, Inc. | | | | | | | 186,013 | |
| | | 6,354 | | Progressive Corp. | | | | | | | 503,745 | |
| | | 775 | | Prudential Financial, Inc. | | | | | | | 71,595 | |
| | | 3,682 | | Torchmark Corp. | | | | | | | 314,848 | |
| | | 2,213 | | Travelers Cos., Inc. | | | | | | | 322,146 | |
| | | 11,654 | | Unum Group | | | | | | | 366,984 | |
| | | | | | | | | | | | 6,431,438 | |
| | | | | Internet - 0.4% | | | | | | | | |
| | | 2,502 | | eBay, Inc. | | | | | | | 89,897 | |
| | | 1,419 | | Expedia Group, Inc. | | | | | | | 163,185 | |
| | | 3,610 | | F5 Networks, Inc. (a) | | | | | | | 476,809 | |
| | | 2,029 | | Facebook, Inc., Class A (a) | | | | | | | 360,087 | |
| | | 1,016 | | Netflix, Inc. (a) | | | | | | | 348,772 | |
| | | 20,330 | | TripAdvisor, Inc. (a) | | | | | | | 859,349 | |
| | | 5,706 | | Twitter, Inc. (a) | | | | | | | 207,927 | |
| | | 2,946 | | VeriSign, Inc. (a) | | | | | | | 574,411 | |
| | | | | | | | | | | | 3,080,437 | |
| | | | | Iron/Steel - 0.0% (b) | | | | | | | | |
| | | 3,266 | | Nucor Corp. | | | | | | | 156,768 | |
| | | | | | | | | | | | | |
| | | | | Leisure Time - 0.1% | | | | | | | | |
| | | 1,489 | | Carnival Corp. | | | | | | | 76,222 | |
| | | 15,124 | | Harley-Davidson, Inc. | | | | | | | 494,857 | |
| | | 4,267 | | Norwegian Cruise Line Holdings Ltd. (a) | | | | | | | 233,448 | |
| | | 916 | | Royal Caribbean Cruises Ltd. | | | | | | | 111,532 | |
| | | | | | | | | | | | 916,059 | |
| | | | | Lodging - 0.1% | | | | | | | | |
| | | 3,629 | | Hilton Worldwide Holdings, Inc. | | | | | | | 324,578 | |
| | | 527 | | Marriott International, Inc., Class A | | | | | | | 65,791 | |
| | | 8,468 | | MGM Resorts International | | | | | | | 210,176 | |
| | | 1,732 | | Wynn Resorts Ltd. | | | | | | | 185,895 | |
| | | | | | | | | | | | 786,440 | |
| | | | | Machinery - Diversified - 0.2% | | | | | | | | |
| | | 755 | | Cummins, Inc. | | | | | | | 113,824 | |
| | | 428 | | Deere & Co. | | | | | | | 59,992 | |
| | | 2,339 | | Dover Corp. | | | | | | | 209,130 | |
| | | 9,864 | | Flowserve Corp. | | | | | | | 458,183 | |
| | | 981 | | Rockwell Automation, Inc. | | | | | | | 146,022 | |
See accompanying notes to financial statements.
23
Horizon Active Risk Assist® Fund
PORTFOLIO OF INVESTMENTS (Unaudited) (Continued)
May 31, 2019 |
| |
Shares
| | | | | | | | Value | |
| | | 1,073 | | Roper Technologies, Inc. | | | | | | $ | 369,026 | |
| | | 3,255 | | Wabtec Corp. | | | | | | | 203,047 | |
| | | 2,936 | | Xylem, Inc. | | | | | | | 217,910 | |
| | | | | | | | | | | | 1,777,134 | |
| | | | | Media - 0.4% | | | | | | | | |
| | | 1,420 | | Charter Communications, Inc. (a) | | | | | | | 535,056 | |
| | | 16,042 | | Comcast Corp., Class A | | | | | | | 657,722 | |
| | | 15,547 | | Discovery, Inc., Class A (a) | | | | | | | 423,811 | |
| | | 10,943 | | DISH Network Corp., Class A (a) | | | | | | | 395,152 | |
| | | 6,961 | | Fox Corp., Class B | | | | | | | 241,616 | |
| | | 76,888 | | News Corp., Class B | | | | | | | 895,745 | |
| | | 3,784 | | Walt Disney Co. | | | | | | | 499,640 | |
| | | | | | | | | | | | 3,648,742 | |
| | | | | Mining - 0.0% (b) | | | | | | | | |
| | | 17,440 | | Freeport-McMoRan, Inc. | | | | | | | 169,343 | |
| | | 4,093 | | Newmont Goldcorp Corp. | | | | | | | 135,437 | |
| | | | | | | | | | | | 304,780 | |
| | | | | Miscellaneous Manufacturing - 0.2% | | | | | | | | |
| | | 7,705 | | AO Smith Corp. | | | | | | | 312,053 | |
| | | 1,149 | | Eaton Corp PLC | | | | | | | 85,589 | |
| | | 422 | | Illinois Tool Works, Inc. | | | | | | | 58,928 | |
| | | 4,234 | | Ingersoll-Rand PLC | | | | | | | 501,052 | |
| | | 842 | | Parker-Hannifin Corp. | | | | | | | 128,253 | |
| | | 5,267 | | Textron, Inc. | | | | | | | 238,595 | |
| | | | | | | | | | | | 1,324,470 | |
| | | | | Office/Business Equipment - 0.1% | | | | | | | | |
| | | 20,152 | | Xerox Corp. | | | | | | | 616,853 | |
| | | | | | | | | | | | | |
| | | | | Oil & Gas - 0.5% | | | | | | | | |
| | | 8,602 | | Apache Corp. | | | | | | | 224,254 | |
| | | 18,263 | | Cabot Oil & Gas Corp. | | | | | | | 456,940 | |
| | | 2,885 | | Chevron Corp. | | | | | | | 328,457 | |
| | | 6,771 | | Cimarex Energy Co. | | | | | | | 387,234 | |
| | | 1,234 | | Concho Resources, Inc. | | | | | | | 120,944 | |
| | | 7,870 | | Devon Energy Corp. | | | | | | | 198,009 | |
| | | 1,615 | | Diamondback Energy, Inc. | | | | | | | 158,367 | |
| | | 597 | | EOG Resources, Inc. | | | | | | | 48,882 | |
| | | 2,935 | | Exxon Mobil Corp. | | | | | | | 207,710 | |
| | | 8,398 | | Helmerich & Payne, Inc. | | | | | | | 410,746 | |
| | | 4,922 | | Hess Corp. | | | | | | | 274,943 | |
| | | 9,670 | | HollyFrontier Corp. | | | | | | | 367,267 | |
| | | 16,125 | | Marathon Oil Corp. | | | | | | | 212,044 | |
| | | 1,736 | | Marathon Petroleum Corp. | | | | | | | 79,839 | |
| | | 11,287 | | Noble Energy, Inc. | | | | | | | 241,542 | |
See accompanying notes to financial statements.
24
Horizon Active Risk Assist® Fund
PORTFOLIO OF INVESTMENTS (Unaudited) (Continued)
May 31, 2019 |
| |
Shares
| | | | | | | | Value | |
| | | 1,390 | | Occidental Petroleum Corp. | | | | | | $ | 69,180 | |
| | | 915 | | Phillips 66 | | | | | | | 73,932 | |
| | | 818 | | Pioneer Natural Resources Co. | | | | | | | 116,123 | |
| | | 1,082 | | Valero Energy Corp. | | | | | | | 76,173 | |
| | | | | | | | | | | | 4,052,586 | |
| | | | | Oil & Gas Services - 0.1% | | | | | | | | |
| | | 12,198 | | Baker Hughes & GE Co., Class A | | | | | | | 261,159 | |
| | | 5,543 | | Halliburton Co. | | | | | | | 118,010 | |
| | | 13,326 | | National Oilwell Varco, Inc. | | | | | | | 277,847 | |
| | | 1,448 | | Schlumberger Ltd. | | | | | | | 50,231 | |
| | | 13,477 | | TechnipFMC PLC | | | | | | | 280,322 | |
| | | | | | | | | | | | 987,569 | |
| | | | | Packaging & Containers - 0.2% | | | | | | | | |
| | | 8,638 | | Ball Corp. | | | | | | | 530,287 | |
| | | 3,450 | | Packaging Corp of America | | | | | | | 307,326 | |
| | | 13,618 | | Sealed Air Corp. | | | | | | | 570,594 | |
| | | 8,875 | | Westrock Co. | | | | | | | 289,325 | |
| | | | | | | | | | | | 1,697,532 | |
| | | | | Pharmaceuticals - 0.3% | | | | | | | | |
| | | 503 | | Allergan PLC | | | | | | | 61,321 | |
| | | 4,657 | | Cardinal Health, Inc. | | | | | | | 195,920 | |
| | | 1,346 | | Eli Lilly & Co. | | | | | | | 156,055 | |
| | | 986 | | McKesson Corp. | | | | | | | 120,430 | |
| | | 5,147 | | Merck & Co., Inc. | | | | | | | 407,694 | |
| | | 13,516 | | Mylan NV (a) | | | | | | | 227,069 | |
| | | 15,641 | | Nektar Therapeutics (a) | | | | | | | 489,876 | |
| | | 8,914 | | Perrigo Co. PLC | | | | | | | 374,566 | |
| | | 3,247 | | Zoetis, Inc., Class A | | | | | | | 328,109 | |
| | | | | | | | | | | | 2,361,040 | |
| | | | | Pipelines - 0.2% | | | | | | | | |
| | | 26,660 | | Kinder Morgan, Inc. | | | | | | | 531,867 | |
| | | 5,981 | | ONEOK, Inc. | | | | | | | 380,511 | |
| | | 15,964 | | Williams Cos., Inc. | | | | | | | 421,131 | |
| | | | | | | | | | | | 1,333,509 | |
| | | | | Real Estate - 0.0% (b) | | | | | | | | |
| | | 3,989 | | CBRE Group, Inc., Class A (a) | | | | | | | 182,297 | |
| | | | | | | | | | | | | |
| | | | | Real Estate Investment Trusts - 1.0% | | | | | | | | |
| | | 2,452 | | Alexandria Real Estate Equities, Inc. | | | | | | | 358,997 | |
| | | 2,676 | | American Tower Corp. | | | | | | | 558,669 | |
| | | 8,434 | | Apartment Investment & Management Co., Class A | | | | | | | 421,278 | |
| | | 556 | | AvalonBay Communities, Inc. | | | | | | | 112,874 | |
| | | 1,158 | | Boston Properties, Inc. | | | | | | | 151,501 | |
See accompanying notes to financial statements.
25
Horizon Active Risk Assist® Fund
PORTFOLIO OF INVESTMENTS (Unaudited) (Continued)
May 31, 2019 |
| |
Shares
| | | | | | | | Value | |
| | | 3,199 | | Crown Castle International Corp. | | | | | | $ | 415,902 | |
| | | 1,090 | | Digital Realty Trust, Inc. | | | | | | | 128,315 | |
| | | 9,288 | | Duke Realty Corp. | | | | | | | 279,476 | |
| | | 903 | | Equinix, Inc. | | | | | | | 438,668 | |
| | | 2,838 | | Equity Residential | | | | | | | 217,306 | |
| | | 1,280 | | Essex Property Trust, Inc. | | | | | | | 373,427 | |
| | | 2,146 | | Extra Space Storage, Inc. | | | | | | | 229,965 | |
| | | 2,502 | | Federal Realty Investment Trust | | | | | | | 327,087 | |
| | | 6,937 | | HCP, Inc. | | | | | | | 219,972 | |
| | | 11,497 | | Host Hotels & Resorts, Inc. | | | | | | | 208,211 | |
| | | 10,913 | | Iron Mountain, Inc. | | | | | | | 334,483 | |
| | | 22,091 | | Kimco Realty Corp. | | | | | | | 384,383 | |
| | | 12,697 | | Macerich Co. | | | | | | | 461,282 | |
| | | 3,268 | | Mid-America Apartment Communities, Inc. | | | | | | | 373,140 | |
| | | 869 | | Prologis, Inc. | | | | | | | 64,019 | |
| | | 347 | | Public Storage | | | | | | | 82,544 | |
| | | 2,108 | | Realty Income Corp. | | | | | | | 147,729 | |
| | | 4,294 | | Regency Centers Corp. | | | | | | | 283,232 | |
| | | 2,363 | | SBA Communications Corp. (a) | | | | | | | 511,377 | |
| | | 328 | | Simon Property Group, Inc. | | | | | | | 53,166 | |
| | | 5,178 | | SL Green Realty Corp. | | | | | | | 445,308 | |
| | | 5,605 | | UDR, Inc. | | | | | | | 250,992 | |
| | | 2,187 | | Ventas, Inc. | | | | | | | 140,624 | |
| | | 3,685 | | Vornado Realty Trust | | | | | | | 244,058 | |
| | | 4,572 | | Welltower, Inc. | | | | | | | 371,338 | |
| | | 6,478 | | Weyerhaeuser Co. | | | | | | | 147,698 | |
| | | | | | | | | | | | 8,737,021 | |
| | | | | | | | | | | | | |
| | | | | Retail - 0.9% | | | | | | | | |
| | | 1,688 | | Advance Auto Parts, Inc. | | | | | | | 261,640 | |
| | | 120 | | AutoZone, Inc. (a) | | | | | | | 123,253 | |
| | | 2,322 | | Best Buy Co., Inc. | | | | | | | 145,520 | |
| | | 5,670 | | CarMax, Inc. (a) | | | | | | | 443,848 | |
| | | 738 | | Chipotle Mexican Grill, Inc. (a) | | | | | | | 487,058 | |
| | | 3,735 | | Darden Restaurants, Inc. | | | | | | | 434,455 | |
| | | 2,505 | | Dollar General Corp. | | | | | | | 318,836 | |
| | | 2,974 | | Dollar Tree, Inc. (a) | | | | | | | 302,129 | |
| | | 8,229 | | Foot Locker, Inc. | | | | | | | 323,811 | |
| | | 14,481 | | Gap, Inc. | | | | | | | 270,505 | |
| | | 2,134 | | Genuine Parts Co. | | | | | | | 211,053 | |
| | | 4,237 | | Kohl’s Corp. | | | | | | | 208,969 | |
| | | 20,143 | | L Brands, Inc. | | | | | | | 452,412 | |
| | | 20,096 | | Macy’s, Inc. | | | | | | | 413,375 | |
| | | 2,141 | | McDonald’s Corp. | | | | | | | 424,496 | |
See accompanying notes to financial statements.
26
Horizon Active Risk Assist® Fund
PORTFOLIO OF INVESTMENTS (Unaudited) (Continued)
May 31, 2019 |
| |
Shares
| | | | | | | | Value | |
| | | 13,027 | | Nordstrom, Inc. | | | | | | $ | 407,745 | |
| | | 296 | | O’Reilly Automotive, Inc. (a) | | | | | | | 109,925 | |
| | | 879 | | Ross Stores, Inc. | | | | | | | 81,738 | |
| | | 6,222 | | Starbucks Corp. | | | | | | | 473,245 | |
| | | 10,507 | | Tapestry, Inc. | | | | | | | 300,080 | |
| | | 1,100 | | Target Corp. | | | | | | | 88,495 | |
| | | 2,397 | | Tiffany & Co. | | | | | | | 213,597 | |
| | | 3,875 | | TJX Cos., Inc. | | | | | | | 194,874 | |
| | | 4,934 | | Tractor Supply Co. | | | | | | | 497,248 | |
| | | 445 | | Ulta Beauty, Inc. (a) | | | | | | | 148,354 | |
| | | 1,224 | | Walgreens Boots Alliance, Inc. | | | | | | | 60,392 | |
| | | 4,334 | | Yum! Brands, Inc. | | | | | | | 443,585 | |
| | | | | | | | | | | | 7,840,638 | |
| | | | | Savings & Loans - 0.1% | | | | | | | | |
| | | 27,751 | | People’s United Financial, Inc. | | | | | | | 426,533 | |
| | | | | | | | | | | | | |
| | | | | Semiconductors - 0.4% | | | | | | | | |
| | | 15,466 | | Advanced Micro Devices, Inc. (a) | | | | | | | 423,923 | |
| | | 1,062 | | Analog Devices, Inc. | | | | | | | 102,610 | |
| | | 2,956 | | Applied Materials, Inc. | | | | | | | 114,368 | |
| | | 3,862 | | IPG Photonics Corp. (a) | | | | | | | 483,407 | |
| | | 2,279 | | KLA-Tencor Corp. | | | | | | | 234,897 | |
| | | 807 | | Lam Research Corp. | | | | | | | 140,910 | |
| | | 5,482 | | Maxim Integrated Products, Inc. | | | | | | | 288,298 | |
| | | 2,591 | | Microchip Technology, Inc. | | | | | | | 207,358 | |
| | | 2,825 | | Micron Technology, Inc. (a) | | | | | | | 92,123 | |
| | | 6,889 | | Qorvo, Inc. (a) | | | | | | | 421,469 | |
| | | 4,911 | | QUALCOMM, Inc. | | | | | | | 328,153 | |
| | | 4,130 | | Skyworks Solutions, Inc. | | | | | | | 275,182 | |
| | | 3,080 | | Xilinx, Inc. | | | | | | | 315,115 | |
| | | | | | | | | | | | 3,427,813 | |
| | | | | Shipbuilding - 0.0% (b) | | | | | | | | |
| | | 1,761 | | Huntington Ingalls Industries, Inc. | | | | | | | 361,216 | |
| | | | | | | | | | | | | |
| | | | | Software - 0.7% | | | | | | | | |
| | | 3,996 | | Activision Blizzard, Inc. | | | | | | | 173,307 | |
| | | 4,833 | | Akamai Technologies, Inc. (a) | | | | | | | 364,215 | |
| | | 1,530 | | ANSYS, Inc. (a) | | | | | | | 274,635 | |
| | | 710 | | Autodesk, Inc. (a) | | | | | | | 114,246 | |
| | | 2,781 | | Broadridge Financial Solutions, Inc. | | | | | | | 347,263 | |
| | | 9,191 | | Cadence Design Systems, Inc. (a) | | | | | | | 584,272 | |
| | | 6,240 | | Cerner Corp. | | | | | | | 436,613 | |
| | | 3,729 | | Citrix Systems, Inc. | | | | | | | 350,974 | |
| | | 2,381 | | Electronic Arts, Inc. (a) | | | | | | | 221,623 | |
See accompanying notes to financial statements.
27
Horizon Active Risk Assist® Fund
PORTFOLIO OF INVESTMENTS (Unaudited) (Continued)
May 31, 2019 |
| |
Shares
| | | | | | | | Value | |
| | | 1,042 | | Fidelity National Information Services, Inc. | | | | | | $ | 125,353 | |
| | | 1,626 | | Fiserv, Inc. (a) | | | | | | | 139,608 | |
| | | 1,240 | | Intuit, Inc. | | | | | | | 303,614 | |
| | | 3,267 | | Jack Henry & Associates, Inc. | | | | | | | 428,696 | |
| | | 2,374 | | MSCI, Inc. | | | | | | | 522,304 | |
| | | 5,813 | | Paychex, Inc. | | | | | | | 498,697 | |
| | | 4,459 | | Synopsys, Inc. (a) | | | | | | | 519,206 | |
| | | 5,216 | | Take-Two Interactive Software, Inc. (a) | | | | | | | 564,110 | |
| | | | | | | | | | | | 5,968,736 | |
| | | | | Telecommunications - 0.2% | | | | | | | | |
| | | 914 | | Arista Networks, Inc. (a) | | | | | | | 223,555 | |
| | | 48,294 | | CenturyLink, Inc. | | | | | | | 504,672 | |
| | | 3,826 | | Cisco Systems, Inc. | | | | | | | 199,067 | |
| | | 19,663 | | Juniper Networks, Inc. | | | | | | | 483,906 | |
| | | 2,648 | | Motorola Solutions, Inc. | | | | | | | 397,068 | |
| | | 3,689 | | Verizon Communications, Inc. | | | | | | | 200,497 | |
| | | | | | | | | | | | 2,008,765 | |
| | | | | Textiles - 0.0% (b) | | | | | | | | |
| | | 2,278 | | Mohawk Industries, Inc. (a) | | | | | | | 308,783 | |
| | | | | | | | | | | | | |
| | | | | Toys/Games/Hobbies - 0.1% | | | | | | | | |
| | | 2,412 | | Hasbro, Inc. | | | | | | | 229,477 | |
| | | 66,488 | | Mattel, Inc. (a) (f) | | | | | | | 654,907 | |
| | | | | | | | | | | | 884,384 | |
| | | | | Transportation - 0.2% | | | | | | | | |
| | | 3,444 | | CH Robinson Worldwide, Inc. | | | | | | | 274,246 | |
| | | 3,394 | | Expeditors International of Washington, Inc. | | | | | | | 236,189 | |
| | | 390 | | FedEx Corp. | | | | | | | 60,169 | |
| | | 3,179 | | JB Hunt Transport Services, Inc. | | | | | | | 270,660 | |
| | | 3,284 | | Kansas City Southern | | | | | | | 372,012 | |
| | | 2,187 | | Norfolk Southern Corp. | | | | | | | 426,771 | |
| | | 1,789 | | Union Pacific Corp. | | | | | | | 298,369 | |
| | | | | | | | | | | | 1,938,416 | |
| | | | | Water - 0.1% | | | | | | | | |
| | | 4,698 | | American Water Works Co., Inc. | | | | | | | 530,968 | |
| | | | | | | | | | | | | |
| | | | | TOTAL COMMON STOCKS (Cost - $121,375,869) | | | | | | | 118,159,360 | |
See accompanying notes to financial statements.
28
Horizon Active Risk Assist® Fund
PORTFOLIO OF INVESTMENTS (Unaudited) (Continued)
May 31, 2019 |
| |
Contracts
| | | | Notional
Amount | | | Value | |
| | | | | PURCHASED OPTIONS - 0.7% (c) | | | | | | | | |
| | | | | PURCHASED CALL OPTIONS - 0.1% | | | | | | | | |
| | | | | Deutsche Bank AG (a) | | | | | | | | |
| | | 6,000 | | Expiration: July 2019, Exercise Price: $12 | | $ | 4,062,000 | | | $ | 6,000 | |
| | | | | iPath Series B S&P 500 VIX Short-Term Futures ETN (a)(g) | | | | | | | | |
| | | 3,000 | | Expiration: July 2019, Exercise Price: $36 | | | 9,126,000 | | | | 520,500 | |
| | | | | iShares China Large-Cap ETF (a) | | | | | | | | |
| | | 10,000 | | Expiration: June 2019, Exercise Price: $42 | | | 40,370,000 | | | | 180,000 | |
| | | 3,000 | | Expiration: July 2019, Exercise Price: $42 | | | 12,111,000 | | | | 150,000 | |
| | | 3,000 | | Expiration: July 2019, Exercise Price: $43 | | | 12,111,000 | | | | 85,500 | |
| | | | | iShares MSCI Emerging Markets ETF (a) | | | | | | | | |
| | | 9,000 | | Expiration: June 2019, Exercise Price: $46.50 | | | 36,639,000 | | | | 40,500 | |
| | | 9,000 | | Expiration: September 2019, Exercise Price: $49 | | | 36,639,000 | | | | 31,500 | |
| | | | | S&P 500 Index (a) | | | | | | | | |
| | | 400 | | Expiration: May 2019, Exercise Price: $2,775 | | | 110,082,400 | | | | 2,000 | |
| | | 2,000 | | Expiration: June 2019, Exercise Price: $3,100 | | | 550,412,000 | | | | 5,000 | |
| | | | | SPDR S&P 500 ETF Trust (a) | | | | | | | | |
| | | 2,500 | | Expiration: June 2019, Exercise Price: $294 | | | 68,817,500 | | | | 13,750 | |
| | | | | SPDR S&P Homebuilders ETF (a) | | | | | | | | |
| | | 5,000 | | Expiration: July 2019, Exercise Price: $41 | | | 19,180,000 | | | | 95,000 | |
| | | | | Technology Select Sector SPDR Fund (a) | | | | | | | | |
| | | 1,500 | | Expiration: June 2019, Exercise Price: $75 | | | 10,783,500 | | | | 47,250 | |
| | | | | VanEck Vectors Semiconductor ETF (a) | | | | | | | | |
| | | 5,000 | | Expiration: June 2019, Exercise Price: $105 | | | 49,115,000 | | | | 47,500 | |
| | | | | TOTAL PURCHASED CALL OPTIONS (Cost - $3,847,975) | | | | | | | 1,224,500 | |
| | | | | | | | | | | | | |
| | | | | PURCHASED PUT OPTIONS - 0.6% | | | | | | | | |
| | | | | CBOE Volatility Index (a) | | | | | | | | |
| | | 1,000 | | Expiration: June 2019, Exercise Price $14.50 | | | 1,871,000 | | | | 17,500 | |
| | | 4,500 | | Expiration: June 2019, Exercise Price $16 | | | 8,419,500 | | | | 258,750 | |
| | | | | Consumer Discretionary Select Sector SPDR Fund (a)(g) | | | | | | | | |
| | | 2,500 | | Expiration: June 2019, Exercise Price: $106 | | | 27,735,000 | | | | 170,000 | |
| | | | | iShares China Large-Cap ETF (a) | | | | | | | | |
| | | 6,000 | | Expiration: June 2019, Exercise Price: $39.50 | | | 24,222,000 | | | | 102,000 | |
| | | 6,000 | | Expiration: June 2019, Exercise Price: $40 | | | 24,222,000 | | | | 177,000 | |
| | | | | iShares MSCI Emerging Markets ETF (a)(g) | | | | | | | | |
| | | 15,000 | | Expiration: July 2019, Exercise Price: $38 | | | 61,065,000 | | | | 615,000 | |
| | | | | iShares MSCI Mexico ETF (a) | | | | | | | | |
| | | 12,000 | | Expiration: June 2019, Exercise Price: $41.50 | | | 51,504,000 | | | | 372,000 | |
| | | | | S&P 500 Index (a)(g) | | | | | | | | |
| | | 450 | | Expiration: June 2019, Exercise Price: $2,725 | | | 123,842,700 | | | | 922,950 | |
| | | 150 | | Expiration: June 2019, Exercise Price: $2,775 | | | 41,280,900 | | | | 605,250 | |
| | | 300 | | Expiration: June 2019, Exercise Price: $2,800 | | | 82,561,800 | | | | 1,462,500 | |
See accompanying notes to financial statements.
29
Horizon Active Risk Assist® Fund
PORTFOLIO OF INVESTMENTS (Unaudited) (Continued)
May 31, 2019 |
| |
Contracts
| | | | Notional
Amount | | | Value | |
| | | | | Utilities Select Sector SPDR Fund (a)(g) | | | | | | | | |
| | | 7,000 | | Expiration: July 2019, Exercise Price: $57 | | $ | 40,775,000 | | | $ | 532,000 | |
| | | | | TOTAL PURCHASED PUT OPTIONS (Cost - $4,583,340) | | | | | | | 5,234,950 | |
| | | | | | | | | | | | | |
| | | | | TOTAL PURCHASED OPTIONS (Cost - $8,431,315) | | | | | | | 6,459,450 | |
| | | | | | | | | | | | | |
| | Shares | | | | | | | | | | |
| | | | | SHORT-TERM INVESTMENTS - 1.0% | | | | | | | | |
| | | | | Money Market Funds - 1.0% | | | | | | | | |
| | | 8,882,421 | | First American Treasury Obligations Fund, Class X, 2.30% (d) | | | | | | | 8,882,421 | |
| | | | | TOTAL SHORT-TERM INVESTMENTS (Cost - $8,882,421) | | | | | | | 8,882,421 | |
| | | | | | | | | | | | | |
| | | | | INVESTMENTS PURCHASED WITH PROCEEDS FROM SECURITIES LENDING - 7.9% | | | | | | | | |
| | | | | Money Market Funds - 7.9% | | | | | | | | |
| | | 68,335,862 | | First American Government Obligations Fund, Class Z, 2.26% (d) | | | | | | | 68,335,862 | |
| | | | | TOTAL INVESTMENTS PURCHASED WITH PROCEEDS FROM SECURITIES LENDING (Cost - $68,335,862) | | | | | | | 68,335,862 | |
| | | | | | | | | | | | | |
| | | | | TOTAL INVESTMENTS - 107.9% (Cost - $953,507,973) | | | | | | | 929,792,178 | |
| | | | | Liabilities in Excess of Other Assets - (7.9)% | | | | | | | (67,947,693 | ) |
| | | | | NET ASSETS - 100.0% | | | | | | $ | 861,844,485 | |
| | | | | | | | | | | | | |
| | Contracts | | | | | | | | | | |
| | | | | SCHEDULE OF WRITTEN OPTIONS - (0.2)% (c) | | | | | | | | |
| | | | | SCHEDULE OF WRITTEN CALL OPTIONS - (0.1)% | | | | | | | | |
| | | | | Invesco QQQ Trust Series 1 (a) | | | | | | | | |
| | | 1,500 | | Expiration: June 2019, Exercise Price $180 | | | 26,092,500 | | | | 181,500 | |
| | | | | iPath Series B S&P 500 VIX Short-Term Futures ETN (a) | | | | | | | | |
| | | 3,000 | | Expiration: June 2019, Exercise Price $36 | | | 9,126,000 | | | | 312,000 | |
| | | | | TOTAL WRITTEN CALL OPTIONS (Premiums Received - $398,802) | | | | | | | 493,500 | |
| | | | | | | | | | | | | |
| | | | | SCHEDULE OF WRITTEN PUT OPTIONS - (0.1)% | | | | | | | | |
| | | | | Consumer Discretionary Select Sector SPDR Fund (a) | | | | | | | | |
| | | 2,500 | | Expiration: June 2019, Exercise Price $104 | | | 27,735,000 | | | | 95,000 | |
| | | | | iShares MSCI Emerging Markets ETF (a) | | | | | | | | |
| | | 15,000 | | Expiration: June 2019, Exercise Price $38 | | | 61,065,000 | | | | 352,500 | |
| | | | | S&P 500 Index (a) | | | | | | | | |
| | | 600 | | Expiration: June 2019, Exercise Price $2,650 | | | 165,123,600 | | | | 231,000 | |
| | | 250 | | Expiration: June 2019, Exercise Price $2,700 | | | 68,801,500 | | | | 45,000 | |
See accompanying notes to financial statements.
30
Horizon Active Risk Assist® Fund
PORTFOLIO OF INVESTMENTS (Unaudited) (Continued)
May 31, 2019 |
| |
Contracts
| | | | Notional
Amount | | | Value | |
| | | | | Utilities Select Sector SPDR Fund (a) | | | | | | | | |
| | | 7,000 | | Expiration: July 2019, Exercise Price $55 | | $ | 40,775,000 | | | $ | 203,000 | |
| | | | | TOTAL WRITTEN PUT OPTIONS (Premiums Received - $1,179,131) | | | | | | | 926,500 | |
| | | | | | | | | | | | | |
| | | | | TOTAL WRITTEN OPTIONS (Premiums Received - $1,577,933) | | | | | | $ | 1,420,000 | |
Percentages are stated as a percent of net assets.
(a) | Non-income producing security. |
(c) | Each Option is exercisable into 100 shares of the underlying security. |
(d) | Money Market Fund; interest rate reflects seven-day yield on May 31, 2019. |
(e) | All or a portion of the security is segregated as collateral for written options. The value of the securities segregated as collateral for written options is $34,361,600. |
(f) | All or a portion of this security is out on loan as of May 31, 2019. |
(g) | Held in connection with a written option, see Schedule of Written Options for more details. |
(h) | Affiliated Security. Please refer to Note 9 of the Notes to Financial Statements. |
See accompanying notes to financial statements.
31
Horizon Active Income Fund
PORTFOLIO OF INVESTMENTS (Unaudited)
May 31, 2019 |
| |
Shares
| | | | | | | | Value | |
| | | | | INVESTMENT COMPANIES - 98.8% | | | | | | | | |
| | | | | Exchange Traded Funds - 98.8% | | | | | | | | |
| | | 109,164 | | iShares 3-7 Year Treasury Bond ETF | | | | | | $ | 13,634,584 | |
| | | 503,474 | | iShares 7-10 Year Treasury Bond ETF (f) | | | | | | | 54,833,353 | |
| | | 138,696 | | Janus Henderson Mortgage-Backed Securities ETF (h) | | | | | | | 7,165,729 | |
| | | 1,225,301 | | SPDR Doubleline Total Return Tactical ETF (e) (f) | | | | | | | 59,647,653 | |
| | | 1,381,044 | | SPDR Portfolio Intermediate Term Corporate Bond ETF | | | | | | | 47,604,587 | |
| | | 1,022,603 | | WisdomTree Yield Enhanced U.S. Aggregate Bond Fund (f) (h) | | | | | | | 51,590,321 | |
| | | 145,279 | | X-Trackers Short Duration High Yield Bond ETF (h) | | | | | | | 7,064,191 | |
| | | 547,146 | | X-Trackers USD High Yield Corporate Bond ETF | | | | | | | 26,788,267 | |
| | | | | TOTAL EXCHANGE TRADED FUNDS (Cost - $262,210,342) | | | | | | | 268,328,685 | |
| | | | | | | | | | | | | |
| |
Contracts
| | | | Notional
Amount | | | | | |
| | | | | PURCHASED OPTIONS - 0.1% (c) | | | | | | | | |
| | | | | PURCHASED CALL OPTIONS - 0.0% (b) | | | | | | | | |
| | | | | iShares iBoxx High Yield Corporate Bond ETF (a) | | | | | | | | |
| | | 4,000 | | Expiration: June 2019, Exercise Price: $87 | | $ | 33,960,000 | | | | 10,000 | |
| | | | | TOTAL PURCHASED CALL OPTIONS (Cost - $126,170) | | | | | | | 10,000 | |
| | | | | | | | | | | | | |
| | | | | PURCHASED PUT OPTIONS - 0.1% | | | | | | | | |
| | | | | iShares 20+ Year Treasury Bond ETF (a) | | | | | | | | |
| | | 2,000 | | Expiration: June 2019, Exercise Price: $127 | | | 26,366,000 | | | | 37,000 | |
| | | | | iShares iBoxx High Yield Corporate Bond ETF (a)(g) | | | | | | | | |
| | | 6,000 | | Expiration: July 2019, Exercise Price: $80 | | | 50,940,000 | | | | 174,000 | |
| | | | | iShares JP Morgan USD Emerging Markets Bond ETF (a)(g) | | | | | | | | |
| | | 2,000 | | Expiration: June 2019, Exercise Price: $109 | | | 21,978,000 | | | | 70,000 | |
| | | | | TOTAL PURCHASED PUT OPTIONS (Cost - $445,433) | | | | | | | 281,000 | |
| | | | | | | | | | | | | |
| | | | | TOTAL PURCHASED OPTIONS (Cost - $571,603) | | | | | | | 291,000 | |
| | | | | | | | | | | | | |
| | Shares | | | | | | | | | | |
| | | | | SHORT-TERM INVESTMENTS - 1.1% | | | | | | | | |
| | | | | Money Market Funds - 1.1% | | | | | | | | |
| | | 2,882,265 | | First American Treasury Obligations Fund, Class X, 2.30% (d) | | | | | | | 2,882,265 | |
| | | | | | | | | | | | | |
| | Principal
Amount | | | | | | | | | | |
| | | | | US TREASURY BILL - 0.0% (b) | | | | | | | | |
| | | $100,000 | | 2.293%, 6/4/2019 (a) (i) | | | | | | | 99,981 | |
| | | | | | | | | | | | | |
| | | | | TOTAL SHORT-TERM INVESTMENTS (Cost - $2,982,246) | | | | | | | 2,982,246 | |
See accompanying notes to financial statements.
32
Horizon Active Income Fund
PORTFOLIO OF INVESTMENTS (Unaudited) (Continued)
May 31, 2019 |
| |
Shares
| | | | | | | | Value | |
| | | | | INVESTMENTS PURCHASED WITH PROCEEDS FROM SECURITIES LENDING - 21.2% | | | | | | | | |
| | | | | Money Market Funds - 21.2% | | | | | | | | |
| | | 57,530,682 | | First American Government Obligations Fund, Class Z, 2.26% (d) | | | | | | $ | 57,530,682 | |
| | | | | TOTAL INVESTMENTS PURCHASED WITH PROCEEDS FROM SECURITIES LENDING (Cost - $57,530,682) | | | | | | | 57,530,682 | |
| | | | | | | | | | | | | |
| | | | | TOTAL INVESTMENTS - 121.2% (Cost - $323,294,873) | | | | | | | 329,132,613 | |
| | | | | Liabilities in Excess of Other Assets - (21.2)% | | | | | | | (57,516,196 | ) |
| | | | | NET ASSETS - 100.0% | | | | | | $ | 271,616,417 | |
| | | | | | | | | | | | | |
| |
Contracts
| | | | Notional
Amount | | | | | |
| | | | | SCHEDULE OF WRITTEN OPTIONS - (0.1)% (c) | | | | | | | | |
| | | | | SCHEDULE OF WRITTEN CALL OPTIONS - (0.1)% | | | | | | | | |
| | | | | iShares 20+ Year Treasury Bond ETF (a) | | | | | | | | |
| | | 1,000 | | Expiration: June 2019, Exercise Price $131 | | $ | 13,183,000 | | | $ | 188,000 | |
| | | | | TOTAL WRITTEN CALL OPTIONS (Premiums Received - $82,444) | | | | | | | 188,000 | |
| | | | | | | | | | | | | |
| | | | | SCHEDULE OF WRITTEN PUT OPTIONS - 0.0% (b) | | | | | | | | |
| | | | | iShares iBoxx High Yield Corporate Bond ETF (a) | | | | | | | | |
| | | 6,000 | | Expiration: July 2019, Exercise Price $79 | | | 50,940,000 | | | | 102,000 | |
| | | | | iShares JP Morgan USD Emerging Markets Bond ETF (a) | | | | | | | | |
| | | 2,000 | | Expiration: June 2019, Exercise Price $107 | | | 21,978,000 | | | | 10,000 | |
| | | | | TOTAL WRITTEN PUT OPTIONS (Premiums Received - $175,657) | | | | | | | 112,000 | |
| | | | | | | | | | | | | |
| | | | | TOTAL WRITTEN OPTIONS (Premiums Received - $258,101) | | | | | | $ | 300,000 | |
Percentages are stated as a percent of net assets.
(a) | Non-income producing security. |
(c) | Each Option is exercisable into 100 shares of the underlying security. |
(d) | Money Market Fund; rate reflects seven-day yield on May 31, 2019. |
(e) | All or a portion of the security is segregated as collateral for written options. The value of the securities segregated as collateral for written options is $34,076,000. |
(f) | All or a portion of this security is out on loan as of May 31, 2019. |
(g) | Held in connection with a written option, see Schedule of Written Options for more details. |
(h) | Affiliated Security. Please refer to Note 9 of the Notes to Financial Statements. |
(i) | Zero coupon bond. The effective yield is listed. |
See accompanying notes to financial statements.
33
Horizon Active Dividend Fund
PORTFOLIO OF INVESTMENTS (Unaudited)
May 31, 2019 |
| |
Shares
| | | | | | | | Value | |
| | | | | COMMON STOCKS - 89.1% | | | | | | | | |
| | | | | Advertising - 5.7% | | | | | | | | |
| | | 42,956 | | Omnicom Group, Inc. | | | | | | $ | 3,323,076 | |
| | | 53,944 | | WPP PLC | | | | | | | 3,209,129 | |
| | | | | | | | | | | | 6,532,205 | |
| | | | | Auto Manufacturers - 3.0% | | | | | | | | |
| | | 29,545 | | Toyota Motor Corp. | | | | | | | 3,473,901 | |
| | | | | | | | | | | | | |
| | | | | Banks - 13.8% | | | | | | | | |
| | | 48,325 | | Comerica, Inc. | | | | | | | 3,325,726 | |
| | | 58,939 | | First Horizon National Corp. | | | | | | | 790,372 | |
| | | 32,050 | | JPMorgan Chase & Co. | | | | | | | 3,396,018 | |
| | | 210,266 | | KeyCorp | | | | | | | 3,357,948 | |
| | | 24,425 | | Synovus Financial Corp. | | | | | | | 780,623 | |
| | | 49,314 | | Umpqua Holdings Corp. | | | | | | | 787,545 | |
| | | 76,155 | | Wells Fargo & Co. | | | | | | | 3,378,997 | |
| | | | | | | | | | | | 15,817,229 | |
| | | | | Biotechnology - 6.0% | | | | | | | | |
| | | 21,566 | | Amgen, Inc. | | | | | | | 3,595,052 | |
| | | 53,287 | | Gilead Sciences, Inc. | | | | | | | 3,317,116 | |
| | | | | | | | | | | | 6,912,168 | |
| | | | | Chemicals - 1.9% | | | | | | | | |
| | | 46,499 | | Dow, Inc. | | | | | | | 2,174,293 | |
| | | | | | | | | | | | | |
| | | | | Computers - 2.7% | | | | | | | | |
| | | 24,518 | | International Business Machines Corp. | | | | | | | 3,113,541 | |
| | | | | | | | | | | | | |
| | | | | Cosmetics/Personal Care - 2.9% | | | | | | | | |
| | | 54,126 | | Unilever PLC | | | | | | | 3,296,815 | |
| | | | | | | | | | | | | |
| | | | | Healthcare Products - 2.9% | | | | | | | | |
| | | 35,649 | | Medtronic PLC | | | | | | | 3,300,384 | |
| | | | | | | | | | | | | |
| | | | | Household Products - 2.8% | | | | | | | | |
| | | 199,265 | | Reckitt Benckiser Group PLC | | | | | | | 3,216,137 | |
| | | | | | | | | | | | | |
| | | | | Insurance - 6.4% | | | | | | | | |
| | | 263,273 | | Aviva PLC | | | | | | | 2,714,344 | |
| | | 69,971 | | AXA SA | | | | | | | 1,717,788 | |
| | | 61,508 | | MetLife, Inc. | | | | | | | 2,842,285 | |
| | | | | | | | | | | | 7,274,417 | |
| | | | | Mining - 1.8% | | | | | | | | |
| | | 35,413 | | Rio Tinto PLC | | | | | | | 2,051,475 | |
| | | | | | | | | | | | | |
See accompanying notes to financial statements.
34
Horizon Active Dividend Fund
PORTFOLIO OF INVESTMENTS (Unaudited) (Continued)
May 31, 2019 |
| |
Shares
| | | | | | | | Value | |
| | | | | Miscellaneous Manufacturing - 2.6% | | | | | | | | |
| | | 52,918 | | Siemens AG | | | | | | $ | 3,003,626 | |
| | | | | | | | | | | | | |
| | | | | Oil & Gas - 7.0% | | | | | | | | |
| | | 36,451 | | Phillips 66 | | | | | | | 2,945,241 | |
| | | 44,210 | | Royal Dutch Shell PLC | | | | | | | 2,779,040 | |
| | | 76,027 | | Suncor Energy, Inc. | | | | | | | 2,341,632 | |
| | | | | | | | | | | | 8,065,913 | |
| | | | | Packaging & Containers - 2.1% | | | | | | | | |
| | | 71,880 | | Westrock Co. | | | | | | | 2,343,288 | |
| | | | | | | | | | | | | |
| | | | | Pharmaceuticals - 8.2% | | | | | | | | |
| | | 86,984 | | GlaxoSmithKline PLC | | | | | | | 3,361,062 | |
| | | 25,035 | | Johnson & Johnson | | | | | | | 3,283,340 | |
| | | 69,040 | | Sanofi | | | | | | | 2,791,287 | |
| | | | | | | | | | | | 9,435,689 | |
| | | | | Retail - 8.3% | | | | | | | | |
| | | 34,326 | | Kohl’s Corp. | | | | | | | 1,692,958 | |
| | | 102,114 | | Macy’s, Inc. | | | | | | | 2,100,485 | |
| | | 89,777 | | Tapestry, Inc. | | | | | | | 2,564,031 | |
| | | 63,758 | | Walgreens Boots Alliance, Inc. | | | | | | | 3,145,820 | |
| | | | | | | | | | | | 9,503,294 | |
| | | | | Semiconductors - 5.0% | | | | | | | | |
| | | 65,183 | | Intel Corp. | | | | | | | 2,870,660 | |
| | | 42,178 | | Skyworks Solutions, Inc. | | | | | | | 2,810,320 | |
| | | | | | | | | | | | 5,680,980 | |
| | | | | Telecommunications - 3.5% | | | | | | | | |
| | | 138,081 | | Deutsche Telekom AG | | | | | | | 2,326,665 | |
| | | 75,439 | | NTT DoCoMo, Inc. (a) | | | | | | | 1,734,343 | |
| | | | | | | | | | | | 4,061,008 | |
| | | | | Transportation - 2.5% | | | | | | | | |
| | | 96,184 | | Deutsche Post AG | | | | | | | 2,825,886 | |
| | | | | | | | | | | | | |
| | | | | TOTAL COMMON STOCKS (Cost - $106,567,762) | | | | | | | 102,082,249 | |
| | | | | | | | | | | | | |
| | | | | PREFERRED STOCKS - 0.2% | | | | | | | | |
| | | | | Real Estate Investment Trusts - 0.2% | | | | | | | | |
| | | 25,673 | | CBL & Associates Properties, Inc., Series E, 6.63% (d) | | | | | | | 211,032 | |
| | | | | TOTAL PREFERRED STOCKS (Cost - $226,072) | | | | | | | 211,032 | |
See accompanying notes to financial statements.
35
Horizon Active Dividend Fund
PORTFOLIO OF INVESTMENTS (Unaudited) (Continued)
May 31, 2019 |
| |
Contracts
| | | | Notional
Amount | | | Value | |
| | | | | PURCHASED OPTIONS - 0.2% (b) | | | | | | | | |
| | | | | PURCHASED PUT OPTIONS - 0.2% | | | | | | | | |
| | | | | S&P 500 Index (a)(e) | | | | | | | | |
| | | 45 | | Expiration: June 2019, Exercise Price: $2,800 | | $ | 12,384,270 | | | $ | 256,275 | |
| | | | | TOTAL PURCHASED PUT OPTIONS (Cost - $118,419) | | | | | | | 256,275 | |
| | | | | | | | | | | | | |
| | | | | TOTAL PURCHASED OPTIONS (Cost - $118,419) | | | | | | | 256,275 | |
| | | | | | | | | | | | | |
| | Shares | | | | | | | | | | |
| | | | | SHORT-TERM INVESTMENTS - 11.1% | | | | | | | | |
| | | | | Money Market Funds - 11.1% | | | | | | | | |
| | | 12,725,525 | | First American Treasury Obligations Fund, Class X, 2.30% (c) | | | | | | | 12,725,525 | |
| | | | | TOTAL SHORT-TERM INVESTMENTS (Cost - $12,725,525) | | | | | | | 12,725,525 | |
| | | | | | | | | | | | | |
| | | | | INVESTMENTS PURCHASED WITH PROCEEDS FROM SECURITIES LENDING - 0.1% | | | | | | | | |
| | | | | Money Market Funds - 0.1% | | | | | | | | |
| | | 68,000 | | First American Government Obligations Fund, Class Z, 2.26% (c) | | | | | | | 68,000 | |
| | | | | TOTAL INVESTMENTS PURCHASED WITH PROCEEDS FROM SECURITIES LENDING (Cost - $68,000) | | | | | | | 68,000 | |
| | | | | | | | | | | | | |
| | | | | TOTAL INVESTMENTS - 100.7% (Cost - $119,705,778) | | | | | | | 115,343,081 | |
| | | | | Liabilities in Excess of Other Assets - (0.7)% | | | | | | | (816,920 | ) |
| | | | | NET ASSETS - 100.0% | | | | | | $ | 114,526,161 | |
| | | | | | | | | | | | | |
| | Contracts | | | | | | | | | | |
| | | | | SCHEDULE OF WRITTEN OPTIONS - (0.1)% (b) | | | | | | | | |
| | | | | SCHEDULE OF WRITTEN PUT OPTIONS - (0.1)% | | | | | | | | |
| | | | | S&P 500 Index (a) | | | | | | | | |
| | | 45 | | Expiration: June 2019, Exercise Price $2,725 | | | 12,384,270 | | | | 81,450 | |
| | | | | TOTAL WRITTEN PUT OPTIONS (Premiums Received - $53,931) | | | | | | | 81,450 | |
| | | | | | | | | | | | | |
| | | | | TOTAL WRITTEN OPTIONS (Premiums Received - $53,931) | | | | | | $ | 81,450 | |
Percentages are stated as a percent of net assets.
(a) | Non-income producing security. |
(b) | Each Option is exercisable into 100 shares of the underlying security. |
(c) | Money Market Fund; interest rate reflects seven-day yield on May 31, 2019. |
(d) | All or a portion of this security is out on loan as of May 31, 2019. |
(e) | Held in connection with a written option, see Schedule of Written Options for more details. |
See accompanying notes to financial statements.
36
Horizon Defined Risk Fund
PORTFOLIO OF INVESTMENTS (Unaudited)
May 31, 2019 |
| |
Shares
| | | | | | | | Value | |
| | | | | COMMON STOCKS - 95.8% | | | | | | | | |
| | | | | Aerospace/Defense - 2.5% | | | | | | | | |
| | | 2,119 | | Boeing Co. (e) | | | | | | $ | 723,872 | |
| | | 1,098 | | General Dynamics Corp. | | | | | | | 176,580 | |
| | | 430 | | Harris Corp. | | | | | | | 80,492 | |
| | | 1,049 | | Lockheed Martin Corp. | | | | | | | 355,128 | |
| | | 636 | | Northrop Grumman Corp. | | | | | | | 192,867 | |
| | | 1,049 | | Raytheon Co. | | | | | | | 183,051 | |
| | | 177 | | TransDigm Group, Inc. (a) | | | | | | | 78,048 | |
| | | 3,856 | | United Technologies Corp. (e) | | | | | | | 487,013 | |
| | | | | | | | | | | | 2,277,051 | |
| | | | | Agriculture - 1.0% | | | | | | | | |
| | | 7,066 | | Altria Group, Inc. | | | | | | | 346,658 | |
| | | 2,090 | | Archer-Daniels-Midland Co. | | | | | | | 80,089 | |
| | | 5,863 | | Philip Morris International, Inc. (e) | | | | | | | 452,213 | |
| | | | | | | | | | | | 878,960 | |
| | | | | Airlines - 0.4% | | | | | | | | |
| | | 1,710 | | American Airlines Group, Inc. | | | | | | | 46,563 | |
| | | 2,572 | | Delta Air Lines, Inc. | | | | | | | 132,458 | |
| | | 2,090 | | Southwest Airlines Co. | | | | | | | 99,484 | |
| | | 1,007 | | United Continental Holdings, Inc. (a) | | | | | | | 78,194 | |
| | | | | | | | | | | | 356,699 | |
| | | | | Apparel - 0.7% | | | | | | | | |
| | | 212 | | Kontoor Brands, Inc. (a) | | | | | | | 6,199 | |
| | | 5,965 | | Nike, Inc., Class B (e) | | | | | | | 460,140 | |
| | | 1,481 | | VF Corp. | | | | | | | 121,264 | |
| | | | | | | | | | | | 587,603 | |
| | | | | Auto Manufacturers - 0.5% | | | | | | | | |
| | | 14,974 | | Ford Motor Co. | | | | | | | 142,552 | |
| | | 5,300 | | General Motors Co. | | | | | | | 176,702 | |
| | | 1,302 | | PACCAR, Inc. | | | | | | | 85,698 | |
| | | | | | | | | | | | 404,952 | |
| | | | | Auto Parts & Equipment - 0.1% | | | | | | | | |
| | | 982 | | Aptiv PLC | | | | | | | 62,887 | |
| | | | | | | | | | | | | |
| | | | | Banks - 6.2% | | | | | | | | |
| | | 36,799 | | Bank of America Corp. (e) | | | | | | | 978,853 | |
| | | 3,706 | | Bank of New York Mellon Corp. | | | | | | | 158,209 | |
| | | 2,867 | | BB&T Corp. | | | | | | | 134,032 | |
| | | 1,767 | | Capital One Financial Corp. | | | | | | | 151,732 | |
| | | 9,145 | | Citigroup, Inc. (e) | | | | | | | 568,362 | |
| | | 1,762 | | Citizens Financial Group, Inc. | | | | | | | 57,406 | |
| | | 590 | | Comerica, Inc. | | | | | | | 40,604 | |
| | | 2,462 | | Fifth Third Bancorp | | | | | | | 65,243 | |
See accompanying notes to financial statements.
37
Horizon Defined Risk Fund
PORTFOLIO OF INVESTMENTS (Unaudited) (Continued)
May 31, 2019 |
| |
Shares
| | | | | | | | Value | |
| | | 1,432 | | Goldman Sachs Group, Inc. | | | | | | $ | 261,326 | |
| | | 3,972 | | Huntington Bancshares, Inc. | | | | | | | 50,246 | |
| | | 12,472 | | JPMorgan Chase & Co. (e) | | | | | | | 1,321,533 | |
| | | 3,858 | | KeyCorp | | | | | | | 61,612 | |
| | | 501 | | M&T Bank Corp. | | | | | | | 79,960 | |
| | | 6,442 | | Morgan Stanley | | | | | | | 262,125 | |
| | | 815 | | Northern Trust Corp. | | | | | | | 69,699 | |
| | | 1,710 | | PNC Financial Services Group, Inc. | | | | | | | 217,615 | |
| | | 4,121 | | Regions Financial Corp. | | | | | | | 56,993 | |
| | | 1,422 | | State Street Corp. | | | | | | | 78,565 | |
| | | 1,671 | | SunTrust Banks, Inc. | | | | | | | 100,277 | |
| | | 17,674 | | Wells Fargo & Co. (e) | | | | | | | 784,195 | |
| | | | | | | | | | | | 5,498,587 | |
| | | | | Beverages - 1.9% | | | | | | | | |
| | | 16,047 | | Coca-Cola Co. (e) | | | | | | | 788,389 | |
| | | 695 | | Constellation Brands, Inc., Class A | | | | | | | 122,633 | |
| | | 2,064 | | Monster Beverage Corp. (a) | | | | | | | 127,679 | |
| | | 5,322 | | PepsiCo, Inc. (e) | | | | | | | 681,216 | |
| | | | | | | | | | | | 1,719,917 | |
| | | | | Biotechnology - 1.8% | | | | | | | | |
| | | 821 | | Alexion Pharmaceuticals, Inc. (a) | | | | | | | 93,331 | |
| | | 2,382 | | Amgen, Inc. (e) | | | | | | | 397,079 | |
| | | 737 | | Biogen, Inc. (a) | | | | | | | 161,617 | |
| | | 2,610 | | Celgene Corp. (a) | | | | | | | 244,792 | |
| | | 4,862 | | Gilead Sciences, Inc. | | | | | | | 302,660 | |
| | | 531 | | Illumina, Inc. (a) | | | | | | | 162,969 | |
| | | 386 | | Regeneron Pharmaceuticals, Inc. (a) | | | | | | | 116,464 | |
| | | 952 | | Vertex Pharmaceuticals, Inc. (a) | | | | | | | 158,203 | |
| | | | | | | | | | | | 1,637,115 | |
| | | | | Building Materials - 0.3% | | | | | | | | |
| | | 3,470 | | Johnson Controls International PLC | | | | | | | 133,664 | |
| | | 215 | | Martin Marietta Materials, Inc. | | | | | | | 45,258 | |
| | | 476 | | Vulcan Materials Co. | | | | | | | 59,457 | |
| | | | | | | | | | | | 238,379 | |
| | | | | Chemicals - 1.7% | | | | | | | | |
| | | 816 | | Air Products & Chemicals, Inc. | | | | | | | 166,130 | |
| | | 391 | | Albemarle Corp. | | | | | | | 24,750 | |
| | | 852 | | CF Industries Holdings, Inc. | | | | | | | 34,285 | |
| | | 2,818 | | Dow, Inc. (e) | | | | | | | 131,770 | |
| | | 8,598 | | DowDuPont, Inc. (e) | | | | | | | 262,411 | |
| | | 501 | | Eastman Chemical Co. | | | | | | | 32,525 | |
| | | 492 | | FMC Corp. | | | | | | | 36,137 | |
| | | 386 | | International Flavors & Fragrances, Inc. | | | | | | | 52,272 | |
| | | 2,062 | | Linde PLC | | | | | | | 372,294 | |
See accompanying notes to financial statements.
38
Horizon Defined Risk Fund
PORTFOLIO OF INVESTMENTS (Unaudited) (Continued)
May 31, 2019 |
| |
Shares
| | | | | | | | Value | |
| | | 1,432 | | LyondellBasell Industries NV, Class A | | | | | | $ | 106,326 | |
| | | 1,424 | | Mosaic Co. | | | | | | | 30,573 | |
| | | 883 | | PPG Industries, Inc. | | | | | | | 92,406 | |
| | | 336 | | Sherwin-Williams Co. | | | | | | | 140,935 | |
| | | | | | | | | | | | 1,482,814 | |
| | | | | Commercial Services - 2.1% | | | | | | | | |
| | | 1,633 | | Automatic Data Processing, Inc. | | | | | | | 261,476 | |
| | | 386 | | Cintas Corp. | | | | | | | 85,626 | |
| | | 1,072 | | Ecolab, Inc. | | | | | | | 197,344 | |
| | | 432 | | Equifax, Inc. | | | | | | | 52,229 | |
| | | 316 | | FleetCor Technologies, Inc. (a) | | | | | | | 81,594 | |
| | | 583 | | Global Payments, Inc. (f) | | | | | | | 89,805 | |
| | | 1,457 | | IHS Markit Ltd. (a) | | | | | | | 83,617 | |
| | | 695 | | Moody’s Corp. | | | | | | | 127,102 | |
| | | 4,405 | | PayPal Holdings, Inc. (a) | | | | | | | 483,449 | |
| | | 1,216 | | Rollins, Inc. | | | | | | | 45,685 | |
| | | 929 | | S&P Global, Inc. | | | | | | | 198,695 | |
| | | 666 | | Total System Services, Inc. | | | | | | | 82,271 | |
| | | 605 | | Verisk Analytics, Inc. | | | | | | | 84,700 | |
| | | | | | | | | | | | 1,873,593 | |
| | | | | Computers - 4.9% | | | | | | | | |
| | | 2,382 | | Accenture PLC, Class A | | | | | | | 424,163 | |
| | | 17,778 | | Apple, Inc. (e) | | | | | | | 3,112,395 | |
| | | 2,167 | | Cognizant Technology Solutions Corp., Class A | | | | | | | 134,202 | |
| | | 1,040 | | DXC Technology Co. | | | | | | | 49,442 | |
| | | 5,553 | | Hewlett Packard Enterprise Co. | | | | | | | 76,187 | |
| | | 5,933 | | HP, Inc. | | | | | | | 110,828 | |
| | | 3,407 | | International Business Machines Corp. (e) | | | | | | | 432,655 | |
| | | 965 | | NetApp, Inc. | | | | | | | 57,128 | |
| | | | | | | | | | | | 4,397,000 | |
| | | | | Cosmetics/Personal Care - 1.6% | | | | | | | | |
| | | 3,252 | | Colgate-Palmolive Co. | | | | | | | 226,404 | |
| | | 1,362 | | Estee Lauder Cos., Inc., Class A | | | | | | | 219,323 | |
| | | 9,361 | | Procter & Gamble Co. (e) | | | | | | | 963,341 | |
| | | | | | | | | | | | 1,409,068 | |
| | | | | Distribution/Wholesale - 0.2% | | | | | | | | |
| | | 865 | | Copart, Inc. (a) | | | | | | | 61,830 | |
| | | 2,130 | | Fastenal Co. | | | | | | | 65,157 | |
| | | 200 | | WW Grainger, Inc. | | | | | | | 52,338 | |
| | | | | | | | | | | | 179,325 | |
| | | | | Diversified Financial Services - 4.4% | | | | | | | | |
| | | 3,190 | | American Express Co. | | | | | | | 365,925 | |
| | | 495 | | Ameriprise Financial, Inc. | | | | | | | 68,424 | |
| | | 596 | | BlackRock, Inc. (e) | | | | | | | 247,674 | |
See accompanying notes to financial statements.
39
Horizon Defined Risk Fund
PORTFOLIO OF INVESTMENTS (Unaudited) (Continued)
May 31, 2019 |
| |
Shares
| | | | | | | | Value | |
| | | 5,077 | | Charles Schwab Corp. | | | | | | $ | 211,254 | |
| | | 1,340 | | CME Group, Inc. | | | | | | | 257,441 | |
| | | 1,244 | | Discover Financial Services | | | | | | | 92,740 | |
| | | 1,946 | | Franklin Resources, Inc. | | | | | | | 61,922 | |
| | | 2,147 | | Intercontinental Exchange, Inc. | | | | | | | 176,505 | |
| | | 3,856 | | MasterCard, Inc., Class A (e) | | | | | | | 969,745 | |
| | | 605 | | Nasdaq, Inc. | | | | | | | 54,837 | |
| | | 2,691 | | Synchrony Financial | | | | | | | 90,498 | |
| | | 883 | | T. Rowe Price Group, Inc. | | | | | | | 89,307 | |
| | | 7,583 | | Visa, Inc., Class A (e) | | | | | | | 1,223,365 | |
| | | | | | | | | | | | 3,909,637 | |
| | | | | Electric - 2.9% | | | | | | | | |
| | | 893 | | Ameren Corp. | | | | | | | 65,493 | |
| | | 1,840 | | American Electric Power Co., Inc. | | | | | | | 158,461 | |
| | | 1,866 | | CenterPoint Energy, Inc. | | | | | | | 53,069 | |
| | | 1,045 | | CMS Energy Corp. | | | | | | | 58,635 | |
| | | 1,162 | | Consolidated Edison, Inc. | | | | | | | 100,281 | |
| | | 2,445 | | Dominion Energy, Inc. | | | | | | | 183,815 | |
| | | 666 | | DTE Energy Co. | | | | | | | 83,563 | |
| | | 2,668 | | Duke Energy Corp. | | | | | | | 228,408 | |
| | | 1,211 | | Edison International | | | | | | | 71,897 | |
| | | 662 | | Entergy Corp. | | | | | | | 64,260 | |
| | | 996 | | Evergy, Inc. | | | | | | | 57,907 | |
| | | 1,172 | | Eversource Energy | | | | | | | 86,540 | |
| | | 3,626 | | Exelon Corp. | | | | | | | 174,338 | |
| | | 1,905 | | FirstEnergy Corp. | | | | | | | 78,562 | |
| | | 1,782 | | NextEra Energy, Inc. | | | | | | | 353,210 | |
| | | 1,116 | | NRG Energy, Inc. | | | | | | | 37,989 | |
| | | 1,952 | | PG&E Corp. (a) | | | | | | | 33,379 | |
| | | 2,694 | | PPL Corp. | | | | | | | 80,173 | |
| | | 1,890 | | Public Service Enterprise Group, Inc. | | | | | | | 111,056 | |
| | | 1,015 | | Sempra Energy | | | | | | | 133,422 | |
| | | 3,801 | | Southern Co. | | | | | | | 203,354 | |
| | | 1,169 | | WEC Energy Group, Inc. | | | | | | | 94,163 | |
| | | 1,918 | | Xcel Energy, Inc. | | | | | | | 109,978 | |
| | | | | | | | | | | | 2,621,953 | |
| | | | | Electrical Components & Equipment - 0.2% | | | | | | | | |
| | | 852 | | AMETEK, Inc. | | | | | | | 69,770 | |
| | | 2,349 | | Emerson Electric Co. | | | | | | | 141,504 | |
| | | | | | | | | | | | 211,274 | |
| | | | | Electronics - 1.2% | | | | | | | | |
| | | 1,187 | | Agilent Technologies, Inc. | | | | | | | 79,588 | |
| | | 1,114 | | Amphenol Corp., Class A | | | | | | | 96,918 | |
| | | 2,986 | | Corning, Inc. | | | | | | | 86,116 | |
See accompanying notes to financial statements.
40
Horizon Defined Risk Fund
PORTFOLIO OF INVESTMENTS (Unaudited) (Continued)
May 31, 2019 |
| |
Shares
| | | | | | | | Value | |
| | | 1,244 | | Fortive Corp. | | | | | | $ | 94,731 | |
| | | 724 | | Garmin Ltd. | | | | | | | 55,372 | |
| | | 2,773 | | Honeywell International, Inc. | | | | | | | 455,632 | |
| | | 1,280 | | TE Connectivity Ltd. | | | | | | | 107,814 | |
| | | 268 | | Waters Corp. (a) | | | | | | | 53,790 | |
| | | | | | | | | | | | 1,029,961 | |
| | | | | Engineering & Construction - 0.0% (b) | | | | | | | | |
| | | 524 | | Jacobs Engineering Group, Inc. | | | | | | | 39,452 | |
| | | | | | | | | | | | | |
| | | | | Environmental Control - 0.3% | | | | | | | | |
| | | 1,206 | | Republic Services, Inc. | | | | | | | 102,016 | |
| | | 1,598 | | Waste Management, Inc. | | | | | | | 174,741 | |
| | | | | | | | | | | | 276,757 | |
| | | | | Food - 1.1% | | | | | | | | |
| | | 2,234 | | General Mills, Inc. | | | | | | | 110,449 | |
| | | 776 | | Hershey Co. | | | | | | | 102,401 | |
| | | 1,999 | | Hormel Foods Corp. | | | | | | | 78,940 | |
| | | 1,280 | | Kellogg Co. | | | | | | | 67,277 | |
| | | 4,603 | | Kraft Heinz Co. | | | | | | | 127,273 | |
| | | 5,471 | | Mondelez International, Inc., Class A | | | | | | | 278,200 | |
| | | 1,950 | | Sysco Corp. | | | | | | | 134,199 | |
| | | 1,476 | | Tyson Foods, Inc., Class A | | | | | | | 112,014 | |
| | | | | | | | | | | | 1,010,753 | |
| | | | | Forest Products & Paper - 0.1% | | | | | | | | |
| | | 1,498 | | International Paper Co. | | | | | | | 62,122 | |
| | | | | | | | | | | | | |
| | | | | Hand/Machine Tools - 0.1% | | | | | | | | |
| | | 553 | | Stanley Black & Decker, Inc. | | | | | | | 70,353 | |
| | | | | | | | | | | | | |
| | | | | Healthcare Products - 3.4% | | | | | | | | |
| | | 6,576 | | Abbott Laboratories (e) | | | | | | | 500,631 | |
| | | 144 | | ABIOMED, Inc. (a) | | | | | | | 37,717 | |
| | | 277 | | Align Technology, Inc. (a) | | | | | | | 78,765 | |
| | | 1,980 | | Baxter International, Inc. | | | | | | | 145,411 | |
| | | 980 | | Becton Dickinson & Co. | | | | | | | 228,771 | |
| | | 2,618 | | Danaher Corp. | | | | | | | 345,602 | |
| | | 765 | | Edwards Lifesciences Corp. (a) | | | | | | | 130,586 | |
| | | 301 | | IDEXX Laboratories, Inc. (a) | | | | | | | 75,181 | |
| | | 415 | | Intuitive Surgical, Inc. (a) | | | | | | | 192,913 | |
| | | 5,073 | | Medtronic PLC (e) | | | | | | | 469,658 | |
| | | 506 | | ResMed, Inc. | | | | | | | 57,745 | |
| | | 1,396 | | Stryker Corp. | | | | | | | 255,803 | |
| | | 1,493 | | Thermo Fisher Scientific, Inc. | | | | | | | 398,601 | |
| | | 737 | | Zimmer Biomet Holdings, Inc. | | | | | | | 83,966 | |
| | | | | | | | | | | | 3,001,350 | |
See accompanying notes to financial statements.
41
Horizon Defined Risk Fund
PORTFOLIO OF INVESTMENTS (Unaudited) (Continued)
May 31, 2019 |
| |
Shares
| | | | | | | | Value | |
| | | | | Healthcare Services - 1.9% | | | | | | | | |
| | | 956 | | Anthem, Inc. | | | | | | $ | 265,749 | |
| | | 1,495 | | Centene Corp. (a) | | | | | | | 86,336 | |
| | | 1,277 | | HCA Healthcare, Inc. | | | | | | | 154,466 | |
| | | 501 | | Humana, Inc. | | | | | | | 122,675 | |
| | | 730 | | IQVIA Holdings, Inc. (a) | | | | | | | 99,171 | |
| | | 351 | | Laboratory Corp. of America Holdings (a) | | | | | | | 57,076 | |
| | | 3,594 | | UnitedHealth Group, Inc. (e) | | | | | | | 869,029 | |
| | | | | | | | | | | | 1,654,502 | |
| | | | | Home Builders - 0.1% | | | | | | | | |
| | | 1,402 | | DR Horton, Inc. | | | | | | | 59,949 | |
| | | 1,201 | | Lennar Corp., Class A | | | | | | | 59,642 | |
| | | | | | | | | | | | 119,591 | |
| | | | | Household Products/Wares - 0.2% | | | | | | | | |
| | | 1,277 | | Kimberly-Clark Corp. | | | | | | | 163,315 | |
| | | | | | | | | | | | | |
| | | | | Insurance - 4.3% | | | | | | | | |
| | | 2,844 | | Aflac, Inc. | | | | | | | 145,897 | |
| | | 1,277 | | Allstate Corp. | | | | | | | 121,966 | |
| | | 3,294 | | American International Group, Inc. | | | | | | | 168,225 | |
| | | 883 | | Aon PLC, Class A | | | | | | | 159,002 | |
| | | 672 | | Arthur J Gallagher & Co. | | | | | | | 56,582 | |
| | | 9,263 | | Berkshire Hathaway, Inc., Class B (a) (e) | | | | | | | 1,828,701 | |
| | | 1,716 | | Chubb Ltd. | | | | | | | 250,656 | |
| | | 1,332 | | Hartford Financial Services Group, Inc. | | | | | | | 70,143 | |
| | | 785 | | Lincoln National Corp. | | | | | | | 46,668 | |
| | | 1,169 | | Loews Corp. | | | | | | | 60,040 | |
| | | 1,880 | | Marsh & McLennan Cos., Inc. | | | | | | | 179,728 | |
| | | 3,701 | | MetLife, Inc. | | | | | | | 171,023 | |
| | | 1,040 | | Principal Financial Group, Inc. | | | | | | | 53,633 | |
| | | 2,179 | | Progressive Corp. | | | | | | | 172,751 | |
| | | 1,549 | | Prudential Financial, Inc. | | | | | | | 143,097 | |
| | | 982 | | Travelers Cos., Inc. | | | | | | | 142,950 | |
| | | 469 | | Willis Towers Watson PLC | | | | | | | 82,310 | |
| | | | | | | | | | | | 3,853,372 | |
| | | | | Internet - 10.3% | | | | | | | | |
| | | 2,579 | | Alphabet, Inc., Class A (a) (e) | | | | | | | 2,853,664 | |
| | | 1,819 | | Amazon.com, Inc. (a) (e) | | | | | | | 3,228,852 | |
| | | 155 | | Booking Holdings, Inc. (a) | | | | | | | 256,714 | |
| | | 3,611 | | eBay, Inc. | | | | | | | 129,743 | |
| | | 542 | | Expedia Group, Inc. | | | | | | | 62,330 | |
| | | 10,830 | | Facebook, Inc., Class A (a) (e) | | | | | | | 1,922,000 | |
| | | 1,627 | | Netflix, Inc. (a) (e) | | | | | | | 558,517 | |
| | | 2,840 | | Twitter, Inc. (a) | | | | | | | 103,490 | |
See accompanying notes to financial statements.
42
Horizon Defined Risk Fund
PORTFOLIO OF INVESTMENTS (Unaudited) (Continued)
May 31, 2019 |
| |
Shares
| | | | | | | | Value | |
| | | 439 | | VeriSign, Inc. (a) | | | | | | $ | 85,596 | |
| | | | | | | | | | | | 9,200,906 | |
| | | | | Iron/Steel - 0.1% | | | | | | | | |
| | | 1,172 | | Nucor Corp. | | | | | | | 56,256 | |
| | | | | | | | | | | | | |
| | | | | Leisure Time - 0.3% | | | | | | | | |
| | | 2,595 | | Carnival Corp. | | | | | | | 132,838 | |
| | | 776 | | Royal Caribbean Cruises Ltd. | | | | | | | 94,486 | |
| | | | | | | | | | | | 227,324 | |
| | | | | Lodging - 0.4% | | | | | | | | |
| | | 1,110 | | Hilton Worldwide Holdings, Inc. | | | | | | | 99,278 | |
| | | 1,296 | | Marriott International, Inc., Class A | | | | | | | 161,793 | |
| | | 1,986 | | MGM Resorts International | | | | | | | 49,293 | |
| | | 391 | | Wynn Resorts Ltd. | | | | | | | 41,966 | |
| | | | | | | | | | | | 352,330 | |
| | | | | Machinery - Construction & Mining - 0.3% | | | | | | | | |
| | | 2,209 | | Caterpillar, Inc. | | | | | | | 264,660 | |
| | | | | | | | | | | | | |
| | | | | Machinery - Diversified - 0.6% | | | | | | | | |
| | | 596 | | Cummins, Inc. | | | | | | | 89,853 | |
| | | 1,201 | | Deere & Co. | | | | | | | 168,344 | |
| | | 528 | | Dover Corp. | | | | | | | 47,209 | |
| | | 441 | | Rockwell Automation, Inc. | | | | | | | 65,643 | |
| | | 382 | | Roper Technologies, Inc. | | | | | | | 131,377 | |
| | | 171 | | Wabtec Corp. | | | | | | | 10,667 | |
| | | 652 | | Xylem, Inc. | | | | | | | 48,391 | |
| | | | | | | | | | | | 561,484 | |
| | | | | Media - 2.0% | | | | | | | | |
| | | 952 | | Charter Communications, Inc., Class A (a) | | | | | | | 358,714 | |
| | | 17,166 | | Comcast Corp., Class A (e) | | | | | | | 703,806 | |
| | | 5,555 | | Walt Disney Co. (e) | | | | | | | 733,482 | |
| | | | | | | | | | | | 1,796,002 | |
| | | | | Mining - 0.1% | | | | | | | | |
| | | 5,466 | | Freeport-McMoRan, Inc. | | | | | | | 53,075 | |
| | | 1,980 | | Newmont Goldcorp Corp. | | | | | | | 65,518 | |
| | | | | | | | | | | | 118,593 | |
| | | | | Miscellaneous Manufacturing - 1.3% | | | | | | | | |
| | | 2,179 | | 3M Co. (e) | | | | | | | 348,095 | |
| | | 1,622 | | Eaton Corp PLC | | | | | | | 120,823 | |
| | | 32,592 | | General Electric Co. | | | | | | | 307,669 | |
| | | 1,230 | | Illinois Tool Works, Inc. | | | | | | | 171,757 | |
| | | 905 | | Ingersoll-Rand PLC | | | | | | | 107,098 | |
| | | 476 | | Parker-Hannifin Corp. | | | | | | | 72,504 | |
See accompanying notes to financial statements.
43
Horizon Defined Risk Fund
PORTFOLIO OF INVESTMENTS (Unaudited) (Continued)
May 31, 2019 |
| |
Shares
| | | | | | | | Value | |
| | | 893 | | Textron, Inc. | | | | | | $ | 40,453 | |
| | | | | | | | | | | | 1,168,399 | |
| | | | | Oil & Gas - 3.8% | | | | | | | | |
| | | 1,880 | | Anadarko Petroleum Corp. | | | | | | | 132,295 | |
| | | 1,409 | | Apache Corp. | | | | | | | 36,733 | |
| | | 7,201 | | Chevron Corp. (e) | | | | | | | 819,834 | |
| | | 724 | | Concho Resources, Inc. | | | | | | | 70,959 | |
| | | 4,315 | | ConocoPhillips | | | | | | | 254,412 | |
| | | 1,895 | | Devon Energy Corp. | | | | | | | 47,678 | |
| | | 2,169 | | EOG Resources, Inc. | | | | | | | 177,598 | |
| | | 15,914 | | Exxon Mobil Corp. (e) | | | | | | | 1,126,234 | |
| | | 1,110 | | Hess Corp. | | | | | | | 62,005 | |
| | | 3,200 | | Marathon Oil Corp. | | | | | | | 42,080 | |
| | | 2,587 | | Marathon Petroleum Corp. | | | | | | | 118,976 | |
| | | 1,790 | | Noble Energy, Inc. | | | | | | | 38,306 | |
| | | 2,816 | | Occidental Petroleum Corp. | | | | | | | 140,152 | |
| | | 1,716 | | Phillips 66 | | | | | | | 138,653 | |
| | | 622 | | Pioneer Natural Resources Co. | | | | | | | 88,299 | |
| | | 1,602 | | Valero Energy Corp. | | | | | | | 112,781 | |
| | | | | | | | | | | | 3,406,995 | |
| | | | | Oil & Gas Services - 0.4% | | | | | | | | |
| | | 4,136 | | Baker Hughes & GE Co., Class A | | | | | | | 88,552 | |
| | | 3,279 | | Halliburton Co. | | | | | | | 69,810 | |
| | | 1,422 | | National Oilwell Varco, Inc. | | | | | | | 29,649 | |
| | | 5,202 | | Schlumberger Ltd. | | | | | | | 180,457 | |
| | | | | | | | | | | | 368,468 | |
| | | | | Packaging & Containers - 0.1% | | | | | | | | |
| | | 1,252 | | Ball Corp. | | | | | | | 76,860 | |
| | | 952 | | Westrock Co. | | | | | | | 31,035 | |
| | | | | | | | | | | | 107,895 | |
| | | | | Pharmaceuticals - 5.6% | | | | | | | | |
| | | 5,708 | | AbbVie, Inc. (e) | | | | | | | 437,861 | |
| | | 1,250 | | Allergan PLC | | | | | | | 152,388 | |
| | | 6,158 | | Bristol-Myers Squibb Co. | | | | | | | 279,388 | |
| | | 1,104 | | Cardinal Health, Inc. | | | | | | | 46,445 | |
| | | 899 | | Cigna Corp. | | | | | | | 133,070 | |
| | | 3,826 | | CVS Health Corp. | | | | | | | 200,368 | |
| | | 3,977 | | Eli Lilly & Co. (e) | | | | | | | 461,093 | |
| | | 10,075 | | Johnson & Johnson (e) | | | | | | | 1,321,336 | |
| | | 710 | | McKesson Corp. | | | | | | | 86,719 | |
| | | 9,984 | | Merck & Co., Inc. (e) | | | | | | | 790,833 | |
| | | 1,905 | | Mylan NV (a) | | | | | | | 32,004 | |
| | | 22,041 | | Pfizer, Inc. (e) | | | | | | | 915,142 | |
See accompanying notes to financial statements.
44
Horizon Defined Risk Fund
PORTFOLIO OF INVESTMENTS (Unaudited) (Continued)
May 31, 2019 |
| |
Shares
| | | | | | | | Value | |
| | | 1,792 | | Zoetis, Inc., Class A | | | | | | $ | 181,082 | |
| | | | | | | | | | | | 5,037,729 | |
| | | | | Pipelines - 0.4% | | | | | | | | |
| | | 8,302 | | Kinder Morgan, Inc. | | | | | | | 165,625 | |
| | | 1,531 | | ONEOK, Inc. | | | | | | | 97,402 | |
| | | 4,547 | | Williams Cos., Inc. | | | | | | | 119,950 | |
| | | | | | | | | | | | 382,977 | |
| | | | | Real Estate - 0.1% | | | | | | | | |
| | | 1,259 | | CBRE Group, Inc., Class A (a) | | | | | | | 57,536 | |
| | | | | | | | | | | | | |
| | | | | Real Estate Investment Trusts - 2.8% | | | | | | | | |
| | | 386 | | Alexandria Real Estate Equities, Inc. | | | | | | | 56,514 | |
| | | 1,649 | | American Tower Corp. | | | | | | | 344,262 | |
| | | 501 | | AvalonBay Communities, Inc. | | | | | | | 101,708 | |
| | | 561 | | Boston Properties, Inc. | | | | | | | 73,396 | |
| | | 1,549 | | Crown Castle International Corp. | | | | | | | 201,386 | |
| | | 803 | | Digital Realty Trust, Inc. | | | | | | | 94,529 | |
| | | 289 | | Equinix, Inc. | | | | | | | 140,393 | |
| | | 1,373 | | Equity Residential | | | | | | | 105,131 | |
| | | 230 | | Essex Property Trust, Inc. | | | | | | | 67,100 | |
| | | 463 | | Extra Space Storage, Inc. | | | | | | | 49,615 | |
| | | 1,754 | | HCP, Inc. | | | | | | | 55,619 | |
| | | 2,783 | | Host Hotels & Resorts, Inc. | | | | | | | 50,400 | |
| | | 417 | | Mid-America Apartment Communities, Inc. | | | | | | | 47,613 | |
| | | 2,349 | | Prologis, Inc. | | | | | | | 173,051 | |
| | | 641 | | Public Storage | | | | | | | 152,481 | |
| | | 1,091 | | Realty Income Corp. | | | | | | | 76,457 | |
| | | 662 | | Regency Centers Corp. | | | | | | | 43,666 | |
| | | 410 | | SBA Communications Corp. (a) | | | | | | | 88,728 | |
| | | 1,147 | | Simon Property Group, Inc. | | | | | | | 185,917 | |
| | | 1,065 | | UDR, Inc. | | | | | | | 47,691 | |
| | | 1,314 | | Ventas, Inc. | | | | | | | 84,490 | |
| | | 695 | | Vornado Realty Trust | | | | | | | 46,030 | |
| | | 1,396 | | Welltower, Inc. | | | | | | | 113,383 | |
| | | 2,811 | | Weyerhaeuser Co. | | | | | | | 64,091 | |
| | | | | | | | | | | | 2,463,651 | |
| | | | | Retail - 6.0% | | | | | | | | |
| | | 261 | | Advance Auto Parts, Inc. | | | | | | | 40,455 | |
| | | 71 | | AutoZone, Inc. (a) | | | | | | | 72,925 | |
| | | 1,020 | | Best Buy Co., Inc. | | | | | | | 63,923 | |
| | | 636 | | CarMax, Inc. (a) | | | | | | | 49,786 | |
| | | 78 | | Chipotle Mexican Grill, Inc. (a) | | | | | | | 51,478 | |
| | | 1,644 | | Costco Wholesale Corp. | | | | | | | 393,870 | |
| | | 441 | | Darden Restaurants, Inc. | | | | | | | 51,297 | |
See accompanying notes to financial statements.
45
Horizon Defined Risk Fund
PORTFOLIO OF INVESTMENTS (Unaudited) (Continued)
May 31, 2019 |
| |
Shares
| | | | | | | | Value | |
| | | 989 | | Dollar General Corp. | | | | | | $ | 125,880 | |
| | | 881 | | Dollar Tree, Inc. (a) | | | | | | | 89,501 | |
| | | 528 | | Genuine Parts Co. | | | | | | | 52,219 | |
| | | 4,294 | | Home Depot, Inc. (e) | | | | | | | 815,216 | |
| | | 613 | | Kohl’s Corp. | | | | | | | 30,233 | |
| | | 3,024 | | Lowe’s Cos., Inc. | | | | | | | 282,079 | |
| | | 1,169 | | Macy’s, Inc. | | | | | | | 24,046 | |
| | | 2,871 | | McDonald’s Corp. (e) | | | | | | | 569,233 | |
| | | 622 | | Nordstrom, Inc. | | | | | | | 19,469 | |
| | | 287 | | O’Reilly Automotive, Inc. (a) | | | | | | | 106,583 | |
| | | 1,402 | | Ross Stores, Inc. | | | | | | | 130,372 | |
| | | 4,919 | | Starbucks Corp. | | | | | | | 374,139 | |
| | | 1,068 | | Tapestry, Inc. | | | | | | | 30,502 | |
| | | 1,973 | | Target Corp. | | | | | | | 158,728 | |
| | | 439 | | Tiffany & Co. | | | | | | | 39,119 | |
| | | 4,681 | | TJX Cos., Inc. | | | | | | | 235,407 | |
| | | 441 | | Tractor Supply Co. | | | | | | | 44,444 | |
| | | 206 | | Ulta Beauty, Inc. (a) | | | | | | | 68,676 | |
| | | 3,559 | | Walgreens Boots Alliance, Inc. | | | | | | | 175,601 | |
| | | 11,038 | | Walmart, Inc. (e) | | | | | | | 1,119,695 | |
| | | 1,162 | | Yum! Brands, Inc. | | | | | | | 118,931 | |
| | | | | | | | | | | | 5,333,807 | |
| | | | | Semiconductors - 3.4% | | | | | | | | |
| | | 3,715 | | Advanced Micro Devices, Inc. (a) | | | | | | | 101,828 | |
| | | 1,385 | | Analog Devices, Inc. | | | | | | | 133,819 | |
| | | 3,701 | | Applied Materials, Inc. | | | | | | | 143,192 | |
| | | 1,535 | | Broadcom, Inc. (e) | | | | | | | 386,267 | |
| | | 17,255 | | Intel Corp. (e) | | | | | | | 759,910 | |
| | | 575 | | Lam Research Corp. | | | | | | | 100,401 | |
| | | 868 | | Microchip Technology, Inc. | | | | | | | 69,466 | |
| | | 4,255 | | Micron Technology, Inc. (a) | | | | | | | 138,756 | |
| | | 2,259 | | NVIDIA Corp. | | | | | | | 306,004 | |
| | | 5,539 | | QUALCOMM, Inc. | | | | | | | 370,116 | |
| | | 662 | | Skyworks Solutions, Inc. | | | | | | | 44,109 | |
| | | 3,601 | | Texas Instruments, Inc. | | | | | | | 375,620 | |
| | | 929 | | Xilinx, Inc. | | | | | | | 95,046 | |
| | | | | | | | | | | | 3,024,534 | |
| | | | | Software - 7.0% | | | | | | | | |
| | | 2,844 | | Activision Blizzard, Inc. | | | | | | | 123,344 | |
| | | 1,819 | | Adobe, Inc. (a) (e) | | | | | | | 492,767 | |
| | | 811 | | Autodesk, Inc. (a) | | | | | | | 130,498 | |
| | | 1,220 | | Cerner Corp. | | | | | | | 85,364 | |
| | | 1,116 | | Electronic Arts, Inc. (a) | | | | | | | 103,877 | |
| | | 1,211 | | Fidelity National Information Services, Inc. | | | | | | | 145,683 | |
See accompanying notes to financial statements.
46
Horizon Defined Risk Fund
PORTFOLIO OF INVESTMENTS (Unaudited) (Continued)
May 31, 2019 |
| |
Shares
| | | | | | | | Value | |
| | | 1,476 | | Fiserv, Inc. (a) | | | | | | $ | 126,729 | |
| | | 956 | | Intuit, Inc. | | | | | | | 234,077 | |
| | | 29,013 | | Microsoft Corp. (e) | | | | | | | 3,588,328 | |
| | | 14,303 | | Oracle Corp. (e) | | | | | | | 723,732 | |
| | | 1,332 | | Paychex, Inc. | | | | | | | 114,272 | |
| | | 2,816 | | salesforce.com, Inc. (a) | | | | | | | 426,371 | |
| | | | | | | | | | | | 6,295,042 | |
| | | | | Telecommunications - 3.0% | | | | | | | | |
| | | 268 | | Arista Networks, Inc. (a) | | | | | | | 65,550 | |
| | | 27,379 | | AT&T, Inc. (e) | | | | | | | 837,250 | |
| | | 17,072 | | Cisco Systems, Inc. (e) | | | | | | | 888,256 | |
| | | 596 | | Motorola Solutions, Inc. | | | | | | | 89,370 | |
| | | 15,550 | | Verizon Communications, Inc. (e) | | | | | | | 845,143 | |
| | | | | | | | | | | | 2,725,569 | |
| | | | | Toys/Games/Hobbies - 0.0% (b) | | | | | | | | |
| | | 457 | | Hasbro, Inc. | | | | | | | 43,479 | |
| | | | | | | | | | | | | |
| | | | | Transportation - 1.6% | | | | | | | | |
| | | 495 | | CH Robinson Worldwide, Inc. | | | | | | | 39,417 | |
| | | 3,165 | | CSX Corp. | | | | | | | 235,698 | |
| | | 641 | | Expeditors International of Washington, Inc. | | | | | | | 44,607 | |
| | | 980 | | FedEx Corp. | | | | | | | 151,194 | |
| | | 391 | | JB Hunt Transport Services, Inc. | | | | | | | 33,290 | |
| | | 1,015 | | Norfolk Southern Corp. | | | | | | | 198,067 | |
| | | 2,763 | | Union Pacific Corp. | | | | | | | 460,813 | |
| | | 3,217 | | United Parcel Service, Inc., Class B | | | | | | | 298,924 | |
| | | | | | | | | | | | 1,462,010 | |
| | | | | Water - 0.1% | | | | | | | | |
| | | 662 | | American Water Works Co., Inc. | | | | | | | 74,819 | |
| | | | | | | | | | | | | |
| | | | | TOTAL COMMON STOCKS (Cost - $78,914,430) | | | | | | | 85,558,807 | |
| | | | | | | | | | | | | |
| | Contracts | | | | Notional
Amount | | | | | |
| | | | | PURCHASED OPTIONS - 4.7% (c) | | | | | | | | |
| | | | | PURCHASED CALL OPTIONS - 0.0% (b) | | | | | | | | |
| | | | | iShares China Large-Cap ETF (a) | | | | | | | | |
| | | 250 | | Expiration: July 2019, Exercise Price: $42 | | $ | 1,009,250 | | | | 8,750 | |
| | | | | S&P 500 Index (a)(g) | | | | | | | | |
| | | 175 | | Expiration: June 2019, Exercise Price: $3,100 | | | 48,161,050 | | | | 437 | |
| | | | | TOTAL PURCHASED CALL OPTIONS (Cost - $48,968) | | | | | | | 9,187 | |
See accompanying notes to financial statements.
47
Horizon Defined Risk Fund
PORTFOLIO OF INVESTMENTS (Unaudited) (Continued)
May 31, 2019 |
| | Contracts | | | | Notional
Amount | | | Value | |
| | | | | PURCHASED PUT OPTIONS - 4.7% | | | | | | | | |
| | | | | Communication Services Select Sector SPDR Fund (a) | | | | | | | | |
| | | 1,409 | | Expiration: June 2019, Exercise Price: $48 | | $ | 6,634,981 | | | $ | 200,783 | |
| | | | | Consumer Discretionary Select Sector SPDR Fund (a) | | | | | | | | |
| | | 590 | | Expiration: June 2019, Exercise Price: $114 | | | 6,545,460 | | | | 227,150 | |
| | | | | Financial Select Sector SPDR Fund (a) | | | | | | | | |
| | | 4,216 | | Expiration: June 2019, Exercise Price: $26 | | | 10,965,816 | | | | 231,880 | |
| | | | | Health Care Select Sector SPDR Fund (a) | | | | | | | | |
| | | 1,074 | | Expiration: June 2019, Exercise Price: $87 | | | 9,373,872 | | | | 151,971 | |
| | | | | S&P 500 Index (a)(g) | | | | | | | | |
| | | 100 | | Expiration: June 2019, Exercise Price: $2,770 | | | 27,520,600 | | | | 530,500 | |
| | | 100 | | Expiration: July 2019, Exercise Price: $2,870 | | | 27,520,600 | | | | 1,319,000 | |
| | | 105 | | Expiration: August 2019, Exercise Price: $2,840 | | | 28,896,630 | | | | 1,319,325 | |
| | | | | Technology Select Sector SPDR Fund (a) | | | | | | | | |
| | | 897 | | Expiration: June 2019, Exercise Price: $74 | | | 6,448,533 | | | | 252,954 | |
| | | | | TOTAL PURCHASED PUT OPTIONS (Cost - $2,456,636) | | | | | | | 4,233,563 | |
| | | | | | | | | | | | | |
| | | | | TOTAL PURCHASED OPTIONS (Cost - $2,505,604) | | | | | | | 4,242,750 | |
| | | | | | | | | | | | | |
| | Shares | | | | | | | | | | |
| | | | | SHORT-TERM INVESTMENTS - 2.2% | | | | | | | | |
| | | | | Money Market Funds - 2.2% | | | | | | | | |
| | | 1,950,871 | | First American Treasury Obligations Fund, Class X, 2.30% (d) | | | | | | | 1,950,871 | |
| | | | | TOTAL SHORT-TERM INVESTMENTS (Cost - $1,950,871) | | | | | | | 1,950,871 | |
| | | | | | | | | | | | | |
| | | | | INVESTMENTS PURCHASED WITH PROCEEDS FROM SECURITIES LENDING - 0.0% (b) | | | | | | | | |
| | | | | Money Market Funds - 0.0% | | | | | | | | |
| | | 24,336 | | First American Government Obligations Fund, Class Z, 2.26% (d) | | | | | | | 24,336 | |
| | | | | TOTAL INVESTMENTS PURCHASED WITH PROCEEDS FROM SECURITIES LENDING (Cost - $24,336) | | | | | | | 24,336 | |
| | | | | | | | | | | | | |
| | | | | TOTAL INVESTMENTS - 102.7% (Cost - $83,395,241) | | | | | | | 91,776,764 | |
| | | | | Liabilities in Excess of Other Assets - (2.7)% | | | | | | | (2,373,157 | ) |
| | | | | NET ASSETS - 100.0% | | | | | | $ | 89,403,607 | |
See accompanying notes to financial statements.
48
Horizon Defined Risk Fund
PORTFOLIO OF INVESTMENTS (Unaudited) (Continued)
May 31, 2019 |
| | Contracts | | | | Notional
Amount | | | Value | |
| | | | | SCHEDULE OF WRITTEN OPTIONS - 3.0% (c) | | | | | | | | |
| | | | | SCHEDULE OF WRITTEN CALL OPTIONS - 0.0% (b) | | | | | | | | |
| | | | | S&P 500 Index (a) | | | | | | | | |
| | | 60 | | Expiration: August 2019, Exercise Price $2,980 | | $ | 16,512,360 | | | $ | 37,500 | |
| | | | | TOTAL WRITTEN CALL OPTIONS (Premiums Received - $188,908) | | | | | | | 37,500 | |
| | | | | | | | | | | | | |
| | | | | SCHEDULE OF WRITTEN PUT OPTIONS - (3.0)% | | | | | | | | |
| | | | | S&P 500 Index (a) | | | | | | | | |
| | | 50 | | Expiration: June 2019, Exercise Price $2,570 | | | 13,760,300 | | | | 31,000 | |
| | | 150 | | Expiration: June 2019, Exercise Price $2,870 | | | 41,280,900 | | | | 1,822,500 | |
| | | 100 | | Expiration: July 2019, Exercise Price $2,670 | | | 27,520,600 | | | | 396,500 | |
| | | 105 | | Expiration: August 2019, Exercise Price $2,610 | | | 28,896,630 | | | | 430,500 | |
| | | | | TOTAL WRITTEN PUT OPTIONS (Premiums Received - $1,267,477) | | | | | | | 2,680,500 | |
| | | | | | | | | | | | | |
| | | | | TOTAL WRITTEN OPTIONS (Premiums Received - $1,456,384) | | | | | | $ | 2,718,000 | |
(a) | Non-income producing security. |
(c) | Each Option is exercisable into 100 shares of the underlying security. |
(d) | Money Market Fund; rate reflects seven-day yield on May 31, 2019. |
(e) | All or a portion of the security is segregated as collateral for written options. The value of the securities segregated as collateral for written options is $36,920,096. |
(f) | All or a portion of this security is out on loan as of May 31, 2019. |
(g) | Held in connection with a written option, see Schedule of Written Options for more details. |
See accompanying notes to financial statements.
49
Horizon Funds Statements of Assets and Liabilities (Unaudited)
May 31, 2019 |
| | | Horizon Active
Asset Allocation
Fund | | | Horizon Active
Risk Assist® Fund | | | Horizon Active
Income Fund | |
Assets: | | | | | | | | | | | | |
Investments in Unaffiliated Securities, at Cost | | $ | 590,374,116 | | | $ | 897,602,270 | | | $ | 258,816,440 | |
Investments in Affiliated Securities, at Cost | | | 5,264,791 | | | | 55,913,366 | | | | 64,478,433 | |
Investments in Unaffiliated Securities, at Value (a) | | $ | 574,656,521 | | | $ | 874,083,205 | | | $ | 263,312,372 | |
Investments in Affiliated Securities, at Value | | | 5,120,702 | | | | 55,708,973 | | | | 65,820,241 | |
Cash | | | 2,259,801 | | | | 1,064,697 | | | | 121,675 | |
Receivable for Investment Securities Sold | | | 43,633,760 | | | | 2,346,030 | | | | — | |
Receivable for Fund Shares Sold | | | 824,850 | | | | 2,358,568 | | | | 642,672 | |
Dividends and Interest Receivable | | | 396,802 | | | | 335,630 | | | | 12,456 | |
Dividend Reclaims | | | 256 | | | | 820 | | | | — | |
Securities Lending Income Receivable | | | 5,995 | | | | 8,671 | | | | 69,139 | |
Prepaid Expenses and Other Assets | | | 66,591 | | | | 93,019 | | | | 51,248 | |
Total Assets | | | 626,965,278 | | | | 935,999,613 | | | | 330,029,803 | |
| | | | | | | | | | | | | |
Liabilities: | | | | | | | | | | | | |
Options written, at value (Premiums received $2,755,267, $1,577,933 and $258,101) | | | 2,294,000 | | | | 1,420,000 | | | | 300,000 | |
Collateral received for securities loaned (Note 5) | | | 70,882,042 | | | | 68,335,862 | | | | 57,530,682 | |
Payable for Investment Securities Purchased | | | 26,971,871 | | | | 1,572,968 | | | | — | |
Payable for Fund Shares Redeemed | | | 490,569 | | | | 570,396 | | | | 240,300 | |
Due to Broker | | | 14,514,922 | | | | 1,064,697 | | | | — | |
Accrued Advisory Fees | | | 466,744 | | | | 794,092 | | | | 175,990 | |
Accrued Custodian Fees | | | 5,686 | | | | 4,926 | | | | 2,594 | |
Accrued Trustees’ Fees and Expenses | | | 3,639 | | | | 2,468 | | | | 2,287 | |
Accrued Distribution Fees (12b-1) - Advisor Class | | | 6,510 | | | | 4,240 | | | | 860 | |
Accrued Shareholder Servicing Fees - Investor Class | | | 173,543 | | | | 257,045 | | | | 88,192 | |
Accrued Expenses and Other Liabilities | | | 112,550 | | | | 128,434 | | | | 72,481 | |
Total Liabilities | | | 115,922,076 | | | | 74,155,128 | | | | 58,413,386 | |
| | | | | | | | | | | | | |
Net Assets | | $ | 511,043,202 | | | $ | 861,844,485 | | | $ | 271,616,417 | |
| | | | | | | | | | | | | |
Composition of Net Assets: | | | | | | | | | | | | |
Net assets consisted of: | | | | | | | | | | | | |
Paid in Capital | | $ | 542,205,930 | | | $ | 921,250,276 | | | $ | 290,476,298 | |
Distributable Earnings/(Accumulated Deficit) | | | (31,162,728 | ) | | | (59,405,791 | ) | | | (18,859,881 | ) |
Net Assets | | $ | 511,043,202 | | | $ | 861,844,485 | | | $ | 271,616,417 | |
| | | | | | | | | | | | | |
Investor Class Shares: | | | | | | | | | | | | |
Net Asset Value Per Share: | | | | | | | | | | | | |
Net Assets | | $ | 475,298,646 | | | $ | 790,009,765 | | | $ | 261,512,827 | |
Shares of Beneficial Interest Outstanding | | | 41,659,967 | | | | 40,075,152 | | | | 28,251,124 | |
| | | | | | | | | | | | | |
Net Asset Value, (Net Assets / Shares Outstanding) Offering and Redemption Price Per Share | | $ | 11.41 | | | $ | 19.71 | | | $ | 9.26 | |
| | | | | | | | | | | | | |
Advisor Class Shares: | | | | | | | | | | | | |
Net Assets | | $ | 7,210,249 | | | $ | 172,307 | | | $ | 2,142,558 | |
Shares of Beneficial Interest Outstanding | | | 634,972 | | | | 8,742 | | | | 230,616 | |
| | | | | | | | | | | | | |
Net Asset Value, (Net Assets / Shares Outstanding) Offering and Redemption Price Per Share | | $ | 11.36 | | | $ | 19.71 | | | $ | 9.29 | |
| | | | | | | | | | | | | |
Institutional Class Shares: | | | | | | | | | | | | |
Net Assets | | $ | 28,534,307 | | | $ | 71,662,413 | | | $ | 7,961,032 | |
Shares of Beneficial Interest Outstanding | | | 2,496,738 | | | | 3,630,085 | | | | 861,330 | |
| | | | | | | | | | | | | |
Net Asset Value, (Net Assets / Shares Outstanding) Offering and Redemption Price Per Share | | $ | 11.43 | | | $ | 19.74 | | | $ | 9.24 | |
| | | | | | | | | | | | | |
(a) Includes loaned securities with a value of: | | $ | 68,440,625 | | | $ | 65,846,719 | | | $ | 56,679,985 | |
See accompanying notes to financial statements.
50
Horizon Funds
STATEMENTS OF ASSETS AND LIABILITIES (Unaudited) (Continued)
May 31, 2019 |
| | |
Horizon Active
Dividend Fund
| | | Horizon Defined
Risk Fund | |
Assets: | | | | | | | | |
Investments in Unaffiliated Securities, at Cost | | $ | 119,705,778 | | | $ | 83,395,241 | |
Investments in Unaffiliated Securities, at Value (a) | | $ | 115,343,081 | | | $ | 91,776,764 | |
Cash | | | 304,000 | | | | — | |
Cash Held at Broker | | | — | | | | 38,513 | |
Receivable for Investment Securities Sold | | | 2,392,668 | | | | 291,713 | |
Receivable for Fund Shares Sold | | | 361,666 | | | | — | |
Dividends and Interest Receivable | | | 634,580 | | | | 178,404 | |
Dividend Reclaims | | | 15,262 | | | | 542 | |
Securities Lending Income Receivable | | | 1,207 | | | | — | |
Prepaid Expenses and Other Assets | | | 40,355 | | | | 34,035 | |
Total Assets | | | 119,092,819 | | | | 92,319,971 | |
| | | | | | | | | |
Liabilities: | | | | | | | | |
Options written, at value (Premiums received $53,931 and $1,456,384) | | | 81,450 | | | | 2,718,000 | |
Collateral received for securities loaned (Note 5) | | | 68,000 | | | | 24,336 | |
Payable for Investment Securities Purchased | | | 4,243,664 | | | | 48,773 | |
Payable for Fund Shares Redeemed | | | 36,746 | | | | 29,621 | |
Accrued Advisory Fees | | | 71,514 | | | | 43,788 | |
Accrued Custodian Fees | | | 1,990 | | | | 3,927 | |
Accrued Trustees’ Fees and Expenses | | | 1,334 | | | | 1,366 | |
Accrued Distribution Fees (12b-1) - Investor Class | | | 9,175 | | | | 8,673 | |
Accrued Distribution Fees (12b-1) - Advisor Class | | | 32,476 | | | | 21,591 | |
Accrued Expenses and Other Liabilities | | | 20,309 | | | | 16,289 | |
Total Liabilities | | | 4,566,658 | | | | 2,916,364 | |
| | | | | | | | | |
Net Assets | | $ | 114,526,161 | | | $ | 89,403,607 | |
| | | | | | | | | |
Composition of Net Assets: | | | | | | | | |
Net assets consisted of: | | | | | | | | |
Paid in Capital | | $ | 118,420,952 | | | $ | 86,908,181 | |
Distributable Earnings/(Accumulated Deficit) | | | (3,894,791 | ) | | | 2,495,426 | |
Net Assets | | $ | 114,526,161 | | | $ | 89,403,607 | |
| | | | | | | | | |
Investor Class Shares: | | | | | | | | |
Net Asset Value Per Share: | | | | | | | | |
Net Assets | | $ | 95,666,455 | | | $ | 77,022,512 | |
Shares of Beneficial Interest Outstanding | | | 1,763,478 | | | | 1,531,498 | |
| | | | | | | | | |
Net Asset Value, (Net Assets / Shares Outstanding)
Offering and Redemption Price Per Share | | $ | 54.25 | | | $ | 50.29 | |
| | | | | | | | | |
Advisor Class Shares: | | | | | | | | |
Net Assets | | $ | 18,859,706 | | | $ | 12,381,095 | |
Shares of Beneficial Interest Outstanding | | | 347,669 | | | | 246,106 | |
| | | | | | | | | |
Net Asset Value, (Net Assets / Shares Outstanding)
Offering and Redemption Price Per Share | | $ | 54.25 | | | $ | 50.31 | |
| | | | | | | | | |
(a) Includes loaned securities with a value of: | | $ | 65,760 | | | $ | 24,030 | |
See accompanying notes to financial statements.
51
Horizon Funds Statements of Operations (Unaudited)
For the Period Ended May 31, 2019 |
| | | Horizon Active
Asset Allocation
Fund | | | Horizon Active
Risk Assist® Fund | | | Horizon Active
Income Fund | |
Investment Income: | | | | | | | | | | | | |
Dividend Income from unaffiliated securities (net of foreign withholdings tax of $0, $(73), $0) | | $ | 5,209,827 | | | $ | 7,102,011 | | | $ | 5,286,359 | |
Dividend Income from affiliated Securities | | | — | | | | 180,316 | | | | 693,724 | |
Interest Income | | | 82,231 | | | | 193,404 | | | | 72,699 | |
Securities Lending Income | | | — | | | | — | | | | 11,927 | |
Total Investment Income | | | 5,292,058 | | | | 7,475,731 | | | | 6,064,709 | |
| | | | | | | | | | | | | |
Expenses: | | | | | | | | | | | | |
Investment Advisory Fees | | | 2,490,718 | | | | 4,075,747 | | | | 1,011,392 | |
Shareholder Servicing Fees - Investor Class | | | 151,721 | | | | 263,997 | | | | 101,331 | |
Administrative & Accounting Service Fees | | | 144,536 | | | | 224,961 | | | | 82,090 | |
Transfer Agent Fees | | | 77,358 | | | | 81,845 | | | | 61,000 | |
Registration Fees | | | 43,482 | | | | 64,129 | | | | 36,352 | |
Legal Fees | | | 30,798 | | | | 40,060 | | | | 14,668 | |
Chief Compliance Officer & Compliance Fees | | | 29,120 | | | | 43,424 | | | | 15,328 | |
Trustees’ Fees and Expenses | | | 28,338 | | | | 41,360 | | | | 16,079 | |
Custodian Fees | | | 14,766 | | | | 30,398 | | | | 7,574 | |
Printing and Postage Expenses | | | 14,717 | | | | 18,955 | | | | 11,706 | |
Interest Expense | | | 13,312 | | | | — | | | | 644 | |
Miscellaneous Expenses | | | 11,563 | | | | 13,625 | | | | 6,399 | |
Distribution Fees (12b-1) - Advisor Class | | | 8,485 | | | | 459 | | | | 2,208 | |
Audit Fees | | | 8,477 | | | | 8,477 | | | | 8,477 | |
Insurance Fees | | | 7,531 | | | | 9,753 | | | | 3,872 | |
Total Expenses | | | 3,074,922 | | | | 4,917,190 | | | | 1,379,120 | |
Securities Lending Expense Offset | | | (138,846 | ) | | | (280,851 | ) | | | (264,188 | ) |
Fees Recouped by the Adviser | | | 181,017 | | | | 406,527 | | | | — | |
| | | | | | | | | | | | | |
Net Expenses | | | 3,117,093 | | | | 5,042,866 | | | | 1,114,932 | |
| | | | | | | | | | | | | |
Net Investment Income | | | 2,174,965 | | | | 2,432,865 | | | | 4,949,777 | |
| | | | | | | | | | | | | |
Net Realized and Unrealized Gain (Loss) on Investments: | | | | | | | | | | | | |
Net Realized Gain (Loss) on: | | | | | | | | | | | | |
Unaffiliated Investments | | | (3,986,038 | ) | | | (25,910,349 | ) | | | (4,608,024 | ) |
Affiliated Investments | | | — | | | | (799,268 | ) | | | — | |
Purchased Options | | | (7,053,833 | ) | | | (1,195,241 | ) | | | (729,703 | ) |
Written Options | | | (2,088,782 | ) | | | (2,760,535 | ) | | | (606,143 | ) |
Net Change in Unrealized Appreciation (Depreciation) on: | | | | | | | | | | | | |
Unaffiliated Investments | | | (4,066,922 | ) | | | (12,566,179 | ) | | | 9,589,106 | |
Affiliated Investments | | | (144,089 | ) | | | 158,750 | | | | 1,526,582 | |
Purchased Options | | | (2,893,505 | ) | | | (406,061 | ) | | | (271,537 | ) |
Written Options | | | 471,925 | | | | 137,976 | | | | (6,815 | ) |
Net Realized and Unrealized Gain (Loss) on Investments | | | (19,761,244 | ) | | | (43,340,907 | ) | | | 4,893,466 | |
| | | | | | | | | | | | | |
Net Increase (Decrease) in Net Assets Resulting From Operations | | $ | (17,586,279 | ) | | $ | (40,908,042 | ) | | $ | 9,843,243 | |
See accompanying notes to financial statements.
52
Horizon Funds
STATEMENTS OF OPERATIONS (Unaudited) (Continued)
For the Period Ended May 31, 2019 |
| | |
Horizon Active
Dividend Fund
| | | Horizon Defined
Risk Fund | |
Investment Income: | | | | | | | | |
Dividend Income from unaffiliated securities (net of foreign withholdings tax of $35,693 and $(14)) | | $ | 1,838,699 | | | $ | 740,712 | |
Interest Income | | | 123,748 | | | | 29,744 | |
Total Investment Income | | | 1,962,447 | | | | 770,456 | |
| | | | | | | | | |
Expenses: | | | | | | | | |
Investment Advisory Fees | | | 357,380 | | | | 284,255 | |
Distribution Fees (12b-1) - Investor Class | | | 38,775 | | | | 29,894 | |
Administrative & Accounting Service Fees | | | 33,774 | | | | 33,278 | |
Transfer Agent Fees | | | 19,198 | | | | 19,029 | |
Registration Fees | | | 26,962 | | | | 17,537 | |
Legal Fees | | | 3,077 | | | | 2,197 | |
Chief Compliance Officer & Compliance Fees | | | 4,958 | | | | 1,977 | |
Trustees’ Fees and Expenses | | | 5,147 | | | | 3,732 | |
Custodian Fees | | | 5,856 | | | | 30,353 | |
Printing and Postage Expenses | | | 8,668 | | | | 6,559 | |
Miscellaneous Expenses | | | 1,957 | | | | 1,447 | |
Distribution Fees (12b-1) - Advisor Class | | | 22,188 | | | | 14,095 | |
Audit Fees | | | 8,477 | | | | 8,478 | |
Insurance Fees | | | 955 | | | | 462 | |
Total Expenses | | | 537,372 | | | | 453,293 | |
Securities Lending Expense Offset | | | (4,946 | ) | | | (1,494 | ) |
Fees Recouped / (Waived) by the Adviser | | | 279 | | | | (73,805 | ) |
| | | | | | | | | |
Net Expenses | | | 532,705 | | | | 377,994 | |
| | | | | | | | | |
Net Investment Income | | | 1,429,742 | | | | 392,462 | |
| | | | | | | | | |
Net Realized and Unrealized Gain (Loss) on Investments: | | | | | | | | |
Net Realized Gain (Loss) on: | | | | | | | | |
Unaffiliated Investments | | | 541,455 | | | | (51,455 | ) |
Purchased Options | | | (201,031 | ) | | | (2,267,778 | ) |
Written Options | | | 80,772 | | | | (2,516,804 | ) |
Foreign Currency | | | (464 | ) | | | — | |
Net Change in Unrealized Appreciation (Depreciation) on: | | | | | | | | |
Unaffiliated Investments | | | (3,197,576 | ) | | | 6,403,092 | |
Purchased Options | | | 141,666 | | | | 1,851,167 | |
Written Options | | | (26,605 | ) | | | (1,350,587 | ) |
Foreign Currency | | | (17 | ) | | | — | |
Net Realized and Unrealized Gain (Loss) on Investments | | | (2,661,800 | ) | | | 2,067,635 | |
| | | | | | | | | |
Net Increase (Decrease) in Net Assets Resulting From Operations | | $ | (1,232,058 | ) | | $ | 2,460,097 | |
See accompanying notes to financial statements.
53
Horizon Active Asset Allocation Fund Statements of Changes in Net Assets |
| | | For the
Period Ended
May 31,
2019 | | | For the
Year Ended
November 30,
2018 | |
| | | (Unaudited) | | | | | |
Operations: | | | | | | | | |
Net Investment Income | | $ | 2,174,965 | | | $ | 2,635,163 | |
Net Realized Gain (Loss) on Investments, | | | | | | | | |
Purchased Options and Written Options | | | (13,128,653 | ) | | | 32,878,789 | |
Distributions of Long-Term Capital Gains by Underlying Investment Companies | | | — | | | | 120,150 | |
Net Change in Unrealized Depreciation on | | | | | | | | |
Investments, Purchased Options and Written Options | | | (6,632,591 | ) | | | (39,775,842 | ) |
Net Decrease in Net Assets Resulting From Operations | | | (17,586,279 | ) | | | (4,141,740 | ) |
| | | | | | | | | |
Distributions to Shareholders From: | | | | | | | | |
Distributable earnings | | | | | | | | |
Investor Class | | | (28,080,978 | ) | | | (43,271,145 | ) |
Advisor Class | | | (449,545 | ) | | | (617,689 | ) |
Institutional Class | | | (1,921,746 | ) | | | (3,269,530 | ) |
Total Distributions to Shareholders | | | (30,452,269 | ) | | | (47,158,364 | ) |
| | | | | | | | | |
Capital Share Transactions: | | | | | | | | |
Proceeds from Shares Issued | | | | | | | | |
Investor Class | | | 115,693,451 | | | | 202,909,817 | |
Advisor Class | | | 1,976,247 | | | | 3,596,369 | |
Institutional Class | | | 2,980,806 | | | | 8,938,049 | |
Distributions Reinvested | | | | | | | | |
Investor Class | | | 26,696,715 | | | | 42,833,606 | |
Advisor Class | | | 388,591 | | | | 517,167 | |
Institutional Class | | | 1,921,746 | | | | 3,269,530 | |
Cost of Shares Redeemed | | | | | | | | |
Investor Class | | | (99,656,856 | ) | | | (115,053,606 | ) |
Advisor Class | | | (1,635,556 | ) | | | (1,339,176 | ) |
Institutional Class | | | (3,796,961 | ) | | | (7,785,149 | ) |
Net Increase in Net Assets Resulting From Beneficial Interest Transactions | | | 44,568,183 | | | | 137,886,607 | |
| | | | | | | | | |
Increase (Decrease) in Net Assets | | | (3,470,365 | ) | | | 86,586,503 | |
| | | | | | | | | |
Net Assets: | | | | | | | | |
Beginning of Period/Year | | | 514,513,567 | | | | 427,927,064 | |
End of Period/Year | | $ | 511,043,202 | | | $ | 514,513,567 | |
| | | | | | | | | |
Share Activity: | | | | | | | | |
Investor Class: | | | | | | | | |
Shares Issued | | | 9,876,425 | | | | 15,210,405 | |
Shares Reinvested | | | 2,602,019 | | | | 3,367,422 | |
Shares Redeemed | | | (8,438,155 | ) | | | (8,696,402 | ) |
Net Increase | | | 4,040,289 | | | | 9,881,425 | |
| | | | | | | | | |
Advisor Class: | | | | | | | | |
Shares Issued | | | 165,848 | | | | 269,968 | |
Shares Reinvested | | | 38,022 | | | | 40,786 | |
Shares Redeemed | | | (138,350 | ) | | | (100,455 | ) |
Net Increase | | | 65,520 | | | | 210,299 | |
| | | | | | | | | |
Institutional Class: | | | | | | | | |
Shares Issued | | | 251,008 | | | | 668,245 | |
Shares Reinvested | | | 187,122 | | | | 256,635 | |
Shares Redeemed | | | (319,333 | ) | | | (587,330 | ) |
Net Increase | | | 118,797 | | | | 337,550 | |
See accompanying notes to financial statements.
54
Horizon Active Risk Assist® Fund
STATEMENTS OF CHANGES IN NET ASSETS (Continued) |
| | | For the
Period Ended
May 31,
2019 | | | For the
Year Ended
November 30,
2018 | |
| | | (Unaudited) | | | | | |
Operations: | | | | | | | | |
Net Investment Income | | $ | 2,432,865 | | | $ | 3,263,976 | |
Net Realized Gain (Loss) on Investments, | | | | | | | | |
Purchased Options and Written Options | | | (30,665,393 | ) | | | 22,061,441 | |
Distributions of Long-Term Capital Gains by Underlying Investment Companies | | | — | | | | 122,180 | |
Net Change in Unrealized Depreciation on | | | | | | | | |
Investments, Purchased Options and Written Options | | | (12,675,514 | ) | | | (38,653,038 | ) |
Net Decrease in Net Assets Resulting From Operations | | | (40,908,042 | ) | | | (13,205,441 | ) |
| | | | | | | | | |
Distributions to Shareholders From: | | | | | | | | |
Distributable earnings | | | | | | | | |
Investor Class | | | (25,020,041 | ) | | | (19,270,621 | ) |
Advisor Class | | | (12,752 | ) | | | (15,334 | ) |
Institutional Class | | | (822,520 | ) | | | (309,439 | ) |
Total Distributions to Shareholders | | | (25,855,313 | ) | | | (19,595,394 | ) |
| | | | | | | | | |
Capital Share Transactions: | | | | | | | | |
Proceeds from Shares Issued | | | | | | | | |
Investor Class | | | 250,326,058 | | | | 382,409,937 | |
Advisor Class | | | 86,301 | | | | 92,540 | |
Institutional Class | | | 62,443,181 | | | | 18,719,909 | |
Distributions Reinvested | | | | | | | | |
Investor Class | | | 23,214,578 | | | | 18,955,229 | |
Advisor Class | | | 12,753 | | | | 15,334 | |
Institutional Class | | | 810,861 | | | | 309,439 | |
Cost of Shares Redeemed | | | | | | | | |
Investor Class | | | (99,920,303 | ) | | | (105,704,359 | ) |
Advisor Class | | | (287,502 | ) | | | (48,948 | ) |
Institutional Class | | | (13,257,428 | ) | | | (1,975,867 | ) |
Net Increase in Net Assets Resulting From Beneficial Interest Transactions | | | 223,428,499 | | | | 312,773,214 | |
| | | | | | | | | |
Increase in Net Assets | | | 156,665,144 | | | | 279,972,379 | |
| | | | | | | | | |
Net Assets: | | | | | | | | |
Beginning of Period/Year | | | 705,179,341 | | | | 425,206,962 | |
End of Period/Year | | $ | 861,844,485 | | | $ | 705,179,341 | |
| | | | | | | | | |
Share Activity: | | | | | | | | |
Investor Class: | | | | | | | | |
Shares Issued | | | 12,302,686 | | | | 16,912,240 | |
Shares Reinvested | | | 1,220,535 | | | | 865,931 | |
Shares Redeemed | | | (4,890,572 | ) | | | (4,677,374 | ) |
Net Increase | | | 8,632,649 | | | | 13,100,797 | |
| | | | | | | | | |
Advisor Class: | | | | | | | | |
Shares Issued | | | 4,236 | | | | 4,126 | |
Shares Reinvested | | | 670 | | | | 701 | |
Shares Redeemed | | | (14,105 | ) | | | (2,144 | ) |
Net Increase (Decrease) | | | (9,199 | ) | | | 2,683 | |
| | | | | | | | | |
Institutional Class: | | | | | | | | |
Shares Issued | | | 3,190,998 | | | | 828,543 | |
Shares Reinvested | | | 42,610 | | | | 14,130 | |
Shares Redeemed | | | (649,112 | ) | | | (87,471 | ) |
Net Increase | | | 2,584,496 | | | | 755,202 | |
See accompanying notes to financial statements.
55
Horizon Active Income Fund
STATEMENTS OF CHANGES IN NET ASSETS (Continued) |
| | | For the
Period Ended
May 31,
2019 | | | For the
Year Ended
November 30,
2018 | |
| | | (Unaudited) | | | | | |
Operations: | | | | | | | | |
Net Investment Income | | $ | 4,949,777 | | | $ | 8,072,615 | |
Net Realized Loss on Investments, | | | | | | | | |
Purchased Options and Written Options | | | (5,943,870 | ) | | | (12,906,931 | ) |
Net Change in Unrealized Appreciation (Depreciation) on | | | | | | | | |
Investments, Purchased Options and Written Options | | | 10,837,336 | | | | (4,027,626 | ) |
Net Increase (Decrease) in Net Assets Resulting From Operations | | | 9,843,243 | | | | (8,861,942 | ) |
| | | | | | | | | |
Distributions to Shareholders From: | | | | | | | | |
Distributable earnings | | | | | | | | |
Investor Class | | | (6,770,959 | ) | | | (6,524,973 | ) |
Advisor Class | | | (40,758 | ) | | | (29,004 | ) |
Institutional Class | | | (203,222 | ) | | | (229,059 | ) |
Total Distributions to Shareholders | | | (7,014,939 | ) | | | (6,783,036 | ) |
| | | | | | | | | |
Capital Share Transactions: | | | | | | | | |
Proceeds from Shares Issued | | | | | | | | |
Investor Class | | | 57,837,644 | | | | 142,464,097 | |
Advisor Class | | | 514,976 | | | | 1,012,985 | |
Institutional Class | | | 758,624 | | | | 2,386,593 | |
Distributions Reinvested | | | | | | | | |
Investor Class | | | 6,327,654 | | | | 6,094,473 | |
Advisor Class | | | 40,758 | | | | 29,004 | |
Institutional Class | | | 203,222 | | | | 229,059 | |
Cost of Shares Redeemed | | | | | | | | |
Investor Class | | | (81,342,473 | ) | | | (58,011,804 | ) |
Advisor Class | | | (29,473 | ) | | | (40,163 | ) |
Institutional Class | | | (589,489 | ) | | | (2,718,117 | ) |
Net Increase (Decrease) in Net Assets Resulting From Beneficial Interest Transactions | | | (16,278,557 | ) | | | 91,446,127 | |
| | | | | | | | | |
Increase (Decrease) in Net Assets | | | (13,450,253 | ) | | | 75,801,149 | |
| | | | | | | | | |
Net Assets: | | | | | | | | |
Beginning of Period/Year | | | 285,066,670 | | | | 209,265,521 | |
End of Period/Year | | $ | 271,616,417 | | | $ | 285,066,670 | |
| | | | | | | | | |
Share Activity: | | | | | | | | |
Investor Class: | | | | | | | | |
Shares Issued | | | 6,345,736 | | | | 15,134,834 | |
Shares Reinvested | | | 706,041 | | | | 644,511 | |
Shares Redeemed | | | (9,021,461 | ) | | | (6,175,688 | ) |
Net Increase (Decrease) | | | (1,969,684 | ) | | | 9,603,657 | |
| | | | | | | | | |
Advisor Class: | | | | | | | | |
Shares Issued | | | 56,065 | | | | 106,778 | |
Shares Reinvested | | | 4,518 | | | | 3,059 | |
Shares Redeemed | | | (3,223 | ) | | | (4,274 | ) |
Net Increase | | | 57,360 | | | | 105,563 | |
| | | | | | | | | |
Institutional Class: | | | | | | | | |
Shares Issued | | | 82,944 | | | | 253,240 | |
Shares Reinvested | | | 22,705 | | | | 24,205 | |
Shares Redeemed | | | (64,835 | ) | | | (288,438 | ) |
Net Increase (Decrease) | | | 40,814 | | | | (10,993 | ) |
See accompanying notes to financial statements.
56
Horizon Active Dividend Fund
STATEMENTS OF CHANGES IN NET ASSETS (Continued) |
| | | For the
Period Ended
May 31,
2019 | | | For the
Year Ended
November 30,
2018 | |
| | | (Unaudited) | | | | | |
Operations: | | | | | | | | |
Net Investment Income | | $ | 1,429,742 | | | $ | 684,471 | |
Net Realized Gain on Investments, | | | | | | | | |
Purchased Options and Written Options | | | 420,732 | | | | 2,561,704 | |
Net Change in Unrealized Depreciation on | | | | | | | | |
Investments, Purchased Options and Written Options | | | (3,082,532 | ) | | | (2,152,986 | ) |
Net Increase (Decrease) in Net Assets Resulting From Operations | | | (1,232,058 | ) | | | 1,093,189 | |
| | | | | | | | | |
Distributions to Shareholders From: | | | | | | | | |
Distributable earnings | | | | | | | | |
Investor Class | | | (2,759,968 | ) | | | (815,228 | ) |
Advisor Class | | | (908,208 | ) | | | (177,769 | ) |
Total Distributions to Shareholders | | | (3,668,176 | ) | | | (992,997 | ) |
| | | | | | | | | |
Capital Share Transactions: | | | | | | | | |
Proceeds from Shares Issued | | | | | | | | |
Investor Class | | | 65,270,556 | | | | 21,346,826 | |
Advisor Class | | | 10,345,781 | | | | 9,447,722 | |
Distributions Reinvested | | | | | | | | |
Investor Class | | | 2,759,942 | | | | 815,228 | |
Advisor Class | | | 710,933 | | | | 140,433 | |
Cost of Shares Redeemed | | | | | | | | |
Investor Class | | | (8,346,059 | ) | | | (6,912,464 | ) |
Advisor Class | | | (2,115,929 | ) | | | (1,998,986 | ) |
Net Increase in Net Assets Resulting From Beneficial Interest Transactions | | | 68,625,224 | | | | 22,838,759 | |
| | | | | | | | | |
Increase in Net Assets | | | 63,724,990 | | | | 22,938,951 | |
| | | | | | | | | |
Net Assets: | | | | | | | | |
Beginning of Period/Year | | | 50,801,171 | | | | 27,862,220 | |
End of Period/Year | | $ | 114,526,161 | | | $ | 50,801,171 | |
| | | | | | | | | |
Share Activity: | | | | | | | | |
Investor Class: | | | | | | | | |
Shares Issued | | | 1,194,097 | | | | 350,521 | |
Shares Reinvested | | | 53,181 | | | | 13,443 | |
Shares Redeemed | | | (148,671 | ) | | | (113,457 | ) |
Net Increase | | | 1,098,607 | | | | 250,507 | |
| | | | | | | | | |
Advisor Class: | | | | | | | | |
Shares Issued | | | 189,551 | | | | 155,431 | |
Shares Reinvested | | | 13,925 | | | | 2,312 | |
Shares Redeemed | | | (37,345 | ) | | | (32,906 | ) |
Net Increase | | | 166,131 | | | | 124,837 | |
See accompanying notes to financial statements.
57
Horizon Defined Risk Fund
STATEMENTS OF CHANGES IN NET ASSETS (Continued) |
| | | For the
Period Ended
May 31,
2019 | | | For the
Period Ended
November 30,
2018 (1) | |
| | | (Unaudited) | | | | | |
Operations: | | | | | | | | |
Net Investment Income | | $ | 392,462 | | | $ | 70,171 | |
Net Realized Loss on Investments, | | | | | | | | |
Purchased Options and Written Options | | | (4,836,037 | ) | | | (103,803 | ) |
Net Change in Unrealized Appreciation on | | | | | | | | |
Investments, Purchased Options and Written Options | | | 6,903,672 | | | | 216,236 | |
Net Increase in Net Assets Resulting From Operations | | | 2,460,097 | | | | 182,604 | |
| | | | | | | | | |
Distributions to Shareholders From: | | | | | | | | |
Distributable earnings | | | | | | | | |
Investor Class | | | (93,806 | ) | | | — | |
Advisor Class | | | (46,441 | ) | | | — | |
Total Distributions to Shareholders | | | (140,247 | ) | | | — | |
| | | | | | | | | |
Capital Share Transactions: | | | | | | | | |
Proceeds from Shares Issued | | | | | | | | |
Investor Class | | | 78,183,301 | | | | 6,362,481 | |
Advisor Class | | | 4,740,937 | | | | 10,548,208 | |
Distributions Reinvested | | | | | | | | |
Investor Class | | | 93,805 | | | | — | |
Advisor Class | | | 28,456 | | | | — | |
Cost of Shares Redeemed | | | | | | | | |
Investor Class | | | (9,528,517 | ) | | | (496,397 | ) |
Advisor Class | | | (1,522,120 | ) | | | (1,509,001 | ) |
Net Increase in Net Assets Resulting From Beneficial Interest Transactions | | | 71,995,862 | | | | 14,905,291 | |
| | | | | | | | | |
Increase in Net Assets | | | 74,315,712 | | | | 15,087,895 | |
| | | | | | | | | |
Net Assets: | | | | | | | | |
Beginning of Period | | | 15,087,895 | | | | — | |
End of Period | | $ | 89,403,607 | | | $ | 15,087,895 | |
| | | | | | | | | |
Share Activity: | | | | | | | | |
Investor Class: | | | | | | | | |
Shares Issued | | | 1,602,920 | | | | 125,760 | |
Shares Reinvested | | | 1,995 | | | | — | |
Shares Redeemed | | | (189,388 | ) | | | (9,789 | ) |
Net Increase | | | 1,415,527 | | | | 115,971 | |
| | | | | | | | | |
Advisor Class: | | | | | | | | |
Shares Issued | | | 95,702 | | | | 209,699 | |
Shares Reinvested | | | 604 | | | | — | |
Shares Redeemed | | | (30,122 | ) | | | (29,777 | ) |
Net Increase | | | 66,184 | | | | 179,922 | |
(1) | Horizon Defined Risk Fund, Investor and Advisor Class, commenced operations on December 28, 2017 and February 5, 2018, respectively. |
See accompanying notes to financial statements.
58
Horizon Active Asset Allocation Fund Financial Highlights |
The table below sets forth financial data for one share of beneficial interest outstanding throughout each period/year.
| | | Investor Class | |
| | | For the
Period Ended
May 31,
2019 | | | For the
Year Ended
November 30,
2018 | | | For the
Year Ended
November 30,
2017 | | | For the
Year Ended
November 30,
2016 | | | For the
Year Ended
November 30,
2015 | | | For the
Year Ended
November 30,
2014 | |
| | | (Unaudited) | | | | | | | | | | | | | | | | | | | | | |
| | | | | | | | | | | | | | | | | | | | | | | | | |
Net Asset Value, Beginning of Period/Year | | $ | 12.68 | | | $ | 14.20 | | | $ | 11.56 | | | $ | 11.99 | | | $ | 12.67 | | | $ | 12.76 | |
Income From Investment Operations: | | | | | | | | | | | | | | | | | | | | | | | | |
Net investment income (c,f) | | | 0.05 | | | | 0.07 | (h) | | | 0.08 | | | | 0.12 | | | | 0.13 | | | | 0.04 | |
Net gain (loss) from investments (both realized and unrealized) | | | (0.52 | ) | | | (0.02 | )(h) | | | 2.66 | | | | (0.20 | ) | | | (0.37 | ) | | | 0.95 | |
Total from investment operations | | | (0.47 | ) | | | 0.05 | | | | 2.74 | | | | (0.08 | ) | | | (0.24 | ) | | | 0.99 | |
| | | | | | | | | | | | | | | | | | | | | | | | | |
Less Distributions: | | | | | | | | | | | | | | | | | | | | | | | | |
From net investment income | | | (0.08 | ) | | | (0.07 | ) | | | (0.10 | ) | | | (0.20 | ) | | | (0.02 | ) | | | (0.03 | ) |
From net realized gains | | | (0.72 | ) | | | (1.50 | ) | | | — | | | | (0.15 | ) | | | (0.42 | ) | | | (1.05 | ) |
Total Distributions | | | (0.80 | ) | | | (1.57 | ) | | | (0.10 | ) | | | (0.35 | ) | | | (0.44 | ) | | | (1.08 | ) |
| | | | | | | | | | | | | | | | | | | | | | | | | |
Net Asset Value, End of Period/Year | | $ | 11.41 | | | $ | 12.68 | | | $ | 14.20 | | | $ | 11.56 | | | $ | 11.99 | | | $ | 12.67 | |
| | | | | | | | | | | | | | | | | | | | | | | | | |
Total Return | | | (2.98 | )%(j) | | | 0.46 | % | | | 23.76 | % | | | (0.59 | )% | | | (2.01 | )% | | | 8.33 | % |
| | | | | | | | | | | | | | | | | | | | | | | | | |
Ratios/Supplemental Data | | | | | | | | | | | | | | | | | | | | | | | | |
Net assets, end of period/year (in 000’s) | | $ | 475,299 | | | $ | 477,097 | | | $ | 393,833 | | | $ | 354,279 | | | $ | 366,368 | | | $ | 418,274 | |
Ratio to average net assets: | | | | | | | | | | | | | | | | | | | | | | | | |
Gross expenses (d,e) | | | 1.22 | %(i) | | | 1.28 | %(g) | | | 1.48 | % | | | 1.54 | % | | | 1.54 | % | | | 1.54 | % |
Net expenses (a,d) | | | 1.24 | %(i) | | | 1.27 | %(g) | | | 1.36 | %(b) | | | 1.43 | % | | | 1.42 | % | | | 1.42 | % |
Net investment income net of reimbursement (recapture) and securities lending expense offset (d,f) | | | 0.86 | %(i) | | | 0.56 | % | | | 0.61 | % | | | 1.09 | % | | | 1.06 | % | | | 0.35 | % |
Portfolio turnover rate | | | 157 | %(j) | | | 256 | % | | | 168 | % | | | 406 | % | | | 472 | % | | | 591 | % |
(a) | The ratio of expenses to average net assets includes interest expense which was 0.00%, 0.00%, 0.00%, 0.01%, 0.00% and 0.00%, respectively. |
(b) | Effective July 1, 2017, Shareholder Servicing Fees for Investor Class shares decreased from 0.25% to 0.10% of average daily net assets. |
(c) | Per share amounts are calculated using the average shares method. |
(d) | Does not reflect the expenses of the underlying funds in which the Fund invests. |
(e) | Represents the ratio of expenses to average net assets absent securities lending expense offset, fee waivers and/or expense reimbursements by the Adviser. |
(f) | Recognition of net investment income by the Fund is affected by the timing of the declaration of dividends by the underlying investment companies in which the Fund invests. The ratio does not include net investment income of the investment companies in which the Fund invests. |
(g) | Effective March 30, 2018, the Operating Expense Limit for the Investor Class decreased from 1.27% to 1.17%. This excludes 0.10% of Shareholder Servicing Fees (See Note 3). |
(h) | Due to timing of shareholder transactions, and allocations of expenses among share classes, the per unit amounts presented may not coincide with the aggregate presentation on the Statements of Operations. |
See accompanying notes to financial statements.
59
Horizon Active Asset Allocation Fund
FINANCIAL HIGHLIGHTS |
The table below sets forth financial data for one share of beneficial interest outstanding throughout each period/year.
| | | Advisor Class | |
| | | For the
Period Ended
May 31,
2019 | | | For the
Year Ended
November 30,
2018 | | | For the
Year Ended
November 30,
2017 | | | For the
Year Ended
November 30,
2016 | | | For the
Period Ended
November 30,
2015 (a) | |
| | | (Unaudited) | | | | | | | | | | | | | | | | | |
| | | | | | | | | | | | | | | | | | | | | |
Net Asset Value, Beginning of Period/Year | | $ | 12.62 | | | $ | 14.16 | | | $ | 11.56 | | | $ | 11.99 | | | $ | 11.21 | |
Income From Investment Operations: | | | | | | | | | | | | | | | | | | | | |
Net investment income (loss) (c,g) | | | 0.05 | | | | 0.05 | (f) | | | 0.05 | | | | 0.12 | | | | (0.03 | )(f) |
Net gain (loss) from investments (both realized and unrealized) | | | (0.52 | ) | | | (0.02 | )(f) | | | 2.68 | | | | (0.20 | ) | | | 0.81 | (f) |
Total from investment operations | | | (0.47 | ) | | | 0.03 | | | | 2.73 | | | | (0.08 | ) | | | 0.78 | |
| | | | | | | | | | | | | | | | | | | | | |
Less Distributions: | | | | | | | | | | | | | | | | | | | | |
From net investment income | | | (0.07 | ) | | | (0.07 | ) | | | (0.13 | ) | | | (0.20 | ) | | | — | |
From net realized gains | | | (0.72 | ) | | | (1.50 | ) | | | — | | | | (0.15 | ) | | | — | |
Total Distributions | | | (0.79 | ) | | | (1.57 | ) | | | (0.13 | ) | | | (0.35 | ) | | | — | |
| | | | | | | | | | | | | | | | | | | | | |
Net Asset Value, End of Period/Year | | $ | 11.36 | | | $ | 12.62 | | | $ | 14.16 | | | $ | 11.56 | | | $ | 11.99 | |
| | | | | | | | | | | | | | | | | | | | | |
Total Return | | | (3.04 | )%(j) | | | 0.29 | % | | | 23.64 | % | | | (0.59 | )% | | | 6.96 | %(j) |
| | | | | | | | | | | | | | | | | | | | | |
Ratios/Supplemental Data | | | | | | | | | | | | | | | | | | | | |
Net assets, end of period/year (in 000’s) | | $ | 7,210 | | | $ | 7,187 | | | $ | 5,084 | | | $ | 2,249 | | | $ | 29 | |
Ratio to average net assets: | | | | | | | | | | | | | | | | | | | | |
Gross expenses (d,e) | | | 1.41 | %(i) | | | 1.43 | %(h) | | | 1.55 | % | | | 1.55 | % | | | 1.54 | %(i) |
Net expenses (b,d) | | | 1.43 | %(i) | | | 1.42 | %(h) | | | 1.42 | % | | | 1.44 | % | | | 1.42 | %(i) |
Net investment income (loss) net of reimbursement (recapture) and securities lending expense offset (d,g) | | | 0.82 | %(i) | | | 0.38 | % | | | 0.35 | % | | | 1.06 | % | | | (0.88 | )%(f)(i) |
Portfolio turnover rate | | | 157 | %(j) | | | 256 | % | | | 168 | % | | | 406 | % | | | 472 | %(j) |
(a) | Since September 4, 2015 (Commencement of Operations). |
(b) | The ratio of expenses to average net assets includes interest expense which was 0.01%, 0.00%, 0.00%, 0.00%, 0.02% and 0.00%, respectively. |
(c) | Per share amounts are calculated using the average shares method. |
(d) | Does not reflect the expenses of the underlying funds in which the Fund invests. |
(e) | Represents the ratio of expenses to average net assets absent securities lending expense offset, fee waivers and/or expense reimbursements by the Adviser. |
(f) | Due to timing of shareholder transactions, and allocations of expenses among share classes, the per unit amounts presented may not coincide with the aggregate presentation on the Statements of Operations. |
(g) | Recognition of net investment income by the Fund is affected by the timing of the declaration of dividends by the underlying investment companies in which the Fund invests. The ratio does not include net investment income of the investment companies in which the Fund invests. |
(h) | Effective March 30, 2018, the Operating Expense Limit for the Advisor Class decreased from 1.42% to 1.17% and now excludes 0.25% of Distribution Fees (12b-1) (See Note 3). |
See accompanying notes to financial statements.
60
Horizon Active Asset Allocation Fund
FINANCIAL HIGHLIGHTS |
The table below sets forth financial data for one share of beneficial interest outstanding throughout each period/year.
| | | Institutional Class | |
| | | For the
Period Ended
May 31,
2019 | | | For the
Year Ended
November 30,
2018 | | | For the
Year Ended
November 30,
2017 | | | For the
Period Ended
November 30,
2016 (a) | |
| | | (Unaudited) | | | | | | | | | | | | | |
| | | | | | | | | | | | | | | | | |
Net Asset Value, Beginning of Period/Year | | $ | 12.71 | | | $ | 14.22 | | | $ | 11.59 | | | $ | 11.54 | |
Income From Investment Operations: | | | | | | | | | | | | | | | | |
Net investment income (c,h) | | | 0.06 | | | | 0.09 | (g) | | | 0.05 | | | | 0.03 | |
Net gain (loss) from investments (both realized and unrealized) | | | (0.52 | ) | | | (0.03 | )(g) | | | 2.71 | | | | 0.02 | (f) |
Total from investment operations | | | (0.46 | ) | | | 0.06 | | | | 2.76 | | | | 0.05 | |
| | | | | | | | | | | | | | | | | |
Less Distributions: | | | | | | | | | | | | | | | | |
From net investment income | | | (0.10 | ) | | | (0.07 | ) | | | (0.13 | ) | | | — | |
From net realized gains | | | (0.72 | ) | | | (1.50 | ) | | | — | | | | — | |
Total Distributions | | | (0.82 | ) | | | (1.57 | ) | | | (0.13 | ) | | | — | |
| | | | | | | | | | | | | | | | | |
Net Asset Value, End of Period/Year | | $ | 11.43 | | | $ | 12.71 | | | $ | 14.22 | | | $ | 11.59 | |
| | | | | | | | | | | | | | | | | |
Total Return | | | (2.94 | )%(j) | | | 0.55 | % | | | 23.92 | % | | | 0.43 | %(j) |
| | | | | | | | | | | | | | | | | |
Ratios/Supplemental Data | | | | | | | | | | | | | | | | |
Net assets, end of period/year (in 000’s) | | $ | 28,534 | | | $ | 30,230 | | | $ | 29,010 | | | $ | 8,809 | |
Ratio to average net assets: | | | | | | | | | | | | | | | | |
Gross expenses (d,e) | | | 1.16 | %(i) | | | 1.18 | % | | | 1.30 | % | | | 1.30 | %(i) |
Net expenses (b,d) | | | 1.18 | %(i) | | | 1.17 | % | | | 1.17 | % | | | 1.19 | %(i) |
Net investment income net of reimbursement (recapture) and securities lending expense offset (d,h) | | | 1.00 | %(i) | | | 0.68 | % | | | 0.38 | % | | | 1.28 | %(i) |
Portfolio turnover rate | | | 157 | %(j) | | | 256 | % | | | 168 | % | | | 406 | %(j) |
(a) | Since September 9, 2016 (Commencement of Operations). |
(b) | The ratio of expenses to average net assets includes interest expense which was 0.01%, 0.00%, 0.00% and 0.02%, respectively. |
(c) | Per share amounts are calculated using the average shares method. |
(d) | Does not reflect the expenses of the underlying funds in which the Fund invests. |
(e) | Represents the ratio of expenses to average net assets absent securities lending expense offset, fee waivers and/or expense reimbursements by the Adviser. |
(f) | Net realized and unrealized gain (loss) per share in this caption is a balancing amount necessary to reconcile the change in net asset value per share for the period, and may not reconcile with the aggregate gain (loss) on the Statements of Operations due to share transactions for the period. |
(g) | Due to timing of shareholder transactions, and allocations of expenses among share classes, the per unit amounts presented may not coincide with the aggregate presentation on the Statements of Operations. |
(h) | Recognition of net investment income by the Fund is affected by the timing of the declaration of dividends by the underlying investment companies in which the Fund invests. The ratio does not include net investment income of the investment companies in which the Fund invests. |
See accompanying notes to financial statements.
61
Horizon Active Risk Assist® Fund
FINANCIAL HIGHLIGHTS |
The table below sets forth financial data for one share of beneficial interest outstanding throughout each period/year.
| | | Investor Class | |
| | | For the
Period Ended
May 31,
2019 | | | For the
Year Ended
November 30,
2018 | | | For the
Year Ended
November 30,
2017 | | | For the
Year Ended
November 30,
2016 (a) | | | For the
Year Ended
November 30,
2015 | | | For the
Period Ended
November 30,
2014 (b) | |
| | | (Unaudited) | | | | | | | | | | | | | | | | | | | | | |
| | | | | | | | | | | | | | | | | | | | | | | | | |
Net Asset Value, Beginning of Period/Year | | $ | 21.69 | | | $ | 22.80 | | | $ | 19.31 | | | $ | 19.62 | | | $ | 20.50 | | | $ | 20.00 | |
Income From Investment Operations: | | | | | | | | | | | | | | | | | | | | | | | | |
Net investment income (loss) (e,i) | | | 0.06 | | | | 0.13 | | | | 0.12 | | | | 0.18 | | | | 0.12 | | | | (0.05 | ) |
Net gain (loss) from investments (both realized and unrealized) | | | (1.28 | ) | | | (0.21 | ) | | | 3.54 | | | | (0.29 | ) | | | (1.00 | ) | | | 0.55 | |
Total from investment operations | | | (1.22 | ) | | | (0.08 | ) | | | 3.66 | | | | (0.11 | ) | | | (0.88 | ) | | | 0.50 | |
| | | | | | | | | | | | | | | | | | | | | | | | | |
Less Distributions: | | | | | | | | | | | | | | | | | | | | | | | | |
From net investment income | | | (0.12 | ) | | | (0.12 | ) | | | (0.17 | ) | | | (0.20 | ) | | | — | | | | — | |
From net realized gains | | | (0.64 | ) | | | (0.91 | ) | | | — | | | | — | | | | (0.00 | )(h) | | | — | |
Total Distributions | | | (0.76 | ) | | | (1.03 | ) | | | (0.17 | ) | | | (0.20 | ) | | | — | | | | — | |
| | | | | | | | | | | | | | | | | | | | | | | | | |
Net Asset Value, End of Period/Year | | $ | 19.71 | | | $ | 21.69 | | | $ | 22.80 | | | $ | 19.31 | | | $ | 19.62 | | | | 20.50 | |
| | | | | | | | | | | | | | | | | | | | | | | | | |
Total Return | | | (5.44 | )%(l) | | | (0.31 | )% | | | 19.05 | % | | | (0.54 | )% | | | (4.29 | )% | | | 2.50 | %(l) |
| | | | | | | | | | | | | | | | | | | | | | | | | |
Ratios/Supplemental Data | | | | | | | | | | | | | | | | | | | | | | | | |
Net assets, end of period/year (in 000’s) | | $ | 790,010 | | | $ | 682,077 | | | $ | 418,227 | | | $ | 319,385 | | | $ | 222,421 | | | $ | 300 | |
Ratio to average net assets: | | | | | | | | | | | | | | | | | | | | | | | | |
Gross expenses (f,g) | | | 1.20 | %(k) | | | 1.28 | %(j) | | | 1.49 | % | | | 1.55 | % | | | 1.54 | % | | | 50.52 | %(k) |
Net expenses (c,f) | | | 1.24 | %(k) | | | 1.27 | %(j) | | | 1.35 | %(d) | | | 1.42 | % | | | 1.42 | % | | | 1.42 | %(k) |
Net investment income (loss) net of reimbursement (recapture) and securities lending expense offset (f,i) | | | 0.62 | %(k) | | | 0.58 | % | | | 0.58 | % | | | 0.92 | % | | | 0.57 | % | | | (1.06 | )%(k) |
Portfolio turnover rate | | | 190 | %(l) | | | 275 | % | | | 143 | % | | | 563 | % | | | 541 | % | | | 55 | %(l) |
(a) | In 2016, 0.02% of the Fund’s total return consists of a voluntary reimbursement by the adviser for losses on investment transactions. Excluding this item, the total return would have been (0.56%). |
(b) | Since August 28, 2014 (Commencement of Operations). |
(c) | The ratio of expenses to average net assets includes interest expense which was 0.00%, 0.00%, 0.00%, 0.01%, 0.00% and 0.00%, respectively. |
(d) | Effective July 1, 2017, Shareholder Servicing Fees for Investor Class shares decreased from 0.25% to 0.10% of average daily net assets. |
(e) | Per share amounts are calculated using the average shares method. |
(f) | Does not reflect the expenses of the underlying funds in which the Fund invests. |
(g) | Represents the ratio of expenses to average net assets absent securities lending expense offset, fee waivers and/or expense reimbursements by the Adviser. |
(h) | Per share amount is less than $0.01. |
(i) | Recognition of net investment income (loss) by the Fund is affected by the timing of the declaration of dividends by the underlying investment companies in which the Fund invests. The ratio does not include net investment income of the investment companies in which the Fund invests. |
(j) | Effective March 30, 2018, the Operating Expense Limit for the Investor Class decreased from 1.27% to 1.17%. This excludes 0.10% of Shareholder Servicing Fees (See Note 3). |
See accompanying notes to financial statements.
62
Horizon Active Risk Assist® Fund
FINANCIAL HIGHLIGHTS |
The table below sets forth financial data for one share of beneficial interest outstanding throughout each period/year.
| | | Advisor Class | |
| | | For the
Period Ended
May 31,
2019 | | | For the
Year Ended
November 30,
2018 | | | For the
Year Ended
November 30,
2017 | | | For the
Year Ended
November 30,
2016 (a) | | | For the
Period Ended
November 30,
2015 (b) | |
| | | (Unaudited) | | | | | | | | | | | | | | | | | |
| | | | | | | | | | | | | | | | | | | | | |
Net Asset Value, Beginning of Period/Year | | $ | 21.66 | | | $ | 22.78 | | | $ | 19.30 | | | $ | 19.62 | | | $ | 18.97 | |
Income From Investment Operations: | | | | | | | | | | | | | | | | | | | | |
Net investment income (d,h) | | | 0.05 | | | | 0.11 | | | | 0.11 | | | | 0.17 | | | | 0.07 | |
Net gain (loss) from investments (both realized and unrealized) | | | (1.28 | ) | | | (0.23 | ) | | | 3.54 | | | | (0.29 | ) | | | 0.58 | (g) |
Total from investment operations | | | (1.23 | ) | | | (0.12 | ) | | | 3.65 | | | | (0.12 | ) | | | 0.65 | |
| | | | | | | | | | | | | | | | | | | | | |
Less Distributions: | | | | | | | | | | | | | | | | | | | | |
From net investment income | | | (0.08 | ) | | | (0.09 | ) | | | (0.17 | ) | | | (0.20 | ) | | | — | |
From net realized gains | | | (0.64 | ) | | | (0.91 | ) | | | — | | | | — | | | | — | |
Total Distributions | | | (0.72 | ) | | | (1.00 | ) | | | (0.17 | ) | | | (0.20 | ) | | | — | |
| | | | | | | | | | | | | | | | | | | | | |
Net Asset Value, End of Period/Year | | $ | 19.71 | | | $ | 21.66 | | | $ | 22.78 | | | $ | 19.30 | | | $ | 19.62 | |
| | | | | | | | | | | | | | | | | | | | | |
Total Return | | | (5.53 | )%(k) | | | (0.46 | )% | | | 19.03 | % | | | (0.59 | )% | | | 3.43 | %(k) |
| | | | | | | | | | | | | | | | | | | | | |
Ratios/Supplemental Data | | | | | | | | | | | | | | | | | | | | |
Net assets, end of period/year (in 000’s) | | $ | 172 | | | $ | 388 | | | $ | 347 | | | $ | 313 | | | $ | 19 | |
Ratio to average net assets: | | | | | | | | | | | | | | | | | | | | |
Gross expenses (e,f) | | | 1.38 | %(j) | | | 1.43 | %(i) | | | 1.56 | % | | | 1.51 | % | | | 1.54 | %(j) |
Net expenses (c,e) | | | 1.42 | %(j) | | | 1.42 | %(i) | | | 1.42 | % | | | 1.42 | % | | | 1.42 | %(j) |
Net investment income net of reimbursement (recapture) and securities lending expense offset (e,h) | | | 0.53 | %(j) | | | 0.48 | % | | | 0.53 | % | | | 0.92 | % | | | 1.52 | %(j) |
Portfolio turnover rate | | | 190 | %(k) | | | 275 | % | | | 143 | % | | | 563 | % | | | 541 | %(k) |
(a) | In 2016, 0.02% of the Fund’s total return consists of a voluntary reimbursement by the adviser for losses on investment transactions. Excluding this item, the total return would have been (0.61%). |
(b) | Since September 4, 2015 (Commencement of Operations). |
(c) | The ratio of expenses to average net assets includes interest expense which was 0.00%, 0.00%, 0.00%, 0.01% and 0.00%, respectively. |
(d) | Per share amounts are calculated using the average shares method. |
(e) | Does not reflect the expenses of the underlying funds in which the Fund invests. |
(f) | Represents the ratio of expenses to average net assets absent securities lending expense offset, fee waivers and/or expense reimbursements by the Adviser. |
(g) | Net realized and unrealized gain (loss) per share in this caption is a balancing amount necessary to reconcile the change in net asset value per share for the period, and may not reconcile with the aggregate gain (loss) on the Statements of Operations due to share transactions for the period. |
(h) | Recognition of net investment income by the Fund is affected by the timing of the declaration of dividends by the underlying investment companies in which the Fund invests. The ratio does not include net investment income of the investment companies in which the Fund invests. |
(i) | Effective March 30, 2018, the Operating Expense Limit for the Advisor Class decreased from 1.42% to 1.17%. This excludes 0.25% of Distribution Fees (12b-1) (See Note 3). |
See accompanying notes to financial statements.
63
Horizon Active Risk Assist® Fund
FINANCIAL HIGHLIGHTS |
The table below sets forth financial data for one share of beneficial interest outstanding throughout each period/year.
| | | Institutional Class | |
| | | For the
Period Ended
May 31,
2019 | | | For the
Year Ended
November 30,
2018 | | | For the
Year Ended
November 30,
2017 | | | For the
Period Ended
November 30,
2016 (a) | |
| | | (Unaudited) | | | | | | | | | | | | | |
| | | | | | | | | | | | | | | | | |
Net Asset Value, Beginning of Period/Year | | $ | 21.72 | | | $ | 22.84 | | | $ | 19.33 | | | $ | 19.21 | |
Income From Investment Operations: | | | | | | | | | | | | | | | | |
Net investment income (loss) (c,g) | | | 0.02 | | | | 0.14 | | | | (0.14 | ) | | | 0.05 | |
Net gain from investments (both realized and unrealized) | | | (1.22 | ) | | | (0.20 | ) | | | 3.86 | | | | 0.07 | (f) |
Total from investment operations | | | (1.20 | ) | | | (0.06 | ) | | | 3.72 | | | | 0.12 | |
| | | | | | | | | | | | | | | | | |
Less Distributions: | | | | | | | | | | | | | | | | |
From net investment income | | | (0.14 | ) | | | (0.15 | ) | | | (0.21 | ) | | | — | |
From net realized gains | | | (0.64 | ) | | | (0.91 | ) | | | — | | | | — | |
Total Distributions | | | (0.78 | ) | | | (1.06 | ) | | | (0.21 | ) | | | — | |
| | | | | | | | | | | | | | | | | |
Net Asset Value, End of Period/Year | | $ | 19.74 | | | $ | 21.72 | | | $ | 22.84 | | | $ | 19.33 | |
| | | | | | | | | | | | | | | | | |
Total Return | | | (5.35 | )%(i) | | | (0.21 | )% | | | 19.31 | % | | | 0.62 | %(i) |
| | | | | | | | | | | | | | | | | |
Ratios/Supplemental Data | | | | | | | | | | | | | | | | |
Net assets, end of period/year (in 000’s) | | $ | 71,662 | | | $ | 22,714 | | | $ | 6,633 | | | $ | 7 | |
Ratio to average net assets: | | | | | | | | | | | | | | | | |
Gross expenses (d,e) | | | 1.13 | %(h) | | | 1.19 | % | | | 1.35 | % | | | 1.31 | %(h) |
Net expenses (b,d) | | | 1.06 | %(h) | | | 1.14 | % | | | 1.17 | % | | | 1.17 | %(h) |
Net investment income (loss) net of reimbursement (recapture) and securities lending expense offset (d,g) | | | 0.24 | %(h) | | | 0.61 | % | | | (0.62 | )% | | | 1.09 | %(h) |
Portfolio turnover rate | | | 190 | %(i) | | | 275 | % | | | 143 | % | | | 563 | %(i) |
(a) | Since September 9, 2016 (Commencement of Operations). |
(b) | The ratio of expenses to average net assets includes interest expense which was 0.00%, 0.00%, 0.00% and 0.00%, respectively. |
(c) | Per share amounts are calculated using the average shares method. |
(d) | Does not reflect the expenses of the underlying funds in which the Fund invests. |
(e) | Represents the ratio of expenses to average net assets absent securities lending expense offset, fee waivers and/or expense reimbursements by the Adviser. |
(f) | Net realized and unrealized gain (loss) per share in this caption is a balancing amount necessary to reconcile the change in net asset value per share for the period, and may not reconcile with the aggregate gain (loss) on the Statements of Operations due to share transactions for the period. |
(g) | Recognition of net investment income by the Fund is affected by the timing of the declaration of dividends by the underlying investment companies in which the Fund invests. The ratio does not include net investment income of the investment companies in which the Fund invests. |
See accompanying notes to financial statements.
64
Horizon Active Income Fund
FINANCIAL HIGHLIGHTS |
The table below sets forth financial data for one share of beneficial interest outstanding throughout each period/year.
| | | Investor Class | |
| | | For the
Period Ended
May 31,
2019 | | | For the
Year Ended
November 30,
2018 | | | For the
Year Ended
November 30,
2017 | | | For the
Year Ended
November 30,
2016 | | | For the
Year Ended
November 30,
2015 | | | For the
Year Ended
November 30,
2014 | |
| | | (Unaudited) | | | | | | | | | | | | | | | | | | | | | |
| | | | | | | | | | | | | | | | | | | | | | | | | |
Net Asset Value, Beginning of Period/Year | | $ | 9.13 | | | $ | 9.73 | | | $ | 9.56 | | | $ | 9.86 | | | $ | 10.11 | | | $ | 10.01 | |
Income From Investment Operations: | | | | | | | | | | | | | | | | | | | | | | | | |
Net investment income (c,f) | | | 0.17 | | | | 0.30 | | | | 0.25 | | | | 0.16 | | | | 0.13 | | | | 0.15 | |
Net gain (loss) from investments (both realized and unrealized) | | | 0.19 | | | | (0.64 | ) | | | 0.17 | | | | (0.36 | ) | | | (0.25 | ) | | | 0.10 | |
Total from investment operations | | | 0.36 | | | | (0.34 | ) | | | 0.42 | | | | (0.20 | ) | | | (0.12 | ) | | | 0.25 | |
| | | | | | | | | | | | | | | | | | | | | | | | | |
Less Distributions: | | | | | | | | | | | | | | | | | | | | | | | | |
From net investment income | | | (0.23 | ) | | | (0.26 | ) | | | (0.25 | ) | | | (0.10 | ) | | | (0.13 | ) | | | (0.13 | ) |
Return of capital | | | — | | | | — | | | | — | | | | — | | | | — | | | | (0.02 | ) |
Total Distributions | | | (0.23 | ) | | | (0.26 | ) | | | (0.25 | ) | | | (0.10 | ) | | | (0.13 | ) | | | (0.15 | ) |
| | | | | | | | | | | | | | | | | | | | | | | | | |
Net Asset Value, End of Period/Year | | $ | 9.26 | | | $ | 9.13 | | | $ | 9.73 | | | $ | 9.56 | | | $ | 9.86 | | | $ | 10.11 | |
| | | | | | | | | | | | | | | | | | | | | | | | | |
Total Return | | | 4.09 | %(i) | | | (3.58 | )% | | | 4.39 | % | | | (2.03 | )% | | | (1.18 | )% | | | 2.50 | % |
| | | | | | | | | | | | | | | | | | | | | | | | | |
Ratios/Supplemental Data | | | | | | | | | | | | | | | | | | | | | | | | |
Net assets, end of period/year (in 000’s) | | $ | 261,513 | | | $ | 275,992 | | | $ | 200,521 | | | $ | 187,698 | | | $ | 169,725 | | | $ | 129,340 | |
Ratio to average net assets: | | | | | | | | | | | | | | | | | | | | | | | | |
Gross expenses (d,e) | | | 1.05 | %(h) | | | 1.09 | %(g) | | | 1.21 | % | | | 1.28 | % | | | 1.28 | % | | | 1.30 | % |
Net expenses (a,d) | | | 0.85 | %(h) | | | 0.98 | %(g) | | | 1.18 | %(b) | | | 1.24 | % | | | 1.24 | % | | | 1.24 | % |
Net investment income net of reimbursement (recapture) and securities lending expense offset (d,f) | | | 3.77 | %(h) | | | 3.16 | % | | | 2.54 | % | | | 1.58 | % | | | 1.25 | % | | | 1.47 | % |
Portfolio turnover rate | | | 94 | %(i) | | | 155 | % | | | 175 | % | | | 205 | % | | | 324 | % | | | 280 | % |
(a) | The ratio of expenses to average net assets includes interest and dividend expense which was 0.00%, 0.00%, 0.00%, 0.00%, 0.00% and 0.00%, respectively. |
(b) | Effective July 1, 2017, Shareholder Servicing Fees for Investor Class shares decreased from 0.25% to 0.10% of average daily net assets. |
(c) | Per share amounts are calculated using the average shares method. |
(d) | Does not reflect the expenses of the underlying funds in which the Fund invests. |
(e) | Represents the ratio of expenses to average net assets absent securities lending expense offset, fee waivers and/or expense reimbursements by the Adviser. |
(f) | Recognition of net investment income by the Fund is affected by the timing of the declaration of dividends by the underlying investment companies in which the Fund invests. The ratio does not include net investment income of the investment companies in which the Fund invests. |
(g) | Effective March 30, 2018, the Operating Expense Limit for the Investor Class decreased from 1.09% to 0.99%. This excludes 0.10% of Shareholder Servicing Fees (See Note 3). |
See accompanying notes to financial statements.
65
Horizon Active Income Fund
FINANCIAL HIGHLIGHTS |
The table below sets forth financial data for one share of beneficial interest outstanding throughout each period/year.
| | | Advisor Class | |
| | | For the
Period Ended
May 31,
2019 | | | For the
Year Ended
November 30,
2018 | | | For the
Year Ended
November 30,
2017 | | | For the
Period Ended
November 30,
2016 (a) | |
| | | (Unaudited) | | | | | | | | | | | | | |
| | | | | | | | | | | | | | | | | |
Net Asset Value, Beginning of Period/Year | | $ | 9.16 | | | $ | 9.76 | | | $ | 9.60 | | | $ | 9.84 | |
Income From Investment Operations: | | | | | | | | | | | | | | | | |
Net investment income (c,f) | | | 0.15 | | | | 0.29 | | | | 0.13 | | | | 0.13 | |
Net gain (loss) from investments (both realized and unrealized) | | | 0.20 | | | | (0.63 | ) | | | 0.28 | | | | (0.30 | ) |
Total from investment operations | | | 0.35 | | | | (0.34 | ) | | | 0.41 | | | | (0.17 | ) |
| | | | | | | | | | | | | | | | | |
Less Distributions: | | | | | | | | | | | | | | | | |
From net investment income | | | (0.22 | ) | | | (0.26 | ) | | | (0.25 | ) | | | (0.07 | ) |
Total Distributions | | | (0.22 | ) | | | (0.26 | ) | | | (0.25 | ) | | | (0.07 | ) |
| | | | | | | | | | | | | | | | | |
Net Asset Value, End of Period/Year | | $ | 9.29 | | | $ | 9.16 | | | $ | 9.76 | | | $ | 9.60 | |
| | | | | | | | | | | | | | | | | |
Total Return | | | 3.89 | %(i) | | | (3.58 | )% | | | 4.31 | % | | | (1.74 | )%(i) |
| | | | | | | | | | | | | | | | | |
Ratios/Supplemental Data | | | | | | | | | | | | | | | | |
Net assets, end of period/year (in 000’s) | | $ | 2,142 | | | $ | 1,587 | | | $ | 661 | | | $ | 6 | |
Ratio to average net assets: | | | | | | | | | | | | | | | | |
Gross expenses (d,e) | | | 1.22 | %(h) | | | 1.24 | %(g) | | | 1.32 | % | | | 1.35 | %(h) |
Net expenses (b,d) | | | 1.02 | %(h) | | | 1.04 | %(g) | | | 1.24 | % | | | 1.25 | %(h) |
Net investment income net of reimbursement (recapture) and securities lending expense offset (d,f) | | | 3.35 | %(h) | | | 3.07 | % | | | 1.37 | % | | | 1.70 | %(h) |
Portfolio turnover rate | | | 94 | %(i) | | | 155 | % | | | 175 | % | | | 205 | %(i) |
(a) | Since February 8, 2016 (Commencement of Operations). |
(b) | The ratio of expenses to average net assets includes interest expense which was 0.00%, 0.00%, 0.00% and 0.01%, respectively. |
(c) | Per share amounts are calculated using the average shares method. |
(d) | Does not reflect the expenses of the underlying funds in which the Fund invests. |
(e) | Represents the ratio of expenses to average net assets absent securities lending expense offset, fee waivers and/or expense reimbursements by the Adviser. |
(f) | Recognition of net investment income by the Fund is affected by the timing of the declaration of dividends by the underlying investment companies in which the Fund invests. The ratio does not include net investment income of the investment companies in which the Fund invests. |
(g) | Effective March 30, 2018, the Operating Expense Limit for the Advisor Class decreased from 1.24% to 1.09%. This excludes 0.25% of Distribution Fees (12b-1) (See Note 3). |
See accompanying notes to financial statements.
66
Horizon Active Income Fund
FINANCIAL HIGHLIGHTS |
The table below sets forth financial data for one share of beneficial interest outstanding throughout each period/year.
| | | Institutional Class | |
| | | For the
Period Ended
May 31,
2019 | | | For the
Year Ended
November 30,
2018 | | | For the
Year Ended
November 30,
2017 | | | For the
Period Ended
November 30,
2016 (a) | |
| | | (Unaudited) | | | | | | | | | | | | | |
| | | | | | | | | | | | | | | | | |
Net Asset Value, Beginning of Period/Year | | $ | 9.13 | | | $ | 9.72 | | | $ | 9.57 | | | $ | 10.00 | |
Income From Investment Operations: | | | | | | | | | | | | | | | | |
Net investment income (c,f) | | | 0.17 | | | | 0.31 | | | | 0.25 | | | | 0.04 | |
Net gain (loss) from investments (both realized and unrealized) | | | 0.19 | | | | (0.63 | ) | | | 0.17 | | | | (0.47 | ) |
Total from investment operations | | | 0.36 | | | | (0.32 | ) | | | 0.42 | | | | (0.43 | ) |
| | | | | | | | | | | | | | | | | |
Less Distributions: | | | | | | | | | | | | | | | | |
From net investment income | | | (0.25 | ) | | | (0.27 | ) | | | (0.27 | ) | | | — | |
Total Distributions | | | (0.25 | ) | | | (0.27 | ) | | | (0.27 | ) | | | — | |
| | | | | | | | | | | | | | | | | |
Net Asset Value, End of Period/Year | | $ | 9.24 | | | $ | 9.13 | | | $ | 9.72 | | | $ | 9.57 | |
| | | | | | | | | | | | | | | | | |
Total Return | | | 4.00 | %(h) | | | (3.33 | )% | | | 4.41 | % | | | (4.30 | )%(h) |
| | | | | | | | | | | | | | | | | |
Ratios/Supplemental Data | | | | | | | | | | | | | | | | |
Net assets, end of period/year (in 000’s) | | $ | 7,961 | | | $ | 7,488 | | | $ | 8,084 | | | $ | 2,572 | |
Ratio to average net assets: | | | | | | | | | | | | | | | | |
Gross expenses (d,e) | | | 0.97 | %(g) | | | 0.99 | % | | | 1.03 | % | | | 1.09 | %(g) |
Net expenses (b,d) | | | 0.77 | %(g) | | | 0.86 | % | | | 0.99 | % | | | 0.99 | %(g) |
Net investment income net of reimbursement (recapture) and securities lending expense offset (d,f) | | | 3.73 | %(g) | | | 3.28 | % | | | 2.53 | % | | | 1.84 | %(g) |
Portfolio turnover rate | | | 94 | %(h) | | | 155 | % | | | 175 | % | | | 205 | %(h) |
(a) | Since September 9, 2016 (Commencement of Operations). |
(b) | The ratio of expenses to average net assets includes interest expense which was 0.00%, 0.00%, 0.00% and 0.00%, respectively. |
(c) | Per share amounts are calculated using the average shares method. |
(d) | Does not reflect the expenses of the underlying funds in which the Fund invests. |
(e) | Represents the ratio of expenses to average net assets absent securities lending expense offset, fee waivers and/or expense reimbursements by the Adviser. |
(f) | Recognition of net investment income by the Fund is affected by the timing of the declaration of dividends by the underlying investment companies in which the Fund invests. The ratio does not include net investment income of the investment companies in which the Fund invests. |
See accompanying notes to financial statements.
67
Horizon Active Dividend Fund
FINANCIAL HIGHLIGHTS |
The table below sets forth financial data for one share of beneficial interest outstanding throughout each period/year.
| | | Investor Class | |
| | | For the
Period Ended
May 31,
2019 | | | For the
Year Ended
November 30,
2018 | | | For the
Period Ended
November 30,
2017 (a) | |
| | | (Unaudited) | | | | | | | | | |
| | | | | | | | | | | | | |
Net Asset Value, Beginning of Period/Year | | $ | 60.03 | | | $ | 59.15 | | | $ | 50.00 | |
Income From Investment Operations: | | | | | | | | | | | | |
Net investment income (c) | | | 0.86 | | | | 1.18 | (e) | | | 0.66 | |
Net gain (loss) from investments (both realized and unrealized) | | | (3.78 | ) | | | 1.61 | (e) | | | 9.01 | |
Total from investment operations | | | (2.92 | ) | | | 2.79 | | | | 9.67 | |
| | | | | | | | | | | | | |
Less Distributions: | | | | | | | | | | | | |
From net investment income | | | (0.81 | ) | | | (1.13 | ) | | | (0.52 | ) |
From net realized gains | | | (2.05 | ) | | | (0.78 | ) | | | — | |
Total Distributions | | | (2.86 | ) | | | (1.91 | ) | | | (0.52 | ) |
| | | | | | | | | | | | | |
Net Asset Value, End of Period/Year | | $ | 54.25 | | | $ | 60.03 | | | $ | 59.15 | |
| | | | | | | | | | | | | |
Total Return | | | (4.50 | )%(g) | | | 4.72 | % | | | 19.45 | %(g) |
| | | | | | | | | | | | | |
Ratios/Supplemental Data | | | | | | | | | | | | |
Net assets, end of period/year (in 000’s) | | $ | 95,666 | | | $ | 39,909 | | | $ | 24,509 | |
Ratio to average net assets: | | | | | | | | | | | | |
Gross expenses (d) | | | 1.10 | %(f) | | | 1.32 | % | | | 2.33 | %(f) |
Net expenses | | | 1.09 | %(f) | | | 1.09 | % | | | 1.09 | %(b,f) |
Net investment income net of reimbursement (recapture) and securities lending expense offset | | | 3.05 | %(f) | | | 1.93 | % | | | 1.24 | %(f) |
Portfolio turnover rate | | | 200 | %(g) | | | 320 | % | | | 184 | %(g) |
(a) | Since December 28, 2016 (Commencement of Operations). |
(b) | Effective July 1, 2017, Shareholder Servicing Fees for Investor Class shares decreased from 0.25% to 0.10% of average daily net assets. |
(c) | Per share amounts are calculated using the average shares method. |
(d) | Represents the ratio of expenses to average net assets absent securities lending expense offset, fee waivers and/or expense reimbursements by the Adviser. |
(e) | Due to the timing of shareholder transactions, and allocations of expenses among share classes, the per unit amounts presented may not coincide with the aggregate presentation on the Statements of Operations. |
See accompanying notes to financial statements.
68
Horizon Active Dividend Fund
FINANCIAL HIGHLIGHTS |
The table below sets forth financial data for one share of beneficial interest outstanding throughout each period/year.
| | | Advisor Class | |
| | | For the
Period Ended
May 31,
2019 | | | For the
Year Ended
November 30,
2018 | | | For the
Period Ended
November 30,
2017 (a) | |
| | | (Unaudited) | | | | | | | | | |
| | | | | | | | | | | | | |
Net Asset Value, Beginning of Period/Year | | $ | 60.00 | | | $ | 59.13 | | | $ | 54.31 | |
Income From Investment Operations: | | | | | | | | | | | | |
Net investment income (b) | | | 0.78 | | | | 1.04 | (d) | | | 0.25 | |
Net gain (loss) from investments (both realized and unrealized) | | | (3.74 | ) | | | 1.66 | (d) | | | 4.78 | |
Total from investment operations | | | (2.96 | ) | | | 2.70 | | | | 5.03 | |
| | | | | | | | | | | | | |
Less Distributions: | | | | | | | | | | | | |
From net investment income | | | (0.74 | ) | | | (1.05 | ) | | | (0.21 | ) |
From net realized gains | | | (2.05 | ) | | | (0.78 | ) | | | — | |
Total Distributions | | | (2.79 | ) | | | (1.83 | ) | | | (0.21 | ) |
| | | | | | | | | | | | | |
Net Asset Value, End of Period/Year | | $ | 54.25 | | | $ | 60.00 | | | $ | 59.13 | |
| | | | | | | | | | | | | |
Total Return | | | (4.57 | )%(f) | | | 4.57 | % | | | 9.28 | %(f) |
| | | | | | | | | | | | | |
Ratios/Supplemental Data | | | | | | | | | | | | |
Net assets, end of period/year (in 000’s) | | $ | 18,860 | | | $ | 10,892 | | | $ | 3,353 | |
Ratio to average net assets: | | | | | | | | | | | | |
Gross expenses (c) | | | 1.25 | %(e) | | | 1.48 | % | | | 2.12 | %(e) |
Net expenses | | | 1.24 | %(e) | | | 1.24 | % | | | 1.24 | %(e) |
Net investment income net of reimbursement (recapture) and securities lending expense offset | | | 2.79 | %(e) | | | 1.71 | % | | | 1.01 | %(e) |
Portfolio turnover rate | | | 200 | %(f) | | | 320 | % | | | 184 | %(f) |
(a) | Since June 20, 2017 (Commencement of Operations). |
(b) | Per share amounts are calculated using the average shares method. |
(c) | Represents the ratio of expenses to average net assets absent securities lending expense offset, fee waivers and/or expense reimbursements by the Adviser. |
(d) | Due to the timing of shareholder transactions, and allocations of expenses among share classes, the per unit amounts presented may not coincide with the aggregate presentation on the Statements of Operations. |
See accompanying notes to financial statements.
69
Horizon Defined Risk Fund
FINANCIAL HIGHLIGHTS |
The table below sets forth financial data for one share of beneficial interest outstanding throughout each period.
| | | Investor Class | |
| | | For the
Period Ended
May 31,
2019 | | | For the
Period Ended
November 30,
2018 (a) | |
| | | (Unaudited) | | | | | |
| | | | | | | | | |
Net Asset Value, Beginning of Period | | $ | 51.00 | | | $ | 50.00 | |
Income From Investment Operations: | | | | | | | | |
Net investment income (b) | | | 0.29 | | | | 0.44 | |
Net gain (loss) from investments (both realized and unrealized) | | | (0.72 | ) | | | 0.56 | |
Total from investment operations | | | (0.43 | ) | | | 1.00 | |
| | | | | | | | | |
Less Distributions: | | | | | | | | |
From net investment income | | | (0.17 | ) | | | — | |
From net realized gains | | | (0.11 | ) | | | — | |
Total Distributions | | | (0.28 | ) | | | — | |
| | | | | | | | | |
Net Asset Value, End of Period | | $ | 50.29 | | | $ | 51.00 | |
| | | | | | | | | |
Total Return | | | (0.79 | )%(e) | | | 2.00 | %(e) |
| | | | | | | | | |
Ratios/Supplemental Data | | | | | | | | |
Net assets, end of period (in 000’s) | | $ | 77,023 | | | $ | 5,915 | |
Ratio to average net assets: | | | | | | | | |
Gross expenses (c) | | | 1.24 | %(d) | | | 2.18 | %(d) |
Net expenses | | | 1.04 | %(d) | | | 1.04 | %(d) |
Net investment income net of reimbursement and securities lending expense offset | | | 1.14 | %(d) | | | 0.94 | %(d) |
Portfolio turnover rate | | | 4 | %(e) | | | 89 | %(e) |
(a) | Since December 28, 2017 (Commencement of Operations). |
(b) | Per share amounts are calculated using the average shares method. |
(c) | Represents the ratio of expenses to average net assets absent securities lending expense offset, fee waivers and/or expense reimbursements by the Adviser. |
See accompanying notes to financial statements.
70
Horizon Defined Risk Fund
FINANCIAL HIGHLIGHTS |
The table below sets forth financial data for one share of beneficial interest outstanding throughout each period.
| | | Advisor Class | |
| | | For the
Period Ended
May 31,
2019 | | | For the
Period Ended
November 30,
2018 (a) | |
| | | (Unaudited) | | | | | |
| | | | | | | | | |
Net Asset Value, Beginning of Period | | $ | 50.98 | | | $ | 50.00 | |
Income From Investment Operations: | | | | | | | | |
Net investment income (b) | | | 0.23 | | | | 0.31 | (d) |
Net gain (loss) from investments (both realized and unrealized) | | | (0.69 | ) | | | 0.67 | (d) |
Total from investment operations | | | (0.46 | ) | | | 0.98 | |
| | | | | | | | | |
Less Distributions: | | | | | | | | |
From net investment income | | | (0.10 | ) | | | — | |
From net realized gains | | | (0.11 | ) | | | — | |
Total Distributions | | | (0.21 | ) | | | — | |
| | | | | | | | | |
Net Asset Value, End of Period | | $ | 50.31 | | | $ | 50.98 | |
| | | | | | | | | |
Total Return | | | (0.88 | )%(f) | | | 0.77 | %(f) |
| | | | | | | | | |
Ratios/Supplemental Data | | | | | | | | |
Net assets, end of period (in 000’s) | | $ | 12,381 | | | $ | 9,173 | |
Ratio to average net assets: | | | | | | | | |
Gross expenses (c) | | | 1.44 | %(e) | | | 1.88 | %(e) |
Net expenses | | | 1.19 | %(e) | | | 0.94 | %(e) |
Net investment income net of reimbursement and securities lending expense offset | | | 0.92 | %(e) | | | 1.26 | %(e) |
Portfolio turnover rate | | | 4 | %(f) | | | 89 | %(f) |
(a) | Since February 2, 2018 (Commencement of Operations). |
(b) | Per share amounts are calculated using the average shares method. |
(c) | Represents the ratio of expenses to average net assets absent securities lending expense offset, fee waivers and/or expense reimbursements by the Adviser. |
(d) | Due to the timing of shareholder transactions, and allocations of expenses among share classes, the per unit amounts presented may not coincide with the aggregate presentation on the Statements of Operations. |
See accompanying notes to financial statements.
71
Horizon Funds Notes to Financial Statements (Unaudited)
May 31, 2019 |
1. ORGANIZATION
The Horizon Active Asset Allocation Fund, Horizon Active Risk Assist® Fund, Horizon Active Income Fund, Horizon Active Dividend Fund and Horizon Defined Risk Fund (each a “Fund” and together the “Funds”) are each a series of shares of beneficial interest of Horizon Funds (the “Trust”), a Delaware business trust organized on May 21, 2015. The Horizon Active Asset Allocation Fund, Horizon Active Risk Assist® Fund, Horizon Active Income Fund, and Horizon Defined Risk Fund are registered under the Investment Company Act of 1940, as amended (the “1940 Act”) as diversified, open-end management investment companies. The Horizon Active Dividend Fund is registered under the 1940 Act as a non-diversified, open-end management investment company. The investment objective of the Horizon Active Asset Allocation Fund is capital appreciation. The Fund presently offers Investor Class shares, Advisor Class shares and Institutional Class shares, which commenced operations on January 31, 2012, September 4, 2015 and September 9, 2016, respectively. The investment objective of the Horizon Active Risk® Assist Fund is to capture the majority of the returns associated with equity market investments, while mitigating downside risk through use of a risk overlay strategy. The Fund presently offers Investor Class shares, Advisor Class shares and Institutional Class shares, which commenced operations on August 28, 2014, September 4, 2015 and September 9, 2016, respectively. The investment objective of the Horizon Active Income Fund is income. The Fund presently offers Investor Class shares, Advisor Class shares and Institutional Class shares, which commenced operations on September 30, 2013, February 8, 2016 and September 9, 2016, respectively. The investment objective of the Horizon Active Dividend Fund is capital appreciation and current income. The Fund presently offers Investor Class shares and Advisor Class shares, which commenced operations on December 28, 2016 and June 20, 2017, respectively. The investment objective of the Horizon Defined Risk Fund is capital appreciation and capital preservation. The Fund presently offers Investor Class shares and Advisor Class shares, which commenced operations on December 28, 2017 and February 2, 2018, respectively.
Each Fund is an investment company and accordingly follows the investment company accounting and reporting guidance of the Financial Accounting Standards Board (“FASB”) Accounting Standards Codification Topic 946 “Financial Services – Investment Companies”.
2. SUMMARY OF SIGNIFICANT ACCOUNTING POLICIES
The following is a summary of significant accounting policies followed by the Funds in the preparation of their financial statements. These policies are in conformity with accounting principles generally accepted in the United States of America (“GAAP”). The preparation of financial statements requires management to make estimates and assumptions that affect the reported amounts of assets and liabilities and disclosure of contingent assets and liabilities at the date of the financial statements and the reported amounts of income and expenses for the year. Actual results could differ from those estimates.
In determining a Fund’s net asset value (“NAV”) per share, equity securities, including common stocks, preferred stocks, and exchange traded funds, for which market quotations are readily available are valued at current market value using the last reported sales price. NASDAQ traded securities are valued using the NASDAQ official closing price (“NOCP”). If the NOCP is not available, such securities shall be valued at the mean between the current bid and ask prices on the day of valuation, or if there has been no sale on such day, at the mean between the current bid and ask prices on the primary exchange. When market quotations received are from an active market, the securities will be classified within Level 1 of the fair value hierarchy. If market quotations are not readily available, then securities are valued at fair value as determined by the Board of Trustees of the Trust (“the Board”) or its delegate. Short-term debt instruments with a remaining maturity of more than 60 days, intermediate and long-term bonds, convertible bonds, and other debt securities are generally valued on the basis of dealer supplied quotations or by a pricing system selected by the Adviser and approved by the Board. Where such prices are not available, valuations will be obtained from brokers who are market makers for such securities. However, in circumstances where the Adviser deems it appropriate to do
72
Horizon Funds
NOTES TO FINANCIAL STATEMENTS (Unaudited) (Continued)
May 31, 2019 |
so, the mean of the bid and asked prices for over-the-counter securities or the last available sale price for exchange-traded debt securities may be used. Where no last sale price for exchange traded debt securities is available, the mean of the bid and asked prices may be used. Short-term debt securities with a remaining maturity of 60 days or less are amortized to maturity, provided such valuations represent fair value. Investments in registered open-end investment companies (including money market funds), other than exchange-traded funds, are valued at their reported NAVs. Purchased and written options are valued primarily at the mean of the bid and the ask.
Other securities and assets for which market quotations are not readily available or for which valuation cannot be provided, as described above, are valued as determined in good faith in accordance with procedures approved by the Board.
The Funds utilize various methods to measure the fair value of all of their investments on a recurring basis. GAAP establishes a hierarchy that prioritizes inputs to valuation methods. The three levels of input are:
Level 1 – Unadjusted quoted prices in active markets for identical assets and liabilities that the Funds have the ability to access.
Level 2 – Observable inputs other than quoted prices included in Level 1 that are observable for the asset or liability, either directly or indirectly. These inputs may include quoted prices for the identical instrument in an inactive market, prices for similar instruments, interest rates, prepayment speeds, credit risk, yield curves, default rates and similar data.
Level 3 – Unobservable inputs for the asset or liability, to the extent relevant observable inputs are not available, representing the Funds’ own assumptions about the assumptions a market participant would use in valuing the asset or liability, and would be based on the best information available.
The availability of observable inputs can vary from security to security and is affected by a wide variety of factors, including, for example, the type of security, whether the security is new and not yet established in the marketplace, the liquidity of markets, and other characteristics particular to the security. To the extent that valuation is based on models or inputs that are less observable or unobservable in the market, the determination of fair value requires more judgment. Accordingly, the degree of judgment exercised in determining fair value is greatest for instruments categorized in Level 3.
The inputs used to measure fair value may fall into different levels of the fair value hierarchy. In such cases, for disclosure purposes, the level in the fair value hierarchy within which the fair value measurement falls in its entirety, is determined based on the lowest level input that is significant to the fair value measurement in its entirety.
The inputs or methodology used for valuing securities are not necessarily an indication of the risk associated with investing in those securities. The following tables summarize the inputs used as of May 31, 2019, for the Funds’ investments measured at value:
Horizon Active Asset Allocation Fund |
Assets * | | Level 1 | | | Level 2 | | | Level 3 | | | Total | |
Exchange Traded Funds | | $ | 478,864,655 | | | $ | — | | | $ | — | | | $ | 478,864,655 | |
Common Stocks | | | 25,742,481 | | | | — | | | | — | | | | 25,742,481 | |
Purchased Call Options | | | — | | | | 1,041,500 | | | | — | | | | 1,041,500 | |
Purchased Put Options | | | 1,716,500 | | | | 1,101,520 | | | | — | | | | 2,818,020 | |
Short-Term Investments | | | 428,525 | | | | — | | | | — | | | | 428,525 | |
Investments Purchased With Proceeds From Securities Lending | | | 70,882,042 | | | | — | | | | — | | | | 70,882,042 | |
Total | | $ | 577,634,203 | | | $ | 2,143,020 | | | $ | — | | | $ | 579,777,223 | |
73
Horizon Funds
NOTES TO FINANCIAL STATEMENTS (Unaudited) (Continued)
May 31, 2019 |
Liabilities * | | Level 1 | | | Level 2 | | | Level 3 | | | Total | |
Written Call Options | | $ | 142,500 | | | $ | 336,000 | | | $ | — | | | $ | 478,500 | |
Written Put Options | | | 985,500 | | | | 830,000 | | | | — | | | | 1,815,500 | |
Total | | $ | 1,128,000 | | | $ | 1,166,000 | | | $ | — | | | $ | 2,294,000 | |
Horizon Active Risk Assist® Fund |
Assets * | | Level 1 | | | Level 2 | | | Level 3 | | | Total | |
Exchange Traded Funds | | $ | 727,955,085 | | | $ | — | | | $ | — | | | $ | 727,955,085 | |
Common Stocks | | | 118,159,360 | | | | — | | | | — | | | | 118,159,360 | |
Purchased Call Options | | | 2,000 | | | | 1,222,500 | | | | — | | | | 1,224,500 | |
Purchased Put Options | | | 1,464,950 | | | | 3,770,000 | | | | — | | | | 5,234,950 | |
Short-Term Investments | | | 8,882,421 | | | | — | | | | — | | | | 8,882,421 | |
Investments Purchased With Proceeds From Securities Lending | | | 68,335,862 | | | | — | | | | — | | | | 68,335,862 | |
Total | | $ | 924,799,678 | | | $ | 4,992,500 | | | $ | — | | | $ | 929,792,178 | |
Liabilities * | | Level 1 | | | Level 2 | | | Level 3 | | | Total | |
Written Call Options | | $ | 181,500 | | | $ | 312,000 | | | $ | — | | | $ | 493,500 | |
Written Put Options | | | 231,000 | | | | 695,500 | | | | — | | | | 926,500 | |
Total | | $ | 412,500 | | | $ | 1,007,500 | | | $ | — | | | $ | 1,420,000 | |
Horizon Active Income Fund |
Assets * | | Level 1 | | | Level 2 | | | Level 3 | | | Total | |
Exchange Traded Funds | | $ | 268,328,685 | | | $ | — | | | $ | — | | | $ | 268,328,685 | |
Purchased Call Options | | | — | | | | 10,000 | | | | — | | | | 10,000 | |
Purchased Put Options | | | — | | | | 281,000 | | | | — | | | | 281,000 | |
U.S. Treasury Bills | | | — | | | | 99,981 | | | | — | | | | 99,981 | |
Short-Term Investments | | | 2,882,265 | | | | — | | | | — | | | | 2,882,265 | |
Investments Purchased With Proceeds From Securities Lending | | | 57,530,682 | | | | — | | | | — | | | | 57,530,682 | |
Total | | $ | 328,741,632 | | | $ | 390,981 | | | $ | — | | | $ | 329,132,613 | |
Liabilities * | | Level 1 | | | Level 2 | | | Level 3 | | | Total | |
Written Call Options | | $ | — | | | $ | 188,000 | | | $ | — | | | $ | 188,000 | |
Written Put Options | | | — | | | | 112,000 | | | | — | | | | 112,000 | |
Total | | $ | — | | | $ | 300,000 | | | $ | — | | | $ | 300,000 | |
74
Horizon Funds
NOTES TO FINANCIAL STATEMENTS (Unaudited) (Continued)
May 31, 2019 |
Horizon Active Dividend Fund |
Assets * | | Level 1 | | | Level 2 | | | Level 3 | | | Total | |
Common Stocks | | $ | 102,082,249 | | | $ | — | | | $ | — | | | $ | 102,082,249 | |
Preferred Stocks | | | 211,032 | | | | — | | | | — | | | | 211,032 | |
Purchased Put Options | | | — | | | | 256,275 | | | | — | | | | 256,275 | |
Short-Term Investments | | | 12,725,525 | | | | — | | | | — | | | | 12,725,525 | |
Investments Purchased With Proceeds From Securities Lending | | | 68,000 | | | | — | | | | — | | | | 68,000 | |
Total | | $ | 115,086,806 | | | $ | 256,275 | | | $ | — | | | $ | 115,343,081 | |
Liabilities * | | Level 1 | | | Level 2 | | | Level 3 | | | Total | |
Written Put Options | | $ | — | | | $ | 81,450 | | | $ | — | | | $ | 81,450 | |
Total | | $ | — | | | $ | 81,450 | | | $ | — | | | $ | 81,450 | |
Horizon Defined Risk Fund |
Assets * | | Level 1 | | | Level 2 | | | Level 3 | | | Total | |
Common Stocks | | $ | 85,558,807 | | | $ | — | | | $ | — | | | $ | 85,558,807 | |
Purchased Call Options | | | — | | | | 9,187 | | | | — | | | | 9,187 | |
Purchased Put Options | | | — | | | | 4,233,563 | | | | — | | | | 4,233,563 | |
Short-Term Investments | | | 1,950,871 | | | | — | | | | — | | | | 1,950,871 | |
Investments Purchased With Proceeds From Securities Lending | | | 24,336 | | | | — | | | | — | | | | 24,336 | |
Total | | $ | 87,534,014 | | | $ | 4,242,750 | | | $ | — | | | $ | 91,776,764 | |
Liabilities * | | Level 1 | | | Level 2 | | | Level 3 | | | Total | |
Written Call Options | | $ | — | | | $ | 37,500 | | | $ | — | | | $ | 37,500 | |
Written Put Options | | | — | | | | 2,680,500 | | | | — | | | | 2,680,500 | |
Total | | $ | — | | | $ | 2,718,000 | | | $ | — | | | $ | 2,718,000 | |
* | Refer to the Portfolios of Investments for security classifications. |
Exchange Traded Funds – The Funds may invest in exchange traded funds (“ETFs”). ETFs are a type of registered investment company that is typically purchased and redeemed at net asset value (“NAV”) in large blocks of shares called “Creation Units”, and bought and sold in secondary markets on a securities exchange, where its shares trade like common stock. An index-based ETF represents a fixed portfolio of securities designed to track the performance and dividend yield of a particular domestic or foreign market index. Alternatively, ETFs may be actively managed in accordance with a particular investment strategy. The risks of owning an ETF generally reflect the risks of owning the underlying securities they hold, although the lack of liquidity on an ETF could result in it being more volatile.
Option Transactions – Options are derivative financial instruments that give the buyer, in exchange for a premium payment, the right, but not the obligation, to either purchase from (call option) or sell to (put option) the writer a specified underlying instrument at a specified price on or before a specified date. The Funds enter into option contracts to meet the requirements of their trading activities. The risk in writing a call option is that the Funds may incur a loss if the market price of the security increases and the option is exercised. The risk in writing a put option is that the Funds
75
Horizon Funds
NOTES TO FINANCIAL STATEMENTS (Unaudited) (Continued)
May 31, 2019 |
may incur a loss if the market price of the security decreases and the option is exercised. The risk in buying an option is that the Fund pays a premium whether or not the option is exercised. The Funds also have the additional risk of not being able to enter into a closing transaction if a liquid secondary market does not exist.
When a Fund writes a call or put option, an amount equal to the premium received is included in the statement of assets and liabilities as a liability. The amount of the liability is subsequently marked-to-market to reflect the current fair value of the option. If an option expires on its stipulated expiration date or if the Fund enters into a closing purchase transaction, a gain or loss is realized. If a written call or put option is exercised, a gain or loss is realized for the sale of the underlying security and the proceeds from the sale are increased by the premium originally received. As the writer of an option, the Fund has no control over whether the option will be exercised and, as a result, retains the market risk of an unfavorable change in price of the security underlying the written option.
A Fund may purchase put and call options. The Funds engage in options transactions on individual securities, ETFs, or indices to hedge against market declines or generate returns from falling asset prices. If such a decline occurs, the put options will permit the Fund to sell the securities underlying such options at the exercise price, or to close out the options at a profit. The premium paid for a put or call option plus any transaction costs will reduce the benefit, if any, realized by the Fund upon exercise of the option, and, unless the price of the underlying security rises or declines sufficiently, the option may expire worthless to the Fund. In addition, in the event that the price of the security in connection with which an option was purchased moves in a direction favorable to the Fund, the benefits realized by the Fund as a result of such a favorable movement will be reduced by the amount of the premium paid for the option and related transaction costs. Written and purchased options are non-income producing securities. With purchased options, there is minimal counterparty risk to the Fund since these options are exchange traded and the exchange’s clearinghouse, as counterparty to all exchange traded options, guarantees against a possible default.
The average quarterly value outstanding of purchased and written options during the six months ended May 31, 2019, were as follows:
| | Horizon Active
Asset Allocation
Fund | | | Horizon Active
Risk Assist Fund | | | Horizon Active
Income Fund | | | Horizon Active
Dividend Fund | | | Horizon Defined
Risk Fund | |
Purchased Options | | $ | 2,629,027 | | | $ | 3,718,219 | | | $ | 174,101 | | | $ | 84,295 | | | $ | 1,290,549 | |
Written Options | | $ | 1,134,063 | | | $ | 817,313 | | | $ | 152,406 | | | $ | 29,101 | | | $ | 1,523,001 | |
The following is a summary of the location of derivative investments on the Funds’ Statements of Assets and Liabilities as of May 31, 2019:
Location on the Statements of Assets and Liabilities |
Fund | Derivatives Investment Type | Asset Derivatives | Liability Derivatives |
Horizon Active Asset Allocation Fund | Equity Risk Contracts | Investments in Unaffiliated Securities, at Value | Options Written, at Value |
Horizon Active Risk Assist® Fund | Equity Risk Contracts | Investments in Unaffiliated Securities, at Value | Options Written, at Value |
Horizon Active
Income Fund | Equity Risk Contracts | Investments in Unaffiliated Securities, at Value | Options Written, at Value |
Horizon Active Dividend Fund | Equity Risk Contracts | Investments in Unaffiliated Securities, at Value | Options Written, at Value |
Horizon Defined
Risk Fund | Equity Risk Contracts | Investments in Unaffiliated Securities, at Value | Options Written, at Value |
76
Horizon Funds
NOTES TO FINANCIAL STATEMENTS (Unaudited) (Continued)
May 31, 2019 |
Active Asset Allocation Fund |
Derivatives Investment Value |
Purchased Options | | $ | 3,859,520 | |
Written Options | | $ | 2,294,000 | |
Active Risk Assist® Fund |
Derivatives Investment Value |
Purchased Options | | $ | 6,459,450 | |
Written Options | | $ | 1,420,000 | |
Active Income Fund |
Derivatives Investment Value |
Purchased Options | | $ | 291,000 | |
Written Options | | $ | 300,000 | |
Active Dividend Fund |
Derivatives Investment Value |
Purchased Options | | $ | 256,275 | |
Written Options | | $ | 81,450 | |
Defined Risk Fund |
Derivatives Investment Value |
Purchased Options | | $ | 4,242,750 | |
Written Options | | $ | 2,718,000 | |
The following is a summary of the location of derivative investments on the Funds’ Statements of Operations for the six months ended May 31, 2019:
Derivative Investment Type | Location of Gain (Loss) on Derivatives in the Statements of Operations |
Equity Risk contracts | Net realized gain (loss) from purchased options |
| | Net realized gain (loss) from written options |
| | Net change in unrealized appreciation (depreciation) on purchased options |
| | Net change in unrealized appreciation (depreciation) on written options |
77
Horizon Funds
NOTES TO FINANCIAL STATEMENTS (Unaudited) (Continued)
May 31, 2019 |
Active Asset Allocation Fund |
Realized gain/(loss) on derivatives recognized in the Statements of Operations |
Derivative Investment Type | | | |
Purchased Options | | $ | (7,053,833 | ) |
Written Options | | | (2,088,782 | ) |
| | | $ | (9,142,615 | ) |
Changes in unrealized appreciation/(depreciation) on derivatives recognized in the Statements of Operations |
Purchased Options | | $ | (2,893,505 | ) |
Written Options | | | 471,925 | |
| | | $ | (2,421,580 | ) |
Active Risk Assist® Fund |
Realized gain/(loss) on derivatives recognized in the Statements of Operations |
Derivative Investment Type | | | |
Purchased Options | | $ | (1,195,241 | ) |
Written Options | | | (2,760,535 | ) |
| | | $ | (3,955,776 | ) |
Changes in unrealized appreciation/(depreciation) on derivatives recognized in the Statements of Operations |
Purchased Options | | $ | (406,061 | ) |
Written Options | | | 137,976 | |
| | | $ | (268,085 | ) |
Active Income Fund |
Realized gain/(loss) on derivatives recognized in the Statements of Operations |
Derivative Investment Type | | | |
Purchased Options | | $ | (729,703 | ) |
Written Options | | | (606,143 | ) |
| | | $ | (1,335,846 | ) |
Changes in unrealized appreciation/(depreciation) on derivatives recognized in the Statements of Operations |
Purchased Options | | $ | (271,537 | ) |
Written Options | | | (6,815 | ) |
| | | $ | (278,352 | ) |
78
Horizon Funds
NOTES TO FINANCIAL STATEMENTS (Unaudited) (Continued)
May 31, 2019 |
Active Dividend Fund |
Realized gain/(loss) on derivatives recognized in the Statements of Operations |
Derivative Investment Type | | | |
Purchased Options | | $ | (201,031 | ) |
Written Options | | | 80,772 | |
| | | $ | (120,259 | ) |
Changes in unrealized appreciation/(depreciation) on derivatives recognized in the Statements of Operations |
Purchased Options | | $ | 141,666 | |
Written Options | | | (26,605 | ) |
| | | $ | 115,061 | |
Defined Risk Fund |
Realized gain/(loss) on derivatives recognized in the Statements of Operations |
Derivative Investment Type | | | |
Purchased Options | | $ | (2,267,778 | ) |
Written Options | | | (2,516,804 | ) |
| | | $ | (4,784,582 | ) |
Changes in unrealized appreciation/(depreciation) on derivatives recognized in the Statements of Operations |
Purchased Options | | $ | 1,851,167 | |
Written Options | | | (1,350,587 | ) |
| | | $ | 500,580 | |
Offsetting of Financial Assets and Derivative Liabilities
The following table presents the Funds’ liability derivatives available for offset under a master netting arrangement net of collateral pledged for the Funds as of May 31, 2019.
Horizon Active Asset Allocation Fund |
Liabilities: | | | | | | | | | | | | | | Gross Amounts Not Offset
in the Statement of Assets &
Liabilities | | | | | |
Description | | Gross Amounts
of Recognized
Liabilities | | | Gross Amounts
Offset in the
Statement
of Assets &
Liabilities | | | Net Amounts
Presented in
the Statement
of Assets &
Liabilities | | | Financial
Instruments | | | Collateral
Pledged/
Received | | | Net Amount | |
Written Options | | $ | 2,294,000 | (1) | | $ | — | | | $ | 2,294,000 | | | $ | — | | | $ | (2,294,000 | )(2) | | $ | — | |
Total | | $ | 2,294,000 | | | $ | — | | | $ | 2,294,000 | | | $ | — | | | $ | (2,294,000 | ) | | $ | — | |
79
Horizon Funds
NOTES TO FINANCIAL STATEMENTS (Unaudited) (Continued)
May 31, 2019 |
Horizon Active Risk Assist® Fund |
Liabilities: | | | | | | | | | | | | | | Gross Amounts Not Offset
in the Statement of Assets &
Liabilities | | | | | |
Description | | Gross Amounts
of Recognized
Liabilities | | | Gross Amounts
Offset in the
Statement
of Assets &
Liabilities | | | Net Amounts
Presented in
the Statement
of Assets &
Liabilities | | | Financial
Instruments | | | Collateral
Pledged/
Received | | | Net Amount | |
Written Options | | $ | 1,420,000 | (1) | | $ | — | | | $ | 1,420,000 | | | $ | — | | | $ | (1,420,000 | )(2) | | $ | — | |
Total | | $ | 1,420,000 | | | $ | — | | | $ | 1,420,000 | | | $ | — | | | $ | (1,420,000 | ) | | $ | — | |
Horizon Active Income Fund |
Liabilities: | | | | | | | | | | | | | | Gross Amounts Not Offset
in the Statement of Assets &
Liabilities | | | | | |
Description | | Gross Amounts
of Recognized
Liabilities | | | Gross Amounts
Offset in the
Statement
of Assets &
Liabilities | | | Net Amounts
Presented in
the Statement
of Assets &
Liabilities | | | Financial
Instruments | | | Collateral
Pledged/
Received | | | Net Amount | |
Written Options | | $ | 300,000 | (1) | | $ | — | | | $ | 300,000 | | | $ | — | | | $ | (300,000 | )(2) | | $ | — | |
Total | | $ | 300,000 | | | $ | — | | | $ | 300,000 | | | $ | — | | | $ | (300,000 | ) | | $ | — | |
Horizon Active Dividend Fund |
Liabilities: | | | | | | | | | | | | | | Gross Amounts Not Offset
in the Statement of Assets &
Liabilities | | | | | |
Description | | Gross Amounts
of Recognized
Liabilities | | | Gross Amounts
Offset in the
Statement
of Assets &
Liabilities | | | Net Amounts
Presented in
the Statement
of Assets &
Liabilities | | | Financial
Instruments | | | Collateral
Pledged/
Received | | | Net Amount | |
Written Options | | $ | 81,450 | (1) | | $ | — | | | $ | 81,450 | | | $ | — | | | $ | (81,450 | )(2) | | $ | — | |
Total | | $ | 81,450 | | | $ | — | | | $ | 81,450 | | | $ | — | | | $ | (81,450 | ) | | $ | — | |
80
Horizon Funds
NOTES TO FINANCIAL STATEMENTS (Unaudited) (Continued)
May 31, 2019 |
Horizon Defined Risk Fund |
Liabilities: | | | | | | | | | | | | | | Gross Amounts Not Offset
in the Statement of Assets &
Liabilities | | | | | |
Description | | Gross Amounts
of Recognized
Liabilities | | | Gross Amounts
Offset in the
Statement
of Assets &
Liabilities | | | Net Amounts
Presented in
the Statement
of Assets &
Liabilities | | | Financial
Instruments | | | Collateral
Pledged/
Received | | | Net Amount | |
Written Options | | $ | 2,718,000 | (1) | | $ | — | | | $ | 2,718,000 | | | $ | — | | | $ | (2,718,000 | )(2) | | $ | — | |
Total | | $ | 2,718,000 | | | $ | — | | | $ | 2,718,000 | | | $ | — | | | $ | (2,718,000 | ) | | $ | — | |
(1) | Written options at value as presented in the Portfolios of Investments. |
(2) | The amount is limited to the derivative liability balance and, accordingly, does not include excess collateral pledged. |
Due to the absence of a master netting agreement relating to the Funds’ participation in securities lending, no additional disclosures have been made on behalf of the Funds. Please reference Note 5 for collateral related to securities on loan.
Security Transactions and Investment Income – Investment security transactions are accounted for on a trade date basis. Cost is determined and gains and losses are based upon the specific identification method for both financial statement and federal income tax purposes. Dividend income and expense is recorded on the ex-dividend date and interest income is recorded on the accrual basis. Long-term capital gain distributions from investment companies are recorded separately from dividend income. Purchase discounts and premiums on securities are accreted and amortized over the life of the respective securities.
Expenses – Expenses of the Trust that are directly identifiable to a specific Fund are charged to that Fund. Expenses, which are not readily identifiable to a specific Fund, are allocated in such a manner as deemed equitable, taking into consideration the nature and type of expense and the relative sizes of the Funds in the Trust. Income, other non-class-specific expenses, and realized and unrealized gains and losses on investments are allocated to each class of shares based on its relative net assets.
Federal Income Taxes – It is each Fund’s policy to comply with all sections of the Internal Revenue Code applicable to regulated investment companies and to distribute all of its taxable income and gains to its shareholders and therefore, no provision for federal income tax has been made. Each Fund is treated as a separate taxpayer for federal income tax purposes.
The Funds recognize the tax benefits of uncertain tax positions only where the position is “more likely than not” to be sustained assuming examination by tax authorities. Management has analyzed the Funds’ tax positions, and has concluded that no liability for unrecognized tax benefits should be recorded related to uncertain tax positions taken on returns filed for open tax years or expected to be taken in the Funds’ 2018 tax returns. The Funds identified their major tax jurisdictions as U.S. Federal, North Carolina State and Delaware State; however, the Funds are not aware of any tax positions for which it is reasonably possible that the total amounts of unrecognized tax benefits will change materially in the next twelve months.
Distributions to Shareholders – Distributions from investment income, if any, are declared and paid at least annually for the Horizon Active Asset Allocation Fund, Horizon Active Risk Assist Fund and the Horizon Defined Risk Fund and quarterly for the Horizon Active Income Fund and Horizon Active Dividend Fund and are recorded on the ex-dividend date. The Funds will declare and pay net realized capital gains, if any, annually. The character of income and gains to be distributed is determined in accordance with income tax regulations, which may differ from GAAP.
81
Horizon Funds
NOTES TO FINANCIAL STATEMENTS (Unaudited) (Continued)
May 31, 2019 |
Shareholder Services Plan – The Board has adopted a shareholder serving plan (the “Plan”) for Investor Class Shares of the Horizon Active Asset Allocation Fund, Horizon Active Risk Assist Fund, and the Horizon Active Income Fund. The Plan allows the Funds to use part of their assets for shareholder servicing expenses. The Shareholder Servicing Expenses for the Investor Class shares of the Horizon Active Asset Allocation Fund, Horizon Active Risk Assist®Fund, and Horizon Active Income Fund is 0.10% of average daily net assets. For these services, the Funds pay a fee up to 0.10% of average net assets attributable to Investor Class shares of the Funds on an annualized basis. Payments under the Plan are made for the provision of support services to shareholders, including administrative or other shareholder support services such as responding to customer inquiries or assisting the Funds in establishing or maintaining shareholder accounts and records. The entities providing shareholder services may provide such services directly, or may arrange for such services to be provided by another entity that has a servicing relationship with one or more shareholders. However, payments under the Plan are an operating expense of each Fund that is not subject to the expense limitation provided by the Adviser. Payments under the Plan may vary and are determined by the respective Fund in its sole discretion, in amounts up to 0.10% of the Fund’s average daily net assets attributable to Investor Class shares of the Fund on an annualized basis.
Rule 12b-1 – The Trust, with respect to all Funds, has adopted a Distribution Plan for Advisor Class shares of each Fund, and also for Investor Class shares of the Horizon Active Dividend Fund and the Horizon Defined Risk Fund, pursuant to Rule 12b-1 under the 1940 Act (the “12b-1 Plan”). However, payments under the 12b-1 Plan are an operating expense of each Fund that is not subject to the expense limitation provided by the Adviser. The 12b-1 Plan provides for the payment of a distribution fee to Quasar Distributors, LLC (the “Distributor”) at an annualized rate of up to 0.25% of the average daily net assets attributable to the applicable classes. Effective as of July 1, 2017, the Board of Trustees authorized a temporary voluntary waiver of a portion of the distribution fee for Investor Class shares of the Active Dividend Fund and Defined Risk Fund, reducing it to 0.10% of the average net assets attributable to Investor Class shares of these Funds, and this waiver is currently in place through March 31, 2020. During the six months ended May 31, 2019 the distribution fees accrued for the Investor Class shares of both the Horizon Active Dividend Fund and the Horizon Defined Risk Fund and Advisor Class shares of all Funds were 0.10% and 0.25% of average daily net assets, respectively. During the six months ended May 31, 2019, the Horizon Active Asset Allocation Fund, Horizon Active Risk Assist®Fund, Horizon Active Income Fund, Horizon Active Dividend Fund, and the Horizon Defined Risk Fund Advisor Class shares incurred $16,462, $954, $2,907, $20,523, and $15,596 respectively, pursuant to the plan. During the six months ended May 31, 2019, the Horizon Active Dividend Fund and the Horizon Defined Risk Fund Investor Class shares incurred $28,122 and $2,502 respectively, pursuant to the plan. Investor Class shares of the Horizon Active Asset Allocation Fund, Horizon Active Risk Assist Fund and Horizon Active Income Fund and Institutional Class shares of Horizon Active Asset Allocation Fund, Horizon Active Risk Assist®Fund and Horizon Active Income Fund do not pay any 12b-1 distribution fees.
Indemnification – The Trust indemnifies its officers and trustees for certain liabilities that may arise from the performance of their duties to the Trust. Additionally, in the normal course of business, the Funds enter into contracts that contain a variety of representations and warranties and which provide general indemnities. A Fund’s maximum exposure under these arrangements is unknown, as this would involve future claims that may be made against the Fund that have not yet occurred. However, based on experience, the Trust expects the risk of loss due to these warranties and indemnities to be remote.
3. ADVISORY FEE AND OTHER RELATED PARTY TRANSACTIONS
Pursuant to an Investment Advisory Agreement with each Fund (the “Advisory Agreements”), investment advisory services are provided to the Funds by Horizon Investments, LLC (the “Adviser”). Under the terms of the Advisory Agreements, the Adviser receives monthly fees calculated at an annual rate of 0.99% of the average daily net assets of the Horizon Active Asset Allocation Fund, 0.99% of the average daily net assets of the Horizon Active Risk Assist® Fund, 0.77% of the average daily net assets of the Horizon Active Income Fund, 0.75% of the average daily net assets
82
Horizon Funds
NOTES TO FINANCIAL STATEMENTS (Unaudited) (Continued)
May 31, 2019 |
of the Horizon Active Dividend Fund and 0.80% of the average daily net assets of the Horizon Defined Risk Fund. Effective January 23, 2018, the Advisory fee rate decreased from 1.10% to 0.99% of the average daily net assets of the Horizon Active Asset Allocation Fund and the Horizon Active Risk Assist Fund.
Pursuant to the Expense Limitation Agreement (the “Waiver Agreement”), the Advisor has agreed, until March 31, 2020, for each Fund, to waive a portion of the Fund’s advisory fee and has agreed to reimburse the Fund for other expenses to the extent that the aggregate expenses of every character, including but not limited to investment advisory fees of the Adviser (but excluding front-end or contingent sales loads; brokerage fees and commissions; acquired fund fees and expenses; borrowing costs, such as interest and dividend expense on securities sold short; payments by the Fund, if any, under the Trust’s Rule 12b-1 Distribution Plan; payments by the Fund, if any, under the Trust’s Shareholder Services Plan; expenses paid with securities lending expense offset credits; taxes; and extraordinary expenses, such as litigation) incurred by a class of shares of the Fund in any fiscal year do not exceed the percentage of average daily net assets in the below table.
Fund | | Investor | | | Advisor | | | Institutional | |
Horizon Active Asset Allocation Fund | | | 1.17 | %(a) | | | 1.17 | %(b) | | | 1.17 | % |
Horizon Active Risk Assist® Fund | | | 1.17 | %(a) | | | 1.17 | %(b) | | | 1.17 | % |
Horizon Active Income Fund | | | 0.99 | %(c) | | | 0.99 | %(d) | | | 0.99 | % |
Horizon Active Dividend Fund | | | 0.99 | % | | | 0.99 | % | | | 0.99 | % |
Horizon Defined Risk Fund | | | 0.94 | % | | | 0.94 | % | | | 0.94 | % |
(a) | Effective March 30, 2018, the Operating Expense Limit for the Investor Class decreased from 1.27% to 1.17% and now excludes 0.10% of Shareholder Servicing Fees. |
(b) | Effective March 30, 2018, the Operating Expense Limit Agreement for the Advisor Class decreased from 1.42% to 1.17% and now excludes 0.25% of Distribution Fees (12b-1). |
(c) | Effective March 30, 2018 the Operating Expense Limit Agreement for the Investor Class decreased from 1.09% to 0.99% and now excludes 0.10% of Shareholder Servicing Fees. |
(d) | Effective March 30, 2018, the Operating Expense Limit for the Advisor Class decreased from 1.24% to 0.99% and now excludes 0.25% of Distribution Fees (12b-1). |
If the Adviser waives any fee or reimburses any expense pursuant to the Waiver Agreement, and a Fund’s Operating Expenses are subsequently less than its respective limit described in the Waiver Agreement, the Adviser shall be entitled to reimbursement by that Fund. If the Funds’ Operating Expenses subsequently exceed the figures in the above table, the reimbursements shall be suspended. Any fees waived on expenses reimbursed are subject to possible recoupment by the Adviser within 36 months after such fees have been waived on expenses reimbursed; provided, however, that such expenses may only be reimbursed to the extent they were waived or paid after the date of the Waiver Agreement (or any similar agreement). No amounts will be paid to the Adviser in any fiscal quarter unless the Board determines that reimbursement is in the best interests of the Funds and their shareholders.
83
Horizon Funds
NOTES TO FINANCIAL STATEMENTS (Unaudited) (Continued)
May 31, 2019 |
The table below contains the amounts of fee waivers and expense reimbursements subject to recapture by the Adviser through November 30 of the year indicated. The fee waivers and expense reimbursements incurred by the Predecessor funds are subject to recapture. During the six months ended May 31, 2019, the Adviser recouped from Horizon Active Asset Allocation Fund, Horizon Active Risk Assist® Fund, Horizon Active Income Fund, Horizon Active Dividend Fund and the Horizon Defined Risk Fund $181,017, $406,527, $0, $7,993 and $0, respectively.
Fund | | 2019 | | | 2020 | | | 2021 | | | 2022 | | | Total | |
Horizon Active Asset Allocation Fund | | $ | 172,411 | | | $ | 470,902 | | | $ | 66,540 | | | $ | — | | | $ | 709,853 | |
Horizon Active Risk Assist® Fund | | | — | | | | 290,006 | | | | 86,367 | | | | — | | | | 376,373 | |
Horizon Active Income Fund | | | — | | | | — | | | | — | | | | — | | | | — | |
Horizon Active Dividend Fund | | | — | | | | 55,972 | | | | 68,437 | | | | 7,714 | | | | 132,123 | |
Horizon Defined Risk Fund | | | — | | | | — | | | | 87,874 | | | | 73,809 | | | | 161,684 | |
Trustees – The Trust pays each Trustee of the Trust who is not an interested person an annual retainer of $26,000 for each fiscal year plus $6,000 for attendance at an in-person board meeting or $1,000 for attendance by telephone. In every instance, the cost of the fees are to be allocated among the participating Funds in accordance with a formula that takes into account the overall asset size of each affected Fund. The Trust also reimburses the Trustees for travel and other expenses incurred in attending meetings of the Board. Officers of the Trust and Trustees who are interested persons of the Trust do not receive any direct compensation from the Trust.
Chief Compliance Officer Compensation – The Board of Trustees renewed the approval of a compensation policy with respect to the Trust’s Chief Compliance Officer pursuant to which the Horizon Funds and the Adviser each pay 50% of the Chief Compliance Officer’s salary, with the portion paid by the Horizon Funds allocated among the Funds in accordance with their relative net assets.
4. INVESTMENT TRANSACTIONS
The cost of purchases and proceeds from the sale of securities, other than short-term securities, for the six months ended May 31, 2019, were as follows:
Fund | | Purchases | | | Sales | |
Horizon Active Asset Allocation Fund | | $ | 789,595,276 | | | $ | 782,397,944 | |
Horizon Active Risk Assist® Fund | | | 1,729,687,060 | | | | 1,533,342,837 | |
Horizon Active Income Fund | | | 242,953,264 | | | | 261,764,131 | |
Horizon Active Dividend Fund | | | 221,603,498 | | | | 165,841,655 | |
Horizon Defined Risk Fund | | | 67,012,746 | | | | 2,599,849 | |
5. SECURITIES LENDING
The Funds may lend domestic securities in their portfolios to approved brokers, dealers and financial institutions (but not individuals) under terms of participation in a securities lending program effective December 20, 2017, which is administered by U.S. Bank N.A. (the “Custodian”). The Funds are entitled to utilize Securities Lending Income to offset costs and other charges incurred by the Funds with the Custodian or its affiliates or, as directed in writing by the Funds, other service providers. In the six months ended May 31, 2019, these expenses included Administrative & Accounting Service Fees, Transfer Agent Fees, and Custodian Fees. As the Securities Lending Expense offset for the Horizon Active Income Fund exceeded charges incurred with the Custodian and its affiliates during the year, these expenses also included Legal Fees, Registration Fees, Printing and Postage Expenses, and Trustees’ Fees and
84
Horizon Funds
NOTES TO FINANCIAL STATEMENTS (Unaudited) (Continued)
May 31, 2019 |
Expenses, as allowed under the Amendment. The securities lending agreement requires that loans are collateralized in an amount equal to at least 102% at the outset of the loan and at least 100%, at all times thereafter, of the value of any loaned securities. The Funds receive compensation in the form of fees and earn interest on the cash collateral. The amount of fees depends on a number of factors including the type of security and length of the loan. Securities lending income is disclosed on the Statements of Operations as securities lending income (for the period before the Board approved the Amendment) and as a securities lending expense offset thereafter. The Funds continue to receive interest payments or dividends on the securities loaned during the borrowing year. Gain or loss on the fair value of securities loaned that may occur during the term of the loan will be for the account of the Funds. The Funds have the right under the terms of the securities lending agreement to recall the securities from the borrower on demand. During the six months ended May 31, 2019, Funds had loaned securities and received cash collateral for the loans. The cash collateral is invested by the Custodian in accordance with approved investment guidelines. Those guidelines allow the cash collateral to be invested in readily marketable, high quality, short-term obligations issued or guaranteed by the United States Government; however, such investments are subject to risk of payment delays, declines in the value of collateral provided, default on the part of the issuer or counterparty, or otherwise may not generate sufficient interest to support the costs associated with securities lending. The Funds could also experience delays in recovering their securities and possible loss of income or value if the borrower fails to return the borrowed securities, although the Funds are indemnified from this risk by contract with the securities lending agent.
As of the six months ended May 31, 2019, the value of the securities on loan and payable for collateral due to broker were as follows:
Value of Securities on Loan and Collateral Received
Fund | | Values of
Securities on Loan | | | Fund Collateral
Received* | |
Horizon Active Asset Allocation Fund | | $ | 68,440,625 | | | $ | 70,882,042 | |
Horizon Active Risk Assist® Fund | | | 65,846,719 | | | | 68,335,862 | |
Horizon Active Income Fund | | | 56,679,985 | | | | 57,530,682 | |
Horizon Active Dividend Fund | | | 65,760 | | | | 68,000 | |
Horizon Defined Risk Fund | | | 24,030 | | | | 24,336 | |
* | The cash collateral received was invested in the First American Government Obligations Fund, a money market fund subject to Rule 2a-7 under the 1940 Act with an overnight and continuous maturity, as shown on the Portfolios of Investments. These amounts were not included in the offsetting disclosures in Note 2 (Offsetting of Financial Assets and Derivative Liabilities). |
6. LINE OF CREDIT ARRANGEMENT
Effective March 1, 2019, the Funds are party to an unsecured line of credit arrangement with the Custodian. The Loan Agreement has an expiration date of February 29, 2020, under which borrowing is limited to the lesser of 15% of the market value of a Fund, 33.33% of the market value of specific marketable securities of a Fund acceptable to the Custodian, or $50,000,000 for all the Funds subject to the line of credit. The Funds may utilize the line of credit for temporary or emergency purposes, primarily for financing redemption payments. The applicable Funds have authorized the Custodian to charge any of the Funds subject to the line of credit for any missed payments by the Funds. The Funds will be charged the prime rate, which was 5.50% as of May 31, 2019, if they borrow. For the six months ended May 31, 2019, the Horizon Active Asset Allocation Fund, Horizon Active Risk Assist® Fund and Horizon Active Income had average borrowings of $9,444,667, $1,212,333, and $843,000 and the weighted average interest rate on the line of credit borrowings was 5.42%, 5.50%, and 5.50%, respectively. Between December 7, 2019 and December 9, 2019, the Horizon Active Asset Allocation Fund had borrowings of $24,204,000, on April 9, 2019 the Horizon Active Risk Assist Fund had borrowings of $1,486,000, and on January 2, 2019 the Horizon Active Income Fund had borrowings of $1,183,000, which represent the largest borrowing
85
Horizon Funds
NOTES TO FINANCIAL STATEMENTS (Unaudited) (Continued)
May 31, 2019 |
amounts, respectively, during the six months ended May 31, 2019. For the Horizon Active Dividend Fund and Horizon Defined Risk Fund, there were no borrowings on the line of credit during the six months ended May 31, 2019. None of the Funds had outstanding borrowings on the line of credit as of May 31, 2019.
7. DISTRIBUTIONS TO SHAREHOLDERS AND TAX COMPONENTS OF CAPITAL
The tax character of fund distributions paid for the years ended November 30, 2018 and November 30, 2017 was as follows::
| | | For the year ended November 30, 2018 | |
Fund | | Ordinary
Income | | | Long-Term
Capital Gains | | | Return of
Capital | | | Total | |
Horizon Active Asset Allocation Fund | | $ | 45,761,474 | | | $ | 1,396,890 | | | $ | — | | | $ | 47,158,364 | |
Horizon Active Risk Assist® Fund | | | 19,595,394 | | | | — | | | | — | | | | 19,595,394 | |
Horizon Active Income Fund | | �� | 6,783,036 | | | | — | | | | — | | | | 6,783,036 | |
Horizon Active Dividend Fund | | | 992,997 | | | | — | | | | — | | | | 992,997 | |
Horizon Defined Risk Fund | | | — | | | | — | | | | — | | | | — | |
| | | For the year ended November 30, 2017 | |
Fund | | Ordinary
Income | | | Long-Term
Capital Gains | | | Return of
Capital | | | Total | |
Horizon Active Asset Allocation Fund | | $ | 3,288,702 | | | $ | — | | | $ | — | | | $ | 3,288,702 | |
Horizon Active Risk Assist® Fund | | | 2,745,980 | | | | — | | | | — | | | | 2,745,980 | |
Horizon Active Income Fund | | | 4,876,613 | | | | — | | | | — | | | | 4,876,613 | |
Horizon Active Dividend Fund | | | 713 | | | | — | | | | — | | | | 713 | |
On December 24, 2018, the Funds paid the following income distributions:
Fund | | Investor
Class | | | Advisor
Class | | | Institutional
Class | |
Horizon Active Asset Allocation Fund | | $ | 0.08393966 | | | $ | 0.07034898 | | | $ | 0.09561637 | |
Horizon Active Risk Assist® Fund | | | 0.12440995 | | | | 0.08679826 | | | | 0.14083785 | |
Horizon Active Income Fund | | | 0.14775681 | | | | 0.13793278 | | | | 0.15598592 | |
Horizon Active Dividend Fund | | | 0.18563359 | | | | 0.15545470 | | | | — | |
Horizon Defined Risk Fund | | | 0.16937597 | | | | 0.09978438 | | | | — | |
On December 24, 2018, the Funds paid the following capital gains distributions from each class:
Fund | | Short-Term* | | | Long-Term | |
Horizon Active Asset Allocation Fund | | $ | 0.59703 | | | $ | 0.12159 | |
Horizon Active Risk Assist® Fund | | | 0.57838 | | | | 0.05981 | |
Horizon Active Income Fund | | | — | | | | — | |
Horizon Active Dividend Fund | | | 2.05126 | | | | — | |
Horizon Defined Risk Fund | | | 0.09162 | | | | — | |
* | Short-Term Capital Gains distributions are considered income distributions for tax purposes. |
86
Horizon Funds
NOTES TO FINANCIAL STATEMENTS (Unaudited) (Continued)
May 31, 2019 |
The cost basis of investments, purchased options and options written for federal income tax purposes at November 30, 2018, were as follows:
Fund | | Cost of
Investments,
Purchased Options
and Written
Options | | | Gross Tax
Unrealized
Appreciation | | | Gross Tax
Unrealized
Depreciation | | | Net Tax
Unrealized
Appreciation
(Depreciation) | |
Horizon Active Asset Allocation Fund | | $ | 527,431,749 | | | $ | 5,582,284 | | | $ | (16,106,811 | ) | | $ | (10,524,527 | ) |
Horizon Active Risk Assist® Fund | | | 745,168,117 | | | | 8,184,771 | | | | (23,302,744 | ) | | | (15,117,973 | ) |
Horizon Active Income Fund | | | 298,330,361 | | | | 532,538 | | | | (5,618,343 | ) | | | (5,085,805 | ) |
Horizon Active Dividend Fund | | | 52,054,742 | | | | 1,045,717 | | | | (2,363,754 | ) | | | (1,318,037 | ) |
Horizon Defined Risk Fund | | | 15,302,080 | | | | 1,003,799 | | | | (959,267 | ) | | | 44,532 | |
As of November 30, 2018, the components of accumulated earnings/(deficit) on a tax basis were as follows:
Fund | | Undistributed
Ordinary
Income | | | Undistributed
Long-Term
Capital Gains | | | Capital
Loss Carry
Forwards | | | Other
Book/Tax
Differences | | | Post October
Loss and Late
Year Loss | | | Unrealized
Appreciation/
(Depreciation) | | | Total
Accumulated
Earnings/
(Deficits) | |
Horizon Active Asset Allocation Fund | | $ | 22,998,025 | | | $ | 4,610,598 | | | $ | — | | | $ | (208,276 | ) | | $ | — | | | $ | (10,524,527 | ) | | $ | 16,875,820 | |
Horizon Active Risk Assist® Fund | | | 20,740,673 | | | | 2,026,444 | | | | — | | | | (291,580 | ) | | | — | | | | (15,117,973 | ) | | | 7,357,564 | |
Horizon Active Income Fund | | | 2,429,934 | | | | — | | | | — | | | | (19,032,314 | ) | | | — | | | | (5,085,805 | ) | | | (21,688,185 | ) |
Horizon Active Dividend Fund | | | 2,323,480 | | | | — | | | | — | | | | — | | | | — | | | | (1,318,037 | ) | | | 1,005,443 | |
Horizon Defined Risk Fund | | | 121,434 | | | | 9,611 | | | | — | | | | — | | | | — | | | | 44,532 | | | | 175,577 | |
The difference between book and tax basis, unrealized appreciation/depreciation, and accumulated net realized gain/(loss) from investments is attributable to mark to market and/or the tax deferral of losses on various investments.
At November 30, 2018, the Funds had capital loss carry forwards for federal income tax purposes available to offset future capital gains as follows:
| | | Non-Expiring | |
Fund | | Short-Term | | | Long-Term | | | Total | |
Horizon Active Asset Allocation Fund | | $ | — | | | $ | — | | | $ | — | |
Horizon Active Risk Assist® Fund | | | — | | | | — | | | | — | |
Horizon Active Income Fund | | | 15,597,640 | | | | 3,074,674 | | | | 19,032,314 | |
Horizon Active Dividend Fund | | | — | | | | — | | | | — | |
Horizon Defined Risk Fund | | | — | | | | — | | | | — | |
87
Horizon Funds
NOTES TO FINANCIAL STATEMENTS (Unaudited) (Continued)
May 31, 2019 |
The Funds did not utilize any capital loss carryforwards during the fiscal year.
Additionally, GAAP requires that certain components of net assets relating to permanent differences be reclassified between financial and tax reporting. These reclassifications have no effect on net assets or net asset value per share. These reclassifications were due to the use of equalization. Each Fund may use earnings and profits distributed to shareholders on redemption of shares as part of the dividends paid deduction. For the year ended November 30, 2018, the following table shows the reclassifications made:
Fund | | Distributable
Earnings/
(Accumulated
Deficit) | | | Paid in
Capital | |
Horizon Active Asset Allocation Fund | | $ | (6,869,252 | ) | | $ | 6,869,252 | |
Horizon Active Risk Assist® Fund | | | (4,344,548 | ) | | | 4,344,548 | |
Horizon Active Income Fund | | | — | | | | — | |
Horizon Active Dividend Fund | | | (371,782 | ) | | | 371,782 | |
Horizon Defined Risk Fund | | | (7,027 | ) | | | 7,027 | |
8. BENEFICIAL OWNERSHIP
The beneficial ownership, either directly or indirectly, of more than 25% of voting securities of a fund creates a presumption of control of that fund, under Section 2(a)(9) of the 1940 Act. As of May 31, 2019, the Funds had omnibus shareholder accounts (comprised of a group of individual shareholders), which amounted to more than 25% of the total shares outstanding of the respective Fund. There were no individual shareholders of record who owned more than 5% of the outstanding shares of beneficial interest of a Fund or Class of shares of a Fund. Shareholders with a controlling interest could affect the outcome of proxy voting or direction of management of a Fund.
9. INVESTMENTS IN AFFILIATES
An affiliated person of the Horizon Active Asset Allocation Fund, as defined by the 1940 Act, may include any company in which the Fund owns fice percent or more of its outstanding voting shares. Holdings and transactions in these affiliated companies for the six months ended May 31, 2019 are as follows:
Security Name | | Value At
November 30,
2018 | | | Value of
Purchases | | | Value of
Sales | | | Net Change
in Unrealized
Appreciation
(Depreciation) | | | Net Realized
Gain (Loss) | | | Dividend
Income | | | Value at
May 31,
2019 | | | Shares
Balance
May 31,
2019 | |
Janus Henderson Small/Mid Cap Growth Alpha ETF* | | $ | — | | | $ | 5,264,791 | | | $ | — | | | $ | (144,089 | ) | | $ | — | | | $ | — | | | $ | 5,120,702 | | | | 123,153 | |
88
Horizon Funds
NOTES TO FINANCIAL STATEMENTS (Unaudited) (Continued)
May 31, 2019 |
An affiliated person of the Horizon Active Risk Assist® Fund, as defined by the 1940 Act, may include any company in which the Fund owns five percent or more of its outstanding voting shares. Holdings and transactions in these affiliated companies for the six months ended May 31, 2019 are as follows:
Security Name | | Value At
November 30,
2018 | | | Value of
Purchases | | | Value of
Sales | | | Net Change
in Unrealized
Appreciation
(Depreciation) | | | Net Realized
Gain (Loss) | | | Dividend
Income | | | Value at
May 31,
2019 | | | Shares
Balance
May 31,
2019 | |
iShares Emerging Markets Dividend ETF | | $ | 27,069,355 | | | $ | 17,138,178 | | | $ | (44,253,097 | ) | | $ | (119,944 | ) | | $ | 165,508 | | | $ | 287,747 | | | $ | — | | | | — | |
X-Trackers Russell 1000 Comprehensive Factor ETF* | | | — | | | | 37,891,532 | | | | (4,628,302 | ) | | | 78,790 | | | | 162,879 | | | | 73,720 | | | | 33,504,900 | | | | 1,051,629 | |
X-Trackers Russell 1000 US QARP ETF* | | | 8,090,470 | | | | 22,289,118 | | | | (7,293,328 | ) | | | 79,960 | | | | (962,147 | ) | | | 106,596 | | | | 22,204,073 | | | | 876,246 | |
| | | $ | 35,159,825 | | | $ | 77,318,828 | | | $ | (56,174,727 | ) | | $ | 38,806 | | | $ | (633,760 | ) | | $ | 468,063 | | | $ | 55,708,973 | | | | 1,927,875 | |
An affiliated person of the Horizon Active Income Fund, as defined by the 1940 Act, may include any company in which the Fund owns fice percent or more of its outstanding voting shares. Holdings and transactions in these affiliated companies for the six months ended May 31, 2019 are as follows:
Security Name | | Value At
November 30,
2018 | | | Value of
Purchases | | | Value of
Sales | | | Net Change
in Unrealized
Appreciation
(Depreciation) | | | Net Realized
Gain (Loss) | | | Dividend
Income | | | Value at
May 31,
2019 | | | Shares
Balance
May 31,
2019 | |
Janus Henderson Mortgage-Backed Securities ETF* | | $ | — | | | $ | 7,026,340 | | | $ | — | | | $ | 139,389 | | | $ | — | | | $ | 53,130 | | | $ | 7,165,729 | | | | 138,696 | |
WisdomTree Yield Enhanced U.S. Aggregate Bond Fund* | | | — | | | | 50,233,157 | | | | — | | | | 1,357,164 | | | | — | | | | 430,891 | | | | 51,590,321 | | | | 1,022,603 | |
X-Trackers Short Duration High Yield Bond ETF* | | | 7,034,162 | | | | — | | | | — | | | | 30,029 | | | | — | | | | 209,703 | | | | 7,064,191 | | | | 145,279 | |
| | | $ | 7,034,162 | | | $ | 57,259,497 | | | $ | — | | | $ | 1,526,582 | | | $ | — | | | $ | 693,724 | | | $ | 65,820,241 | | | | 1,306,578 | |
* | Affiliate as of May 31, 2019. |
10. SUBSEQUENT EVENTS
Subsequent events after the date of the Statements of Assets and Liabilities have been evaluated through the date the financial statements were issued. Management has concluded that there is no impact requiring adjustment to or disclosure in the financial statements.
89
Horizon Funds Disclosure of Fund Expenses (Unaudited)
May 31, 2019 |
As a shareholder of the Funds you incur ongoing costs, including management fees, sales charges, and other Fund operating expenses. This example is intended to help you understand your ongoing costs (in dollars) of investing in the Funds and to compare these costs with the ongoing costs of investing in other mutual funds. Please note, the expenses shown in the tables are meant to highlight ongoing costs only and do not reflect any transactional costs.
This example is based on an investment of $1,000 invested for the period of time as indicated in the table below.
Actual Expenses: The column labeled “Actual” of the table provides information about actual account values and actual expenses. You may use the information in this line, together with the amount you invested, to estimate the expenses that you paid over the period. Simply divide your account value by $1,000 (for example, an $8,600 account value divided by $1,000 = 8.6), then multiply the result by the number in the first line under the heading entitled “Expenses Paid During Period” to estimate the expenses you paid on your account during the period.
Hypothetical Examples for Comparison Purposes: The column labeled “Hypothetical” of the table below provides information about hypothetical account values and hypothetical expenses based on the Funds’ actual expense ratios and an assumed rate of return of 5% per year before expenses, which is not the Funds’ actual return. The hypothetical account values and expenses may not be used to estimate the actual ending account balance or expenses you paid for the period. You may use this information to compare the ongoing costs of investing in the Funds and other funds. To do so, compare this 5% hypothetical example with the 5% hypothetical examples that appear in the shareholder reports of the other funds.
Please note that the expenses shown in the table are meant to highlight your ongoing costs only and do not reflect any transactional costs which may be applicable to your account. Therefore, the second line of the table is useful in comparing ongoing costs only, and will not help you determine the relative total costs of owning different funds. In addition, if these transactional costs were included, your costs would have been higher.
| | | | Actual | Hypothetical
(5% return before expenses) |
| Fund’s
Annualized
Expense Ratio | Beginning
Account Value
12/1/2018 | Ending
Account Value
5/31/2019 | Expenses
Paid During
Period* | Ending
Account Value
5/31/2019 | Expenses
Paid During
Period |
Horizon Active Asset Allocation - Investor Class | 1.24% | $ 1,000.00 | $ 970.20 | $ 6.07 | $ 1,018.77 | $ 6.22 |
Horizon Active Asset Allocation - Advisor Class | 1.43% | $ 1,000.00 | $ 969.60 | $ 7.02 | $ 1,017.80 | $ 7.19 |
Horizon Active Asset Allocation - Institutional Class | 1.18% | $ 1,000.00 | $ 970.60 | $ 5.80 | $ 1,019.05 | $ 5.94 |
Horizon Active Risk Assist® - Investor Class | 1.24% | $ 1,000.00 | $ 945.60 | $ 6.01 | $ 1,018.75 | $ 6.24 |
Horizon Active Risk Assist® - Advisor Class | 1.42% | $ 1,000.00 | $ 944.70 | $ 6.88 | $ 1,017.85 | $ 7.14 |
Horizon Active Risk Assist® - Institutional Class | 1.06% | $ 1,000.00 | $ 946.50 | $ 5.14 | $ 1,019.65 | $ 5.34 |
Horizon Active Income - Investor Class | 0.85% | $ 1,000.00 | $ 1,040.90 | $ 4.33 | $ 1,020.69 | $ 4.28 |
Horizon Active Income - Advisor Class | 1.02% | $ 1,000.00 | $ 1,038.90 | $ 5.18 | $ 1,019.85 | $ 5.14 |
Horizon Active Income - Institutional Class | 0.77% | $ 1,000.00 | $ 1,040.00 | $ 3.92 | $ 1,021.09 | $ 3.88 |
Horizon Active Dividend - Investor Class | 1.09% | $ 1,000.00 | $ 955.00 | $ 5.31 | $ 1,019.50 | $ 5.49 |
Horizon Active Dividend - Advisor Class | 1.24% | $ 1,000.00 | $ 954.30 | $ 6.04 | $ 1,018.75 | $ 6.24 |
Horizon Defined Risk - Investor Class | 1.04% | $ 1,000.00 | $ 992.10 | $ 5.17 | $ 1,019.75 | $ 5.24 |
Horizon Defined Risk - Advisor Class | 1.19% | $ 1,000.00 | $ 991.20 | $ 5.91 | $ 1,019.00 | $ 5.99 |
* | Expenses Paid During the Period are equal to the Funds’ annualized expense ratio, multiplied by the average account value over the period, multiplied by 182 days, and divided by 365 (to reflect the number of days in the period). |
90
Horizon Funds Approval of the Management Agreements (Unaudited)
May 31, 2019 |
At an in-person meeting held on July 24, 2018, at which all of the Trustees were present, the Board of Trustees (the “Board”), including the Trustees who are not “interested persons,” as defined by the Investment Company Act of 1940 (the “1940 Act”), of the Trust (the “Independent Trustees”), voting separately, reviewed and approved the continuance of each Investment Advisory Agreement (each, an “Advisory Agreement”, and together the “Advisory Agreements”) between the Trust and the Adviser for each of the Horizon Active Allocation Fund, the Horizon Active Risk Assist Fund, the Horizon Active Income Fund the Horizon Active Dividend Fund and the Horizon Defined Risk Fund (each a “Fund” and together the “Funds”). In the course of their deliberations, the Board was advised by independent legal counsel. The Board received and reviewed a substantial amount of information provided by the Adviser in response to requests of the Board and counsel.
In considering the approval of the Advisory Agreements and reaching their conclusions with respect thereto, the Board reviewed a memorandum, provided by independent legal counsel, which summarized the Board’s fiduciary duties and responsibilities in reviewing and approving the Advisory Agreements and other matters to be considered by the Board at the Meeting and the types of information that should be reviewed by them and their responsibilities in making an informed decision regarding the approval of the Advisory Agreements. The Board also reviewed and analyzed various factors that they determined were relevant, including: (i) the nature, extent and quality of the services to be provided by the Adviser to each Fund; (ii) the costs of the services to be provided and the profits to be realized by the Adviser and its affiliates from the relationship with the Funds; (iii) the investment performance of each Funds and the Adviser, (iv) the extent to which economies of scale will be realized as each Fund grows; and (iv) whether the fee levels reflect these economies of scale to the benefit of each Fund’s shareholders, including the following:
| | ● | Nature, extent and quality of the services to be provided by the Adviser to the Funds. In this regard, the Board considered information regarding the services to be provided to the Funds, the experience, qualifications and key personnel of the Adviser, the Adviser’s sales force, the Adviser’s assets under management and relationships with other registered investment advisers for distribution purposes. The Board reviewed the Adviser’s financial statements and considered the Adviser’s financial condition. |
| | ● | The Investment Performance of the Funds and the Adviser. In this regard, the Board considered each Fund’s past performance, including comparisons to peer funds. The Board also considered each Fund’s portfolio turnover, use of soft dollars and best execution policies. The Board also considered the performance of other accounts managed by the Adviser. |
| | ● | Costs of the services to be provided and the profits to be realized by the Adviser and its affiliates from the relationship with the Fund. In this regard, the Board considered the management fees proposed to be charged to each Fund, and each Fund’s total expense ratios, each as compared to each Fund’s peer group, and took into account the differences in managing the Funds compared to other products that the Adviser offers, as well as the fees charged by Horizon to its separately managed accounts. The Board considered the terms and conditions of each Advisory Agreement, including the management fee and the services to be provided by the Adviser thereunder. The Board also considered the indirect benefits that the Adviser receives through soft dollars, cross sales of other products the Adviser sells and third-party marketing materials. |
| | ● | The extent to which economies of scale will be realized as the Fund grows and whether the fee levels reflect these economies of scale to the benefit of shareholders. In this regard, the Board considered that the Adviser was still waiving a portion of its advisory fees under the Expense Limitation Agreements with each Fund and considered how these waivers supported the Funds, noting that the Adviser expected to receive its full fees from all of the Funds as the Funds continue to grow. The Board considered the terms of the expense limitation agreement for each Fund, and the fact that the Adviser had agreed to continue the expense limitation agreements through at least December 31, 2019, and noted that the expense waivers and reimbursements were |
91
Horizon Funds Approval of the Management Agreements (Unaudited) (Continued)
May 31, 2019 |
subject to recoupment during a three-year look-back window. The Board also considered that the Adviser agreed to consider implementing breakpoints in its management fee after such time as the Fund’s grow to a size that the Adviser is receiving its full fee.
After full consideration of the above factors as well as other factors, the Board unanimously approved the continuance and renewal of each Advisory Agreement.
At an in-person meeting held on April 23, 2019, at which all of the Trustees were present, the Board, including Independent Trustees, voting separately, reviewed and approved the initial Investment Advisory Agreements (the “New Advisory Agreements”) with the Adviser for the Horizon Multi-Asset Income Fund, Horizon U.S. Risk Assist Fund, and the Horizon Sustainable Risk Assist Fund (each a “New Fund” and together the “New Funds”). In the course of their deliberations, the Board was advised by legal counsel. The Board received and reviewed a substantial amount of information provided by the Adviser in response to requests of the Board and counsel.
In considering the approval of the New Advisory Agreements and reaching their conclusions with respect thereto, the Board reviewed a memorandum, provided by Fund counsel, which summarized the Board’s fiduciary duties and responsibilities in reviewing and approving the New Advisory Agreements and other matters to be considered by the Board at the Meeting and the types of information that should be reviewed by them and their responsibilities in making an informed decision regarding the approval of the New Advisory Agreements. The Board also reviewed and analyzed various factors that they determined were relevant, including: (i) the nature, extent and quality of the services to be provided by the Adviser to the New Fund; (ii) the costs of the services to be provided and the profits to be realized by the Adviser and its affiliates from the relationship with the New Fund; (iii) the extent to which economies of scale will be realized as the New Fund grows; and (iv) whether the fee levels reflect these economies of scale to the benefit of shareholders, including the following:
| | ● | Nature, extent and quality of the services to be provided by the Adviser to the Fund. The Board considered information regarding the services to be provided to the New Funds, the experience, qualifications and key personnel of the Adviser, the Adviser’s sales force, the Adviser’s assets under management and relationships with other registered investment advisers for distribution purposes. The Board reviewed the Adviser’s financial statements and considered the Adviser’s financial condition. The Board also considered the capabilities of Horizon to operate each of the New Funds, Horizon’s commitment to the New Funds, Horizon’s staffing, trading and compliance systems, and its capabilities with respect to service provider oversight. The Board also considered the performance of other accounts managed by the Adviser. |
| | ● | Costs of the services to be provided and the profits to be realized by the Adviser and its affiliates from the relationship with the Fund. The Board considered the management fees proposed to be charged to each New Fund, and each New Fund’s total expense ratios, each as compared to each New Fund’s peer group, and took into account the differences in managing the New Funds compared to other products that the Adviser offers, as well as the fees charged by Horizon to its separately managed accounts. The Board considered the terms and conditions of the New Advisory Agreements, including the management fee and the services to be provided by the Adviser thereunder. The Board also considered the indirect benefits that the Adviser receives through soft dollars, cross sales of other products the Adviser sells and third-party marketing materials. The Board also considered the regulatory regime and additional oversight under which the New Funds’ will operate, as well as operational differences between the New Funds and Horizon’s other clients, and considered that Horizon would effect trading and execution for the New Funds, unlike model portfolio clients, and that such other accounts do not trade options, have little opportunity for price improvement, and do not get benefit of trustee oversight. |
92
Horizon Funds Approval of the Management Agreements (Unaudited) (Continued)
May 31, 2019 |
| | ● | The extent to which economies of scale will be realized as the Fund grows and whether the fee levels reflect these economies of scale to the benefit of shareholders. The Board considered the details of the proposed expense limitation agreement for each New Fund, the fact that the Adviser had agreed to continue the expense limitation agreements through at least March 31, 2022, and noted that the expense waivers and reimbursements were subject to recoupment during a 36 month look-back window. The Board also considered that the Adviser agreed to consider implementing breakpoints in its management fee after such time as the New Fund’s grow to a size that the Adviser is receiving its full fee. |
After full consideration of the above factors as well as other factors, the Board unanimously concluded that the terms of each proposed New Advisory Agreement between each of the New Funds and the Adviser was fair and reasonable and approved the New Advisory Agreements.
93
Horizon Funds Additional Information (Unaudited)
May 31, 2019 |
Independent Trustees |
Name, Address*
and
Year of Birth | Position/Term
of Office | Principal Occupation During
the Past Five Years | Number of
Portfolios
in Fund
Complex
Overseen
by Trustee | Other
Directorships
held by Trustee
During the Past
Five Years |
John W. Davidson Year of Birth: 1946 | Trustee; Indefinite Term of Office
(since 2015) | Director, President & Chief Economist of PartnerRe Asset Management Corporation; Chief Investment Officer of Partner Reinsurance Company of the US (2001-2008); Creator, author and founder of John Davidson’s Economic Comments (2009-Present). | 5 | Trustee, AdvisorOne Funds
(7 portfolios). |
Todd W. Gaylord Year of Birth: 1975 | Trustee; Indefinite Term of Office
(since 2015) | Consultant (financial services) since 2012; Owner, McCauley Street Partners, Inc. (real estate brokerage firm) (2009-2014); Vice President, Corporate Bond, Syndicated Loan, and Credit Default Swap Trader, Wachovia Securities (2005-2008). | 5 | None |
Thomas W. Okel Year of Birth: 1962 | Trustee; Indefinite Term of Office
(since 2015) | Executive Director (2011-2019), Catawba Lands Conservancy; Global Head of Syndicated Capital Markets (1998-2010), Bank of America Merrill Lynch. | 5 | Trustee, Barings Funds Trust (8 portfolios); Trustee, Barings Global Short Duration High Yield Fund (1 portfolio). Trustee, Barings BDC, Inc. |
* | The address for each Trustee and officer is 6210 Ardrey Kell Road, Suite 300, Charlotte, North Carolina 28277. |
94
Horizon Funds
ADDITIONAL INFORMATION (Unaudited) (Continued)
May 31, 2019 |
Interested Trustees and Officers |
Name, Address*
and
Year of Birth | Position/Term
of Office | Principal Occupation During
the Past Five Years | Number of
Portfolios
in Fund
Complex
Overseen
by Trustee | Other
Directorships
held by Trustee
During the Past
Five Years |
Robert J. Cannon** Year of Birth: 1972 | Interested Trustee Indefinite Term of Office
(since 2015) and President; One Year Term of Office
(since 2015) | President and CEO of Horizon Investments, LLC | 5 | None |
Matthew Chambers Year of Birth: 1976 | Vice President, Chief Compliance Officer and Secretary; One Year Term of Office
(since 2015) | General Counsel and Chief Compliance Officer of Horizon Investments, LLC, December 2014-present; Attorney, Kilpatrick Townsend & Stockton, September 2008- November 2014 | Not Applicable | Not Applicable |
Steve Terry*** Year of Birth: 1980 | Treasurer; One Year Term of Office
(since October 2018) | Head of Finance and Business Systems of Horizon Investments, LLC, August 2016-present; Co-Founder, Catamaran Investment Partners, 2015-August 2016; Principal Intersection Partners, 2011-2015. | Not Applicable | Not Applicable |
* | The address for each Trustee and officer is 6210 Ardrey Kell Road, Suite 300, Charlotte, North Carolina 28277. |
** | Mr. Cannon is considered an “interested person” of the Trust, as defined in the 1940 Act, because of his current position with the Adviser. |
95
THIS PAGE INTENTIONALLY LEFT BLANK
THIS PAGE INTENTIONALLY LEFT BLANK
Investment Adviser
Horizon Investments, LLC
6210 Ardrey Kell Road, Suite 300
Charlotte, NC 28277
Distributor
Quasar Distributors, LLC
615 East Michigan Street
Milwaukee, WI 53202
Custodian
U.S. Bank N.A.
Custody Operations
1555 N. RiverCenter Drive, Suite 302
Milwaukee, WI 53212
Transfer Agent, Fund Accountant and Fund Administrator
U.S. Bancorp Fund Services, LLC, doing business as U.S. Bank Global Fund Services
615 East Michigan Street
Milwaukee, WI 53202
Independent Registered Public Accounting Firm
Cohen & Company, Ltd.
1350 Euclid Avenue, Suite 800
Cleveland, OH 44115
Legal Counsel
Kilpatrick Townsend & Stockton LLP
1001 West Fourth Street
Winston-Salem, NC 27101
How to Obtain Proxy Voting Information
Information regarding how the Funds vote proxies relating to portfolio securities for the 12 month period ended June 30th as well as a description of the policies and procedures that the Funds used to determine how to vote proxies is available without charge, upon request, by calling l-855-754-7932 or by referring to the Securities and Exchange Commission’s (“SEC”) website at http://www.sec.gov.
How to Obtain 1st and 3rd Fiscal Quarter Portfolio Holdings
The Funds file their complete schedule of portfolio holdings with the SEC for the first and third quarters of each fiscal year on Form N-Q or Part F of Form N-PORT (beginning with filings after March 31, 2019). Form N-Q or Part F of Form N-PORT is available on the SEC’s website at http://www.sec.gov. The information on Form N-Q is available without charge, upon request, by calling 1-855-754-7932.
Item 2. Code of Ethics.
Not applicable for semi-annual reports.
Item 3. Audit Committee Financial Expert.
Not applicable for semi-annual reports.
Item 4. Principal Accountant Fees and Services.
Not applicable for semi-annual reports.
Item 5. Audit Committee of Listed Registrants.
Not applicable to registrants who are not listed issuers (as defined in Rule 10A-3 under the Securities Exchange Act of 1934).
Item 6. Investments.
| (a) | Schedule of Investments is included as part of the report to shareholders filed under Item 1 of this Form. |
Item 7. Disclosure of Proxy Voting Policies and Procedures for Closed-End Management Investment Companies.
Not applicable to open-end investment companies.
Item 8. Portfolio Managers of Closed-End Management Investment Companies.
Not applicable to open-end investment companies.
Item 9. Purchases of Equity Securities by Closed-End Management Investment Company and Affiliated Purchasers.
Not applicable to open-end investment companies.
Item 10. Submission of Matters to a Vote of Security Holders.
The registrant has not adopted any procedure by which shareholders may recommend nominees to the registrant’s board of directors.
Item 11. Controls and Procedures.
| (a) | The registrant's principal executive officer and principal financial officer have concluded, based on an evaluation of the registrant's disclosure controls and procedures (as defined in Rule 30a-3(c) under the Investment Company Act of 1940, as amended) as of a date within 90 days prior to the filing date of this Form N-CSR, that the disclosure controls and procedures are effectively designed to ensure that information required to be disclosed by the registrant in this Form N-CSR is recorded, processed, summarized and reported by the filing date, including ensuring that information required to be disclosed in this Form N-CSR is accumulated and communicated to the registrant's management, including the registrant's principal executive officer and principal financial officer, as appropriate, to allow timely decisions regarding required disclosure. |
| (b) | There were no significant changes in the registrant's internal control over financial reporting (as defined in Rule 30a-3(d) under the Investment Company Act of 1940, as amended) that occurred during the second fiscal quarter covered by this report that have materially affected, or are reasonably likely to materially affect, the registrant's internal control over financial reporting. |
Item 12. Disclosure of Securities Lending Activities for Closed-End Management Investment Companies.
Not applicable to open-end investment companies.
Item 13. Exhibits.
| (a) | (1)Any code of ethics or amendment thereto, that is the subject of the disclosure required by Item 2, to the extent that the registrant intends to satisfy Item 2 requirements through filing an exhibit.Incorporated by reference to the Registrant’s Form N-CSR filed February 1, 2018. |
(2)A separate certification for each principal executive and principal financial officer pursuant to Section 302 of the Sarbanes-Oxley Act of 2002.Filed herewith.
(3)Any written solicitation to purchase securities under Rule 23c-1 under the Act sent or given during the period covered by the report by or on behalf of the registrant to 10 or more persons.Not applicable to open-end investment companies.
(4)Change in the registrant’s independent public accountant. There was no change in the registrant’s independent public accountant for the period covered by this report.
| (b) | Certifications pursuant to Section 906 of the Sarbanes-Oxley Act of 2002. Furnished herewith. |
SIGNATURES
Pursuant to the requirements of the Securities Exchange Act of 1934 and the Investment Company Act of 1940, the registrant has duly caused this report to be signed on its behalf by the undersigned, thereunto duly authorized.
| (Registrant) | Horizon Funds | |
| | | |
| By (Signature and Title)* | /s/Robert Cannon | |
| | Robert Cannon, President and Principal Executive Officer | |
| | | |
| Date: | 8/1/19 | |
Pursuant to the requirements of the Securities Exchange Act of 1934 and the Investment Company Act of 1940, this report has been signed below by the following persons on behalf of the registrant and in the capacities and on the dates indicated.
| By (Signature and Title)* | /s/Robert Cannon | |
| | Robert Cannon, President and Principal Executive Officer | |
| | | |
| Date: | 8/1/19 | |
| | | |
| By (Signature and Title)* | /s/ Stephen Terry | |
| | Stephen Terry, Treasurer and Principal Financial Officer | |
| | | |
| Date: | 8/1/19 | |
| * | Print the name and title of each signing officer under his or her signature. |