Wells Fargo Commercial Mortgage Trust 2015-C29
Filed: 10 Jun 15, 12:00am
| FREE WRITING PROSPECTUS | ||
| FILED PURSUANT TO RULE 433 | ||
| REGISTRATION FILE NO.: 333-195164-09 | ||

Free Writing Prospectus
Structural and Collateral Term Sheet
$1,177,025,122
(Approximate Aggregate Cut-off Date Balance of Mortgage Pool)
$1,091,690,000
(Approximate Aggregate Principal Balance of Offered Certificates)
Wells Fargo Commercial Mortgage Trust 2015-C29
as Issuing Entity
Wells Fargo Commercial Mortgage Securities, Inc.
as Depositor
Wells Fargo Bank, National Association
Rialto Mortgage Finance, LLC
Silverpeak Real Estate Finance LLC
Walker & Dunlop Commercial Property Funding I WF, LLC
National Cooperative Bank, N.A.
as Sponsors and Mortgage Loan Sellers
Commercial Mortgage Pass-Through Certificates
Series 2015-C29
June 9, 2015
| WELLS FARGO SECURITIES | |||
| Lead Manager and Sole Bookrunner | |||
| Citigroup Co-Manager | Deutsche Bank Securities Co-Manager |
STATEMENT REGARDING THIS FREE WRITING PROSPECTUS
The depositor has filed a registration statement (including a prospectus) with the Securities and Exchange Commission (‘‘SEC’’) (SEC File No. 333-195164) for the offering to which this communication relates. Before you invest, you should read the prospectus in the registration statement and other documents the depositor has filed with the SEC for more complete information about the depositor, the issuing entity and this offering. You may get these documents for free by visiting EDGAR on the SEC Web site at www.sec.gov. Alternatively, the depositor, any underwriter, or any dealer participating in the offering will arrange to send you the prospectus after filing if you request it by calling toll free 1-800-745-2063 (8 a.m. – 5 p.m. EST) or by emailing wfs.cmbs@wellsfargo.com.
Nothing in this document constitutes an offer of securities for sale in any jurisdiction where the offer or sale is not permitted. The information contained herein is preliminary as of the date hereof, supersedes any such information previously delivered to you and will be superseded by any such information subsequently delivered and ultimately by the final prospectus relating to the securities. These materials are subject to change, completion, supplement or amendment from time to time.
This free writing prospectus has been prepared by the Underwriters for information purposes only and does not constitute, in whole or in part, a prospectus for the purposes of Directive 2003/71/EC (as amended) and/or Part VI of the Financial Services and Markets Act 2000 as amended or other offering document.
STATEMENT REGARDING ASSUMPTIONS AS TO SECURITIES, PRICING ESTIMATES AND OTHER INFORMATION
The attached information contains certain tables and other statistical analyses (the “Computational Materials”) which have been prepared in reliance upon information furnished by the Mortgage Loan Sellers. Numerous assumptions were used in preparing the Computational Materials, which may or may not be reflected herein. As such, no assurance can be given as to the Computational Materials’ accuracy, appropriateness or completeness in any particular context; or as to whether the Computational Materials and/or the assumptions upon which they are based reflect present market conditions or future market performance. The Computational Materials should not be construed as either projections or predictions or as legal, tax, financial or accounting advice. You should consult your own counsel, accountant and other advisors as to the legal, tax, business, financial and related aspects of a purchase of these securities. Any weighted average lives, yields and principal payment periods shown in the Computational Materials are based on prepayment and/or loss assumptions, and changes in such prepayment and/or loss assumptions may dramatically affect such weighted average lives, yields and principal payment periods. In addition, it is possible that prepayments or losses on the underlying assets will occur at rates higher or lower than the rates shown in the attached Computational Materials. The specific characteristics of the securities may differ from those shown in the Computational Materials due to differences between the final underlying assets and the preliminary underlying assets used in preparing the Computational Materials. The principal amount and designation of any security described in the Computational Materials are subject to change prior to issuance. None of Wells Fargo Securities, LLC, Citigroup Global Markets Inc., Deutsche Bank Securities Inc., or any of their respective affiliates, make any representation or warranty as to the actual rate or timing of payments or losses on any of the underlying assets or the payments or yield on the securities. The information in this presentation is based upon management forecasts and reflects prevailing conditions and management’s views as of this date, all of which are subject to change. In preparing this presentation, we have relied upon and assumed, without independent verification, the accuracy and completeness of all information available from public sources or which was provided to us by or on behalf of the Mortgage Loan Sellers or which was otherwise reviewed by us.
This free writing prospectus contains certain forward-looking statements. If and when included in this free writing prospectus, the words “expects”, “intends”, “anticipates”, “estimates” and analogous expressions and all statements that are not historical facts, including statements about our beliefs or expectations, are intended to identify forward-looking statements. Any forward-looking statements are made subject to risks and uncertainties which could cause actual results to differ materially from those stated. Those risks and uncertainties include, among other things, declines in general economic and business conditions, increased competition, changes in demographics, changes in political and social conditions, regulatory initiatives and changes in customer preferences, many of which are beyond our control and the control of any other person or entity related to this offering. The forward-looking statements made in this free writing prospectus are made as of the date stated on the cover. We have no obligation to update or revise any forward-looking statement.
Wells Fargo Securities is the trade name for the capital markets and investment banking services of Wells Fargo & Company and its subsidiaries, including but not limited to Wells Fargo Securities, LLC, a member of NYSE, FINRA, NFA and SIPC, Wells Fargo Prime Services, LLC, a member of FINRA, NFA and SIPC, and Wells Fargo Bank, N.A. Wells Fargo Securities, LLC and Wells Fargo Prime Services, LLC are distinct entities from affiliated banks and thrifts.
IMPORTANT NOTICE REGARDING THE OFFERED CERTIFICATES
The Offered Certificates referred to in these materials and the asset pool backing them are subject to modification or revision (including the possibility that one or more classes of certificates may be split, combined or eliminated at any time prior to issuance or availability of a final prospectus) and are offered on a “when, as and if issued” basis. Prospective investors should understand that, when considering the purchase of the Offered Certificates, a contract of sale will come into being no sooner than the date on which the relevant class of certificates has been priced and the underwriters have confirmed the allocation of certificates to be made to investors; any “indications of interest” expressed by any prospective investor, and any “soft circles” generated by the underwriters, will not create binding contractual obligations for such prospective investors, on the one hand, or the underwriters, the depositor or any of their respective agents or affiliates, on the other hand.
As a result of the foregoing, a prospective investor may commit to purchase certificates that have characteristics that may change, and each prospective investor is advised that all or a portion of the certificates referred to in these materials may be issued without all or certain of the characteristics described in these materials. The underwriters’ obligation to sell certificates to any prospective investor is conditioned on the certificates and the transaction having the characteristics described in these materials. If the underwriters determine that a condition is not satisfied in any material respect, such prospective investor will be notified, and neither the depositor nor the underwriters will have any obligation to such prospective investor to deliver any portion of the Offered Certificates which such prospective investor has committed to purchase, and there will be no liability between the underwriters, the depositor or any of their respective agents or affiliates, on the one hand, and such prospective investor, on the other hand, as a consequence of the non-delivery.
Each prospective investor has requested that the underwriters provide to such prospective investor information in connection with such prospective investor’s consideration of the purchase of the certificates described in these materials. These materials are being provided to each prospective investor for informative purposes only in response to such prospective investor’s specific request. The underwriters described in these materials may from time to time perform investment banking services for, or solicit investment banking business from, any company named in these materials. The underwriters and/or their affiliates or respective employees may from time to time have a long or short position in any security or contract discussed in these materials.
The information contained herein supersedes any previous such information delivered to any prospective investor and will be superseded by information delivered to such prospective investor prior to the time of sale.
IMPORTANT NOTICE RELATING TO AUTOMATICALLY-GENERATED EMAIL DISCLAIMERS
Any legends, disclaimers or other notices that may appear at the bottom of any email communication to which this free writing prospectus is attached relating to (1) these materials not constituting an offer (or a solicitation of an offer), (2) no representation that these materials are accurate or complete and may not be updated or (3) these materials possibly being confidential, are not applicable to these materials and should be disregarded. Such legends, disclaimers or other notices have been automatically generated as a result of these materials having been sent via Bloomberg or another system.
THE INFORMATION IN THIS STRUCTURAL AND COLLATERAL TERM SHEET IS NOT COMPLETE AND MAY BE AMENDED PRIOR TO THE TIME OF SALE. THIS TERM SHEET IS NOT AN OFFER TO SELL THESE SECURITIES AND IT IS NOT A SOLICITATION OF AN OFFER TO BUY THESE SECURITIES IN ANY JURISDICTION WHERE THE OFFER OR SALE IS NOT PERMITTED.
| 2 |
| Wells Fargo Commercial Mortgage Trust 2015-C29 | Certificate Structure |
I. Certificate Structure
| Class | Expected Ratings (Fitch/KBRA/Moody’s)(1) | Approximate Initial Certificate Principal Balance or Notional Amount(2) |
Approx. Initial | Pass-Through Rate Description | Weighted Average Life (Years)(4) | Expected Principal Window(4) | Certificate Principal to Value Ratio(5) | Certificate Principal U/W NOI Debt Yield(6) |
| Offered Certificates | ||||||||
| A-1 | AAAsf/AAA(sf)/Aaa(sf) | $50,145,000 | 30.000% | (7) | 2.59 | 07/15 - 12/19 | 45.1% | 16.9% |
| A-2 | AAAsf/AAA(sf)/Aaa(sf) | $30,508,000 | 30.000% | (7) | 4.77 | 12/19 - 05/20 | 45.1% | 16.9% |
| A-3 | AAAsf/AAA(sf)/Aaa(sf) | $250,000,000 | 30.000% | (7) | 9.78 | 01/25 - 05/25 | 45.1% | 16.9% |
| A-4 | AAAsf/AAA(sf)/Aaa(sf) | $396,065,000(8) | 30.000% | (7) | 9.91 | 05/25 - 06/25 | 45.1% | 16.9% |
| A-SB | AAAsf/AAA(sf)/Aaa(sf) | $97,199,000 | 30.000% | (7) | 7.29 | 05/20 - 01/25 | 45.1% | 16.9% |
| A-S(9) | AAAsf/AAA(sf)/Aa2(sf) | $88,277,000 | 22.500% | (7) | 9.97 | 06/25 - 06/25 | 50.0% | 15.3% |
| X-A | AAAsf/AAA(sf)/NR | $912,194,000(10) | N/A | Variable(11) | N/A | N/A | N/A | N/A |
| X-B | NR/AAA(sf)/NR | $120,645,000(12) | N/A | Variable(13) | N/A | N/A | N/A | N/A |
| B(9) | AA-sf/AA-(sf)/NR | $70,621,000 | 16.500% | (7) | 9.97 | 06/25 - 06/25 | 53.8% | 14.2% |
| C(9) | A-sf/A-(sf)/NR | $50,024,000 | 12.250% | (7) | 9.97 | 06/25 - 06/25 | 56.6% | 13.5% |
| PEX(9) | A-sf/A-(sf)/NR | $208,922,000 | 12.250% | (7) | 9.97 | 06/25 - 06/25 | 56.6% | 13.5% |
| D | BBB-sf/BBB-(sf)/NR | $58,851,000 | 7.250% | (7) | 9.97 | 06/25 - 06/25 | 59.8% | 12.8% |
| Non-Offered Certificates | ||||||||
| A-4FL | AAAsf/AAA(sf)/Aaa(sf)(14) | $396,065,000(15)(16) | 30.000% | LIBOR plus [ ](17) | 9.91 | 05/25 - 06/25 | 45.1% | 16.9% |
| A-4FX | AAAsf/AAA(sf)/Aaa(sf)(14) | $0(15)(16) | 30.000% | (7) | 9.91 | 05/25 - 06/25 | 45.1% | 16.9% |
| E | BBsf/BB(sf)/NR | $23,541,000 | 5.250% | (7) | 9.97 | 06/25 - 06/25 | 61.1% | 12.5% |
| F | Bsf/B(sf)/NR | $11,770,000 | 4.250% | (7) | 9.97 | 06/25 - 06/25 | 61.7% | 12.4% |
| G | NR/NR/NR | $50,024,121 | 0.000% | (7) | 9.97 | 06/25 - 06/25 | 64.5% | 11.8% |
| Notes: | |
| (1) | The expected ratings presented are those of Fitch Ratings, Inc. (“Fitch”), Kroll Bond Rating Agency, Inc. (“KBRA”) and Moody’s Investors Service, Inc. (“Moody’s”) which the depositor hired to rate the offered certificates. One or more other nationally recognized statistical rating organizations that were not hired by the depositor may use information they receive pursuant to Rule 17g-5 under the Securities Exchange Act of 1934, as amended (the “Exchange Act”) or otherwise, to rate or provide market reports and/or published commentary related to the offered certificates. We cannot assure you as to what ratings a non-hired nationally recognized statistical rating organization would assign or that its reports will not express differing, possibly negative, views of the mortgage loans and/or the offered certificates. The ratings of each class of offered certificates address the likelihood of the timely distribution of interest and, except in the case of the Class X-A and Class X-B certificates, the ultimate distribution of principal due on those classes on or before the Rated Final Distribution Date. See “Risk Factors—Risks Related to the Offered Certificates—Ratings of the Certificates Have Substantial Limitations” and “Ratings” in the free writing prospectus, dated June 9, 2015 (the “Free Writing Prospectus”). Fitch, KBRA and Moody’s have informed us that the “sf” designation in their ratings represents an identifier for structured finance product ratings. |
| (2) | The principal balances and notional amounts set forth in the table are approximate. The actual initial principal balances and notional amounts may be larger or smaller depending on the aggregate cut-off date principal balance of the mortgage loans definitively included in the pool of mortgage loans, which aggregate cut-off date principal balance may be as much as 5% larger or smaller than the amount presented in the Free Writing Prospectus. |
| (3) | The approximate initial credit support with respect to the Class A-1, A-2, A-3, A-4, A-4FL, A-4FX and A-SB Certificates represents the approximate credit enhancement for the Class A-1, A-2, A-3, A-4, A-4FL, A-4FX and A-SB Certificates in the aggregate. The percentage indicated under the column “Approx. Initial Credit Support” with respect to the Class C Certificates and the Class PEX Certificates represents the approximate credit support for the Class C regular interest, which will have an initial outstanding principal balance on the closing date of $50,024,000. |
| (4) | Weighted Average Lives and Expected Principal Windows are calculated based on an assumed prepayment rate of 0% CPR and the “Structuring Assumptions” described on Annex B to the Free Writing Prospectus. |
| (5) | The Certificate Principal to Value Ratio for each Class of Certificates (other than the Class A-1, A-2, A-3, A-4, A-4FL, A-4FX, A-SB and PEX Certificates) is calculated as the product of (a) the weighted average Cut-off Date LTV Ratio for the mortgage loans and (b) a fraction, the numerator of which is the total initial Certificate Balance of such Class of Certificates and all Classes of Principal Balance Certificates (other than the Class PEX Certificates) senior to such Class of Certificates and the denominator of which is the total initial Certificate Balance of all of the Principal Balance Certificates (other than the Class PEX Certificates). The Certificate Principal to Value Ratios for each of the Class A-1, A-2, A-3, A-4, A-4FL, A-4FX and A-SB Certificates are calculated in the aggregate for those Classes as if they were a single Class and is calculated as the product of (a) the weighted average Cut-off Date LTV Ratio for the mortgage loans and (b) a fraction, the numerator of which is the total initial aggregate Certificate Balances of such Classes of Certificates and the denominator of which is the total initial Certificate Balance of all of the Principal Balance Certificates (other than the Class PEX Certificates). The Certificate Principal to Value Ratio of the Class PEX Certificates is equal to the Certificate Principal to Value Ratio of the Class C Certificates. In any event, however, excess mortgaged property value associated with a mortgage loan will not be available to offset losses on any other mortgage loan. |
| (6) | The Certificate Principal U/W NOI Debt Yield for each Class of Certificates (other than the Class A-1, A-2, A-3, A-4, A-4FL, A-4FX, A-SB and PEX Certificates) is calculated as the product of (a) the weighted average UW NOI Debt Yield for the mortgage loans and (b) a fraction, the numerator of which is the total initial Certificate Balance of all of the Classes of Principal Balance Certificates (other than the Class PEX Certificates) and the denominator of which is the total initial Certificate Balance for such Class of Certificates and all Classes of Principal Balance Certificates (other than the Class PEX Certificates) senior to such Class of Certificates. The Certificate Principal U/W NOI Debt Yield for each of the Class A-1, A-2, A-3, A-4, A-4FL, A-4FX and A-SB Certificates is calculated in the aggregate for those Classes as if they were a single Class and is calculated as the product of (a) the weighted average UW NOI Debt Yield for the mortgage loans and (b) a fraction, the numerator of which is the total initial Certificate Balance of all of the Classes of Principal Balance Certificates (other than the Class PEX Certificates) and the denominator of which is the total aggregate initial Certificate Balances for the Class A-1, A-2, A-3, A-4, A-4FL, A-4FX and A-SB Certificates. The Certificate Principal U/W NOI Debt Yield of the Class PEX Certificates is equal to the Certificate Principal U/W NOI Debt Yield for the Class C Certificates. In any event, however, cash flow from each mortgaged property supports only the related mortgage loan and will not be available to support any other mortgage loan. |
THE INFORMATION IN THIS STRUCTURAL AND COLLATERAL TERM SHEET IS NOT COMPLETE AND MAY BE AMENDED PRIOR TO THE TIME OF SALE. THIS TERM SHEET IS NOT AN OFFER TO SELL THESE SECURITIES AND IT IS NOT A SOLICITATION OF AN OFFER TO BUY THESE SECURITIES IN ANY JURISDICTION WHERE THE OFFER OR SALE IS NOT PERMITTED.
| 3 |
| Wells Fargo Commercial Mortgage Trust 2015-C29 | Certificate Structure |
| (7) | The pass-through rates for the Class A-1, A-2, A-3, A-4, A-4FX, A-SB, D, E, F and G Certificates and the Class A-4FX, A-S, B and C regular interests in each case will be one of the following: (i) a fixed rateper annum, (ii) the weighted average of the net mortgage interest rates on the mortgage loans for the related distribution date, (iii) a variable rateper annum equal to the lesser of (a) a fixed rate and (b) the weighted average of the net mortgage interest rates on the mortgage loans for the related distribution date or (iv) a variable rateper annum equal to the weighted average of the net mortgage interest rates on the mortgage loans for the related distribution date minus a specified percentage. For purposes of the calculation of the weighted average of the net mortgage interest rates on the mortgage loans for each distribution date, the mortgage interest rates will be adjusted as necessary to a 30/360 basis. The Class PEX Certificates will not have a pass-through rate, but will be entitled to receive the sum of the interest distributable on the Class PEX Components. The pass-through rate for the Class A-S Certificates, the Class A-S regular interest and the Class PEX Component A-S will, at all times, be the same. The pass-through rate for the Class B Certificates, the Class B regular interest and the Class PEX Component B will, at all times, be the same. The pass-through rate for the Class C Certificates, the Class C regular interest and the Class PEX Component C will, at all times, be the same. |
| (8) | Represents the maximum initial principal balance of the Class A-4 certificates that will be issued on the closing date. The aggregate initial principal balance of the Class A-4, A-4FL and A-4FX certificates will be $396,065,000. |
| (9) | The Class A-S, B, C and PEX Certificates are “Exchangeable Certificates”. On the closing date, the upper-tier REMIC of the issuing entity will issue the Class A-S, B and C regular interests (each a “regular interest”) which will have outstanding principal balances on the closing date of $88,277,000, $70,621,000 and $50,024,000, respectively. The regular interests will be held in a grantor trust for the benefit of the holders of the Class A-S, B, C and PEX Certificates. The Class A-S, B, C and PEX Certificates will, at all times, represent undivided beneficial ownership interests in a grantor trust that will hold those regular interests. Each class of the Class A-S, B and C Certificates will, at all times, represent an undivided beneficial ownership interest in a percentage of the outstanding certificate principal balance of the regular interest with the same alphabetical class designation. The Class PEX Certificates will, at all times, represent an undivided beneficial ownership interest in the remaining percentages of the outstanding certificate principal balances of the Class A-S, B and C regular interests and which portions of those regular interests are referred to in this Term Sheet as the Class PEX Component A-S, Class PEX Component B and Class PEX Component C (collectively, the “Class PEX Components”). Following any exchange of Class A-S, B and C Certificates for Class PEX Certificates or any exchange of Class PEX Certificates for Class A-S, B and C Certificates as described in the Free Writing Prospectus, the percentage interest of the outstanding certificate principal balances of the Class A-S, B and C regular interest that is represented by the Class A-S, B, C and PEX Certificates will be increased or decreased accordingly. The initial certificate principal balance of each of the Class A-S, B and C Certificates shown in the table represents the maximum certificate principal balance of such class without giving effect to any exchange. The initial certificate principal balance of the Class PEX Certificates is equal to the aggregate of the initial certificate principal balance of the Class A-S, B and C Certificates and represents the maximum certificate principal balance of the Class PEX Certificates that could be issued in an exchange. The certificate principal balances of the Class A-S, B and C Certificates to be issued on the closing date will be reduced, in required proportions, by an amount equal to the certificate principal balance of the Class PEX Certificates issued on the closing date. Distributions and allocations of payments and losses with respect to the Exchangeable Certificates are described in this Term Sheet under “Allocations and Distributions on the Class A-S, B, C and PEX Certificates” and under “Description of the Offered Certificates—Distributions” in the Free Writing Prospectus. The maximum certificate principal balance of the Class PEX Certificates is set forth in the table but is not included in the certificate principal balance of the certificates set forth on the cover page of this Term Sheet or on the top of the cover page of the Free Writing Prospectus. |
| (10) | The Class X-A Certificates are notional amount certificates. The Notional Amount of the Class X-A Certificates will be equal to the aggregate principal balance of the Class A-1, A-2, A-3, A-4 and A-SB Certificates and the Class A-4FX and A-S regular interests outstanding from time to time (without regard to any exchange of the Class A-S, B and C Certificates for the Class PEX Certificates). The Class X-A Certificates will not be entitled to distributions of principal. |
| (11) | The pass-through rate for the Class X-A Certificates for any distribution date will be aper annum rate equal to the excess, if any, of (a) the weighted average of the net mortgage interest rates on the mortgage loans for the related distribution date, over (b) the weighted average of the pass-through rates on the Class A-1, A-2, A-3, A-4 and A-SB Certificates and the Class A-4FX and A-S regular interests for the related distribution date, weighted on the basis of their respective aggregate principal balances outstanding immediately prior to that distribution date. For purposes of the calculation of the weighted average of the net mortgage interest rates on the mortgage loans for each distribution date, the mortgage interest rates will be adjusted as necessary to a 30/360 basis. |
| (12) | The Class X-B Certificates are notional amount certificates. The Notional Amount of the Class X-B Certificates will be equal to the aggregate principal balance of the Class B and C regular interests outstanding from time to time (without regard to any exchange of the Class A-S, B and C Certificates for the Class PEX Certificates). The Class X-B Certificates will not be entitled to distributions of principal. |
| (13) | The pass-through rate for the Class X-B Certificates for any distribution date will be aper annum rate equal to the excess, if any, of (a) the weighted average of the net mortgage interest rates on the mortgage loans for the related distribution date, over (b) the weighted average of the pass-through rates on the Class B and C regular interests for the related distribution date, weighted on the basis of their respective aggregate principal balances outstanding immediately prior to that distribution date. For purposes of the calculation of the weighted average of the net mortgage interest rates on the mortgage loans for each distribution date, the mortgage interest rates will be adjusted as necessary to a 30/360 basis. |
| (14) | The ratings assigned to the Class A-4FL Certificates reflect only the receipt of up to the fixed rate of interest at a rate equal to the pass-through rate for the Class A-4FX Regular Interest. The ratings of Fitch, KBRA and Moody’s do not address any shortfalls or delays in payment that investors in the Class A-4FL Certificates may experience as a result of the conversion of the pass-through rate on Class A-4FL Certificates from a floating interest rate to a fixed rate. See “Ratings” in the Private Placement Memorandum. |
| (15) | The aggregate initial principal balance of the Class A-4, A-4FL and A-4FX certificates will be $396,065,000. The aggregate principal balance of the Class A-4FL and A-4FX certificates will at all times equal the principal balance of the Class A-4FX regular interest. The maximum initial principal balance of the Class A-4FL certificates is $396,065,000. The principal balance of the Class A-4FX certificates will initially be $0. The maximum initial principal balance of the Class A-4FX regular interest is $396,065,000. |
| (16) | The Class A-4FL Certificates will evidence a beneficial interest in a grantor trust that includes the Class A-4FX regular interest and an interest rate swap contract. Under some circumstances, holders of the Class A-4FL Certificates may exchange all or a portion of their certificates for a like principal amount of Class A-4FX Certificates having the same pass-through rate as the Class A-4FX Regular Interest. The aggregate principal balance of the Class A-4FL Certificates may be adjusted from time to time as a result of such an exchange. |
| (17) | The pass-through rate applicable to the Class A-4FL Certificates on each distribution date will be aper annum rate equal to LIBOR plus a specified percentage; provided, however, that under certain circumstances (generally involving a default or termination under the related interest rate swap contract), the pass-through rate applicable to the Class A-4FL Certificates may convert to a fixed rate equal to the pass-through rate on the Class A-4FX Regular Interest. The initial LIBOR rate will be determined two LIBOR business days prior to the Closing Date, and subsequent LIBOR rates for the Class A-4FL Certificates will be determined two LIBOR business days before the start of the related interest accrual period. |
THE INFORMATION IN THIS STRUCTURAL AND COLLATERAL TERM SHEET IS NOT COMPLETE AND MAY BE AMENDED PRIOR TO THE TIME OF SALE. THIS TERM SHEET IS NOT AN OFFER TO SELL THESE SECURITIES AND IT IS NOT A SOLICITATION OF AN OFFER TO BUY THESE SECURITIES IN ANY JURISDICTION WHERE THE OFFER OR SALE IS NOT PERMITTED.
| 4 |
| Wells Fargo Commercial Mortgage Trust 2015-C29 | Issue Characteristics |
II. Transaction Highlights
Mortgage Loan Sellers:
Mortgage Loan Seller | Number of | Number of | Aggregate Cut-off | % of Cut-off | |
| Wells Fargo Bank, National Association | 53 | 64 | $578,987,789 | 49.2% | |
| Rialto Mortgage Finance, LLC | 25 | 26 | 236,805,755 | 20.1 | |
| Silverpeak Real Estate Finance LLC | 13 | 13 | 145,314,173 | 12.3 | |
| Walker & Dunlop Commercial Property Funding I WF, LLC | 7 | 13 | 113,270,708 | 9.6 | |
| National Cooperative Bank, N.A. | 35 | 35 | 102,646,698 | 8.7 | |
Total
| 133 | 151 | $1,177,025,122 | 100.0% | |
Loan Pool:
| Cut-off Date Balance: | $1,177,025,122 |
| Number of Mortgage Loans: | 133 |
| Average Cut-off Date Balance per Mortgage Loan: | $8,849,813 |
| Number of Mortgaged Properties: | 151 |
| Average Cut-off Date Balance per Mortgaged Property(1): | $7,794,868 |
| Weighted Average Mortgage Interest Rate: | 4.266% |
| Ten Largest Mortgage Loans as % of Cut-off Date Pool Balance: | 32.6% |
| Weighted Average Original Term to Maturity or ARD (months): | 119 |
| Weighted Average Remaining Term to Maturity or ARD (months): | 118 |
| Weighted Average Original Amortization Term (months)(2): | 355 |
| Weighted Average Remaining Amortization Term (months)(2): | 354 |
| Weighted Average Seasoning (months): | 1 |
(1) Information regarding mortgage loans secured by multiple properties is based on an allocation according to relative appraised values or the allocated loan amounts or property-specific release prices set forth in the related loan documents or such other allocation as the related mortgage loan seller deemed appropriate. (2) Excludes any mortgage loan that does not amortize.
| |
Credit Statistics:
| Weighted Average U/W Net Cash Flow DSCR(1): | 1.98x |
| Weighted Average U/W Net Operating Income Debt Yield(1): | 11.8% |
| Weighted Average Cut-off Date Loan-to-Value Ratio(1): | 64.5% |
| Weighted Average Balloon or ARD Loan-to-Value Ratio(1): | 55.5% |
| % of Mortgage Loans with Additional Subordinate Debt(2): | 7.9% |
| % of Mortgage Loans with Single Tenants(3): | 3.4% |
(1) With respect to the Brickyard Square mortgage loan and the Bella Luna / San Lucas mortgage loan, each of which is part of a loan combination, loan-to-value ratio, debt service coverage ratio and debt yield calculations include the relatedpari passu companion loan(s) (unless otherwise stated) but does not take account of any related subordinate debt. For mortgaged properties securing residential cooperative mortgage loans, the debt service coverage ratio or debt yield for each such mortgaged property is calculated using underwritten net cash flow for the related residential cooperative property which is the projected net cash flow reflected in the most recent appraisal obtained by or otherwise in the possession of the related mortgage loan seller as of the cut-off date (plus, in the case of the mortgage loan identified on Annex A 1 to the Free Writing Prospectus as Baywoods of Annapolis, the projected net cash flow of the portion of such mortgaged property operated as a residential healthcare facility, as set forth in the related appraisal), and the loan-to-value ratio is calculated based upon the appraised value of the residential cooperative property determined as if such residential cooperative property is operated as a residential cooperative (plus, in the case of the mortgage loan identified on Annex A 1 to the Free Writing Prospectus as Baywoods of Annapolis, the value of the portion of such mortgaged property operated as a residential healthcare facility, as set forth in the related appraisal). (2) Twenty-two (22) of the mortgage loans, each of which is secured by a residential cooperative property (including the mortgage loan identified on Annex A-1 to this free writing prospectus as Baywoods of Annapolis), currently have in place subordinate secured lines of credit to the related mortgage borrowers that permit future advances (such loans, collectively, the “Subordinate Coop LOCs”) and/or subordinate chattel mortgages to the related mortgage borrowers, the proceeds of which have been fully advanced and utilized to make certain energy-related improvements to the mortgaged property. The percentage figure expressed as “% of Mortgage Loans with Additional Subordinate Debt” is determined as a percentage of cut-off date principal balance and does not take into account future subordinate debt (whether or not secured by the mortgaged property), if any, that may be permitted under the terms of any mortgage loan or the Pooling and Servicing Agreement. See “Description of the Mortgage Pool—Subordinate and/or Other Financing” and “Additional Debt Financing for Mortgage Loans Secured by Residential Cooperatives” in the Free Writing Prospectus. (3) Excludes mortgage loans that are secured by multiple single tenant properties and includes mortgage loans secured by multiple single tenant properties where each property is occupied by the same tenant or tenants that are affiliates of one another. | |
THE INFORMATION IN THIS STRUCTURAL AND COLLATERAL TERM SHEET IS NOT COMPLETE AND MAY BE AMENDED PRIOR TO THE TIME OF SALE. THIS TERM SHEET IS NOT AN OFFER TO SELL THESE SECURITIES AND IT IS NOT A SOLICITATION OF AN OFFER TO BUY THESE SECURITIES IN ANY JURISDICTION WHERE THE OFFER OR SALE IS NOT PERMITTED.
| 5 |
| Wells Fargo Commercial Mortgage Trust 2015-C29 | Issue Characteristics |
Loan Structural Features:
Amortization:Based on the Cut-off Date Pool Balance, 87.3% of the mortgage pool (119 mortgage loans) has scheduled amortization, as follows:
53.1% (50 mortgage loans) provides for an interest-only period followed by an amortization period; and
34.2% (69 mortgage loans) requires amortization during the entire loan term.
Interest-Only:Based on the Cut-off Date Pool Balance, 12.7% of the mortgage pool (14 mortgage loans) provides for interest-only payments during the entire loan term. The Weighted Average Cut-off Date Loan-to-Value Ratio and Weighted Average U/W Net Cash Flow DSCR for those mortgage loans are 59.2% and 2.39x, respectively.
Hard Lockboxes: Based on the Cut-off Date Pool Balance, 21.0% of the mortgage pool (nine mortgage loans) has hard lockboxes in place.
Reserves:The mortgage loans require amounts to be escrowed monthly as follows (excluding any mortgage loans with springing provisions):
| Real Estate Taxes: | 85.4% of the pool |
| Insurance: | 46.9% of the pool |
| Capital Replacements: | 74.2% of the pool |
| TI/LC: | 76.7% of the pool(1) |
| (1) The percentage of Cut-off Date Balance for mortgage loans with TI/LC reserves is based on the aggregate principal balance allocable to loans that include retail, office, industrial and mixed use properties. | |
Call Protection/Defeasance: Based on the Cut-off Date Pool Balance, the mortgage pool had the following call protection and defeasance features:
83.0% of the mortgage pool (94 mortgage loans) features a lockout period, then defeasance only until an open period;
10.6% of the mortgage pool (10 mortgage loans) features a lockout period, then the greater of a prepayment premium or yield maintenance until an open period;
5.6% of the mortgage pool (27 mortgage loans) features no lockout period, but requires the greater of a prepayment premium or yield maintenance, then a prepayment premium until an open period;
0.6% of the mortgage pool (one mortgage loan) features a lockout period, then defeasance or the greater of a prepayment premium or yield maintenance until an open period;
0.2% of the mortgage pool (one mortgage loan) features no lockout period, but requires the greater of a prepayment premium or yield maintenance until an open period;
Please refer to Annex A-1 to the Free Writing Prospectus for further information regarding individual loan call protection.
THE INFORMATION IN THIS STRUCTURAL AND COLLATERAL TERM SHEET IS NOT COMPLETE AND MAY BE AMENDED PRIOR TO THE TIME OF SALE. THIS TERM SHEET IS NOT AN OFFER TO SELL THESE SECURITIES AND IT IS NOT A SOLICITATION OF AN OFFER TO BUY THESE SECURITIES IN ANY JURISDICTION WHERE THE OFFER OR SALE IS NOT PERMITTED.
| 6 |
| Wells Fargo Commercial Mortgage Trust 2015-C29 | Issue Characteristics |
III. Issue Characteristics
| Securities Offered: | $1,091,690,000 approximate monthly pay, multi-class, commercial mortgage REMIC pass-through certificates consisting of twelve classes (Classes A-1, A-2, A-3, A-4, A-SB, A-S, B, C, PEX, D, X-A and X-B), which are offered pursuant to a registration statement filed with the SEC. |
| Mortgage Loan Sellers: | Wells Fargo Bank, National Association (“WFB”), Rialto Mortgage Finance, LLC (“RMF”), Silverpeak Real Estate Finance LLC (“SPREF”), Walker & Dunlop Commercial Property Funding I WF, LLC (“WDCPF”) and National Cooperative Bank, N.A. (“NCB”) |
| Sole Lead Bookrunning Manager: | Wells Fargo Securities, LLC |
| Co-Managers: | Citigroup Global Markets Inc. and Deutsche Bank Securities Inc. |
| Rating Agencies: | Fitch Ratings, Inc., Kroll Bond Rating Agency, Inc. and Moody’s Investors Service, Inc. |
| Master Servicers: | Wells Fargo Bank, National Association and National Cooperative Bank, N.A. |
| Special Servicers: | Midland Loan Services, a Division of PNC Bank, National Association and National Cooperative Bank, N.A. |
| Certificate Administrator: | Wells Fargo Bank, National Association |
| Trustee: | Wilmington Trust, National Association |
| Trust Advisor: | Trimont Real Estate Advisors, Inc. |
| Initial Majority Subordinate Certificateholder: | DoubleLine Capital L.P. or an affiliate |
| Cut-off Date: | The Cut-off Date with respect to each mortgage loan is the due date for the monthly debt service payment that is due in June 2015 (or, in the case of any mortgage loan that has its first due date in July 2015, the date that would have been its due date in June 2015 under the terms of that mortgage loan if a monthly debt service payment were scheduled to be due in that month). |
| Expected Closing Date: | On or about June 26, 2015. |
| Determination Dates: | The 11th day of each month (or if that day is not a business day, the next succeeding business day), commencing in July 2015. |
| Distribution Dates: | The fourth business day following the Determination Date in each month, commencing in July 2015. |
| Rated Final Distribution Date: | The Distribution Date in June 2048. |
| Interest Accrual Period: | With respect to any Distribution Date, the calendar month immediately preceding the month in which such Distribution Date occurs. |
| Day Count: | The Offered Certificates will accrue interest on a 30/360 basis. |
| Minimum Denominations: | $10,000 for each Class of Offered Certificates (other than the Class X-A and X-B Certificates) and $1,000,000 for the Class X-A and X-B Certificates. Investments may also be made in any whole dollar denomination in excess of the applicable minimum denomination. |
| Clean-up Call: | 1% |
| Delivery: | DTC, Euroclear and Clearstream Banking |
| ERISA/SMMEA Status: | Each Class of Offered Certificates is expected to be eligible for exemptive relief under ERISA. No Class of Offered Certificates will be SMMEA eligible. |
| Risk Factors: | THE CERTIFICATES INVOLVE CERTAIN RISKS AND MAY NOT BE SUITABLE FOR ALL INVESTORS. SEE THE “RISK FACTORS” SECTION OF THE FREE WRITING PROSPECTUS. |
| Bond Analytics Information: | The Certificate Administrator will be authorized to make distribution date settlements, CREFC® reports and certain supplemental reports (other than confidential information) available to certain financial modeling and data provision services, including Bloomberg, L.P., Trepp, LLC, Intex Solutions, Inc., Markit Group Limited, Interactive Data Corp., BlackRock Financial Management, Inc, CMBS.com, Inc. and Thomson Reuters Corporation. |
THE INFORMATION IN THIS STRUCTURAL AND COLLATERAL TERM SHEET IS NOT COMPLETE AND MAY BE AMENDED PRIOR TO THE TIME OF SALE. THIS TERM SHEET IS NOT AN OFFER TO SELL THESE SECURITIES AND IT IS NOT A SOLICITATION OF AN OFFER TO BUY THESE SECURITIES IN ANY JURISDICTION WHERE THE OFFER OR SALE IS NOT PERMITTED.
| 7 |
| Wells Fargo Commercial Mortgage Trust 2015-C29 | Characteristics of the Mortgage Pool |
IV. Characteristics of the Mortgage Pool(1)
A. Ten Largest Mortgage Loans
| Mortgage Loan Seller | Mortgage Loan Name | City | State | Number of Mortgage Loans / Mortgaged Properties | Mortgage Loan Cut-off Date Balance ($) | % of Cut-off Date Pool Balance (%) | Property Type | Number of SF or Units | Cut-off Date Balance Per SF or Unit ($) | Cut-off Date LTV Ratio (%) | Balloon or ARD LTV Ratio (%) | U/W NCF DSCR (x) | U/W NOI Debt Yield (%) | ||||||||||||||
| WFB | Hutchinson Metro Center I | Bronx | NY | 1 / 1 | $100,000,000 | 8.5% | Office | 422,452 | $237 | 70.4% | 61.2% | 1.40x | 9.1% | ||||||||||||||
| WDCPF | Cathedral Place | Milwaukee | WI | 1 / 1 | 39,900,000 | 3.4 | Office | 219,778 | 182 | 70.0 | 59.2 | 1.41 | 9.0 | ||||||||||||||
| WFB | 150 Royall Street | Canton | MA | 1 / 1 | 38,187,500 | 3.2 | Office | 259,341 | 147 | 64.8 | 59.0 | 1.41 | 9.4 | ||||||||||||||
| WFB | WPC Self Storage Portfolio VII | Various | Various | 1 / 9 | 37,245,000 | 3.2 | Self Storage | 650,686 | 57 | 64.9 | 64.9 | 2.00 | 9.1 | ||||||||||||||
| WFB | Queens' MarketPlace | Waikoloa | HI | 1 / 1 | 35,000,000 | 3.0 | Retail | 130,925 | 267 | 63.1 | 63.1 | 2.10 | 9.4 | ||||||||||||||
| RMF | El Sol Brillante and Laguna Del Sol Apartments | Houston | TX | 1 / 2 | 28,750,000 | 2.4 | Multifamily | 792 | 36,301 | 73.1 | 66.7 | 1.68 | 10.7 | ||||||||||||||
| WFB | Country Club Center | Aventura | FL | 1 / 1 | 27,000,000 | 2.3 | Office | 64,971 | 416 | 75.0 | 60.4 | 1.24 | 7.7 | ||||||||||||||
| WFB | Parkway Crossing East Shopping Center | Woodbridge | VA | 1 / 1 | 26,216,058 | 2.2 | Retail | 143,330 | 183 | 74.9 | 59.9 | 1.38 | 8.6 | ||||||||||||||
| SPREF | Olmsted Plaza Shopping Center | North Olmsted | OH | 1 / 1 | 25,500,000 | 2.2 | Retail | 255,902 | 100 | 72.1 | 65.5 | 1.57 | 9.8 | ||||||||||||||
| WFB | Hall Office Park | Frisco | TX | 1 / 1 | 25,500,000 | 2.2 | Office | 142,761 | 179 | 73.7 | 60.7 | 1.35 | 8.8 | ||||||||||||||
| Top Three Total/Weighted Average | 3 / 3 | $178,087,500 | 15.1% | 69.1% | 60.3% | 1.40x | 9.1% | ||||||||||||||||||||
| Top Five Total/Weighted Average | 5 / 13 | $250,332,500 | 21.3% | 67.6% | 61.4% | 1.59x | 9.2% | ||||||||||||||||||||
| Top Ten Total/Weighted Average | 10 / 19 | $383,298,558 | 32.6% | 69.8% | 61.8% | 1.54x | 9.2% | ||||||||||||||||||||
| Non-Top Ten Total/Weighted Average | 123 / 132 | $793,726,563 | 67.4% | 61.9% | 52.4% | 2.19x | 13.1% | ||||||||||||||||||||
| (1) | With respect to the Brickyard Square mortgage loan and the Bella Luna / San Lucas mortgage loan, each of which is part of a loan combination, loan-to-value ratio, debt service coverage ratio and debt yield calculations include the related pari passu companion loan(s) (unless otherwise stated) but does not take account of any related subordinate debt. |
THE INFORMATION IN THIS STRUCTURAL AND COLLATERAL TERM SHEET IS NOT COMPLETE AND MAY BE AMENDED PRIOR TO THE TIME OF SALE. THIS TERM SHEET IS NOT AN OFFER TO SELL THESE SECURITIES AND IT IS NOT A SOLICITATION OF AN OFFER TO BUY THESE SECURITIES IN ANY JURISDICTION WHERE THE OFFER OR SALE IS NOT PERMITTED.
| 8 |
| Wells Fargo Commercial Mortgage Trust 2015-C29 | Characteristics of the Mortgage Pool |
B. Summary ofPari Passu Loan Combinations
| Property Name | Mortgage Loan Seller | Related Notes in Loan Group (Original Balance) | Holder of Note | Lead Servicer for the Entire Loan Combination | Current Master Servicer Under Related Securitization Servicing Agreement | Current Special Servicer Under Related Securitization Servicing Agreement | |||||
| Brickyard Square | RMF | $11,450,000 | WFCM 2015-C29 | No | Wells Fargo Bank, National Association | Midland Loan Services, a Division of PNC Bank, National Association | |||||
| RMF | $25,000,000 | WFCM 2015-C28 | Yes | Wells Fargo Bank, National Association | Midland Loan Services, a Division of PNC Bank, National Association | ||||||
| Bella Luna / San Lucas | SPREF | $4,957,123 | WFCM 2015-C29 | No | Wells Fargo Bank, National Association | Midland Loan Services, a Division of PNC Bank, National Association | |||||
| SPREF | $15,367,079 | WFCM 2015-LC20 | Yes | Wells Fargo Bank, National Association | Rialto Capital Advisors, LLC |
C.Mortgage Loans with Additional Secured and Mezzanine Financing(1)
| Loan No. | Mortgage Loan Seller | Mortgage Loan Name | Mortgage Loan Cut-off Date Balance ($) | % of Cut-off Date Balance (%) | Sub Debt Cut-off Date Balance ($) | Mezzanine Debt Cut-off Date Balance ($) | Total Debt Interest Rate (%)(2) | Mortgage Loan U/W NCF DSCR (x) | Total Debt U/W NCF DSCR (x) | Mortgage Loan Cut- off Date U/W NOI Debt Yield (%) | Total Debt Cut-off Date U/W NOI Debt Yield (%) | Mortgage Loan Cut-off Date LTV Ratio (%) | Total Debt Cut-off Date LTV Ratio (%) | ||||||||||||
| 16 | WDCPF | Magnolia Marketplace | $18,885,708 | 1.6% | $892,920 | NAP | 4.017% | 1.27x | 1.26x | 7.8% | 7.4% | 74.4% | 77.9% | ||||||||||||
| 60 | RMF | Staybridge Suites Indianapolis Airport | 6,000,000 | 0.5 | 0 | $600,000 | 5.870 | 1.52 | 1.19 | 12.0 | 10.9 | 63.2 | 69.5 | ||||||||||||
| Total/Weighted Average | $24,885,708 | 2.1% | $892,920 | $600,000 | 4.464% | 1.33x | 1.24x | 8.8% | 8.2% | 71.7% | 75.9% | ||||||||||||||
| (1) | In addition, twenty-two (22) of the mortgage loans, each of which are secured by residential cooperative properties (including the mortgage loan identified on Annex A 1 to the Free Writing Prospectus as Baywoods of Annapolis), currently have in place Subordinate Coop LOCs that permit future advances and/or subordinate chattel mortgages to the related mortgage borrowers, the proceeds of which have been fully advanced and utilized to make certain energy-related improvements to the mortgaged property. See “Description of the Mortgage Pool—Subordinate and/or Other Financing” and “—Additional Debt Financing for Mortgage Loans Secured by Residential Cooperatives” in the Free Writing Prospectus. |
| (2) | Total Debt Interest Rate for any specified mortgage loan reflects the weighted average of the interest rates on the respective components of the total debt. |
THE INFORMATION IN THIS STRUCTURAL AND COLLATERAL TERM SHEET IS NOT COMPLETE AND MAY BE AMENDED PRIOR TO THE TIME OF SALE. THIS TERM SHEET IS NOT AN OFFER TO SELL THESE SECURITIES AND IT IS NOT A SOLICITATION OF AN OFFER TO BUY THESE SECURITIES IN ANY JURISDICTION WHERE THE OFFER OR SALE IS NOT PERMITTED.
| 9 |
| Wells Fargo Commercial Mortgage Trust 2015-C29 | Characteristics of the Mortgage Pool |
| D. Previous Securitization History(1) | ||||||||||
| Loan No. | Mortgage Loan Seller | Mortgage Loan or Mortgaged Property Name | City | State | Property Type | Mortgage Loan or Mortgaged Property Cut-off Date Balance ($) | % of Cut- off Date Pool Balance (%) | Previous Securitization | ||
| 1 | WFB | Hutchinson Metro Center I | Bronx | NY | Office | $100,000,000 | 8.5 | % | JPMCC 2005-LDP2 | |
| 2 | WDCPF | Cathedral Place | Milwaukee | WI | Office | 39,900,000 | 3.4 | BSCMS 2005-PWR9 | ||
| 7 | WFB | Country Club Center | Aventura | FL | Office | 27,000,000 | 2.3 | WBCMT 2005-C22 | ||
| 8 | WFB | Parkway Crossing East Shopping Center | Woodbridge | VA | Retail | 26,216,058 | 2.2 | MLMT 2005-CKI1 | ||
| 9 | SPREF | Olmsted Plaza Shopping Center | North Olmsted | OH | Retail | 25,500,000 | 2.2 | MLMT 2005-CIP1 | ||
| 11 | WFB | Dulles North Corporate Parks | Sterling | VA | Various | 24,956,509 | 2.1 | LBUBS 2000-C4 | ||
| 13 | WFB | Foothills Park Place | Phoenix | AZ | Retail | 23,000,000 | 2.0 | MLMT 2005-CIP1 | ||
| 15 | RMF | Hunterstone Apartments | Leland | NC | Multifamily | 19,000,000 | 1.6 | BSCMS 2006-PW13 | ||
| 18 | SPREF | Summer Bend Apartments | Irving | TX | Multifamily | 17,500,000 | 1.5 | CSFB 2005-C3 and MEZZ 2005-C3 | ||
| 19 | NCB | Baywoods of Annapolis | Annapolis | MD | Multifamily | 16,500,000 | 1.4 | JPMCC 2005-LDP5 | ||
| 24 | RMF | Maricopa Fiesta | Maricopa | AZ | Retail | 13,825,000 | 1.2 | MLMT 2005-MCP1 | ||
| 25 | WFB | Dunwoody Place | Sandy Springs | GA | Retail | 13,000,000 | 1.1 | WBCMT 2005-C19 | ||
| 30 | RMF | Old Mills | Omaha | NE | Multifamily | 12,000,000 | 1.0 | FNA 2013-M11 | ||
| 31.04 | WDCPF | Towne Crest Village | McDonough | GA | Retail | 1,750,000 | 0.1 | CSMC 2006-C5 | ||
| 33 | WFB | Dos Santos Apartments | El Paso | TX | Multifamily | 11,100,000 | 0.9 | MLMT 2005-CIP1 | ||
| 37 | WFB | Homewood Suites - Tallahassee | Tallahassee | FL | Hospitality | 9,483,700 | 0.8 | GECMC 2005-C3 | ||
| 38 | WFB | San Mateo Apartments | El Paso | TX | Multifamily | 9,445,000 | 0.8 | GECMC 2005-C3 | ||
| 39 | WDCPF | Brittany Bay II | Naples | FL | Multifamily | 9,400,000 | 0.8 | CSFB 2005-C1 | ||
| 40 | WFB | Nexus Town Center | Riverside | CA | Retail | 9,347,420 | 0.8 | JPMCC 2005-CB12 | ||
| 42 | SPREF | Indiana Village | Lubbock | TX | Multifamily | 9,200,000 | 0.8 | GECMC 2005-C2 | ||
| 44 | RMF | Causeway Corporate Centre | Fort Lauderdale | FL | Office | 8,989,249 | 0.8 | TIAAS 2007-C4 | ||
| 47 | NCB | 39-60 54th Street Owners, Inc. | Woodside | NY | Multifamily | 7,675,000 | 0.7 | CSFB 2005-C5 | ||
| 49 | WFB | Athens Gate Apartments | El Paso | TX | Multifamily | 7,520,000 | 0.6 | MLMT 2005-CIP1 | ||
| 50 | WFB | Sand Pebble Apartments | El Paso | TX | Multifamily | 7,490,000 | 0.6 | GECMC 2005-C3 | ||
| 55 | RMF | Casa Cruz | Houston | TX | Multifamily | 6,900,000 | 0.6 | CSMC 2006-C1 | ||
| 57 | RMF | Oak Tree Plaza | Alamo | CA | Retail | 6,500,000 | 0.6 | GCCFC 2005-GG5 | ||
| 64 | WFB | Lakeside Plaza | Collinsville | IL | Retail | 5,360,000 | 0.5 | WBCMT 2005-C19 | ||
| 69 | NCB | Bristol House, Inc. | White Plains | NY | Multifamily | 4,992,556 | 0.4 | BSCMS 2006-T24 | ||
| 70 | WFB | Storaway Self Storage - Nashville | Nashville | TN | Self Storage | 4,975,000 | 0.4 | WBCMT 2006-C23 | ||
| 73 | NCB | 230 Garth Road Owners, Inc. | Scarsdale | NY | Multifamily | 4,543,115 | 0.4 | CSMC 2006-C4 | ||
| 74 | RMF | Comfort Suites - Near the Galleria | Houston | TX | Hospitality | 4,332,758 | 0.4 | GSMS 1998-C1 | ||
| 75 | RMF | Sandstone Apartments | Pensacola | FL | Multifamily | 4,195,936 | 0.4 | LBUBS 2006-C7 | ||
| 80 | SPREF | Silver Bridge Plaza | Gallipolis | OH | Retail | 3,750,000 | 0.3 | LBUBS 2005-C3 | ||
| 85.00 | RMF | Sycamore Terrace | Vista | CA | Retail | 3,188,000 | 0.3 | MSC 2007-HQ12 | ||
| 89 | NCB | Regency Park Owners Corp. | White Plains | NY | Multifamily | $3,100,000 | 0.3 | CSMC 2006-C4 | ||
| 92 | WFB | Hacienda Heights Apartments | Hacienda Heights | CA | Multifamily | 2,996,129 | 0.3 | BSCMS 2005-PWR8 | ||
THE INFORMATION IN THIS STRUCTURAL AND COLLATERAL TERM SHEET IS NOT COMPLETE AND MAY BE AMENDED PRIOR TO THE TIME OF SALE. THIS TERM SHEET IS NOT AN OFFER TO SELL THESE SECURITIES AND IT IS NOT A SOLICITATION OF AN OFFER TO BUY THESE SECURITIES IN ANY JURISDICTION WHERE THE OFFER OR SALE IS NOT PERMITTED.
| 10 |
| Wells Fargo Commercial Mortgage Trust 2015-C29 | Characteristics of the Mortgage Pool |
| Loan No. | Mortgage Loan Seller | Mortgage Loan or Mortgaged Property Name | City | State | Property Type | Mortgage Loan or Mortgaged Property Cut-off Date Balance ($) | % of Cut- off Date Pool Balance (%) | Previous Securitization | ||
| 94 | WFB | Walgreens - Warrensburg, MO | Warrensburg | MO | Retail | 2,945,000 | 0.3 | WBCMT 2005-C22 | ||
| 95 | NCB | 230 Tenants Corporation | New York | NY | Multifamily | 2,900,000 | 0.2 | MSC 2005-IQ10 | ||
| 99 | WFB | Storaway Self Storage - Palm Bay | Palm Bay | FL | Self Storage | 2,725,000 | 0.2 | WBCMT 2006-C23 | ||
| 101 | NCB | 321 West 90th St. Owners Corp. | New York | NY | Multifamily | 2,500,000 | 0.2 | CSMC 2006-C1 | ||
| 105 | SPREF | Moundsville Plaza | Moundsville | WV | Retail | 2,225,000 | 0.2 | LBUBS 2005-C3 | ||
| 106 | WFB | Storaway Self Storage- Deltona I | Deltona | FL | Self Storage | 2,100,000 | 0.2 | WBCMT 2006-C23 | ||
| 107 | WFB | Sedona Peak Apartments | El Paso | TX | Multifamily | 2,025,000 | 0.2 | GECMC 2005-C3 | ||
| 108 | NCB | Sea Breeze Town Houses Owners, Inc. | Long Beach | NY | Multifamily | 2,000,000 | 0.2 | MSC 2005-IQ10 | ||
| 115 | WFB | Kingstowne Shops | Newport News | VA | Retail | 1,622,953 | 0.1 | CSFB 2004-C5 | ||
| 116 | NCB | 109-111 N. Broadway Apt. Corp. | White Plains | NY | Multifamily | 1,617,987 | 0.1 | CSFB 2005-C3 | ||
| 119 | WFB | Victorville Retail Center | Victorville | CA | Retail | 1,500,000 | 0.1 | MLCFC 2006-1 | ||
| 124 | WFB | Gillespie Field Business Park | El Cajon | CA | Industrial | 1,308,421 | 0.1 | CD 2005-CD1 | ||
| 128 | NCB | 30 Bond Street Owners Corp. | New York | NY | Multifamily | 1,144,978 | 0.1 | CSFB 2005-C3 | ||
| 129 | NCB | 166 West 76th Apartment Corp. | New York | NY | Multifamily | 1,096,839 | 0.1 | MSC 2005-IQ10 | ||
| 132 | NCB | 170 East 92nd Street Owners, Inc. | New York | NY | Multifamily | 800,000 | 0.1 | MSC 2005-IQ10 | ||
| Total | $533,142,610 | 45.3 | % | |||||||
| (1) | The table above represents the most recent securitization with respect to the mortgaged property securing the related mortgage loan, based on information provided by the related borrower or obtained through searches of a third-party database. While the above mortgage loans may have been securitized multiple times in prior transactions, mortgage loans are only listed in the above chart if the mortgage loan in this securitization paid off a mortgage loan in another securitization. The information has not otherwise been confirmed by the mortgage loan sellers. |
THE INFORMATION IN THIS STRUCTURAL AND COLLATERAL TERM SHEET IS NOT COMPLETE AND MAY BE AMENDED PRIOR TO THE TIME OF SALE. THIS TERM SHEET IS NOT AN OFFER TO SELL THESE SECURITIES AND IT IS NOT A SOLICITATION OF AN OFFER TO BUY THESE SECURITIES IN ANY JURISDICTION WHERE THE OFFER OR SALE IS NOT PERMITTED.
| 11 |
| Wells Fargo Commercial Mortgage Trust 2015-C29 | Characteristics of the Mortgage Pool |
E. Mortgage Loans with Scheduled Balloon Payments and Related Classes
| Class A-2(1) |
| Loan No. | Mortgage Loan Seller | Mortgage Loan Name | State | Property Type | Mortgage Loan Cut-off Date Balance ($) | % of Cut-off Date Pool Balance (%) | Mortgage Loan Balance at Maturity ($) | % of Class A-2 Certificate Principal Balance (%)(2) | SF or Units | Loan per SF or Unit ($) | U/W NCF DSCR (x) | U/W NOI Debt Yield (%) | Cut-off Date LTV Ratio (%) | Balloon or ARD LTV Ratio (%) | Rem. IO Period (mos.) | Rem. Term to Maturity (mos.) | ||||||
| 29 | RMF | Riverchase Apartments | IN | Multifamily | $12,000,000 | 1.0 | % | $11,212,712 | 36.8 | % | 216 | $55,556 | 1.23x | 8.0 | % | 72.3 | % | 67.5 | % | 11 | 59 | |
| 71 | SPREF | Bella Luna / San Lucas | TX | Multifamily | 4,957,123 | 0.4 | 4,533,711 | 14.9 | 780 | 26,057 | 2.03 | 12.8 | 58.1 | 53.1 | 0 | 54 | ||||||
| 75 | RMF | Sandstone Apartments | FL | Multifamily | 4,195,936 | 0.4 | 3,896,642 | 12.8 | 172 | 24,395 | 1.62 | 12.1 | 56.0 | 52.0 | 0 | 59 | ||||||
| 97 | WFB | De La Cruz Professional Center | FL | Retail | 2,831,476 | 0.2 | 2,586,692 | 8.5 | 27,980 | 101 | 1.81 | 11.8 | 73.5 | 67.2 | 0 | 59 | ||||||
| Total/Weighted Average | $23,984,534 | 2.0 | % | $22,229,756 | 72.9 | % | 1.53x | 10.2 | % | 66.7 | % | 61.8 | % | 6 | 58 | |||||||
(1) The table above presents the mortgage loan(s) whose balloon payments would be applied to pay down the principal balance of the Class A-2 Certificates, assuming a 0% CPR and applying the “Structuring Assumptions” described in the Free Writing Prospectus, including the assumptions that (i) none of the mortgage loans in the pool experience prepayments prior to maturity (or, in the case of an ARD loan, its anticipated repayment date), defaults or losses; (ii) there are no extensions of maturity dates of any mortgage loans in the pool; and (iii) each mortgage loan in the pool is paid in full on its stated maturity date (or, in the case of an ARD loan, its anticipated repayment date). Each Class of Certificates, including the Class A-2 Certificates, evidences undivided ownership interests in the entire pool of mortgage loans. Debt service coverage ratio, debt yield and loan-to-value ratio information takes no account of subordinate debt (whether or not secured by the mortgaged property), if any, that is allowed under the terms of any mortgage loan. See Annex A-1 to the Free Writing Prospectus. (2) Reflects the percentage equal to the Mortgage Loan Balance at Maturity divided by the initial Class A-2 Certificate Principal Balance. | ||||||||||||||||||||||
THE INFORMATION IN THIS STRUCTURAL AND COLLATERAL TERM SHEET IS NOT COMPLETE AND MAY BE AMENDED PRIOR TO THE TIME OF SALE. THIS TERM SHEET IS NOT AN OFFER TO SELL THESE SECURITIES AND IT IS NOT A SOLICITATION OF AN OFFER TO BUY THESE SECURITIES IN ANY JURISDICTION WHERE THE OFFER OR SALE IS NOT PERMITTED.
| 12 |
[THIS PAGE INTENTIONALLY LEFT BLANK.]
THE INFORMATION IN THIS STRUCTURAL AND COLLATERAL TERM SHEET IS NOT COMPLETE AND MAY BE AMENDED PRIOR TO THE TIME OF SALE. THIS TERM SHEET IS NOT AN OFFER TO SELL THESE SECURITIES AND IT IS NOT A SOLICITATION OF AN OFFER TO BUY THESE SECURITIES IN ANY JURISDICTION WHERE THE OFFER OR SALE IS NOT PERMITTED.
| 13 |
| Wells Fargo Commercial Mortgage Trust 2015-C29 | Characteristics of the Mortgage Pool |
F. Property Type Distribution(1)
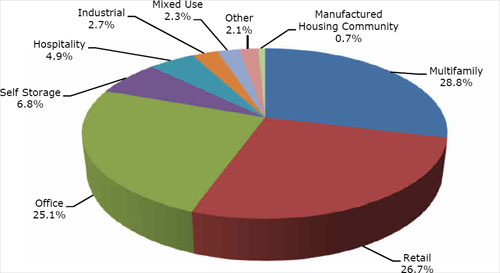
| Property Type | Number of Mortgaged Properties | Aggregate Cut-off Date | % of Cut-off Date Balance (%) | Weighted Average Cut- off Date LTV Ratio (%) | Weighted Average Balloon or ARD LTV Ratio (%) | Weighted Average U/W NCF DSCR (x) | Weighted Average U/W NOI Debt Yield (%) | Weighted Average U/W NCF Debt Yield (%) | Weighted Rate (%) | ||||||||||||||||
| Multifamily | 53 | $339,058,508 | 28.8 | % | 58.1 | % | 49.7 | % | 2.87 | x | 16.4 | % | 15.9 | % | 4.242 | % | |||||||||
| Garden | 22 | 220,029,188 | 18.7 | 70.8 | 60.9 | 1.53 | 9.8 | 9.2 | 4.347 | ||||||||||||||||
| Cooperative | 27 | 65,694,607 | 5.6 | 15.5 | 12.8 | 8.29 | 43.0 | 43.0 | 3.658 | ||||||||||||||||
| Student Housing | 1 | 24,000,000 | 2.0 | 73.4 | 62.4 | 1.40 | 8.9 | 8.3 | 4.330 | ||||||||||||||||
| Cooperative/Residential Healthcare Facility | 1 | 16,500,000 | 1.4 | 28.9 | 23.6 | 2.20 | 13.7 | 13.7 | 4.700 | ||||||||||||||||
| Independent Living | 1 | 10,114,439 | 0.9 | 66.5 | 54.2 | 1.65 | 10.6 | 10.3 | 4.690 | ||||||||||||||||
| High Rise | 1 | 2,720,274 | 0.2 | 73.5 | 60.2 | 1.61 | 11.7 | 10.1 | 4.680 | ||||||||||||||||
| Retail | 44 | 313,808,559 | 26.7 | 67.2 | 59.5 | 1.67 | 9.7 | 9.0 | 4.253 | ||||||||||||||||
| Anchored | 20 | 209,457,278 | 17.8 | 68.7 | 60.2 | 1.61 | 9.5 | 8.8 | 4.213 | ||||||||||||||||
| Shadow Anchored | 5 | 43,873,000 | 3.7 | 63.9 | 60.3 | 1.95 | 10.3 | 9.5 | 4.299 | ||||||||||||||||
| Unanchored | 13 | 33,308,985 | 2.8 | 63.1 | 54.9 | 1.86 | 11.6 | 10.5 | 4.402 | ||||||||||||||||
| Single Tenant | 6 | 27,169,296 | 2.3 | 66.4 | 58.7 | 1.44 | 8.3 | 8.2 | 4.304 | ||||||||||||||||
| Office | 11 | 294,897,126 | 25.1 | 69.4 | 59.2 | 1.41 | 9.2 | 8.4 | 4.241 | ||||||||||||||||
| Suburban | 10 | 254,997,126 | 21.7 | 69.4 | 59.2 | 1.41 | 9.3 | 8.4 | 4.259 | ||||||||||||||||
| CBD | 1 | 39,900,000 | 3.4 | 70.0 | 59.2 | 1.41 | 9.0 | 8.2 | 4.125 | ||||||||||||||||
| Self Storage | 20 | 79,519,010 | 6.8 | 63.7 | 58.3 | 1.96 | 9.8 | 9.5 | 4.313 | ||||||||||||||||
| Self Storage | 20 | 79,519,010 | 6.8 | 63.7 | 58.3 | 1.96 | 9.8 | 9.5 | 4.313 | ||||||||||||||||
| Hospitality | 7 | 57,703,508 | 4.9 | 64.4 | 50.2 | 1.74 | 12.9 | 11.4 | 4.456 | ||||||||||||||||
| Limited Service | 4 | 36,396,458 | 3.1 | 64.5 | 49.7 | 1.74 | 13.1 | 11.5 | 4.407 | ||||||||||||||||
| Extended Stay | 2 | 13,727,050 | 1.2 | 66.8 | 51.7 | 1.68 | 12.5 | 11.0 | 4.538 | ||||||||||||||||
| Full Service | 1 | 7,580,000 | 0.6 | 59.2 | 50.0 | 1.89 | 13.3 | 11.5 | 4.540 | ||||||||||||||||
| Industrial | 10 | 32,318,421 | 2.7 | 57.1 | 47.1 | 1.83 | 12.3 | 10.5 | 4.450 | ||||||||||||||||
| Flex | 5 | 21,618,421 | 1.8 | 55.8 | 47.2 | 1.81 | 12.0 | 10.3 | 4.479 | ||||||||||||||||
| Warehouse | 5 | 10,700,000 | 0.9 | 59.8 | 47.0 | 1.85 | 12.9 | 11.1 | 4.393 | ||||||||||||||||
| Mixed Use | 2 | 27,100,000 | 2.3 | 68.0 | 59.1 | 1.79 | 12.2 | 10.5 | 4.234 | ||||||||||||||||
| Office/Industrial | 1 | 18,000,000 | 1.5 | 69.9 | 61.0 | 1.84 | 13.1 | 11.0 | 4.377 | ||||||||||||||||
| Office/Retail | 1 | 9,100,000 | 0.8 | 64.1 | 55.4 | 1.69 | 10.5 | 9.6 | 3.950 | ||||||||||||||||
| Other | 2 | 24,173,905 | 2.1 | 63.4 | 49.4 | 1.58 | 10.6 | 9.8 | 4.240 | ||||||||||||||||
| Data Center | 1 | 14,973,905 | 1.3 | 59.6 | 43.5 | 1.50 | 10.8 | 9.8 | 4.310 | ||||||||||||||||
| Parking Garage | 1 | 9,200,000 | 0.8 | 69.7 | 58.9 | 1.70 | 10.4 | 9.9 | 4.125 | ||||||||||||||||
| Manufactured Housing Community | 2 | 8,446,084 | 0.7 | 70.8 | 58.0 | 1.56 | 9.5 | 9.3 | 4.310 | ||||||||||||||||
| Manufactured Housing Community | 2 | 8,446,084 | 0.7 | 70.8 | 58.0 | 1.56 | 9.5 | 9.3 | 4.310 | ||||||||||||||||
| Total/Weighted Average | 151 | $1,177,025,122 | 100.0 | % | 64.5 | % | 55.5 | % | 1.98 | x | 11.8 | % | 11.1 | % | 4.266 | % | |||||||||
| (1) | Because this table presents information relating to the mortgaged properties and not the mortgage loans, the information for mortgage loans secured by more than one mortgaged property is based on allocated amounts (allocating the mortgage loan principal balance to each of those properties according to the relative appraised values of the mortgaged properties or the allocated loan amounts or property-specific release prices set forth in the related mortgage loan documents or such other allocation as the related mortgage loan seller deemed appropriate). For mortgaged properties securing residential cooperative mortgage loans, the debt service coverage ratio or debt yield for each such mortgaged property is calculated using underwritten net cash flow for the related residential cooperative property which is the projected net cash flow reflected in the most recent appraisal obtained by or otherwise in the possession of the related mortgage loan seller as of the cut-off date (plus, in the case of the mortgage loan identified on Annex A-1 to the Free Writing Prospectus as Baywoods of Annapolis, the projected net cash flow of the portion of such mortgaged property operated as a residential healthcare facility, as set forth in the related appraisal), and the loan-to-value ratio is calculated based upon the appraised value of the residential cooperative property determined as if such residential cooperative property is operated as a residential cooperative (plus, in the case of the mortgage loan identified on Annex A-1 to the Free Writing Prospectus as Baywoods of Annapolis, the value of the portion of such mortgaged property operated as a residential healthcare facility, as set forth in the related appraisal). With respect to the Brickyard Square mortgage loan and the Bella Luna / San Lucas mortgage loan, each of which is part of a loan combination, loan-to-value ratio, debt service coverage ratio and debt yield calculations include the related pari passu companion loan(s) (unless otherwise stated) but does not take account of any related subordinate debt. See Annex A-1 to the Free Writing Prospectus. |
THE INFORMATION IN THIS STRUCTURAL AND COLLATERAL TERM SHEET IS NOT COMPLETE AND MAY BE AMENDED PRIOR TO THE TIME OF SALE. THIS TERM SHEET IS NOT AN OFFER TO SELL THESE SECURITIES AND IT IS NOT A SOLICITATION OF AN OFFER TO BUY THESE SECURITIES IN ANY JURISDICTION WHERE THE OFFER OR SALE IS NOT PERMITTED.
| 14 |
| Wells Fargo Commercial Mortgage Trust 2015-C29 | Characteristics of the Mortgage Pool |
G. Geographic Distribution(1)(2)
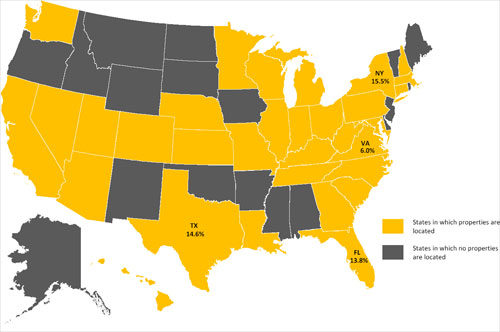
| Location | Number of Mortgaged Properties | Aggregate Cut-off Date Balance ($) | % of Cut- off Date Balance (%) | Weighted Average Cut-off Date LTV Ratio (%) | Weighted Average Balloon or ARD LTV Ratio (%) | Weighted Average U/W NCF DSCR (x) | Weighted Average U/W NOI Debt Yield (%) | Weighted Average U/W NCF Debt Yield (%) | Weighted Average Mortgage Rate (%) | |||||||||||||||||||||||||||
| New York | 30 | $ | 182,319,607 | 15.5 | % | 50.9 | % | 43.2 | % | 3.88 | x | 21.4 | % | 20.8 | % | 4.039 | % | |||||||||||||||||||
| Texas | 19 | 171,494,880 | 14.6 | 70.4 | 60.1 | 1.57 | 10.2 | 9.3 | 4.313 | |||||||||||||||||||||||||||
| Florida | 26 | 161,854,235 | 13.8 | 67.3 | 57.6 | 1.66 | 10.2 | 9.4 | 4.398 | |||||||||||||||||||||||||||
| Virginia | 5 | 70,795,520 | 6.0 | 67.9 | 54.1 | 1.55 | 10.6 | 9.5 | 4.259 | |||||||||||||||||||||||||||
| Other(3) | 71 | 590,560,879 | 50.2 | 65.8 | 57.5 | 1.65 | 10.0 | 9.2 | 4.287 | |||||||||||||||||||||||||||
| Total/Weighted Average | 151 | $ | 1,177,025,122 | 100.0 | % | 64.5 | % | 55.5 | % | 1.98 | x | 11.8 | % | 11.1 | % | 4.266 | % | |||||||||||||||||||
| (1) | The Mortgaged Properties are located in 32 states. |
| (2) | Because this table presents information relating to the mortgaged properties and not the mortgage loans, the information for mortgage loans secured by more than one mortgaged property is based on allocated amounts (allocating the mortgage loan principal balance to each of those properties according to the relative appraised values of the mortgaged properties or the allocated loan amounts or property-specific release prices set forth in the related mortgage loan documents or such other allocation as the related mortgage loan seller deemed appropriate). For mortgaged properties securing residential cooperative mortgage loans, the debt service coverage ratio or debt yield for each such mortgaged property is calculated using underwritten net cash flow for the related residential cooperative property which is the projected net cash flow reflected in the most recent appraisal obtained by or otherwise in the possession of the related mortgage loan seller as of the cut-off date (plus, in the case of the mortgage loan identified on Annex A-1 to the Free Writing Prospectus as Baywoods of Annapolis, the projected net cash flow of the portion of such mortgaged property operated as a residential healthcare facility, as set forth in the related appraisal), and the loan-to-value ratio is calculated based upon the appraised value of the residential cooperative property determined as if such residential cooperative property is operated as a residential cooperative (plus, in the case of the mortgage loan identified on Annex A-1 to the Free Writing Prospectus as Baywoods of Annapolis, the value of the portion of such mortgaged property operated as a residential healthcare facility, as set forth in the related appraisal). With respect to the Brickyard Square mortgage loan and the Bella Luna / San Lucas mortgage loan, each of which is part of a loan combination, loan-to-value ratio, debt service coverage ratio and debt yield calculations include the related pari passu companion loan(s) (unless otherwise stated) but does not take account of any related subordinate debt. See Annex A-1 to the Free Writing Prospectus. |
| (3) | Includes 28 other states. |
THE INFORMATION IN THIS STRUCTURAL AND COLLATERAL TERM SHEET IS NOT COMPLETE AND MAY BE AMENDED PRIOR TO THE TIME OF SALE. THIS TERM SHEET IS NOT AN OFFER TO SELL THESE SECURITIES AND IT IS NOT A SOLICITATION OF AN OFFER TO BUY THESE SECURITIES IN ANY JURISDICTION WHERE THE OFFER OR SALE IS NOT PERMITTED.
| 15 |
| Wells Fargo Commercial Mortgage Trust 2015-C29 | Characteristics of the Mortgage Pool |
H.Characteristics of the Mortgage Pool(1)
| CUT-OFF DATE BALANCE | LOAN PURPOSE | |||||||||||||||||
| Number of | Number of | |||||||||||||||||
| Range of Cut-off Date | Mortgage | Aggregate Cut- | % of Cut-off | Mortgage | Aggregate Cut- | % of Cut-off | ||||||||||||
| Balances ($) | Loans | off Date Balance | Date Balance | Loan Purpose | Loans | off Date Balance | Date Balance | |||||||||||
| 750,000 - 1,000,000 | 3 | $2,550,000 | 0.2 | % | Refinance | 99 | $866,806,304 | 73.6 | % | |||||||||
| 1,000,001 - 2,000,000 | 23 | 35,019,508 | 3.0 | Acquisition | 33 | 306,022,882 | 26.0 | |||||||||||
| 2,000,001 - 3,000,000 | 18 | 47,620,905 | 4.0 | Recapitalization | 1 | 4,195,936 | 0.4 | |||||||||||
| 3,000,001 - 4,000,000 | 14 | 48,776,901 | 4.1 | Total: | 133 | $1,177,025,122 | 100.0 | % | ||||||||||
| 4,000,001 - 5,000,000 | 8 | 37,870,775 | 3.2 | |||||||||||||||
| 5,000,001 - 6,000,000 | 8 | 43,913,626 | 3.7 | MORTGAGE RATE | ||||||||||||||
| 6,000,001 - 7,000,000 | 6 | 39,555,000 | 3.4 | Number of | ||||||||||||||
| 7,000,001 - 8,000,000 | 9 | 67,350,050 | 5.7 | Range of Mortgage Rates | Mortgage | Aggregate Cut- | % of Cut-off | |||||||||||
| 8,000,001 - 9,000,000 | 1 | 8,989,249 | 0.8 | (%) | Loans | off Date Balance | Date Balance | |||||||||||
| 9,000,001 - 10,000,000 | 9 | 84,563,894 | 7.2 | 3.380 - 3.500 | 4 | $16,628,398 | 1.4 | % | ||||||||||
| 10,000,001 - 15,000,000 | 13 | 161,924,439 | 13.8 | 3.501 - 3.750 | 11 | 22,481,385 | 1.9 | |||||||||||
| 15,000,001 - 20,000,000 | 7 | 121,385,708 | 10.3 | 3.751 - 4.000 | 17 | 61,779,778 | 5.2 | |||||||||||
| 20,000,001 - 30,000,000 | 9 | 227,172,567 | 19.3 | 4.001 - 4.250 | 37 | 491,509,181 | 41.8 | |||||||||||
| 30,000,001 - 50,000,000 | 4 | 150,332,500 | 12.8 | 4.251 - 4.500 | 41 | 429,141,617 | 36.5 | |||||||||||
| 90,000,001 - 100,000,000 | 1 | 100,000,000 | 8.5 | 4.501 - 4.750 | 20 | 134,418,828 | 11.4 | |||||||||||
| Total: | 133 | $1,177,025,122 | 100.0 | % | 4.751 - 5.000 | 1 | 5,360,000 | 0.5 | ||||||||||
| Average: | $8,849,813 | 5.001 - 5.250 | 1 | 11,510,000 | 1.0 | |||||||||||||
| 5.251 - 5.390 | 1 | 4,195,936 | 0.4 | |||||||||||||||
| UNDERWRITTEN NOI DEBT SERVICE COVERAGE RATIO | Total: | 133 | $1,177,025,122 | 100.0 | % | |||||||||||||
| Number of | Weighted Average: | 4.266% | ||||||||||||||||
| Range of U/W NOI | Mortgage | Aggregate Cut- | % of Cut-off | |||||||||||||||
| DSCRs (x) | Loans | off Date Balance | Date Balance | UNDERWRITTEN NOI DEBT YIELD | ||||||||||||||
| 1.14 - 1.20 | 1 | $5,500,000 | 0.5 | % | Number of | |||||||||||||
| 1.21 - 1.30 | 3 | 41,734,296 | 3.5 | Range of U/W NOI | Mortgage | Aggregate Cut- | % of Cut-off | |||||||||||
| 1.31 - 1.40 | 9 | 98,488,708 | 8.4 | Debt Yields (%) | Loans | off Date Balance | Date Balance | |||||||||||
| 1.41 - 1.50 | 8 | 111,497,555 | 9.5 | 7.5 - 8.0 | 7 | $87,075,708 | 7.4 | % | ||||||||||
| 1.51 - 1.60 | 15 | 232,811,980 | 19.8 | 8.1 - 9.0 | 16 | 222,145,525 | 18.9 | |||||||||||
| 1.61 - 1.70 | 14 | 151,509,426 | 12.9 | 9.1 - 10.0 | 28 | 398,051,813 | 33.8 | |||||||||||
| 1.71 - 1.80 | 16 | 140,604,980 | 11.9 | 10.1 - 11.0 | 15 | 171,602,553 | 14.6 | |||||||||||
| 1.81 - 1.90 | 8 | 59,366,016 | 5.0 | 11.1 - 12.0 | 19 | 99,825,072 | 8.5 | |||||||||||
| 1.91 - 2.00 | 8 | 44,288,861 | 3.8 | 12.1 - 13.0 | 10 | 55,378,276 | 4.7 | |||||||||||
| 2.01 - 2.25 | 14 | 171,625,825 | 14.6 | 13.1 - 14.0 | 6 | 51,690,000 | 4.4 | |||||||||||
| 2.26 - 2.50 | 2 | 3,900,000 | 0.3 | 14.1 - 15.0 | 2 | 11,358,700 | 1.0 | |||||||||||
| 2.51 - 2.75 | 2 | 24,192,867 | 2.1 | 15.1 - 16.0 | 1 | 11,510,000 | 1.0 | |||||||||||
| 2.76 - 3.00 | 4 | 21,585,000 | 1.8 | 16.1 - 17.0 | 1 | 2,000,000 | 0.2 | |||||||||||
| 3.01 - 3.50 | 2 | 6,375,000 | 0.5 | 17.1 - 18.0 | 1 | 1,192,867 | 0.1 | |||||||||||
| 3.51 - 4.00 | 3 | 11,223,691 | 1.0 | 18.1 - 19.0 | 1 | 3,650,000 | 0.3 | |||||||||||
| 4.01 - 21.73 | 24 | 52,320,916 | 4.4 | 19.1 - 20.0 | 2 | 10,287,957 | 0.9 | |||||||||||
| Total: | 133 | $1,177,025,122 | 100.0 | % | 20.1 - 119.4 | 24 | 51,256,651 | 4.4 | ||||||||||
| Weighted Average: | 2.11x | Total: | 133 | $1,177,025,122 | 100.0 | % | ||||||||||||
| Weighted Average: | 11.8% | |||||||||||||||||
| UNDERWRITTEN NCF DEBT SERVICE COVERAGE RATIO | ||||||||||||||||||
| Number of | UNDERWRITTEN NCF DEBT YIELD | |||||||||||||||||
| Range of U/W NCF | Mortgage | Aggregate Cut- | % of Cut-off | Number of | ||||||||||||||
| DSCRs (x) | Loans | off Date Balance | Date Balance | Range of U/W NCF | Mortgage | Aggregate Cut- | % of Cut-off | |||||||||||
| 1.13 - 1.20 | 1 | $5,500,000 | 0.5 | % | Debt Yields (%) | Loans | off Date Balance | Date Balance | ||||||||||
| 1.21 - 1.30 | 8 | 101,008,004 | 8.6 | 7.5 - 8.0 | 14 | $208,616,766 | 17.7 | % | ||||||||||
| 1.31 - 1.40 | 13 | 261,415,308 | 22.2 | 8.1 - 9.0 | 30 | 436,452,410 | 37.1 | |||||||||||
| 1.41 - 1.50 | 17 | 193,202,784 | 16.4 | 9.1 - 10.0 | 24 | 225,289,933 | 19.1 | |||||||||||
| 1.51 - 1.80 | 44 | 323,396,834 | 27.5 | 10.1 - 11.0 | 19 | 140,112,498 | 11.9 | |||||||||||
| 1.81 - 2.00 | 8 | 97,563,896 | 8.3 | 11.1 - 12.0 | 9 | 46,296,930 | 3.9 | |||||||||||
| 2.01 - 2.25 | 8 | 80,433,690 | 6.8 | 12.1 - 13.0 | 6 | 25,885,410 | 2.2 | |||||||||||
| 2.26 - 2.50 | 2 | 34,510,000 | 2.9 | 13.1 - 14.0 | 3 | 27,176,567 | 2.3 | |||||||||||
| 2.76 - 3.00 | 3 | 10,075,000 | 0.9 | 16.1 - 17.0 | 1 | 2,000,000 | 0.2 | |||||||||||
| 3.01 - 3.50 | 2 | 6,375,000 | 0.5 | 18.1 - 19.0 | 1 | 3,650,000 | 0.3 | |||||||||||
| 3.51 - 4.00 | 3 | 11,223,691 | 1.0 | 19.1 - 20.0 | 2 | 10,287,957 | 0.9 | |||||||||||
| 4.01 - 21.73 | 24 | 52,320,916 | 4.4 | 20.1 - 119.4 | 24 | 51,256,651 | 4.4 | |||||||||||
| Total: | 133 | $1,177,025,122 | 100.0 | % | Total: | 133 | $1,177,025,122 | 100.0 | % | |||||||||
| Weighted Average: | 1.98x | Weighted Average: | 11.1% | |||||||||||||||
(1) For mortgaged properties securing residential cooperative mortgage loans, the debt service coverage ratio or debt yield for each such mortgaged property is calculated using underwritten net cash flow for the related residential cooperative property which is the projected net cash flow reflected in the most recent appraisal obtained by or otherwise in the possession of the related mortgage loan seller as of the cut-off date (plus, in the case of the mortgage loan identified on Annex A-1 to the Free Writing Prospectus as Baywoods of Annapolis, the projected net cash flow of the portion of such mortgaged property operated as a residential healthcare facility, as set forth in the related appraisal), and the loan-to-value ratio is calculated based upon the appraised value of the residential cooperative property determined as if such residential cooperative property is operated as a residential cooperative (plus, in the case of the mortgage loan identified on Annex A-1 to the Free Writing Prospectus as Baywoods of Annapolis, the value of the portion of such mortgaged property operated as a residential healthcare facility, as set forth in the related appraisal) With respect to the Brickyard Square mortgage loan and the Bella Luna / San Lucas mortgage loan, each of which is part of a loan combination, loan-to-value ratio, debt service coverage ratio and debt yield calculations include the related pari passu companion loan(s) (unless otherwise stated) but does not take account of any related subordinate debt. See Annex A-1 to the Free Writing Prospectus. Prepayment provisions for each mortgage loan reflects the entire life of the loan (from origination to maturity or ARD).
THE INFORMATION IN THIS STRUCTURAL AND COLLATERAL TERM SHEET IS NOT COMPLETE AND MAY BE AMENDED PRIOR TO THE TIME OF SALE. THIS TERM SHEET IS NOT AN OFFER TO SELL THESE SECURITIES AND IT IS NOT A SOLICITATION OF AN OFFER TO BUY THESE SECURITIES IN ANY JURISDICTION WHERE THE OFFER OR SALE IS NOT PERMITTED.
| 16 |
| Wells Fargo Commercial Mortgage Trust 2015-C29 | Characteristics of the Mortgage Pool |
| ORIGINAL TERM TO MATURITY OR ARD | CUT-OFF DATE LOAN-TO-VALUE RATIO | |||||||||||||||||
| Number of | Number of | |||||||||||||||||
| Original Terms to | Mortgage | Aggregate Cut- | % of Cut-off | Range of Cut-off Date LTV | Mortgage | Aggregate Cut- | % of Cut-off | |||||||||||
| Maturity or ARD (months) | Loans | off Date Balance | Date Balance | Ratios (%) | Loans | off Date Balance | Date Balance | |||||||||||
| 60 | 4 | $23,984,534 | 2.0 | % | 3.0 - 20.0 | 20 | $41,262,200 | 3.5 | % | |||||||||
| 61 - 84 | 1 | 1,192,867 | 0.1 | 20.1 - 25.0 | 4 | 13,545,400 | 1.2 | |||||||||||
| 85 - 120 | 128 | 1,151,847,721 | 97.9 | 25.1 - 30.0 | 5 | 28,887,007 | 2.5 | |||||||||||
| Total: | 133 | $1,177,025,122 | 100.0 | % | 40.1 - 45.0 | 1 | 5,360,000 | 0.5 | ||||||||||
| Weighted Average: | 119 months | 45.1 - 50.0 | 9 | 32,914,407 | 2.8 | |||||||||||||
| 50.1 - 55.0 | 2 | 18,747,420 | 1.6 | |||||||||||||||
| REMAINING TERM TO MATURITY OR ARD | 55.1 - 60.0 | 12 | 105,066,220 | 8.9 | ||||||||||||||
| Number of | 60.1 - 65.0 | 11 | 175,151,546 | 14.9 | ||||||||||||||
| Range of Remaining Terms | Mortgage | Aggregate Cut- | % of Cut-off | 65.1 - 70.0 | 31 | 250,753,883 | 21.3 | |||||||||||
| to Maturity or ARD (months) | Loans | off Date Balance | Date Balance | 70.1 - 75.0 | 38 | 505,337,039 | 42.9 | |||||||||||
| 54 - 60 | 4 | $23,984,534 | 2.0 | % | Total: | 133 | $1,177,025,122 | 100.0 | % | |||||||||
| 61 - 84 | 1 | 1,192,867 | 0.1 | Weighted Average: | 64.5% | |||||||||||||
| 85 - 120 | 128 | 1,151,847,721 | 97.9 | |||||||||||||||
| Total: | 133 | $1,177,025,122 | 100.0 | % | BALLOON OR ARD LOAN-TO-VALUE RATIO | |||||||||||||
| Weighted Average: | 118 months | Number of | ||||||||||||||||
| Range of Balloon LTV | Mortgage | Aggregate Cut- | % of Cut-off | |||||||||||||||
| ORIGINAL AMORTIZATION TERM(2) | Ratios (%) | Loans | off Date Balance | Date Balance | ||||||||||||||
| Range of Original | Number of | 2.4 - 20.0 | 23 | $50,402,610 | 4.3 | % | ||||||||||||
| Amortization Terms | Mortgage | Aggregate Cut- | % of Cut-off | 20.1 - 25.0 | 6 | 33,682,407 | 2.9 | |||||||||||
| (months) | Loans | off Date Balance | Date Balance | 25.1 - 30.0 | 1 | 2,000,000 | 0.2 | |||||||||||
| Interest-Only | 14 | $149,405,000 | 12.7 | % | 35.1 - 40.0 | 4 | 11,573,996 | 1.0 | ||||||||||
| 180 | 1 | 2,390,410 | 0.2 | 40.1 - 45.0 | 4 | 53,187,629 | 4.5 | |||||||||||
| 241 - 300 | 16 | 116,775,130 | 9.9 | 45.1 - 50.0 | 15 | 77,491,295 | 6.6 | |||||||||||
| 301 - 360 | 97 | 891,191,493 | 75.7 | 50.1 - 55.0 | 17 | 101,084,871 | 8.6 | |||||||||||
| 421 - 480 | 5 | 17,263,089 | 1.5 | 55.1 - 60.0 | 27 | 303,486,327 | 25.8 | |||||||||||
| Total: | 133 | $1,177,025,122 | 100.0 | % | 60.1 - 65.0 | 25 | 403,906,510 | 34.3 | ||||||||||
| Weighted Average(3): | 355 months | 65.1 - 69.8 | 11 | 140,209,476 | 11.9 | |||||||||||||
(2) The original amortization term shown for any mortgage loan that is interest-only for part of its term does not include the number of months in its interest-only period and reflects only the number of months as of the commencement of amortization remaining from the end of such interest-only period. | Total: | 133 | $1,177,025,122 | 100.0 | % | |||||||||||||
| Weighted Average: | 55.5% | |||||||||||||||||
| (3) Excludes the non-amortizing mortgage loans. | AMORTIZATION TYPE | |||||||||||||||||
| Number of | ||||||||||||||||||
| REMAINING AMORTIZATION TERM(4) | Mortgage | Aggregate Cut- | % of Cut-off | |||||||||||||||
| Range of Remaining | Number of | Type of Amortization | Loans | off Date Balance | Date Balance | |||||||||||||
| Amortization Terms | Mortgage | Aggregate Cut- | % of Cut-off | Interest-only, Amortizing | ||||||||||||||
| (months) | Loans | off Date Balance | Date Balance | Balloon | 50 | $625,323,500 | 53.1 | % | ||||||||||
| Interest-Only | 14 | $149,405,000 | 12.7 | % | Amortizing Balloon | 67 | 395,812,325 | 33.6 | ||||||||||
| 179 - 180 | 1 | 2,390,410 | 0.2 | Interest-only, Balloon | 14 | 149,405,000 | 12.7 | |||||||||||
| 241 - 300 | 16 | 116,775,130 | 9.9 | Amortizing ARD | 2 | 6,484,296 | 0.6 | |||||||||||
| 301 - 360 | 97 | 891,191,493 | 75.7 | Total: | 133 | $1,177,025,122 | 100.0 | % | ||||||||||
| 421 - 480 | 5 | 17,263,089 | 1.5 | |||||||||||||||
| Total: | 133 | $1,177,025,122 | 100.0 | % | ORIGINAL TERM OF INTEREST-ONLY PERIOD FOR PARTIAL IO LOANS | |||||||||||||
| Weighted Average(5): | 354 months | Number of | ||||||||||||||||
| (4) The remaining amortization term shown for any mortgage loan that is interest- only for part of its term does not include the number of months in its interest-only period and reflects only the number of months as of the commencement of amortization remaining from the end of such interest-only period. | Mortgage | Aggregate Cut- | % of Cut-off | |||||||||||||||
| Range of IO Term (months) | Loans | off Date Balance | Date Balance | |||||||||||||||
| 12 - 24 | 28 | $242,513,000 | 20.6 | % | ||||||||||||||
| (5) Excludes the non-amortizing mortgage loans. | 25 - 48 | 10 | 206,790,000 | 17.6 | ||||||||||||||
| 49 - 60 | 12 | 176,020,500 | 15.0 | |||||||||||||||
| LOCKBOXES | Total: | 50 | $625,323,500 | 53.1 | % | |||||||||||||
| Number of | Weighted Average: | 37 months | ||||||||||||||||
| Mortgage | Aggregate Cut- | % of Cut-off | ||||||||||||||||
| Type of Lockbox | Loans | off Date Balance | Date Balance | SEASONING | ||||||||||||||
| Springing | 60 | $546,961,117 | 46.5 | % | Number of | |||||||||||||
| Hard | 9 | 247,685,916 | 21.0 | Mortgage | Aggregate Cut- | % of Cut-off | ||||||||||||
| Soft | 14 | 221,312,623 | 18.8 | Seasoning (months) | Loans | off Date Balance | Date Balance | |||||||||||
| None | 50 | 161,065,465 | 13.7 | 0 | 52 | $559,042,500 | 47.5 | % | ||||||||||
| Total: | 133 | $1,177,025,122 | 100.0 | % | 1-2 | 66 | 520,030,163 | 44.2 | ||||||||||
| 3-4 | 12 | 86,512,078 | 7.4 | |||||||||||||||
| PREPAYMENT PROVISION SUMMARY | 5-6 | 3 | 11,440,381 | 1.0 | ||||||||||||||
| Number of | Total: | 133 | $1,177,025,122 | 100.0 | % | |||||||||||||
| Mortgage | Aggregate Cut- | % of Cut-off | Weighted Average: | 1 month | ||||||||||||||
| Prepayment Provision | Loans | off Date Balance | Date Balance | |||||||||||||||
| Lockout/Defeasance/Open | 94 | $976,968,682 | 83.0 | % | ||||||||||||||
| Lockout/GTR YM or 1%/Open | 10 | 124,968,000 | 10.6 | |||||||||||||||
| GTR YM or 1% / 1% / Open | 27 | 65,694,607 | 5.6 | |||||||||||||||
| Lockout/Def or GTR YM or | ||||||||||||||||||
| 1% / Open | 1 | 7,000,000 | 0.6 | |||||||||||||||
| GTR YM or 1% / Open | 1 | 2,393,832 | 0.2 | |||||||||||||||
| Total: | 133 | $1,177,025,122 | 100.0 | % | ||||||||||||||
THE INFORMATION IN THIS STRUCTURAL AND COLLATERAL TERM SHEET IS NOT COMPLETE AND MAY BE AMENDED PRIOR TO THE TIME OF SALE. THIS TERM SHEET IS NOT AN OFFER TO SELL THESE SECURITIES AND IT IS NOT A SOLICITATION OF AN OFFER TO BUY THESE SECURITIES IN ANY JURISDICTION WHERE THE OFFER OR SALE IS NOT PERMITTED.
| 17 |
| Wells Fargo Commercial Mortgage Trust 2015-C29 | Certain Terms and Conditions |
V.Certain Terms and Conditions
| Interest Entitlements: | The interest entitlement of each Class of Offered Certificates on each Distribution Date generally will be the interest accrued during the related Interest Accrual Period on the related Certificate Principal Balance or Notional Amount at the related pass-through rate, net of any prepayment interest shortfalls allocated to that Class for such Distribution Date as described below. If prepayment interest shortfalls arise from voluntary prepayments (without applicable Special Servicer consent) on particular non-specially serviced mortgage loans during any collection period, the applicable Master Servicer is required to make a compensating interest payment to offset those shortfalls, generally up to an amount equal to the portion of its master servicing fees that accrue at one basis pointper annum. The remaining amount of prepayment interest shortfalls will be allocated to reduce the interest entitlement on all Classes of Certificates (other than the Class X-A and X-B Certificates),pro rata, based on their respective amounts of accrued interest for the related Distribution Date (except with respect to the allocation among the Class A-S, B, C and PEX Certificates as described below under “Allocations and Distributions on the Class A-S, B, C and PEX Certificates”). If a Class receives less than the entirety of its interest entitlement on any Distribution Date, then the shortfall, excluding any shortfall due to prepayment interest shortfalls, will be added to its interest entitlement for the next succeeding Distribution Date. Interest entitlements on the Class D Certificates and the Class C and B regular interests, in that order, may be reduced by certain Trust Advisor expenses (subject to the discussion below under “Allocations and Distributions on the Class A-S, B, C and PEX Certificates”). |
| Principal Distribution Amount: | The Principal Distribution Amount for each Distribution Date generally will be the aggregate amount of principal received or advanced in respect of the mortgage loans, net of any non-recoverable advances and interest thereon that are reimbursed to the applicable Master Servicer, the applicable Special Servicer or the Trustee during the related collection period. Non-recoverable advances and interest thereon are reimbursable from principal collections and advances before reimbursement from other amounts. The Principal Distribution Amount may also be reduced, with a corresponding loss, to the Class D Certificates and the Class C, B and A-S regular interests, then to the Class A-1, A-2, A-3, A-4 and A-SB Certificates and Class A-4FX regular interest (with any losses on the Class A-1, A-2, A-3, A-4 and A-SB Certificates and Class A-4FX regular interest allocatedpro rataaccording to their respective Certificate Principal Balances immediately prior to that Distribution Date), in that order, in connection with certain Trust Advisor expenses to the extent that interest entitlements on the Class B and C regular interests and the Class D Certificates are insufficient to absorb the effect of the expense on any particular Distribution Date. For a discussion on the allocation of amounts distributable in respect of the Class A-S, B and C regular interests, see “Allocations and Distributions on the Class A-S, B, C and PEX Certificates” below. |
| Distributions: | On each Distribution Date, funds available for distribution from the mortgage loans, net of specified trust fees, expenses and reimbursements will generally be distributed in the following amounts and order of priority (in each case to the extent of remaining available funds): |
| 1. Class A-1, A-2, A-3, A-4, A-SB, X-A and X-B Certificates and Class A-4FX regular interest: To interest on the Class A-1, A-2, A-3, A-4, A-SB, X-A and X-B Certificates and the Class A-4FX regular interest,pro rata, according to their respective interest entitlements. | |
| 2. Class A-1, A-2, A-3, A-4 and A-SB Certificates and Class A-4FX regular interest: To principal on the Class A-1, A-2, A-3, A-4 and A-SB Certificates and the Class A-4FX regular interest in the following amounts and order of priority: (i) first, to principal on the Class A-SB Certificates, in an amount up to the Principal Distribution Amount for such Distribution Date until their Certificate Principal Balance is reduced to the Class A-SB Planned Principal Balance for such Distribution Date; (ii) second, to principal on the Class A-1 Certificates until their Certificate Principal Balance is reduced to zero, up to the remainder of the Principal Distribution Amount for such Distribution Date; (iii) third, to principal on the Class A-2 Certificates until their Certificate Principal Balance is reduced to zero, up to the remainder of the Principal Distribution Amount for such Distribution Date; (iv) fourth, to principal on the Class A-3 Certificates until their Certificate Principal Balance is reduced to zero, up to the remainder of the Principal Distribution Amount for such Distribution Date; (v) fifth, on apro rata basis, to principal on the Class A-4 Certificates and the Class A-4FX regular interest until their respective Certificate Principal Balances are reduced to zero, up to the remainder of the Principal Distribution Amount for such Distribution Date; and (vi) sixth, to principal on the Class A-SB Certificates until their Certificate Principal Balance is reduced to zero, up to the remainder of the Principal Distribution Amount for such Distribution Date. However, if the Certificate Principal Balance of each and every Class of Principal Balance Certificates, |
THE INFORMATION IN THIS STRUCTURAL AND COLLATERAL TERM SHEET IS NOT COMPLETE AND MAY BE AMENDED PRIOR TO THE TIME OF SALE. THIS TERM SHEET IS NOT AN OFFER TO SELL THESE SECURITIES AND IT IS NOT A SOLICITATION OF AN OFFER TO BUY THESE SECURITIES IN ANY JURISDICTION WHERE THE OFFER OR SALE IS NOT PERMITTED.
| 18 |
| Wells Fargo Commercial Mortgage Trust 2015-C29 | Certain Terms and Conditions |
| other than the Class A-1, A-2, A-3, A-4 and A-SB Certificates and the Class A-4FX regular interest, has been reduced to zero as a result of the allocation of Mortgage Loan losses and expenses and any of the Class A-1, A-2, A-3, A-4 and A-SB Certificates and Class A-4FX regular interest remains outstanding, then the Principal Distribution Amount will be distributed on the Class A-1, A-2, A-3, A-4 and A-SB Certificates and the Class A-4FX regular interest,pro rata, based on their respective outstanding Certificate Principal Balances, until their Certificate Principal Balances have been reduced to zero. | |
3. Class A-1, A-2, A-3, A-4 and A-SB Certificates and Class A-4FX regular interest: To reimburse the holders of the Class A-1, A-2, A-3, A-4 and A-SB Certificates and the Class A-4FX regular interest,pro rata, for any previously unreimbursed losses (other than certain Trust Advisor expenses) on the mortgage loans that were previously allocated in reduction of the Certificate Principal Balances of such Classes. | |
4. Class A-S regular interest: To make distributions on the Class A-S regular interest as follows: (a) first, to interest on Class A-S regular interest in the amount of the interest entitlement for that Class; (b) next, to the extent of the portion of the Principal Distribution Amount remaining after distributions in respect of principal to each Class with a higher distribution priority (in this case, the Class A-1, A-2, A-3, A-4 and A-SB Certificates and the Class A-4FX regular interest), to principal on the Class A-S regular interest until its principal balance is reduced to zero; and (c) next, to reimburse the holders of the Class A-S regular interest for any previously unreimbursed losses (other than certain Trust Advisor expenses) on the mortgage loans that were previously allocated to that Class in reduction of its principal balance.
5. Class B regular interest: To make distributions on the Class B regular interest as follows: (a) first, to interest on Class B regular interest in the amount of the interest entitlement for that Class; (b) next, to the extent of the portion of the Principal Distribution Amount remaining after distributions in respect of principal to each Class with a higher distribution priority (in this case, the Class A-1, A-2, A-3, A-4 and A-SB Certificates and the Class A-4FX and A-S regular interests), to principal on the Class B regular interest until its principal balance is reduced to zero; and (c) next, to reimburse the holders of the Class B regular interest for any previously unreimbursed losses (other than certain Trust Advisor expenses) on the mortgage loans that were previously allocated to that Class in reduction of its principal balance.
6. Class C regular interest: To make distributions on the Class C regular interest as follows: (a) first, to interest on Class C regular interest in the amount of the interest entitlement for that Class; (b) next, to the extent of the portion of the Principal Distribution Amount remaining after distributions in respect of principal to each Class with a higher distribution priority (in this case, the Class A-1, A-2, A-3, A-4 and A-SB Certificates and the Class A-4FX, A-S and B regular interests), to principal on the Class C regular interest until its principal balance is reduced to zero; and (c) next, to reimburse the holders of the Class C regular interest for any previously unreimbursed losses (other than certain Trust Advisor expenses) on the mortgage loans that were previously allocated to that Class in reduction of its principal balance.
| |
7. Class D Certificates: To make distributions on the Class D Certificates as follows: (a) first, to interest on Class D Certificates in the amount of the interest entitlement for that Class; (b) next, to the extent of the portion of the Principal Distribution Amount remaining after distributions in respect of principal to each Class with a higher distribution priority (in this case, the Class A-1, A-2, A-3, A-4 and A-SB Certificates and the Class A-4FX, A-S, B and C regular interests), to principal on the Class D Certificates until its principal balance is reduced to zero; and (c) next, to reimburse the holders of the Class D Certificates for any previously unreimbursed losses (other than certain Trust Advisor expenses) on the mortgage loans that were previously allocated to that Class in reduction of its principal balance. | |
8. After the Class A-1, A-2, A-3, A-4 and A-SB Certificates, the Class A-4FX, A-S, B and C regular interests and the Class D Certificates are paid all amounts to which they are entitled, the remaining funds available for distribution will be used to pay interest, principal and loss reimbursement amounts (other than certain Trust Advisor expenses) on the Class E, F and G Certificates sequentially in that order in a manner analogous to the Class D Certificates. |
THE INFORMATION IN THIS STRUCTURAL AND COLLATERAL TERM SHEET IS NOT COMPLETE AND MAY BE AMENDED PRIOR TO THE TIME OF SALE. THIS TERM SHEET IS NOT AN OFFER TO SELL THESE SECURITIES AND IT IS NOT A SOLICITATION OF AN OFFER TO BUY THESE SECURITIES IN ANY JURISDICTION WHERE THE OFFER OR SALE IS NOT PERMITTED.
| 19 |
| Wells Fargo Commercial Mortgage Trust 2015-C29 | Certain Terms and Conditions |
| Allocations and Distributions on the Class A-S, B, C and PEX Certificates: | On the closing date, the upper-tier REMIC of the issuing entity will issue the Class A-S, Class B and Class C regular interests (each a “regular interest”) which will have outstanding principal balances on the closing date of $88,277,000, $70,621,000 and $50,024,000, respectively. The regular interests will be held in a grantor trust for the benefit of the holders of the Class A-S, B, C and PEX Certificates. The Class A-S, B, C and PEX Certificates will, at all times, represent undivided beneficial ownership interests in a grantor trust that will hold those regular interests. Each class of the Class A-S, B and C Certificates will, at all times, represent an undivided beneficial ownership interest in a percentage of the outstanding principal balance of the regular interest with the same alphabetical class designation. The Class PEX Certificates will, at all times, represent an undivided beneficial ownership interest in the remaining percentages of the outstanding principal balances of the Class A-S, B and C regular interests and which percentage interests are referred to in this Term Sheet as the “Class PEX Component A-S”, “Class PEX Component B” and “Class PEX Component C”, respectively (collectively, the “Class PEX Components”).
Interest, principal, prepayment premiums, yield maintenance charges and voting rights that are allocated to the Class A-S, B or C regular interest will be distributed or allocated, as applicable, as between the Class A-S, B or C Certificates, as applicable, on the one hand, and Class PEX Component A-S, Class PEX Component B or Class PEX Component C, as applicable (and correspondingly, the Class PEX Certificates), on the other hand,pro rata, based on their respective percentage interests in the Class A-S, Class B or Class C regular interest, as applicable. In addition, any losses (including, without limitation, as a result of Trust Advisor expenses) that are allocated to the Class A-S, Class B or Class C regular interest will correspondingly be allocated as between the Class A-S, B or C Certificates, as applicable, on the one hand, and Class PEX Component A-S, Class PEX Component B or Class PEX Component C, as applicable (and correspondingly, the Class PEX Certificates), on the other hand,pro rata, based on their respective percentage interests in the Class A-S, Class B or Class C regular interest, as applicable. For a complete description of the allocations and distributions with respect to the Class A-S regular interest, the Class B regular interest and the Class C regular interest (and correspondingly the Class A-S, B, C and PEX Certificates and the Class PEX Component A-S, Class PEX Component B and Class PEX Component C), see “Description of the Offered Certificates” in the Free Writing Prospectus. See “Material Federal Income Tax Consequences” in the Free Writing Prospectus for a discussion of the tax treatment of the Exchangeable Certificates.
|
Exchanging Certificates through Combination and Recombination:
| If you own Class A-S, B and C Certificates, you will be able to exchange them for a proportionate interest in the Class PEX Certificates, and vice versa, as described in the Free Writing Prospectus. You can exchange your Exchangeable Certificates by notifying the Certificate Administrator. If Exchangeable Certificates are outstanding and held by certificateholders, those certificates will receive principal and interest that would otherwise have been payable on the same proportion of certificates exchanged therefor if those certificates were outstanding and held by certificateholders. Any such allocations of principal and interest between classes of Exchangeable Certificates will have no effect on the principal or interest entitlements of any other class of certificates. The Free Writing Prospectus describes the available combinations of Exchangeable Certificates eligible for exchange. |
THE INFORMATION IN THIS STRUCTURAL AND COLLATERAL TERM SHEET IS NOT COMPLETE AND MAY BE AMENDED PRIOR TO THE TIME OF SALE. THIS TERM SHEET IS NOT AN OFFER TO SELL THESE SECURITIES AND IT IS NOT A SOLICITATION OF AN OFFER TO BUY THESE SECURITIES IN ANY JURISDICTION WHERE THE OFFER OR SALE IS NOT PERMITTED.
| 20 |
| Wells Fargo Commercial Mortgage Trust 2015-C29 | Certain Terms and Conditions |
| Allocation of Yield Maintenance and Prepayment Premiums: | If any yield maintenance charge or prepayment premium is collected during any particular collection period with respect to any mortgage loan, then on the distribution date corresponding to that collection period, the certificate administrator will pay that yield maintenance charge or prepayment premium (net of liquidation fees payable therefrom) in the following manner: (1) to each of the Class A-1, A-2, A-3, A-4, A-SB and D Certificates and Class A-4FX, A-S, B and C regular interests, the product of (a) such yield maintenance charge or prepayment premium, (b) the related Base Interest Fraction (as defined in the Free Writing Prospectus) for such class or regular interest, and (c) a fraction, the numerator of which is equal to the amount of principal distributed to such class or regular interest for that distribution date, and the denominator of which is the total amount of principal distributed to all Principal Balance Certificates (other than the Class A-4FX and A-4FL Certificates and the Exchangeable Certificates) and the Class A-4FX, A-S, B and C regular interests for that distribution date, and (2) to the Class X-A Certificates, the excess, if any, of (a) the product of (i) such yield maintenance charge or prepayment premium and (ii) a fraction, the numerator of which is equal to the amount of principal distributed to the Class A-1, A-2, A-3, A-4, A-SB Certificates and Class A-4FX and A-S regular interest for that distribution date, and the denominator of which is the total amount of principal distributed to all Principal Balance Certificates (other than the Class A-4FX and A-4FL Certificates and the Exchangeable Certificates) and the Class A-4FX, A-S, B and C regular interests for that distribution date, over (b) the amount of such yield maintenance charge or prepayment premium distributed to the Class A-1, A-2, A-3, A-4, A-SB Certificates and Class A-4FX and A-S regular interests as described above, and (3) to the Class X-B Certificates, any remaining such yield maintenance charge or prepayment premium not distributed as described above. No prepayment premiums or yield maintenance charges will be distributed to the holders of the Class E, F, G, V-1, V-2 or R Certificates. For a description of when prepayment premiums and yield maintenance charges are generally required on the mortgage loans, see Annex A-1 to the Free Writing Prospectus. See also “Risk Factors—Prepayments and Repurchases of the Mortgage Assets Will Affect the Timing of Your Cash Flow and May Affect Your Yield” in the prospectus attached to the Free Writing Prospectus. Prepayment premiums and yield maintenance charges will be distributed on each Distribution Date only to the extent they are actually received on the mortgage loans as of the related Determination Date. |
| Realized Losses: | The Certificate Principal Balances of the Class A-1, A-2, A-3, A-4, A-SB, D, E, F and G Certificates, and the Class A-4FX, A-S, B and C regular interests will be reduced without distribution on any Distribution Date as a write-off to the extent of any losses realized on the mortgage loans allocated to such Class or regular interest on such Distribution Date. Such losses (other than certain Trust Advisor expenses) will be applied in the following order, in each case until the related Certificate Principal Balance is reduced to zero: first, to Class G; second, to Class F; third, to Class E; fourth, to Class D; fifth, to the Class C regular interest; sixth, to the Class B regular interest; seventh, to the Class A-S regular interest; and, finally,pro rata, to Classes A-1, A-2, A-3, A-4 and A-SB Certificates and the Class A-4FX regular interest based on their outstanding Certificate Principal Balances. Certain Trust Advisor expenses (if not absorbed by reductions of interest entitlements on the Class D Certificates and the Class C and B regular interests) will be applied as write-offs in a similar manner, except that such write-offs will be applied only to the Class D Certificates, the Class C, B and A-S regular interests, and the Class A-1, A-2, A-3, A-4 and A-SB Certificates and the Class A-4FX regular interest (with any write-offs on the Class A-1, A-2, A-3, A-4 and A-SB Certificates and the Class A-4FX regular interest to be allocatedpro rata according to their respective Certificate Principal Balances immediately prior to that Distribution Date), in that order. Any realized losses allocated to the Class A-S, B and C regular interests will, in turn, be allocated to the Class A-S, B, C and PEX Certificates as described above in “Allocations and Distributions on the Class A-S, B, C and PEX Certificates”.
The notional amount of the Class X-A Certificates will be reduced by the amount of all losses that are allocated to the Class A-1, A-2, A-3, A-4 or A-SB Certificates or the Class A-4FX or A-S regular interests as write-offs in reduction of their Certificate Principal Balances. The notional amount of the Class X-B Certificates will be reduced by the amount of all losses that are allocated to the Class B and C regular interests as write-offs in reduction of their Certificate Principal Balances.
|
| Debt Service Advances: | The related Master Servicer or, if such Master Servicer fails to do so, the Trustee, will be obligated to advance delinquent debt service payments (other than balloon payments and default interest) and assumed debt service payments on the mortgage loans (including eachpari passu mortgage loan but not its relatedpari passucompanion loans), except to the extent any such advance is deemed non-recoverable from collections on the related mortgage loan. In addition, if an Appraisal Reduction Amount exists for a given mortgage loan, the interest portion of any debt service advance for such mortgage loan will be reduced, which will have the effect of reducing the amount of interest available for distribution to the Certificates in reverse alphabetical order of their Class designations (except that interest payments on the Class A-1, A-2, A-3, A-4, A-SB, X-A and X-B Certificates and the Class A-4FX regular interest would be affected on apari passu basis). |
THE INFORMATION IN THIS STRUCTURAL AND COLLATERAL TERM SHEET IS NOT COMPLETE AND MAY BE AMENDED PRIOR TO THE TIME OF SALE. THIS TERM SHEET IS NOT AN OFFER TO SELL THESE SECURITIES AND IT IS NOT A SOLICITATION OF AN OFFER TO BUY THESE SECURITIES IN ANY JURISDICTION WHERE THE OFFER OR SALE IS NOT PERMITTED.
| 21 |
| Wells Fargo Commercial Mortgage Trust 2015-C29 | Certain Terms and Conditions |
| Servicing Advances: | The related Master Servicer or, if such Master Servicer fails to do so, the Trustee, will be obligated to make servicing advances with respect to each mortgage loan it services, including the payment of delinquent property taxes, insurance premiums and ground rent, except to the extent that those advances are deemed non-recoverable from collections on the related mortgage loan. The master servicer under the WFCM 2015-C28 securitization will have the primary obligation to make any servicing advances with respect to the Brickyard Square loan combination. The master servicer of the WFCM 2015-LC20 securitization will have the primary obligation to make any servicing advances with respect to the Bella Luna / San Lucas loan combination.
|
Appraisal Reduction Amounts: | An Appraisal Reduction Amount generally will be created in the amount, if any, by which the principal balance of a required appraisal loan (which is a mortgage loan with respect to which certain defaults, modifications or insolvency events have occurred as further described in the Free Writing Prospectus) plus other amounts overdue or advanced in connection with such mortgage loan exceeds 90% of the appraised value of the related mortgaged property plus certain escrows and reserves (including letters of credit) held with respect to the mortgage loan.
A mortgage loan will cease to be a required appraisal loan when the same has ceased to be a specially serviced mortgage loan (if applicable), has been brought current for at least three consecutive months and no other circumstances exist that would cause such mortgage loan to be a required appraisal loan.
Appraisal Reduction Amounts will affect the amount of debt service advances on the related mortgage loan. Appraisal Reduction Amounts will also be taken into account in the determination of the identity of the Class whose majority constitutes the “majority subordinate certificateholder” and is entitled to appoint the subordinate class representative. |
Clean-Up Call and Exchange Termination: | On each Distribution Date occurring after the aggregate unpaid principal balance of the mortgage loans is reduced below 1% of the initial aggregate principal balance of the mortgage loans as of the Cut-off Date, certain specified persons will have the option to purchase all of the remaining mortgage loans (and the trust’s interest in all property acquired through exercise of remedies in respect of any mortgage loan) at the price specified in the Free Writing Prospectus. Exercise of the option will terminate the trust and retire the then-outstanding certificates.
If the aggregate Certificate Principal Balances of each of the Class A-1, A-2, A-3, A-4, A-SB, PEX and D Certificates and the Class A-4FX, A-S, B and C regular interests have been reduced to zero, the trust may also be terminated in connection with an exchange of all the then-outstanding certificates, for the mortgage loans and REO properties then remaining in the issuing entity, but all of the holders of those Classes of outstanding certificates would have to voluntarily participate in the exchange.
|
| Liquidation Loan Waterfall: | Following the liquidation of any loan or property, the net liquidation proceeds generally will be applied (after reimbursement of advances and certain trust fund expenses), first, as a recovery of accrued interest, other than delinquent interest that was not advanced as a result of Appraisal Reduction Amounts, second, as a recovery of principal until all principal has been recovered, and then as a recovery of delinquent interest that was not advanced as a result of Appraisal Reduction Amounts. Please see “Description of the Offered Certificates—Distributions—Application of Mortgage Loan Collections” in the Free Writing Prospectus.
|
| Majority Subordinate Certificateholder and Subordinate Class Representative: | A subordinate class representative may be appointed by the “majority subordinate certificate-holder”, which will be the holder(s) of a majority of: (a) during a “subordinate control period”, the most subordinate class among the Class E, F and G Certificates that has a Certificate Principal Balance, as notionally reduced by any Appraisal Reduction Amounts allocable to that class, that is at least equal to 25% of its total initial principal balance and (b) during a “collective consultation period”, the most subordinate class among the Class E, F and G Certificates that has a total principal balance, without regard to Appraisal Reduction Amounts, that is at least equal to 25% of its initial Certificate Principal Balance. The majority subordinate certificateholder will have a continuing right to appoint, remove or replace the subordinate class representative in its sole discretion. This right may be exercised at any time and from time to time. See “Servicing of the Mortgage Loans and Administration of the Trust Fund—The Majority Subordinate Certificateholder and the Subordinate Class Representative” in the Free Writing Prospectus. |
Control and Consultation: |
The rights of various parties to replace each Special Servicer and approve or consult with respect to major actions of each Special Servicer will vary according to defined periods. A “subordinate control period” will exist as long as the Class E Certificates have a Certificate Principal Balance, net of any Appraisal Reduction Amounts allocable to that class, that is not less than 25% of the initial principal balance of that class (unless a senior consultation period is deemed to occur generally or with respect to a particular mortgage loan, pursuant to clause (ii) of the definition of “senior consultation period”). In general, during a subordinate control period, (i) the subordinate class representative will be entitled to grant or withhold approval of asset status reports prepared, |
THE INFORMATION IN THIS STRUCTURAL AND COLLATERAL TERM SHEET IS NOT COMPLETE AND MAY BE AMENDED PRIOR TO THE TIME OF SALE. THIS TERM SHEET IS NOT AN OFFER TO SELL THESE SECURITIES AND IT IS NOT A SOLICITATION OF AN OFFER TO BUY THESE SECURITIES IN ANY JURISDICTION WHERE THE OFFER OR SALE IS NOT PERMITTED.
| 22 |
| Wells Fargo Commercial Mortgage Trust 2015-C29 | Certain Terms and Conditions |
| and material servicing actions proposed, by either Special Servicer, and (ii) the majority subordinate certificateholder, or the subordinate class representative on its behalf, will be entitled to terminate and replace each Special Servicer with or without cause, and appoint itself or another person as the applicable successor special servicer (other than with respect to the Brickyard Square and Bella Luna / San Lucas loan combinations). It will be a condition to such appointment that Fitch, KBRA and Moody's confirm that the appointment would not result in a qualification, downgrade or withdrawal of any of their then-current ratings of certificates. A "collective consultation period” will exist as long as the Class E Certificates have a Certificate Principal Balance that both (i) as notionally reduced by any Appraisal Reduction Amounts allocable to that class, is less than 25% of its initial principal balance and (ii) without regard to any Appraisal Reduction Amounts allocable to that class, is 25% or more of its initial Certificate Principal Balance (unless a senior consultation period is deemed to occur generally or with respect to a particular mortgage loan, pursuant to clause (ii) of the definition of "senior consultation period”). In general, during a collective consultation period, each Special Servicer will be required to consult with the Trust Advisor (in addition to the subordinate class representative, during a collective consultation period) in connection with asset status reports and material special servicing actions. A “senior consultation period” will exist as long as either (i) the Class E certificates have an aggregate principal balance, without regard to any Appraisal Reduction Amounts allocable to that class, that is less than 25% of its initial principal balance or (ii) during such time as the Class E certificates are the most subordinate class of control-eligible certificates that have a then outstanding principal balance, net of Appraisal Reduction Amounts, at least equal to 25% of its initial principal balance, the then-majority subordinate certificateholder has irrevocably waived its right to appoint a subordinate class representative and to exercise any of the rights of the majority subordinate certificateholder or cause the exercise of the rights of the subordinate class representative and such rights have not been reinstated to a successor majority subordinate certificateholder as set forth in the pooling and servicing agreement. In general, during a senior consultation period, each Special Servicer must seek to consult with the Trust Advisor in connection with asset status reports and material special servicing actions, and, in general, no subordinate class representative will be recognized or have any right to terminate either Special Servicer or approve, direct or consult with respect to servicing matters. Notwithstanding any contrary description set forth above, with respect to the Brickyard Square mortgage loan and the Bella Luna / San Lucas mortgage loan, in general the related loan combination will be serviced under the WFCM 2015-C28 pooling and servicing agreement and WFCM 2015-LC20 pooling and servicing agreement, respectively, which grant to the related subordinate class representative control rights that include the right to approve or disapprove various material servicing actions involving the related loan combination but the subordinate class representative for this securitization will nonetheless have the right to be consulted on a non-binding basis with respect to such actions. For purposes of the servicing of the Brickyard Square loan combination and the Bella Luna / San Lucas loan combination, the occurrence and continuance of a collective consultation period or senior consultation period with respect to the subordinate class representative under this securitization will not limit the control or other rights of the subordinate class representative under the WFCM 2015-C28 or WFCM 2015-LC20 securitization, respectively, and any collective consultation period or senior consultation period or similar period under the WFCM 2015-C28 or WFCM 2015-LC20 securitization, respectively, will not limit the consultation rights of the subordinate class representative under this securitization. In general, loan combination control rights also include the right, in certain circumstances, to direct the replacement of the applicable special servicer for the related loan combination only. | |
| Replacement of Special Servicer by General Vote of Certificateholders: | During any ”collective consultation period” or “senior consultation period”, each Special Servicer may be terminated and replaced upon the affirmative direction of certificate owners holding not less than 75% of the appraisal-reduced voting rights of all certificates, following a proposal from certificate owners holding not less than 25% of the appraisal-reduced voting rights of all certificates. The certificateholders who initiate a vote on a termination and replacement of either Special Servicer without cause must cause Fitch, KBRA and Moody’s to confirm the then-current ratings of the certificates (or decline to review the matter) and cause the payment of the fees and expenses incurred in the replacement. |
| Appraisal Remedy: | Solely for purposes of determining whether a “subordinate control period” is in effect, whenever either Special Servicer obtains an appraisal or updated appraisal under the pooling and servicing agreement, the subordinate class representative, with respect to the mortgage loans serviced by either Special Servicer will have the right (at its or their expense) to direct such Special Servicer to hire a qualified appraiser to prepare a second appraisal of the mortgaged property. The applicable Special Servicer must thereafter determine whether, based on its assessment of such second appraisal, any recalculation of the Appraisal Reduction Amount is warranted. The Appraisal Reduction Amount, whether based on the first or the second appraisal, will become effective following the second appraisal, except that the Appraisal Reduction Amount based on the first |
THE INFORMATION IN THIS STRUCTURAL AND COLLATERAL TERM SHEET IS NOT COMPLETE AND MAY BE AMENDED PRIOR TO THE TIME OF SALE. THIS TERM SHEET IS NOT AN OFFER TO SELL THESE SECURITIES AND IT IS NOT A SOLICITATION OF AN OFFER TO BUY THESE SECURITIES IN ANY JURISDICTION WHERE THE OFFER OR SALE IS NOT PERMITTED.
| 23 |
| Wells Fargo Commercial Mortgage Trust 2015-C29 | Certain Terms and Conditions |
| appraisal shall become effective if the subordinate class representative declines to demand a second appraisal within a specified number of business days, or if a second appraisal is not received within 90 days after the direction of the subordinate class representative. In addition, for the same purposes, if there is a material change in the mortgaged property securing any mortgage loan for which an Appraisal Reduction Amount has been calculated, the majority certificateholder of the Class E, F or G Certificates or other designated certificateholders will be entitled (at its expense) to present an additional appraisal to such Special Servicer, which will generally be required to recalculate the Appraisal Reduction Amount based upon such additional appraisal. This latter right may not be exercised more frequently than once in any 12-month period for each mortgage loan for which an Appraisal Reduction Amount was calculated and can only be exercised during a subordinate control period or a collective consultation period as further described in the Free Writing Prospectus. | |
| Sale of Defaulted Assets: | There will be no “fair value” purchase option. Instead, the pooling and servicing agreement will authorize each Special Servicer to sell defaulted mortgage loans serviced by such Special Servicer to the highest bidder in a manner generally similar to sales of REO properties. The sale of a defaulted loan (other than the Brickyard Square mortgage loan and the Bella Luna / San Lucas mortgage loan) for less than par plus accrued interest and certain other fees and expenses owed on the loan will be subject to consent or consultation rights of the subordinate class representative and/or Trust Advisor.
In the case of the Brickyard Square mortgage loan, pursuant to the related intercreditor agreement and the WFCM 2015-C28 pooling and servicing agreement, the WFCM 2015-C28 special servicer may offer to sell to any person (or may offer to purchase) for cash the related loan combination during such time as the related pari passu companion loan constitutes a defaulted mortgage loan under the WFCM 2015-C28 pooling and servicing agreement, and, in connection with any such sale, the WFCM 2015-C28 special servicer is required to sell both the applicable mortgage loan and the related pari passu companion loan as a whole loan. The subordinate class representative for this securitization will have consultation rights as the holder of an interest in the related pari passu mortgage loan, as described in the Free Writing Prospectus.
In the case of the Bella Luna / San Lucas mortgage loan, pursuant to the related intercreditor agreement and the WFCM 2015-LC20 pooling and servicing agreement, the WFCM 2015-LC20 special servicer may offer to sell to any person (or may offer to purchase) for cash the related loan combination during such time as the related pari passu companion loan constitutes a defaulted mortgage loan under the WFCM 2015-LC20 pooling and servicing agreement, and, in connection with any such sale, the WFCM 2015-LC20 special servicer is required to sell both the applicable mortgage loan and the related pari passu companion loan as a whole loan. The subordinate class representative for this securitization will have consultation rights as the holder of an interest in the related pari passu mortgage loan, as described in the Free Writing Prospectus.
|
| “As-Is” Appraisals: | Appraisals must be conducted on an “as-is” basis, and must be no more than 9 months old, for purposes of determining Appraisal Reduction Amounts, market value in connection with REO sales, etc. Required appraisals may consist of updates of prior appraisals. Internal valuations by the applicable Special Servicer are permitted if the principal balance of a mortgage loan is less than $2,000,000.
|
| Trust Advisor: | The Trust Advisor will perform certain review duties that will generally include a limited annual review of and report regarding each Special Servicer to the Certificate Administrator. The review and report generally will be based on: (a) during a collective consultation period or senior consultation period, any asset status reports and additional information delivered to the Trust Advisor by either Special Servicer with respect to any mortgage loan serviced by such Special Servicer, and/or (b) during a senior consultation period, in addition to the applicable information described above, a meeting with each Special Servicer to conduct a limited review of such Special Servicer’s operational practices on a platform basis in light of the servicing standard. In addition, during any collective consultation period or senior consultation period, each Special Servicer must seek to consult with the Trust Advisor (in addition to the subordinate class representative during a collective consultation period) in connection with material special servicing actions with respect to specially serviced mortgage loans serviced by such Special Servicer. Furthermore, under certain circumstances, but only during a senior consultation period, the Trust Advisor may recommend the replacement of the Special Servicer, in which case the Certificate Administrator will deliver notice of such recommendation to the certificateholders, and certificateholders with specified percentages of the voting rights may direct the replacement of such Special Servicer at their expense. |
THE INFORMATION IN THIS STRUCTURAL AND COLLATERAL TERM SHEET IS NOT COMPLETE AND MAY BE AMENDED PRIOR TO THE TIME OF SALE. THIS TERM SHEET IS NOT AN OFFER TO SELL THESE SECURITIES AND IT IS NOT A SOLICITATION OF AN OFFER TO BUY THESE SECURITIES IN ANY JURISDICTION WHERE THE OFFER OR SALE IS NOT PERMITTED.
| 24 |
| Wells Fargo Commercial Mortgage Trust 2015-C29 | Certain Terms and Conditions |
| The Trust Advisor may be removed and replaced without cause upon the affirmative direction of certificates owners holding not less than 75% of the appraisal-reduced voting rights of all certificates, following a proposal from certificate owners holding not less than 25% of the appraisal-reduced voting rights of all certificates. The certificateholders who initiate a vote on a termination and replacement of the Trust Advisor without cause must cause Fitch, KBRA and Moody’s to confirm the then-current ratings of the certificates (or decline to review the matter) and cause the payment of the fees and expenses incurred in the replacement. During any “subordinate control period”, the proposed replacement trust advisor will be subject to the subordinate class representative’s consent (such consent not to be unreasonably withheld). If a proposed termination and replacement of the Trust Advisor is not consummated within 180 days following the initial request of the certificateholders who requested a vote, the proposed termination and replacement shall have no further force or effect. The Trust Advisor generally may be discharged from its duties if and when the Class A-1, A-2, A-3, A-4, A-4FL, A-4FX, A-SB, A-S, B, C, PEX and D Certificates are retired. | |
| Certain Fee Offsets: | If a workout fee is earned by either Special Servicer following a loan default with respect to any mortgage loan that it services, then certain limitations will apply to the collection and retention of a modification fee from the borrower. The modification fee generally must not exceed 1% of the principal balance of the loan as modified. In addition, if the loan re-defaults within a specified period of months and other conditions are satisfied, any subsequent workout or liquidation fee on that loan must be reduced by a portion of the previously-collected modification fee. Furthermore, workout fees, liquidation fees and modification fees collected with respect to any workout, liquidation and/or partial liquidation of a mortgage loan or loan combination that is serviced by a Special Servicer will be subject to an aggregate cap equal to the greater of (i) $1,000,000 and (ii) 1.00% of the stated principal balance of the subject mortgage loan or loan combination. |
| Deal Website: | The Certificate Administrator will be required to maintain a deal website which will include, among other items: (a) summaries of asset status reports prepared by each Special Servicer, (b) inspection reports, (c) appraisals, (d) various “special notices” described in the Free Writing Prospectus, (e) the “Investor Q&A Forum” and (f) a voluntary “Investor Registry”. Investors may access the deal website following execution of a certification and confidentiality agreement. |
| Initial Majority Subordinate Certificateholder: | It is expected that DoubleLine Capital L.P. or an affiliate will be the initial majority subordinate certificateholder.
|
| Loan Combinations: | Each of the mortgaged properties identified on Annex A-1 to the Free Writing Prospectus as Brickyard Square and Bella Luna / San Lucas secures both a mortgage loan to be included in the trust fund and one or more other mortgage loans that will not be included in the trust fund, which will bepari passuin right of payment with the trust mortgage loan. The Brickyard Square loan combination will be serviced under the pooling and servicing agreement for the WFCM 2015-C28 securitization. The Bella Luna / San Lucas loan combination will be serviced under the pooling and servicing agreement for the WFCM 2015-LC20 securitization.
As of the closing date, thepari passu companion loans in such loan combinations will be held by the parties identified above under “IV. Characteristics of the Mortgage Pool—B. Summary ofPari Passu Loan Combinations”. |
THE INFORMATION IN THIS STRUCTURAL AND COLLATERAL TERM SHEET IS NOT COMPLETE AND MAY BE AMENDED PRIOR TO THE TIME OF SALE. THIS TERM SHEET IS NOT AN OFFER TO SELL THESE SECURITIES AND IT IS NOT A SOLICITATION OF AN OFFER TO BUY THESE SECURITIES IN ANY JURISDICTION WHERE THE OFFER OR SALE IS NOT PERMITTED.
| 25 |
HUTCHINSON METRO CENTER I |
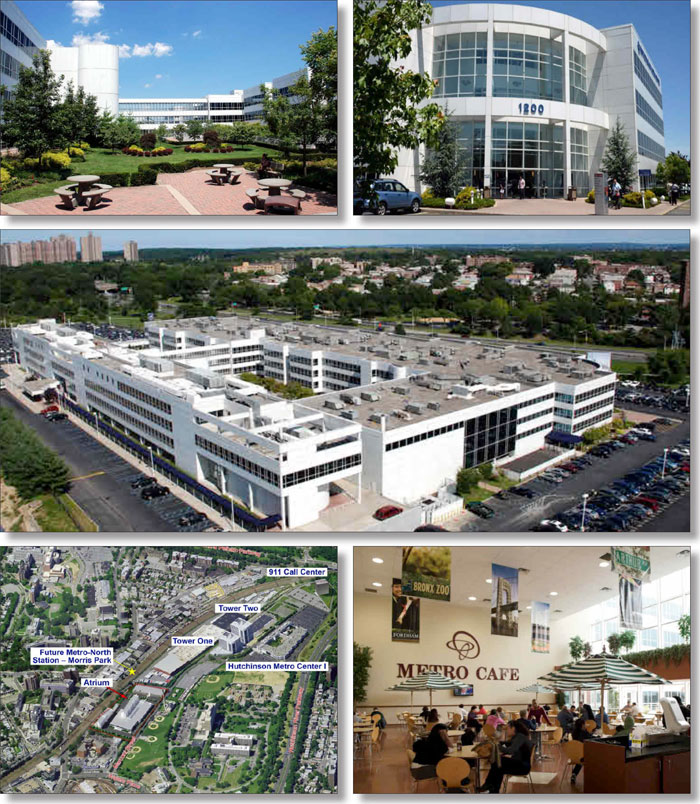
THE INFORMATION IN THIS STRUCTURAL AND COLLATERAL TERM SHEET IS NOT COMPLETE AND MAY BE AMENDED PRIOR TO THE TIME OF SALE. THIS TERM SHEET IS NOT AN OFFER TO SELL THESE SECURITIES AND IT IS NOT A SOLICITATION OF AN OFFER TO BUY THESE SECURITIES IN ANY JURISDICTION WHERE THE OFFER OR SALE IS NOT PERMITTED.
| 26 |
HUTCHINSON METRO CENTER I |
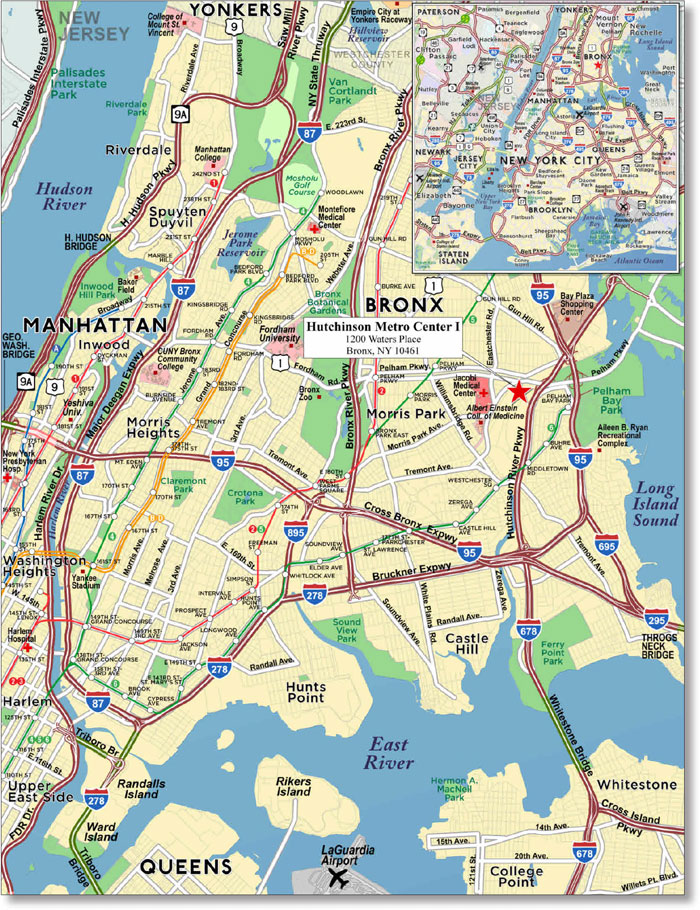
THE INFORMATION IN THIS STRUCTURAL AND COLLATERAL TERM SHEET IS NOT COMPLETE AND MAY BE AMENDED PRIOR TO THE TIME OF SALE. THIS TERM SHEET IS NOT AN OFFER TO SELL THESE SECURITIES AND IT IS NOT A SOLICITATION OF AN OFFER TO BUY THESE SECURITIES IN ANY JURISDICTION WHERE THE OFFER OR SALE IS NOT PERMITTED.
| 27 |
| No. 1 – Hutchinson Metro Center I | |||||||
| Loan Information | Property Information | ||||||
| Mortgage Loan Seller: | Wells Fargo Bank, National Association | Single Asset/Portfolio: | Single Asset | ||||
Credit Assessment (Fitch/KBRA/Moody's): | NR/NR/NR | Property Type: | Office | ||||
| Original Principal Balance: | $100,000,000 | Specific Property Type: | Suburban | ||||
| Cut-off Date Principal Balance: | $100,000,000 | Location: | Bronx, NY | ||||
| % of Initial Pool Balance: | 8.5% | Size: | 422,452 SF | ||||
| Loan Purpose: | Refinance | Cut-off Date Principal Balance Per SF: | $236.71 | ||||
| Borrower Name: | Hutch Metro Center I LLC | Year Built/Renovated: | 1974/2006 | ||||
| Sponsor: | Joseph Simone | Title Vesting: | Fee | ||||
| Mortgage Rate: | 4.200% | Property Manager: | Self-managed | ||||
| Note Date: | May 12, 2015 | 3rd Most Recent Occupancy (As of): | 99.4% (12/31/2012) | ||||
| Anticipated Repayment Date: | NAP | 2nd Most Recent Occupancy (As of): | 100.0% (12/31/2013) | ||||
| Maturity Date: | June 11, 2025 | Most Recent Occupancy (As of): | 99.7% (12/31/2014) | ||||
| IO Period: | 36 months | Current Occupancy (As of)(2): | 100.0% (4/1/2015) | ||||
| Loan Term (Original): | 120 months | ||||||
| Seasoning: | 0 months | Underwriting and Financial Information: | |||||
| Amortization Term (Original): | 360 months | ||||||
| Loan Amortization Type: | Interest-only, Amortizing Balloon | 3rdMost Recent NOI (As of): | $8,953,898 (12/31/2012) | ||||
| Interest Accrual Method: | Actual/360 | 2ndMost Recent NOI (As of): | $9,155,415 (12/31/2013) | ||||
| Call Protection: | L(24),D(92),O(4) | Most Recent NOI (As of): | $9,280,842 (12/31/2014) | ||||
| Lockbox Type: | Hard/Upfront Cash Management | ||||||
| Additional Debt: | None | ||||||
| Additional Debt Type: | NAP | ||||||
| U/W Revenues: | $16,203,748 | ||||||
| U/W Expenses: | $7,070,708 | ||||||
| U/W NOI: | $9,133,039 | ||||||
| Escrows and Reserves(1): | U/W NCF: | $8,228,451 | |||||
| U/W NOI DSCR: | 1.56x | ||||||
| Type: | Initial | Monthly | Cap (If Any) | U/W NCF DSCR: | 1.40x | ||
| Taxes | $229,840 | $42,338 | NAP | U/W NOI Debt Yield: | 9.1% | ||
| Insurance | $0 | Springing | NAP | U/W NCF Debt Yield: | 8.2% | ||
| Replacement Reserves | $0 | $8,801 | NAP | As-Is Appraised Value: | $142,000,000 | ||
| TI/LC Reserve | $0 | $49,286 | $1,500,000 | As-Is Appraisal Valuation Date: | April 1, 2015 | ||
| Deferred Maintenance | $49,688 | $0 | NAP | Cut-off Date LTV Ratio: | 70.4% | ||
| Visiting Nurse Reserve | $2,000,000 | $0 | NAP | LTV Ratio at Maturity or ARD: | 61.2% | ||
| (1) | See “Escrows” section. |
| (2) | Current Occupancy includes the Visiting Nurse Service of NY space (55,859 square feet; 13.2% of net rentable area). Visiting Nurse Service of NY did not deliver notice of renewal prior to its notice date of November 30, 2014 and its lease is scheduled to expire on November 30, 2015. Current Occupancy excluding this tenant is 86.8%. See “Historical Occupancy” and “Cash Flow Analysis” sections. |
The Mortgage Loan.The mortgage loan (the “Hutchinson Metro Center I Mortgage Loan”) is evidenced by a single promissory note that is secured by a first mortgage encumbering an office building located in the Bronx, New York (the “Hutchinson Metro Center I Property”). The Hutchinson Metro Center I Mortgage Loan was originated on May 12, 2015 by Wells Fargo Bank, National Association. The Hutchinson Metro Center I Mortgage Loan had an original principal balance of $100,000,000, has an outstanding principal balance as of the Cut-off Date of $100,000,000 and accrues interest at an interest rate of 4.200%per annum. The Hutchinson Metro Center I Mortgage Loan had an initial term of 120 months, has a remaining term of 120 months as of the Cut-off Date and requires interest-only payments for the first 36 payments following origination and, thereafter, requires payments of principal and interest based on a 30-year amortization schedule. The Hutchinson Metro Center I Mortgage Loan matures on June 11, 2025.
Following the lockout period, the borrower has the right to defease the Hutchinson Metro Center I Mortgage Loan in whole, but not in part, on any date before March 11, 2025. In addition, the Hutchinson Metro Center I Mortgage Loan is prepayable without penalty on or after March 11, 2025.
THE INFORMATION IN THIS STRUCTURAL AND COLLATERAL TERM SHEET IS NOT COMPLETE AND MAY BE AMENDED PRIOR TO THE TIME OF SALE. THIS TERM SHEET IS NOT AN OFFER TO SELL THESE SECURITIES AND IT IS NOT A SOLICITATION OF AN OFFER TO BUY THESE SECURITIES IN ANY JURISDICTION WHERE THE OFFER OR SALE IS NOT PERMITTED.
| 28 |
HUTCHINSON METRO CENTER I |
Sources and Uses
| Sources | Uses | |||||||
| Original loan amount | $100,000,000 | 100.0% | Loan payoff(1) | $80,035,665 | 80.0% | |||
| Reserves | 2,279,508 | 2.3 | ||||||
| Closings costs | 1,260,620 | 1.3 | ||||||
| Return of equity | 16,424,207 | 16.4 | ||||||
| Total Sources | $100,000,000 | 100.0% | Total Uses | $100,000,000 | 100.0% |
| (1) | The Hutchinson Metro Center I Property was previously securitized in the JPMCC 2005-LDP2 transaction. |
The Property.The Hutchinson Metro Center I Property is a four-story, class A office building totaling 422,452 square feet located in the Westchester Heights section of the Bronx, New York, approximately 9.4 miles northeast of Manhattan. The Hutchinson Metro Center I Property is part of the larger Hutchinson Metro Center Complex, a 42.0-acre suburban style campus comprised of four class A office buildings (including the Hutchinson Metro Center I Property) totaling approximately 1.3 million square feet that is approximately 100.0% leased. Built in 1974, the Hutchinson Metro Center I Property was extensively renovated from 2002 through 2006 at a cost of approximately $41.6 million. Amenities available to tenants at the Hutchinson Metro Center I Property include two fitness centers, two child care centers, a landscaped courtyard, a teleconference center, a sundry shop, restaurants, a cafeteria and convenient access to public transportation (including free shuttle service). Further, the Metropolitan Transit Authority is planning a new Metro North train station adjacent to the Hutchinson Metro Center I Property, which will provide direct access to Penn Station in Manhattan and to Connecticut. Parking for the Hutchinson Metro Center I Property is provided by 409 surface parking spaces on the Hutchinson Metro Center I Property, and additional parking for 1,432 vehicles is provided via two parking garages and multiple surface lots in the Hutchinson Metro Center Complex, equating to a parking ratio of 3.4 spaces per 1,000 square feet of rentable area.
The Hutchinson Metro Center I Property has averaged 98.3% occupancy since 2008, ranging from 96.6% in 2008 to 100.0% currently. The largest tenant, Mercy College, is a four-year private institution founded by the Sisters of Mercy with a total enrollment of approximately 11,272 students. The Bronx campus is the only location with a child care center and is the home of the popular physicians assistant program. As of April 1, 2015, the Hutchinson Metro Center I Property was 100.0% leased by 25 tenants (see “Historical Occupancy” and “Cash Flow Analysis” section). Visting Nurse Service of NY (55,859 square feet; 13.2% of net rentable area) did not deliver notice of renewal prior to its notice date of November 30, 2014 and its lease is scheduled to expire on November 30, 2015. Current Occupancy excluding Visiting Nurse Service of NY is 86.8%.
The following table presents certain information relating to the tenancy at the Hutchinson Metro Center I Property:
Major Tenants
| Tenant Name | Credit Rating (Fitch/Moody’s/ S&P)(1) | Tenant NRSF | % of NRSF | Annual U/W Base Rent PSF(2) | Annual U/W Base Rent(2) | % of Total Annual U/W Base Rent | Lease Expiration Date |
| Major Tenants | |||||||
| Mercy College | NR/NR/A | 125,522 | 29.7% | $31.41 | $3,942,646 | 27.4% | 2/27/2024 |
| Administration of Childrens Services | AA/Aa2/AA | 63,462 | 15.0% | $40.64(3) | $2,579,046(3) | 17.9% | 3/31/2027(4) |
| NYC Housing Authority | AA/Aa2/AA | 62,977 | 14.9% | $30.39(5) | $1,913,842(5) | 13.3% | 3/31/2026(6) |
| Visiting Nurse Service of NY | NR/NR/NR | 55,859 | 13.2% | $30.27 | $1,690,766 | 11.8% | 11/30/2015(7) |
| University Diagnostic Medical Imaging, PC | NR/NR/NR | 20,000 | 4.7% | $37.20 | $744,000 | 5.2% | 6/30/2025 |
| Total Major Tenants | 327,820 | 77.6% | $33.16 | $10,870,300 | 75.6% | ||
| Non-Major Tenants | 94,632 | 22.4% | $37.07 | $3,507,760 | 24.4% | ||
| Occupied Collateral Total | 422,452 | 100.0% | $34.03 | $14,378,060 | 100.0% | ||
| Vacant Space | 0 | 0.0% | |||||
| Collateral Total | 422,452 | 100.0% | |||||
| (1) | Certain ratings are those of the parent company whether or not the parent company guarantees the lease. |
| (2) | Annual U/W Base Rent PSF and Annual U/W Base Rent include contractual rent steps through May 2016 totaling $394,687. |
| (3) | The Annual U/W Base Rent and Annual U/W Base Rent PSF for Administration of Childrens Services represent the tenant’s average rent over the loan term. The tenant’s current in-place annual rent is $2,319,536 ($36.55 per square foot). |
| (4) | Administration of Childrens Services has the right to terminate its lease on March 15, 2018 by providing 12 months’ written notice with payment of a termination fee equal to $3,005,560 ($47.36 per square foot) and on March 15, 2020 by providing 12 months’ written notice with payment of a termination fee equal to $1,882,283 ($29.66 per square foot). |
| (5) | The Annual U/W Base Rent and Annual U/W Base Rent PSF for NYC Housing Authority represent the tenant’s average rent over the loan term. The tenant’s current in-place annual rent is $1,826,333 ($29.00 per square foot). |
| (6) | NYC Housing Authority has a one-time right to terminate its lease on November 30, 2020 by providing 12 months’ written notice with payment of a termination fee equal to $1,952,287 ($31.00 per square foot). |
| (7) | Visiting Nurse Service of NY did not deliver notice of renewal prior to its notice date of November 30, 2014 and its lease is scheduled to expire on November 30, 2015. See “Cash Flow Analysis” section. |
THE INFORMATION IN THIS STRUCTURAL AND COLLATERAL TERM SHEET IS NOT COMPLETE AND MAY BE AMENDED PRIOR TO THE TIME OF SALE. THIS TERM SHEET IS NOT AN OFFER TO SELL THESE SECURITIES AND IT IS NOT A SOLICITATION OF AN OFFER TO BUY THESE SECURITIES IN ANY JURISDICTION WHERE THE OFFER OR SALE IS NOT PERMITTED.
| 29 |
| HUTCHINSON METRO CENTER I |
The following table presents certain information relating to the lease rollover schedule at the Hutchinson Metro Center I Property:
Lease Expiration Schedule(1)(2)
Year Ending December 31, | No. of Leases Expiring | Expiring NRSF | % of Total NRSF | Cumulative Expiring NRSF | Cumulative % of Total NRSF | Annual U/W Base Rent | Annual U/W Base Rent PSF(3) |
| MTM | 2 | 3,850 | 0.9% | 3,850 | 0.9% | $140,536 | $36.50 |
| 2015 | 6 | 61,185 | 14.5% | 65,035 | 15.4% | $1,892,978 | $30.94 |
| 2016 | 4 | 28,956 | 6.9% | 93,991 | 22.2% | $912,791 | $31.52 |
| 2017 | 0 | 0 | 0.0% | 93,991 | 22.2% | $0 | $0.00 |
| 2018 | 3 | 6,875 | 1.6% | 100,866 | 23.9% | $256,826 | $37.36 |
| 2019 | 5 | 9,564 | 2.3% | 110,430 | 26.1% | $382,799 | $40.02 |
| 2020 | 0 | 0 | 0.0% | 110,430 | 26.1% | $0 | $0.00 |
| 2021 | 2 | 6,500 | 1.5% | 116,930 | 27.7% | $260,195 | $40.03 |
| 2022 | 3 | 9,824 | 2.3% | 126,754 | 30.0% | $385,595 | $39.25 |
| 2023 | 0 | 0 | 0.0% | 126,754 | 30.0% | $0 | $0.00 |
| 2024 | 4 | 142,522 | 33.7% | 269,276 | 63.7% | $4,646,709 | $32.60 |
| 2025 | 3 | 26,737 | 6.3% | 296,013 | 70.1% | $1,006,743 | $37.65 |
| Thereafter | 2 | 126,439 | 29.9% | 422,452 | 100.0% | $4,492,888 | $35.53 |
| Vacant | 0 | 0 | 0.0% | 422,452 | 100.0% | $0 | $0.00 |
| Total/Weighted Average | 34 | 422,452 | 100.0% | $14,378,060 | $34.03 |
| (1) | Information obtained from the underwritten rent roll. |
| (2) | Certain tenants may have lease termination options that are exercisable prior to the originally stated expiration date of the subject lease and that are not considered in the Lease Expiration Schedule. |
| (3) | Weighted Average Annual U/W Base Rent PSF excludes vacant space. |
The following table presents historical occupancy percentages at the Hutchinson Metro Center I Property:
Historical Occupancy
12/31/2012(1) | 12/31/2013(1) | 12/31/2014(1) | 4/1/2015(2) |
| 99.4% | 100.0% | 99.7% | 100.0% |
| (1) | Information obtained from the borrower. |
| (2) | Information obtained from the underwritten rent roll. Current Occupancy includes the Visiting Nurse Service of NY space (55,859 square feet; 13.2% of net rentable area). Visiting Nurse Service of NY did not deliver notice of renewal prior to its notice date of November 30, 2014 and its lease is scheduled to expire on November 30, 2015. Current occupancy excluding this tenant is 86.8%. |
THE INFORMATION IN THIS STRUCTURAL AND COLLATERAL TERM SHEET IS NOT COMPLETE AND MAY BE AMENDED PRIOR TO THE TIME OF SALE. THIS TERM SHEET IS NOT AN OFFER TO SELL THESE SECURITIES AND IT IS NOT A SOLICITATION OF AN OFFER TO BUY THESE SECURITIES IN ANY JURISDICTION WHERE THE OFFER OR SALE IS NOT PERMITTED.
| 30 |
| HUTCHINSON METRO CENTER I |
Operating History and Underwritten Net Cash Flow. The following table presents certain information relating to the historical operating performance and underwritten net cash flow at the Hutchinson Metro Center I Property:
Cash Flow Analysis
| 2012 | 2013 | 2014 | U/W(1) | % of U/W Effective Gross Income | U/W $ per SF | |
| Base Rent | $12,756,516 | $13,433,672 | $13,786,657(2) | $14,378,060(2) | 88.7% | $34.03 |
| Grossed Up Vacant Space | 0 | 0 | 0 | 0 | 0.0 | 0.00 |
| Total Reimbursables | 1,211,037 | 1,107,213 | 1,322,401 | 2,478,374 | 15.3 | 5.87 |
| Other Income | 29,645 | 34,407 | 66,217 | 66,217 | 0.4 | 0.16 |
| Less Vacancy & Free Rent | 0 | 0 | 0 | (718,903)(3) | (4.4) | (1.70) |
| Effective Gross Income | $13,997,198 | $14,575,291 | $15,175,275 | $16,203,748 | 100.0% | $38.36 |
| Total Operating Expenses | $5,043,300 | $5,419,876 | $5,894,432 | $7,070,708(4) | 43.6% | $16.74 |
| Net Operating Income | $8,953,898 | $9,155,415 | $9,280,842 | $9,133,039 | 56.4% | $21.62 |
| TI/LC | 0 | 0 | 0 | 798,975 | 4.9 | 1.89 |
| Capital Expenditures | 0 | 0 | 0 | 105,613 | 0.7 | 0.25 |
| Net Cash Flow | $8,953,898 | $9,155,415 | $9,280,842 | $8,228,451 | 50.8% | $19.48 |
| NOI DSCR | 1.53x | 1.56x | 1.58x | 1.56x | ||
| NCF DSCR | 1.53x | 1.56x | 1.58x | 1.40x | ||
| NOI DY | 9.0% | 9.2% | 9.3% | 9.1% | ||
| NCF DY | 9.0% | 9.2% | 9.3% | 8.2% |
| (1) | Visiting Nurse Service of NY did not deliver notice of renewal prior to its notice date of November 30, 2014 and its lease is scheduled to expire on November 30, 2015. Current occupancy excluding this tenant is 86.8%, the NOI DSCR and NCF DSCR are 1.36x and 1.21x, respectively, and the NOI DY and NCF DY are 8.0% and 7.1%, respectively. A $2.0 million reserve was taken for this space, which equates to $35.80 per square foot of Visiting Nurse Service of NY space, or approximately one year of current base rent and reimbursements. |
| (2) | The increase from 2014 to U/W Base Rent is due to rent averaging for two investment-grade rated tenants and contractual rent steps through May 2016 totaling $394,687, along with contractual rent increases that occurred in late 2014 and early 2015.. |
| (3) | The underwritten economic vacancy is 5.0%. The Hutchinson Metro Center I Property was 100.0% physically occupied as of April 1, 2015. |
| (4) | The Hutchinson Metro Center I Property benefits from an Industrial and Commercial Incentive Program (“ICIP”), which results in a reduced property tax expense. The estimated unabated property tax expense for the 2015/2016 assessment year was $2,654,593. The ICIP expires in 2029 and is currently being phased out. The U/W property tax expense of $1,354,875 is based on the unabated tax expense for the 2015 calendar year, less the average benefit of the abatement over the Hutchinson Metro Center I Mortgage Loan term. The taxes are projected to increase from the current level to $2,792,875 by the time the Hutchinson Metro Center I Mortgage Loan matures. According to the leases, most tax increases may be passed through to the tenants (over a base-year stop) at the Hutchinson Metro Center I Property. |
Appraisal.As of the appraisal valuation date of April 1, 2015, the Hutchinson Metro Center I Property had an “as-is” appraised value of $142,000,000.
Environmental Matters.According to the Phase I environmental report dated April 2, 2015, there was no evidence of any recognized environmental conditions at the Hutchinson Metro Center I Property.
Market Overview and Competition. The Hutchinson Metro Center I Property is located in the Westchester Heights section of the Bronx, New York, approximately 9.4 miles northeast of Manhattan, along the Hutchinson River Parkway, a north-south parkway connecting the Bronx to Greenwich, Connecticut to the north. The Hutchinson Metro Center I Property is part of the larger Hutchinson Metro Center Complex, a 42.0-acre suburban style campus comprised of four class A office buildings (including the Hutchinson Metro Center I Property) totaling approximately 1.3 million square feet that is approximately 100.0% leased. The Hutchinson Metro Center Complex is comprised of (i) the Hutchinson Metro Center I Property, (ii) the 13-story, 284,979 square-foot multi-tenant 1250 Waters Place Tower One completed in 2008 and 100.0% leased, (iii) the 11-story, 278,133 square-foot 1250 Waters Place Tower Two, completed in 2014 and 100.0% leased to Montefiore Medical Center through September 2030, and (iv) the three-story, 360,000 square-foot mixed-use Hutch Metro Atrium, which features office and medical office space, along with an LA Fitness and restaurants. Further, a new 125-room Marriott Residence Inn Hotel opened in May 2015 within the Hutchinson Metro Center Complex. There are also a significant number of hospital and institutional health service uses within the Westchester Heights area, including Calvary Hospital, Albert Einstein Medical Center, Montefiore Medical Center, Jacobi Medical Center, and the Bronx Psychiatric Center, all located within five miles of the Hutchinson Metro Center I Property. The Hutchinson Metro Center I Property is serviced by the Number Six (Lexington Avenue/Pelham) subway line at Westchester Square (1.0 mile south), which is connected to Hutchinson Metro Center I Property by a free shuttle service and various bus lines. As of 2014, the estimated population within a three- and five-mile radius of the Hutchinson Metro Center I Property was 707,650 and 1,689,210, respectively and the average household income within the same radii was $48,925 and $49,817, respectively.
According to a third party market research report, the Hutchinson Metro Center I Property is located in the Bronx office submarket of the Westchester/Southen Connecticut office market. The Bronx office submarket contained approximately 10.2 million square feet of office space in 424 buildings exhibiting a direct vacancy rate of 11.3% as of first quarter 2015. According to the appraisal, the class A Bronx office submarket contained 2.4 million square feet (23.9% of the overall Bronx submarket), exhibiting a vacancy rate of 3.8% as of April 9, 2015 with a current quoted rental rate of $36.42 per square foot, gross. The appraiser concluded to gross rents of $40.00 per square foot for space less than 3,000 square feet, $38.00 per square foot for space greater than 3,000 square feet but less than 10,000 square feet and $36.00 per square foot for office space greater than 10,000 square feet.
THE INFORMATION IN THIS STRUCTURAL AND COLLATERAL TERM SHEET IS NOT COMPLETE AND MAY BE AMENDED PRIOR TO THE TIME OF SALE. THIS TERM SHEET IS NOT AN OFFER TO SELL THESE SECURITIES AND IT IS NOT A SOLICITATION OF AN OFFER TO BUY THESE SECURITIES IN ANY JURISDICTION WHERE THE OFFER OR SALE IS NOT PERMITTED.
| 31 |
| HUTCHINSON METRO CENTER I |
The following table presents certain information relating to comparable office properties for the Hutchinson Metro Center I Property:
Competitive Set(1)
Hutchinson (Subject) | Concourse Plaza | 1776 Eastchester Road | Hutchinson Metro Center – Tower II | Hutchinson Metro Center – Tower I | Banknote Building | Fordham Plaza | |
| Location | Bronx, NY | Bronx, NY | Bronx, NY | Bronx, NY | Bronx, NY | Bronx, NY | Bronx, NY |
| Distance from Subject | -- | 5.3 miles | 0.8 miles | 0.1 miles | 0.1 miles | 4.3 miles | 3.6 miles |
| Property Type | Office | Office | Office | Office | Office | Office | Office |
| Year Built/Renovated | 1974/2006 | 2011/NAV | 2015/NAV | 2012/NAV | 2014/NAV | 1935/NAV | 1933/NAV |
| Stories | 4 | 5 | 3 | 13 | 11 | 12 | 7 |
| Total GLA | 422,452 SF | 76,710 SF | 258,859 SF | 284,000 SF | 280,000 SF | 410,194 SF | 550,000 SF |
| Total Occupancy | 100%(2) | 96% | 100% | 100% | 100% | 91% | 100% |
| (1) | Information obtained from the appraisal and a third party market research report. |
| (2) | Current occupancy includes the Visiting Nurse Service of NY space (55,859 square feet; 13.2% of net rentable area). Visiting Nurse Service of NY did not deliver a notice of renewal prior to their notice date of November 30, 2014 and its lease is scheduled to expire on November 30, 2015. Current Occupancy excluding this tenant is 86.8%. |
The Borrower.The borrower is Hutch Metro Center I LLC, a Delaware limited liability company which is a single purpose entity with two independent directors. Legal counsel to the borrower delivered a non-consolidation opinion in connection with the origination of the Hutchinson Metro Center I Mortgage Loan. Joseph Simone is the guarantor of certain nonrecourse carveouts under the Hutchinson Metro Center I Mortgage Loan.
The Sponsor.Joseph Simone is the founder of Simone Development, a full-service, privately held commercial and residential real estate and management company. Mr. Simone owns and manages a portfolio of approximately 100 properties in the tri-state area including office, medical, industrial flex, and retail, totaling more than five million square feet. Mr. Simone is currently in the process of settling outstanding litigation, which will be covered by the sponsor’s insurance. See “Description of the Mortgage Pool—Litigation Considerations” in the Free Writing Prospectus.
Escrows.The loan documents provide for upfront reserves in the amount of $229,840 for taxes, $49,688 for deferred maintenance and $2,000,000 for renewal or re-leasing expenses related to the Visiting Nurse Service of NY space. Funds will be disbursed from the Visiting Nurse Service of NY reserve for qualified leasing costs in connection with the renewal of Visiting Nurse Service of NY (for no less than three years at then market rent) or the re-leasing of the Visiting Nurse Service of NY space to one or more acceptable replacement tenants for a term of no less than five years at then market rent. Funds will not be fully disbursed until all of the borrower’s work has been completed in connection with the replacement lease, the replacement tenant has taken possession of and is occupying the Visiting Nurse Service of NY space, open for business and paying regularly scheduled unabated base rent and the borrower has delivered to the lender an acceptable tenant estoppel.
Ongoing monthly reserves are required in an amount equal to $42,338 for taxes, $8,801 for replacement reserves and $49,286 for general tenant improvements and leasing commissions (subject to a cap of $1,500,000). The loan documents do not require monthly escrows for insurance, provided that (i) no event of default has occurred and is continuing; (ii) the Hutchinson Metro Center I Property is insured via an acceptable blanket insurance policy; and (iii) the borrower provides the lender with evidence of renewal of the insurance policies and timely proof of payment of the insurance premiums when due.
Lockbox and Cash Management.The Hutchinson Metro Center I Mortgage Loan requires a lender-controlled lockbox account, which is already in place, and that the borrower direct tenants to pay their rents directly into such lockbox account. The loan documents also require that all rents received by the borrowers or the property manager be deposited into the lockbox account within one business day of receipt. Prior to the occurrence of a Cash Trap Event Period (as defined below), all excess cash flow is distributed to the borrower. During a Cash Trap Event Period, all cash flow is swept to a lender-controlled cash management account.
A “Cash Trap Event Period” will commence upon the earlier of (i) the occurrence and continuance of an event of default; (ii) the amortizing net cash flow debt service coverage ratio being less than 1.10x; or (iii) the occurrence of a Mercy Cash Trap Event Period (as defined below). A Cash Trap Event Period will end, with regard to clause (i), upon the cure of such event of default; with regard to clause (ii), upon the amortizing net cash flow debt service coverage ratio being equal to or greater than 1.15x for two consecutive calendar quarters; and with regard to clause (iii), upon the termination of such Mercy Cash Trap Event Period.
A “Mercy Cash Trap Event Period” will commence upon the earlier of the following events (i) Mercy College goes dark in substantially all of their space, (ii) Mercy College gives notice of its intention to vacate, surrender its space or ceases to conduct business in substantially all of its space; (iii) the date the Mercy College lease expires or is otherwise terminated (provided that if Mercy College gives notice of its intention to terminate the lease more than 18 months prior to the stated expiration date of the Mercy Lease (February 27, 2024), a cash flow sweep will not commence until 18 months prior to the expiration of the lease); and (iv) Mercy College files bankruptcy or a similar insolvency proceeding. A Mercy Cash Trap Event Period will end, with regard to clause (i), (ii) and (iii), (a) when Mercy College resumes operations in their space, the Mercy College lease is in full force and effect and the borrower delivers an acceptable estoppel or (b) when the Mercy College space is re-leased to an acceptable replacement tenant (or tenants) for a term of no less than five years at then-market rent, the borrower’s work is completed in connection with the replacement lease, the replacement tenant takes possession, is in occupancy, is open for business and paying regularly scheduled unabated base rent in the Mercy College Space and the borrower delivers to the lender an acceptable tenant estoppel; and with regard to clause (iv), the earlier to occur of the following: (1) a Mercy College insolvency proceeding is terminated and the Mercy College lease is affirmed, assumed or assigned or (2) the Mercy College space is re-leased to an acceptable replacement tenant, as outlined in clause (b) directly above. Provided a Cash Trap Event Period has not occurred
THE INFORMATION IN THIS STRUCTURAL AND COLLATERAL TERM SHEET IS NOT COMPLETE AND MAY BE AMENDED PRIOR TO THE TIME OF SALE. THIS TERM SHEET IS NOT AN OFFER TO SELL THESE SECURITIES AND IT IS NOT A SOLICITATION OF AN OFFER TO BUY THESE SECURITIES IN ANY JURISDICTION WHERE THE OFFER OR SALE IS NOT PERMITTED.
| 32 |
| HUTCHINSON METRO CENTER I |
and is not continuing, the amount collected as a result of a Mercy Cash Trap Event Period will be capped at one year of rent (after the date on which the particular trigger occurred) plus the tenant improvements and leasing commissions the lender estimates will be incurred in connection with the re-leasing of the space.
Property Management.The Hutchinson Metro Center I Property is managed by an affiliate of the borrower.
Assumption.The borrower has a two-time right to transfer the Hutchinson Metro Center I Property, provided that no event of default has occurred and is continuing and certain other conditions are satisfied, including (i) the lender's reasonable determination that the proposed transferee and guarantor satisfy the lender's credit review and underwriting standards, taking into consideration such transferee’s experience, financial strength and general business standing; (ii) execution of a recourse guaranty (which includes an environmental indemnity) by an affiliate of the transferee; and (iii) rating agency confirmation from Fitch, KBRA and Moody’s that the transfer will not result in a downgrade, withdrawal or qualification of the respective ratings assigned to the Series 2015-C29 Certificates.
Partial Release.Not permitted.
Real Estate Substitution.Not permitted.
Subordinate and Mezzanine Indebtedness. Not permitted.
Ground Lease.None.
Terrorism Insurance.The loan documents require that the “all risk” insurance policy required to be maintained by the borrower provide coverage for terrorism in an amount equal to the full replacement cost of the Hutchinson Metro Center I Property. The loan documents also require business interruption insurance covering no less than the 24-month period following the occurrence of a casualty event, together with a six-month extended period of indemnity.
THE INFORMATION IN THIS STRUCTURAL AND COLLATERAL TERM SHEET IS NOT COMPLETE AND MAY BE AMENDED PRIOR TO THE TIME OF SALE. THIS TERM SHEET IS NOT AN OFFER TO SELL THESE SECURITIES AND IT IS NOT A SOLICITATION OF AN OFFER TO BUY THESE SECURITIES IN ANY JURISDICTION WHERE THE OFFER OR SALE IS NOT PERMITTED.
| 33 |
[THIS PAGE INTENTIONALLY LEFT BLANK.]
THE INFORMATION IN THIS STRUCTURAL AND COLLATERAL TERM SHEET IS NOT COMPLETE AND MAY BE AMENDED PRIOR TO THE TIME OF SALE. THIS TERM SHEET IS NOT AN OFFER TO SELL THESE SECURITIES AND IT IS NOT A SOLICITATION OF AN OFFER TO BUY THESE SECURITIES IN ANY JURISDICTION WHERE THE OFFER OR SALE IS NOT PERMITTED.
| 34 |
| CATHEDRAL PLACE |

THE INFORMATION IN THIS STRUCTURAL AND COLLATERAL TERM SHEET IS NOT COMPLETE AND MAY BE AMENDED PRIOR TO THE TIME OF SALE. THIS TERM SHEET IS NOT AN OFFER TO SELL THESE SECURITIES AND IT IS NOT A SOLICITATION OF AN OFFER TO BUY THESE SECURITIES IN ANY JURISDICTION WHERE THE OFFER OR SALE IS NOT PERMITTED.
| 35 |
| CATHEDRAL PLACE |
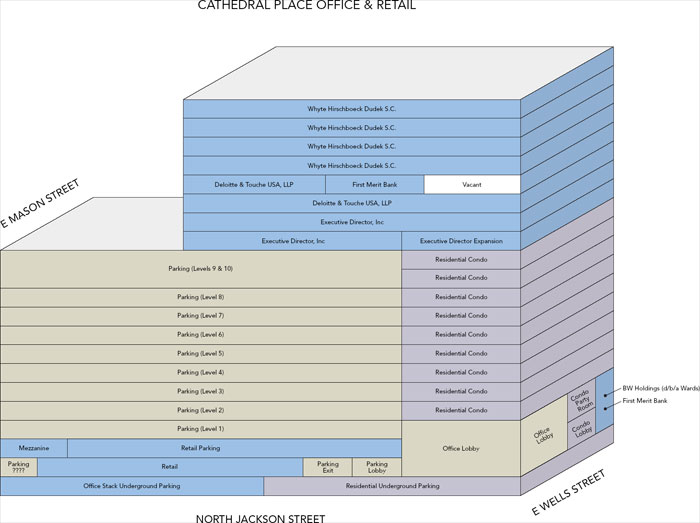
THE INFORMATION IN THIS STRUCTURAL AND COLLATERAL TERM SHEET IS NOT COMPLETE AND MAY BE AMENDED PRIOR TO THE TIME OF SALE. THIS TERM SHEET IS NOT AN OFFER TO SELL THESE SECURITIES AND IT IS NOT A SOLICITATION OF AN OFFER TO BUY THESE SECURITIES IN ANY JURISDICTION WHERE THE OFFER OR SALE IS NOT PERMITTED.
| 36 |
| CATHEDRAL PLACE |

THE INFORMATION IN THIS STRUCTURAL AND COLLATERAL TERM SHEET IS NOT COMPLETE AND MAY BE AMENDED PRIOR TO THE TIME OF SALE. THIS TERM SHEET IS NOT AN OFFER TO SELL THESE SECURITIES AND IT IS NOT A SOLICITATION OF AN OFFER TO BUY THESE SECURITIES IN ANY JURISDICTION WHERE THE OFFER OR SALE IS NOT PERMITTED.
| 37 |
| No. 2 Cathedral Place | ||||||
| Loan Information | Property Information | |||||
| Mortgage Loan Seller: | Walker & Dunlop Commercial Property Funding I WF, LLC | Single Asset/Portfolio: | Single Asset | |||
Credit Assessment (Fitch/KBRA/Moody’s): | NR/NR/NR | Property Type: | Office | |||
| Original Principal Balance: | $39,900,000 | Specific Property Type: | CBD | |||
| Cut-off Date Principal Balance: | $39,900,000 | Location: | Milwaukee, WI | |||
| % of Initial Pool Balance: | 3.4% | Size: | 219,778 SF | |||
| Loan Purpose: | Refinance | Cut-off Date Principal Balance Per SF: | $181.55 | |||
| Borrower Name: | Cathedral Place, LLC | Year Built/Renovated: | 2003/NAP | |||
| Sponsor: | Joel S. Lee | Title Vesting: | Fee | |||
| Mortgage Rate: | 4.125% | Property Manager: | Self-managed | |||
| Note Date: | February 10, 2015 | 3rd Most Recent Occupancy (As of)(2): | 98.5% (12/31/2012) | |||
| Anticipated Repayment Date: | NAP | 2nd Most Recent Occupancy (As of)(2): | 99.3% (12/31/2013) | |||
| Maturity Date: | March 1, 2025 | Most Recent Occupancy (As of)(2): | 92.2% (12/31/2014) | |||
| IO Period: | 24 months | Current Occupancy (As of)(3): | 91.1% (5/1/2015) | |||
| Loan Term (Original): | 120 months | |||||
| Seasoning: | 3 months | Underwriting and Financial Information: | ||||
| Amortization Term (Original): | 360 months | |||||
| Loan Amortization Type: | Interest-only, Amortizing Balloon | 3rdMost Recent NOI (As of): | $3,821,889 (12/31/2012) | |||
| Interest Accrual Method: | Actual/360 | 2ndMost Recent NOI (As of)(4): | $4,190,167 (12/31/2013) | |||
| Call Protection: | L(27),D(89),O(4) | Most Recent NOI (As of)(4): | $3,423,365 (12/31/2014) | |||
| Lockbox Type: | Hard/Springing Cash Management | |||||
| Additional Debt: | None | |||||
| Additional Debt Type: | NAP | |||||
| U/W Revenue: | $6,150,769 | |||||
| U/W Expenses: | $2,556,668 | |||||
| U/W NOI: | $3,594,101 | |||||
| Escrows and Reserves(1): | U/W NCF: | $3,276,228 | ||||
| U/W NOI DSCR: | 1.55x | |||||
| Type: | Initial | Monthly | Cap (If Any) | U/W NCF DSCR: | 1.41x | |
| Taxes | $271,791 | $90,597 | NAP | U/W NOI Debt Yield: | 9.0% | |
| Insurance | $19,469 | $4,867 | NAP | U/W NCF Debt Yield: | 8.2% | |
| Replacement Reserve | $0 | $3,663 | $205,000 | As-Is Appraised Value: | $57,000,000 | |
| TI/LC Reserve | $0 | $22,826 | $1,300,000 | As-Is Appraisal Valuation Date: | January 7, 2015 | |
| Outstanding Tenant TI/LC Reserve | $3,354,587 | $0 | NAP | Cut off Date LTV Ratio | 70.0% | |
| Free Rent | $141,706 | $0 | NAP | LTV Ratio at Maturity or ARD: | 59.2% | |
| (1) | See “Escrows” section. |
| (2) | Historical Occupancy is based on the simple average of the monthly occupancies for the applicable calendar year. Monthly occupancy is calculated as the weighted average of the office and retail occupancy, excluding storage and fitness center spaces. |
| (3) | See “Historical Occupancy” section. |
| (4) | See “Cash Flow Analysis” section. |
The Mortgage Loan. The mortgage loan (the “Cathedral Place Mortgage Loan”) is evidenced by a single promissory note that is secured by a first mortgage encumbering the fee interest in an office property located in Milwaukee, Wisconsin (the “Cathedral Place Property”). The Cathedral Place Mortgage Loan was originated on February 10, 2015 by Walker & Dunlop Commercial Property Funding I WF, LLC. The Cathedral Place Mortgage Loan had an original principal balance of $39,900,000, has an outstanding principal balance as of the Cut-off Date of $39,900,000 and accrues interest at an interest rate of 4.125%per annum. The Cathedral Place Mortgage Loan had an initial term of 120 months, has a remaining term of 117 months as of the Cut-off Date and requires interest-only payments for the first 24 payments following origination, and, thereafter, requires payments of principal and interest based on a 30-year amortization schedule. The Cathedral Place Mortgage Loan matures on March 1, 2025.
Following the lockout period, the borrower has the right to defease the Cathedral Place Mortgage Loan in whole, but not in part, onany date before December 1, 2024. In addition, the Cathedral Place Mortgage Loan is prepayable without penalty on or after December 1, 2024. Notwithstanding the foregoing, any defeasance or prepayment of the Cathedral Place Mortgage Loan must be simultaneous with the defeasance or prepayment of the mortgage loan identified on Annex A-1 to the Free Writing Prospectus as Cathedral Place – Parking (the “Cathedral Place – Parking Mortgage Loan”) with an outstanding principal balance as of the Cut-off Date of $9,200,000. The Cathedral Place – Parking Mortgage Loan is secured by a 10-story, 941-space parking deck that is located adjacent to the Cathedral Place Property.
THE INFORMATION IN THIS STRUCTURAL AND COLLATERAL TERM SHEET IS NOT COMPLETE AND MAY BE AMENDED PRIOR TO THE TIME OF SALE. THIS TERM SHEET IS NOT AN OFFER TO SELL THESE SECURITIES AND IT IS NOT A SOLICITATION OF AN OFFER TO BUY THESE SECURITIES IN ANY JURISDICTION WHERE THE OFFER OR SALE IS NOT PERMITTED.
| 38 |
| CATHEDRAL PLACE |
Sources and Uses
| Sources | Uses | |||||||
| Original loan amount | $39,900,000 | 87.5% | Loan payoff(1) | $29,500,000 | 64.7% | |||
| Sponsor new cash contribution | 5,680,073 | 12.5 | Line of credit payoff(2) | 10,829,185 | 23.8 | |||
| Reserves | 3,787,553 | 8.3 | ||||||
| Closing costs | 1,463,335 | 3.2 | ||||||
| Total Sources | $45,580,073 | 100.0% | Total Uses | $45,580,073 | 100.0% |
| (1) | The Cathedral Place Property was previously securitized in the BSCMS 2005-PWR9 transaction. |
| (2) | Line of credit payoff represents a payoff of a line of credit to the Lee Family Limited Partnership. |
The Property. The Cathedral Place Property comprises two of the four condominium units (see “Condominium Structure” section) within an 18-story office building located in the central business district of Milwaukee, Wisconsin. The office condominium (“Unit 1”) is comprised of approximately 203,379 square feet (92.3% of net rentable area of the Cathedral Place Property), is situated on floors 11-18 of the Cathedral Place Property and includes 2,356 square feet of basement storage space and 1,411 square feet currently utilized as a fitness center. The ground-floor retail condominium (“Unit 2”) consists of approximately 16,887 square feet (7.7% of net rentable area of the Cathedral Place Property) and has frontage along Jackson, Mason, and Wells Streets. Currently, the only retail tenants are BW Holdings (doing business as Ward’s House of Prime) which leases 6,528 square feet and First Merit Bank which leases 1,200 square feet.
The Cathedral Place Property is situated adjacent to the Cathedral Place – Parking garage (“Unit 3”). The office and retail tenants will have access to the parking garage via a perpetual parking easement agreement, an option to lease parking stalls agreement, and memorandum of option to lease parking stalls under which the parking condominium unit (Unit 3) gives the office and retail tenants the right to lease 433 spaces (the current amount presently leased by the office and retail tenants) at market rates. A breach of the parking easement agreement or the option to lease parking stalls agreement will constitute an event of default and be subject to the loss carveout provisions of the Cathedral Place Mortgage Loan.
The office space has direct access to the Cathedral Place – Parking garage as well as 37 stalls within the 100-space underground parking garage shared with the 27 residential condominiums (“Unit 4”). Parking for the retail stores is provided by 15 spaces of allocated ground-floor parking, as well as the parking garage. Unit 4, which is not part of the collateral for the Cathedral Place Mortgage Loan, is situated on floors 2-10, and is accessible through a separate entrance on Wells Street.
Major tenants at the Cathedral Place Property include Whyte Hirschboeck Dudek S.C. (“WHD”), Executive Director, Inc. (“EDI”), and Deloitte & Touche, USA LLP (“Deloitte”). WHD is headquartered at the Cathedral Place Property and is a full-service law firm with offices in Milwaukee, Wisconsin, Madison, Wisconsin and Chicago, Illinois and has more than 150 professionals practicing in more than 50 industry and specialty areas. EDI provides professional services for national and international medical, certification, and scientific associations. Deloitte provides audit, tax, consulting, enterprise risk, and financial advisory services with over 200,000 professionals in 150 countries. The Cathedral Place Property was 91.1% physically occupied by five tenants as of May 1, 2015.
Condominium Structure. The Cathedral Place Office Property is comprised of two of the four condominium units: the office unit (Unit 1) and the retail unit (Unit 2) of the Cathedral Place Condominium Association, Inc. (together, the “Master Association”). The Master Association also includes a third condominium unit consisting of a 941 space parking garage, and a fourth condominium unit consisting of 27 residential condominium units. The borrower has a combined 47.0% voting interest in the Master Association and control of certain operational decisions, along with the right to vote or appoint directors on behalf of the office and retail units.
THE INFORMATION IN THIS STRUCTURAL AND COLLATERAL TERM SHEET IS NOT COMPLETE AND MAY BE AMENDED PRIOR TO THE TIME OF SALE. THIS TERM SHEET IS NOT AN OFFER TO SELL THESE SECURITIES AND IT IS NOT A SOLICITATION OF AN OFFER TO BUY THESE SECURITIES IN ANY JURISDICTION WHERE THE OFFER OR SALE IS NOT PERMITTED.
| 39 |
| CATHEDRAL PLACE |
The following table presents certain information relating to the tenancy at the Cathedral Place Property:
Major Tenants
| Tenant Name | Credit Rating (Fitch/ Moody’s/S&P)(1) | Tenant NRSF | % of NRSF | Annual U/W Base Rent PSF | Annual U/W Base Rent | % of Total Annual U/W Base Rent | Lease Expiration Date |
| Major Tenants | |||||||
| Whyte Hirschboeck Dudek S.C. | NR/NR/NR | 93,859 | 42.7% | $18.73 | $1,757,792 | 42.1% | 11/30/2020 |
| Deloitte & Touche USA, LLP | NR/NR/NR | 37,476 | 17.1% | $28.41 | 1,064,693 | 25.5% | 10/31/2024(2) |
| Executive Director, Inc.(3) | NR/NR/NR | 51,853 | 23.6% | $18.50 | 959,280 | 23.0% | 6/30/2030(4) |
| First Merit Bank | NR/A3/BBB+ | 9,010 | 4.1% | $30.66 | 276,252 | 6.6% | 11/14/2024(5) |
| BW Holdings | NR/NR/NR | 6,528 | 3.0% | $17.99 | 117,439 | 2.8% | 2/28/2018 |
| Total Major Tenants | 198,726 | 90.4% | $21.01 | $4,175,456 | 100.0% | ||
| Non-Major Tenant(6) | 1,411 | 0.6% | $0.00 | $0 | 0.0% | ||
| Occupied Collateral Total | 200,137 | 91.1% | $21.01 | $4,175,456 | 100.0% | ||
| Vacant Space | 19,641 | 8.9% | |||||
| Collateral Total | 219,778 | 100.0% | |||||
| (1) | Certain ratings are those of the parent company whether or not the parent guarantees the lease. |
| (2) | Deloitte has a one-time right to terminate one of its two leases (10,526 square feet; 4.8% of net rentable area) on October 31, 2019 with 12 months’ notice and a termination fee of $181,000. |
| (3) | EDI recently executed a lease for 9,951 square feet of expansion space (4.5% of net rentable area). Executive Director, Inc. is expected to take occupancy on June 6, 2015 and will commence rent payments on July 1, 2015. A reserve for free rent and TI/LC was established at closing. |
| (4) | EDI has a one-time right to terminate the lease for the expansion space (9,951 square feet; 4.5% of net rentable area) on June 15, 2020 with 180 days’ notice. |
| (5) | First Merit Bank has a one-time right to terminate its leases (9,010 square feet; 4.1% of net rentable area) on December 31, 2020 with 270 days’ notice and a termination fee of $255,000. |
| (6) | Represents the Fitness Center (1,411 square feet), which does not have a lease or any associated underwritten rent and is not included in total Annual U/W Base Rent. |
The following table presents certain information relating to the lease rollover schedule at the Cathedral Place Property:
Lease Expiration Schedule(1)(2)
Year Ending December 31, | No. of Leases Expiring | Expiring NRSF | % of Total NRSF | Cumulative Expiring NRSF | Cumulative % of Total NRSF | Annual U/W Base Rent | Annual U/W Base Rent PSF(3) |
| MTM(4) | 1 | 1,411 | 0.6% | 1,411 | 0.6% | $0 | $0.00 |
| 2015 | 0 | 0 | 0.0% | 1,411 | 0.6% | $0 | $0.00 |
| 2016 | 0 | 0 | 0.0% | 1,411 | 0.6% | $0 | $0.00 |
| 2017 | 0 | 0 | 0.0% | 1,411 | 0.6% | $0 | $0.00 |
| 2018 | 1 | 6,528 | 3.0% | 7,939 | 3.6% | $117,439 | $17.99 |
| 2019 | 0 | 0 | 0.0% | 7,939 | 3.6% | $0 | $0.00 |
| 2020 | 7 | 93,859 | 42.7% | 101,798 | 46.3% | $1,757,792 | $18.73 |
| 2021 | 0 | 0 | 0.0% | 101,798 | 46.3% | $0 | $0.00 |
| 2022 | 0 | 0 | 0.0% | 101,798 | 46.3% | $0 | $0.00 |
| 2023 | 0 | 0 | 0.0% | 101,798 | 46.3% | $0 | $0.00 |
| 2024 | 5 | 46,486 | 21.2% | 148,284 | 67.5% | $1,340,945 | $28.85 |
| 2025 | 0 | 0 | 0.0% | 148,284 | 67.5% | $0 | $0.00 |
| Thereafter | 3 | 51,853 | 23.6% | 200,137 | 91.1% | $959,281 | $18.50 |
| Vacant | 0 | 19,641 | 8.9% | 219,778 | 100.0% | $0 | $0.00 |
| Total/Weighted Average | 17 | 219,778 | 100.0% | $4,175,456 | $20.86 |
| (1) | Information obtained from the underwritten rent roll. |
| (2) | Certain tenants may have lease termination options that are exercisable prior to the originally stated expiration date of the subject lease and that are not considered in the Lease Expiration Schedule. |
| (3) | Weighted Average Annual U/W Base Rent PSF excludes vacant space. |
| (4) | Represents the Fitness Center (1,411 square feet), which does not have a lease or any associated underwritten rent and is not included in total Annual U/W Base Rent. |
THE INFORMATION IN THIS STRUCTURAL AND COLLATERAL TERM SHEET IS NOT COMPLETE AND MAY BE AMENDED PRIOR TO THE TIME OF SALE. THIS TERM SHEET IS NOT AN OFFER TO SELL THESE SECURITIES AND IT IS NOT A SOLICITATION OF AN OFFER TO BUY THESE SECURITIES IN ANY JURISDICTION WHERE THE OFFER OR SALE IS NOT PERMITTED.
| 40 |
| CATHEDRAL PLACE |
The following table presents historical occupancy percentages at the Cathedral Place Property:
Historical Occupancy
12/31/2012(1) | 12/31/2013(1) | 12/31/2014(1) | 5/1/2015(2)(3) |
| 98.5% | 99.3% | 92.2% | 91.1% |
| (1) | Information obtained from the borrower. |
| (2) | Information obtained from the underwritten rent roll. |
| (3) | Current Occupancy, per rent roll obtained from the borrower, as of May 1, 2015 includes the EDI expansion space of 9,951 square feet (4.5% of net rentable area). |
Underwritten Net Cash Flow.The following table presents certain information relating to the historical operating performance and underwritten net cash flow at the Cathedral Place Property:
Cash Flow Analysis
| 2012 | 2013(1) | 2014(1) | U/W | % of U/W Effective Gross Income | U/W $ per SF | |
| Base Rent | $4,611,148 | $4,792,629 | $3,702,507 | $4,175,456 | 67.9% | $19.86 |
| Grossed Up Vacant Space | 0 | 0 | 0 | 408,155 | 6.6 | 1.86 |
| Total Reimbursables | 1,808,672 | 2,040,690 | 2,345,404 | 2,066,832 | 33.6 | 9.40 |
| Other Income | 85,825 | 94,468 | 122,326 | 101,570 | 1.7 | 0.46 |
| Less Vacancy & Credit Loss | 0 | 0 | 0 | (601,244) | (9.8) | 2.74 |
| Effective Gross Income | $6,505,645 | $6,927,787 | $6,170,237 | $6,150,769 | 100.0% | $27.99 |
| Total Operating Expenses | $2,683,756 | $2,737,621 | $2,746,872 | $2,556,668 | 41.6% | $11.63 |
| Net Operating Income | $3,821,889 | $ 4,190,167 | $3,423,365 | $3,594,101 | 58.4% | $16.35 |
| TI/LC | 0 | 0 | 0 | 273,918 | 4.5 | 1.25 |
| Capital Expenditures | 0 | 0 | 0 | 43,956 | 0.7 | 0.20 |
| Net Cash Flow | $3,821,889 | $4,190,167 | $3,423,365 | $3,276,228 | 53.3% | $14.91 |
| NOI DSCR | 1.65x | 1.81x | 1.48x | 1.55x | ||
| NCF DSCR | 1.65x | 1.81x | 1.48x | 1.41x | ||
| NOI DY | 9.6% | 10.5% | 8.6% | 9.0% | ||
| NCF DY | 9.6% | 10.5% | 8.6% | 8.2% |
| (1) | Base Rent and Net Operating Income decreased from 2013 to 2014 due to Deloitte giving back a total of 33,115 square feet (15.1% of net rentable area) when its initial 10-year lease term expired. EDI took occupancy of 16,701 square feet (7.6% of net rentable area) and First Merit Bank took occupancy of 7,322 square feet (3.3% of net rentable area) that was vacated by Deloitte. |
Appraisal. As of the appraisal valuation date of January 7, 2015, the Cathedral Place Property had an “as-is” appraised value of $57,000,000.
Environmental Matters.The Phase I environmental site assessment dated January 23, 2015 revealed no evidence of recognized environmental conditions.
Market Overview and Competition.The Cathedral Place Property is located along East Wells Street in the central business district of Milwaukee, Wisconsin. The immediate neighborhood consists of a mix of class A and class B office buildings. Most land in the neighborhood is fully developed.
The Cathedral Place Property is located in an area that is also home to banks, law and accounting firms, and other large corporate tenants including the headquarters campus of Northwestern Mutual Life Insurance Company, which is located one block east of the Cathedral Place Property, and the U.S. Bank Center located three blocks to the southeast. The Cathedral Place Property is located four blocks north of the Interstate-794 on and off ramps, which provide immediate access to Interstate-94 (the major north-south interstate running to and from Chicago) and the entire Milwaukee metropolitan statistical area.
The estimated 2014 population within a half-, one-, and two-mile radius of the Cathedral Place Property was 7,748, 23,458, and 79,133, respectively, and the population within the same radii is expected to grow at an annual rate of 0.9%, 1.4% and 0.7%, respectively. The estimated 2014 median household income within the same half-, one-, and two-mile radii was $45,116, $44,026 and $27,597, respectively.
The Cathedral Place Property is located in the Milwaukee-Waukesha-West Allis metropolitan statistical area. The estimated 2014 population of the metropolitan statistical area was 1,571,200, a 0.1% increase from 2013. Total employment in 2014 in the Milwaukee Waukesha-West Allis metropolitan statistical area was at 839,400, a 1.6% increase from 2013 and the unemployment rate was at 6.2% as of October, 2014.
THE INFORMATION IN THIS STRUCTURAL AND COLLATERAL TERM SHEET IS NOT COMPLETE AND MAY BE AMENDED PRIOR TO THE TIME OF SALE. THIS TERM SHEET IS NOT AN OFFER TO SELL THESE SECURITIES AND IT IS NOT A SOLICITATION OF AN OFFER TO BUY THESE SECURITIES IN ANY JURISDICTION WHERE THE OFFER OR SALE IS NOT PERMITTED.
| 41 |
| CATHEDRAL PLACE |
According to the appraisal, the education and health services sector contributes 18.4% of total employment in the Milwaukee-Waukesha-West Allis metropolitan statistical area, followed by the manufacturing sector (14.4%) and the professional and business services sector (14.3%). The top six employers in the Milwaukee-Waukesha-West Allis metropolitan statistical area are: Aurora Health Care Inc. (22,000 employees), Wheaton Franciscan Healthcare (12,000 employees), Froedtert and Community Health (8,900 employees), Roundy’s Inc. (8,400 employees), Kohl’s Department Stores Inc. (7,800 employees), and Northwestern Mutual Life Insurance Co. (5,000 employees).
According to the appraisal, the Cathedral Place Property is located within the Downtown East office submarket. The Downtown East office submarket is bounded by Interstate 794 to the south, the Milwaukee River to the west, Ogden Avenue to the north, and both Lincoln Memorial Drive and Lake Michigan to the east. According to the appraisal, as of the third quarter of 2014, the Downtown East office submarket had an inventory of 8.2 million square feet, exhibiting a vacancy rate of 13.8% with asking rents of $25.88 per square foot on a gross basis.
According to a third-party market research report, as of the first quarter of 2015, the Downtown East office submarket is the most desirable in the central business district and rents are 10% greater than comparable office buildings in the Downtown West office submarket. The third-party market research report indicated a vacancy rate of 8.8% for 4 & 5 star office properties in the Downtown East office submarket.
The following table presents certain information relating to comparable retail properties for the Cathedral Place Property:
Competitive Set(1)
| Cathedral Place (Subject) | The Milwaukee Center | Chase Tower | 100 East Building | US Bank Center | 875 E Wisconsin Avenue | |
| Location | Milwaukee, WI | Milwaukee, WI | Milwaukee, WI | Milwaukee, WI | Milwaukee, WI | Milwaukee, WI |
| Distance from Subject | -- | 0.4 miles | 0.4 miles | 0.4 miles | 0.3 miles | 0.4 miles |
| Property Type | Office | Office | Office | Office | Office | Office |
| Year Built/Renovated | 2003/NAP | 1988/NAP | 1961/NAP | 1989/NAP | 1971/NAP | 2003/NAP |
| Stories | 18 | 28 | 22 | 35 | 42 | 8 |
| Total GLA | 219,778 SF | 373,489 SF | 485,153 SF | 423,723 SF | 1,079,021 SF | 209,209 SF |
| Total Occupancy | 91% | 96% | 84% | 95% | 98% | 100% |
| (1) | Information obtained from the appraisal and underwritten rent roll. |
The Borrower. The borrower is Cathedral Place, LLC, a Wisconsin limited liability company and a single purpose entity whose managing member has two independent directors. Legal counsel to the borrower delivered a non-consolidation opinion in connection with the origination of the Cathedral Place Mortgage Loan. Joel S. Lee is the guarantor of certain nonrecourse carveouts under the Cathedral Place Mortgage Loan.
The Sponsor. The sponsor is Joel S. Lee. Mr. Lee developed the Cathedral Place Property in 2003/2004. Mr. Lee is the owner and founder of Van Buren Management, Inc., which owns a portfolio of approximately 2.0 million square feet of primarily office space in downtown Milwaukee.
Escrows. The loan documents require upfront reserves of $271,791 for real estate taxes, $19,469 for insurance premiums, $141,706 for free rent ($76,706 for EDI with an anticipated rent commencement date of July 1, 2015, and $65,000 for First Merit Bank), and $3,354,588 for outstanding tenant improvements ($2,312,269 for Deloitte, $530,999 for EDI and $511,320 for First Merit Bank). The loan documents require monthly deposits into the reserve accounts of $90,597 for real estate taxes, $4,867 for insurance, $22,826 for tenant improvements and leasing commissions (capped at $1,300,000), and $3,663 for replacement reserves (capped at $205,000).
Lockbox and Cash Management. The Cathedral Place Mortgage Loan requires a lender-controlled lockbox account, which is already in place, and that the borrower direct tenants to pay their rents directly into such lockbox account. The loan documents also require that all rents received by the borrower or the property manager be deposited into the lockbox account within two business days of receipt. Funds are then swept into a cash management account controlled by the lender, and prior to the occurrence of a Cash Trap Event Period (as defined below), funds are distributed to the borrower’s operating account. During a Cash Trap Event Period, all excess cash flow is deposited into the excess cash reserve account and/or the Primary Lease reserve account. During a Primary Lease Termination/Extension Event, all excess cash flow is deposited into the primary lease reserve account.
A “Cash Trap Event Period” will commence upon the earlier of (i) the occurrence and continuance of an event of default, (ii) the amortizing debt service coverage ratio based on the trailing 12 calendar months falling below 1.15x, (iii) WHD (“Primary Tenant”) not extending the term of its lease on or before the period that is one year prior to the lease’s expiration for a term of at least the earlier of (a) ten years or (b) the date which is two years after loan maturity (a “Primary Lease Termination/Extension Event”), (iv) the Primary Tenant being (a) in monetary default under its lease, (b) going dark or subletting more than 50% of its space, (c) vacating or giving notice of its intent to vacate the leased space or (d) becoming a debtor in an insolvency proceeding which is not dismissed within 90 days, or (v) any other tenant that occupies over 20% of the net rentable area at the Cathedral Place Property (“Non-Primary Tenant”) (a) going dark or subletting more than 50% of its space or vacating, (b) giving notice of its intent to vacate the leased space or (c) becoming a debtor in an insolvency proceeding that is not dismissed within 90 days. A Cash Trap Event Period will end, with regard to clause (i), upon the cure of such event of default; with regard to clause (ii), upon the date the amortizing debt service coverage ratio is at least
THE INFORMATION IN THIS STRUCTURAL AND COLLATERAL TERM SHEET IS NOT COMPLETE AND MAY BE AMENDED PRIOR TO THE TIME OF SALE. THIS TERM SHEET IS NOT AN OFFER TO SELL THESE SECURITIES AND IT IS NOT A SOLICITATION OF AN OFFER TO BUY THESE SECURITIES IN ANY JURISDICTION WHERE THE OFFER OR SALE IS NOT PERMITTED.
| 42 |
| CATHEDRAL PLACE |
1.15x for six consecutive months; with regard to clause (iii), upon the occurrence of a Primary Lease Termination/Extension Event Cure (as defined below); and with regard to clause (iv), upon the occurrence of a Primary Tenant Trigger Event Cure (as defined below) and with regard to clause (v), upon the occurrence of a Non-Primary Trigger Event Cure (as defined below).
“Primary Lease” refers to the lease with WHD. A “Primary Lease Termination/Extension Event Cure” means (i) either (1) (A) execution and delivery of an extension of the Primary Lease, in form and substance acceptable to the lender in its discretion, and (B) delivery of an executed estoppel certificate from the Primary Tenant with respect to the Primary Lease; or (2) (A) execution and delivery of a replacement lease or leases for the entirety of the Primary Lease space, which replacement lease or leases (x) have an expiration date that is at least two years after March 1, 2025, and (y) are in form and substance acceptable to the lender in its discretion, and (B) delivery of an executed estoppel certificate from the applicable replacement tenant or tenants under the replacement lease or leases set forth in subsection (2)(A) above and (ii) no Cash Trap Event Period has occurred and is then-continuing.
“Primary Tenant Trigger Event Cure” means the occurrence of any of the following, as applicable: (i) the execution and delivery of a replacement lease and estoppel certificate for the Primary Tenant’s leased space in form and substance reasonably acceptable to the lender, (ii) the Primary Tenant has cured all defaults and remains in good standing under its lease or (iii) the lease has been assumed by the applicable Primary Tenant in accordance with applicable law, such assumption has been approved by the appropriate bankruptcy court having jurisdiction over such matter and such Primary Tenant is no longer involved in any bankruptcy or insolvency proceeding.
“Non-Primary Trigger Event Cure” means the occurrence of any of the following, as applicable: (i) the execution and delivery of a replacement lease and estoppel certificate for the Non-Primary Tenant’s leased space in form and substance reasonably acceptable to the lender, (ii) the Non-Primary Tenant (a) has revoked its intention to vacate, (b) is occupying its leased premises and (c) has paid all amounts due under the lease or (iii) the Non-Primary Tenant lease has been assumed by the applicable Non-Primary Tenant in accordance with applicable law, such assumption has been approved by the appropriate bankruptcy court having jurisdiction over such matter and such Non-Primary Tenant is no longer involved in any bankruptcy or insolvency proceeding.
Property Management. The Cathedral Place Property is managed by an affiliate of the borrower.
Assumption.The borrower has the right to transfer the Cathedral Place Property, provided that certain conditions are satisfied, including (i) no event of default has occurred and is continuing; (ii) the proposed transferee and transferee’s principal have the creditworthiness, reputation, and qualifications to the lender’s satisfaction, as well as an aggregate net worth and liquidity reasonably acceptable to the lender; (iii) the lender has received confirmation from Fitch, KBRA and Moody’s that such assumption will not result in a downgrade, withdrawal or qualification of the respective ratings assigned to the Series 2015-C29 Certificates; and (iv) the Cathedral Place – Parking Mortgage Loan is assumed simultaneously.
Partial Release. Not permitted.
Real Estate Substitution. Not permitted.
Subordinate and Mezzanine Indebtedness. Not permitted.
Ground Lease. None
Terrorism Insurance.The loan documents require that the “all risk” insurance policy required to be maintained by the borrower provide coverage for terrorism in an amount equal to the full replacement cost of the Cathedral Place Property so long as the lender determines that either (i) prudent owners of real estate comparable to the Cathedral Place Property are maintaining the same level of coverage or (ii) prudent institutional lenders to such owners are requiring that such owners maintain such insurance. The loan documents also require business interruption insurance covering no less than the 18-month period following the occurrence of a casualty event, together with an extended period of indemnity that is unlimited as to the number of days.
THE INFORMATION IN THIS STRUCTURAL AND COLLATERAL TERM SHEET IS NOT COMPLETE AND MAY BE AMENDED PRIOR TO THE TIME OF SALE. THIS TERM SHEET IS NOT AN OFFER TO SELL THESE SECURITIES AND IT IS NOT A SOLICITATION OF AN OFFER TO BUY THESE SECURITIES IN ANY JURISDICTION WHERE THE OFFER OR SALE IS NOT PERMITTED.
| 43 |
| 150 ROYALL STREET |
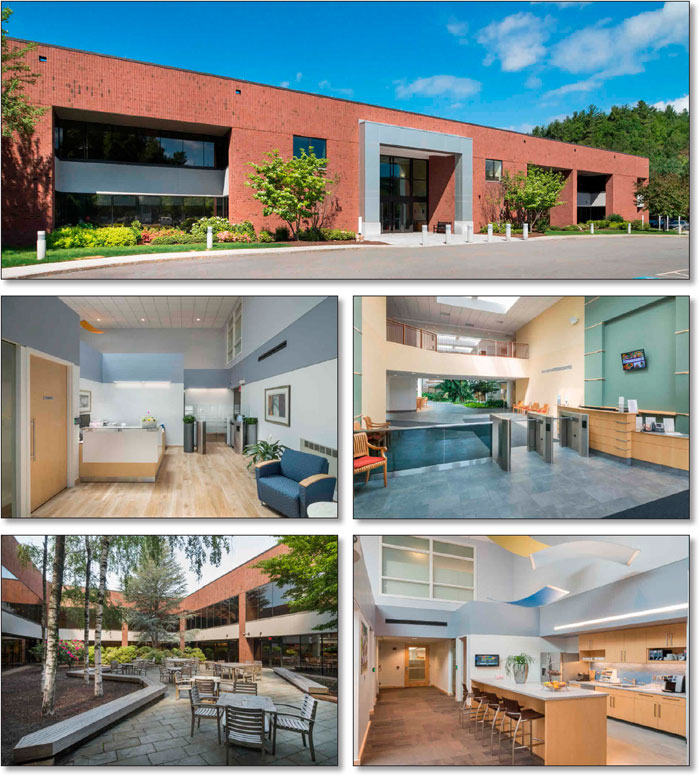
THE INFORMATION IN THIS STRUCTURAL AND COLLATERAL TERM SHEET IS NOT COMPLETE AND MAY BE AMENDED PRIOR TO THE TIME OF SALE. THIS TERM SHEET IS NOT AN OFFER TO SELL THESE SECURITIES AND IT IS NOT A SOLICITATION OF AN OFFER TO BUY THESE SECURITIES IN ANY JURISDICTION WHERE THE OFFER OR SALE IS NOT PERMITTED.
| 44 |
| 150 ROYALL STREET |

THE INFORMATION IN THIS STRUCTURAL AND COLLATERAL TERM SHEET IS NOT COMPLETE AND MAY BE AMENDED PRIOR TO THE TIME OF SALE. THIS TERM SHEET IS NOT AN OFFER TO SELL THESE SECURITIES AND IT IS NOT A SOLICITATION OF AN OFFER TO BUY THESE SECURITIES IN ANY JURISDICTION WHERE THE OFFER OR SALE IS NOT PERMITTED.
| 45 |
| No. 3 – 150 Royall Street |
| Loan Information | Property Information | ||||||
| Mortgage Loan Seller: | Wells Fargo Bank, National Association | Single Asset/Portfolio: | Single Asset | ||||
| Credit Assessment (Fitch/KBRA/Moody’s): | NR/NR/NR | Property Type: | Office | ||||
| Original Principal Balance: | $38,187,500 | Specific Property Type: | Suburban | ||||
| Cut-off Date Principal Balance: | $38,187,500 | Location: | Canton, MA | ||||
| % of Initial Pool Balance: | 3.2% | Size: | 259,341 SF | ||||
| Loan Purpose: | Acquisition | Cut-off Date Principal Balance Per SF: | $147.25 | ||||
| Borrower Name: | BAC Canton Holdings LLC | Year Built/Renovated: | 1985/2007 | ||||
| Sponsors: | Jay O. Hirsh; James S. Hughes | Title Vesting: | Fee | ||||
| Mortgage Rate: | 4.140% | Property Manager: | Self-managed | ||||
| Note Date: | May 27, 2015 | 3rd Most Recent Occupancy(2): | NAV | ||||
| Anticipated Repayment Date: | NAP | 2nd Most Recent Occupancy(2): | NAV | ||||
| Maturity Date: | June 11, 2025 | Most Recent Occupancy(2): | NAV | ||||
| IO Period: | 60 months | Current Occupancy (As of)(3): | 100.0% (4/1/2015) | ||||
| Loan Term (Original): | 120 months | ||||||
| Seasoning: | 0 months | Underwriting and Financial Information: | |||||
| Amortization Term (Original): | 360 months | ||||||
| Loan Amortization Type: | Interest-only, Amortizing Balloon | 3rd Most Recent NOI(2): | NAV | ||||
| Interest Accrual Method: | Actual/360 | 2nd Most Recent NOI(2): | NAV | ||||
| Call Protection: | L(24),D(92),O(4) | Most Recent NOI(2): | NAV | ||||
| Lockbox Type: | Soft/Springing Cash Management | ||||||
| Additional Debt: | None | ||||||
| Additional Debt Type: | NAP | U/W Revenues: | $6,382,931 | ||||
| U/W Expenses: | $2,802,786 | ||||||
| U/W NOI: | $3,580,145 | ||||||
| U/W NCF: | $3,136,672 | ||||||
| Escrows and Reserves(1): | U/W NOI DSCR: | 1.61x | |||||
| U/W NCF DSCR: | 1.41x | ||||||
| Type: | Initial | Monthly | Cap (If Any) | U/W NOI Debt Yield: | 9.4% | ||
| Taxes | $125,155 | $62,578 | NAP | U/W NCF Debt Yield: | 8.2% | ||
| Insurance | $0 | Springing | NAP | As-Is Appraised Value: | $58,900,000 | ||
| Replacement Reserves | $0 | Springing | NAP | As-Is Appraisal Valuation Date: | February 25, 2015 | ||
| TI/LC Reserve | $0 | $27,015 | NAP | Cut-off Date LTV Ratio: | 64.8% | ||
| Gray, Gray & Gray Reserve | $187,253 | $0 | NAP | LTV Ratio at Maturity or ARD: | 59.0% | ||
| (1) | See “Escrows” section. |
| (2) | Historical occupancy and financials are not available, as the borrower recently acquired the 150 Royall Street Property, which was previously owner-occupied. |
| (3) | See “Historical Occupancy” section. |
The Mortgage Loan.The mortgage loan (the “150 Royall Street Mortgage Loan”) is evidenced by a single promissory note that is secured by a first mortgage encumbering the fee interest in an office building located in Canton, Massachusetts (the “150 Royall Street Property”). The 150 Royall Street Mortgage Loan was originated on May 27, 2015 by Wells Fargo Bank, National Association. The 150 Royall Street Mortgage Loan had an original principal balance of $38,187,500, has an outstanding principal balance as of the Cut-off Date of $38,187,500 and accrues interest at an interest rate of 4.140%per annum. The 150 Royall Street Mortgage Loan had an initial term of 120 months, has a remaining term of 120 months as of the Cut-off Date and requires interest-only payments for the first 60 payments following origination and, thereafter, requires payments of principal and interest based on a 30-year amortization schedule. The 150 Royall Street Mortgage Loan matures on June 11, 2025.
Following the lockout period, the borrower has the right to defease the 150 Royall Street Mortgage Loan in whole, but not in part, on any date before March 11, 2025. In addition, the 150 Royall Street Mortgage Loan is prepayable without penalty on or after March 11, 2025.
THE INFORMATION IN THIS STRUCTURAL AND COLLATERAL TERM SHEET IS NOT COMPLETE AND MAY BE AMENDED PRIOR TO THE TIME OF SALE. THIS TERM SHEET IS NOT AN OFFER TO SELL THESE SECURITIES AND IT IS NOT A SOLICITATION OF AN OFFER TO BUY THESE SECURITIES IN ANY JURISDICTION WHERE THE OFFER OR SALE IS NOT PERMITTED.
| 46 |
| 150 ROYALL STREET |
Sources and Uses
| Sources | Uses | |||||||
| Original loan amount | $38,187,500 | 64.0% | Purchase price | $58,000,000 | 97.3% | |||
Sponsor’s new cash contribution
| 21,437,751 | 36.0 | Reserves | 312,408 | 0.5 | |||
| Closing costs | 1,312,843 | 2.2 | ||||||
| Total Sources | $59,625,251 | 100.0% | Total Uses | $59,625,251 | 100.0% |
The Property.The 150 Royall Street Property is a two-story, class A suburban office building totaling 259,341 square feet located in Canton, Massachusetts, approximately 15.5 miles southwest of the Boston central business district. Built in 1985 and renovated in 2007, the 150 Royall Street Property is situated on a 20.2-acre parcel and its amenities include a landscaped indoor atrium, 7,900-square-foot fitness center with locker rooms, conference center, full-service cafeteria and shuttle service. The building’s main entrance has a full-time security guard and opens into the central atrium area. Tenant Gray, Gray & Gray has a private entrance that leads directly into its space. The 150 Royall Street Property comprises 1,080 surface parking spaces, resulting in a parking ratio of 4.2 spaces per 1,000 square feet of rentable area. As of April 1, 2015, the 150 Royall Street Property was 100.0% leased by three tenants.
The largest tenant at the 150 Royall Street Property is Chicago Bridge & Iron (“CB&I”; NYSE: CBI; market cap of approximately $6.0 billion as of June 4, 2015), which accounts for 72.8% of the net rentable area and 69.0% of the underwritten base rent. With 125 years of experience and approximately 54,000 employees, CB&I is one of the world’s largest engineering, procurement and construction companies focused on the global energy industry. CB&I offers a wide range of services including design, engineering, construction, fabrication, maintenance and environmental services.
The following table presents certain information relating to the tenancy at the 150 Royall Street Property:
Major Tenants
| Tenant Name | Credit Rating (Fitch/Moody’s/ S&P)(1) | Tenant NRSF | % of NRSF | Annual U/W Base Rent PSF(2) | Annual U/W Base Rent(2) | % of Total Annual U/W Base Rent | Lease Expiration Date |
| Major Tenants | |||||||
| CB&I(3) | NR/NR/NR | 188,857 | 72.8% | $23.50 | $4,438,140 | 69.0% | 1/31/2023(4) |
| OneBeacon | BBB+/NR/BBB- | 41,185 | 15.9% | $28.50 | $1,173,773 | 18.3% | 3/31/2025 |
| Gray, Gray & Gray(5) | NR/NR/NR | 29,299(6) | 11.3% | $27.92 | $818,028 | 12.7% | 4/1/2030(7) |
| Total Major Tenants | 259,341 | 100.0% | $24.79 | $6,429,940 | 100.0% | ||
| Vacant Space | 0 | 0.0% | |||||
| Collateral Total | 259,341 | 100.0% | |||||
| (1) | Certain ratings are those of the parent company whether or not the parent guarantees the lease. |
| (2) | Annual U/W Base Rent PSF and Annual U/W Base Rent include contractual rent steps through December 2015 totaling $122,347. |
| (3) | CB&I is currently not utilizing approximately 35,000 square feet of its space. |
| (4) | CB&I has the right to terminate its lease on August 31, 2018 with 12 months’ written notice and payment of a termination fee equal to approximately $9.1 million. |
| (5) | Gray, Gray & Gray is in a free rent period and will commence rent payments in July 2015. A reserve has been taken for this rent abatement. |
| (6) | 3,480 square feet of Gray, Gray & Gray’s space is expansion space that is currently leased by OneBeacon. Gray, Gray & Gray is obligated by the terms of its lease to take over the expansion space no later than April 2020. Until Gray, Gray & Gray takes over its expansion space, OneBeacon is responsible for rent payments at Gray, Gray & Gray’s contractual rental rate. |
| (7) | Gray, Gray & Gray has the right to terminate its lease on July 31, 2025 with 12 months’ written notice and payment of a termination fee equal to approximately $1.3 million. |
THE INFORMATION IN THIS STRUCTURAL AND COLLATERAL TERM SHEET IS NOT COMPLETE AND MAY BE AMENDED PRIOR TO THE TIME OF SALE. THIS TERM SHEET IS NOT AN OFFER TO SELL THESE SECURITIES AND IT IS NOT A SOLICITATION OF AN OFFER TO BUY THESE SECURITIES IN ANY JURISDICTION WHERE THE OFFER OR SALE IS NOT PERMITTED.
| 47 |
| 150 ROYALL STREET |
The following table presents certain information relating to the lease rollover schedule at the 150 Royall Street Property:
Lease Expiration Schedule(1)(2)
| Year Ending December 31, | No. of Leases Expiring | Expiring NRSF | % of Total NRSF | Cumulative Expiring NRSF | Cumulative % of Total NRSF | Annual U/W Base Rent | Annual U/W Base Rent PSF |
| MTM | 0 | 0 | 0.0% | 0 | 0.0% | $0 | $0.00 |
| 2015 | 0 | 0 | 0.0% | 0 | 0.0% | $0 | $0.00 |
| 2016 | 0 | 0 | 0.0% | 0 | 0.0% | $0 | $0.00 |
| 2017 | 0 | 0 | 0.0% | 0 | 0.0% | $0 | $0.00 |
| 2018 | 0 | 0 | 0.0% | 0 | 0.0% | $0 | $0.00 |
| 2019 | 0 | 0 | 0.0% | 0 | 0.0% | $0 | $0.00 |
| 2020 | 0 | 0 | 0.0% | 0 | 0.0% | $0 | $0.00 |
| 2021 | 0 | 0 | 0.0% | 0 | 0.0% | $0 | $0.00 |
| 2022 | 0 | 0 | 0.0% | 0 | 0.0% | $0 | $0.00 |
| 2023 | 1 | 188,857 | 72.8% | 188,857 | 72.8% | $4,438,140 | $23.50 |
| 2024 | 0 | 0 | 0.0% | 188,857 | 72.8% | $0 | $0.00 |
| 2025 | 1 | 41,185 | 15.9% | 230,042 | 88.7% | $1,173,773 | $28.50 |
| Thereafter | 1 | 29,299 | 11.3% | 259,341 | 100.0% | $818,028 | $27.92 |
| Vacant | 0 | 0 | 0.0% | 259,341 | 100.0% | $0 | $0.00 |
| Total/Weighted Average | 3 | 259,341 | 100.0% | $6,429,940 | $24.79 |
| (1) | Information obtained from the underwritten rent roll. |
| (2) | Certain tenants may have lease termination options that are exercisable prior to the originally stated expiration date of the subject lease and that are not considered in the Lease Expiration Schedule. |
The following table presents historical occupancy percentages at the 150 Royall Street Property:
Historical Occupancy
12/31/2012(1) | 12/31/2013(1) | 12/31/2014(1) | 4/1/2015(2) |
| NAV | NAV | NAV | 100.0% |
| (1) | Historical occupancy is not available, as the borrower recently acquired the 150 Royall Street Property, which was previously owner-occupied. |
| (2) | Information obtained from the underwritten rent roll. CB&I is currently not utilizing approximately 35,000 square feet of its space. Excluding this space, the physical occupancy was 86.5% as of April 1, 2015. |
Operating History and Underwritten Net Cash Flow. The following table presents certain information relating to the underwritten net cash flow at the 150 Royall Street Property:
Cash Flow Analysis(1)
U/W | % of U/W Effective Gross Income | U/W $ per SF | |
| Base Rent | $6,429,940 | 100.7% | $24.79 |
| Grossed Up Vacant Space | 0 | 0.0 | 0.00 |
| Total Reimbursables | 403,087 | 6.3 | 1.55 |
| Less Vacancy | (450,096)(2) | (7.1) | (1.74) |
| Effective Gross Income | $6,382,931 | 100.0% | $24.61 |
| Total Operating Expenses | $2,802,786 | 43.9% | $10.81 |
|
|
| |
| Net Operating Income | $3,580,145 | 56.1% | $13.80 |
| TI/LC | 389,012 | 6.1 | 1.50 |
| Capital Expenditures | 54,462 | 0.9 | 0.21 |
| Net Cash Flow | $3,136,672 | 49.1% | $12.09 |
| NOI DSCR | 1.61x | ||
| NCF DSCR | 1.41x | ||
| NOI DY | 9.4% | ||
| NCF DY | 8.2% |
| (1) | Historical financials are not available, as the borrower recently acquired the 150 Royall Street Property, which was previously owner-occupied. |
| (2) | The underwritten economic vacancy is 7.0%. The 150 Royall Street Property was 100.0% leased and 86.5% physically occupied as of April 1, 2015. |
THE INFORMATION IN THIS STRUCTURAL AND COLLATERAL TERM SHEET IS NOT COMPLETE AND MAY BE AMENDED PRIOR TO THE TIME OF SALE. THIS TERM SHEET IS NOT AN OFFER TO SELL THESE SECURITIES AND IT IS NOT A SOLICITATION OF AN OFFER TO BUY THESE SECURITIES IN ANY JURISDICTION WHERE THE OFFER OR SALE IS NOT PERMITTED.
| 48 |
| 150 ROYALL STREET |
Appraisal.As of the appraisal valuation date of February 25, 2015, the 150 Royall Street Property had an “as-is” appraised value of $58,900,000.
Environmental Matters. According to a Phase I environmental site assessment dated February 25, 2015, there was no evidence of any recognized environmental conditions at the 150 Royall Street Property.
Market Overview and Competition. The 150 Royall Street Property is located in Canton, Norfolk County, Massachusetts, approximately 15.5 miles southwest of the Boston central business district and 35.3 miles northeast of Providence, Rhode Island. The 150 Royall Street Property is situated along the south side of Royall Street, which runs parallel to Interstate 93, a major north/south artery. In addition to Interstate 93, primary access to the surrounding area is provided by Interstate 95, and secondary access is provided by Routes 1 and 138. In addition, the 150 Royall Street Property is located two miles northeast of the Canton Center Station of the local Massachusetts Bay Transportation Authority Commuter Rail line, which provides direct access to downtown Boston. The 150 Royall Street Property is situated within a commercial area that is home to the national headquarters of notable commercial tenants including Dunkin Brands and Reebok International. According to a third-party market research report, as of 2015, the estimated population within a three- and five-mile radius of the 150 Royall Street Property was 38,100 and 189,646, respectively, and the median household income within the same three- and five-mile radii was $86,415 and $76,329, respectively.
According to a third-party market research report, the 150 Royall Street Property is situated within the Route 1 South submarket of the Boston office market. As of the first quarter of 2015, the submarket reported a total inventory of 245 properties totaling approximately 8.0 million square feet with a 9.5% vacancy rate. The submarket reported a class A inventory comprising 18 properties totaling approximately 3.0 million square feet with a 7.7% vacancy rate. The appraiser concluded to a market rent for the 150 Royall Street Property of $27.50 per square foot, full service gross, which is approximately 10.9% above the average underwritten base rent.
The following table presents certain information relating to comparable properties to the 150 Royall Street Property:
Competitive Set(1)
150 Royall (Subject) | Dedham Executive Center | 45 Shawmut Road | Watermill Center | Hobbs Brook Office Park | Charles River Place | |
| Location | Canton, MA | Dedham, MA | Canton, MA | Waltham, MA | Waltham, MA | Needham, MA |
| Distance from Subject | -- | 8.6 miles | 4.8 miles | 15.6 miles | 19.4 miles | 11.3 miles |
| Property Type | Office | Office | Office | Office | Office | Office |
| Year Built/Renovated | 1985/2007 | 1974/2007 | 1998/NAP | 1984/NAP | 1989/2005 | 1995/1998 |
| Stories | 2 | 3 | 3 | 6 | 4 | 2 |
| Total GLA | 259,341 SF | 178,292 SF | 66,000 SF | 206,722 SF | 440,000 SF | 103,000 SF |
| Total Occupancy | 100% | 93% | 100% | 93% | 92% | 100% |
(1) Information obtained from the appraisal and third-party market research reports.
The Borrower.The borrower is BAC Canton Holdings LLC, a Delaware limited liability company and single purpose entity with one independent director. Legal counsel to the borrower delivered a non-consolidation opinion in connection with the origination of the 150 Royall Street Mortgage Loan. Jay O. Hirsh and James S. Hughes are the guarantors of certain nonrecourse carveouts under the 150 Royall Street Mortgage Loan.
The Sponsors.The sponsors are Jay O. Hirsh and James S. Hughes. Mr. Hirsh is the co-founder and managing partner of Jumbo Capital Management (“JCM”) and has extensive experience with real estate acquisitions, construction and renovation throughout the Boston metropolitan area. JCM has more than $75.0 million in equity under management with 17 properties totaling more than 1.0 million square feet. JCM’s portfolio comprises a variety of tenants including Oracle, Amphenol, Morgan Stanley, AT&T, Verizon, HUB International, Preferred Freezer Services and Waddington North America. Mr. Hughes is the founder and principal of Boston Andes Capital (“BAC”). BAC is a real estate investment, consulting, asset management and development firm headquartered in Boston. Since 2011, BAC has participated in a variety of real estate projects in the New England area, and assets currently under management include existing and new development office and apartment buildings.
Escrows.The loan documents provide for upfront reserves in the amount of $125,155 for real estate taxes and $187,253 for potential tenant improvements and leasing commissions (“TI/LCs”) related to the expansion space to be occupied by Gray, Gray & Gray. The loan documents also provide for ongoing monthly reserves of $62,578 for real estate taxes and $27,015 for general TI/LCs. The loan documents do not require monthly replacement reserves as long as (a) no event of default has occurred; and (b) the 150 Royall Street Property is being adequately maintained. The loan documents do not require monthly escrows for insurance, provided that (i) no event of default has occurred; (ii) the 150 Royall Street Property is insured via an acceptable blanket insurance policy; and (iii) the borrower provides the lender with evidence of renewal of the insurance policies and timely proof of payment of insurance premiums.
Lockbox and Cash Management.The 150 Royall Street Mortgage Loan requires a lender-controlled lockbox account, which is already in place, and that the borrower deposit all rents directly into such lockbox account. The loan documents also require that all rents received by the borrower or the property manager be deposited into the lockbox account within one business day of receipt. Prior to the occurrence of a Cash Trap Event Period (as defined below), all cash flow is distributed to the borrower. During a Cash Trap Event Period, all cash flow is swept to a lender-controlled cash management account.
THE INFORMATION IN THIS STRUCTURAL AND COLLATERAL TERM SHEET IS NOT COMPLETE AND MAY BE AMENDED PRIOR TO THE TIME OF SALE. THIS TERM SHEET IS NOT AN OFFER TO SELL THESE SECURITIES AND IT IS NOT A SOLICITATION OF AN OFFER TO BUY THESE SECURITIES IN ANY JURISDICTION WHERE THE OFFER OR SALE IS NOT PERMITTED.
| 49 |
| 150 ROYALL STREET |
A “Cash Trap Event Period” will commence upon the earlier of (i) the occurrence and continuance of an event of default; (ii) the amortizing debt service coverage ratio falling below 1.15x at the end of any calendar month; or (iii) the occurrence of a Tenant Trigger Event (as defined below). A Cash Trap Event Period will be cured, with regard to clause (i), upon the cure of such event of default; with regard to clause (ii), upon the amortizing debt service coverage ratio being equal to or greater than 1.25x for two consecutive calendar quarters; and with regard to clause (iii), upon the termination of such Tenant Trigger Event.
A “Tenant Trigger Event” will commence upon either CB&I or OneBeacon (or either tenant’s parent company, as applicable) (i) filing for bankruptcy or becoming insolvent; (ii) defaulting under its lease; (iii) receiving a rent reduction; (iv) indicating its intention to terminate its lease; (v) going dark; or (vi) failing to exercise its extension option at least (a) 18 months prior to its lease expiration date for CB&I and (b) 12 months prior to its lease expiration date for OneBeacon. A Tenant Trigger Event will be cured, with regard to clause (i), upon the applicable tenant having its lease affirmed in connection with a plan of reorganization and commencing the payment and performance of its obligations under such lease; and with respect to clauses (ii) through (vi), upon the applicable tenant resuming operations in accordance with the terms of its lease for a period of 60 days. In addition, a Tenant Trigger Event triggered by clauses (i) through (vi) will be cured upon the date on which the applicable tenant’s space has been leased to one or more replacement tenants acceptable to the lender; such replacement tenants are paying full, unabated rent, and are in occupancy of and utilizing their space; and all required tenant improvements required under such replacement tenant lease have been completed.
Property Management. The 150 Royall Street Property is managed by an affiliate of the borrower.
Assumption.The borrower has a two-time right to transfer the 150 Royall Street Property, provided that certain conditions are satisfied, including (i) no event of default has occurred and is continuing; (ii) the lender has reasonably determined that the proposed transferee and guarantor satisfy the lender’s credit review and underwriting standards, taking into consideration transferee’s experience, financial strength and general business standing; and (iii) the lender has received confirmation from Fitch, KBRA and Moody’s that such assumption will not result in a downgrade, withdrawal or qualification of the respective ratings assigned to the Series 2015-C29 Certificates.
Partial Release. Not permitted.
Real Estate Substitution.Not permitted.
Subordinate and Mezzanine Indebtedness.None.
Ground Lease. None
Terrorism Insurance. The loan documents require that the “all risk” insurance policy required to be maintained by the borrower provides coverage for terrorism in an amount equal to the full replacement cost of the 150 Royall Street Property; provided however, if the Terrorism Risk Insurance Program Reauthorization Act is discontinued or not renewed, the borrower will not be required to pay annual premiums in excess of two times the amount of a standalone all-risk poicy. The loan documents also require business interruption insurance covering no less than the 18-month period following the occurrence of a casualty event, together with a six-month extended period of indemnity.
THE INFORMATION IN THIS STRUCTURAL AND COLLATERAL TERM SHEET IS NOT COMPLETE AND MAY BE AMENDED PRIOR TO THE TIME OF SALE. THIS TERM SHEET IS NOT AN OFFER TO SELL THESE SECURITIES AND IT IS NOT A SOLICITATION OF AN OFFER TO BUY THESE SECURITIES IN ANY JURISDICTION WHERE THE OFFER OR SALE IS NOT PERMITTED.
| 50 |
[THIS PAGE INTENTIONALLY LEFT BLANK.]
THE INFORMATION IN THIS STRUCTURAL AND COLLATERAL TERM SHEET IS NOT COMPLETE AND MAY BE AMENDED PRIOR TO THE TIME OF SALE. THIS TERM SHEET IS NOT AN OFFER TO SELL THESE SECURITIES AND IT IS NOT A SOLICITATION OF AN OFFER TO BUY THESE SECURITIES IN ANY JURISDICTION WHERE THE OFFER OR SALE IS NOT PERMITTED.
| 51 |
| WPC SELF STORAGE PORTFOLIO VII |
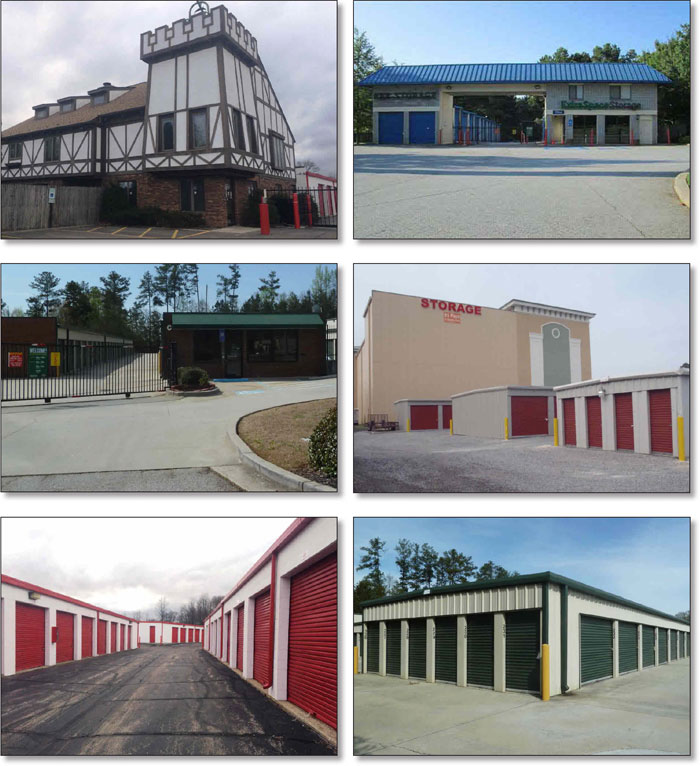
THE INFORMATION IN THIS STRUCTURAL AND COLLATERAL TERM SHEET IS NOT COMPLETE AND MAY BE AMENDED PRIOR TO THE TIME OF SALE. THIS TERM SHEET IS NOT AN OFFER TO SELL THESE SECURITIES AND IT IS NOT A SOLICITATION OF AN OFFER TO BUY THESE SECURITIES IN ANY JURISDICTION WHERE THE OFFER OR SALE IS NOT PERMITTED.
| 52 |
| WPC SELF STORAGE PORTFOLIO VII |
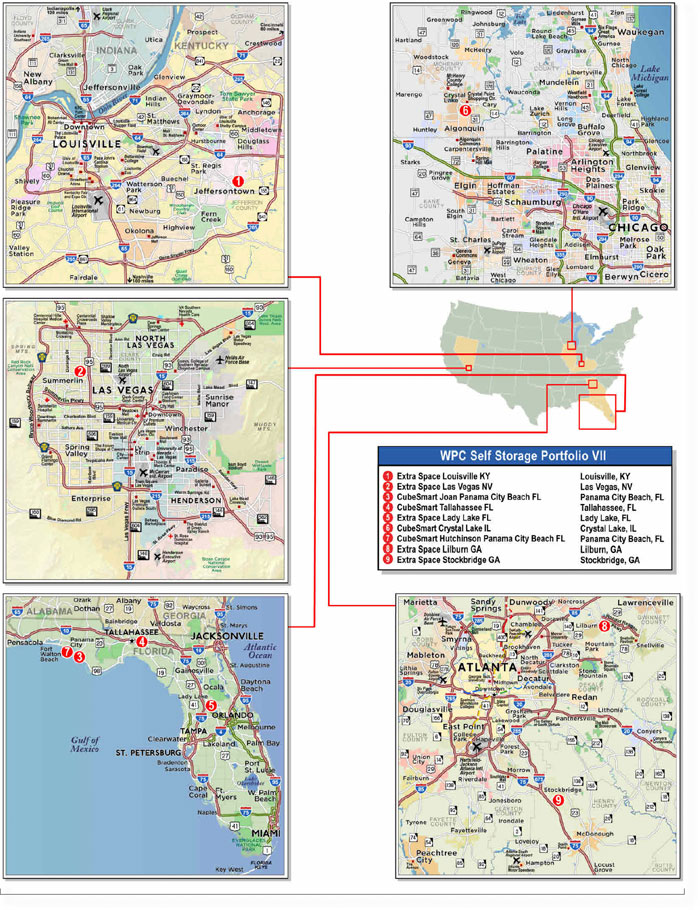
THE INFORMATION IN THIS STRUCTURAL AND COLLATERAL TERM SHEET IS NOT COMPLETE AND MAY BE AMENDED PRIOR TO THE TIME OF SALE. THIS TERM SHEET IS NOT AN OFFER TO SELL THESE SECURITIES AND IT IS NOT A SOLICITATION OF AN OFFER TO BUY THESE SECURITIES IN ANY JURISDICTION WHERE THE OFFER OR SALE IS NOT PERMITTED.
| 53 |
| No. 4 – WPC Self Storage Portfolio VII | ||||||||
| Loan Information | Property Information | |||||||
| Mortgage Loan Seller: | Wells Fargo Bank, National Association | Single Asset/Portfolio: | Portfolio | |||||
| Credit Assessment (Fitch/KBRA/Moody’s): | NR/NR/NR | Property Type: | Self Storage | |||||
| Original Principal Balance: | $37,245,000 | Specific Property Type: | Self Storage | |||||
| Cut-off Date Principal Balance: | $37,245,000 | Location: | Various – See Table | |||||
| % of Initial Pool Balance: | 3.2% | Size: | 650,686 SF | |||||
| Loan Purpose: | Acquisition | Cut-off Date Principal Balance Per SF: | $57.24 | |||||
| Borrower Names(1): | Various | Year Built/Renovated: | Various – See Table | |||||
| Sponsor: | Corporate Property Associates 18 – Global Incorporated | Title Vesting: | Fee | |||||
| Mortgage Rate: | 4.300% | Property Manager(3): | Various | |||||
| Note Date: | May 27, 2015 | 3rdMost Recent Occupancy (As of)(4): | NAV (12/31/2012) | |||||
| Anticipated Repayment Date: | NAP | 2ndMost Recent Occupancy (As of)(4): | 80.7% (12/31/2013) | |||||
| Maturity Date: | June 11, 2025 | Most Recent Occupancy (As of)(4): | 84.0% (12/31/2014) | |||||
| IO Period: | 120 months | Current Occupancy (As of)(4): | 88.3% (Various) | |||||
| Loan Term (Original): | 120 months | |||||||
| Seasoning: | 0 months | Underwriting and Financial Information: | ||||||
| Amortization Term (Original): | NAP | |||||||
| Loan Amortization Type: | Interest-only, Balloon | 3rdMost Recent NOI (As of)(5): | $3,059,624 (Various) | |||||
| Interest Accrual Method: | Actual/360 | 2ndMost Recent NOI (As of): | $3,613,336 (12/31/2014) | |||||
| Call Protection: | L(24),D(92),O(4) | Most Recent NOI (As of)(5): | $3,760,875 (Various) | |||||
| Lockbox Type: | Springing (Without Established Account) | |||||||
| Additional Debt: | None | U/W Revenues: | $5,789,282 | |||||
| Additional Debt Type: | NAP | U/W Expenses: | $2,407,887 | |||||
| U/W NOI: | $3,381,395 | |||||||
| U/W NCF: | $3,249,081 | |||||||
| U/W NOI DSCR: | 2.08x | |||||||
| Escrows and Reserves(2): | U/W NCF DSCR: | 2.00x | ||||||
| U/W NOI Debt Yield: | 9.1% | |||||||
| Type: | Initial | Monthly | Cap (If Any) | U/W NCF Debt Yield: | 8.7% | |||
| Taxes | $0 | Springing | NAP | As-Is Appraised Value: | $57,350,000 | |||
| Insurance | $0 | Springing | NAP | As-Is Appraisal Valuation Date(6): | Various | |||
| Replacement Reserves | $0 | Springing | NAP | Cut-off Date LTV Ratio: | 64.9% | |||
| Amortization Reserves | $0 | Springing | NAP | LTV Ratio at Maturity or ARD: | 64.9% | |||
| (1) | See “The Borrowers” section. |
| (2) | See “Escrows” section. |
| (3) | See “Property Management” section. |
| (4) | See “Historical Occupancy” section. |
| (5) | See “Cash Flow Analysis” section. |
| (6) | See “Appraisal” section. |
The Mortgage Loan. The mortgage loan (the “WPC Self Storage Portfolio VII Mortgage Loan”) is evidenced by a single promissory note that is secured by first mortgages encumbering nine self storage properties located in five states (the “WPC Self Storage Portfolio VII Properties”). The WPC Self Storage Portfolio VII Mortgage Loan was originated on May 27, 2015 by Wells Fargo Bank, National Association. The WPC Self Storage Portfolio VII Mortgage Loan had an original principal balance of $37,245,000, has an outstanding principal balance as of the Cut-off Date of $37,245,000 and accrues interest at an interest rate of 4.300%per annum. The WPC Self Storage Portfolio VII Mortgage Loan had an initial term of 120 months, has a remaining term of 120 months as of the Cut-off Date and requires interest-only payments through the term of the WPC Self Storage Portfolio VII Mortgage Loan. The WPC Self Storage Portfolio VII Mortgage Loan matures on June 11, 2025.
Following the lockout period, the borrower has the right to defease the WPC Self Storage Portfolio VII Mortgage Loan in whole or in part (see “Partial Release” section), on any day before March 11, 2025. In addition, the WPC Self Storage Portfolio VII Mortgage Loan is prepayable without penalty on or after March 11, 2025.
THE INFORMATION IN THIS STRUCTURAL AND COLLATERAL TERM SHEET IS NOT COMPLETE AND MAY BE AMENDED PRIOR TO THE TIME OF SALE. THIS TERM SHEET IS NOT AN OFFER TO SELL THESE SECURITIES AND IT IS NOT A SOLICITATION OF AN OFFER TO BUY THESE SECURITIES IN ANY JURISDICTION WHERE THE OFFER OR SALE IS NOT PERMITTED.
| 54 |
| WPC SELF STORAGE PORTFOLIO VII |
Sources and Uses
| Sources | Uses | |||||||
| Original loan amount | $37,245,000 | 64.5% | Purchase price | $57,300,000 | 99.2% | |||
| Sponsor’s new cash contribution | 20,511,503 | 35.5% | Closing costs | 456,503 | 0.8 | |||
| Total Sources | $57,756,503 | 100.0% | Total Uses | $57,756,503 | 100.0% |
The Properties.The WPC Self Storage Portfolio VII Mortgage Loan is secured by the fee interest in a portfolio of nine self storage properties totaling 650,686 rentable square feet or 5,487 units (including 311 RV spots) and located in five states: Florida (4), Georgia (2), Nevada (1), Kentucky (1), and Illinois (1). The WPC Self Storage Portfolio VII Properties range in size from 32,358 square feet to 118,780 square feet and as of dates ranging from March 31, 2015, to April 22, 2015, the WPC Self Storage Portfolio VII Properties were 88.3% occupied.
The following table presents certain information relating to the WPC Self Storage Portfolio VII Properties:
| Property Name – Location | Allocated Cut-off Date Principal Balance | % of Portfolio Cut-off Date Principal Balance | Occupancy | Year Built/ Renovated | Net Rentable Area (SF) | Appraised Value | Allocated LTV |
| Extra Space – Louisville, KY | $6,607,250 | 17.7% | 97.8% | 1998/2008 | 103,497 | $10,200,000 | 64.8% |
| Extra Space – Las Vegas, NV | $6,370,000 | 17.1% | 93.4% | 1996/NAP | 74,045 | $9,800,000 | 65.0% |
| CubeSmart – Panama City Beach, FL (Joan Avenue) | $6,175,000 | 16.6% | 84.3% | 1996/NAP | 86,426 | $9,500,000 | 65.0% |
| CubeSmart – Tallahassee, FL | $4,923,750 | 13.2% | 75.1% | 1999/NAP | 118,780 | $7,600,000 | 64.8% |
| Extra Space – Lady Lake, FL | $3,948,750 | 10.6% | 88.6% | 2010/NAP | 68,750 | $6,100,000 | 64.7% |
| CubeSmart – Crystal Lake, IL | $2,632,500 | 7.1% | 85.4% | 1976/NAP | 58,157 | $4,050,000 | 65.0% |
| CubeSmart – Panama City Beach, FL (Hutchinson Boulevard) | $2,622,750 | 7.0% | 97.9% | 1997/NAP | 42,301 | $4,000,000 | 65.6% |
| Extra Space – Lilburn, GA | $2,340,000 | 6.3% | 90.8% | 1988/NAP | 66,372 | $3,600,000 | 65.0% |
| Extra Space – Stockbridge, GA | $1,625,000 | 4.4% | 91.8% | 2003/NAP | 32,358 | $2,500,000 | 65.0% |
| Total/Weighted Average | $37,245,000 | 100.0% | 88.3% | 650,686 | $57,350,000 | 64.9% |
The following table presents historical occupancy percentages at the WPC Self Storage Portfolio VII Properties:
Historical Occupancy
12/31/2012 | 12/31/2013(1) | 12/31/2014(1) | Various(2) |
| NAV | 80.7% | 84.0% | 88.3% |
| (1) | Information obtained from the borrower. |
| (2) | Information obtained from the underwritten rent roll. Current Occupancy is based on dates ranging from March 31, 2015 to April 22, 2015. |
THE INFORMATION IN THIS STRUCTURAL AND COLLATERAL TERM SHEET IS NOT COMPLETE AND MAY BE AMENDED PRIOR TO THE TIME OF SALE. THIS TERM SHEET IS NOT AN OFFER TO SELL THESE SECURITIES AND IT IS NOT A SOLICITATION OF AN OFFER TO BUY THESE SECURITIES IN ANY JURISDICTION WHERE THE OFFER OR SALE IS NOT PERMITTED.
| 55 |
| WPC SELF STORAGE PORTFOLIO VII |
Operating History and Underwritten Net Cash Flow. The following table presents certain information relating to the historical operating performance and the underwritten net cash flow at the WPC Self Storage Portfolio VII Properties:
Cash Flow Analysis
Various(1) | 2014 | Various(2) | U/W | % of U/W Effective Gross Income | U/W $ per SF | ||||||||
| Base Rent | $4,815,783 | $5,315,809 | $5,444,327 | $5,886,837 | 101.7% | $9.05 | |||||||
| Grossed Up Vacant Space | 0 | 0 | 0 | 819,612 | 14.1 | 1.26 | |||||||
| Less Concessions | 0 | 0 | 0 | 0 | 0.0 | 0.00 | |||||||
| Other Income | 233,654 | 332,393 | 349,050 | 349,050 | 6.0 | 0.54 | |||||||
| Less Vacancy & Credit Loss | 0 | 0 | 0 | (1,266,217)(3) | (21.9) | (1.95) | |||||||
| Effective Gross Income | $5,049,437 | $5,648,201 | $5,793,377 | $5,789,282 | 100.0% | $8.90 | |||||||
| Total Operating Expenses | $1,989,813 | $2,034,865 | $2,032,503 | $2,407,887 | 41.6% | 3.70 | |||||||
| Net Operating Income | $3,059,624 | $3,613,336 | $3,760,875 | $3,381,395 | 58.4% | $5.20 | |||||||
| Capital Expenditures | 0 | 0 | 0 | 132,314 | 2.3 | 0.20 | |||||||
| Net Cash Flow | $3,059,624 | $3,613,336 | $3,760,875 | $3,249,081 | 56.1% | $4.99 | |||||||
| NOI DSCR | 1.88x | 2.22x | 2.31x | 2.08x | |||||||||
| NCF DSCR | 1.88x | 2.22x | 2.31x | 2.00x | |||||||||
| NOI DY | 8.2% | 9.7% | 10.1% | 9.1% | |||||||||
| NCF DY | 8.2% | 9.7% | 10.1% | 8.7% | |||||||||
| (1) | The 2013 financials represent the year-end 2013 period for eight of the WPC Self Storage Portfolio VII Properties and the trailing 12-month period ending April 30, 2014 for one of the WPC Self Storage Portfolio VII Properties. |
| (2) | The most recent financials represent the trailing 12-month period ending January 31, 2015 for one of the WPC Self Storage Portfolio VII Properties, February 28, 2015 for one of the WPC Self Storage Portfolio VII Properties and March 31, 2015 for seven of the WPC Self Storage Portfolio VII Properties. |
| (3) | The underwritten economic vacancy is 18.9%. As of dates ranging from March 31, 2015 to April 22, 2015, the WPC Self Storage Portfolio VII Properties were 88.3% physically occupied. |
Appraisal. As of the appraisal valuation dates ranging from April 1, 2015 to April 25, 2015, the WPC Self Storage Portfolio VII Properties had an aggregate “as-is” appraised value of $57,350,000.
Environmental Matters. According to Phase I environmental assessments dated December 31, 2014 through May 13, 2015, there was no evidence of any recognized environmental conditions at any of the WPC Self Storage Portfolio VII Properties.
The Borrowers. The borrower structure comprises eight separate Delaware limited liability companies, each of which is a single purpose entity with one independent director. Legal counsel to the borrower provided a non-consolidation opinion in connection with the origination of the WPC Self Storage Portfolio VII Mortgage Loan. Corporate Property Associates 18 – Global Incorporated (“CPA 18”) is the guarantor of certain nonrecourse carveouts under the WPC Self Storage Portfolio VII Mortgage Loan.
The Sponsor. The sponsor is CPA 18, a non-traded real estate investment trust. CPA 18 is managed by W.P. Carey (NYSE:WPC), an investment management company that provides long-term sale-leaseback and build-to-suit financing for companies worldwide. As of March 31, 2015, W.P. Carey managed a global investment portfolio comprising 852 commercial properties totaling 89.2 million square feet with an average occupancy rate of 98.4%.
Escrows. The loan documents do not require monthly escrows for real estate taxes provided the following conditions are met: (i) no event of default has occurred and is continuing and (ii) the borrower has provided the lender with timely proof of full payment. The loan documents do not require monthly escrows for insurance provided the following conditions are met: (i) no event of default has occurred and is continuing; (ii) the WPC Self Storage Portfolio VII Properties are insured via an acceptable blanket insurance policy; and (iii) the borrower provides the lender with evidence of renewal of the policies and timely proof of payment of the insurance premiums. The loan documents do not require monthly reserves for replacement reserves except upon the occurrence and continuance of an event of default, when the borrower will be required to deposit $10,845 monthly into a replacement reserve escrow.
The WPC Self Storage Portfolio VII Mortgage Loan is also structured with an amortization reserve account. During an Amortization Deposit Period (as defined below), the borrower is required to make monthly deposits into the amortization reserve account, as outlined in the amortization schedule in the loan agreement. The scheduled payments outlined in the amortization schedule are equivalent to the hypothetical principal payments assuming the WPC Self Storage Portfolio VII Mortgage Loan had a 30-year amortization period (with the same 4.300%per annum interest rate).
An “Amortization Deposit Period” is defined as any period on or after July 11, 2020, commencing upon the net cash flow debt yield being less than 10.5% at the end of any calendar quarter and ending when the net cash flow debt yield is equal to or greater than 11.0% for one calendar quarter.
Lockbox and Cash Management.Upon the occurrence of a Cash Trap Event Period (as defined below), the borrower will be required to establish a lender-controlled lockbox account and direct all tenants to deposit all rents directly into such lockbox account. Additionally, all revenues and other monies received by the borrower or property manager relating to the WPC Self Storage Portfolio VII Properties will be deposited into the lockbox account. During a Cash Trap Event Period, all excess funds on deposit in the lockbox account are swept to a lender-controlled subaccount on a monthly basis.
THE INFORMATION IN THIS STRUCTURAL AND COLLATERAL TERM SHEET IS NOT COMPLETE AND MAY BE AMENDED PRIOR TO THE TIME OF SALE. THIS TERM SHEET IS NOT AN OFFER TO SELL THESE SECURITIES AND IT IS NOT A SOLICITATION OF AN OFFER TO BUY THESE SECURITIES IN ANY JURISDICTION WHERE THE OFFER OR SALE IS NOT PERMITTED.
| 56 |
| WPC SELF STORAGE PORTFOLIO VII |
A “Cash Trap Event Period” will commence upon the earlier of (i) the occurrence and continuance of an event of default; and (ii) the amortizing debt service coverage ratio (based on a 30-year amortization period) for the trailing 12-month period falling below 1.20x at the end of any calendar month. A Cash Trap Event Period will expire, with regard to clause (i), upon the cure of such event of default; and with regard to clause (ii), upon the amortizing debt service coverage ratio being equal to or greater than 1.30x for two consecutive calendar quarters.
Property Management.The WPC Self Storage Portfolio VII Properties are managed by Extra Space Management, Inc. and CubeSmart Asset Management, LLC.
Assumption. The borrower has a two-time right to transfer the WPC Self Storage Portfolio VII Properties in whole, provided that no event of default has occurred and is continuing and certain other conditions are satisfied, including (i) the lender’s reasonable determination that the proposed transferee and guarantor satisfy the lender’s credit review and underwriting standards, taking into consideration transferee experience, financial strength and general business standing; (ii) execution of a recourse guaranty and an environmental indemnity by an affiliate of the transferee; and (iii) if requested by the lender, rating agency confirmation from Fitch, KBRA and Moody’s that the transfer will not result in a downgrade, withdrawal or qualification of the respective ratings assigned to the Series 2015-C29 Certificates.
The borrower also has a two-time right to transfer any individual property (provided that any given property can only be transferred once) along with the allocated loan amount of such a transferred property in the WPC Self Storage Portfolio VII Mortgage Loan (“Partial Assumption”), provided that no event of default has occurred and is continuing and certain other conditions are satisfied, including (i) the portion of the WPC Self Storage Portfolio VII Mortgage Loan relating to the transferred property shall no longer be cross-collateralized and/or cross-defaulted with the remaining properties of the WPC Self Storage Portfolio VII Mortgage Loan; (ii) the loan-to-value ratio of both the property proposed to be transferred and the properties that would be remaining if such transfer occurred must be no greater than 65.0%; (iii) the amortizing debt service coverage ratio of both the property proposed to be transferred and the properties that would be remaining if such transfer occurred must be greater than 1.40x; and clauses (i) through (iii) outlined in the paragraph above.
Partial Release.Following the lockout period, the borrower is permitted to partially release any constituent properties in connection with a partial defeasance, subject to certain conditions including (i) no event of default has occurred and is continuing; (ii) partial defeasance of 125% of the released property’s allocated loan balance; (iii) the loan-to-value with respect to the remaining properties will be no greater than the lesser of 64.9% and the loan-to-value immediately prior to the release; (iv) the amortizing debt service coverage ratio (based on a 30-year amortization period) with respect to the remaining properties will be no less than the greater of the debt service coverage ratio at loan closing and the amortizing debt service coverage ratio immediately prior to the release; and (v) if required by the lender, receipt of rating agency confirmation from Fitch, KBRA and Moody’s that the release will not result in a downgrade, withdrawal or qualification of the respective ratings assigned to the Series 2015-C29 Certificates.
Real Estate Substitution.The borrower may obtain a release of any individual WPC Self Storage Portfolio VII Properties from the lien of the mortgage in connection with a substitution of a different property subject to the satisfaction of certain conditions, including without limitation (i) no event of default has occurred and is continuing; (ii) the substituted property must have a current appraised value equal to or greater than that of the released property, and the loan-to-value of the properties remaining following the substitution must be no greater than the lesser of 64.9% and the loan-to-value immediately prior to the substitution; (iii) the substituted property shall be equal or superior to that of the release property as to physical condition, building use and quality, lease terms favorable to the borrower and market attributes as determined by the lender; (iv) the substituted property must have a debt service coverage ratio equal to or greater than the released property, and the trailing 12-month amortizing debt service coverage ratio for the properties remaining following the substitution must be no less than the greater of the debt service coverage ratio at loan closing and the debt service coverage ratio prior to the substitution; (v) the lender receives a legal opinion that the substitution satisfies REMIC requirements; and (vi) the lender receives rating agency confirmation from Fitch, KBRA and Moody’s that the substitution will not result in a downgrade, withdrawal or qualification of the respective ratings assigned to the Series 2015-C29 Certificates.
Subordinate and Mezzanine Indebtedness.Not permitted.
Ground Lease. None.
Terrorism Insurance. The loan documents require that the “all risk” insurance policy required to be maintained by the borrower provide coverage for terrorism in an amount equal to the full replacement cost of the WPC Self Storage Portfolio VII Properties, as well as business interruption insurance covering no less than the 18-month period following the occurrence of a casualty event, together with a six-month extended period of indemnity.
Windstorm Insurance.The loan documents require windstorm insurance covering the full replacement cost of the WPC Self Storage Portfolio VII Properties during the loan term. At the time of loan closing, the WPC Self Storage Portfolio Properties had insurance coverage for windstorm.
THE INFORMATION IN THIS STRUCTURAL AND COLLATERAL TERM SHEET IS NOT COMPLETE AND MAY BE AMENDED PRIOR TO THE TIME OF SALE. THIS TERM SHEET IS NOT AN OFFER TO SELL THESE SECURITIES AND IT IS NOT A SOLICITATION OF AN OFFER TO BUY THESE SECURITIES IN ANY JURISDICTION WHERE THE OFFER OR SALE IS NOT PERMITTED.
| 57 |
[THIS PAGE INTENTIONALLY LEFT BLANK.]
THE INFORMATION IN THIS STRUCTURAL AND COLLATERAL TERM SHEET IS NOT COMPLETE AND MAY BE AMENDED PRIOR TO THE TIME OF SALE. THIS TERM SHEET IS NOT AN OFFER TO SELL THESE SECURITIES AND IT IS NOT A SOLICITATION OF AN OFFER TO BUY THESE SECURITIES IN ANY JURISDICTION WHERE THE OFFER OR SALE IS NOT PERMITTED.
| 58 |
| QUEENS’ MARKETPLACE |
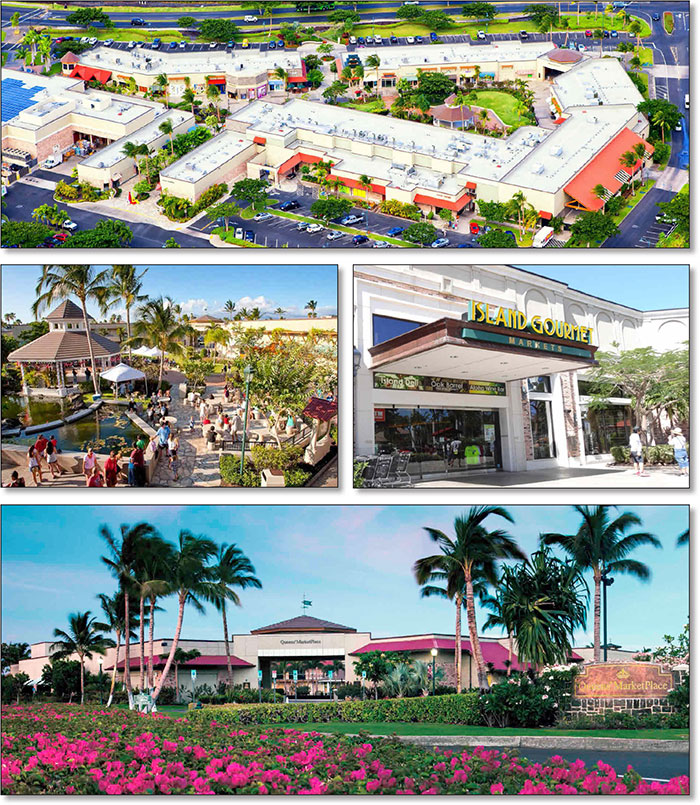
THE INFORMATION IN THIS STRUCTURAL AND COLLATERAL TERM SHEET IS NOT COMPLETE AND MAY BE AMENDED PRIOR TO THE TIME OF SALE. THIS TERM SHEET IS NOT AN OFFER TO SELL THESE SECURITIES AND IT IS NOT A SOLICITATION OF AN OFFER TO BUY THESE SECURITIES IN ANY JURISDICTION WHERE THE OFFER OR SALE IS NOT PERMITTED.
| 59 |
| QUEENS’ MARKETPLACE |
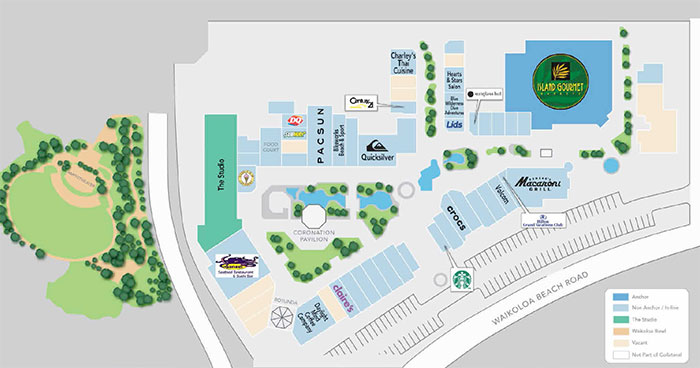
THE INFORMATION IN THIS STRUCTURAL AND COLLATERAL TERM SHEET IS NOT COMPLETE AND MAY BE AMENDED PRIOR TO THE TIME OF SALE. THIS TERM SHEET IS NOT AN OFFER TO SELL THESE SECURITIES AND IT IS NOT A SOLICITATION OF AN OFFER TO BUY THESE SECURITIES IN ANY JURISDICTION WHERE THE OFFER OR SALE IS NOT PERMITTED.
| 60 |
| QUEENS’ MARKETPLACE |

THE INFORMATION IN THIS STRUCTURAL AND COLLATERAL TERM SHEET IS NOT COMPLETE AND MAY BE AMENDED PRIOR TO THE TIME OF SALE. THIS TERM SHEET IS NOT AN OFFER TO SELL THESE SECURITIES AND IT IS NOT A SOLICITATION OF AN OFFER TO BUY THESE SECURITIES IN ANY JURISDICTION WHERE THE OFFER OR SALE IS NOT PERMITTED.
| 61 |
| No. 5 – Queens’ MarketPlace | |||||||
| Loan Information | Property Information | ||||||
| Mortgage Loan Seller: | Wells Fargo Bank, National Association | Single Asset/Portfolio: | Single Asset | ||||
Credit Assessment (Fitch/KBRA/Moody’s): | NR/NR/NR | Property Type: | Retail | ||||
| Original Principal Balance: | $35,000,000 | Specific Property Type: | Anchored | ||||
| Cut-off Date Principal Balance: | $35,000,000 | Location: | Waikoloa, HI | ||||
| % of Initial Pool Balance: | 3.0% | Size: | 130,925 SF | ||||
| Loan Purpose: | Refinance | Cut-off Date Principal Balance Per SF: | $267.33 | ||||
| Borrower Name: | Queens’ Market, LLC | Year Built/Renovated: | 2007/NAP | ||||
| Sponsors: | Waikoloa Development Co.; Seligman & Associates, Inc. | Title Vesting: | Fee | ||||
| Mortgage Rate: | 4.130% | Property Manager: | Self-managed | ||||
| Note Date: | May 21, 2015 | 3rdMost Recent Occupancy (As of)(3): | 57.2% (12/31/2012) | ||||
| Anticipated Repayment Date: | NAP | 2ndMost Recent Occupancy (As of)(3): | 62.3% (12/31/2013) | ||||
| Maturity Date: | June 11, 2025 | Most Recent Occupancy (As of)(3): | 66.9% (12/31/2014) | ||||
| IO Period: | 120 months | Current Occupancy (As of)(3): | 66.1% (4/3/2015) | ||||
| Loan Term (Original): | 120 months | ||||||
| Seasoning: | 0 months | Underwriting and Financial Information: | |||||
| Amortization Term (Original): | NAP | ||||||
| Loan Amortization Type: | Interest-only, Balloon | 3rdMost Recent NOI (As of)(4): | $2,617,691 (12/31/2013) | ||||
| Interest Accrual Method: | Actual/360 | 2ndMost Recent NOI (As of)(4): | $3,166,454 (12/31/2014) | ||||
| Call Protection: | L(24),D(91),O(5) | Most Recent NOI (As of): | $3,156,655 (TTM 2/28/2015) | ||||
| Lockbox Type: | Springing (Without Established Account) | ||||||
| Additional Debt(1): | Yes | U/W Revenues: | $7,144,696 | ||||
| Additional Debt Type(1): | Future Mezzanine | U/W Expenses: | $3,841,397 | ||||
| U/W NOI: | $3,303,299 | ||||||
| Escrows and Reserves(2): | U/W NCF: | $3,083,595 | |||||
| U/W NOI DSCR: | 2.25x | ||||||
| Type: | Initial | Monthly | Cap (If Any) | U/W NCF DSCR: | 2.10x | ||
| Taxes | $144,205(2) | $28,841(2) | NAP | U/W NOI Debt Yield: | 9.4% | ||
| Insurance | $0 | Springing | NAP | U/W NCF Debt Yield: | 8.8% | ||
| Replacement Reserves | $0 | $1,637 | NAP | As-Is Appraised Value: | $55,500,000 | ||
| TI/LC Reserve | $0 | $9,275(2) | $334,000(2) | As-Is Appraisal Valuation Date: | April 1, 2015 | ||
| Rent Concession Reserve | $164,280 | $0 | NAP | Cut-off Date LTV Ratio: | 63.1% | ||
| Outstanding TI/LC Reserve | $688,807 | $0 | NAP | LTV Ratio at Maturity or ARD: | 63.1% | ||
| (1) | See “Subordinate and Mezzanine Indebtedness” section. |
| (2) | See “Escrows” section. |
| (3) | Historical and Current Occupancy excludes 14,205 square feet (10.8% of net rentable area) leased to a borrower-related entity through April 2021, which is currently vacant. Inclusive of the borrower-related lease, Current Occupancy was 77.0% as of April 3, 2015. See “The Property” and “Cash Flow Analysis” sections. |
| (4) | See “Cash Flow Analysis” section. |
The Mortgage Loan.The mortgage loan (the “Queens’ MarketPlace Mortgage Loan”) is evidenced by a single promissory note that is secured by a first mortgage encumbering an anchored retail center located in Waikoloa, Hawaii (the “Queens’ MarketPlace Property”). The Queens’ MarketPlace Mortgage Loan was originated on May 21, 2015 by Wells Fargo Bank, National Association. The Queens’ MarketPlace Mortgage Loan had an original principal balance of $35,000,000, has an outstanding principal balance as of the Cut-off Date of $35,000,000 and accrues interest at an interest rate of 4.130%per annum. The Queens’ MarketPlace Mortgage Loan had an initial term of 120 months, has a remaining term of 120 months as of the Cut-off Date and requires interest-only payments through the term of the Queens’ MarketPlace Mortgage Loan. The Queens’ MarketPlace Mortgage Loan matures on June 11, 2025.
Following the lockout period, the borrower has the right to defease the Queens’ MarketPlace Mortgage Loan in whole, but not in part, on any date before February 11, 2025. In addition, the Queens’ MarketPlace Mortgage Loan is prepayable without penalty on or after February 11, 2025.
THE INFORMATION IN THIS STRUCTURAL AND COLLATERAL TERM SHEET IS NOT COMPLETE AND MAY BE AMENDED PRIOR TO THE TIME OF SALE. THIS TERM SHEET IS NOT AN OFFER TO SELL THESE SECURITIES AND IT IS NOT A SOLICITATION OF AN OFFER TO BUY THESE SECURITIES IN ANY JURISDICTION WHERE THE OFFER OR SALE IS NOT PERMITTED.
| 62 |
| QUEENS’ MARKETPLACE |
Sources and Uses
| Sources | Uses | |||||||
| Original loan amount | $35,000,000 | 100.0% | Loan payoff | $18,997,437 | 54.3% | |||
| Reserves | 997,292 | 2.8 | ||||||
| Closing costs | 223,202 | 0.6 | ||||||
| Return of equity | 14,782,069 | 42.2 | ||||||
| Total Sources | $35,000,000 | 100.0% | Total Uses | $35,000,000 | 100.0% |
The Property.The Queens’ MarketPlace Property comprises a two-story, open-air shopping center totaling 130,925 square feet of rentable area that was constructed in 2007 on 29.2-acres and is located in Waikoloa, Hawaii (on “The Big Island” of Hawaii). The Queens’ MarketPlace Property is located along the Kohala Coast on the west side of The Big Island, within the Waikoloa Beach Resort, approximately 18.0 miles northwest of the Kona International Airport. The Waikoloa Beach Resort is a 1,150-acre resort community that has over 3,400 hotel rooms and luxury residential units. The Queens’ MarketPlace Property features a plaza area with a gazebo, exterior dining patios, seating areas throughout, a Koi pond and fountain with a bridge, and tropical, landscaped areas. Further, the 10.8-acre, 5,000-seat, open-air Waikoloa Bowl amphitheater was completed in 2008 and is part of the collateral for the Queens’ MarketPlace Mortgage Loan (however no income or value was attributed to this parcel or improvements – see “Free Release” section). The Waikoloa Bowl presents local Hawaiian music concerts, hula shows and big name bands and artists that provide a significant draw to the Queens’ MarketPlace Property.
The Queens’ MarketPlace Property features 10 buildings and was originally developed by the borrower in 2007 at an estimated cost of $66.4 million. As a result of the economic downturn, a portion of the initial construction loan for the Queens’ MarketPlace Property was forgiven, resulting in a discounted payoff. See “Description of the Mortgage Pool – Default History, Bankruptcy Issues and Other Proceedings” in the Free Writing Prospectus. The Queens’ MarketPlace Property is anchored by Island Gourmet Markets (18.0% of net rentable area), a Hawaiian-based grocery store offering fresh local and organic produce, seafood and numerous other offerings. Island Gourmet Markets generated sales of approximately $22.2 million ($938 per square foot) as of the trailing 12-month period ending February 2015, a 4.2% increase over 2013 levels. The remainder of the in-line tenancy is comprised of three restaurants and national and local retailers. Reporting in-line tenants (totaling 41.7% of net rentable area) generated sales of approximately $32.4 million as of the trailing 12-month period ending February 2015, or $593 per square foot. Including Island Gourmet Markets, the Queens’ MarketPlace Property generated total sales of approximately $54.6 million, or $697 per square foot as of the trailing-twelve months February 2015. The Queens’ MarketPlace Property contains 553 surface parking spaces, resulting in a parking ratio of 4.2 spaces per 1,000 square feet of rentable area. The Queens’ MarketPlace Property features 14,205 square feet (10.8% of net rentable area) of space referred to as “The Studio”, which is leased to a borrower related entity through April 2021, and base rent and reimbursements are not required to be paid. The space was originally intended to be a museum/studio space for music, film and the cultural arts, but with the onset of the recession as construction at the Queens’ MarketPlace Property was completed, the space was never built out. The Studio is currently used for additional storage and as a staging area for special events. Underwriting does not include any rent or reimbursements for this space; however there is a letter of intent from a theater tenant to lease 9,761 square feet of The Studio space (see “Cash Flow Analysis” section). As of April 3, 2015, the Queens’ MarketPlace Property was 66.1% occupied (and 77.0% leased including The Studio) by 47 tenants.
THE INFORMATION IN THIS STRUCTURAL AND COLLATERAL TERM SHEET IS NOT COMPLETE AND MAY BE AMENDED PRIOR TO THE TIME OF SALE. THIS TERM SHEET IS NOT AN OFFER TO SELL THESE SECURITIES AND IT IS NOT A SOLICITATION OF AN OFFER TO BUY THESE SECURITIES IN ANY JURISDICTION WHERE THE OFFER OR SALE IS NOT PERMITTED.
| 63 |
| QUEENS’ MARKETPLACE |
The following table presents certain information relating to the tenancy at the Queens’ MarketPlace Property:
Major Tenants
| Tenant Name | Credit Rating (Fitch/ Moody’s/ S&P) | Tenant NRSF | % of NRSF | Annual U/W Base Rent PSF(1) | Annual U/W Base Rent(1) | % of Total Annual U/W Base Rent | Sales PSF | Occupancy Cost(2) | Lease Expiration Date | |
| Anchor Tenant | ||||||||||
| Island Gourmet Markets | NR/NR/NR | 23,627 | 18.0% | $33.38 | $788,761 | 19.9% | $938 | 7.8% | 4/30/2021(3) | |
| Total Anchor Tenant | 23,627 | 18.0% | $33.38 | $788,761 | 19.9% | |||||
| Major Tenants | ||||||||||
| Sansei Seafood | NR/NR/NR | 6,263 | 4.8% | $72.60 | $454,694 | 11.4% | $572 | 13.0% | 4/30/2018(4) | |
| Quiksilver | NR/NR/NR | 4,392 | 3.4% | $82.75 | $363,456 | 9.1% | $384 | 29.1% | 4/30/2021 | |
| Romano’s Macaroni Grill | NR/NR/NR | 6,196 | 4.7% | $32.52 | $201,467 | 5.1% | $724 | 6.7% | 11/30/2018 | |
| Daylight Mind Cafe(5) | NR/NR/NR | 3,079 | 2.4% | $48.00 | $147,792 | 3.7% | NAV | NAV | 12/31/2025 | |
| Lemongrass Express Bistro | NR/NR/NR | 817 | 0.6% | $140.24 | $114,577 | 2.9% | $1,112 | 13.0% | 1/31/2018 | |
| Total Major Tenants | 20,747 | 15.8% | $61.79 | $1,281,986 | 32.3% | |||||
| Non-Major Tenants(6) | 42,231 | 32.3% | $45.05(6) | $1,902,707 | 47.9% | |||||
| Occupied Collateral Total(6) | 86,605 | 66.1% | $45.88(6) | $3,973,454 | 100.0% | |||||
| Vacant Space(7) | 44,320 | 33.9% | ||||||||
| Collateral Total | 130,925 | 100.0% | ||||||||
| (1) | Annual U/W Base Rent PSF and Annual U/W Base Rent include contractual rent bumps through January 2016 totaling $108,912. |
| (2) | Sales PSF and Occupancy Cost are for the trailing 12-month period ending February 28, 2015. |
| (3) | Island Gourmet Markets has one, 10-year lease renewal option. |
| (4) | Sansei Seafood has the right to terminate its lease in the event gross sales are less than $3,000,000 during the 12-month period ending October 2016. Current gross sales for Sansei Seafood are $3.6 million. |
| (5) | Daylight Mind Cafe is currently building out its space and is not yet in occupancy or paying rent. The estimated opening date and rent commencement date is October 2015. A reserve has been taken for all gap rent and outstanding tenant improvement and leasing commission obligations. |
| (6) | The Non-Major Tenants and the Occupied Collateral Total square footage includes 7,780 square feet of occupied space for which no rent was underwritten, as three of the tenants pay percentage rent in-lieu of base rent and one space is utilized as storage space. Excluding this space, the Non-Major Tenant Annual U/W Base Rent PSF and Occupied Collateral Total Annual U/W Base Rent PSF are $52.23 and $50.41, respectively. |
| (7) | Vacant space includes The Studio, a 14,205 square foot (10.8% of net rentable area) space leased to a borrower-related entity through April 2021, which is currently unoccupied. See “The Property” and “Cash Flow Analysis” sections. |
The following table presents certain information relating to the historical sales and occupancy costs at the Queens’ MarketPlace Property:
Historical Sales (PSF) and Occupancy Costs(1)
| Tenant Name | 2013 | 2014 | TTM 2/28/2015 | Current Occupancy Cost |
| Island Gourmet Markets | $901 | $940 | $938 | 7.8% |
| Total Comparable In-line | $589 | $599 | $595 | 17.0% |
| (1) | Historical Sales (PSF) and Occupancy Costs were provided by the borrower. Tenants who are not required to report sales or have not reported sales for all three reporting periods have been excluded from the chart above. Current Occupancy Cost is based on sales for the trailing 12-month period ending February 2015. |
THE INFORMATION IN THIS STRUCTURAL AND COLLATERAL TERM SHEET IS NOT COMPLETE AND MAY BE AMENDED PRIOR TO THE TIME OF SALE. THIS TERM SHEET IS NOT AN OFFER TO SELL THESE SECURITIES AND IT IS NOT A SOLICITATION OF AN OFFER TO BUY THESE SECURITIES IN ANY JURISDICTION WHERE THE OFFER OR SALE IS NOT PERMITTED.
| 64 |
| QUEENS’ MARKETPLACE |
The following table presents certain information relating to the lease rollover schedule at the Queens’ MarketPlace Property:
Lease Expiration Schedule(1)(2)
| Year Ending December 31, | No. of Leases Expiring | Expiring NRSF | % of Total NRSF | Cumulative Expiring NRSF | Cumulative % of Total NRSF | Annual U/W Base Rent | Annual U/W Base Rent PSF(3) |
| MTM | 3 | 2,872 | 2.2% | 2,872 | 2.2% | $39,666 | $13.81 |
| 2015 | 2 | 1,840 | 1.4% | 4,712 | 3.6% | $87,360 | $47.48 |
| 2016 | 6 | 5,965 | 4.6% | 10,677 | 8.2% | $308,329 | $51.69 |
| 2017 | 17 | 14,791 | 11.3% | 25,468 | 19.5% | $985,717 | $66.64 |
| 2018 | 9(4) | 22,523 | 17.2% | 47,991 | 36.7% | $983,596 | $43.67 |
| 2019 | 3 | 2,114 | 1.6% | 50,105 | 38.3% | $121,964 | $57.69 |
| 2020 | 1 | 1,610 | 1.2% | 51,715 | 39.5% | $73,973 | $45.95 |
| 2021 | 3(4) | 29,233 | 22.3% | 80,948 | 61.8% | $1,225,057 | $41.91 |
| 2022 | 0 | 0 | 0.0% | 80,948 | 61.8% | $0 | $0.00 |
| 2023 | 1(4) | 1,213 | 0.9% | 82,161 | 62.8% | $0 | $0.00 |
| 2024 | 1(4) | 1,365 | 1.0% | 83,526 | 63.8% | $0 | $0.00 |
| 2025 | 1 | 3,079 | 2.4% | 86,605 | 66.1% | $147,792 | $48.00 |
| Thereafter | 0 | 0 | 0.0% | 86,605 | 66.1% | $0 | $0.00 |
| Vacant(5) | 0 | 44,320 | 33.9% | 130,925 | 100.0% | $0 | $0.00 |
| Total/Weighted Average | 47 | 130,925 | 100.0% | $3,973,454 | $45.88(6) |
| (1) | Information obtained from the underwritten rent roll. |
| (2) | Certain tenants may have lease termination options that are exercisable prior to the originally stated expiration date of the subject lease and that are not considered in the Lease Expiration Schedule. |
| (3) | Annual U/W Base Rent PSF excludes vacant space. |
| (4) | Includes expiring tenants who pay percentage rent in-lieu of base rent. |
| (5) | Vacant space includes The Studio, the 14,205 square feet (10.8% of net rentable area) space leased to the borrower through April 2021 but currently unoccupied. See “The Property” and “Cash Flow Analysis” sections. |
| (6) | The Total/Weighted Average Annual U/W Base Rent PSF includes 7,780 square feet of occupied space for which no rent was underwritten, as three of the tenants pay percentage rent in-lieu of base rent and one is storage space. Excluding this space, the Total/Weighted Average Annual U/W Base Rent PSF is $50.41. |
The following table presents historical occupancy percentages at the Queens’ MarketPlace Property:
Historical Occupancy(1)
12/31/2012(2) | 12/31/2013(2) | 12/31/2014(2) | 4/3/2015(3) |
| 57.2% | 62.3% | 66.9% | 66.1% |
| (1) | Historical and Current Occupancy excludes The Studio (14,205 square feet; 10.8% of net rentable area) leased to a borrower-related entity through April 2021, which is currently vacant. See “The Property” and “Cash Flow Analysis” sections. |
| (2) | Information obtained from the borrower. |
| (3) | Information obtained from the underwritten rent roll. The Queens’ MarketPlace Property was 77.0% leased including The Studio as of April 3, 2015. |
THE INFORMATION IN THIS STRUCTURAL AND COLLATERAL TERM SHEET IS NOT COMPLETE AND MAY BE AMENDED PRIOR TO THE TIME OF SALE. THIS TERM SHEET IS NOT AN OFFER TO SELL THESE SECURITIES AND IT IS NOT A SOLICITATION OF AN OFFER TO BUY THESE SECURITIES IN ANY JURISDICTION WHERE THE OFFER OR SALE IS NOT PERMITTED.
| 65 |
| QUEENS’ MARKETPLACE |
Operating History and Underwritten Net Cash Flow.The following table presents certain information relating to the historical operating performance and underwritten net cash flow at the Queens’ MarketPlace Property:
Cash Flow Analysis
| 2012(1) | 2013(1) | 2014(1) | TTM 2/28/2015 | U/W(2) | % of U/W Effective Gross Income | U/W $ per SF | ||||||||
| Base Rent | $3,301,326 | $3,427,253 | $3,834,955 | $3,884,622 | $3,973,454(3) | 55.6% | $30.35 | |||||||
| Grossed Up Vacant Space | 0 | 0 | 0 | 0 | 1,377,897 | 19.3 | 10.52 | |||||||
| Percentage Rent | 286,415 | 423,748 | 561,947 | 544,965 | 446,841 | 6.3 | 3.41 | |||||||
| Total Reimbursables | 1,944,535 | 2,211,575 | 2,534,310 | 2,573,133 | 2,696,160 | 37.7 | 20.59 | |||||||
| Other Income | 294,320 | 309,318 | 266,635 | 270,728 | 28,241 | 0.4 | 0.22 | |||||||
| Less Vacancy & Credit Loss | 0 | 17,150 | (232,759)(4) | (232,759)(4) | (1,377,897)(5) | (19.3) | (10.52) | |||||||
| Effective Gross Income | $5,826,596 | $6,389,044 | $6,965,088 | $7,040,689 | $7,144,696 | 100.0% | $54.57 | |||||||
| Total Operating Expenses | $3,617,818 | $3,771,353 | $3,798,634 | $3,884,034 | $3,841,397 | 53.8% | $29.34 | |||||||
| Net Operating Income | $2,208,778 | $2,617,691 | $3,166,454 | $3,156,655 | $3,303,299 | 46.2% | $25.23 | |||||||
| TI/LC | 0 | 0 | 0 | 0 | 193,519 | 2.7 | 1.48 | |||||||
| Capital Expenditures | 0 | 0 | 0 | 0 | 26,185 | 0.4 | 0.20 | |||||||
| Net Cash Flow | $2,208,778 | $2,617,691 | $3,166,454 | $3,156,655 | $3,083,595 | 43.2% | $23.55 | |||||||
| NOI DSCR | 1.50x | 1.78x | 2.15x | 2.15x | 2.25x | |||||||||
| NCF DSCR | 1.50x | 1.78x | 2.15x | 2.15x | 2.10x | |||||||||
| NOI DY | 6.3% | 7.5% | 9.0% | 9.0% | 9.4% | |||||||||
| NCF DY | 6.3% | 7.5% | 9.0% | 9.0% | 8.8% |
| (1) | The increase in Effective Gross Income and Net Operating Income from 2012 through 2014 was due to continued new leasing activity as the Queens’ MarketPlace Property stabilized after the recession. |
| (2) | The Queens’ MarketPlace Property features 14,205 square feet (10.8% of net rentable area) of space referred to as “The Studio”, which is leased to a borrower-related entity through April 2021, and base rent and reimbursements are not required to be paid and, therefore, were not underwritten. There is an executed letter of intent (“LOI”) from a theater tenant to lease most of The Studio space (9,761 square feet; 7.4% of net rentable area). Also, there is an LOI from Long’s Drugs to lease 10,400 square feet (7.9% of net rentable area). If both of these LOIs ultimately become signed leases, occupancy will increase to 81.5% and the NCF DSCR and DY will increase to 2.64x and 11.1%, respectively. |
| (3) | U/W Base Rent includes contractual rent steps through January 2016 totaling $108,912. |
| (4) | Historical Vacancy and Credit Loss represents bad debt expenses related to two delinquent tenants that have been marked as vacant in the underwritten net cash flow. |
| (5) | The underwritten economic vacancy is 25.7%. The Queens’ MarketPlace Property was 77.0% leased and 66.1% physically occupied as of April 3, 2015. |
Appraisal. As of the appraisal valuation date of April 1, 2015, the Queens’ MarketPlace Property had an “as-is” appraised value of $55,500,000. Also, the appraiser concluded to an “as-stabilized” value of $67,400,000 as of July 1, 2017 assuming a 94.0% occupancy.
Environmental Matters.According to a Phase I environmental assessment dated April 3, 2015, there was no evidence of any recognized environmental conditions at the Queens’ MarketPlace Property.
Market Overview and Competition.The Queens’ MarketPlace Property is located in Waikoloa, Hawaii, also known as “The Big Island”, along the Kohala Coast within the Waikoloa Beach Resort. The Queens’ MarketPlace Property is located approximately 18.0 miles northwest of the Kona International Airport, the only airport on The Big Island. The Waikoloa Beach Resort is a 1,150 acre resort community with over 3,400 hotel rooms and luxury residential units, including the Hilton Waikoloa Village and the Marriott Waikoloa Beach Resort & Spa, which make up 1,796 hotel rooms combined. The Waikoloa Beach Resort generated approximately 2.1 million annual visitor days in 2014. Amenities within the resort include 36 holes of championship golf, two full-service spas, a day spa, an interactive dolphin program, ocean sports and a variety of restaurants, boutiques and galleries. In addition to the Queens’ MarketPlace Property, the Waikoloa Beach Resort features the complimentary retail center King’s Shops (located directly northwest across Waikoloa Beach Drive), which offers a collection of luxury brand stores such as Louis Vuitton, Tiffany & Co., Coach, Tommy Bahama and Michael Kors along with high-end boutique stores, fine art galleries and a Macy’s. As of the trailing 12-month period ending July 2014, 28 in-line tenants at King’s Shops reported $35.1 million in sales ($750 per square foot), resulting in a weighted average occupancy cost of 13.8%. In addition to the Waikoloa Beach Resort, the Kohala Coast is home to several luxury resorts including The Fairmont Orchid, the Four Seasons Hualalai at Historic Ka’upulehu, Mauna Kea Beach Hotel and the Mauna Lani Bay Hotel within Mauna Lani Resort. Due to the lack of available developable sites, deed restrictions, high construction costs and the rugged terrain of the volcanic islands along the Kohala Coast, there are significant barriers to entry and limited opportunities for new development in the immediate area.
The Big Island was ranked fourth on a major travel publication’s list of World’s Best/Top Islands, and was ranked eighth on another travel publication’s “Destination on the Rise” in the United States. The Big Island attracts the third most tourists of the Hawaiian Islands, with an estimated 1.5 million visitors spending approximately $1.9 billion in 2014, a 5.6% increase over spending in 2013. The number of airline seats traveling to Kona also increased by 11.7% from 2013 to 686,553. According to a third-party market research report, the Queens’ MarketPlace Property is located within the Hawaii County submarket, which covers most of The Big Island, within the Hawaii retail market. As of fourth quarter 2014, the Hawaii county submarket reported a total inventory of 15.3 million square feet (10.8% of the total state inventory) with a 3.9% vacancy rate. The Hawaii County submarket has averaged a 3.9% vacancy rate since 2007. As of fourth quarter 2014, the Hawaii County submarket had an average asking rental rate of $25.32 per square foot, triple-net, up 11.6% from the prior year. The appraiser concluded to the following market rents for select spaces at the Queens’ MarketPlace Property, all on a triple-net basis: $39.00 per square foot for the grocery anchor; $48.00 per square foot for large restaurant space; $60.00 per square foot for shop space less than 1,000 square feet and $42.00 per square foot for shop space greater than 1,000 square feet.
THE INFORMATION IN THIS STRUCTURAL AND COLLATERAL TERM SHEET IS NOT COMPLETE AND MAY BE AMENDED PRIOR TO THE TIME OF SALE. THIS TERM SHEET IS NOT AN OFFER TO SELL THESE SECURITIES AND IT IS NOT A SOLICITATION OF AN OFFER TO BUY THESE SECURITIES IN ANY JURISDICTION WHERE THE OFFER OR SALE IS NOT PERMITTED.
| 66 |
| QUEENS’ MARKETPLACE |
The following table presents certain information relating to some comparable retail properties for the Queens’ MarketPlace Property:
Competitive Set(1)
Queens’ (Subject) | The King’s Shops | Shops at Mauna Kani | Waikoloa Highlands | Waimea Center | Parker Ranch | |
| Location | Waikoloa, HI | Waikoloa, HI | Mauna Lani, HI | Waikoloa Village, HI | Kamuela, HI | Kamuela, HI |
| Distance from Subject | -- | 0.3 miles | 4.1 miles | 7.1 miles | 19.8 miles | 19.6 miles |
| Property Type | Community Center | Neighborhood Center | Specialty Center | Neighborhood Center | Neighborhood Center | Neighborhood Center |
| Year Built/Renovated | 2007/NAP | 1991/2001 | 2005-2007/NAP | 1990/NAP | 1989/NAP | 1968/2008 |
| Significant Tenants | Island Gourmet Markets, Romano’s Macaroni Grill, Sansei Seafood | Macy’s, Roys | Foodland Farms, Tommy Bahamas, Ruth’s Chris Steakhouse | Waikoloa Village Market | KTA Superstore | Foodland |
| Total GLA | 130,925 SF | 75,000 SF | 77,800 SF | 73,524 SF | 73,345 SF | 150,549 SF |
| Total Occupancy | 66%(2) | 99% | 94% | 75% | 100% | 85% |
| (1) | Information obtained from the appraisal. |
| (2) | The Queens’ MarketPlace Property was 66.1% occupied (and 77.0% leased including The Studio) as of April 3, 2015. |
The Borrower.The borrower is Queens’ Market, LLC a Nevada limited liability company which is a single purpose entity with one independent director. Legal counsel to the borrower delivered a non-consolidation opinion in connection with the origination of the Queens’ MarketPlace Mortgage Loan. Waikoloa Development Co. and Seligman & Associates, Inc. are the guarantors of certain nonrecourse carveouts under the Queens’ MarketPlace Mortgage Loan.
The Sponsors.The sponsors are Waikoloa Development Co. and Seligman & Associates, Inc. Waikoloa Development Co. is the successor a partnership between Transcontinental Corporation of Santa Barbara and the Bass family, the original master developers of Waikoloa (including the Waikoloa Beach Resort). The four Bass brothers - Sid, Edward, Robert and Lee - control the family’s investments and Robert started an investment company called Oak Hill in the early 1990s, which now has more than $35.0 billion in assets under management. Transcontinental Corporation is a privately held company headquartered in Santa Barbara, California. Some of its better known projects include Lake Las Vegas, a 3,600-acre resort near Las Vegas, Nevada; McCormick Ranch, a 3,100-acre master-planned community in Scottsdale, Arizona; Lake Arrowhead, a large project near Los Angeles; and Las Campanas, a 4,700-acre community in Santa Fe, New Mexico. The Bass brothers and Transcontinental Corporation disclosed one prior bankruptcy, one loan default and one lawsuit with a prior lender. See “Description of the Mortgage Pool – Default History, Bankruptcy Issues and Other Proceedings” in the Free Writing Prospectus.
Scott Seligman is the chairman and chief executive officer of Seligman & Associates, Inc (“Seligman & Associates”), a real estate owner and operator of commercial and residential properties throughout the western United States, with a primary focus in Hawaii, Michigan, California, Nevada, Texas and Arizona. Currently, Seligman & Associates owns (directly or indirectly) 1.0 million square feet of retail, 2.0 million square feet of office and 817 multifamily units. Seligman & Associates also owns the adjacent King’s Shops and Queen Ka’ahumanu Center in Kahului on Maui, among other retail properties. Seligman & Associates and Scott Seligman disclosed two prior deed-in-lieu foreclosures, two prior loan modifications and one prior bankruptcy (over 30 years ago). See “Description of the Mortgage Pool – Default History, Bankruptcy Issues and Other Proceedings” in the Free Writing Prospectus.
Escrows.The loan documents provide for upfront reserves of $144,205 for taxes, $164,280 for rent concessions for Daylight Mind Cafe and $688,807 for outstanding tenant improvements and leasing commissions (“TI/LCs”) ($533,947 for Daylight Mind Cafe and $154,860 for Quiksilver). Ongoing monthly reserves are required in an amount equal to $28,841 for taxes (during any period in which the net cash flow debt yield is less than 9.0%), $1,637 for replacement reserves and $9,275 for general TI/LCs (subject to a cap of $334,000, with the following variations: (i) if the amortizing debt service coverage ratio (based on a hypothetical 30-year amortizing schedule) is between 1.20x and 1.75x, the monthly TI/LC deposit will increase to $16,365, provided that the amount then on deposit in the TI/LC reserve is less than a cap of $1.2 million and (ii) if the amortizing debt service coverage ratio is less than 1.20x, the monthly TI/LC deposit will be $16,365 with no cap). The loan documents do not require monthly escrows for insurance provided that (i) no event of default has occurred and is continuing; (ii) the Queens’ MarketPlace Property is insured via an acceptable blanket insurance policy; (iii) the borrower provides the lender with evidence of renewal of the insurance policies and timely proof of payment of the insurance premiums when due; and (iv) the net cash flow debt yield is greater than 9.0%.
Lockbox and Cash Management.Upon the occurrence of a Deposit Account Event Period (as defined below), the borrower will be required to establish a lender-controlled lockbox account and cause all rents to be deposited directly into such lockbox account. During a Deposit Account Event Period, and prior to a Cash Trap Event Period (as defined below), funds on deposit in the lockbox account are distributed to the borrower. During a Cash Trap Event Period, all excess funds on deposit in the lockbox account are swept to a lender-controlled subaccount on a monthly basis.
A “Deposit Account Event Period” will commence upon the earlier of (i) the occurrence and continuance of an event of default or (ii) the amortizing debt service coverage ratio falling below 1.15x at the end of any calendar month. A Deposit Account Event Period will expire with regard to clause (i), upon the cure of such event of default. There is no cure for a Deposit Account Event Period arising under clause (ii) above.
THE INFORMATION IN THIS STRUCTURAL AND COLLATERAL TERM SHEET IS NOT COMPLETE AND MAY BE AMENDED PRIOR TO THE TIME OF SALE. THIS TERM SHEET IS NOT AN OFFER TO SELL THESE SECURITIES AND IT IS NOT A SOLICITATION OF AN OFFER TO BUY THESE SECURITIES IN ANY JURISDICTION WHERE THE OFFER OR SALE IS NOT PERMITTED.
| 67 |
| QUEENS’ MARKETPLACE |
A “Cash Trap Event Period” will commence upon the earlier of (i) the occurrence and continuance of an event of default or (ii) the amortizing debt service coverage ratio falling below 1.10x. A Cash Trap Event Period will expire with regard to clause (i), upon the cure of such event of default; and with regard to clause (ii), upon the date that the amortizing debt service coverage ratio is equal to or greater than 1.15x for two consecutive calendar quarters.
Property Management. The Queens’ MarketPlace Property is managed by an affiliate of the borrower.
Assumption.The borrower has a two-time right to transfer the Queens’ MarketPlace Property, provided that no event of default has occurred and is continuing and certain other conditions are satisfied, including, but not limited to the following: (i) the lender’s reasonable determination that the proposed transferee and guarantor satisfy the lender’s credit review and underwriting standards, taking into consideration such transferee’s experience, financial strength and general business standing; (ii) execution of a recourse guaranty and an environmental indemnity by an affiliate of the transferee; and (iii) if requested by the lender, rating agency confirmation from Fitch, KBRA and Moody’s that the transfer will not result in a downgrade, withdrawal or qualification of the respective ratings assigned to the Series 2015-C29 Certificates.
Partial Release.Not permitted.
Free Release.The borrower is permitted to obtain the release of the parcel improved with the Waikoloa Bowl from the lien of the mortgage, subject to the satisfaction of certain conditions contained in the loan agreement, including but not limited to (i) evidence that the release parcel has been legally subdivided and that the remaining Queens’ MarketPlace Property will constitute one or more separate legal tax lot(s); (ii) evidence that the remaining Queens’ MarketPlace Property will be in compliance with all applicable legal and zoning requirements; and (iii) the loan to value ratio for the remaining Queens’ MarketPlace is in compliance with all REMIC requirements. No value was attributed to this parcel in the appraisal.
Real Estate Substitution.Not permitted.
Subordinate and Mezzanine Indebtedness.Provided no event of default has occurred and is continuing, a direct or indirect owner of the borrower has the right to incur mezzanine financing subject to the satisfaction of certain conditions, including but not limited to (i) the execution of an intercreditor agreement in form and substance acceptable to the lender and each of Fitch, KBRA and Moody’s; (ii) the combined loan-to-value ratio is not greater than 75.0%; (iii) the combined net cash flow debt yield is not less than 7.5%; (iv) the borrower will establish a hard lockbox and direct all tenants to make rental payments directly into the lockbox account and (v) the lender receives rating agency confirmation from Fitch, KBRA and Moody’s that the mezzanine financing will not result in a downgrade, withdrawal or qualification of the respective ratings assigned to the Series 2015-C29 Certificates.
Ground Lease.None.
Terrorism Insurance.The loan documents require that the “all risk” insurance policy required to be maintained by the borrower provide coverage for terrorism in an amount equal to the full replacement cost of the Queens’ MarketPlace Property, as well as business interruption insurance covering no less than the 18-month period following the occurrence of a casualty event, together with a six-month extended period of indemnity.
Earthquake Insurance.A seismic report dated April 4, 2015 determined that the probable maximum loss at the Queens’ MarketPlace Property was 6.0%. Earthquake insurance is not required.
Windstorm Insurance. The loan documents require windstorm insurance covering the full replacement cost of the Queens’ MarketPlace Property during the loan term. At the time of loan closing, the Queens’ MarketPlace Property had insurance coverage for windstorm.
THE INFORMATION IN THIS STRUCTURAL AND COLLATERAL TERM SHEET IS NOT COMPLETE AND MAY BE AMENDED PRIOR TO THE TIME OF SALE. THIS TERM SHEET IS NOT AN OFFER TO SELL THESE SECURITIES AND IT IS NOT A SOLICITATION OF AN OFFER TO BUY THESE SECURITIES IN ANY JURISDICTION WHERE THE OFFER OR SALE IS NOT PERMITTED.
| 68 |
[THIS PAGE INTENTIONALLY LEFT BLANK.]
THE INFORMATION IN THIS STRUCTURAL AND COLLATERAL TERM SHEET IS NOT COMPLETE AND MAY BE AMENDED PRIOR TO THE TIME OF SALE. THIS TERM SHEET IS NOT AN OFFER TO SELL THESE SECURITIES AND IT IS NOT A SOLICITATION OF AN OFFER TO BUY THESE SECURITIES IN ANY JURISDICTION WHERE THE OFFER OR SALE IS NOT PERMITTED.
| 69 |
| EL SOL BRILLANTE AND LAGUNA DEL SOL APARTMENTS |
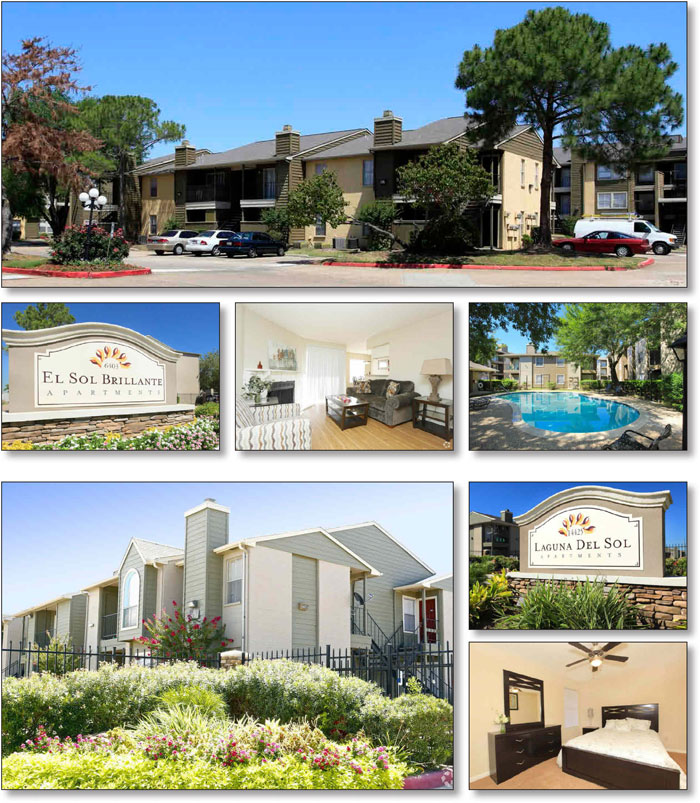
THE INFORMATION IN THIS STRUCTURAL AND COLLATERAL TERM SHEET IS NOT COMPLETE AND MAY BE AMENDED PRIOR TO THE TIME OF SALE. THIS TERM SHEET IS NOT AN OFFER TO SELL THESE SECURITIES AND IT IS NOT A SOLICITATION OF AN OFFER TO BUY THESE SECURITIES IN ANY JURISDICTION WHERE THE OFFER OR SALE IS NOT PERMITTED.
| 70 |
| EL SOL BRILLANTE AND LAGUNA DEL SOL APARTMENTS |

THE INFORMATION IN THIS STRUCTURAL AND COLLATERAL TERM SHEET IS NOT COMPLETE AND MAY BE AMENDED PRIOR TO THE TIME OF SALE. THIS TERM SHEET IS NOT AN OFFER TO SELL THESE SECURITIES AND IT IS NOT A SOLICITATION OF AN OFFER TO BUY THESE SECURITIES IN ANY JURISDICTION WHERE THE OFFER OR SALE IS NOT PERMITTED.
| 71 |
| No. 6 – El Sol Brillante and Laguna Del Sol Apartments | ||||||||
| Loan Information | Property Information | |||||||
| Mortgage Loan Seller: | Rialto Mortgage Finance, LLC | Single Asset/Portfolio: | Portfolio | |||||
| Credit Assessment (Fitch/KBRA/Moody’s): | NR/NR/NR | Property Type: | Multifamily | |||||
| Original Principal Balance: | $28,750,000 | Specific Property Type: | Garden | |||||
| Cut-off Date Principal Balance: | $28,750,000 | Location: | Houston, TX | |||||
| % of Initial Pool Balance: | 2.4% | Size: | 792 Units | |||||
| Loan Purpose: | Acquisition | Cut-off Date Principal Balance Per Unit: | $36,301 | |||||
| Borrower Names(1): | Various | Year Built/Renovated: | Various – See Table | |||||
| Sponsor: | Arun Verma | Title Vesting: | Fee | |||||
| Mortgage Rate: | 4.300% | Property Manager: | Self-managed | |||||
| Note Date: | April 30, 2015 | 3rdMost Recent Occupancy (As of)(4): | 46.9% (12/31/2012) | |||||
| Anticipated Repayment Date: | NAP | 2ndMost Recent Occupancy (As of)(4): | 68.5% (12/31/2013) | |||||
| Maturity Date: | May 6, 2025 | Most Recent Occupancy (As of)(4): | 88.2% (12/31/2014) | |||||
| IO Period: | 60 months | Current Occupancy (As of)(5): | 93.7% Various | |||||
| Loan Term (Original): | 120 months | |||||||
| Seasoning: | 1 month | Underwriting and Financial Information: | ||||||
| Amortization Term (Original): | 360 months | |||||||
| Loan Amortization Type: | Interest-only, Amortizing Balloon | 3rd Most Recent NOI (As of)(6): | $961,437 (12/31/2013) | |||||
| Interest Accrual Method: | Actual/360 | 2nd Most Recent NOI (As of)(6): | $2,818,454 (12/31/2014) | |||||
| Call Protection: | L(24), GRTR 1% or YM(92), O(4) | Most Recent NOI (As of): | $3,243,404 (TTM 3/31/2015) | |||||
| Lockbox Type: | Springing (Without Established Account) | |||||||
| Additional Debt(2): | Yes | U/W Revenues: | $6,319,448 | |||||
| Additional Debt Type(2): | Future Mezzanine | U/W Expenses: | $3,240,610 | |||||
| U/W NOI: | $3,078,838 | |||||||
| U/W NCF: | $2,868,574 | |||||||
| Escrows and Reserves(3): | U/W NOI DSCR: | 1.80x | ||||||
| U/W NCF DSCR: | 1.68x | |||||||
| Type: | Initial | Monthly | Cap (If Any) | U/W NOI Debt Yield: | 10.7% | |||
| Taxes | $142,305 | $27,106 | NAP | U/W NCF Debt Yield: | 10.0% | |||
| Insurance | $83,405 | $26,478 | NAP | As-Is Appraised Value: | $39,310,000 | |||
| Replacement Reserves | $0 | $17,522 | NAP | As-Is Appraisal Valuation Date: | April 7, 2015 | |||
| Deferred Maintenance | $34,300 | $0 | NAP | Cut-off Date LTV Ratio: | 73.1% | |||
| Existing Casualty Reserve | $854,695 | $0 | NAP | LTV Ratio at Maturity or ARD: | 66.7% | |||
| (1) | See “Borrowers” section. |
| (2) | See “Subordinate and Mezzanine Indebtedness” section. |
| (3) | See “Escrows” section. |
| (4) | See “Historical Occupancy” section. |
| (5) | The Current Occupancy for the El Sol Brillante Property is as of April 23, 2015 and for the Laguna Del Sol Property is as of April 22, 2015. |
| (6) | See “Cash Flow Analysis” section. |
The Mortgage Loan. The mortgage loan (the “El Sol Brillante and Laguna Del Sol Apartments Mortgage Loan”) is evidenced by a single promissory note that is secured by a first mortgage encumbering two garden-style multifamily properties located in Houston, Texas (the “El Sol Brillante and Laguna Del Sol Apartments Properties”). The El Sol Brillante and Laguna Del Sol Apartments Mortgage Loan was originated on April 30, 2015 by Rialto Mortgage Finance, LLC. The El Sol Brillante and Laguna Del Sol Apartments Mortgage Loan had an original principal balance of $28,750,000, has an outstanding principal balance as of the Cut-off Date of $28,750,000 and accrues interest at an interest rate of 4.300%per annum. The El Sol Brillante and Laguna Del Sol Apartments Mortgage Loan had an initial term of 120 months, has a remaining term of 119 months as of the Cut-off Date and requires interest-only payments for the first 60 payments following origination and, thereafter, requires payments of principal and interest based on a 30-year amortization schedule. The El Sol Brillante and Laguna Del Sol Apartments Mortgage Loan matures on May 6, 2025.
Following the lockout period, the borrowers have the right to prepay the El Sol Brillante and Laguna Del Sol Apartments Mortgage Loan in whole, but not in part, provided that the borrowers pay the greater of a yield maintenance premium or a prepayment premium equal to 1.0% of the principal amount being prepaid, on any date prior to February 6, 2025. In addition, the El Sol Brillante and Laguna Del Sol Apartments Mortgage Loan is prepayable without penalty on or after February 6, 2025.
THE INFORMATION IN THIS STRUCTURAL AND COLLATERAL TERM SHEET IS NOT COMPLETE AND MAY BE AMENDED PRIOR TO THE TIME OF SALE. THIS TERM SHEET IS NOT AN OFFER TO SELL THESE SECURITIES AND IT IS NOT A SOLICITATION OF AN OFFER TO BUY THESE SECURITIES IN ANY JURISDICTION WHERE THE OFFER OR SALE IS NOT PERMITTED.
| 72 |
| EL SOL BRILLANTE AND LAGUNA DEL SOL APARTMENTS |
Sources and Uses
| Sources | Uses | |||||||
| Original loan amount | $28,750,000 | 75.3% | Purchase price | $36,800,000 | 96.4% | |||
| Sponsor's new cash contribution | $9,435,524 | 24.7 | Reserves | 1,114,705 | 2.9 | |||
| Closing costs | 270,819 | 0.7 | ||||||
| Total Sources | $38,185,524 | 100.0% | Total Uses | $38,185,524 | 100.0% |
The Property.The El Sol Brillante and Laguna Del Sol Apartments Properties consist of two garden-style multifamily properties (the “El Sol Brillante Property” and the “Laguna Del Sol Property”, respectively) totaling 792 units and situated on approximately 23.0 acres in Houston, Texas. The El Sol Brillante and Laguna Del Sol Apartments Properties are located adjacent to one another along Sierra Blanca Drive in Houston, Texas, approximately 20.1 miles west of the Houston central business district. As of April 2015, the El Sol Brillante and Laguna Del Sol Apartments Properties were 93.7% occupied.
The following table presents certain information relating to the El Sol Brillante and Laguna Del Sol Apartments Properties:
| Property Name | Allocated Cut- off Date Principal Balance | % of Portfolio Cut-off Date Principal Balance | Occupancy | Year Built/ Renovated | Units | Appraised Value | Allocated LTV | |||||||
| Laguna Del Sol Apartments | $14,868,672 | 51.7% | 91.8% | 1983/2015 | 400 | $20,330,000 | 73.1% | |||||||
| El Sol Brillante Apartments | $13,881,328 | 48.3% | 95.7% | 1981/2015 | 392 | $18,980,000 | 73.1% | |||||||
| Total / Weighted Average | $28,750,000 | 100.0% | 93.7% | 792 | $39,310,000 | 73.1% |
Laguna Del Sol Apartments
The Laguna Del Sol Property is a 400-unit, garden-style apartment complex consisting of 35, two and three-story residential buildings. The improvements were constructed in 1983, renovated in 2015, and are situated on 11.5 acres. The Laguna Del Sol Property amenities include two outdoor swimming pools, a picnic area, a playground, a dog-park, and two laundry facilities. Unit amenities include electric ranges/ovens with vent-hood, garbage disposal, dishwasher, formica countertops, and vinyl tile flooring in the kitchen. All units include washer/dryer connections and a private patio or balcony area with an exterior storage room. The Laguna Del Sol Property has 627 surface parking spaces, reflecting a parking ratio of 1.6 spaces per unit. As of April 22, 2015, the Laguna Del Sol Property was 91.8% occupied.
El Sol Brillante Apartments
The El Sol Brillante Property is a 392-unit, garden-style apartment complex consisting of 33, two- and three-story residential buildings. The improvements were constructed in 1981, renovated in 2015, and are situated on 11.5 acres. The El Sol Brillante Property amenities include three outdoor swimming pools, a picnic area, a playground, a dog-park, and three laundry facilities. Unit amenities include electric ranges/ovens with vent-hood, garbage disposal, dishwasher, formica countertops, and vinyl tile flooring in the kitchen. All units include washer/dryer connections and a private patio or balcony area with an exterior storage room. The El Sol Brillante Property has 627 surface parking spaces, reflecting a parking ratio of 1.6 spaces per unit. As of April 23, 2015, the El Sol Brillante Property was 95.7% occupied.
The following table presents certain information relating to the unit mix of the El Sol Brillante and Laguna Del Sol Apartments Properties:
Apartment Unit Summary(1)
| Unit Type | No. of Units | % of Total Units | Average Unit Size (SF) | Average UW Monthly Rent per Unit | ||||
| 1 Bedroom/1 Bath (El Sol Brilliante) | 244 | 30.8% | 657 | $640 | ||||
| 2 Bedroom/1.5 Bath (El Sol Brillante) | 60 | 7.6% | 850 | $820 | ||||
| 2 Bedroom/2 Bath (El Sol Brillante) | 88 | 11.1% | 910 | $852 | ||||
| 1 Bedroom/1 Bath (Laguna Del Sol) | 184 | 23.2% | 643 | $629 | ||||
| 2 Bedroom/2 Bath (Laguna Del Sol) | 192 | 24.2% | 881 | $831 | ||||
| 3 Bedroom/2 Bath (Laguna Del Sol) | 24 | 3.0% | 1,133 | $1,093 | ||||
| Total/Weighted Average | 792 | 100.0% | 765 | $735 |
| (1) | Information obtained from the underwritten rent roll. |
THE INFORMATION IN THIS STRUCTURAL AND COLLATERAL TERM SHEET IS NOT COMPLETE AND MAY BE AMENDED PRIOR TO THE TIME OF SALE. THIS TERM SHEET IS NOT AN OFFER TO SELL THESE SECURITIES AND IT IS NOT A SOLICITATION OF AN OFFER TO BUY THESE SECURITIES IN ANY JURISDICTION WHERE THE OFFER OR SALE IS NOT PERMITTED.
| 73 |
| EL SOL BRILLANTE AND LAGUNA DEL SOL APARTMENTS |
The following table presents historical occupancy percentages at the El Sol Brillante and Laguna Del Sol Apartments Properties:
Historical Occupancy
12/31/2012(1)(2) | 12/31/2013(1)(2) | 12/31/2014(1)(2) | Various(3) |
| 46.9% | 68.5% | 88.2% | 93.7% |
| (1) | Information obtained from the borrowers. |
| (2) | The El Sol Brillante and Laguna Del Sol Apartments Properties were purchased out of foreclosure by the prior owners in 2011. At the time, the properties had significant deferred maintenance issues with approximately 126 down units and occupancy was below 50.0%. According to the borrowers, the prior owners spent approximately $9.5 million between July 2011 and March 2015 to renovate the properties and bring all down units back online. |
| (3) | Information obtained from the underwritten rent roll. The Current Occupancy for the El Sol Brillante Property is as of April 23, 2015 and for the Laguna Del Sol Property is as of April 22, 2015. |
Operating History and Underwritten Net Cash Flow.The following table presents certain information relating to the historical operating performance and underwritten net cash flow at the El Sol Brillante and Laguna Del Sol Apartments Properties:
Cash Flow Analysis
| 2013(1) | 2014(1) | TTM 3/31/2015(1) | U/W | % of U/W Effective Gross Income | U/W $ per Unit | ||||||||||||||
| Base Rent | $4,981,322 | $5,856,376 | $6,237,225 | $6,528,372 | 103.3 | % | $8,243 | ||||||||||||
| Grossed Up Vacant Space | 0 | 0 | 0 | 483,048 | 7.6 | 610 | |||||||||||||
| Concessions | (266,274 | ) | (161,441 | ) | (163,297 | ) | (183,762 | ) | (2.9 | ) | (232 | ) | |||||||
| Other Income | 384,178 | 567,614 | 589,833 | 590,000 | 9.3 | 745 | |||||||||||||
| Less Vacancy & Credit Loss | (1,191,960 | ) | (647,668 | ) | (682,846 | ) | (1,098,210 | )(2) | (17.4 | ) | (1,387 | ) | |||||||
| Effective Gross Income | $3,907,266 | $5,614,881 | $5,980,915 | $6,319,449 | 100.0 | % | $7,979 | ||||||||||||
| Total Operating Expenses | $2,945,829 | $2,796,427 | $2,737,511 | $3,240,610 | 51.3 | % | $4,092 | ||||||||||||
| Net Operating Income | $961,437 | $2,818,454 | $3,243,404 | $3,078,838 | 48.7 | % | $3,887 | ||||||||||||
| Capital Expenditures | 0 | 0 | 0 | 210,264 | 3.3 | 265 | |||||||||||||
| Net Cash Flow | $961,437 | $2,818,454 | $3,243,404 | $2,868,574 | 45.4 | % | $3,622 | ||||||||||||
| NOI DSCR | 0.56x | 1.65x | 1.90x | 1.80x | |||||||||||||||
| NCF DSCR | 0.56x | 1.65x | 1.90x | 1.68x | |||||||||||||||
| NOI DY | 3.3% | 9.8% | 11.3% | 10.7% | |||||||||||||||
| NCF DY | 3.3% | 9.8% | 11.3% | 10.0% |
| (1) | The El Sol Brillante and Laguna Del Sol Apartments Properties were purchased out of foreclosure by the prior owners in 2011. At the time, the properties had significant deferred maintenance issues with approximately 126 down units and occupancy was below 50.0%. According to the borrowers, the prior owners spent approximately $9.5 million between July 2011 and March 2015 to renovate the properties and bring all down units back online. |
| (2) | The underwritten economic vacancy is 18.3%. The El Sol Brillante and Laguna Del Sol Apartments Properties were 93.7% occupied as of April 2015. |
Appraisal.As of the appraisal valuation date of April 7, 2015, the El Sol Brillante and Laguna Del Sol Apartments Properties had an aggregate “as-is” appraised value of $39,310,000.
Environmental Matters.According to a Phase I environmental assessment dated April 20, 2015, there was no evidence of any recognized environmental conditions at the El Sol Brillante and Laguna Del Sol Apartments Properties.
Market Overview and Competition.The El Sol Brillante and Laguna Del Sol Apartments Properties are located in Houston, Texas, approximately 20.1 miles west of the Houston central business district. Access is available from all parts of the Houston metropolitan area via the Sam Houston Tollway, the Katy Freeway, and the Westpark Tollway (located immediately north of the El Sol Brillante and Laguna Del Sol Apartments Properties). Westheimer Road, the primary local thoroughfare, is located north of Westpark Tollway, and essentially runs parallel to the Westpark Tollway, and the terminus is approximately 3.7 miles west of the El Sol Brillante and Laguna Del Sol Apartments Properties. There is a significant amount of retail development at the intersection of State Highway 6 and Bellaire Blvd, approximately half a mile southwest of the El Sol Brillante and Laguna Del Sol Apartments Properties, including H-E-B and Fiesta Mart supermarkets, Walgreens, NTB Tires & Battery, Chick-fil-A, Dollar General, and Family Dollar. Additionally, there is a Walmart Supercenter and a Home Depot approximately 1.5 miles north of the El Sol Brilliante-Laguna Del Sol Apartments Properties along State Highway 6. The West Houston Medical Center is located approximately 4.6 miles northeast of the El Sol Brillante and Laguna Del Sol Apartments Properties. The West Houston Medical Center has been providing healthcare to the West Houston community for 30 years, and the hospital recently added 95,000 square feet. George Bush Park is located approximately 5.8 miles northwest of the El Sol Brillante and Laguna Del Sol Apartments Properties. The George Bush Park is a 7,800-acre green space which includes recreational facilities such as a baseball field, dog-park, fishing areas, hiking and biking trail, picnic/barbecue areas, children’s playground, water features, soccer field, and wetland habitat. The 2015 estimated population within the one-, three- and five-mile radii of the El Sol Brillante and Laguna Del Sol Apartments Properties is 11,823, 171,381 and 380,922, respectively, and the estimated 2015 average household income within the same radii is $58,788, $67,388, and $73,692, respectively.
THE INFORMATION IN THIS STRUCTURAL AND COLLATERAL TERM SHEET IS NOT COMPLETE AND MAY BE AMENDED PRIOR TO THE TIME OF SALE. THIS TERM SHEET IS NOT AN OFFER TO SELL THESE SECURITIES AND IT IS NOT A SOLICITATION OF AN OFFER TO BUY THESE SECURITIES IN ANY JURISDICTION WHERE THE OFFER OR SALE IS NOT PERMITTED.
| 74 |
| EL SOL BRILLANTE AND LAGUNA DEL SOL APARTMENTS |
According to a third party market research report the El Sol Brillante and Laguna Del Sol Apartments Properties are located in the Houston multifamily market and the Alief submarket. As of April 2015, the Houston multifamily market contained 594,243 units, with an 8.9% vacancy rate, and average monthly asking rent of $1.07 per square foot. As of April 2015, the Alief submarket contained 27,276 units, with a 6.2% vacancy rate, and average monthly asking rent of $0.92 per square foot.
The following table presents certain information relating to some comparable multifamily properties for the El Sol Brillante and Laguna Del Sol Apartments Properties:
Competitive Set(1)
| El Sol Brillante and Laguna Del Sol Apartments Properties (Subject) | Woodbridge Crossing | Cape Colony | Hawthorne | Fox Pointe | El Sol Del Rio | Windchase Hamlet | |
| Location | Houston, TX | Houston, TX | Houston, TX | Houston, TX | Houston, TX | Houston, TX | Houston, TX |
| Distance to Subject | NAP | 1.1 miles | 2.1 miles | 1.9 miles | 1.4 miles | 0.1 miles | 2.8 miles |
| Property Type | Garden | Garden | Garden | Garden | Garden | Garden | Garden |
| Number of Units | 792 | 384 | 132 | 312 | 488 | 424 | 200 |
| Average Rent (per unit) | |||||||
| 1BR | $629-$640 | $590-$680 | $830-$990 | $745 | $625-$750 | $560-$750 | $659-$799 |
| 2BR | $820-$852 | $830-$870 | $1,010-$1,109 | $775-$900 | $885 | $810-$1,050 | $829-$1,020 |
| 3BR | $1,093 | $999-$1,099 | NAP | $935 | NAP | NAP | NAP |
| Total Occupancy | 94% | 91% | 97% | 97% | 97% | 96% | 97% |
| (1) | Information obtained from the appraisal and underwritten rent roll. |
The Borrowers.The borrowers - Rama Elite, LLC, Rama North, LLC, and Rama York, LLC, each a Delaware limited liability company - are tenant-in-common borrowers with each individual entity structured as a single purpose entity with one independent director. Arun Verma is the guarantor of certain nonrecourse carveouts under the El Sol Brillante and Laguna Del Sol Apartments Mortgage Loan.
The Sponsor.The sponsor, Arun Verma, serves as the manager of the borrowers and has 28 years of real estate acquisition, development, rehabilitation and management experience. Mr. Verma was the founder, chairman and CEO of BVM Real Estate, Inc. for six years and chairman and CEO of BVM Group for 23 years. According to Mr. Verma’s real estate investment schedule, he maintains partnership equity interests of approximately $209.8 million in 12 multifamily projects and approximately 192,500 square feet of office space.
Escrows.The loan documents provide for upfront escrows in the amount of$142,305 for real estate taxes, $83,405 for insurance and $34,300 for deferred maintenance. The loan documents also provide for ongoing monthly reserves in the amount of $27,106 for real estate taxes, $26,478 for insurance, and $17,522 for replacement reserves. Additionally, in February 2015, building 58 (8 units) of the Laguna Del Sol Property had extensive fire damage. CENA Builders provided an estimate of $683,756 for the cost of the building reconstruction, which includes cost of labor, materials, equipment, supervision, insurance, permits and taxes. $854,695 (125% of the estimated cost) was escrowed up front to complete the reconstruction of the 8 units.
Lockbox and Cash Management.Upon the occurrence and continuance of a Cash Management Trigger Event (as defined below) the borrowers are required to establish a lender-controlled lockbox account. The loan documents also require that all revenues received by the borrowers or the property manager, after a Cash Management Trigger Event, be deposited into the lockbox account within one business day of receipt. Other than during a Cash Sweep Event (as defined below), all excess funds on deposit are disbursed to the borrowers.
A “Cash Management Trigger Event” will commence upon the occurrence of (i) an event of default under the loan documents; or (ii) any bankruptcy action of any of the borrowers, the guarantor or the manager. A Cash Management Trigger Event will end with respect to clause (i), when such event of default has been cured, and with respect to clause (ii), when such bankruptcy petition has been discharged, stayed, or dismissed, among other conditions. With regards to a bankruptcy of the property manager, clause (ii) may also be cured by the borrowers replacing the manager with a qualified manager acceptable to the lender.
A “Cash Sweep Event” will commence upon the occurrence of (i) an event of default under the loan documents; or (ii) any bankruptcy action of any of the borrowers, the guarantor, or the manager. A Cash Sweep Event will end with respect to clause (i), when such event of default has been cured, and with respect to clause (ii), when such bankruptcy petition has been discharged, stayed, or dismissed, among other conditions. With regards to a bankruptcy of the property manager, clause (ii) may also be cured by the borrowers replacing the manager with a qualified manager acceptable to the lender.
Property Management.The El Sol Brillante and Laguna Del Sol Apartments Properties are managed by an affiliate of the borrowers.
Assumption.The borrowers have the right to transfer the El Sol Brillante and Laguna Del Sol Apartments Properties 12 months after the origination date, provided that no event of default has occurred and is continuing and certain other conditions are satisfied, including, but not limited to, (i) the lender’s reasonable determination that the proposed transferee and guarantor satisfy the lender’s credit review and underwriting standards, taking into consideration transferee’s experience, financial strength and general business standing; (ii) execution of a recourse guaranty and an environmental indemnity by an affiliate of the transferee; and (iii) if requested by the lender, rating agency confirmation from Fitch, KBRA and Moody’s that the transfer will not result in a downgrade, withdrawal or qualification of the respective ratings assigned to the Series 2015-C29 Certificates.
THE INFORMATION IN THIS STRUCTURAL AND COLLATERAL TERM SHEET IS NOT COMPLETE AND MAY BE AMENDED PRIOR TO THE TIME OF SALE. THIS TERM SHEET IS NOT AN OFFER TO SELL THESE SECURITIES AND IT IS NOT A SOLICITATION OF AN OFFER TO BUY THESE SECURITIES IN ANY JURISDICTION WHERE THE OFFER OR SALE IS NOT PERMITTED.
| 75 |
| EL SOL BRILLANTE AND LAGUNA DEL SOL APARTMENTS |
Partial Release.Not permitted.
Real Estate Substitution.Not permitted.
Ground Lease.None
Subordinate and Mezzanine Indebtedness.Provided no event of default has occurred and is continuing, the borrowers have the right to incur mezzanine financing subject to the satisfaction of certain conditions, including but not limited to (i) the execution of an intercreditor agreement in form and substance acceptable to the lender and each of Fitch, KBRA and Moody’s; (ii) the combined loan-to-value is not greater than 73.5%; (iii) the combined amortizing debt service coverage ratio is not less than 1.30x (using a 30-year amortization schedule); and (iv) the lender receives rating agency confirmation from Fitch, KBRA and Moody’s that the mezzanine financing will not result in a downgrade, withdrawal or qualification of the respective ratings assigned to the Series 2015-C29 Certificates.
Terrorism Insurance.The loan documents require that the “all risk” insurance policy required to be maintained by the borrowers provides coverage for terrorism in an amount equal to the full replacement cost of the El Sol Brillante and Laguna Del Sol Apartments Properties, as well as business interruption insurance covering no less than the 12-month period following the occurrence of a casualty event, together with a 12-month extended period of indemnity.
Windstorm Insurance.The loan documents require windstorm insurance covering the full replacement cost of the El Sol Brillante and Laguna Del Sol Apartments Properties during the loan term. At the time of loan closing, the El Sol Brillante and Laguna Del Sol Apartments Properties had insurance coverage for windstorm.
THE INFORMATION IN THIS STRUCTURAL AND COLLATERAL TERM SHEET IS NOT COMPLETE AND MAY BE AMENDED PRIOR TO THE TIME OF SALE. THIS TERM SHEET IS NOT AN OFFER TO SELL THESE SECURITIES AND IT IS NOT A SOLICITATION OF AN OFFER TO BUY THESE SECURITIES IN ANY JURISDICTION WHERE THE OFFER OR SALE IS NOT PERMITTED.
| 76 |
[THIS PAGE INTENTIONALLY LEFT BLANK.]
THE INFORMATION IN THIS STRUCTURAL AND COLLATERAL TERM SHEET IS NOT COMPLETE AND MAY BE AMENDED PRIOR TO THE TIME OF SALE. THIS TERM SHEET IS NOT AN OFFER TO SELL THESE SECURITIES AND IT IS NOT A SOLICITATION OF AN OFFER TO BUY THESE SECURITIES IN ANY JURISDICTION WHERE THE OFFER OR SALE IS NOT PERMITTED.
| 77 |
[THIS PAGE INTENTIONALLY LEFT BLANK.]
THE INFORMATION IN THIS STRUCTURAL AND COLLATERAL TERM SHEET IS NOT COMPLETE AND MAY BE AMENDED PRIOR TO THE TIME OF SALE. THIS TERM SHEET IS NOT AN OFFER TO SELL THESE SECURITIES AND IT IS NOT A SOLICITATION OF AN OFFER TO BUY THESE SECURITIES IN ANY JURISDICTION WHERE THE OFFER OR SALE IS NOT PERMITTED.
| 78 |
| COUNTRY CLUB CENTER |

THE INFORMATION IN THIS STRUCTURAL AND COLLATERAL TERM SHEET IS NOT COMPLETE AND MAY BE AMENDED PRIOR TO THE TIME OF SALE. THIS TERM SHEET IS NOT AN OFFER TO SELL THESE SECURITIES AND IT IS NOT A SOLICITATION OF AN OFFER TO BUY THESE SECURITIES IN ANY JURISDICTION WHERE THE OFFER OR SALE IS NOT PERMITTED.
| 79 |
| COUNTRY CLUB CENTER |
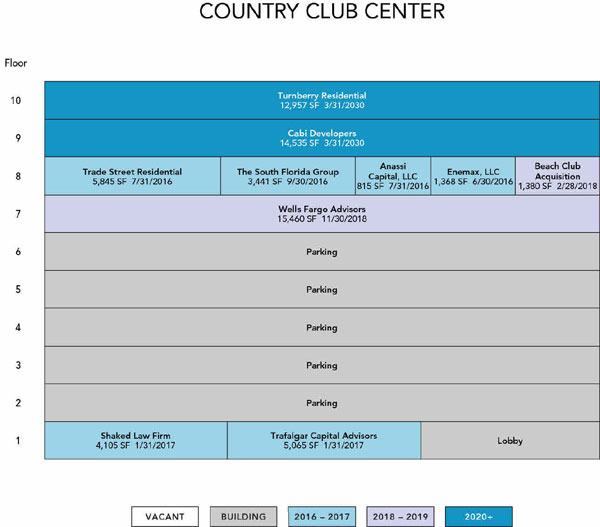
THE INFORMATION IN THIS STRUCTURAL AND COLLATERAL TERM SHEET IS NOT COMPLETE AND MAY BE AMENDED PRIOR TO THE TIME OF SALE. THIS TERM SHEET IS NOT AN OFFER TO SELL THESE SECURITIES AND IT IS NOT A SOLICITATION OF AN OFFER TO BUY THESE SECURITIES IN ANY JURISDICTION WHERE THE OFFER OR SALE IS NOT PERMITTED.
| 80 |
| COUNTRY CLUB CENTER |
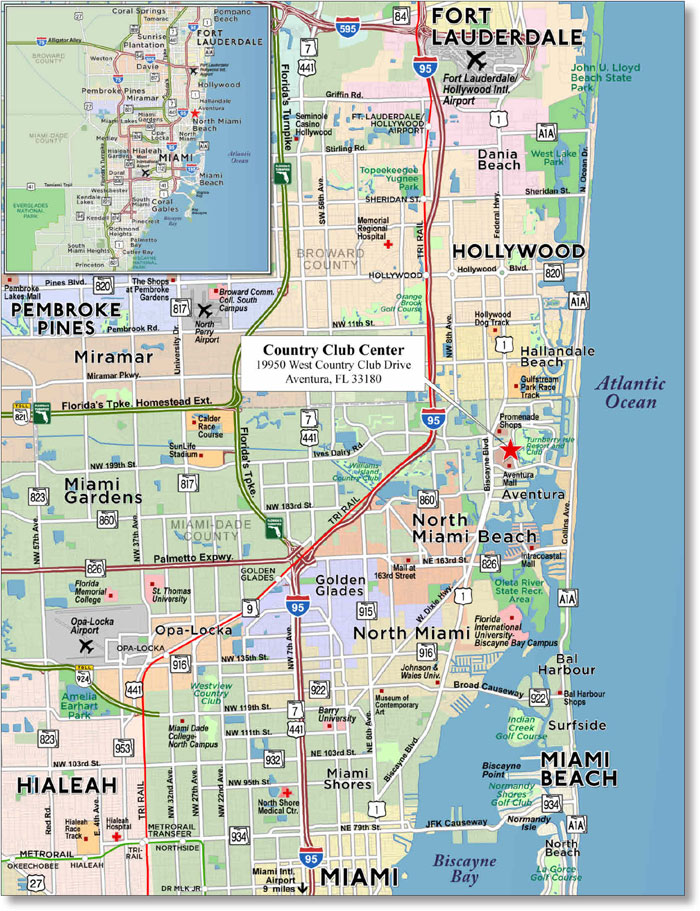
THE INFORMATION IN THIS STRUCTURAL AND COLLATERAL TERM SHEET IS NOT COMPLETE AND MAY BE AMENDED PRIOR TO THE TIME OF SALE. THIS TERM SHEET IS NOT AN OFFER TO SELL THESE SECURITIES AND IT IS NOT A SOLICITATION OF AN OFFER TO BUY THESE SECURITIES IN ANY JURISDICTION WHERE THE OFFER OR SALE IS NOT PERMITTED.
| 81 |
| No. 7 – Country Club Center |
| Loan Information | Property Information | ||||||
| Mortgage Loan Seller: | Wells Fargo Bank, National Association | Single Asset/Portfolio: | Single Asset | ||||
Credit Assessment (Fitch/KBRA/Moody’s): | NR/NR/NR | Property Type: | Office | ||||
| Original Principal Balance: | $27,000,000 | Specific Property Type: | Suburban | ||||
| Cut-off Date Principal Balance: | $27,000,000 | Location: | Aventura, FL | ||||
| % of Initial Pool Balance: | 2.3% | Size: | 64,971 SF | ||||
| Loan Purpose: | Refinance | Cut-off Date Principal Balance Per SF: | $415.57 | ||||
| Borrower Name: | Cabi Turnberry Aventura Offices, LP | Year Built/Renovated: | 2004/2006 | ||||
| Sponsor: | Jeffrey Soffer; Jacquelyn Soffer | Title Vesting: | Fee | ||||
| Mortgage Rate: | 4.390% | Property Manager: | Self-managed | ||||
| Note Date: | June 1, 2015 | 3rd Most Recent Occupancy (As of): | 100.0% (12/31/2012) | ||||
| Anticipated Repayment Date: | NAP | 2nd Most Recent Occupancy (As of): | 100.0% (12/31/2013) | ||||
| Maturity Date: | June 11, 2025 | Most Recent Occupancy (As of): | 100.0% (12/31/2014) | ||||
| IO Period: | 0 months | Current Occupancy (As of): | 100.0% (2/1/2015) | ||||
| Loan Term (Original): | 120 months | ||||||
| Seasoning: | 0 months | Underwriting and Financial Information: | |||||
| Amortization Term (Original): | 360 months | ||||||
| Loan Amortization Type: | Amortizing Balloon | 3rd Most Recent NOI (As of): | $1,964,026 (12/31/2012) | ||||
| Interest Accrual Method: | Actual/360 | 2nd Most Recent NOI (As of): | $1,801,286 (12/31/2013) | ||||
| Call Protection: | L(24),D(92),O(4) | Most Recent NOI (As of): | $1,819,446 (12/31/2014) | ||||
| Lockbox Type: | Soft/Springing Cash Management | ||||||
| Additional Debt: | None | ||||||
| Additional Debt Type: | NAP | ||||||
| U/W Revenues(2): | $3,186,714 | ||||||
| U/W Expenses: | $1,100,060 | ||||||
| U/W NOI: | $2,086,654 | ||||||
| Escrows and Reserves(1): | U/W NCF: | $2,015,376 | |||||
| U/W NOI DSCR: | 1.29x | ||||||
| Type: | Initial | Monthly | Cap (If Any) | U/W NCF DSCR: | 1.24x | ||
| Taxes | $205,376 | $25,672 | NAP | U/W NOI Debt Yield: | 7.7% | ||
| Insurance | $0 | Springing | NAP | U/W NCF Debt Yield: | 7.5% | ||
| Replacement Reserves | $0 | Springing | NAP | As-Is Appraised Value: | $36,000,000 | ||
| TI/LC Reserve | $0 | $0 | NAP | As-Is Appraisal Valuation Date: | March 23, 2015 | ||
| Major Tenant Reserve | $0 | Springing | NAP | Cut-off Date LTV Ratio: | 75.0% | ||
| Non-Renewing Tenant Reserve | $0 | Springing | NAP | LTV Ratio at Maturity or ARD: | 60.4% | ||
| (1) | See “Escrows” section. |
| (2) | See “Cash Flow Analysis” section. |
The Mortgage Loan.The mortgage loan (the “Country Club Center Mortgage Loan”) is evidenced by a single promissory note that is secured by a first mortgage encumbering an office building located in Aventura, Florida (the “Country Club Center Property”). The Country Club Center Mortgage Loan was originated on June 1, 2015 by Wells Fargo Bank, National Association. The Country Club Center Mortgage Loan had an original principal balance of $27,000,000, has an outstanding principal balance as of the Cut-off Date of $27,000,000 and accrues interest at an interest rate of 4.390%per annum. The Country Club Center Mortgage Loan had an initial term of 120 months, has a remaining term of 120 months as of the Cut-off Date and requires payments of principal and interest based on a 30-year amortization schedule. The Country Club Center Mortgage Loan matures on June 11, 2025.
Following the lockout period, the borrower has the right to defease the Country Club Center in whole, but not in part, on any date before March 11, 2025. In addition, the Country Club Center Mortgage Loan is prepayable without penalty on or after March 11, 2025.
THE INFORMATION IN THIS STRUCTURAL AND COLLATERAL TERM SHEET IS NOT COMPLETE AND MAY BE AMENDED PRIOR TO THE TIME OF SALE. THIS TERM SHEET IS NOT AN OFFER TO SELL THESE SECURITIES AND IT IS NOT A SOLICITATION OF AN OFFER TO BUY THESE SECURITIES IN ANY JURISDICTION WHERE THE OFFER OR SALE IS NOT PERMITTED.
| 82 |
| COUNTRY CLUB CENTER |
Sources and Uses
| Sources | Uses | |||||||||
| Original loan amount | $27,000,000 | 100.0 | % | Loan payoff(1) | $16,726,150 | 61.9 | % | |||
| Reserves | 205,376 | 0.8 | ||||||||
| Closings costs | 186,215 | 0.7 | ||||||||
| Return of equity | 9,882,259 | 36.6 | ||||||||
| Total Sources | $27,000,000 | 100.0 | % | Total Uses | $27,000,000 | 100.0 | % |
| (1) | The Country Club Center Property was previously securitized in the WBCMT 2005-C22 transaction. |
The Property.The Country Club Center Property is a 10-story, class A office building totaling 64,971 square feet located in Aventura, Florida, approximately 18.1 miles northeast of the Miami central business district. Built in 2004 and renovated in 2006, the Country Club Center Property is comprised of a parking garage on floors one through six and office space located on floors seven through ten. Upper floors feature small balconies and large glass windows allowing city views to the west and views of the Turnberry Golf Club and the Atlantic Ocean to the east. The Country Club Center Property is located less than one mile from the Turnberry Isle Miami Spa & Fitness Center, Residence Inn Miami Aventura Mall and the 2.7 million square foot Aventura Mall that has approximately 30.0 million visitors each year, per the appraisal. Parking for the Country Club Center Property is provided by a six-level parking structure that contains 216 garage spaces, equating to a parking ratio of 3.3 spaces per 1,000 square feet of rentable area. As of February 1, 2015, the Country Club Center Property was 100.0% occupied by 12 tenants.
The following table presents certain information relating to the tenancy at the Country Club Center Property:
Major Tenants
| Tenant Name | Credit Rating (Fitch/Moody’s/ S&P)(1) | Tenant NRSF | % of NRSF | Annual U/W Base Rent PSF(2) | Annual U/W Base Rent(2) | % of Total Annual U/W Base Rent | Lease Expiration Date | |||||||
| Major Tenants | ||||||||||||||
| Cabi Developers(3)(4) | NR/NR/NR | 14,535 | 22.4% | $37.50 | $545,063 | 25.2% | 2/28/2030 | |||||||
| Turnberry Residential(3)(5) | NR/NR/NR | 12,957 | 19.9% | $37.50 | $485,888 | 22.5% | 2/28/2030 | |||||||
| Wells Fargo Advisors | AA-/A2/A+ | 15,460 | 23.8% | $30.44(6) | $470,631(6) | 21.7% | 11/30/2018 | |||||||
| Trafalgar Capital Advisors | NR/NR/NR | 5,065 | 7.8% | $34.00 | $172,210 | 8.0% | 1/31/2017 | |||||||
| Trade Street Residential | NR/NR/NR | 5,845 | 9.0% | $25.48 | $148,931 | 6.9% | 7/31/2016(7) | |||||||
| Total Major Tenants | 53,862 | 82.9% | $33.84 | $1,822,722 | 84.2% | |||||||||
| Non-Major Tenants(8) | 11,109 | 17.1% | $30.70 | $341,101 | 15.8% | |||||||||
| Occupied Collateral Total | 64,971 | 100.0% | $33.30 | $2,163,823 | 100.0% | |||||||||
| Vacant Space | 0 | 0.0% | ||||||||||||
| Collateral Total | 64,971 | 100.0% | ||||||||||||
| (1) | Certain ratings are those of the parent company whether or not the parent company guarantees the lease. |
| (2) | Annual U/W Base Rent PSF and Annual U/W Base Rent include contractual rent steps through February 2016 totaling $17,061. |
| (3) | Borrower-affiliated tenant. |
| (4) | The lease for Cabi Developers is personally guaranteed by Cabi Holdings, Inc., who owns 49.5% of the borrower. |
| (5) | The lease for Turnberry Residential is personally guaranteed by Jeffrey Soffer, one of the sponsors. |
| (6) | The Annual U/W Base Rent and Annual U/W Base Rent PSF for Wells Fargo Advisors represent the tenant’s average rent through the remaining lease term. The current in-place rent for Wells Fargo Advisors is $28.96 per square foot. |
| (7) | Trade Street Residential has the right to terminate its lease at any time with four months’ notice. |
| (8) | Annual U/W Base Rent for Non-Major Tenants includes rental income from leases for cellular antennae and air rights that have no associated square footage. |
THE INFORMATION IN THIS STRUCTURAL AND COLLATERAL TERM SHEET IS NOT COMPLETE AND MAY BE AMENDED PRIOR TO THE TIME OF SALE. THIS TERM SHEET IS NOT AN OFFER TO SELL THESE SECURITIES AND IT IS NOT A SOLICITATION OF AN OFFER TO BUY THESE SECURITIES IN ANY JURISDICTION WHERE THE OFFER OR SALE IS NOT PERMITTED.
| 83 |
| COUNTRY CLUB CENTER |
The following table presents certain information relating to the lease rollover schedule at the Country Club Center Property:
Lease Expiration Schedule(1)(2)
| Year Ending December 31, | No. of Leases Expiring | Expiring NRSF | % of Total NRSF | Cumulative Expiring NRSF | Cumulative % of Total NRSF | Annual U/W Base Rent | Annual U/W Base Rent PSF(3) | ||||||||
| MTM | 0 | 0 | 0.0% | 0 | 0.0% | $0 | $0.00 | ||||||||
| 2015 | 0 | 0 | 0.0% | 0 | 0.0% | $0 | $0.00 | ||||||||
| 2016 | 4 | 11,469 | 17.7% | 11,469 | 17.7% | $296,135 | $25.82 | ||||||||
| 2017 | 2 | 9,170 | 14.1% | 20,639 | 31.8% | $288,751 | $31.49 | ||||||||
| 2018 | 2 | 16,840 | 25.9% | 37,479 | 57.7% | $504,786 | $29.98 | ||||||||
| 2019 | 2 | 0 | 0.0% | 37,479 | 57.7% | $43,200(4) | (4) | ||||||||
| 2020 | 0 | 0 | 0.0% | 37,479 | 57.7% | $0 | $0.00 | ||||||||
| 2021 | 0 | 0 | 0.0% | 37,479 | 57.7% | $0 | $0.00 | ||||||||
| 2022 | 0 | 0 | 0.0% | 37,479 | 57.7% | $0 | $0.00 | ||||||||
| 2023 | 0 | 0 | 0.0% | 37,479 | 57.7% | $0 | $0.00 | ||||||||
| 2024 | 0 | 0 | 0.0% | 37,479 | 57.7% | $0 | $0.00 | ||||||||
| 2025 | 0 | 0 | 0.0% | 37,479 | 57.7% | $0 | $0.00 | ||||||||
| Thereafter | 2 | 27,492 | 42.3% | 64,971 | 100.0% | $1,030,950 | $37.50 | ||||||||
| Vacant | 0 | 0 | 0.0% | 64,971 | 100.0% | $0 | $0.00 | ||||||||
| Total/Weighted Average | 12 | 64,971 | 100.0% | $2,163,823 | $33.30 |
| (1) | Information obtained from the underwritten rent roll. |
| (2) | Certain tenants may have lease termination options that are exercisable prior to the originally stated expiration date of the subject lease and that are not considered in the Lease Expiration Schedule. |
| (3) | Weighted Average Annual U/W Base Rent PSF excludes storage and vacant space. |
| (4) | Annual U/W Base Rent and Annual U/W Base Rent PSF include rental income from leases for a cellular antennae and air rights that have no associated square footage. |
The following table presents historical occupancy percentages at the Country Club Center Property:
Historical Occupancy
| 12/31/2012(1) | 12/31/2013(1) | 12/31/2014(1) | 2/1/2015(2) | |||
| 100.0% | 100.0% | 100.0% | 100.0% |
| (1) | Information obtained from the borrower. |
| (2) | Information obtained from the underwritten rent roll. |
THE INFORMATION IN THIS STRUCTURAL AND COLLATERAL TERM SHEET IS NOT COMPLETE AND MAY BE AMENDED PRIOR TO THE TIME OF SALE. THIS TERM SHEET IS NOT AN OFFER TO SELL THESE SECURITIES AND IT IS NOT A SOLICITATION OF AN OFFER TO BUY THESE SECURITIES IN ANY JURISDICTION WHERE THE OFFER OR SALE IS NOT PERMITTED.
| 84 |
| COUNTRY CLUB CENTER |
Operating History and Underwritten Net Cash Flow. The following table presents certain information relating to the historical operating performance and underwritten net cash flow at the Country Club Center Property:
Cash Flow Analysis
| 2012 | 2013 | 2014 | U/W | % of U/W Effective Gross Income | U/W $ per SF | ||||||||
| Base Rent | $1,845,076 | $1,794,782 | $1,768,453(1) | $2,163,823(1)(2) | 67.9% | $33.30 | |||||||
| Grossed Up Vacant Space | 0 | 0 | 0 | 0 | 0.0 | 0.00 | |||||||
| Total Reimbursables | 986,559 | 931,619 | 931,913 | 982,490 | 30.8 | 15.12 | |||||||
| Parking Income | 125,915 | 121,190 | 126,307 | 126,307 | 4.0 | 1.94 | |||||||
| Other Income | 20,760 | 20,950 | 22,286 | 22,286 | 0.7 | 0.34 | |||||||
| Less Vacancy & Free Rent | 0 | 0 | 0 | (108,191)(3) | (3.4) | (1.67) | |||||||
| Effective Gross Income | $2,978,310 | $2,868,541 | $2,848,959 | $3,186,714 | 100.0% | $49.05 | |||||||
| Total Operating Expenses | $1,014,284 | $1,067,255 | $1,029,513 | $1,100,060 | 34.5% | $16.93 | |||||||
| Net Operating Income | $1,964,026 | $1,801,286 | $1,819,446 | $2,086,654 | 65.5% | $32.12 | |||||||
| TI/LC | 0 | 0 | 0 | 58,284 | 1.9 | 0.90 | |||||||
| Capital Expenditures | 0 | 0 | 0 | 12,994 | 0.4 | 0.20 | |||||||
| Net Cash Flow | $1,964,026 | $1,801,286 | $1,819,446 | $2,015,376 | 63.2% | $31.02 | |||||||
| NOI DSCR | 1.21x | 1.11x | 1.12x | 1.29x | |||||||||
| NCF DSCR | 1.21x | 1.11x | 1.12x | 1.24x | |||||||||
| NOI DY | 7.3% | 6.7% | 6.7% | 7.7% | |||||||||
| NCF DY | 7.3% | 6.7% | 6.7% | 7.5% |
| (1) | The increase in the U/W Base Rent from 2014 is primarily due to new leases executed by Cabi Developers and Turnberry Residential at a higher rental rate for a total annual base rent increase of $371,142 that became effective in April 2015. |
| (2) | U/W Base Rent includes contractual rent steps through February 2016 totaling $17,061. |
| (3) | The underwritten economic vacancy is 5.0%. The Country Club Center Property was 100.0% physically occupied as of February 1, 2015. |
Appraisal.As of the appraisal valuation date of March 23, 2015, the Country Club Center Property had an “as-is” appraised value of $36,000,000.
Environmental Matters.According to the Phase I environmental report dated March 27, 2015, there was no evidence of any recognized environmental conditions at the Country Club Center Property.
Market Overview and Competition.The Country Club Center Property is located in Aventura, Florida, approximately one mile south of Broward County and approximately 18.1 miles northeast of the Miami central business district. Interstate 95 is the major north/south expressway providing direct access to the southeastern and northeastern areas of Miami-Dade County and is located approximately 2.1 miles west of the Country Club Center Property. The Miami International Airport is approximately 18.8 miles southwest of the Country Club Center Property. The City of Aventura provides a wide spectrum of land uses ranging from single-family homes and high-rise multifamily dwellings to the regional Aventura Mall and high-rise office buildings, as well as a variety of strip centers and free-standing retail along the major corridors. The 2.7 million square foot Aventura Mall is one of the largest shopping centers in the country, which is anchored by Nordstrom, Bloomingdale’s and Macy’s, plus luxury boutiques including Louis Vuitton, Cartier, Burberry, Red Valentino, Emilio Pucci, Sandro and Breitling. The estimated 2015 population within a one- and three-mile radius of the Country Club Center Property is 28,088 and 183,945, respectively, and the estimated average 2015 household income for the same radii is $82,591 and $67,478, respectively.
According to a third party research report, the Country Club Center Property is located in the Aventura office submarket which reported a total inventory of 52 buildings totaling 2.2 million square feet with a 7.9% vacancy rate as of the first quarter of 2015. The Aventura class A office submarket is comprised of 11 buildings totaling 1.0 million square feet and reported a 12.8% vacancy rate as of the first quarter of 2015. The appraiser concluded to a market rent for the Country Club Center Property of $34.00 per square foot, triple net, which is slightly higher than the weighted average underwritten base rent of $33.30 per square foot. The Aventura class A office submarket has experienced positive net absorption with vacancy declining from 17.2% at year end of 2014 to 12.8% as of the first quarter of 2015.
THE INFORMATION IN THIS STRUCTURAL AND COLLATERAL TERM SHEET IS NOT COMPLETE AND MAY BE AMENDED PRIOR TO THE TIME OF SALE. THIS TERM SHEET IS NOT AN OFFER TO SELL THESE SECURITIES AND IT IS NOT A SOLICITATION OF AN OFFER TO BUY THESE SECURITIES IN ANY JURISDICTION WHERE THE OFFER OR SALE IS NOT PERMITTED.
| 85 |
| COUNTRY CLUB CENTER |
The following table presents certain information relating to comparable office properties for the Country Club Center Property:
Competitive Set(1)
| Country Club Center (Subject) | One Turnberry Place | Aventura Corp. Center I & II | Aventura Harbour Centre | Turnberry Plaza | ||||||
| Location | Aventura, FL | Aventura, FL | Aventura, FL | Aventura, FL | Aventura, FL | |||||
| Distance from Subject | -- | 0.5 miles | 0.0 miles | 0.8 miles | 0.7 miles | |||||
| Property Type | Office | Office | Office | Office | Office | |||||
| Year Built/Renovated | 2004/2006 | 1990/NAP | 1988/2003 | 2003/NAP | 1985/NAP | |||||
| Stories | 10 | 9 | 5 | 11 | 10 | |||||
| Total GLA | 64,971 SF | 136,411 SF | 164,000 SF | 217,056 SF | 106,000 SF | |||||
| Total Occupancy | 100% | 100% | 89% | 96% | 100% |
| (1) | Information obtained from the appraisal. |
The Borrower.The borrower is Cabi Turnberry Aventura Offices, LP, a Delaware limited partnership and a single purpose entity that is owned by Cabi Holdings, Inc. and Jeffrey Soffer. Jeffrey and Jacquelyn Soffer are the guarantors of certain nonrecourse carveouts under the Country Club Center Mortgage Loan.
The Sponsor.The sponsors are Jeffrey and Jacquelyn Soffer. Mr. Soffer is the chairman and CEO of Turnberry Associates, a real estate development and property management company. Turnberry Associates has developed more than $10.0 billion in commercial and residential properties including approximately 20.0 million square feet of retail space, more than 7,000 apartments and condominium units, 1.5 million square feet of class A office space and in excess of 3,000 hotel and resort rooms. Mr. Soffer was involved in various litigation matters involving claims resulting from the Fontainebleau Las Vegas project filing for Chapter 11 bankruptcy protection in mid-2009, as well as other matters. In addition, affiliates of Cabi Holdings, Inc. have filed Chapter 11 bankruptcy and were involved in a default on a $1.5 billion real estate loan in 2008. See “Description of the Mortgage Pool – Litigation Considerations” and “Description of the Mortgage Pool – Default History, Bankruptcy Issues and Other Proceedings” in the Free Writing Prospectus.
Escrows.The loan documents provide for an upfront reserve in the amount of $205,376 and monthly escrows in the amount of $25,672 for real estate taxes. The loan documents require monthly escrows in an amount of $1,083 for replacement reserves; however, monthly escrows are waived provided no event of default has occurred and is continuing and the property is being adequately maintained as reasonably determined by the lender based on annual site inspections. The loan documents do not require monthly escrows for insurance as long as (i) no event of default has occurred and is continuing; (ii) the Country Club Center Property is insured under an acceptable blanket insurance policy; and (iii) the borrower provides the lender with evidence of renewal of the required policies and timely proof of payment of the insurance premiums.
Upon the occurrence of any tenant that leases more than 5.0% of the net rentable area at the Country Club Center Property failing to extend its lease, the borrower must deposit or provide a letter of credit for an amount equal to $25.00 per square foot for the applicable tenant space for tenant improvements and leasing commissions related to re-tenanting the non-renewing tenant space. Upon the occurrence of a Major Tenant Event Period (as defined below in the Lockbox and Cash Management section), all excess cash flow must be deposited into a cash management subaccount to be used for tenant improvements and leasing commissions; however, the borrower may deposit $365,000 in lieu of an excess cash flow sweep.
Lockbox and Cash Management.The Country Club Center Mortgage Loan requires a lender-controlled lockbox account, which is already in place, and that the borrower and property manager deposit all rents received into such lockbox account within one business day after receipt. Prior to a Cash Trap Event Period (as defined below), all funds on deposit in the lockbox account are swept to a borrower account. During a Cash Trap Event, the borrower and property manager will cause all rents to be deposited directly into the lockbox account, and all funds on deposit in the lockbox account will be swept into a lender-controlled cash management account.
A “Cash Trap Event Period” will commence upon the earlier of (i) the occurrence of an event of default; (ii) the amortizing debt service coverage ratio falling below 1.05x at the end of any calendar quarter; or (iii) the occurrence of a Major Tenant Event Period. A Cash Trap Event Period will be cured, with regard to clause (i), upon the cure of such event of default; with regard to clause (ii), upon the amortizing debt service coverage ratio being equal to or greater than 1.10x for two consecutive calendar quarters; and with regard to clause (iii), upon the ending of the Major Tenant Event Period.
A “Major Tenant Event Period” will commence upon the earlier of Cabi Developers (i) filing bankruptcy or similar insolvency proceeding; or (ii) going dark, vacating or otherwise failing to occupy the property or giving notice of its intent to commence any of the foregoing. A Major Tenant Event Period will end, with regard to clause (i), upon the bankruptcy or insolvency proceeding being terminated and Cabi Developers’ lease being affirmed; with regard to clause (ii), upon Cabi Developers resuming normal business operations for two consecutive calendar quarters; or, with regard to clauses (i) and (ii), upon the borrower depositing $365,000 or the lender receiving satisfactory evidence that the Cabi Developers’ space has been leased to one or more satisfactory replacement tenants on terms acceptable to the lender, such replacement tenants have taken occupancy and are open for business and the amortizing debt service coverage ratio is equal to or greater than 1.10x.
Property Management.The Country Club Center Property is managed by an affiliate of the borrower.
THE INFORMATION IN THIS STRUCTURAL AND COLLATERAL TERM SHEET IS NOT COMPLETE AND MAY BE AMENDED PRIOR TO THE TIME OF SALE. THIS TERM SHEET IS NOT AN OFFER TO SELL THESE SECURITIES AND IT IS NOT A SOLICITATION OF AN OFFER TO BUY THESE SECURITIES IN ANY JURISDICTION WHERE THE OFFER OR SALE IS NOT PERMITTED.
| 86 |
| COUNTRY CLUB CENTER |
Assumption.The borrower has a two-time right to transfer the Country Club Center Property, provided that no event of default has occurred and is continuing and certain other conditions are satisfied, including (i) the lender's reasonable determination that the proposed transferee and guarantor satisfy the lender's credit review and underwriting standards, taking into consideration transferee experience, financial strength and general business standing; (ii) execution of a recourse guaranty (which includes an environmental indemnity) by an affiliate of the transferee; and (iii) rating agency confirmation from Fitch, KBRA and Moody’s that the transfer will not result in a downgrade, withdrawal or qualification of the respective ratings assigned to the Series 2015-C29 Certificates.
Partial Release.Not permitted.
Real Estate Substitution.Not permitted.
Subordinate and Mezzanine Indebtedness. Not permitted.
Additional Indebtedness. Jeffrey Soffer and certain affiliates are permitted to pledge their direct or indirect, non-controlling ownership of the borrower (other than the general partner of the borrower). See “Description of the Mortgage Pool-Subordinate and/or Other Financing” in the Free Writing Prospectus.
Ground Lease.None.
Terrorism Insurance. The loan documents require that the “all risk” insurance policy required to be maintained by the borrower provide coverage for terrorism in an amount equal to the full replacement cost of the Country Club Center Property. The loan documents also require business interruption insurance covering no less than the 12-month period following the occurrence of a casualty event, together with a 6-month extended period of indemnity.
Windstorm Insurance. The loan documents require windstorm insurance covering the full replacement cost of the Country Club Center Property during the loan term. At the time of loan closing, the Country Club Center Property had insurance coverage for windstorm.
THE INFORMATION IN THIS STRUCTURAL AND COLLATERAL TERM SHEET IS NOT COMPLETE AND MAY BE AMENDED PRIOR TO THE TIME OF SALE. THIS TERM SHEET IS NOT AN OFFER TO SELL THESE SECURITIES AND IT IS NOT A SOLICITATION OF AN OFFER TO BUY THESE SECURITIES IN ANY JURISDICTION WHERE THE OFFER OR SALE IS NOT PERMITTED.
| 87 |
[THIS PAGE INTENTIONALLY LEFT BLANK.]
THE INFORMATION IN THIS STRUCTURAL AND COLLATERAL TERM SHEET IS NOT COMPLETE AND MAY BE AMENDED PRIOR TO THE TIME OF SALE. THIS TERM SHEET IS NOT AN OFFER TO SELL THESE SECURITIES AND IT IS NOT A SOLICITATION OF AN OFFER TO BUY THESE SECURITIES IN ANY JURISDICTION WHERE THE OFFER OR SALE IS NOT PERMITTED.
| 88 |
| PARKWAY CROSSING EAST SHOPPING CENTER |
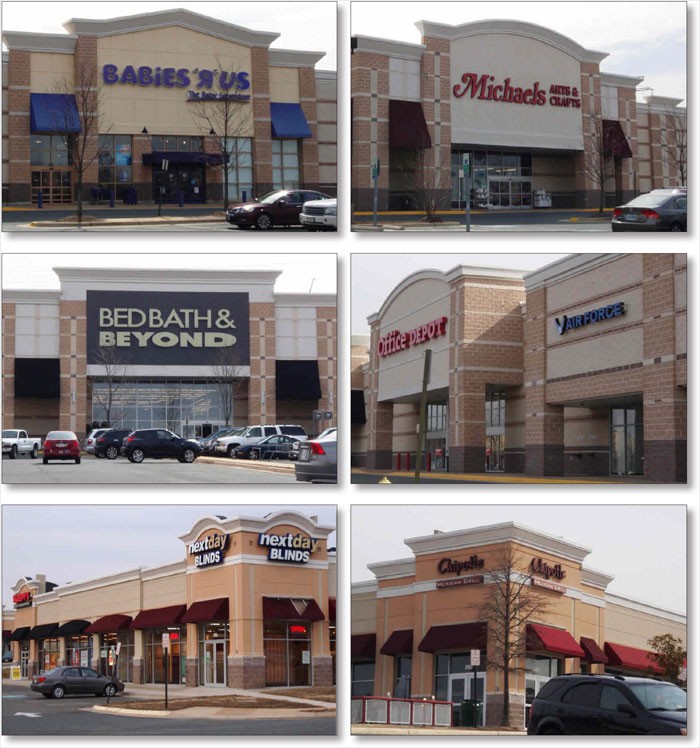
THE INFORMATION IN THIS STRUCTURAL AND COLLATERAL TERM SHEET IS NOT COMPLETE AND MAY BE AMENDED PRIOR TO THE TIME OF SALE. THIS TERM SHEET IS NOT AN OFFER TO SELL THESE SECURITIES AND IT IS NOT A SOLICITATION OF AN OFFER TO BUY THESE SECURITIES IN ANY JURISDICTION WHERE THE OFFER OR SALE IS NOT PERMITTED.
| 89 |
| PARKWAY CROSSING EAST SHOPPING CENTER |
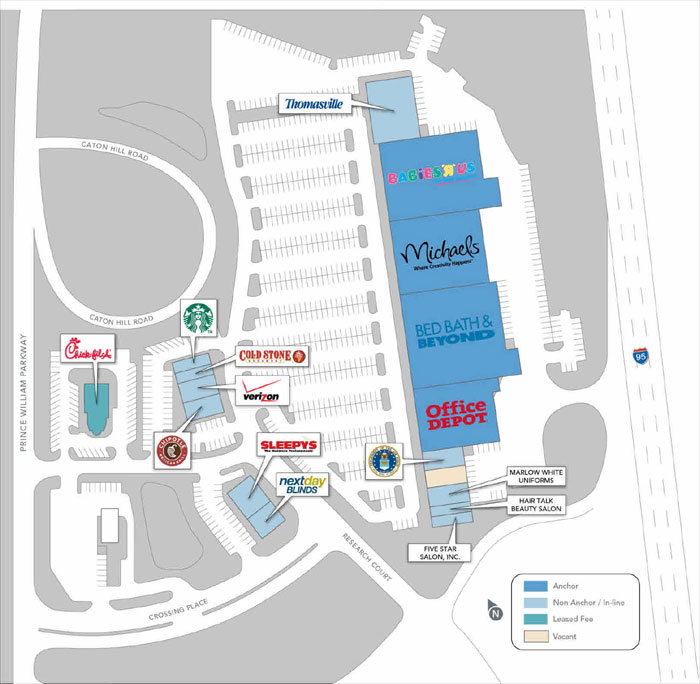
THE INFORMATION IN THIS STRUCTURAL AND COLLATERAL TERM SHEET IS NOT COMPLETE AND MAY BE AMENDED PRIOR TO THE TIME OF SALE. THIS TERM SHEET IS NOT AN OFFER TO SELL THESE SECURITIES AND IT IS NOT A SOLICITATION OF AN OFFER TO BUY THESE SECURITIES IN ANY JURISDICTION WHERE THE OFFER OR SALE IS NOT PERMITTED.
| 90 |
| PARKWAY CROSSING EAST SHOPPING CENTER |
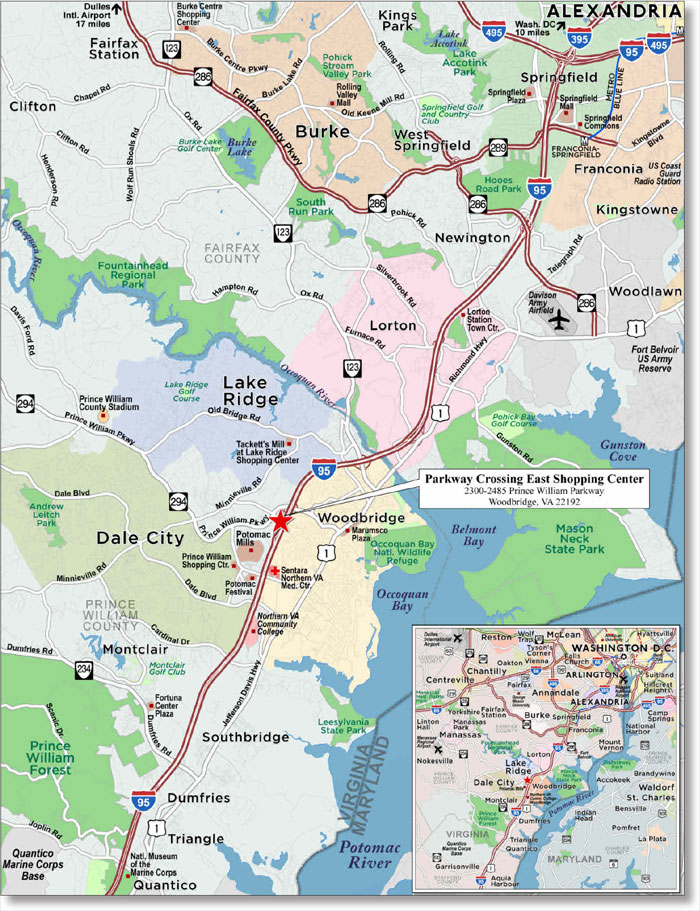
THE INFORMATION IN THIS STRUCTURAL AND COLLATERAL TERM SHEET IS NOT COMPLETE AND MAY BE AMENDED PRIOR TO THE TIME OF SALE. THIS TERM SHEET IS NOT AN OFFER TO SELL THESE SECURITIES AND IT IS NOT A SOLICITATION OF AN OFFER TO BUY THESE SECURITIES IN ANY JURISDICTION WHERE THE OFFER OR SALE IS NOT PERMITTED.
| 91 |
| No. 8 – Parkway Crossing East Shopping Center | |||||||
| Loan Information | Property Information | ||||||
| Mortgage Loan Seller: | Wells Fargo Bank, National Association | Single Asset/Portfolio: | Single Asset | ||||
| Credit Assessment (Fitch/KBRA/Moody’s): | NR/NR/NR | Property Type: | Retail | ||||
| Original Principal Balance: | $26,250,000 | Specific Property Type: | Anchored | ||||
| Cut-off Date Principal Balance: | $26,216,058 | Location: | Woodbridge, VA | ||||
| % of Initial Pool Balance: | 2.2% | Size(2): | 143,330 SF | ||||
| Loan Purpose: | Refinance | Cut-off Date Principal Balance Per SF: | $182.91 | ||||
| Borrower Name: | Parkway Crossing East Shopping Center, L.P. | Year Built/Renovated: | 2004/NAP | ||||
| Sponsor: | Thomas R. Green | Title Vesting: | Fee | ||||
| Mortgage Rate: | 4.130% | Property Manager: | Self-managed | ||||
| Note Date: | May 1, 2015 | 3rd Most Recent Occupancy (As of)(2): | 96.2% (12/31/2012) | ||||
| Anticipated Repayment Date: | NAP | 2nd Most Recent Occupancy (As of)(2): | 96.2% (12/31/2013) | ||||
| Maturity Date: | May 11, 2025 | Most Recent Occupancy (As of)(2): | 96.2% (12/31/2014) | ||||
| IO Period: | 0 months | Current Occupancy (As of)(2): | 98.1% (4/24/2015) | ||||
| Loan Term (Original): | 120 months | ||||||
| Seasoning: | 1 month | Underwriting and Financial Information: | |||||
| Amortization Term (Original): | 360 months | ||||||
| Loan Amortization Type: | Amortizing Balloon | 3rd Most Recent NOI (As of): | $2,078,711 (12/31/2012) | ||||
| Interest Accrual Method: | Actual/360 | 2nd Most Recent NOI (As of): | $1,999,461 (12/31/2013) | ||||
| Call Protection: | L(25),D(91),O(4) | Most Recent NOI (As of)(3): | $1,965,295 (12/31/2014) | ||||
| Lockbox Type: | Springing (Without Established Account) | ||||||
| Additional Debt: | No | ||||||
| Additional Debt Type: | NAP | U/W Revenues: | $2,962,282 | ||||
| U/W Expenses: | $707,962 | ||||||
| U/W NOI(3): | $2,254,321 | ||||||
| U/W NCF: | $2,107,163 | ||||||
| Escrows and Reserves(1): | U/W NOI DSCR | 1.48x | |||||
| U/W NCF DSCR: | 1.38x | ||||||
| Type: | Initial | Monthly | Cap (If Any) | U/W NOI Debt Yield: | 8.6% | ||
| Taxes | $0 | Springing | NAP | U/W NCF Debt Yield: | 8.0% | ||
| Insurance | $0 | Springing | NAP | As-Is Appraised Value: | $35,000,000 | ||
| Replacement Reserves | $0 | $2,747 | NAP | As-Is Appraisal Valuation Date: | February 10, 2015 | ||
| TI/LC Reserve | $0 | $7,764 | $400,000 | Cut-off Date LTV Ratio: | 74.9% | ||
| Office Depot Reserve | $200,000 | $0 | NAP | LTV Ratio at Maturity or ARD: | 59.9% | ||
| (1) | See “Escrows” section. |
| (2) | Occupancy includes Babies “R” Us (30,000 square feet) which is on a ground lease and owns its own improvements. |
| (3) | See “Cash Flow Analysis” section. |
The Mortgage Loan.The mortgage loan (the “Parkway Crossing East Shopping Center Mortgage Loan”) is evidenced by a single promissory note that is secured by a first mortgage encumbering an anchored retail center located in Woodbridge, Virginia (the “Parkway Crossing East Shopping Center Property”). The Parkway Crossing East Shopping Center Mortgage Loan was originated on May 1, 2015 by Wells Fargo Bank, National Association. The Parkway Crossing East Shopping Center Mortgage Loan had an original principal balance of $26,250,000, has an outstanding principal balance as of the Cut-off Date of $26,216,058 and accrues interest at an interest rate of 4.130%per annum. The Parkway Crossing East Shopping Center Mortgage Loan had an initial term of 120 months, has a remaining term of 119 months as of the Cut-off Date and requires payments of principal and interest based on a 30-year amortization schedule. The Parkway Crossing East Shopping Center Mortgage Loan matures on May 11, 2025.
Following the lockout period, the borrower has the right to defease the Parkway Crossing East Shopping Center Mortgage Loan in whole, but not in part, on any date before February 11, 2025. In addition, the Parkway Crossing East Shopping Center is prepayable without penalty on or after February 11, 2025.
THE INFORMATION IN THIS STRUCTURAL AND COLLATERAL TERM SHEET IS NOT COMPLETE AND MAY BE AMENDED PRIOR TO THE TIME OF SALE. THIS TERM SHEET IS NOT AN OFFER TO SELL THESE SECURITIES AND IT IS NOT A SOLICITATION OF AN OFFER TO BUY THESE SECURITIES IN ANY JURISDICTION WHERE THE OFFER OR SALE IS NOT PERMITTED.
| 92 |
| PARKWAY CROSSING EAST SHOPPING CENTER |
Sources and Uses
| Sources | Uses | ||||||||
| Original loan amount | $26,250,000 | 100.0% | Loan payoff(1) | $20,871,216 | 79.5 | % | |||
| Reserves | 200,000 | 0.8 | |||||||
| Closing costs | 178,919 | 0.7 | |||||||
| Return of equity | 4,999,865 | 19.0 | |||||||
| Total Sources | $26,250,000 | 100.0% | Total Uses | $26,250,000 | 100.0 | % |
| (1) | The Parkway Crossing East Shopping Center Property was previously securitized in the MLMT 2005-CK11 transaction. |
The Property.The Parkway Crossing East Shopping Center Property is an anchored retail center located in Woodbridge, Virginia, approximately 24.3 miles southwest of Washington D.C. Built in 2004, the Parkway Crossing East Shopping Center Property is situated on a 21.3-acre parcel and is anchored by Michaels, Bed Bath & Beyond, Office Depot and Babies R Us, which is on a ground lease and owns its own improvements. The Parkway Crossing East Shopping Center Property consists of four buildings including three, multi-tenant retail strips and one pad site that is ground leased to Chick-Fil-A. The Parkway Crossing East Shopping Center Property contains 596 parking spaces, resulting in a parking ratio of 4.2 spaces per 1,000 square feet of rentable area. Since its construction in 2004, occupancy at the Parkway Crossing East Shopping Center Property has averaged 98.8%. As of April 24, 2015, the Parkway Crossing East Shopping Center Property was 98.1% occupied by 16 tenants.
The following table presents certain information relating to the tenancy at the Parkway Crossing East Shopping Center Property:
Major Tenants
| Tenant Name | Credit Rating (Fitch/Moody’s/ S&P)(1) | Tenant NRSF | % of NRSF | Annual U/W Base Rent PSF(2) | Annual U/W Base Rent(2) | % of Total Annual U/W Base Rent | Sales PSF(3) | Occupancy Cost(3) | Lease Expiration Date | ||||||||||||
| Anchor Tenants | |||||||||||||||||||||
| Michaels | NR/NR/B+ | 23,982 | 16.7% | $16.87 | $404,600 | 16.4 | % | NAV | NAV | 2/29/2020(4) | |||||||||||
| Bed Bath & Beyond | NR/Baa1/A- | 35,070 | 24.5% | $11.53 | $404,250 | 16.4 | % | NAV | NAV | 1/31/2020(5) | |||||||||||
| Office Depot | NR/B2/B- | 18,000 | 12.6% | $15.00 | $270,000 | 10.9 | % | NAV | NAV | 10/31/2019(6) | |||||||||||
| Babies “R” Us | CC/B3/B- | 30,000(7) | 20.9%(7) | $8.07(7) | $242,000 | 9.8 | % | NAV | NAV | 1/31/2020(8) | |||||||||||
| Total Anchor Tenants | 107,052 | 74.7% | $12.34 | $1,320,850 | 53.6 | % | |||||||||||||||
| Major Tenants | |||||||||||||||||||||
| Thomasville Furniture | NR/NR/NR | 10,403 | 7.3% | $23.83 | $247,903 | 10.1 | % | NAV | NAV | 3/31/2017 | |||||||||||
| Sleepy’s | NR/NR/NR | 3,644 | 2.5% | $41.59 | $151,554 | 6.1 | % | NAV | NAV | 11/30/2020 | |||||||||||
| Total Major Tenants | 14,047 | 9.8% | $28.44 | $399,457 | 16.2 | % | |||||||||||||||
| Non-Major Tenants | 19,528(9) | 13.6% | $38.20(9) | $745,993(9) | 30.2 | % | |||||||||||||||
| Occupied Collateral Total | 140,627 | 98.1% | $17.54 | $2,466,300 | 100.0 | % | |||||||||||||||
| Vacant Space | 2,703 | 1.9% | |||||||||||||||||||
| Collateral Total | 143,330 | 100.0% | |||||||||||||||||||
| (1) | Certain ratings are those of the parent company whether or not the parent guarantees the lease. |
| (2) | Annual U/W Base Rent PSF and Annual U/W Base Rent include contractual rent steps through January 2016 totaling $8,569. |
| (3) | The majority of tenants at the Parkway Crossing East Shopping Center Property are not required to report sales. |
| (4) | Michaels has four, 5-year lease renewal options. |
| (5) | Bed Bath & Beyond has three, 5-year lease renewal options. |
| (6) | Office Depot has two, 5-year lease renewal options. |
| (7) | Babies “R” Us is on a ground lease and owns its own improvements. |
| (8) | Babies “R” Us has seven, 5-year lease renewal options. |
| (9) | The Annual U/W Base Rent PSF and Annual U/W Base Rent include ground rent from Chick-Fil-A ($115,719) but the square footage attributed to the Chick-Fil-A outparcel was excluded from the Non-Major Tenants NRSF since the tenant is on a ground lease and owns its own improvements. The Annual U/W Base Rent PSF excluding the Chick-Fil-A rent is $32.28. |
THE INFORMATION IN THIS STRUCTURAL AND COLLATERAL TERM SHEET IS NOT COMPLETE AND MAY BE AMENDED PRIOR TO THE TIME OF SALE. THIS TERM SHEET IS NOT AN OFFER TO SELL THESE SECURITIES AND IT IS NOT A SOLICITATION OF AN OFFER TO BUY THESE SECURITIES IN ANY JURISDICTION WHERE THE OFFER OR SALE IS NOT PERMITTED.
| 93 |
| PARKWAY CROSSING EAST SHOPPING CENTER |
The following table presents certain information relating to the lease rollover schedule at the Parkway Crossing East Shopping Center Property:
Lease Expiration Schedule(1)(2)
| Year Ending December 31, | No. of Leases Expiring | Expiring NRSF | % of Total NRSF | Cumulative Expiring NRSF | Cumulative % of Total NRSF | Annual U/W Base Rent | % of Annual U/W Base Rent | Annual U/W Base Rent PSF(3) | ||||||||||
| MTM | 0 | 0 | 0.0% | 0 | 0.0% | $0 | 0.0% | $0.00 | ||||||||||
| 2015 | 0 | 0 | 0.0% | 0 | 0.0% | $0 | 0.0% | $0.00 | ||||||||||
| 2016 | 0 | 0 | 0.0% | 0 | 0.0% | $0 | 0.0% | $0.00 | ||||||||||
| 2017 | 4 | 17,513 | 12.2% | 17,513 | 12.2% | $473,778 | 19.2% | $27.05 | ||||||||||
| 2018 | 0 | 0 | 0.0% | 17,513 | 12.2% | $0 | 0.0% | $0.00 | ||||||||||
| 2019 | 1 | 18,000 | 12.6% | 35,513 | 24.8% | $270,000 | 10.9% | $15.00 | ||||||||||
| 2020 | 9 | (4) | 102,591(4) | 71.6%(4) | 138,104(4) | 96.4%(4) | $1,522,282 | 61.7% | $14.84 | (4) | ||||||||
| 2021 | 0 | 0 | 0.0% | 138,104 | 96.4% | $0 | 0.0% | $0.00 | ||||||||||
| 2022 | 1 | 2,523 | 1.8% | 140,627 | 98.1% | $84,521 | 3.4% | $33.50 | ||||||||||
| 2023 | 1 | (5) | 0(5) | 0.0%(5) | 140,627(5) | 98.1%(5) | $115,719 | (5) | 4.7% | (5) | ||||||||
| 2024 | 0 | 0 | 0.0% | 140,627 | 98.1% | $0 | 0.0% | $0.00 | ||||||||||
| 2025 | 0 | 0 | 0.0% | 140,627 | 98.1% | $0 | 0.0% | $0.00 | ||||||||||
| Thereafter | 0 | 0 | 0.0% | 140,627 | 98.1% | $0 | 0.0% | $0.00 | ||||||||||
| Vacant | 0 | 2,703 | 1.9% | 143,330 | 100.0% | $0 | 0.0% | $0.00 | ||||||||||
| Total/Weighted Average | 16 | 143,330 | 100.0% | $2,466,300 | 100.0% | $17.54 | ||||||||||||
| (1) | Information obtained from the underwritten rent roll. |
| (2) | Certain tenants may have lease termination options that are exercisable prior to the originally stated expiration date of the subject lease and that are not considered in the Lease Expiration Schedule. |
| (3) | Weighted Average Annual U/W Base Rent PSF excludes vacant space. |
| (4) | Babies “R” Us (30,000 square feet; 20.9% of NRSF) is on a ground lease and owns its own improvements. |
| (5) | The square footage attributed to a Chick-Fil-A outparcel was excluded from the total NRSF since the tenant is on a ground lease and owns its own improvements. |
The following table presents historical occupancy percentages at the Parkway Crossing East Shopping Center Property:
Historical Occupancy
| 12/31/2012(1)(2) | 12/31/2013(1)(2) | 12/31/2014(1)(2) | 4/24/2015(1)(3) | |||
| 96.2% | 96.2% | 96.2% | 98.1% |
| (1) | Occupancy includes Babies R US (30,000 square feet) which is on a ground lease and owns its own improvements. |
| (2) | Information obtained from the borrower. |
| (3) | Information obtained from the underwritten rent roll. |
THE INFORMATION IN THIS STRUCTURAL AND COLLATERAL TERM SHEET IS NOT COMPLETE AND MAY BE AMENDED PRIOR TO THE TIME OF SALE. THIS TERM SHEET IS NOT AN OFFER TO SELL THESE SECURITIES AND IT IS NOT A SOLICITATION OF AN OFFER TO BUY THESE SECURITIES IN ANY JURISDICTION WHERE THE OFFER OR SALE IS NOT PERMITTED.
| 94 |
| PARKWAY CROSSING EAST SHOPPING CENTER |
Operating History and Underwritten Net Cash Flow. The following table presents certain information relating to the historical operating performance and the underwritten net cash flow at the Parkway Crossing East Shopping Center Property:
Cash Flow Analysis
| 2012 | 2013 | 2014 | U/W | % of U/W Effective Gross Income | U/W $ per SF(1) | ||||||||
| Base Rent | $2,218,984 | $2,232,056 | $2,255,394 | $2,466,300(2) | 83.3% | $17.21 | |||||||
| Grossed Up Vacant Space | 0 | 0 | 0 | 81,089 | 2.7 | 0.57 | |||||||
| Total Reimbursables | 539,937 | 422,983 | 446,044 | 542,263 | 18.3 | 3.78 | |||||||
| Other Income | 0 | 648 | 294 | 0 | 0.0 | 0.00 | |||||||
| Less Vacancy & Credit Loss | 0 | 0 | 0 | (127,369)(3) | (4.3) | (0.89) | |||||||
| Effective Gross Income | $2,758,921 | $2,655,687 | $2,701,732 | $2,962,282 | 100.0% | $20.67 | |||||||
| Total Operating Expenses | $680,210 | $656,226 | $736,437 | $707,962 | 23.9% | 4.94 | |||||||
| Net Operating Income | $2,078,711 | $1,999,461 | $1,965,295(4) | $2,254,321(4) | 76.1% | $15.73 | |||||||
| TI/LC | 0 | 0 | 0 | 118,491 | 4.0 | 0.83 | |||||||
| Capital Expenditures | 0 | 0 | 0 | 28,666 | 1.0 | 0.20 | |||||||
| Net Cash Flow | $2,078,711 | $1,999,461 | $1,965,295 | $2,107,163 | 71.1% | $14.70 | |||||||
| NOI DSCR | 1.36x | 1.31x | 1.29x | 1.48x | |||||||||
| NCF DSCR | 1.36x | 1.31x | 1.29x | 1.38x | |||||||||
| NOI DY | 7.9% | 7.6% | 7.5% | 8.6% | |||||||||
| NCF DY | 7.9% | 7.6% | 7.5% | 8.0% | |||||||||
| (1) | Total square footage includes Babies R Us (30,000 square feet) which is on a ground lease and owns its own improvements. |
| (2) | U/W Base Rent includes contractual rent increases occurring through January 2016 totaling $8,569. |
| (3) | The underwritten economic vacancy is 5.0%. The Parkway Crossing East Shopping Center Property was 98.1% physically occupied as of April 24, 2015. |
| (4) | U/W Net Operating Income is greater than 2014 due to contractual rent increases that occurred from January 2015 through May 2015 totaling $113,873 and contractual rent increases occurring through January 2016 totaling $8,569 being underwritten. |
Appraisal. As of the appraisal valuation date of February 10, 2015, the Parkway Crossing East Shopping Center Property had an “as-is” appraised value of $35,000,000.
Environmental Matters. According to a Phase I environmental site assessment dated February 24, 2015, there was no evidence of any recognized environmental conditions at the Parkway Crossing East Shopping Center Property.
Market Overview and Competition.The Parkway Crossing East Shopping Center Property is located on the east side of Prince William Parkway, at the intersection of Caton Hill Road and bounded by Interstate 95 to the east, in Woodbridge, Virginia. Woodbridge is located approximately 24.3 miles southwest of Washington D.C. and is bounded by the Potomac and Occoquan Rivers. Given the substantial presence of the government in the market, many of the largest private-sector employers in the Washington D.C. metro area are defense manufacturers, government contractors and law firms. There are 17 Fortune 500 companies that have headquarters located in the greater Washington D.C. metro area and Inova Health Systems is the largest private employer in the region with approximately 16,000 employees. The neighborhood surrounding the Parkway Crossing East Shopping Center Property offers a variety of amenities for residents including the 100.0% occupied Potomac Mills Mall, located approximately 1.7 miles southwest of the Parkway Crossing East Shopping Center Property, which is one of the largest shopping centers in Northern Virginia and is anchored by JC Penney, Bloomingdale’s, Costco, Neiman Marcus, Nordstrom Rack and Marshalls. As of 2014, the estimated population within a three- and five-mile radius of the Parkway Crossing East Shopping Center Property was 112,686 and 220,400, respectively, and the average 2015 household income within the same radii was $105,163 and $117,345, respectively.
According to a third party research report, the Parkway Crossing East Shopping Center Property is located in the Washington, D.C. retail market. As of the first quarter of 2015, the Washington D.C. retail market was comprised of 16,285 properties totaling 224.1 million square feet and reported an overall vacancy rate of 4.5%. Within the Washington D.C. retail market, the Parkway Crossing East Shopping Center Property is located in the Woodbridge/I-95 Corridor retail submarket which reported a total inventory of 402 properties totaling approximately 3.7 million square feet as of the first quarter of 2015. The Woodbridge/I-95 Corridor retail submarket reported a vacancy rate of 3.5% and an average asking rent of $20.45 per square foot full-service gross.
THE INFORMATION IN THIS STRUCTURAL AND COLLATERAL TERM SHEET IS NOT COMPLETE AND MAY BE AMENDED PRIOR TO THE TIME OF SALE. THIS TERM SHEET IS NOT AN OFFER TO SELL THESE SECURITIES AND IT IS NOT A SOLICITATION OF AN OFFER TO BUY THESE SECURITIES IN ANY JURISDICTION WHERE THE OFFER OR SALE IS NOT PERMITTED.
| 95 |
| PARKWAY CROSSING EAST SHOPPING CENTER |
The following table presents certain information relating to comparable properties to the Parkway Crossing East Shopping Center Property:
Competitive Set(1)
| Parkway Crossing East Shopping Center (Subject) | Parkway Crossing West | Smoketown Stations | Potomac Festival | Prince William Square | Rollingwood Shopping Center | |||||||
| Location | Woodbridge, VA | Woodbridge, VA | Woodbridge, VA | Woodbridge, VA | Woodbridge, VA | Woodbridge, VA | ||||||
| Distance from Subject | -- | 0.5 miles | 1.0 miles | 2.1 miles | 1.9 miles | 1.6 miles | ||||||
| Property Type | Power Center | Power Center | Power Center | Community Center | Community Center | Community Center | ||||||
| Year Built/Renovated | 2004/NAP | 1995/NAP | 1992/2009 | 1990/NAP | 1986/NAP | 1997/2005 | ||||||
| Anchors | Michaels, Bed Bath & Beyond, Office Depot, Babies R Us | Target, Value City Furniture, Beauty 4U | Dick’s Sporting Goods, LA Fitness, Best Buy, Petsmart | Everest College, Savers, Staples, hhgregg | Jo-Ann Fabrics, Ashley Furniture, Ross Dress for Less, CW Price | Kohl’s, Global Foods, Home Depot (shadow anchor) | ||||||
| Total GLA | 143,330 SF | 185,261 SF | 494,506 SF | 327,886 SF | 233,147 SF | 163,317 SF | ||||||
| Total Occupancy | 98% | 100% | 97% | 96% | 86% | 100% |
| (1) | Information obtained from the appraisal. |
The Borrower.The borrower is Parkway Crossing East Shopping Center, L.P., a Virginia limited partnership and single purpose entity with one independent director. Thomas R. Green is the guarantor of certain nonrecourse carveouts under the Parkway Crossing East Shopping Center Mortgage Loan.
The Sponsors.The sponsor is Thomas R. Green, who founded National Real Estate Management Corp (“NRE”) in the early 1960’s to develop and manage various family-controlled real estate holdings. Headquartered in St. Louis, Missouri, NRE has built a diverse real estate portfolio that includes over 3.5 million square feet of retail shopping centers, 1,000 manufactured housing rental pads, 600 apartment units and 300,000 square feet of office and industrial space located across 11 states and Puerto Rico.
Escrows.The loan documents provide for upfront reserves in the amount of $200,000 for re-leasing expenses related to the Office Depot space due to potential uncertainty in connection with the pending Staples, Inc. acquisition of Office Depot; the funds will be returned to the borrower in June 2017, provided that no event of default has occurred or is continuing and no Major Tenant Event Period (as defined below in the Lockbox and Cash Management section) has occurred or is continuing with respect to the Office Depot space. The loan documents require monthly deposits of $2,747 for replacement reserves and $7,764 for tenant improvements and leasing commissions (subject to a cap of $400,000). The loan documents do not require monthly escrows for real estate taxes, provided that (i) no event of default or Cash Trap Event Period (as defined below in the Lockbox and Cash Management section) has occurred and is continuing; (ii) the borrower pays all taxes at least seven calendar days prior to delinquency; and (iii) the borrower provides satisfactory evidence of payment of taxes at least seven days prior to delinquency. The loan documents also do not require monthly escrows for insurance, provided that (a) no event of default has occurred and is continuing; (b) the Parkway Crossing East Shopping Center Property is insured via an acceptable blanket insurance policy; and (c) the borrower provides the lender with evidence of renewal of the insurance policies and timely proof of payment of insurance premiums.
Lockbox and Cash Management.Upon the occurrence of a Cash Trap Event Period (as defined below), the borrower will be required to establish a lender-controlled lockbox account and direct tenants to deposit all rents directly into such lockbox account. During a Cash Trap Event Period, all excess funds on deposit in the lockbox account are swept to a lender-controlled cash flow sub-account.
A “Cash Trap Event Period” will commence upon the earlier of (i) the occurrence and continuance of an event of default; (ii) the net cash flow debt yield falling below 7.0%; or (iii) the occurrence of a Major Tenant Event Period (as defined below). A Cash Trap Event Period will be cured, with regard to clause (i), upon the cure of such event of default; with regard to clause (ii), upon the net cash flow debt yield being equal to or greater than 7.0% for two consecutive calendar quarters; and with regard to clause (iii), upon the end of a Major Tenant Event Period.
A “Major Tenant Event Period” will commence upon the earlier of Bed Bath & Beyond, Babies “R” Us, Michaels or Office Depot (individually or collectively, a “Major Tenant”) (i) going dark, vacating or otherwise failing to occupy its space; (ii) filing bankruptcy or similar insolvency; or (iii) terminating its lease, giving a termination notice or the lease otherwise failing to be in full force and effect. A Major Tenant Event Period will be cured, with regard to clause (i), upon the occurrence of a Major Tenant Re-Tenanting Event (as defined below) or the applicable Major Tenant resuming its normal business operations and being open for two consecutive calendar quarters; with respect to clause (ii), upon the occurrence of a Major Tenant Re-Tenanting Event or the bankruptcy or insolvency proceeding being terminated and the related Major Tenant’s lease being affirmed; with respect to clause (iii), upon the occurrence of a Major Tenant Re-Tenanting Event or any applicable default being cured and such Major Tenant’s lease being in full force and effect for two consecutive calendar quarters; and with respect to clauses (i), (ii) and (iii), in the event that such Major Tenant Event Period has occurred (x) with respect to only one Major Tenant that is not Office Depot, (y) no other Major Tenant Event Period has occurred with respect to a different Major Tenant and (z) no other tenant’s lease includes co-tenancy provisions with respect to such Major Tenant, the Major Tenant Event Period will end once the balance of funds in the excess cash flow sub-account is equal to or greater than $10.00 per square foot of the related Major Tenant’s space.
THE INFORMATION IN THIS STRUCTURAL AND COLLATERAL TERM SHEET IS NOT COMPLETE AND MAY BE AMENDED PRIOR TO THE TIME OF SALE. THIS TERM SHEET IS NOT AN OFFER TO SELL THESE SECURITIES AND IT IS NOT A SOLICITATION OF AN OFFER TO BUY THESE SECURITIES IN ANY JURISDICTION WHERE THE OFFER OR SALE IS NOT PERMITTED.
| 96 |
| PARKWAY CROSSING EAST SHOPPING CENTER |
A “Major Tenant Re-Tenanting Event” will occur upon the lender receiving satisfactory evidence that the applicable Major Tenant’s space has been leased to one or more satisfactory replacement tenants and that such replacement tenant is in occupancy, open for business and paying full unabated rent.
Property Management. The Parkway Crossing East Shopping Center Property is managed by an affiliate of the borrower.
Assumption. The borrower has the two-time right to transfer the Parkway Crossing East Shopping Center Property, provided that certain conditions are satisfied, including (i) the lender has reasonably determined that the proposed transferees and guarantor satisfy the lender’s credit review and underwriting standards, taking into consideration transferee’s experience, financial strength and general business standing; (ii) execution of a recourse guaranty and environmental indemnity; and (iii) the lender has received confirmation from Fitch, KBRA and Moody’s that such assumption will not result in a downgrade, withdrawal or qualification of the respective ratings assigned to the Series 2015-C29 Certificates.
Partial Release. Not permitted.
Real Estate Substitution.Not permitted.
Subordinate and Mezzanine Indebtedness.Not permitted.
Ground Lease. None.
Terrorism Insurance. The loan documents require that the “all risk” insurance policy required to be maintained by the borrower provides coverage for terrorism in an amount equal to the full replacement cost of the Parkway Crossing East Shopping Center Property. The loan documents also require business interruption insurance covering no less than the 12-month period following the occurrence of a casualty event, together with a six-month extended period of indemnity.
THE INFORMATION IN THIS STRUCTURAL AND COLLATERAL TERM SHEET IS NOT COMPLETE AND MAY BE AMENDED PRIOR TO THE TIME OF SALE. THIS TERM SHEET IS NOT AN OFFER TO SELL THESE SECURITIES AND IT IS NOT A SOLICITATION OF AN OFFER TO BUY THESE SECURITIES IN ANY JURISDICTION WHERE THE OFFER OR SALE IS NOT PERMITTED.
| 97 |
| OLMSTED PLAZA SHOPPING CENTER |
THE INFORMATION IN THIS STRUCTURAL AND COLLATERAL TERM SHEET IS NOT COMPLETE AND MAY BE AMENDED PRIOR TO THE TIME OF SALE. THIS TERM SHEET IS NOT AN OFFER TO SELL THESE SECURITIES AND IT IS NOT A SOLICITATION OF AN OFFER TO BUY THESE SECURITIES IN ANY JURISDICTION WHERE THE OFFER OR SALE IS NOT PERMITTED.
| 98 |
| OLMSTED PLAZA SHOPPING CENTER |

THE INFORMATION IN THIS STRUCTURAL AND COLLATERAL TERM SHEET IS NOT COMPLETE AND MAY BE AMENDED PRIOR TO THE TIME OF SALE. THIS TERM SHEET IS NOT AN OFFER TO SELL THESE SECURITIES AND IT IS NOT A SOLICITATION OF AN OFFER TO BUY THESE SECURITIES IN ANY JURISDICTION WHERE THE OFFER OR SALE IS NOT PERMITTED.
| 99 |
| No. 9 – Olmsted Plaza Shopping Center | |||||||
| Loan Information | Property Information | ||||||
| Mortgage Loan Seller: | Silverpeak Real Estate Finance LLC | Single Asset/Portfolio: | Single Asset | ||||
| Credit Assessment (Fitch/KBRA/Moody’s): | NR/NR/NR | Property Type: | Retail | ||||
| Original Principal Balance: | $25,500,000 | Specific Property Type: | Anchored | ||||
| Cut-off Date Principal Balance: | $25,500,000 | Location: | North Olmsted, OH | ||||
| % of Initial Pool Balance: | 2.2% | Size: | 255,902 SF | ||||
| Loan Purpose: | Refinance | Cut-off Date Principal Balance Per SF: | $99.65 | ||||
| Borrower Name: | B & G Properties Limited Partnership | Year Built/Renovated: | 1969/NAP | ||||
| Sponsor: | B & G Properties LP | Title Vesting: | Fee | ||||
| Mortgage Rate: | 4.100% | Property Manager: | Self-managed | ||||
| Note Date: | April 7, 2015 | 3rd Most Recent Occupancy (As of): | 98.0% (12/31/2012) | ||||
| Anticipated Repayment Date: | NAP | 2nd Most Recent Occupancy (As of): | 100.0% (12/31/2013) | ||||
| Maturity Date: | May 6, 2025 | Most Recent Occupancy (As of): | 100.0% (12/31/2014) | ||||
| IO Period: | 60 months | Current Occupancy (As of): | 93.6% (4/6/2015) | ||||
| Loan Term (Original): | 120 months | ||||||
| Seasoning: | 1 months | Underwriting and Financial Information: | |||||
| Amortization Term (Original): | 360 months | ||||||
| Loan Amortization Type: | Interest-only, Amortizing Balloon | 3rd Most Recent NOI (As of): | $2,960,269 (12/31/2012) | ||||
| Interest Accrual Method: | Actual/360 | 2nd Most Recent NOI (As of): | $2,725,912 (12/31/2013) | ||||
| Call Protection: | L(25),D(91),O(4) | Most Recent NOI (As of)(2): | $2,820,280 (12/31/2014) | ||||
| Lockbox Type: | Hard/Springing Cash Management | ||||||
| Additional Debt: | None | ||||||
| Additional Debt Type: | NAP | ||||||
| U/W Revenues: | $4,250,049 | ||||||
| U/W Expenses: | $1,743,501 | ||||||
| U/W NOI(2): | $2,506,548 | ||||||
| U/W NCF: | $2,327,417 | ||||||
| Escrows and Reserves(1): | U/W NOI DSCR: | 1.70x | |||||
| U/W NCF DSCR: | 1.57x | ||||||
| Type: | Initial | Monthly | Cap (If Any) | U/W NOI Debt Yield: | 9.8% | ||
| Taxes | $319,454 | $63,891 | NAP | U/W NCF Debt Yield: | 9.1% | ||
| Insurance | $74,310 | $6,193 | NAP | As-Is Appraised Value: | $35,370,000 | ||
| Replacement Reserves | $4,287 | $4,287 | $100,000 | As-Is Appraisal Valuation Date: | February 11, 2015 | ||
| TI/LC Reserve | $10,717 | $10,717 | $200,000 | Cut-off Date LTV Ratio: | 72.1% | ||
| Special Rollover Reserve | NAP | Springing | NAP | LTV Ratio at Maturity or ARD: | 65.5% | ||
| (1) | See “Escrows” section. |
| (2) | See “Cash Flow Analysis” section. |
The Mortgage Loan. The mortgage loan (the “Olmsted Plaza Shopping Center Mortgage Loan”) is evidenced by a single promissory note that is secured by a first mortgage encumbering the fee interest in an anchored retail property located in North Olmsted, Ohio (the “Olmsted Plaza Shopping Center Property”). The Olmsted Plaza Shopping Center Mortgage Loan was originated on April 7, 2015 by Silverpeak Real Estate Finance LLC. The Olmsted Plaza Shopping Center Mortgage Loan had an original principal balance of $25,500,000, has an outstanding principal balance as of the Cut-off Date of $25,500,000 and accrues interest at an interest rate of 4.100%per annum. The Olmsted Plaza Shopping Center Mortgage Loan had an initial term of 120 months, has a remaining term of 119 months as of the Cut-off Date and requires interest-only payments for the first 60 payments following origination and, thereafter, requires payments of principal and interest based on a 30-year amortization schedule. The Olmsted Plaza Shopping Center Mortgage Loan matures on May 6, 2025.
Following the lockout period, the borrower has the right to defease the Olmsted Plaza Shopping Center Mortgage Loan in whole, but not in part, on any date before February 6, 2025. In addition, the Olmsted Plaza Shopping Center Mortgage Loan is prepayable without penalty on or after February 6, 2025.
THE INFORMATION IN THIS STRUCTURAL AND COLLATERAL TERM SHEET IS NOT COMPLETE AND MAY BE AMENDED PRIOR TO THE TIME OF SALE. THIS TERM SHEET IS NOT AN OFFER TO SELL THESE SECURITIES AND IT IS NOT A SOLICITATION OF AN OFFER TO BUY THESE SECURITIES IN ANY JURISDICTION WHERE THE OFFER OR SALE IS NOT PERMITTED.
| 100 |
| OLMSTED PLAZA SHOPPING CENTER |
Sources and Uses
| Sources | Uses | |||||||||
| Original loan amount | $25,500,000 | 98.0 | % | Loan payoff(1) | $25,118,692 | 96.5 | % | |||
| Sponsors’ new cash contribution | 516,315 | 2.0 | Reserves | 408,768 | 1.6 | |||||
| Closing costs | 488,855 | 1.9 | ||||||||
| Total Sources | $26,016,315 | 100.0 | % | Total Uses | $26,016,315 | 100.0 | % |
| (1) | The Olmsted Plaza Shopping Center Property was previously securitized in the MLMT 2005-CIP1 transaction. |
The Property. The Olmsted Plaza Shopping Center Property is an anchored retail property comprising approximately 255,902 square feet of rentable area within nine one-story buildings located in North Olmsted, Ohio, approximately 15.9 miles southwest of Cleveland, Ohio. Built in 1969, the Olmsted Plaza Shopping Center Property is located on Great Northern Boulevard, bounded by Brookpark Road to the south and Lorain Road to the north. The Olmsted Plaza Shopping Center Property is anchored by Value City Furniture, Aldi, and hhgregg and other tenants include PNC Bank, FedEx, Sherwin-Williams, H&R Block and Wells Fargo. The Olmsted Plaza Shopping Center Property contains 1,030 parking spaces, resulting in a parking ratio of 4.0 spaces per 1,000 square feet of rentable area. As of April 6, 2015, the Olmsted Plaza Shopping Center Property was 93.6% occupied by 30 tenants.
The following table presents certain information relating to the tenancy at the Olmsted Plaza Shopping Center Property:
Major Tenants
| Tenant Name | Credit Rating (Fitch/Moody’s/ S&P) (1) | Tenant NRSF | % of NRSF | Annual U/W Base Rent PSF(2) | Annual U/W Base Rent(2) | % of Total Annual U/W Base Rent | Sales PSF(3) | Occupancy Costs(3) | Lease Expiration Date | ||||||||||||
| Major Tenants | |||||||||||||||||||||
| Value City Furniture(4) | NR/NR/NR | 50,290 | 19.7% | $11.50 | $578,335 | 19.4% | NAV | NAV | 1/31/2026(5) | ||||||||||||
| hhgregg | NR/NR/NR | 31,800 | 12.4% | $10.66 | $338,988 | 11.4% | NAV | NAV | 8/1/2021(6) | ||||||||||||
| Harbor Freight and Tools | NR/Ba3/BB- | 16,000 | 6.3% | $10.75 | $172,000 | 5.8% | NAV | NAV | 10/31/2023 | ||||||||||||
| Aldi | NR/NR/NR | 16,785 | 6.6% | $10.13 | $170,000 | 5.7% | NAV | NAV | 9/30/2024(7) | ||||||||||||
| Cort Furniture Rental | NR/NR/NR | 10,737 | 4.2% | $12.55 | $134,799 | 4.5% | NAV | NAV | 1/31/2016(8) | ||||||||||||
| Total Major Tenants | 125,612 | 49.1% | $11.10 | $1,394,122 | 46.8% | ||||||||||||||||
| Non-Major Tenants | 113,832 | 44.5% | $13.94 | $1,586,965 | 53.2% | ||||||||||||||||
| Occupied Collateral Total | 239,444 | 93.6% | $12.45 | $2,981,087 | 100.0% | ||||||||||||||||
| Vacant Space | 16,458 | 6.4% | |||||||||||||||||||
| Collateral Total | 255,902 | 100.0% | |||||||||||||||||||
| (1) | Certain ratings are those of the parent company whether or not the parent company guarantees the lease. |
| (2) | Annual U/W Base Rent PSF and Annual U/W Base Rent include contractual rent steps through May 2016 totaling $10,509. |
| (3) | Tenants are not required to report sales figures under their respective leases. |
| (4) | Value City Furniture subleases its space from Dick’s Sporting Goods under a lease that expires in January 2016. Value City Furniture has occupied the former Dick’s Sporting Goods space since August 2005. Value City Furniture has executed a 10-year direct lease which will commence in February 2016. Value City Furniture’s direct lease was included in the underwriting of the Olmsted Shopping Center Mortgage Loan. The current rent under the Dick’s Sporting Goods lease is $12.50 per square foot. |
| (5) | Value City Furniture has two, 5-year lease renewal options. |
| (6) | hhgregg has two, 5-year lease renewal options. |
| (7) | Aldi has three, 5-year lease renewal options. |
| (8) | Cort Furniture Rental has one, 5-year lease renewal option. |
THE INFORMATION IN THIS STRUCTURAL AND COLLATERAL TERM SHEET IS NOT COMPLETE AND MAY BE AMENDED PRIOR TO THE TIME OF SALE. THIS TERM SHEET IS NOT AN OFFER TO SELL THESE SECURITIES AND IT IS NOT A SOLICITATION OF AN OFFER TO BUY THESE SECURITIES IN ANY JURISDICTION WHERE THE OFFER OR SALE IS NOT PERMITTED.
| 101 |
| OLMSTED PLAZA SHOPPING CENTER |
The following table presents certain information relating to the lease rollover schedule at the Olmsted Plaza Shopping Center Property:
Lease Expiration Schedule(1)(2)
| Year Ending December 31, | No. of Leases Expiring | Expiring NRSF | % of Total NRSF | Cumulative Expiring NRSF | Cumulative % of Total NRSF | Annual U/W Base Rent | Annual U/W Base Rent PSF(3) | ||||||||||||
| MTM | 3 | 10,110 | 4.0% | 10,110 | 4.0% | $74,400 | $7.36 | ||||||||||||
| 2015 | 2 | 3,302 | 1.3% | 13,412 | 5.2% | $41,958 | $12.71 | ||||||||||||
| 2016 | 5 | 20,827 | 8.1% | 34,239 | 13.4% | $284,595 | $13.66 | ||||||||||||
| 2017 | 2 | 7,430 | 2.9% | 41,669 | 16.3% | $114,000 | $15.34 | ||||||||||||
| 2018 | 4 | 29,012 | 11.3% | 70,681 | 27.6% | $398,460 | $13.73 | ||||||||||||
| 2019 | 2 | 9,200 | 3.6% | 79,881 | 31.2% | $124,200 | $13.50 | ||||||||||||
| 2020 | 4 | 14,486 | 5.7% | 94,367 | 36.9% | $247,476 | $17.08 | ||||||||||||
| 2021 | 3 | 43,300 | 16.9% | 137,667 | 53.8% | $530,788 | $12.26 | ||||||||||||
| 2022 | 2 | 18,702 | 7.3% | 156,369 | 61.1% | $244,875 | $13.09 | ||||||||||||
| 2023 | 1 | 16,000 | 6.3% | 172,369 | 67.4% | $172,000 | $10.75 | ||||||||||||
| 2024 | 1 | 16,785 | 6.6% | 189,154 | 73.9% | $170,000 | $10.13 | ||||||||||||
| 2025 | 0 | 0 | 0.0% | 189,154 | 73.9% | $0 | $0.00 | ||||||||||||
| Thereafter | 1 | 50,290 | 19.7% | 239,444 | 93.6% | $578,335 | $11.50 | ||||||||||||
| Vacant | 4 | 16,458 | 6.4% | 255,902 | 100.0% | $0 | $0.00 | ||||||||||||
| Total/Weighted Average | 34 | 255,902 | 100.0% | $2,981,087 | $12.45 | ||||||||||||||
| (1) | Information obtained from the underwritten rent roll. |
| (2) | Certain tenants may have lease termination options that are exercisable prior to the originally stated expiration date of the subject lease and that are not considered in the Lease Expiration Schedule. |
| (3) | The Annual U/W Base Rent PSF and Total/Weighted Average Annual U/W Base Rent PSF exclude vacant space. |
The following table presents historical occupancy percentages at the Olmsted Plaza Shopping Center Property:
Historical Occupancy
| 12/31/2012(1) | 12/31/2013(1) | 12/31/2014(1) | 4/6/2015(2) | |||
| 98.0% | 100.0% | 100.0% | 93.6% |
| (1) | Information obtained from the borrower. |
| (2) | Information obtained from the underwritten rent roll. |
THE INFORMATION IN THIS STRUCTURAL AND COLLATERAL TERM SHEET IS NOT COMPLETE AND MAY BE AMENDED PRIOR TO THE TIME OF SALE. THIS TERM SHEET IS NOT AN OFFER TO SELL THESE SECURITIES AND IT IS NOT A SOLICITATION OF AN OFFER TO BUY THESE SECURITIES IN ANY JURISDICTION WHERE THE OFFER OR SALE IS NOT PERMITTED.
| 102 |
| OLMSTED PLAZA SHOPPING CENTER |
Operating History and Underwritten Net Cash Flow. The following table presents certain information relating to the historical operating performance and the underwritten net cash flow at the Olmsted Plaza Shopping Center Property:
Cash Flow Analysis
| 2012 | 2013 | 2014(1) | U/W(1) | % of U/W Effective Gross Income | U/W $ per SF | ||||||||
| Base Rent | $3,204,276 | $3,351,408 | $3,364,665 | $2,981,087(2) | 70.1% | $11.65 | |||||||
| Grossed Up Vacant Space | 0 | 0 | 0 | 246,328 | 5.8 | 0.96 | |||||||
| Total Reimbursables | 1,174,571 | 847,438 | 1,393,022 | 1,268,962 | 29.9 | 4.96 | |||||||
| Less Vacancy & Credit Loss | 0 | 0 | 0 | (246,328)(3) | (5.8) | (0.96) | |||||||
| Effective Gross Income | $4,378,847 | $4,198,846 | $4,757,687 | $4,250,049 | 100.0% | $16.61 | |||||||
| Total Operating Expenses | $1,418,578 | $1,472,934 | $1,937,407 | $1,743,501 | 41.0% | $6.81 | |||||||
|
|
|
|
|
| ||||||||
| Net Operating Income | $2,960,269 | $2,725,912 | $2,820,280 | $2,506,548 | 59.0% | $9.79 | |||||||
| TI/LC | 0 | 0 | 0 | 127,951 | 3.0 | 0.50 | |||||||
| Reserves for Replacements | 0 | 0 | 0 | 51,180 | 1.2 | 0.20 | |||||||
| Net Cash Flow | $2,960,269 | $2,725,912 | $2,820,280 | $2,327,417 | 54.8% | $9.09 | |||||||
| NOI DSCR | 2.00x | 1.84x | 1.91x | 1.70x | |||||||||
| NCF DSCR | 2.00x | 1.84x | 1.91x | 1.57x | |||||||||
| NOI DY | 11.6% | 10.7% | 11.1% | 9.8% | |||||||||
| NCF DY | 11.6% | 10.7% | 11.1% | 9.1% |
| (1) | The decrease in NOI from 2014 to U/W is due to a tenant vacating 13,058 square feet (5.1% of net rentable area). |
| (2) | Base Rent includes contractual rent steps through May 2016 totaling $10,509. |
| (3) | The U/W economic vacancy is 5.5%. The Olmsted Plaza Shopping Center Property was 93.6% physically occupied as of April 6, 2015. |
Appraisal.As of the appraisal valuation date of February 11, 2015, the Olmsted Plaza Shopping Center Property had an “as-is” appraised value of $35,370,000.
Environmental Matters.According to the Phase I environmental site assessment dated February 19, 2015, there was no evidence of any recognized environmental conditions at the Olmsted Plaza Shopping Center Property.
Market Overview and Competition.The Olmsted Plaza Shopping Center Property is located within the Cleveland, Ohio metropolitan statistical area. Cleveland is the 28th most populous metropolitan area in the United States and the largest metropolitan area entirely in Ohio, accounting for 17.8% of the state’s population. Unemployment has declined in the metropolitan statistical area from 8.9% in 2010 to 6.0% in 2014. The largest employers in the market are the Cleveland Clinic, US Office of Personnel Management, University Hospitals, Giant Eagle, and Progressive Corporation.
The Olmsted Plaza Shopping Center Property is located within the Cleveland retail market's West retail submarket, approximately 16 miles southwest of the Cleveland central business district. The Great Northern Mall, a super-regional mall owned by an affiliate of Starwood Capital Group Global, L.P. and anchored by Dillard’s, Macy’s, JCPenney, Sears, Dick’s Sporting Goods and a 10-screen Regal Cinemas & RPX, is located along Great Northern Boulevard across from the Olmsted Plaza Shopping Center Property. The 2014 estimated population within a three- and five- mile radii of the Olmsted Plaza Shopping Center Property was approximately 63,467 and 178,407, respectively, and the median household income within the same three- and five-mile radii was approximately $58,373 and $58,008, respectively.
According to the appraisal, as of year-end 2014 there were no new projects under construction within the West retail submarket and the existing supply consisted of approximately 16.7 million square feet. From 2011 to 2014, vacancy in the West retail market has decreased from 6.3% to 5.1%.
THE INFORMATION IN THIS STRUCTURAL AND COLLATERAL TERM SHEET IS NOT COMPLETE AND MAY BE AMENDED PRIOR TO THE TIME OF SALE. THIS TERM SHEET IS NOT AN OFFER TO SELL THESE SECURITIES AND IT IS NOT A SOLICITATION OF AN OFFER TO BUY THESE SECURITIES IN ANY JURISDICTION WHERE THE OFFER OR SALE IS NOT PERMITTED.
| 103 |
| OLMSTED PLAZA SHOPPING CENTER |
The following table presents certain information relating to some comparable retail properties for the Olmsted Plaza Shopping Center Property:
Competitive Set(1)
| Olmsted Plaza Shopping Center (Subject) | Berea Plaza | Water Tower Square | Plazas at Great Northern | Village Square | ||||||
| Location | North Olmsted, OH | Berea, OH | North Olmsted, OH | North Olmsted, OH | Woodmere, OH | |||||
| Distance from Subject | 3.8 miles | 1.2 miles | 0.7 mile | 21.8 miles | ||||||
| Property Type | Shopping Center | Shopping Center | Shopping Center | Shopping Center | Shopping Center | |||||
| Year Built | 1969 | 1994 | 1995 | 1986 | 1960 | |||||
| Anchors | Value City Furniture, hhgregg, Aldi | Jax Big Discount | Volunteer of America | Big Lots | DXL | |||||
| Total GLA | 255,902(2) SF | 100,000 SF | 182,861 SF | 632,309 SF | 110,000 SF | |||||
| Total Occupancy | 94% | 100% | 73% | 98% | 100% |
| (1) | Information obtained from the appraisal. |
| (2) | Information obtained from the underwritten rent roll. |
The Borrower.The borrower is B & G Properties Limited Partnership, an Ohio limited partnership and single purpose entity with one independent director. Legal counsel to the borrower delivered a non-consolidation opinion in connection with the origination of the Olmsted Plaza Shopping Center Mortgage Loan. Jeffrey Glazer and Marshall Brown are the guarantors of certain nonrecourse carveouts under the Olmsted Plaza Shopping Center Mortgage Loan.
The Sponsor.The sponsor is B & G Properties LP, an entity controlled by Jeffrey Glazer and Marshall Brown. Mr. Glazer and Mr. Brown have been actively engaged in real estate investment, development and management activities since 1974. The sponsor developed the Olmsted Plaza Shopping Center Property in 1969 and has owned, managed and operated the property since that time.
Escrows.The loan documents provide for upfront escrows in the amount of $319,454 for taxes, $74,310 for insurance, $4,287 for replacement reserves and $10,717 for tenant improvements and leasing commissions (“TI/LCs”). The loan documents provide for ongoing monthly escrows of $63,891 for taxes, $6,193 for insurance, $4,287 for replacement reserves (subject to a cap of $100,000) and $10,717 for TI/LCs (subject to a cap of $200,000). Additionally, during a Lease Sweep Period (as defined below), all excess cash will be deposited into the special rollover reserve.
Lockbox and Cash Management.The Olmsted Plaza Shopping Center Mortgage Loan requires a lender-controlled lockbox account, which is already in place, and that the borrowers direct tenants to pay their rents directly into such lockbox account. The loan documents also require that all cash revenues and all other monies received by the borrower or the property manager be deposited into the lockbox account within one business day after receipt. Prior to the occurrence of a Cash Management Period (as defined below), all funds on deposit in the lockbox account will be disbursed to the borrower daily. During a Cash Management Period, funds are swept into a lender controlled cash management account.
A “Cash Management Period” will commence upon the occurrence of any of the following (i) the occurrence of an event of default; (ii) the amortizing debt service coverage ratio being less than 1.20x at the end of any calendar quarter; or (iii) the commencement of a Lease Sweep Period (as defined below). A Cash Management Period will be cured with regard to clause (i) when such event of default has been cured and no other default or event of default has occurred and is continuing; with regard to clause (ii) when the amortizing debt service coverage ratio is greater than or equal to 1.20x for two consecutive calendar quarters; and with regard to clause (iii), upon the termination of the Lease Sweep Period.
A “Lease Sweep Period” will commence upon the earlier of: (i) the date which is 12 months prior to the expiration of any Major Lease (Value City Furniture’s Lease and any other lease aggregating 40,000 or more square feet at the Olmsted Plaza Shopping Center Property), including any renewal terms; (ii) the date which any tenant under a Major Lease (a “Major Tenant”) is required to give notice of its exercise of a renewal option thereunder (and such renewal has not been exercised); (iii) any Major Lease (or material portion thereof) is surrendered, cancelled or terminated prior to its then-current expiration date; (iv) any Major Tenant discontinues its business at the premises (“goes dark”) or gives notice that it intends to discontinue its business; (v) the occurrence of a default (beyond any applicable notice and cure periods) under any Major Lease; or (vi) upon the occurrence of an insolvency proceeding by a Major Tenant.
A Lease Sweep Period will end upon the occurrence of, among other things, any of the following: with respect to clauses (i), (ii), (iii), or (iv), the earlier to occur of (A) the date on which the applicable Major Tenant exercises its renewal or extension option and sufficient funds have accumulated in the special rollover reserve to pay for all anticipated leasing expenses, or (B) the date on which all the space demised under the applicable Major Lease has been fully leased pursuant to a replacement lease and all leasing expenses have been paid in full; with respect to clause (v), the default being cured and no other Major Tenant default occurring for a period of three consecutive months following such cure; with respect to clause (vi), the applicable insolvency proceeding being terminated and the applicable Major Lease being affirmed, assumed or assigned; and with respect to clauses (i), (ii), (iii), (iv), (v) and (vi), the determination by the lender that an amount equal to $20.00 per square foot of the space demised under the applicable Major Lease has been deposited into the special rollover reserve (provided, however, that to the extent that the borrower shall lease a portion of the space demised under the applicable Major Lease to a replacement tenant or tenants approved by the lender, then such $20.00 per square foot amount will be decreased so that it applies only to the space that remains after taking into account such replacement lease or leases).
THE INFORMATION IN THIS STRUCTURAL AND COLLATERAL TERM SHEET IS NOT COMPLETE AND MAY BE AMENDED PRIOR TO THE TIME OF SALE. THIS TERM SHEET IS NOT AN OFFER TO SELL THESE SECURITIES AND IT IS NOT A SOLICITATION OF AN OFFER TO BUY THESE SECURITIES IN ANY JURISDICTION WHERE THE OFFER OR SALE IS NOT PERMITTED.
| 104 |
| OLMSTED PLAZA SHOPPING CENTER |
Property Management.The Olmsted Plaza Shopping Center Property is managed by an affiliate of the borrower.
Assumption.The borrower has the right to transfer the Olmsted Plaza Shopping Center Property, provided that certain conditions are satisfied, including (i) no default or event of default has occurred and is continuing; (ii) the borrower has provided the lender with not less than forty-five days’ prior written notice; (iii) the lender reasonably determines that the proposed transferee and guarantor satisfy the lender's credit review and underwriting standards, taking into consideration transferee’s experience, financial condition and creditworthiness; and (iv) the lender has received confirmation from Fitch, KBRA, and Moody’s that such assumption will not result in a downgrade, withdrawal or qualification of the respective ratings assigned to the Series 2015-C29 Certificates.
Partial Release.Not permitted.
Real Estate Substitution.Not permitted.
Subordinate and Mezzanine Indebtedness.Not permitted.
Ground Lease. None
Terrorism Insurance.The loan documents require that the “all-risk” insurance policy required to be maintained by the borrower provides coverage for terrorism (or such policies shall have no exclusion from coverage with respect thereto) in an amount equal to the full replacement cost of the Olmsted Plaza Shopping Center Property, as well as business interruption insurance covering no less than the 18-month period following the occurrence of a casualty event, together with a 6-month extended period of indemnity.
THE INFORMATION IN THIS STRUCTURAL AND COLLATERAL TERM SHEET IS NOT COMPLETE AND MAY BE AMENDED PRIOR TO THE TIME OF SALE. THIS TERM SHEET IS NOT AN OFFER TO SELL THESE SECURITIES AND IT IS NOT A SOLICITATION OF AN OFFER TO BUY THESE SECURITIES IN ANY JURISDICTION WHERE THE OFFER OR SALE IS NOT PERMITTED.
| 105 |
[THIS PAGE INTENTIONALLY LEFT BLANK.]
THE INFORMATION IN THIS STRUCTURAL AND COLLATERAL TERM SHEET IS NOT COMPLETE AND MAY BE AMENDED PRIOR TO THE TIME OF SALE. THIS TERM SHEET IS NOT AN OFFER TO SELL THESE SECURITIES AND IT IS NOT A SOLICITATION OF AN OFFER TO BUY THESE SECURITIES IN ANY JURISDICTION WHERE THE OFFER OR SALE IS NOT PERMITTED.
| 106 |
| HALL OFFICE PARK |
|---|

THE INFORMATION IN THIS STRUCTURAL AND COLLATERAL TERM SHEET IS NOT COMPLETE AND MAY BE AMENDED PRIOR TO THE TIME OF SALE. THIS TERM SHEET IS NOT AN OFFER TO SELL THESE SECURITIES AND IT IS NOT A SOLICITATION OF AN OFFER TO BUY THESE SECURITIES IN ANY JURISDICTION WHERE THE OFFER OR SALE IS NOT PERMITTED.
| 107 |
| HALL OFFICE PARK |
|---|
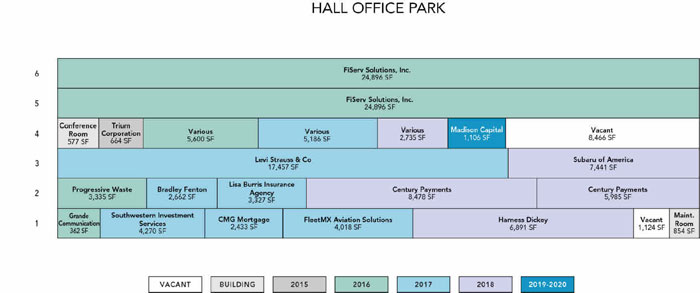
THE INFORMATION IN THIS STRUCTURAL AND COLLATERAL TERM SHEET IS NOT COMPLETE AND MAY BE AMENDED PRIOR TO THE TIME OF SALE. THIS TERM SHEET IS NOT AN OFFER TO SELL THESE SECURITIES AND IT IS NOT A SOLICITATION OF AN OFFER TO BUY THESE SECURITIES IN ANY JURISDICTION WHERE THE OFFER OR SALE IS NOT PERMITTED.
| 108 |
| HALL OFFICE PARK |
|---|

THE INFORMATION IN THIS STRUCTURAL AND COLLATERAL TERM SHEET IS NOT COMPLETE AND MAY BE AMENDED PRIOR TO THE TIME OF SALE. THIS TERM SHEET IS NOT AN OFFER TO SELL THESE SECURITIES AND IT IS NOT A SOLICITATION OF AN OFFER TO BUY THESE SECURITIES IN ANY JURISDICTION WHERE THE OFFER OR SALE IS NOT PERMITTED.
| 109 |
| No. 10 – Hall Office Park | ||||||||
| Loan Information | Property Information | |||||||
| Mortgage Loan Seller: | Wells Fargo Bank, National Association | Single Asset/Portfolio: | Single Asset | |||||
| Credit Assessment (Fitch/KBRA/Moody’s): | NR/NR/NR | Property Type: | Office | |||||
| Original Principal Balance: | $25,500,000 | Specific Property Type: | Suburban | |||||
| Cut-off Date Principal Balance: | $25,500,000 | Location: | Frisco, TX | |||||
| % of Initial Pool Balance: | 2.2% | Size: | 142,761 SF | |||||
| Loan Purpose: | Refinance | Cut-off Date Principal Balance Per SF: | $178.62 | |||||
| Borrower Name: | Hall 2601 Network Associates, Ltd. | Year Built/Renovated: | 2000/NAP | |||||
| Sponsor: | Craig Hall | Title Vesting: | Fee | |||||
| Mortgage Rate: | 4.200% | Property Manager: | Self-managed | |||||
| Note Date: | May 29, 2015 | 3rd Most Recent Occupancy (As of): | 88.0% (12/31/2012) | |||||
| Anticipated Repayment Date: | NAP | 2nd Most Recent Occupancy (As of): | 94.0% (12/31/2013) | |||||
| Maturity Date: | June 11, 2025 | Most Recent Occupancy (As of): | 96.0% (12/31/2014) | |||||
| IO Period: | 12 months | Current Occupancy (As of): | 93.3% (4/1/2015) | |||||
| Loan Term (Original): | 120 months | |||||||
| Seasoning: | 0 months | Underwriting and Financial Information: | ||||||
| Amortization Term (Original): | 360 months | |||||||
| Loan Amortization Type: | Interest-only, Amortizing Balloon | 3rd Most Recent NOI (As of): | $1,373,368 (12/31/2012) | |||||
| Interest Accrual Method: | Actual/360 | 2nd Most Recent NOI (As of)(2): | $1,715,514 (12/31/2013) | |||||
| Call Protection: | L(24),D(92),O(4) | Most Recent NOI (As of)(2): | $2,021,589 (12/31/2014) | |||||
| Lockbox Type: | Soft/Springing Cash Management | |||||||
| Additional Debt: | None | |||||||
| Additional Debt Type: | NAP | U/W Revenues: | $3,845,173 | |||||
| U/W Expenses: | $1,611,150 | |||||||
| U/W NOI(2): | $2,234,023 | |||||||
| U/W NCF: | $2,025,519 | |||||||
| U/W NOI DSCR: | 1.49x | |||||||
| Escrows and Reserves(1): | U/W NCF DSCR: | 1.35x | ||||||
| U/W NOI Debt Yield: | 8.8% | |||||||
| Type: | Initial | Monthly | Cap (If Any) | U/W NCF Debt Yield: | 7.9% | |||
| Taxes | $328,830 | $54,805 | NAP | As-Is Appraised Value: | $34,600,000 | |||
| Insurance | $0 | Springing | NAP | As-Is Appraisal Valuation Date: | March 20, 2015 | |||
| Replacement Reserves | $0 | $2,379 | NAP | Cut-off Date LTV Ratio: | 73.7% | |||
| TI/LC Reserve | $500,000 | $14,871 | (1) | LTV Ratio at Maturity or ARD: | 60.7% | |||
| (1) | See “Escrows” section. |
| (2) | See “Cash Flow Analysis” section. |
The Mortgage Loan.The mortgage loan (the “Hall Office Park Mortgage Loan”) is evidenced by a single promissory note that is secured by a first mortgage encumbering the fee interest in an office building located in Frisco, Texas (the “Hall Office Park Property”). The Hall Office Park Mortgage Loan was originated on May 29, 2015 by Wells Fargo Bank, National Association. The Hall Office Park Mortgage Loan had an original principal balance of $25,500,000, has an outstanding principal balance as of the Cut-off Date of $25,500,000 and accrues interest at an interest rate of 4.200%per annum. The Hall Office Park Mortgage Loan had an initial term of 120 months, has a remaining term of 120 months as of the Cut-off Date and requires interest-only payments for the first 12 payments following origination and, thereafter, requires payments of principal and interest based on a 30-year amortization schedule. The Hall Office Park Mortgage Loan matures on June 11, 2025.
Following the lockout period, the borrower has the right to defease the Hall Office Park Mortgage Loan in whole, but not in part, on any date before March 11, 2025. In addition, the Hall Office Park Mortgage Loan is prepayable without penalty on or after March 11, 2025.
THE INFORMATION IN THIS STRUCTURAL AND COLLATERAL TERM SHEET IS NOT COMPLETE AND MAY BE AMENDED PRIOR TO THE TIME OF SALE. THIS TERM SHEET IS NOT AN OFFER TO SELL THESE SECURITIES AND IT IS NOT A SOLICITATION OF AN OFFER TO BUY THESE SECURITIES IN ANY JURISDICTION WHERE THE OFFER OR SALE IS NOT PERMITTED.
| 110 |
| HALL OFFICE PARK |
|---|
Sources and Uses
| Sources | Uses | |||||||
| Original loan amount | $25,500,000 | 100.0% | Loan payoff | $14,360,000 | 56.3% | |||
| Reserves | 828,830 | 3.3 | ||||||
| Closing costs | 218,252 | 0.9 | ||||||
| Return of equity | 10,092,918 | 39.6 | ||||||
| Total Sources | $25,500,000 | 100.0% | Total Uses | $25,500,000 | 100.0% |
The Property.The Hall Office Park Property is a six-story, class A mid-rise office building totaling 142,761 square feet of rentable area and located in Frisco, Texas, approximately 24.0 miles north of the Dallas central business district. Built in 2000, the Hall Office Park Property is situated on a 7.5-acre parcelwithin the Hall Office Park complex, a 162-acre development with 16 class A and B office buildings totaling approximately 2.2 million square feet. The Hall Office Park complex offers amenities including a YMCA fitness center, on-site car detailing, personal care services, errand-running, grocery delivery, laundry pickup and an on-site masseuse. The Hall Office Park Property features double glass entry doors on the east and west sides of the building, which open into a two-story atrium lobby featuring artwork by well-known artists. The grounds of the Hall Office Park Property comprise a central courtyard and a water feature on the east end of the site. The Hall Office Park Property comprises 571 surface and garage parking spaces, resulting in a parking ratio of 4.0 spaces per 1,000 square feet of rentable area. The Hall Office Park Property has averaged an approximate 94.0% occupancy rate since its initial lease-up in 2005. As of April 1, 2015 the Hall Office Park Property was 93.3% occupied by 24 tenants.
The following table presents certain information relating to the tenancy at the Hall Office Park Property:
Major Tenants
| Tenant Name | Credit Rating (Fitch/ Moody’s/ S&P)(1) | Tenant NRSF | % of NRSF | Annual U/W Base Rent PSF(2) | Annual U/W Base Rent(2) | % of Total Annual U/W Base Rent | Lease Expiration Date |
| Major Tenants | |||||||
| FiServ Solutions, Inc. | NR/Baa2/BBB | 49,792 | 34.9% | $26.47(3) | $1,317,994(3) | 38.4% | 4/30/2019 |
| Levi Strauss & Co. | BB-/Ba1/BB | 17,457 | 12.2% | $25.00 | $436,425 | 12.7% | 3/31/2017 |
| Century Payments | NR/NR/NR | 14,463 | 10.1% | $24.00 | $347,112 | 10.1% | 4/1/2018(4) |
| Subaru of America | NR/NR/NR | 7,441 | 5.2% | $27.50 | $204,628 | 6.0% | 10/31/2018 |
| Harness Dickey | NR/NR/NR | 6,891 | 4.8% | $27.50 | $189,503 | 5.5% | 4/30/2018 |
| Total Major Tenants | 96,044 | 67.3% | $25.98 | $2,495,662 | 72.6% | ||
| Non-Major Tenants(5) | 37,127 | 26.0% | $25.33 | $940,485 | 27.4% | ||
| Occupied Collateral Total | 133,171 | 93.3% | $25.80 | $3,436,147 | 100.0% | ||
| Vacant Space | 9,590 | 6.7% | |||||
| Collateral Total | 142,761 | 100.0% | |||||
| (1) | Certain ratings are those of the parent company whether or not the parent company guarantees the lease. |
| (2) | Annual U/W Base Rent PSF and Annual U/W Base Rent include contractual rent steps through May 2016 totaling $71,684. |
| (3) | The Annual U/W Base Rent PSF and Annual U/W Base Rent for FiServ Solutions, Inc. (“FiServ”) represent the tenant’s average contractual rental rate over the remaining lease term. FiServ’s current in-place rental rate is $25.00 per square foot. |
| (4) | Century Payments has the right to terminate its lease on April 30, 2017 with notice provided by July 31, 2016 and payment of a termination fee equal to two months’ base rent plus unamortized tenant improvement costs and leasing commissions. |
| (5) | Includes maintenance and conference room space totaling 1,431 square feet, which has no lease or Annual U/W Base Rent. |
THE INFORMATION IN THIS STRUCTURAL AND COLLATERAL TERM SHEET IS NOT COMPLETE AND MAY BE AMENDED PRIOR TO THE TIME OF SALE. THIS TERM SHEET IS NOT AN OFFER TO SELL THESE SECURITIES AND IT IS NOT A SOLICITATION OF AN OFFER TO BUY THESE SECURITIES IN ANY JURISDICTION WHERE THE OFFER OR SALE IS NOT PERMITTED.
| 111 |
| HALL OFFICE PARK |
|---|
The following table presents certain information relating to the lease rollover schedule at the Hall Office Park Property:
Lease Expiration Schedule(1)(2)
| Year Ending December 31, | No. of Leases Expiring | Expiring NRSF | % of Total NRSF | Cumulative Expiring NRSF | Cumulative % of Total NRSF | Annual U/W Base Rent | Annual U/W Base Rent PSF(3) |
| MTM | 0 | 0 | 0.0% | 0 | 0.0% | $0 | $0.00 |
| 2015 | 2 | 2,266 | 1.6% | 2,266 | 1.6% | $56,982 | $25.15 |
| 2016 | 6 | 7,695 | 5.4% | 9,961 | 7.0% | $200,228 | $26.02 |
| 2017 | 9 | 39,353 | 27.6% | 49,314 | 34.5% | $1,013,062 | $25.74 |
| 2018 | 6 | 31,528 | 22.1% | 80,842 | 56.6% | $816,360 | $25.89 |
| 2019 | 2 | 49,792 | 34.9% | 130,634 | 91.5% | $1,317,994 | $26.47 |
| 2020 | 1 | 1,106 | 0.8% | 131,740 | 92.3% | $31,521 | $28.50 |
| 2021 | 0 | 0 | 0.0% | 131,740 | 92.3% | $0 | $0.00 |
| 2022 | 0 | 0 | 0.0% | 131,740 | 92.3% | $0 | $0.00 |
| 2023 | 0 | 0 | 0.0% | 131,740 | 92.3% | $0 | $0.00 |
| 2024 | 0 | 0 | 0.0% | 131,740 | 92.3% | $0 | $0.00 |
| 2025 | 0 | 0 | 0.0% | 131,740 | 92.3% | $0 | $0.00 |
| Thereafter(4) | 2 | 1,431 | 1.0% | 133,171 | 93.3% | $0 | $0.00 |
| Vacant | 0 | 9,590 | 6.7% | 142,761 | 100.0% | $0 | $0.00 |
| Total/Weighted Average | 28 | 142,761 | 100.0% | $3,436,147 | $25.80 |
| (1) | Information obtained from the underwritten rent roll. |
| (2) | Certain tenants may have lease termination options that are exercisable prior to the originally stated expiration date of the subject lease and that are not considered in the Lease Expiration Schedule. |
| (3) | Weighted Average Annual U/W Base Rent PSF excludes vacant space. |
| (4) | Represents maintenance and conference room space, which has no lease or Annual U/W Base Rent. |
The following table presents historical occupancy percentages at the Hall Office Park Property:
Historical Occupancy
12/31/2012(1) | 12/31/2013(1) | 12/31/2014(1) | 4/1/2015(2) |
| 88.0% | 94.0% | 96.0% | 93.3% |
| (1) | Information obtained from the borrower. |
| (2) | Information obtained from the underwritten rent roll. |
THE INFORMATION IN THIS STRUCTURAL AND COLLATERAL TERM SHEET IS NOT COMPLETE AND MAY BE AMENDED PRIOR TO THE TIME OF SALE. THIS TERM SHEET IS NOT AN OFFER TO SELL THESE SECURITIES AND IT IS NOT A SOLICITATION OF AN OFFER TO BUY THESE SECURITIES IN ANY JURISDICTION WHERE THE OFFER OR SALE IS NOT PERMITTED.
| 112 |
| HALL OFFICE PARK |
|---|
Operating History and Underwritten Net Cash Flow. The following table presents certain information relating to the historical operating performance and the underwritten net cash flow at the Hall Office Park Property:
Cash Flow Analysis
| 2012 | 2013 | 2014 | U/W | % of U/W Effective Gross Income | U/W $ per SF | ||||||||||||
| Base Rent | $2,504,156 | $2,865,528 | $3,202,601 | $3,436,147 | 89.4 | % | $24.07 | ||||||||||
| Grossed Up Vacant Space | 0 | 0 | 0 | 263,725 | 6.9 | 1.85 | |||||||||||
| Total Reimbursables | 232,176 | 287,149 | 371,826 | 371,826 | 9.7 | 2.60 | |||||||||||
| Other Income | 12,843 | 19,878 | 32,349 | 37,200 | 1.0 | 0.26 | |||||||||||
| Less Vacancy & Credit Loss | 0 | 0 | 0 | (263,725)(1) | (6.9 | ) | (1.85) | ||||||||||
| Effective Gross Income | $2,749,175 | $3,172,555 | $3,606,776 | $3,845,173 | 100.0 | % | $26.93 | ||||||||||
| Total Operating Expenses | $1,375,807 | $1,457,041 | $1,585,187 | $1,611,150 | 41.9 | % | $11.29 | ||||||||||
| Net Operating Income | $1,373,368 | $1,715,514(2) | $2,021,589(3) | $2,234,023(4) | 58.1 | % | $15.65 | ||||||||||
| TI/LC | 0 | 0 | 0 | 179,952 | 4.7 | 1.26 | |||||||||||
| Capital Expenditures | 0 | 0 | 0 | 28,552 | 0.7 | 0.20 | |||||||||||
| Net Cash Flow | $1,373,368 | $1,715,514 | $2,021,589 | $2,025,519 | 52.7 | % | $14.19 | ||||||||||
| NOI DSCR | 0.92x | 1.15x | 1.35x | 1.49x | |||||||||||||
| NCF DSCR | 0.92x | 1.15x | 1.35x | 1.35x | |||||||||||||
| NOI DY | 5.4% | 6.7% | 7.9% | 8.8% | |||||||||||||
| NCF DY | 5.4% | 6.7% | 7.9% | 7.9% | |||||||||||||
| (1) | The underwritten economic vacancy is 7.1%. The Hall Office Park Property was 93.3% physically occupied as of April 1, 2015. |
| (2) | Net Operating Income increased from 2012 to 2013 due to the signing of six new leases from July 2012 through March 2013, accounting for 10.6% of the net rentable and totaling $393,292 of underwritten base rent. |
| (3) | Net Operating Income increased from 2013 to 2014 due to the signing of seven new leases from September 2013 through October 2014, accounting for 13.2% of the net rentable area and totaling $517,613 of underwritten base rent. |
| (4) | U/W Net Operating Income is higher than 2014 due to the underwriting of contractual rent steps through May 2016 totaling $71,684 and rent averaging for FiServ (see “Major Tenants” above). |
Appraisal. As of the appraisal valuation date of March 20, 2015, the Hall Office Park Property had an “as-is” appraised value of $34,600,000.
Environmental Matters. According to a Phase I environmental site assessment dated April 8, 2015, there was no evidence of any recognized environmental conditions at the Hall Office Park Property.
Market Overview and Competition.The Hall Office Park Property is located in Frisco, Texas, just west of the Dallas North Tollway, and within the Hall Office Park complex. Frisco is located in the far northern suburban sector of the Dallas metropolitan area, just north of Plano and approximately 24.0 miles north of the Dallas central business district. The Dallas Cowboys announced they are moving their headquarters to Frisco, after gaining approval to develop a $350.0 million mixed-use facility known as “The Star”. The planned Cowboys development is expected to create 4,500 new jobs by 2026. In addition, Toyota will be making the area its North American headquarters and will relocate approximately 4,000 employees from Torrance, California. Over the next two years, Toyota is expected to build a 1.3 million-square-foot facility in Plano. Primary regional access to the surrounding area is provided by State Highway 121 (a major transportation link between the growing Collin County cities of Allen, McKinney and Plano to the east/south and DFW International Airport to the west) and the Dallas North Tollway (one of the most heavily traveled tollways in the area, providing access to the Dallas central business district to the south and growing suburban locales to the north). According to the appraisal, as of 2014, the estimated population within a three- and five-mile radius of the Hall Office Park Property was 81,229 and 245,207, respectively, and the average household income within the same radii was $111,927 and $118,664, respectively.
According to a third-party market research report, the Hall Office Park Property is situated within the Frisco/The Colony submarket of the Dallas office market. As of the first quarter of 2015, the submarket reported an inventory of 215 office properties totaling approximately 5.7 million square feet with a 14.2% vacancy rate and average asking rent of $27.86 per square foot, modified gross.
The appraiser’s competitive set comprised the 16 class A and B office buildings within the Hall Office Park complex. The competitive properties were built between 1997 and 2014 (average year built of 2004); contain between 90,000 and 200,000 square feet of rentable area (average size of 135,421 square feet); reported occupancy rates ranging from 20.0% (new building in lease-up) to 100.0% (average occupancy rate of 85.0%); and had asking rents ranging from $25.00 to $32.00 per square foot, plus electric (average asking rent of $26.95 per square foot, plus electric). Excluding one property from the competitive set, which was built on a speculative basis in 2014 and reported a 20.0% occupancy rate, the average occupancy rate is 92.0%.
THE INFORMATION IN THIS STRUCTURAL AND COLLATERAL TERM SHEET IS NOT COMPLETE AND MAY BE AMENDED PRIOR TO THE TIME OF SALE. THIS TERM SHEET IS NOT AN OFFER TO SELL THESE SECURITIES AND IT IS NOT A SOLICITATION OF AN OFFER TO BUY THESE SECURITIES IN ANY JURISDICTION WHERE THE OFFER OR SALE IS NOT PERMITTED.
| 113 |
| HALL OFFICE PARK |
|---|
Competitive Set(1)
Hall Office Park (Subject) | 2591 Dallas Pky | 2595 N Dallas Pky | 6801 Gaylord Pky | 2600 Network Blvd | 2801 Network Blvd | 3000 Internet Blvd | |
| Location | Frisco, TX | Frisco, TX | Frisco, TX | Frisco, TX | Frisco, TX | Frisco, TX | Frisco, TX |
| Distance from Subject | -- | 0.4 miles | 0.1 miles | 0.2 miles | 0.1 miles | 0.1 miles | 0.2 miles |
| Property Type | Office | Office | Office | Office | Office | Office | Office |
| Year Built/Renovated | 2000/NAP | 1999/NAV | 1997/NAV | 2000/NAV | 2006/NAV | 2001/NAV | 2007/NAV |
| Stories | 6 | 6 | 4 | 4 | 6 | 8 | 6 |
| Total GLA | 142,761 SF | 150,000 SF | 100,000 SF | 100,000 SF | 150,000 SF | 197,717 SF | 150,000 SF |
| Total Occupancy | 93% | 91% | 100% | 92% | 99% | 86% | 98% |
| (1) | Information obtained from the appraisal. |
The Borrower.The borrower is Hall 2601 Network Associates, Ltd., a Texas limited partnership and single purpose entity with one independent director. Legal counsel to the borrower delivered a non-consolidation opinion in connection with the origination of the Hall Office Park Mortgage Loan. Hall Phoenix/Inwood Ltd. is the guarantor of certain nonrecourse carveouts under the Hall Office Park Mortgage Loan.
The Sponsor.The sponsor is Craig Hall, who is the chairman and founder of Hall Financial Group. Hall Financial Group was founded in 1968 and has diversified holdings including active operations in commercial real estate development, ownership and management. Since its inception, Hall Financial Group has owned and operated approximately 100,000 apartment units and more than five million square feet of office space. Hall Financial Group owns and manages the entire Hall Office Park complex, which comprises 16 class A and B office buildings occupied by tenants including Fiserv, SANYO Energy (USA) Corporation, AmerisourceBergen Specialty Group and Levi Strauss & Company. Craig Hall filed for bankruptcy in the 1980s. In addition, in 2010 and 2011, affiliated entities of Hall Financial Group were involved in four instances of loan defaults, deed-in-lieu of foreclosure proceedings and discounted payoffs. See “Description of the Mortgage Pool – Default History, Bankruptcy Issues and Other Proceedings” in the Free Writing Prospectus.
Escrows.The loan documents provide for upfront reserves in the amount of $328,830 for real estate taxes and $500,000 for tenant improvements and leasing commissions (“TI/LCs”). The loan documents require monthly deposits of $54,805 for real estate taxes, $2,379 for replacement reserves and $14,871 for TI/LCs (subject to a cap of $725,000, as long as (i) no event of default has occurred; (ii) the property maintains a physical and economic occupancy of at least 90.0%; (iii) the amortizing debt service coverage ratio is at least 1.25x; and (iv) the net cash flow debt yield is at least 7.75%). The loan documents do not require monthly escrows for insurance, provided that (a) no event of default has occurred; (b) the Hall Office Park Property is insured via an acceptable blanket insurance policy; and (c) the borrower provides the lender with evidence of renewal of the insurance policies and timely proof of payment of insurance premiums.
Lockbox and Cash Management.The Hall Office Park Mortgage Loan requires a lender-controlled lockbox account, which is already in place, and that the borrower or manager deposit all rents directly into such lockbox account. Prior to the occurrence of a Cash Trap Event Period (as defined below), all funds are distributed to the borrower. During a Cash Trap Event Period, the borrower or manager will cause all rents to be deposited directly into the lockbox account, and all funds on deposit in the lockbox account are swept to a lender-controlled cash management account.
A “Cash Trap Event Period” will commence upon the earlier of (i) the occurrence of an event of default; (ii) the amortizing debt service coverage ratio being less than 1.10x and/or the net cash flow debt yield being less than 7.0% at the end of any calendar month; or (iii) Fiserv Solutions, Inc. (“Fiserv”) (or any replacement tenant of Fiserv) (a) failing to renew its lease or providing renewal notice 12 months prior to its lease expiration date; (b) going dark, vacating or failing to occupy its space; or (c) filing for bankruptcy or being subject to a bankruptcy or insolvency proceeding. A Cash Trap Event Period will end, with regard to clause (i), upon the cure of such event of default; with regard to clause (ii), upon (x) the amortizing debt service coverage ratio being equal to or greater than 1.15x and the net cash flow debt yield being equal to or greater than 7.25%, both for three consecutive calendar months or (y) the borrower agreeing to deposit $12,544 per month into an additional leasing reserve if the Cash Trap Event Period (as a result of clause (ii) above) occurs prior to the first anniversary of the first loan payment date, otherwise the borrower agreeing to deposit $9,182 per month in an additional leasing reserve; with regard to clause (iii)(a), upon Fiserv (or any satisfactory replacement tenant of Fiserv) exercising its renewal option or otherwise extending the term of its lease on terms and conditions acceptable to the lender; with regard to clause (iii)(b), upon Fiserv (or any replacement tenant of Fiserv) resuming business operations in its space for two consecutive calendar quarters; with respect to clause (iii)(c), upon the termination of such bankruptcy or insolvency proceedings and the affirmation of the related lease; and with respect to clauses (iii)(a), (iii)(b) and (iii)(c), (1) upon the amortizing debt service coverage ratio and debt yield (both exclusive of the rent associated with Fiserv (or any satisfactory replacement tenant of Fiserv)) being equal to or greater than 1.15x and 7.25%, respectively, for three consecutive calendar months; (2) upon Fiserv’s space being leased to one or more replacement tenants satisfactory to the lender and receipt of a satisfactory tenant estoppel, with each replacement tenant paying full, unabated rent of not less than Fiserv’s rent at the time of closing of the Hall Office Park Mortgage Loan; being in occupancy and utilizing its space; and having any related tenant improvement costs and leasing commissions fully paid or reserved for or (3) the borrower depositing $75,868 monthly into an additional leasing reserve if the Cash Trap Event Period occurs prior to the first anniversary of the first loan payment date, otherwise the borrower depositing $49,848 monthly in an additional leasing reserve.
Property Management. The Hall Office Park Property is managed by an affiliate of the borrower.
THE INFORMATION IN THIS STRUCTURAL AND COLLATERAL TERM SHEET IS NOT COMPLETE AND MAY BE AMENDED PRIOR TO THE TIME OF SALE. THIS TERM SHEET IS NOT AN OFFER TO SELL THESE SECURITIES AND IT IS NOT A SOLICITATION OF AN OFFER TO BUY THESE SECURITIES IN ANY JURISDICTION WHERE THE OFFER OR SALE IS NOT PERMITTED.
| 114 |
| HALL OFFICE PARK |
|---|
Assumption. The borrower has the right to transfer the Hall Office Park Property, provided that certain conditions are satisfied, including (i) no event of default has occurred and is continuing; (ii) the lender has reasonably determined that the proposed transferee and guarantor satisfy the lender’s credit review and underwriting standards, taking into consideration transferee’s experience, financial strength and general business standing; and (iii) the lender has received confirmation from Fitch, KBRA and Moody’s that such assumption will not result in a downgrade, withdrawal or qualification of the respective ratings assigned to the Series 2015-C29 Certificates.
Partial Release. Not permitted.
Real Estate Substitution.Not permitted.
Subordinate and Mezzanine Indebtedness.None.
Additional Indebtedness. Hall Phoenix/Inwood Ltd. is permitted to pledge up to 49% of their indirect ownership of the borrower subject to certain conditions, including: (i) the holder of such debt is an institutional lender; (ii) the debt secured by such pledge is also secured by substantial other collateral unrelated to the borrower or the Hall Office Park Property; and (iii) the repayment of the debt secured by such pledge is not specifically tied to the Hall Office Park Property’s cash flow. See “Description of the Mortgage Pool-Subordinate and/or Other Financing” in the Free Writing Prospectus.
Ground Lease. None
Terrorism Insurance. The loan documents require that the “all risk” insurance policy required to be maintained by the borrower provides coverage for terrorism in an amount equal to the full replacement cost of the Hall Office Park Property. The loan documents also require business interruption insurance covering no less than the 12-month period following the occurrence of a casualty event, together with a six-month extended period of indemnity.
THE INFORMATION IN THIS STRUCTURAL AND COLLATERAL TERM SHEET IS NOT COMPLETE AND MAY BE AMENDED PRIOR TO THE TIME OF SALE. THIS TERM SHEET IS NOT AN OFFER TO SELL THESE SECURITIES AND IT IS NOT A SOLICITATION OF AN OFFER TO BUY THESE SECURITIES IN ANY JURISDICTION WHERE THE OFFER OR SALE IS NOT PERMITTED.
| 115 |
| No. 11 – Dulles North Corporate Parks |
| Loan Information | Property Information | ||||||
| Mortgage Loan Seller: | Wells Fargo Bank, National Association | Single Asset/Portfolio: | Portfolio | ||||
| Credit Assessment (Fitch/KBRA/Moody’s): | NR/NR/NR | Property Type: | Various – See Table | ||||
| Original Principal Balance: | $25,000,000 | Specific Property Type: | Various – See Table | ||||
| Cut-off Date Principal Balance: | $24,956,509 | Location: | Sterling, VA | ||||
| % of Initial Pool Balance: | 2.1% | Size: | 159,601 SF | ||||
| Loan Purpose: | Refinance | Cut-off Date Principal Balance Per SF: | $156.37 | ||||
| Borrower Names: | Dulles North Office Park II Corporation; Dulles North Five, Corp. | Year Built/Renovated: | Various – See Table | ||||
| Sponsor: | B. F. Saul Real Estate Investment Trust | Title Vesting: | Fee | ||||
| Mortgage Rate: | 4.310% | Property Manager: | Self-managed | ||||
| Note Date: | May 6, 2015 | 3rdMost Recent Occupancy (As of): | 100.0% (12/31/2012) | ||||
| Anticipated Repayment Date: | NAP | 2ndMost Recent Occupancy (As of): | 100.0% (12/31/2013) | ||||
| Maturity Date: | May 11, 2025 | Most Recent Occupancy (As of): | 100.0% (12/31/2014) | ||||
| IO Period: | None | Current Occupancy (As of)(2): | 100.0% (Various) | ||||
| Loan Term (Original): | 120 months | ||||||
| Seasoning: | 1 month | Underwriting and Financial Information: | |||||
| Amortization Term (Original): | 300 months | ||||||
| Loan Amortization Type: | Amortizing Balloon | 3rdMost Recent NOI (As of): | $2,999,217 (12/31/2013) | ||||
| Interest Accrual Method: | Actual/360 | 2ndMost Recent NOI (As of): | $3,050,129 (12/31/2014) | ||||
| Call Protection: | L(25),D(91),O(4) | Most Recent NOI (As of): | $3,055,121 (TTM 1/31/2015) | ||||
| Lockbox Type: | Hard/Springing Cash Management | ||||||
| Additional Debt: | No | ||||||
| Additional Debt Type: | NAP | U/W Revenues: | $3,603,745 | ||||
| U/W Expenses: | $902,456 | ||||||
| U/W NOI: | $2,701,289 | ||||||
| Escrows and Reserves: | U/W NCF: | $2,449,610 | |||||
| U/W NOI DSCR: | 1.65x | ||||||
| Type: | Initial | Monthly | Cap (If Any) | U/W NCF DSCR: | 1.50x | ||
| Taxes | $197,864 | $34,626 | NAP | U/W NOI Debt Yield: | 10.8% | ||
| Insurance | $0 | Springing | NAP | U/W NCF Debt Yield: | 9.8% | ||
| Replacement Reserves | $0 | $4,457 | NAP | As-Is Appraised Value: | $41,900,000 | ||
| TI/LC Reserve | $0 | $12,500 | $300,000 | As-Is Appraisal Valuation Date: | Various | ||
| Asurion TI/LC Reserve(1) | $381,900 | $0 | NAP | Cut-off Date LTV Ratio: | 59.6% | ||
| NTT Letter of Credit | $0 | Springing | NAP | LTV Ratio at Maturity or ARD: | 43.5% | ||
| (1) | Asurion TI/LC Reserve will be disbursed to the borrowers upon the satisfaction of the earlier to occur of the following conditions: (i) providing the lender with a satisfactory estoppel letter stating, among other things, that there is no tenant improvement allowance owed to Asurion under its lease, (ii) Asurion is renewing its lease at the Dulles North Corporate Parks Property, or (iii) the expiration of the current lease to Asurion. |
| (2) | See “Historical Occupancy” section. |
The Dulles North Corporate Parks mortgage loan is evidenced by a single promissory note that is secured by a first mortgage encumbering the borrowers’ fee interest in a suburban office building and a data center totaling 159,601 square feet located in Sterling, Virginia (the “Dulles North Corporate Parks Property”). The Dulles North Corporate Parks Property consists of Dulles North Corporate Park 2 (the “Office Building”), a 79,210 square foot class B suburban office building; and Dulles North Corporate Park 5 (the “Data Center”), an 80,391 square foot powered-shell data center. The sponsor developed the collateral over 15 years ago for a total cost basis of approximately $13.6 million. The Office Building was developed in 1999, while the Data Center was constructed in 2000. The Office Building features 300 parking spaces, resulting in a parking ratio of 3.8 spaces per 1,000 square feet of rentable area; while the Data Center features 240 parking spaces, resulting in a parking ratio of 3.0 spaces per 1,000 square feet of rentable area. The Dulles North Corporate Parks Property is part of a larger corporate park containing three additional flex buildings, which are not part of the collateral.
The Northern Virginia data center market is the second largest data center market along the eastern seaboard after the New York metropolitan area. The Dulles North Corporate Parks Property is located in Loudoun County, which benefits from access to Dulles Airport, located approximately 4.7 miles south of the Dulles North Corporate Parks Property. Approximately 70.0% of the world’s internet traffic passes through the Loudoun County centers every day. According to the appraiser, the state of Virginia continues to pass measures to make it more attractive to data center investors, and Dominion Power continues to keep power prices near state and national lows. With immediate accessibility to the airport, the Dulles North Corporate Parks Property provides convenient access to the Washington D.C. metropolitan statistical area, its surrounding area and many parts of the eastern seaboard from Interstate 95. According to a third party market research report, in 2014 the estimated population within a one-, three- and five-mile radius of the Dulles North Corporate Parks Property was 6,540, 66,178 and 236,834, respectively, and the estimated median household income within the same radii was $112,260, $120,431 and $142,246, respectively. As of May 1, 2015 and June 1, 2015, the Dulles North Corporate Parks Property was 100.0% occupied by six tenants.
THE INFORMATION IN THIS STRUCTURAL AND COLLATERAL TERM SHEET IS NOT COMPLETE AND MAY BE AMENDED PRIOR TO THE TIME OF SALE. THIS TERM SHEET IS NOT AN OFFER TO SELL THESE SECURITIES AND IT IS NOT A SOLICITATION OF AN OFFER TO BUY THESE SECURITIES IN ANY JURISDICTION WHERE THE OFFER OR SALE IS NOT PERMITTED.
| 116 |
| DULLES NORTH CORPORATE PARKS |
Sources and Uses
| Sources | Uses | ||||||||
| Original loan amount | $25,000,000 | 100.0% | Loan Payoff(1) | $12,522,879 | 50.1 | % | |||
| Reserves | 579,764 | 2.3 | |||||||
| Closing costs | 469,431 | 1.9 | |||||||
| Return of equity | 11,427,926 | 45.7 | |||||||
| Total Sources | $25,000,000 | 100.0% | Total Uses | $25,000,000 | 100.0 | % | |||
| (1) | The Dulles North Corporate Parks Property was previously securitized in the LBUBS 2000-C4 transaction. |
The following table presents certain information relating to the Dulles North Corporate Parks Property:
| Property Name – Location | Property Type/Sub- Type | Allocated Cut-off Date Principal Balance | % of Portfolio Cut-off Date Principal Balance | Occupancy | Year Built/ Renovated | Net Rentable Area (SF) | Appraised Value | Allocated Cut-off LTV | |||||||||
| Dulles North Corporate Park 5 | Other/ Data Center | $14,973,905 | 60.0% | 100.0% | 2000/2006 | 80,391 | $23,700,000 | 63.2 | % | ||||||||
| Dulles North Corporate Park 2 | Office/ Suburban | $9,982,604 | 40.0% | 100.0% | 1999/NAP | 79,210 | $18,200,000 | 54.8 | % | ||||||||
| Total/Weighted Average | $24,956,509 | 100.0% | 100.0% | 159,601 | $41,900,000 | 59.6 | % | ||||||||||
The following table presents certain information relating to the tenancy at the Dulles North Corporate Parks Property:
Major Tenants
| Tenant Name | Credit Rating (Fitch/Moody’s/ S&P)(1) | Tenant NRSF | % of NRSF | Annual U/W Base Rent PSF(2) | Annual U/W Base Rent(2) | % of Total Annual U/W Base Rent | Lease Expiration Date | ||||||||
| Major Tenants | |||||||||||||||
| NTT Worldwide Telecommunications | NR/Aa3/AA- | 80,391 | 50.4% | $19.89 | $1,598,881 | 49.7% | 2/29/2020(3) | ||||||||
| US Customs and Border Protection | NR/NR/NR | 23,535 | 14.7% | $23.00 | $541,308 | 16.8% | 2/14/2017 | ||||||||
| Asurion/National Electronics Warranty | NR/NR/NR | 25,460 | 16.0% | $18.45 | $469,689 | 14.6% | 7/31/2016(4) | ||||||||
| 1000 Sully Road, LLC(5) | NR/NR/NR | 20,056 | 12.6% | $20.38 | $408,738 | 12.7% | 5/31/2027(6) | ||||||||
| PaeTec Communications, Inc. | NR/NR/NR | 10,079 | 6.3% | $19.10 | $192,558 | 6.0% | 5/31/2019(7) | ||||||||
| Total Major Tenants | 159,521 | 99.9% | $20.13 | $3,211,174 | 99.9% | ||||||||||
| Other Space(8) | 80 | 0.1% | $48.01 | $3,841 | 0.1% | ||||||||||
| Occupied Collateral Total | 159,601 | 100.0% | $20.14 | $3,215,015 | 100.0% | ||||||||||
| Collateral Total | 159,601 | 100.0% | |||||||||||||
| (1) | Certain ratings are those of the parent company whether or not the parent guarantees the lease. | |
| (2) | Annual U/W Base Rent PSF and Annual U/W Base Rent include contractual rent escalations through June 2016 totaling $85,374. | |
| (3) | NTT Worldwide Telecommunications has one, 10-year renewal option. | |
| (4) | Asurion/National Electronics Warranty has one, 5-year renewal option. | |
| (5) | 1000 Sully Road, LLC is an affiliate of the borrower. | |
| (6) | 1000 Sully Road, LLC has one, 5-year renewal option. | |
| (7) | PaeTec Communications, Inc. has one, 5-year renewal option. | |
| (8) | Other Space is related to antenna equipment space leased by MCImetro Access Transmission Services. |
THE INFORMATION IN THIS STRUCTURAL AND COLLATERAL TERM SHEET IS NOT COMPLETE AND MAY BE AMENDED PRIOR TO THE TIME OF SALE. THIS TERM SHEET IS NOT AN OFFER TO SELL THESE SECURITIES AND IT IS NOT A SOLICITATION OF AN OFFER TO BUY THESE SECURITIES IN ANY JURISDICTION WHERE THE OFFER OR SALE IS NOT PERMITTED.
| 117 |
| DULLES NORTH CORPORATE PARKS |
The following table presents certain information relating to the lease rollover schedule at the Dulles North Corporate Parks:
Lease Expiration Schedule(1)(2)
| Year Ending December 31, | No. of Leases Expiring | Expiring NRSF | % of Total NRSF | Cumulative Expiring NRSF | Cumulative % of Total NRSF | Annual U/W Base Rent | Annual U/W Base Rent PSF | ||||||||
| MTM | 0 | 0 | 0.0% | 0 | 0.0% | $0 | $0.00 | ||||||||
| 2015 | 0 | 0 | 0.0% | 0 | 0.0% | $0 | $0.00 | ||||||||
| 2016 | 1 | 25,460 | 16.0% | 25,460 | 16.0% | $469,689 | $18.45 | ||||||||
| 2017 | 1 | 23,535 | 14.7% | 48,995 | 30.7% | $541,308 | $23.00 | ||||||||
| 2018 | 0 | 0 | 0.0% | 48,995 | 30.7% | $0 | $0.00 | ||||||||
| 2019 | 2 | 10,159 | 6.4% | 59,154 | 37.1% | $196,399 | $19.33 | ||||||||
| 2020 | 1 | 80,391 | 50.4% | 139,545 | 87.4% | $1,598,881 | $19.89 | ||||||||
| 2021 | 0 | 0 | 0.0% | 139,545 | 87.4% | $0 | $0.00 | ||||||||
| 2022 | 0 | 0 | 0.0% | 139,545 | 87.4% | $0 | $0.00 | ||||||||
| 2023 | 0 | 0 | 0.0% | 139,545 | 87.4% | $0 | $0.00 | ||||||||
| 2024 | 0 | 0 | 0.0% | 139,545 | 87.4% | $0 | $0.00 | ||||||||
| 2025 | 0 | 0 | 0.0% | 139,545 | 87.4% | $0 | $0.00 | ||||||||
| Thereafter | 1 | 20,056 | 12.6% | 159,601 | 100.0% | $408,738 | $20.38 | ||||||||
| Vacant | 0 | 0 | 0.0% | 159,601 | 100.0% | $0 | $0.00 | ||||||||
| Total/Weighted Average | 6 | 159,601 | 100.0% | $3,215,015 | $20.14 | ||||||||||
| (1) | Information obtained from the underwritten rent roll. |
| (2) | Certain tenants may have lease termination options that are exercisable prior to the originally stated expiration date of the subject lease and that are not considered in the Lease Expiration Schedule |
The following table presents historical occupancy percentages at the Dulles North Corporate Parks:
Historical Occupancy
| 12/31/2012(1) | 12/31/2013(1) | 12/31/2014(1) | Various(2) | |||
| 100.0% | 100.0% | 100.0% | 100.0% |
| (1) | Information obtained from the borrowers. |
| (2) | Information obtained from the underwritten rent roll. Occupancy shown is as of dates ranging from May 1, 2015 to June 1, 2015. |
Operating History and Underwritten Net Cash Flow. The following table presents certain information relating to the historical operating performance and underwritten net cash flow at the Dulles North Corporate Parks Property:
Cash Flow Analysis
| 2013 | 2014 | TTM 1/31/2015 | U/W | % of U/W Effective Gross Income | U/W $ per SF | ||||||||
| Base Rent | $3,019,065 | $3,057,860 | $3,060,675 | $3,215,015(1) | 89.2% | $20.14 | |||||||
| Total Reimbursables | 724,277 | 788,505 | 785,906 | 692,901 | 19.2 | 4.34 | |||||||
| Other Income | 92,783 | 103,085 | 103,382 | 99,000 | 2.7 | 0.62 | |||||||
| Less Vacancy & Credit Loss | 0 | 0 | 0 | (403,171)(2) | (11.2) | (2.53) | |||||||
| Effective Gross Income | $3,836,125 | $3,949,450 | $3,949,963 | $3,603,745 | 100.0% | $22.58 | |||||||
| Total Operating Expenses | $836,908 | $899,321 | $894,842 | $902,456 | 25.0% | $5.65 | |||||||
| Net Operating Income | $2,999,217 | $3,050,129 | $3,055,121 | $2,701,289 | 75.0% | $16.93 | |||||||
| TI/LC | 0 | 0 | 0 | 200,690 | 5.6 | 1.26 | |||||||
| Replacement Reserves | 0 | 0 | 0 | 50,990 | 1.4 | 0.32 | |||||||
| Net Cash Flow | $2,999,217 | $3,050,129 | $3,055,121 | $2,449,610 | 68.0% | $15.35 | |||||||
| NOI DSCR | 1.83x | 1.87x | 1.87x | 1.65x | |||||||||
| NCF DSCR | 1.83x | 1.87x | 1.87x | 1.50x | |||||||||
| NOI DY | 12.0% | 12.2% | 12.2% | 10.8% | |||||||||
| NCF DY | 12.0% | 12.2% | 12.2% | 9.8% |
| (1) | U/W Base Rent is greater than TTM January 31, 2015 due to contractual rent increases that occurred from February 2015 through May 2015 totaling $68,963 and future rent increases totalling $85,377 through June 2016 being underwritten. |
| (2) | The underwritten economic vacancy is 12.5%. The Dulles North Corporate Parks Property was 100.0% physically occupied as of May 1, 2015 and June 1, 2015. |
THE INFORMATION IN THIS STRUCTURAL AND COLLATERAL TERM SHEET IS NOT COMPLETE AND MAY BE AMENDED PRIOR TO THE TIME OF SALE. THIS TERM SHEET IS NOT AN OFFER TO SELL THESE SECURITIES AND IT IS NOT A SOLICITATION OF AN OFFER TO BUY THESE SECURITIES IN ANY JURISDICTION WHERE THE OFFER OR SALE IS NOT PERMITTED.
| 118 |
[THIS PAGE INTENTIONALLY LEFT BLANK.]
THE INFORMATION IN THIS STRUCTURAL AND COLLATERAL TERM SHEET IS NOT COMPLETE AND MAY BE AMENDED PRIOR TO THE TIME OF SALE. THIS TERM SHEET IS NOT AN OFFER TO SELL THESE SECURITIES AND IT IS NOT A SOLICITATION OF AN OFFER TO BUY THESE SECURITIES IN ANY JURISDICTION WHERE THE OFFER OR SALE IS NOT PERMITTED.
| 119 |
| No. 12 – Coastal Village Apartments | ||||||
| Loan Information | Property Information | |||||
| Mortgage Loan Seller: | Silverpeak Real Estate Finance LLC | Single Asset/Portfolio: | Single Asset | |||
Credit Assessment (Fitch/KBRA/Moody’s): | NR/NR/NR | Property Type: | Multifamily | |||
| Original Principal Balance: | $24,000,000 | Specific Property Type: | Student Housing | |||
| Cut-off Date Principal Balance: | $24,000,000 | Location: | Fort Myers, FL | |||
| % of Initial Pool Balance: | 2.0% | Size: | 800 beds | |||
| Loan Purpose: | Acquisition | Cut-off Date Principal Balance Per Bed: | $30,000 | |||
| Borrower Name: | Brightstone Fort Myers, LLC | Year Built/Renovated: | 2004/NAP | |||
| Sponsors: | David Kirshenbaum; Shaul Kopelowitz; Chaim Munk | Title Vesting: | Fee | |||
| Mortgage Rate: | 4.330% | Property Manager: | Ambling Management Company, LLC | |||
| Note Date: | January 29, 2015 | 3rd Most Recent Occupancy (As of): | 88.0% (12/31/2012) | |||
| Anticipated Repayment Date: | NAP | 2nd Most Recent Occupancy (As of): | 91.0% (12/31/2013) | |||
| Maturity Date: | February 6, 2025 | Most Recent Occupancy (As of): | 92.9% (12/31/2014) | |||
| IO Period: | 24 months | Current Occupancy (As of): | 95.1% (5/18/2015) | |||
| Loan Term (Original): | 120 months | |||||
| Seasoning: | 4 months | Underwriting and Financial Information: | ||||
| Amortization Term (Original): | 360 months | |||||
| Loan Amortization Type: | Interest-only, Amortizing Balloon | 3rd Most Recent NOI (As of): | $2,199,220 (12/31/2013) | |||
| Interest Accrual Method: | Actual/360 | 2nd Most Recent NOI (As of): | $2,186,829 (12/31/2014) | |||
| Call Protection: | L(28),D(89),O(3) | Most Recent NOI (As of): | $2,094,562 (TTM 3/31/2015) | |||
| Lockbox Type: | Soft/Springing Cash Management | |||||
| Additional Debt(1): | Yes | U/W Revenues: | $4,815,207 | |||
| Additional Debt Type(1): | Future Mezzanine | U/W Expenses: | $2,680,878 | |||
| U/W NOI: | $2,134,330 | |||||
| U/W NCF: | $2,003,994 | |||||
| U/W NOI DSCR: | 1.49x | |||||
| Escrows and Reserves: | U/W NCF DSCR: | 1.40x | ||||
| U/W NOI Debt Yield: | 8.9% | |||||
| Type: | Initial | Monthly | Cap (If Any) | U/W NCF Debt Yield: | 8.3% | |
| Taxes | $101,631 | $33,875 | NAP | As-Is Appraised Value: | $32,700,000 | |
| Insurance | $20,614 | $21,800 | NAP | As-Is Appraisal Valuation Date: | December 22, 2014 | |
| Replacement Reserves | $500,000 | $10,861 | $1,000,000 | Cut-off Date LTV Ratio: | 73.4% | |
| Deferred Maintenance | $90,000 | NAP | NAP | LTV Ratio at Maturity or ARD: | 62.4% | |
| (1) | The borrower may incur mezzanine debt provided certain conditions are satisfied, including, but not limited to: (i) the combined amortizing net cash flow debt service coverage ratio is not less than 1.25x and (ii) the combined loan-to-value ratio is not greater than 75.0%. |
The Coastal Village Apartments mortgage loan is evidenced by a single promissory note that is secured by a first mortgage encumbering an 800-bed student housing multifamily property located in Fort Myers, Florida (the “Coastal Village Apartments Property”). The Coastal Village Apartments Property is less than three miles from Florida Gulf Coast University, which currently has an enrollment of over 14,000 students. As of May 21, 2015, the Coastal Village Apartments Property was 73% pre-leased for Fall 2015, compared to 48% at that time last year. Students typically sign 12 month leases. Built in 2004, each unit at the Coastal Village Apartments contains four bedrooms and four bathrooms with an average of 1,385 square feet. Unit amenities include a kitchen with full appliance package, private bathrooms in each bedroom, and in-unit washer and dryer. Coastal Village Apartments Property amenities include an outdoor swimming pool with a sun deck, clubhouse, study rooms, a fitness center, a game room, a computer lab with high speed internet connection, and an outdoor sand volleyball court. The Coastal Village Apartments Property contains 789 surface parking spaces, resulting in a parking ratio of 1.0 space per bed. Access to the Coastal Village Apartments Property is controlled via electronic security gates located at the primary entry point along Three Oaks Parkway. As of May 18, 2015, the property was 95.1% occupied.
THE INFORMATION IN THIS STRUCTURAL AND COLLATERAL TERM SHEET IS NOT COMPLETE AND MAY BE AMENDED PRIOR TO THE TIME OF SALE. THIS TERM SHEET IS NOT AN OFFER TO SELL THESE SECURITIES AND IT IS NOT A SOLICITATION OF AN OFFER TO BUY THESE SECURITIES IN ANY JURISDICTION WHERE THE OFFER OR SALE IS NOT PERMITTED.
| 120 |
| COASTAL VILLAGE APARTMENTS |
Sources and Uses
| Sources | Uses | |||||||
| Original loan amount | $24,000,000 | 71.8% | Purchase price | $32,000,000 | 95.7% | |||
| Sponsor’s new cash contribution | 9,427,702 | 28.2 | Reserves | 712,245 | 2.1 | |||
| Closing costs | 715,457 | 2.1 | ||||||
| Total Sources | $33,427,702 | 100.0% | Total Uses | $33,427,702 | 100.0% | |||
The following table presents certain information relating to the unit mix of the Coastal Village Apartments Property:
Apartment Unit Summary(1)
| Unit Type | No. of Units |
No. of Beds | % of Total Beds | % of Total Beds | Average Unit Size (SF) |
| 4 Bedroom - 4 Bathroom | 200 | 800 | 100.0% | 100.0% | 1,385 |
| Total/Weighted Average | 200 | 800 | 100.0% | 100.0% | 1,385 |
| (1) | Information obtained from the appraisal. |
The following table presents historical occupancy percentages at the Coastal Village Apartments Property:
Historical Occupancy
12/31/2012(1) | 12/31/2013(1) | 12/31/2014(1) | 5/18/2015(2) |
| 88.0% | 91.0% | 92.9% | 95.1% |
| (1) | Information obtained from the borrower. |
| (2) | Information obtained from the underwritten rent roll. |
Operating History and Underwritten Net Cash Flow. The following table presents certain information relating to the historical operating performance and underwritten net cash flow at the Coastal Village Apartments Property:
Cash Flow Analysis
| 2013 | 2014 | TTM 3/31/2015 | U/W | % of U/W Effective Gross Income | U/W $ per Unit | ||||||||||||||||||||
| Gross Potential Rent | $4,818,015 | $4,909,309 | $4,904,710 | $4,914,072 | 102.1% | $6,143 | |||||||||||||||||||
| Concessions | (15,037) | (6,888) | (3,079) | (3,079) | (0.1) | (4) | |||||||||||||||||||
| Other Income | 143,034 | 210,774 | 210,266 | 210,266 | 4.4 | 263 | |||||||||||||||||||
| Less Vacancy & Credit Loss | (480,186) | (364,903) | (394,372) | (306,052)(1) | (6.4) | (383) | |||||||||||||||||||
| Effective Gross Income | $4,465,826 | $4,748,292 | $4,717,525 | $4,815,207 | 100.0% | $6,019 | |||||||||||||||||||
| Total Operating Expenses | $2,266,606 | $2,561,463 | $2,622,963 | $2,680,878 | 55.7% | $3,351 | |||||||||||||||||||
| Net Operating Income | $2,199,220 | $2,186,829 | $2,094,562 | $2,134,330 | 44.3% | $2,668 | |||||||||||||||||||
| Capital Expenditures | 0 | 0 | 0 | 130,336 | 2.7 | 163 | |||||||||||||||||||
| Net Cash Flow | $2,199,220 | $2,186,829 | $2,094,562 | $2,003,994 | 41.6% | $2,505 | |||||||||||||||||||
| NOI DSCR | 1.54x | 1.53x | 1.46x | 1.49x | |||||||||||||||||||||
| NCF DSCR | 1.54x | 1.53x | 1.46x | 1.40x | |||||||||||||||||||||
| NOI DY | 9.2% | 9.1% | 8.7% | 8.9% | |||||||||||||||||||||
| NCF DY | 9.2% | 9.1% | 8.7% | 8.3% | |||||||||||||||||||||
| (1) | The underwritten economic vacancy is 5.0% and underwritten credit loss is 1.0%. The Coastal Village Apartments Property was 95.1% occupied as of May 18, 2015. |
THE INFORMATION IN THIS STRUCTURAL AND COLLATERAL TERM SHEET IS NOT COMPLETE AND MAY BE AMENDED PRIOR TO THE TIME OF SALE. THIS TERM SHEET IS NOT AN OFFER TO SELL THESE SECURITIES AND IT IS NOT A SOLICITATION OF AN OFFER TO BUY THESE SECURITIES IN ANY JURISDICTION WHERE THE OFFER OR SALE IS NOT PERMITTED.
| 121 |
| No. 13 – Foothills Park Place | |||||||
| Loan Information | Property Information | ||||||
| Mortgage Loan Seller: | Wells Fargo Bank, National Association | Single Asset/Portfolio: | Single Asset | ||||
Credit Assessment (Fitch/KBRA/Moody’s): | NR/NR/NR | Property Type: | Retail | ||||
| Original Principal Balance: | $23,000,000 | Specific Property Type: | Shadow Anchored | ||||
| Cut-off Date Principal Balance: | $23,000,000 | Location: | Phoenix, AZ | ||||
| % of Initial Pool Balance: | 2.0% | Size: | 132,496 SF | ||||
| Loan Purpose: | Refinance | Cut-off Date Principal Balance Per SF: | $173.59 | ||||
| Borrower Name: | Foothills Shopping Center, L.L.C. | Year Built/Renovated: | 1991/2009 | ||||
| Sponsor: | Ronald Hahn | Title Vesting: | Fee | ||||
| Mortgage Rate: | 4.130% | Property Manager: | Zell Commercial Real Estate Service, Inc. | ||||
| Note Date: | April 3, 2015 | 3rdMost Recent Occupancy (As of): | 98.2% (1/31/2012) | ||||
| Anticipated Repayment Date: | NAP | 2ndMost Recent Occupancy (As of): | 99.9% (1/31/2013) | ||||
| Maturity Date: | April 11, 2025 | Most Recent Occupancy (As of): | 97.5% (1/31/2014) | ||||
| IO Period: | 120 months | Current Occupancy (As of): | 91.7% (2/25/2015) | ||||
| Loan Term (Original): | 120 months | ||||||
| Seasoning: | 2 month | Underwriting and Financial Information: | |||||
| Amortization Term (Original): | NAP | ||||||
| Loan Amortization Type: | Interest-only, Balloon | 3rdMost Recent NOI (As of): | $2,543,147 (12/31/2013) | ||||
| Interest Accrual Method: | Actual/360 | 2ndMost Recent NOI (As of)(2): | $2,175,933 (12/31/2014) | ||||
| Call Protection: | L(26),GRTR 1% or YM(90),O(4) | Most Recent NOI (As of): | $2,165,788 (TTM 1/1/2015) | ||||
| Lockbox Type: | Springing (Without Established Account) | ||||||
| Additional Debt(1): | Yes | U/W Revenues: | $3,388,274 | ||||
| Additional Debt Type(1): | Future Unsecured | U/W Expenses: | $844,492 | ||||
| U/W NOI: | $2,543,783 | ||||||
| U/W NCF: | $2,317,655 | ||||||
| Escrows and Reserves: | U/W NOI DSCR: | 2.63x | |||||
| U/W NCF DSCR: | 2.40x | ||||||
| Type: | Initial | Monthly | Cap (If Any) | U/W NOI Debt Yield: | 11.1% | ||
| Taxes | $21,089 | $21,089 | NAP | U/W NCF Debt Yield: | 10.1% | ||
| Insurance | $28,677 | $2,607 | NAP | As-Is Appraised Value: | $39,000,000 | ||
| Replacement Reserve | $0 | $0 | NAP | As-Is Appraisal Valuation Date: | March 9, 2015 | ||
| Existing TI/LC Reserve | $257,827 | $0 | NAP | Cut-off Date LTV Ratio: | 59.0% | ||
| Rent Concession Reserve | $49,724 | $0 | NAP | LTV Ratio at Maturity or ARD: | 59.0% | ||
| (1) | Future unsecured subordinate debt is permitted from affiliates of the borrower in an amount up to $585,500. |
| (2) | See “Cash Flow Analysis” section. |
The Foothills Park Place mortgage loan is evidenced by a single promissory note that is secured by a first mortgage encumbering a 132,496 square foot shadow anchored retail center (the “Foothills Park Place Property”) located in Phoenix, Arizona, approximately 14.2 miles southeast of the Phoenix central business district. The Foothills Park Place Property is located on a 11.6-acre site, was built in 1991, was most recently renovated in 2009, and is comprised of 11, one-story buildings. The Foothills Park Place Property is part of the larger Foothills Park Place Shopping Center, a 315,999 square foot retail center anchored by a 104,880 square foot JCPenney and a 62,868 square foot Sports Authority (neither are part of the collateral). Major tenants at the Foothills Park Place Property include Goodwill, Peter Piper Pizza, and numerous other national tenants. Approximately 40.5% of the underwritten base rent is from tenants that have occupied their space for over 10 years.
The Foothills Park Place Property includes 530 surface parking spaces resulting in a parking ratio of 4.0 spaces per 1,000 square feet of rentable area. In 2014, the population within a one-, three- and five-mile radius of the Foothills Park Place Property was 15,789, 82,957 and 186,088, respectively, while the estimated median household income within the same radii was $71,476, $85,445, and $80,400, respectively. As of February 25, 2015, the Foothill Park Place Property was 91.7% occupied by 36 tenants.
THE INFORMATION IN THIS STRUCTURAL AND COLLATERAL TERM SHEET IS NOT COMPLETE AND MAY BE AMENDED PRIOR TO THE TIME OF SALE. THIS TERM SHEET IS NOT AN OFFER TO SELL THESE SECURITIES AND IT IS NOT A SOLICITATION OF AN OFFER TO BUY THESE SECURITIES IN ANY JURISDICTION WHERE THE OFFER OR SALE IS NOT PERMITTED.
| 122 |
| FOOTHILLS PARK PLACE |
Sources and Uses
| Sources | Uses | |||||||
| Original loan amount | $23,000,000 | 99.4% | Loan payoff(1) | $22,506,453 | 97.3% | |||
| Sponsor’s new cash contribution | 142,037 | 0.6 | Reserves | 357,317 | 1.5 | |||
| Closing costs | 278,267 | 1.2 | ||||||
| Total Sources | $23,142,037 | 100.0% | Total Uses | $23,142,037 | 100.0% |
| (1) | The Foothills Park Place Property was previously securitized in the MLMT 2005-CIP1 transaction. |
The following table presents certain information relating to the tenancy at the Foothills Park Place Property:
Major Tenants
| Tenant Name | Credit Rating (Fitch/ Moody’s/ S&P)(1) | Tenant NRSF | % of NRSF | Annual U/W Base Rent PSF(2) | Annual U/W Base Rent(2) | % of Total Annual U/W Base Rent | Sales PSF(3) | Occupancy Cost(3) | Lease Expiration Date |
| Anchor Tenants – Not Part of Collateral | |||||||||
| JCPenney(4) | CCC/Caa2/CCC+ | 104,880 | ANCHOR OWNED – NOT PART OF THE COLLATERAL | ||||||
| Sports Authority(4)(5) | NR/Caa1/NR | 62,868 | ANCHOR OWNED – NOT PART OF THE COLLATERAL | ||||||
| Total Anchor Tenants – Not Part of Collateral | 167,748 | ||||||||
| Major Tenant – Collateral | |||||||||
| Goodwill | NR/NR/NR | 22,565 | 17.0% | $15.50 | $349,758 | 13.7% | NAV | NAV | 11/30/2029 |
| Peter Piper Pizza | NR/NR/NR | 14,000 | 10.6% | $13.50 | $189,000 | 7.4% | $133 | 14.8% | 3/31/2018 |
| Total Major Tenant – Collateral | 36,565 | 27.6% | $14.73 | $538,758 | 21.2% | ||||
| Non-Major Tenant – Collateral | |||||||||
| Native New Yorker | NR/NR/NR | 6,498 | 4.9% | $25.00 | $162,450 | 6.4% | $475 | 6.6% | 1/31/2023 |
| Desert Federal Credit Union | NR/NR/NR | 5,914 | 4.5% | $26.66 | $157,687 | 6.2% | NAV | NAV | 8/31/2016 |
| 2ndWind Exercise Equipment | NR/NR/NR | 4,332 | 3.3% | $35.00 | $151,620 | 6.0% | NAV | NAV | 10/31/2024 |
| Vitamin Shoppe | NR/NR/NR | 3,867 | 2.9% | $38.75 | $149,846 | 5.9% | NAV | NAV | 5/31/2025 |
| Total Non-Major Tenant – Collateral | 20,611 | 15.6% | $30.16 | $621,603 | 24.4% | ||||
| Other Tenants – Collateral | 64,342 | 48.6% | $21.51 | $1,383,807 | 54.4% | ||||
| Occupied Collateral Total | 121,518 | 91.7% | $20.94 | $2,544,168 | 100.0% | ||||
| Vacant Space | 10,978 | 8.3% | |||||||
| Collateral Total | 132,496 | 100.0% | |||||||
| (1) | Certain ratings are those of the parent company whether or not the parent guarantees the lease. |
| (2) | Annual U/W Base Rent PSF and Annual U/W Base Rent include contractual rent bumps through December 2015, totaling $52,515. Sherwin Williams signed an early 5-year renewal with increased rent starting October 1, 2016, which was included in underwriting as Sherman Williams’ rent is significantly below the concluded market rent. |
| (3) | Sales PSF and Occupancy Cost are for the trailing 12-month period ending December 31, 2014. |
| (4) | JCPenney, Sports Authority, and 5 other outparcel sites are not part of the collateral but contribute to their pro-rata share of common area maintenance reimbursements. |
| (5) | Sports Authority subleases a portion of its space to Fresh & Easy, who recently announced they will be closing approximately 50 stores including this location. |
THE INFORMATION IN THIS STRUCTURAL AND COLLATERAL TERM SHEET IS NOT COMPLETE AND MAY BE AMENDED PRIOR TO THE TIME OF SALE. THIS TERM SHEET IS NOT AN OFFER TO SELL THESE SECURITIES AND IT IS NOT A SOLICITATION OF AN OFFER TO BUY THESE SECURITIES IN ANY JURISDICTION WHERE THE OFFER OR SALE IS NOT PERMITTED.
| 123 |
| FOOTHILLS PARK PLACE |
The following table presents certain information relating to the lease rollover schedule at the Foothills Park Place Property:
Lease Expiration Schedule(1)(2)
| Year Ending December 31, | No. of Leases Expiring | Expiring NRSF | % of Total NRSF | Cumulative Expiring NRSF | Cumulative % of Total NRSF | Annual U/W Base Rent | Annual U/W Base Rent PSF(3) |
| MTM | 0 | 0 | 0.0% | 0 | 0.0% | $0 | $0.00 |
| 2015 | 2 | 2,338 | 1.8% | 2,338 | 1.8% | $52,238 | $22.34 |
| 2016 | 7 | 12,341 | 9.3% | 14,679 | 11.1% | $325,674 | $26.39 |
| 2017 | 4 | 4,960 | 3.7% | 19,639 | 14.8% | $133,283 | $26.87 |
| 2018 | 5 | 27,328 | 20.6% | 46,967 | 35.4% | $443,788 | $16.24 |
| 2019 | 5 | 11,541 | 8.7% | 58,508 | 44.2% | $242,944 | $21.05 |
| 2020 | 3 | 5,180 | 3.9% | 63,688 | 48.1% | $125,612 | $24.25 |
| 2021 | 2 | 6,264 | 4.7% | 69,952 | 52.8% | $107,856 | $17.22 |
| 2022 | 2 | 7,068 | 5.3% | 77,020 | 58.1% | $136,380 | $19.30 |
| 2023 | 2 | 12,534 | 9.5% | 89,554 | 67.6% | $283,170 | $22.59 |
| 2024 | 2 | 5,532 | 4.2% | 95,086 | 71.8% | $193,620 | $35.00 |
| 2025 | 1 | 3,867 | 2.9% | 98,953 | 74.7% | $149,846 | $38.75 |
| Thereafter | 1 | 22,565 | 17.0% | 121,518 | 91.7% | $349,758 | $15.50 |
| Vacant | 0 | 10,978 | 8.3% | 132,496 | 100.0% | $0 | $0.00 |
| Total/Weighted Average | 36 | 132,496 | 100.0% | $2,544,168 | $20.94 |
| (1) | Information obtained from the underwritten rent roll. |
| (2) | Certain tenants may have lease termination options that are exercisable prior to the originally stated expiration date of the subject lease and that are not considered in the Lease Expiration Schedule. |
| (3) | Annual U/W Base Rent PSF excludes vacant space. |
The following table presents historical occupancy percentages at the Foothills Park Place Property:
Historical Occupancy
1/31/2012(1) | 1/31/2013(1) | 1/31/2014(1) | 2/25/2015(2) |
| 98.2% | 99.9% | 97.5% | 91.7% |
| (1) | Information obtained from the borrower. |
| (2) | Information obtained from the underwritten rent roll. |
Operating History and Underwritten Net Cash Flow.The following table presents certain information relating to the historical operating performance and underwritten net cash flow at the Foothills Park Place Property:
Cash Flow Analysis
| 2013 | 2014 | TTM 1/31/2015 | U/W | % of U/W Effective Gross Income | U/W $ per SF | |||||||
| Base Rent | $2,528,449 | $2,215,797 | $2,216,842 | $2,627,740(1) | 77.6% | $19.83 | ||||||
| Grossed Up Vacant Space | 0 | 0 | 0 | 219,216 | 6.5 | 1.65 | ||||||
| Percentage Rent | 66 | 18,023 | 18,023 | 0 | 0.0 | 0.00 | ||||||
| Total Reimbursables | 839,216 | 710,890 | 707,729 | 760,534 | 22.4 | 5.74 | ||||||
| Other Income | 1,940 | 7,240 | 6,903 | 0 | 0.0 | 0.00 | ||||||
| Less Vacancy & Credit Loss | 0 | 0 | 0 | (219,216)(2) | (6.5) | (1.65) | ||||||
| Effective Gross Income | $3,369,671 | $2,951,950 | $2,949,497 | $3,388,274 | 100.0% | $25.57 | ||||||
| Total Operating Expenses | $826,524 | $776,016 | $783,709 | $844,492 | 24.9% | $6.37 | ||||||
|
|
|
|
|
| |||||||
| Net Operating Income | $2,543,147 | $2,175,933(3) | $2,165,788 | $2,543,783(4) | 75.1% | $19.20 | ||||||
| TI/LC | 0 | 0 | 0 | 199,628 | 5.9 | 1.51 | ||||||
| Capital Expenditures | 0 | 0 | 0 | 26,499 | 0.8 | 0.20 | ||||||
| Net Cash Flow | $2,543,147 | $2,175,933 | $2,165,788 | $2,317,655 | 68.4% | $17.49 | ||||||
| NOI DSCR | 2.63x | 2.25x | 2.24x | 2.63x | ||||||||
| NCF DSCR | 2.63x | 2.25x | 2.24x | 2.40x | ||||||||
| NOI DY | 11.1% | 9.5% | 9.4% | 11.1% | ||||||||
| NCF DY | 11.1% | 9.5% | 9.4% | 10.1% |
| (1) | Annual U/W Base Rent includes contractual rent bumps through December 2015, totaling $52,515. |
| (2) | The underwritten economic vacancy is 7.7%. The Foothills Park Place Property was 91.7% physically occupied as of February 25, 2015. |
| (3) | The decrease in Net Operating Income from 2013 to 2014 can be attributed to the Michael’s lease expiration in February 2014. The new lease with Goodwill was signed four months later in June 2014 with the tenant taking occupancy on November 26, 2014 and rent payments commencing on February 27, 2015. |
| (4) | The increase in U/W Net Operating Income from TTM January 31, 2015 is primarily due to the new lease with Goodwill with annual rent payments of $349,758 commencing on February 27, 2015 and contractual rent increases through December 2015 totaling $52,515 being underwritten. |
THE INFORMATION IN THIS STRUCTURAL AND COLLATERAL TERM SHEET IS NOT COMPLETE AND MAY BE AMENDED PRIOR TO THE TIME OF SALE. THIS TERM SHEET IS NOT AN OFFER TO SELL THESE SECURITIES AND IT IS NOT A SOLICITATION OF AN OFFER TO BUY THESE SECURITIES IN ANY JURISDICTION WHERE THE OFFER OR SALE IS NOT PERMITTED.
| 124 |
[THIS PAGE INTENTIONALLY LEFT BLANK.]
THE INFORMATION IN THIS STRUCTURAL AND COLLATERAL TERM SHEET IS NOT COMPLETE AND MAY BE AMENDED PRIOR TO THE TIME OF SALE. THIS TERM SHEET IS NOT AN OFFER TO SELL THESE SECURITIES AND IT IS NOT A SOLICITATION OF AN OFFER TO BUY THESE SECURITIES IN ANY JURISDICTION WHERE THE OFFER OR SALE IS NOT PERMITTED.
| 125 |
| No. 14 - Smiths Medical | |||||||
| Loan Information | Property Information | ||||||
| Mortgage Loan Seller: | Rialto Mortgage Finance, LLC | Single Asset/Portfolio: | Single Asset | ||||
| Credit Assessment (Fitch/KBRA/Moody’s): | NR/NR/NR | Property Type: | Office | ||||
| Original Principal Balance: | $22,250,000 | Specific Property Type: | Suburban | ||||
| Cut-off Date Principal Balance: | $22,250,000 | Location: | Plymouth, MN | ||||
| % of Initial Pool Balance: | 1.9% | Size: | 182,250 SF | ||||
| Loan Purpose: | Acquisition | Cut-off Date Principal Balance Per Unit/SF: | $122.09 | ||||
| Borrower Name: | 6000 Nathan (MN) LLC | Year Built/Renovated: | 1999/NAP | ||||
| Sponsor: | Corporate Property Associates 17 - Global Incorporated | Title Vesting: | Fee | ||||
| Mortgage Rate: | 4.475% | Property Manager: | Interstate Partners II, LLC | ||||
| Note Date: | May 8, 2015 | 3rdMost Recent Occupancy (As of): | 45.0% (12/31/2012) | ||||
| Anticipated Repayment Date: | NAP | 2ndMost Recent Occupancy (As of): | 45.0% (12/31/2013) | ||||
| Maturity Date: | May 6, 2025 | Most Recent Occupancy (As of)(4): | 45.0% (12/31/2014) | ||||
| IO Period: | 60 months | Current Occupancy (As of)(4): | 100.0% (3/1/2015) | ||||
| Loan Term (Original): | 120 months | ||||||
| Seasoning: | 1 month | Underwriting and Financial Information: | |||||
| Amortization Term (Original): | 360 months | ||||||
| Loan Amortization Type: | Interest-only, Amortizing Balloon | 3rdMost Recent NOI (As of): | $515,262 (12/31/2013) | ||||
| Interest Accrual Method: | Actual/360 | 2ndMost Recent NOI (As of): | $827,333 (12/31/2014) | ||||
| Call Protection: | L(25),D(88),O(7) | Most Recent NOI (As of)(4): | $1,176,135 (TTM 2/28/2015) | ||||
| Lockbox Type: | Springing (Without Established Account) | ||||||
| Additional Debt: | None | ||||||
| Additional Debt Type: | NAP | ||||||
| U/W Revenues: | $4,125,555 | ||||||
| U/W Expenses: | $1,735,379 | ||||||
| U/W NOI: | $2,390,177 | ||||||
| Escrows and Reserves: | U/W NCF: | $2,171,477 | |||||
| U/W NOI DSCR: | 1.77x | ||||||
| Type: | Initial | Monthly | Cap (If Any) | U/W NCF DSCR: | 1.61x | ||
| Taxes(1) | $0 | Springing | NAP | U/W NOI Debt Yield: | 10.7% | ||
| Insurance(1) | $0 | Springing | NAP | U/W NCF Debt Yield: | 9.8% | ||
| Replacement Reserves(1) | $0 | Springing | NAP | As-Is Appraised Value: | $35,400,000 | ||
| TI/LC Reserve(1) | $0 | Springing | NAP | As-Is Appraisal Valuation Date: | April 1, 2015 | ||
| Other(2) | $1,339,166 | $0 | NA | Cut-off Date LTV Ratio: | 62.9% | ||
| Critical Tenant TI/LC(3) | $0 | Springing | NAP | LTV Ratio at Maturity or ARD: | 57.5% | ||
| (1) | Monthly collections spring upon a Cash Management Trigger Event, which includes, but is not limited to: an event of default, a bankruptcy event of the borrower or guarantor or the debt service coverage ratio falling below 1.20x. |
| (2) | Other Initial reserves consist of a Brocade free rent reserve ($775,512), Stanley Convergent Security Solutions TI/LC and abatement reserve ($318,617) and a parking lot future expansion reserve ($245,037). |
| (3) | All excess cash flow shall be deposited in the Critical Tenant TI/LC monthly reserves upon (i) the monetary or material non-monetary event of default occurring under the Smiths Medical (the “Critical Tenant”) lease, (ii) the bankruptcy or insolvency of the Critical Tenant or any lease guarantor under the Critical Tenant lease, or (iii) the Critical Tenant (or an assignee of subtenant) ceasing to occupy, or discontinuing its normal operations at, the Smiths Medical Property. |
| (4) | Smiths Medical executed a lease for 99,977 square feet (54.9% of the net rentable square footage) of previously vacant space on February 1, 2015. |
The Smiths Medical mortgage loan is evidenced by a single promissory note that is secured by a first mortgage encumbering a 182,250 square-foot office property located in Plymouth, Minnesota (the “Smiths Medical Property”), approximately 10.6 miles west of Minneapolis, Minnesota. The Smiths Medical Property is a four-story, suburban office building that was built in 1999 and situated on a 26.3-acre site. As of March 1, 2015, the Smiths Medical Property was 100.0% leased to three tenants including, Smiths Medical (“Smiths Medical”), Brocade Communications Systems, Inc. (“Brocade”), and Stanley Convergent. As part of the Smiths Medical recent lease execution, Smiths Medical entered into an agreement to take the Brocade’s space in January 2016. Simultaneously, Brocade agreed to accelerate its lease expiration to December 2015 in exchange for full gross abatement on its space for the remainder of the year. Smiths Medical will take occupancy in Brocade’s space and commence rental payments in January 2016. Additionally, the Smiths Medical lease has a “must-take” provision which obligates Smiths Medical to lease any rentable space in the Smith Medical Property as it becomes available, at Smiths Medical’s then-escalated rent, during the course of its lease term through its current lease maturity of January 31, 2028. Surface level parking is currently available for 902 cars, reflecting a parking ratio of 4.9 spaces per 1,000 square feet of rentable area.
THE INFORMATION IN THIS STRUCTURAL AND COLLATERAL TERM SHEET IS NOT COMPLETE AND MAY BE AMENDED PRIOR TO THE TIME OF SALE. THIS TERM SHEET IS NOT AN OFFER TO SELL THESE SECURITIES AND IT IS NOT A SOLICITATION OF AN OFFER TO BUY THESE SECURITIES IN ANY JURISDICTION WHERE THE OFFER OR SALE IS NOT PERMITTED.
| 126 |
| SMITHS MEDICAL |
Sources and Uses
| Sources | Uses | |||||||
| Original loan amount | $22,250,000 | 65.3% | Purchase price | $32,258,738 | 94.7% | |||
| Sponsor's new cash contribution | 11,812,607 | 34.7 | Reserves | 1,339,166 | 3.9 | |||
| Closing costs | 464,703 | 1.4 | ||||||
| Total Sources | $34,062,607 | 100.0% | Total Uses | $34,062,607 | 100.0% |
The following table presents certain information relating to the tenancies at the Smiths Medical Property:
Major Tenants
| Tenant Name | Credit Rating (Fitch/Moody’s/ S&P)(1) | Tenant NRSF | % of NRSF | Annual U/W Base Rent PSF | Annual U/W Base Rent | % of Total Annual U/W Base Rent | Lease Expiration Date | |
| Major Tenants | ||||||||
| Smiths Medical(2) | NR/Baa2/BBB+ | 99,977 | 54.9% | $12.00 | $1,199,724 | 49.2% | 1/31/2028 | |
| Brocade Communications(3) | NR/NR/NR | 44,846 | 24.6% | $15.89 | $712,743 | 29.3% | 12/31/2015 | |
| Stanley Convergent | A-/ Baa1/A | 37,427 | 20.5% | $14.00 | $523,978 | 21.5% | 5/31/2021 | |
| Total Major Tenants | 182,250 | 100.0% | $13.37 | $2,436,445 | 100.0% | |||
| Occupied Collateral Total | 182,250 | 100.0% | $13.37 | $2,436,445 | 100.0% | |||
| Vacant Space | 0 | 0.0% | ||||||
| Collateral Total | 182,250 | 100.0% | ||||||
| (1) | Certain ratings are those of the parent company whether or not the parent guarantees the lease. |
| (2) | Smiths Medical has a one-time termination option on July 31, 2025, with 12-months’ notice and a payment of $2,046,940. Due to the structure of Smiths Medical lease, all space at the Smiths Medical Property which becomes vacant will be taken by Smiths Medical due to the must-take clause in its lease. |
| (3) | Brocade accelerated its lease termination to take effect on December 31, 2015. Smiths Medical is required to take Brocade’s space on January 1, 2016. As part of its lease termination, Brocade is not required to pay rent through the remainder of its lease term. A free rent reserve of $775,512 was collected at closing. |
The following table presents certain information relating to the lease rollover schedule at the Smiths Medical Property:
Lease Expiration Schedule(1)(2)
| Year Ending December 31, | No. of Leases Expiring | Expiring NRSF | % of Total NRSF | Cumulative Expiring NRSF | Cumulative % of Total NRSF | Annual U/W Base Rent | Annual U/W Base Rent PSF(3) | |||||
| MTM | 0 | 0 | 0.0% | 0 | 0.0% | $0 | $0.00 | |||||
| 2015 | 2 | 44,846 | 24.6% | 44,846 | 24.6% | $712,743 | $15.89 | |||||
| 2016 | 0 | 0 | 0.0% | 44,846 | 24.6% | $0 | $0.00 | |||||
| 2017 | 0 | 0 | 0.0% | 44,846 | 24.6% | $0 | $0.00 | |||||
| 2018 | 0 | 0 | 0.0% | 44,846 | 24.6% | $0 | $0.00 | |||||
| 2019 | 0 | 0 | 0.0% | 44,846 | 24.6% | $0 | $0.00 | |||||
| 2020 | 0 | 0 | 0.0% | 44,846 | 24.6% | $0 | $0.00 | |||||
| 2021 | 1 | 37,427 | 20.5% | 82,273 | 45.1% | $523,978 | $14.00 | |||||
| 2022 | 0 | 0 | 0.0% | 82,273 | 45.1% | $0 | $0.00 | |||||
| 2023 | 0 | 0 | 0.0% | 82,273 | 45.1% | $0 | $0.00 | |||||
| 2024 | 0 | 0 | 0.0% | 82,273 | 45.1% | $0 | $0.00 | |||||
| 2025 | 0 | 0 | 0.0% | 82,273 | 45.1% | $0 | $0.00 | |||||
| Thereafter | 1 | 99,977 | 54.9% | 182,250 | 100.0% | $1,199,724 | $12.00 | |||||
| Vacant | 0 | 0 | 0.0% | 182,250 | 100.0% | 0 | $0.00 | |||||
| Total/Weighted Average | 4 | 182,250 | 100.0% | $2,436,445 | $13.37 | |||||||
| (1) | Information obtained from the underwritten rent roll. |
| (2) | Certain tenants may have lease termination options that are exercisable prior to the originally stated expiration date of the subject lease and that are not considered in the Lease Expiration Schedule. |
| (3) | Weighted Average Annual U/W Base Rent PSF excludes vacant space. |
THE INFORMATION IN THIS STRUCTURAL AND COLLATERAL TERM SHEET IS NOT COMPLETE AND MAY BE AMENDED PRIOR TO THE TIME OF SALE. THIS TERM SHEET IS NOT AN OFFER TO SELL THESE SECURITIES AND IT IS NOT A SOLICITATION OF AN OFFER TO BUY THESE SECURITIES IN ANY JURISDICTION WHERE THE OFFER OR SALE IS NOT PERMITTED.
| 127 |
| SMITHS MEDICAL |
The following table presents historical occupancy percentages at the Smiths Medical Property:
Historical Occupancy
12/31/2012(1)(2) | 12/31/2013(1)(2) | 12/31/2014(1)(2) | 3/23/2015(2)(3) |
| 45.0% | 45.0% | 45.0% | 100.0% |
| (1) | Information obtained from the borrower. |
| (2) | Smiths Medical ASD executed a lease for 99,977 square feet of previously vacant space (54.9% of the net rentable square footage) on February 1, 2015. |
| (3) | Information obtained from the underwritten rent roll. |
Operating History and Underwritten Net Cash Flow.The following table presents certain information relating to the historical operating performance and underwritten net cash flow at the Smiths Medical Property:
Cash Flow Analysis
| 2013 | 2014 | TTM 2/28/2015(1) | U/W(1) | % of U/W Effective Gross Income | U/W $ per SF | |||||||||
| Base Rent | $1,196,673 | $1,229,794 | $1,453,470 | $2,436,445 | 59.1 | % | $13.37 | |||||||
| Grossed Up Vacant Space | 0 | 0 | 0 | 0 | 0.0 | 0.00 | ||||||||
| Straight Line Rent(2) | 0 | 0 | 0 | 249,536 | 6.0 | 1.37 | ||||||||
| Mark to Market Adjustment | 0 | 0 | 0 | (174,591)(3) | (4.2 | ) | (0.96) | |||||||
| Total Reimbursables | 948,034 | 1,028,578 | 1,133,143 | 1,735,379 | 42.1 | 9.52 | ||||||||
| Other Income | 99,034 | 93,921 | 77,394 | 91,125 | 2.2 | 0.50 | ||||||||
| Less Vacancy & Credit Loss | 0 | 0 | 0 | (212,338)(4) | (5.1 | ) | (1.17) | |||||||
| Effective Gross Income | $2,243,741 | $2,352,293 | $2,664,008 | $4,125,555 | 100.0 | % | $22.64 | |||||||
| Total Operating Expenses | $1,728,479 | $1,524,960 | $1,487,873 | $1,735,379 | 42.1 | % | $9.52 | |||||||
| Net Operating Income | $515,262 | $827,333 | $1,176,135 | $2,390,177 | 57.9 | % | $13.11 | |||||||
| TI/LC | 0 | 0 | 0 | 182,250 | 4.4 | 1.00 | ||||||||
| Capital Expenditures | 0 | 0 | 0 | 36,450 | 0.9 |
| 0.20 | |||||||
| Net Cash Flow | $515,262 | $827,333 | $1,176,135 | $2,171,477 | 52.6 | % | $11.91 | |||||||
| NOI DSCR | 0.38x | 0.61x | 0.87x | 1.77x | ||||||||||
| NCF DSCR | 0.38x | 0.61x | 0.87x | 1.61x | ||||||||||
| NOI DY | 2.3% | 3.7% | 5.3% | 10.7% | ||||||||||
| NCF DY | 2.3% | 3.7% | 5.3% | 9.8% |
| (1) | Smiths Medical executed a lease for 99,977 square feet of previously vacant space (54.9% of the net rentable square footage) on February 1, 2015. |
| (2) | Due to the credit nature of the tenants, Straight Line Rent includes underwritten rent increases of $0.35 per square foot through the fifth year of the Smiths Medical lease and the average rent through the remaining term of the Stanley Convergent lease. Smiths Medical has a current rent of $12.00 per square foot and Stanley Convergent has a current rent of $14.00 per square foot. |
| (3) | Mark to Market Adjustment is based on the difference of Brocade Communication in-place rent and the contractual Smiths Medical rent due to Smiths Medical’s takeover in January 1, 2016. |
| (4) | The underwritten economic vacancy is 5.0%. The Smiths Medical Property was 100.0% physically occupied as of March 1, 2015. |
THE INFORMATION IN THIS STRUCTURAL AND COLLATERAL TERM SHEET IS NOT COMPLETE AND MAY BE AMENDED PRIOR TO THE TIME OF SALE. THIS TERM SHEET IS NOT AN OFFER TO SELL THESE SECURITIES AND IT IS NOT A SOLICITATION OF AN OFFER TO BUY THESE SECURITIES IN ANY JURISDICTION WHERE THE OFFER OR SALE IS NOT PERMITTED.
| 128 |
[THIS PAGE INTENTIONALLY LEFT BLANK.]
THE INFORMATION IN THIS STRUCTURAL AND COLLATERAL TERM SHEET IS NOT COMPLETE AND MAY BE AMENDED PRIOR TO THE TIME OF SALE. THIS TERM SHEET IS NOT AN OFFER TO SELL THESE SECURITIES AND IT IS NOT A SOLICITATION OF AN OFFER TO BUY THESE SECURITIES IN ANY JURISDICTION WHERE THE OFFER OR SALE IS NOT PERMITTED.
| 129 |
| No. 15 – Hunterstone Apartments | |||||||
| Loan Information | Property Information | ||||||
| Mortgage Loan Seller: | Rialto Mortgage Finance, LLC | Single Asset/Portfolio: | Single Asset | ||||
| Credit Assessment (Fitch/KBRA/Moody’s): | NR/NR/NR | Property Type: | Multifamily | ||||
| Original Principal Balance: | $19,000,000 | Specific Property Type: | Garden | ||||
| Cut-off Date Principal Balance: | $19,000,000 | Location: | Leland, NC | ||||
| % of Initial Pool Balance: | 1.6% | Size: | 288 Units | ||||
| Loan Purpose: | Acquisition | Cut-off Date Principal Balance Per Unit: | $65,972 | ||||
| Borrower Name: | HPI Hunterstone LLC | Year Built/Renovated: | 2005/NAP | ||||
| Sponsor: | Matthew A. Sharp; J. David Kelsey | Title Vesting: | Fee | ||||
| Mortgage Rate: | 4.380% | Property Manager: | Self-managed | ||||
| Note Date: | May 1, 2015 | 3rd Most Recent Occupancy (As of): | 92.2% (12/31/2012) | ||||
| Anticipated Repayment Date: | NAP | 2nd Most Recent Occupancy (As of): | 94.3% (12/31/2013) | ||||
| Maturity Date: | May 6, 2025 | Most Recent Occupancy (As of): | 94.4% (12/31/2014) | ||||
| IO Period: | 48 months | Current Occupancy (As of): | 91.3% (4/13/2015) | ||||
| Loan Term (Original): | 120 Months | ||||||
| Seasoning: | 1 month | Underwriting and Financial Information: | |||||
| Amortization Term (Original): | 360 months | ||||||
| Loan Amortization Type: | Interest-only, Amortizing Balloon | 3rd Most Recent NOI (As of): | $1,556,530 (12/31/2013) | ||||
| Interest Accrual Method: | Actual/360 | 2nd Most Recent NOI (As of): | $1,625,397 (12/31/2014) | ||||
| Call Protection: | L(25),D(88),O(7) | Most Recent NOI (As of): | $1,627,567 (TTM 3/31/2015) | ||||
| Lockbox Type: | Springing (Without Established Account) | ||||||
| Additional Debt(1): | Yes | U/W Revenues: | $2,512,786 | ||||
| Additional Debt Type(1): | Future Mezzanine | U/W Expenses: | $963,627 | ||||
| U/W NOI: | $1,549,159 | ||||||
| U/W NCF: | $1,477,159 | ||||||
| U/W NOI DSCR: | 1.36x | ||||||
| U/W NCF DSCR: | 1.30x | ||||||
| Escrows and Reserves: | U/W NOI Debt Yield: | 8.2% | |||||
| U/W NCF Debt Yield: | 7.8% | ||||||
| Type: | Initial | Monthly | Cap (If Any) | As-Is Appraised Value: | $25,375,000 | ||
| Taxes | $50,135 | $9,549 | NAP | As-Is Appraisal Valuation Date: | April 08, 2015 | ||
| Insurance(2) | $0 | Springing | NAP | Cut-off Date LTV Ratio: | 74.9% | ||
| Replacement Reserves | $0 | $6,000 | NAP | LTV Ratio at Maturity or ARD: | 66.9% | ||
| (1) | The borrower may incur mezzanine debt provided certain provisions are satisfied, including, but not limited to: (i) the combined amortizing net cash flow debt service coverage ratio is not less than 1.30x and (ii) the combined loan-to-value ratio is not greater than 75.0%. |
| (2) | The borrower is not required to make monthly insurance deposits as long as the insurance coverage remains in full force and effect. |
The mortgage loan is evidenced by a single promissory note that is secured by a first mortgage encumbering a garden-style multifamily property containing 288 units and located in Leland, North Carolina (the “Hunterstone Apartments Property”). Built in 2005, the Hunterstone Apartments Property is situated on 26.5 acres, located approximately 6.1 miles west of the Wilmington, North Carolina central business district and is within the Wilmington metropolitan statistical area, which has an estimated population of 274,427 as of 2015. The Port of Wilmington, approximately 8.1 miles east of the Hunterstone Apartments Property and the busiest port in North Carolina, accommodates refrigerated and non-refrigerated container cargo destined for North Carolina and other surrounding states. Primary access to the Hunterstone Apartments Property’s neighborhood is provided by Ocean Highway/Highway 17 (approximately 0.4 mile northwest of the Hunterstone Apartments Property) and Highway 74 (approximately 2.0 miles northeast of the Hunterstone Apartments Property), which connects to downtown Wilmington to the east. The Hunterstone Apartments Property is comprised of 12 buildings with a mixture of one, two and three bedroom units. Community amenities consist of a leasing office/clubhouse, fitness center, swimming pool, picnic and grill areas, laundry facility, playground, washer/dryer connections, 24-hour emergency maintenance, and free DVD exchange. Unit amenities include large walk-in closets, fully equipped kitchens, intrusion alarms, washer/dryer connections, private patio/balcony, and outside storage. As of April 13, 2015, the Hunterstone Apartments Property was 91.3% occupied.
THE INFORMATION IN THIS STRUCTURAL AND COLLATERAL TERM SHEET IS NOT COMPLETE AND MAY BE AMENDED PRIOR TO THE TIME OF SALE. THIS TERM SHEET IS NOT AN OFFER TO SELL THESE SECURITIES AND IT IS NOT A SOLICITATION OF AN OFFER TO BUY THESE SECURITIES IN ANY JURISDICTION WHERE THE OFFER OR SALE IS NOT PERMITTED.
| 130 |
| HUNTERSTONE APARTMENTS |
Sources and Uses
| Sources | Uses | |||||||
| Original loan amount | $19,000,000 | 74.9% | Purchase price(1) | $25,000,000 | 98.5% | |||
| Sponsor's new cash contribution | 6,368,432 | 25.1 | Closing costs | 318,297 | 1.3 | |||
| Reserves | 50,135 | 0.2 | ||||||
| Total Sources | $25,368,432 | 100.0% | Total Uses | $25,368,432 | 100.0% |
| (1) | The Hunterstone Apartments Property was previously securitized in the BSCMS 2006-PW13 transaction. |
The following table presents certain information relating to the unit mix of the Hunterstone Apartments Property:
Apartment Unit Summary(1)
| Unit Type | No. of Units | % of Total Units | Average Unit Size (SF) | Average Monthly Rent per Unit |
| 1 Bedroom/1 Bath | 72 | 25.0% | 576 | $706 |
| 2 Bedroom/2 Bath | 144 | 50.0% | 889 | $772 |
| 3 Bedroom/2 Bath | 72 | 25.0% | 1,125 | $887 |
| Total/Weighted Average | 288 | 100.0% | 870 | $784 |
| (1) | Information obtained from the underwritten rent roll. |
The following table presents historical occupancy percentages at the Hunterstone Apartments Property:
Historical Occupancy
12/31/2012(1) | 12/31/2013(1) | 12/31/2014(1) | 4/13/2015(2) |
| 92.2% | 94.3% | 94.4% | 91.3% |
(1) Information obtained from the borrower.
(2) Information obtained from the underwritten rent roll.
Operating History and Underwritten Net Cash Flow.The following table presents certain information relating to the historical operating performance and underwritten net cash flow at the Hunterstone Apartments Property:
Cash Flow Analysis
| 2013 | 2014 | TTM 3/31/2015 | U/W | % of U/W Effective Gross Income | U/W $ per Unit | ||||||||||||||||||||
| Base Rent | $2,603,005 | $2,686,500 | $2,715,653 | $2,475,996 | 98.5 | % | $8,597 | ||||||||||||||||||
| Grossed Up Vacant Space | 0 | 0 | 0 | 249,840 | 9.9 | 867 | |||||||||||||||||||
| Concessions | (83,047 | ) | (70,170 | ) | (63,801 | ) | (63,801 | ) | (2.5 | ) | (221 | ) | |||||||||||||
| Other Income(1) | 139,891 | 117,351 | 114,090 | 114,090 | 4.5 | 396 | |||||||||||||||||||
| Less Vacancy & Credit Loss | (155,883 | ) | (152,059 | ) | (160,511 | ) | (263,339 | )(2) | (10.5 | ) | (914 | ) | |||||||||||||
| Effective Gross Income | $2,503,966 | $2,581,622 | $2,605,431 | $2,512,786 | 100.0 | % | $8,724 | ||||||||||||||||||
| Total Operating Expenses | $947,436 | $956,225 | $977,864 | $963,627 | 38.3 | % | $3,345 | ||||||||||||||||||
| Net Operating Income | $1,556,530 | $1,625,397 | $1,627,567 | $1,549,159 | 61.7 | % | $5,379 | ||||||||||||||||||
| Capital Expenditures | 0 | 0 | 0 | 72,000 | 2.9 | 250 | |||||||||||||||||||
| Net Cash Flow | $1,556,530 | $1,625,397 | $1,627,567 | $1,477,159 | 58.8 | % | $5,129 | ||||||||||||||||||
| NOI DSCR | 1.37 | x | 1.43 | x | 1.43 | x | 1.36 | x | |||||||||||||||||
| NCF DSCR | 1.37 | x | 1.43 | x | 1.43 | x | 1.30 | x | |||||||||||||||||
| NOI DY | 8.2 | % | 8.6 | % | 8.6 | % | 8.2 | % | |||||||||||||||||
| NCF DY | 8.2 | % | 8.6 | % | 8.6 | % | 7.8 | % | |||||||||||||||||
| (1) | Other income includes washer/dryer rentals, late fees, lease termination fees, pet fees and application fees. |
| (2) | The underwritten economic vacancy is 12.0%. The Hunterstone Apartments Property was 91.3% physically occupied as of April 13, 2015. |
THE INFORMATION IN THIS STRUCTURAL AND COLLATERAL TERM SHEET IS NOT COMPLETE AND MAY BE AMENDED PRIOR TO THE TIME OF SALE. THIS TERM SHEET IS NOT AN OFFER TO SELL THESE SECURITIES AND IT IS NOT A SOLICITATION OF AN OFFER TO BUY THESE SECURITIES IN ANY JURISDICTION WHERE THE OFFER OR SALE IS NOT PERMITTED.
| 131 |
| Wells Fargo Commercial Mortgage Trust 2015-C29 | Transaction Contact Information |
VI. Transaction Contact Information
Questions regarding this Structural and Collateral Term Sheet may be directed to any of the following individuals:
| Wells Fargo Securities, LLC | |
| Brigid Mattingly | Tel. (312) 269-3062 |
| Fax (312) 658-0140 | |
| A.J. Sfarra | Tel. (212) 214-5613 |
| Fax (212) 214-8970 | |
| Alex Wong | Tel. (212) 214-5615 |
| Fax (212) 214-8970 | |
THE INFORMATION IN THIS STRUCTURAL AND COLLATERAL TERM SHEET IS NOT COMPLETE AND MAY BE AMENDED PRIOR TO THE TIME OF SALE. THIS TERM SHEET IS NOT AN OFFER TO SELL THESE SECURITIES AND IT IS NOT A SOLICITATION OF AN OFFER TO BUY THESE SECURITIES IN ANY JURISDICTION WHERE THE OFFER OR SALE IS NOT PERMITTED.
| 132 |