united states
securities and exchange commission
washington, d.c. 20549
form n-csr
certified shareholder report of registered management
investment companies
Investment Company Act file number 811-23066
Northern Lights Fund Trust IV
(Exact name of registrant as specified in charter)
225 Pictoria Drive, Suite 450, Cincinnati, Ohio 45246
(Address of principal executive offices) (Zip code)
Jennifer Farrell, Gemini Fund Services, LLC.
80 Arkay Drive, Hauppauge, NY 11788
(Name and address of agent for service)
Registrant's telephone number, including area code: 631-470-2600
Date of fiscal year end: 5/31
Date of reporting period: 5/31/21
Item 1. Reports to Stockholders.
| Main Sector Rotation ETF |
| (SECT) |
| Main Thematic Innovation ETF |
| (TMAT) |
| Annual Report |
| May 31, 2021 |
| 1-866-383-9778 |
| www.mainmgtetfs.com |
| This report and the financial statements contained herein are submitted for the general information of shareholders and are not authorized for distribution to prospective investors unless preceded or accompanied by an effective prospectus. Nothing herein contained is to be considered an offer of sale or solicitation of an offer to buy shares of the Main Sector Rotation ETF or Main Thematic Innovation ETF. Such offering is made only by prospectus, which includes details as to offering price and other material information. |
| Distributed by Northern Lights Distributors, LLC. Member FINRA |
May 31, 2020
Dear Shareholder,
The US is poised for its 3rd straight quarter of strong growth with the preliminary estimates of Q1 2021 GDP coming in at above 6%. It seems that the recession by proclamation is over and the output gap has closed down to around 3%. Consumer balance sheets appear strong, buoyed by the multiple rounds of government stimulus, and the retail sales data shows that people are spending this money. The unemployment rate has come down to under 6% and there are now more job openings than there are unemployed persons. Within the US, the vaccination efforts are well underway and case counts are dropping significantly. The rest of the world remains behind the US, but progress is being made and as we saw domestically, once vaccination efforts ramp up, they do so quickly and are highly effective against the virus.
Let’s look at the four legs of the stool (Price, Fed, Fiscal Stimulus, and Virus) and then at Price & Proof, which can prove more difficult to come by simultaneously than one might expect.
1. Price. The Forward Twelve Months P/E for the S&P 500 Total Return Index is 21.2x, or almost 1 multiple below the past 12-month average. This is partially due to the “inflation” fear discount. Capital Expenditures are booming and Information Technology is 50% of total capital expenditures, or double what it averaged in the 1970s. This leads to productivity, currently 4% and expanding, versus the 1970s when there was no productivity. This productivity as well as demographics are big headwinds to future inflation.
2. The Federal Reserve (the Fed). M2 Money Supply has increased by +$4.6t since February 2020 through April 2021 to $20t, and the Fed’s balance sheet is $7.7t as of May 31, 2021. The 5 Year TIPS/Treasury Breakeven Rate (which is a forecast of future inflation) has rolled over from the highs this spring. Part of this is the decline of some commodities like lumber and soybeans, and part is a growing realization that supply chains are being “unclogged” since manufacturing capacity does exist. We continue to hear from additional Fed members that have begun the “taper” talk, which is the discussion around when to start slowing or decreasing the ongoing asset purchase programs.
3. The Fiscal Stimulus. The Biden budget has two noteworthy forecasts: 2023 and beyond GDP of below 2% and negative real rates. Let’s hope that the stimulus, productivity gains, cash on sidelines, and the expanding economy all lead to better outcomes versus those forecasts. Infrastructure negotiations continue as the bid/ask remains $700b apart, and focus is on “new” money spent, recycling un-spent COVID-19 money, and corporate tax rates. Repeat reconciliation is facing a bottleneck as a straightforward ruling by Senate Parliamentarian Elizabeth MacDonough makes a single reconciliation per fiscal year look more likely.
4. The Virus. On account of the Freedom of Information Act (FOIA) a whole treasure trove of emails from Anthony Fauci over the past year has been released. This has re-centered the discussion on the virus’s origins, mask efficacy, and more. In the meantime, the rest of world vaccination effort is in full swing, and Goldman Sachs estimates that 60-70% of the Emerging Market population will have some immunity by year end 2021. The rest of the world is at total vaccination rates similar to where the US was in the middle of February, which means that progress will likely happen quickly, as we saw in the US. Global cases have dropped 60% in the past month, and deaths are down 50% in that same time. This is a huge tailwind for international equities playing catch up, and the final rotation of value.
Price & Proof: The UK continues to move ahead with a Manufacturing PMI of 65.6 in May, with new orders at the quickest pace in 3 decades. 8 Emerging Market economies, ex China/Turkey, have Central Bank policy interest rates of 3%, which look to have bottomed. Inflation appears to have bottomed 6 months ago. These rates will likely rise as their economies are expanding and may lead to rising equity market prices going forward. Business travel is 70% below pre-pandemic but seems poised to change quickly. 47 out of 50 of American Airlines largest corporate clients are signaling that travel will resume.
Main Sector Rotation ETF’s (SECT) performance was +47.61% for the year ended May 31, 2021. The S&P 500 Total Return Index returned +40.32% and the Morningstar US Large Blend Category returned
1
+39.85% for the same period. For some additional perspective, during the year ended May 31, 2021, the MSCI USA Value Index was up +40.32% while the MSCI USA Growth Index was up +42.26%. In the 2nd and 3rd quarters of 2020, we made some changes in the portfolio to implement a barbell approach between value & cyclical areas on one side and growth at a reasonable price on the other. The portfolio has performed as we hoped it would, outperforming the benchmarks for the year ended May 31, 2021. The strongest positive contributions to the Fund’s performance came from its positions in broad Homebuilders (XHB, ITB), Semiconductors (SMH), and Financials (XLF) while its positions in Biotechnology (IBB), Consumer Staples (XLP) and Small Cap Tech (PSCT) have dragged on performance. As we head into the next year, SECT remains positioned with a barbell approach between value & cyclicals on one side and growth at a reasonable price on the other in order to take advantage of the ongoing economic recovery.
Main Thematic Innovation ETF’s (TMAT) performance was -7.80% from inception on January 28, 2021 through May 31, 2021. The MSCI All Country World Index returned +9.39% and the Morningstar US Fund Mid-Cap Growth Category returned +4.18% for the same period. The thematic space in general underwent a bit of a correction in the first months of 2021 as markets shifted away from the stay-at-home trade and looked to the re-opening trade. We feel that the themes we hold in the TMAT will play out over years rather than quarters, so we while we did revisit the holdings to be sure our investment thesis still holds, we did not make many significant changes to the portfolio in response to the performance. The strongest positive contributions to the Fund’s performance came from its positions in Cannabis (CNBS) and Pet Care (PAWZ) while its positions in Solar (TAN), Online Retail (ONLN) weighed on performance. As we head into the next year, the Fund remains positioned with a variety of themes that we feel have strong growth prospects at a reasonable price, large total addressable markets, and prospects for significant further market penetration.
We at Main Management ETF Advisors, LLC would like to thank you for being an investor and look forward to working with you in the coming year.
Glossary of Terms:
The 5 Year TIPS/Treasury Breakeven Rate – This is calculated as the difference between the 5 year treasury rate and the 5 year treasury inflation-indexed security rate. Market participants use this value as what they believe the expected inflation should be in the next 5 years, on average.
Source: YCharts.com
S&P 500 Total Return Index – The S&P 500 Total Return Index is widely regarded as the best single gauge of large-cap U.S. equities. There is over USD 11.2 trillion indexed or benchmarked to the index, with indexed assets comprising approximately USD 4.6 trillion of this total. The index includes 500 leading companies and covers approximately 80% of available market capitalization.
Source: SPGlobal.com
Morningstar US Large Blend Category – Large-blend portfolios are fairly representative of the overall US stock market in size, growth rates and price. Stocks in the top 70% of the capitalization of the US equity market are defined as large cap. The blend style is assigned to portfolios where neither growth nor value characteristics predominate. These portfolios tend to invest across the spectrum of US industries, and owing to their broad exposure, the portfolios’ returns are often similar to those of the S&P 500 Index
Source: Morningstar Report: Mutual Fund Data Definitions
Morningstar US Mid-Cap Growth Category – Mid-growth funds invest in stocks medium-sized companies that are projected to grow faster than other mid-cap stocks. The market capitalization range for U.S. mid-caps typically falls between $1 billion and $8 billion and represents 20% of the total capitalization of the U.S. equity market. Growth is defined based on fast growth (high growth rates for earnings, sales, book value, and cash flow) and high valuations (high price ratios and low dividend yields).
Source: Morningstar.com
2
MSCI USA Growth Index – The MSCI USA Growth Index captures large and mid cap securities exhibiting overall growth style characteristics in the US. The growth investment style characteristics for index construction are defined using five variables: long-term forward EPS growth rate, short-term forward EPS growth rate, current internal growth rate and long-term historical EPS growth trend and long-term historical sales per share growth trend.
Source: MSCI.com
MSCI USA Value Index – The MSCI USA Value Index captures large and mid cap US securities exhibiting overall value style characteristics. The value investment style characteristics for index construction are defined using three variables: book value to price, 12-month forward earnings to price and dividend yield.
Source: MSCI.com
MSCI ACWI Index – The MSCI ACWI Index, MSCI’s flagship global equity index, is designed to represent performance of the full opportunity set of large- and mid-cap stocks across 23 developed and 27 emerging markets. As of November 2020, it covers more than 3,000 constituents across 11 sectors and approximately 85% of the free float-adjusted market capitalization in each market. The index is built using MSCI’s Global Investable Market Index (GIMI) methodology, which is designed to take into account variations reflecting conditions across regions, marketcap sizes, sectors, style segments and combinations.
Source: MSCI.com
4892-NLD-6/10/2021
3
| MAIN SECTOR ROTATION ETF |
| PORTFOLIO REVIEW (Unaudited) |
| May 31, 2021 |
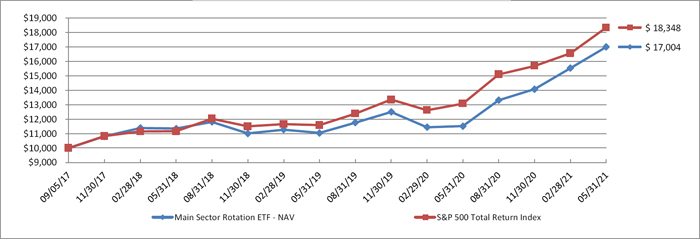
Average Total Return through May 31, 2021*, as compared to its benchmark:
| One Year | Since Inception (1) | |
| Main Sector Rotation ETF - NAV | 47.61% | 15.28% |
| Main Sector Rotation ETF - Market Price | 47.70% | 15.31% |
| S&P 500 Total Return Index (2) | 40.32% | 17.65% |
Comparison of the Change in Value of a $10,000 Investment
| * | The Fund’s past performance does not guarantee future results. The investment return and principal value of an investment in the Fund will fluctuate so that an investor’s shares, when redeemed, may be worth more or less than their original cost. The returns shown do not reflect the deduction of taxes that a shareholder would pay on Fund distributions or on the sales of Fund shares. Current performance of the Fund may be lower or higher than the performance quoted. Performance data current to the most recent month end may be obtained by visiting www.mainmgtetfs.com or by calling 1-866-383-9778. The Fund’s per share net asset value or NAV is the value of one share of the Fund as calculated in accordance with the standard formula for valuing fund shares. The NAV return is based on the NAV of the Fund and the market return is based on the market price per share of the Fund. Beginning November 2, 2020, market price returns are calculated using the closing price and account for distributions from the Fund. Prior to November 2, 2020, market price returns were calculated using the midpoint price and accounted for distributions from the Fund. The midpoint is the average of the bid-ask prices at 4:00 PM ET (when NAV is normally determined for most funds). Market and NAV returns assume that dividends and capital gain distributions have been reinvested in the Fund at Market Price and NAV, respectively. The Fund’s adviser has contractually agreed to reduce its fees and/or absorb expenses of the Fund, until at least July 31, 2031, to insure that total annual fund operating expenses after fee waiver and/or reimbursement (exclusive of any front-end or contingent deferred loads, taxes, brokerage fees and commissions, borrowing costs (such as interest and dividend expense on securities sold short), acquired fund fees and expenses, fees and expenses associated with investments in other collective investment vehicles or derivative instruments (including for example option and swap fees and expenses), or extraordinary expenses such as litigation (which may include indemnification of Fund officers and Trustees, contractual indemnification of Fund service providers (other than the adviser))) will not exceed 0.65% of the Fund’s average daily net assets. These fee waivers and expense reimbursements are subject to possible recoupment by the adviser from the Fund in future years (within the three years from the time the fees were waived or reimbursed), if such recoupment can be achieved within the lesser of the foregoing expense limits or those in place at the time of recapture. This agreement may be terminated only by the Board of Trustees on 60 days’ written notice to the adviser. The Fund’s total annual operating expenses are 0.80% including acquired fund fees and expenses per the September 28, 2020 Prospectus. |
| (1) | As of the close of business on the day of commencement of operations on September 5, 2017. |
| (2) | The S&P 500 Total Return Index is an unmanaged free-float capitalization-weighted index which measures the performance of 500 large-cap common stocks actively traded in the United States. Index returns assume reinvestment of dividends. Investors may not invest in the Index directly; unlike the Fund’s returns, the Index does not reflect any fees or expenses. |
| Portfolio Composition as of May 31, 2021 | ||||
| Holdings By Asset Type | % of Net Assets | |||
| Exchange Traded Funds | 97.7 | % | ||
| Money Market Funds - Securities Lending Collateral | 10.8 | % | ||
| Liabilities In Excess of Other Assets | (8.5 | )% | ||
| 100.0 | % | |||
Please refer to the Portfolio of Investments in this annual report for a detailed listing of the Fund’s holdings.
4
| MAIN THEMATIC INNOVATION ETF |
| PORTFOLIO REVIEW (Unaudited) |
| May 31, 2021 |
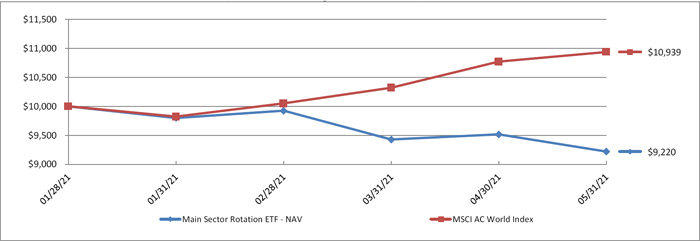
Average Total Return through May 31, 2021*, as compared to its benchmark:
| Since Inception (1) | |
| Main Thematic Innovation ETF - NAV | (7.80)% |
| Main Thematic Innovation ETF - Market Price | (7.84)% |
| MSCI AC World Index (2) | 9.39% |
Comparison of the Change in Value of a $10,000 Investment
| * | The Fund’s past performance does not guarantee future results. The investment return and principal value of an investment in the Fund will fluctuate so that an investor’s shares, when redeemed, may be worth more or less than their original cost. The returns shown do not reflect the deduction of taxes that a shareholder would pay on Fund distributions or on the sales of Fund shares. Current performance of the Fund may be lower or higher than the performance quoted. Performance data current to the most recent month end may be obtained by visiting www.mainmgtetfs.com or by calling 1-866-383-9778. The Fund’s per share net asset value or NAV is the value of one share of the Fund as calculated in accordance with the standard formula for valuing fund shares. The NAV return is based on the NAV of the Fund and the market return is based on the market price per share of the Fund. Market price returns are calculated using the closing price and account for distributions from the Fund. Market and NAV returns assume that dividends and capital gain distributions have been reinvested in the Fund at Market Price and NAV, respectively. The Fund’s adviser has contractually agreed to reduce its fees and/or absorb expenses of the Fund, until at least July 31, 2031, to insure that total annual fund operating expenses after fee waiver and/or reimbursement (exclusive of any front-end or contingent deferred loads, taxes, brokerage fees and commissions, borrowing costs (such as interest and dividend expense on securities sold short), acquired fund fees and expenses, fees and expenses associated with investments in other collective investment vehicles or derivative instruments (including for example option and swap fees and expenses), or extraordinary expenses such as litigation (which may include indemnification of Fund officers and Trustees, contractual indemnification of Fund service providers (other than the adviser))) will not exceed 0.99% of the Fund’s average daily net assets. These fee waivers and expense reimbursements are subject to possible recoupment by the adviser from the Fund in future years (within the three years from the time the fees were waived or reimbursed), if such recoupment can be achieved within the lesser of the foregoing expense limits or those in place at the time of recapture. This agreement may be terminated only by the Board of Trustees on 60 days’ written notice to the adviser. The Fund’s total annual operating expenses are 1.98% including acquired fund fees and expenses per the January 25, 2021 Prospectus. |
| (1) | As of the close of business on the day of commencement of operations on January 28, 2021. |
| (2) | The MSCI AC World Index is designed to represent performance of the full opportunity set of large- and mid-cap stocks across 23 developed and 27 emerging markets. Index returns assume reinvestment of dividends. Investors may not invest in the Index directly; unlike the Fund’s returns, the Index does not reflect any fees or expenses. |
| Portfolio Composition as of May 31, 2021 | ||||
| Holdings By Asset Type | % of Net Assets | |||
| Exchange Traded Funds | 97.8 | % | ||
| Money Market Funds - Securities Lending Collateral | 15.2 | % | ||
| Liabilities In Excess of Other Assets | (13.0 | )% | ||
| 100.0 | % | |||
Please refer to the Portfolio of Investments in this annual report for a detailed listing of the Fund’s holdings.
5
| MAIN SECTOR ROTATION ETF |
| PORTFOLIO OF INVESTMENTS |
| May 31, 2021 |
| Shares | Fair Value | |||||||
| EXCHANGE TRADED FUNDS - 97.7% | ||||||||
| BROAD MARKET - 8.0% | ||||||||
| 650,810 | iShares MSCI USA Value Factor ETF + | $ | 69,799,373 | |||||
| CONSUMER DISCRETIONARY - 15.1% | ||||||||
| 275,840 | Consumer Discretionary Select Sector SPDR Fund | 47,676,186 | ||||||
| 577,540 | iShares U.S. Home Construction ETF * | 41,536,677 | ||||||
| 560,300 | SPDR S&P Homebuilders ETF | 42,005,691 | ||||||
| 131,218,554 | ||||||||
| ENERGY - 5.9% | ||||||||
| 706,840 | Vanguard Energy ETF * | 51,429,678 | ||||||
| FINANCIAL - 12.7% | ||||||||
| 2,909,250 | Financial Select Sector SPDR Fund + | 110,522,407 | ||||||
| HEALTH CARE - 15.7% | ||||||||
| 754,250 | Health Care Select Sector SPDR Fund | 93,225,300 | ||||||
| 155,160 | iShares Nasdaq Biotechnology ETF * | 23,576,562 | ||||||
| 155,160 | SPDR S&P Biotech ETF * | 19,875,996 | ||||||
| 136,677,858 | ||||||||
| LARGE CAP - 15.3% | ||||||||
| 241,360 | Invesco QQQ Trust Series 1 | 80,597,345 | ||||||
| 767,180 | Schwab U.S. Large-Cap Value ETF * + | 52,996,794 | ||||||
| 133,594,139 | ||||||||
| SMALL CAP - 6.5% | ||||||||
| 249,980 | iShares Russell 2000 ETF * | 56,370,490 | ||||||
| TECHNOLOGY - 18.5% | ||||||||
| 405,140 | Invesco S&P SmallCap Information Technology ETF * | 55,094,989 | ||||||
| 543,060 | Technology Select Sector SPDR Fund + | 75,159,504 | ||||||
| 124,990 | VanEck Vectors Semiconductor ETF * | 31,146,258 | ||||||
| 161,400,751 | ||||||||
| TOTAL EXCHANGE TRADED FUNDS (Cost - $606,271,906) | 851,013,250 | |||||||
| MONEY MARKET FUNDS - 10.8% | ||||||||
| SECURITIES LENDING COLLATERAL - 10.8% | ||||||||
| 94,197,746 | Fidelity Money Market Government Portfolio - Institutional Class 0.01% (a)(b) | 94,197,746 | ||||||
| TOTAL MONEY MARKET FUNDS (Cost - $94,197,746) | ||||||||
| TOTAL INVESTMENTS - 108.5% (Cost - $700,469,652) | $ | 945,210,996 | ||||||
| LIABILITIES IN EXCESS OF OTHER ASSETS - (8.5)% | (74,114,252 | ) | ||||||
| NET ASSETS - 100.0% | $ | 871,096,744 | ||||||
ETF - Exchange Traded Fund
MSCI - Morgan Stanley Capital International
SPDR - Standard & Poor’s Depositary Receipt
| * | All or a portion of this security is on loan. The market value of loaned securities is $92,717,115. |
| + | All or a portion of this security is held as collateral for options. As of May 31, 2021, the total fair value of the securities held as collateral was $119,215,000. |
| (a) | Security was purchased with cash received as collateral for securities on loan at May 31, 2021. Total collateral had a value of $94,197,746 at May 31, 2021. |
| (b) | Rate disclosed is the seven day effective yield as of May 31, 2021. |
See accompanying notes to financial statements.
6
| MAIN THEMATIC INNOVATION ETF |
| PORTFOLIO OF INVESTMENTS |
| May 31, 2021 |
| Shares | Fair Value | |||||||
| EXCHANGE TRADED FUNDS - 97.8% | ||||||||
| HEALTHCARE - 14.8% | ||||||||
| 171,925 | ETFMG Alternative Harvest ETF | $ | 3,710,142 | |||||
| 50,830 | SPDR S&P Biotech ETF | 6,511,323 | ||||||
| 10,221,465 | ||||||||
| LARGE CAP - 5.8% | ||||||||
| 164,450 | KraneShares SSE STAR Market 50 Index ETF + | 4,027,380 | ||||||
| SPECIALTY - 2.6% | ||||||||
| 71,760 | Grayscale Ethereum Trust + | 1,809,070 | ||||||
| TECHNOLOGY - 7.5% | ||||||||
| 197,340 | Global X Cloud Computing ETF + | 5,162,414 | ||||||
| THEMATIC - 67.1% | ||||||||
| 130,065 | ARK Fintech Innovation ETF * | 6,481,139 | ||||||
| 161,460 | Global X Robotics & Artificial Intelligence ETF | 5,530,005 | ||||||
| 79,235 | Proshares Online Retail ETF | 5,999,674 | ||||||
| 79,235 | Proshares Pet Care ETF * | 6,159,729 | ||||||
| 109,135 | SPDR S&P Kensho New Economies Composite ETF * | 7,139,612 | ||||||
| 94,185 | SPDR S&P Kensho Clean Power ETF | 9,510,801 | ||||||
| 76,245 | VanEck Vectors Video Gaming and eSports ETF * | 5,392,046 | ||||||
| 46,213,006 | ||||||||
| TOTAL EXCHANGE TRADED FUNDS (Cost - $68,476,564) | 67,433,335 | |||||||
| MONEY MARKET FUNDS - 15.2% | ||||||||
| SECURITIES LENDING COLLATERAL - 15.2% | ||||||||
| 10,467,001 | Fidelity Money Market Government Portfolio - Institutional Class 0.01% (a) | 10,467,001 | ||||||
| TOTAL MONEY MARKET FUNDS (Cost - $10,467,001) | ||||||||
| TOTAL INVESTMENTS - 113.0% (Cost - $78,943,565) | $ | 77,900,336 | ||||||
| LIABILITIES IN EXCESS OF OTHER ASSETS - (13.0)% | (8,981,845 | ) | ||||||
| NET ASSETS - 100.0% | $ | 68,918,491 | ||||||
ETF - Exchange Traded Fund
SPDR - Standard & Poor’s Depositary Receipt
| + | Non-income producing security. |
| * | All or a portion of this security is on loan. The market value of loaned securities is $7,481,690. |
| (a) | Security was purchased with cash received as collateral for securities on loan at May 31, 2021. Total collateral had a value of $10,467,001 at May 31, 2021. |
| (b) | Rate disclosed is the seven day effective yield as of May 31, 2021. |
See accompanying notes to financial statements.
7
| MAIN ETFS |
| STATEMENTS OF ASSETS AND LIABILITIES |
| May 31, 2021 |
| Main Sector | Main Thematic | |||||||
| Rotation ETF | Innovation ETF | |||||||
| ASSETS | ||||||||
| Investment securities: | ||||||||
| At cost | $ | 700,469,652 | $ | 78,943,565 | ||||
| At value | $ | 945,210,996 | * | $ | 77,900,336 | * | ||
| Cash and cash equivalents | 9,623,212 | — | ||||||
| Cash held for collateral at broker for options | 9,559,340 | — | ||||||
| Cash held for collateral at custodian | 1,487,767 | — | ||||||
| Receivable for securities sold | 3,949,017 | 2,493,931 | ||||||
| Receivable for fund shares sold | 2,018,687 | 1,383,062 | ||||||
| TOTAL ASSETS | 971,849,019 | 81,777,329 | ||||||
| LIABILITIES | ||||||||
| Securities lending collateral payable upon return | �� | 94,197,746 | 10,467,001 | |||||
| Payable for fund shares redeemed | 4,042,403 | — | ||||||
| Payable for securities purchased | 1,971,963 | 1,353,177 | ||||||
| Investment advisory fees payable | 365,804 | 36,378 | ||||||
| Payable to related parties | 112,758 | 2,404 | ||||||
| Due to custodian | — | 985,204 | ||||||
| Other accrued expenses and other liabilities | 61,601 | 14,674 | ||||||
| TOTAL LIABILITIES | 100,752,275 | 12,858,838 | ||||||
| NET ASSETS | $ | 871,096,744 | $ | 68,918,491 | ||||
| NET ASSETS CONSIST OF: | ||||||||
| Paid in capital | $ | 639,151,824 | $ | 75,244,067 | ||||
| Accumulated earnings (loss) | 231,944,920 | (6,325,576 | ) | |||||
| NET ASSETS | $ | 871,096,744 | $ | 68,918,491 | ||||
| NET ASSET VALUE PER SHARE: | ||||||||
| Net Assets | $ | 871,096,744 | $ | 68,918,491 | ||||
| Shares of beneficial interest outstanding ($0 par value, unlimited shares authorized) | 21,550,000 | 2,990,000 | ||||||
| Net asset value (Net Assets ÷ Shares Outstanding), offering price and redemption price per share | $ | 40.42 | $ | 23.05 | ||||
| * | Includes fair value of securities on loan $92,717,115 and $7,481,690 for Main Sector Rotation ETF and Main Thematic Innovation ETF, respectively. |
See accompanying notes to financial statements.
8
| MAIN ETFS |
| STATEMENTS OF OPERATIONS |
| Main Sector Rotation ETF | Main Thematic Innovation ETF | |||||||
| For the Year Ended May 31, 2021 | For the Period Ended May 31, 2021 (a) | |||||||
| INVESTMENT INCOME | ||||||||
| Dividends | $ | 8,040,671 | $ | 21,821 | ||||
| Interest | 1,222 | — | ||||||
| Securities lending income | 393,341 | 832 | ||||||
| TOTAL INVESTMENT INCOME | 8,435,234 | 22,653 | ||||||
| EXPENSES | ||||||||
| Investment advisory fees | 3,301,367 | 111,180 | ||||||
| Administrative services fees | 318,088 | 3,177 | ||||||
| Custodian fees | 63,471 | 1,343 | ||||||
| Professional fees | 37,191 | 11,684 | ||||||
| Printing and postage expenses | 31,919 | 10,543 | ||||||
| Compliance officer fees | 30,922 | 2,843 | ||||||
| Insurance expense | 29,954 | — | ||||||
| Trustees fees and expenses | 24,958 | 3,184 | ||||||
| Transfer agent fees | 18,444 | 1,475 | ||||||
| Interest expense | 381 | — | ||||||
| Other expenses | 17,444 | 2,448 | ||||||
| TOTAL EXPENSES | 3,874,139 | 147,877 | ||||||
| NET INVESTMENT INCOME (LOSS) | 4,561,095 | (125,224 | ) | |||||
| REALIZED AND UNREALIZED GAIN (LOSS) ON INVESTMENTS | ||||||||
| Net realized gain (loss) on: | ||||||||
| Investments | 45,829,883 | (5,165,093 | ) | |||||
| Options written | 8,003,911 | — | ||||||
| Net realized gain on in-kind redemptions | 20,186,501 | — | ||||||
| Net change in unrealized appreciation (depreciation) on: | ||||||||
| Investments | 170,468,584 | (1,043,229 | ) | |||||
| Options written | 2,288,179 | — | ||||||
| NET REALIZED AND UNREALIZED GAIN (LOSS) ON INVESTMENTS | 246,777,058 | (6,208,322 | ) | |||||
| NET INCREASE (DECREASE) IN NET ASSETS RESULTING FROM OPERATIONS | $ | 251,338,153 | $ | (6,333,546 | ) | |||
| (a) | The Main Thematic Innovation ETF commenced operations on January 28, 2021. |
See accompanying notes to financial statements.
9
| MAIN SECTOR ROTATION ETF |
| STATEMENTS OF CHANGES IN NET ASSETS |
| For the | For the | |||||||
| Year Ended | Year Ended | |||||||
| May 31, 2021 | May 31, 2020 | |||||||
| FROM OPERATIONS: | ||||||||
| Net investment income | $ | 4,561,095 | $ | 6,749,721 | ||||
| Net realized gain (loss) from investments, options purchased, options written and in-kind redemptions | 74,020,295 | (51,897,566 | ) | |||||
| Net change in unrealized appreciation on investments and options written | 172,756,763 | 60,007,987 | ||||||
| Net increase in net assets resulting from operations | 251,338,153 | 14,860,142 | ||||||
| DISTRIBUTIONS TO SHAREHOLDERS: | ||||||||
| Total distributions paid | (7,204,110 | ) | (6,830,425 | ) | ||||
| Decrease in net assets resulting from distributions to shareholders | (7,204,110 | ) | (6,830,425 | ) | ||||
| FROM SHARES OF BENEFICIAL INTEREST: | ||||||||
| Proceeds from shares sold | 161,886,162 | 133,782,652 | ||||||
| Payments for shares redeemed | (69,988,493 | ) | (49,381,238 | ) | ||||
| Net increase in net assets resulting from shares of beneficial interest | 91,897,669 | 84,401,414 | ||||||
| TOTAL INCREASE IN NET ASSETS | 336,031,712 | 92,431,131 | ||||||
| NET ASSETS | ||||||||
| Beginning of Year | 535,065,032 | 442,633,901 | ||||||
| End of Year | $ | 871,096,744 | $ | 535,065,032 | ||||
| SHARE ACTIVITY | ||||||||
| Shares sold | 4,450,000 | 4,750,000 | ||||||
| Shares redeemed | (2,200,000 | ) | (1,850,000 | ) | ||||
| Net increase in shares of beneficial interest outstanding | 2,250,000 | 2,900,000 | ||||||
See accompanying notes to financial statements.
10
| MAIN THEMATIC INNOVATION ETF |
| STATEMENT OF CHANGES IN NET ASSETS |
| For the | ||||
| Period Ended | ||||
| May 31, 2021 (a) | ||||
| FROM OPERATIONS: | ||||
| Net investment loss | $ | (125,224 | ) | |
| Net realized loss from investments | (5,165,093 | ) | ||
| Net change in unrealized depreciation on investments | (1,043,229 | ) | ||
| Net decrease in net assets resulting from operations | (6,333,546 | ) | ||
| FROM SHARES OF BENEFICIAL INTEREST: | ||||
| Proceeds from shares sold | 75,252,037 | |||
| Net increase in net assets resulting from shares of beneficial interest | 75,252,037 | |||
| TOTAL INCREASE IN NET ASSETS | 68,918,491 | |||
| NET ASSETS | ||||
| Beginning of Period | — | |||
| End of Period | $ | 68,918,491 | ||
SHARE ACTIVITY | ||||
| Shares sold | 2,990,000 | |||
| Net increase in shares of beneficial interest outstanding | 2,900,000 | |||
| (a) | The Main Thematic Innovation ETF commenced operations on January 28, 2021. |
See accompanying notes to financial statements.
11
| MAIN SECTOR ROTATION ETF |
| FINANCIAL HIGHLIGHTS |
| Per Share Data and Ratios for a Share of Beneficial Interest Outstanding Throughout Each Period |
| For the | For the | For the | For the | |||||||||||||
| Year Ended | Year Ended | Year Ended | Period Ended | |||||||||||||
| May 31, 2021 | May 31, 2020 | May 31, 2019 | May 31, 2018 (1) | |||||||||||||
| Net asset value, beginning of period | $ | 27.72 | $ | 26.99 | $ | 28.21 | $ | 25.00 | ||||||||
| Income from investment operations: | ||||||||||||||||
| Net investment income (2) | 0.24 | 0.38 | 0.27 | 0.12 | ||||||||||||
| Net realized and unrealized gain (loss) on investments | 12.83 | 0.74 | (1.05 | ) | 3.25 | |||||||||||
| Total from investment operations | 13.07 | 1.12 | (0.78 | ) | 3.37 | |||||||||||
| Less distributions from: | ||||||||||||||||
| Net investment income | (0.37 | ) | (0.39 | ) | (0.20 | ) | (0.16 | ) | ||||||||
| Net realized gains | — | — | (0.24 | ) | — | |||||||||||
| Total distributions | (0.37 | ) | (0.39 | ) | (0.44 | ) | (0.16 | ) | ||||||||
| Net asset value, end of period | $ | 40.42 | $ | 27.72 | $ | 26.99 | $ | 28.21 | ||||||||
| Market price, end of period * | $ | 40.46 | $ | 27.73 | $ | 26.98 | $ | 28.30 | ||||||||
| Total return (3) | 47.61 | % | 4.28 | % | (2.68 | )% | 13.52 | % (4) | ||||||||
| Net assets, at end of period (000s) | $ | 871,097 | $ | 535,065 | $ | 442,634 | $ | 328,621 | ||||||||
| Ratio of expenses to average net assets (6) | 0.59 | % | 0.60 | % | 0.61 | % | 0.61 | % (5) | ||||||||
| Ratio of net investment income to average net assets (7) | 0.69 | % | 1.32 | % | 1.00 | % | 0.58 | % (5) | ||||||||
| Portfolio Turnover Rate (8) | 27 | % | 76 | % | 61 | % | 12 | % (4) | ||||||||
| (1) | The Main Sector Rotation ETF commenced operations on September 5, 2017. |
| (2) | Per share amounts calculated using the average shares method, which more appropriately presents the per share data for the period. |
| (3) | Total returns are historical in nature and assume changes in share price, reinvestment of all dividends and distributions, if any. |
| (4) | Not annualized. |
| (5) | Annualized. |
| (6) | Does not include the expenses of other investment companies in which the Fund invests. |
| (7) | Recognition of investment income by the Fund is affected by the timing and declaration of dividends by the underlying investment companies in which the Fund invests. |
| (8) | Portfolio turnover rate excludes portfolio securities received or delivered as a result of processing capital share transactions in Creation Units. (Note 7) |
| * | Market Price is determined by using the midpoint between the highest bid and the lowest offer on the primary stock exchange on which shares of the Fund are listed for trading, as of the time that the Fund’s NAV is calculated. |
See accompanying notes to financial statements.
12
| MAIN THEMATIC INNOVATION ETF |
| FINANCIAL HIGHLIGHTS |
| Per Share Data and Ratios for a Share of Beneficial Interest Outstanding Throughout the Period |
| For the | ||||
| Period Ended | ||||
| May 31, 2021 (1) | ||||
| Net asset value, beginning of period | $ | 25.00 | ||
| Income from investment operations: | ||||
| Net investment loss (2) | (0.06 | ) | ||
| Net realized and unrealized loss on investments | (1.89 | ) | ||
| Total from investment operations | (1.95 | ) | ||
| Net asset value, end of period | $ | 23.05 | ||
| Market price, end of period * | $ | 23.04 | ||
| Total return (3) | (7.80) | % (4) | ||
| Net assets, at end of period (000s) | $ | 68,918 | ||
| Ratio of expenses to average net assets (6) | 0.86 | % (5) | ||
| Ratio of net investment loss to average net assets (7) | (0.72 | )% (5) | ||
| Portfolio Turnover Rate (8) | 60 | % (4) | ||
| (1) | The Main Thematic Innovation ETF commenced operations on January 28, 2021. |
| (2) | Per share amounts calculated using the average shares method, which more appropriately presents the per share data for the period. |
| (3) | Total returns are historical in nature and assume changes in share price, reinvestment of all dividends and distributions, if any. |
| (4) | Not annualized. |
| (5) | Annualized. |
| (6) | Does not include the expenses of other investment companies in which the Fund invests. |
| (7) | Recognition of investment income by the Fund is affected by the timing and declaration of dividends by the underlying investment companies in which the Fund invests. |
| (8) | Portfolio turnover rate excludes portfolio securities received or delivered as a result of processing capital share transactions in Creation Units. (Note 7) |
| * | Market Price is determined by using the midpoint between the highest bid and the lowest offer on the primary stock exchange on which shares of the Fund are listed for trading, as of the time that the Fund’s NAV is calculated. |
See accompanying notes to financial statements.
13
| MAIN ETFS |
| NOTES TO FINANCIAL STATEMENTS |
| May 31, 2021 |
| 1. | ORGANIZATION |
The Main Sector Rotation ETF and the Main Thematic Innovation ETF (the “Funds”) are each a diversified series of Northern Lights Fund Trust IV (the “Trust”), a trust organized under the laws of the State of Delaware on June 2, 2015, and registered under the Investment Company Act of 1940, as amended (the “1940 Act”), as open-end management investment companies. The Main Sector Rotation ETF commenced operations on September 5, 2017. The Main Thematic Innovation ETF commenced operations on January 28, 2021.
The Funds’ investment objectives are as follows:
Main Sector Rotation ETF – seeks to outperform the S&P 500 Total Return Index in rising markets while limiting losses during periods of decline.
Main Thematic Innovation ETF – seeks to outperform the MSCI ACWI Index in rising markets while limiting losses during periods of decline.
| 2. | SIGNIFICANT ACCOUNTING POLICIES |
The following is a summary of significant accounting policies followed by the Funds in preparation of their financial statements. These policies are in conformity with accounting principles generally accepted in the United States of America (“GAAP”). The preparation of financial statements requires management to make estimates and assumptions that affect the reported amounts of assets and liabilities and disclosure of contingent assets and liabilities at the date of the financial statements and the reported amounts of increase and decrease in net assets from operations during the reporting period. Actual results could differ from those estimates. The Funds are investment companies and accordingly follow the investment company accounting and reporting guidance of the Financial Accounting Standards Board (“FASB”) Accounting Standards Codification Topic 946 “Financial Services – Investment Companies”.
Security Valuation – Securities listed on an exchange are valued at the last reported sale price at the close of the regular trading session of the exchange on the business day the value is being determined, or in the case of securities listed on NASDAQ at the NASDAQ Official Closing Price (“NOCP”). In the absence of a sale, such securities shall be valued at the mean between the current bid and ask prices on the day of valuation. Options contracts listed on a securities exchange or board of trade for which market quotations are readily available shall be valued at the last quoted sales price or, in the absence of a sale, at the mean between the current bid and ask prices on the day of valuation. Option contracts not listed on a securities exchange or board of trade for which over-the-counter market quotations are readily available shall be valued at the mean between the current bid and ask prices on the day of valuation. Index options shall be valued at the mean between the current bid and ask prices on the day of valuation. Investments in open-end investment companies are- valued at net asset value, including the short-term investment currently held. Debt securities (other than short term obligations) are valued each day by an independent pricing service approved by the Board of Trustees (the “Board”) based on methods which include consideration of: yields or prices of securities of comparable quality, coupon, maturity and type, indications as to values from dealers,- and general market conditions or market quotations from a major market maker in the securities. Short term debt obligations, having 60 days or less remaining until maturity, at time of purchase, may be valued at amortized cost.
The Funds may hold securities, such as private investments, interests in commodity pools, other non-traded securities or temporarily illiquid securities, for which market quotations are not readily available or are determined to be unreliable. These securities will be valued using the “fair value” procedures approved by the Board. The Board has delegated execution of these procedures to a fair value committee composed of one or more representatives from each of the (i) Trust, (ii) administrator, and (iii) adviser. The committee may also enlist third party consultants such as a valuation specialist from a public accounting firm, valuation consultant, or financial officer of a security issuer on an as-needed basis to assist in determining a security-specific fair value.
14
| MAIN ETFS |
| NOTES TO FINANCIAL STATEMENTS (Continued) |
| May 31, 2021 |
Valuation of Underlying Investment Companies – The Funds may invest in portfolios of open-end or closed-end investment companies (the “Underlying Funds”). Mutual funds are valued at their respective net asset values as reported by such investment companies. Exchange-traded funds (“ETFs”) are valued at the lasted reported sales price or official closing price. Open-end investment companies value securities in their portfolios for which market quotations are readily available at their market values (generally the last reported sale price) and all other securities and assets at their fair value to the methods established by the board of directors of the open-end funds. The shares of many closed-end investment companies and ETFs, after their initial public offering, frequently trade at a price per share, which is different than the net asset value per share. The difference represents a market premium or market discount of such shares. There can be no assurances that the market discount or market premium on shares of any closed-end investment company or ETF purchased by the Funds will not change.
Fair Valuation Process – As noted above, the fair value committee is composed of one or more representatives from each of the (i) Trust, (ii) administrator, and (iii) adviser. The applicable investments are valued collectively via inputs from each of these groups. For example, fair value determinations are required for the following securities: (i) securities for which market quotations are insufficient or not readily available on a particular business day (including securities for which there is a short and temporary lapse in the provision of a price by the regular pricing source); (ii) securities for which, in the judgment of the adviser, the prices or values available do not represent the fair value of the instrument. Factors which may cause the adviser to make such a judgment include, but are not limited to, the following: only a bid price or an asked price is available; the spread between bid and asked prices is substantial; the frequency of sales; the thinness of the market; the size of reported trades; and actions of the securities markets, such as the suspension or limitation of trading; (iii) securities determined to be illiquid; (iv) securities with respect to which an event that will affect the value thereof has occurred (a “significant event”) since the closing prices were established on the principal exchange on which they are traded, but prior to the Funds’ calculation of its net asset value. Restricted or illiquid securities, such as private investments or non-traded securities are valued via inputs from the adviser based upon the current bid for the security from two or more independent dealers or other parties reasonably familiar with the facts and circumstances of the security (who should take into consideration all relevant factors as may be appropriate under the circumstances). If the adviser is unable to obtain a current bid from such independent dealers or other independent parties, the fair value committee shall determine the fair value of such security using the following factors: (i) the type of security; (ii) the cost at date of purchase; (iii) the size and nature of the Funds’ holdings; (iv) the discount from market value of unrestricted securities of the same class at the time of purchase and subsequent thereto; (v) information as to any transactions or offers with respect to the security; (vi) the nature and duration of restrictions on disposition of the security and the existence of any registration rights; (vii) how the yield of the security compares to similar securities of companies of similar or equal creditworthiness; (viii) the level of recent trades of similar or comparable securities; (ix) the liquidity characteristics of the security; (x) current market conditions; and (xi) the market value of any securities into which the security is convertible or exchangeable.
The Funds utilize various methods to measure the fair value of its investments on a recurring basis. GAAP establishes a hierarchy that prioritizes inputs to valuation methods. The three levels of input are:
Level 1 – Unadjusted quoted prices in active markets for identical assets and liabilities that the Funds have the ability to access.
Level 2 – Observable inputs other than quoted prices included in Level 1 that are observable for the asset or liability, either directly or indirectly. These inputs may include quoted prices for the identical instrument in an inactive market, prices for similar instruments, interest rates, prepayment speeds, credit risk, yield curves, default rates and similar data.
Level 3 – Unobservable inputs for the asset or liability, to the extent relevant observable inputs are not available, representing the Funds’ own assumptions about the assumptions a market participant would use in valuing the asset or liability, and would be based on the best information available.
15
| MAIN ETFS |
| NOTES TO FINANCIAL STATEMENTS (Continued) |
| May 31, 2021 |
The availability of observable inputs can vary from security to security and is affected by a wide variety of factors, including, for example, the type of security, whether the security is new and not yet established in the marketplace, the liquidity of markets, and other characteristics particular to the security. To the extent that valuation is based on models or inputs that are less observable or unobservable in the market, the determination of fair value requires more judgment. Accordingly, the degree of judgment exercised in determining fair value is greatest for instruments categorized in Level 3.
The inputs used to measure fair value may fall into different levels of the fair value hierarchy. In such cases, for disclosure purposes, the level in the fair value hierarchy within which the fair value measurement falls in its entirety, is determined based on the lowest level input that is significant to the fair value measurement in its entirety.
The inputs or methodology used for valuing securities are not necessarily an indication of the risk associated with investing in those securities. The following tables summarize the inputs used as of May 31, 2021 for the Funds’ investments measured at fair value:
| Main Sector Rotation ETF | ||||||||||||||||
| Assets * | Level 1 | Level 2 | Level 3 | Total | ||||||||||||
| Exchange Traded Funds | $ | 851,013,250 | $ | — | $ | — | $ | 851,013,250 | ||||||||
| Money Market Funds - Securities Lending Collateral | 94,197,746 | — | — | 94,197,746 | ||||||||||||
| Total | $ | 945,210,996 | $ | — | $ | — | $ | 945,210,996 | ||||||||
| Main Thematic Innovation ETF | ||||||||||||||||
| Assets * | Level 1 | Level 2 | Level 3 | Total | ||||||||||||
| Exchange Traded Funds | $ | 67,433,335 | $ | — | $ | — | $ | 67,433,335 | ||||||||
| Money Market Funds - Securities Lending Collateral | 10,467,001 | — | — | 10,467,001 | ||||||||||||
| Total | $ | 77,900,336 | $ | — | $ | — | $ | 77,900,336 | ||||||||
The Funds did not hold any Level 2 or Level 3 securities during the period.
| * | Please refer to the Portfolio of Investments for industry classifications. |
Option Transactions – When a Fund writes a call option, an amount equal to the premium received is included in the Statements of Assets and Liabilities as a liability. The amount of the liability is subsequently marked -to-market to reflect the current market value of the option. If an option expires on its stipulated expiration date or if a Fund enters into a closing purchase transaction, a gain or loss is realized. If a written call option is exercised, a gain or loss is realized for the sale of the underlying security and the proceeds from the sale are increased by the premium originally received. As writer of an option, a Fund has no control over whether the option will be exercised and, as a result, retains the market risk of an unfavorable change in the price of the security underlying the written option.
The Funds may purchase put and call options. A call option on a security is a contract that gives the holder of the option, in return for a premium, the right, but not the obligation, to buy from the writer of the option the security underlying the option at a specified exercise or “strike” price by or before the contract’s expiration. Put options are purchased to hedge against a decline in the value of securities held in the Funds’ portfolios. If such a decline occurs, the put options will permit the Funds to sell the securities underlying such options at the exercise price, or to close out the options at a profit. The premium paid for a put or call option plus any transaction costs will reduce the benefit, if any, realized by the Funds upon exercise of the option, and, unless the price of the underlying security rises or declines sufficiently, the option may expire worthless to the Funds. In addition, in the event that the price of the security in connection with which an option was purchased moves in a direction favorable to the Funds, the benefits realized by the Funds as a result of such favorable movement will be reduced by the amount of the premium paid for the option and related transaction costs. Written and purchased options are non-income producing securities. With purchased options, there is minimal counterparty risk to the Funds since these options are exchange traded and the exchange’s clearinghouse, as counterparty to all exchange traded options, guarantees against a possible default.
16
| MAIN ETFS |
| NOTES TO FINANCIAL STATEMENTS (Continued) |
| May 31, 2021 |
Exchange Traded Funds – The Funds may invest in ETFs. ETFs are a type of fund bought and sold on a securities exchange. An ETF trades like common stock and represents a portfolio of securities. The Funds may purchase an ETF to gain exposure to a portion of the U.S. or a foreign market. The risks of owning an ETF generally reflect the risks of owning the underlying securities they are designed to track, although the lack of liquidity on an ETF could result in it being more volatile. Additionally, ETFs have fees and expenses that reduce their value.
Derivatives Risk – The Funds’ use of derivative instruments involves risks different from, or possibly greater than, the risks associated with investing directly in securities and other traditional investments. These risks include (i) the risk that the counterparty to a derivative transaction may not fulfill its contractual obligations; (ii) risk of mispricing or improper valuation; and (iii) the risk that changes in the value of the derivative may not correlate perfectly with the underlying asset, rate or index. Derivative prices are highly volatile and may fluctuate substantially during a short period of time. Such prices are influenced by numerous factors that affect the markets, including, but not limited to: changing supply and demand relationships; government programs and policies; national and international political and economic events, changes in interest rates, inflation and deflation and changes in supply and demand relationships. Trading derivative instruments involves risks different from, or possibly greater than, the risks associated with investing directly in securities including:
Leverage and Volatility Risk: Derivative contracts ordinarily have leverage inherent in their terms. The low margin deposits normally required in trading derivatives, including options, permit a high degree of leverage. Accordingly, a relatively small price movement may result in an immediate and substantial loss to the Funds. The use of leverage may also cause the Funds to liquidate portfolio positions when it would not be advantageous to do so in order to satisfy its obligations or to meet collateral segregation requirements. The use of leveraged derivatives can magnify the Funds’ potential for gain or loss and, therefore, amplify the effects of market volatility on the Funds’ share price.
Options Risk: There are risks associated with the sale and purchase of call and put options. As a seller (writer) of a put option, the Funds will tend to lose money if the value of the reference index or security falls below the strike price. As the seller (writer) of a call option, the Funds may experience lower returns if the value of the reference index or security rises above the strike price.
Index Call Option Risk: Because the exercise of index options is settled in cash, sellers of index call options, such as the Funds, cannot provide in advance for their potential settlement obligations by acquiring and holding the underlying securities. The Funds bears a risk that the value of the securities held by the Funds will vary from the value of the index and relative to the written index call option positions. Accordingly, the Funds may incur losses on the index call options that it has sold that exceed gains on other securities in its portfolio. The value of index options written by the Funds, which will be priced daily, will be affected by changes in the value of and dividend rates of the underlying common stocks in the index, changes in the actual or perceived volatility of the stock market and the remaining time to the options’ expiration. The value of the index options also may be adversely affected if the market for the index options becomes less liquid or smaller.
As the writer of an index call option, the Funds foregoe, during the option’s life, the opportunity to profit from increases in the market value of the index underlying the call option above the sum of the premium and the strike price of the option, but will retain the risk of loss should the market value of the index underlying the call option decline. The purchaser of the index call option has the right to any appreciation in the value of the underlying index over the exercise price upon the exercise of the call option or the expiration date.
Security Transactions and Related Income – Security transactions are accounted for on the trade date. Interest income is recognized on an accrual basis. Discounts are accreted and premiums are amortized on securities purchased over the lives of the respective securities using the effective yield method. Dividend income and
17
| MAIN ETFS |
| NOTES TO FINANCIAL STATEMENTS (Continued) |
| May 31, 2021 |
expense are recorded on the ex-dividend date. Realized gains or losses from sales of securities are determined by comparing the identified cost of the security lot sold with the net sales proceeds.
Distributions to Shareholders – Dividends from net investment income, if any, are declared and paid quarterly. Distributable net realized capital gains, if any, are declared and distributed annually. Dividends from net investment income and distributions from net realized gains are determined in accordance with federal income tax regulations, which may differ from GAAP. These “book/tax” differences are considered either temporary (e.g., deferred losses, capital loss carryforwards, etc.) or permanent in nature. To the extent these differences are permanent in nature, such amounts are reclassified within the composition of net assets based on their federal tax-basis treatment; temporary differences do not require reclassification. Any such reclassifications will have no effect on net assets, results of operations, or net asset values per share of the Funds. Dividends that represent long term capital gain distributions from underlying investments are reclassified out of dividend income and presented separately for financial reporting purposes. The Funds hold certain investments which pay dividends to their shareholders based upon available funds from operations. Distributions received from investments in securities that represent a return of capital or long-term capital gains are recorded as a reduction of the cost of investments or as a realized gain, respectively.
Federal Income Taxes – The Funds intend to continue to comply with the requirements of the Internal Revenue Code applicable to regulated investment companies and to distribute all of its taxable income to its shareholders. Therefore, no provision for federal income tax is required.
The Funds recognize the tax benefits of uncertain tax positions only where the position is “more likely than not” to be sustained assuming examination by tax authorities. Management has analyzed the Funds’ tax positions and has concluded that no liability for unrecognized tax benefits should be recorded related to uncertain tax positions taken in the 2019 and 2020 tax returns for the Main Sector Rotation ETF or expected to be taken in each Fund’s 2021 tax returns. The Funds identified its major tax jurisdictions as U.S. federal, Ohio and foreign jurisdictions where the Funds make significant investments. The Funds recognize interest and penalties, if any, related to unrecognized tax benefits as income tax expenses, in the Statements of Operations. For the year or period ended May 31, 2021, the Funds did not incur any interest or penalties. The Funds are not aware of any tax positions for which it is reasonably possible that the total amounts of unrecognized tax benefits will change materially in the next twelve months.
Expenses – Expenses of the Trust that are directly identifiable to a specific fund are charged to that fund. Expenses, which are not readily identifiable to a specific fund, are allocated in such a manner as deemed equitable (as determined by the Board), taking into consideration the nature and type of expense and the relative sizes of the funds in the Trust.
Indemnification – The Trust indemnifies its officers and trustees for certain liabilities that may arise from the performance of their duties to the Trust. Additionally, in the normal course of business, the Funds enter into contracts that contain a variety of representations and warranties and which provide general indemnities. The Funds’ maximum exposure under these arrangements is unknown, as this would involve future claims that may be made against the Funds that have not yet occurred. However, based on experience, the risk of loss due to these warranties and indemnities appears to be remote.
Cash and Cash Equivalents – Idle cash may be swept into various overnight demand deposits and is classified as cash and cash equivalents on the Statements of Assets and Liabilities. The Funds maintain cash in bank deposit account which, at times, may exceed United States federally insured limits. Amounts swept overnight are available on the next business day.
Securities Lending Risk – The Funds may lend portfolio securities to institutions, such as banks and certain broker-dealers. The Funds may experience a loss or delay in the recovery of its securities if the borrowing institution breaches its agreement with the Funds (see additional information at Note 8).
18
| MAIN ETFS |
| NOTES TO FINANCIAL STATEMENTS (Continued) |
| May 31, 2021 |
Cryptocurrency Risk – Cryptocurrency, often referred to as “virtual currency” or “digital currency,” operates as a decentralized, peer-to-peer financial exchange and value storage that is used like money. The Main Thematic Innovation ETF may have exposure to Ethereum, a cryptocurrency, indirectly through an investment in an investment vehicle. Cryptocurrencies operate without central authority or banks and is not backed by any government. Cryptocurrencies may experience very high volatility and related investment vehicles may be affected by such volatility. Cryptocurrency is not legal tender. Federal, state or foreign governments may restrict the use and exchange of cryptocurrency, and regulation in the U.S. is still developing. Cryptocurrency exchanges may stop operating or permanently shut down due to fraud, technical glitches, hackers or malware. Currently, there is relatively small use of cryptocurrencies in the retail and commercial marketplace in comparison to the relatively large use of cryptocurrencies by speculators, thus contributing to price volatility that could adversely affect the Main Thematic Innovation ETF’s investment in cryptocurrency funds. Cryptocurrencies transactions are irrevocable and stolen or incorrectly transferred cryptocurrency tokens may be irretrievable. As a result, any incorrectly executed cryptocurrency transactions could adversely affect the value of the Fund’s investment in cryptocurrency funds.
| 3. | INVESTMENT TRANSACTIONS |
For the year or period ended May 31, 2021, cost of purchases and proceeds from sales of portfolio securities (excluding in-kind transactions and short-term investments), amounted to the following:
| Purchases | Sales | |||||||
| Main Sector Rotation ETF | $ | 176,934,915 | $ | 173,780,023 | ||||
| Main Thematic Innovation ETF | 29,209,741 | 26,134,313 | ||||||
For the year or period ended May 31, 2021, cost of purchases and proceeds from sales of portfolio securities for in-kind transactions, amounted to the following:
| Purchases | Sales | |||||||
| Main Sector Rotation ETF | $ | 157,479,642 | $ | 68,734,131 | ||||
| Main Thematic Innovation ETF | 70,566,395 | — | ||||||
| 4. | INVESTMENT ADVISORY AGREEMENT AND TRANSACTIONS WITH RELATED PARTIES |
Main Management ETF Advisors, LLC serves as the investment adviser (the “Adviser”) to the Fund’s. Pursuant to an investment advisory agreement with the Trust, on behalf of each Fund, the Adviser, under the oversight of the Board, oversees the daily operations of the Funds, manages the Funds’ portfolios, and supervises the performance of administrative and professional services provided by others. As compensation for its services and the related expenses borne by the Adviser, the Funds pay the Adviser a management fee, computed and accrued daily and paid monthly, at an annual rate of 0.50% and 0.65% of the average daily net assets of the Main Sector Rotation ETF and Main Thematic Innovation ETF, respectively.
For the year or period ended May 31, 2021, the advisory fees incurred by each of the Funds were as follows:
| Advisory Fee | ||||
| Main Sector Rotation ETF | $ | 3,301,367 | ||
| Main Thematic Innovation ETF | 111,180 | |||
The Adviser has contractually agreed to reduce its fees and/or absorb expenses of the Funds, until at least July 31, 2031, to insure that total annual fund operating expenses after fee waiver and/or reimbursement (exclusive of any front-end or contingent deferred loads, taxes, brokerage fees and commissions, borrowing costs (such as interest and dividend expense on securities sold short), acquired fund fees and expenses, fees and expenses associated with investments in other collective investment vehicles or derivative instruments (including for example option and swap fees and expenses), or extraordinary expenses such as litigation (which may include
19
| MAIN ETFS |
| NOTES TO FINANCIAL STATEMENTS (Continued) |
| May 31, 2021 |
indemnification of Fund officers and Trustees, contractual indemnification of Fund service providers (other than the Adviser))) will not exceed 0.65% and 0.99% of the average daily net assets of the Main Sector Rotation ETF and Main Thematic Innovation ETF, respectively. These fee waivers and expense reimbursements are subject to possible recoupment by the Adviser from the Funds in future years (within the three years from the time the fees were waived or reimbursed), if such recoupment can be achieved within the lesser of the foregoing expense limits or those in place at the time of recapture. This agreement may be terminated only by the Trust’s Board of Trustees on 60 days’ written notice to the Adviser. During the year or period ended May 31, 2021, the Adviser did not waive any fees or reimburse expenses pursuant to this agreement. As of May 31, 2021, there are no previously waived advisory fees subject to recapture.
Distributor – The distributor of the Funds is Northern Lights Distributors, LLC (“NLD” or the “Distributor”). The Board has adopted, on behalf of the Funds, the Trust’s Master Distribution and Shareholder Servicing Plan as amended (the “Plan”), pursuant to Rule 12b-1 under the 1940 Act, to pay for certain distribution activities and shareholder services related to Fund shares. Under the Plan, the Funds may pay 0.25% per year of the average daily net assets of each Fund’s shares for such distribution and shareholder service activities. As of May 31, 2021, the Plan has not been activated. For the year or period ended May 31, 2021, the Funds did not incur any distribution fees.
The Distributor acts as the Funds’ principal underwriter in a continuous public offering of each Fund’s shares and is an affiliate of Gemini Fund Services, LLC.
In addition, certain affiliates of the Distributor provide services to the Funds as follows:
Gemini Fund Services, LLC (“GFS”) – An affiliate of the Distributor, provides administration and fund accounting services to the Trust. Pursuant to separate servicing agreements with GFS, the Funds pay GFS customary fees for providing administration and fund accounting services to the Funds as shown in the Statements of Operations. Certain officers of the Trust are also officers of GFS, and are not paid any fees directly by the Funds for serving in such capacities.
Northern Lights Compliance Services, LLC (“NLCS”) – NLCS, an affiliate of GFS and the Distributor, provides a Chief Compliance Officer to the Trust, as well as related compliance services, pursuant to a consulting agreement between NLCS and the Trust. Under the terms of such agreement, NLCS receives customary fees from the Funds which are included in the compliance officer fees in the Statements of Operations.
Blu Giant, LLC (“Blu Giant”) – Blu Giant, an affiliate of GFS and the Distributor, provides EDGAR conversion and filing services as well as print management services for the Funds on an ad-hoc basis. For the provision of these services, Blu Giant receives customary fees from the Funds which are included in the printing and postage expenses in the Statements of Operations.
| 5. | AGGREGATE UNREALIZED APPRECIATION AND DEPRECIATION – TAX BASIS |
| Gross | Gross | Net Unrealized | ||||||||||||||
| Tax | Unrealized | Unrealized | Appreciation | |||||||||||||
| Cost | Appreciation | Depreciation | (Depreciation) | |||||||||||||
| Main Sector Rotation ETF | $ | 700,483,160 | $ | 244,741,344 | $ | (13,508 | ) | $ | 244,727,836 | |||||||
| Main Thematic Innovation ETF | $ | 78,943,565 | $ | 1,140,505 | $ | (2,183,734 | ) | $ | (1,043,229 | ) | ||||||
20
| MAIN ETFS |
| NOTES TO FINANCIAL STATEMENTS (Continued) |
| May 31, 2021 |
| 6. | DISTRIBUTIONS TO SHAREHOLDERS AND TAX COMPONENTS OF CAPITAL |
The tax character of Funds’ distributions for the years ended May 31, 2021 and May 31, 2020 was as follows:
| For the year or period ended May 31, 2021: | ||||||||||||||||
| Ordinary | Long-Term | Return | ||||||||||||||
| Portfolio | Income | Capital Gains | of Capital | Total | ||||||||||||
| Main Sector Rotation ETF | $ | 7,204,110 | $ | — | $ | — | $ | 7,204,110 | ||||||||
| Main Thematic Innovation ETF | — | — | — | — | ||||||||||||
| For the year or period ended May 31, 2020: | ||||||||||||||||
| Ordinary | Long-Term | Return | ||||||||||||||
| Portfolio | Income | Capital Gains | of Capital | Total | ||||||||||||
| Main Sector Rotation ETF | $ | 6,830,425 | $ | — | $ | — | $ | 6,830,425 | ||||||||
As of May 31, 2021, the components of accumulated earnings/(deficit) on a tax basis were as follows:
| Undistributed | Undistributed | Post October Loss | Capital Loss | Other | Unrealized | Total | ||||||||||||||||||||||
| Ordinary | Long-Term | and | Carry | Book/Tax | Appreciation/ | Accumulated | ||||||||||||||||||||||
| Portfolio | Income | Capital Gains | Late Year Loss | Forwards | Differences | (Depreciation) | Earnings/(Deficits) | |||||||||||||||||||||
| Main Sector Rotation ETF | $ | 313,841 | $ | — | $ | — | $ | (12,360,084 | ) | $ | (736,673 | ) | 244,727,836 | $ | 231,944,920 | |||||||||||||
| Main Thematic Innovation ETF | — | — | (5,282,347 | ) | — | — | (1,043,229 | ) | (6,325,576 | ) | ||||||||||||||||||
The difference between book basis and tax basis accumulated net investment income, unrealized appreciation (depreciation) and accumulated net realized loss from investments is primarily attributable to the tax deferral of losses on wash sales and tax deferral of losses on straddles.
Late year losses incurred after December 31 within the fiscal year are deemed to arise on the first business day of the following fiscal year for tax purposes. The Main Thematic Innovation ETF incurred and elected to defer such late year losses of $117,254.
Capital losses incurred after October 31 within the fiscal year are deemed to arise on the first business day of the following fiscal year for tax purposes. The Main Thematic Innovation ETF incurred and elected to defer such capital losses of $5,165,093.
At May 31, 2021, the Funds had a capital loss carry forwards for federal income tax purposes available to offset future capital gains as follows:
| Non-Expiring | ||||||||||||||||
| Long- | CLCF | |||||||||||||||
| Portfolio | Short-Term | Term | Total | Utilized | ||||||||||||
| Main Sector Rotation ETF | $ | 12,360,084 | $ | — | $ | 12,360,084 | $ | — | ||||||||
| Main Thematic Innovation ETF | — | — | — | — | ||||||||||||
Permanent book and tax differences, primarily attributable to tax adjustments for realized gains (losses) on in-kind redemptions and the tax treatment of non-deductible expenses, resulted in reclassification for the year ended May 31, 2021 as follows:
| Paid | ||||||||
| In | Accumulated | |||||||
| Portfolio | Capital | Earnings (Losses) | ||||||
| Main Sector Rotation ETF | $ | 20,070,888 | $ | (20,070,888 | ) | |||
| Main Thematic Innovation ETF | (7,970 | ) | 7,970 | |||||
21
| MAIN ETFS |
| NOTES TO FINANCIAL STATEMENTS (Continued) |
| May 31, 2021 |
| 7. | CAPITAL SHARE TRANSACTIONS |
Shares are not individually redeemable and may be redeemed by the Funds at net asset value only in large blocks known as “Creation Units.” Shares are created and redeemed by the Main Sector Rotation ETF only in Creation Unit size aggregations of 50,000 shares. Shares are created and redeemed by the Main Thematic Innovation ETF only in Creation Unit size aggregations of 10,000 shares. Only Authorized Participants are permitted to purchase or redeem Creation Units from the Funds. An Authorized Participant is either (i) a broker-dealer or other participant in the clearing process through the Continuous Net Settlement System of the National Securities Clearing Corporation or (ii) a DTC participant and, in each case, must have executed a Participant Agreement with the Distributor. Such transactions are generally permitted on an in-kind basis, with a balancing cash component to equate the transaction to the net asset value per share of the Funds on the transaction date. Cash may be substituted equivalent to the value of certain securities generally when they are not available in sufficient quantity for delivery, not eligible for trading by the Authorized Participant or as a result of other market circumstances. In addition, the Funds may impose transaction fees on purchases and redemptions of Funds shares to cover the custodial and other costs incurred by the Funds in effecting trades. A fixed fee payable to the custodian may be imposed on each creation and redemption transaction regardless of the number of Creation Units involved in the transaction (“Fixed Fee”). Purchases and redemptions of Creation Units for cash or involving cash-in-lieu are required to pay an additional variable charge to compensate the Funds and its ongoing shareholders for brokerage and market impact expenses relating to Creation Unit transactions (“Variable Charge,” and together with the Fixed Fee, the “Transaction Fees”). Transactions in capital shares for the Funds are disclosed in the Statements of Changes in Net Assets.
For the year or period ended May 31, 2021, the fixed and variable fees were as follows:
| Fixed Fees | Variable Fees | |||||||
| Main Sector Rotation ETF | $ | 12,000 | $ | 2,991 | ||||
| Main Thematic Innovation ETF | $ | 5,200 | $ | — | ||||
The Transaction Fees for the Funds are listed in the table below:
| Fixed Fee | Variable Charge | ||
| $200 | 2.00%* |
* The maximum Transaction Fee may be up to 2.00% of the amount invested.
| 8. | SECURITIES LENDING |
Under an agreement (the “Securities Lending Agreement”) with Brown Brothers Harriman (“BBH”), each Fund can lend its portfolio securities to brokers, dealers and other financial institutions approved by the Board to earn additional income. The securities lending agreement requires that loans are collateralized at all times in an amount equal to at least 100% of the value of any loaned securities at the time of the loan. Each Fund receives compensation in the form of fees. The amount of fees depends on a number of factors including the type of security and length of the loan. Each Fund continues to receive interest payments or dividends on the securities loaned during the borrowing period. Gain or loss in the fair value of securities loaned that may occur during the term of the loan will be for the account of each Fund. Each Fund has the right under the terms of the securities lending agreement to recall the securities from the borrower on demand. The cash collateral is held by the custodian in accordance with the custody agreement. Each Fund could experience delays in recovering their securities and possible loss of income or value if the borrower fails to return the borrowed securities, although the Funds are indemnified from this risk by contract with the securities lending agent.
22
| MAIN ETFS |
| NOTES TO FINANCIAL STATEMENTS (Continued) |
| May 31, 2021 |
The following table breaks out the Funds’ securities lending transactions accounted for as secured borrowings with cash collateral of overnight and continuous maturities as of May 31, 2021:
| Overnight and | Up to | Greater than | ||||||||||||||||||||
| Collateral | Continuous | 30 Days | 30-90 days | 90 days | Total | |||||||||||||||||
| Main Sector Rotation ETF | Fidelity Money Market Government Portfolio | $ | 94,197,746 | $ | — | $ | — | $ | — | $ | 94,197,746 | |||||||||||
| Main Thematic Innovation ETF | Fidelity Money Market Government Portfolio | 10,467,001 | — | — | — | 10,467,001 | ||||||||||||||||
At May 31, 2021, each Fund had loaned securities and received cash collateral for the loan. This cash was invested in the Fidelity Money Market Government Portfolio as shown in each Fund’s Portfolio of Investments. The Funds receive compensation relating to the lending of the Funds’ securities as reflected in the Statements of Operations. The fair value of the securities loaned for the Funds totaled $92,717,115 and $7,481,690 for the Main Sector Rotation ETF and Main Thematic Innovation ETF, respectively, at May 31, 2021. The securities loaned are noted in each Fund’s Portfolio of Investments. The fair value of the “Securities Lending Collateral” in each Fund’s Portfolio of Investments includes only cash collateral received and reinvested that totaled $94,197,746 and $10,467,001 for the Main Sector Rotation ETF and the Main Thematic Innovation ETF, respectively, at May 31, 2021. These amounts are offset by a liability recorded as “Securities lending collateral payable upon return” as shown in the Statements of Assets and Liabilities.
| 9. | DERIVATIVE TRANSACTIONS |
The following is a summary of the effect of derivative instruments on the Main Sector Rotation ETF’s Statements of Operations for the year ended May 31, 2021.
| Net | ||||||||
| Net | Change in Unrealized | |||||||
| Realized Gain | Appreciation | |||||||
| Contract Type/Primary Risk Exposure | on Options Written | on Options Written | ||||||
| Equity Contract/Equity Price Risk | $ | 8,003,911 | $ | 2,288,179 | ||||
The average notional value of derivative instruments during the year ended May 31, 2021 was $16,286,400. As of the year ended May 31, 2021 the Fund did not invest in any options written. As of May 31, 2021, there was $9,559,340 in cash held for collateral at the broker for options as shown in the Statements of Assets and Liabilities. As of May 31, 2021, there were securities held as collateral for options with a total fair value of $119,215,000.
| 10. | SUBSEQUENT EVENTS |
Subsequent events after the date of the Statements of Assets and Liabilities have been evaluated through the date the financial statements were issued. Management has determined that no events or transactions occurred requiring adjustment or disclosure in the financial statements.
23

REPORT OF INDEPENDENT REGISTERED PUBLIC ACCOUNTING FIRM
To the Shareholders of Main Sector Rotation ETF and Main Thematic Innovation ETF and
Board of Trustees of Northern Lights Fund Trust IV
Opinion on the Financial Statements
We have audited the accompanying statements of assets and liabilities, including the portfolios of investments, of Main Sector Rotation ETF and Main Thematic Innovation ETF (the “Funds”), each a series of Northern Lights Fund Trust IV, as of May 31, 2021, the related statements of operations, the statements of changes in net assets, the related notes, and the financial highlights for each of the periods indicated below (collectively referred to as the “financial statements”) . In our opinion, the financial statements present fairly, in all material respects, the financial position of each of the Funds as of May 31, 2021, the results of their operations, the changes in net assets, and the financial highlights for each of the periods indicated below in conformity with accounting principles generally accepted in the United States of America.
| Statements of | |||
| Statements of | Changes in Net | Financial | |
| Fund Name | Operations | Assets | Highlights |
| Main Sector Rotation ETF | For the year ended May 31, 2021. | For the years ended May 31, 2021 and 2020. | For the years ended May 31, 2021, 2020 and 2019 and for the period September 5, 2017 (commencement of operations) through May 31, 2018. |
| Main Thematic Innovation ETF | For the period from January 28, 2021 (commencement of operations) through May 31, 2021. | ||
Basis for Opinion
These financial statements are the responsibility of the Funds’ management. Our responsibility is to express an opinion on the Funds’ financial statements based on our audits. We are a public accounting firm registered with the Public Company Accounting Oversight Board (United States) (“PCAOB”) and are required to be independent with respect to the Funds in accordance with the U.S. federal securities laws and the applicable rules and regulations of the Securities and Exchange Commission and the PCAOB.
We conducted our audits in accordance with the standards of the PCAOB. Those standards require that we plan and perform the audit to obtain reasonable assurance about whether the financial statements are free of material misstatement whether due to error or fraud.
C O H E N & C O M P A N Y, L T D.
800.229.1099 | 866.818.4538 fax | cohencpa.com
Registered with the Public Company Accounting Oversight Board
24
Our audits included performing procedures to assess the risks of material misstatement of the financial statements, whether due to error or fraud, and performing procedures that respond to those risks. Such procedures included examining, on a test basis, evidence regarding the amounts and disclosures in the financial statements. Our procedures included confirmation of securities owned as of May 31, 2021, by correspondence with the custodian and brokers; when replies were not received from brokers, we performed other auditing procedures. Our audits also included evaluating the accounting principles used and significant estimates made by management, as well as evaluating the overall presentation of the financial statements. We believe that our audits provide a reasonable basis for our opinion.
We have served as the auditor of one or more investment companies with a related advisor since 2015.

COHEN & COMPANY, LTD.
Cleveland, Ohio
July 30, 2021
25
MAIN ETFS
EXPENSE EXAMPLE (Unaudited)
May 31, 2021
ETFs have operating expenses. As a shareholder of the Funds you incur two types of costs: (1) transaction costs, including brokerage commissions on purchases and sales of Fund shares; and (2) ongoing costs, including management fees and other Fund expenses. This example is intended to help you understand your ongoing costs (in dollars) of investing in the Funds and to compare these costs with the ongoing costs of investing in other funds. A shareholder may incur brokerage commissions on their purchase and sales of Fund shares, which are not reflected in the examples below.
The example is based on an investment of $1,000 invested at the beginning of the period and held for the entire period as disclosed in the table below.
Actual Expenses
The “Actual” lines in the table below provide information about actual account values and actual expenses. You may use the information below, together with the amount you invested, to estimate the expenses that you paid over the period. Simply divide your account value by $1,000 (for example, an $8,600 account value divided by $1,000 = 8.6), then multiply the result by the number in the table under the heading entitled “Expenses Paid During Period” to estimate the expenses you paid on your account during this period.
Hypothetical Example for Comparison Purposes
The “Hypothetical” line in the table below provides information about hypothetical account values and hypothetical expenses based on the Funds’ actual expense ratios and an assumed rate of return of 5% per year before expenses, which are not the Funds’ actual returns. The hypothetical account values and expenses may not be used to estimate the actual ending account balances or expenses you paid for the period. You may use this information to compare this 5% hypothetical example with the 5% hypothetical examples that appear in the shareholder reports of other funds.
Please note that the expenses shown in the table are meant to highlight your ongoing costs only and do not reflect any transactional costs, such as brokerage commissions paid. Therefore, the table is useful in comparing ongoing costs only, and will not help you determine the relative total costs of owning different funds. In addition, if these transactional costs were included, your costs would have been higher.
| Ending | Annualized | |||
| Beginning | Account | Expense | Expenses Paid | |
| Account Value | Value | Ratio | During Period | |
| Actual* | 12/1/20 | 5/31/21 | 12/1/20-5/31/21* | |
| Main Sector Rotation ETF | $1,000.00 | $1,207.50 | 0.42% | $ 2.31 |
| Actual** | 1/30/21 | 5/31/21 | 1/30/21-5/31/21** | |
| Main Thematic Innovation ETF | $1,000.00 | $1,222.50 | 0.86% | $ 3.19 |
| Hypothetical*** (5% return before expenses) | 12/1/20 | 5/31/21 | 12/1/20-5/31/21* | |
| Main Sector Rotation ETF | $1,000.00 | $ 1,022.84 | 0.42% | $ 2.12 |
| Main Thematic Innovation ETF | $1,000.00 | $ 1,020.64 | 0.86% | $ 4.33 |
| * | Expenses are equal to the average account value over the period, multiplied by the Fund’s annualized expense ratio, multiplied by the number of days in the period (182) divided by the number of days in the fiscal year (365). |
| ** | Expenses are equal to the average account value over the period, multiplied by the Fund’s annualized expense ratio, multiplied by the number of days in the period (122) divided by the number of days in the fiscal year (365). |
| *** | The hypothetical example assumes that the Fund was in operation for the full six months ended May 31, 2021. |
For more information about current performance, holdings, or historical premiums/discounts, please visit our website at www.mainmgtetfs.com.
26
| MAIN ETFs |
| SUPPLEMENTAL INFORMATION (Unaudited) |
| May 31, 2021 |
Approval of the Investment Advisory Agreement – Main Management ETF Advisors, LLC (“MMEA”)
In connection with the meeting of the Board of Trustees (the “Trustees”) of Northern Lights Fund Trust IV (the “Trust”) held on January 20-21, 2021 (the “Meeting”), the Trustees, including a majority of the Trustees who are not “interested persons,” as that term is defined in the Investment Company Act of 1940, as amended, discussed the approval of an investment advisory agreement (the “MMEA Advisory Agreement”) between MMEA and the Trust, with respect to Main Thematic Innovation ETF (“Main TI”). In considering the approval of the MMEA Advisory Agreement, the Trustees received materials specifically relating to the MMEA Advisory Agreement.
The Trustees reviewed and discussed the materials about the proposed MMEA Advisory Agreement that were provided in advance of the Meeting and deliberated on the approval of the MMEA Advisory Agreement. The Trustees relied upon the advice of independent legal counsel and their own business judgment in determining the material factors to be considered in evaluating the MMEA Advisory Agreement and the weight to be given to each factor considered. The conclusions reached by the Trustees were based on a comprehensive evaluation of all the information provided and were not the result of any one factor. Moreover, each Trustee may have afforded different weight to the various factors in reaching his conclusions with respect to the approval of the MMEA Advisory Agreement.
Nature, Extent and Quality of Services. The Trustees acknowledged that the personnel who will manage Main TI have accrued extensive experience implementing strategies similar to that of Main TI through their involvement in managing the separately managed accounts of the parent company, Main Management, LLC. The Trustees noted that investment decisions will be made based on internal and external research and agreed upon by MMEA’s investment committee. The Trustees also noted the portfolio management team’s experience with trading ETFs and with the use of option strategies. The Trustees acknowledged that MMEA currently provides a high level of service as adviser to another ETF in the Trust. They reviewed MMEA’s broker-dealer selection criteria noting its detail and periodic post-trade review in addition to pre-trade review and selection. After further discussion, the Trustees concluded that MMEA has the ability to provide a level of service consistent with the Trustees’ expectations.
Performance. The Trustees noted that Main TI was new and therefore did not have any prior performance to provide. The Trustees instead reviewed performance information for a separately managed accounts composite, which is managed pursuant to an investment strategy substantially similar to that of Main TI and noted that Main TI will be managed by the same portfolio management team. The Trustees noted that the separately managed accounts composite outperformed the benchmark for the reviewed period. The Trustees acknowledged that the generally strong performance reported for the separately managed account composite is indicative of the performance had assets been invested under the Main TI investment strategy for the same periods. However, the Trustees recognized the separately managed accounts are not under the same various regulatory constraints as an ETF.
Fees and Expenses. The Trustees discussed the reports prepared by Broadridge and reviewed the proposed advisory fee and net operating expenses of Main TI as compared to its Broadridge selected peer group and Morningstar category. The Trustees noted that MMEA proposed to charge an advisory fee of 0.65% of average net daily assets. They further noted that the advisory fee is lower than the 0.70% average fee charged by funds in the Broadridge selected peer group, and higher than the 0.60% average advisory fee for Main TI’s Morningstar category. The Trustees considered the net expense ratio and noted that at 0. 85%, the net expense ratio was higher than the peer group average of 0.71% but below the high of 0.99% of its Morningstar category. The Trustees further noted that this expense ratio was the result of an expense limitation put in place by MMEA of 0.99% of Main TI’s average net assets. After further discussion, the Trustees concluded that the proposed advisory fee was not unreasonable.
Profitability. The Trustees reviewed a profitability analysis provided by MMEA and noted that MMEA expects to realize a modest gain in connection with its relationship with Main TI during the first 12 months
27
| MAIN ETFs |
| SUPPLEMENTAL INFORMATION (Unaudited)(Continued) |
| May 31, 2021 |
of operation. The Trustees concluded, after further discussion of the profitability analysis provided, that excessive profitability from MMEA’s relationship with Main TI is not an issue at this time.
Economies of Scale. The Trustees considered whether MMEA would realize economies of scale during the initial period of the MMEA Advisory Agreement. They noted that the proposed fee schedule does not currently provide breakpoints, but that MMEA indicated it is amenable to the discussion of adding breakpoints as Main TI’s assets experience significant growth. The Trustees concluded that absence of breakpoints was acceptable at this time.
Conclusion. Having requested and received such information from MMEA as the Trustees believed to be reasonably necessary to evaluate the terms of the MMEA Advisory Agreement, and as assisted by the advice of independent counsel, the Trustees determined that approval of the MMEA Advisory Agreement was in the best interests of Main TI and its future shareholders.
28
| MAIN ETFs |
| SUPPLEMENTAL INFORMATION (Unaudited) |
| May 31, 2021 |
The business address of each Trustee and Officer is 225 Pictoria Drive, Suite 450, Cincinnati, OH 45246. All correspondence to the Trustees and Officers should be directed to c/o Gemini Fund Services, LLC, P.O. Box 541150, Omaha, Nebraska 68154.
Independent Trustees
| Number of | ||||
| Funds in | ||||
| Fund | ||||
| Name and Year of Birth | Position/Term of Office * | Principal Occupation During the Past Five Years | Complex** Overseen by Trustee | Other Directorships held by Trustee During the Past Five Years |
| Joseph Breslin Year of Birth: 1953 | Independent Trustee and Chairman of the Board since 2015 | President and Consultant, Adviser Counsel, Inc. (formerly J.E. Breslin & Co.) (management consulting firm to investment advisers), (since 2009); Senior Counsel, White Oak Global Advisors, LLC. (since 2016). | 2 | Northern Lights Fund Trust IV (for series not affiliated with the Fund since 2015); Director, Kinetics Mutual Funds, Inc. (since 2000); Trustee, Kinetics Portfolios Trust (since 2000); Trustee, Forethought Variable Insurance Trust (since 2013); Trustee, BlueArc Multi-Strategy Fund (2014-2017); Hatteras Trust (2004-2016) |
| Thomas Sarkany Year of Birth: 1946 | Independent Trustee since 2015 | Founder and President, TTS Consultants, LLC (financial services) (since 2010). | 2 | Northern Lights Fund Trust IV (for series not affiliated with the Fund since 2015); Arrow Investments Trust (since 2014), Arrow ETF Trust (since 2012), Trustee, Northern Lights Fund Trust II (since 2011); Director, Aquila Distributors (since 1981) |
| Charles Ranson Year of Birth: 1947 | Independent Trustee since 2015 | Principal, Ranson & Associates (strategic analysis and planning, including risk assessment and capital formation for entrepreneurial ventures) (since 2003). | 2 | Northern Lights Fund Trust IV (for series not affiliated with the Fund since 2015); Advisors Preferred Trust (since November 2012) |
5/31/21 – NLFT IV_v1
29
| MAIN ETFs |
| SUPPLEMENTAL INFORMATION (Unaudited)(Continued) |
| May 31, 2021 |
Officers
| Name and Year of Birth | Position/Term of Office * | Principal Occupation During the Past Five Years | Number of Funds in Fund Complex** Overseen by Trustee | Other Directorships held by Trustee During the Past Five Years |
| Wendy Wang Year of Birth: 1970 | President since 2015 | Senior Vice President, Director of Tax and Compliance Administration, Gemini Fund Services, LLC (since 2012). | N/A | N/A |
| Sam Singh Year of Birth: 1976 | Treasurer since 2015 | Vice President, Gemini Fund Services, LLC (since 2015); Assistant Vice President, Gemini Fund Services, LLC (2011-2014). | N/A | N/A |
| Jennifer Farrell Year of Birth: 1969 | Secretary since 2017 | Manager, Legal Administration, Gemini Fund Services, LLC (since 2018); Senior Paralegal, Gemini Fund Services, LLC (since 2015); Legal Trainer, Gemini Fund Services, LLC (2013-2015); Senior Paralegal, Gemini Fund Services, LLC (2006-2012). | N/A | N/A |
| James Ash Year of Birth: 1976 | Chief Compliance Officer since 2019 | Senior Compliance Officer, Northern Lights Compliance, LLC (since 2019); Senior Vice President, National Sales Gemini Fund Services, LLC (2017-2019); Senior Vice President and Director of Legal Administration, Gemini Fund Services, LLC (2012-2017). | N/A | N/A |
| * | The term of office for each Trustee and officer listed above will continue indefinitely until the individual resigns or is removed. |
| ** | As of May 31, 2021, the Trust was comprised of 27 other active portfolios managed by unaffiliated investment advisers. The term “Fund Complex” applies only to the Funds managed by the same investment adviser. The Funds do not hold themselves out as related to any other series within the Trust for investment purposes, nor do they share the same investment adviser with any other series. |
The Funds’ SAI includes additional information about the Trustees and is available free of charge, upon request, by calling toll-free at 1-866-383-9778.
5/31/21 – NLFT IV_v1
30
PRIVACY NOTICE
Northern Lights Fund Trust IV
Rev. August 2015
| FACTS | WHAT DOES NORTHERN LIGHTS FUND TRUST IV DO WITH YOUR PERSONAL INFORMATION? |
| Why? | Financial companies choose how they share your personal information. Federal law gives consumers the right to limit some, but not all sharing. Federal law also requires us to tell you how we collect, share, and protect your personal information. Please read this notice carefully to understand what we do. |
| What? | The types of personal information we collect and share depends on the product or service that you have with us. This information can include:
● Social Security number and wire transfer instructions
● account transactions and transaction history
● investment experience and purchase history
When you are no longer our customer, we continue to share your information as described in this notice. |
| How? | All financial companies need to share customers’ personal information to run their everyday business. In the section below, we list the reasons financial companies can share their customers’ personal information; the reasons Northern Lights Fund Trust IV chooses to share; and whether you can limit this sharing. |
| Reasons we can share your personal information: | Does Northern Lights Fund Trust IV share information? | Can you limit this sharing? |
| For our everyday business purposes - such as to process your transactions, maintain your account(s), respond to court orders and legal investigations, or report to credit bureaus. | YES | NO |
| For our marketing purposes - to offer our products and services to you. | NO | We don’t share |
| For joint marketing with other financial companies. | NO | We don’t share |
| For our affiliates’ everyday business purposes - information about your transactions and records. | NO | We don’t share |
| For our affiliates’ everyday business purposes - information about your credit worthiness. | NO | We don’t share |
| For nonaffiliates to market to you | NO | We don’t share |
| QUESTIONS? | Call 1-402-493-4603 |
31
PRIVACY NOTICE
Northern Lights Fund Trust IV
| Page 2 |
| What we do: | |
How does Northern Lights Fund Trust IV protect my personal information? | To protect your personal information from unauthorized access and use, we use security measures that comply with federal law. These measures include computer safeguards and secured files and buildings.
Our service providers are held accountable for adhering to strict policies and procedures to prevent any misuse of your nonpublic personal information. |
How does Northern Lights Fund Trust IV collect my personal information? | We collect your personal information, for example, when you ● open an account or deposit money
● direct us to buy securities or direct us to sell your securities
● seek advice about your investments
We also collect your personal information from others, such as credit bureaus, affiliates, or other companies. |
Why can’t I limit all sharing? | Federal law gives you the right to limit only: ● sharing for affiliates’ everyday business purposes – information about your creditworthiness.
● affiliates from using your information to market to you.
● sharing for nonaffiliates to market to you.
State laws and individual companies may give you additional rights to limit sharing. |
| Definitions | |
| Affiliates | Companies related by common ownership or control. They can be financial and nonfinancial companies.
● Northern Lights Fund Trust IV has no affiliates. |
| Nonaffiliates | Companies not related by common ownership or control. They can be financial and nonfinancial companies.
● Northern Lights Fund Trust IV does not share with nonaffiliates so they can market to you. |
| Joint marketing | A formal agreement between nonaffiliated financial companies that together market financial products or services to you.
● Northern Lights Fund Trust IV does not jointly market. |
32
PROXY VOTING POLICY
Information regarding how the Funds voted proxies relating to portfolio securities for the twelve month period ended June 30 as well as a description of the policies and procedures that the Funds use to determine how to vote proxies will be available without charge, upon request, by calling 1-866-383-9778 or by referring to the Securities and Exchange Commission’s (“SEC”) website at www.sec.gov.
PORTFOLIO HOLDINGS
The Funds file a complete schedule of portfolio holdings with the SEC for the first and third quarters of each fiscal year as an exhibit to its reports on Form N-PORT, within sixty days after the end of the period. Form N-PORT reports are available at the SEC’s website at www.sec.gov. The information on Form N-PORT is available without charge, upon request, by calling 1-866-383-9778.
| ADVISER |
| Main Management ETF Advisors, LLC |
| 601 California Street, Suite 620 |
| San Francisco, California 94108 |
| ADMINISTRATOR |
| Gemini Fund Services, LLC |
| 4221 North 203rd Street, Suite 100 |
| Elkhorn, Nebraska 68022 |
| MAINETF-AR21 |
(a) Include a copy of the report transmitted to stockholders pursuant to Rule 30e-1 under the Act (17 CFR 270.30e-1).
(b) Include a copy of each notice transmitted to stockholders in reliance on Rule 30e-3 under the Act (17 CFR 270.30e-3) that contains disclosures specified by paragraph (c)(3) of that rule.
Item 2. Code of Ethics.
(a) As of the end of the period covered by this report, the registrant has adopted a code of ethics that applies to the registrant's principal executive officer, principal financial officer, principal accounting officer or controller, or persons performing similar functions, regardless of whether these individuals are employed by the registrant or a third party.
(b) For purposes of this item, “code of ethics” means written standards that are reasonably designed to deter wrongdoing and to promote:
| (1) | Honest and ethical conduct, including the ethical handling of actual or apparent conflicts of interest between personal and professional relationships; |
| (2) | Full, fair, accurate, timely, and understandable disclosure in reports and documents that a registrant files with, or submits to, the Commission and in other public communications made by the registrant; |
(3) Compliance with applicable governmental laws, rules, and regulations;
| (4) | The prompt internal reporting of violations of the code to an appropriate person or persons identified in the code; and |
(5) Accountability for adherence to the code.
(c) Amendments: During the period covered by the report, there have not been any amendments to the provisions of the code of ethics.
(d) Waivers: During the period covered by the report, the registrant has not granted any express or implicit waivers from the provisions of the code of ethics.
(e) The Code of Ethics is not posted on Registrant’ website.
(f) A copy of the Code of Ethics is attached as an exhibit.
Item 3. Audit Committee Financial Expert.
(a) The Registrant’s board of trustees has determined that Joseph Breslin is an audit committee financial expert, as defined in Item 3 of Form N-CSR. Mr. Breslin is independent for purposes of this Item 3.
Item 4. Principal Accountant Fees and Services.
| (a) | Audit Fees | 2020 | 2021 | ||||||
| Main Sector Rotation ETF | $ | 13,750 | $ | 13,750 | |||||
| Main Thematic Innovation ETF | N/A | $ | 10,350 | ||||||
| (b) | Audit-Related Fees | 2020 | 2021 | ||||||
| Main Sector Rotation ETF | None | None | |||||||
| Main Thematic Innovation ETF | N/A | None |
| (c) | Tax Fees | 2020 | 2021 | ||||||
| Main Sector Rotation ETF | $ | 3,000 | $ | 3,000 | |||||
| Main Thematic Innovation ETF | N/A | $ | 3,000 | ||||||
| Preparation of Federal & State income tax returns, assistance with calculation of required income, capital gain and excise distributions and preparation of Federal excise tax returns. | |||||||||
| (d) | All Other Fees | 2020 | 2021 | ||||||
| Main Sector Rotation ETF | None | None | |||||||
| Main Thematic Innovation ETF | N/A | None |
| (e) | (1) Audit Committee’s Pre-Approval Policies |
The registrant’s Audit Committee is required to pre-approve all audit services and, when appropriate, any non-audit services (including audit-related, tax and all other services) to the registrant. The registrant’s Audit Committee also is required to pre-approve, when appropriate, any non-audit services (including audit-related, tax and all other services) to its adviser, or any entity controlling, controlled by or under common control with the adviser that provides ongoing services to the registrant, to the extent that the services may be determined to have an impact on the operations or financial reporting of the registrant. Services are reviewed on an engagement by engagement basis by the Audit Committee.
| (2) | Percentages of Services Approved by the Audit Committee |
Main Sector Rotation ETF
| 2020 | 2021 | |||||||
| Audit-Related Fees: | 0.00 | % | 0.00 | % | ||||
| Tax Fees: | 0.00 | % | 0.00 | % | ||||
| All Other Fees: | 0.00 | % | 0.00 | % | ||||
Main Thematic Innovation ETF
| 2020 | 2021 | |||||||
| Audit-Related Fees: | 0.00 | % | 0.00 | % | ||||
| Tax Fees: | 0.00 | % | 0.00 | % | ||||
| All Other Fees: | 0.00 | % | 0.00 | % | ||||
| (f) | During the audit of registrant's financial statements for the most recent fiscal year, less than 50 percent of the hours expended on the principal accountant's engagement were attributed to work performed by persons other than the principal accountant's full-time, permanent employees. |
| (g) | The aggregate non-audit fees billed by the registrant's accountant for services rendered to the registrant, and rendered to the registrant's investment adviser (not including any sub-adviser whose role is primarily portfolio management and is subcontracted with or overseen by another investment adviser), and any entity controlling, controlled by, or under common control with the adviser that provides ongoing services to the registrant: |
| 2020 | 2021 | |||||||
| Main Sector Rotation ETF | $ | 3,000 | $ | 3,000 | ||||
| Main Thematic Innovation ETF | N/A | $ | 3,000 | |||||
(h) The registrant's audit committee has considered whether the provision of non-audit services to the registrant's investment adviser (not including any sub-adviser whose role is primarily portfolio management and is subcontracted with or overseen by another investment adviser), and any entity controlling, controlled by, or under common control with the investment adviser that provides ongoing services to the registrant, that were not pre-approved pursuant to paragraph (c)(7)(ii) of Rule 2-01 of Regulation S-X, is compatible with maintaining the principal accountant's independence.
Item 5. Audit Committee of Listed Companies. The registrant is an issuer as defined in Rule 10A-3 under the Securities Exchange Act of 1934, as amended (the “Exchange Act”) and has a separately-designated standing audit committee established in accordance with Section 3(a)(58)A of the Exchange Act. The registrant’s audit committee members are Joseph Breslin, Thomas Sarkany, and Charles Ranson.
Item 6. Schedule of Investments. Schedule of investments in securities of unaffiliated issuers is included under Item 1.
Item 7. Disclosure of Proxy Voting Policies and Procedures for Closed-End Funds. Not applicable to open-end investment companies.
Item 8. Portfolio Managers of Closed-End Management Investment Companies. Not applicable to open-end investment companies.
Item 9. Purchases of Equity Securities by Closed-End Funds. Not applicable to open-end investment companies.
Item 10. Submission of Matters to a Vote of Security Holders. None
Item 11. Controls and Procedures.
(a) Based on an evaluation of the Registrant’s disclosure controls and procedures as of a date within 90 days of filing date of this Form N-CSR, the principal executive officer and principal financial officer of the Registrant have concluded that the disclosure controls and procedures of the Registrant are reasonably designed to ensure that the information required in filings on Form N-CSR is recorded, processed, summarized, and reported by the filing date, including that information required to be disclosed is accumulated and communicated to the Registrant’s management, including the Registrant’s principal executive officer and principal financial officer, as appropriate to allow timely decisions regarding required disclosure.
(b) There were no significant changes in the Registrant’s internal control over financial reporting that occurred during the Registrant’s last fiscal half-year that have materially affected, or are reasonably likely to materially affect, the Registrant’s internal control over financial reporting.
Item 12. Disclosure of securities lending activities for closed-end management investment companies.
Not applicable to open-end investment companies.
Item 13. Exhibits.
(a)(1) Code of Ethics filed herewith.
(a)(3) Not applicable for open-end investment companies.
SIGNATURES
Pursuant to the requirements of the Securities Exchange Act of 1934 and the Investment Company Act of 1940, the registrant has duly caused this report to be signed on its behalf by the undersigned, thereunto duly authorized.
(Registrant) Northern Lights Fund Trust IV
By (Signature and Title)
/s/ Wendy Wang
Wendy Wang, Principal Executive Officer/President
Date 8/5/21
Pursuant to the requirements of the Securities Exchange Act of 1934 and the Investment Company Act of 1940, this report has been signed below by the following persons on behalf of the registrant and in the capacities and on the dates indicated.
By (Signature and Title)
/s/ Wendy Wang
Wendy Wang, Principal Executive Officer/President
Date 8/5/21
By (Signature and Title)
/s/ Sam Singh
Sam Singh, Principal Financial Officer/Treasurer
Date 8/5/21