united states
securities and exchange commission
washington, d.c. 20549
form n-csr
certified shareholder report of registered management
investment companies
Investment Company Act file number 811-23066
Northern Lights Fund Trust IV
(Exact name of registrant as specified in charter)
225 Pictoria Drive, Suite 450, Cincinnati, OH 45246
(Address of principal executive offices) (Zip code)
The Corporation Trust Company
1209 Orange Street, Wilmington, DE 19801
(Name and address of agent for service)
Registrant's telephone number, including area code: 631-490-4300
Date of fiscal year end: 5/31
Date of reporting period: 11/30/22
Item 1. Reports to Stockholders.
| LGM Risk Managed Total Return Fund |
| Institutional Class – LBETX |
| Semi-Annual Report |
| November 30, 2022 |
| 1-844-655-9371 |
| www.LGMCapitalManagement.com |
| LGM Capital Management, LLC |
| 11811 N. Tatum Blvd., Suite 3031 |
| Phoenix, AZ 85028 |
| Distributed by Northern Lights Distributors, LLC |
| Member FINRA |
Greetings LGM Risk Managed Total Return Fund Shareholders,
We are pleased to present the Fund’s semi-annual report. This report summarizes the Fund’s semi-annual performance, and provides an audited accounting of LGM Risk Managed Total Return Fund (ticker symbol LBETX) ended November 30, 2022. Below is the summary of the Fund’s principal investment strategy.
The Fund seeks to provide total return from capital appreciation and income with lower volatility than the S&P 500 Index1, with a secondary objective of limiting risk during unfavorable or declining market conditions. The Fund seeks its objective by investing in unaffiliated equity exchange traded funds (ETFs) when we believe equity markets may rise and selling the equity ETFs and investing in unaffiliated bond ETFs or money market funds when we believe equity markets may decline. Our decisions are based on our technical research and analysis, including monitoring price movements and price trends. By applying its technical research and analysis, we seek to produce returns over a complete market cycle with lower volatility, or “beta” than the S&P 500 Index. The S&P 500 Index has a beta of “1”2.
Our 2022 Financial Market Concerns
Our technical research and analysis entering, and during 2022 revealed multiple economic and stock market data point concerns. Our studies revealed that individually, each point resulted in historical market headwinds, that when combined could be recipes for a bear stock market. For example:
| ● | The Federal Reserve (FED) balance sheet that exploded from $3.8 to $9 trillion since 2018. |
| ● | The U.S. deficit that exploded from $22 to $30 trillion since 2018. |
| ● | Inflation rising faster than any time in the past 40 years. |
| ● | Interest rates rising faster than any time in the past 40 years. |
| ● | The FED halting their $120 billion per month of quantitative easing. |
| ● | The FED implementing quantitative tightening; decreasing $95 billion per month off their balance sheet. |
| ● | Stock valuations as extreme as 1929 and 2000 yet markets reached all-time highs. |
Our research and analysis warning of a bear market came to fruition. Our managed risk is reflected in the Fund’s limited drawdowns versus the S&P 500 and NASDAQ. The S&P 500, and NASDAQ hit new lows in October 2022.
Maximum Drawdown* (One-year period ended November 30, 2022)
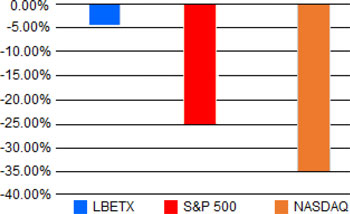
* Maximum Drawdown is the largest decline from peak to low in value.
5048-NLD-01102023
1
Performance
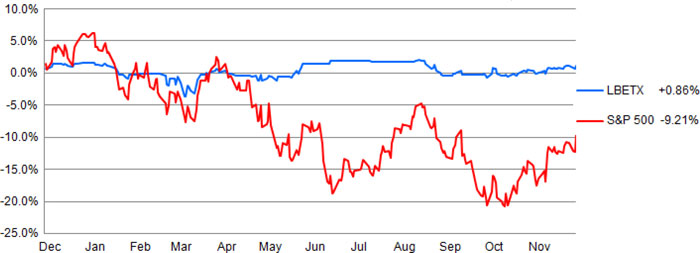
LBETX returned -0.42% vs. -0.40 for the S&P 500 for the six-month period ended November 30, 2022, and top-performed, returning +0.86% net vs. -9.21% for the S&P 500 for the one-year period ended November 30, 2022.
We managed risk, and minimized losses when markets began selling-off. Markets hit lows in June. A bear market rally took place through August, and then markets hit new lows in October. We successfully met The Fund’s investment objective providing total returns with lower volatility than the S&P 500, limited risk, and minimized losses during the declining, bear market conditions. The line graph below best illustrates, and further, reflects the Fund’s top-performance.
| Performance (One-year period ended November 30, 2022) |
| LBETX | S&P 500 |
| +0.86% | -9.21% |
LBETX vs. the S&P 500 One-Year Period Ended November 30, 2022
Moving Forward
The year-to-date S&P 500 ended November 30, 2022 -13.10%, yet many investors believe it cannot sell-off further. Meanwhile, some Wall Street analysts warn of zero-net S&P 500 returns through 2031. That took place as recently as 2000-2010. That decade began at the peak of the dot-com bubble, and a 2000-2002 50% S&P 500 sell-off took place. After rebounding from 2003-2007, another 50% S&P 500 sell-off took place in 2008-2009. By 2010, the market ended the decade with a compounded annual rate of return of -0.9%.
The current economic environment appears similar to the 2000 -2010 decade when many buy and hold investors nearing retirement lost 40% or more with no time to recover. If a similar scenario takes place for the next decade, it may be catastrophic for buy and hold strategy retirement focused investors, and investors in general. For example, a $1,000 S&P 500 investment in year 2000 became $707.49 by the end of 2008, a -29.25% loss. Worse, when adjusted for inflation it was a -43.41% loss without factoring in withdrawals needed in retirement.
Many financial advisers and planners illustrate to investors 9-10% average annual returns based on 120 cumulative years of stock market returns. And many investors expect those average annual returns when calculating how much money they will need to retire. For investors approximately 50 years of age and older, a 10- year period of zero-net returns may be catastrophic to buy and hold strategy retirement accounts, and retirement lifestyle expectations. Instead of having their 401k and retirement accounts exposed to constant risk, including LGM Risk Managed Total Return Fund in their portfolios may be of great help to those investors.
We are pleased with the Fund’s top-performance for the year ended November 30, 2022, and minimized drawdowns compared to the S&P 500. We anticipate future volatility and seek to continue top-performing with minimized drawdowns in future volatile and bear markets. Additional information can be found at: www.LGMCapitalManagement.com. We thank the Fund’s shareholders for making this important opportunity possible.
Cheers!
5048-NLD-01102023
2
Performance quoted represents past performance which does not guarantee future results. Investment returns and principal will fluctuate so an investor’s shares, when redeemed, may be worth more or less the original cost. Current performance may be higher or higher than performance quoted. For performance data current to the most recent month end, please call toll-free 844-655-9371.
| 1 | The S&P 500 is an American stock market index based on the market capitalization of 500 large companies. It is widely regarded as one of the best representations of the U.S. stock market, and is a benchmark for many professional money managers. Investors cannot invest directly in an index. |
| 2 | Beta is a measurement of market risk or volatility. A beta of 1 represents the volatility of the S&P 500, against which other mutual funds and their betas are measured. If a mutual fund has a beta of one, it will move the same amount and direction as the S&P 500. A beta greater than 1 indicates the mutual fund tends to be more volatile than the S&P 500, and a beta less than 1 means it tends to be less volatile than the S&P 500. |
5048-NLD-01102023
3
| LGM RISK MANAGED TOTAL RETURN FUND |
| SCHEDULE OF INVESTMENTS (Unaudited) |
| November 30, 2022 |
| Shares | Fair Value | |||||||
| EXCHANGE-TRADED FUND — 14.1% | ||||||||
| EQUITY - 14.1% | ||||||||
| 5,000 | SPDR S&P 500 ETF Trust | $ | 2,038,400 | |||||
| TOTAL EXCHANGE-TRADED FUND (Cost $1,801,200) | 2,038,400 | |||||||
| Shares | Fair Value | |||||||
| SHORT-TERM INVESTMENT — 81.7% | ||||||||
| MONEY MARKET FUND - 81.7% | ||||||||
| 11,773,786 | Morgan Stanley Institutional Liquidity - Treasury Portfolio, Institutional Class, 3.55% (Cost $11,773,786)(a) | 11,773,786 | ||||||
| TOTAL INVESTMENTS – 95.8% (Cost $13,574,986) | $ | 13,812,186 | ||||||
| LIABILITIES IN EXCESS OF OTHER ASSETS – 4.2% | 605,704 | |||||||
| NET ASSETS - 100.0% | $ | 14,417,890 | ||||||
| ETF | - Exchange-Traded Fund |
| SPDR | - Standard & Poor’s Depositary Receipt |
| (a) | Rate disclosed is the seven day effective yield as of November 30, 2022. |
See accompanying notes which are an integral part of these financial statements.
4
| LGM Risk Managed Total Return Fund |
| STATEMENT OF ASSETS AND LIABILITIES (Unaudited) |
| November 30, 2022 |
| ASSETS | ||||
| Investment securities: | ||||
| At cost | $ | 13,574,986 | ||
| At fair value | $ | 13,812,186 | ||
| Receivable for fund shares sold | 666,000 | |||
| Dividends and interest receivable | 31,780 | |||
| TOTAL ASSETS | 14,509,966 | |||
| LIABILITIES | ||||
| Investment advisory fees payable | 22,129 | |||
| Payable to related parties | 32,600 | |||
| Accrued expenses and other liabilities | 37,347 | |||
| TOTAL LIABILITIES | 92,076 | |||
| NET ASSETS | $ | 14,417,890 | ||
| Net Assets Consist Of: | ||||
| Paid in capital ($0 par value, unlimited shares authorized) | $ | 18,439,291 | ||
| Accumulated losses | (4,021,401 | ) | ||
| NET ASSETS | $ | 14,417,890 | ||
| Net Asset Value Per Share: | ||||
| Institutional Class Shares: | ||||
| Net Assets | $ | 14,417,890 | ||
| Shares of beneficial interest outstanding * | 1,531,433 | |||
| Net asset value (Net Assets ÷ Shares Outstanding), offering price and redemption price per share ** | $ | 9.41 | ||
| * | Unlimited number of shares of beneficial interest authorized, no par value. |
| ** | Redemptions made within 90 days of purchase may be assessed a redemption fee of 2.00%. |
See accompanying notes to financial statements.
5
| LGM Risk Managed Total Return Fund |
| STATEMENT OF OPERATIONS (Unaudited) |
| For the Six Months Ended November 30, 2022 |
| INVESTMENT INCOME | ||||
| Interest | $ | 135,012 | ||
| TOTAL INVESTMENT INCOME | 135,012 | |||
| EXPENSES | ||||
| Investment advisory fees | 70,254 | |||
| Administrative services fees | 26,773 | |||
| Accounting services fees | 16,951 | |||
| Transfer agent fees | 16,095 | |||
| Compliance officer fees | 12,367 | |||
| Third party administrative servicing fees | 8,839 | |||
| Legal fees | 8,524 | |||
| Audit and tax fees | 8,147 | |||
| Registration fees | 7,320 | |||
| Trustees’ fees and expenses | 7,280 | |||
| Printing and postage expenses | 5,014 | |||
| Custodian fees | 1,955 | |||
| Insurance expense | 915 | |||
| Other expenses | 1,360 | |||
| NET EXPENSES | 191,794 | |||
| NET INVESTMENT LOSS | (56,782 | ) | ||
| REALIZED AND UNREALIZED GAIN (LOSS) FROM INVESTMENTS | ||||
| Net realized loss from investments | (202,903 | ) | ||
| Net change in unrealized appreciation on investments | 237,200 | |||
| NET REALIZED AND UNREALIZED GAIN FROM INVESTMENTS | 34,297 | |||
| NET DECREASE IN NET ASSETS RESULTING FROM OPERATIONS | $ | (22,485 | ) | |
See accompanying notes to financial statements.
6
| LGM Risk Managed Total Return Fund |
| STATEMENTS OF CHANGES IN NET ASSETS |
| For the | For the | |||||||
| Six Months Ended | Year Ended | |||||||
| November 30, 2022 | May 31, 2022 | |||||||
| (Unaudited) | ||||||||
| FROM OPERATIONS | ||||||||
| Net investment loss | $ | (56,782 | ) | $ | (333,472 | ) | ||
| Net realized gain (loss) from investments | (202,903 | ) | 823,734 | |||||
| Net change in unrealized appreciation (depreciation) on investments | 237,200 | (51,003 | ) | |||||
| Net increase (decrease) in net assets resulting from operations | (22,485 | ) | 439,259 | |||||
| FROM SHARES OF BENEFICIAL INTEREST | ||||||||
| Proceeds from shares sold: | ||||||||
| Institutional Class | 1,109,573 | 131,167 | ||||||
| Redemption fee proceeds: | ||||||||
| Institutional Class | — | 348 | ||||||
| Payments for shares redeemed: | ||||||||
| Institutional Class | (1,728,859 | ) | (5,239,284 | ) | ||||
| Net decrease in net assets from shares of beneficial interest | (619,286 | ) | (5,107,769 | ) | ||||
| TOTAL DECREASE IN NET ASSETS | (641,771 | ) | (4,668,510 | ) | ||||
| NET ASSETS | ||||||||
| Beginning of Period | 15,059,661 | 19,728,171 | ||||||
| End of Period | $ | 14,417,890 | $ | 15,059,661 | ||||
| SHARE ACTIVITY | ||||||||
| Institutional Class: | ||||||||
| Shares Sold | 118,837 | 14,187 | ||||||
| Shares Redeemed | (183,252 | ) | (558,643 | ) | ||||
| Net decrease in shares of beneficial interest outstanding | (64,415 | ) | (544,456 | ) | ||||
See accompanying notes to financial statements.
7
| LGM Risk Managed Total Return Fund |
| FINANCIAL HIGHLIGHTS |
| Per Share Data and Ratios for a Share of Beneficial Interest Outstanding Throughout the Periods Presented |
| Institutional Class | ||||||||||||||||||||||||
| For the | For the | For the | For the | For the | For the | |||||||||||||||||||
| Six Months Ended | Year Ended | Year Ended | Year Ended | Year Ended | Period Ended | |||||||||||||||||||
| November 30, 2022 | May 31, 2022 | May 31, 2021 | May 31, 2020 | May 31, 2019 | May 31, 2018 (1) | |||||||||||||||||||
| (Unaudited) | ||||||||||||||||||||||||
| Net asset value, beginning of period | $ | 9.44 | $ | 9.22 | $ | 9.58 | $ | 10.47 | $ | 11.19 | $ | 10.00 | ||||||||||||
| Activity from investment operations: | ||||||||||||||||||||||||
| Net investment income (loss) (2) | (0.04 | ) | (0.18 | ) | (0.12 | ) | 0.04 | 0.03 | (0.04 | ) | ||||||||||||||
| Net realized and unrealized gain (loss) on investments | 0.01 | 0.40 | 0.32 | (0.51 | ) | (0.17 | ) | 1.40 | ||||||||||||||||
| Total from investment operations | (0.03 | ) | 0.22 | 0.20 | (0.47 | ) | (0.14 | ) | 1.36 | |||||||||||||||
| Redemption fees | — | 0.00 | (3) | 0.00 | (3) | 0.00 | (3) | 0.00 | (3) | 0.00 | (3) | |||||||||||||
| Less distributions from: | ||||||||||||||||||||||||
| Net investment income | — | — | (0.06 | ) | (0.02 | ) | — | — | ||||||||||||||||
| Net realized gains | — | — | (0.50 | ) | (0.40 | ) | (0.58 | ) | (0.17 | ) | ||||||||||||||
| Total distributions | — | — | (0.56 | ) | (0.42 | ) | (0.58 | ) | (0.17 | ) | ||||||||||||||
| Net asset value, end of period | $ | 9.41 | $ | 9.44 | $ | 9.22 | $ | 9.58 | $ | 10.47 | $ | 11.19 | ||||||||||||
| Total return (4) | (0.32 | )% (8) | 2.39 | % | 2.16 | % | (4.95 | )% | (0.96 | )% | 13.74 | % | ||||||||||||
| Net assets, end of period (000s) | $ | 14,418 | $ | 15,060 | $ | 19,728 | $ | 35,001 | $ | 51,199 | $ | 39,718 | (8) | |||||||||||
| Ratio of gross expenses to average net assets (5,6) | 2.73 | % (9) | 2.32 | % | 2.08 | % | 1.67 | % | 1.62 | % | 1.96 | % (9) | ||||||||||||
| Ratio of net expenses to average net assets (6) | 2.73 | % (9) | 2.32 | % | 1.91 | % | 1.55 | % | 1.58 | % | 1.75 | % (9) | ||||||||||||
| Ratio of net investment income (loss) to average net assets (7) | (0.81 | )% (9) | (1.96 | )% | (1.25 | )% | 0.41 | % | 0.24 | % | (0.38 | )% (9) | ||||||||||||
| Portfolio Turnover Rate | 922 | % (8) | 3065 | % | 5180 | % | 5582 | % | 3908 | % | 1535 | % (8) | ||||||||||||
| (1) | LGM Risk Managed Total Return Fund Institutional Class commenced operations on June 12, 2017. |
| (2) | Per share amounts calculated using the average shares method, which more appropriately represents the per share data for the year or period. |
| (3) | Less than $0.01 per share. |
| (4) | Total returns shown exclude the effect of applicable sales charges and redemption fees and assumes reinvestment of all distributions. |
| (5) | Represents the ratio of expenses to average net assets absent fee waivers and/or expense reimbursements by the Advisor. |
| (6) | Does not include the expenses of other investment companies in which the Fund invests. |
| (7) | Recognition of net investment income (loss) by the Fund is affected by the timing and declaration of dividends by the underlying investment companies in which the Fund invests. |
| (8) | Not annualized. |
| (9) | Annualized for periods less than one full year. |
See accompanying notes to financial statements.
8
| LGM Risk Managed Total Return Fund |
| NOTES TO FINANCIAL STATEMENTS (Unaudited) |
| November 30, 2022 |
| 1. | ORGANIZATION |
The LGM Risk Managed Total Return Fund (the “Fund”) is a diversified series of shares of Northern Lights Fund Trust IV (the “Trust”), a statutory trust organized under the laws of the State of Delaware on June 2, 2015, and registered under the Investment Company Act of 1940, as amended (the “1940 Act”), as an open-end management investment company. The Fund commenced operations on June 12, 2017. The Fund’s objective is to provide total return from capital appreciation and income with lower volatility than the S&P 500 Index, with a secondary objective of limiting risk during unfavorable or declining market conditions.
The Fund currently offers Institutional Class shares. Institutional Class shares are offered at net asset value. Effective September 24, 2020, the remaining Investor Class shares of the Fund converted into Institutional Class shares.
| 2. | SUMMARY OF SIGNIFICANT ACCOUNTING POLICIES |
The following is a summary of significant accounting policies consistently followed by the Fund in the preparation of its financial statements. The policies are in conformity with accounting principles generally accepted in the United States of America (’‘GAAP”), which require management to make estimates and assumptions that affect the reported amounts of assets and liabilities and disclosure of contingent assets and liabilities at the date of the financial statements and the reported amounts of increases and decreases in net assets from operations during the reporting period. Actual results could differ from those estimates. The Fund is an investment company and accordingly follows the investment company accounting and reporting guidance of the Financial Accounting Standards Board (“FASB”) Accounting Standards Codification Topic 946 “Financial Services – Investment Companies”, including Accounting Standards Update 2013-08.
Security Valuation – The Fund records its investments at fair value. Securities listed on an exchange are valued at the last reported sale price at the close of the regular trading session of the exchange on the business day the value is being determined or, in the case of securities listed on NASDAQ, at the NASDAQ Official Closing Price. In the absence of a sale, such securities shall be valued at the mean between the current bid and ask prices on the day of valuation. Short-term debt obligations having 60 days or less remaining until maturity at time of purchase may be valued at amortized cost. Investments in open-end investment companies are valued at net asset value, including the short-term investment currently held.
The Fund may hold securities, such as private investments, interests in commodity pools, other non-traded securities or temporarily illiquid securities, for which market quotations are not readily available or are determined to be unreliable. These securities will be valued using the “fair value” procedures approved by the Board of Trustees (“Board”). The Board has delegated execution of these procedures to a fair value committee composed of one or more representatives from each of the (i) Trust, (ii) administrator, and (iii) adviser. The committee may also enlist third party consultants such as a valuation specialist at a public accounting firm, valuation consultant, or financial officer of a security issuer on an as-needed basis to assist in determining a security-specific fair value.
Valuation of Underlying Funds – The Fund may invest in portfolios of open-end or closed-end investment companies (the “Underlying Funds”). Mutual funds, including money market funds, are valued at their respective net asset values as reported by such investment companies. Exchange-traded funds (“ETFs”) are valued at the last reported sale price or official closing price. Open-end investment companies value securities in their portfolios for which market quotations are readily available at their market values (generally the last reported sale price) and all other securities and assets at their fair value to the methods established by the board of directors of the open- end funds. The shares of many closed-end investment companies and ETFs, after their initial public offering, frequently trade at a price per share, which is different than the net asset value per share. The difference represents a market premium or market discount of such shares. There can be no assurances that the market discount or market premium on shares of any closed-end investment company or ETF purchased by the Fund will not change.
Fair Valuation Process – As noted above, the fair value committee is composed of one or more representatives from each of the (i) Trust, (ii) administrator, and (iii) adviser. The applicable investments are valued collectively via inputs from each of these groups. For example, fair value determinations are required for the following securities: (i) securities for which market quotations are insufficient or not readily available on a particular business day (including securities for which there is a short and temporary lapse in the provision of a price by the regular pricing source); (ii) securities for which, in the judgment of the adviser, the prices or values available do not represent the fair value of the instrument. Factors which may cause the adviser to make such a judgment include, but are not limited to, the following: only a bid price or an ask
9
| LGM Risk Managed Total Return Fund |
| NOTES TO FINANCIAL STATEMENTS (Unaudited) (Continued) |
| November 30, 2022 |
price is available; the spread between bid and ask prices is substantial; the frequency of sales; the thinness of the market; the size of reported trades; and actions of the securities markets, such as the suspension or limitation of trading; (iii) securities determined to be illiquid; (iv) securities with respect to which an event that will affect the value thereof has occurred (a “significant event”) since the closing prices were established on the principal exchange on which they are traded, but prior to the Fund’s calculation of its net asset value. Restricted or illiquid securities, such as private investments or non-traded securities are valued via inputs from the adviser based upon the current bid for the security from two or more independent dealers or other parties reasonably familiar with the facts and circumstances of the security (who should take into consideration all relevant factors as may be appropriate under the circumstances). If the adviser is unable to obtain a current bid from such independent dealers or other independent parties, the fair value committee shall determine the fair value of such security using the following factors: (i) the type of security; (ii) the cost at date of purchase; (iii) the size and nature of the Fund’s holdings; (iv) the discount from market value of unrestricted securities of the same class at the time of purchase and subsequent thereto; (v) information as to any transactions or offers with respect to the security; (vi) the nature and duration of restrictions on disposition of the security and the existence of any registration rights; (vii) how the yield of the security compares to similar securities of companies of similar or equal creditworthiness; (viii) the level of recent trades of similar or comparable securities; (ix) the liquidity characteristics of the security; (x) current market conditions; and (xi) the market value of any securities into which the security is convertible or exchangeable.
The Fund utilizes various methods to measure the fair value of all of its investments on a recurring basis. GAAP establishes a hierarchy that prioritizes inputs to valuation methods. The three levels of inputs are:
Level 1 – Unadjusted quoted prices in active markets for identical assets and liabilities that the Fund has the ability to access.
Level 2 – Observable inputs other than quoted prices included in Level 1 that are observable for the asset or liability, either directly or indirectly. These inputs may include quoted prices for the identical instrument on an inactive market, prices for similar instruments, interest rates, prepayment speeds, credit risk, yield curves, default rates and similar data.
Level 3 – Unobservable inputs for the asset or liability, to the extent relevant observable inputs are not available, representing the Fund’s own assumptions about the assumptions a market participant would use in valuing the asset or liability, and would be based on the best information available.
The availability of observable inputs can vary from security to security and is affected by a wide variety of factors, including, for example, the type of security, whether the security is new and not yet established in the marketplace, the liquidity of markets, and other characteristics particular to the security. To the extent that valuation is based on models or inputs that are less observable or unobservable in the market, the determination of fair value requires more judgment. Accordingly, the degree of judgment exercised in determining fair value is greatest for instruments categorized in Level 3.
The inputs used to measure fair value may fall into different levels of the fair value hierarchy. In such cases, for disclosure purposes, the level in the fair value hierarchy within which the fair value measurement falls in its entirety, is determined based on the lowest level input that is significant to the fair value measurement in its entirety.
The inputs or methodology used for valuing securities are not necessarily an indication of the risk associated with investing in those securities. The following table summarizes the inputs used as of November 30, 2022, for the Fund’s investments measured at fair value:
| Assets* | Level 1 | Level 2 | Level 3 | Total | ||||||||||||
| Exchange-Traded Fund | $ | 2,038,400 | $ | — | $ | — | $ | 2,038,400 | ||||||||
| Short-Term Investment | 11,773,786 | — | — | 11,773,786 | ||||||||||||
| Total | $ | 13,812,186 | $ | — | $ | — | $ | 13,812,186 | ||||||||
The Fund did not hold any Level 2 or 3 securities during the period.
| * | Refer to the Schedule of Investments for classifications. |
Exchange Traded Funds – The Fund may invest in ETFs. ETFs are a type of fund bought and sold on a securities exchange. An ETF trades like common stock. An index ETF represents a fixed portfolio of securities designed to track the
10
| LGM Risk Managed Total Return Fund |
| NOTES TO FINANCIAL STATEMENTS (Unaudited) (Continued) |
| November 30, 2022 |
performance and dividend yield of a particular domestic or foreign market index. The risks of owning an ETF generally reflect the risks of owning the underlying securities in their portfolio, although the lack of liquidity on an ETF could result in it being more volatile. Additionally, ETFs have fees and expenses that reduce their value.
Security Transactions and Related Income – Security transactions are accounted for on the trade date. Interest income is recognized on an accrual basis. Discounts are accreted and premiums are amortized on securities purchased over the lives of the respective securities using the effective yield method. Dividend income is recorded on the ex-dividend date. Realized gains or losses from sales of securities are determined by comparing the identified cost of the security lot sold with the net sales proceeds. Dividends that represent long-term capital gain distributions from underlying investments are reclassified out of dividend income and presented separately for financial reporting purposes. The Fund holds certain investments which pay dividends to their shareholders based upon available funds from operations. Distributions received from investments in securities that represent a return of capital or long-term capital gains are recorded as a reduction of the cost of investments or as a realized gain, respectively.
Distributions to Shareholders – Dividends from net investment income are declared and paid annually. Distributions from net realized capital gains, if any, are declared and paid annually. Dividends and distributions to shareholders are recorded on the ex-dividend date and are determined in accordance with federal income tax regulations, which may differ from GAAP. These “book/tax” differences are considered either temporary (e.g., deferred losses, capital loss carryforwards) or permanent in nature. To the extent these differences are permanent in nature, such amounts are reclassified within the composition of net assets based on their federal tax -basis treatment; temporary differences do not require reclassification. These reclassifications have no effect on net assets, results from operations or net asset values per share of the Fund.
Federal Income Taxes – The Fund qualifies as a regulated investment company by complying with the provisions of the Internal Revenue Code of 1986, as amended, that are applicable to regulated investment companies and to distribute substantially all of its taxable income and net realized gains to shareholders. Therefore, no federal income tax provision has been recorded. The Fund recognizes the tax benefits of uncertain tax positions only where the position is “more likely than not” to be sustained assuming examination by tax authorities. Management has analyzed the Fund’s tax positions and has concluded that no liability for unrecognized tax benefits should be recorded related to uncertain tax positions taken on returns filed for open tax years ended May 31, 2020 through May 31, 2022, or expected to be taken in the Fund’s May 31, 2023 year-end tax returns. The Fund recognizes interest and penalties, if any, related to unrecognized tax benefits as income tax expense in the Statement of Operations. During the six months ended November 30, 2022, the Fund did not incur any interest or penalties. The Fund identified its major tax jurisdictions as U.S. Federal, Ohio, and foreign jurisdictions where the Fund makes significant investments. The Fund is not aware of any tax positions for which it is reasonably possible that the total amounts of unrecognized tax benefits will change materially in the next twelve months.
Expenses – Expenses of the Trust that are directly identifiable to a specific fund are charged to that fund. Expenses, which are not readily identifiable to a specific fund, are allocated in such a manner as deemed equitable (as determined by the Board), taking into consideration the nature and type of expense and the relative sizes of the funds in the Trust.
Cash and Cash Equivalents – Cash and cash equivalents, if any, are held with a financial institution. The assets of the Fund may be placed in deposit accounts at U.S. banks and such deposits generally exceed Federal Deposit Insurance Corporation (“FDIC”) insurance limits. The FDIC insures deposit accounts up to $250,000 for each accountholder. The Fund maintains cash balances, which, at times, may exceed federally insured limits. The counterparty is generally a single bank rather than a group of financial institutions; thus there may be a greater counterparty credit risk. The Fund places deposits only with those counterparties which are believed to be creditworthy and there has been no history of loss.
Indemnification – The Trust indemnifies its officers and Trustees for certain liabilities that may arise from the performance of their duties to the Trust. Additionally, in the normal course of business, the Fund enters into contracts that contain a variety of representations and warranties and which provide general indemnities. The Fund’s maximum exposure under these arrangements is unknown, as this would involve future claims that may be made against the Fund that have not yet occurred. However, based on experience, the risk of loss due to these warranties and indemnities appears to be remote.
11
| LGM Risk Managed Total Return Fund |
| NOTES TO FINANCIAL STATEMENTS (Unaudited) (Continued) |
| November 30, 2022 |
| 3. | INVESTMENT TRANSACTIONS |
For the six months ended November 30, 2022, cost of purchases and proceeds from sales of portfolio securities, excluding short-term investments, amounted to $18,243,034 and $16,238,931, respectively.
| 4. | INVESTMENT ADVISORY AGREEMENT AND TRANSACTIONS WITH RELATED PARTIES |
LGM Capital Management, LLC serves as the Fund’s investment adviser (the “Adviser”). Pursuant to an advisory agreement with the Trust on behalf of the Fund, the Adviser, under the oversight of the Board, directs the daily operations of the Fund and supervises the performance of administrative and professional services provided by others. As compensation for its services and the related expenses borne by the Adviser, the Fund pays the Adviser a fee computed and accrued daily and paid monthly, based on the Fund’s average daily net assets and is computed at the annual rate of 1.00%. Pursuant to the advisory agreement, the Fund accrued $70,254 in advisory fees for the six months ended November 30, 2022.
Prior to October 1, 2020, the Adviser had contractually agreed to reduce its fees and/or absorb expenses of the Fund (“Waiver Agreement”) to ensure that Total Annual Fund Operating Expenses After Fee Waiver and/or Reimbursement (exclusive fees and expenses associated with investments in other collective investment vehicles or derivative instruments (including for example option and swap fees and expenses) and derivatives of any front-end or contingent deferred loads; brokerage fees and commissions, acquired fund fees and expenses; borrowing costs (such as interest and dividend expense on securities sold short); taxes; and extraordinary expenses, such as litigation expenses (which may include indemnification of Fund officers and Trustees, contractual indemnification of Fund service providers (other than the Adviser))), did not exceed 1.55% of the daily average net assets attributable to Institutional Class shares. This expense limitation expired on September 30, 2020. These fee waivers and reimbursements are subject to possible recoupment from the Fund by the Adviser in future years (within the three years after the fees have been waived or reimbursed) if such recoupment can be achieved within the lesser of the expense limitation in place at the time of wavier and the expense limitation in place at the time of recapture. During the six months ended November 30, 2022, the Fund recaptured $0.
Of the total amount of advisory fees waived subject to recapture, $43,058 will expire May 31, 2024 and $52,554 will expire May 31, 2023.
In addition, certain affiliates of the Northern Lights Distributors, LLC (the “Distributor”) provide services to the Fund as follows:
Ultimus Fund Solutions, LLC (“UFS”), an affiliate of the Distributor, provides administration, fund accounting, and transfer agent services to the Trust. Pursuant to a separate servicing agreement with UFS, the Fund pays UFS customary fees for providing administration, fund accounting and transfer agency services to the Fund as shown in the Statement of Operations. Certain officers of the Trust are also officers of UFS and are not paid any fees directly by the Fund for serving in such capacities.
Northern Lights Compliance Services, LLC (“NLCS”), an affiliate of UFS and the Distributor, provides a Chief Compliance Officer to the Trust, as well as related compliance services, pursuant to a consulting agreement between NLCS and the Trust. Under the terms of such agreement, NLCS receives customary fees from the Fund which are included in “Compliance officer fees” in the Statement of Operations.
Blu Giant, LLC (“Blu Giant”), an affiliate of UFS and the Distributor, provides EDGAR conversion and filing services as well as print management services for the Fund on an ad-hoc basis as shown in the Statement of Operations. For the provision of these services, Blu Giant receives customary fees from the Fund which are included in “Printing and postage expenses” in the Statement of Operations.
12
| LGM Risk Managed Total Return Fund |
| NOTES TO FINANCIAL STATEMENTS (Unaudited) (Continued) |
| November 30, 2022 |
| 5. | DISTRIBUTIONS TO SHAREHOLDERS AND TAX COMPONENTS OF CAPITAL |
The Statement of Assets and Liabilities represents cost for financial reporting purposes. Aggregate cost for federal tax purposes is $13,577,484 for the Fund.
| Unrealized Appreciation | $ | 234,702 | ||
| Unrealized Depreciation | — | |||
| Tax Net Unrealized Appreciation | $ | 234,702 | ||
The tax character of fund distributions paid for the periods ended May 31, 2022 and May 31, 2021 was as follows:
| Fiscal Year Ended | Fiscal Year Ended | |||||||
| May 31, 2022 | May 31, 2021 | |||||||
| Ordinary Income | $ | — | $ | 1,531,875 | ||||
| Long-Term Capital Gain | — | — | ||||||
| Return of Capital | — | 183 | ||||||
| $ | — | $ | 1,532,058 | |||||
As of May 31, 2022, the components of accumulated earnings/(deficit) on a tax basis were as follows:
| Undistributed | Undistributed | Post October Loss | Capital Loss | Other | Unrealized | Total | ||||||||||||||||||||
| Ordinary | Long-Term | and | Carry | Book/Tax | Appreciation/ | Accumulated | ||||||||||||||||||||
| Income | Gains | Late Year Loss | Forwards | Differences | (Depreciation) | Earnings/(Losses) | ||||||||||||||||||||
| $ | — | $ | — | $ | (113,303 | ) | $ | (3,883,115 | ) | $ | — | $ | (2,498 | ) | $ | (3,998,916 | ) | |||||||||
The difference between book basis and tax basis undistributed net investment income/(loss), accumulated net realized gain/(loss), and unrealized appreciation/(depreciation) from investments is primarily attributable to the tax deferral of losses on wash sales.
Late year losses incurred after December 31 within the fiscal year are deemed to arise on the first business day of the following fiscal year for tax purposes. The Fund incurred and elected to defer such late year losses of $113,303.
At May 31, 2022, the Fund had capital loss carry forwards for federal income tax purposes available to offset future capital gains and utilized capital loss carryforwards as follows:
| Non-Expiring | Non-Expiring | |||||||||||||
| Short-Term | Long-Term | Total | CLCF Utilized | |||||||||||
| $ | 3,883,115 | $ | — | $ | 3,883,115 | $ | 826,232 | |||||||
Permanent book and tax differences, primarily attributable to the book/tax basis treatment of net operating losses, resulted in reclassifications for the Fund for the fiscal year ended May 31, 2022 as follows:
| Paid | ||||||
| In | Accumulated | |||||
| Capital | Earnings (Losses) | |||||
| $ | (412,609 | ) | $ | 412,609 | ||
13
| LGM Risk Managed Total Return Fund |
| NOTES TO FINANCIAL STATEMENTS (Unaudited) (Continued) |
| November 30, 2022 |
| 6. | REDEMPTION FEES |
The Fund may assess a short-term redemption fee of 2.00% of the total redemption amount if shareholders sell their shares after holding them for less than ninety days. The redemption fee is paid directly to the Fund. Please refer to the Statements of Changes in Net Assets for the collected redemption fees.
| 7. | BENEFICIAL OWNERSHIP |
The beneficial ownership, either directly or indirectly, of more than 25% of voting securities of the Fund creates a presumption of control of the Fund, under Section 2(a)(9) of the 1940 Act. As of November 30, 2022, Charles Schwab & Co. held 91.8% of the voting securities and may be deemed to control the Fund.
| 8. | UNDERLYING INVESTMENT IN OTHER INVESTMENT COMPANIES |
The Fund currently seeks to achieve its investment objectives by investing its assets in Underlying Funds. As of November 30, 2022, the percentage of the Fund’s net assets invested in the Morgan Stanley Institutional Liquidity - Treasury Portfolio, Institutional Class was 81.7%, (the “Security”). The Fund may sell its investments in the Security at any time if the Adviser determines that it is in the best interest of the Fund and its shareholders to do so.
The performance of the Fund will be directly affected by the performance of these investments. The annual report of the Security, along with the report of the independent registered public accounting firm is included in the respective Securities’ N-CSR’s available at “www.sec.gov”.
| 9. | SUBSEQUENT EVENTS |
Subsequent events after the date of the Statement of Assets and Liabilities have been evaluated through the date the financial statements were issued. Management has determined that no events or transactions occurred requiring adjustment or disclosure in the financial statements.
14
| LGM Risk Managed Total Return Fund |
| EXPENSE EXAMPLE (Unaudited) |
| November 30, 2022 |
Example
As a shareholder of the Fund you will incur two types of costs: (1) transaction costs, including redemption fees; and (2) ongoing expenses, such as advisory fees, and/or other fund expenses. The following example is intended to help you understand the ongoing cost (in dollars) of investing in the Fund and to compare these costs with the ongoing costs of investing in other mutual funds. Please note, the expenses shown in the tables are meant to highlight ongoing costs only and do not reflect any transactional costs. The example is based on an investment of $1,000 invested at the beginning of the six-month period and held for the entire six-month period from June 1, 2022 to November 30, 2022 (the “period”).
Actual Expenses
The first table below provides information about actual account values and actual expenses. You may use the information in this line, together with the amount you invested, to estimate the expenses that you paid over the period. Simply divide your account value by $ 1,000 (for example, an $8,600 account value divided by $1,000 = 8.6), then multiply the result by the number in the first line under the heading entitled “Expenses Paid During the Period” to estimate the expenses you paid on your account during the period.
Hypothetical Example for Comparison Purposes
The second table below provides information about hypothetical account values and hypothetical expenses based on the Fund’s actual expense ratio and an assumed rate of return of 5% per year before expenses, which is not the Fund’s actual return. The hypothetical account values and expenses may not be used to estimate the actual ending account balance or expenses you paid for the period. You may use this information to compare the ongoing costs of investing in the Fund and other funds. To do so, compare this 5% hypothetical example with the 5% hypothetical examples that appear in the shareholder reports of the other funds. Please note that the expenses shown in the table are meant to highlight your ongoing costs only and do not reflect any transactional costs. Therefore, the second line of the table is useful in comparing ongoing costs only, and will not help you determine the relative total costs of owning different funds. In addition, if these transactional costs were included, your costs would have been higher.
| Beginning | Ending | Expenses Paid | Expense Ratio During the | |
| Account Value | Account Value | During Period | Period 6/1/2022 – | |
| Actual | 6/1/2022 | 11/30/2022 | 6/1/2022 – 11/30/2022* | 11/30/2022 |
| Institutional Class | $1,000.00 | $996.80 | $13.67 | 2.73% |
| Beginning | Ending | Expenses Paid | Expense Ratio During the | |
| Hypothetical | Account Value | Account Value | During Period | Period 6/1/2022 – |
| (5% return before expenses) | 6/1/2022 | 11/30/2022 | 6/1/2022 – 11/30/2022* | 11/30/2022 |
| Institutional Class | $1,000.00 | $1,011.38 | $13.77 | 2.73% |
| * | Expenses are equal to the average account value over the period, multiplied by the Fund’s annualized expense ratio, multiplied by the number of days in the period (183) divided by the number of days in the fiscal year (365). |
15
| LGM Risk Managed Total Return Fund |
| ADDITIONAL INFORMATION (Unaudited) |
| November 30, 2022 |
LIQUIDITY RISK MANAGEMENT PROGRAM
The Fund has adopted and implemented a written liquidity risk management program as required by Rule 22e-4 (the “Liquidity Rule”) under the 1940 Act. The program is reasonably designed to assess and manage the Fund’s liquidity risk, taking into consideration, among other factors, the Fund’s investment strategy and the liquidity of its portfolio investments during normal and reasonably foreseeable stressed conditions; its short and long-term cash flow projections; and its cash holdings and access to other funding sources.
During the six months ended November 30, 2022, the Trust’s Liquidity Risk Management Program Committee (the “Committee”) reviewed the Fund’s investments and determined that the Fund held adequate levels of cash and highly liquid investments to meet shareholder redemption activities in accordance with applicable requirements. Accordingly, the Committee concluded that (i) the Fund’s liquidity risk management program is reasonably designed to prevent violations of the Liquidity Rule and (ii) the Fund’s liquidity risk management program has been effectively implemented.
16
| LGM Risk Managed Total Return Fund |
| PORTFOLIO REVIEW (Unaudited) |
| November 30, 2022 |
Average Annual Total Return through November 30, 2022*, as compared to its benchmark:
| Six Months | One Year | Three Year | Five Year | Since Inception (b) | |
| LGM Risk Managed Total Return Fund - Institutional Class | -0.32% | 0.86% | -1.87% | 1.29% | 2.03% |
| S&P 500 Total Return Index (a) | -0.40% | -9.21% | 10.91% | 10.98% | 11.93% |
| * | Past performance is not predictive of future results. The investment return and principal value of an investment will fluctuate. An investor’s shares, when redeemed, may be worth more or less than the original cost. Total return is calculated assuming reinvestment of all dividends and distributions, if any. Prior to October 1, 2020 the Adviser had contractually agreed to reduce its fees and/or absorb expenses of the Fund (“Waiver Agreement”), to ensure that Total Annual Fund Operating Expenses After Fee Waiver and/or Reimbursement (exclusive of any front-end or contingent deferred loads; brokerage fees and commissions, acquired fund fees and expenses; borrowing costs (such as interest and dividend expense on securities sold short), fees and expenses associated with investments in other collective investment vehicles or derivative instruments (including for example option and swap fees and expenses); taxes; and extraordinary expenses, such as litigation expenses (which may include indemnification of Fund officers and Trustees, contractual indemnification of Fund service providers (other than the Adviser))), did not exceed 1.55% of the daily average net assets attributable to Institutional Class shares. This expense limitation expired on September 30, 2020. The fee waivers and reimbursements are subject to possible recoupment from the Fund by the Adviser in future years (within the three years after the fees have been waived or reimbursed) if such recoupment can be achieved within the lesser of the expense limitation in place at the time of wavier and the expense limitation in place at the time of recapture. The Fund’s total annual net and gross operating expenses, including underlying funds, are 2.49% for Institutional Class per the Fund’s prospectus dated September 28, 2022. Shares redeemed within 90 days of purchase are subject to a 2.00% redemption fee. The performance data does not reflect the deduction of taxes that a shareholder would have to pay on Fund distributions, if any, or the redemption of the Fund shares. |
| (a) | The S&P 500 Total Return Index, is a market capitalization-weighted index of 500 widely held common stocks. Investors cannot invest directly in an index. |
| (b) | Inception date is June 12, 2017. |
| Top Holdings by Industry | Percentage of Net Assets | |||
| Short-Term Investment | 81.7 | % | ||
| Exchange-Traded Fund | 14.1 | % | ||
| Other Assets in Excess of Liabilities | 4.2 | % | ||
| 100.0 | % | |||
Please refer to the Schedule of Investments in this semi-annual report for a detailed listing of the Fund’s holdings.
17
PRIVACY NOTICE
Northern Lights Fund Trust IV
Rev. August 2015
| FACTS | WHAT DOES NORTHERN LIGHTS FUND TRUST IV DO WITH YOUR PERSONAL INFORMATION? |
| Why? | Financial companies choose how they share your personal information. Federal law gives consumers the right to limit some, but not all sharing. Federal law also requires us to tell you how we collect, share, and protect your personal information. Please read this notice carefully to understand what we do. |
| What? | The types of personal information we collect and share depends on the product or service that you have with us. This information can include:
● Social Security number and wire transfer instructions
● account transactions and transaction history
● investment experience and purchase history
When you are no longer our customer, we continue to share your information as described in this notice. |
| How? | All financial companies need to share customers’ personal information to run their everyday business. In the section below, we list the reasons financial companies can share their customers’ personal information; the reasons Northern Lights Fund Trust IV chooses to share; and whether you can limit this sharing. |
| Reasons we can share your personal information: | Does Northern Lights Fund Trust IV share information? | Can you limit this sharing? |
| For our everyday business purposes - such as to process your transactions, maintain your account(s), respond to court orders and legal investigations, or report to credit bureaus. | YES | NO |
| For our marketing purposes - to offer our products and services to you. | NO | We don’t share |
| For joint marketing with other financial companies. | NO | We don’t share |
| For our affiliates’ everyday business purposes - information about your transactions and records. | NO | We don’t share |
| For our affiliates’ everyday business purposes - information about your credit worthiness. | NO | We don’t share |
| For nonaffiliates to market to you | NO | We don’t share |
| QUESTIONS? | Call 1-844-655-9371 |
18
PRIVACY NOTICE
Northern Lights Fund Trust IV
| Page 2 |
| What we do: | |
How does Northern Lights Fund Trust IV protect my personal information? | To protect your personal information from unauthorized access and use, we use security measures that comply with federal law. These measures include computer safeguards and secured files and buildings.
Our service providers are held accountable for adhering to strict policies and procedures to prevent any misuse of your nonpublic personal information. |
How does Northern Lights Fund Trust IV collect my personal information? | We collect your personal information, for example, when you ● open an account or deposit money
● direct us to buy securities or direct us to sell your securities
● seek advice about your investments
We also collect your personal information from others, such as credit bureaus, affiliates, or other companies. |
Why can’t I limit all sharing? | Federal law gives you the right to limit only: ● sharing for affiliates’ everyday business purposes – information about your creditworthiness.
● affiliates from using your information to market to you.
● sharing for nonaffiliates to market to you.
State laws and individual companies may give you additional rights to limit sharing. |
| Definitions | |
| Affiliates | Companies related by common ownership or control. They can be financial and nonfinancial companies.
● Northern Lights Fund Trust IV has no affiliates. |
| Nonaffiliates | Companies not related by common ownership or control. They can be financial and nonfinancial companies.
● Northern Lights Fund Trust IV does not share with nonaffiliates so they can market to you. |
| Joint marketing | A formal agreement between nonaffiliated financial companies that together market financial products or services to you.
● Northern Lights Fund Trust IV does not jointly market. |
19
PROXY VOTING POLICY
Information regarding how the Fund votes proxies relating to portfolio securities for the twelve month period ended June 30, as well as a description of the policies and procedures that the Fund used to determine how to vote proxies is available without charge, upon request, by calling 1-844-655-9371 or by referring to the Securities and Exchange Commission’s (“SEC”) website at http://www.sec.gov.
PORTFOLIO HOLDINGS
The Fund files a complete schedule of portfolio holdings with the SEC for the first and third quarters of each fiscal year as an exhibit to its reports on Form N-PORT, within sixty days after the end of the period. Form N-PORT reports are available at the SEC’s website at http://www.sec.gov. The information on Form N-PORT is available without charge, upon request, by calling 1-844-655-9371.
| INVESTMENT ADVISOR |
| LGM Capital Management, LLC |
| 11811 N. Tatum Blvd., Suite 3031 |
| Phoenix, AZ 85028 |
| ADMINISTRATOR |
| Ultimus Fund Solutions, LLC |
| 225 Pictoria Drive, Suite 450 |
| Cincinnati, OH 45246 |
| LGM-SAR22 |
(b) Not applicable
Item 2. Code of Ethics. Not applicable.
Item 3. Audit Committee Financial Expert. Not applicable.
Item 4. Principal Accountant Fees and Services. Not applicable.
Item 5. Audit Committee of Listed Companies. Not applicable to open-end investment companies.
Item 6. Schedule of Investments. Schedule of investments in securities of unaffiliated issuers is included under Item 1.
Item 7. Disclosure of Proxy Voting Policies and Procedures for Closed-End Management Investment Companies. Not applicable to open-end investment companies.
Item 8. Portfolio Managers of Closed-End Management Investment Companies. Not applicable to open-end investment companies.
Item 9. Purchases of Equity Securities by Closed-End Management Investment Company and Affiliated Purchasers. Not applicable to open-end investment companies.
Item 10. Submission of Matters to a Vote of Security Holders. None
Item 11. Controls and Procedures.
(a) Based on an evaluation of the Registrant’s disclosure controls and procedures as of a date within 90 days of filing date of this Form N-CSR, the principal executive officer and principal financial officer of the Registrant have concluded that the disclosure controls and procedures of the Registrant are reasonably designed to ensure that the information required in filings on Form N-CSR is recorded, processed, summarized, and reported by the filing date, including that information required to be disclosed is accumulated and communicated to the Registrant’s management, including the Registrant’s principal executive officer and principal financial officer, as appropriate to allow timely decisions regarding required disclosure.
(b) There were no significant changes in the Registrant’s internal control over financial reporting that occurred during the period covered by this report that have materially affected, or are reasonably likely to materially affect, the Registrant’s internal control over financial reporting.
Item 12. Disclosure of Securities Lending Activities for Closed-End Management Investment Companies. Not applicable to open-end investment companies.
Item 13. Exhibits.
(a)(1) Not applicable.
(a)(3) Not applicable for open-end investment companies.
(a)(4) Not applicable.
SIGNATURES
Pursuant to the requirements of the Securities Exchange Act of 1934 and the Investment Company Act of 1940, the registrant has duly caused this report to be signed on its behalf by the undersigned, thereunto duly authorized.
(Registrant) Northern Lights Fund Trust IV
By (Signature and Title)
/s/ Wendy Wang
Wendy Wang, Principal Executive Officer/President
Date 2/6/2023
Pursuant to the requirements of the Securities Exchange Act of 1934 and the Investment Company Act of 1940, this report has been signed below by the following persons on behalf of the registrant and in the capacities and on the dates indicated.
By (Signature and Title)
/s/ Wendy Wang
Wendy Wang, Principal Executive Officer/President
Date 2/6/2023______
By (Signature and Title)
/s/ Sam Singh
Sam Singh, Principal Financial Officer/Treasurer
Date 2/6/2023