UNITED STATES
SECURITIES AND EXCHANGE COMMISSION
WASHINGTON, D.C. 20549
CERTIFIED SHAREHOLDER REPORT OF REGISTERED MANAGEMENT INVESTMENT COMPANIES
Investment Company Act file number 811-23086
WP Trust
(Exact name of registrant as specified in charter) |
| 127 NW 13th Street Suite 13, Boca Raton, FL | 33432 |
| (Address of principal executive offices) | (Zip code) |
The Corporation Trust Company
Corporation Trust Center
1209 Orange St., Wilmington, DE 19801
(Name and address of agent for service) |
Registrant’s telephone number, including area code: (800) 950-9112
Date of fiscal year end: February 29
Date of reporting period: February 29, 2024
Item 1. Report to Stockholders.

IPS Strategic Capital Absolute Return Fund
Institutional Class Shares (Ticker Symbol: IPSAX)
A series of the
WP TRUST
ANNUAL REPORT
February 29, 2024 |
Investment Adviser
IPS Strategic Capital, Inc.
215 S. Wadsworth Blvd., Suite 540
Denver, CO 80226
| Table of Contents |
| |
| |
| |
| |
| IPS Strategic Capital Absolute Return Fund | |
| |
| Letter to Shareholders | 1 |
| Investment Highlights | 3 |
| Allocation of Portfolio Holdings | 3 |
| Performance Information | 4 |
| Schedule of Investments | 5 |
| Schedule of Options Written | 6 |
| Statement of Assets and Liabilities | 7 |
| Statement of Operations | 8 |
| Statements of Changes in Net Assets | 9 |
| Financial Highlights | 10 |
| |
| NOTES TO FINANCIAL STATEMENTS | 11 |
| |
| REPORT OF INDEPENDENT REGISTERED PUBLIC ACCOUNTING FIRM | 18 |
| |
| ADDITIONAL INFORMATION | 19 |
| |
| TRUSTEES AND OFFICERS | 23 |
IPS Strategic Capital Absolute Return Fund
Annual Report
February 29, 2024
(Unaudited)
Dear Shareholders,
The IPS Strategic Capital Absolute Return Fund Class I Institutional (IPSAX) (the “Fund”) shares posted a gain of 20.13% net of fees for the fiscal year ended February 29, 2024. During the fiscal year, the S&P 500® Index had a gain of 30.45% while the Bloomberg U.S Aggregate Bond Index had a gain of 3.77% . A blended portfolio comprised of 60% U.S Equity and 40% U.S. Bonds, as represented by the Bloomberg U.S Equity/Fixed Income 60/40 had a gain of 14.25% over the fiscal year.
The Fund utilizes a hedged equity strategy, seeking meaningful participation during up markets in U.S equities while providing attractive returns with lower volatility and drawdowns during down markets. With that in mind, the performance over the 12-month period ending February 29, 2024, is, in the view of the Adviser (“IPS Strategic Capital” or “IPS”) of the Fund, an acceptable performance.
Compared to the S&P 500® Index, the Fund experienced far lower volatility on returns and lower maximum drawdown within the fiscal year. The standard deviation of the monthly returns of the S&P 500® Index was 3.86% while the standard deviation of the Bloomberg U.S. Aggregate Bond Index was 2.19% . This compares to a monthly standard deviation of returns for the Fund of 2.79% which was also in line with the monthly standard deviation of the Bloomberg U.S. Equity/Fixed Income 60/40 Index, which was 2.74% . During the calendar year ended February 29, 2024, the portfolio turnover was lower than the prior fiscal year ended as a result of a decrease in the level of trading long-term securities, including exchange traded funds (ETFs).
The Fund also experienced a substantially lower maximum drawdown than its benchmarks, exhibiting a maximum drawdown using daily returns of -6.87% compared to a maximum drawdown of -10.07% for the S&P 500® Index, -9.11% for the Bloomberg U.S. Aggregate Bond Index, and -7.10% for the Bloomberg U.S. Equity/Fixed Income 60/40 Index. The core holdings of the Fund, which is exposure to the S&P 500® Index gained via index options, performed in-line with the expectations of IPS throughout the fiscal year despite the increase volatility exhibited across equity and fixed income markets.
The Fund utilizes derivatives to manage its downside risk. Specifically, the Fund will utilize options contracts on the S&P 500® Index, that are used to hedge the equity exposure of the Fund. The goal of the strategy is to provide returns that are competitive with that of a traditional 60/40 portfolio, allocated to both U.S. equities and bonds, through the use of hedges rather than allocating a substantial portion of the portfolio to debt. The hedges utilized by the Fund provided net positive returns to our Shareholders over the fiscal year as equity markets were quite volatile through this period.
This approach proved successful as fixed income markets experienced unprecedented volatility over the fiscal year on the back of multi-decade highs in inflation as measured by the Consumer Price Index (CPI). The performance of the 60/40 portfolio speaks to the lack of protection that fixed income was able to provide throughout the year. The use of explicit hedges on the S&P 500® Index allowed the Fund to outperform a 60/40 portfolio by 5.57% over the fiscal year.
IPS Strategic Capital believes that the outlook for both stocks and bonds is highly dependent on forthcoming economic data like inflation and employment figures. The Federal Reserve has maintained its stance of “higher for longer” despite fixed income markets pricing in imminent rate cuts, however they appear to be open to changing monetary policy if economic data shows signs of weakness.
The higher interest rate regime has been beneficial for both the equity exposure and hedge overlay portions of the Fund’s investment approach. Should we continue to see higher inter-
2024 Annual Report 1
est rates in the future, IPS feels that the Fund is set up to outperform its benchmarks on a risk-adjusted basis moving forward. The performance of bonds over the fiscal year drove home the issue with relying on bonds to ballast portfolios against equity market volatility and, in the view of IPS, this dynamic is here to stay until the Federal Reserve changes their policy stance.
We appreciate the continued trust in our Fund by our shareholders and look forward to continuing to manage the risks of these ever-changing markets in the future with the goal of producing above average risk adjusted returns.
Sincerely,

Dominick Paoloni, CIMA®
Portfolio Manager, IPSAX
Disclaimers:
S&P 500 ® Index is widely regarded as the best gauge of large-cap U.S. Equities. The S&P 500 Index assumes the re-investment of dividends and is an untraded index, therefore it does not reflect the cost of any management fees. The Bloomberg U.S. Aggregate Bond Index is a broad-based benchmark that measures U.S. investment grade debt. The Bloomberg U.S. Aggregate Bond Index assumes the reinvestment of dividends and is an untraded index, therefore it does not reflect the cost of any management fees. The Bloomberg U.S. Equity/Fixed Income 60/40 Index is designed to measure the performance of an index that rebalances monthly to 60% equities and 40% fixed income. The equity and fixed income allocations are represented by the Bloomberg U.S. Large Cap (B500T Index) and Bloomberg U.S. Aggregate Bond Index, respectively.
Past performance does not guarantee future results. The investment return and principal value of an investment in the Fund will fluctuate so that an investors shares, when redeemed, may be worth more or less than their original cost. Current performance may be higher or lower than the performance data quoted. Performance data current to the most recent month end are available by calling 1-866-959-9260.
The IPS Strategic Capital Absolute Return Fund’s prospectus contains important information about the Fund’s investment objectives, potential risks, management fees, charges and expenses, and other information and should be read and considered carefully before investing. You may obtain a current copy of the Fund’s prospectus by calling 1-866-959-9260. Distributed by Arbor Court Capital, LLC.
2024 Annual Report 2
IPS Strategic Capital Absolute Return Fund (Unaudited)
INVESTMENT HIGHLIGHTS
February 29, 2024
The investment objective of the IPS Strategic Capital Absolute Return Fund (the “Fund”) is total return. Under normal circumstances, the Fund’s primary strategy consists of selling and purchasing put and call options on equity indices and exchange traded funds (“ETFs”). The sale of put options generates income for the Fund, but exposes it to the risk of declines in the value of the underlying assets. The risk in purchasing options is limited to the premium paid by the Fund for the options. The sale of call options generates income for the Fund, but may limit the Fund's participation in equity market gains.
IPS Strategic Capital, Inc. (the “Adviser”) seeks to reduce the overall volatility of returns by managing a portfolio of options. The Fund buys and sells both put and call exchange-traded listed options to establish exposure to the overall market. When the Adviser believes the value of an underlying asset will decline, the Fund may purchase a put option to profit from the decline. Similarly, when the Adviser anticipates an increase in the value of an underlying asset, the Fund may purchase a call option with respect to that asset.
The Fund may take a defensive position when the Adviser believes that current market, economic, political or other conditions are unsuitable and would impair the pursuit of the Fund’s investment objectives. When taking a defensive position, the Fund may invest up to 100% of its assets in cash, cash equivalents, including but not limited to, obligations of the U.S. Government, money market fund shares, commercial paper, certificates of deposit and/or bankers acceptances, as well as other interest bearing or discount obligations or debt instruments that carry an investment grade rating by a national rating agency. When the Fund takes a defensive position, the Fund may not achieve its investment objectives.
The Adviser reallocates the Fund’s investments continually to be commensurate with the risk profile that the Adviser deems appropriate for the Fund. The Fund seeks to use leverage to modify portfolio risk to be equal to, or less than that of, the market in total.
Allocation of Portfolio Holdings
(% of Investments, Net Written Options) as of February 29, 2024
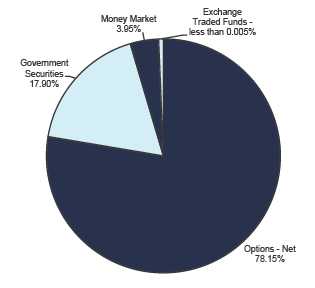
The percentages in the above graph are based on the portfolio holdings of the Fund as of February 29, 2024, and are subject to change.
For a detailed break-out of holdings by industry and exchange traded funds by investment type, please refer to the Schedule of Investments and Schedule of Options Written.
2024 Annual Report 3
IPS Strategic Capital Absolute Return Fund (Unaudited)
PERFORMANCE INFORMATION
Average Annual Rate of Return (%) for the Periods Ended February 29, 2024
| | | | | | Since | |
| | 1 Year(A) | | 5 Year(A) | | Inception(A) | |
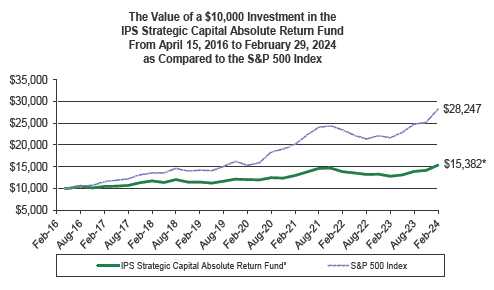
| IPS Strategic Capital Absolute Return Fund | 20.13% | | 6.02% | | 5.62% | |
| S&P 500® Index (B) | 30.45% | | 14.76% | | 14.10% | |
(A) 1 Year, 5 Year and Since Inception returns include change in share prices and in each case includes reinvestment of any dividends and capital gain distributions. The inception date of the Fund was April 15, 2016.
(B) The S&P 500® Index is a broad, unmanaged index of 500 stocks, which is widely recognized as representative of the equity market in general. Please note that the index does not take into account any fees and expenses of investing in the individual securities that it tracks and individuals cannot invest directly in any index.
For purposes of the graph and the accompanying table, it is assumed that all dividends and distributions were reinvested.
Per the Fund’s most recent prospectus, the Institutional Class’ Total Annual Operating Expense Ratio is 1.58% . The Total Annual Fund Operating Expense Ratio reported above may not correlate to the expense ratios presented in the Fund’s financial highlights because (a) the financial highlights include only the direct operating expenses incurred by the Fund, not the indirect costs of investing in acquired funds, and (b) the expense ratio may fluctuate due to changes in net assets and actual expenses incurred during the reported period.
PAST PERFORMANCE DOES NOT GUARANTEE FUTURE RESULTS. INVESTMENT RETURN AND PRINCIPAL VALUE WILL FLUCTUATE SO THAT SHARES, WHEN REDEEMED, MAY BE WORTH MORE OR LESS THAN THEIR ORIGINAL COST. RETURNS DO NOT REFLECT THE DEDUCTION OF TAXES THAT A SHAREHOLDER WOULD PAY ON FUND DISTRIBUTIONS OR THE REDEMPTION OF FUND SHARES. CURRENT PERFORMANCE MAY BE LOWER OR HIGHER THAT THE PERFORMANCE DATA QUOTED. TO OBTAIN PERFORMANCE DATA CURRENT TO THE MOST RECENT MONTH END, PLEASE CALL 1-866-959-9260. THE FUND’S DISTRIBUTOR IS ARBOR COURT CAPITAL, LLC.
2024 Annual Report 4
| IPS Strategic Capital Absolute Return Fund |
| |
| | | | | | | Schedule of Investments |
| | | | | | | February 29, 2024 |
| Shares / Principal Amount | | | | | Fair Value | | | % of Net Assets |
| |
| EXCHANGE TRADED FUNDS | | | | | | | | | |
| Equity Funds - Equity | | | | | | | | | |
| 1 | SPDR S&P 500 ETF Trust | | | | | $ 508 | | | | |
| Total for Exchange Traded Funds (Cost $209) | | | | | 508 | | | 0.00 | % |
| |
| U.S. TREASURY BILLS | | | | | | | | | |
| $ 2,000,000 | 5.37%, due 03/28/2024 ** *** | | | | | 1,992,081 | | | | |
| 2,000,000 | 5.33%, due 04/23/2024 ** *** | | | | | 1,984,439 | | | | |
| 2,800,000 | 4.04%, due 10/03/2024 ** *** | | | | | 2,716,966 | | | | |
| 2,078,000 | 5.11%, due 11/29/2024 ** *** | | | | | 2,000,813 | | | | |
| Total for U.S. Treasury Bills (Cost $8,698,237) | | | | | 8,694,299 | | | 17.32 | % |
| MONEY MARKET FUNDS | | | | | | | | | |
| 1,917,882 | Federated Hermes Government Obligations Fund - Institutional | | 1,917,882 | | | | |
| | Class 5.18% **** | | | | | 1,917,882 | | | 3.82 | % |
| Total for Money Market Funds (Cost $1,917,882) | | | | | | | | | |
| CALL/PUT OPTIONS PURCHASED | | | Notional | | | | | | |
| Expiration Date/Exercise Price | Contracts | | Amount | | Fair Value | | | % of Net Assets |
| Call Options Purchased | | | | | | | | | |
| Cboe S&P 500 Index * | | | | | | | | | |
| March 6, 2024, Call @ $5,055 | 30 | | $15,165,000 | | 151,350 | | | | |
| March 15, 2024, Call @ $4,000 | 53 | | 21,200,000 | | 5,816,485 | | | | |
| March 15, 2024, Call @ $4,075 | 7 | | 2,852,500 | | 716,205 | | | | |
| April 19, 2024, Call @ $4,100 | 5 | | 2,050,000 | | 509,350 | | | | |
| May 17, 2024, Call @ $4,150 | 8 | | 3,320,000 | | 787,800 | | | | |
| June 21, 2024, Call @ $4,000 | 43 | | 17,200,000 | | 4,945,645 | | | | |
| June 21, 2024, Call @ $4,175 | 10 | | 4,175,000 | | 981,050 | | | | |
| July 19, 2024, Call @ $4,400 | 8 | | 3,520,000 | | 630,440 | | | | |
| August 16, 2024, Call @ $4,550 | 9 | | 4,095,000 | | 604,350 | | | | |
| September 20, 2024, Call @ $4,000 | 53 | | 21,200,000 | | 6,372,985 | | | | |
| September 20, 2024, Call @ $4,500 | 8 | | 3,600,000 | | 594,600 | | | | |
| November 15, 2024, Call @ $4,000 | 60 | | 24,000,000 | | 7,420,500 | | | | |
| December 20, 2024, Call @ $4,000 | 64 | | 25,600,000 | | 8,026,560 | | | | |
| January 17, 2025, Call @ $4,000 | 68 | | 27,200,000 | | 8,640,080 | | | | |
| Total Call Options Purchased (Premiums Paid $29,641,763) | | 175,177,500 | | 46,197,400 | | | | |
| |
| Put Options Purchased | | | | | | | | | |
| Cboe S&P 500 Index * | | | | | | | | | |
| March 15, 2024 Puts @ $5,000 | 53 | | 26,500,000 | | 74,465 | | | | |
| June 21, 2024 Puts @ $5,000 | 43 | | 21,500,000 | | 347,225 | | | | |
| September 20, 2024 Puts @ $5,000 | 53 | | 26,500,000 | | 658,790 | | | | |
| November 15, 2024 Puts @ $5,000 | 60 | | 30,000,000 | | 929,700 | | | | |
| December 20, 2024 Puts @ $5,000 | 64 | | 32,000,000 | | 1,078,400 | | | | |
| January 17, 2025 Puts @ $5,000 | 68 | | 34,000,000 | | 1,194,420 | | | | |
| Total Put Options Purchased (Premiums Paid $15,100,040) | | 170,500,000 | | 4,283,000 | | | | |
| Total Options Purchased (Premiums Paid $44,741,803) | | $ 345,677,500 | | 50,480,400 | | | 100.55 | % |
| Total Investments (Cost $55,358,131) | | | | | 61,093,089 | | | 121.69 | % |
| Liabilities in Excess of Other Assets | | | | | (10,889,522 | ) | | -21.69 | % |
| Net Assets | | | | | | $ 50,203,567 | | | 100.00 | % |
| | * Non-Income Producing Securities.
** Zero coupon bond. Coupon rate disclosed represents 7-day yield at February 29, 2024.
*** Level 2 valuation. See Note 2.
**** The rate shown represents the 7-day yield at February 29, 2024. |
The accompanying notes are an integral part of these
financial statements. |
2024 Annual Report 5
| IPS Strategic Capital Absolute Return Fund | |
| |
| | | | Schedule of Options Written |
| | | | February 29, 2024 |
| CALL/PUT OPTIONS WRITTEN | | Notional | | | |
| Expiration Date/Exercise Price | Contracts | Amount | | | Fair Value |
| Call Options Written | | | | | | |
| Cboe S&P 500 Index * | | | | | | |
| March 15, 2024, Call @ $5,000 | 53 | $ | 26,500,000 | | $ | 602,610 |
| June 21, 2024, Call @ $5,000 | 43 | | 21,500,000 | | | 1,028,560 |
| September 20, 2024, Call @ $5,000 | 53 | | 26,500,000 | | | 1,767,815 |
| November 15, 2024, Call @ $5,000 | 60 | | 30,000,000 | | | 2,368,200 |
| December 20, 2024, Call @ $5,000 | 64 | | 32,000,000 | | | 2,716,800 |
| January 17, 2025, Call @ $5,000 | 68 | | 34,000,000 | | | 3,047,080 |
| Total Call Options Written (Premiums Received $5,794,498) | | | 170,500,000 | | | 11,531,065 |
| Put Options Written | | | | | | |
| Cboe S&P 500 Index * | | | | | | |
| March 8, 2024, Put @ $4,815 | 52 | | 25,038,000 | | | 5,720 |
| March 15, 2024, Put @ $4,000 | 53 | | 21,200,000 | | | 2,915 |
| March 15, 2024, Put @ $4,680 | 13 | | 6,084,000 | | | 2,698 |
| April 19, 2024, Put @ $3,500 | 9 | | 3,150,000 | | | 1,147 |
| May 17, 2024, Put @ $3,500 | 14 | | 4,900,000 | | | 3,605 |
| June 21, 2024, Put @ $3,500 | 17 | | 5,950,000 | | | 7,820 |
| June 21, 2024, Put @ $4,000 | 43 | | 17,200,000 | | | 38,700 |
| July 19, 2024, Put @ $3,525 | 15 | | 5,287,500 | | | 10,350 |
| August 16, 2024, Put @ $3,625 | 14 | | 5,075,000 | | | 14,980 |
| September 20, 2024, Put @ $3,600 | 11 | | 3,960,000 | | | 15,235 |
| September 20, 2024, Put @ $4,000 | 53 | | 21,200,000 | | | 121,105 |
| November 15, 2024, Put @ $4,000 | 60 | | 24,000,000 | | | 206,400 |
| December 20, 2024, Put @ $4,000 | 64 | | 25,600,000 | | | 257,280 |
| January 17, 2025, Put @ $4,000 | 68 | | 27,200,000 | | | 299,200 |
| Total Put Options Written (Premiums Received $4,638,524) | | | 195,844,500 | | | 987,155 |
| Total Options Written (Premiums Received $10,433,022) | | $ | 366,344,500 | | $ | 12,518,220 |
* Non-Income Producing Securities.
The accompanying notes are an integral part of these
financial statements. |
2024 Annual Report 6
| IPS Strategic Capital Absolute Return Fund | |
| |
| Statement of Assets and Liabilities | | | |
| February 29, 2024 | | | |
| |
| Assets: | | | |
| Investments at Fair Value* | $ | 61,093,089 |
| Deposit at Broker for Options Written | | | 1,759,972 |
| Dividends and Interest Receivable | | | 16,614 |
| Prepaid Expenses | | | 5,307 |
| Total Assets | | | 62,874,982 |
| Liabilities: | | | |
| Options Written at Fair Value (Premiums Received $10,433,022) | | | 12,518,220 |
| Payable to Adviser | | | 39,410 |
| Payable to Administrator | | | 2,896 |
| Payable to Chief Compliance Officer | | | 34 |
| Payable to Trustees | | | 2,027 |
| Payable for Shareholder Redemptions | | | 75,261 |
| Other Accrued Expenses | | | 33,567 |
| Total Liabilities | | | 12,671,415 |
| Net Assets | $ | 50,203,567 |
| Net Assets Consist of: | | | |
| Paid In Capital | $ | 46,439,506 |
| Total Distributable Earnings (Accumulated Deficit) | | | 3,764,061 |
| Net Assets | $ | 50,203,567 |
| |
| Net Asset Value, Offering and Redemption Price | $ | 10.80 |
| |
| * Investments at Identified Cost | $ | 55,358,131 |
| |
| Shares Outstanding (Unlimited number of shares | | | 4,648,491 |
| authorized without par value) | | | |
The accompanying notes are an integral part of these
financial statements. |
2024 Annual Report 7
| IPS Strategic Capital Absolute Return Fund | | |
| |
| Statement of Operations | | | | |
| For the fiscal year ended February 29, 2024 | | | | |
| |
| Investment Income: | | | | |
| Interest | $ | 510,904 | |
| Dividends | | | 127,071 | |
| Total Investment Income | | | 637,975 | |
| Expenses: | | | | |
| Management Fees | | | 455,588 | |
| Portfolio Software Fees | | | 65,381 | |
| Fund Accounting & Transfer Agent Fees | | | 41,334 | |
| Administration Expense | | | 33,782 | |
| Audit Fees | | | 20,304 | |
| Legal Fees | | | 19,276 | |
| Miscellaneous Expense | | | 12,809 | |
| Compliance Officer Expense | | | 12,034 | |
| Registration Expense | | | 11,137 | |
| Trustees Fees | | | 9,781 | |
| Custody Fees | | | 8,158 | |
| Insurance Expense | | | 2,928 | |
| Printing and Postage Expense | | | 2,158 | |
| Total Expenses | | | 694,670 | |
| |
| |
| Net Investment Income (Loss) | | | (56,695 | ) |
| |
| Net Realized and Unrealized Gain (Loss) on Investments: | | | | |
| Net Realized Gain (Loss) on Investments | | | 4,069 | |
| Net Realized Gain (Loss) on Options Purchased | | | (6,024,144 | ) |
| Net Realized Gain (Loss) on Options Written | | | 10,853,392 | |
| Net Change in Unrealized Appreciation (Depreciation) on Investments | | | 14,014 | |
| Net Change in Unrealized Appreciation (Depreciation) on Options Purchased | | | 9,454,829 | |
| Net Change in Unrealized Appreciation (Depreciation) on Options Written | | | (5,803,321 | ) |
| Net Realized and Unrealized Gain (Loss) on Investments | | | 8,498,839 | |
| |
| Net Increase (Decrease) in Net Assets from Operations | $ | 8,442,144 | |
The accompanying notes are an integral part of these
financial statements. |
2024 Annual Report 8
| IPS Strategic Capital Absolute Return Fund |
| | |
| Statements of Changes in Net Assets | | | | | | | | |
| | |
| | | 3/1/2023 | | | | 3/1/2022 | | |
| | | to | | | | to | | |
| | | 2/29/2024 | | | | 2/28/2023 | | |
| From Operations: | | | | | | | | |
| Net Investment Income (Loss) | $ | (56,695 | ) | | $ | (64,264 | ) | |
| Net Realized Gain (Loss) on Investments and Options | | | | | | | | |
| Contracts | | 4,833,317 | | | | (4,465,290 | ) | |
| Net Change in Unrealized Appreciation (Depreciation) | | | | | | | | |
| on Investments and Options Contracts | | 3,665,522 | | | | (90,761 | ) | |
| Net Increase (Decrease) in Net Assets from Operations | | 8,442,144 | | | | (4,620,315 | ) | |
| From Distributions to Shareholders: | | - | | | | (5,030,959 | ) | |
| From Capital Share Transactions: | | | | | | | | |
| Proceeds From Sale of Shares | | 4,943,097 | | | | 2,632,415 | | |
| Shares Issued on Reinvestment of Dividends | | - | | | | 5,030,633 | | |
| Cost of Shares Redeemed | | (5,512,755 | ) | | | (22,346,831 | ) | |
| Net Increase (Decrease) from Shareholder Activity | | (569,658 | ) | | | (14,683,783 | ) | |
| Net Increase (Decrease) in Net Assets | | 7,872,486 | | | | (24,335,057 | ) | |
| | |
| Net Assets at Beginning of Year | | 42,331,081 | | | | 66,666,138 | | |
| | |
| Net Assets at End of Year | $ | 50,203,567 | | | $ | 42,331,081 | | |
| | |
| | |
| Share Transactions: | | | | | | | | |
| Issued | | 504,931 | | | | 249,065 | | |
| Reinvested | | - | | | | 549,650 | | |
| Redeemed | | (565,293 | ) | | | (2,213,575 | ) | |
| Net Increase (Decrease) in Shares | | (60,362 | ) | | | (1,414,860 | ) | |
The accompanying notes are an integral part of these
financial statements. |
2024 Annual Report 9
| IPS Strategic Capital Absolute Return Fund |
| | |
| Financial Highlights | | | | | | | | | | | | | | | | | | | | |
| | |
| Selected data for a share outstanding throughout the year: | | | | | | | | | | | | | | | | | | | | |
| | | 3/1/2023 | | | | 3/1/2022 | | | | 3/1/2021 | | | | 3/1/2020 | | | | 3/1/2019 | | |
| | | to | | | | to | | | | to | | | | to | | | | to | | |
| | | 2/29/2024 | | | | 2/28/2023 | | | | 2/28/2022 | | | | 2/28/2021 | | | | 2/29/2020 | | |
| Net Asset Value - Beginning of Year | $ | 8.99 | | | $ | 10.89 | | | $ | 10.74 | | | $ | 10.00 | | | $ | 9.54 | | |
| Net Investment Income (Loss) (a) | | (0.01 | ) | | | (0.01 | ) | | | (0.07 | ) | | | (0.11 | ) | | | - | | + |
| Net Gain (Loss) on Investments (Realized and Unrealized) | | 1.82 | | | | (0.82 | ) | | | 0.83 | | | | 0.90 | | | | 0.46 | | |
| Total from Investment Operations | | 1.81 | | | | (0.83 | ) | | | 0.76 | | | | 0.79 | | | | 0.46 | | |
| Distributions (From Net Investment Income) | | - | | | | - | | | | - | | | | - | | + | | - | | |
| Distributions (From Capital Gains) | | - | | | | (1.07 | ) | | | (0.61 | ) | | | (0.05 | ) | | | - | | |
| Total Distributions | | - | | | | (1.07 | ) | | | (0.61 | ) | | | (0.05 | ) | | | - | | |
| | |
| Net Asset Value - End of Year | $ | 10.80 | | | $ | 8.99 | | | $ | 10.89 | | | $ | 10.74 | | | $ | 10.00 | | |
| Total Return (b) | | 20.13 | % | | | (7.59 | )% | | | 6.70 | % | | | 7.90 | % | | | 4.82 | % | |
| Ratios/Supplemental Data | | | | | | | | | | | | | | | | | | | | |
| Net Assets - End of Year (Thousands) | $ | 50,204 | | | $ | 42,331 | | | $ | 66,666 | | | $ | 61,648 | | | $ | 51,701 | | |
| Ratio of Expenses to Average Net Assets (c) (e) | | 1.53 | % | | | 1.50 | % | | | 1.50 | % | | | 1.67 | % | | | 1.65 | % | |
| Ratio of Net Investment Income (Loss) to Average | | | | | | | | | | | | | | | | | | | | |
| Net Assets (c) (d) (e) | | (0.12 | )% | | | (0.12 | )% | | | (0.56 | )% | | | (1.07 | )% | | | 0.00 | % | + |
| Portfolio Turnover Rate | | 2.45 | % | | | 453.75 | % | | | 0.00 | % | | | 50.17 | % | | | 0.00 | % | |
| | + Less than $0.005/0.005% .
(a) Per share amount calculated using the average shares method.
(b) Total return represents the rate that the investor would have earned or lost on an investment in the Fund assuming
reinvestment of dividends. Returns do not reflect the deduction of taxes a shareholder would pay on Fund distributions
or redemption of Fund shares.
(c) Ratios do not include expenses of the investment companies in which the Fund invests.
(d) Recognition of net investment income by the Fund is affected by the timing of the declaration of the dividends by
the underlying investment companies in which the Fund invests.
(e) The ratios include 0.00%, 0.06%, 0.00%, 0.00%, and 0.00% of interest expense during the fiscal years ended
February 29, 2024, February 28, 2023, February 28, 2022, February 28, 2021 and February 29, 2020, respectively. |
The accompanying notes are an integral part of these
financial statements. |
2024 Annual Report 10
NOTES TO FINANCIAL STATEMENTS
IPS STRATEGIC CAPITAL ABSOLUTE RETURN FUND
February 29, 2024
1.) ORGANIZATION AND SIGNIFICANT ACCOUNTING POLICIES
The IPS Strategic Capital Absolute Return Fund (the “Fund”) is a series of WP Trust (the “Trust”). The Trust was organized on June 4, 2015, as a Delaware statutory trust. The Trust is registered as an open-end management investment company under the Investment Company Act of 1940 (the “1940 Act”). As of February 29, 2024, there were two series authorized by the Trust. The Fund is a non-diversified Fund. As a non-diversified Fund, the Fund may invest a significant portion of its assets in a small number of companies. The Fund’s investment objective is total return. The Fund’s investment adviser is IPS Strategic Capital, Inc. (the “Adviser”). The Fund has three classes of shares, Class A, Class C and Institutional Class shares. Currently, only the Institutional Class shares are being offered for sale. The Institutional Class shares commenced operations on April 15, 2016.
The Fund is an investment company that follows the investment company accounting and reporting guidance of Financial Accounting Standards Board (“FASB”) Accounting Standards Codification Topic 946 Financial Services - Investment Companies. The financial statements are prepared in conformity with accounting principals generally accepted in the United States of America ("GAAP"). The Fund follows the significant accounting policies described in this section.
SHARE VALUATION: The net asset value (“NAV”) is generally calculated as of the close of trading on the New York Stock Exchange (the “Exchange”) (normally 4:00 p.m. Eastern time) every day the Exchange is open. The NAV is calculated by taking the total value of the Fund’s assets, subtracting its liabilities, and then dividing by the total number of shares outstanding, rounded to the nearest cent. For the Institutional Class, the offering price and redemption price per share is equal to the NAV per share.
SECURITY VALUATION: All investments in securities are recorded at their estimated fair value, as described in note 2.
OPTIONS: The Fund’s option strategy consists of selling and purchasing put and call options on equity indices and exchange traded funds (“ETFs”). The sale of put options generates income for the Fund, but exposes it to the risk of declines in the value of the underlying assets. The risk in purchasing options is limited to the premium paid by the Fund for the options. The sale of call options generates income for the Fund, but may limit the Fund's participation in equity market gains. The Fund’s Adviser seeks to reduce the overall volatility of returns by managing a portfolio of options. When the Fund writes or purchases an option, an amount equal to the premium received or paid by the Fund is recorded as a liability or an asset and is subsequently adjusted to the current value of the option written or purchased. Premiums received or paid from writing or purchasing options which expire unexercised are treated by the Fund on the expiration date as realized gains or losses. The difference between the premium and the amount paid or received on effecting a closing purchase or sale transaction, including brokerage commissions, is also treated as a realized gain or loss. If an option is exercised, the premium paid or received is added to the cost of the purchase or proceeds from the sale in determining whether the Fund has realized a gain or a loss on investment transactions.
Purchasing and selling put and call options are highly specialized activities and entail greater than ordinary investment risks. The successful use of options depends in part on the ability of the Adviser to manage future price fluctuations and the degree of correlation between the options and securities (or currency) markets. By selling call options on equity securities or indices, the Fund gives up the opportunity to benefit from potential increases in the value of the underlying securities above the strike prices of the sold call options, but continues to bear the risks of declines in the value of the markets, including the underlying indices for the puts as well, if different, as the securities that are held by the Fund. The premium received from the sold options may not be sufficient to offset any losses sustained from the volatility of the underlying equity indices over time.
The Fund will incur a loss as a result of a written option (also referred to as a short position) if the price of the written option instrument increases in value between the date when the Fund writes the option and the date on which the Fund purchases an offsetting position. The Fund’s losses are potentially large in a written put transaction and potentially unlimited in a written call transaction. Please refer to the Fund’s prospectus for a full listing of risks associated with these instruments.
ETFs AND MONEY MARKET FUNDS: The Fund may invest in ETFs and money market mutual funds (“MM Funds”). An ETF is a fund that may hold a portfolio of common stocks or bonds designed to track the performance of a securities index or sector of an index. ETFs are traded on a securities exchange based on their market value. Some ETF portfolios are designed to track the performance of an index and it is possible the ETF’s performance may not closely track its index. ETFs and MM Funds incur fees and expenses such as operating expenses, licensing fees, registration fees, trustees’ fees, and marketing expenses; and ETF and MM Fund shareholders, such as the Fund, pay their proportionate share of these expenses. Your cost of
2024 Annual Report 11
Notes to Financial Statements - continued
investing in the Fund will generally be higher than the cost of investing directly in ETFs and MM Funds. By investing in the Fund, you will indirectly bear fees and expenses charged by the underlying ETFs and MM Funds in which the Fund invests in addition to the Fund’s direct fees and expenses.
SHORT SALES OF SECURITIES: The Fund may make short sales, which are transactions in which the Fund sells a security it does not own in anticipation of a decline in the market value of that security. To complete a short-sale transaction, the Fund will borrow the security from a broker-dealer, which generally involves the payment of a premium and transaction costs. The Fund then sells the borrowed security to a buyer in the market. The Fund will then cover the short position by buying shares in the market either (i) at its discretion; or (ii) when called by the broker-dealer lender. Until the security is replaced, the Fund is required to pay the broker-dealer lender any dividends or interest that accrue during the period of the loan. In addition, the net proceeds of the short sale will be retained by the broker to the extent necessary to meet regulatory or other requirements, until the short position is closed out.
The Fund will incur a loss, unlimited in size, as a result of the short sale if the price of the security increases between the date of the short sale and the date on which the Fund replaces the borrowed security. The Fund will realize a gain if the security declines in price between those dates. The amount of any gain will be decreased, and the amount of any loss increased, by the amount of the premium, dividends, interest or expenses the Fund may be required to pay in connection with a short sale.
In addition, the Fund may make short sales “against the box” (i.e., when the Fund sells a security short when the Fund has segregated securities equivalent in kind and amount to the securities sold short, or securities convertible or exchangeable into such securities) and will hold such securities while the short sale is outstanding. The Fund will incur transaction costs, including interest, in connection with opening, maintaining, and closing short sales against the box.
FUTURES CONTRACTS: The Fund may buy and sell stock index futures contracts. A stock index futures contract obligates the seller to deliver (and the buyer to take) an amount of cash equal to a specific dollar amount times the difference between the value of a specific stock index at the close of the last trading day of the contract and the price at which the agreement was made. To the extent the Fund enters into a futures contract, it will deposit with the broker cash, cash equivalents or U.S. Treasury obligations equal to a specified percentage of the value of the futures contract (the initial margin), as required by the relevant contract market and futures commission merchant. The futures contract will be marked to market daily. Should the value of the futures contract decline relative to the Fund's position, the Fund, if required by law, will pay the futures commission merchant an amount equal to the change in value to maintain its appropriate margin balance. When the contract is closed, the Fund records a realized gain or loss equal to the difference between the proceeds from (or cost of) the closing transaction and the Fund's basis in the contract. The use of futures transactions involves the risk of imperfect correlation in movements in the price of futures contracts, interest rates, and the underlying hedged assets. The Fund may sell stock index futures contracts in anticipation of or during a market decline to attempt to offset the decrease in market value of its long positions in equity securities that might otherwise result. When the Fund is not fully invested in equity securities and anticipates a significant market advance, it may buy stock index futures in order to gain rapid market exposure that may in part or entirely offset increases in the cost of equity securities that it intends to buy. With futures, there is minimal counterparty credit risk to the Fund since futures are exchange traded and the exchange's clearing-house, as counterparty to all exchange traded futures, guarantees the futures against default.
FEDERAL INCOME TAXES: The Fund has qualified and intends to continue to qualify as a regulated investment company (“RIC”) under Subchapter M of the Internal Revenue Code of 1986, as amended (the “Code”). It is the policy of the Fund to comply with the requirements of the Code applicable to regulated investment companies and to distribute substantially all of its net investment company taxable income and net capital gains. Therefore, no provision for federal income taxes is required.
As of and during the fiscal year ended February 29, 2024, the Fund did not have a liability for any unrecognized tax benefits. The Fund recognizes interest and penalties, if any, related to unrecognized tax liability as income tax expense in the Statement of Operations. During the fiscal year ended February 29, 2024, the Fund did not incur any interest or penalties. The Fund identifies its major tax jurisdictions as U.S. Federal and the state of Delaware.
In addition, GAAP requires management of the Fund to analyze all open tax years, as defined by IRS statute of limitations, including federal tax authorities and certain state tax authorities. Management has analyzed the Fund’s tax positions and has concluded that no liability for unrecognized tax benefits should be recorded related to uncertain tax positions taken on returns filed for open tax years. The Fund has no examination in progress and is not aware of any tax positions for which it is reasonably possible that the total tax amounts of unrecognized tax benefits will significantly change in the next twelve months.
DISTRIBUTIONS TO SHAREHOLDERS: Dividends from net investment income and distributions of net realized capital gains, if any, will be declared and paid at least annually. The Fund may utilize earnings and
2024 Annual Report 12
Notes to Financial Statements - continued
profits distributed to shareholders on redemptions of shares as part of the dividends paid deduction. Income and capital gain distributions, which are determined in accordance with income tax regulations, are recorded on the ex-dividend date. GAAP requires that permanent financial reporting differences relating to shareholder distributions be reclassified to paid-in capital.
USE OF ESTIMATES: The preparation of financial statements in conformity with GAAP requires management to make estimates and assumptions that affect the reported amounts of assets and liabilities and disclosure of contingent assets and liabilities at the date of the financial statements and the reported amounts of increases and decreases in net assets from operations during the reporting period. Actual results could differ from those estimates.
EXPENSES: Expenses incurred by the Trust that do not relate to a specific fund of the Trust are allocated to the individual funds based on each fund's relative net assets or another appropriate basis (as determined by the Board of Trustees (the “Board”)).
OTHER: Investment and shareholder transactions are recorded on trade date. The Fund determines the gain or loss realized from the investment transactions by comparing the original cost of the security lot sold with the net sales proceeds using the identified cost method. Dividend income is recognized on the ex-dividend date or as soon as information is available to the Fund. Interest income and interest expenses, if any, are recognized on an accrual basis. Discounts and premiums on fixed income securities purchased are accreted or amortized over the life of the respective securities using the effective interest method. Withholding taxes on foreign dividends have been provided for in accordance with the Fund’s understanding of the applicable country’s tax rules and rates.
2.) SECURITIES VALUATIONS
PROCESSES AND STRUCTURE: The Fund’s Board has adopted guidelines for valuing securities and other derivative instruments including in circumstances in which market quotes are not readily available, and has delegated authority to the Valuation Designee to apply those guidelines in determining fair value prices, subject to review by the Board.
HIERARCHY OF FAIR VALUE INPUTS: The Fund utilizes various methods to measure the fair value of its investments on a recurring basis. GAAP establishes a hierarchy that prioritizes inputs to valuation techniques used to measure fair value. The three levels of inputs are as follows:
Level 1 - Unadjusted quoted prices in active markets for identical assets or liabilities that the Fund has the ability to access.
Level 2 - Observable inputs other than quoted prices included in level 1 that are observable for the asset or liability, either directly or indirectly. These inputs may include quoted prices for the identical instrument on an inactive market, prices for similar instruments, interest rates, prepayment speeds, credit risk, yield curves, default rates and similar data.
Level 3 - Unobservable inputs for the asset or liability, to the extent relevant observable inputs are not available, representing the Fund’s best information about the assumptions a market participant would use in valuing the assets or liabilities.
The availability of observable inputs can vary from security to security and is affected by a wide variety of factors, including, for example, the type of security, whether the security is new and not yet established in the marketplace, the liquidity of markets, and other characteristics particular to the security. To the extent that valuation is based on models or inputs that are less observable or unobservable in the market, the determination of fair value requires more judgment. Accordingly, the degree of judgment exercised in determining fair value is greatest for instruments categorized in Level 3.
The inputs used to measure fair value may fall into different levels of the fair value hierarchy. In such cases, for disclosure purposes, the level in the fair value hierarchy within which the fair value measurement falls in its entirety is determined based on the lowest level input that is significant to the fair value measurement in its entirety.
FAIR VALUE MEASUREMENTS: A description of the valuation techniques applied to the Fund’s major categories of assets and liabilities measured at fair value on a recurring basis follows.
Equity securities (including ETFs). Securities that are traded on any stock exchange or on the NASDAQ over-the-counter market are generally valued by the pricing service at the last quoted sale price on the primary exchange or market on which the security trades. Lacking a last sale price, an equity security is generally valued by the pricing service at its last bid price. In the event of a short sale of an equity security, lacking a last sale price, an equity security is generally valued by the pricing service at its last ask price. Generally, if the security is traded in an active market and is valued at the last sale price, the security is categorized as a
2024 Annual Report 13
Notes to Financial Statements - continued
level 1 security, and if an equity security is valued by the pricing service at its last bid or ask, it is generally categorized as a level 2 security. When market quotations are not readily available or when a Valuation Designee determines that the market quotation or the price provided by the pricing service does not accurately reflect the current market value, or when restricted or illiquid securities are being valued, such securities are valued pursuant to the fair value pricing procedures and are categorized as level 2 or level 3, as appropriate.
Money market funds. Money market funds are valued at net asset value and are classified in Level 1 of the fair value hierarchy.
Derivative instruments. Listed derivatives, including purchased options and written options, will be valued at the mean of the bid and ask price on the primary exchange on which the option trades and are categorized a level 1 of the fair value hierarchy. If there is not a bid and ask price on the primary exchange on which the option trades, or if the Valuation Designee determines that the mean of the bid and ask price does not accurately reflect the current value, the option will be valued at fair value as determined under the fair value pricing procedures and may be categorized as level 2 or level 3, as appropriate.
Fixed income securities. Fixed income securities, including government securities denominated in U.S. dollars, valued using market quotations in an active market, will be categorized as level 1 securities. However, they may be valued on the basis of prices furnished by a pricing service when the Adviser believes such prices more accurately reflect the fair value of such securities. A pricing service utilizes electronic data processing techniques based on yield spreads relating to securities with similar characteristics to determine prices for normal institutional-size trading units of debt securities without regard to sale or bid prices. These securities will generally be categorized as level 2 securities.
In accordance with the Trust's Valuation and Fair Value Pricing Policies and Procedures, the Fund's Valuation Committee, which includes the Valuation Designee, shall consider all appropriate factors relevant to the value of securities for which market quotations are not readily available. No single standard for determining fair value can be established, since fair value depends upon the circumstances of each individual case. As a general principle, the current fair value of an issue of securities being valued by a Fund's Valuation Committee is the price at which the security could reasonably be sold in a current market transaction. Methods that are in accord with this principle may, for example, be based on a multiple of earnings; a discount from market of a similar freely traded security (including a derivative security or a basket of securities traded on other markets, exchanges or among dealers); or yield to maturity and credit spread with respect to debt issues, or a combination of these and other methods. The Board maintains responsibilities for the fair value determinations under Rule 2a-5 under the 1940 Act and oversees the Valuation Designee.
The following tables summarize the inputs used to value the Funds’ assets and liabilities measured at fair value as of February 29, 2024:
| Valuation Inputs of Assets | Level 1 | | Level 2 | Level 3 | | Total |
| Exchange Traded Funds | $ 508 | | $ – | $– | | $ 508 |
| U.S. Treasury Bills | – | | 8,694,299 | – | | 8,694,299 |
| Call Options Purchased | 46,197,400 | | – | – | | 46,197,400 |
| Put Options Purchased | 4,283,000 | | – | – | | 4,283,000 |
| Money Market Funds | 1,917,882 | | – | – | | 1,917,882 |
| Total | $52,398,790 | | $8,694,299 | $– | | $61,093,089 |
| |
| Valuation Inputs of Liabilities | Level 1 | | Level 2 | Level 3 | | Total |
| Call Options Written | $11,531,065 | | $ – | $– | | $11,531,065 |
| Put Options Written | 987,155 | | – | – | | 987,155 |
| Total | $12,518,220 | | $ – | $– | | $12,518,220 |
Refer to the Fund’s Schedule of Investments for a listing of securities by industry. The Fund did not hold any level 3 assets during the fiscal year ended February 29, 2024.
3. DERIVATIVES TRANSACTIONS
The Fund has adopted a derivative risk management program under Rule 18f-4 of the 1940 Act which governs the Fund's use of derivative transactions. As part of the program, the Board has appointed a member of the Fund's Adviser as the derivatives risk manager.
As of February 29, 2024, $1,759,972 was held at the broker as collateral for options transactions.
The average monthly notional values of options contracts purchased and written by the Fund for the fiscal year ended February 29, 2024, were as follows:
2024 Annual Report 14
| Notes to Financial Statements - continued | | | |
| |
| Derivative Type | | Average Notional Value | |
| Call Options Purchased | | $171,073,038 | |
| Put Options Purchased | | $163,687,846 | |
| Call Options Written | | ($154,984,615) | |
| Put Options Written | | ($186,427,846) | |
As of February 29, 2024, the location on the Statement of Assets and Liabilities for financial derivative instrument fair values is as follows:
| Assets | | Location | | Equity Contracts/Total |
| Call Options Purchased | | Investments at Fair Value | | $46,197,400 |
| Put Options Purchased | | Investments at Fair Value | | 4,283,000 |
| Total Assets | | | | $50,480,400 |
| |
| Liabilities | | Location | | Equity Contracts/Total |
| Call Options Written | | Options Written at Fair Value | | $11,531,065 |
| Put Options Written | | Options Written at Fair Value | | 987,155 |
| Total Liabilities | | | | $12,518,220 |
Realized and unrealized gains and losses on derivatives contracts entered into by the Fund during the fiscal year ended February 29, 2024, are recorded in the following locations in the Statement of Operations:
| Net Change in Unrealized | | | | | |
| Appreciation (Depreciation) on: | | Location | | Equity Contracts/Total | |
| Call Options Purchased | | Options Purchased | | $18,643,073 | |
| Put Options Purchased | | Options Purchased | | (9,188,244 | ) |
| Call Options Written | | Options Written | | (6,086,509 | ) |
| Put Options Written | | Options Written | | 283,188 | |
| | | | | $3,651,508 | |
| |
| Net Realized Gain (Loss) on: | | Location | | Equity Contracts/Total | |
| Call Options Purchased | | Options Purchased | | $8,825,448 | |
| Put Options Purchased | | Options Purchased | | (14,849,592 | ) |
| Call Options Written | | Options Written | | 428,428 | |
| Put Options Written | | Options Written | | 10,424,964 | |
| | | | | $4,829,248 | |
All open derivative positions at February 29, 2024, are reflected on the Fund's Schedule of Investments and Schedule of Options Written.
The following tables present the Fund’s asset and liability derivatives available for offset under a master netting arrangement as of February 29, 2024.
| Assets: | Gross Amounts of Assets Presented in the Statement of Assets & Liabilities |
| | | | | | | | Gross Amounts Not Offset in | | |
| | | | | | | | the Statement of Assets and | | |
| | | | | | | | Liabilities | | |
| | | | Gross | | Net Amount of | | | | | | |
| | | | Amounts | | Assets | | | | | | |
| | Gross | | Offset in the | | Presented in the | | | | Cash | | |
| | Amounts of | | Statement of | | Statement of | | Financial | | Collateral | | |
| | Recognized | | Assets and | | Assets and | | Instruments | | Pledged of | | Net Amount |
| Description | Assets | | Liabilities | | Liabilities | | Pledged | | Assets | | of Assets | |
| Options Purchased | $50,480,400 | (1) | $- | | $50,480,400 | (1) | $(12,518,220) | (2) | $- | | $37,962,180 |
| |
| Total | $50,480,400 | | $- | | $50,480,400 | | $(12,518,220) | | $- | | $37,962,180 |
(1) Purchased options at value as presented in the Schedule of Investments.
(2) The amount is limited to the derivative liability balance and accordingly does not include excess collateral pledged.
2024 Annual Report 15
| Notes to Financial Statements - continued | | | | | | | |
| |
| Liabilities: | Gross Amounts of Liabilities Presented in the Statement of Assets & Liabilities | |
| | | | | | | | Gross Amounts Not Offset in | | |
| | | | | | | | the Statement of Assets and | | |
| | | | | | | | Liabilities | | |
| | | | Gross | | Net Amount of | | | | | | |
| | | | Amounts | | Liabilities | | | | | | |
| | Gross | | Offset in the | | Presented in the | | | | | | |
| | Amounts of | | Statement of | | Statement of | | Financial | | Cash | | |
| | Recognized | | Assets and | | Assets and | | Instruments | | Collateral | Net Amount |
| Description | Liabilities | | Liabilities | | Liabilities | | Pledged | | Pledged | of Liabilities |
| Options Written | $(12,518,220) | (3) | $- | | $(12,518,220) | (3) | $12,518,220 | (2) | $- | $ - |
| |
| Total | $(12,518,220) | | $- | | $(12,518,220) | | $12,518,220 | | $- | $ - |
(2) The amount is limited to the derivative liability balance and accordingly does not include excess collateral pledged.
(3) Options written at value as presented in the Schedule of Options Written.
4.) ADVISORY FEES AND OTHER RELATED PARTY TRANSACTIONS
The Fund has entered into an Investment Advisory Agreement (the “Advisory Agreement”) with the Adviser. Pursuant to the Advisory Agreement, the Adviser manages the operations of the Fund and manages the Fund’s investments in accordance with the stated policies of the Fund. As compensation for the investment advisory services provided to the Fund, the Adviser receives a monthly management fee equal to an annual rate of 1.00% of the Fund’s net assets. For the fiscal year ended February 29, 2024, the Adviser earned $455,588 of advisory fees. At February 29, 2024, $39,410 was due to the Adviser.
Premier Fund Solutions, Inc. (“PFS” or “Administrator”) serves as the Administrator for all the Funds in the Trust, pursuant to a written agreement with the Trust. PFS provides day-to-day administrative services to the Funds. For PFS’s services to the Funds, each Fund of the Trust pays PFS an annualized asset-based fee of 0.07% of average daily net assets up to $200 million, with lower fees at higher asset levels; subject to a minimum monthly fee of $2,800 per Fund, plus reimbursement of out-of-pocket expenses. For its services to the Fund, during the fiscal year ended February 29, 2024, amounts earned by PFS were $33,782. At February 29, 2024, $2,896 was due to the Administrator.
An officer of the Fund is also an employee of the Administrator.
5.) INVESTMENT TRANSACTIONS
For the fiscal year ended February 29, 2024, purchases and sales of investment securities other than U.S. Government obligations and short-term investments were $20,751,413 and $270,731, respectively.
6.) TAX MATTERS
For federal income tax purposes, at February 29, 2024, the cost of securities on a tax basis and the composition of gross unrealized appreciation (the excess of value over tax cost) and depreciation (the excess of tax cost over value) including written options were as follows:
| Cost of Investments | $ | 61,096,728 | |
| |
| Gross Unrealized Appreciation | $ | 394 | |
| Gross Unrealized Depreciation | | (4,033 | ) |
| Net Unrealized Appreciation (Depreciation) on Investments | $ | (3,639 | ) |
The difference between book basis and tax basis unrealized appreciation (depreciation) is primarily attributable to the tax treatment of derivatives.
The Fund’s tax basis distributable earnings are determined only at the end of each fiscal year. The tax character of distributable earnings (deficit) at February 29, 2024, the Fund’s most recent fiscal year end, was as follows:
| Undistributed Ordinary Income | $ | 1,512,208 | |
| Undistributed Capital Gains | | 2,255,791 | |
| Other Losses | | (299 | ) |
| Unrealized Depreciation | | (3,639 | ) |
| | $ | 3,764,061 | |
As of February 29, 2024, other losses includes $299 of losses on straddles from options. During the fiscal year ended February 29, 2024, the Fund utilized capital loss carryforwards of $4,537,619.
2024 Annual Report 16
Notes to Financial Statements - continued
As of February 29, 2024, the Fund recorded reclassifications to increase Paid In Capital and decrease Distributable Earnings by $122,623, which was primarily related to use of equalization for tax purposes.
The Fund did not have any distributions during the fiscal year ended February 29, 2024.
During the fiscal year ended February 28, 2023, the Fund distributed $5,030,959 of ordinary income.
7.) CONTROL OWNERSHIP
The beneficial ownership, either directly or indirectly, of more than 25% of the voting shares of a fund creates a presumption of control of the fund, under section 2(a)(9) of the 1940 Act. At February 29, 2024, Charles Schwab & Co., Inc., held for the benefit of its customers, in aggregate, 100.00% of Fund shares. The Trust does not know whether any underlying accounts of Charles Schwab & Co., Inc., owned or controlled 25% or more of the voting securities of the Fund.
8.) COMMITMENTS AND CONTINGENCIES
In the normal course of business, the Trust may enter into contracts that may contain a variety of representations and warranties and provide general indemnifications. The Fund’s maximum exposure under these arrangements is dependent on future claims that may be made against the Fund and, therefore, cannot be estimated; however, management considers the risk of loss from such claims to be remote.
9.) SUBSEQUENT EVENTS
Subsequent events after the date of the Statement of Assets and Liabilities have been evaluated through the date the financial statements were issued. Management has concluded that there are no subsequent events requiring adjustment to or disclosure in the financial statements.
2024 Annual Report 17
REPORT OF INDEPENDENT REGISTERED PUBLIC ACCOUNTING FIRM
To the Shareholders of IPS Strategic Capital Absolute Return Fund and
Board of Trustees of WP Trust
Opinion on the Financial Statements
We have audited the accompanying statement of assets and liabilities, including the schedules of investments and options written, of IPS Strategic Capital Absolute Return Fund (the “Fund”), a series of WP Trust, as of February 29, 2024, the related statement of operations for the year then ended, the statements of changes in net assets for each of the two years in the period then ended, the financial highlights for each of the five years in the period then ended, and the related notes (collectively referred to as the “financial statements”). In our opinion, the financial statements present fairly, in all material respects, the financial position of the Fund as of February 29, 2024, the results of its operations for the year then ended, the changes in net assets for each of the two years in the period then ended, and the financial highlights for each of the five years in the period then ended, in conformity with accounting principles generally accepted in the United States of America.
Basis for Opinion
These financial statements are the responsibility of the Fund’s management. Our responsibility is to express an opinion on the Fund’s financial statements based on our audits. We are a public accounting firm registered with the Public Company Accounting Oversight Board (United States) (“PCAOB”) and are required to be independent with respect to the Fund in accordance with the U.S. federal securities laws and the applicable rules and regulations of the Securities and Exchange Commission and the PCAOB.
We conducted our audits in accordance with the standards of the PCAOB. Those standards require that we plan and perform the audit to obtain reasonable assurance about whether the financial statements are free of material misstatement whether due to error or fraud.
Our audits included performing procedures to assess the risks of material misstatement of the financial statements, whether due to error or fraud, and performing procedures that respond to those risks. Such procedures included examining, on a test basis, evidence regarding the amounts and disclosures in the financial statements. Our procedures included confirmation of securities owned as of February 29, 2024, by correspondence with the custodian and brokers. Our audits also included evaluating the accounting principles used and significant estimates made by management, as well as evaluating the overall presentation of the financial statements. We believe that our audits provide a reasonable basis for our opinion.
We have served as the Fund’s auditor since 2016.

COHEN & COMPANY, LTD.
Milwaukee, Wisconsin
April 25, 2024
2024 Annual Report 18
ADDITIONAL INFORMATION
February 29, 2024
(Unaudited)
EXPENSE EXAMPLE |
As a shareholder of the Fund, you incur ongoing costs, including management fees and other Fund expenses. Although the Fund charges no sales loads or transaction fees, you will be assessed fees for outgoing wire transfers, returned checks and stop payment orders at prevailing rates charged by Mutual Shareholder Services, LLC, the Fund’s transfer agent. IRA accounts will be charged an $8.00 annual maintenance fee. Additionally, your account will be indirectly subject to the expenses of any underlying funds. The following example is intended to help you understand your ongoing costs of investing in the Fund and to compare these costs with similar costs of investing in other mutual funds. The example is based on an investment of $1,000 invested in the Fund on September 1, 2023, and held through February 29, 2024.
The first line of the table below provides information about actual account values and actual expenses. In order to estimate the expenses a shareholder paid during the period covered by this report, shareholders can divide their account value by $1,000 (for example, an $8,600 account value divided by $1,000 = 8.6) and then multiply the result by the number in the first line under the heading entitled “Expenses Paid During the Period.”
The second line of the table below provides information about hypothetical account values and hypothetical expenses based on the Fund’s actual expense ratios and an assumed rate of return of 5% per year before expenses, which is not the Fund’s actual return. The hypothetical account values and expenses may not be used to estimate the actual ending account balance or expenses paid by a shareholder for the period. Shareholders may use this information to compare the ongoing costs of investing in the Fund and other funds. In order to do so, compare these 5% hypothetical examples with the 5% hypothetical examples that appear in other funds’ shareholder reports.
Please note that the expenses shown in the table are meant to highlight your ongoing costs only and do not reflect any transactional costs, such as the annual maintenance fee charged to IRA accounts, or exchange fees or expenses of any underlying funds. Therefore, the second line of the table is useful in comparing ongoing costs only, and will not help you determine the relative total costs of owning different funds. In addition, if these transactional costs were included, your costs would have been higher.
| | | | | | | Expenses Paid |
| | | Beginning | | Ending | | During the Period* |
| | | Account Value | | Account Value | | September 1, 2023 |
| | | September 1, 2023 | | February 29, 2024 | | to February 29, 2024 |
| |
| Actual | | $1,000.00 | | $1,104.29 | | $7.59 |
| |
| Hypothetical | | $1,000.00 | | $1,017.65 | | $7.27 |
| (5% annual return | | | | | | |
| before expenses) | | | | | | |
* Expenses are equal to the Fund’s annualized expense ratio of 1.45%, multiplied by the average account value over the period, multiplied by 182/366 (to reflect the one-half year period).
AVAILABILITY OF QUARTERLY SCHEDULE OF INVESTMENTS
The Fund publicly files its complete schedules of portfolio holdings with the Securities and Exchange Commission (“SEC”) for the first and third quarters of each fiscal year on Form N-PORT. The Fund’s Form N-PORT is available on the SEC’s website at http://www.sec.gov.
A description of the policies and procedures that the Fund uses to determine how to vote proxies relating to portfolio securities is available without charge, upon request, by calling 1-866-959-9260; and on the Commission’s website at http://www.sec.gov.
Form N-PX provides information regarding how the Fund voted proxies with regards to portfolio securities held during the most recent 12-month period ended June 30th and is available without charge, upon request, by calling 1-866-959-9260. This information is also available on the SEC’s website at http://www.sec.gov.
2024 Annual Report 19
Additional Information (Unaudited) - continued
APPROVAL OF THE ADVISORY AGREEMENT RENEWAL FOR THE IPS STRATEGIC CAPITAL ABSOLUTE RETURN FUND
At a meeting held on January 25, 2024, the Board of Trustees (the “Board” or “Trustees”) considered the renewal of the Investment Advisory Agreement (the “Advisory Agreement”) between the Trust and IPS Strategic Capital, Inc. (the “Adviser” or “IPS Capital”) in regard to the IPS Strategic Capital Absolute Return Fund (the “IPS Fund”).
Legal Counsel to the Trust (“Counsel”) reviewed with the Board a memorandum from Counsel and addressed to the Trustees that summarized, among other things, the fiduciary duties, and responsibilities of the Board and approving the renewal of the Investment Advisory Agreement (the “Advisory Agreement”) between the Trust, on behalf of the IPS Fund, and IPS Capital. A copy of this memorandum was included in the Board Materials. Counsel discussed with the Trustees the types of information and factors that should be considered by the Board in order to make an informed decision regarding the approval of the continuation of the Advisory Agreement, including the following material factors: (i) the nature, extent and quality of the services provided by the Adviser; (ii) the investment performance of the IPS Fund; (iii) the costs of the services provided and profits to be realized by the Adviser from its relationship with the IPS Fund; (iv) the extent to which economies of scale would be realized if the IPS Fund grows and whether advisory fee levels reflect those economies of scale for the benefit of the IPS Fund’s investors; and (v) the Adviser’s practices regarding possible conflicts of interest and other benefits derived by the Adviser.
In assessing these factors and reaching its decisions, the Board took into consideration information furnished for the Board’s review and consideration throughout the year at regular Board meetings, as well as information specifically prepared and/or presented in connection with the annual renewal process, including information presented to the Board in the Adviser’s presentation earlier in the Meeting. The Board requested and was provided with information and reports relevant to the annual renewal of the Advisory Agreement, including: (i) reports regarding the services and support provided to the IPS Fund and its shareholders by the Adviser; (ii) quarterly assessments of the investment performance of IPS Fund from the Adviser; (iii) periodic commentary on the reasons for the performance; (iv) presentations by the Adviser regarding its investment philosophy, investment strategy, personnel and operations; (v) compliance reports concerning the IPS Fund and the Adviser; (vi) disclosure information contained in the registration statement of the Trust and the Form ADV of the Adviser; and (vii) a memorandum from Counsel, that summarized the fiduciary duties and responsibilities of the Board in reviewing and approving the renewal of the Advisory Agreement, including the material factors set forth above and the types of information included in each factor that should be considered by the Board in order to make an informed decision.
The Board also requested and received various informational materials including, without limitation: (i) documents containing information about the Adviser, including financial information, a description of personnel and the services provided to the IPS Fund, information on investment advice, performance, summaries of the IPS Fund’s expenses, compliance program, current legal matters and other general information; (ii) comparative expense and performance information for other mutual funds with strategies similar to the IPS Fund; and (iii) benefits to be realized by the Adviser from its relationship with the IPS Fund. The Board did not identify any particular information that was most relevant to its consideration to approve the Advisory Agreement and each Trustee may have afforded different weight to the various factors.
(1) The nature, extent and quality of the services provided by the Adviser.
In this regard, the Board considered the responsibilities the Adviser has under the Advisory Agreement with respect to IPS Fund. The Board reviewed the services provided by the Adviser to the IPS Fund including, without limitation: the Adviser’s processes for formulating investment recommendations, market monitoring and risk management and assuring compliance with the IPS Fund’s investment objectives and limitations, and the efforts to promote the IPS Fund, grow assets and assist in the distribution of the IPS Fund’s shares. The Board considered: the Adviser’s staffing, personnel, and methods of operating; the education and experience of the Adviser’s personnel; and the Adviser’s compliance program, policies, and procedures. After reviewing the foregoing and other information from the Adviser, the Board concluded that the nature, extent and quality of the services to be provided by the Adviser was satisfactory and adequate for the IPS Fund.
2024 Annual Report 20
Additional Information (Unaudited) - continued
(2) Investment Performance of the IPS Fund and the Adviser.
In considering the investment performance of the IPS Fund and the Adviser, the Trustees compared the performance of the IPS Fund with the performance of comparable funds with similar objectives managed by other investment advisers. The Trustees also considered the consistency of the Adviser’s management of the IPS Fund with its investment objective and policies and the Adviser’s ongoing commitment to the IPS Fund’s overall investment process. The Board noted that the IPS Fund, in comparison with its Morningstar Options Trading Category (the “Category”), had underperformed the Category average for the 1-year, 3-year and 5-year periods ended November 30, 2023. They also compared the IPS Fund’s performance to a subset of the Category which included funds in the Category with assets ranging from $20 million to $110 million (the “Subset Category”). The Board noted that the IPS Fund had outperformed the Subset Category average for the 1-year and 3-year periods ended November 30, 2023, and underperformed the Subset Category average for the 5-year period ended November 30, 2023. The Board also considered the range of performance within the Category and Subset Category. The Board also considered the IPS Fund’s performance relative to a peer group selected by the Adviser (the “Peer Group”), noting that the IPS Fund’s performance was within the range of performance of the Peer Group funds for the 1-year and 3-year periods ended November 30, 2023 while the IPS Fund underperformed compared to the Peer Group funds for the 5-year period ended November 30, 2023. The Board considered the Adviser’s periodic explanations of performance, including those that occurred at this Meeting. The Trustees considered the differences in the investment strategies of the separate accounts managed by the Adviser compared to the IPS Fund, noting that the Adviser manages one separate account strategy that is substantially similar to the IPS Fund’s investment objective, the IPS Stock Replacement Strategy. The Board noted that the IPS Fund underperformed compared to the separate accounts managed in this strategy during the last year. Based on the foregoing, the Board concluded that the investment performance of the IPS Fund was satisfactory.
(3) The costs of the services to be provided and profits to be realized by the Adviser from the relationship with the IPS Fund.
In considering the costs of the services to be provided and profits to be realized by the Adviser from its relationship with the IPS Fund, the Trustees considered: the Adviser’s staffing, personnel, and methods of operating; the financial condition of the; the current asset level of the IPS Fund; and the Adviser’s direct and indirect expenses, including software related expenses of the IPS Fund. The Trustees considered the financial circumstances of the Adviser and discussed the financial stability of the firm. The Trustees considered the fees and expenses of the IPS Fund (including the management fee) relative to its Category median and average. The Trustees noted that the IPS Fund’s management fee of 1.00% was higher than the Category’s median and average management fees of 0.78% and 0.83%, respectively. They also discussed how the IPS Fund’s management fee compared to the Subset Category and Peer Group, noting that the Fund’s management fee was within the range of management fees charged by the funds within these two comparative groups. The Trustees compared the IPS Fund’s overall expense ratio to its Category and Subset Category’s median and average expense ratios, noting that the Fund’s expense ratio was higher than both comparative ratios for the respective Categories, but withing the range of the Categories. They also noted that the IPS Fund’s expense ratio was higher than the expense ratio for each fund within the Peer Group. Further, the Trustees observed that every strategy managed by the Adviser is charged an annual 1.00% management fee. The Board discussed the complexity of the IPS Fund’s strategy, which is actively managed and requires daily monitoring by the Adviser. The Board also discussed the software expenses being incurred by the IPS Fund and the impact these expenses have on the Adviser and the Fund. It was noted that the IPS Fund may invest in other investment companies so the Board considered the nature of the services rendered and determined, based on the information provided by the Adviser in its response, that the fees paid with respect to the IPS Fund were based on services provided that are not duplicative of the services provided by the investment advisers to the underlying investment companies in which the IPS Fund may invest. The Board discussed the Adviser’s high level of service provided to shareholders and its overall performance record relative to its stated investment strategy. The Board considered the Adviser’s profitability as it relates to its services to the IPS Fund, concluding that, in consideration of the above the factors, the Adviser’s profitability was reasonable. The Board further concluded that the fee to be paid to the Adviser by the IPS Fund was fair and reasonable.
(4) The extent to which economies of scale would be realized as the IPS Fund grows and whether advisory fee levels reflect these economies of scale for the benefit of the IPS Fund’s investors.
In this regard, the Board considered the IPS Fund’s fee arrangements with the Adviser. The Trustees noted
2024 Annual Report 21
Additional Information (Unaudited) - continued
that the IPS Fund would benefit from economies of scale under its agreements with some of its service providers other than the Adviser as fees that were in place with those other service providers include breakpoints which if achieved will benefit shareholders. The Trustees considered that if the IPS Fund continues to grow assets the Adviser will consider adding breakpoints to its fee structure with the Fund. Following further discussion of the IPS Fund’s expected asset levels, expectations for growth and levels of fees, the Board determined that the IPS Fund’s fee arrangements, in light of all the facts and circumstances, were fair and reasonable.
(5) Possible conflicts of interest and benefits derived by the Adviser.
In considering the Adviser’s practices regarding conflicts of interest, the Trustees evaluated the potential for conflicts of interest and considered such matters as: the experience and ability of the advisory and compliance personnel assigned to the IPS Fund; the fact that the Adviser does not utilize soft dollars; the manner of placement of investments in the IPS Fund and separate accounts managed by the Adviser; and the substance and administration of the Adviser’s code of ethics. Based on the foregoing, the Board determined that the Adviser’s standards and practices relating to the identification and mitigation of possible conflicts of interest were satisfactory. The Trustees noted that there were no benefits identified by the Adviser to the Board, other than the receipt of advisory fees under the Advisory Agreement and the possible recognition for managing a public mutual fund by such groups as Morningstar, in managing the assets of the IPS Fund.
After additional consideration of the factors delineated in the memorandum provided by Counsel and further discussion among the Board, the Board determined that the compensation payable under the Advisory Agreement with respect to the IPS Fund was fair, reasonable and within a range of what could have been negotiated at arms-length in light of all the surrounding circumstances, and the Board of Trustees renewed the Advisory Agreement with respect to the IPS Fund.
| LIQUIDITY RISK MANAGEMENT PROGRAM |
During the fiscal year ended February 29, 2024, the Board reviewed the Fund’s liquidity risk management program, adopted pursuant to Rule 22e-4 under the 1940 Act. The program is overseen by the Adviser, who is the Fund’s liquidity program administrator (the “LPA”). The LPA reported that it had assessed, managed and reviewed the program for the Fund taking into consideration several factors including the liquidity of the Fund’s portfolio investments and the market, trading or investment specific considerations that may reasonably affect a security’s classification as a liquid investment. The LPA certified that the program was adequate, effectively implemented and needed no changes at that time.
2024 Annual Report 22
TRUSTEES AND OFFICERS - Unaudited
The Trustees are responsible for the management and supervision of the Fund. The Trustees approve all significant agreements between the Trust, on behalf of the Fund, and those companies that furnish services to the Fund; review performance of the Fund; and oversee activities of the Fund. Generally, each Trustee and officer serves an indefinite term or until certain circumstances occur such as their resignation, death, or otherwise as specified in the Trust’s organizational documents. Any Trustee may be removed at a meeting of shareholders by a vote meeting the requirements of the Trust’s organizational documents. The following chart shows information for the Trustees, including the Trustees who are not “interested persons” as defined in the 1940 Act (“Independent Trustees”) and the Trustees who are “interested persons” as defined in the 1940 Act (“Interested Trustees”), as well as each officer of the Trust. The address of each trustee and officer is 127 NW 13th Street, Suite 13, Boca Raton, Florida 33432. The Statement of Additional Information of the Trust includes additional information about the Fund’s Trustees and is available upon request, without charge, by calling (866) 959-9260.
Interested Trustee* and Officers
| Name, | Position | Length of | Principal | Number of | Other |
| Address, | with the | Time Served | Occupation(s) | Portfolios | Directorships |
| and Age | Trust | | During | Overseen by | Held by |
| | | | Past 5 Years | Trustee | Trustee |
| |
| Charles S. Stoll * | President, | Since 2015 | Managing Member, Winning | 2 | None |
| Year of Birth: 1955 | Trustee | | Points Advisors, LLC (1989 to | | |
| present). |
| |
| John Brandt | Vice | Since 2020 | Investment Advisor | N/A | N/A |
| Year of Birth: 1943 | President | | Representative and Portfolio | | |
| | | | Manager, Winning Points | | |
| | | | Advisors, LLC (2000 to present). | | |
| |
| John H. Lively | Secretary | Since 2017 | Attorney, Practus, LLP (law firm) | N/A | N/A |
| Year of Birth: 1969 | | | (May 2018–present); The Law | | |
| | | | Offices of John H. Lively & | | |
| | | | Associates, Inc. (law firm) (2010 | | |
| | | | to May 2018). | | |
| |
| James D. Craft | Treasurer | Since 2020 | Fund Administrator, Premier | N/A | N/A |
| Year of Birth: 1982 | and Principal | | Fund Solutions, Inc. (2007-pre- | | |
| | Financial | | sent); Chief Technology Officer, | | |
| | Officer | | Premier Fund Solutions, Inc. | | |
| | | | (2011 to present). | | |
| |
| Julian G. Winters | Chief | Since 2020 | Managing Member of Watermark | N/A | N/A |
| Year of Birth: 1968 | Compliance | | Solutions, LLC (investment man- | | |
| | Officer | | agement compliance and con- | | |
| | | | sulting) (2007 to present). | | |
| |
| Gino Malaspina | Assistant | Since 2022 | Counsel, Practus, LLP (law firm), | N/A | N/A |
| Year of Birth: 1968 | Secretary | | since Aug. 2022; Vice President | | |
| | | | and Senior Counsel, State Street | | |
| | | | Corporation, Oct. 2019 to July | | |
| | | | 2022; Senior Counsel, Apex | | |
| | | | Fund Services (formerly, Atlantic | | |
| | | | Fund Services), June 2014 to | | |
| Oct. 2019. |
* Mr. Stoll is an Interested Trustee because he is managing member of the Winning Points Advisors, LLC, the investment adviser to one fund in the Trust.
Independent Trustees
| | | | Principal | Number of | Other |
| Name, | Position | Length of | Occupation(s) | Portfolios | Directorships |
| Address, | with the | Time Served | During | Overseen by | Held by |
| and Age | Trust | | Past 5 Years | Trustee | Trustee |
| |
| Donald H. Baxter | Independent | Since 2015 | President and Treasurer, Baxter | 2 | None |
| Year of Birth: 1942 | Trustee | | Financial Corporation (investment | | |
| | | | advisor) (1989 to present). | | |
| |
| Michael G. Rogan | Independent | Since 2015 | President, Rogan & Associates, | 2 | None |
| Year of Birth: 1963 | Trustee | | Inc. (investment advisor) (1997 to | | |
| present). |
2024 Annual Report 23
This page intentionally left blank.
This page intentionally left blank.
WP TRUST
127 NW 13th Street
Suite 13
Boca Raton, FL 33432
INVESTMENT ADVISER
IPS Strategic Capital, Inc.
215 S. Wadsworth Blvd.
Suite 540
Denver, CO 80226
FUND ADMINISTRATOR
Premier Fund Solutions, Inc.
1939 Friendship Drive
Suite C
El Cajon, CA 92020
TRANSFER AGENT AND FUND ACCOUNTANT
Mutual Shareholder Services, LLC
8000 Town Centre Drive
Suite 400
Broadview Heights, OH 44147
DISTRIBUTOR
Arbor Court Capital, LLC
8000 Town Centre Drive
Suite 400
Broadview Heights, OH 44147
INDEPENDENT REGISTERED PUBLIC ACCOUNTING FIRM
Cohen & Company, Ltd.
342 N. Water Street
Suite 830
Milwaukee, WI 53202
LEGAL COUNSEL
Practus, LLP
11300 Tomahawk Creek Parkway
Suite 310
Leawood, KS 66211
CUSTODIAN BANK
Fifth Third Bank
Fifth Third Center
38 Fountain Square Plaza
Cincinnati, OH 45263 |
(b) Not applicable.
Item 2. Code of Ethics.
The registrant has adopted a code of ethics that applies to the registrant’s principal executive officer and the principal financial officer. The registrant has not made any amendments to its code of ethics during the covered period. The registrant has not granted any waivers from any provisions of the code of ethics during the covered period. A copy of the registrant’s Code of Ethics is filed herewith.
Item 3. Audit Committee Financial Expert.
The registrant's Board of Trustees has determined that the registrant has at least one audit committee financial expert serving on its audit committee. The name of the audit committee financial expert is Ronald F. Rohe. Mr. Rohe is “independent” for purposes of this Item.
Item 4. Principal Accountant Fees and Services.
(a-d) The following table details the aggregate fees billed for each of the last two fiscal years for audit fees, audit-related fees, tax fees and other fees by the principal accountant to the registrant. The principal accountant has provided no services to the adviser or any entity controlled by, or under common control with the adviser that provides ongoing services to the registrant.
| | | FYE 2/29/2024 | | FYE 2/28/2023 |
| Audit Fees | | $16,500 | | $16,000 |
| Audit-Related Fees | | $0 | | $0 |
| Tax Fees | | $5,000 | | $5,000 |
| All Other Fees | | $750 | | $750 |
Nature of Tax Fees: preparation of Excise Tax Statement, 1120 RIC, and review of year end dividend calculation. All Other Fees: Semi-Annual Report Review.
(e) (1) The audit committee approves all audit and non-audit related services and, therefore, has not adopted pre-approval policies and procedures described in paragraph (c)(7) of Rule 2-01 of Regulation S-X.
(e) (2) None of the services described in paragraph (b) through (d) of this Item were approved by the audit committee pursuant to paragraph (c)(7)(i)(C) of Rule 2-01 of Regulation S-X.
(f) All of the principal accountant’s hours spent on auditing the registrant’s financial statements were attributed to work performed by full-time permanent employees of the principal accountant.
(g) The following table indicates the aggregate non-audit fees billed by the registrant’s principal accountant for services to the registrant, the registrant’s investment adviser (not sub-adviser), and any entity controlling, controlled by, or under common control with the adviser that provides ongoing services to the registrant, for the last two years.
| Non-Audit Fees | | FYE 2/29/2024 | | FYE 2/28/2023 |
| Registrant | | $5,750 | | $4,250 |
| Registrant’s Investment Adviser | | $0 | | $0 |
(h) The principal accountant provided no services to the investment adviser or any entity controlling, controlled by, or under common control with the adviser that provides ongoing services to the registrant.
(i) Not applicable.
(j) Not applicable.
Item 5. Audit Committee of Listed Companies. Not applicable.
Item 6. Investments.
(a) Not applicable. Schedule filed with Item 1.
(b) Not applicable.
Item 7. Disclosure of Proxy Voting Policies and Procedures for Closed-End Management Investment Companies. Not applicable.
Item 8. Portfolio Managers of Closed End Management Investment Companies. Not applicable.
Item 9. Purchases of Equity Securities by Closed-End Management Investment Companies and Affiliated Purchasers. Not applicable.
Item 10. Submission of Matters to a Vote of Security Holders.
The registrant has not adopted procedures by which shareholders may recommend nominees to the registrant’s board of trustees.
Item 11. Controls and Procedures.
(a) The Registrant’s president and chief financial officer concluded that the disclosure controls and procedures (as defined in Rule 30a-3(c) under the Act (17 CFR 270.30a -3(c))) as of a date within 90 days of the filing date of the report that includes the disclosure required by this paragraph, based on the evaluation of these controls and procedures required by Rule 30a-3(b) under the Act (17 CFR 270.30a -3(b)) and Rules 13a-15(b) or 15d-15(b) under the Exchange Act (17 CFR 240.13a -15(b) or 240.15d -15(b)).
(b) There were no changes in the registrant’s internal control over financial reporting (as defined in Rule 30a-3(d) under the Act (17 CFR 270.30a -3(d)) that occurred during the period covered by this report that has materially affected, or is reasonably likely to materially affect, the registrant’s internal control over financial reporting.
Item 12. Disclosure of Securities Lending Activities for Closed-End Management Investment Companies.
Not applicable.
Item 13. Exhibits.
(a)(1) Code of Ethics. Filed herewith.
(a)(2) Certifications pursuant to Section 302 of the Sarbanes-Oxley Act of 2002. Filed herewith.
(a)(3) Not applicable.
(a)(4) Not applicable.
(b) Certification pursuant to Section 906 of the Sarbanes-Oxley Act of 2002. Filed herewith.
Pursuant to the requirements of the Securities Exchange Act of 1934 and the Investment Company Act of 1940, the registrant has duly caused this report to be signed on its behalf by the undersigned, thereunto duly authorized.
| | By: /s/Charles S. Stoll
Charles S. Stoll
Principal Executive Officer |
Pursuant to the requirements of the Securities Exchange Act of 1934 and the Investment Company Act of 1940, this report has been signed below by the following persons on behalf of the registrant and in the capacities and on the dates indicated.
| | By: /s/Charles S. Stoll
Charles S. Stoll
Principal Executive Officer |
| | By: /s/James Craft
James Craft
Chief Financial Officer |