UNITED STATES
SECURITIES AND EXCHANGE COMMISSION
Washington, D.C. 20549
FORMN-CSR
CERTIFIED SHAREHOLDER REPORT OF REGISTERED
MANAGEMENT INVESTMENT COMPANIES
Investment Company Act file number811-23096
Legg Mason ETF Investment Trust
(Exact name of registrant as specified in charter)
620 Eighth Avenue, 49th Floor, New York, NY 10018
(Address of principal executive offices) (Zip code)
Robert I. Frenkel, Esq.
Legg Mason & Co., LLC
100 First Stamford Place
Stamford, CT 06902
(Name and address of agent for service)
Registrant’s telephone number, including area code:1-877-721-1926
Date of fiscal year end: November 30
Date of reporting period: November 30, 2018
| ITEM 1. | REPORT TO STOCKHOLDERS. |
TheAnnual Report to Stockholders is filed herewith.

| | |
| Annual Report | | November 30, 2018 |
CLEARBRIDGE
DIVIDEND STRATEGY ESG ETF
YLDE
Beginning in January 2021, as permitted by regulations adopted by the Securities and Exchange Commission, the Fund intends to no longer mail paper copies of the Fund’s shareholder reports like this one, unless you specifically request paper copies of the reports from your financial intermediary (such as a broker-dealer or bank). Instead, the reports will be made available on a website, and you will be notified by mail each time a report is posted and provided with a website link to access the report.
If you already elected to receive shareholder reports electronically (“e-delivery”), you will not be affected by this change and you need not take any action. If you have not already elected e-delivery, you may elect to receive shareholder reports and other communications from the Fund electronically by contacting your financial intermediary.
You may elect to receive all future reports in paper free of charge by contacting your financial intermediary to request that you continue to receive paper copies of your shareholder reports. Your election to receive reports in paper will apply to all Legg Mason Funds held in your account with your financial intermediary.

|
| INVESTMENT PRODUCTS: NOT FDIC INSURED • NO BANK GUARANTEE • MAY LOSE VALUE |
Fund objective
The Fund seeks dividend income, growth of dividend income and long-term capital appreciation.
Letter from the president

Dear Shareholder,
We are pleased to provide the annual report of ClearBridge Dividend Strategy ESG ETF for the twelve-month reporting period ended November 30, 2018. Please read on for a detailed look at prevailing economic and market conditions during the Fund’s reporting period and to learn how those conditions have affected Fund performance.
As always, we remain committed to providing you with excellent service and a full spectrum of investment choices. We also remain committed to supplementing the support you receive from your financial advisor. One way we accomplish this is through our website, www.leggmason.com. Here you can gain immediate access to market and investment information, including:
| • | | Fund net asset value and market price, |
| • | | Market insights and commentaries from our portfolio managers, and |
| • | | A host of educational resources. |
We look forward to helping you meet your financial goals.
Sincerely,

Jane Trust, CFA
President and Chief Executive Officer
December 28, 2018
| | |
| II | | ClearBridge Dividend Strategy ESG ETF |
Investment commentary
Economic review
Economic activity in the U.S. was mixed during the twelve months ended November 30, 2018 (the “reporting period”). Looking back, the U.S. Department of Commerce reported that fourth quarter 2017 and first quarter 2018 U.S. gross domestic product (“GDP”)i growth was 2.3% and 2.2%, respectively. GDP growth then accelerated to 4.2% during the second quarter of 2018 — the strongest reading since the third quarter of 2014. Finally, the U.S. Department of Commerce’s final reading for third quarter 2018 GDP growth — released after the reporting period ended — was 3.4%. The deceleration in GDP growth in the third quarter of 2018 reflected a downturn in exports and decelerations in nonresidential fixed investment and personal consumption expenditures. Imports increased in the third quarter after decreasing in the second. These movements were partly offset by an upturn in private inventory investment.
Job growth in the U.S. was solid overall and supported the economy during the reporting period. As reported by the U.S. Department of Labor, when the reporting period ended on November 30, 2018, the unemployment rate was 3.7%, versus 4.1% when the period began. November 2018’s reading equaled the lowest unemployment rate since 1969. The percentage of longer-term unemployed also declined during the reporting period. In November 2018, 20.8% of Americans looking for a job had been out of work for more than six months, versus 22.9% when the period began.
Looking back, at its meeting that concluded on September 20, 2017, the Federal Reserve Board (the “Fed”)ii kept the federal funds rateiii on hold, but reiterated its intention to begin reducing its balance sheet, saying, “In October, the Committee will initiate the balance sheet normalization program….” At its meeting that ended on December 13, 2017, the Fed raised rates to a range between 1.25% and 1.50%. As widely expected, the Fed again raised rates at its meetings that ended on March 21, 2018 (to a range between 1.50% and 1.75%), June 13, 2018 (to a range between 1.75% and 2.00%) and September 26, 2018 (to a range between 2.00% and 2.25%). Finally, at its meeting that ended on December 19, 2018, after the reporting period ended, the Fed raised rates to a range between 2.25% and 2.50%.
As always, thank you for your confidence in our stewardship of your assets.
Sincerely,
Jane Trust, CFA
President and Chief Executive Officer
December 28, 2018
All investments are subject to risk including the possible loss of principal. Past performance is no guarantee of future results.
| i | Gross domestic product (“GDP”) is the market value of all final goods and services produced within a country in a given period of time. |
| ii | The Federal Reserve Board (the “Fed”) is responsible for the formulation of U.S. policies designed to promote economic growth, full employment, stable prices, and a sustainable pattern of international trade and payments. |
| iii | The federal funds rate is the rate charged by one depository institution on an overnight sale of immediately available funds (balances at the Federal Reserve) to another depository institution; the rate may vary from depository institution to depository institution and from day to day. |
| | |
| ClearBridge Dividend Strategy ESG ETF | | III |
Fund overview
Q. What is the Fund’s investment strategy?
A. ClearBridge Dividend Strategy ESG ETF (the “Fund”) seeks dividend income, growth
of dividend income and long-term capital appreciation.
Under normal circumstances, the Fund will invest at least 80% of its net assets, plus borrowings for investment purposes, if any, in dividend-paying stocks or other instruments with similar economic characteristics that offer the potential for income growth and capital appreciation over time and that meet its financial and environmental, social and governance (“ESG”) criteria. The Fund may also invest in companies that ClearBridge Investments, LLC (“ClearBridge”), the Fund’s subadviser, believes are making substantial progress toward becoming a leader in ESG policies.
The Fund invests primarily in common stocks. Equity securities in which the Fund may invest also include preferred securities, convertible securities, securities of other investment companies and of real estate investment companies (“REITs”)i and warrants and rights. The Fund may invest in equity securities of foreign issuers, either directly or through depositary receipts. The Fund may invest in companies of any size but focuses on large cap companies. We, as portfolio managers, focus on companies that we believe to be of high quality and that:
| • | | Pay an attractive dividend |
| • | | Have the potential to significantly grow their dividends |
| • | | Provide consistent and competitive risk-adjusted returns achieved by capitalizing on the convergence between a company’s investment potential and its ESG attributes. |
Q. What were the overall market conditions during the Fund’s reporting period?
A. U.S. equity markets finished with decent returns for the twelve-month reporting period ended November 30, 2018, with the S&P 500 Indexii advancing 6.27%.Small-cap stocks struggled, especially toward the end of the reporting period, with the Russell 2000 Indexiii edging up 0.57%. Growth stocks of both large and small market capitalization companies outperformed value stocks during the reporting period, with the large-cap Russell 1000 Growth Index’siv 8.59% return besting its value counterpart, the Russell 1000 Value Index’sv 2.96% gain and thesmall-cap Russell 2000 Growth Index’svi 2.81% return capping the Russell 2000 Value Index’svii 1.83% decline.
The stock market opened the year strongly and then experienced a correction in February 2018 caused by higher interest rates, fear of increasing inflation and concerns regarding trade disputes. Overall, investors focused on U.S. economic strength and strong earnings growth, which were helped by tax cuts passed at the end of 2017, to push equity markets higher. U.S. equities underwent another correction in October 2018, however, as a mix of continuing trade concerns, higher interest rates and uninspiring financial results from some mega cap tech companies combined to make for a volatile month.
For most of the year, the cyclical sectors most tied to the performance of the U.S. economy led the market. Information Technology (“IT”) was a strong performer during the reporting period. Consumer discretionary stocks also performed well, as low unemployment, gently rising wages and
| | |
| ClearBridge Dividend Strategy ESG ETF 2018 Annual Report | | 1 |
Fund overview (cont’d)
cycle-high consumer confidence created a good environment for discretionary spending. Materials stocks, however, faced cost pressures and underperformed the market.
U.S. economic indicators were generally powerful during the reporting period. U.S. gross domestic product (“GDP”)viii growth, as measured by the U.S. Department of Commerce, rose to over 4% in the second quarter of 2018; jobless claims hit a five-decade low. Unemployment was at levels below the commonly acceptednon-inflationary rate, putting the Federal Reserve Board (the “Fed”)ix on inflation watch. Capital expenditures also reached the highest level of this business cycle, helped by incentives in the tax reform law. Share repurchases for companies in the S&P 500 were $191 billion in the second quarter of 2018, the highest amount ever.
Seeing a steadily growing U.S. economy with low unemployment and core inflation approaching its target 2%, the Fed raised the federal funds ratex four times during the period. The target range at the end of the period was 2.00% and 2.25%. The yield on theten-year U.S. Treasury likewise rose, from 2.3% to 3.0%, and pressured defensive, yield-oriented sectors such as the Consumer Staples, Real Estate and Utilities sectors, which underperformed the market during the reporting period.
Q. How did we respond to these changing market conditions?
A.The Fund has always taken a diversified approach across sectors with an emphasis on dividend growth rather than seeking to maximize high current yield. Our broad exposure to dividend growers promoted performance in line with expectations throughout the reporting period.
We target companies with a track record of dividend increases and the combination of financial strength and growth which should enable them to continue raising their dividend payments. These companies typically feature healthy balance sheets and consistent cash flows that provide plenty of capital to effectively operate their business and fund a growing dividend. In an environment of slowly rising interest rates, easing regulatory burdens potentially benefiting banks, and reasonable valuations, we increased the Fund’s Financials sector exposure by initiating positions in PNC Financial Services Group Inc. and increasing positions in U.S. Bancorp, MetLife Inc., Bank of New York Mellon Corp. and Bank of America Corp.
We also increased aggregate exposure to the Materials sector by initiating a position in Vulcan Materials Co., a leading construction aggregates company with dominant market position in an industry with relatively low risk of technological obsolescence. It has also shown a strong ability to maintain pricing in cyclical downturns.
Performance review
For the twelve months ended November 30, 2018, ClearBridge Dividend Strategy ESG ETF generated a 5.75% return on a net asset value (“NAV”)xi basis and 5.97% based on its market pricexii per share.
The performance table shows the Fund’s total return for the twelve months ended November 30, 2018 based on its NAV and market price as of November 30, 2018. The Fund’s broad-based market index, the S&P 500 Index, returned 6.27% over the same time frame. The Lipper Equity Income Funds
| | |
| 2 | | ClearBridge Dividend Strategy ESG ETF 2018 Annual Report |
Category Average1returned 2.67% for the period. Please note that Lipper performance returns are based on each fund’s NAV.
| | | | | | | | |
Performance Snapshotas of November 30, 2018
(unaudited) | |
| | | 6 months | | | 12 months | |
| ClearBridge Dividend Strategy ESG ETF: | | | | | | | | |
$28.46 (NAV) | | | 5.28 | % | | | 5.75 | %*† |
$28.51 (Market Price) | | | 5.27 | % | | | 5.97 | %*‡ |
| S&P 500 Index | | | 3.02 | % | | | 6.27 | % |
| Lipper Equity Income Funds Category Average1 | | | 2.35 | % | | | 2.67 | % |
The performance shown represents past performance. Past performance is no guarantee of future results and current performance may be higher or lower than the performance shown. Principal value and investment returns will fluctuate so shares, when sold, may be worth more or less than their original cost. Performance data current to the most recentmonth-end is available at www.leggmason.com/etf.
Investors buy and sell shares of an exchange-traded fund (“ETF”) at market price (not NAV) in the secondary market throughout the trading day. These shares are not individually available for direct purchase from or direct redemption to the ETF. Market price returns shown are typically based upon themid-point between the bid and ask on the Fund’s principal trading market when the Fund’s NAV is determined, which is typically 4:00 p.m. Eastern time (US). These returns do not represent investors’ returns had they traded shares at other times. Performance figures for periods shorter than one year represent cumulative figures and are not annualized.
Information showing the number of days the market price of the Fund’s shares was greater than the Fund’s NAV and the number of days it was less than the Fund’s NAV (i.e., premium or discount) for various time periods is available by visiting the Fund’s website at www.leggmason.com/etf.
As of the Fund’s current prospectus dated March 31, 2018, the gross total annual fund operating expense ratio for the Fund was 0.60%.
* Total returns are based on changes in NAV or market price, respectively. Returns reflect the deduction of all Fund expenses. Returns do not reflect the deduction of brokerage commissions or taxes that investors pay on distributions or the sale of shares.
† Total return assumes the reinvestment of all distributions at NAV.
‡ Total return assumes the reinvestment of all distributions at market price.
Q. What were the leading contributors to performance?
A.On an absolute basis, the Fund had positive returns in seven of the eleven economic sectors in which it was invested during the reporting period, with the greatest contribution to returns coming from the IT and Health Care sectors. Relative to the benchmark, stock selection in the IT, Industrials and Health Care sectors drove performance. In terms of sector allocation, an underweight to the Energy sector aided performance.
| 1 | Lipper, Inc., a wholly-owned subsidiary of Reuters, provides independent insight on global collective investments. Returns are based on the period ended November 30, 2018, including the reinvestment of all distributions, including returns of capital, if any, calculated among the 554 funds for the six-month period and 542 funds for the twelve-month period in the Fund’s Lipper category. |
| | |
| ClearBridge Dividend Strategy ESG ETF 2018 Annual Report | | 3 |
Fund overview (cont’d)
Q. What were the leading detractors from performance?
A.Relative to the benchmark, the Fund’s overweight to the Materials sector and underweights to the Health Care and IT sectors detracted the most from performance during the reporting period. Stock selection in the Energy and Financials sectors also hurt relative results.
In terms of individual Fund holdings, leading detractors from performance for the period included Schlumberger Ltd., Weyerhaeuser Co., DowDuPont Inc., International Paper Co. and BlackRock Inc.
Q. Were there any significant changes to the Fund during the reporting period?
A.Over the course of the reporting period we established new positions in PNC Financial Services Group Inc. and Vulcan Materials Co. Shares of Time Warner Inc. were converted to shares of AT&T Inc. following AT&T Inc.’s acquisition of Time Warner Inc. and were retained. We closed positions in Pentair PLC, Aflac Inc. and Kimberly-Clark Corporation.
Looking for additional information?
The Fund’s daily NAV is availableon-line at www.leggmason.com/etf. The Fund is traded under the symbol “YLDE” and its closing market price is available on most financial websites. In a continuing effort to provide information concerning the Fund, shareholders may call1-877-721-1926 (toll free), Monday through Friday from 8:00 a.m. to 5:30 p.m. Eastern time, for the Fund’s current NAV, market price and other information.
Thank you for your investment in ClearBridge Dividend Strategy ESG ETF. As always, we appreciate that you have chosen us to manage your assets and we remain focused on achieving the Fund’s investment goals.
Sincerely,

Michael Clarfeld, CFA
Portfolio Manager
ClearBridge Investments, LLC

Mary Jane McQuillen
Portfolio Manager
ClearBridge Investments, LLC

Scott Glasser
Portfolio Manager
ClearBridge Investments, LLC

Peter Vanderlee, CFA
Portfolio Manager
ClearBridge Investments, LLC
December 21, 2018
RISKS:Equity securities are subject to market and price fluctuations. Dividends are not guaranteed, and a company may reduce or eliminate its dividend at any time. The Fund’s environmental, social and governance (“ESG”) investment strategy may limit the types and number of investment opportunities available to the Fund and, as a result, may underperform
| | |
| 4 | | ClearBridge Dividend Strategy ESG ETF 2018 Annual Report |
funds that are not subject to such criteria. The Fund’s ESG investment strategy may result in the Fund investing in securities or industry sectors that underperform the market as a whole, or forgoing opportunities to invest in securities that might otherwise be advantageous to buy. The Fund may also underperform other funds screened for different ESG standards. In addition, the subadviser may be unsuccessful in creating a portfolio composed of companies that exhibit positive ESG characteristics.
Small-andmid-cap stocks involve greater risks and volatility thanlarge-cap stocks. The Fund’s investments in securities of foreign issuers or issuers with significant exposure to foreign markets involve additional risk. Foreign securities are subject to certain risks of overseas investing, including currency fluctuations and social, political and economic uncertainties, which could result in significant market fluctuations. Securities or other assets in the Fund’s portfolio may underperform in comparison to the general financial markets, a particular financial market or other asset classes. Please see the Fund’s prospectus for a more complete discussion of these and other risks and the Fund’s investment strategies.
All investments are subject to risk including the possible loss of principal. Past performance is no guarantee of future results. An index is a statistical composite that tracks a specified financial market, sector or rule-based investment process. Unlike a fund, an index does not actually hold a portfolio of securities and therefore does not incur the expenses incurred by a fund. These expenses negatively impact fund performance. All index performance reflects no deduction for fees, expenses or taxes. Please note that an investor cannot invest directly in an index.
The mention of sector breakdowns is for informational purposes only and should not be construed as a recommendation to purchase or sell any securities. The information provided regarding such sectors is not a sufficient basis upon which to make an investment decision. Investors seeking financial advice regarding the appropriateness of investing in any securities or investment strategies discussed should consult their financial professional. The Fund’s top five sector holdings (as a percentage of net assets) as of November 30, 2018 were: Information Technology (13.4%), Financials (12.9%), Consumer Staples (12.1%), Industrials (11.6%) and Materials (11.5%). The Fund’s composition may differ over time.
The information provided is not intended to be a forecast of future events, a guarantee of future results or investment advice. Views expressed may differ from those of the firm as a whole.
| | |
| ClearBridge Dividend Strategy ESG ETF 2018 Annual Report | | 5 |
Fund overview (cont’d)
| i | Real estate investment trusts (“REITs”) invest in real estate or loans secured by real estate and issue shares in such investments, which can be illiquid. |
| ii | The S&P 500 Index is an unmanaged index of 500 stocks and is generally representative of the performance of larger companies in the U.S. |
| iii | The Russell 2000 Index measures the performance of the small-cap segment of the U.S. equity universe. The Russell 2000 is a subset of the Russell 3000 Index representing approximately 10% of the total market capitalization of that index. It includes approximately 2,000 of the smallest securities based on a combination of their market cap and current index membership. The Russell 3000 Index measures the performance of the 3,000 largest U.S. companies based on total market capitalization, which represents approximately 98% of the U.S. equity market. |
| iv | The Russell 1000 Growth Index measures the performance of those Russell 1000 Index companies with higher price-to-book ratios and higher forecasted growth values. (A price-to-book ratio is the price of a stock compared to the difference between a company’s assets and liabilities). The Russell 1000 Index measures the performance of the large-cap segment of the U.S. equity universe. It is a subset of the Russell 3000 Index and includes approximately 1,000 of the largest securities based on a combination of their market cap and current index membership. The Russell 1000 represents approximately 90% of the U.S. market. |
| v | The Russell 1000 Value Index measures the performance of the large-cap value segment of the U.S. equity universe. It includes those Russell 1000 Index companies with lower price-to-book ratios and lower expected growth values. |
| vi | The Russell 2000 Growth Index measures the performance of the small-cap growth segment of the U.S. equity universe. It includes those Russell 2000 Index companies with higher price-to-value ratios and higher forecasted growth values. |
| vii | The Russell 2000 Value Index measures the performance of those Russell 2000 Index companies with lower price-to-book ratios and lower forecasted growth values. |
| viii | Gross domestic product (“GDP”) is the market value of all final goods and services produced within a country in a given period of time. |
| ix | The Federal Reserve Board (the “Fed”) is responsible for the formulation of U.S. policies designed to promote economic growth, full employment, stable prices and a sustainable pattern of international trade and payments. |
| x | The federal funds rate is the rate charged by one depository institution on an overnight sale of immediately available funds (balances at the Federal Reserve) to another depository institution; the rate may vary from depository institution to depository institution and from day to day. |
| xi | Net Asset Value (NAV) is calculated by subtracting total liabilities from total assets and dividing the results by the number of shares outstanding. |
| xii | Market price is determined by supply and demand. It is the price at which an investor purchases or sells shares of the Fund. The Market price may differ from the Fund’s NAV. |
| | |
| 6 | | ClearBridge Dividend Strategy ESG ETF 2018 Annual Report |
Fund at a glance†(unaudited)
Investment breakdown(%) as a percent of total investments
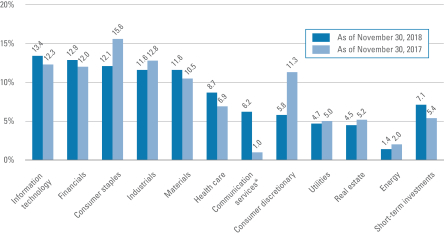
| † | The bar graph above represents the composition of the Fund’s investments as of November 30, 2018 and November 30, 2017. The composition of the Fund’s investments is subject to change at any time. |
| * | As of September 28, 2018, the Telecommunication Services sector was broadened to include some companies previously classified in the Consumer Discretionary and Information Technology sectors and renamed the Communication Services sector. |
| | |
| ClearBridge Dividend Strategy ESG ETF 2018 Annual Report | | 7 |
Fund expenses(unaudited)
Example
As a shareholder of the Fund, you may incur two types of costs: (1) transaction costs, such as brokerage commissions paid on purchases and sales of Fund shares; and (2) ongoing costs, including management fees; and other Fund expenses. This example is intended to help you understand your ongoing costs (in dollars) of investing in the Fund and to compare these costs with the ongoing costs of investing in other funds.
This example is based on an investment of $1,000 invested on June 1, 2018 and held for the six months ended November 30, 2018.
Actual expenses
The table below titled “Based on Actual Total Return” provides information about actual account values and actual expenses. You may use the information provided in this table, together with the amount you invested, to estimate the expenses that you paid over the period. To estimate the expenses you paid on your account, divide your ending account value by $1,000 (for example, an $8,600 ending account value divided by $1,000 = 8.6), then multiply the result by the number under the heading entitled “Expenses Paid During the Period”.
Hypothetical example for comparison purposes
The table below titled “Based on Hypothetical Total Return” provides information about hypothetical account values and hypothetical expenses based on the actual expense ratio and an assumed rate of return of 5.00% per year before expenses, which is not the Fund’s actual return. The hypothetical account values and expenses may not be used to estimate the actual ending account balance or expenses you paid for the period. You may use the information provided in this table to compare the ongoing costs of investing in the Fund and other funds. To do so, compare the 5.00% hypothetical example relating to the Fund with the 5.00% hypothetical examples that appear in the shareholder reports of the other funds.
Please note that the expenses shown in the table below are meant to highlight your ongoing costs only and do not reflect any transactional costs, such as brokerage commissions paid on purchases and sales of Fund shares. Therefore, the table is useful in comparing ongoing costs only, and will not help you determine the relative total costs of owning different funds. In addition, if these transaction costs were included, your costs would have been higher.
| | | | | | | | | | | | | | | | | | | | | | | | | | | | | | | | | | | | | | | | | | | | | | | | | | |
| Based on actual total return1 | | | | Based on hypothetical total return1 |
Actual
Total
Return2 | | Beginning
Account
Value | | Ending
Account
Value | | Annualized
Expense
Ratio | | Expenses
Paid During
the Period3 | | | | Hypothetical
Annualized
Total Return | | Beginning
Account
Value | | Ending
Account
Value | | Annualized
Expense
Ratio | | Expenses
Paid During
the Period3 |
| | | 5.28% | | | | $ | 1,000.00 | | | | $ | 1,052.80 | | | | | 0.59 | % | | | $ | 3.04 | | | | | | | 5.00 | % | | | | $1,000.00 | | | | $ | 1,022.11 | | | | | 0.59 | % | | | $ | 2.99 | |
| 1 | For the six months ended November 30, 2018. |
| 2 | Assumes the reinvestment of all distributions, including returns of capital, if any, at net asset value. Total return is not annualized, as it may not be representative of the total fund return for the year. Performance figures may reflect fee waivers and/or expense reimbursements. In the absence of fee waivers and/or expense reimbursements, the total return would have been lower. Past performance is no guarantee of future results. |
| 3 | Expenses (net of fee waivers and/or expense reimbursements) are equal to the Fund’s annualized expense ratio multiplied by the average account value over the period, multiplied by the number of days in the most recent fiscal half-year (183), then divided by 365. |
| | |
| 8 | | ClearBridge Dividend Strategy ESG ETF 2018 Annual Report |
Fund performance(unaudited)
| | | | |
| Net asset value | |
| Average annual total returns1 | | | |
| Twelve Months Ended 11/30/18 | | | 5.75 | % |
| Inception* through 11/30/18 | | | 10.20 | |
| |
| Cumulative total returns1 | | | |
| Inception date of 5/22/17 through 11/30/18 | | | 15.98 | % |
| | | | |
| Market price | |
| Average annual total returns2 | | | |
| Twelve Months Ended 11/30/18 | | | 5.97 | % |
| Inception* through 11/30/18 | | | 10.33 | |
| |
| Cumulative total returns2 | | | |
| Inception date of 5/22/17 through 11/30/18 | | | 16.18 | % |
All figures represent past performance and are not a guarantee of future results. Investment returns and principal value of an investment will fluctuate so that an investor’s shares, when redeemed, may be worth more or less than their original cost. The returns shown do not reflect the deduction of brokerage commissions or taxes that investors would pay on distributions or the sale of shares. Performance figures may reflect fee waivers and/or expense reimbursements. In the absence of fee waivers and/or expense reimbursements, the total return would have been lower.
Investors buy and sell shares of the Fund at market price, not NAV, in the secondary market throughout the trading day. These shares are not individually available for direct purchase from or direct redemption to the Fund. The Fund’s per share NAV is the value of one share of the Fund and is calculated by dividing the value of total assets less total liabilities by the number of shares outstanding. The NAV return is based on the NAV of the Fund and the market price return is typically based upon themid-point between the bid and ask on the Fund’s principal trading market when the Fund’s NAV is determined, which is typically 4:00 p.m. Eastern time (US). These returns do not represent investors’ returns had they traded shares at other times. NAV and market price returns assume that dividends and capital gain distributions have been reinvested in the Fund at NAV and market price, respectively. As with other exchange-traded funds, NAV returns and market price returns may differ because of factors such as the supply and demand for Fund shares and investors’ assessment of the underlying value of the Fund’s portfolio securities.
| 1 | Assumes the reinvestments of all distributions, including returns of capital, if any, at net asset value. |
| 2 | Assumes the reinvestment of all distributions, including returns of capital, if any, at market price. |
| * | Inception date of the Fund is May 22, 2017. |
| | |
| ClearBridge Dividend Strategy ESG ETF 2018 Annual Report | | 9 |
Fund performance(unaudited) (cont’d)
Historical performance
Value of $10,000 invested in
ClearBridge Dividend Strategy ESG ETF vs S&P 500 Index† — May 22, 2017 - November 30, 2018
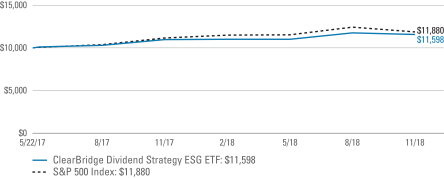
All figures represent past performance and are not a guarantee of future results. Investment returns and principal value of an investment will fluctuate so that an investor’s shares, when redeemed, may be worth more or less than their original cost. NAV returns assume that dividends and capital gain distributions have been reinvested in the Fund at NAV. The returns shown do not reflect the deduction of brokerage commissions or taxes that investors would pay on distributions or the sale of shares. Performance figures may reflect fee waivers and/or expense reimbursements. In the absence of fee waivers and/or expense reimbursements, the total return would have been lower.
| † | Hypothetical illustration of $10,000 invested in ClearBridge Dividend Strategy ESG ETF on May 22, 2017, assuming the reinvestment of all distributions, including returns of capital, if any, at net asset value through November 30, 2018. The hypothetical illustration also assumes a $10,000 investment in the S&P 500 Index. The Fund’s per share NAV is the value of one share of the Fund and is calculated by dividing the value of total assets less total liabilities by the number of shares outstanding. The NAV return is based on the NAV of the Fund. The S&P 500 Index (the “Index”) is an unmanaged index of 500 stocks and is generally representative of the performance of larger companies in the U.S. The Index is not subject to the same management and trading expenses as a fund. An index is a statistical composite that tracks a specified financial market, sector, or rules-based investment process. Unlike a fund, an index does not actually hold a portfolio of securities and therefore does not incur the expenses incurred by a fund. These expenses negatively impact fund performance. All index performance reflects no deduction for fees, expenses or taxes. Please note that an investor cannot invest directly in an index. |
| | |
| 10 | | ClearBridge Dividend Strategy ESG ETF 2018 Annual Report |
Schedule of investments
November 30, 2018
ClearBridge Dividend Strategy ESG ETF
| | | | | | | | | | | | | | | | |
| Security | | | | | | | | Shares | | | Value | |
| Common Stocks — 92.7% | | | | | | | | | | | | | | | | |
| Communication Services — 6.2% | | | | | | | | | | | | | | | | |
Diversified Telecommunication Services — 2.0% | | | | | | | | | | | | | | | | |
AT&T Inc. | | | | | | | | | | | 1,172 | | | $ | 36,614 | |
Verizon Communications Inc. | | | | | | | | | | | 777 | | | | 46,853 | |
Total Diversified Telecommunication Services | | | | | | | | | | | | | | | 83,467 | |
Entertainment — 2.0% | | | | | | | | | | | | | | | | |
Walt Disney Co. | | | | | | | | | | | 741 | | | | 85,578 | |
Media — 2.2% | | | | | | | | | | | | | | | | |
Comcast Corp., Class A Shares | | | | | | | | | | | 2,412 | | | | 94,092 | |
Total Communication Services | | | | | | | | | | | | | | | 263,137 | |
| Consumer Discretionary — 5.7% | | | | | | | | | | | | | | | | |
Hotels, Restaurants & Leisure — 1.4% | | | | | | | | | | | | | | | | |
Starbucks Corp. | | | | | | | | | | | 912 | | | | 60,849 | |
Specialty Retail — 2.9% | | | | | | | | | | | | | | | | |
Home Depot Inc. | | | | | | | | | | | 696 | | | | 125,503 | |
Textiles, Apparel & Luxury Goods — 1.4% | | | | | | | | | | | | | | | | |
V.F. Corp. | | | | | | | | | | | 732 | | | | 59,504 | |
Total Consumer Discretionary | | | | | | | | | | | | | | | 245,856 | |
| Consumer Staples — 12.1% | | | | | | | | | | | | | | | | |
Beverages — 1.0% | | | | | | | | | | | | | | | | |
PepsiCo Inc. | | | | | | | | | | | 356 | | | | 43,411 | |
Food & Staples Retailing — 1.4% | | | | | | | | | | | | | | | | |
Sysco Corp. | | | | | | | | | | | 897 | | | | 60,458 | |
Food Products — 4.6% | | | | | | | | | | | | | | | | |
McCormick & Co. Inc., Non Voting Shares | | | | | | | | | | | 215 | | | | 32,250 | |
Mondelez International Inc., Class A Shares | | | | | | | | | | | 1,680 | | | | 75,566 | |
Nestle SA, ADR | | | | | | | | | | | 1,027 | | | | 87,521 | |
Total Food Products | | | | | | | | | | | | | | | 195,337 | |
Household Products — 3.5% | | | | | | | | | | | | | | | | |
Colgate-Palmolive Co. | | | | | | | | | | | 888 | | | | 56,406 | |
Procter & Gamble Co. | | | | | | | | | | | 993 | | | | 93,848 | |
Total Household Products | | | | | | | | | | | | | | | 150,254 | |
Personal Products — 1.6% | | | | | | | | | | | | | | | | |
Unilever PLC, ADR | | | | | | | | | | | 1,211 | | | | 65,745 | |
Total Consumer Staples | | | | | | | | | | | | | | | 515,205 | |
| Energy — 1.4% | | | | | | | | | | | | | | | | |
Energy Equipment & Services — 1.4% | | | | | | | | | | | | | | | | |
Schlumberger Ltd. | | | | | | | | | | | 1,310 | | | | 59,081 | |
See Notes to Financial Statements.
| | |
| ClearBridge Dividend Strategy ESG ETF 2018 Annual Report | | 11 |
Schedule of investments (cont’d)
November 30, 2018
ClearBridge Dividend Strategy ESG ETF
| | | | | | | | | | | | | | | | |
| Security | | | | | | | | Shares | | | Value | |
| Financials — 12.9% | | | | | | | | | | | | | | | | |
Banks — 6.5% | | | | | | | | | | | | | | | | |
Bank of America Corp. | | | | | | | | | | | 4,243 | | | $ | 120,501 | |
PNC Financial Services Group Inc. | | | | | | | | | | | 572 | | | | 77,666 | |
U.S. Bancorp | | | | | | | | | | | 1,435 | | | | 78,150 | |
Total Banks | | | | | | | | | | | | | | | 276,317 | |
Capital Markets — 3.7% | | | | | | | | | | | | | | | | |
Bank of New York Mellon Corp. | | | | | | | | | | | 1,436 | | | | 73,681 | |
BlackRock Inc. | | | | | | | | | | | 193 | | | | 82,606 | |
Total Capital Markets | | | | | | | | | | | | | | | 156,287 | |
Insurance — 2.7% | | | | | | | | | | | | | | | | |
MetLife Inc. | | | | | | | | | | | 1,537 | | | | 68,596 | |
Travelers Cos. Inc. | | | | | | | | | | | 372 | | | | 48,498 | |
Total Insurance | | | | | | | | | | | | | | | 117,094 | |
Total Financials | | | | | | | | | | | | | | | 549,698 | |
| Health Care — 8.7% | | | | | | | | | | | | | | | | |
Health Care Providers & Services — 1.3% | | | | | | | | | | | | | | | | |
UnitedHealth Group Inc. | | | | | | | | | | | 200 | | | | 56,272 | |
Pharmaceuticals — 7.4% | | | | | | | | | | | | | | | | |
Johnson & Johnson | | | | | | | | | | | 730 | | | | 107,237 | |
Merck & Co. Inc. | | | | | | | | | | | 1,482 | | | | 117,582 | |
Pfizer Inc. | | | | | | | | | | | 1,940 | | | | 89,686 | |
Total Pharmaceuticals | | | | | | | | | | | | | | | 314,505 | |
Total Health Care | | | | | | | | | | | | | | | 370,777 | |
| Industrials — 11.6% | | | | | | | | | | | | | | | | |
Air Freight & Logistics — 2.1% | | | | | | | | | | | | | | | | |
United Parcel Service Inc., Class B Shares | | | | | | | | | | | 792 | | | | 91,310 | |
Commercial Services & Supplies — 2.7% | | | | | | | | | | | | | | | | |
Covanta Holding Corp. | | | | | | | | | | | 2,166 | | | | 35,869 | |
Waste Management Inc. | | | | | | | | | | | 831 | | | | 77,906 | |
Total Commercial Services & Supplies | | | | | | | | | | | | | | | 113,775 | |
Electrical Equipment — 1.2% | | | | | | | | | | | | | | | | |
Emerson Electric Co. | | | | | | | | | | | 771 | | | | 52,058 | |
Industrial Conglomerates — 3.3% | | | | | | | | | | | | | | | | |
3M Co. | | | | | | | | | | | 297 | | | | 61,752 | |
Honeywell International Inc. | | | | | | | | | | | 531 | | | | 77,924 | |
Total Industrial Conglomerates | | | | | | | | | | | | | | | 139,676 | |
Road & Rail — 2.3% | | | | | | | | | | | | | | | | |
Union Pacific Corp. | | | | | | | | | | | 645 | | | | 99,188 | |
Total Industrials | | | | | | | | | | | | | | | 496,007 | |
See Notes to Financial Statements.
| | |
| 12 | | ClearBridge Dividend Strategy ESG ETF 2018 Annual Report |
ClearBridge Dividend Strategy ESG ETF
| | | | | | | | | | | | | | | | |
| Security | | | | | | | | Shares | | | Value | |
| Information Technology — 13.4% | | | | | | | | | | | | | | | | |
IT Services — 5.0% | | | | | | | | | | | | | | | | |
Mastercard Inc., Class A Shares | | | | | | | | | | | 554 | | | $ | 111,393 | |
Visa Inc., Class A Shares | | | | | | | | | | | 707 | | | | 100,189 | |
Total IT Services | | | | | | | | | | | | | | | 211,582 | |
Semiconductors & Semiconductor Equipment — 3.0% | | | | | | | | | | | | | | | | |
Intel Corp. | | | | | | | | | | | 449 | | | | 22,140 | |
Texas Instruments Inc. | | | | | | | | | | | 1,047 | | | | 104,543 | |
Total Semiconductors & Semiconductor Equipment | | | | | | | | | | | | | | | 126,683 | |
Software — 3.3% | | | | | | | | | | | | | | | | |
Microsoft Corp. | | | | | | | | | | | 1,287 | | | | 142,715 | |
Technology Hardware, Storage & Peripherals — 2.1% | | | | | | | | | | | | | | | | |
Apple Inc. | | | | | | | | | | | 509 | | | | 90,897 | |
Total Information Technology | | | | | | | | | | | | | | | 571,877 | |
| Materials — 11.5% | | | | | | | | | | | | | | | | |
Chemicals — 7.5% | | | | | | | | | | | | | | | | |
DowDuPont Inc. | | | | | | | | | | | 1,293 | | | | 74,800 | |
Ecolab Inc. | | | | | | | | | | | 590 | | | | 94,689 | |
Linde PLC | | | | | | | | | | | 439 | | | | 69,823 | |
PPG Industries Inc. | | | | | | | | | | | 750 | | | | 81,998 | |
Total Chemicals | | | | | | | | | | | | | | | 321,310 | |
Construction Materials — 0.9% | | | | | | | | | | | | | | | | |
Vulcan Materials Co. | | | | | | | | | | | 360 | | | | 38,056 | |
Containers & Packaging — 1.9% | | | | | | | | | | | | | | | | |
International Paper Co. | | | | | | | | | | | 1,776 | | | | 82,033 | |
Metals & Mining — 1.2% | | | | | | | | | | | | | | | | |
Nucor Corp. | | | | | | | | | | | 830 | | | | 50,140 | |
Total Materials | | | | | | | | | | | | | | | 491,539 | |
| Real Estate — 4.5% | | | | | | | | | | | | | | | | |
Equity Real Estate Investment Trusts (REITs) — 4.5% | | | | | | | | | | | | | | | | |
American Tower Corp. | | | | | | | | | | | 542 | | | | 89,154 | |
Healthcare Trust of America Inc., Class A Shares | | | | | | | | | | | 1,584 | | | | 44,542 | |
Weyerhaeuser Co. | | | | | | | | | | | 2,251 | | | | 59,449 | |
Total Real Estate | | | | | | | | | | | | | | | 193,145 | |
| Utilities — 4.7% | | | | | | | | | | | | | | | | |
Electric Utilities — 1.8% | | | | | | | | | | | | | | | | |
NextEra Energy Inc. | | | | | | | | | | | 429 | | | | 77,954 | |
Independent Power and Renewable Electricity Producers — 1.5% | | | | | | | | | | | | | | | | |
Brookfield Renewable Partners LP | | | | | | | | | | | 2,280 | | | | 65,254 | |
See Notes to Financial Statements.
| | |
| ClearBridge Dividend Strategy ESG ETF 2018 Annual Report | | 13 |
Schedule of investments (cont’d)
November 30, 2018
ClearBridge Dividend Strategy ESG ETF
| | | | | | | | | | | | | | | | |
| Security | | | | | | | | Shares | | | Value | |
Multi-Utilities — 1.4% | | | | | | | | | | | | | | | | |
Sempra Energy | | | | | | | | | | | 498 | | | $ | 57,379 | |
Total Utilities | | | | | | | | | | | | | | | 200,587 | |
Total Investments before Short-Term Investments (Cost — $3,662,896) | | | | | | | | | | | | | | | 3,956,909 | |
| | | | |
| | | Rate | | | | | | | | | | |
| Short-Term Investments — 7.1% | | | | | | | | | | | | | | | | |
JPMorgan 100% U.S. Treasury Securities Money Market Fund, Institutional Class (Cost — $301,870) | | | 2.070 | % | | | | | | | 301,870 | | | | 301,870 | |
Total Investments — 99.8% (Cost — $3,964,766) | | | | | | | | | | | | | | | 4,258,779 | |
Other Assets in Excess of Liabilities — 0.2% | | | | | | | | | | | | | | | 9,766 | |
Total Net Assets — 100.0% | | | | | | | | | | | | | | $ | 4,268,545 | |
| | |
Abbreviation used in this schedule: |
| ADR | | — American Depositary Receipts |
See Notes to Financial Statements.
| | |
| 14 | | ClearBridge Dividend Strategy ESG ETF 2018 Annual Report |
Statement of assets and liabilities
November 30, 2018
| | | | |
| |
| Assets: | | | | |
Investments, at value (Cost — $3,964,766) | | $ | 4,258,779 | |
Dividends and interest receivable | | | 11,796 | |
Total Assets | | | 4,270,575 | |
| |
| Liabilities: | | | | |
Investment management fee payable | | | 2,030 | |
Total Liabilities | | | 2,030 | |
| Total Net Assets | | $ | 4,268,545 | |
| |
| Net Assets: | | | | |
Par value (Note 5) | | $ | 2 | |
Paid-in capital in excess of par value | | | 3,931,357 | |
Total distributable earnings (loss) | | | 337,186 | |
| Total Net Assets | | $ | 4,268,545 | |
| |
| Shares Outstanding | | | 150,000 | |
| |
| Net Asset Value | | | $28.46 | |
See Notes to Financial Statements.
| | |
| ClearBridge Dividend Strategy ESG ETF 2018 Annual Report | | 15 |
Statement of operations
For the Year Ended November 30, 2018
| | | | |
| |
| Investment Income: | | | | |
Dividends and distributions | | $ | 91,035 | |
Return of capital (Note 1 (d)) | | | (4,884) | |
Net Dividends and Distributions | | | 86,151 | |
Interest | | | 3,989 | |
Less: Foreign taxes withheld | | | (657) | |
Total Investment Income | | | 89,483 | |
| |
| Expenses: | | | | |
Investment management fee (Note 2) | | | 23,581 | |
Total Expenses | | | 23,581 | |
| Net Investment Income | | | 65,902 | |
| |
| Realized and Unrealized Gain on Investments (Notes 1 and 3): | | | | |
Net Realized Gain From: | | | | |
Investment transactions | | | 19,197 | |
REIT distributions | | | 3,277 | |
Net Realized Gain | | | 22,474 | |
Change in Net Unrealized Appreciation (Depreciation) From Investments | | | 83,827 | |
| Net Gain on Investments | | | 106,301 | |
| Increase in Net Assets From Operations | | $ | 172,203 | |
See Notes to Financial Statements.
| | |
| 16 | | ClearBridge Dividend Strategy ESG ETF 2018 Annual Report |
Statements of changes in net assets
| | | | | | | | |
For the Year Ended November 30,
and the Period Ended November 30, 2017 | | 2018 | | | 20171 | |
| | |
| Operations: | | | | | | | | |
Net investment income | | $ | 65,902 | | | $ | 24,366 | |
Net realized gain | | | 22,474 | | | | 8,255 | |
Change in net unrealized appreciation (depreciation) | | | 83,827 | | | | 210,186 | |
Increase in Net Assets From Operations | | | 172,203 | | | | 242,807 | |
| | |
| Distributions to Shareholders From (Note 1): | | | | | | | | |
Total distributable earnings2 | | | (62,724) | | | | (15,100) | |
Decrease in Net Assets From Distributions to Shareholders | | | (62,724) | | | | (15,100) | |
| | |
| Fund Share Transactions (Note 5): | | | | | | | | |
Net proceeds from sale of shares (50,000 and 100,000 shares issued, respectively) | | | 1,419,756 | | | | 2,511,603 | |
Increase in Net Assets From Fund Share Transactions | | | 1,419,756 | | | | 2,511,603 | |
Increase in Net Assets | | | 1,529,235 | | | | 2,739,310 | |
| | |
| Net Assets: | | | | | | | | |
Beginning of year | | | 2,739,310 | | | | — | |
End of year3 | | $ | 4,268,545 | | | $ | 2,739,310 | |
| 1 | For the period May 22, 2017 (inception date) to November 30, 2017. |
| 2 | Distributions from net investment income and from realized gains are no longer required to be separately disclosed. See Note 7. For the period May 22, 2017 (inception date) to November 30, 2017, distributions from net investment income were $15,100. |
| 3 | Parenthetical disclosure of undistributed net investment income is no longer required. See Note 7. For the period May 22, 2017 (inception date) to November 30, 2017, end of year net assets included undistributed net investment income of $7,134. |
See Notes to Financial Statements.
| | |
| ClearBridge Dividend Strategy ESG ETF 2018 Annual Report | | 17 |
Financial highlights
| | | | | | | | |
For a share of beneficial interest outstanding throughout each year ended November 30,
unless otherwise noted: | |
| | | 20181 | | | 20171,2 | |
| | |
| Net asset value, beginning of year | | | $27.39 | | | | $25.12 | |
| | |
| Income from operations: | | | | | | | | |
Net investment income | | | 0.46 | | | | 0.24 | |
Net realized and unrealized gain | | | 1.10 | | | | 2.18 | |
Total income from operations | | | 1.56 | | | | 2.42 | |
| | |
| Less distributions from: | | | | | | | | |
Net investment income | | | (0.48) | | | | (0.15) | |
Net realized gains | | | (0.01) | | | | — | |
Total distributions | | | (0.49) | | | | (0.15) | |
| | |
| Net asset value, end of year | | | $28.46 | | | | $27.39 | |
Total return, based on NAV3 | | | 5.75 | % | | | 9.68 | % |
| | |
| Net assets, end of year (000s) | | | $4,269 | | | | $2,739 | |
| | |
| Ratios to average net assets: | | | | | | | | |
Gross expenses | | | 0.59 | % | | | 0.59 | %4 |
Net expenses | | | 0.59 | | | | 0.59 | 4 |
Net investment income | | | 1.65 | | | | 1.78 | 4 |
| | |
| Portfolio turnover rate5 | | | 10 | % | | | 5 | % |
| 1 | Per share amounts have been calculated using the average shares method. |
| 2 | For the period May 22, 2017 (inception date) to November 30, 2017. |
| 3 | Performance figures may reflect fee waivers and/or expense reimbursements. In the absence of fee waivers and/or expense reimbursements, the total return would have been lower. The total return calculation assumes that distributions are reinvested at NAV. Past performance is no guarantee of future results. Total returns for periods of less than one year are not annualized. |
| 5 | Portfolio turnover excludes the value of portfolio securities received or delivered as a result ofin-kind fund share transactions. |
See Notes to Financial Statements.
| | |
| 18 | | ClearBridge Dividend Strategy ESG ETF 2018 Annual Report |
Notes to financial statements
1. Organization and significant accounting policies
ClearBridge Dividend Strategy ESG ETF (the “Fund”) is a separate diversified investment series of Legg Mason ETF Investment Trust (the “Trust”). The Trust, a Maryland statutory trust, is registered under the Investment Company Act of 1940, as amended (the “1940 Act”), as anopen-end management investment company.
The Fund is an actively managed exchange-traded fund (“ETF”). ETFs are funds that trade like other publicly-traded securities. Unlike shares of a mutual fund, which can be bought from and redeemed by the issuing fund by all shareholders at a price based on net asset value (“NAV”), shares of the Fund may be directly purchased from and redeemed by the Fund at NAV solely by certain large institutional investors who have entered into agreements with the Fund’s distributor (“Authorized Participants”). Also unlike shares of a mutual fund, shares of the Fund are listed on a national securities exchange and trade in the secondary market at market prices that change throughout the day.
Shares of the Fund are listed and traded at market prices on NASDAQ. The market price for the Fund’s shares may be different from the Fund’s NAV. The Fund issues and redeems shares at NAV only in blocks of a specified number of shares or multiples thereof (“Creation Units”). Only Authorized Participants may purchase or redeem Creation Units directly with the Fund at NAV. Creation Units are created and redeemed principallyin-kind (although under some circumstances its shares are created redeemed partially for cash). Except when aggregated in Creation Units, shares of the Fund are not redeemable securities. Shareholders who are not Authorized Participants may not redeem shares directly from the Fund at NAV.
The Fund seeks dividend income, growth of dividend income and long-term capital appreciation.
The following are significant accounting policies consistently followed by the Fund and are in conformity with U.S. generally accepted accounting principles (“GAAP”). Estimates and assumptions are required to be made regarding assets, liabilities and changes in net assets resulting from operations when financial statements are prepared. Changes in the economic environment, financial markets and any other parameters used in determining these estimates could cause actual results to differ. Subsequent events have been evaluated through the date the financial statements were issued.
(a) Investment valuation. Equity securities for which market quotations are available arevalued at the last reported sales price or official closing price on the primary market or exchange on which they trade. The valuations for fixed income securities (which may include, but are not limited to, corporate, government, municipal, mortgage-backed, collateralized mortgage obligations and asset-backed securities) and certain derivative instruments are typically the prices supplied by independent third party pricing services, which may use market prices or broker/dealer quotations or a variety of valuation techniques and methodologies. The independent third party pricing services use inputs that are observable such as issuer details, interest rates, yield curves, prepayment speeds, credit
| | |
| ClearBridge Dividend Strategy ESG ETF 2018 Annual Report | | 19 |
Notes to financial statements (cont’d)
risks/spreads, default rates and quoted prices for similar securities. Investments inopen-end funds are valued at the closing net asset value per share of each fund on the day of valuation. When the Fund holds securities or other assets that are denominated in a foreign currency, the Fund will use the currency exchange rates, generally determined as of 4:00 p.m. (London Time) (4:00 p.m. Eastern Time prior to October 1, 2018). If independent third party pricing services are unable to supply prices for a portfolio investment, or if the prices supplied are deemed by the manager to be unreliable, the market price may be determined by the manager using quotations from one or more broker/dealers or at the transaction price if the security has recently been purchased and no value has yet been obtained from a pricing service or pricing broker. When reliable prices are not readily available, such as when the value of a security has been significantly affected by events after the close of the exchange or market on which the security is principally traded, but before the Fund calculates its net asset value, the Fund values these securities as determined in accordance with procedures approved by the Fund’s Board of Trustees.
The Board of Trustees is responsible for the valuation process and has delegated the super-vision of the daily valuation process to the Legg Mason North Atlantic Fund Valuation Committee (the “Valuation Committee”). The Valuation Committee, pursuant to the policies adopted by the Board of Trustees, is responsible for making fair value determinations, evaluating the effectiveness of the Fund’s pricing policies, and reporting to the Board of Trustees. When determining the reliability of third party pricing information for investments owned by the Fund, the Valuation Committee, among other things, conducts due diligence reviews of pricing vendors, monitors the daily change in prices and reviews transactions among market participants.
The Valuation Committee will consider pricing methodologies it deems relevant and appropriate when making fair value determinations. Examples of possible methodologies include, but are not limited to, multiple of earnings; discount from market of a similar freely traded security; discounted cash-flow analysis; book value or a multiple thereof; risk premium/yield analysis; yield to maturity; and/or fundamental investment analysis. The Valuation Committee will also consider factors it deems relevant and appropriate in light of the facts and circumstances. Examples of possible factors include, but are not limited to, the type of security; the issuer’s financial statements; the purchase price of the security; the discount from market value of unrestricted securities of the same class at the time of purchase; analysts’ research and observations from financial institutions; information regarding any transactions or offers with respect to the security; the existence of merger proposals or tender offers affecting the security; the price and extent of public trading in similar securities of the issuer or comparable companies; and the existence of a shelf registration for restricted securities.
For each portfolio security that has been fair valued pursuant to the policies adopted by the Board of Trustees, the fair value price is compared against the last available and next available market quotations. The Valuation Committee reviews the results of such back testing monthly and fair valuation occurrences are reported to the Board of Trustees quarterly.
| | |
| 20 | | ClearBridge Dividend Strategy ESG ETF 2018 Annual Report |
The Fund uses valuation techniques to measure fair value that are consistent with the market approach and/or income approach, depending on the type of security and the particular circumstance. The market approach uses prices and other relevant information generated by market transactions involving identical or comparable securities. The income approach uses valuation techniques to discount estimated future cash flows to present value.
GAAP establishes a disclosure hierarchy that categorizes the inputs to valuation techniques used to value assets and liabilities at measurement date. These inputs are summarized in the three broad levels listed below:
| • | | Level 1 — quoted prices in active markets for identical investments |
| • | | Level 2 — other significant observable inputs (including quoted prices for similar investments, interest rates, prepayment speeds, credit risk, etc.) |
| • | | Level 3 — significant unobservable inputs (including the Fund’s own assumptions in determining the fair value of investments) |
The inputs or methodologies used to value securities are not necessarily an indication of the risk associated with investing in those securities.
The following is a summary of the inputs used in valuing the Fund’s assets carried at fair value:
| | | | | | | | | | | | | | | | |
| ASSETS | |
| Description | | Quoted Prices
(Level 1) | | | Other Significant
Observable Inputs
(Level 2) | | | Significant
Unobservable
Inputs
(Level 3) | | | Total | |
| Common stocks† | | $ | 3,956,909 | | | | — | | | | — | | | $ | 3,956,909 | |
| Short-term investments† | | | 301,870 | | | | — | | | | — | | | | 301,870 | |
| Total investments | | $ | 4,258,779 | | | | — | | | | — | | | $ | 4,258,779 | |
| † | See Schedule of Investments for additional detailed categorizations. |
(b) Foreign investment risks. The Fund’s investments in foreign securities may involverisks not present in domestic investments. Since securities may be denominated in foreign currencies, may require settlement in foreign currencies or pay interest or dividends in foreign currencies, changes in the relationship of these foreign currencies to the U.S. dollar can significantly affect the value of the investments and earnings of the Fund. Foreign investments may also subject the Fund to foreign government exchange restrictions, expropriation, taxation or other political, social or economic developments, all of which affect the market and/or credit risk of the investments.
(c) Security transactions and investment income. Security transactions are accountedfor on a trade date basis. Interest income (including interest income frompayment-in-kind securities), adjusted for amortization of premium and accretion of discount, is recorded on the accrual basis. Dividend income is recorded on theex-dividend date for dividends received in cash and/or securities. Foreign dividend income is recorded on the
| | |
| ClearBridge Dividend Strategy ESG ETF 2018 Annual Report | | 21 |
Notes to financial statements (cont’d)
ex-dividend date or as soon as practicable after the Fund determines the existence of a dividend declaration after exercising reasonable due diligence. The cost of investments sold is determined by use of the specific identification method. To the extent any issuer defaults or a credit event occurs that impacts the issuer, the Fund may halt any additional interest income accruals and consider the realizability of interest accrued up to the date of default or credit event.
(d) REIT distributions. The character of distributions received from Real Estate Investment Trusts (‘‘REITs’’) held by the Fund is generally comprised of net investment income, capital gains, and return of capital. It is the policy of the Fund to estimate the character of distributions received from underlying REITs based on historical data provided by the REITs. After each calendar year end, REITs report the actual tax character of these distributions. Differences between the estimated and actual amounts reported by the REITs are reflected in the Fund’s records in the year in which they are reported by the REITs by adjusting related investment cost basis, capital gains and income, as necessary.
(e) Distributions to shareholders. Distributions from net investment income of the Fund,if any, are declared and paid on a quarterly basis. Distributions of net realized gains, if any, are declared at least annually. Distributions to shareholders of the Fund are recorded on theex-dividend date and are determined in accordance with income tax regulations, which may differ from GAAP.
(f) Federal and other taxes. It is the Fund’s policy to comply with the federal income andexcise tax requirements of the Internal Revenue Code of 1986 (the “Code”), as amended, applicable to regulated investment companies. Accordingly, the Fund intends to distribute its taxable income and net realized gains, if any, to shareholders in accordance with timing requirements imposed by the Code. Therefore, no federal or state income tax provision is required in the Fund’s financial statements.
Management has analyzed the Fund’s tax positions taken on income tax returns for all open tax years and has concluded that as of November 30, 2018, no provision for income tax is required in the Fund’s financial statements. The Fund’s federal and state income and federal excise tax returns for tax years for which the applicable statutes of limitations have not expired are subject to examination by the Internal Revenue Service and state departments of revenue.
Under the applicable foreign tax laws, a withholding tax may be imposed on interest, dividends and capital gains at various rates.
(g) Reclassification. GAAP requires that certain components of net assets be reclassifiedto reflect permanent differences between financial and tax reporting. These reclassifications have no effect on net assets or net asset value per share. During the current year, the Fund had no reclassifications.
| | |
| 22 | | ClearBridge Dividend Strategy ESG ETF 2018 Annual Report |
2. Investment management agreement and other transactions with affiliates
Legg Mason Partners Fund Advisor, LLC (“LMPFA”) is the Fund’s investment manager and ClearBridge Investments, LLC (“ClearBridge”) is the Fund’s subadviser. Western Asset Management Company, LLC (formerly Western Asset Management Company) (“Western Asset”) manages the portion of the Fund’s cash and short-term instruments allocated to it. LMPFA, ClearBridge and Western Asset are wholly-owned subsidiaries of Legg Mason, Inc. (“Legg Mason”).
LMPFA provides administrative and certain oversight services to the Fund. LMPFA delegates to the subadviser theday-to-day portfolio management of the Fund. The Fund is responsible for paying interest expenses, taxes, brokerage expenses, future12b-1 fees (if any), acquired fund fees and expenses, extraordinary expenses and the management fee payable to LMPFA under the investment management agreement.
Under the investment management agreement and subject to the general supervision of the Fund’s Board of Trustees, LMPFA provides or causes to be furnished all investment management, supervisory, administrative and other services reasonably necessary for the operation of the Fund, including certain distribution services (provided pursuant to a separate distribution agreement) and investment advisory services (provided pursuant to separate subadvisory agreements) under a unitary fee structure. The Fund pays an investment management fee, calculated daily and paid monthly, at an annual rate of 0.59% of the Fund’s average daily net assets.
As compensation for its subadvisory services, LMPFA pays ClearBridge monthly 70% of the management fee paid by the Fund to LMPFA, net of (i) all fees and expenses incurred by LMPFA under the investment management agreement (including without limitation any subadvisory fee paid to another subadviser to the Fund) and (ii) expense waivers, if any, and reimbursements. LMPFA pays Western Asset monthly a fee of 0.02% of the portion of the Fund’s average daily net assets allocated to Western Asset for the management of cash and other short-term instruments, net of expense waivers, if any, and reimbursements.
Legg Mason Investor Services, LLC, a wholly-owned broker-dealer subsidiary of Legg Mason, serves as the distributor of Creation Units for the Fund on an agency basis.
The Fund’s Board of Trustees has adopted a Rule12b-1 shareholder services and distribution plan and under that plan, the Fund is authorized to pay service and/or distribution fees calculated at an annual rate of up to 0.25% of its average daily net assets. No service and/or distribution fees are currently paid by the Fund, and there are no current plans to impose these fees.
All officers and one Trustee of the Trust are employees of Legg Mason or its affiliates and do not receive compensation from the Trust.
As of November 30, 2018, Legg Mason and its affiliates owned 57% of the Fund.
| | |
| ClearBridge Dividend Strategy ESG ETF 2018 Annual Report | | 23 |
Notes to financial statements (cont’d)
3. Investments
During the year ended November 30, 2018, the aggregate cost of purchases and proceeds from sales of investments (excluding in-kind transactions and short-term investments) were as follows:
| | | | |
| Purchases | | $ | 371,893 | |
| Sales | | | 444,981 | |
During the year ended November 30, 2018,in-kind transactions (Note 5) were as follows:
| | | | |
| Contributions | | $ | 1,347,057 | |
| Redemptions | | | — | |
Thein-kind contributions andin-kind redemptions shown in this table may not agree with the Fund Share Transactions on the Statement of Changes in Net Assets. This table represents the accumulation of the Fund’s daily net shareholder transactions while the Statement of Changes in Net Assets reflects gross shareholder transactions including any cash component of the transactions.
At November 30, 2018, the aggregate cost of investments and the aggregate gross unrealized appreciation and depreciation of investments for federal income tax purposes were as follows:
| | | | | | | | | | | | | | | | |
| | | Cost | | | Gross
Unrealized
Appreciation | | | Gross
Unrealized
Depreciation | | | Net
Unrealized
Appreciation | |
| Securities | | $ | 3,963,786 | | | $ | 414,162 | | | $ | (119,169) | | | $ | 294,993 | |
4. Derivative instruments and hedging activities
During the year ended November 30, 2018, the Fund did not invest in derivative instruments.
5. Fund share transactions
At November 30, 2018, the Trust had an unlimited number of shares of beneficial interest authorized with a par value of $0.00001 per share. Fund shares are issued and redeemed by the Fund only in Creation Units or Creation Unit aggregations, where 50,000 shares of the Fund constitute a Creation Unit. Such transactions are made principally on anin-kind basis, and, under some circumstances partially on a cash basis, with a separate cash payment, which is a balancing cash component to equate the transaction to the net asset value per share of the Fund on the transaction date. Transactions in capital shares of the Fund are disclosed in detail in the Statement of Changes in Net Assets. Authorized Participants are subject to standard creation and redemption transaction fees to offset transfer and other transaction costs associated with the issuance and redemption of Creation Units. Creations and redemptions for cash (when cash creations and redemptions are available or specified) may be subject to an additional variable fee.
| | |
| 24 | | ClearBridge Dividend Strategy ESG ETF 2018 Annual Report |
6. Income tax information and distributions to shareholders
The tax character of distributions paid during the fiscal year ended November 30, 2018 and the period ended November 30, 2017 was as follows:
| | | | | | | | |
| | | 2018 | | | 2017 | |
| Distributions paid from: | | | | | | | | |
| Ordinary income | | $ | 61,136 | | | $ | 15,100 | |
| Net long-term capital gains | | | 1,588 | | | | — | |
| Total distributions paid | | $ | 62,724 | | | $ | 15,100 | |
As of November 30, 2018, the components of accumulated earnings (losses) on a tax basis were as follows:
| | | | |
| Undistributed ordinary income — net | | $ | 36,871 | |
| Undistributed long-term capital gains — net | | | 5,322 | |
| Total undistributed earnings | | $ | 42,193 | |
| Unrealized appreciation (depreciation)(a) | | | 294,993 | |
| Total accumulated earnings (losses) — net | | $ | 337,186 | |
| (a) | The difference between book-basis andtax-basis unrealized appreciation (depreciation) is attributable to the tax deferral of losses on wash sales and the difference between the book and tax cost basis of partnership investments. |
7. Recent accounting pronouncement
In August 2018, the Securities and Exchange Commission released its Final Rule on Disclosure Update and Simplification (the “Final Rule”) which is intended to simplify an issuer’s disclosure compliance efforts by removing redundant or outdated disclosure requirements without significantly altering the mix of information provided to investors. Effective with the current reporting period, the Fund adopted the Final Rule with the most notable impacts being that the Fund is no longer required to present the components of distributable earnings on the Statement of Assets and Liabilities or the sources of distributions to shareholders and the amount of undistributed net investment income on the Statements of Changes in Net Assets. The tax components of distributable earnings and distributions to shareholders continue to be disclosed within the Notes to Financial Statements.
| | |
| ClearBridge Dividend Strategy ESG ETF 2018 Annual Report | | 25 |
Report of independent registered public accounting firm
To the Board of Trustees of Legg Mason ETF Investment Trust and
Shareholders of ClearBridge Dividend Strategy ESG ETF
Opinion on the financial statements
We have audited the accompanying statement of assets and liabilities, including the schedule of investments, ofClearBridge Dividend Strategy ESG ETF (one of the funds constituting Legg Mason ETF Investment Trust, referred to hereafter as the “Fund”) as of November 30, 2018, the related statement of operations for the year ended November 30, 2018 and the statement of changes in net assets and the financial highlights for the year ended November 30, 2018 and for the period May 22, 2017 (commencement of operations) through November 30, 2017, including the related notes(collectively referred to as the “financial statements”). In our opinion, the financial statements present fairly, in all material respects, the financial position of the Fund as of November 30, 2018, the results of its operations for the year ended November 30, 2018, and the changes in its net assets and the financial highlights for the year ended November 30, 2018 and for the period May 22, 2017 (commencement of operations) through November 30, 2017 in conformity with accounting principles generally accepted in the United States of America.
Basis for opinion
These financial statements are the responsibility of the Fund’s management. Our responsibility is to express an opinion on the Fund’s financial statements based on our audits. We are a public accounting firm registered with the Public Company Accounting Oversight Board (United States) (“PCAOB”) and are required to be independent with respect to the Fund in accordance with the U.S. federal securities laws and the applicable rules and regulations of the Securities and Exchange Commission and the PCAOB.
We conducted our audits of these financial statements in accordance with the standards of the PCAOB. Those standards require that we plan and perform the audit to obtain reasonable assurance about whether the financial statements are free of material misstatement, whether due to error or fraud.
Our audits included performing procedures to assess the risks of material misstatement of the financial statements, whether due to error or fraud, and performing procedures that respond to those risks. Such procedures included examining, on a test basis, evidence regarding the amounts and disclosures in the financial statements. Our audits also included evaluating the accounting principles used and significant estimates made by management, as well as evaluating the overall presentation of the financial statements. Our procedures included confirmation of securities owned as of November 30, 2018 by correspondence with the custodian. We believe that our audits provide a reasonable basis for our opinion.
/s/PricewaterhouseCoopers LLP
Baltimore, Maryland
January 17, 2019
We have served as the auditor of one or more investment companies in Legg Mason investment company group since at least 1973. We have not been able to determine the specific year we began serving as auditor.
| | |
| 26 | | ClearBridge Dividend Strategy ESG ETF 2018 Annual Report |
Board approval of management and subadvisory agreements(unaudited)
At a meeting of the Trust’s Board of Trustees, the Board considered there-approval for an annual period of the management agreement pursuant to which Legg Mason Partners Fund Advisor, LLC (the “Manager”) provides the Fund with investment advisory and administrative services, thesub-advisory agreement pursuant to which ClearBridge Investments, LLC (“ClearBridge”) providesday-to-day management of the Fund’s portfolio, and thesub-advisory agreement pursuant to which Western Asset Management Company, LLC (“Western Asset” and, together with ClearBridge, the“Sub-Advisers”) providesday-to-day management of the Fund’s cash and short-term instruments allocated to it by the Manager. (The management agreement andsub-advisory agreements are collectively referred to as the “Agreements.”) The Manager and theSub-Advisers are wholly-owned subsidiaries of Legg Mason, Inc. The Trustees who are not “interested persons” (as defined in the Investment Company Act of 1940, as amended (the “Independent Trustees”)) of the Fund were assisted in their review by Fund counsel and independent legal counsel and met with independent legal counsel in executive sessions separate from representatives of the Manager and theSub-Advisers. The Independent Trustees requested and received information from the Manager and theSub-Advisers they deemed reasonably necessary for their review of the Agreements and the performance of the Manager and theSub-Advisers. Included was information about the Manager, theSub-Advisers and the Fund’s distributor, as well as the management,sub-advisory and distribution arrangements and services provided to the Fund and other funds overseen by the Board. This information was initially reviewed by a special committee of the Independent Trustees and then by the full Board.
In voting to approve the Agreements, the Independent Trustees considered whether the approval of the Agreements would be in the best interests of the Fund and its shareholders, an evaluation based on several factors including those discussed below.
Nature, Extent and Quality of the Services provided to the Fund under the Management Agreement andSub-Advisory Agreements
The Board received and considered information regarding the nature, extent and quality of services provided to the Fund by the Manager and theSub-Advisers under the Management Agreement andSub-Advisory Agreements, respectively, since the Fund’s inception. The Trustees also considered the Manager’s supervisory activities over theSub-Advisers. In addition, the Independent Trustees received and considered other information regarding the administrative and other services rendered to the Fund by the Manager, including services specific to the Fund’s operation as an exchange-traded fund. The Board noted information received at regular meetings throughout the year related to the services rendered by the Manager in its management of the Fund’s affairs and the Manager’s role in coordinating the activities of theSub-Advisers and the Fund’s other service providers. The Board’s evaluation of the services provided by the Manager and theSub-Advisers took into account the Board’s knowledge and familiarity gained as Trustees of funds in the Legg Mason fund complex, including the scope and quality of the investment management and other capabilities of the Manager and theSub-Advisers and the quality of the Manager’s administrative and other services. The Board observed that the scope of services provided by the Manager had expanded over time as a result of regulatory and other developments, including maintaining and monitoring its own and
| | |
| ClearBridge Dividend Strategy ESG ETF | | 27 |
Board approval of management and subadvisory agreements(unaudited) (cont’d)
the Fund’s compliance programs specific to the Fund’s operation as an exchange-traded fund. The Board reviewed information received from the Manager and the Fund’s Chief Compliance Officer regarding the Fund’s compliance policies and procedures established pursuant toRule 38a-1 under the Investment Company Act of 1940, as amended.
The Board reviewed the qualifications, backgrounds and responsibilities of the Fund’s senior personnel and the portfolio management team primarily responsible for theday-to-day portfolio management of the Fund. The Board considered the services provided to the Legg Mason fund complex and the Manager’s commitment to continue to provide effective and efficient investment management services. The Board also considered, based on its knowledge of the Manager and the Manager’s affiliates, the financial resources available to the Manager’s parent organization, Legg Mason, Inc.
The Board considered the division of responsibilities among the Manager and theSub-Advisers and the oversight provided by the Manager. The Board also considered the Manager’s and ClearBridge’s brokerage policies and practices, the standards applied in seeking best execution, their policies and practices regarding soft dollars, the existence of quality controls applicable to brokerage allocation procedures, and the arrangements for communication and processing of orders for creations and redemptions of Fund shares. In addition, management also reported to the Board on, among other things, its business plans regarding exchange-traded funds, recent organizational changes, portfolio manager compensation plan and policy regarding portfolio managers’ ownership of fund shares.
The Board concluded that, overall, it was satisfied with the nature, extent and quality of services provided (and expected to be provided) under the respective Agreement by the Manager and theSub-Advisers.
Fund Performance
The Board received and reviewed performance information for the Fund and for a group of equity income institutional actively managed exchange-traded funds (the “Performance Group”) selected by Broadridge Financial Solutions Inc. (“Broadridge”), an independent provider of investment company data. The Board was provided with a description of the methodology Broadridge used to determine the similarity of the Fund with the funds included in the Performance Group. The Trustees noted that they also had received and discussed with management at periodic intervals information on the investment performance of the Fund in comparison to similar exchange-traded funds and benchmark performance indices. The information comparing the Fund’s performance to that of the Performance Group was for theone-year period ended June 30, 2018 and the period since the Fund’s inception (May 22, 2017) through June 30, 2018. The Fund performed below the median performance of the funds in the Performance Group for each period. The Board reviewed performance information provided by the Manager for periods ended September 30, 2018, which showed that the Fund’s performance was better than the Broadridge category average during the third quarter. The Trustees noted that due to the limited number of comparable institutional actively managed exchange-traded funds included in the Performance Group, the statistical information provided in Broadridge’s report may or may not provide meaningful direct comparisons to the Fund in all
| | |
| 28 | | ClearBridge Dividend Strategy ESG ETF |
instances. The Trustees also noted that the Manager and ClearBridge were committed to providing the resources necessary to assist the Fund’s portfolio managers. Based on its review, and noting the limited period of performance data available, the Board determined to continue to evaluate the Fund’s performance and directed the Independent Trustees’ performance committee to continue to periodically review Fund performance with the Manager and report to the full Board during periods between Board meetings.
Management Fees and Expense Ratios
The Board reviewed and considered the contractual management fee rate (the “Actual Management Fee”) paid by the Fund to the Manager over the Fund’s last fiscal year in light of the nature, extent and quality of the management andsub-advisory services provided by the Manager and theSub-Advisers, respectively. The Board noted that the Manager, and not the Fund, pays thesub-advisory fees to theSub-Advisers and, accordingly, that the retention of theSub-Advisers does not increase the fees and expenses incurred by the Fund. The Board also noted that the Manager pays all fund expenses, other than the Actual Management Fee and certain other expenses. Because of the Fund’s “unitary fee” structure, the Board recognized that the Fund’s fees and expenses will vary within a much smaller range and the Manager will bear the risk that Fund expenses may increase over time. On the other hand, the Board noted that it is possible that the Manager could earn a profit on the fees charged under the management agreement and would benefit from any price decreases in third-party services covered by the management agreement.
The Board also reviewed information regarding the fees the Manager and ClearBridge charged any of their U.S. clients investing primarily in an asset class similar to that of the Fund including, where applicable, institutional separate and commingled accounts and retail managed accounts. The Manager reviewed with the Board the significant differences in the scope of services provided to the Fund and to such other clients, noting that the Fund is provided with regulatory compliance and administrative services, office facilities and Fund officers (including the Fund’s chief financial, chief legal and chief compliance officers), and that the Manager coordinates and oversees the provision of services to the Fund by other fund service providers, including theSub-Advisers. The Board considered the fee comparisons in light of the scope of services required to manage these different types of accounts. Management also discussed with the Board the Fund’s distribution arrangements.
Additionally, the Board received and considered information comparing the Fund’s Actual Management Fee and the Fund’s overall expense ratio with those of the same group of institutional actively managed exchange-traded funds, which included three equity income funds, selected by Broadridge as the Performance Group for the Fund (the “Expense Group”), and the Fund’s overall expense ratio with a broader group of funds selected by Broadridge consisting of all institutional actively managed equity income exchange-traded funds (the “Expense Universe”). This information showed that the Fund’s Actual Management Fee was at the median of management fees paid by the funds in the Expense Group, and that the Fund’s total expense ratio was at the median of the total expense ratios of the funds in the Expense Group (before and after fee waivers and expense reimbursements) and the funds in the Expense Universe.
| | |
| ClearBridge Dividend Strategy ESG ETF | | 29 |
Board approval of management and subadvisory agreements(unaudited) (cont’d)
Manager Profitability
The Board received and considered a profitability analysis of the Manager and its affiliates in providing services to the Fund. The Board also received profitability information with respect to the Legg Mason fund complex as a whole. In addition, the Board received information with respect to the Manager’s allocation methodologies used in preparing this profitability data as well as a report from an outside consultant that had reviewed the Manager’s methodology. The Board noted the profitability percentage ranges determined by appropriate court cases to be reasonable given the services rendered to investment companies. The Board determined that the Manager’s profitability was not excessive in light of the nature, extent and quality of the services provided to the Fund.
Economies of Scale
The Board discussed any economies of scale or other efficiencies that may result from increases in the Fund’s assets. The Board noted that the Fund’s management agreement did not provide for any breakpoints in the Fund’s Actual Management Fee to the extent the assets of the Fund increase. The Board further noted that should material economies of scale exist in the future, a breakpoint structure for the Fund may be appropriate, and that it would continue to monitor the sharing of economies of scale to determine the appropriateness of adding breakpoints in the future. The Board also noted that there are various ways to share potential economies of scale with Fund shareholders and that it appeared that the benefits of any economies of scale would be appropriately shared with shareholders through increased investment in fund management and administration resources.
Taking all of the above into consideration, the Board determined that the management fee was reasonable in light of the comparative performance and expense information and the nature, extent and quality of the services provided to the Fund under the Agreements.
Other Benefits to the Manager
The Board considered other benefits received by the Manager and its affiliates, including theSub-Advisers, as a result of the Manager’s relationship with the Fund, including the opportunity to offer additional products and services such as 529 College Savings Plans and retail managed accounts.
In light of the costs of providing investment management and other services to the Fund and the Manager’s ongoing commitment to the Fund, the profits and other ancillary benefits that the Manager and its affiliates received were considered reasonable.
Based on their discussions and considerations, including those described above, the Trustees approved the Management Agreement and theSub-Advisory Agreements to continue for another year.
No single factor reviewed by the Board was identified by the Board as the principal factor in determining whether to approve the Management Agreement and theSub-Advisory Agreements.
| | |
| 30 | | ClearBridge Dividend Strategy ESG ETF |
Additional information(unaudited)
Information about Trustees and Officers
The business and affairs of ClearBridge Dividend Strategy ESG ETF (the “Fund”) are conducted by management under the supervision and subject to the direction of its Board of Trustees. The business address of each Trustee is c/o Jane Trust, Legg Mason, 100 International Drive, 11th Floor, Baltimore, Maryland 21202. Information pertaining to the Trustees and officers of the Fund is set forth below.
The Statement of Additional Information includes additional information about Trustees and is available, without charge, upon request by calling the Fund at1-877-721-1926.
| | |
| Independent Trustees† | | |
| |
| Paul R. Ades | | |
| |
| Year of birth | | 1940 |
| Position(s) with Trust | | Trustee |
| Term of office1 and length of time served2 | | Since 1983 |
| Principal occupation(s) during past five years | | Paul R. Ades, PLLC (law firm) (since 2000) |
| Number of funds in fund complex overseen by Trustee | | 48 |
| Other board memberships held by Trustee during past five years | | None |
| |
| Andrew L. Breech | | |
| |
| Year of birth | | 1952 |
| Position(s) with Trust | | Trustee |
| Term of office1 and length of time served2 | | Since 1991 |
| Principal occupation(s) during past five years | | President, Dealer Operating Control Service, Inc. (automotive retail management) (since 1985) |
| Number of funds in fund complex overseen by Trustee | | 48 |
| Other board memberships held by Trustee during past five years | | None |
| |
| Dwight B. Crane | | |
| |
| Year of birth | | 1937 |
| Position(s) with Trust | | Trustee |
| Term of office1 and length of time served2 | | Since 1981 |
| Principal occupation(s) during past five years | | Professor Emeritus, Harvard Business School (since 2007); formerly, Professor, Harvard Business School (1969 to 2007); Independent Consultant (since 1969) |
| Number of funds in fund complex overseen by Trustee | | 48 |
| Other board memberships held by Trustee during past five years | | None |
| | |
| ClearBridge Dividend Strategy ESG ETF | | 31 |
Additional information(unaudited) (cont’d)
Information about Trustees and Officers
| | |
| Independent Trustees†cont’d | | |
| |
| Althea L. Duersten | | |
| |
| Year of birth | | 1951 |
| Position(s) with Trust | | Trustee |
| Term of office1 and length of time served2 | | Since 2014 |
| Principal occupation(s) during past five years | | Retired (since 2011); formerly, Chief Investment Officer, North America, JPMorgan Chase (investment bank) and member of JPMorgan Executive Committee (2007 to 2011) |
| Number of funds in fund complex overseen by Trustee | | 48 |
| Other board memberships held by Trustee during past five years | | None |
| |
| Frank G. Hubbard | | |
| |
| Year of birth | | 1937 |
| Position(s) with Trust | | Trustee |
| Term of office1 and length of time served2 | | Since 1993 |
| Principal occupation(s) during past five years | | President, Fealds, Inc. (business development) (since 2016); formerly, President, Avatar International Inc. (business development) (1998 to 2015) |
| Number of funds in fund complex overseen by Trustee | | 48 |
| Other board memberships held by Trustee during past five years | | None |
| |
| Howard J. Johnson | | |
| |
| Year of birth | | 1938 |
| Position(s) with Trust | | Trustee and Chairman |
| Term of office1 and length of time served2 | | From 1981 to 1998 and since 2000 (Chairman since 2013) |
| Principal occupation(s) during past five years | | Chief Executive Officer, Genesis Imaging LLC (technology company) (since 2003) |
| Number of funds in fund complex overseen by Trustee | | 48 |
| Other board memberships held by Trustee during past five years | | None |
| |
| Jerome H. Miller | | |
| |
| Year of birth | | 1938 |
| Position(s) with Trust | | Trustee |
| Term of office1 and length of time served2 | | Since 1995 |
| Principal occupation(s) during past five years | | Retired |
| Number of funds in fund complex overseen by Trustee | | 48 |
| Other board memberships held by Trustee during past five years | | None |
| | |
| 32 | | ClearBridge Dividend Strategy ESG ETF |
| | |
| Independent Trustees†cont’d | | |
| |
| Ken Miller | | |
| |
| Year of birth | | 1942 |
| Position(s) with Trust | | Trustee |
| Term of office1 and length of time served2 | | Since 1983 |
| Principal occupation(s) during past five years | | Retired; formerly, President, Young Stuff Apparel Group, Inc. (apparel manufacturer), division of Li & Fung (1963 to 2012) |
| Number of funds in fund complex overseen by Trustee | | 48 |
| Other board memberships held by Trustee during past five years | | None |
| |
| Thomas F. Schlafly | | |
| |
| Year of birth | | 1948 |
| Position(s) with Trust | | Trustee |
| Term of office1 and length of time served2 | | Since 1983 |
| Principal occupation(s) during past five years | | Chairman, The Saint Louis Brewery, LLC (brewery) (since 2012); formerly, President, The Saint Louis Brewery, Inc. (1989 to 2012); Senior Counsel (since 2017) and formerly, Partner (2009 to 2016), Thompson Coburn LLP (law firm) |
| Number of funds in fund complex overseen by Trustee | | 48 |
| Other board memberships held by Trustee during past five years | | Director, Citizens National Bank of Greater St. Louis (since 2006) |
| | |
| Interested Trustee and Officer |
| |
| Jane Trust, CFA3 | | |
| |
| Year of birth | | 1962 |
| Position(s) with Trust | | Trustee, President and Chief Executive Officer |
| Term of office1 and length of time served2 | | Since 2015 |
| Principal occupation(s) during past five years | | Senior Managing Director of Legg Mason & Co., LLC (“Legg Mason & Co.”) (since 2018); Managing Director of Legg Mason & Co. (2016 to 2018); Officer and/or Trustee/Director of 146 funds associated with Legg Mason Partners Fund Advisor, LLC (“LMPFA”) or its affiliates (since 2015); President and Chief Executive Officer of LMPFA (since 2015); formerly, Senior Vice President of LMPFA (2015); Director of ClearBridge, LLC (formerly, Legg Mason Capital Management, LLC) (2007 to 2014); Managing Director of Legg Mason Investment Counsel & Trust Co. (2000 to 2007) |
| Number of funds in fund complex overseen by Trustee | | 137 |
| Other board memberships held by Trustee during past five years | | None |
| | |
| | |
| ClearBridge Dividend Strategy ESG ETF | | 33 |
Additional information(unaudited) (cont’d)
Information about Trustees and Officers
| | |
| Additional Officers | | |
| |
Ted P. Becker Legg Mason 620 Eighth Avenue, 49th Floor, New York, NY 10018 | | |
| |
| Year of birth | | 1951 |
| Position(s) with Trust | | Chief Compliance Officer |
| Term of office1 and length of time served2 | | Since 2007 |
| Principal occupation(s) during past five years | | Director of Global Compliance at Legg Mason (since 2006); Chief Compliance Officer of LMPFA (since 2006); Managing Director of Compliance of Legg Mason & Co. (since 2005); Chief Compliance Officer of certain mutual funds associated with Legg Mason & Co. or its affiliates (since 2006) |
| |
Susan Kerr Legg Mason 620 Eighth Avenue, 49th Floor, New York, NY 10018 | | |
| |
| Year of birth | | 1949 |
| Position(s) with Trust | | Chief Anti-Money Laundering Compliance Officer |
| Term of office1 and length of time served2 | | Since 2013 |
| Principal occupation(s) during past five years | | Assistant Vice President of Legg Mason & Co. and Legg Mason Investor Services, LLC (“LMIS”) (since 2010); Chief Anti-Money Laundering Compliance Officer of certain mutual funds associated with Legg Mason & Co. or its affiliates (since 2013) and Anti-Money Laundering Compliance Officer of LMIS (since 2012); Senior Compliance Officer of LMIS (since 2011); formerly, AML Consultant, DTCC (2010); AML Consultant, Rabobank Netherlands, (2009); First Vice President, Director of Marketing & Advertising Compliance and Manager of Communications Review Group at Citigroup Inc. (1996 to 2008) |
| |
Jenna Bailey Legg Mason 100 First Stamford Place, 5th Floor, Stamford, CT 06902 | | |
| |
| Year of birth | | 1978 |
| Position(s) with Trust | | Identity Theft Prevention Officer |
| Term of office1 and length of time served2 | | Since 2015 |
| Principal occupation(s) during past five years | | Identity Theft Prevention Officer of certain mutual funds associated with Legg Mason & Co. or its affiliates (since 2015); Compliance Officer of Legg Mason & Co. (since 2013); Assistant Vice President of Legg Mason & Co. (since 2011); formerly, Associate Compliance Officer of Legg Mason & Co. (2011 to 2013) |
| | |
| 34 | | ClearBridge Dividend Strategy ESG ETF |
| | |
| Additional Officers cont’d | | |
| |
Robert I. Frenkel Legg Mason 100 First Stamford Place, 6th Floor, Stamford, CT 06902 | | |
| |
| Year of birth | | 1954 |
| Position(s) with Trust | | Secretary and Chief Legal Officer |
| Term of office1 and length of time served2 | | Since 2007 |
| Principal occupation(s) during past five years | | Vice President and Deputy General Counsel of Legg Mason (since 2006); Managing Director and General Counsel— U.S. Mutual Funds for Legg Mason & Co. (since 2006) and Legg Mason & Co. predecessors (since 1994); Secretary and Chief Legal Officer of certain mutual funds associated with Legg Mason & Co. or its affiliates (since 2006) and Legg Mason & Co. predecessors (prior to 2006) |
| |
Thomas C. Mandia Legg Mason 100 First Stamford Place, 6th Floor, Stamford, CT 06902 | | |
| |
| Year of birth | | 1962 |
| Position(s) with Trust | | Assistant Secretary |
| Term of office1 and length of time served2 | | Since 2007 |
| Principal occupation(s) during past five years | | Managing Director and Deputy General Counsel of Legg Mason & Co. (since 2005) and Legg Mason & Co. predecessors (prior to 2005); Secretary of LMPFA (since 2006); Assistant Secretary of certain mutual funds associated with Legg Mason & Co. or its affiliates (since 2006) and Legg Mason & Co. predecessors (prior to 2006); Secretary of LM Asset Services, LLC (“LMAS”) (since 2002) and Legg Mason Fund Asset Management, Inc. (“LMFAM”) (since 2013) (formerly registered investment advisers) |
| |
Richard F. Sennett Legg Mason 100 International Drive, 7th Floor, Baltimore, MD 21202 | | |
| |
| Year of birth | | 1970 |
| Position(s) with Trust | | Principal Financial Officer |
| Term of office1 and length of time served2 | | Since 2011 |
| Principal occupation(s) during past five years | | Principal Financial Officer and Treasurer of certain mutual funds associated with Legg Mason & Co. or its affiliates (since 2011 and since 2013); Managing Director of Legg Mason & Co. and Senior Manager of the Treasury Policy group for Legg Mason & Co.’s Global Fiduciary Platform (since 2011); formerly, Chief Accountant within the SEC’s Division of Investment Management (2007 to 2011); Assistant Chief Accountant within the SEC’s Division of Investment Management (2002 to 2007) |
| | |
| ClearBridge Dividend Strategy ESG ETF | | 35 |
Additional information(unaudited) (cont’d)
Information about Trustees and Officers
| | |
| Additional Officers cont’d | | |
| |
Christopher Berarducci Legg Mason 620 Eighth Avenue, 49th Floor, New York, NY 10018 | | |
| |
| Year of birth | | 1974 |
| Position(s) with Trust | | Treasurer |
| Term of office1 and length of time served2 | | Since 2014 |
| Principal occupation(s) during past five years | | Director of Legg Mason & Co. (since 2015); Treasurer of certain mutual funds associated with Legg Mason & Co. or its affiliates (since 2010); formerly, Vice President of Legg Mason & Co. (2011 to 2015); Assistant Controller of certain mutual funds associated with Legg Mason & Co. or its affiliates (prior to 2010) |
| |
Jeanne M. Kelly Legg Mason 620 Eighth Avenue, 49th Floor, New York, NY 10018 | | |
| |
| Year of birth | | 1951 |
| Position(s) with Trust | | Senior Vice President |
| Term of office1 and length of time served2 | | Since 2007 |
| Principal occupation(s) during past five years | | Senior Vice President of certain mutual funds associated with Legg Mason & Co. or its affiliates (since 2007); Senior Vice President of LMPFA (since 2006); President and Chief Executive Officer of LMAS and LMFAM (since 2015); Managing Director of Legg Mason & Co. (since 2005) and Legg Mason & Co. predecessors (prior to 2005); formerly, Senior Vice President of LMFAM (2013 to 2015) |
| † | Trustees who are not “interested persons” of the Fund within the meaning of Section 2(a)(19) of the Investment Company Act of 1940, as amended the (the “1940 Act”). |
| 1 | Each Trustee and officer serves until his or her respective successor has been duly elected and qualified or until his or her earlier death, resignation, retirement or removal. |
| 2 | Indicates the earliest year in which the Trustee became a board member for a fund in the Legg Mason fund complex or the officer took such office. |
| 3 | Ms. Trust is an “interested person” of the Fund, as defined in the 1940 Act, because of her position with LMPFA and/or certain of its affiliates. |
| | |
| 36 | | ClearBridge Dividend Strategy ESG ETF |
Important tax information(unaudited)
The following information is provided with respect to the distributions paid during the taxable year ended November 30, 2018:
| | | | | | | | | | | | | | | | |
| Record date | | | 12/27/2017 | | | | 3/27/2018 | | | | 6/27/2018 | | | | 9/26/2018 | |
| Payable date | | | 12/29/2017 | | | | 3/29/2018 | | | | 6/29/2018 | | | | 9/29/2018 | |
| Ordinary income: | | | | | | | | | | | | | | | | |
Qualified dividend income for individuals | | | 77.28 | % | | | 100.00 | % | | | 100.00 | % | | | 100.00 | % |
Dividends qualifying for the dividends | | | | | | | | | | | | | | | | |
received deduction for corporations | | | 73.30 | % | | | 93.95 | % | | | 93.95 | % | | | 93.95 | % |
| Long-term capital gain | | | — | | | | — | | | | $0.010587 | | | | — | |
Please retain this information for your records.
| | |
| ClearBridge Dividend Strategy ESG ETF | | 37 |
ClearBridge
Dividend Strategy ESG ETF
Trustees
Paul R. Ades
Andrew L. Breech
Dwight B. Crane
Althea L. Duersten
Frank G. Hubbard
Howard J. Johnson
Chairman
Jerome H.Miller
Ken Miller
Thomas F. Schlafly
Jane Trust
Investment manager
Legg Mason Partners Fund Advisor, LLC
Subadviser
ClearBridge Investments, LLC
Custodian
The Bank of New York Mellon (“BNY”)*
Transfer agent
BNYMellon Investment Servicing
(US) Inc. (“BNY Mellon”)*
4400 Computer Drive
Westborough, MA 01581
Independent registered public accounting firm
PricewaterhouseCoopers LLP
Baltimore, MD
| * | Effective July 16, 2018, BNY became custodian and BNY Mellon became transfer agent. |
ClearBridge Dividend Strategy ESG ETF
The Fund is a separate investment series of Legg Mason ETF Investment Trust, a Maryland statutory trust.
ClearBridge Dividend Strategy ESG ETF
Legg Mason Funds
620 Eighth Avenue, 49th Floor
New York, NY 10018
The Fund files its complete schedule of portfolio
holdings with the Securities and Exchange Commission (“SEC”) for the first and third quarters of each fiscal year on FormN-Q. The Fund’s FormsN-Q are available on the SEC’s website at www.sec.gov. To obtain information on FormN-Q, shareholders can call the Fund at1-877-721-1926.
Information on how the Fund voted proxies relating to portfolio securities during the prior12-month period ended June 30th of each year and a description of the policies and procedures that the Fund uses to determine how to vote proxies related to portfolio transactions are available (1) without charge, upon request, by calling the Fund at1-877-721-1926, (2) at www.leggmason.com/etf and (3) on the SEC’s website at www.sec.gov.
This report is submitted for the general information of the shareholders of ClearBridge Dividend Strategy ESG ETF. This report is not authorized for distribution to prospective investors in the Fund unless preceded or accompanied by a current prospectus.
Investors should consider the Fund’s investment objectives, risks, charges and expenses carefully before investing. The prospectus contains this and other important information about the Fund. Please read the prospectus carefully before investing.
www.leggmason.com
© 2019 Legg Mason Investors Services, LLC
Member FINRA, SIPC
www.leggmason.com
© 2019 Legg Mason Investor Services, LLC Member FINRA, SIPC
ETF425109 1/19 SR18-3512
The registrant has adopted a code of ethics that applies to the registrant’s principal executive officer, principal financial officer, principal accounting officer or controller.
| ITEM 3. | AUDIT COMMITTEE FINANCIAL EXPERT. |
The Board of Trustees of the registrant has determined that Dwight B. Crane, possess the technical attributes identified in Instruction 2(b) of Item 3 to FormN-CSR to qualify as “audit committee financial experts,” and have designated Dwight B. Crane as the Audit Committee’s financial experts. Dwight B. Crane is an “independent” Trustees pursuant to paragraph (a) (2) of Item 3 to FormN-CSR.
| ITEM 4. | PRINCIPAL ACCOUNTANT FEES AND SERVICES. |
a)Audit Fees. The aggregate fees billed in the last fiscal period ending November 30, 2017 and November 30, 2018 (the “Reporting Period”) for professional services rendered by the Registrant’s principal accountant (the “Auditor”) for the audit of the Registrant’s annual financial statements, or services that are normally provided by the Auditor in connection with the statutory and regulatory filings or engagements for the Reporting Period, were $12,000 in November 30, 2017 and $48,000 in November 30, 2018.
b)Audit-Related Fees. The aggregate fees billed in the Reporting Period for assurance and related services by the Auditor that are reasonably related to the performance of the Registrant’s financial statements were $0 in November 30, 2017 and $0 in November 30, 2018.
(c)Tax Fees. The aggregate fees billed in the Reporting Period for professional services rendered by the Auditor for tax compliance, tax advice and tax planning (“Tax Services”) were $0 in November 30, 2017 and $0 in November 30, 2018. These services consisted of (i) review or preparation of U.S. federal, state, local and excise tax returns; (ii) U.S. federal, state and local tax planning, advice and assistance regarding statutory, regulatory or administrative developments, and (iii) tax advice regarding tax qualification matters and/or treatment of various financial instruments held or proposed to be acquired or held.
There were no fees billed for tax services by the Auditors to service affiliates during the Reporting Period that requiredpre-approval by the Audit Committee.
d)All Other Fees. The aggregate fees for other fees billed in the Reporting Periods for products and services provided by the Auditor were $0 in November 30, 2017 and $0 in November 30, 2018, other than the services reported in paragraphs (a) through (c) of this item for the Legg Mason ETF Investment Trust.
All Other Fees. There were no othernon-audit services rendered by the Auditor to Legg Mason Partners Fund Advisors, LLC (“LMPFA”), and any entity controlling, controlled by or under common control with LMPFA that provided ongoing services to Legg Mason ETF Investment Trust requiringpre-approval by the Audit Committee in the Reporting Period.
(e) Audit Committee’s pre–approval policies and procedures described in paragraph (c) (7) of Rule2-01 of RegulationS-X.
(1) The Charter for the Audit Committee (the “Committee”) of the Board of each registered investment company (the “Fund”) advised by LMPFA or one of their affiliates (each, an “Adviser”) requires that the Committee shall approve (a) all audit and permissiblenon-audit services to be provided to the Fund and (b) all permissiblenon-audit services to be provided by the Fund’s independent auditors to the Adviser and any Covered Service Providers if the engagement relates directly to the operations and financial reporting of the Fund. The Committee may implement policies and procedures by which such services are approved other than by the full Committee.
The Committee shall not approvenon-audit services that the Committee believes may impair the independence of the auditors. As of the date of the approval of this Audit Committee Charter, permissiblenon-audit services include any professional services (including tax services), that are not prohibited services as described below, provided to the Fund by the independent auditors, other than those provided to the Fund in connection with an audit or a review of the financial statements of the Fund. Permissiblenon-audit services may not include: (i) bookkeeping or other services related to the accounting records or financial statements of the Fund; (ii) financial information systems design and implementation; (iii) appraisal or valuation services, fairness opinions orcontribution-in-kind reports; (iv) actuarial services; (v) internal audit outsourcing services; (vi) management functions or human resources; (vii) broker or dealer, investment adviser or investment banking services; (viii) legal services and expert services unrelated to the audit; and (ix) any other service the Public Company Accounting Oversight Board determines, by regulation, is impermissible.
Pre-approval by the Committee of any permissiblenon-audit services is not required so long as: (i) the aggregate amount of all such permissiblenon-audit services provided to the Fund, the Adviser and any service providers controlling, controlled by or under common control with the Adviser that provide ongoing services to the Fund (“Covered Service Providers”) constitutes not more than 5% of the total amount of revenues paid to the independent auditors during the fiscal year in which the permissiblenon-audit services are provided to (a) the Fund, (b) the Adviser and (c) any entity controlling, controlled by or under common control with the Adviser that provides ongoing services to the Fund during the fiscal year in which the services are provided that would have to be approved by the Committee; (ii) the permissiblenon-audit services were not recognized by the Fund at the time of the engagement to benon-audit services; and (iii) such services are promptly brought to the attention of the Committee and approved by the Committee (or its delegate(s)) prior to the completion of the audit.
(2) For the Legg Mason ETF Investment Trust, the percentage of fees that were approved by the audit committee, with respect to: Audit-Related Fees were 100% and 100% for November 30, 2017 and November 30, 2018; Tax Fees were 100% and 100% for November 30, 2017 and November 30, 2018; and Other Fees were 100% and 100% for November 30, 2017 and November 30, 2018.
(f) N/A
(g)Non-audit fees billed by the Auditor for services rendered to Legg Mason ETF Investment Trust, LMPFA and any entity controlling, controlled by, or under common control with LMPFA that provides ongoing services to Legg Mason ETF Investment Trust during the reporting period were $160,000 in November 30, 2017 and $678,000 in November 30, 2018.
(h) Yes. Legg Mason ETF Investment Trust’s Audit Committee has considered whether the provision ofnon-audit services that were rendered to Service Affiliates, which were notpre-approved (not requiringpre-approval), is compatible with maintaining the Accountant’s independence. All services provided by the Auditor to the Legg Mason ETF Investment Trust or to Service Affiliates, which were required to bepre-approved, werepre-approved as required.
| ITEM 5. | AUDIT COMMITTEE OF LISTED REGISTRANTS. |
| | a) | The independent board members are acting as the registrant’s audit committee as specified in Section 3(a)(58)(B) of the Exchange Act . The Audit Committee consists of the following Board members: |
Paul R. Ades
Andrew L. Breech
Dwight B. Crane
Althea L. Duersten
Frank G. Hubbard
Howard J. Johnson
Jerome H. Miller
Ken Miller
Thomas F. Schlafly
| ITEM 6. | SCHEDULE OF INVESTMENTS. |
Included herein under Item 1.
| ITEM 7. | DISCLOSURE OF PROXY VOTING POLICIES AND PROCEDURES FORCLOSED-END MANAGEMENT INVESTMENT COMPANIES. |
Not applicable.
| ITEM 8. | PORTFOLIO MANAGERS OFCLOSED-END MANAGEMENT INVESTMENT COMPANIES. |
Not applicable.
| ITEM 9. | PURCHASES OF EQUITY SECURITIES BYCLOSED-END MANAGEMENT INVESTMENT COMPANY AND AFFILIATED PURCHASERS. |
Not applicable.
| ITEM 10. | SUBMISSION OF MATTERS TO A VOTE OF SECURITY HOLDERS. |
Not applicable.
| ITEM 11. | CONTROLS AND PROCEDURES. |
| | (a) | The registrant’s principal executive officer and principal financial officer have concluded that the registrant’s disclosure controls and procedures (as defined in Rule30a- 3(c) under the Investment Company Act of 1940, as amended (the “1940 Act”)) are effective as of a date within 90 days of the filing date of this report that includes the disclosure required by this paragraph, based on their evaluation of the disclosure controls and procedures required by Rule30a-3(b) under the 1940 Act and15d-15(b) under the Securities Exchange Act of 1934. |
| | (b) | There were no changes in the registrant’s internal control over financial reporting (as defined in Rule30a-3(d) under the 1940 Act) that occurred during the second fiscal quarter of the period covered by this report that have materially affected, or are likely to materially affect the registrant’s internal control over financial reporting. |
(a) (1) Code of Ethics attached hereto.
Exhibit 99.CODE ETH
(a) (2) Certifications pursuant to section 302 of the Sarbanes-Oxley Act of 2002 attached hereto.
Exhibit 99.CERT
(b) Certifications pursuant to Section 906 of the Sarbanes-Oxley Act of 2002 attached hereto.
Exhibit 99.906CERT
SIGNATURES
Pursuant to the requirements of the Securities Exchange Act of 1934 and the Investment Company Act of 1940, the registrant has duly caused this Report to be signed on its behalf by the undersigned, there unto duly authorized.
Legg Mason ETF Investment Trust
| | |
| By: | | /s/ Jane Trust |
| | Jane Trust |
| | Chief Executive Officer |
| |
| Date: | | January 22, 2019 |
Pursuant to the requirements of the Securities Exchange Act of 1934 and the Investment Company Act of 1940, this report has been signed below by the following persons on behalf of the registrant and in the capacities and on the dates indicated.
| | |
| By: | | /s/ Jane Trust |
| | Jane Trust |
| | Chief Executive Officer |
| |
| Date: | | January 22, 2019 |
| | |
| By: | | /s/ Richard F. Sennett |
| | Richard F. Sennett |
| | Principal Financial Officer |
| |
| Date: | | January 22, 2019 |