UNITED STATES
SECURITIES AND EXCHANGE COMMISSION
Washington, D.C. 20549
FORMN-CSR
CERTIFIED SHAREHOLDER REPORT OF REGISTERED
MANAGEMENT INVESTMENT COMPANIES
Investment Company Act file number811-23096
Legg Mason ETF Investment Trust
(Exact name of registrant as specified in charter)
620 Eighth Avenue, 49th Floor,
New York, NY 10018
(Address of principal executive offices) (Zip code)
Robert I. Frenkel, Esq.
Legg Mason & Co., LLC
100 First Stamford Place
Stamford, CT 06902
(Name and address of agent for service)
Registrant’s telephone number, including area code:1-877-721-1926
Date of fiscal year end: July 31
Date of reporting period: July 31, 2019
| ITEM 1. | REPORT TO STOCKHOLDERS. |
TheAnnual Report to Stockholders is filed herewith.

| | |
| Annual Report | | July 31, 2019 |
LEGG MASON
SMALL-CAP QUALITY
VALUE ETF
SQLV
Beginning in January 2021, as permitted by regulations adopted by the Securities and Exchange Commission, the Fund intends to no longer mail paper copies of the Fund’s shareholder reports like this one, unless you specifically request paper copies of the reports from your financial intermediary (such as a broker-dealer or bank). Instead, the reports will be made available on a website, and you will be notified by mail each time a report is posted and provided with a website link to access the report.
If you already elected to receive shareholder reports electronically(“e-delivery”), you will not be affected by this change and you need not take any action. If you have not already electede-delivery, you may elect to receive shareholder reports and other communications from the Fund electronically by contacting your financial intermediary.
You may elect to receive all future reports in paper free of charge by contacting your financial intermediary to request that you continue to receive paper copies of your shareholder reports. Your election to receive reports in paper will apply to all Legg Mason Funds held in your account with your financial intermediary.

|
| INVESTMENT PRODUCTS: NOT FDIC INSURED • NO BANK GUARANTEE • MAY LOSE VALUE |
Fund objective
The Fund seeks to track the investment results of an index composed of equity securities of small-capitalization companies that are traded in the United States.
Letter from the president

Dear Shareholder,
We are pleased to provide the annual report of Legg MasonSmall-Cap Quality Value ETF for the twelve-month reporting period ended July 31, 2019. Please read on for a detailed look at prevailing economic and market conditions during the Fund’s reporting period and to learn how those conditions have affected Fund performance.
As always, we remain committed to providing you with excellent service and a full spectrum of investment choices. We also remain committed to supplementing the support you receive from your financial advisor. One way we accomplish this is through our website, www.leggmason.com. Here you can gain immediate access to market and investment information, including:
| • | | Fund net asset value and market price, |
| • | | Market insights and commentaries from our portfolio managers, and |
| • | | A host of educational resources. |
We look forward to helping you meet your financial goals.
Sincerely,

Jane Trust, CFA
President and Chief Executive Officer
August 30, 2019
| | |
II | | Legg Mason Small-Cap Quality Value ETF |
Fund overview
Q. What is the Fund’s investment strategy?
A.Legg MasonSmall-Cap Quality Value ETF (the “Fund”) seeks to track the investment results of an index composed of equity securities of small-capitalization companies that are traded in the United States. The Fund seeks to track the investment results of the RoyceSmall-Cap Quality Value Index (the “Underlying Index”)i. The Underlying Index utilizes a proprietary methodology created and sponsored by Royce & Associates, LP (“Royce”), the Fund’s subadviser. Royce is affiliated with both Legg Mason Partners Fund Advisor, LLC (“LMPFA”), the Fund’s investment manager, and the Fund. The Fund will invest at least 80% of its net assets, plus borrowings for investment purposes, if any, in securities that compose its Underlying Index.
The Underlying Index is composed of equity securities that meet certain criteria. Using Royce’s methodology, the Underlying Index will generally favor stocks with lower than average valuation, higher than average profitability, and higher than average debt coverage (i.e., available cash flow to pay current debt obligations) as compared with other stocks included in the investment universe while maintaining a comparable risk profile.
The Underlying Index’s constituents are reconstituted quarterly. The Fund’s securities portfolio is rebalanced when the Underlying Index is reconstituted. The composition of the Underlying Index and the Fund after reconstitution and rebalancing may fluctuate and exceed the above Underlying Index limitations due to market movements and other factors. The components of the Underlying Index, and the degree to which these components represent certain sectors and industries, may change over time.
The Fund may invest up to 20% of its net assets in cash and cash equivalents; other investment companies, including exchange-traded funds; exchange-traded notes; depositary receipts; and in securities and other instruments not included in its Underlying Index but which Royce believes will help the Fund track its Underlying Index.
Q. What were the overall market conditions during the Fund’s reporting period?
A.The twelve-month reporting period ended July 31, 2019 began on a bearish note and ended on a bullish one, with the end result thatsmall-cap stocks trailedlarge-cap stocks.Small-cap stocks, as measured by the Russell 2000 Indexii, were down 4.42% for the reporting period, whilelarge-cap stocks, as measured by the Russell 1000 Indexiii, gained 8.00% for the same span.
The damage tosmall-cap stocks was done primarily in the fourth quarter of 2018, when the Russell 2000 Index fell 20.20% (and was down 11.90% in December 2018 alone), compared to a loss of 13.82% for the Russell 1000 Index. Part of why this bearish jolt was so unexpected may be due to the placid nature of the bull market it wrenched to a stop.
For much of 2018, the U.S. market cruised confidently ahead, with very little congestion and few potholes. Through the first three quarters of the year, volatility barely registered in thesmall-cap market, with only 22% of the trading days having intraday moves of at least 1% in thesmall-cap Russell 2000 Index (and this asset class has
| | |
| Legg Mason Small-Cap Quality Value ETF 2019 Annual Report | | 1 |
Fund overview (cont’d)
historically been the most volatile segment of the equity world).
Of course, this all changed dramatically later in the year. For small-caps, it began after the Russell 2000 Index reached anall-time high on August 31, 2018, following which the wave of volatility hit. In the fourth quarter of 2018, 54% of the trading days for the Russell 2000 Index had intraday moves of at least 1%.
The first seven months of 2019 then offered equity investors almost everything they could have hoped for following the high anxiety of a recession scare and the bearish fourth quarter of 2018. Stocks immediately showed great resilience, and then some, by roaring back in the first half of the year.
A highly welcome double-digit rebound in the first quarter of 2019 was followed by a quieter period that saw more motion than progress. This was an understandable pause that gave the market time to digest the prior advance.
The Russell 2000 Index gained 14.6% for the first quarter of 2019. In the midst of December’s steep downdraft, it looked to us as if the market was experiencing something like a manic episode. As we observed at the time, it appeared that market sentiment had become detached from company fundamentals, creating an opportunity for selective patient investors. The rally that kicked off 2019 was the reversal of this dynamic.
The next four months of 2019 saw a seesaw ride — lots of motion with little overall progress. Bullish months in April, June, and July bookended a bearish May, leading to a modest 2.7% positive return for these four months. The upshot was a solid advance rise in the year’s first seven months, a period that saw low trading volumes and little volatility, which was mostly confined to a small decline in May 2019.
During the twelve-month reporting period ended July 31, 2019, eight of the eleven sectors in the Russell 2000 Index detracted from performance. The Energy sector made the biggest negative impact, followed by the Health Care and Materials sectors. Of the three sectors that made positive contributions, the Information Technology (“IT”) sector led, followed by the Utilities and Real Estate sectors. The Energy sector’s two industries — oil, gas & consumable fuels and energy equipment & services — detracted most while two groups in the IT sectors contributed most — software and semiconductors & semiconductor equipment.
The Fund uses a passive investment approach to achieve its investment objective, and therefore made no change in investment approach in response to market conditions.
Performance review
For the twelve months ended July 31, 2019, Legg MasonSmall-Cap Quality Value ETF generated a-11.29% return on a net asset value (“NAV”)iv basis and-11.26% based on its market price per sharev.
The performance table shows the Fund’s total return for the twelve months ended July 31, 2019 based on its NAV and market price as of July 31, 2019. The Fund seeks to track the investment results of the RoyceSmall-Cap Quality Value Index, which returned-10.91% for the same period. The Fund’s broad-based market index, the Russell 2000 Index, returned-4.42% over the
| | |
2 | | Legg Mason Small-Cap Quality Value ETF 2019 Annual Report |
same time frame. The LipperSmall-Cap Core Funds Category Averagevi returned-4.41% for the same period. Please note that Lipper performance returns are based on each fund’s NAV.
| | | | | | | | |
Performance Snapshotas of July 31, 2019 (unaudited) | |
| | | 6 months | | | 12 months | |
| Legg MasonSmall-Cap Quality Value ETF: | | | | | | | | |
$26.21 (NAV) | | | -1.79 | % | | | -11.29 | %*† |
$26.22 (Market Price) | | | -1.79 | % | | | -11.26 | %*‡ |
| RoyceSmall-Cap Quality Value Index | | | -1.66 | % | | | -10.91 | % |
| Russell 2000 Index | | | 5.76 | % | | | -4.42 | % |
| LipperSmall-Cap Core Funds Category Average | | | 5.54 | % | | | -4.41 | % |
The performance shown represents past performance. Past performance is no guarantee of future results and current performance may be higher or lower than the performance shown above. Principal value and investment returns will fluctuate so shares, when sold, may be worth more or less than their original cost. Performance data current to the most recentmonth-end is available at www.leggmason.com/etf.
Investors buy and sell shares of an exchange-traded fund (“ETF”) at market price (not NAV) in the secondary market throughout the trading day. These shares are not individually available for direct purchase from or direct redemption to the ETF. Market price returns shown are typically based upon themid-point between the bid and ask on the Fund’s principal trading market when the Fund’s NAV is determined, which is typically 4:00 p.m. Eastern time (US). These returns do not represent investors’ returns had they traded shares at other times. Performance figures for periods shorter than one year represent cumulative figures and are not annualized.
Information showing the number of days the market price of the Fund’s shares was greater than the Fund’s NAV and the number of days it was less than the Fund’s NAV (i.e., premium or discount) for various time periods is available by visiting the Fund’s website at www.leggmason.com/etf.
As of the Fund’s current prospectus dated November 9, 2018, the gross total annual fund operating expense ratio for the Fund was 0.60%.
* Total returns are based on changes in NAV or market price, respectively. Returns reflect the deduction of all Fund expenses. Returns do not reflect the deduction of brokerage commissions or taxes that investors pay on distributions or the sale of shares.
† Total return assumes the reinvestment of all distributions, at NAV.
‡ Total return assumes the reinvestment of all distributions at market price.
Q. What were the leading contributors to performance?
A.The IT and Utilities sectors made the largest positive contributions to performance in the Underlying Index on a sector level, as they were the only two sectors to post positive returns for the twelve-month reporting period ended July 31, 2019. IT services, electric utilities, and diversified consumer services were the three industries that contributed the most. Relative to the Russell 2000 Index, the Underlying Index’s
| | |
| Legg Mason Small-Cap Quality Value ETF 2019 Annual Report | | 3 |
Fund overview (cont’d)
allocations to the Utilities sector were the largest contributors as the stocks in the Underlying Index outperformed those in the broad-based market index. Additionally, the Underlying Index’s underweight position in the Financials sector contributed modestly to relative results as that sector lagged returns in the broad-based market index.
The Fund’s exposure to stocks with higher ratios of sales to assets than those in the broad-based market index contributed to relative performance.
Q. What were the leading detractors from performance?
A.The Consumer Discretionary and Energy sectors within the Underlying Index were the largest sector detractors from overall performance over the reporting period. At the industry level, auto components, oil, gas & consumable fuels, energy equipment & services, and biotechnology detracted the most. Relative to the Russell 2000 Index, holdings in the Consumer Discretionary sector were the largest detractors as the stocks in the Underlying Index declined more than those in the broad-based market index. IT stocks in the Underlying Index also detracted from relative performance. These stocks advanced, though not by as much as those in the broad-based market index.
The Fund’s relative performance was also hindered by a greater exposure to the value factor (cheaper stocks) and a greater exposure to smaller stocks.
Looking for additional information?
The Fund’s daily NAV is availableon-line at www.leggmason.com/etf. The Fund is traded under the symbol “SQLV” and its closing market price is available on most financial websites. In a continuing effort to provide information concerning the Fund, shareholders may call1-877-721-1926 (toll free), Monday through Friday from 8:00 a.m. to 5:30 p.m. Eastern time, for the Fund’s current NAV, market price and other information.
Thank you for your investment in Legg MasonSmall-Cap Quality Value ETF. As always, we appreciate that you have chosen us to manage your assets and we remain focused on achieving the Fund’s investment goals.
Sincerely,
Royce & Associates, LP
August 30, 2019
RISKS:Equity securities are subject to market and price fluctuations. The Fund invests primarily insmall-cap stocks, which may involve considerably more risk than investing inlarger-cap stocks. The Fund has significant exposure to U.S. issuers. A decrease in imports or exports, changes in trade regulations and/or an economic recession in the United States may have a material adverse effect on the U.S. economy and the securities listed on U.S. exchanges. There is no guarantee that the Fund will achieve a high degree of correlation to the index it seeks to track. The Fund does not seek to outperform the index it tracks, and does not seek temporary defensive positions when markets decline or appear overvalued. If the Underlying Index is concentrated in a particular industry or industries, the Fund may focus its investments in these industries, increasing its vulnerability to market volatility. Diversification does not ensure gains or protect against market declines. Please see the Fund’s prospectus for a more complete discussion of these and other risks and the Fund’s investment strategies.
The mention of sector breakdowns is for informational purposes only and should not be construed
| | |
4 | | Legg Mason Small-Cap Quality Value ETF 2019 Annual Report |
as a recommendation to purchase or sell any securities. The information provided regarding such sectors is not a sufficient basis upon which to make an investment decision. Investors seeking financial advice regarding the appropriateness of investing in any securities or investment strategies discussed should consult their financial professional. The Fund’s top five sector holdings (as a percentage of net assets) as of July 31, 2019 were: Health Care (18.2%), Financials (16.9%), Industrials (16.4%), Consumer Discretionary 13.7%) and Information Technology (12.1%). The Fund’s composition may differ over time.
All investments are subject to risk including the possible loss of principal. Past performance is no guarantee of future results. An index is a statistical composite that tracks a specified financial market, sector or rules-based investment process. Unlike a fund, an index does not actually hold a portfolio of securities and therefore does not incur the expenses incurred by a fund. These expenses negatively impact fund performance. All index performance reflects no deduction for fees, expenses or taxes. Please note that an investor cannot invest directly in an index.
The information provided is not intended to be a forecast of future events, a guarantee of future results or investment advice. Views expressed may differ from those of the firm as a whole.
| i | The RoyceSmall-Cap Quality Value Index is a proprietary index composed ofsmall-cap stocks trading in the United States with relatively low valuations, high profitability and high debt coverage compared with the average of stocks in the investment universe. |
| ii | The Russell 2000 Index measures the performance of thesmall-cap segment of the U.S. equity universe. The Russell 2000 is a subset of the Russell 3000 Index representing approximately 10% of the total market capitalization of that index. It includes approximately 2,000 of the smallest securities based on a combination of their market cap and current index membership. The Russell 3000 Index measures the performance of the 3,000 largest U.S. companies based on total market capitalization, which represents approximately 98% of the U.S. equity market. |
| iii | The Russell 1000 Index measures the performance of thelarge-cap segment of the U.S. equity universe. It is a subset of the Russell 3000 Index and includes approximately 1,000 of the largest securities based on a combination of their market cap and current index membership. The Russell 1000 represents approximately 90% of the U.S. market. |
| iv | Net Asset Value (“NAV”) is calculated by subtracting total liabilities from total assets and dividing the results by the number of shares outstanding. |
| v | Market Price is determined by supply and demand. It is the price at which an investor purchases or sells shares of the Fund. The Market Price may differ from the Fund’s NAV. |
| vi | Lipper, Inc., a wholly-owned subsidiary of Reuters, provides independent insight on global collective investments. Returns are based on the period ended July 31, 2019 calculated among the 973 funds for thesix-month period and among the 959 funds for the twelve-month period in the Fund’s Lipper category. |
| | |
| Legg Mason Small-Cap Quality Value ETF 2019 Annual Report | | 5 |
Fund at a glance†(unaudited)
Investment breakdown(%) as a percent of total investments
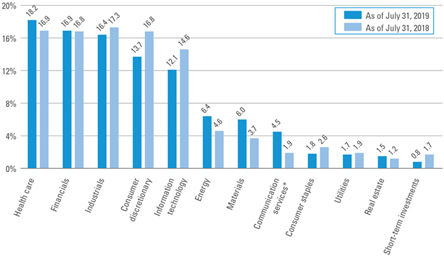
| † | The bar graph above represents the composition of the Fund’s investments as of July 31, 2019 and July 31, 2018. The composition of the Fund’s investments is subject to change at any time. |
| * | As of September 28, 2018, the Telecommunication Services sector was broadened to include some companies previously classified in the Consumer Discretionary and Information Technology sectors and renamed the Communication Services sector. |
| | |
6 | | Legg Mason Small-Cap Quality Value ETF 2019 Annual Report |
Fund expenses(unaudited)
Example
As a shareholder of the Fund, you may incur two types of costs: (1) transaction costs, such as brokerage commissions paid on purchases and sales of Fund shares; and (2) ongoing costs, including management fees; and other Fund expenses. This example is intended to help you understand your ongoing costs (in dollars) of investing in the Fund and to compare these costs with the ongoing costs of investing in other funds.
This example is based on an investment of $1,000 invested on February 1, 2019 and held for the six months ended July 31, 2019.
Actual expenses
The table below titled “Based on Actual Total Return” provides information about actual account values and actual expenses. You may use the information provided in this table, together with the amount you invested, to estimate the expenses that you paid over the period. To estimate the expenses you paid on your account, divide your ending account value by $1,000 (for example, an $8,600 ending account value divided by $1,000 = 8.6), then multiply the result by the number under the heading entitled “Expenses Paid During the Period”.
Hypothetical example for comparison purposes
The table below titled “Based on Hypothetical Total Return” provides information about hypothetical account values and hypothetical expenses based on the actual expense ratio and an assumed rate of return of 5.00% per year before expenses, which is not the Fund’s actual return. The hypothetical account values and expenses may not be used to estimate the actual ending account balance or expenses you paid for the period. You may use the information provided in this table to compare the ongoing costs of investing in the Fund and other funds. To do so, compare the 5.00% hypothetical example relating to the Fund with the 5.00% hypothetical examples that appear in the shareholder reports of the other funds.
Please note that the expenses shown in the table below are meant to highlight your ongoing costs only and do not reflect any transactional costs, such as brokerage commissions paid on purchases and sales of Fund shares. Therefore, the table is useful in comparing ongoing costs only, and will not help you determine the relative total costs of owning different funds. In addition, if these transaction costs were included, your costs would have been higher.
| | | | | | | | | | | | | | | | | | | | | | | | | | | | | | | | | | | | | | | | | | | | | | | | | | |
| | |
| Based on actual total return1 | | | | Based on hypothetical total return1 |
Actual
Total
Return2 | | Beginning
Account
Value | | Ending
Account
Value | | Annualized
Expense
Ratio | | Expenses Paid During
the Period3 | | | | Hypothetical
Annualized
Total Return | | Beginning
Account
Value | | Ending
Account
Value | | Annualized
Expense
Ratio | | Expenses Paid During
the Period3 |
| | | -1.79% | | | | $ | 1,000.00 | | | | $ | 982.10 | | | | | 0.60 | % | | | $ | 2.95 | | | | | | | 5.00 | % | | | | $1,000.00 | | | | $ | 1,021.82 | | | | | 0.60 | % | | | $ | 3.01 | |
| 1 | For the six months ended July 31, 2019. |
| 2 | Assumes the reinvestment of all distributions, including returns of capital, if any, at net asset value. Total return is not annualized, as it may not be representative of the total fund return for the year. Performance figures may reflect fee waivers and/or expense reimbursements. In the absence of fee waivers and/or expense reimbursements, the total return would have been lower. Past performance is no guarantee of future results. |
| 3 | Expenses (net of fee waivers and/or expense reimbursements) are equal to the Fund’s annualized expense ratio multiplied by the average account value over the period, multiplied by the number of days in the most recent fiscal half-year (181), then divided by 365. |
| | |
| Legg Mason Small-Cap Quality Value ETF 2019 Annual Report | | 7 |
Fund performance(unaudited)
| | | | |
| Net Asset Value | |
| Average annual total returns1 | | | |
| Twelve Months Ended 7/31/19 | | | -11.29 | % |
| Inception* through 7/31/19 | | | 3.11 | |
|
| Cumulative total returns1 | |
| Inception date of 7/12/17 through 7/31/19 | | | 6.50 | % |
| | | | |
| Market Price | |
| Average annual total returns2 | | | |
| Twelve Months Ended 7/31/19 | | | -11.26 | % |
| Inception* through 7/31/19 | | | 3.13 | |
|
| Cumulative total returns2 | |
| Inception date of 7/12/17 through 7/31/19 | | | 6.54 | % |
All figures represent past performance and are not a guarantee of future results. Investment returns and principal value of an investment will fluctuate so that an investor’s shares, when redeemed, may be worth more or less than their original cost. The returns shown do not reflect the deduction of brokerage commissions or taxes that investors would pay on distributions or the sale of shares. Performance figures may reflect fee waivers and/or expense reimbursements. In the absence of fee waivers and/or expense reimbursements, the total return would have been lower.
Investors buy and sell shares of the Fund at market price, not NAV, in the secondary market throughout the trading day. These shares are not individually available for direct purchase from or direct redemption to the Fund. The Fund’s per share NAV is the value of one share of the Fund and is calculated by dividing the value of total assets less total liabilities by the number of shares outstanding. The NAV return is based on the NAV of the Fund and the market price return is based on the market price per share of the Fund. Market price returns shown are typically based upon themid-point between the bid and ask on the Fund’s principal trading market when the Fund’s NAV is determined, which is typically 4:00 p.m. Eastern time (US). These returns do not represent investors’ returns had they traded shares at other times. NAV and market price returns assume that dividends and capital gain distributions have been reinvested in the Fund at NAV and market price, respectively. As with other exchange-traded funds, NAV returns and market price returns may differ because of factors such as the supply and demand for Fund shares and investors’ assessment of the underlying value of the Fund’s portfolio securities.
| 1 | Assumes the reinvestment of all distributions, including returns of capital, if any, at net asset value. |
| 2 | Assumes the reinvestment of all distributions, including returns of capital, if any, at market price. |
| * | Inception date of the Fund is July 12, 2017. |
| | |
8 | | Legg Mason Small-Cap Quality Value ETF 2019 Annual Report |
Historical performance
Value of $10,000 invested in
Legg Mason Small-Cap Quality Value ETF vs. Royce Small-Cap Value Index & Russell 2000 Index† — July 12, 2017 - July 2019
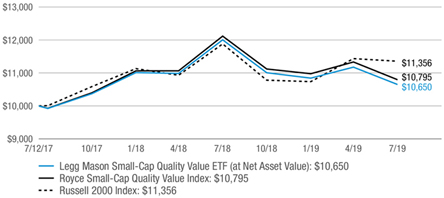
All figures represent past performance and are not a guarantee of future results. Investment returns and principal value of an investment will fluctuate so that an investor’s shares, when redeemed, may be worth more or less than their original cost. NAV returns assume that dividends and capital gain distributions have been reinvested in the Fund at NAV. The returns shown do not reflect the deduction of brokerage commissions or taxes that investors would pay on distributions or the sale of shares. Performance figures may reflect fee waivers and/or expense reimbursements. In the absence of fee waivers and/or expense reimbursements, the total return would have been lower.
| † | Hypothetical illustration of $10,000 invested in Legg MasonSmall-Cap Quality Value ETF on July 12, 2017 assuming the reinvestment of all distributions, including returns of capital, if any, at net asset value through July 31, 2019. The hypothetical illustration also assumes a $10,000 investment in the RoyceSmall-Cap Quality Value Index and the Russell 2000 Index. The Fund’s per share NAV is the value of one share of the Fund and is calculated by dividing the value of total assets less total liabilities by the number of shares outstanding. The NAV return is based on the NAV of the Fund. The RoyceSmall-Cap Quality Value Index (the “Underlying Index”) is an index composed of equity securities that meet certain criteria – lower than average valuation, higher than average profitability and higher than average debt coverage. The Underlying Index is based on a proprietary methodology created and sponsored by Royce & Associates, LP, the Fund’s subadviser. The Russell 2000 Index measures the 2000 smallest companies in the Russell 3000 Index. The indices are not subject to the same management and trading expenses as a fund. An index is a statistical composite that tracks a specified financial market, sector, or rules-based investment process. Unlike a fund, an index does not actually hold a portfolio of securities and therefore does not incur the expenses incurred by a fund. These expenses negatively impact fund performance. All index performance reflects no deduction for fees, expenses or taxes. Please note that an investor cannot invest directly in an index. |
| | |
| Legg Mason Small-Cap Quality Value ETF 2019 Annual Report | | 9 |
Schedule of investments
July 31, 2019
Legg MasonSmall-Cap Quality Value ETF
| | | | | | | | |
| Security | | Shares | | | Value | |
| Common Stocks — 99.2% | | | | | | | | |
| Communication Services — 4.5% | | | | | | | | |
Diversified Telecommunication Services — 1.6% | | | | | | | | |
Cogent Communications Holdings Inc. | | | 869 | | | $ | 54,756 | |
Frontier Communications Corp. | | | 50,842 | | | | 67,111 | * |
Vonage Holdings Corp. | | | 3,690 | | | | 45,756 | * |
Total Diversified Telecommunication Services | | | | | | | 167,623 | |
Entertainment — 0.2% | | | | | | | | |
Sciplay Corp., Class A Shares | | | 2,349 | | | | 24,500 | * |
Interactive Media & Services — 0.4% | | | | | | | | |
Eventbrite Inc., Class A Shares | | | 2,221 | | | | 39,290 | * |
Media — 2.3% | | | | | | | | |
AMC Networks Inc., Class A Shares | | | 1,077 | | | | 57,490 | * |
Gannett Co. Inc. | | | 7,534 | | | | 77,223 | |
MSG Networks Inc., Class A Shares | | | 2,042 | | | | 38,778 | * |
National CineMedia Inc. | | | 9,014 | | | | 64,180 | |
Total Media | | | | | | | 237,671 | |
Total Communication Services | | | | | | | 469,084 | |
| Consumer Discretionary — 13.7% | | | | | | | | |
Auto Components — 0.3% | | | | | | | | |
Superior Industries International Inc. | | | 11,320 | | | | 28,979 | |
Distributors — 0.7% | | | | | | | | |
Core-Mark Holding Co. Inc. | | | 1,891 | | | | 70,780 | |
Diversified Consumer Services — 1.6% | | | | | | | | |
American Public Education Inc. | | | 1,181 | | | | 38,997 | * |
Collectors Universe Inc. | | | 1,469 | | | | 34,830 | |
K12 Inc. | | | 1,438 | | | | 42,924 | * |
Weight Watchers International Inc. | | | 2,225 | | | | 48,171 | * |
Total Diversified Consumer Services | | | | | | | 164,922 | |
Hotels, Restaurants & Leisure — 1.9% | | | | | | | | |
Brinker International Inc. | | | 1,471 | | | | 58,620 | |
Cheesecake Factory Inc. | | | 1,254 | | | | 54,022 | |
Hilton Grand Vacations Inc. | | | 1,563 | | | | 51,110 | * |
Ruth’s Hospitality Group Inc. | | | 1,595 | | | | 35,521 | |
Total Hotels, Restaurants & Leisure | | | | | | | 199,273 | |
Household Durables — 1.7% | | | | | | | | |
La-Z-Boy Inc. | | | 1,638 | | | | 54,038 | |
Meritage Homes Corp. | | | 1,085 | | | | 68,149 | * |
Sonos Inc. | | | 3,359 | | | | 36,445 | * |
Turtle Beach Corp. | | | 2,429 | | | | 25,237 | * |
Total Household Durables | | | | | | | 183,869 | |
See Notes to Financial Statements.
| | |
10 | | Legg Mason Small-Cap Quality Value ETF 2019 Annual Report |
Legg MasonSmall-Cap Quality Value ETF
| | | | | | | | |
| Security | | Shares | | | Value | |
Internet & Direct Marketing Retail — 1.3% | | | | | | | | |
PetMed Express Inc. | | | 2,115 | | | $ | 36,738 | |
Shutterstock Inc. | | | 1,170 | | | | 44,893 | |
Stamps.com Inc. | | | 1,238 | | | | 59,114 | * |
Total Internet & Direct Marketing Retail | | | | | | | 140,745 | |
Leisure Products — 0.7% | | | | | | | | |
MasterCraft Boat Holdings Inc. | | | 1,908 | | | | 31,673 | * |
Sturm Ruger & Co. Inc. | | | 844 | | | | 47,686 | |
Total Leisure Products | | | | | | | 79,359 | |
Specialty Retail — 3.9% | | | | | | | | |
Buckle Inc. | | | 3,619 | | | | 73,647 | |
Children’s Place Inc. | | | 526 | | | | 51,374 | |
Michaels Cos. Inc. | | | 7,227 | | | | 49,650 | * |
Sally Beauty Holdings Inc. | | | 3,716 | | | | 51,058 | * |
Sleep Number Corp. | | | 1,102 | | | | 54,185 | * |
Tilly’s Inc., Class A Shares | | | 5,303 | | | | 43,432 | |
Urban Outfitters Inc. | | | 2,625 | | | | 62,501 | * |
Winmark Corp. | | | 116 | | | | 19,605 | |
Total Specialty Retail | | | | | | | 405,452 | |
Textiles, Apparel & Luxury Goods — 1.6% | | | | | | | | |
Culp Inc. | | | 1,848 | | | | 33,208 | |
Fossil Group Inc. | | | 4,759 | | | | 52,539 | * |
Movado Group Inc. | | | 1,675 | | | | 44,103 | |
Vera Bradley Inc. | | | 2,993 | | | | 35,168 | * |
Total Textiles, Apparel & Luxury Goods | | | | | | | 165,018 | |
Total Consumer Discretionary | | | | | | | 1,438,397 | |
| Consumer Staples — 1.8% | | | | | | | | |
Beverages — 0.5% | | | | | | | | |
National Beverage Corp. | | | 1,127 | | | | 49,058 | |
Personal Products — 0.6% | | | | | | | | |
Lifevantage Corp. | | | 1,933 | | | | 22,423 | * |
USANA Health Sciences Inc. | | | 581 | | | | 39,537 | * |
Total Personal Products | | | | | | | 61,960 | |
Tobacco — 0.7% | | | | | | | | |
Vector Group Ltd. | | | 6,706 | | | | 77,454 | |
Total Consumer Staples | | | | | | | 188,472 | |
| Energy — 6.4% | | | | | | | | |
Energy Equipment & Services — 1.8% | | | | | | | | |
Cactus Inc., Class A Shares | | | 1,149 | | | | 33,746 | * |
Era Group Inc. | | | 4,691 | | | | 48,411 | * |
Liberty Oilfield Services Inc., Class A Shares | | | 2,864 | | | | 40,525 | |
See Notes to Financial Statements.
| | |
| Legg Mason Small-Cap Quality Value ETF 2019 Annual Report | | 11 |
Schedule of investments (cont’d)
July 31, 2019
Legg MasonSmall-Cap Quality Value ETF
| | | | | | | | |
| Security | | Shares | | | Value | |
Energy Equipment & Services — continued | | | | | | | | |
Matrix Service Co. | | | 1,992 | | | $ | 36,593 | * |
Select Energy Services Inc., Class A Shares | | | 3,580 | | | | 36,409 | * |
Total Energy Equipment & Services | | | | | | | 195,684 | |
Oil, Gas & Consumable Fuels — 4.6% | | | | | | | | |
Antero Resources Corp. | | | 12,823 | | | | 59,114 | * |
Arch Coal Inc., Class A Shares | | | 609 | | | | 54,299 | |
CONSOL Energy Inc. | | | 2,451 | | | | 52,672 | * |
Contura Energy Inc. | | | 1,106 | | | | 39,628 | * |
Evolution Petroleum Corp. | | | 4,802 | | | | 29,292 | |
Falcon Minerals Corp. | | | 6,074 | | | | 48,045 | |
NACCO Industries Inc., Class A Shares | | | 737 | | | | 39,172 | |
Peabody Energy Corp. | | | 3,659 | | | | 77,059 | |
Renewable Energy Group Inc. | | | 3,278 | | | | 44,548 | * |
REX American Resources Corp. | | | 519 | | | | 38,717 | * |
Total Oil, Gas & Consumable Fuels | | | | | | | 482,546 | |
Total Energy | | | | | | | 678,230 | |
| Financials — 16.9% | | | | | | | | |
Banks — 6.3% | | | | | | | | |
Bancorp Inc. | | | 3,603 | | | | 34,877 | * |
Bar Harbor Bankshares | | | 1,533 | | | | 38,923 | |
Cathay General Bancorp | | | 1,872 | | | | 69,676 | |
Chemical Financial Corp. | | | 1,721 | | | | 72,351 | |
First Financial Corp. | | | 1,055 | | | | 45,798 | |
First Internet Bancorp | | | 1,367 | | | | 28,816 | |
Great Western Bancorp Inc. | | | 1,777 | | | | 60,098 | |
Hanmi Financial Corp. | | | 2,113 | | | | 45,408 | |
Home BancShares Inc. | | | 3,460 | | | | 68,058 | |
Northeast Bank | | | 1,157 | | | | 25,396 | |
PCB Bancorp | | | 1,691 | | | | 28,071 | |
Preferred Bank | | | 873 | | | | 47,308 | |
RBB Bancorp | | | 1,715 | | | | 34,472 | |
Texas Capital Bancshares Inc. | | | 998 | | | | 62,804 | * |
Total Banks | | | | | | | 662,056 | |
Capital Markets — 4.0% | | | | | | | | |
Artisan Partners Asset Management Inc., Class A Shares | | | 2,565 | | | | 75,898 | |
Cohen & Steers Inc. | | | 1,184 | | | | 62,006 | |
Diamond Hill Investment Group Inc. | | | 292 | | | | 41,157 | |
Moelis & Co., Class A Shares | | | 2,186 | | | | 79,658 | |
Oaktree Specialty Lending Corp. | | | 9,677 | | | | 51,579 | |
See Notes to Financial Statements.
| | |
12 | | Legg Mason Small-Cap Quality Value ETF 2019 Annual Report |
Legg MasonSmall-Cap Quality Value ETF
| | | | | | | | |
| Security | | Shares | | | Value | |
Capital Markets — continued | | | | | | | | |
Waddell & Reed Financial Inc., Class A Shares | | | 3,811 | | | $ | 66,693 | |
Westwood Holdings Group Inc. | | | 1,341 | | | | 41,973 | |
Total Capital Markets | | | | | | | 418,964 | |
Insurance — 3.4% | | | | | | | | |
American Equity Investment Life Holding Co. | | | 2,988 | | | | 77,090 | |
American National Insurance Co. | | | 713 | | | | 86,287 | |
Employers Holdings Inc. | | | 1,232 | | | | 54,085 | |
Investors Title Co. | | | 215 | | | | 35,282 | |
National Western Life Group Inc., Class A Shares | | | 224 | | | | 60,256 | |
Universal Insurance Holdings Inc. | | | 1,769 | | | | 43,889 | |
Total Insurance | | | | | | | 356,889 | |
Thrifts & Mortgage Finance — 3.2% | | | | | | | | |
Axos Financial Inc. | | | 1,651 | | | | 48,391 | * |
Flagstar Bancorp Inc. | | | 1,491 | | | | 51,409 | |
FS Bancorp Inc. | | | 526 | | | | 25,932 | |
Home Bancorp Inc. | | | 913 | | | | 34,110 | |
Merchants Bancorp | | | 2,074 | | | | 37,104 | |
Mr. Cooper Group Inc. | | | 9,999 | | | | 76,092 | * |
OP Bancorp | | | 2,502 | | | | 24,670 | |
Sterling Bancorp Inc. | | | 3,714 | | | | 36,471 | |
Total Thrifts & Mortgage Finance | | | | | | | 334,179 | |
Total Financials | | | | | | | 1,772,088 | |
| Health Care — 18.2% | | | | | | | | |
Biotechnology — 4.5% | | | | | | | | |
Acorda Therapeutics Inc. | | | 5,059 | | | | 35,059 | * |
Alector Inc. | | | 1,475 | | | | 31,152 | * |
Anika Therapeutics Inc. | | | 764 | | | | 42,089 | * |
Arena Pharmaceuticals Inc. | | | 883 | | | | 55,346 | * |
BioSpecifics Technologies Corp. | | | 428 | | | | 24,867 | * |
Eagle Pharmaceuticals Inc. | | | 668 | | | | 36,647 | * |
Emergent BioSolutions Inc. | | | 996 | | | | 43,963 | * |
Enanta Pharmaceuticals Inc. | | | 374 | | | | 28,058 | * |
Genomic Health Inc. | | | 645 | | | | 47,066 | * |
Ligand Pharmaceuticals Inc. | | | 428 | | | | 39,166 | * |
Myriad Genetics Inc. | | | 2,002 | | | | 58,338 | * |
Principia Biopharma Inc. | | | 710 | | | | 26,369 | * |
Total Biotechnology | | | | | | | 468,120 | |
Health Care Equipment & Supplies — 7.2% | | | | | | | | |
AngioDynamics Inc. | | | 1,936 | | | | 39,456 | * |
Atrion Corp. | | | 39 | | | | 30,010 | |
See Notes to Financial Statements.
| | |
| Legg Mason Small-Cap Quality Value ETF 2019 Annual Report | | 13 |
Schedule of investments (cont’d)
July 31, 2019
Legg MasonSmall-Cap Quality Value ETF
| | | | | | | | |
| Security | | Shares | | | Value | |
Health Care Equipment & Supplies — continued | | | | | | | | |
Cantel Medical Corp. | | | 587 | | | $ | 54,168 | |
CryoLife Inc. | | | 1,007 | | | | 29,022 | * |
FONAR Corp. | | | 1,190 | | | | 29,203 | * |
Heska Corp. | | | 326 | | | | 26,126 | * |
Inogen Inc. | | | 515 | | | | 31,672 | * |
iRadimed Corp. | | | 884 | | | | 21,110 | * |
LeMaitre Vascular Inc. | | | 1,083 | | | | 35,836 | |
Meridian Bioscience Inc. | | | 3,446 | | | | 41,180 | |
Merit Medical Systems Inc. | | | 756 | | | | 29,832 | * |
Natus Medical Inc. | | | 1,443 | | | | 44,834 | * |
Neogen Corp. | | | 658 | | | | 46,981 | * |
NuVasive Inc. | | | 766 | | | | 51,015 | * |
OraSure Technologies Inc. | | | 3,564 | | | | 29,759 | * |
Orthofix Medical Inc. | | | 683 | | | | 36,506 | * |
Quidel Corp. | | | 688 | | | | 40,613 | * |
Surmodics Inc. | | | 587 | | | | 24,478 | * |
Tactile Systems Technology Inc. | | | 434 | | | | 25,059 | * |
Utah Medical Products Inc. | | | 329 | | | | 29,936 | |
Varex Imaging Corp. | | | 1,844 | | | | 58,621 | * |
Total Health Care Equipment & Supplies | | | | | | | 755,417 | |
Health Care Providers & Services — 2.9% | | | | | | | | |
American Renal Associates Holdings Inc. | | | 6,243 | | | | 48,071 | * |
National HealthCare Corp. | | | 612 | | | | 53,611 | |
National Research Corp. | | | 691 | | | | 46,588 | |
Patterson Cos. Inc. | | | 3,159 | | | | 62,548 | |
Petiq Inc. | | | 1,030 | | | | 35,267 | * |
Premier Inc., Class A Shares | | | 1,581 | | | | 61,264 | * |
Total Health Care Providers & Services | | | | | | | 307,349 | |
Life Sciences Tools & Services — 0.4% | | | | | | | | |
Luminex Corp. | | | 1,755 | | | | 38,136 | |
Pharmaceuticals — 3.2% | | | | | | | | |
ANI Pharmaceuticals Inc. | | | 444 | | | | 37,558 | * |
Assertio Therapeutics Inc. | | | 11,493 | | | | 39,421 | * |
Collegium Pharmaceutical Inc. | | | 1,962 | | | | 21,523 | * |
Corcept Therapeutics Inc. | | | 3,530 | | | | 39,748 | * |
Innoviva Inc. | | | 2,924 | | | | 34,737 | * |
Lannett Co. Inc. | | | 7,549 | | | | 53,371 | * |
Osmotica Pharmaceuticals PLC | | | 12,671 | | | | 41,308 | * |
See Notes to Financial Statements.
| | |
14 | | Legg Mason Small-Cap Quality Value ETF 2019 Annual Report |
Legg MasonSmall-Cap Quality Value ETF
| | | | | | | | |
| Security | | Shares | | | Value | |
Pharmaceuticals — continued | | | | | | | | |
Phibro Animal Health Corp., Class A Shares | | | 1,484 | | | $ | 46,197 | |
SIGA Technologies Inc. | | | 4,434 | | | | 24,830 | * |
Total Pharmaceuticals | | | | | | | 338,693 | |
Total Health Care | | | | | | | 1,907,715 | |
| Industrials — 16.4% | | | | | | | | |
Aerospace & Defense — 0.9% | | | | | | | | |
Aerojet Rocketdyne Holdings Inc. | | | 1,223 | | | | 52,247 | * |
National Presto Industries Inc. | | | 493 | | | | 45,341 | |
Total Aerospace & Defense | | | | | | | 97,588 | |
Air Freight & Logistics — 0.7% | | | | | | | | |
Echo Global Logistics Inc. | | | 2,160 | | | | 45,490 | * |
Radiant Logistics Inc. | | | 5,023 | | | | 27,576 | * |
Total Air Freight & Logistics | | | | | | | 73,066 | |
Building Products — 2.0% | | | | | | | | |
Builders FirstSource Inc. | | | 4,179 | | | | 71,795 | * |
Continental Building Products Inc. | | | 1,635 | | | | 40,188 | * |
Patrick Industries Inc. | | | 1,023 | | | | 46,925 | * |
Quanex Building Products Corp. | | | 2,374 | | | | 44,204 | |
Total Building Products | | | | | | | 203,112 | |
Commercial Services & Supplies — 2.6% | | | | | | | | |
Deluxe Corp. | | | 1,495 | | | | 66,707 | |
Ennis Inc. | | | 2,358 | | | | 47,938 | |
HNI Corp. | | | 1,558 | | | | 53,346 | |
Kimball International Inc., Class B Shares | | | 2,342 | | | | 40,610 | |
Pitney Bowes Inc. | | | 15,727 | | | | 63,695 | |
Total Commercial Services & Supplies | | | | | | | 272,296 | |
Construction & Engineering — 0.8% | | | | | | | | |
Comfort Systems USA Inc. | | | 999 | | | | 41,958 | |
Great Lakes Dredge & Dock Corp. | | | 3,334 | | | | 35,774 | * |
Total Construction & Engineering | | | | | | | 77,732 | |
Electrical Equipment — 0.4% | | | | | | | | |
Encore Wire Corp. | | | 808 | | | | 44,375 | |
Machinery — 1.6% | | | | | | | | |
Commercial Vehicle Group Inc. | | | 4,915 | | | | 39,910 | * |
Hillenbrand Inc. | | | 1,495 | | | | 50,366 | |
Omega Flex Inc. | | | 363 | | | | 27,610 | |
Wabash National Corp. | | | 3,333 | | | | 52,761 | |
Total Machinery | | | | | | | 170,647 | |
Professional Services — 3.6% | | | | | | | | |
Barrett Business Services Inc. | | | 514 | | | | 44,975 | |
See Notes to Financial Statements.
| | |
| Legg Mason Small-Cap Quality Value ETF 2019 Annual Report | | 15 |
Schedule of investments (cont’d)
July 31, 2019
Legg MasonSmall-Cap Quality Value ETF
| | | | | | | | |
| Security | | Shares | | | Value | |
Professional Services — continued | | | | | | | | |
BG Staffing Inc. | | | 1,835 | | | $ | 30,498 | |
Exponent Inc. | | | 731 | | | | 50,293 | |
Heidrick & Struggles International Inc. | | | 1,235 | | | | 36,679 | |
Kforce Inc. | | | 1,180 | | | | 40,226 | |
Korn Ferry | | | 1,216 | | | | 47,764 | |
Mistras Group Inc. | | | 2,574 | | | | 39,022 | * |
TrueBlue Inc. | | | 2,305 | | | | 45,570 | * |
WageWorks Inc. | | | 868 | | | | 44,416 | * |
Total Professional Services | | | | | | | 379,443 | |
Road & Rail — 0.9% | | | | | | | | |
ArcBest Corp. | | | 1,988 | | | | 59,501 | |
YRC Worldwide Inc. | | | 11,808 | | | | 38,494 | * |
Total Road & Rail | | | | | | | 97,995 | |
Trading Companies & Distributors — 2.9% | | | | | | | | |
BMC Stock Holdings Inc. | | | 2,651 | | | | 56,069 | * |
GMS Inc. | | | 2,697 | | | | 60,710 | * |
H&E Equipment Services Inc. | | | 1,692 | | | | 51,792 | |
Systemax Inc. | | | 2,842 | | | | 61,671 | |
WESCO International Inc. | | | 1,403 | | | | 71,188 | * |
Total Trading Companies & Distributors | | | | | | | 301,430 | |
Total Industrials | | | | | | | 1,717,684 | |
| Information Technology — 12.1% | | | | | | | | |
Communications Equipment — 2.0% | | | | | | | | |
CalAmp Corp. | | | 3,234 | | | | 36,091 | * |
Casa Systems Inc. | | | 10,158 | | | | 66,941 | * |
InterDigital Inc. | | | 867 | | | | 55,861 | |
NetScout Systems Inc. | | | 2,115 | | | | 55,075 | * |
Total Communications Equipment | | | | | | | 213,968 | |
Electronic Equipment, Instruments & Components — 4.5% | | | | | | | | |
AVX Corp. | | | 4,058 | | | | 61,803 | |
Coherent Inc. | | | 444 | | | | 61,650 | * |
Control4 Corp. | | | 1,268 | | | | 30,318 | * |
Insight Enterprises Inc. | | | 1,103 | | | | 60,687 | * |
Mesa Laboratories Inc. | | | 134 | | | | 33,725 | |
PC Connection Inc. | | | 1,483 | | | | 48,509 | |
Taitron Components Inc., Class A Shares | | | 5,018 | | | | 15,907 | |
TTM Technologies Inc. | | | 5,842 | | | | 61,107 | * |
Vishay Intertechnology Inc. | | | 3,817 | | | | 64,889 | |
Vishay Precision Group Inc. | | | 789 | | | | 32,144 | * |
Total Electronic Equipment, Instruments & Components | | | | | | | 470,739 | |
See Notes to Financial Statements.
| | |
16 | | Legg Mason Small-Cap Quality Value ETF 2019 Annual Report |
Legg MasonSmall-Cap Quality Value ETF
| | | | | | | | |
| Security | | Shares | | | Value | |
IT Services — 1.8% | | | | | | | | |
Cass Information Systems Inc. | | | 792 | | | $ | 40,321 | |
CSG Systems International Inc. | | | 992 | | | | 50,830 | |
NIC Inc. | | | 2,667 | | | | 48,379 | |
Sykes Enterprises | | | 1,794 | | | | 50,752 | * |
Total IT Services | | | | | | | 190,282 | |
Semiconductors & Semiconductor Equipment — 2.8% | | | | | | | | |
Cirrus Logic Inc. | | | 1,288 | | | | 63,177 | * |
Diodes Inc. | | | 1,389 | | | | 59,171 | * |
Ichor Holdings Ltd. | | | 1,517 | | | | 38,244 | * |
Nanometrics Inc. | | | 1,063 | | | | 33,357 | * |
Rudolph Technologies Inc. | | | 1,408 | | | | 37,903 | * |
SMART Global Holdings Inc. | | | 1,960 | | | | 59,662 | * |
Total Semiconductors & Semiconductor Equipment | | | | | | | 291,514 | |
Software — 1.0% | | | | | | | | |
American Software Inc., Class A Shares | | | 2,433 | | | | 32,408 | |
Intelligent Systems Corp. | | | 577 | | | | 28,325 | * |
Progress Software Corp. | | | 1,073 | | | | 46,450 | |
Total Software | | | | | | | 107,183 | |
Total Information Technology | | | | | | | 1,273,686 | |
| Materials — 6.0% | | | | | | | | |
Chemicals — 1.5% | | | | | | | | |
FutureFuel Corp. | | | 4,464 | | | | 52,005 | |
Tredegar Corp. | | | 2,607 | | | | 43,459 | |
Trinseo SA | | | 1,568 | | | | 60,854 | |
Total Chemicals | | | | | | | 156,318 | |
Construction Materials — 0.4% | | | | | | | | |
U.S. Concrete Inc. | | | 923 | | | | 43,464 | * |
Containers & Packaging — 0.3% | | | | | | | | |
Myers Industries Inc. | | | 2,158 | | | | 34,895 | |
Metals & Mining — 2.5% | | | | | | | | |
AK Steel Holding Corp. | | | 26,768 | | | | 75,486 | * |
Materion Corp. | | | 667 | | | | 41,441 | |
Warrior Met Coal Inc. | | | 2,888 | | | | 71,449 | |
Worthington Industries Inc. | | | 1,693 | | | | 68,092 | |
Total Metals & Mining | | | | | | | 256,468 | |
Paper & Forest Products — 1.3% | | | | | | | | |
Boise Cascade Co. | | | 2,341 | | | | 63,207 | |
Domtar Corp. | | | 1,730 | | | | 73,439 | |
Total Paper & Forest Products | | | | | | | 136,646 | |
Total Materials | | | | | | | 627,791 | |
See Notes to Financial Statements.
| | |
| Legg Mason Small-Cap Quality Value ETF 2019 Annual Report | | 17 |
Schedule of investments (cont’d)
July 31, 2019
Legg MasonSmall-Cap Quality Value ETF
| | | | | | | | | | | | |
| Security | | | | | Shares | | | Value | |
| Real Estate — 1.5% | | | | | | | | | | | | |
Real Estate Management & Development — 1.5% | | | | | | | | | | | | |
Consolidated-Tomoka Land Co. | | | | | | | 437 | | | $ | 27,408 | |
Forestar Group Inc. | | | | | | | 1,909 | | | | 39,440 | * |
Marcus & Millichap Inc. | | | | | | | 1,294 | | | | 42,961 | * |
RMR Group Inc., Class A Shares | | | | | | | 928 | | | | 45,695 | |
Total Real Estate | | | | | | | | | | | 155,504 | |
| Utilities — 1.7% | | | | | | | | | | | | |
Electric Utilities — 1.2% | | | | | | | | | | | | |
Genie Energy Ltd., Class B Shares | | | | | | | 3,217 | | | | 35,451 | |
Otter Tail Corp. | | | | | | | 989 | | | | 52,793 | |
Spark Energy Inc., Class A Shares | | | | | | | 3,717 | | | | 40,664 | |
Total Electric Utilities | | | | | | | | | | | 128,908 | |
Water Utilities — 0.5% | | | | | | | | | | | | |
American States Water Co. | | | | | | | 610 | | | | 47,257 | |
Total Utilities | | | | | | | | | | | 176,165 | |
Total Investments before Short-Term Investments (Cost — $10,822,622) | | | | | | | | 10,404,816 | |
| | | |
| | | Rate | | | | | | | |
| Short-Term Investments — 0.8% | | | | | | | | | | | | |
Dreyfus Treasury Cash Management, Institutional Class (Cost — $80,720) | | | 2.211% | | | | 80,720 | | | | 80,720 | |
Total Investments — 100.0% (Cost — $10,903,342) | | | | | | | | | | | 10,485,536 | |
Liabilities in Excess of Other Assets — 0.0% | | | | | | | | | | | (2,067 | ) |
Total Net Assets — 100.0% | | | | | | | | | | $ | 10,483,469 | |
| * | Non-income producing security. |
See Notes to Financial Statements.
| | |
18 | | Legg Mason Small-Cap Quality Value ETF 2019 Annual Report |
Statement of assets and liabilities
July 31, 2019
| | | | |
| |
| Assets: | | | | |
Investments, at value (Cost — $10,903,342) | | $ | 10,485,536 | |
Dividends and interest receivable | | | 2,410 | |
Total Assets | | | 10,487,946 | |
| |
| Liabilities: | | | | |
Investment management fee payable | | | 4,477 | |
Total Liabilities | | | 4,477 | |
| Total Net Assets | | $ | 10,483,469 | |
| |
| Net Assets: | | | | |
Par value (Note 5) | | $ | 4 | |
Paid-in capital in excess of par value | | | 12,212,768 | |
Total distributable earnings (loss) | | | (1,729,303) | |
| Total Net Assets | | $ | 10,483,469 | |
| |
| Shares Outstanding | | | 400,000 | |
| |
| Net Asset Value | | $ | 26.21 | |
See Notes to Financial Statements.
| | |
| Legg Mason Small-Cap Quality Value ETF 2019 Annual Report | | 19 |
Statement of operations
For the Year Ended July 31, 2019
| | | | |
| |
| Investment Income: | | | | |
Dividends | | $ | 136,371 | |
Interest | | | 1,138 | |
Total Investment Income | | | 137,509 | |
| |
| Expenses: | | | | |
Investment management fee (Note 2) | | | 43,522 | |
Total Expenses | | | 43,522 | |
| Net Investment Income | | | 93,987 | |
| |
| Realized and Unrealized Loss on Investments (Notes 1 and 3): | | | | |
Net Realized Loss From Investment Transactions | | | (595,750) | |
Change in Net Unrealized Appreciation (Depreciation) From Investments | | | (440,527) | |
| Net Loss on Investments | | | (1,036,277) | |
| Decrease in Net Assets From Operations | | $ | (942,290) | |
See Notes to Financial Statements.
| | |
20 | | Legg Mason Small-Cap Quality Value ETF 2019 Annual Report |
Statements of changes in net assets
| | | | | | | | |
| For the Years Ended July 31, | | 2019 | | | 2018 | |
| | |
| Operations: | | | | | | | | |
Net investment income | | $ | 93,987 | | | $ | 33,868 | |
Net realized gain (loss) | | | (595,750) | | | | 521,333 | |
Change in net unrealized appreciation (depreciation) | | | (440,527) | | | | 40,776 | |
Increase (Decrease) in Net Assets From Operations | | | (942,290) | | | | 595,977 | |
| | |
| Distributions to Shareholders From (Note 1): | | | | | | | | |
Total distributable earnings(a) | | | (115,500) | | | | (11,000) | |
Decrease in Net Assets From Distributions to Shareholders | | | (115,500) | | | | (11,000) | |
| | |
| Fund Share Transactions (Note 5): | | | | | | | | |
Net proceeds from sale of shares (450,000 and 250,000 shares issued, respectively) | | | 12,447,188 | | | | 6,913,721 | |
Cost of shares repurchased (200,000 and 200,000 shares repurchased, respectively) | | | (5,414,769) | | | | (5,485,149) | |
Increase in Net Assets From Fund Share Transactions | | | 7,032,419 | | | | 1,428,572 | |
Increase in Net Assets | | | 5,974,629 | | | | 2,013,549 | |
| | |
| Net Assets: | | | | | | | | |
Beginning of year | | | 4,508,840 | | | | 2,495,291 | |
End of year(b) | | $ | 10,483,469 | | | $ | 4,508,840 | |
| (a) | Distributions from net investment income and from realized gains are no longer required to be separately disclosed (Note 7). For the year ended July 31, 2018, distributions from net investment income were $11,000. |
| (b) | Parenthetical disclosure of undistributed net investment income is no longer required (Note 7). For the year ended July 31, 2018, end of year net assets included undistributed net investment income of $22,020. |
See Notes to Financial Statements.
| | |
| Legg Mason Small-Cap Quality Value ETF 2019 Annual Report | | 21 |
Financial highlights
| | | | | | | | | | | | |
| For a share of beneficial interest outstanding throughout each year ended July 31, unless otherwise noted: | |
| | | 20191 | | | 20181 | | | 20171,2 | |
| | | |
| Net asset value, beginning of year | | | $30.06 | | | | $24.95 | | | | $25.14 | |
| | | |
| Income (loss) from operations: | | | | | | | | | | | | |
Net investment income (loss) | | | 0.35 | | | | 0.31 | | | | (0.00) | 3 |
Net realized and unrealized gain (loss) | | | (3.77) | | | | 4.91 | | | | (0.19) | |
Total income (loss) from operations | | | (3.42) | | | | 5.22 | | | | (0.19) | |
| | | |
| Less distributions from: | | | | | | | | | | | | |
Net investment income | | | (0.43) | | | | (0.11) | | | | — | |
Total distributions | | | (0.43) | | | | (0.11) | | | | — | |
| | | |
| Net asset value, end of year | | | $26.21 | | | | $30.06 | | | | $24.95 | |
Total return, based on NAV4 | | | (11.29) | % | | | 20.97 | % | | | (0.76) | % |
| | | |
| Net assets, end of year (000s) | | | $10,483 | | | | $4,509 | | | | $2,495 | |
| | | |
| Ratios to average net assets: | | | | | | | | | | | | |
Gross expenses | | | 0.60 | % | | | 0.60 | % | | | 0.60 | %5 |
Net expenses | | | 0.60 | | | | 0.60 | | | | 0.60 | 5 |
Net investment income (loss) | | | 1.30 | | | | 1.12 | | | | (0.29) | 5 |
| | | |
| Portfolio turnover rate6 | | | 87 | % | | | 80 | % | | | 0 | % |
| 1 | Per share amounts have been calculated using the average shares method. |
| 2 | For the period July 12, 2017 (inception date) to July 31, 2017. |
| 3 | Amount represents less than $0.005 per share. |
| 4 | Performance figures may reflect fee waivers and/or expense reimbursements. In the absence of fee waivers and/or expense reimbursements, the total return would have been lower. The total return calculation assumes that distributions are reinvested at NAV. Past performance is no guarantee of future results. Total returns for periods of less than one year are not annualized. |
| 6 | Portfolio turnover excludes the value of portfolio securities received or delivered as a result ofin-kind fund share transactions. |
See Notes to Financial Statements.
| | |
22 | | Legg Mason Small-Cap Quality Value ETF 2019 Annual Report |
Notes to financial statements
1. Organization and significant accounting policies
Legg MasonSmall-Cap Quality Value ETF (the “Fund”) is a separate diversified investment series of Legg Mason ETF Investment Trust (the “Trust”). The Trust, a Maryland statutory trust, is registered under the Investment Company Act of 1940, as amended (the “1940 Act”), as anopen-end management investment company.
The Fund is an exchange-traded fund (“ETF”). ETFs are funds that trade like other publicly-traded securities. The Fund is designed to track an index. Similar to shares of an index mutual fund, each share of the Fund represents an ownership interest in an underlying portfolio of securities intended to track an index. Unlike shares of a mutual fund, which can be bought from and redeemed by the issuing fund by all shareholders at a price based on net asset value (“NAV”), shares of the Fund may be directly purchased from and redeemed by the Fund at NAV solely by certain large institutional investors who have entered into agreements with the Fund’s distributor (“Authorized Participants”). Also unlike shares of a mutual fund, shares of the Fund are listed on a national securities exchange and trade in the secondary market at market prices that change throughout the day.
Shares of the Fund are listed and traded at market prices on NASDAQ. The market price for the Fund’s shares may be different from the Fund’s NAV. The Fund issues and redeems shares at NAV only in blocks of a specified number of shares or multiples thereof (“Creation Units”). Only Authorized Participants may purchase or redeem Creation Units directly with the Fund at NAV. Creation Units are issued and redeemed principallyin-kind (although under some circumstances its shares are created and redeemed partially for cash). Except when aggregated in Creation Units, shares of the Fund are not redeemable securities. Shareholders who are not Authorized Participants may not redeem shares directly from the Fund at NAV.
The Fund seeks to track the investment results of the RoyceSmall-Cap Quality Value Index (the “Underlying Index”). The Underlying Index utilizes a proprietary methodology created and sponsored by Royce & Associates, LP (“Royce”), the Fund’s subadviser.
The following are significant accounting policies consistently followed by the Fund and are in conformity with U.S. generally accepted accounting principles (“GAAP”). Estimates and assumptions are required to be made regarding assets, liabilities and changes in net assets resulting from operations when financial statements are prepared. Changes in the economic environment, financial markets and any other parameters used in determining these estimates could cause actual results to differ. Subsequent events have been evaluated through the date the financial statements were issued.
(a) Investment valuation. Equity securities for which market quotations are available are valued at the last reported sales price or official closing price on the primary market or exchange on which they trade. The valuations for fixed income securities (which may
| | |
| Legg Mason Small-Cap Quality Value ETF 2019 Annual Report | | 23 |
Notes to financial statements (cont’d)
include, but are not limited to, corporate, government, municipal, mortgage-backed, collateralized mortgage obligations and asset-backed securities) and certain derivative instruments are typically the prices supplied by independent third party pricing services, which may use market prices or broker/dealer quotations or a variety of valuation techniques and methodologies. The independent third party pricing services use inputs that are observable such as issuer details, interest rates, yield curves, prepayment speeds, credit risks/spreads, default rates and quoted prices for similar securities. Investments inopen-end funds are valued at the closing net asset value per share of each fund on the day of valuation. When the Fund holds securities or other assets that are denominated in a foreign currency, the Fund will use the currency exchange rates, generally determined as of 4:00 p.m. (London Time) (4.00 p.m. Eastern Time prior to October 1, 2018). If independent third party pricing services are unable to supply prices for a portfolio investment, or if the prices supplied are deemed by the manager to be unreliable, the market price may be determined by the manager using quotations from one or more broker/dealers or at the transaction price if the security has recently been purchased and no value has yet been obtained from a pricing service or pricing broker. When reliable prices are not readily available, such as when the value of a security has been significantly affected by events after the close of the exchange or market on which the security is principally traded, but before the Fund calculates its net asset value, the Fund values these securities as determined in accordance with procedures approved by the Fund’s Board of Trustees.
The Board of Trustees is responsible for the valuation process and has delegated the supervision of the daily valuation process to the Legg Mason North Atlantic Fund Valuation Committee (the “Valuation Committee”). The Valuation Committee, pursuant to the policies adopted by the Board of Trustees, is responsible for making fair value determinations, evaluating the effectiveness of the Fund’s pricing policies, and reporting to the Board of Trustees. When determining the reliability of third party pricing information for investments owned by the Fund, the Valuation Committee, among other things, conducts due diligence reviews of pricing vendors, monitors the daily change in prices and reviews transactions among market participants.
The Valuation Committee will consider pricing methodologies it deems relevant and appropriate when making fair value determinations. Examples of possible methodologies include, but are not limited to, multiple of earnings; discount from market of a similar freely traded security; discounted cash-flow analysis; book value or a multiple thereof; risk premium/yield analysis; yield to maturity; and/or fundamental investment analysis. The Valuation Committee will also consider factors it deems relevant and appropriate in light of the facts and circumstances. Examples of possible factors include, but are not limited to, the type of security; the issuer’s financial statements; the purchase price of the security; the discount from market value of unrestricted securities of the same class at the time of purchase; analysts’ research and observations from financial institutions; information regarding any transactions or offers with respect to the security; the existence of merger proposals or tender
| | |
24 | | Legg Mason Small-Cap Quality Value ETF 2019 Annual Report |
offers affecting the security; the price and extent of public trading in similar securities of the issuer or comparable companies; and the existence of a shelf registration for restricted securities.
For each portfolio security that has been fair valued pursuant to the policies adopted by the Board of Trustees, the fair value price is compared against the last available and next available market quotations. The Valuation Committee reviews the results of such back testing monthly and fair valuation occurrences are reported to the Board of Trustees quarterly.
The Fund uses valuation techniques to measure fair value that are consistent with the market approach and/or income approach, depending on the type of security and the particular circumstance. The market approach uses prices and other relevant information generated by market transactions involving identical or comparable securities. The income approach uses valuation techniques to discount estimated future cash flows to present value.
GAAP establishes a disclosure hierarchy that categorizes the inputs to valuation techniques used to value assets and liabilities at measurement date. These inputs are summarized in the three broad levels listed below:
| • | | Level 1 — quoted prices in active markets for identical investments |
| • | | Level 2 — other significant observable inputs (including quoted prices for similar investments, interest rates, prepayment speeds, credit risk, etc.) |
| • | | Level 3 — significant unobservable inputs (including the Fund’s own assumptions in determining the fair value of investments) |
The inputs or methodologies used to value securities are not necessarily an indication of the risk associated with investing in those securities.
The following is a summary of the inputs used in valuing the Fund’s assets carried at fair value:
| | | | | | | | | | | | | | | | |
| ASSETS | |
| Description | | Quoted Prices
(Level 1) | | | Other Significant
Observable Inputs
(Level 2) | | | Significant
Unobservable
Inputs (Level 3) | | | Total | |
| Common Stocks† | | $ | 10,404,816 | | | | — | | | | — | | | $ | 10,404,816 | |
| Short-Term Investments† | | | 80,720 | | | | — | | | | — | | | | 80,720 | |
| Total Investments | | $ | 10,485,536 | | | | — | | | | — | | | $ | 10,485,536 | |
| † | See Schedule of Investments for additional detailed categorizations. |
| | |
| Legg Mason Small-Cap Quality Value ETF 2019 Annual Report | | 25 |
Notes to financial statements (cont’d)
(b) Foreign currency translation.Investment securities and other assets and liabilities denominated in foreign currencies are translated into U.S. dollar amounts based upon prevailing exchange rates on the date of valuation. Purchases and sales of investment securities and income and expense items denominated in foreign currencies are translated into U.S. dollar amounts based upon prevailing exchange rates on the respective dates of such transactions.
The Fund does not isolate that portion of the results of operations resulting from fluctuations in foreign exchange rates on investments from the fluctuations arising from changes in market prices of securities held. Such fluctuations are included with the net realized and unrealized gain or loss on investments.
Net realized foreign exchange gains or losses arise from sales of foreign currencies, including gains and losses on forward foreign currency contracts, currency gains or losses realized between the trade and settlement dates on securities transactions, and the difference between the amounts of dividends, interest, and foreign withholding taxes recorded on the Fund’s books and the U.S. dollar equivalent of the amounts actually received or paid. Net unrealized foreign exchange gains and losses arise from changes in the values of assets and liabilities, other than investments in securities, on the date of valuation, resulting from changes in exchange rates.
Foreign security and currency transactions may involve certain considerations and risks not typically associated with those of U.S. dollar denominated transactions as a result of, among other factors, the possibility of lower levels of governmental supervision and regulation of foreign securities markets and the possibility of political or economic instability.
(c) Foreign investment risks.The Fund’s investments in foreign securities may involve risks not present in domestic investments. Since securities may be denominated in foreign currencies, may require settlement in foreign currencies or pay interest or dividends in foreign currencies, changes in the relationship of these foreign currencies to the U.S. dollar can significantly affect the value of the investments and earnings of the Fund. Foreign investments may also subject the Fund to foreign government exchange restrictions, expropriation, taxation or other political, social or economic developments, all of which affect the market and/or credit risk of the investments.
(d) Security transactions and investment income.Security transactions are accounted for on a trade date basis. Interest income (including interest income frompayment-in-kind securities), adjusted for amortization of premium and accretion of discount, is recorded on the accrual basis. Dividend income is recorded on theex-dividend date for dividends received in cash and/or securities. Foreign dividend income is recorded on theex-dividend date or as soon as practicable after the Fund determines the existence of a dividend declaration after exercising reasonable due diligence. The cost of investments sold is determined by use of the specific identification method. To the extent any issuer defaults or a credit
| | |
26 | | Legg Mason Small-Cap Quality Value ETF 2019 Annual Report |
event occurs that impacts the issuer, the Fund may halt any additional interest income accruals and consider the realizability of interest accrued up to the date of default or credit event.
(e) Distributions to shareholders.Distributions from net investment income of the Fund, if any, are declared and paid on a quarterly basis. Prior to February 6, 2019, distributions from net investment income of the Fund, if any, were declared at least annually. Distributions of net realized gains, if any, are declared at least annually. Distributions to shareholders of the Fund are recorded on theex-dividend date and are determined in accordance with income tax regulations, which may differ from GAAP.
(f) Federal and other taxes.It is the Fund’s policy to comply with the federal income and excise tax requirements of the Internal Revenue Code of 1986 (the “Code”), as amended, applicable to regulated investment companies. Accordingly, the Fund intends to distribute its taxable income and net realized gains, if any, to shareholders in accordance with timing requirements imposed by the Code. Therefore, no federal or state income tax provision is required in the Fund’s financial statements.
Management has analyzed the Fund’s tax positions taken on income tax returns for all open tax years and has concluded that as of July 31, 2019, no provision for income tax is required in the Fund’s financial statements. The Fund’s federal and state income and federal excise tax returns for tax years for which the applicable statutes of limitations have not expired are subject to examination by the Internal Revenue Service and state departments of revenue.
Under the applicable foreign tax laws, a withholding tax may be imposed on interest, dividends and capital gains at various rates.
(g) Reclassification.GAAP requires that certain components of net assets be reclassified to reflect permanent differences between financial and tax reporting. These reclassifications have no effect on net assets or net asset value per share. During the current year ended, the following reclassifications have been made:
| | | | | | | | |
| | | Total Distributable
Earnings (Loss) | | | Paid-in
Capital | |
| (a) | | $ | (578,005) | | | $ | 578,005 | |
| (a) | Reclassifications are due to book/tax differences in the treatment of anin-kind distribution of securities. |
2. Investment management agreement and other transactions with affiliates
Legg Mason Partners Fund Advisor, LLC (“LMPFA”) is the Fund’s investment manager and Royce & Associates, LP (“Royce”) is the Fund’s subadviser. Western Asset Management Company, LLC (“Western Asset”) manages the portion of the Fund’s cash and short-term instruments allocated to it. LMPFA and Western Asset are wholly-owned subsidiaries, and Royce is a majority-owned subsidiary, of Legg Mason, Inc. (“Legg Mason”).
| | |
| Legg Mason Small-Cap Quality Value ETF 2019 Annual Report | | 27 |
Notes to financial statements (cont’d)
LMPFA provides administrative and certain oversight services to the Fund. LMPFA delegates to the subadviser theday-to-day portfolio management of the Fund. The Fund is responsible for paying interest expenses, taxes, brokerage expenses, future12b-1 fees (if any), acquired fund fees and expenses, extraordinary expenses and the management fee payable to LMPFA under the investment management agreement. LMPFA has agreed to pay all of the Fund’s organization and offering costs.
Under the investment management agreement and subject to the general supervision of the Fund’s Board of Trustees, LMPFA provides or causes to be furnished all investment management, supervisory, administrative and other services reasonably necessary for the operation of the Fund, including certain distribution services (provided pursuant to a separate distribution agreement) and investment advisory services (provided pursuant to separate subadvisory agreements) under a unitary fee structure. The Fund pays an investment management fee, calculated daily and paid monthly, at an annual rate of 0.60% of the Fund’s average daily net assets.
As compensation for its subadvisory services, LMPFA pays Royce monthly 90% of the management fee paid by the Fund to LMPFA, net of (i) all fees and expenses incurred by LMPFA under the investment management agreement (including without limitation any subadvisory fee paid to another subadviser to the Fund) and (ii) expense waivers, if any, and reimbursements. LMPFA pays Western Asset monthly a fee of 0.02% of the portion of the Fund’s average daily net assets allocated to Western Asset for the management of cash and other short-term instruments, net of expense waivers, if any, and reimbursements.
Legg Mason Investor Services, LLC, a wholly-owned broker-dealer subsidiary of Legg Mason, serves as the distributor of Creation Units for the Fund on an agency basis.
The Fund’s Board of Trustees has adopted a Rule12b-1 shareholder services and distribution plan and under that plan, the Fund is authorized to pay service and/or distribution fees calculated at an annual rate of up to 0.25% of its average daily net assets. No service and/or distribution fees are currently paid by the Fund, and there are no current plans to impose these fees.
All officers and one Trustee of the Trust are employees of Legg Mason or its affiliates and do not receive compensation from the Trust.
3. Investments
During the year ended July 31, 2019, the aggregate cost of purchases and proceeds from sales of investments (excludingin-kind transactions and short-term investments) were as follows:
| | | | |
| Purchases | | $ | 6,409,516 | |
| Sales | | | 6,351,824 | |
| | |
28 | | Legg Mason Small-Cap Quality Value ETF 2019 Annual Report |
During the year ended July 31, 2019,in-kind transactions (Note 5) were as follows:
| | | | |
| Contributions | | $ | 12,447,420 | |
| Redemptions | | | 5,438,616 | |
| Realized gain (loss)* | | | 765,306 | |
| * | Net realized gains on redemptionsin-kind are not taxable to the remaining shareholders of the Fund. |
Thein-kind contributions andin-kind redemptions shown in this table may not agree with the Fund Share Transactions on the Statement of Changes in Net Assets. This table represents the accumulation of the Fund’s daily net shareholder transactions while the Statement of Changes in Net Assets reflects gross shareholder transactions including any cash component of the transactions.
At July 31, 2019, the aggregate cost of investments and the aggregate gross unrealized appreciation and depreciation of investments for federal income tax purposes were as follows:
| | | | | | | | | | | | | | | | |
| | | Cost | | | Gross
Unrealized
Appreciation | | | Gross
Unrealized
Depreciation | | | Net
Unrealized
Depreciation | |
| Securities | | $ | 11,190,634 | | | $ | 590,915 | | | $ | (1,296,013) | | | $ | (705,098) | |
4. Derivative instruments and hedging activities
During the year ended July 31, 2019, the Fund did not invest in derivative instruments.
5. Fund share transactions
At July 31, 2019, the Trust had an unlimited number of shares of beneficial interest authorized with a par value of $0.00001 per share. Fund shares are issued and redeemed by the Fund only in Creation Units or Creation Unit aggregations, where 50,000 shares of the Fund constitute a Creation Unit. Such transactions are generally on anin-kind basis, with a separate cash payment, which is a balancing cash component to equate the transaction to the net asset value per share of the Fund on the transaction date. Transactions in capital shares of the Fund are disclosed in detail in the Statement of Changes in Net Assets. Authorized Participants are subject to standard creation and redemption transaction fees to offset transfer and other transaction costs associated with the issuance and redemption of Creation Units. Creations and redemptions for cash (when cash creations and redemptions are available or specified) may be subject to an additional variable fee.
6. Income tax information and distributions to shareholders
The tax character of distributions paid during the fiscal years ended July 31, was as follows:
| | | | | | | | |
| | | 2019 | | | 2018 | |
| Distributions paid from: | | | | | | | | |
| Ordinary income | | $ | 115,500 | | | $ | 11,000 | |
| | |
| Legg Mason Small-Cap Quality Value ETF 2019 Annual Report | | 29 |
Notes to financial statements (cont’d)
As of July 31, 2019, the components of accumulated earnings (losses) on a tax basis were as follows:
| | | | |
| Undistributed ordinary income — net | | $ | 507 | |
| Deferred capital losses* | | | (1,024,711) | |
| Unrealized appreciation (depreciation)(a) | | | (705,099) | |
| Total accumulated earnings (losses) — net | | $ | (1,729,303) | |
| * | These capital losses have been deferred in the current year as either short-term or long-term losses. The losses will be deemed to occur on the first day of the next taxable year in the same character as they were originally deferred and will be available to offset future taxable capital gains. |
| (a) | The difference between book-basis andtax-basis unrealized appreciation (depreciation) is attributable to the tax deferral of losses on wash sales. |
7. Recent accounting pronouncements
In August 2018, the Securities and Exchange Commission released its Final Rule on Disclosure Update and Simplification (the “Final Rule”) which is intended to simplify an issuer’s disclosure compliance efforts by removing redundant or outdated disclosure requirements without significantly altering the mix of information provided to investors. Effective with the current reporting period, the Fund adopted the Final Rule with the most notable impacts being that the Fund is no longer required to present the components of distributable earnings on the Statement of Assets and Liabilities or the sources of distributions to shareholders and the amount of undistributed net investment income on the Statements of Changes in Net Assets. The tax components of distributable earnings and distributions to shareholders continue to be disclosed within the Notes to Financial Statements.
The Fund has adopted the disclosure provisions of the Financial Accounting Standards Board Accounting Standards UpdateNo. 2018-13,Fair Value Measurement (Topic 820)— Disclosure Framework—Changes to the Disclosure Requirements for Fair Value Measurement(“ASU2018-13”) which introduces new fair value disclosure requirements as well as eliminates and modifies certain existing fair value disclosure requirements. ASU2018-13 would be effective for fiscal years beginning after December 15, 2019, and interim periods within those fiscal years; however, management has elected to early adopt ASU2018-13. The impact of the Fund’s adoption was limited to changes in the Fund’s financial statement disclosures regarding fair value, primarily those disclosures related to transfers between levels of the fair value hierarchy.
| | |
30 | | Legg Mason Small-Cap Quality Value ETF 2019 Annual Report |
Report of independent registered public accounting firm
To the Board of Trustees of Legg Mason ETF Investment Trust and Shareholders of Legg MasonSmall-Cap Quality Value ETF
Opinion on the Financial Statements
We have audited the accompanying statement of assets and liabilities, including the schedule of investments, of Legg MasonSmall-Cap Quality Value ETF (one of the funds constituting Legg Mason ETF Investment Trust, referred to hereafter as the “Fund”) as of July 31, 2019, the related statement of operations for the year ended July 31, 2019 and the statement of changes in net assets and the financial highlights for each of the two years in the period ended July 31, 2019, including the related notes (collectively referred to as the “financial statements”). In our opinion, the financial statements present fairly, in all material respects, the financial position of the Fund as of July 31, 2019, the results of its operations for the year then ended, and the changes in its net assets and the financial highlights for each of the two years in the period ended July 31, 2019 in conformity with accounting principles generally accepted in the United States of America.
The financial statements and financial highlights of the Fund as of July 31, 2017 and for the period July 12, 2017 (commencement of operations) through July 31, 2017 (not presented herein, other than the financial highlights) were audited by other auditors whose report dated September 18, 2017 expressed an unqualified opinion on those financial statements and financial highlights.
Basis for Opinion
These financial statements are the responsibility of the Fund’s management. Our responsibility is to express an opinion on the Fund’s financial statements based on our audits. We are a public accounting firm registered with the Public Company Accounting Oversight Board (United States) (PCAOB) and are required to be independent with respect to the Fund in accordance with the U.S. federal securities laws and the applicable rules and regulations of the Securities and Exchange Commission and the PCAOB.
We conducted our audits of these financial statements in accordance with the standards of the PCAOB. Those standards require that we plan and perform the audit to obtain reasonable assurance about whether the financial statements are free of material misstatement, whether due to error or fraud.
Our audits included performing procedures to assess the risks of material misstatement of the financial statements, whether due to error or fraud, and performing procedures that respond to those risks. Such procedures included examining, on a test basis, evidence regarding the amounts and disclosures in the financial statements. Our audits also included evaluating the accounting principles used and significant estimates made by management, as well as evaluating the overall presentation of the financial statements. Our procedures included confirmation of securities owned as of July 31, 2019 by correspondence with the custodian. We believe that our audits provide a reasonable basis for our opinion.
/s/PricewaterhouseCoopers LLP
Baltimore, Maryland
September 17, 2019
We have served as the auditor of one or more investment companies in Legg Mason investment company group since at least 1973. We have not been able to determine the specific year we began serving as auditor.
| | |
| Legg Mason Small-Cap Quality Value ETF 2019 Annual Report | | 31 |
Additional information(unaudited)
Information about Trustees and Officers
The business and affairs of Legg MasonSmall-Cap Quality Value ETF (the “Fund”) are conducted by management under the supervision and subject to the direction of its Board of Trustees. The business address of each Trustee is c/o Jane Trust, Legg Mason, 100 International Drive, 11th Floor, Baltimore, Maryland 21202. Information pertaining to the Trustees and officers of the Fund is set forth below.
The Statement of Additional Information includes additional information about Trustees and is available, without charge, upon request by calling the Fund at1-877-721-1926.
| | |
| Independent Trustees† |
| |
| Paul R. Ades | | |
| |
| Year of birth | | 1940 |
| Position(s) with Trust | | Trustee |
| Term of office1and length of time served2 | | Since 1983 |
| Principal occupation(s) during the past five years | | Paul R. Ades, PLLC (law firm) (since 2000) |
| Number of funds in fund complex overseen by Trustee | | 48 |
| Other board memberships held by Trustee during the past five years | | None |
|
| Andrew L. Breech |
| Year of birth | | 1952 |
| Position(s) with Trust | | Trustee |
| Term of office1and length of time served2 | | Since 1991 |
| Principal occupation(s) during the past five years | | President, Dealer Operating Control Service, Inc. (automotive retail management) (since 1985) |
| Number of funds in fund complex overseen by Trustee | | 48 |
| Other board memberships held by Trustee during the past five years | | None |
|
| Dwight B. Crane |
| Year of birth | | 1937 |
| Position(s) with Trust | | Trustee |
| Term of office1and length of time served2 | | Since 1981 |
| Principal occupation(s) during the past five years | | Professor Emeritus, Harvard Business School (since 2007); formerly, Professor, Harvard Business School (1969 to 2007); Independent Consultant (since 1969) |
| Number of funds in fund complex overseen by Trustee | | 48 |
| Other board memberships held by Trustee during the past five years | | None |
| | |
32 | | Legg Mason Small-Cap Quality Value ETF |
| | |
| Independent Trustees†(cont’d) |
|
| Althea L. Duersten |
| |
| Year of birth | | 1951 |
| Position(s) with Trust | | Trustee |
| Term of office1and length of time served2 | | Since 2014 |
| Principal occupation(s) during the past five years | | Retired (since 2011); formerly, Chief Investment Officer, North America, JPMorgan Chase (investment bank) and member of JPMorgan Executive Committee (2007 to 2011) |
| Number of funds in fund complex overseen by Trustee | | 48 |
| Other board memberships held by Trustee during the past five years | | Non-Executive Director, Rokos Capital Management LLP (since 2019) |
|
| Stephen R. Gross* |
| |
| Year of birth | | 1947 |
| Position(s) with Trust | | Trustee |
| Term of office1and length of time served2 | | Since 1986 |
| Principal occupation(s) during the past five years | | Chairman Emeritus (since 2011) and formerly, Chairman, HLB Gross Collins, P.C. (accounting and consulting firm) (1979 to 2011); Executive Director of Business Builders Team, LLC (since 2005); Principal, Gross Consulting Group, LLC (since 2011); CEO, Gross Capital Partners, LLC (since 2014); CEO, Trusted CFO Solutions, LLC (since 2011) |
| Number of funds in fund complex overseen by Trustee | | 93 |
| Other board memberships held by Trustee during the past five years | | None |
|
| Susan M. Heilbron* |
| |
| Year of birth | | 1945 |
| Position(s) with Trust | | Trustee |
| Term of office1and length of time served2 | | Since 1994 |
| Principal occupation(s) during the past five years | | Retired; formerly, President, Lacey & Heilbron (communications consulting) (1990 to 2002); General Counsel and Executive Vice President, The Trump Organization (1986 to 1990); Senior Vice President, New York State Urban Development Corporation (1984 to 1986); Associate, Cravath, Swaine & Moore (1980 to 1984) and (1977 to 1979) |
| Number of funds in fund complex overseen by Trustee | | 93 |
| Other board memberships held by Trustee during the past five years | | Formerly, Director, Lincoln Savings Bank, FSB (1991 to 1994); Director, Trump Shuttle, Inc. (air transportation) (1989 to 1990); Director, Alexander’s Inc. (department store) (1987 to 1990) |
| | |
| Legg Mason Small-Cap Quality Value ETF | | 33 |
Additional information(unaudited) (cont’d)
Information about Trustees and Officers
| | |
| Independent Trustees†(cont’d) |
|
| Frank G. Hubbard |
| |
| Year of birth | | 1937 |
| Position(s) with Trust | | Trustee |
| Term of office1and length of time served2 | | Since 1993 |
| Principal occupation(s) during the past five years | | President, Fealds, Inc. (business development) (since 2016); formerly, President, Avatar International Inc. (business development) (1998 to 2015) |
| Number of funds in fund complex overseen by Trustee | | 48 |
| Other board memberships held by Trustee during the past five years | | None |
|
| Howard J. Johnson |
| |
| Year of birth | | 1938 |
| Position(s) with Trust | | Trustee and Chairman |
| Term of office1and length of time served2 | | From 1981 to 1998 and since 2000 (Chairman since 2013) |
| Principal occupation(s) during the past five years | | Retired; formerly, Chief Executive Officer, Genesis Imaging LLC (technology company) (2003 to 2012) |
| Number of funds in fund complex overseen by Trustee | | 48 |
| Other board memberships held by Trustee during the past five years | | None |
|
| Jerome H. Miller |
| |
| Year of birth | | 1938 |
| Position(s) with Trust | | Trustee |
| Term of office1and length of time served2 | | Since 1995 |
| Principal occupation(s) during the past five years | | Retired; formerly, Vice Chairman, Shearson Lehman Hutton Inc. (1989 to 1992) and Senior Executive Vice President, E.F. Hutton Group Inc. (1986 to 1989) |
| Number of funds in fund complex overseen by Trustee | | 48 |
| Other board memberships held by Trustee during the past five years | | None |
|
| Ken Miller |
| |
| Year of birth | | 1942 |
| Position(s) with Trust | | Trustee |
| Term of office1and length of time served2 | | Since 1983 |
| Principal occupation(s) during the past five years | | Retired; formerly, President, Young Stuff Apparel Group, Inc. (apparel manufacturer), division of Li & Fung (1963 to 2012) |
| Number of funds in fund complex overseen by Trustee | | 48 |
| Other board memberships held by Trustee during the past five years | | None |
| | |
34 | | Legg Mason Small-Cap Quality Value ETF |
| | |
| Independent Trustees†(cont’d) |
|
| Thomas F. Schlafly |
| |
| Year of birth | | 1948 |
| Position(s) with Trust | | Trustee |
| Term of office1and length of time served2 | | Since 1983 |
| Principal occupation(s) during the past five years | | Chairman, The Saint Louis Brewery, LLC (brewery) (since 2012); formerly, President, The Saint Louis Brewery, Inc. (1989 to 2012); Senior Counsel (since 2017) and formerly, Partner (2009 to 2016), Thompson Coburn LLP (law firm) |
| Number of funds in fund complex overseen by Trustee | | 48 |
| Other board memberships held by Trustee during the past five years | | Director, Citizens National Bank of Greater St. Louis (since 2006) |
| | |
| Interested Trustee and Officer |
|
| Jane Trust, CFA3 |
| |
| Year of birth | | 1962 |
| Position(s) with Trust | | Trustee, President and Chief Executive Officer |
| Term of office1and length of time served2 | | Since 2015 |
| Principal occupation(s) during the past five years | | Senior Managing Director of Legg Mason & Co., LLC (“Legg Mason & Co.”) (since 2018); Managing Director of Legg Mason & Co. (2016 to 2018); Officer and/or Trustee/Director of 141 funds associated with Legg Mason Partners Fund Advisor, LLC (“LMPFA”) or its affiliates (since 2015); President and Chief Executive Officer of LMPFA (since 2015); formerly, Senior Vice President of LMPFA (2015); Director of ClearBridge, LLC (formerly, Legg Mason Capital Management, LLC) (2007 to 2014); Managing Director of Legg Mason Investment Counsel & Trust Co. (2000 to 2007) |
| Number of funds in fund complex overseen by Trustee | | 132 |
| Other board memberships held by Trustee during the past five years | | None |
| | |
| Additional Officers |
|
Ted P. Becker
Legg Mason 620 Eighth Avenue, 49th Floor, New York, NY 10018 |
| |
| Year of birth | | 1951 |
| Position(s) with Trust | | Chief Compliance Officer |
| Term of office1and length of time served2 | | Since 2007 |
| Principal occupation(s) during the past five years | | Director of Global Compliance at Legg Mason (since 2006); Chief Compliance Officer of LMPFA (since 2006); Managing Director of Compliance of Legg Mason & Co. (since 2005); Chief Compliance Officer of certain mutual funds associated with Legg Mason & Co. or its affiliates (since 2006) |
| | |
| Legg Mason Small-Cap Quality Value ETF | | 35 |
Additional information(unaudited) (cont’d)
Information about Trustees and Officers
| | |
| Additional Officers (cont’d) |
|
Susan Kerr
Legg Mason 620 Eighth Avenue, 49th Floor, New York, NY 10018 |
| |
| Year of birth | | 1949 |
| Position(s) with Trust | | Chief Anti-Money Laundering Compliance Officer |
| Term of office1and length of time served2 | | Since 2013 |
| Principal occupation(s) during the past five years | | Assistant Vice President of Legg Mason & Co. and Legg Mason Investor Services, LLC (“LMIS”) (since 2010); Chief Anti-Money Laundering Compliance Officer of certain mutual funds associated with Legg Mason & Co. or its affiliates (since 2013) and Anti-Money Laundering Compliance Officer of LMIS (since 2012); Senior Compliance Officer of LMIS (since 2011); formerly, AML Consultant, DTCC (2010); AML Consultant, Rabobank Netherlands, (2009); First Vice President, Director of Marketing & Advertising Compliance and Manager of Communications Review Group at Citigroup Inc. (1996 to 2008) |
|
Jenna Bailey
Legg Mason 100 First Stamford Place, 5th Floor, Stamford, CT 06902 |
| |
| Year of birth | | 1978 |
| Position(s) with Trust | | Identity Theft Prevention Officer |
| Term of office1and length of time served2 | | Since 2015 |
| Principal occupation(s) during the past five years | | Identity Theft Prevention Officer of certain mutual funds associated with Legg Mason & Co. or its affiliates (since 2015); Compliance Officer of Legg Mason & Co. (since 2013); Assistant Vice President of Legg Mason & Co. (since 2011); formerly, Associate Compliance Officer of Legg Mason & Co. (2011 to 2013) |
|
Robert I. Frenkel Legg Mason 100 First Stamford Place, 6th Floor, Stamford, CT 06902 |
| |
| Year of birth | | 1954 |
| Position(s) with Trust | | Secretary and Chief Legal Officer |
| Term of office1and length of time served2 | | Since 2007 |
| Principal occupation(s) during the past five years | | Vice President and Deputy General Counsel of Legg Mason (since 2006); Managing Director and General Counsel— U.S. Mutual Funds for Legg Mason & Co. (since 2006) and Legg Mason & Co. predecessors (since 1994); Secretary and Chief Legal Officer of certain mutual funds associated with Legg Mason & Co. or its affiliates (since 2006) and Legg Mason & Co. predecessors (prior to 2006) |
| | |
36 | | Legg Mason Small-Cap Quality Value ETF |
| | |
| Additional Officers (cont’d) |
|
Thomas C. Mandia Legg Mason 100 First Stamford Place, 6th Floor, Stamford, CT 06902 |
| |
| Year of birth | | 1962 |
| Position(s) with Trust | | Assistant Secretary |
| Term of office1and length of time served2 | | Since 2007 |
| Principal occupation(s) during the past five years | | Managing Director and Deputy General Counsel of Legg Mason & Co. (since 2005) and Legg Mason & Co. predecessors (prior to 2005); Secretary of LMPFA (since 2006); Assistant Secretary of certain mutual funds associated with Legg Mason & Co. or its affiliates (since 2006) and Legg Mason & Co. predecessors (prior to 2006); Secretary of LM Asset Services, LLC (“LMAS”) (since 2002) and Legg Mason Fund Asset Management, Inc. (“LMFAM”) (since 2013) (formerly registered investment advisers) |
|
Richard F. Sennett Legg Mason 100 International Drive, Baltimore, MD 21202 |
| |
| Year of birth | | 1970 |
| Position(s) with Trust | | Principal Financial Officer |
| Term of office1and length of time served2 | | Since 2011 |
| Principal occupation(s) during the past five years | | Principal Financial Officer and Treasurer of certain mutual funds associated with Legg Mason & Co. or its affiliates (since 2011 and since 2013); Managing Director of Legg Mason & Co. and Senior Manager of the Treasury Policy group for Legg Mason & Co.’s Global Fiduciary Platform (since 2011); formerly, Chief Accountant within the SEC’s Division of Investment Management (2007 to 2011); Assistant Chief Accountant within the SEC’s Division of Investment Management (2002 to 2007) |
|
Christopher Berarducci Legg Mason 620 Eighth Avenue, 49th Floor, New York, NY 10018 |
| |
| Year of birth | | 1974 |
| Position(s) with Trust | | Treasurer |
| Term of office1and length of time served2 | | Since 2014 |
| Principal occupation(s) during the past five years | | Director of Legg Mason & Co. (since 2015); Treasurer of certain mutual funds associated with Legg Mason & Co. or its affiliates (since 2010); formerly, Vice President of Legg Mason & Co. (2011 to 2015); Assistant Controller of certain mutual funds associated with Legg Mason & Co. or its affiliates (prior to 2010) |
| | |
| Legg Mason Small-Cap Quality Value ETF | | 37 |
Additional information(unaudited) (cont’d)
Information about Trustees and Officers
| | |
| Additional Officers (cont’d) |
|
Jeanne M. Kelly Legg Mason 620 Eighth Avenue, 49th Floor, New York, NY 10018 |
| |
| Year of birth | | 1951 |
| Position(s) with Trust | | Senior Vice President |
| Term of office1and length of time served2 | | Since 2007 |
| Principal occupation(s) during the past five years | | Senior Vice President of certain mutual funds associated with Legg Mason & Co. or its affiliates (since 2007); Senior Vice President of LMPFA (since 2006); President and Chief Executive Officer of LMAS and LMFAM (since 2015); Managing Director of Legg Mason & Co. (since 2005) and Legg Mason & Co. predecessors (prior to 2005); formerly, Senior Vice President of LMFAM (2013 to 2015) |
| † | Trustees who are not “interested persons” of the Fund within the meaning of Section 2(a)(19) of the Investment Company Act of 1940, as amended (the “1940 Act”). |
| * | Effective February 6, 2019, Mr. Gross and Ms. Heilbron became Trustees on this Board and an additional Board within the Legg Mason fund complex, which is reflected in the “Number of funds in fund complex overseen by Trustee”. |
| 1 | Each Trustee and officer serves until his or her respective successor has been duly elected and qualified or until his or her earlier death, resignation, retirement or removal. |
| 2 | Indicates the earliest year in which the Trustee became a board member for a fund in the Legg Mason fund complex or the officer took such office. |
| 3 | Ms. Trust is an “interested person” of the Fund, as defined in the 1940 Act, because of her position with LMPFA and/or certain of its affiliates. |
| | |
38 | | Legg Mason Small-Cap Quality Value ETF |
Important tax information(unaudited)
The following information is provided with respect to the distributions paid during the taxable year ended July 31, 2019:
| | | | | | | | | | | | |
| Record date: | | | 12/27/2018 | | | | 3/19/2019 | | | | 6/18/2019 | |
| Payable date: | | | 12/31/2018 | | | | 3/21/2019 | | | | 6/20/2019 | |
| Ordinary income: | | | | | | | | | | | | |
Qualified dividend income for individuals | | | 100.00 | % | | | 100.00 | % | | | 100.00 | % |
Dividends qualifying for the dividends | | | | | | | | | | | | |
received deduction for corporations | | | 100.00 | % | | | 100.00 | % | | | 100.00 | % |
Please retain this information for your records.
| | |
| Legg Mason Small-Cap Quality Value ETF | | 39 |
Legg Mason
Small-Cap Quality Value ETF
Trustees
Paul R. Ades
Andrew L. Breech
Dwight B. Crane
Althea L. Duersten
Stephen R. Gross*
Susan M. Heilbron*
Frank G. Hubbard
Howard J. Johnson
Chairman
Jerome H.Miller
Ken Miller
Thomas F. Schlafly
Jane Trust
| * | Effective February 6, 2019, Mr. Gross and Ms. Heilbron became Trustees. |
Investment manager
Legg Mason Partners Fund Advisor, LLC
Subadviser
Royce & Associates, LP
Custodian
The Bank of New York Mellon
Transfer agent
BNY Mellon Investment Servicing (US) Inc.
4400 Computer Drive
Westborough, MA 01581
Independent registered public accounting firm
PricewaterhouseCoopers LLP
Baltimore, MD
Legg MasonSmall-Cap Quality Value ETF
The Fund is a separate investment series of Legg Mason ETF Investment Trust, a Maryland statutory trust.
Legg MasonSmall-Cap Quality Value ETF
Legg Mason Funds
620 Eighth Avenue, 49th Floor
New York, NY 10018
The Fund files its complete schedule of portfolio holdings with the Securities and Exchange Commission (“SEC”) for the first and third quarters of each fiscal year as an exhibit to its reports on FormN-PORT. Previously, the Fund filed a complete schedule of portfolio holdings with the SEC for the first and third quarters of each fiscal year on FormN-Q. The Fund’s FormsN-PORT andN-Q are available on the SEC’s website at www.sec.gov. To obtain information on FormsN-PORT andN-Q, shareholders can call the Fund at1-877-721-1926.
Information on how the Fund voted proxies relating to portfolio securities during the prior12-month period ended June 30th of each year and a description of the policies and procedures that the Fund uses to determine how to vote proxies related to portfolio transactions are available (1) without charge, upon request, by calling the Fund at1-877-721-1926, (2) at www.leggmason.com/etf and (3) on the SEC’s website at www.sec.gov.
This report is submitted for the general information of the shareholders of Legg MasonSmall-Cap Quality Value ETF. This report is not authorized for distribution to prospective investors in the Fund unless preceded or accompanied by a current prospectus.
Investors should consider the Fund’s investment objectives, risks, charges and expenses carefully before investing. The prospectus contains this and other important information about the Fund. Please read the prospectus carefully before investing.
www.leggmason.com
© 2019 Legg Mason Investor Services, LLC
Member FINRA, SIPC
ETF Index Disclaimers
The RoyceSmall-Cap Quality Value Index (the “Underlying Index”) is created and sponsored by Royce & Associates, LP (“Royce”), the subadviser to Legg MasonSmall-Cap Quality Value ETF (the “Fund”). Royce is an affiliated person of Legg Mason Partners Fund Advisor, LLC, the Fund’s manager and the Fund. The Underlying Index is the exclusive property of Royce. Legg Mason ETF Investment Trust has entered into a license agreement with Royce to use the Underlying Index at no charge. Royce has retained Solactive AG, an unaffiliated third party, to calculate the Underlying Index. Solactive AG publishes information regarding the market value of the Underlying Index.
The Fund is not sponsored, promoted, sold or supported in any other manner by Solactive AG nor does Solactive AG offer any express or implicit guarantee or assurance either with regard to the results of using the Underlying Index and/or Underlying Index trade marks or the Underlying Index Price at any time or in any other respect. The Underlying Index is calculated and published by Solactive AG. Solactive AG uses its best efforts to ensure that the Underlying Index is calculated correctly. Irrespective of its obligations towards the Fund, Solactive AG has no obligation to point out errors in the Underlying Index to third parties including but not limited to investors and/or financial intermediaries of the Fund. Neither publication of the Underlying Index by Solactive AG nor the licensing of the Underlying Index or Underlying Index trade marks for the purpose of use in connection with the Fund constitutes a recommendation by Solactive AG to invest capital in the Fund nor does it in any way represent an assurance or opinion of Solactive AG with regard to any investment in the Fund.
Royce does not guarantee the accuracy and/or the completeness of the Underlying Index or any data included therein, and Royce shall not have any liability for any errors, omissions or interruptions therein. Royce makes no warranty, express or implied, as to results to be obtained by the Fund, owners of the shares of the Fund or any other person or entity from the use of the Underlying Index or any data included therein, either in connection with the Fund or for any other use. Royce makes no express or implied warranties, and expressly disclaims all warranties of merchantability or fitness for a particular purpose or use with respect to the Underlying Index or any data included therein. Without limiting any of the foregoing, in no event shall Royce have any liability for any special, punitive, direct, indirect or consequential damages (including lost profits) arising out of matters relating to the use of the Underlying Index, even if notified of the possibility of such damages.
www.leggmason.com
© 2019 Legg Mason Investor Services, LLC Member FINRA, SIPC
ETFF399959 9/19 SR19-3701
The registrant has adopted a code of ethics that applies to the registrant’s principal executive officer, principal financial officer, principal accounting officer or controller.
| ITEM 3. | AUDIT COMMITTEE FINANCIAL EXPERT. |
The Board of Trustees of the registrant has determined that Dwight B. Crane possesses the technical attributes identified in Instruction 2(b) of Item 3 to FormN-CSR to qualify as an “audit committee financial expert,” and has designated Dwight B. Crane as the Audit Committee’s financial expert Dwight B. Crane is an “independent” Trustees pursuant to paragraph (a)(2) of Item 3 to FormN-CSR.
| ITEM 4. | PRINCIPAL ACCOUNTANT FEES AND SERVICES. |
a)Audit Fees. The aggregate fees billed in the last two fiscal years ending July 31, 2018 and July 31, 2019 (the “Reporting Periods”) for professional services rendered by the Registrant’s principal accountant (the “Auditor”) for the audit of the Registrant’s annual financial statements, or services that are normally provided by the Auditor in connection with the statutory and regulatory filings or engagements for the Reporting Periods, were $0 in July 31, 2018 and $20,000 in July 31, 2019.
b)Audit-Related Fees. The aggregate fees billed in the Reporting Period for assurance and related services by the Auditor that are reasonably related to the performance of the Registrant’s financial statements were $0 in July 31, 2018 and $0 in July 31, 2019.
(c)Tax Fees. The aggregate fees billed in the Reporting Periods for professional services rendered by the Auditor for tax compliance, tax advice and tax planning (“Tax Services”) were $0 in July 31, 2018 and $0 in July 31, 2019. These services consisted of (i) review or preparation of U.S. federal, state, local and excise tax returns; (ii) U.S. federal, state and local tax planning, advice and assistance regarding statutory, regulatory or administrative developments, and (iii) tax advice regarding tax qualification matters and/or treatment of various financial instruments held or proposed to be acquired or held.
There were no fees billed for tax services by the Auditors to service affiliates during the Reporting Periods that requiredpre-approval by the Audit Committee.
d)All Other Fees.
The aggregate fees billed in the Reporting Periods for products and services provided by the Auditor, other than the services reported in paragraphs (a) through (c) for the Item 4 for the Legg Mason ETF Investment Trust, were $0 in July 31, 2018 and $0 in July 31, 2019.
All Other Fees. There were no othernon-audit services rendered by the Auditor to Legg Mason Partners Fund Advisors, LLC (“LMPFA”), and any entity controlling, controlled by or under common control with LMPFA that provided ongoing services to Legg Mason ETF Investment Trust requiringpre-approval by the Audit Committee in the Reporting Period.
(e) Audit Committee’s pre–approval policies and procedures described in paragraph (c) (7) of Rule2-01 of RegulationS-X.
(1) The Charter for the Audit Committee (the “Committee”) of the Board of each registered investment company (the “Fund”) advised by LMPFA or one of their affiliates (each, an “Adviser”) requires that the Committee shall approve (a) all audit and permissiblenon-audit services to be provided to the Fund and (b) all permissiblenon-audit services to be provided by the Fund’s independent auditors to the Adviser and any Covered Service Providers if the engagement relates directly to the operations and financial reporting of the Fund. The Committee may implement policies and procedures by which such services are approved other than by the full Committee.
The Committee shall not approvenon-audit services that the Committee believes may impair the independence of the auditors. As of the date of the approval of this Audit Committee Charter, permissiblenon-audit services include any professional services (including tax services), that are not prohibited services as described below, provided to the Fund by the independent auditors, other than those provided to the Fund in connection with an audit or a review of the financial statements of the Fund. Permissiblenon-audit services may not include: (i) bookkeeping or other services related to the accounting records or financial statements of the Fund; (ii) financial information systems design and implementation; (iii) appraisal or valuation services, fairness opinions orcontribution-in-kind reports; (iv) actuarial services; (v) internal audit outsourcing services; (vi) management functions or human resources; (vii) broker or dealer, investment adviser or investment banking services; (viii) legal services and expert services unrelated to the audit; and (ix) any other service the Public Company Accounting Oversight Board determines, by regulation, is impermissible.
Pre-approval by the Committee of any permissiblenon-audit services is not required so long as: (i) the aggregate amount of all such permissiblenon-audit services provided to the Fund, the Adviser and any service providers controlling, controlled by or under common control with the Adviser that provide ongoing services to the Fund (“Covered Service Providers”) constitutes not more than 5% of the total amount of revenues paid to the independent auditors during the fiscal year in which the permissiblenon-audit services are provided to (a) the Fund, (b) the Adviser and (c) any entity controlling, controlled by or under common control with the Adviser that provides ongoing services to the Fund during the fiscal year in which the services are provided that would have to be approved by the Committee; (ii) the permissiblenon-audit services were not recognized by the Fund at the time of the engagement to benon-audit services; and (iii) such services are promptly brought to the attention of the Committee and approved by the Committee (or its delegate(s)) prior to the completion of the audit.
(2) For the Legg Mason ETF Investment Trust, the percentage of fees that were approved by the audit committee, with respect to: Audit-Related Fees were 100% and 100% for July 31, 2018 and July 31, 2019; Tax Fees were 100% and 100% for July 31, 2018 and July 31, 2019; and Other Fees were 100% and 100% for July 31, 2018 and July 31, 2019.
(f) N/A
(g)Non-audit fees billed by the Auditor for services rendered to Legg Mason ETF Investment Trust, LMPFA and any entity controlling, controlled by, or under common control with LMPFA that provides ongoing services to Legg Mason ETF Investment Trust during the reporting period were $472,645 in July 31, 2018 and $463,523 in July 31, 2019.
(h) Yes. Legg Mason ETF Investment Trust’s Audit Committee has considered whether the provision ofnon-audit services that were rendered to Service Affiliates, which were notpre-approved (not requiringpre-approval), is compatible with maintaining the Accountant’s independence. All services provided by the Auditor to the Legg Mason ETF Investment Trust or to Service Affiliates, which were required to bepre-approved, werepre-approved as required.
| ITEM 5. | AUDIT COMMITTEE OF LISTED REGISTRANTS. |
a)The independent board members are acting as the registrant’s audit committee as specified in Section 3(a)(58)(B) of the Exchange Act. The Audit Committee consists of the following Board members:
Paul R. Ades
Andrew L. Breech
Dwight B. Crane
Althea L. Duersten
Frank G. Hubbard
Howard J. Johnson
Jerome H. Miller
Ken Miller
Thomas F. Schlafly
b) Not applicable.
| ITEM 6. | SCHEDULE OF INVESTMENTS. |
Included herein under Item 1.
| ITEM 7. | DISCLOSURE OF PROXY VOTING POLICIES AND PROCEDURES FORCLOSED-END MANAGEMENT INVESTMENT COMPANIES. |
Not applicable.
| ITEM 8. | PORTFOLIO MANAGERS OFCLOSED-END MANAGEMENT INVESTMENT COMPANIES. |
Not applicable.
| ITEM 9. | PURCHASES OF EQUITY SECURITIES BYCLOSED-END MANAGEMENT INVESTMENT COMPANY AND AFFILIATED PURCHASERS. |
Not applicable.
| ITEM 10. | SUBMISSION OF MATTERS TO A VOTE OF SECURITY HOLDERS. |
Not applicable.
| ITEM 11. | CONTROLS AND PROCEDURES. |
(a) The registrant’s principal executive officer and principal financial officer have concluded that the registrant’s disclosure controls and procedures (as defined in Rule30a- 3(c) under the Investment Company Act of 1940, as amended (the “1940 Act”)) are effective as of a date within 90 days of the filing date of this report that includes the disclosure required by this paragraph, based on their evaluation of the disclosure controls and procedures required by Rule30a-3(b) under the 1940 Act and15d-15(b) under the Securities Exchange Act of 1934.
(b) There were no changes in the registrant’s internal control over financial reporting (as defined in Rule30a-3(d) under the 1940 Act) that occurred during the second fiscal quarter of the period covered by this report that have materially affected, or are likely to materially affect the registrant’s internal control over financial reporting.
| ITEM 12. | DISCLOSURE OF SECURITIES LENDING ACTIVITIES FORCLOSED-END MANAGEMENT INVESTMENT COMPANIES. |
Not applicable.
(a) (1) Code of Ethics attached hereto.
Exhibit 99.CODE ETH
(a) (2) Certifications pursuant to section 302 of the Sarbanes-Oxley Act of 2002 attached hereto.
Exhibit 99.CERT
(b) Certifications pursuant to Section 906 of the Sarbanes-Oxley Act of 2002 attached hereto.
Exhibit 99.906CERT
SIGNATURES
Pursuant to the requirements of the Securities Exchange Act of 1934 and the Investment Company Act of 1940, the registrant has duly caused this Report to be signed on its behalf by the undersigned, there unto duly authorized.
| | |
| Legg Mason ETF Investment Trust |
| |
| By: | | /s/Jane Trust |
| | Jane Trust |
| | Chief Executive Officer |
| |
| Date: | | September 23, 2019 |
Pursuant to the requirements of the Securities Exchange Act of 1934 and the Investment Company Act of 1940, this report has been signed below by the following persons on behalf of the registrant and in the capacities and on the dates indicated.
| | |
| By: | | /s/Jane Trust |
| | Jane Trust |
| | Chief Executive Officer |
| |
| Date: | | September 23, 2019 |
| | |
| By: | | /s/Richard F. Sennett |
| | Richard F. Sennett |
| | Principal Financial Officer |
| |
| Date: | | September 23, 2019 |