UNITED STATES
SECURITIES AND EXCHANGE COMMISSION
Washington, D.C. 20549
FORMN-CSR
CERTIFIED SHAREHOLDER REPORT OF REGISTERED
MANAGEMENT INVESTMENT COMPANIES
Investment Company Act file number811-23096
Legg Mason ETF Investment Trust
(Exact name of registrant as specified in charter)
620 Eighth Avenue, 49th Floor, New York, NY 10018
(Address of principal executive offices) (Zip code)
Robert I. Frenkel, Esq.
Legg Mason & Co., LLC
100 First Stamford Place
Stamford, CT 06902
(Name and address of agent for service)
Registrant’s telephone number, including area code:1-877-721-1926
Date of fiscal year end: October 31
Date of reporting period: April 30, 2019
| ITEM 1. | REPORT TO STOCKHOLDERS. | |
| TheSemi-Annual Report to Stockholders is filed herewith. | ||

| Semi-Annual Report | April 30, 2019 |
LEGG MASON
GLOBAL INFRASTRUCTURE ETF
INFR
Beginning in April 2021, as permitted by regulations adopted by the Securities and Exchange Commission, the Fund intends to no longer mail paper copies of the Fund’s shareholder reports like this one, unless you specifically request paper copies of the reports from your financial intermediary (such as a broker-dealer or bank). Instead, the reports will be made available on a website, and you will be notified by mail each time a report is posted and provided with a website link to access the report.
If you already elected to receive shareholder reports electronically(“e-delivery”), you will not be affected by this change and you need not take any action. If you have not already electede-delivery, you may elect to receive shareholder reports and other communications from the Fund electronically by contacting your financial intermediary.
You may elect to receive all future reports in paper free of charge by contacting your financial intermediary to request that you continue to receive paper copies of your shareholder reports. Your election to receive reports in paper will apply to all Legg Mason Funds held in your account with your financial intermediary.
| INVESTMENT PRODUCTS: NOT FDIC INSURED • NO BANK GUARANTEE • MAY LOSE VALUE |
Fund objective
The Fund seeks to track the investment results of an index composed of infrastructure-related equity securities from global markets constructed through the application of several fundamental factors.

Dear Shareholder,
We are pleased to provide the semi-annual report of Legg Mason Global Infrastructure ETF for thesix-month period ended April 30, 2019. Please read on for Fund performance information and a detailed look at prevailing economic and market conditions during the Fund’s reporting period.
As always, we remain committed to providing you with excellent service and a full spectrum of investment choices. We also remain committed to supplementing the support you receive from your financial advisor. One way we accomplish this is through our website, www.leggmason.com. Here you can gain immediate access to market and investment information, including:
| • | Fund net asset value and market price, |
| • | Market insights and commentaries from our portfolio managers, and |
| • | A host of educational resources. |
We look forward to helping you meet your financial goals.
Sincerely,

Jane Trust, CFA
President and Chief Executive Officer
May 31, 2019
| II | Legg Mason Global Infrastructure ETF |
Economic review
Economic activity in the U.S. was mixed during the six months ended April 30, 2019 (the “reporting period”). Looking back, the U.S. Department of Commerce reported that third quarter 2018 U.S. gross domestic product (“GDP”)i growth was 3.4%. Fourth quarter 2018 GDP growth then moderated to 2.2%. Finally, the U.S. Department of Commerce’s second reading for first quarter 2019 GDP growth, released after the reporting period ended, was 3.1%. The acceleration in GDP growth during the first quarter of 2019 was attributed to an upturn in state and local government spending, increases in private inventory investment and exports, and a smaller decrease in residential investment. These movements were partly offset by decelerations in personal consumption expenditures and nonresidential fixed investment, along with a downturn in federal government spending. Imports also turned down.
Job growth in the U.S. was solid overall and was a tailwind for the economy during the reporting period. As reported by the U.S. Department of Labor, when the reporting period ended on April 30, 2019, the unemployment rate was 3.6%, versus 3.7% when the period began. April 2019’s reading was the lowest reading since December 1969. However, the percentage of longer-term unemployed moved higher during the reporting period. In April 2019, 21.1% of Americans looking for a job had been out of work for more than six months, versus 20.8% when the period began.
Turning to the global economy, in its April 2019World Economic Outlook Update, the International Monetary Fund (“IMF”)ii said, “After strong growth in 2017 and early 2018, global economic activity slowed notably in the second half of last year, reflecting a confluence of factors affecting major economies. China’s growth declined following a combination of needed regulatory tightening to rein in shadow banking and an increase in trade tensions with the United States. The euro area economy lost more momentum than expected as consumer and business confidence weakened and car production in Germany was disrupted by the introduction of new emission standards; investment dropped in Italy as sovereign spreads widened; and external demand, especially from emerging Asia, softened. Elsewhere, natural disasters hurt activity in Japan. Trade tensions increasingly took a toll on business confidence and, so, financial market sentiment worsened, with financial conditions tightening for vulnerable emerging markets in the spring of 2018 and then in advanced economies later in the year, weighing on global demand. Conditions have eased in 2019 as the US Federal Reserve signaled a more accommodative monetary policy stance and markets became more optimistic about a US — China trade deal, but they remain slightly more restrictive than in the fall [of 2018].” From a regional perspective, the IMF projects 2019 growth in the Eurozone will be 1.3%, versus 1.8% in 2018. Japan’s economy is expected to expand 1.0% in 2019, compared to 0.8% in 2018. Elsewhere, the IMF projects that overall growth in emerging market countries will decelerate to 4.4% in 2019, versus 4.5% in 2018.
| Legg Mason Global Infrastructure ETF | III |
Investment commentary (cont’d)
Market review
Q. What actions did international central banks take during the reporting period?
A. Central banks outside the U.S. generally pursued accommodative monetary policies during the reporting period. Looking back, in December 2018, the European Central Bank (“ECB”)iii ended its bond buying program and said that it did not anticipate raising interest rates “at least through the summer of 2019”. However, in March 2019, the ECB said it didn’t expect to raise rates “at least through the end of 2019.” In other developed countries, the Bank of Englandiv kept rates on hold at 0.75% throughout the reporting period. After holding rates steady at 0.10% for more than five years, in January 2016, the Bank of Japanv announced that it cut the rate on current accounts that commercial banks hold with it to-0.10% and kept rates on hold during the reporting period. Elsewhere, the People’s Bank of Chinavi kept rates steady at 4.35% during the reporting period.
Q. How did the international stock market perform during the reporting period?
A.International equities experienced periods of volatility but produced positive results during the reporting period. Developed market equities, as measured by the MSCI EAFE Indexvii, fell sharply during the first two months of the period. This occurred as global growth moderated, there were several geopolitical issues and the U.S. dollar generally rallied. However, developed market equities then moved higher over the last four months of the period. Supporting international equities were indications from several central banks that they would pursue accommodative monetary policies, there were hopes for a resolution to numerous trade conflicts and investors risk appetite increased. All told, the MSCI EAFE Index returned 7.45% for the six months ended April 30, 2019. Meanwhile, emerging market equities, as represented by the MSCI Emerging Markets Indexviii gained 13.76% over the reporting period.
Performance review
For the six months ended April 30, 2019, Legg Mason Global Infrastructure ETF generated a 14.23% return on a net asset value (“NAV”)ix basis and 14.44% based on its market pricex per share.
The performance table shows the Fund’s total return for the six months ended April 30, 2019 based on its NAV and market price as of April 30, 2019. The Fund seeks to track the investment results of an index composed of infrastructure-related equity securities from global markets, the RARE Global Infrastructure Indexxi, which returned 14.37% for the same period. The Fund’s broad-based market index, the S&P Global Infrastructure Index (NTR)xii, returned 13.52% over the same time frame. The Lipper Global Infrastructure Funds Category Averagexiii returned 12.60% for the period. Please note that Lipper performance returns are based on each fund’s NAV.
| Performance Snapshotas of April 30, 2019 (unaudited) | ||||
| 6 months | ||||
| Legg Mason Global Infrastructure ETF: | ||||
$29.78 (NAV) | 14.23 | %*† | ||
$29.64 (Market Price) | 14.44 | %*‡ | ||
| RARE Global Infrastructure Index | 14.37 | % | ||
| S&P Global Infrastructure Index (NTR) | 13.52 | % | ||
| Lipper Global Infrastructure Funds Category Average | 12.60 | % | ||
The performance shown represents past performance. Past performance is no
| IV | Legg Mason Global Infrastructure ETF |
guarantee of future results and current performance may be higher or lower than the performance shown. Principal value and investment returns will fluctuate so shares, when sold, may be worth more or less than their original cost. Performance data current to the most recentmonth-end is available at www.leggmason.com/etf.
Investors buy and sell shares of an exchange-traded fund (“ETF”) at market price (not NAV) in the secondary market throughout the trading day. These shares are not individually available for direct purchase from or direct redemption to the ETF. Market price returns shown are typically based upon themid-point between the bid and ask on the Fund’s principal trading market when the Fund’s NAV is determined, which is typically 4:00 p.m. Eastern time (US). These returns do not represent investors’ returns had they traded shares at other times. Performance figures for periods shorter than one year represent cumulative figures and are not annualized.
Information showing the number of days the market price of the Fund’s shares was greater than the Fund’s NAV and the number of days it was less than the Fund’s NAV (i.e., premium or discount) for various time periods is available by visiting the Fund’s website at www.leggmason.com/etf.
As of the Fund’s current prospectus dated March 1, 2019, the gross total annual fund operating expense ratio for the Fund was 0.45%.
The management agreement between Legg Mason ETF Investment Trust (the “Trust”) and Legg Mason Partners Fund Advisor, LLC (“LMPFA” or the “manager”) (the “Management Agreement”) provides that LMPFA will pay all operating expenses of the Fund, except interest expenses, taxes, brokerage expenses, future Rule12b-1 fees (if any), acquired fund fees and expenses, extraordinary expenses and the management fee payable to LMPFA under the Management Agreement. LMPFA will also pay all subadvisory fees of the Fund. The manager has agreed to waive and/or reimburse management fees so that the ratio of total annual fund operating expenses will not exceed 0.40% (subject to the same exclusions as the management agreement). This arrangement cannot be terminated prior to March 1, 2020 without the Board of Trustees’ consent.
* Total returns are based on changes in NAV or market price, respectively. Returns reflect the deduction of all Fund expenses. Returns do not reflect the deduction of brokerage commissions or taxes that investors pay on distributions or the sale of shares.
† Total return assumes the reinvestment of all distributions, including returns of capital, if any, at NAV.
‡ Total return assumes the reinvestment of all distributions, including returns of capital, if any, at market price.
Looking for additional information?
The Fund’s daily NAV is availableon-line at www.leggmason.com/etf. The Fund is traded under the symbol “INFR” and its closing market price is available on most financial websites. In a continuing effort to provide information concerning the Fund, shareholders may call1-877-721-1926 (toll free), Monday through Friday from 8:00 a.m. to 5:30 p.m. Eastern time, for the Fund’s current NAV, market price and other information.
As always, thank you for your confidence in our stewardship of your assets.
| Legg Mason Global Infrastructure ETF | V |
Investment commentary (cont’d)
Sincerely,
Jane Trust, CFA
President and Chief Executive Officer
May 31, 2019
RISKS:Equity securities are subject to market and price fluctuations. Companies in the infrastructure industry may be subject to a variety of factors that could adversely affect their business or operations, including high interest costs in connection with capital construction programs, high degrees of leverage, costs associated with governmental, environmental and other regulations, the effects of economic slowdowns, increased competition from other providers of services, uncertainties concerning costs, the level of government spending on infrastructure projects, and other factors. International investments are subject to special risks including currency fluctuations, social, economic and political uncertainties, which could increase volatility. These risks are magnified in emerging markets. In rising markets, the value oflarge-cap stocks may not rise as much assmaller-cap stocks. Small- andmid-cap stocks involve greater risks and volatility thanlarge-cap stocks. The Fund may focus its investments in certain industries, increasing its vulnerability to market volatility. There is no guarantee that the Fund will achieve a high degree of correlation to the index it seeks to track. The Fund does not seek to outperform the index it tracks, and does not seek temporary defensive positions when markets decline or appear overvalued. Derivatives, such as options and futures, can be illiquid, may disproportionately increase losses and have a potentially large impact on Fund performance. Please see the Fund’s prospectus for a more complete discussion of these and other risks and the Fund’s investment strategies.
All investments are subject to risk including the possible loss of principal. Past performance is no guarantee of future results. An index is a statistical composite that tracks a specified financial market, sector or rules-based investment process. Unlike a fund, an index does not actually hold a portfolio of securities and therefore does not incur the expenses incurred by a fund. These expenses negatively impact fund performance. All index performance reflects no deduction for fees, expenses or taxes. Please note that an investor cannot invest directly in an index.
The information provided is not intended to be a forecast of future events, a guarantee of future results or investment advice. Views expressed may differ from those of the firm as a whole. Forecasts and predictions are inherently limited and should not be relied upon as an indication of actual or future performance.
| VI | Legg Mason Global Infrastructure ETF |
| i | Gross domestic product (“GDP”) is the market value of all final goods and services produced within a country in a given period of time. |
| ii | The International Monetary Fund (“IMF”) is an organization of 189 countries, working to foster global monetary cooperation, secure financial stability, facilitate international trade, promote high employment and sustainable economic growth, and reduce poverty around the world. |
| iii | The European Central Bank (“ECB”) is responsible for the monetary system of the European Union and the euro currency. |
| iv | The Bank of England (“BoE”), formally the Governor and Company of the BoE, is the central bank of the United Kingdom. The BoE’s purpose is to maintain monetary and financial stability. |
| v | The Bank of Japan is the central bank of Japan. The bank is responsible for issuing and handling currency and treasury securities, implementing monetary policy, maintaining the stability of the Japanese financial system and the yen currency. |
| vi | The People’s Bank of China is the central bank of the People’s Republic of China with the power to carry out monetary policy and regulate financial institutions in mainland China. |
| vii | The MSCI EAFE Index is a free float-adjusted market capitalization index designed to measure developed market equity performance, excluding the U.S. and Canada. |
| viii | The MSCI Emerging Markets Index is a free float-adjusted market capitalization index that is designed to measure equity market performance in the global emerging markets. |
| ix | Net Asset Value (NAV) is calculated by subtracting total liabilities from total assets and dividing the results by the number of shares outstanding. |
| x | Market Price is determined by supply and demand. It is the price at which an investor purchases or sells shares of the Fund. The Market Price may differ the Fund’s NAV. |
| xi | The RARE Global Infrastructure Index (the “Underlying Index”), is constructed from global infrastructure-related equity securities. The Underlying Index utilizes a proprietary methodology created and sponsored by RARE Infrastructure (North America) Pty Limited (“RARE”), the Fund’s subadviser. RARE is affiliated with both Legg Mason Partners Fund Advisor, LLC (“LMPFA”), the Fund’s investment manager, and the Fund. Securities that compose the Underlying Index include depositary receipts representing securities in the Underlying Index. The Underlying Index is composed of equity securities in developed and developing markets that are included in the MSCI ACWI All Cap Index. The Underlying Index’s securities are reconstituted quarterly and rebalanced quarterly. |
| xii | The S&P Global Infrastructure Index (NTR) is designed to track 75 companies from around the world chosen to represent the listed infrastructure industry while maintaining liquidity and tradability. |
| xiii | Lipper, Inc., a wholly-owned subsidiary of Reuters, provides independent insight on global collective investments. Returns are based on thesix-month period ended April 30, 2019, including the reinvestment of all distributions, including returns of capital, if any, calculated among the 102 funds in the Fund’s Lipper category |
| Legg Mason Global Infrastructure ETF | VII |
Investment breakdown(%) as a percent of total investments
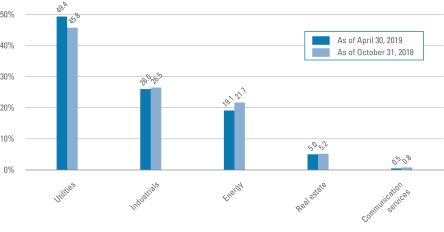
| † | The bar graph above represents the composition of the Fund’s investments as of April 30, 2019 and October 31, 2018. The composition of the Fund’s investments is subject to change at any time. |
| Legg Mason Global Infrastructure ETF 2019 Semi-Annual Report | 1 |
Example
As a shareholder of the Fund, you may incur two types of costs: (1) transaction costs, such as brokerage commissions paid on purchases and sales of Fund shares; and (2) ongoing costs, including management fees; and other Fund expenses. This example is intended to help you understand your ongoing costs (in dollars) of investing in the Fund and to compare these costs with the ongoing costs of investing in other funds.
This example is based on an investment of $1,000 invested on November 1, 2018 and held for the six months ended April 30, 2019.
Actual expenses
The table below titled “Based on Actual Total Return” provides information about actual account values and actual expenses. You may use the information provided in this table, together with the amount you invested, to estimate the expenses that you paid over the period. To estimate the expenses you paid on your account, divide your ending account value by $1,000 (for example, an $8,600 ending account value divided by $1,000 = 8.6), then multiply the result by the number under the heading entitled “Expenses Paid During the Period”.
Hypothetical example for comparison purposes
The table below titled “Based on Hypothetical Total Return” provides information about hypothetical account values and hypothetical expenses based on the actual expense ratio and an assumed rate of return of 5.00% per year before expenses, which is not the Fund’s actual return. The hypothetical account values and expenses may not be used to estimate the actual ending account balance or expenses you paid for the period. You may use the information provided in this table to compare the ongoing costs of investing in the Fund and other funds. To do so, compare the 5.00% hypothetical example relating to the Fund with the 5.00% hypothetical examples that appear in the shareholder reports of the other funds.
Please note that the expenses shown in the table below are meant to highlight your ongoing costs only and do not reflect any transactional costs, such as brokerage commissions paid on purchases and sales of Fund shares. Therefore, the table is useful in comparing ongoing costs only, and will not help you determine the relative total costs of owning different funds. In addition, if these transaction costs were included, your costs would have been higher.
| Based on actual total return1 | Based on hypothetical total return1 | ||||||||||||||||||||||||||||||||||||||||||||||||||
| Actual Total Return2 | Beginning Account Value | Ending Account Value | Annualized Expense Ratio | Expenses Paid During the Period3 | Hypothetical Annualized Total Return | Beginning Account Value | Ending Account Value | Annualized Expense Ratio | Expenses Paid During the Period3 | ||||||||||||||||||||||||||||||||||||||||||
| 14.23% | $ | 1,000.00 | $ | 1,142.30 | 0.40 | % | $ | 2.12 | 5.00 | % | $1,000.00 | $ | 1,022.81 | 0.40 | % | $ | 2.01 | ||||||||||||||||||||||||||||||||||
| 1 | For the six months ended April 30, 2019. |
| 2 | Assumes the reinvestment of all distributions, including return of capital, if any, at net asset value. Total return is not annualized, as it may not be representative of the total fund return for the year. Performance figures may reflect fee waivers and/or expense reimbursements. In the absence of fee waivers and/or expense reimbursements, the total return would have been lower. Past performance is no guarantee of future results. |
| 3 | Expenses (net of fee waivers and/or expense reimbursements) are equal to the Fund’s annualized expense ratio multiplied by the average account value over the period, multiplied by the number of days in the most recent fiscal half-year (181), then divided by 365. |
| 2 | Legg Mason Global Infrastructure ETF 2019 Semi-Annual Report |
Schedule of investments(unaudited)
April 30, 2019
Legg Mason Global Infrastructure ETF
| Security | Shares | Value | ||||||||||||||
| Common Stocks — 99.4% | ||||||||||||||||
| Communication Services — 0.5% | ||||||||||||||||
Media — 0.5% | ||||||||||||||||
Eutelsat Communications SA | 2,061 | $ | 37,164 | |||||||||||||
SES SA FDR | 4,179 | 71,047 | ||||||||||||||
Total Communication Services | 108,211 | |||||||||||||||
| Energy — 18.8% | ||||||||||||||||
Oil, Gas & Consumable Fuels — 18.8% | ||||||||||||||||
Enagas SA | 9,236 | 262,910 | ||||||||||||||
Enbridge Inc. | 29,197 | 1,074,160 | ||||||||||||||
Inter Pipeline Ltd. | 5,905 | 95,783 | ||||||||||||||
Kinder Morgan Inc. | 23,663 | 470,184 | ||||||||||||||
Koninklijke Vopak NV | 1,464 | 65,218 | ||||||||||||||
Kunlun Energy Co. Ltd. | 61,723 | 65,142 | ||||||||||||||
Pembina Pipeline Corp. | 9,206 | 327,808 | ||||||||||||||
Snam SpA | 60,457 | 307,401 | ||||||||||||||
TransCanada Corp. | 22,467 | 1,067,901 | ||||||||||||||
Williams Cos. Inc. | 6,613 | 187,346 | ||||||||||||||
Total Energy | 3,923,853 | |||||||||||||||
| Industrials — 25.9% | ||||||||||||||||
Road & Rail — 12.2% | ||||||||||||||||
Aurizon Holdings Ltd. | 64,030 | 214,521 | ||||||||||||||
Central Japan Railway Co. | 2,762 | 592,575 | ||||||||||||||
East Japan Railway Co. | 6,479 | 608,779 | ||||||||||||||
Genesee & Wyoming Inc., Class A Shares | 672 | 59,573 | * | |||||||||||||
Kansas City Southern | 1,218 | 149,985 | ||||||||||||||
Norfolk Southern Corp. | 3,255 | 664,085 | ||||||||||||||
West Japan Railway Co. | 3,528 | 261,713 | ||||||||||||||
Total Road & Rail | 2,551,231 | |||||||||||||||
Transportation Infrastructure — 13.7% | ||||||||||||||||
Aena SME SA | 2,445 | 453,078 | ||||||||||||||
Atlantia SpA | 10,127 | 276,016 | ||||||||||||||
Atlas Arteria Ltd. | 15,146 | 74,623 | ||||||||||||||
CCR SA | 12,350 | 36,953 | ||||||||||||||
China Merchants Port Holdings Co. Ltd. | 25,131 | 50,740 | ||||||||||||||
Enav SpA | 8,419 | 45,893 | ||||||||||||||
Flughafen Zurich AG | 628 | 103,413 | ||||||||||||||
Fraport AG Frankfurt Airport Services Worldwide | 1,230 | 101,785 | ||||||||||||||
Grupo Aeroportuario del Pacifico SAB de CV, Class B Shares | 7,053 | 71,224 | ||||||||||||||
See Notes to Financial Statements.
| Legg Mason Global Infrastructure ETF 2019 Semi-Annual Report | 3 |
Schedule of investments(unaudited) (cont’d)
April 30, 2019
Legg Mason Global Infrastructure ETF
| Security | Shares | Value | ||||||||||||||
Transportation Infrastructure — continued | ||||||||||||||||
International Container Terminal Services Inc. | 16,564 | $ | 40,208 | |||||||||||||
Jiangsu Expressway Co. Ltd., Class H Shares | 27,096 | 38,544 | ||||||||||||||
Promotora y Operadora de Infraestructura SAB de CV | 4,358 | 44,080 | ||||||||||||||
Sydney Airport | 74,939 | 401,923 | ||||||||||||||
Taiwan High Speed Rail Corp. | 38,045 | 46,293 | ||||||||||||||
Transurban Group | 112,810 | 1,067,154 | ||||||||||||||
Total Transportation Infrastructure | 2,851,927 | |||||||||||||||
Total Industrials | 5,403,158 | |||||||||||||||
| Real Estate — 5.0% | ||||||||||||||||
Equity Real Estate Investment Trusts (REITs) — 5.0% | ||||||||||||||||
Crown Castle International Corp. | 8,264 | 1,039,446 | ||||||||||||||
| Utilities — 49.2% | ||||||||||||||||
Electric Utilities — 31.9% | ||||||||||||||||
ALLETE Inc. | 471 | 38,363 | ||||||||||||||
American Electric Power Co. Inc. | 4,076 | 348,702 | ||||||||||||||
AusNet Services | 29,993 | 37,471 | ||||||||||||||
CEZ AS | 1,544 | 35,859 | ||||||||||||||
Chubu Electric Power Co. Inc. | 4,021 | 58,343 | ||||||||||||||
CK Infrastructure Holdings Ltd. | 10,148 | 82,396 | ||||||||||||||
CLP Holdings Ltd. | 30,532 | 346,167 | ||||||||||||||
Contact Energy Ltd. | 10,759 | 48,145 | ||||||||||||||
Duke Energy Corp. | 6,674 | 608,135 | ||||||||||||||
Edison International | 1,495 | 95,336 | ||||||||||||||
EDP — Energias de Portugal SA | 28,642 | 108,463 | ||||||||||||||
Emera Inc. | 1,947 | 72,817 | ||||||||||||||
Endesa SA | 3,571 | 88,885 | ||||||||||||||
Enel Americas SA | 223,453 | 39,073 | ||||||||||||||
Enel Chile SA | 342,175 | 34,360 | ||||||||||||||
Enel SpA | 97,366 | 615,317 | ||||||||||||||
Entergy Corp. | 1,743 | 168,897 | ||||||||||||||
Evergy Inc. | 2,309 | 133,506 | ||||||||||||||
Exelon Corp. | 7,951 | 405,104 | ||||||||||||||
FirstEnergy Corp. | 3,640 | 152,989 | ||||||||||||||
Fortis Inc. | 3,928 | 144,599 | ||||||||||||||
HK Electric Investments & HK Electric Investments Ltd. | 37,855 | 37,057 | ||||||||||||||
Hydro One Ltd. | 2,589 | 41,726 | ||||||||||||||
Iberdrola SA | 79,853 | 724,701 | ||||||||||||||
IDACORP Inc. | 459 | 45,450 | ||||||||||||||
See Notes to Financial Statements.
| 4 | Legg Mason Global Infrastructure ETF 2019 Semi-Annual Report |
Legg Mason Global Infrastructure ETF
| Security | Shares | Value | ||||||||||||||
Electric Utilities — continued | ||||||||||||||||
Kansai Electric Power Co. Inc. | 2,218 | $ | 26,795 | |||||||||||||
Korea Electric Power Corp. | 2,623 | 63,546 | * | |||||||||||||
OGE Energy Corp. | 1,828 | 77,398 | ||||||||||||||
Pinnacle West Capital Corp. | 1,027 | 97,842 | ||||||||||||||
Portland General Electric Co. | 815 | 42,633 | ||||||||||||||
Power Assets Holdings Ltd. | 22,839 | 159,239 | ||||||||||||||
PPL Corp. | 6,617 | 206,517 | ||||||||||||||
Red Electrica Corp. SA | 7,196 | 149,073 | ||||||||||||||
Southern Co. | 9,487 | 504,898 | ||||||||||||||
Spark Infrastructure Group | 20,902 | 33,249 | ||||||||||||||
SSE PLC | 12,756 | 190,323 | ||||||||||||||
Tenaga Nasional Bhd | 52,380 | 155,575 | ||||||||||||||
Terna Rete Elettrica Nazionale SpA | 17,671 | 105,713 | ||||||||||||||
Tohoku Electric Power Co. Inc. | 4,191 | 47,865 | ||||||||||||||
Tokyo Electric Power Co. Holdings Inc. | 5,367 | 30,262 | * | |||||||||||||
Xcel Energy Inc. | 4,238 | 239,447 | ||||||||||||||
Total Electric Utilities | 6,642,236 | |||||||||||||||
Gas Utilities — 1.8% | ||||||||||||||||
APA Group | 9,814 | 66,451 | ||||||||||||||
Atmos Energy Corp. | 1,061 | 108,583 | ||||||||||||||
Naturgy Energy Group SA | 3,627 | 102,920 | ||||||||||||||
Spire Inc. | 452 | 38,054 | ||||||||||||||
Tokyo Gas Co. Ltd. | 2,397 | 60,842 | ||||||||||||||
Total Gas Utilities | 376,850 | |||||||||||||||
Independent Power and Renewable Electricity Producers — 0.6% |
| |||||||||||||||
AES Corp. | 3,029 | 51,856 | ||||||||||||||
CGN Power Co. Ltd., Class H Shares | 139,913 | 36,916 | ||||||||||||||
Meridian Energy Ltd. | 15,703 | 42,518 | ||||||||||||||
Total Independent Power and Renewable Electricity Producers |
| 131,290 | ||||||||||||||
Multi-Utilities — 13.8% | ||||||||||||||||
Algonquin Power & Utilities Corp. | 4,447 | 50,546 | ||||||||||||||
Ameren Corp. | 2,240 | 163,005 | ||||||||||||||
CenterPoint Energy Inc. | 4,131 | 128,061 | ||||||||||||||
Centrica PLC | 32,681 | 45,267 | ||||||||||||||
CMS Energy Corp. | 2,588 | 143,764 | ||||||||||||||
Dominion Energy Inc. | 7,307 | 568,996 | ||||||||||||||
DTE Energy Co. | 1,503 | 188,942 | ||||||||||||||
E.ON SE | 12,675 | 135,912 | ||||||||||||||
See Notes to Financial Statements.
| Legg Mason Global Infrastructure ETF 2019 Semi-Annual Report | 5 |
Schedule of investments(unaudited) (cont’d)
April 30, 2019
Legg Mason Global Infrastructure ETF
| Security | Shares | Value | ||||||||||||||
Multi-Utilities — continued | ||||||||||||||||
Engie SA | 21,788 | $ | 322,438 | |||||||||||||
Innogy SE | 1,124 | 52,138 | ||||||||||||||
National Grid PLC | 41,962 | 457,378 | ||||||||||||||
NorthWestern Corp. | 459 | 32,061 | ||||||||||||||
Public Service Enterprise Group Inc. | 3,703 | 220,884 | ||||||||||||||
RWE AG | 2,171 | 55,400 | ||||||||||||||
Veolia Environnement SA | 4,682 | 110,504 | ||||||||||||||
WEC Energy Group Inc. | 2,601 | 203,997 | ||||||||||||||
Total Multi-Utilities | 2,879,293 | |||||||||||||||
Water Utilities — 1.1% | ||||||||||||||||
Pennon Group PLC | 5,257 | 51,304 | ||||||||||||||
Severn Trent PLC | 2,940 | 78,034 | ||||||||||||||
United Utilities Group PLC | 8,339 | 90,100 | ||||||||||||||
Total Water Utilities | 219,438 | |||||||||||||||
Total Utilities | 10,249,107 | |||||||||||||||
Total Common Stocks (Cost — $20,198,775) | 20,723,775 | |||||||||||||||
| Preferred Stocks — 0.2% | ||||||||||||||||
| Energy — 0.2% | ||||||||||||||||
Oil, Gas & Consumable Fuels — 0.2% | ||||||||||||||||
Transneft PJSC (Cost — $43,419) | 15 | 39,023 | ||||||||||||||
Total Investments — 99.6% (Cost — $20,242,194) | 20,762,798 | |||||||||||||||
Other Assets in Excess of Liabilities — 0.4% | 86,437 | |||||||||||||||
Total Net Assets — 100.0% | $ | 20,849,235 | ||||||||||||||
| * | Non-income producing security. |
Abbreviations used in this schedule: | ||
| FDR | — Fiduciary Depositary Receipts | |
| PJSC | — Private Joint Stock Company | |
| Summary of Investments by Country(unaudited)** | ||||
| United States | 36.5 | % | ||
| Canada | 13.8 | |||
| Australia | 9.1 | |||
| Spain | 8.6 | |||
| Japan | 8.1 | |||
| Italy | 6.5 | |||
| United Kingdom | 4.4 | |||
| Hong Kong | 3.0 | |||
See Notes to Financial Statements.
| 6 | Legg Mason Global Infrastructure ETF 2019 Semi-Annual Report |
Legg Mason Global Infrastructure ETF
| Summary of Investments by Country(unaudited)**(cont’d) | ||||
| France | 2.3 | % | ||
| Germany | 1.7 | |||
| China | 0.9 | |||
| Malaysia | 0.8 | |||
| Mexico | 0.6 | |||
| Portugal | 0.5 | |||
| Switzerland | 0.5 | |||
| New Zealand | 0.4 | |||
| Chile | 0.4 | |||
| Luxembourg | 0.3 | |||
| Netherlands | 0.3 | |||
| South Korea | 0.3 | |||
| Taiwan | 0.2 | |||
| Philippines | 0.2 | |||
| Russia | 0.2 | |||
| Brazil | 0.2 | |||
| Czech Republic | 0.2 | |||
| 100.0 | % | |||
| ** | As a percentage of total investments. Please note that the Fund holdings are as of April 30, 2019 and are subject to change. |
See Notes to Financial Statements.
| Legg Mason Global Infrastructure ETF 2019 Semi-Annual Report | 7 |
Statement of assets and liabilities(unaudited)
April 30, 2019
| Assets: | ||||
Investments, at value (Cost — $20,242,194) | $ | 20,762,798 | ||
Cash | 46,040 | |||
Dividends and interest receivable | 47,222 | |||
Total Assets | 20,856,060 | |||
| Liabilities: | ||||
Investment management fee payable | 6,825 | |||
Total Liabilities | 6,825 | |||
| Total Net Assets | $ | 20,849,235 | ||
| Net Assets: | ||||
Par value (Note 5) | $ | 7 | ||
Paid-in capital in excess of par value | 20,211,501 | |||
Total distributable earnings (loss) | 637,727 | |||
| Total Net Assets | $ | 20,849,235 | ||
| Shares Outstanding | 700,000 | |||
| Net Asset Value | $29.78 | |||
See Notes to Financial Statements.
| 8 | Legg Mason Global Infrastructure ETF 2019 Semi-Annual Report |
Statement of operations(unaudited)
For the Six Months Ended April 30, 2019
| Investment Income: | ||||
Dividends | $ | 524,680 | ||
Interest | 21 | |||
Less: Foreign taxes withheld | (47,249) | |||
Total Investment Income | 477,452 | |||
| Expenses: | ||||
Investment management fee (Note 2) | 61,289 | |||
Interest expense | 341 | |||
Total Expenses | 61,630 | |||
Less: Fee waivers and/or expense reimbursements (Note 2) | (6,810) | |||
Net Expenses | 54,820 | |||
| Net Investment Income | 422,632 | |||
| Realized and Unrealized Gain (Loss) on Investments and Foreign Currency Transactions (Notes 1 and 3): | ||||
Net Realized Gain (Loss) From: | ||||
Investment transactions | 412,204 | |||
Foreign currency transactions | (4,301) | |||
Net Realized Gain | 407,903 | |||
Change in Net Unrealized Appreciation (Depreciation) From: | ||||
Investments | 2,941,982 | |||
Foreign currencies | (141) | |||
Change in Net Unrealized Appreciation (Depreciation) | 2,941,841 | |||
| Net Gain on Investments and Foreign Currency Transactions | 3,349,744 | |||
| Increase in Net Assets From Operations | $ | 3,772,376 | ||
See Notes to Financial Statements.
| Legg Mason Global Infrastructure ETF 2019 Semi-Annual Report | 9 |
Statements of changes in net assets
| For the Six Months Ended April 30, 2019 (unaudited) and the Year Ended October 31, 2018 | 2019 | 2018 | ||||||
| Operations: | ||||||||
Net investment income | $ | 422,632 | $ | 1,216,906 | ||||
Net realized gain | 407,903 | 555,347 | ||||||
Change in net unrealized appreciation (depreciation) | 2,941,841 | (3,393,809) | ||||||
Increase (Decrease) in Net Assets From Operations | 3,772,376 | (1,621,556) | ||||||
| Distributions to Shareholders From (Note 1): | ||||||||
Total distributable earnings(a) | (405,000) | (1,219,191) | ||||||
Decrease in Net Assets From Distributions to Shareholders | (405,000) | (1,219,191) | ||||||
| Fund Share Transactions (Note 5): | ||||||||
Net proceeds from sale of shares (0 and 200,000 shares issued, respectively) | — | 5,571,855 | ||||||
Cost of shares repurchased (400,000 and 300,000 shares repurchased, respectively) | (11,655,308) | (8,568,757) | ||||||
Decrease in Net Assets From Fund Share Transactions | (11,655,308) | (2,996,902) | ||||||
Decrease in Net Assets | (8,287,932) | (5,837,649) | ||||||
| Net Assets: | ||||||||
Beginning of period | 29,137,167 | 34,974,816 | ||||||
End of period(b) | $ | 20,849,235 | $ | 29,137,167 | ||||
| (a) | Distributions from net investment income and from realized gains are no longer required to be separately disclosed (Note 7). For the year ended October 31, 2018, distributions from net investment income were $1,219,191. |
| (b) | Parenthetical disclosure of undistributed net investment income is no longer required (Note 7). For the year ended October 31, 2018, end of year net assets included undistributed net investment income of $27,456. |
See Notes to Financial Statements.
| 10 | Legg Mason Global Infrastructure ETF 2019 Semi-Annual Report |
| For a share of beneficial interest outstanding throughout each year ended October 31, unless otherwise noted: | ||||||||||||
| 20191,2 | 20182 | 20172,3 | ||||||||||
| Net asset value, beginning of period | $26.49 | $29.15 | $25.18 | |||||||||
| Income (loss) from operations: | ||||||||||||
Net investment income | 0.43 | 1.01 | 0.64 | |||||||||
Net realized and unrealized gain (loss) | 3.30 | (2.64) | 3.88 | |||||||||
Total income (loss) from operations | 3.73 | (1.63) | 4.52 | |||||||||
| Less distributions from: | ||||||||||||
Net investment income | (0.44) | (1.03) | (0.55) | |||||||||
Total distributions | (0.44) | (1.03) | (0.55) | |||||||||
| Net asset value, end of period | $29.78 | $26.49 | $29.15 | |||||||||
Total return, based on NAV4 | 14.23 | % | (5.76) | % | 18.04 | % | ||||||
| Net assets, end of period (000s) | $20,849 | $29,137 | $34,975 | |||||||||
| Ratios to average net assets: | ||||||||||||
Gross expenses | 0.45 | %5 | 0.49 | % | 0.53 | %5 | ||||||
Net expenses6 | 0.40 | 5,7 | 0.47 | 7 | 0.53 | 5 | ||||||
Net investment income | 3.10 | 5 | 3.57 | 2.67 | 5 | |||||||
| Portfolio turnover rate8 | 14 | % | 45 | % | 43 | % | ||||||
| 1 | For the six months ended April 30, 2019 (unaudited). |
| 2 | Per share amounts have been calculated using the average shares method. |
| 3 | For the period December 29, 2016 (inception date) to October 31, 2017. |
| 4 | Performance figures may reflect fee waivers and/or expense reimbursements. In the absence of fee waivers and/or expense reimbursements, the total return would have been lower. The total return calculation assumes that distributions are reinvested at NAV. Past performance is no guarantee of future results. Total returns for periods of less than one year are not annualized. |
| 5 | Annualized. |
| 6 | As a result of an expense limitation, effective May 4, 2018, the ratio of total annual fund operating expenses, other than interest expenses, taxes, brokerage expenses, future12b-1 fees (if any), acquired fund fees and expenses, extraordinary expenses and the management fee payable to LMPFA under the investment management agreement, to average net assets did not exceed 0.40%. This expense limitation cannot be terminated prior to March 1, 2020 without the Board of Trustees’ consent. |
| 7 | Reflects fee waivers and/or expense reimbursements. |
| 8 | Portfolio turnover excludes the value of portfolio securities received or delivered as a result ofin-kind fund share transactions. |
See Notes to Financial Statements.
| Legg Mason Global Infrastructure ETF 2019 Semi-Annual Report | 11 |
Notes to financial statements(unaudited)
1. Organization and significant accounting policies
Legg Mason Global Infrastructure ETF (the “Fund”) is a separate diversified investment series of Legg Mason ETF Investment Trust (the “Trust”). The Trust, a Maryland statutory trust, is registered under the Investment Company Act of 1940, as amended (the “1940 Act”), as anopen-end management investment company.
The Fund is an exchange-traded fund (“ETF”). ETFs are funds that trade like other publicly-traded securities. The Fund is designed to track an index. Similar to shares of an index mutual fund, each share of the Fund represents an ownership interest in an underlying portfolio of securities intended to track an index. Unlike shares of a mutual fund, which can be bought from and redeemed by the issuing fund by all shareholders at a price based on net asset value (“NAV”), shares of the Fund may be directly purchased from and redeemed by the Fund at NAV solely by certain large institutional investors who have entered into agreements with the Fund’s distributor (“Authorized Participants”). Also unlike shares of a mutual fund, shares of the Fund are listed on a national securities exchange and trade in the secondary market at market prices that change throughout the day.
Shares of the Fund are listed and traded at market prices on NASDAQ. The market price for the Fund’s shares may be different from the Fund’s NAV. The Fund issues and redeems shares at NAV only in blocks of a specified number of shares or multiples thereof (“Creation Units”). Only Authorized Participants may purchase or redeem Creation Units directly with the Fund at NAV. Creation Units are issued and redeemed generallyin-kind for a basket of securities and/or cash. Except when aggregated in Creation Units, shares of the Fund are not redeemable securities. Shareholders who are not Authorized Participants may not redeem shares directly from the Fund at NAV.
The Fund seeks to track the investment results of the RARE Global Infrastructure Index (the “Underlying Index”). The Underlying Index is constructed from global infrastructure-related equity securities and utilizes a proprietary methodology created and sponsored by RARE Infrastructure (North America) Pty Limited (“RARE”), the Fund’s subadviser.
The following are significant accounting policies consistently followed by the Fund and are in conformity with U.S. generally accepted accounting principles (“GAAP”). Estimates and assumptions are required to be made regarding assets, liabilities and changes in net assets resulting from operations when financial statements are prepared. Changes in the economic environment, financial markets and any other parameters used in determining these estimates could cause actual results to differ. Subsequent events have been evaluated through the date the financial statements were issued.
(a) Investment valuation. Equity securities for which market quotations are available are valued at the last reported sales price or official closing price on the primary market or exchange on which they trade. The valuations for fixed income securities (which may include, but are not limited to, corporate, government, municipal, mortgage-backed, collateralized mortgage obligations and asset-backed securities) and certain derivative instruments are typically the prices supplied by independent third party pricing services,
| 12 | Legg Mason Global Infrastructure ETF 2019 Semi-Annual Report |
which may use market prices or broker/dealer quotations or a variety of valuation techniques and methodologies. The independent third party pricing services use inputs that are observable such as issuer details, interest rates, yield curves, prepayment speeds, credit risks/spreads, default rates and quoted prices for similar securities. Investments inopen-end funds are valued at the closing net asset value per share of each fund on the day of valuation. When the Fund holds securities or other assets that are denominated in a foreign currency, the Fund will use the currency exchange rates, generally determined as of 4:00 p.m. (London Time). If independent third party pricing services are unable to supply prices for a portfolio investment, or if the prices supplied are deemed by the manager to be unreliable, the market price may be determined by the manager using quotations from one or more broker/ dealers or at the transaction price if the security has recently been purchased and no value has yet been obtained from a pricing service or pricing broker. When reliable prices are not readily available, such as when the value of a security has been significantly affected by events after the close of the exchange or market on which the security is principally traded, but before the Fund calculates its net asset value, the Fund values these securities as determined in accordance with procedures approved by the Fund’s Board of Trustees.
The Board of Trustees is responsible for the valuation process and has delegated the supervision of the daily valuation process to the Legg Mason North Atlantic Fund Valuation Committee (the “Valuation Committee”). The Valuation Committee, pursuant to the policies adopted by the Board of Trustees, is responsible for making fair value determinations, evaluating the effectiveness of the Fund’s pricing policies, and reporting to the Board of Trustees. When determining the reliability of third party pricing information for investments owned by the Fund, the Valuation Committee, among other things, conducts due diligence reviews of pricing vendors, monitors the daily change in prices and reviews transactions among market participants.
The Valuation Committee will consider pricing methodologies it deems relevant and appropriate when making fair value determinations. Examples of possible methodologies include, but are not limited to, multiple of earnings; discount from market of a similar freely traded security; discounted cash-flow analysis; book value or a multiple thereof; risk premium/yield analysis; yield to maturity; and/or fundamental investment analysis. The Valuation Committee will also consider factors it deems relevant and appropriate in light of the facts and circumstances. Examples of possible factors include, but are not limited to, the type of security; the issuer’s financial statements; the purchase price of the security; the discount from market value of unrestricted securities of the same class at the time of purchase; analysts’ research and observations from financial institutions; information regarding any transactions or offers with respect to the security; the existence of merger proposals or tender offers affecting the security; the price and extent of public trading in similar securities of the issuer or comparable companies; and the existence of a shelf registration for restricted securities.
| Legg Mason Global Infrastructure ETF 2019 Semi-Annual Report | 13 |
Notes to financial statements(unaudited) (cont’d)
For each portfolio security that has been fair valued pursuant to the policies adopted by the Board of Trustees, the fair value price is compared against the last available and next available market quotations. The Valuation Committee reviews the results of such back testing monthly and fair valuation occurrences are reported to the Board of Trustees quarterly.
The Fund uses valuation techniques to measure fair value that are consistent with the market approach and/or income approach, depending on the type of security and the particular circumstance. The market approach uses prices and other relevant information generated by market transactions involving identical or comparable securities. The income approach uses valuation techniques to discount estimated future cash flows to present value.
GAAP establishes a disclosure hierarchy that categorizes the inputs to valuation techniques used to value assets and liabilities at measurement date. These inputs are summarized in the three broad levels listed below:
| • | Level 1 — quoted prices in active markets for identical investments |
| • | Level 2 — other significant observable inputs (including quoted prices for similar investments, interest rates, prepayment speeds, credit risk, etc.) |
| • | Level 3 — significant unobservable inputs (including the Fund’s own assumptions in determining the fair value of investments) |
The inputs or methodologies used to value securities are not necessarily an indication of the risk associated with investing in those securities.
The following is a summary of the inputs used in valuing the Fund’s assets carried at fair value:
| ASSETS | ||||||||||||||||
| Description | Quoted Prices (Level 1) | Other Significant Observable Inputs (Level 2) | Significant Unobservable Inputs (Level 3) | Total | ||||||||||||
| Long-term investments†: | ||||||||||||||||
Common stocks | $ | 20,735,775 | — | — | $ | 20,723,775 | ||||||||||
Preferred stocks | 39,023 | — | — | 39,023 | ||||||||||||
| Total investments | $ | 20,762,798 | — | — | $ | 20,762,798 | ||||||||||
| † | See Schedule of Investments for additional detailed categorizations. |
(b) Foreign currency translation. Investment securities and other assets and liabilities denominated in foreign currencies are translated into U.S. dollar amounts based upon prevailing exchange rates on the date of valuation. Purchases and sales of investment securities and income and expense items denominated in foreign currencies are translated into U.S. dollar amounts based upon prevailing exchange rates on the respective dates of such transactions.
| 14 | Legg Mason Global Infrastructure ETF 2019 Semi-Annual Report |
The Fund does not isolate that portion of the results of operations resulting from fluctuations in foreign exchange rates on investments from the fluctuations arising from changes in market prices of securities held. Such fluctuations are included with the net realized and unrealized gain or loss on investments.
Net realized foreign exchange gains or losses arise from sales of foreign currencies, including gains and losses on forward foreign currency contracts, currency gains or losses realized between the trade and settlement dates on securities transactions, and the difference between the amounts of dividends, interest, and foreign withholding taxes recorded on the Fund’s books and the U.S. dollar equivalent of the amounts actually received or paid. Net unrealized foreign exchange gains and losses arise from changes in the values of assets and liabilities, other than investments in securities, on the date of valuation, resulting from changes in exchange rates.
Foreign security and currency transactions may involve certain considerations and risks not typically associated with those of U.S. dollar denominated transactions as a result of, among other factors, the possibility of lower levels of governmental supervision and regulation of foreign securities markets and the possibility of political or economic instability.
(c) Foreign investment risks. The Fund’s investments in foreign securities may involve risks not present in domestic investments. Since securities may be denominated in foreign currencies, may require settlement in foreign currencies or pay interest or dividends in foreign currencies, changes in the relationship of these foreign currencies to the U.S. dollar can significantly affect the value of the investments and earnings of the Fund. Foreign investments may also subject the Fund to foreign government exchange restrictions, expropriation, taxation or other political, social or economic developments, all of which affect the market and/or credit risk of the investments.
(d) Security transactions and investment income. Security transactions are accounted for on a trade date basis. Interest income (including interest income frompayment-in-kind securities), adjusted for amortization of premium and accretion of discount, is recorded on the accrual basis. Dividend income is recorded on theex-dividend date for dividends received in cash and/or securities. Foreign dividend income is recorded on theex-dividend date or as soon as practicable after the Fund determines the existence of a dividend declaration after exercising reasonable due diligence. The cost of investments sold is determined by use of the specific identification method. To the extent any issuer defaults or a credit event occurs that impacts the issuer, the Fund may halt any additional interest income accruals and consider the realizability of interest accrued up to the date of default or credit event.
(e) Distributions to shareholders. Distributions from net investment income of the Fund, if any, are declared and paid on a quarterly basis. Distributions of net realized gains, if any, are declared at least annually. Distributions to shareholders of the Fund are recorded on theex-dividend date and are determined in accordance with income tax regulations, which may differ from GAAP.
| Legg Mason Global Infrastructure ETF 2019 Semi-Annual Report | 15 |
Notes to financial statements(unaudited) (cont’d)
(f) Federal and other taxes. It is the Fund’s policy to comply with the federal income and excise tax requirements of the Internal Revenue Code of 1986 (the “Code”), as amended, applicable to regulated investment companies. Accordingly, the Fund intends to distribute its taxable income and net realized gains, if any, to shareholders in accordance with timing requirements imposed by the Code. Therefore, no federal or state income tax provision is required in the Fund’s financial statements.
Management has analyzed the Fund’s tax positions taken on income tax returns for all open tax years and has concluded that as of October 31, 2018, no provision for income tax is required in the Fund’s financial statements. The Fund’s federal and state income and federal excise tax returns for tax years for which the applicable statutes of limitations have not expired are subject to examination by the Internal Revenue Service and state departments of revenue.
(g) Reclassification. GAAP requires that certain components of net assets be reclassified to reflect permanent differences between financial and tax reporting. These reclassifications have no effect on net assets or net asset value per share.
2. Investment management agreement and other transactions with affiliates
Legg Mason Partners Fund Advisor, LLC (“LMPFA”) is the Fund’s investment manager and RARE is the Fund’s subadviser. Western Asset Management Company, LLC (“Western Asset”) manages the portion of the Fund’s cash and short-term instruments allocated to it. LMPFA and Western Asset are wholly-owned subsidiaries of Legg Mason, Inc. (“Legg Mason”) and RARE is a subsidiary of Legg Mason.
LMPFA provides administrative and certain oversight services to the Fund. LMPFA delegates to the subadviser theday-to-day portfolio management of the Fund. The Fund is responsible for paying interest expenses, taxes, brokerage expenses, future12b-1 fees (if any), acquired fund fees and expenses, extraordinary expenses and the management fee payable to LMPFA under the investment management agreement.
Under the investment management agreement and subject to the general supervision of the Fund’s Board of Trustees, LMPFA provides or causes to be furnished all investment management, supervisory, administrative and other services reasonably necessary for the operation of the Fund, including certain distribution services (provided pursuant to a separate distribution agreement) and investment advisory services (provided pursuant to separate subadvisory agreements) under a unitary fee structure. The Fund pays an investment management fee, calculated daily and paid monthly, at an annual rate of 0.45% of the Fund’s average daily net assets.
LMPFA has agreed to waive and/or reimburse investment management fees so that the ratio of total annual fund operating expenses will not exceed 0.40% of the Fund’s average daily net assets (subject to the same exclusions as the investment management agreement). This arrangement cannot be terminated prior to March 1, 2020 without the Board of Trustees’ consent.
| 16 | Legg Mason Global Infrastructure ETF 2019 Semi-Annual Report |
During the six months ended April 30, 2019, fees waived and/or expenses reimbursed amounted to $6,810.
As compensation for its subadvisory services, LMPFA pays RARE monthly 90% of the management fee paid by the Fund to LMPFA, net of (i) all fees and expenses incurred by LMPFA under the investment management agreement (including without limitation any subadvisory fee paid to another subadviser to the Fund) and (ii) expense waivers, if any, and reimbursements. LMPFA pays Western Asset monthly a fee of 0.02% of the portion of the Fund’s average daily net assets allocated to Western Asset for the management of cash and other short-term instruments, net of expense waivers, if any, and reimbursements.
Legg Mason Investor Services, LLC, a wholly-owned broker-dealer subsidiary of Legg Mason, serves as the distributor of Creation Units for the Fund on an agency basis.
The Fund’s Board of Trustees has adopted a Rule12b-1 shareholder services and distribution plan and under that plan, the Fund is authorized to pay service and/or distribution fees calculated at an annual rate of up to 0.25% of its average daily net assets. No service and/or distribution fees are currently paid by the Fund, and there are no current plans to impose these fees.
All officers and one Trustee of the Trust are employees of Legg Mason or its affiliates and do not receive compensation from the Trust.
3. Investments
During the six months ended April 30, 2019, the aggregate cost of purchases and proceeds from sales of investments (excluding in-kind transactions and short-term investments) were as follows:
| Purchases | $ | 3,929,311 | ||
| Sales | 4,069,379 |
During the six months ended April 30, 2019,in-kind transactions (Note 5) were as follows:
| Contributions | $ | 0 | ||
| Redemptions | 11,323,786 | |||
| Realized gain (loss)* | 856,062 |
| * | Net realized gains on redemptionsin-kind are not taxable to the remaining shareholders of the Fund. |
Thein-kind contributions andin-kind redemptions shown in this table may not agree with the Fund Share Transactions on the Statement of Changes in Net Assets. This table represents the accumulation of the Fund’s daily net shareholder transactions while the Statement of Changes in Net Assets reflects gross shareholder transactions including any cash component of the transactions.
At April 30, 2019, the aggregate cost of investments and the aggregate gross unrealized appreciation and depreciation of investments for federal income tax purposes were substantially as follows:
| Cost | Gross Unrealized Appreciation | Gross Unrealized Depreciation | Net Unrealized Appreciation | |||||||||||||
| Securities | $ | 20,242,194 | $ | 1,214,262 | $ | (693,658) | $ | 520,604 | ||||||||
| Legg Mason Global Infrastructure ETF 2019 Semi-Annual Report | 17 |
Notes to financial statements(unaudited) (cont’d)
4. Derivative instruments and hedging activities
During the six months ended April 30, 2019, the Fund did not invest in derivative instruments.
5. Fund share transactions
At April 30, 2019, the Trust had an unlimited number of shares of beneficial interest authorized with a par value of $0.00001 per share. Fund shares are issued and redeemed by the Fund only in Creation Units or Creation Unit aggregations, where 100,000 shares of the Fund constitute a Creation Unit. Such transactions are generally on anin-kind basis, with a separate cash payment, which is a balancing cash component to equate the transaction to the net asset value per share of the Fund on the transaction date. Transactions in capital shares of the Fund are disclosed in detail in the Statement of Changes in Net Assets. Authorized Participants are subject to standard creation and redemption transaction fees to offset transfer and other transaction costs associated with the issuance and redemption of Creation Units. Creations and redemptions for cash (when cash creations and redemptions are available or specified) may be subject to an additional variable fee.
6. Deferred capital losses
As of October 31, 2018, the Fund had deferred capital losses of $309,940, which have no expiration date, that will be available to offset future taxable gains.
7. Recent accounting pronouncements
In August 2018, the Securities and Exchange Commission released its Final Rule on Disclosure Update and Simplification (the “Final Rule”) which is intended to simplify an issuer’s disclosure compliance efforts by removing redundant or outdated disclosure requirements without significantly altering the mix of information provided to investors. Effective with the current reporting period, the Fund adopted the Final Rule with the most notable impacts being that the Fund is no longer required to present the components of distributable earnings on the Statement of Assets and Liabilities or the sources of distributions to shareholders and the amount of undistributed net investment income on the Statements of Changes in Net Assets. The tax components of distributable earnings and distributions to shareholders continue to be disclosed within the Notes to Financial Statements.
The Fund has adopted the disclosure provisions of the Financial Accounting Standards Board Accounting Standards UpdateNo. 2018-13,Fair Value Measurement (Topic 820) — Disclosure Framework — Changes to the Disclosure Requirements for Fair Value Measurement(“ASU2018-13”) which introduces new fair value disclosure requirements as well as eliminates and modifies certain existing fair value disclosure requirements.ASU 2018-13 would be effective for fiscal years beginning after December 15, 2019, and interim periods within those fiscal years; however, management has elected to early adopt ASU2018-13. The impact of the Fund’s adoption was limited to changes in the Fund’s financial statement disclosures regarding fair value, primarily those disclosures related to transfers between levels of the fair value hierarchy.
| 18 | Legg Mason Global Infrastructure ETF 2019 Semi-Annual Report |
Board approval of management and subadvisory agreements(unaudited)
At a meeting of the Trust’s Board of Trustees, the Board considered there-approval for an annual period of the management agreement pursuant to which Legg Mason Partners Fund Advisor, LLC (the “Manager”) provides the Fund with investment advisory and administrative services, thesub-advisory agreement pursuant to which RARE Infrastructure (North America) Pty Limited (“RARE”) providesday-to-day management of the Fund’s portfolio, and thesub-advisory agreement pursuant to which Western Asset Management Company, LLC (“Western Asset” and, together with RARE, the“Sub-Advisers”) providesday-to-day management of the Fund’s cash and short-term instruments allocated to it by the Manager. (The management agreement andsub-advisory agreements are collectively referred to as the “Agreements.”) The Manager and Western Asset are wholly-owned subsidiaries, and RARE is an affiliate, of Legg Mason, Inc. The Trustees who are not “interested persons” (as defined in the Investment Company Act of 1940, as amended (the “Independent Trustees”)) of the Fund were assisted in their review by Fund counsel and independent legal counsel and met with independent legal counsel in executive sessions separate from representatives of the Manager and theSub-Advisers. The Independent Trustees requested and received information from the Manager and theSub-Advisers they deemed reasonably necessary for their review of the Agreements and the performance of the Manager and theSub-Advisers. Included was information about the Manager, theSub-Advisers and the Fund’s distributor, as well as the management,sub-advisory and distribution arrangements and services provided to the Fund and other funds overseen by the Board. This information was initially reviewed by a special committee of the Independent Trustees and then by the full Board.
In voting to approve the Agreements, the Independent Trustees considered whether the approval of the Agreements would be in the best interests of the Fund and its prospective shareholders, an evaluation based on several factors including those discussed below.
Nature, extent and quality of the services provided to the fund under the management agreement andsub-advisory agreements
The Board received and considered information regarding the nature, extent and quality of services provided to the Fund by the Manager and theSub-Advisers under the Management Agreement andSub-Advisory Agreements, respectively, since the Fund’s inception. The Trustees also considered the Manager’s supervisory activities over theSub-Advisers. In addition, the Independent Trustees received and considered other information regarding the administrative and other services rendered to the Fund by the Manager, including services specific to the Fund’s operation as an exchange-traded fund. The Board noted information received at regular meetings throughout the year related to the services rendered by the Manager in its management of the Fund’s affairs and the Manager’s role in coordinating the activities of theSub-Advisers and the Fund’s other service providers. The Board’s evaluation of the services provided by the Manager and theSub-Advisers took into account the Board’s knowledge and familiarity gained as Trustees of funds in the Legg Mason fund complex, including the scope and quality of the investment management and other
| Legg Mason Global Infrastructure ETF | 19 |
Board approval of management and subadvisory agreements(unaudited) (cont’d)
capabilities of the Manager and theSub-Advisers and the quality of the Manager’s administrative and other services. The Board observed that the scope of services provided by the Manager had expanded over time as a result of regulatory and other developments, including maintaining and monitoring its own and the Fund’s compliance programs specific to the Fund’s operation as an exchange-traded fund. The Board reviewed information received from the Manager and the Fund’s Chief Compliance Officer regarding the Fund’s compliance policies and procedures established pursuant to Rule38a-1 under the Investment Company Act of 1940, as amended.
The Board reviewed the qualifications, backgrounds and responsibilities of the Fund’s senior personnel and the portfolio management team primarily responsible for theday-to-day portfolio management of the Fund. The Board considered the services provided to the Legg Mason fund complex and the Manager’s commitment to continue to provide effective and efficient investment management services. The Board also considered, based on its knowledge of the Manager and the Manager’s affiliates, the financial resources available to the Manager’s parent organization, Legg Mason, Inc.
The Board considered the division of responsibilities among the Manager and theSub-Advisers and the oversight provided by the Manager. The Board also considered the arrangements for communication and processing of orders for creations and redemptions of Fund shares. In addition, management also reported to the Board on, among other things, its business plans regarding exchange-traded funds, recent organizational changes, portfolio manager compensation plan and policy regarding portfolio managers’ ownership of fund shares.
The Board concluded that, overall, it was satisfied with the nature, extent and quality of services provided (and expected to be provided) under the respective Agreement by the Manager and theSub-Advisers.
Fund performance
The Board received and reviewed performance information for the Fund and for a group of five institutional passively managed global infrastructure exchange-traded funds (the “Performance Group”) selected by Broadridge Financial Solutions Inc. (“Broadridge”), an independent provider of investment company data. The Board was provided with a description of the methodology Broadridge used to determine the similarity of the Fund with the funds included in the Performance Group. The Trustees noted that they also had received and discussed with management at periodic intervals information on the investment performance of the Fund in comparison to similar exchange-traded funds and benchmark performance indices, including the RARE Global Infrastructure Index, the Fund’s underlying index. The information comparing the Fund’s performance to that of the Performance Group was for theone-year period ended June 30, 2018 and the period since the Fund’s inception (December 29, 2016) through June 30, 2018. The Fund performed better than the median performance of the funds in the Performance Group for each period and was ranked in the
| 20 | Legg Mason Global Infrastructure ETF |
first quintile of the funds in the Performance Universe. The Board reviewed performance information provided by the Manager for periods ended September 30, 2018, which showed that the Fund’s performance was below the Broadridge category average during the third quarter. The Trustees noted that due to the limitations in providing comparable funds in the Performance Group, the statistical information provided in Broadridge’s report may or may not provide meaningful direct comparisons to the Fund in all instances. The Trustees also noted that the Fund generally performed in line with its underlying index during the periods under review. The Trustees further noted that the Manager and RARE were committed to providing the resources necessary to assist the Fund’s portfolio managers. Based on its review, and noting the limited period of performance data available, the Board determined to continue to evaluate the Fund’s performance and directed the Independent Trustees’ performance committee to continue to periodically review Fund performance with the Manager and report to the full Board.
Management fees and expense ratios
The Board reviewed and considered the contractual management fee rate (the “Actual Management Fee”) paid by the Fund to the Manager over the Fund’s last fiscal year in light of the nature, extent and quality of the management andsub-advisory services provided by the Manager and theSub-Advisers, respectively. The Board noted that the Manager, and not the Fund, pays thesub-advisory fees to theSub-Advisers and, accordingly, that the retention of theSub-Advisers does not increase the fees and expenses incurred by the Fund. The Board also noted that the Manager pays all fund expenses, other than the Actual Management Fee and certain other expenses. Because of the Fund’s “unitary fee” structure, the Board recognized that the Fund’s fees and expenses will vary within a much smaller range and the Manager will bear the risk that Fund expenses may increase over time. On the other hand, the Board noted that it is possible that the Manager could earn a profit on the fees charged under the management agreement and would benefit from any price decreases in third-party services covered by the management agreement.
The Board noted that the Manager provides the Fund with regulatory compliance and administrative services, office facilities and Fund officers (including the Fund’s chief financial, chief legal and chief compliance officers), and that the Manager coordinates and oversees the provision of services to the Fund by other fund service providers, including theSub-Advisers. Management also discussed with the Board the Fund’s distribution arrangements.
Additionally, the Board received and considered information comparing the Fund’s Actual Management Fee and the Fund’s overall expense ratio with those of the same group of five institutional passively managed global infrastructure exchange-traded funds selected by Broadridge as the Performance Group for the Fund (the “Expense Group”), and the Fund’s overall expense ratio with a broader group of funds selected by Broadridge consisting of all institutional passively managed global infrastructure exchange-traded funds (the “Expense Universe”). This information showed that the Fund’s Actual Management Fee was higher than the median of management fees paid by the funds in the Expense Group, and that the
| Legg Mason Global Infrastructure ETF | 21 |
Board approval of management and subadvisory agreements(unaudited) (cont’d)
Fund’s total expense ratio was lower than the median of the total expense ratios of the funds in the Expense Group and was higher than the median of the total expense ratios of the funds in the Expense Group and the funds in the Expense Universe. The Trustees noted that the Manager had contractually reduced the Fund’s Actual Management Fee during the period under review which was not reflected in the Broadridge data for an annual period. The Trustees also noted the Manager instituted a fee waiver and/or expense reimbursement arrangement during the period under review which also was not reflected in the Broadridge data for an annual period.
Manager profitability
The Board received and considered a profitability analysis of the Manager and its affiliates in providing services to the Fund. The Board also received profitability information with respect to the Legg Mason fund complex as a whole. In addition, the Board received information with respect to the Manager’s allocation methodologies used in preparing this profitability data as well as a report from an outside consultant that had reviewed the Manager’s methodology. The Board noted the profitability percentage ranges determined by appropriate court cases to be reasonable given the services rendered to investment companies. The Board determined that the Manager’s profitability was not excessive in light of the nature, extent and quality of the services provided to the Fund.
Economies of scale
The Board discussed any economies of scale or other efficiencies that may result from increases in the Fund’s assets. The Board noted that the Fund’s management agreement did not provide for any breakpoints in the Fund’s Actual Management Fee to the extent the assets of the Fund increase. The Board further noted that should material economies of scale exist in the future, a breakpoint structure for the Fund may be appropriate, and that it would continue to monitor the sharing of economies of scale to determine the appropriateness of adding breakpoints in the future. The Board also noted that there are various ways to share potential economies of scale with Fund shareholders and that it appeared that the benefits of any economies of scale would be appropriately shared with shareholders through increased investment in fund management and administration resources.
Taking all of the above into consideration, the Board determined that the management fee was reasonable in light of the comparative performance and expense information and the nature, extent and quality of the services provided to the Fund under the Agreements.
Other benefits to the manager
The Board considered other benefits received by the Manager and its affiliates, including theSub-Advisers, as a result of the Manager’s relationship with the Fund, including the opportunity to offer additional products and services such as 529 College Savings Plans and retail managed accounts.
| 22 | Legg Mason Global Infrastructure ETF |
In light of the costs of providing investment management and other services to the Fund and the Manager’s ongoing commitment to the Fund, the profits and other ancillary benefits that the Manager and its affiliates received were considered reasonable.
Based on their discussions and considerations, including those described above, the Trustees approved the Management Agreement and theSub-Advisory Agreements to continue for another year.
No single factor reviewed by the Board was identified by the Board as the principal factor in determining whether to approve the Management Agreement and theSub-Advisory Agreements.
| Legg Mason Global Infrastructure ETF | 23 |
Legg Mason
Global Infrastructure ETF
Trustees
Paul R. Ades
Andrew L. Breech
Dwight B. Crane
Althea L. Duersten
Stephen R. Gross*
Susan M. Heilbron*
Frank G. Hubbard
Howard J. Johnson
Chairman
Jerome H. Miller
Ken Miller
Thomas F. Schlafly
Jane Trust
| * | Effective February 6, 2019, Mr. Gross and Ms. Heilbron became Trustees. |
Investment manager
Legg Mason Partners Fund Advisor, LLC
Subadviser
RARE Infrastructure (North America) Pty Limited
Custodian
The Bank of New York Mellon
Transfer agent
BNY Mellon Investment Servicing (US) Inc.
4400 Computer Drive
Westborough, MA 01581
Independent registered public accounting firm
PricewaterhouseCoopers LLP
Baltimore, MD
Legg Mason Global Infrastructure ETF
The Fund is a separate investment series of Legg Mason ETF Investment Trust, a Maryland statutory trust.
Legg Mason Global Infrastructure ETF
Legg Mason Funds
620 Eighth Avenue, 49th Floor
New York, NY 10018
The Fund files its complete schedule of portfolio holdings with the Securities and Exchange Commission (“SEC”) for the first and third quarters of each fiscal year as an exhibit to its reports on FormN-PORT. Previously, the Fund filed a complete schedule of portfolio holdings with the SEC for the first and third quarters of each fiscal year on FormN-Q. The Fund’s FormsN-PORT andN-Q are available on the SEC’s website at www.sec.gov. To obtain information on FormsN-PORT andN-Q, shareholders can call the Fund at1-877-721-1926.
Information on how the Fund voted proxies relating to portfolio securities during the prior12-month period ended June 30th of each year and a description of the policies and procedures that the Fund uses to determine how to vote proxies related to portfolio transactions are available (1) without charge, upon request, by calling the Fund at1-877-721-1926, (2) at www.leggmason.com/etf and (3) on the SEC’s website at www.sec.gov.
This report is submitted for the general information of the shareholders of Legg Mason Global Infrastructure ETF. This report is not authorized for distribution to prospective investors in the Fund unless preceded or accompanied by a current prospectus.
Investors should consider the Fund’s investment objectives, risks, charges and expenses carefully before investing. The prospectus contains this and other important information about the Fund. Please read the prospectus carefully before investing.
www.leggmason.com
© 2019 Legg Mason Investors Services, LLC
Member FINRA, SIPC
ETF Index Disclaimers
The MSCI ACWI All Cap Index (the “MSCI Index”) was used by RARE Infrastructure (North America) Pty Limited (“RARE”) as the reference universe for selection of the component securities included in the RARE Global Infrastructure Index (the “Underlying Index”). MSCI Inc. does not in any way sponsor, support, promote or endorse the Underlying Index or Legg Mason Global Infrastructure ETF (the “Fund”). MSCI Inc. was not and is not involved in any way in the creation, calculation, maintenance or review of the Underlying Index. The MSCI Index was provided on an “as is” basis. MSCI Inc., its affiliates and any other person or entity involved in or related to compiling, computing or creating the MSCI Index (collectively, the “MSCI Parties”) expressly disclaim all warranties (including, without limitation, any warranties of originality, accuracy, completeness, timeliness,non-infringement, merchantability and fitness for a particular purpose). Without limiting any of the foregoing, in no event shall any MSCI Party have any liability for any direct, indirect, special, incidental, punitive, consequential (including without limitation lost profits) or any other damages in connection with the MSCI Index, the Underlying Index or the Fund.
The Fund is not sponsored, promoted, sold or supported in any other manner by Solactive AG nor does Solactive AG offer any express or implicit guarantee or assurance either with regard to the results of using the Underlying Index and/or Underlying Index trade mark or the Underlying Index Price at any time or in any other respect. The Underlying Index is calculated and published by Solactive AG. Solactive AG uses its best efforts to ensure that the Underlying Index is calculated correctly. Irrespective of its obligations towards the Fund, Solactive AG has no obligation to point out errors in the Underlying Index to third parties including but not limited to investors and/or financial intermediaries of the Fund. Neither publication of the Underlying Index by Solactive AG nor the licensing of the Underlying Index or the Underlying Index trade mark for the purpose of use in connection with the Fund constitutes a recommendation by Solactive AG to invest capital in this Fund nor does it in any way represent an assurance or opinion of Solactive AG with regard to any investment in this Fund.
RARE does not guarantee the accuracy and/or the completeness of the Underlying Index or any data included therein, and RARE shall not have any liability for any errors, omissions or interruptions therein. RARE makes no warranty, express or implied, as to results to be obtained by the Fund, owners of the shares of the Fund or any other person or entity from the use of the Underlying Index, or any data included therein, either in connection with the Fund or for any other use. RARE makes no express or implied warranties, and expressly disclaims all warranties of merchantability or fitness for a particular purpose or use with respect to the Underlying Index or any data included therein. Without limiting any of the foregoing, in no event shall RARE have any liability for any special, punitive, direct, indirect or consequential damages (including lost profits) arising out of matters relating to the use of the Underlying Index, even if notified of the possibility of such damages.
www.leggmason.com
© 2019 Legg Mason Investor Services, LLC Member FINRA, SIPC
ETFF377674 6/19 SR19-3635
| ITEM 2. | CODE OF ETHICS. | |
| Not applicable. | ||
| ITEM 3. | AUDIT COMMITTEE FINANCIAL EXPERT. | |
| Not applicable. | ||
| ITEM 4. | PRINCIPAL ACCOUNTANT FEES AND SERVICES. | |
| Not applicable. | ||
| ITEM 5. | AUDIT COMMITTEE OF LISTED REGISTRANTS. | |
| Not applicable. | ||
| ITEM 6. | SCHEDULE OF INVESTMENTS. | |
| Included herein under Item 1. | ||
| ITEM 7. | DISCLOSURE OF PROXY VOTING POLICIES AND PROCEDURES FORCLOSED-END MANAGEMENT INVESTMENT COMPANIES. | |
| Not applicable. | ||
| ITEM 8. | PORTFOLIO MANAGERS OFCLOSED-END MANAGEMENT INVESTMENT COMPANIES. | |
| Not applicable. | ||
| ITEM 9. | PURCHASES OF EQUITY SECURITIES BYCLOSED-END MANAGEMENT INVESTMENT COMPANY AND AFFILIATED PURCHASERS. | |
| Not applicable. | ||
| ITEM 10. | SUBMISSION OF MATTERS TO A VOTE OF SECURITY HOLDERS. | |
| Not applicable. | ||
| ITEM 11. | CONTROLS AND PROCEDURES. | |
(a) The registrant’s principal executive officer and principal financial officer have concluded that the registrant’s disclosure controls and procedures (as defined in Rule30a- 3(c) under the Investment Company Act of 1940, as amended (the “1940 Act”)) are effective as of a date within 90 days of the filing date of this report that includes the disclosure required by this paragraph, based on their evaluation of the disclosure controls and procedures required by Rule30a-3(b) under the 1940 Act and15d-15(b) under the Securities Exchange Act of 1934. | ||
(b) There were no changes in the registrant’s internal control over financial reporting (as defined in Rule30a-3(d) under the 1940 Act) that occurred during the second fiscal quarter of the period covered by this report that have materially affected, or are likely to materially affect the registrant’s internal control over financial reporting. | ||
| ITEM 12. | DISCLOSURE OF SECURITIES LENDING ACTIVITIES FOR CLOSED-END MANAGEMENT INVESTMENT COMPANIES. | |
| Not applicable. | ||
| ITEM 13. | EXHIBITS. | |
| (a) (1) Not applicable. | ||
| Exhibit 99.CODE ETH | ||
| (a) (2) Certifications pursuant to section 302 of the Sarbanes-Oxley Act of 2002 attached hereto. | ||
| Exhibit 99.CERT | ||
| (b) Certifications pursuant to Section 906 of the Sarbanes-Oxley Act of 2002 attached hereto. | ||
| Exhibit 99.906CERT | ||
SIGNATURES
Pursuant to the requirements of the Securities Exchange Act of 1934 and the Investment Company Act of 1940, the registrant has duly caused this Report to be signed on its behalf by the undersigned, there unto duly authorized.
| Legg Mason ETF Investment Trust | ||
| By: | /s/Jane Trust | |
| Jane Trust | ||
| Chief Executive Officer | ||
| Date: | June 20, 2019 | |
Pursuant to the requirements of the Securities Exchange Act of 1934 and the Investment Company Act of 1940, this report has been signed below by the following persons on behalf of the registrant and in the capacities and on the dates indicated.
| By: | /s/Jane Trust | |
| Jane Trust | ||
| Chief Executive Officer | ||
| Date: | June 20, 2019 | |
| By: | /s/Richard F. Sennett | |
| Richard F. Sennett | ||
| Principal Financial Officer | ||
| Date: | June 20, 2019 | |