UNITED STATES
SECURITIES AND EXCHANGE COMMISSION
Washington, D.C. 20549
FORM N-CSR
CERTIFIED SHAREHOLDER REPORT OF REGISTERED
MANAGEMENT INVESTMENT COMPANIES
Investment Company Act file number 811-23096
Legg Mason ETF Investment Trust
(Exact name of registrant as specified in charter)
620 Eighth Avenue, 47th Floor, New York, NY 10018
(Address of principal executive offices) (Zip code)
Robert I. Frenkel, Esq.
Legg Mason & Co., LLC
100 First Stamford Place
Stamford, CT 06902
(Name and address of agent for service)
Registrant’s telephone number, including area code: 1-877-721-1926
Date of fiscal year end: July 31
Date of reporting period: July 31, 2020
| ITEM 1. | REPORT TO STOCKHOLDERS. |
The Annual Report to Stockholders is filed herewith.

| | |
| Annual Report | | July 31, 2020 |
LEGG MASON
SMALL-CAP QUALITY
VALUE ETF
SQLV
Beginning in January 2021, as permitted by regulations adopted by the Securities and Exchange Commission, the Fund intends to no longer mail paper copies of the Fund’s shareholder reports like this one, unless you specifically request paper copies of the reports from your financial intermediary (such as a broker-dealer or bank). Instead, the reports will be made available on a website, and you will be notified by mail each time a report is posted and provided with a website link to access the report.
If you already elected to receive shareholder reports electronically (“e-delivery”), you will not be affected by this change and you need not take any action. If you have not already elected e-delivery, you may elect to receive shareholder reports and other communications from the Fund electronically by contacting your financial intermediary.
You may elect to receive all future reports in paper free of charge by contacting your financial intermediary to request that you continue to receive paper copies of your shareholder reports. Your election to receive reports in paper will apply to all Legg Mason Funds held in your account with your financial intermediary.

|
| INVESTMENT PRODUCTS: NOT FDIC INSURED • NO BANK GUARANTEE • MAY LOSE VALUE |
Fund objective
The Fund seeks to track the investment results of an index composed of equity securities of small-capitalization companies that are traded in the United States.
Letter from the president

Dear Shareholder,
We are pleased to provide the annual report of Legg Mason Small-Cap Quality Value ETF for the twelve-month reporting period ended July 31, 2020. Please read on for a detailed look at prevailing economic and market conditions during the Fund’s reporting period and to learn how those conditions have affected Fund performance.
Special shareholder notice
On July 31, 2020, Franklin Resources, Inc. (“Franklin Resources”) acquired Legg Mason, Inc. (“Legg Mason”) in an all-cash transaction. As a result of the transaction, Royce & Associates, LP (“Royce”), Legg Mason Partners Fund Advisor, LLC (“LMPFA”), and Western Asset Management Company, LLC (“Western Asset”) became subsidiaries of Franklin Resources. Under the Investment Company Act of 1940, as amended, consummation of the transaction automatically terminated the management and subadvisory agreements that were in place for the Fund prior to the transaction. The Fund’s manager and subadviser(s) continue to provide uninterrupted services with respect to the Fund pursuant to new management and subadvisory agreements that were approved by Fund shareholders.
Franklin Resources, whose principal executive offices are at One Franklin Parkway, San Mateo, California 94403, is a global investment management organization operating, together with its subsidiaries, as Franklin Templeton. As of June 30, 2020, after giving effect to the transaction described above, Franklin Templeton’s asset management operations had aggregate assets under management of approximately $1.4 trillion.
| | |
| II | | Legg Mason Small-Cap Quality Value ETF |
As always, we remain committed to providing you with excellent service and a full spectrum of investment choices. We also remain committed to supplementing the support you receive from your financial advisor. One way we accomplish this is through our website, www.leggmason.com. Here you can gain immediate access to market and investment information, including:
| • | | Fund net asset value and market price, |
| • | | Market insights and commentaries from our portfolio managers, and |
| • | | A host of educational resources. |
We look forward to helping you meet your financial goals.
Sincerely,

Jane Trust, CFA
President and Chief Executive Officer
August 31, 2020
| | |
| Legg Mason Small-Cap Quality Value ETF | | III |
(This page intentionally left blank.)
Fund overview
Q. What is the Fund’s investment strategy
A. Legg Mason Small-Cap Quality Value ETF (the “Fund”) seeks to track the investment results of an index composed of equity securities of small-capitalization companies that are traded in the United States. The Fund seeks to track the investment results of the Royce Small-Cap Quality Value Index (the “Underlying Index”)i. The Underlying Index utilizes a proprietary methodology created and sponsored by Royce & Associates, LP (“Royce”), the Fund’s subadviser. Royce is affiliated with both Legg Mason Partners Fund Advisor, LLC (“LMPFA”), the Fund’s investment manager, and the Fund. The Fund will invest at least 80% of its net assets, plus borrowings for investment purposes, if any, in securities that compose its Underlying Index.
The Underlying Index is composed of equity securities that meet certain criteria. Using Royce’s methodology, the Underlying Index will generally favor stocks with lower than average valuation, higher than average profitability, and higher than average debt coverage (i.e., available cash flow to pay current debt obligations) as compared with other stocks included in the investment universe while maintaining a comparable risk profile.
The Underlying Index’s constituents are reconstituted quarterly. The Fund’s securities portfolio is rebalanced when the Underlying Index is reconstituted. The composition of the Underlying Index and the Fund after reconstitution and rebalancing may fluctuate and exceed the above Underlying Index limitations due to market movements and other factors. The components of the Underlying Index, and the degree to which these components represent certain sectors and industries, may change over time.
The Fund may invest up to 20% of its net assets in cash and cash equivalents; other investment companies, including exchange-traded funds; exchange-traded notes; depositary receipts; and in securities and other instruments not included in its Underlying Index but which Royce believes will help the Fund track its Underlying Index.
Q. What were the overall market conditions during the Fund’s reporting period?
A. The twelve-month reporting period ended July 31, 2020 began on a down note. And while the period ended on a far more bullish one, the end result was a negative return for small-caps and underperformance versus large-cap stocks. As measured by the Russell 2000 Indexii, small-caps were down 4.59% for the reporting period, while large-cap stocks, as measured by the Russell 1000 Indexiii, gained 12.03% for the same span. This pattern began in August 2019 and, with some exceptions, persisted through much of the reporting period. For the full third quarter of 2019, the Russell 1000 Index was up 1.42%, while the Russell 2000 Index finished with a loss of 2.40%.
The final quarter of 2019 was a strong one for the major U.S. equity indexes. While a market rotation that began in late August proved shorter lived than we initially expected, it led to results that were generally better the farther down the capitalization range one traveled. Micro-caps led in the fourth quarter of 2019, followed by small-caps and then large caps. The Russell Microcap Indexiv surged 13.45% in in the fourth quarter of 2019,
| | |
| Legg Mason Small-Cap Quality Value ETF 2020 Annual Report | | 1 |
Fund overview (cont’d)
while the Russell 2000 Index increased 9.94% and the Russell 1000 Index advanced 9.04%. Performance in calendar year 2019 overall was mostly in line with previous rebounds off precipitous declines — biotech, software, and other growth stocks were among those that did best, along with non-dividend payers and companies with high debt. The somewhat peculiar exception to the pattern was large-cap outperformance. In high-octane markets such as what we saw in 2019, small-cap stocks have typically contended with few, if any, competitors for leadership. This pattern was undone by the ongoing leadership of mega-cap stocks — including the now familiar “FAAMG” group of Facebook, Apple, Amazon, Microsoft, and Google.
The first quarter of 2020 kicked off as tumultuous and volatile a period as we have seen in nearly 50 years of small-cap investing. The world’s equity indexes plummeted with alarming speed and depth during the opening quarter. No asset class or locale was spared as the effects of the coronavirus reverberated across the globe, causing major market dislocations. The 30.61% first-quarter decline for the Russell 2000 Index was the largest quarterly loss for the small-cap index in its more than 40-year history. As might be expected in such a steep bear market, small-caps bore the brunt of the decline on both a domestic and global level. To be sure, the farther down the market capitalization range one went here in the U.S., the bigger the negative result. Large-caps lost the least, followed by mid-caps, small-caps, and micro-caps. The Russell 1000 Index fell 20.22% in the first quarter of 2020 during the reporting period ended July 31, 2020.
This highly challenging period was followed by a remarkable recovery for equities in the second quarter of 2020. Stocks came back strong following their mid-March bottoms that resulted from COVID-19-driven lockdowns. The Russell 2000 Index went from its worst-ever quarter in the first quarter of 2020 to one of its three best quarters since its inception more than 40 years ago. In spite of ongoing volatility and considerable economic anxiety, stocks behaved in a fashion consistent with historical rebounds in recessionary periods. So, while the global health crisis was an unprecedented cause for the market’s decline, the subsequent pattern for equities was very much in line with history: Micro-caps beat small-caps, which in turn outpaced large-caps. The recurrence of this familiar recovery pattern gives us a measure of confidence amidst the ongoing short-term uncertainty. For the second quarter of 2020, the Russell 2000 Index advanced 25.42% while the Russell 1000 Index gained 21.82%. July 2020, however, saw large-caps pull ahead once more, as the Russell 2000 Index increased 2.77% versus 5.86% for its large-cap counterpart. During the twelve-month reporting period ended July 31, 2020, seven of the eleven sectors in the Russell 2000 Index detracted from performance. Financials made the biggest negative impact, followed by Real Estate, Energy, and Industrials. Of the four sectors that made positive contributions, Health Care and Information Technology led, followed by the Consumer Discretionary and Consumer Staples sectors. At the industry level, banks (Financials) detracted most while both types of REITs also made notable negative impacts: equity real estate investment trusts (Real Estate), and mortgage real estate investment trusts (Financials), along with oil, gas & consumable fuels (Energy). The industries that
| | |
| 2 | | Legg Mason Small-Cap Quality Value ETF 2020 Annual Report |
made the biggest positive contributions during the reporting period included two from Health Care — biotechnology, and health care technology, and two from Information Technology — semiconductors & semiconductor equipment, and software.
The Fund uses a passive investment approach to achieve its investment objective, and therefore made no change in investment approach in response to market conditions.
Performance review
For the twelve months ended July 31, 2020, Legg Mason Small-Cap Quality Value ETF generated a -11.71% return on a net asset value (“NAV”)v basis and -11.86% based on its market price per sharevi.
The performance table shows the Fund’s total return for the twelve months ended July 31, 2020 based on its NAV and market price as of July 31, 2020. The Fund seeks to track the investment results of the Royce Small-Cap Quality Value Index, which returned -10.80% for the same period. The Fund’s broad-based market index, the Russell 2000 Index, returned -4.59% over the same time frame. The Lipper Small-Cap Core Funds Category Averagevii returned -10.15% for the same period. Please note that Lipper performance returns are based on each fund’s NAV.
| | | | | | | | |
| Performance Snapshot as of July 31, 2020 (unaudited) | |
| | | 6 months | | | 12 months | |
Legg Mason Small-Cap Quality Value ETF: $ 22.80 (NAV) | | | -12.74 | % | | | -11.71 | %*† |
$ 22.77 (Market Price) | | | -12.89 | % | | | -11.86 | %*‡ |
| Royce Small-Cap Quality Value Index | | | -12.46 | % | | | -10.80 | % |
| Russell 2000 Index | | | -7.61 | % | | | -4.59 | % |
| Lipper Small-Cap Core Funds Category Average | | | -12.11 | % | | | -10.15 | % |
The performance shown represents past performance. Past performance is no guarantee of future results and current performance may be higher or lower than the performance shown above. Principal value and investment returns will fluctuate so shares, when sold, may be worth more or less than their original cost. Performance data current to the most recent month-end is available at www.leggmason.com/etf.
Investors buy and sell shares of an exchange-traded fund (“ETF”) at market price (not NAV) in the secondary market throughout the trading day. These shares are not individually available for direct purchase from or direct redemption to the ETF. Effective July 1, 2020, market price returns typically will be based upon the official closing price of the Fund’s shares. Prior to July 1, 2020, market price returns generally were based upon the mid-point between the bid and ask on the Fund’s principal trading market when the Fund’s NAV was determined, which was typically 4:00 p.m. Eastern time (US). Market price performance reported for periods prior to July 1, 2020 will continue to reflect market prices calculated based upon the mid-point between the bid and ask on the Fund’s principal trading market typically as of 4:00 p.m. Eastern time (US). These returns do not represent investors’ returns had they traded shares at other times. Performance figures for periods shorter than one year represent cumulative figures and are not annualized.
| | |
| Legg Mason Small-Cap Quality Value ETF 2020 Annual Report | | 3 |
Fund overview (cont’d)
Information showing the Fund’s net asset value, market price, premiums and discounts, and bid-ask spreads for various time periods is available by visiting the Fund’s website at www.leggmason.com/etf.
As of the Fund’s current prospectus dated November 29, 2019, as revised July 1, 2020, the gross total annual fund operating expense ratio for the Fund was 0.62%.
* Total returns are based on changes in NAV or market price, respectively. Returns reflect the deduction of all Fund expenses. Returns do not reflect the deduction of brokerage commissions or taxes that investors pay on distributions or the sale of shares.
† Total return assumes the reinvestment of all distributions, at NAV.
‡ Total return assumes the reinvestment of all distributions at market price, which typically is based upon the official closing price of the Fund’s shares.
Q. What were the leading contributors to performance?
A. The Information Technology and Consumer Staples sectors made the largest positive contributions to performance in the Underlying Index on a sector level for the twelve-month reporting period ended July 31, 2020. Semiconductors & semiconductor equipment, internet & direct marketing retail, and electronic equipment, instrument & components were the three industries that contributed the most. Relative to the Russell 2000 Index, the Underlying Index’s underweight to the Real Estate sector was the largest contributor as that sector lagged returns in the broad-based market index. Additionally, the Underlying Index’s stock selection in the Financial sector contributed to relative results as stocks in the Underlying Index outperformed those in the broad-based market index. The Fund’s exposure to stocks with higher ratios of sales to assets than those in the broad-based market index contributed to relative performance.
Q. What were the leading detractors from performance?
A. The Financials and Energy sectors within the Underlying Index were the largest sector detractors from overall performance over the reporting period. At the industry level, oil, gas & consumable fuels, banks, and media detracted the most. Relative to the Russell 2000 Index, holdings in the Health Care sector were the largest detractors as the stocks in the Underlying Index declined, while those in the broad-based market index advanced. Energy sector stocks in the Underlying Index also detracted from relative performance. The Underlying Index was overweight this lagging sector and stocks in the Underlying Index also declined more than those in the broad-based market index. The Fund’s relative performance was also hindered by a greater exposure to the value factor (cheaper stocks) and to stocks with higher profitability.
Looking for additional information?
The Fund’s daily NAV is available on-line at www.leggmason.com/etf. The Fund is traded under the symbol “SQLV” and its closing market price is available on most financial websites. In a continuing effort to provide information concerning the Fund, shareholders may call 1-877-721-1926 (toll free), Monday through Friday from 8:00 a.m. to 5:30 p.m. Eastern time, for the Fund’s current NAV, market price and other information.
| | |
| 4 | | Legg Mason Small-Cap Quality Value ETF 2020 Annual Report |
Thank you for your investment in Legg Mason Small-Cap Quality Value ETF. As always, we appreciate that you have chosen us to manage your assets and we remain focused on achieving the Fund’s investment goals.
Sincerely,
Royce & Associates, LP
August 31, 2020
RISKS: Equity securities are subject to market and price fluctuations. The Fund invests primarily in small-cap stocks, which may involve considerably more risk than investing in larger-cap stocks. The Fund has significant exposure to U.S. issuers. A decrease in imports or exports, changes in trade regulations and/or an economic recession in the United States may have a material adverse effect on the U.S. economy and the securities listed on U.S. exchanges. There is no guarantee that the Fund will achieve a high degree of correlation to the index it seeks to track. The Fund does not seek to outperform the index it tracks and does not seek temporary defensive positions when markets decline or appear overvalued. If the Underlying Index is concentrated in a particular industry or industries, the Fund may focus its investments in these industries, increasing its vulnerability to market volatility. Diversification does not ensure gains or protect against market declines. Please see the Fund’s prospectus for a more complete discussion of these and other risks and the Fund’s investment strategies.
The mention of sector breakdowns is for informational purposes only and should not be construed as a recommendation to purchase or sell any securities. The information provided regarding such sectors is not a sufficient basis upon which to make an investment decision. Investors seeking financial advice regarding the appropriateness of investing in any securities or investment strategies discussed should consult their financial professional. The Fund’s top five sector holdings (as a percentage of net assets) as of July 31, 2020 were: Financials (22.1%), Health Care (15.9%), Industrials (15.5%), Information Technology (13.3%) and Consumer Discretionary (12.1%). The Fund’s composition may differ over time.
All investments are subject to risk including the possible loss of principal. Past performance is no guarantee of future results. An index is a statistical composite that tracks a specified financial market, sector or rules-based investment process. Unlike a fund, an index does not actually hold a portfolio of securities and therefore does not incur the expenses incurred by a fund. These expenses negatively impact fund performance. All index performance reflects no deduction for fees, expenses or taxes. Please note that an investor cannot invest directly in an index.
The information provided is not intended to be a forecast of future events, a guarantee of future results or investment advice. Views expressed may differ from those of the firm as a whole.
| | |
| Legg Mason Small-Cap Quality Value ETF 2020 Annual Report | | 5 |
Fund overview (cont’d)
| i | The Royce Small-Cap Quality Value Index is a proprietary index composed of small-cap stocks trading in the United States with relatively low valuations, high profitability and high debt coverage compared with the average of stocks in the investment universe. |
| ii | The Russell 2000 Index measures the performance of the small-cap segment of the U.S. equity universe. The Russell 2000 is a subset of the Russell 3000 Index representing approximately 10% of the total market capitalization of that index. It includes approximately 2,000 of the smallest securities based on a combination of their market cap and current index membership. The Russell 3000 Index measures the performance of the 3,000 largest U.S. companies based on total market capitalization, which represents approximately 98% of the U.S. equity market. |
| iii | The Russell 1000 Index measures the performance of the large-cap segment of the U.S. equity universe. It is a subset of the Russell 3000 Index and includes approximately 1,000 of the largest securities based on a combination of their market cap and current index membership. The Russell 1000 represents approximately 90% of the U.S. market. |
| iv | The Russell Microcap Index measures the performance of the microcap segment of the U.S. equity market. It makes up less than 3% of the U.S. equity market. It includes 1,000 of the smallest securities in the Russell 2000 Index based on a combination of their market cap and current index membership and it also includes up to the next 1,000 stocks. |
| v | Net Asset Value (“NAV”) is calculated by subtracting total liabilities from total assets and dividing the results by the number of shares outstanding. |
| vi | Market Price is determined by supply and demand. It is the price at which an investor purchases or sells shares of the Fund. The Market Price may differ from the Fund’s NAV. For performance reporting purposes for periods including and after July 1, 2020, Market Price typically is calculated using the official closing price of the ETF’s shares. |
| vii | Lipper, Inc., a wholly-owned subsidiary of Reuters, provides independent insight on global collective investments. Returns are based on the period ended July 31, 2020 calculated among the 918 funds for the six-month period and among the 907 funds for the twelve-month period in the Fund’s Lipper category. |
| | |
| 6 | | Legg Mason Small-Cap Quality Value ETF 2020 Annual Report |
Fund at a glance† (unaudited)
Investment breakdown (%) as a percent of total investments
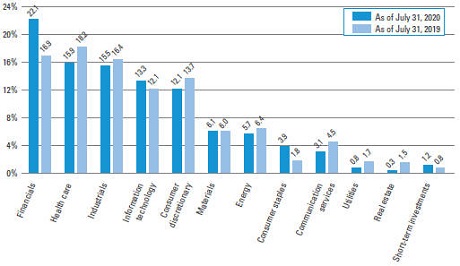
| † | The bar graph above represents the composition of the Fund’s investments as of July 31, 2020 and July 31, 2019. The composition of the Fund’s investments is subject to change at any time. |
| | |
| Legg Mason Small-Cap Quality Value ETF 2020 Annual Report | | 7 |
Fund expenses (unaudited)
Example
As a shareholder of the Fund, you may incur two types of costs: (1) transaction costs, such as brokerage commissions paid on purchases and sales of Fund shares; and (2) ongoing costs, including management fees; and other Fund expenses. This example is intended to help you understand your ongoing costs (in dollars) of investing in the Fund and to compare these costs with the ongoing costs of investing in other funds.
This example is based on an investment of $1,000 invested on February 1, 2020 and held for the six months ended July 31, 2020.
Actual expenses
The table below titled “Based on Actual Total Return” provides information about actual account values and actual expenses. You may use the information provided in this table, together with the amount you invested, to estimate the expenses that you paid over the period. To estimate the expenses you paid on your account, divide your ending account value by $1,000 (for example, an $8,600 ending account value divided by $1,000 = 8.6), then multiply the result by the number under the heading entitled “Expenses Paid During the Period”.
Hypothetical example for comparison purposes
The table below titled “Based on Hypothetical Total Return” provides information about hypothetical account values and hypothetical expenses based on the actual expense ratio and an assumed rate of return of 5.00% per year before expenses, which is not the Fund’s actual return. The hypothetical account values and expenses may not be used to estimate the actual ending account balance or expenses you paid for the period. You may use the information provided in this table to compare the ongoing costs of investing in the Fund and other funds. To do so, compare the 5.00% hypothetical example relating to the Fund with the 5.00% hypothetical examples that appear in the shareholder reports of the other funds.
Please note that the expenses shown in the table below are meant to highlight your ongoing costs only and do not reflect any transactional costs, such as brokerage commissions paid on purchases and sales of Fund shares. Therefore, the table is useful in comparing ongoing costs only, and will not help you determine the relative total costs of owning different funds. In addition, if these transaction costs were included, your costs would have been higher.
| | | | | | | | | | | | | | | | | | | | | | | | | | | | | | | | | | | | | | | | |
| | |
| Based on actual total return1 | | | | | | Based on hypothetical total return1 | |
Actual Total Return2 | | | Beginning
Account Value | | | Ending
Account
Value | | | Annualized
Expense
Ratio | | | Expenses Paid During the Period3 | | | | | | Hypothetical
Annualized
Total Return | | | Beginning
Account Value | | Ending
Account
Value | | | Annualized
Expense
Ratio | | | Expenses Paid During the Period3 | |
| | -12.74% | | | $ | 1,000.00 | | | $ | 872.60 | | | | 0.60 | % | | $ | 2.79 | | | | | | | | 5.00 | % | | $1,000.00 | | $ | 1,021.88 | | | | 0.60 | % | | $ | 3.02 | |
| 1 | For the six months ended July 31, 2020. |
| 2 | Assumes the reinvestment of all distributions, including returns of capital, if any, at net asset value. Total return is not annualized, as it may not be representative of the total return for the year. Performance figures may reflect fee waivers and/or expense reimbursements. In the absence of fee waivers and/or expense reimbursements, the total return would have been lower. Past performance is no guarantee of future results. |
| 3 | Expenses (net of fee waivers and/or expense reimbursements) are equal to the Fund’s annualized expense ratio multiplied by the average account value over the period, multiplied by the number of days in the most recent fiscal half-year (182), then divided by 366. |
| | |
| 8 | | Legg Mason Small-Cap Quality Value ETF 2020 Annual Report |
Fund performance (unaudited)
| | | | |
| Net Asset Value | | | |
| Average annual total returns1 | | | |
| Twelve Months Ended 7/31/20 | | | -11.71 | % |
| Inception* through 7/31/20 | | | -2.00 | |
| |
| Cumulative total returns1 | | | |
| Inception date of 7/12/17 through 7/31/20 | | | -5.97 | % |
| | | | |
| Market Price | | | |
| Average annual total returns2 | | | |
| Twelve Months Ended 7/31/20 | | | -11.86 | % |
| Inception* through 7/31/20 | | | -2.04 | |
| |
| Cumulative total returns2 | | | |
| Inception date of 7/12/17 through 7/31/20 | | | -6.09 | % |
All figures represent past performance and are not a guarantee of future results. Investment returns and principal value of an investment will fluctuate so that an investor’s shares, when sold, may be worth more or less than their original cost. The returns shown do not reflect the deduction of brokerage commissions or taxes that investors would pay on distributions or the sale of shares. Performance figures may reflect fee waivers and/or expense reimbursements. In the absence of fee waivers and/or expense reimbursements, the total return would have been lower.
Investors buy and sell shares of the Fund at market price, not NAV, in the secondary market throughout the trading day. These shares are not individually available for direct purchase from or direct redemption to the Fund. The Fund’s per share NAV is the value of one share of the Fund and is calculated by dividing the value of total assets less total liabilities by the number of shares outstanding. The NAV return is based on the NAV of the Fund and effective July 1, 2020, market price returns typically will be based upon the official closing price of the Fund’s shares. Prior to July 1, 2020, market price returns generally were based upon the mid-point between the bid and ask on the Fund’s principal trading market when the Fund’s NAV was determined, which was typically 4:00 p.m. Eastern time (US). Market price performance reported for periods prior to July 1, 2020 will continue to reflect market prices calculated based upon the mid-point between the bid and ask on the Fund’s principal trading market typically as of 4:00 p.m. Eastern time (US). These returns do not represent investors’ returns had they traded shares at other times. NAV and market price returns assume that dividends and capital gain distributions have been reinvested in the Fund at NAV and market price, respectively. As with other exchange-traded funds, NAV returns and market price returns may differ because of factors such as the supply and demand for Fund shares and investors’ assessment of the underlying value of the Fund’s portfolio securities.
| 1 | Assumes the reinvestment of all distributions, including returns of capital, if any, at net asset value. |
| 2 | Assumes the reinvestment of all distributions, including returns of capital, if any, at market price. |
| * | Inception date of the Fund is July 12, 2017. |
| | |
| Legg Mason Small-Cap Quality Value ETF 2020 Annual Report | | 9 |
Fund performance (unaudited) (cont’d)
Historical performance
Value of $10,000 invested in
Legg Mason Small-Cap Quality Value ETF vs. Royce Small-Cap Value Index and Russell 2000 Index† — July 12, 2017 - July 2020
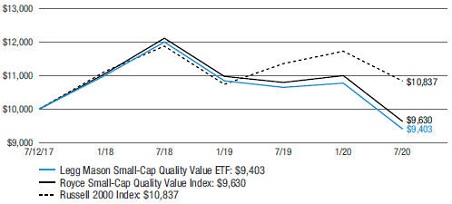
All figures represent past performance and are not a guarantee of future results. Investment returns and principal value of an investment will fluctuate so that an investor’s shares, when redeemed, may be worth more or less than their original cost. NAV returns assume that dividends and capital gain distributions have been reinvested in the Fund at NAV. The returns shown do not reflect the deduction of brokerage commissions or taxes that investors would pay on distributions or the sale of shares. Performance figures may reflect fee waivers and/or expense reimbursements. In the absence of fee waivers and/or expense reimbursements, the total return would have been lower.
| † | Hypothetical illustration of $10,000 invested in Legg Mason Small-Cap Quality Value ETF on July 12, 2017 assuming the reinvestment of all distributions, including returns of capital, if any, at net asset value through July 31, 2020. The hypothetical illustration also assumes a $10,000 investment in the Royce Small-Cap Quality Value Index and the Russell 2000 Index. The Fund’s per share NAV is the value of one share of the Fund and is calculated by dividing the value of total assets less total liabilities by the number of shares outstanding. The NAV return is based on the NAV of the Fund. The Royce Small-Cap Quality Value Index (the “Underlying Index”) is an index composed of equity securities that meet certain criteria – lower than average valuation, higher than average profitability and higher than average debt coverage. The Underlying Index is based on a proprietary methodology created and sponsored by Royce & Associates, LP, the Fund’s subadviser. The Russell 2000 Index measures the 2000 smallest companies in the Russell 3000 Index. The indices are not subject to the same management and trading expenses as a fund. An index is a statistical composite that tracks a specified financial market, sector, or rules-based investment process. Unlike a fund, an index does not actually hold a portfolio of securities and therefore does not incur the expenses incurred by a fund. These expenses negatively impact fund performance. All index performance reflects no deduction for fees, expenses or taxes. Please note that an investor cannot invest directly in an index. |
| | |
| 10 | | Legg Mason Small-Cap Quality Value ETF 2020 Annual Report |
Schedule of investments
July 31, 2020
Legg Mason Small-Cap Quality Value ETF
| | | | | | | | |
| Security | | Shares | | | Value | |
| Common Stocks — 98.8% | | | | | | | | |
| Communication Services — 3.1% | | | | | | | | |
Entertainment — 1.0% | | | | | | | | |
Lions Gate Entertainment Corp., Class A Shares | | | 9,316 | | | $ | 71,361 | * |
Sciplay Corp., Class A Shares | | | 2,517 | | | | 36,798 | * |
Total Entertainment | | | | | | | 108,159 | |
Interactive Media & Services — 1.0% | | | | | | | | |
Travelzoo | | | 2,656 | | | | 16,281 | * |
TrueCar Inc. | | | 12,128 | | | | 45,601 | * |
Yelp Inc. | | | 2,063 | | | | 51,534 | * |
Total Interactive Media & Services | | | | | | | 113,416 | |
Media — 1.1% | | | | | | | | |
AMC Networks Inc., Class A Shares | | | 2,092 | | | | 48,325 | * |
MSG Networks Inc., Class A Shares | | | 3,648 | | | | 34,766 | * |
National CineMedia Inc. | | | 18,049 | | | | 44,581 | |
Total Media | | | | | | | 127,672 | |
Total Communication Services | | | | | | | 349,247 | |
| Consumer Discretionary — 12.1% | | | | | | | | |
Distributors — 0.3% | | | | | | | | |
Funko Inc., Class A Shares | | | 7,234 | | | | 40,076 | * |
Diversified Consumer Services — 1.9% | | | | | | | | |
American Public Education Inc. | | | 1,071 | | | | 31,177 | * |
Collectors Universe Inc. | | | 1,198 | | | | 45,596 | |
Houghton Mifflin Harcourt Co. | | | 18,586 | | | | 55,015 | * |
K12 Inc. | | | 1,826 | | | | 83,612 | * |
Total Diversified Consumer Services | | | | | | | 215,400 | |
Hotels, Restaurants & Leisure — 1.4% | | | | | | | | |
Biglari Holdings Inc., Class B Shares | | | 552 | | | | 35,842 | * |
Cheesecake Factory Inc. | | | 2,450 | | | | 58,800 | |
Hilton Grand Vacations Inc. | | | 1,931 | | | | 39,199 | * |
Ruth’s Hospitality Group Inc. | | | 3,799 | | | | 25,434 | |
Total Hotels, Restaurants & Leisure | | | | | | | 159,275 | |
Household Durables — 2.7% | | | | | | | | |
Ethan Allen Interiors Inc. | | | 3,900 | | | | 46,176 | |
Hooker Furniture Corp. | | | 1,957 | | | | 41,880 | |
La-Z-Boy Inc. | | | 1,950 | | | | 55,497 | |
Meritage Homes Corp. | | | 892 | | | | 88,469 | * |
TRI Pointe Group Inc. | | | 4,434 | | | | 74,136 | * |
Total Household Durables | | | | | | | 306,158 | |
See Notes to Financial Statements.
| | |
| Legg Mason Small-Cap Quality Value ETF 2020 Annual Report | | 11 |
Schedule of investments (cont’d)
July 31, 2020
Legg Mason Small-Cap Quality Value ETF
| | | | | | | | |
| Security | | Shares | | | Value | |
Internet & Direct Marketing Retail — 1.0% | | | | | | | | |
PetMed Express Inc. | | | 1,184 | | | $ | 36,941 | |
Shutterstock Inc. | | | 1,422 | | | | 77,271 | |
Total Internet & Direct Marketing Retail | | | | | | | 114,212 | |
Leisure Products — 0.4% | | | | | | | | |
Malibu Boats Inc., Class A Shares | | | 754 | | | | 44,320 | * |
Specialty Retail — 3.9% | | | | | | | | |
Asbury Automotive Group Inc. | | | 822 | | | | 82,323 | * |
Buckle Inc. | | | 4,000 | | | | 64,120 | |
Chico’s FAS Inc. | | | 29,919 | | | | 37,997 | |
Rent-A-Center Inc. | | | 2,007 | | | | 58,043 | |
Sally Beauty Holdings Inc. | | | 3,798 | | | | 44,095 | * |
Shoe Carnival Inc. | | | 1,553 | | | | 38,126 | |
Sleep Number Corp. | | | 1,108 | | | | 51,522 | * |
Winmark Corp. | | | 168 | | | | 26,709 | |
Zumiez Inc. | | | 1,580 | | | | 36,498 | * |
Total Specialty Retail | | | | | | | 439,433 | |
Textiles, Apparel & Luxury Goods — 0.5% | | | | | | | | |
Kontoor Brands Inc. | | | 3,015 | | | | 57,767 | |
Total Consumer Discretionary | | | | | | | 1,376,641 | |
| Consumer Staples — 3.9% | | | | | | | | |
Beverages — 0.6% | | | | | | | | |
National Beverage Corp. | | | 1,085 | | | | 69,603 | * |
Food & Staples Retailing — 1.1% | | | | | | | | |
Ingles Markets Inc., Class A Shares | | | 1,434 | | | | 57,718 | |
Weis Markets Inc. | | | 1,335 | | | | 66,510 | |
Total Food & Staples Retailing | | | | | | | 124,228 | |
Food Products — 0.4% | | | | | | | | |
Seneca Foods Corp., Class A Shares | | | 1,219 | | | | 47,760 | * |
Household Products — 0.3% | | | | | | | | |
Oil-Dri Corp. of America | | | 1,022 | | | | 35,535 | |
Personal Products — 1.0% | | | | | | | | |
BellRing Brands Inc., Class A Shares | | | 1,948 | | | | 38,707 | * |
Lifevantage Corp. | | | 1,672 | | | | 21,468 | * |
USANA Health Sciences Inc. | | | 586 | | | | 47,572 | * |
Total Personal Products | | | | | | | 107,747 | |
Tobacco — 0.5% | | | | | | | | |
Vector Group Ltd. | | | 6,889 | | | | 60,761 | |
Total Consumer Staples | | | | | | | 445,634 | |
See Notes to Financial Statements.
| | |
| 12 | | Legg Mason Small-Cap Quality Value ETF 2020 Annual Report |
Legg Mason Small-Cap Quality Value ETF
| | | | | | | | |
| Security | | Shares | | | Value | |
| Energy — 5.7% | | | | | | | | |
Energy Equipment & Services — 2.5% | | | | | | | | |
Bristow Group Inc. | | | 1,606 | | | $ | 25,712 | * |
Cactus Inc., Class A Shares | | | 2,102 | | | | 47,547 | |
Matrix Service Co. | | | 3,617 | | | | 31,667 | * |
NexTier Oilfield Solutions Inc. | | | 14,523 | | | | 36,598 | * |
Patterson-UTI Energy Inc. | | | 12,434 | | | | 48,182 | |
ProPetro Holding Corp. | | | 6,762 | | | | 36,312 | * |
Select Energy Services Inc., Class A Shares | | | 7,010 | | | | 31,124 | * |
Solaris Oilfield Infrastructure Inc., Class A Shares | | | 4,904 | | | | 35,603 | |
Total Energy Equipment & Services | | | | | | | 292,745 | |
Oil, Gas & Consumable Fuels — 3.2% | | | | | | | | |
CONSOL Energy Inc. | | | 6,505 | | | | 38,249 | * |
CVR Energy Inc. | | | 3,964 | | | | 76,109 | |
Evolution Petroleum Corp. | | | 11,716 | | | | 30,696 | |
Falcon Minerals Corp. | | | 15,568 | | | | 39,076 | |
Kosmos Energy Ltd. | | | 21,272 | | | | 34,248 | |
Peabody Energy Corp. | | | 19,156 | | | | 59,767 | |
World Fuel Services Corp. | | | 3,535 | | | | 83,178 | |
Total Oil, Gas & Consumable Fuels | | | | | | | 361,323 | |
Total Energy | | | | | | | 654,068 | |
| Financials — 22.1% | | | | | | | | |
Banks — 7.7% | | | | | | | | |
Associated Banc-Corp. | | | 4,865 | | | | 62,467 | |
Cathay General Bancorp | | | 2,455 | | | | 59,362 | |
CNB Financial Corp. | | | 2,056 | | | | 33,575 | |
Eagle Bancorp Inc. | | | 1,453 | | | | 43,706 | |
Financial Institutions Inc. | | | 2,117 | | | | 31,268 | |
First Business Financial Services Inc. | | | 2,025 | | | | 30,112 | |
First Financial Bancorp | | | 4,374 | | | | 60,864 | |
First Internet Bancorp | | | 1,756 | | | | 25,725 | |
HBT Financial Inc. | | | 4,408 | | | | 52,984 | |
Horizon Bancorp Inc. | | | 4,048 | | | | 40,925 | |
Independent Bank Corp. | | | 2,628 | | | | 36,700 | |
Mercantile Bank Corp. | | | 1,794 | | | | 38,194 | |
Metrocity Bankshares Inc. | | | 2,809 | | | | 37,865 | |
Old Second Bancorp Inc. | | | 4,063 | | | | 33,804 | |
Parke Bancorp Inc. | | | 2,310 | | | | 27,004 | |
Preferred Bank | | | 1,007 | | | | 37,511 | |
RBB Bancorp | | | 2,560 | | | | 32,768 | |
Republic Bancorp Inc., Class A Shares | | | 1,418 | | | | 42,852 | |
See Notes to Financial Statements.
| | |
| Legg Mason Small-Cap Quality Value ETF 2020 Annual Report | | 13 |
Schedule of investments (cont’d)
July 31, 2020
Legg Mason Small-Cap Quality Value ETF
| | | | | | | | |
| Security | | Shares | | | Value | |
Banks — continued | | | | | | | | |
Simmons First National Corp., Class A Shares | | | 3,768 | | | $ | 62,511 | |
Sterling Bancorp | | | 5,493 | | | | 61,796 | |
Summit Financial Group Inc. | | | 2,035 | | | | 30,607 | |
Total Banks | | | | | | | 882,600 | |
Capital Markets — 4.7% | | | | | | | | |
Artisan Partners Asset Management Inc., Class A Shares | | | 2,355 | | | | 85,322 | |
Brightsphere Investment Group Inc. | | | 5,430 | | | | 72,979 | |
Diamond Hill Investment Group Inc. | | | 383 | | | | 43,673 | |
Donnelley Financial Solutions Inc. | | | 4,563 | | | | 39,470 | * |
Evercore Inc., Class A Shares | | | 1,161 | | | | 64,203 | |
Federated Hermes Inc., Class B Shares | | | 2,834 | | | | 74,704 | |
Moelis & Co., Class A Shares | | | 2,230 | | | | 66,432 | |
Safeguard Scientifics Inc. | | | 4,056 | | | | 23,079 | |
Waddell & Reed Financial Inc., Class A Shares | | | 4,367 | | | | 63,715 | |
Total Capital Markets | | | | | | | 533,577 | |
Consumer Finance — 1.2% | | | | | | | | |
Curo Group Holdings Corp. | | | 7,178 | | | | 50,174 | |
Elevate Credit Inc. | | | 19,391 | | | | 37,425 | * |
SLM Corp. | | | 6,947 | | | | 47,031 | |
Total Consumer Finance | | | | | | | 134,630 | |
Diversified Financial Services — 0.5% | | | | | | | | |
Cannae Holdings Inc. | | | 1,473 | | | | 55,503 | * |
Insurance — 4.5% | | | | | | | | |
American Equity Investment Life Holding Co. | | | 3,341 | | | | 85,028 | |
CNO Financial Group Inc. | | | 5,027 | | | | 75,908 | |
Genworth Financial Inc., Class A Shares | | | 32,063 | | | | 65,408 | * |
Hallmark Financial Services Inc. | | | 6,052 | | | | 17,188 | * |
Investors Title Co. | | | 286 | | | | 32,913 | |
National General Holdings Corp. | | | 3,321 | | | | 112,881 | |
National Western Life Group Inc., Class A Shares | | | 286 | | | | 55,710 | |
Stewart Information Services Corp. | | | 1,673 | | | | 70,182 | |
Total Insurance | | | | | | | 515,218 | |
Thrifts & Mortgage Finance — 3.5% | | | | | | | | |
Axos Financial Inc. | | | 2,167 | | | | 48,562 | * |
Flagstar Bancorp Inc. | | | 2,440 | | | | 76,567 | |
Merchants Bancorp | | | 2,462 | | | | 45,375 | |
Meta Financial Group Inc. | | | 2,365 | | | | 44,131 | |
Mr. Cooper Group Inc. | | | 6,829 | | | | 111,518 | * |
See Notes to Financial Statements.
| | |
| 14 | | Legg Mason Small-Cap Quality Value ETF 2020 Annual Report |
Legg Mason Small-Cap Quality Value ETF
| | | | | | | | |
| Security | | Shares | | | Value | |
Thrifts & Mortgage Finance — continued | | | | | | | | |
NMI Holdings Inc., Class A Shares | | | 2,814 | | | $ | 43,673 | * |
Riverview Bancorp Inc. | | | 5,045 | | | | 24,620 | |
Total Thrifts & Mortgage Finance | | | | | | | 394,446 | |
Total Financials | | | | | | | 2,515,974 | |
| Health Care — 15.9% | | | | | | | | |
Biotechnology — 3.4% | | | | | | | | |
Akcea Therapeutics Inc. | | | 2,152 | | | | 23,328 | * |
Alector Inc. | | | 1,027 | | | | 16,093 | * |
Anika Therapeutics Inc. | | | 926 | | | | 33,706 | * |
BioSpecifics Technologies Corp. | | | 447 | | | | 28,009 | * |
Catalyst Pharmaceuticals Inc. | | | 5,009 | | | | 21,539 | * |
Dicerna Pharmaceuticals Inc. | | | 1,854 | | | | 39,861 | * |
Eagle Pharmaceuticals Inc. | | | 741 | | | | 34,375 | * |
Enanta Pharmaceuticals Inc. | | | 780 | | | | 35,763 | * |
Frequency Therapeutics Inc. | | | 1,240 | | | | 26,213 | * |
Ironwood Pharmaceuticals Inc. | | | 2,328 | | | | 21,348 | * |
Lexicon Pharmaceuticals Inc. | | | 11,209 | | | | 21,745 | * |
Myriad Genetics Inc. | | | 3,157 | | | | 38,105 | * |
Puma Biotechnology Inc. | | | 1,890 | | | | 19,486 | * |
Vanda Pharmaceuticals Inc. | | | 3,334 | | | | 33,607 | * |
Total Biotechnology | | | | | | | 393,178 | |
Health Care Equipment & Supplies — 6.0% | | | | | | | | |
Allied Healthcare Products Inc. | | | 1,706 | | | | 17,708 | * |
AngioDynamics Inc. | | | 3,580 | | | | 29,571 | * |
Atrion Corp. | | | 60 | | | | 37,206 | |
Electromed Inc. | | | 1,189 | | | | 19,726 | * |
FONAR Corp. | | | 1,159 | | | | 28,535 | * |
Heska Corp. | | | 333 | | | | 32,041 | * |
Inogen Inc. | | | 945 | | | | 29,012 | * |
iRadimed Corp. | | | 880 | | | | 19,606 | * |
Lantheus Holdings Inc. | | | 2,365 | | | | 31,880 | * |
LeMaitre Vascular Inc. | | | 1,256 | | | | 36,838 | |
Meridian Bioscience Inc. | | | 2,577 | | | | 63,111 | * |
Merit Medical Systems Inc. | | | 1,065 | | | | 47,627 | * |
Mesa Laboratories Inc. | | | 145 | | | | 34,356 | |
Natus Medical Inc. | | | 1,672 | | | | 31,066 | * |
OraSure Technologies Inc. | | | 3,088 | | | | 56,047 | * |
Orthofix Medical Inc. | | | 1,019 | | | | 31,293 | * |
Repro-Med Systems Inc. | | | 1,284 | | | | 13,392 | * |
Surmodics Inc. | | | 602 | | | | 28,469 | * |
See Notes to Financial Statements.
| | |
| Legg Mason Small-Cap Quality Value ETF 2020 Annual Report | | 15 |
Schedule of investments (cont’d)
July 31, 2020
Legg Mason Small-Cap Quality Value ETF
| | | | | | | | |
| Security | | Shares | | | Value | |
Health Care Equipment & Supplies — continued | | | | | | | | |
Tactile Systems Technology Inc. | | | 561 | | | $ | 22,990 | * |
Utah Medical Products Inc. | | | 298 | | | | 24,287 | |
Varex Imaging Corp. | | | 3,468 | | | | 54,378 | * |
Total Health Care Equipment & Supplies | | | | | | | 689,139 | |
Health Care Providers & Services — 2.7% | | | | | | | | |
Magellan Health Inc. | | | 916 | | | | 67,940 | * |
MEDNAX Inc. | | | 3,441 | | | | 68,751 | * |
National HealthCare Corp. | | | 829 | | | | 49,176 | |
National Research Corp. | | | 728 | | | | 41,635 | |
RadNet Inc. | | | 2,363 | | | | 37,548 | * |
US Physical Therapy Inc. | | | 518 | | | | 43,025 | |
Total Health Care Providers & Services | | | | | | | 308,075 | |
Health Care Technology — 0.5% | | | | | | | | |
NextGen Healthcare Inc. | | | 3,554 | | | | 51,960 | * |
Pharmaceuticals — 3.3% | | | | | | | | |
ANI Pharmaceuticals Inc. | | | 1,036 | | | | 30,676 | * |
Assertio Holdings Inc. | | | 33,398 | | | | 30,078 | * |
Corcept Therapeutics Inc. | | | 2,901 | | | | 43,370 | * |
Innoviva Inc. | | | 3,536 | | | | 47,895 | * |
Opiant Pharmaceuticals Inc. | | | 1,999 | | | | 18,351 | * |
Osmotica Pharmaceuticals PLC | | | 5,012 | | | | 26,814 | * |
Pacira BioSciences Inc. | | | 800 | | | | 42,088 | * |
Phibro Animal Health Corp., Class A Shares | | | 1,722 | | | | 39,942 | |
Prestige Consumer Healthcare Inc. | | | 1,337 | | | | 49,723 | * |
Supernus Pharmaceuticals Inc. | | | 1,928 | | | | 42,927 | * |
Total Pharmaceuticals | | | | | | | 371,864 | |
Total Health Care | | | | | | | 1,814,216 | |
| Industrials — 15.5% | | | | | | | | |
Air Freight & Logistics — 1.1% | | | | | | | | |
Echo Global Logistics Inc. | | | 2,220 | | | | 55,644 | * |
Hub Group Inc. , Class A Shares | | | 1,233 | | | | 65,226 | * |
Total Air Freight & Logistics | | | | | | | 120,870 | |
Building Products — 1.9% | | | | | | | | |
Builders FirstSource Inc. | | | 3,121 | | | | 73,936 | * |
Insteel Industries Inc. | | | 1,927 | | | | 35,919 | |
Patrick Industries Inc. | | | 915 | | | | 58,514 | |
Quanex Building Products Corp. | | | 3,291 | | | | 46,239 | |
Total Building Products | | | | | | | 214,608 | |
Commercial Services & Supplies — 3.2% | | | | | | | | |
ACCO Brands Corp. | | | 8,047 | | | | 52,466 | |
See Notes to Financial Statements.
| | |
| 16 | | Legg Mason Small-Cap Quality Value ETF 2020 Annual Report |
Legg Mason Small-Cap Quality Value ETF
| | | | | | | | |
| Security | | Shares | | | Value | |
Commercial Services & Supplies — continued | | | | | | | | |
Deluxe Corp. | | | 2,162 | | | $ | 61,033 | |
Ennis Inc. | | | 2,507 | | | | 43,371 | |
Herman Miller Inc. | | | 2,408 | | | | 56,420 | |
HNI Corp. | | | 2,043 | | | | 60,677 | |
Kimball International Inc., Class B Shares | | | 3,451 | | | | 37,754 | |
Steelcase Inc., Class A Shares | | | 5,116 | | | | 54,895 | |
Total Commercial Services & Supplies | | | | | | | 366,616 | |
Construction & Engineering — 1.4% | | | | | | | | |
Arcosa Inc. | | | 1,390 | | | | 58,686 | |
Comfort Systems USA Inc. | | | 1,357 | | | | 67,457 | |
Great Lakes Dredge & Dock Corp. | | | 4,187 | | | | 35,003 | * |
Total Construction & Engineering | | | | | | | 161,146 | |
Electrical Equipment — 0.5% | | | | | | | | |
Orion Energy Systems Inc. | | | 5,226 | | | | 20,695 | * |
Powell Industries Inc. | | | 1,429 | | | | 37,940 | |
Total Electrical Equipment | | | | | | | 58,635 | |
Machinery — 2.6% | | | | | | | | |
Commercial Vehicle Group Inc. | | | 11,720 | | | | 27,425 | * |
Lydall Inc. | | | 2,318 | | | | 37,551 | * |
Manitowoc Co. Inc. | | | 3,868 | | | | 41,233 | * |
Meritor Inc. | | | 2,662 | | | | 60,560 | * |
Mueller Industries Inc. | | | 2,083 | | | | 58,241 | |
Navistar International Corp. | | | 2,334 | | | | 74,758 | * |
Total Machinery | | | | | | | 299,768 | |
Professional Services — 2.9% | | | | | | | | |
Barrett Business Services Inc. | | | 844 | | | | 44,462 | |
Heidrick & Struggles International Inc. | | | 1,880 | | | | 38,032 | |
Kelly Services Inc., Class A Shares | | | 3,781 | | | | 55,997 | |
Kforce Inc. | | | 1,483 | | | | 42,770 | |
Korn Ferry | | | 1,908 | | | | 53,615 | |
Resources Connection Inc. | | | 3,732 | | | | 42,171 | |
TrueBlue Inc. | | | 3,054 | | | | 47,123 | * |
Total Professional Services | | | | | | | 324,170 | |
Road & Rail — 0.6% | | | | | | | | |
ArcBest Corp. | | | 2,279 | | | | 69,259 | |
Trading Companies & Distributors — 1.3% | | | | | | | | |
GMS Inc. | | | 2,369 | | | | 55,506 | * |
See Notes to Financial Statements.
| | |
| Legg Mason Small-Cap Quality Value ETF 2020 Annual Report | | 17 |
Schedule of investments (cont’d)
July 31, 2020
Legg Mason Small-Cap Quality Value ETF
| | | | | | | | |
| Security | | Shares | | | Value | |
Trading Companies & Distributors — continued | | | | | | | | |
MRC Global Inc. | | | 7,612 | | | $ | 45,291 | * |
NOW Inc. | | | 6,279 | | | | 49,479 | * |
Total Trading Companies & Distributors | | | | | | | 150,276 | |
Total Industrials | | | | | | | 1,765,348 | |
| Information Technology — 13.3% | | | | | | | | |
Communications Equipment — 1.6% | | | | | | | | |
Comtech Telecommunications Corp. | | | 2,536 | | | | 41,641 | |
NETGEAR Inc. | | | 1,661 | | | | 51,076 | * |
NetScout Systems Inc. | | | 2,157 | | | | 54,917 | * |
PC-Tel Inc. | | | 4,153 | | | | 27,202 | * |
Total Communications Equipment | | | | | | | 174,836 | |
Electronic Equipment, Instruments & Components — 3.7% | | | | | | | | |
Bel Fuse Inc., Class B Shares | | | 2,697 | | | | 32,903 | |
PC Connection Inc. | | | 1,165 | | | | 50,911 | |
Plexus Corp. | | | 804 | | | | 59,729 | * |
Sanmina Corp. | | | 2,534 | | | | 75,209 | * |
ScanSource Inc. | | | 2,104 | | | | 48,287 | * |
TTM Technologies Inc. | | | 4,923 | | | | 60,602 | * |
Vishay Intertechnology Inc. | | | 3,856 | | | | 60,501 | |
Vishay Precision Group Inc. | | | 1,345 | | | | 34,230 | * |
Total Electronic Equipment, Instruments & Components | | | | | | | 422,372 | |
IT Services — 1.8% | | | | | | | | |
Cass Information Systems Inc. | | | 1,004 | | | | 35,973 | |
CSG Systems International Inc. | | | 1,140 | | | | 48,028 | |
Hackett Group Inc. | | | 2,675 | | | | 36,888 | |
NIC Inc. | | | 1,890 | | | | 41,429 | |
Sykes Enterprises | | | 1,697 | | | | 46,600 | * |
Total IT Services | | | | | | | 208,918 | |
Semiconductors & Semiconductor Equipment — 2.7% | | | | | | | | |
Diodes Inc. | | | 1,016 | | | | 52,273 | * |
NeoPhotonics Corp. | | | 3,041 | | | | 27,704 | * |
NVE Corp. | | | 584 | | | | 31,676 | |
Photronics Inc. | | | 3,394 | | | | 40,321 | * |
SMART Global Holdings Inc. | | | 1,508 | | | | 42,058 | * |
Synaptics Inc. | | | 772 | | | | 61,775 | * |
Ultra Clean Holdings Inc. | | | 1,814 | | | | 54,583 | * |
Total Semiconductors & Semiconductor Equipment | | | | | | | 310,390 | |
Software — 2.4% | | | | | | | | |
CommVault Systems Inc. | | | 1,096 | | | | 48,312 | * |
GlobalSCAPE Inc. | | | 3,891 | | | | 37,081 | |
See Notes to Financial Statements.
| | |
| 18 | | Legg Mason Small-Cap Quality Value ETF 2020 Annual Report |
Legg Mason Small-Cap Quality Value ETF
| | | | | | | | |
| Security | | Shares | | | Value | |
Software — continued | | | | | | | | |
Intelligent Systems Corp. | | | 548 | | | $ | 16,616 | * |
Issuer Direct Corp. | | | 1,653 | | | | 24,762 | * |
Progress Software Corp. | | | 1,264 | | | | 44,063 | |
Telenav Inc. | | | 5,072 | | | | 26,298 | * |
Xperi Holding Corp. | | | 4,205 | | | | 77,540 | |
Total Software | | | | | | | 274,672 | |
Technology Hardware, Storage & Peripherals — 1.1% | | | | | | | | |
NCR Corp. | | | 3,556 | | | | 65,537 | * |
Super Micro Computer Inc. | | | 2,008 | | | | 60,853 | * |
Total Technology Hardware, Storage & Peripherals | | | | | | | 126,390 | |
Total Information Technology | | | | | | | 1,517,578 | |
| Materials — 6.1% | | | | | | | | |
Chemicals — 1.6% | | | | | | | | |
Avient Corp. | | | 2,507 | | | | 59,918 | |
FutureFuel Corp. | | | 3,040 | | | | 40,067 | |
Kraton Corp. | | | 2,934 | | | | 38,582 | * |
Tredegar Corp. | | | 2,861 | | | | 45,433 | |
Total Chemicals | | | | | | | 184,000 | |
Containers & Packaging — 0.6% | | | | | | | | |
Myers Industries Inc. | | | 2,993 | | | | 45,075 | |
UFP Technologies Inc. | | | 667 | | | | 28,774 | * |
Total Containers & Packaging | | | | | | | 73,849 | |
Metals & Mining — 2.7% | | | | | | | | |
Commercial Metals Co. | | | 3,876 | | | | 80,156 | |
Materion Corp. | | | 843 | | | | 48,405 | |
Ryerson Holding Corp. | | | 8,524 | | | | 47,990 | * |
TimkenSteel Corp. | | | 9,472 | | | | 34,762 | * |
Warrior Met Coal Inc. | | | 5,699 | | | | 90,728 | |
Total Metals & Mining | | | | | | | 302,041 | |
Paper & Forest Products — 1.2% | | | | | | | | |
Boise Cascade Co. | | | 1,821 | | | | 84,840 | |
P.H. Glatfelter Co. | | | 2,903 | | | | 46,245 | |
Total Paper & Forest Products | | | | | | | 131,085 | |
Total Materials | | | | | | | 690,975 | |
| Real Estate — 0.3% | | | | | | | | |
Real Estate Management & Development — 0.3% | | | | | | | | |
Marcus & Millichap Inc. | | | 1,381 | | | | 37,618 | * |
See Notes to Financial Statements.
| | |
| Legg Mason Small-Cap Quality Value ETF 2020 Annual Report | | 19 |
Schedule of investments (cont’d)
July 31, 2020
Legg Mason Small-Cap Quality Value ETF
| | | | | | | | | | | | |
| Security | | | | | Shares | | | Value | |
| Utilities — 0.8% | | | | | | | | | | | | |
Electric Utilities — 0.7% | | | | | | | | | | | | |
Genie Energy Ltd., Class B Shares | | | | | | | 4,434 | | | $ | 36,048 | |
Spark Energy Inc., Class A Shares | | | | | | | 5,510 | | | | 41,601 | |
Total Electric Utilities | | | | | | | | | | | 77,649 | |
Water Utilities — 0.1% | | | | | | | | | | | | |
Pure Cycle Corp. | | | | | | | 2,018 | | | | 18,222 | * |
Total Utilities | | | | | | | | | | | 95,871 | |
Total Investments before Short-Term Investments (Cost — $11,936,989) | | | | | | | | 11,263,170 | |
| | | |
| | | Rate | | | | | | | |
| Short-Term Investments — 1.2% | | | | | | | | | | | | |
Dreyfus Treasury Cash Management, Institutional Class (Cost — $139,149) | | | 0.043 | % | | | 139,149 | | | | 139,149 | |
Total Investments — 100.0% (Cost — $12,076,138) | | | | | | | | | | | 11,402,319 | |
Liabilities in Excess of Other Assets — (0.0)%†† | | | | | | | | | | | (442 | ) |
Total Net Assets — 100.0% | | | | | | | | | | $ | 11,401,877 | |
| †† | Represents less than 0.1%. |
| * | Non-income producing security. |
See Notes to Financial Statements.
| | |
| 20 | | Legg Mason Small-Cap Quality Value ETF 2020 Annual Report |
Statement of assets and liabilities
July 31, 2020
| | | | |
| |
| Assets: | | | | |
Investments, at value (Cost — $12,076,138) | | $ | 11,402,319 | |
Dividends and interest receivable | | | 5,232 | |
Total Assets | | | 11,407,551 | |
| |
| Liabilities: | | | | |
Investment management fee payable | | | 5,674 | |
Total Liabilities | | | 5,674 | |
| Total Net Assets | | $ | 11,401,877 | |
| |
| Net Assets: | | | | |
Par value (Note 5) | | $ | 5 | |
Paid-in capital in excess of par value | | | 15,864,165 | |
Total distributable earnings (loss) | | | (4,462,293) | |
| Total Net Assets | | $ | 11,401,877 | |
| |
| Shares Outstanding | | | 500,000 | |
| |
| Net Asset Value | | | $22.80 | |
See Notes to Financial Statements.
| | |
| Legg Mason Small-Cap Quality Value ETF 2020 Annual Report | | 21 |
Statement of operations
For the Year Ended July 31, 2020
| | | | |
| |
| Investment Income: | | | | |
Dividends | | $ | 227,715 | |
Interest | | | 656 | |
Less: Foreign taxes withheld | | | (210) | |
Total Investment Income | | | 228,161 | |
| |
| Expenses: | | | | |
Investment management fee (Note 2) | | | 66,421 | |
Excise tax (Note 1) | | | 36 | |
Interest expense | | | 6 | |
Total Expenses | | | 66,463 | |
| Net Investment Income | | | 161,698 | |
| |
| Realized and Unrealized Loss on Investments (Notes 1 and 3): | | | | |
Net Realized Loss From Investment Transactions | | | (1,422,025) | |
Change in Net Unrealized Appreciation (Depreciation) From Investments | | | (256,013) | |
| Net Loss on Investments | | | (1,678,038) | |
| Decrease in Net Assets From Operations | | $ | (1,516,340) | |
See Notes to Financial Statements.
| | |
| 22 | | Legg Mason Small-Cap Quality Value ETF 2020 Annual Report |
Statements of changes in net assets
| | | | | | | | |
| For the Years Ended July 31, | | 2020 | | | 2019 | |
| | |
| Operations: | | | | | | | | |
Net investment income | | $ | 161,698 | | | $ | 93,987 | |
Net realized loss | | | (1,422,025) | | | | (595,750) | |
Change in net unrealized appreciation (depreciation) | | | (256,013) | | | | (440,527) | |
Decrease in Net Assets From Operations | | | (1,516,340) | | | | (942,290) | |
| | |
| Distributions to Shareholders From (Note 1): | | | | | | | | |
Total distributable earnings | | | (157,180) | | | | (115,500) | |
Decrease in Net Assets From Distributions to Shareholders | | | (157,180) | | | | (115,500) | |
| | |
| Fund Share Transactions (Note 5): | | | | | | | | |
Net proceeds from sale of shares (350,000 and 450,000 shares issued, respectively) | | | 9,197,480 | | | | 12,447,188 | |
Cost of shares repurchased (250,000 and 200,000 shares repurchased, respectively) | | | (6,605,552) | | | | (5,414,769) | |
Increase in Net Assets From Fund Share Transactions | | | 2,591,928 | | | | 7,032,419 | |
Increase in Net Assets | | | 918,408 | | | | 5,974,629 | |
| | |
| Net Assets: | | | | | | | | |
Beginning of year | | | 10,483,469 | | | | 4,508,840 | |
End of year | | $ | 11,401,877 | | | $ | 10,483,469 | |
See Notes to Financial Statements.
| | |
| Legg Mason Small-Cap Quality Value ETF 2020 Annual Report | | 23 |
Financial highlights
| | | | | | | | | | | | | | | | |
| For a share of beneficial interest outstanding throughout each year ended July 31, unless otherwise noted: | |
| | | 20201 | | | 20191 | | | 20181 | | | 20171,2 | |
| | | | |
| Net asset value, beginning of year | | | $26.21 | | | | $30.06 | | | | $24.95 | | | | $25.14 | |
| | | | |
| Income (loss) from operations: | | | | | | | | | | | | | | | | |
Net investment income (loss) | | | 0.35 | | | | 0.35 | | | | 0.31 | | | | (0.00) | 3 |
Net realized and unrealized gain (loss) | | | (3.42) | | | | (3.77) | | | | 4.91 | | | | (0.19) | |
Total income (loss) from operations | | | (3.07) | | | | (3.42) | | | | 5.22 | | | | (0.19) | |
| | | | |
| Less distributions from: | | | | | | | | | | | | | | | | |
Net investment income | | | (0.34) | | | | (0.43) | | | | (0.11) | | | | — | |
Total distributions | | | (0.34) | | | | (0.43) | | | | (0.11) | | | | — | |
| | | | |
| Net asset value, end of year | | | $22.80 | | | | $26.21 | | | | $30.06 | | | | $24.95 | |
Total return, based on NAV4 | | | (11.71) | % | | | (11.29) | % | | | 20.97 | % | | | (0.76) | % |
| | | | |
| Net assets, end of year (000s) | | | $11,402 | | | | $10,483 | | | | $4,509 | | | | $2,495 | |
| | | | |
| Ratios to average net assets: | | | | | | | | | | | | | | | | |
Gross expenses | | | 0.60 | % | | | 0.60 | % | | | 0.60 | % | | | 0.60 | %5 |
Net expenses | | | 0.60 | | | | 0.60 | | | | 0.60 | | | | 0.60 | 5 |
Net investment income (loss) | | | 1.46 | | | | 1.30 | | | | 1.12 | | | | (0.29) | 5 |
| | | | |
| Portfolio turnover rate6 | | | 95 | % | | | 87 | % | | | 80 | % | | | 0 | % |
| 1 | Per share amounts have been calculated using the average shares method. |
| 2 | For the period July 12, 2017 (inception date) to July 31, 2017. |
| 3 | Amount represents less than $0.005 per share. |
| 4 | Performance figures may reflect fee waivers and/or expense reimbursements. In the absence of fee waivers and/or expense reimbursements, the total return would have been lower. The total return calculation assumes that distributions are reinvested at NAV. Past performance is no guarantee of future results. Total returns for periods of less than one year are not annualized. |
| 6 | Portfolio turnover excludes the value of portfolio securities received or delivered as a result of in-kind fund share transactions. |
See Notes to Financial Statements.
| | |
| 24 | | Legg Mason Small-Cap Quality Value ETF 2020 Annual Report |
Notes to financial statements
1. Organization and significant accounting policies
Legg Mason Small-Cap Quality Value ETF (the “Fund”) is a separate diversified investment series of Legg Mason ETF Investment Trust (the “Trust”). The Trust, a Maryland statutory trust, is registered under the Investment Company Act of 1940, as amended (the “1940 Act”), as an open-end management investment company.
The Fund is an exchange-traded fund (“ETF”). ETFs are funds that trade like other publicly-traded securities. The Fund is designed to track an index. Similar to shares of an index mutual fund, each share of the Fund represents an ownership interest in an underlying portfolio of securities intended to track an index. Unlike shares of a mutual fund, which can be bought from and redeemed by the issuing fund by all shareholders at a price based on net asset value (“NAV”), shares of the Fund may be directly purchased from and redeemed by the Fund at NAV solely by certain large institutional investors who have entered into agreements with the Fund’s distributor (“Authorized Participants”). Also unlike shares of a mutual fund, shares of the Fund are listed on a national securities exchange and trade in the secondary market at market prices that change throughout the day.
Shares of the Fund are listed and traded at market prices on NASDAQ. The market price for the Fund’s shares may be different from the Fund’s NAV. The Fund issues and redeems shares at NAV only in blocks of a specified number of shares or multiples thereof (“Creation Units”). Only Authorized Participants may purchase or redeem Creation Units directly with the Fund at NAV. Creation Units are issued and redeemed principally in-kind (although under some circumstances its shares are created and redeemed partially for cash). Except when aggregated in Creation Units, shares of the Fund are not redeemable securities. Shareholders who are not Authorized Participants may not redeem shares directly from the Fund at NAV.
The Fund seeks to track the investment results of the Royce Small-Cap Quality Value Index (the “Underlying Index”). The Underlying Index utilizes a proprietary methodology created and sponsored by Royce & Associates, LP (“Royce”), the Fund’s subadviser.
The following are significant accounting policies consistently followed by the Fund and are in conformity with U.S. generally accepted accounting principles (“GAAP”). Estimates and assumptions are required to be made regarding assets, liabilities and changes in net assets resulting from operations when financial statements are prepared. Changes in the economic environment, financial markets and any other parameters used in determining these estimates could cause actual results to differ. Subsequent events have been evaluated through the date the financial statements were issued.
(a) Investment valuation. Equity securities for which market quotations are available are valued at the last reported sales price or official closing price on the primary market or exchange on which they trade. The valuations for fixed income securities (which may include, but are not limited to, corporate, government, municipal, mortgage-backed, collateralized mortgage obligations and asset-backed securities) and certain derivative instruments are typically the prices supplied by independent third party pricing services, which may use market prices or broker/dealer quotations or a variety of valuation
| | |
| Legg Mason Small-Cap Quality Value ETF 2020 Annual Report | | 25 |
Notes to financial statements (cont’d)
techniques and methodologies. The independent third party pricing services use inputs that are observable such as issuer details, interest rates, yield curves, prepayment speeds, credit risks/spreads, default rates and quoted prices for similar securities. Investments in open-end funds are valued at the closing net asset value per share of each fund on the day of valuation. When the Fund holds securities or other assets that are denominated in a foreign currency, the Fund will use the currency exchange rates, generally determined as of 4:00 p.m. (London Time). If independent third party pricing services are unable to supply prices for a portfolio investment, or if the prices supplied are deemed by the manager to be unreliable, the market price may be determined by the manager using quotations from one or more broker/dealers or at the transaction price if the security has recently been purchased and no value has yet been obtained from a pricing service or pricing broker. When reliable prices are not readily available, such as when the value of a security has been significantly affected by events after the close of the exchange or market on which the security is principally traded, but before the Fund calculates its net asset value, the Fund values these securities as determined in accordance with procedures approved by the Fund’s Board of Trustees.
The Board of Trustees is responsible for the valuation process and has delegated the supervision of the daily valuation process to the Legg Mason North Atlantic Fund Valuation Committee (the “Valuation Committee”). The Valuation Committee, pursuant to the policies adopted by the Board of Trustees, is responsible for making fair value determinations, evaluating the effectiveness of the Fund’s pricing policies, and reporting to the Board of Trustees. When determining the reliability of third party pricing information for investments owned by the Fund, the Valuation Committee, among other things, conducts due diligence reviews of pricing vendors, monitors the daily change in prices and reviews transactions among market participants.
The Valuation Committee will consider pricing methodologies it deems relevant and appropriate when making fair value determinations. Examples of possible methodologies include, but are not limited to, multiple of earnings; discount from market of a similar freely traded security; discounted cash-flow analysis; book value or a multiple thereof; risk premium/yield analysis; yield to maturity; and/or fundamental investment analysis. The Valuation Committee will also consider factors it deems relevant and appropriate in light of the facts and circumstances. Examples of possible factors include, but are not limited to, the type of security; the issuer’s financial statements; the purchase price of the security; the discount from market value of unrestricted securities of the same class at the time of purchase; analysts’ research and observations from financial institutions; information regarding any transactions or offers with respect to the security; the existence of merger proposals or tender offers affecting the security; the price and extent of public trading in similar securities of the issuer or comparable companies; and the existence of a shelf registration for restricted securities.
For each portfolio security that has been fair valued pursuant to the policies adopted by the Board of Trustees, the fair value price is compared against the last available and next available market quotations. The Valuation Committee reviews the results of such back testing monthly and fair valuation occurrences are reported to the Board of Trustees quarterly.
| | |
| 26 | | Legg Mason Small-Cap Quality Value ETF 2020 Annual Report |
The Fund uses valuation techniques to measure fair value that are consistent with the market approach and/or income approach, depending on the type of security and the particular circumstance. The market approach uses prices and other relevant information generated by market transactions involving identical or comparable securities. The income approach uses valuation techniques to discount estimated future cash flows to present value.
GAAP establishes a disclosure hierarchy that categorizes the inputs to valuation techniques used to value assets and liabilities at measurement date. These inputs are summarized in the three broad levels listed below:
| • | | Level 1 — quoted prices in active markets for identical investments |
| • | | Level 2 — other significant observable inputs (including quoted prices for similar investments, interest rates, prepayment speeds, credit risk, etc.) |
| • | | Level 3 — significant unobservable inputs (including the Fund’s own assumptions in determining the fair value of investments) |
The inputs or methodologies used to value securities are not necessarily an indication of the risk associated with investing in those securities.
The following is a summary of the inputs used in valuing the Fund’s assets carried at fair value:
| | | | | | | | | | | | | | | | |
| ASSETS | |
| | | | | | | | | Significant | | | | |
| | | | | | Other Significant | | | Unobservable | | | | |
| | | Quoted Prices | | | Observable Inputs | | | Inputs | | | | |
| Description | | (Level 1) | | | (Level 2) | | | (Level 3) | | | Total | |
| Common Stocks† | | $ | 11,263,170 | | | | — | | | | — | | | $ | 11,263,170 | |
| Short-Term Investments† | | | 139,149 | | | | — | | | | — | | | | 139,149 | |
| Total Investments | | $ | 11,402,319 | | | | — | | | | — | | | $ | 11,402,319 | |
| † | See Schedule of Investments for additional detailed categorizations. |
(b) Foreign investment risks. The Fund’s investments in foreign securities may involve risks not present in domestic investments. Since securities may be denominated in foreign currencies, may require settlement in foreign currencies or pay interest or dividends in foreign currencies, changes in the relationship of these foreign currencies to the U.S. dollar can significantly affect the value of the investments and earnings of the Fund. Foreign investments may also subject the Fund to foreign government exchange restrictions, expropriation, taxation or other political, social or economic developments, all of which affect the market and/or credit risk of the investments.
| | |
| Legg Mason Small-Cap Quality Value ETF 2020 Annual Report | | 27 |
Notes to financial statements (cont’d)
(c) Security transactions and investment income. Security transactions are accounted for on a trade date basis. Interest income (including interest income from payment-in-kind securities), adjusted for amortization of premium and accretion of discount, is recorded on the accrual basis. Dividend income is recorded on the ex-dividend date for dividends received in cash and/or securities. Foreign dividend income is recorded on the ex-dividend date or as soon as practicable after the Fund determines the existence of a dividend declaration after exercising reasonable due diligence. The cost of investments sold is determined by use of the specific identification method. To the extent any issuer defaults or a credit event occurs that impacts the issuer, the Fund may halt any additional interest income accruals and consider the realizability of interest accrued up to the date of default or credit event.
(d) Distributions to shareholders. Distributions from net investment income of the Fund, if any, are declared and paid on a quarterly basis. Distributions of net realized gains, if any, are declared at least annually. Distributions to shareholders of the Fund are recorded on the ex-dividend date and are determined in accordance with income tax regulations, which may differ from GAAP.
(e) Federal and other taxes. It is the Fund’s policy to comply with the federal income and excise tax requirements of the Internal Revenue Code of 1986 (the “Code”), as amended, applicable to regulated investment companies. Accordingly, the Fund intends to distribute its taxable income and net realized gains, if any, to shareholders in accordance with timing requirements imposed by the Code. Therefore, no federal or state income tax provision is required in the Fund’s financial statements.
However, due to the timing of when distributions are made by the Fund, the Fund may be subject to an excise tax of 4% of the amount by which 98% of the Fund’s annual taxable income and 98.2% of net realized gains exceed the distributions from such taxable income and realized gains for the calendar year. The Fund paid $36 of federal excise taxes attributable to calendar year 2019 in March 2020.
Management has analyzed the Fund’s tax positions taken on income tax returns for all open tax years and has concluded that as of July 31, 2020, no provision for income tax is required in the Fund’s financial statements. The Fund’s federal and state income and federal excise tax returns for tax years for which the applicable statutes of limitations have not expired are subject to examination by the Internal Revenue Service and state departments of revenue.
Under the applicable foreign tax laws, a withholding tax may be imposed on interest, dividends and capital gains at various rates.
(f) Reclassification. GAAP requires that certain components of net assets be reclassified to reflect permanent differences between financial and tax reporting. These
| | |
| 28 | | Legg Mason Small-Cap Quality Value ETF 2020 Annual Report |
reclassifications have no effect on net assets or net asset value per share. During the current year, the following reclassifications have been made:
| | | | | | | | |
| | | Total Distributable Earnings (Loss) | | | Paid-in Capital | |
| (a) | | $ | (1,059,470) | | | $ | 1,059,470 | |
| (a) | Reclassifications are due to book/tax differences in the treatment of an in-kind distribution of securities and a non-deductible excise tax paid by the Fund. |
2. Investment management agreement and other transactions with affiliates
Legg Mason Partners Fund Advisor, LLC (“LMPFA”) is the Fund’s investment manager and Royce & Associates, LP (“Royce”) is the Fund’s subadviser. Western Asset Management Company, LLC (“Western Asset”) manages the portion of the Fund’s cash and short-term instruments allocated to it. LMPFA and Western Asset were wholly-owned subsidiaries, and Royce was a majority-owned subsidiary, of Legg Mason, Inc. (“Legg Mason”). As of July 31, 2020, LMPFA, Western Asset, and Royce are subsidiaries of Franklin Resources, Inc. (“Franklin Resources”).
LMPFA provides administrative and certain oversight services to the Fund. LMPFA delegates to the subadviser the day-to-day portfolio management of the Fund. The Fund is responsible for paying interest expenses, taxes, brokerage expenses, future 12b-1 fees (if any), acquired fund fees and expenses, extraordinary expenses and the management fee payable to LMPFA under the investment management agreement. LMPFA has agreed to pay all of the Fund’s organization and offering costs.
Under the investment management agreement and subject to the general supervision of the Fund’s Board of Trustees, LMPFA provides or causes to be furnished all investment management, supervisory, administrative and other services reasonably necessary for the operation of the Fund, including certain distribution services (provided pursuant to a separate distribution agreement) and investment advisory services (provided pursuant to separate subadvisory agreements) under a unitary fee structure. The Fund pays an investment management fee, calculated daily and paid monthly, at an annual rate of 0.60% of the Fund’s average daily net assets.
As compensation for its subadvisory services, LMPFA pays Royce monthly 90% of the management fee paid by the Fund to LMPFA, net of (i) all fees and expenses incurred by LMPFA under the investment management agreement (including without limitation any subadvisory fee paid to another subadviser to the Fund) and (ii) expense waivers, if any, and reimbursements. LMPFA pays Western Asset monthly a fee of 0.02% of the portion of the Fund’s average daily net assets allocated to Western Asset for the management of cash and other short-term instruments, net of expense waivers, if any, and reimbursements.
Legg Mason Investor Services, LLC (“LMIS”), a wholly-owned broker-dealer subsidiary of Legg Mason, serves as the distributor of Creation Units for the Fund on an agency basis. As of July 31, 2020, LMIS is an indirect, wholly-owned broker-dealer subsidiary of Franklin Resources.
| | |
| Legg Mason Small-Cap Quality Value ETF 2020 Annual Report | | 29 |
Notes to financial statements (cont’d)
The Fund’s Board of Trustees has adopted a Rule 12b-1 shareholder services and distribution plan and under that plan, the Fund is authorized to pay service and/or distribution fees calculated at an annual rate of up to 0.25% of its average daily net assets. No service and/or distribution fees are currently paid by the Fund, and there are no current plans to impose these fees.
All officers and one Trustee of the Trust are employees of Legg Mason or its affiliates and do not receive compensation from the Trust.
3. Investments
During the year ended July 31, 2020, the aggregate cost of purchases and proceeds from sales of investments (excluding in-kind transactions and short-term investments) were as follows:
| | | | |
| Purchases | | $ | 10,392,041 | |
| Sales | | | 10,470,099 | |
During the year ended July 31, 2020, in-kind transactions (Note 5) were as follows:
| | | | |
| Contributions | | $ | 9,198,337 | |
| Redemptions | | | 6,583,856 | |
| Realized gain (loss)* | | | 1,398,346 | |
| * | Net realized gains on redemptions in-kind are not taxable to the remaining shareholders of the Fund. |
The in-kind contributions and in-kind redemptions shown in this table may not agree with the Fund Share Transactions on the Statement of Changes in Net Assets. This table represents the accumulation of the Fund’s daily net shareholder transactions while the Statement of Changes in Net Assets reflects gross shareholder transactions including any cash component of the transactions.
At July 31, 2020, the aggregate cost of investments and the aggregate gross unrealized appreciation and depreciation of investments for federal income tax purposes were as follows:
| | | | | | | | | | | | | | | | |
| | | Cost | | | Gross Unrealized Appreciation | | | Gross Unrealized Depreciation | | | Net Unrealized Depreciation | |
| Securities | | $ | 12,627,909 | | | $ | 1,057,903 | | | $ | (2,283,493) | | | $ | (1,225,590) | |
4. Derivative instruments and hedging activities
During the year ended July 31, 2020, the Fund did not invest in derivative instruments.
5. Fund share transactions
At July 31, 2020, the Trust had an unlimited number of shares of beneficial interest authorized with a par value of $0.00001 per share. Fund shares are issued and redeemed by the Fund only in Creation Units or Creation Unit aggregations, where 50,000 shares of the Fund constitute a Creation Unit. Such transactions are generally on an in-kind basis, with a separate cash payment, which is a balancing cash component to equate the transaction to
| | |
| 30 | | Legg Mason Small-Cap Quality Value ETF 2020 Annual Report |
the net asset value per share of the Fund on the transaction date. Transactions in capital shares of the Fund are disclosed in detail in the Statement of Changes in Net Assets. Authorized Participants are subject to standard creation and redemption transaction fees to offset transfer and other transaction costs associated with the issuance and redemption of Creation Units. Creations and redemptions for cash (when cash creations and redemptions are available or specified) may be subject to an additional variable fee.
6. Income tax information and distributions to shareholders
The tax character of distributions paid during the fiscal years ended July 31, was as follows:
| | | | | | | | |
| | | 2020 | | | 2019 | |
| Distributions paid from: | | | | | | | | |
| Ordinary income | | $ | 157,180 | | | $ | 115,500 | |
As of July 31, 2020, the components of total distributable earnings (loss) on a tax basis were as follows:
| | | | |
| Undistributed ordinary income — net | | $ | 5,061 | |
| Deferred capital losses* | | | (3,241,763) | |
| Unrealized appreciation (depreciation)(a) | | | (1,225,591) | |
| Total distributable earnings (loss) — net | | $ | (4,462,293) | |
| * | These capital losses have been deferred in the current year as either short-term or long-term losses. The losses will be deemed to occur on the first day of the next taxable year in the same character as they were originally deferred and will be available to offset future taxable capital gains. |
| (a) | The difference between book-basis and tax-basis unrealized appreciation (depreciation) is attributable to the tax deferral of losses on wash sales |
7. Other matters
The outbreak of the respiratory illness COVID-19 (commonly referred to as “coronavirus”) has continued to rapidly spread around the world, causing considerable uncertainty for the global economy and financial markets. The ultimate economic fallout from the pandemic, and the long-term impact on economies, markets, industries and individual issuers, are not known. The COVID-19 pandemic could adversely affect the value and liquidity of the Fund’s investments, impair the Fund’s ability to satisfy redemption requests, and negatively impact the Fund’s performance. In addition, the outbreak of COVID-19, and measures taken to mitigate its effects, could result in disruptions to the services provided to the Fund by its service providers.
| | |
| Legg Mason Small-Cap Quality Value ETF 2020 Annual Report | | 31 |
Report of independent registered public accounting firm
To the Board of Trustees of Legg Mason ETF Investment Trust and Shareholders of Legg Mason Small-Cap Quality Value ETF
Opinion on the Financial Statements
We have audited the accompanying statement of assets and liabilities, including the schedule of investments, of Legg Mason Small-Cap Quality Value ETF (one of the funds constituting Legg Mason ETF Investment Trust, referred to hereafter as the “Fund”) as of July 31, 2020, the related statement of operations for the year ended July 31, 2020, the statement of changes in net assets for each of the two years in the period ended July 31, 2020, including the related notes, and the financial highlights for each of the three years in the period ended July 31, 2020 (collectively referred to as the “financial statements”). In our opinion, the financial statements present fairly, in all material respects, the financial position of the Fund as of July 31, 2020, the results of its operations for the year then ended, the changes in its net assets for each of the two years in the period ended July 31, 2020 and the financial highlights for each of the three years in the period ended July 31, 2020 in conformity with accounting principles generally accepted in the United States of America.
The financial statements and financial highlights of the Fund as of July 31, 2017 and for the period July 12, 2017 (commencement of operations) through July 31, 2017 (not presented herein, other than the financial highlights) were audited by other auditors whose report dated September 18, 2017 expressed an unqualified opinion on those financial statements and financial highlights.
Basis for Opinion
These financial statements are the responsibility of the Fund’s management. Our responsibility is to express an opinion on the Fund’s financial statements based on our audits. We are a public accounting firm registered with the Public Company Accounting Oversight Board (United States) (PCAOB) and are required to be independent with respect to the Fund in accordance with the U.S. federal securities laws and the applicable rules and regulations of the Securities and Exchange Commission and the PCAOB.
We conducted our audits of these financial statements in accordance with the standards of the PCAOB. Those standards require that we plan and perform the audit to obtain reasonable assurance about whether the financial statements are free of material misstatement, whether due to error or fraud.
Our audits included performing procedures to assess the risks of material misstatement of the financial statements, whether due to error or fraud, and performing procedures that respond to those risks. Such procedures included examining, on a test basis, evidence regarding the amounts and disclosures in the financial statements. Our audits also included evaluating the accounting principles used and significant estimates made by management, as well as evaluating the overall presentation of the financial statements. Our procedures included confirmation of securities owned as of July 31, 2020 by correspondence with the custodian. We believe that our audits provide a reasonable basis for our opinion.
/s/PricewaterhouseCoopers LLP
Baltimore, Maryland
September 17, 2020
We have served as the auditor of one or more investment companies in the Franklin Templeton Group of Funds since 1948.
| | |
| 32 | | Legg Mason Small-Cap Quality Value ETF 2020 Annual Report |
Board approval of new management and new subadvisory agreements (unaudited)
Legg Mason ETF Investment Trust
— Legg Mason Small-Cap Quality Value ETF
At a meeting of the Trust’s Board of Trustees held on April 7, 2020, the Board, including a majority of the Trustees who are not “interested persons” (as defined in the Investment Company Act of 1940, as amended (the “Independent Trustees”)) of the Trust, approved new management and investment advisory agreements to take effect, subject to shareholder approval, upon the sale of Legg Mason, Inc. to Franklin Resources, Inc., a global investment management organization operating as Franklin Templeton.1 The agreements were a new management agreement pursuant to which Legg Mason Partners Fund Advisor, LLC (the “Manager”) provides the Fund with investment advisory and administrative services, a new sub-advisory agreement pursuant to which Royce & Associates, LP (“Royce”) provides day-to-day management of the Fund’s portfolio, and a new sub-advisory agreement pursuant to which Western Asset Management Company, LLC (“Western Asset” and, together with Royce, the “Subadvisers”) provides day-to-day management of the Fund’s cash and short-term instruments allocated to it by the Manager. (The new management agreement and the new sub-advisory agreements are collectively referred to as the “New Agreements.”) The prior management agreement and prior sub-advisory agreements are collectively referred to as the “Prior Agreements.” The New Agreements are identical to the Prior Agreements, except for the dates of execution, effectiveness and termination. The Board considered that the Prior Agreements were considered by the Board in the exercise of its business judgment as recently as at a meeting of the Trust’s Board of Trustees held in November 2019.
The sale of Legg Mason, Inc. to Franklin Resources, Inc. (referred to herein as the “Transaction”) was consummated on July 31, 2020. The Manager and Western Asset, each a wholly-owned subsidiary of Legg Mason, Inc., and Royce, a majority-owned subsidiary of Legg Mason, Inc., became subsidiaries of Franklin Templeton. The sale resulted in what is commonly called a “change of control” of Legg Mason and caused the Prior Agreements to terminate in accordance with applicable law.
The Board also approved an interim management agreement with the Manager and interim sub-advisory agreements between the Manager and the Subadvisers that would have taken effect in the event shareholders had not approved the New Agreements before the Transaction was completed to allow the Manager and the Subadvisers to continue providing services to the Fund while shareholder approval of the New Agreements continued to be sought. (The interim management agreement and interim sub-advisory agreements are collectively referred to as the “Interim Agreements.”) The terms of the Interim Agreements were identical to those of the Prior Agreements, except for the term and certain escrow provisions. At a meeting held on July 14, 2020, shareholders of the Fund approved the New Agreements.
| 1 | The meeting was held telephonically in reliance on an exemptive order issued by the Securities and Exchange Commission on March 25, 2020. Reliance on the exemptive order was necessary and appropriate due to circumstances related to the effects of COVID-19. All Trustees participating in the telephonic meeting were able to hear each other simultaneously during the meeting. Reliance on the exemptive order requires Trustees, including a majority of the Independent Trustees, to ratify actions taken pursuant to the exemptive order by vote cast at the next in-person meeting. |
| | |
| Legg Mason Small-Cap Quality Value ETF | | 33 |
Board approval of new management and new subadvisory agreements (unaudited) (cont’d)
At a telephonic meeting of the Trust’s Board of Trustees held on March 9, 2020, the Trustees discussed with Legg Mason management and certain Franklin Templeton representatives the Transaction and Franklin Templeton’s plans and intentions regarding the Legg Mason funds and Legg Mason’s asset management business, including the preservation and continued investment autonomy of the investment advisory businesses conducted by the Subadvisers and the combination of Legg Mason’s and Franklin Templeton’s distribution resources.
At the March and April meetings, the Independent Trustees considered, among other things, the anticipated impact of the Transaction on the Fund and its shareholders. To assist the Independent Trustees in their consideration of the New Agreements, Franklin Templeton provided materials and information about Franklin Templeton, including its financial condition and asset management capabilities and organization, Legg Mason provided materials and information about Legg Mason, including performance and expense comparison data and profitability information with respect to the Fund and the Legg Mason fund complex as a whole, and Franklin Templeton and Legg Mason provided materials and information about the proposed Transaction. The Independent Trustees were assisted in their review by Fund counsel and independent legal counsel and met with independent legal counsel in executive sessions separate from representatives of Franklin Templeton, Legg Mason, the Manager and the Subadvisers. The Independent Trustees requested and received information from Legg Mason and Franklin Templeton they deemed reasonably necessary for their review of the New Agreements. Included was information about the Transaction, distribution arrangements, Franklin Templeton’s business plan and other anticipated impacts of the Transaction on the Fund and its shareholders. This information was initially reviewed by a special committee of the Independent Trustees and then by the full Board. Following their review of this information, the Independent Trustees requested additional information from Franklin Templeton and Legg Mason. Franklin Templeton and Legg Mason provided further information in response to these requests, which the Board reviewed. Senior management representatives from Franklin Templeton and Legg Mason participated in portions of the meetings and addressed various questions raised by the Independent Trustees.
In voting to approve the New Agreements, the Independent Trustees considered whether the approval of the New Agreements would be in the best interests of the Fund and its shareholders. The Trustees’ evaluation of the New Agreements reflected the information provided specifically in connection with its review of the New Agreements, as well as, where relevant, information that was previously furnished to the Board in connection with the most recent renewal of the Prior Agreements at in-person meetings held in November 2019 and at other prior Board meetings.
| | |
| 34 | | Legg Mason Small-Cap Quality Value ETF |
Among other things, the Trustees considered:
| (i) | the reputation, experience, financial strength and resources of Franklin Templeton and its investment advisory subsidiaries; |
| (ii) | that Franklin Templeton informed the Board that it intends to maintain the investment autonomy of the Legg Mason investment advisory subsidiaries; |
| (iii) | that Franklin Templeton and Legg Mason informed the Board that, following the Transaction, there is not expected to be any diminution in the nature, quality and extent of services provided to the Fund and its shareholders by the Manager and Subadvisers, including compliance and other non-advisory services, and represented that there are not expected to be any changes in the portfolio management personnel managing the Fund as a result of the Transaction; |
| (iv) | that Franklin Templeton and Legg Mason informed the Board regarding initial transition plans and that they are instituting long-term retention arrangements for key personnel; |
| (v) | that Franklin Templeton informed the Board that there are not expected to be any changes to the brokerage practices and standards applied by the Subadvisers in seeking best execution; |
| (vi) | that there are not expected to be any changes to the Fund’s custodian or other service providers as a result of the Transaction; |
| (vii) | that Franklin Templeton informed the Board that it has no present intention to alter currently effective expense waivers and reimbursement arrangements after their expiration, and, while it reserves the right to do so in the future, it would consult with the Board before making any changes; |
| (viii) | that Franklin Templeton does not expect to propose any changes to the investment objective of the Fund or any changes to the principal investment strategies of the Fund as a result of the Transaction; |
| (ix) | the potential benefits to Fund shareholders from being part of a combined fund family with Franklin Templeton-sponsored funds and access to a broader array of investment opportunities; |
| (x) | that Franklin Templeton’s distribution capabilities, particularly with respect to retail investors, and significant network of intermediary relationships may provide additional opportunities for the Fund to grow assets and lower expenses by spreading expenses over a larger asset base; |
| | |
| Legg Mason Small-Cap Quality Value ETF | | 35 |
Board approval of new management and new subadvisory agreements (unaudited) (cont’d)
| (xi) | that Franklin Templeton and Legg Mason will each derive direct and ancillary benefits from the Transaction and that, as a result, they have a financial interest in the matters that were being considered; |
| (xii) | the fact that the Fund’s contractual management fee rate will remain the same and will not increase by virtue of the New Agreements; |
| (xiii) | the terms and conditions of the New Agreements, including that each New Agreement is identical to its corresponding Current Agreement except for their respective dates of execution, effectiveness and termination; |
| (xiv) | the support expressed by the current senior management team at Legg Mason for the Transaction and Legg Mason’s recommendation that the Board approve the New Agreements; |
| (xv) | that at the November 2019 meeting, the Board conducted a full review of the investment advisory and distribution arrangements for the Fund and approved the Prior Agreements in accordance with the provisions of the Investment Company Act of 1940, as amended. Without any one factor being dispositive, in approving the Prior Agreements, the Board determined, in the exercise of the Trustees’ business judgment, that: (a) overall, the Board was satisfied with the nature, extent and quality of services provided (and expected to be provided) under the respective Current Agreement by the Manager and Subadvisers and their affiliates; (b) the overall performance of the Fund was satisfactory and that management was committed to providing the resources necessary to assist the Fund’s portfolio managers; (c) the Fund’s management fees and cost structure are reasonable in light of the comparative performance and expense information and in relation to the services provided; (d) in light of the costs of providing investment management and other services to the Fund and the Manager’s and Subadvisers’ ongoing commitment to the Fund, the profits that Legg Mason and its affiliates received were considered to be not excessive; and (e) the ancillary benefits that the Manager and Subadvisers and their affiliates received were considered reasonable; |
| (xvi) | that the Prior Agreements were considered and approved as recently as November 2019; |
| (xvii) | that the Fund would not bear the costs of obtaining shareholder approval of the New Agreements, including proxy solicitation costs, legal fees and the costs of printing and mailing the proxy statement, regardless of whether the Transaction was consummated; and |
| (xviii) | that under the definitive agreement between Legg Mason and Franklin Templeton (the “Transaction Agreement”), Franklin Templeton has acknowledged that Legg Mason |
| | |
| 36 | | Legg Mason Small-Cap Quality Value ETF |
| | had entered into the Transaction Agreement in reliance upon the benefits and protections provided by Section 15(f) of the Investment Company Act of 1940, as amended, and that, in furtherance of the foregoing, Franklin Templeton agreed to use reasonable best efforts to conduct its business so that (a) for a period of not less than three years after the closing of the Transaction no more than 25% of the members of the Board shall be “interested persons” (as defined in the Investment Company Act of 1940, as amended) of any investment adviser for the Fund, and (b) for a period of not less than two years after the closing, neither Franklin Templeton nor any of its affiliates shall impose an “unfair burden” (within the meaning of the Investment Company Act of 1940, as amended, including any interpretations or no-action letters of the Securities and Exchange Commission) on any Fund as a result of the transactions contemplated by the Transaction Agreement or any express or implied terms, conditions or understandings applicable thereto. |
Certain of these considerations are discussed in more detail below.
In connection with the most recent approval or continuation of each Current Agreement, and in connection with their review of each New Agreement, the Trustees did not identify any particular factor that was all-important or controlling, and each Trustee may have attributed different weights to the various factors.
The discussion below covers both the advisory and the administrative functions rendered by the Manager for the Fund, both of which functions are encompassed by the New Management Agreement for the Fund, as well as the advisory functions rendered by the Subadvisers pursuant to the New Sub-advisory Agreements for the Fund. The Independent Trustees considered the New Management Agreement and the New Sub-advisory Agreements separately in the course of their review. In doing so, they considered the respective roles and compensation of the Manager and the Subadvisers in providing services to the Fund.
The Independent Trustees were advised by separate independent legal counsel throughout the process. Prior to voting, the Independent Trustees received a memorandum from their independent legal counsel discussing the legal standards for their consideration of the New Agreements for the Fund. The Independent Trustees discussed the Transaction and the proposed approval of the New Agreements for the Fund on multiple occasions with their independent legal counsel in private sessions at which no representatives of Franklin Templeton, Legg Mason, or the Manager or Subadvisers for the Fund were present.
Nature, Extent and Quality of the Services to be provided to the Fund under the New Management Agreement and New Sub-Advisory Agreements
The Board received and considered information regarding the nature, extent and quality of services provided to the Fund by the Manager and the Subadvisers under the Prior
| | |
| Legg Mason Small-Cap Quality Value ETF | | 37 |
Board approval of new management and new subadvisory agreements (unaudited) (cont’d)
Agreements. In evaluating the nature, extent and quality of the services expected to be provided to the Fund by the Manager and the Subadvisers under the New Management Agreement and New Sub-advisory Agreements, respectively, the Trustees considered, among other things, the expected impact, if any, of the Transaction on the operations, facilities, organization and personnel of the Manager and the Subadvisers, and that Franklin Templeton and Legg Mason have advised the Board that, following the Transaction, there is not expected to be any diminution in the nature, extent and quality of services provided to the Fund and its shareholders by the Manager and the Subadvisers, including compliance and other non-advisory services, and that there are not expected to be any changes in portfolio management personnel as a result of the Transaction. The Board considered information Franklin Templeton and Legg Mason provided regarding initial transition plans and the institution of long-term retention arrangements for key personnel. The Board considered that Franklin Templeton informed the Boards that there are not expected to be any changes to the brokerage practices and standards applied by the Subadvisers in seeking best execution. The Board also considered the reputation, experience, financial strength and resources of Franklin Templeton and its investment advisory subsidiaries, its business and operating structure, scale of operation, distribution capabilities, and leadership, as well as the combined financial resources of Legg Mason, Inc. and Franklin Templeton and the benefits to the Fund of being part of a larger combined organization with greater financial resources following the Transaction, particularly during periods of market disruptions and volatility.
The Board’s evaluation of the services provided by the Manager and the Subadvisers took into account the Board’s knowledge and familiarity gained as Trustees of funds in the Legg Mason fund complex, including the scope and quality of the investment management and other capabilities of the Manager and the Subadvisers and the quality of the Manager’s administrative and other services rendered to the Fund and its shareholders by the Manager, including services specific to the Fund’s operation as an exchange-traded fund. The Board observed that the scope of services provided by the Manager and the Subadvisers, and the undertakings required of the Manager and Subadvisers in connection with those services, including maintaining and monitoring their own and the Fund’s compliance programs, liquidity management programs and cybersecurity programs, had expanded over time as a result of regulatory, market and other developments. The Board received and reviewed on a regular basis information from the Manager and the Subadvisers regarding the Fund’s compliance policies and procedures established pursuant to Rule 38a-1 under the Investment Company Act of 1940, as amended, including those specific to the Fund’s operation as an exchange-traded fund, and took that information into account in its evaluation of the New Agreements. The Board also considered the risks associated with the Fund borne by the Manager and its affiliates (such as entrepreneurial, operational, reputational, litigation and regulatory risk), as well as the risk management processes of the Manager and Subadvisers.
| | |
| 38 | | Legg Mason Small-Cap Quality Value ETF |
The Board reviewed the qualifications, backgrounds and responsibilities of the Fund’s senior personnel and the portfolio management team primarily responsible for the day-to-day portfolio management of the Fund. The Board also considered the policies and practices of the Manager and the Subadvisers regarding the selection of brokers and dealers and the execution of portfolio transactions for the Fund (including policies and practices regarding soft dollars and brokerage allocation), and Franklin Templeton’s representations that the brokerage practices and standards applied by the Manager and Subadvisers in seeking best execution will continue.
Fund Performance
The Board received and reviewed performance information for the Fund and for a group of institutional small-cap core funds (the “Performance Group”) selected by Broadridge Financial Solutions Inc. (“Broadridge”), an independent provider of investment company data based on classifications provided by Thomson Reuters Lipper. The Board was provided with a description of the methodology Broadridge used to determine the similarity of the Fund with the funds included in the Performance Group. It was noted that, while the Board has found the Broadridge data generally useful, the Trustees recognized the limitations of such data, including that the data may vary depending on the end date selected and that the results of the performance comparisons may vary depending on the selection of the peer group and its composition over time. In addition, the Trustees noted the limited period and number of comparable exchange-traded funds for which performance data was available. The Trustees also noted that they also had received and discussed with management at periodic intervals information on the investment performance of the Fund in comparison to similar exchange-traded funds and benchmark performance indices, including the Royce Small-Cap Quality Value Index, the Fund’s underlying index. In addition, the Board considered the Fund’s performance in light of overall financial market conditions.
The information comparing the Fund’s performance to that of the Performance Group was for the one-year period ended December 31, 2019 and the period since the Fund’s inception (July 12, 2017) through December 31, 2019. The Fund performed below the median performance of the funds in the Performance Group for each period. The Board also reviewed performance information provided by the Manager for periods ended February 29, 2020 and March 31, 2020. The Trustees noted that the Fund generally performed in line with its underlying index during the periods under review.
* * * * * *
Based on their review of the materials provided and the assurances they had received from Franklin Templeton and Legg Mason, Inc., the Trustees determined that the Transaction was
| | |
| Legg Mason Small-Cap Quality Value ETF | | 39 |
Board approval of new management and new subadvisory agreements (unaudited) (cont’d)
not expected to affect adversely the nature, extent and quality of services provided by the Manager and the Subadvisers and that the Transaction was not expected to have an adverse effect on the ability of the Manager and the Subadvisers to provide those services, and the Board concluded that, overall, the nature, extent and quality of services, including portfolio management, expected to be provided under the New Agreements for the Fund were sufficient and supported a decision to approve each New Agreement.
Management Fees and Expense Ratios
The Board considered that it had reviewed the Fund’s management fee and total expense ratio in connection with the November 2019 contract renewal meeting. The Board noted that the New Agreements do not change the Fund’s management fee rate or the computation method for calculating such fee.
The Board reviewed and considered the contractual management fee rate (the “Actual Management Fee”) paid by the Fund to the Manager over the Fund’s last fiscal year in light of the nature, extent and quality of the management and sub-advisory services provided and expected to be provided by the Manager and the Subadvisers, respectively. The Board noted that the Manager, and not the Fund, pays the sub-advisory fees to the Subadvisers. The Board also noted that the Manager pays all fund expenses, other than the Actual Management Fee and certain other expenses. Because of the Fund’s “unitary fee” structure, the Board recognized that the Fund’s fees and expenses will vary within a much smaller range and the Manager will bear the risk that Fund expenses may increase over time. On the other hand, the Board noted that it is possible that the Manager could earn a profit on the fees charged under the Management Agreement and would benefit from any price decreases in third-party services covered by the Management Agreement. The Board also considered the management fee, the fees of each Subadviser and the portion of the management fee retained by the Manager after payment of the subadvisory fees, in each case in light of the services rendered for those amounts.
The Board reviewed information regarding the scope of services provided to the Fund by the Manager and its affiliates, noting that the Fund is provided with regulatory compliance and administrative services, office facilities and Fund officers (including the Fund’s chief financial, chief legal and chief compliance officers), and that the Manager coordinates and oversees the provision of services to the Fund by other fund service providers, including the Subadvisers.
Additionally, the Board received and considered information comparing the Fund’s Actual Management Fee and the Fund’s overall expense ratio with those of the same group of 11 institutional small-cap core funds selected by Broadridge as the Performance Group for the Fund (the “Expense Group”), and the Fund’s overall expense ratio with a broader group of funds selected by Broadridge consisting of all institutional small-cap core funds (the “Expense Universe”). It was noted that while the Board found the Broadridge data generally
| | |
| 40 | | Legg Mason Small-Cap Quality Value ETF |
useful they recognized its limitations, including that the data may vary depending on the selection of the peer group. This information showed that the Fund’s Actual Management Fee was higher than the median of management fees paid by the funds in the Expense Group, and that the Fund’s total expense ratio was higher than the median of the total expense ratios of the funds in the Expense Group and the funds in the Expense Universe.
In evaluating the costs of the services to be provided by the Manager and the Subadvisers under the New Agreements, the Trustees considered, among other things, whether management fees would change as a result of the Transaction. Based on their review of the materials provided and the assurances they had received from Franklin Templeton and Legg Mason, the Trustees determined that the Transaction would not increase the total fees payable by the Fund for management services.
Manager Profitability and Economies of Scale
The Board received and considered a profitability analysis of the Manager and its affiliates in providing services to the Fund. The Board also received profitability information with respect to the Legg Mason fund complex as a whole. In addition, the Board received information with respect to the Manager’s allocation methodologies used in preparing this profitability data. It was noted that the allocation methodologies had been previously reviewed by an outside consultant. The profitability of the Manager and its affiliates was considered by the Board not excessive in light of the nature, extent and quality of the services provided to the Fund.
The Board also received and considered information regarding whether there have been economies of scale with respect to the management of the Fund as the Fund’s assets grow. The Board noted that the Fund’s Management Agreement did not provide for any breakpoints in the Fund’s Actual Management Fee to the extent the assets of the Fund increase. The Board further noted that should material economies of scale exist in the future, a breakpoint structure for the Fund may be appropriate, and that it would continue to monitor the sharing of economies of scale to determine the appropriateness of adding breakpoints in the future. The Board also noted that it appeared that the benefits of any economies of scale also would be appropriately shared with shareholders through increased investment in fund management and administration resources (e.g., enhanced cyber security oversight, enhanced risk management oversight, etc.).
The Trustees noted that Franklin Templeton and Legg Mason expected to realize cost savings from the Transaction based on synergies of operations, as well as to benefit from possible growth of the funds in the Legg Mason fund complex resulting from enhanced distribution capabilities. However, they noted that other factors could also affect profitability and potential economies of scale, and that it was not possible to predict with any degree of certainty how the Transaction would affect the profitability of the Manager and its affiliates in providing services to the Fund, nor to quantify any possible future economies of scale. The Trustees noted they will have the opportunity to periodically re-examine such profitability and any economies of scale going forward.
* * * * * *
| | |
| Legg Mason Small-Cap Quality Value ETF | | 41 |
Board approval of new management and new subadvisory agreements (unaudited) (cont’d)
Taking all of the above into consideration, the Board determined that the management fee was reasonable in light of the comparative performance and expense information and the nature, extent and quality of the services expected to be provided to the Fund under the New Agreements after the Transaction.
Other Benefits to the Manager
The Board considered other benefits received by the Manager and its affiliates, including the Subadvisers, as a result of their relationship with the Fund, including the opportunity to offer additional products and services to Fund shareholders. In light of the costs of providing investment management and other services to the Fund and the ongoing commitment of the Manager and the Subadvisers to the Fund, the Board considered that the ancillary benefits that the Manager, the Subadvisers and their affiliates receive were reasonable. In evaluating the fall-out benefits to be received by the Manager and the Subadvisers under the New Agreements, the Trustees considered whether the Transaction would have an impact on the fall-out benefits received by virtue of the Prior Agreements.
The Board also considered that Franklin Templeton may derive reputational and other benefits from its ability to use the Legg Mason investment affiliates’ names in connection with operating and marketing the Fund. The Board also considered that the Transaction, if completed, would significantly increase Franklin Templeton’s assets under management and expand Franklin Templeton’s investment capabilities. Such ancillary benefits were considered reasonable.
* * * * * *
After consideration of the factors described above as well as other factors, and in the exercise of their business judgment, the Trustees, including the Independent Trustees, concluded that the New Agreements for the Fund, including the fees payable thereunder, were fair and reasonable and that entering into the New Agreements for the Fund was in the best interests of the Fund’s shareholders, and they voted to approve the New Agreements and to recommend that shareholders approve the New Agreements.
| | |
| 42 | | Legg Mason Small-Cap Quality Value ETF |
Additional shareholder information (unaudited)
Results of special meeting of shareholders
On July 14, 2020 a special meeting of shareholders was held for the following purposes: 1) to approve a new management agreement between the Fund and its investment adviser; and 2) to approve a new subadvisory agreement with respect to each of the Fund’s subadvisers. The following table provides the number of votes cast for or against, as well as the number of abstentions and broker non-votes as to each matter voted on at the special meeting of shareholders. Each item voted on was approved.
| | | | | | | | | | | | | | | | |
| Item Voted On | | Voted For | | | Voted Against | | | Abstentions | | | Broker Non-Votes | |
| To Approve a New Management Agreement with Legg Mason Partners Fund Advisor, LLC | | | 6,790,655.533 | | | | 5,023.417 | | | | 85,146.924 | | | | 0 | |
| To Approve a New Subadvisory Agreement with Western Asset Management Company, LLC | | | 6,790,655.533 | | | | 5,023.417 | | | | 85,146.924 | | | | 0 | |
| To Approve a New Subadvisory Agreement with Royce & Associates, LP | | | 6,790,655.533 | | | | 5,023.417 | | | | 85,146.924 | | | | 0 | |
| | |
| Legg Mason Small-Cap Quality Value ETF | | 43 |
Additional information (unaudited)
Information about Trustees and Officers
The business and affairs of Legg Mason Small-Cap Quality Value ETF (the “Fund”) are conducted by management under the supervision and subject to the direction of its Board of Trustees. The business address of each Trustee is c/o Jane Trust, Legg Mason, 100 International Drive, 11th Floor, Baltimore, Maryland 21202. Information pertaining to the Trustees and officers of the Fund is set forth below.
The Statement of Additional Information includes additional information about Trustees and is available, without charge, upon request by calling the Fund at 1-877-721-1926.
| | |
| Independent Trustees† |
|
| Paul R. Ades |
| |
| Year of birth | | 1940 |
| Position(s) with Trust | | Trustee |
| Term of office1 and length of time served2 | | Since 1983 |
| Principal occupation(s) during the past five years | | Paul R. Ades, PLLC (law firm) (since 2000) |
| Number of funds in fund complex overseen by Trustee | | 49 |
| Other board memberships held by Trustee during the past five years | | None |
|
| Andrew L. Breech |
| |
| Year of birth | | 1952 |
| Position(s) with Trust | | Trustee |
| Term of office1 and length of time served2 | | Since 1991 |
| Principal occupation(s) during the past five years | | President, Dealer Operating Control Service, Inc. (automotive retail management) (since 1985) |
| Number of funds in fund complex overseen by Trustee | | 49 |
| Other board memberships held by Trustee during the past five years | | None |
|
| Dwight B. Crane |
| |
| Year of birth | | 1937 |
| Position(s) with Trust | | Trustee |
| Term of office1 and length of time served2 | | Since 1981 |
| Principal occupation(s) during the past five years | | Professor Emeritus, Harvard Business School (since 2007); formerly, Professor, Harvard Business School (1969 to 2007); Independent Consultant (since 1969) |
| Number of funds in fund complex overseen by Trustee | | 49 |
| Other board memberships held by Trustee during the past five years | | None |
| | |
| 44 | | Legg Mason Small-Cap Quality Value ETF |
| | |
| Independent Trustees† (cont’d) |
| |
| Althea L. Duersten | | |
| |
| Year of birth | | 1951 |
| Position(s) with Trust | | Trustee |
| Term of office1 and length of time served2 | | Since 2014 |
| Principal occupation(s) during the past five years | | Retired (since 2011); formerly, Chief Investment Officer, North America, JPMorgan Chase (investment bank) and member of JPMorgan Executive Committee (2007 to 2011) |
| Number of funds in fund complex overseen by Trustee | | 49 |
| Other board memberships held by Trustee during the past five years | | Non-Executive Director, Rokos Capital Management LLP (since 2019) |
| |
| Stephen R. Gross | | |
| |
| Year of birth | | 1947 |
| Position(s) with Trust | | Trustee |
| Term of office1 and length of time served2 | | Since 1986 |
| Principal occupation(s) during the past five years | | Chairman Emeritus (since 2011) and formerly, Chairman, HLB Gross Collins, P.C. (accounting and consulting firm) (1979 to 2011); Executive Director of Business Builders Team, LLC (since 2005); Principal, Gross Consulting Group, LLC (since 2011); CEO, Gross Capital Partners, LLC (since 2014); CEO, Trusted CFO Solutions, LLC (since 2011) |
| Number of funds in fund complex overseen by Trustee | | 49 |
| Other board memberships held by Trustee during the past five years | | None |
| |
| Susan M. Heilbron | | |
| |
| Year of birth | | 1945 |
| Position(s) with Trust | | Trustee |
| Term of office1 and length of time served2 | | Since 1991 |
| Principal occupation(s) during the past five years | | Retired; formerly, President, Lacey & Heilbron (communications consulting) (1990 to 2002); General Counsel and Executive Vice President, The Trump Organization (1986 to 1990); Senior Vice President, New York State Urban Development Corporation (1984 to 1986); Associate, Cravath, Swaine & Moore LLP (1980 to 1984) and (1977 to 1979) |
| Number of funds in fund complex overseen by Trustee | | 49 |
| Other board memberships held by Trustee during the past five years | | Formerly, Director, Lincoln Savings Bank, FSB (1991 to 1994); Director, Trump Shuttle, Inc. (air transportation) (1989 to 1990); Director, Alexander’s Inc. (department store) (1987 to 1990) |
| | |
| Legg Mason Small-Cap Quality Value ETF | | 45 |
Additional information (unaudited) (cont’d)
Information about Trustees and Officers
| | |
| Independent Trustees† (cont’d) |
| |
| Frank G. Hubbard | | |
| |
| Year of birth | | 1937 |
| Position(s) with Trust | | Trustee |
| Term of office1 and length of time served2 | | Since 1993 |
| Principal occupation(s) during the past five years | | President, Fealds, Inc. (business development) (since 2016); formerly, President, Avatar International Inc. (business development) (1998 to 2015) |
| Number of funds in fund complex overseen by Trustee | | 49 |
| Other board memberships held by Trustee during the past five years | | None |
| |
| Howard J. Johnson | | |
| |
| Year of birth | | 1938 |
| Position(s) with Trust | | Trustee and Chairman |
| Term of office1 and length of time served2 | | From 1981 to 1998 and since 2000 (Chairman since 2013) |
| Principal occupation(s) during the past five years | | Retired; formerly, Chief Executive Officer, Genesis Imaging LLC (technology company) (2003 to 2012) |
| Number of funds in fund complex overseen by Trustee | | 49 |
| Other board memberships held by Trustee during the past five years | | None |
| |
| Jerome H. Miller | | |
| |
| Year of birth | | 1938 |
| Position(s) with Trust | | Trustee |
| Term of office1 and length of time served2 | | Since 1995 |
| Principal occupation(s) during the past five years | | Retired; formerly, President, Shearson Lehman Asset Management (1991 to 1993), Vice Chairman, Shearson Lehman Hutton Inc. (1989 to 1992) and Senior Executive Vice President, E.F. Hutton Group Inc. (1986 to 1989) |
| Number of funds in fund complex overseen by Trustee | | 49 |
| Other board memberships held by Trustee during the past five years | | None |
| |
| Ken Miller | | |
| |
| Year of birth | | 1942 |
| Position(s) with Trust | | Trustee |
| Term of office1 and length of time served2 | | Since 1983 |
| Principal occupation(s) during the past five years | | Retired; formerly, President, Young Stuff Apparel Group, Inc. (apparel manufacturer), division of Li & Fung (1963 to 2012) |
| Number of funds in fund complex overseen by Trustee | | 49 |
| Other board memberships held by Trustee during the past five years | | None |
| | |
| 46 | | Legg Mason Small-Cap Quality Value ETF |
| | |
| Independent Trustees† (cont’d) | | |
| |
| Thomas F. Schlafly | | |
| Year of birth | | 1948 |
| Position(s) with Trust | | Trustee |
| Term of office1 and length of time served2 | | Since 1983 |
| Principal occupation(s) during the past five years | | Chairman, The Saint Louis Brewery, LLC (brewery) (since 2012); formerly, President, The Saint Louis Brewery, Inc. (1989 to 2012); Senior Counsel (since 2017) and formerly, Partner (2009 to 2016), Thompson Coburn LLP (law firm) |
| Number of funds in fund complex overseen by Trustee | | 49 |
| Other board memberships held by Trustee during the past five years | | Director, Citizens National Bank of Greater St. Louis (since 2006) |
| | |
| Interested Trustee and Officer | | |
| |
| Jane Trust, CFA3 | | |
| Year of birth | | 1962 |
| Position(s) with Trust | | Trustee, President and Chief Executive Officer |
| Term of office1 and length of time served2 | | Since 2015 |
| Principal occupation(s) during the past five years | | Senior Vice President, Fund Board Management, Franklin Templeton (since 2020); Officer and/or Trustee/Director of 149 funds associated with Legg Mason Partners Fund Advisor, LLC (“LMPFA”) or its affiliates (since 2015); President and Chief Executive Officer of LMPFA (since 2015); formerly, Senior Managing Director (2018 to 2020) and Managing Director (2016 to 2018) of Legg Mason & Co., LLC (“Legg Mason & Co.”); Senior Vice President of LMPFA (2015) |
| Number of funds in fund complex overseen by Trustee | | 148 |
| Other board memberships held by Trustee during the past five years | | None |
| | |
| Additional Officers | | |
|
Ted P. Becker Legg Mason 620 Eighth Avenue, 47th Floor, New York, NY 10018 |
| Year of birth | | 1951 |
| Position(s) with Trust | | Chief Compliance Officer |
| Term of office1 and length of time served2 | | Since 2007 |
| Principal occupation(s) during the past five years | | Vice President, Global Compliance of Franklin Templeton (since 2020); Chief Compliance Officer of LMPFA (since 2006); Chief Compliance Officer of certain funds associated with Legg Mason & Co. or its affiliates (since 2006); formerly, Director of Global Compliance at Legg Mason (2006 to 2020); Managing Director of Compliance of Legg Mason & Co. (2005 to 2020) |
| | |
| Legg Mason Small-Cap Quality Value ETF | | 47 |
Additional information (unaudited) (cont’d)
Information about Trustees and Officers
| | |
| Additional Officers (cont’d) | | |
| |
Susan Kerr Legg Mason 620 Eighth Avenue, 47th Floor, New York, NY 10018 | | |
| |
| Year of birth | | 1949 |
| |
| Position(s) with Trust | | Chief Anti-Money Laundering Compliance Officer |
| |
| Term of office1 and length of time served2 | | Since 2013 |
| Principal occupation(s) during the past five years | | Senior Compliance Analyst, Franklin Templeton (since 2020); Chief Anti-Money Laundering Compliance Officer of certain funds associated with Legg Mason & Co. or its affiliates (since 2013) and Anti-Money Laundering Compliance Officer (since 2012), Senior Compliance Officer (since 2011) and Assistant Vice President (since 2010) of Legg Mason Investors Services, LLC (“LMIS”); formerly, Assistant Vice President of Legg Mason & Co. (2010 to 2020) |
| |
Jenna Bailey Legg Mason 100 First Stamford Place, 5th Floor, Stamford, CT 06902 | | |
| |
| Year of birth | | 1978 |
| |
| Position(s) with Trust | | Identity Theft Prevention Officer |
| |
| Term of office1 and length of time served2 | | Since 2015 |
| Principal occupation(s) during the past five years | | Senior Compliance Analyst of Franklin Templeton (since 2020); Identity Theft Prevention Officer of certain funds associated with Legg Mason & Co. or its affiliates (since 2015); formerly, Compliance Officer of Legg Mason & Co. (2013 to 2020); Assistant Vice President of Legg Mason & Co. (2011 to 2020) |
| |
Marc A. De Oliveira* Legg Mason 100 First Stamford Place, 6th Floor, Stamford, CT 06902 | | |
| |
| Year of birth | | 1971 |
| |
| Position(s) with Trust | | Secretary and Chief Legal Officer |
| |
| Term of office1 and length of time served2 | | Since 2020 |
| Principal occupation(s) during the past five years | | Associate General Counsel of Franklin Templeton (since 2020); Assistant Secretary of certain funds associated with Legg Mason & Co. or its affiliates (since 2006); formerly, Managing Director (2016 to 2020) and Associate General Counsel of Legg Mason & Co. (2005 to 2020) |
| | |
| 48 | | Legg Mason Small-Cap Quality Value ETF |
| | |
| Additional Officers (cont’d) |
| | |
|
Thomas C. Mandia Legg Mason 100 First Stamford Place, 6th Floor, Stamford, CT 06902 |
| |
| Year of birth | | 1962 |
| Position(s) with Trust | | Senior Vice President |
| Term of office1 and length of time served2 | | Since 2020 |
| Principal occupation(s) during the past five years | | Senior Associate General Counsel of Franklin Templeton (since 2020); Secretary of LMPFA (since 2006); Assistant Secretary of certain funds associated with Legg Mason & Co. or its affiliates (since 2006); Secretary of LM Asset Services, LLC (“LMAS”) (since 2002) and Legg Mason Fund Asset Management, Inc. (“LMFAM”) (since 2013) (formerly registered investment advisers); formerly, Managing Director and Deputy General Counsel of Legg Mason & Co. (2005 to 2020) |
|
Christopher Berarducci** Legg Mason 620 Eighth Avenue, 47th Floor, New York, NY 10018 |
| |
| Year of birth | | 1974 |
| Position(s) with Trust | | Treasurer and Principal Financial Officer |
| Term of office1 and length of time served2 | | Since 2014 and 2019 |
| Principal occupation(s) during the past five years | | Vice President, Fund Administration and Reporting, Franklin Templeton (since 2020); Treasurer (since 2010) and Principal Financial Officer (since 2019) of certain funds associated with Legg Mason & Co. or its affiliates; formerly, Managing Director (2020), Director (2015 to 2020), and Vice President (2011 to 2015) of Legg Mason & Co. |
|
Jeanne M. Kelly Legg Mason 620 Eighth Avenue, 47th Floor, New York, NY 10018 |
| |
| Year of birth | | 1951 |
| Position(s) with Trust | | Senior Vice President |
| Term of office1 and length of time served2 | | Since 2007 |
| Principal occupation(s) during the past five years | | U.S. Fund Board Team Manager, Franklin Templeton (since 2020); Senior Vice President of certain funds associated with Legg Mason & Co. or its affiliates (since 2007); Senior Vice President of LMPFA (since 2006); President and Chief Executive Officer of LMAS and LMFAM (since 2015); formerly, Managing Director of Legg Mason & Co. (2005 to 2020); Senior Vice President of LMFAM (2013 to 2015) |
| † | Trustees who are not “interested persons” of the Fund within the meaning of Section 2(a)(19) of the Investment Company Act of 1940, as amended (the “1940 Act”). |
| * | Effective August 6, 2020, Mr. De Oliveira became Secretary and Chief Legal Officer. |
| ** | Effective September 27, 2019, Mr. Berarducci became Treasurer and Principal Financial Officer. |
| 1 | Each Trustee and officer serves until his or her respective successor has been duly elected and qualified or until his or her earlier death, resignation, retirement or removal. |
| | |
| Legg Mason Small-Cap Quality Value ETF | | 49 |
Additional information (unaudited) (cont’d)
|
| Information about Trustees and Officers |
| 2 | Indicates the earliest year in which the Trustee became a board member for a fund in the Legg Mason fund complex or the officer took such office. |
| 3 | Ms. Trust is an “interested person” of the Fund, as defined in the 1940 Act, because of her position with LMPFA and/or certain of its affiliates. |
| | |
| 50 | | Legg Mason Small-Cap Quality Value ETF |
Important tax information (unaudited)
The following information is provided with respect to the distributions paid during the taxable year ended July 31, 2020:
| | | | | | | | | | | | | | | | |
| Record date: | | | 9/17/2019 | | | | 12/17/2019 | | | | 3/17/2020 | | | | 6/16/2020 | |
| Payable date: | | | 9/19/2019 | | | | 12/19/2019 | | | | 3/19/2020 | | | | 6/18/2020 | |
| Ordinary income: | | | | | | | | | | | | | | | | |
Qualified dividend income for individuals | | | 100.00 | % | | | 100.00 | % | | | 100.00 | % | | | 100.00 | % |
Dividends qualifying for the dividends | | | | | | | | | | | | | | | | |
received deduction for corporations | | | 100.00 | % | | | 100.00 | % | | | 100.00 | % | | | 100.00 | % |
Please retain this information for your records.
| | |
| Legg Mason Small-Cap Quality Value ETF | | 51 |
Legg Mason
Small-Cap Quality Value ETF
Trustees
Paul R. Ades
Andrew L. Breech
Dwight B. Crane
Althea L. Duersten
Stephen R. Gross
Susan M. Heilbron
Frank G. Hubbard
Howard J. Johnson
Chairman
Jerome H. Miller
Ken Miller
Thomas F. Schlafly
Jane Trust
Investment manager
Legg Mason Partners Fund Advisor, LLC
Subadviser
Royce & Associates, LP
Custodian
The Bank of New York Mellon
Transfer agent
The Bank of New York Mellon
240 Greenwich Street
New York, NY 10286
Independent registered public accounting firm
PricewaterhouseCoopers LLP
Baltimore, MD
Legg Mason Small-Cap Quality Value ETF
The Fund is a separate investment series of Legg Mason ETF Investment Trust, a Maryland statutory trust.
Legg Mason Small-Cap Quality Value ETF
Legg Mason Funds
620 Eighth Avenue, 47th Floor
New York, NY 10018
The Fund files its complete schedule of portfolio holdings with the Securities and Exchange Commission (“SEC”) for the first and third quarters of each fiscal year as an exhibit to its reports on Form N-PORT. The Fund’s Forms N-PORT are available on the SEC’s website at www.sec.gov. To obtain information on Form N-PORT, shareholders can call the Fund at 1-877-721-1926.
Information on how the Fund voted proxies relating to portfolio securities during the prior 12-month period ended June 30th of each year and a description of the policies and procedures that the Fund uses to determine how to vote proxies related to portfolio transactions are available (1) without charge, upon request, by calling the Fund at 1-877-721-1926, (2) at www.leggmason.com/etf and (3) on the SEC’s website at www.sec.gov.
This report is submitted for the general information of the shareholders of Legg Mason Small-Cap Quality Value ETF. This report is not authorized for distribution to prospective investors in the Fund unless preceded or accompanied by a current prospectus.
Investors should consider the Fund’s investment objectives, risks, charges and expenses carefully before investing. The prospectus contains this and other important information about the Fund. Please read the prospectus carefully before investing.
www.leggmason.com
© 2020 Legg Mason Investor Services, LLC
Member FINRA, SIPC
ETF Index Disclaimers
The Royce Small-Cap Quality Value Index (the “Underlying Index”) is created and sponsored by Royce & Associates, LP (“Royce”), the subadviser to Legg Mason Small-Cap Quality Value ETF (the “Fund”). Royce is an affiliated person of Legg Mason Partners Fund Advisor, LLC, the Fund’s manager and the Fund. The Underlying Index is the exclusive property of Royce. Legg Mason ETF Investment Trust has entered into a license agreement with Royce to use the Underlying Index at no charge. Royce has retained Solactive AG, an unaffiliated third party, to calculate the Underlying Index. Solactive AG publishes information regarding the market value of the Underlying Index.
The Fund is not sponsored, promoted, sold or supported in any other manner by Solactive AG nor does Solactive AG offer any express or implicit guarantee or assurance either with regard to the results of using the Underlying Index and/or Underlying Index trade marks or the Underlying Index Price at any time or in any other respect. The Underlying Index is calculated and published by Solactive AG. Solactive AG uses its best efforts to ensure that the Underlying Index is calculated correctly. Irrespective of its obligations towards the Fund, Solactive AG has no obligation to point out errors in the Underlying Index to third parties including but not limited to investors and/or financial intermediaries of the Fund. Neither publication of the Underlying Index by Solactive AG nor the licensing of the Underlying Index or Underlying Index trade marks for the purpose of use in connection with the Fund constitutes a recommendation by Solactive AG to invest capital in the Fund nor does it in any way represent an assurance or opinion of Solactive AG with regard to any investment in the Fund.
Royce does not guarantee the accuracy and/or the completeness of the Underlying Index or any data included therein, and Royce shall not have any liability for any errors, omissions or interruptions therein. Royce makes no warranty, express or implied, as to results to be obtained by the Fund, owners of the shares of the Fund or any other person or entity from the use of the Underlying Index or any data included therein, either in connection with the Fund or for any other use. Royce makes no express or implied warranties, and expressly disclaims all warranties of merchantability or fitness for a particular purpose or use with respect to the Underlying Index or any data included therein. Without limiting any of the foregoing, in no event shall Royce have any liability for any special, punitive, direct, indirect or consequential damages (including lost profits) arising out of matters relating to the use of the Underlying Index, even if notified of the possibility of such damages.
www.leggmason.com
© 2020 Legg Mason Investor Services, LLC Member FINRA, SIPC
ETFF399959 9/20 SR20-3967
The registrant has adopted a code of ethics that applies to the registrant’s principal executive officer, principal financial officer, principal accounting officer or controller.
| ITEM 3. | AUDIT COMMITTEE FINANCIAL EXPERT. |
The Board of Trustees of the registrant has determined that Dwight B. Crane possesses the technical attributes identified in Instruction 2(b) of Item 3 to Form N-CSR to qualify as an “audit committee financial expert,” and has designated Dwight B. Crane as the Audit Committee’s financial expert Dwight B. Crane is an “independent” Trustees pursuant to paragraph (a)(2) of Item 3 to Form N-CSR.
| ITEM 4. | PRINCIPAL ACCOUNTANT FEES AND SERVICES. |
a) Audit Fees. The aggregate fees billed in the last two fiscal years ending July 31, 2019 and July 31, 2020 (the “Reporting Periods”) for professional services rendered by the Registrant’s principal accountant (the “Auditor”) for the audit of the Registrant’s annual financial statements, or services that are normally provided by the Auditor in connection with the statutory and regulatory filings or engagements for the Reporting Periods, were $20,000 in July 31, 2019 and $45,000 in July 31, 2020.
b) Audit-Related Fees. The aggregate fees billed in the Reporting Period for assurance and related services by the Auditor that are reasonably related to the performance of the Registrant’s financial statements were $0 in July 31, 2019 and $0 in July 31, 2020.
(c) Tax Fees. The aggregate fees billed in the Reporting Periods for professional services rendered by the Auditor for tax compliance, tax advice and tax planning (“Tax Services”) were $0 in July 31, 2019 and $0 in July 31, 2020. These services consisted of (i) review or preparation of U.S. federal, state, local and excise tax returns; (ii) U.S. federal, state and local tax planning, advice and assistance regarding statutory, regulatory or administrative developments, and (iii) tax advice regarding tax qualification matters and/or treatment of various financial instruments held or proposed to be acquired or held.
There were no fees billed for tax services by the Auditors to service affiliates during the Reporting Periods that required pre-approval by the Audit Committee.
d) All Other Fees.
The aggregate fees billed in the Reporting Periods for products and services provided by the Auditor, other than the services reported in paragraphs (a) through (c) for the Item 4 for the Legg Mason ETF Investment Trust, were $0 in July 31, 2019 and $0 in July 31, 2020.
All Other Fees. There were no other non-audit services rendered by the Auditor to Legg Mason Partners Fund Advisors, LLC (“LMPFA”), and any entity controlling, controlled by or under common control with LMPFA that provided ongoing services to Legg Mason ETF Investment Trust requiring pre-approval by the Audit Committee in the Reporting Period.
(e) Audit Committee’s pre–approval policies and procedures described in paragraph (c) (7) of Rule 2-01 of Regulation S-X.
(1) The Charter for the Audit Committee (the “Committee”) of the Board of each registered investment company (the “Fund”) advised by LMPFA or one of their affiliates (each, an “Adviser”) requires that the Committee shall approve (a) all audit and permissible non-audit services to be provided to the Fund and (b) all permissible non-audit services to be provided by the Fund’s independent auditors to the Adviser and any Covered Service Providers if the engagement relates directly to the operations and financial reporting of the Fund. The Committee may implement policies and procedures by which such services are approved other than by the full Committee.
The Committee shall not approve non-audit services that the Committee believes may impair the independence of the auditors. As of the date of the approval of this Audit Committee Charter, permissible non-audit services include any professional services (including tax services), that are not prohibited services as described below, provided to the Fund by the independent auditors, other than those provided to the Fund in connection with an audit or a review of the financial statements of the Fund. Permissible non-audit services may not include: (i) bookkeeping or other services related to the accounting records or financial statements of the Fund; (ii) financial information systems design and implementation; (iii) appraisal or valuation services, fairness opinions or contribution-in-kind reports; (iv) actuarial services; (v) internal audit outsourcing services; (vi) management functions or human resources; (vii) broker or dealer, investment adviser or investment banking services; (viii) legal services and expert services unrelated to the audit; and (ix) any other service the Public Company Accounting Oversight Board determines, by regulation, is impermissible.
Pre-approval by the Committee of any permissible non-audit services is not required so long as: (i) the aggregate amount of all such permissible non-audit services provided to the Fund, the Adviser and any service providers controlling, controlled by or under common control with the Adviser that provide ongoing services to the Fund (“Covered Service Providers”) constitutes not more than 5% of the total amount of revenues paid to the independent auditors during the fiscal year in which the permissible non-audit services are provided to (a) the Fund, (b) the Adviser and (c) any entity controlling, controlled by or under common control with the Adviser that provides ongoing services to the Fund during the fiscal year in which the services are provided that would have to be approved by the Committee; (ii) the permissible non-audit services were not recognized by the Fund at the time of the engagement to be non-audit services; and (iii) such services are promptly brought to the attention of the Committee and approved by the Committee (or its delegate(s)) prior to the completion of the audit.
(2) For the Legg Mason ETF Investment Trust, the percentage of fees that were approved by the audit committee, with respect to: Audit-Related Fees were 100% and 100% for July 31, 2019 and July 31, 2020; Tax Fees were 100% and 100% for July 31, 2019 and July 31, 2020; and Other Fees were 100% and 100% for July 31, 2019 and July 31, 2020.
(f) N/A
(g) Non-audit fees billed by the Auditor for services rendered to Legg Mason ETF Investment Trust, LMPFA and any entity controlling, controlled by, or under common control with LMPFA that provides ongoing services to Legg Mason ETF Investment Trust during the reporting period were $463,523 in July 31, 2019 and $1,051,186 in July 31, 2020.
(h) Yes. Legg Mason ETF Investment Trust’s Audit Committee has considered whether the provision of non-audit services that were rendered to Service Affiliates, which were not pre-approved (not requiring pre-approval), is compatible with maintaining the Accountant’s independence. All services provided by the Auditor to the Legg Mason ETF Investment Trust or to Service Affiliates, which were required to be pre-approved, were pre-approved as required.
| ITEM 5. | AUDIT COMMITTEE OF LISTED REGISTRANTS. |
| | a) | The independent board members are acting as the registrant’s audit committee as specified in Section 3(a)(58)(B) of the Exchange Act. The Audit Committee consists of the following Board members: |
Paul R. Ades
Andrew L. Breech
Dwight B. Crane
Althea L. Duersten
Stephen R. Gross
Susan M. Heilborn
Frank G. Hubbard
Howard J. Johnson
Jerome H. Miller
Ken Miller
Thomas F. Schlafly
| ITEM 6. | SCHEDULE OF INVESTMENTS. |
Included herein under Item 1.
| ITEM 7. | DISCLOSURE OF PROXY VOTING POLICIES AND PROCEDURES FOR CLOSED-END MANAGEMENT INVESTMENT COMPANIES. |
Not applicable.
| ITEM 8. | PORTFOLIO MANAGERS OF CLOSED-END MANAGEMENT INVESTMENT COMPANIES. |
Not applicable.
| ITEM 9. | PURCHASES OF EQUITY SECURITIES BY CLOSED-END MANAGEMENT INVESTMENT COMPANY AND AFFILIATED PURCHASERS. |
Not applicable.
| ITEM 10. | SUBMISSION OF MATTERS TO A VOTE OF SECURITY HOLDERS. |
Not applicable.
| ITEM 11. | CONTROLS AND PROCEDURES. |
| | (a) | The registrant’s principal executive officer and principal financial officer have concluded that the registrant’s disclosure controls and procedures (as defined in Rule 30a- 3(c) under the Investment Company Act of 1940, as amended (the “1940 Act”)) are |
| | effective as of a date within 90 days of the filing date of this report that includes the disclosure required by this paragraph, based on their evaluation of the disclosure controls and procedures required by Rule 30a-3(b) under the 1940 Act and 15d-15(b) under the Securities Exchange Act of 1934. |
| | (b) | There were no changes in the registrant’s internal control over financial reporting (as defined in Rule 30a-3(d) under the 1940 Act) that occurred during the second fiscal quarter of the period covered by this report that have materially affected, or are likely to materially affect the registrant’s internal control over financial reporting. |
| ITEM 12. | DISCLOSURE OF SECURITIES LENDING ACTIVITIES FOR CLOSED-END MANAGEMENT INVESTMENT COMPANIES. |
Not applicable.
(a) (1) Code of Ethics attached hereto.
Exhibit 99.CODE ETH
(a) (2) Certifications pursuant to section 302 of the Sarbanes-Oxley Act of 2002 attached hereto.
Exhibit 99.CERT
(b) Certifications pursuant to Section 906 of the Sarbanes-Oxley Act of 2002 attached hereto.
Exhibit 99.906CERT
SIGNATURES
Pursuant to the requirements of the Securities Exchange Act of 1934 and the Investment Company Act of 1940, the registrant has duly caused this Report to be signed on its behalf by the undersigned, there unto duly authorized.
| | |
| Legg Mason ETF Investment Trust |
| |
| By: | | /s/ Jane Trust |
| | Jane Trust |
| | Chief Executive Officer |
| |
| Date: | | September 23, 2020 |
Pursuant to the requirements of the Securities Exchange Act of 1934 and the Investment Company Act of 1940, this report has been signed below by the following persons on behalf of the registrant and in the capacities and on the dates indicated.
| | |
| By: | | /s/ Jane Trust |
| | Jane Trust |
| | Chief Executive Officer |
| |
| Date: | | September 23, 2020 |
| |
| By: | | /s/ Christopher Berarducci |
| | Christopher Berarducci |
| | Principal Financial Officer |
| |
| Date: | | September 23, 2020 |