UNITED STATES
SECURITIES AND EXCHANGE COMMISSION
Washington, D.C. 20549
FORM N-CSR
CERTIFIED SHAREHOLDER REPORT OF REGISTERED
MANAGEMENT INVESTMENT COMPANIES
Investment Company Act file number 811-23096
Legg Mason ETF Investment Trust
(Exact name of registrant as specified in charter)
620 Eighth Avenue, 47th Floor, New York, NY 10018
(Address of principal executive offices) (Zip code)
Marc A. De Oliveira
Legg Mason & Co., LLC
100 First Stamford Place
Stamford, CT 06902
(Name and address of agent for service)
Registrant’s telephone number, including area code: 1-877-721-1926
Date of fiscal year end: October 31
Date of reporting period: October 31, 2020
| ITEM 1. | REPORT TO STOCKHOLDERS. |
The Annual Report to Stockholders is filed herewith.

| | |
| Annual Report | | October 31, 2020 |
LEGG MASON
INTERNATIONAL
LOW VOLATILITY
HIGH DIVIDEND ETF
LVHI
Beginning in or after April 2021, as permitted by regulations adopted by the Securities and Exchange Commission, the Fund intends to no longer mail paper copies of the Fund’s shareholder reports like this one, unless you specifically request paper copies of the reports from your financial intermediary (such as a broker-dealer or bank). Instead, the reports will be made available on a website, and you will be notified by mail each time a report is posted and provided with a website link to access the report.
If you already elected to receive shareholder reports electronically (“e-delivery”), you will not be affected by this change and you need not take any action. If you have not already elected e-delivery, you may elect to receive shareholder reports and other communications from the Fund electronically by contacting your financial intermediary.
You may elect to receive all future reports in paper free of charge by contacting your financial intermediary to request that you continue to receive paper copies of your shareholder reports. Your election to receive reports in paper will apply to all Legg Mason Funds held in your account with your financial intermediary.
|
| INVESTMENT PRODUCTS: NOT FDIC INSURED • NO BANK GUARANTEE • MAY LOSE VALUE |
Fund objective
The Fund seeks to track the investment results of an index composed of publicly traded equity securities of developed markets outside of the United States with relatively high yield and low price and earnings volatility while mitigating exposure to fluctuations between the values of the U.S. dollar and other international currencies.
Letter from the president

Dear Shareholder,
We are pleased to provide the annual report of Legg Mason International Low Volatility High Dividend ETF for the twelve-month reporting period ended October 31, 2020. Please read on for a detailed look at prevailing economic and market conditions during the Fund’s reporting period and to learn how those conditions have affected Fund performance.
Special shareholder notice
On July 31, 2020, Franklin Resources, Inc. (“Franklin Resources”) acquired Legg Mason, Inc. (“Legg Mason”) in an all-cash transaction. As a result of the transaction, Legg Mason Partners Fund Advisor, LLC (“LMPFA”) and the subadviser(s) became indirect, wholly-owned subsidiaries of Franklin Resources. Under the Investment Company Act of 1940, as amended, consummation of the transaction automatically terminated the management and subadvisory agreements that were in place for the Fund prior to the transaction. The Fund’s manager and subadviser(s) continue to provide uninterrupted services with respect to the Fund pursuant to new management and subadvisory agreements that were approved by Fund shareholders.
Franklin Resources, whose principal executive offices are at One Franklin Parkway, San Mateo, California 94403, is a global investment management organization operating, together with its subsidiaries, as Franklin Templeton. As of October 31, 2020, after giving effect to the transaction described above, Franklin Templeton’s asset management operations had aggregate assets under management of approximately $1.4 trillion.
| | |
| II | | Legg Mason International Low Volatility High Dividend ETF |
As always, we remain committed to providing you with excellent service and a full spectrum of investment choices. We also remain committed to supplementing the support you receive from your financial advisor. One way we accomplish this is through our website, www.leggmason.com. Here you can gain immediate access to market and investment information, including:
| • | | Fund net asset value and market price, |
| • | | Market insights and commentaries from our portfolio managers, and |
| • | | A host of educational resources. |
We look forward to helping you meet your financial goals.
Sincerely,

Jane Trust, CFA
President and Chief Executive Officer
November 30, 2020
| | |
| Legg Mason International Low Volatility High Dividend ETF | | III |
Fund overview
Q. What is the Fund’s investment strategy?
A. Legg Mason International Low Volatility High Dividend ETF (the “Fund”) seeks to track the investment results of the QS International Low Volatility High Dividend Hedged Index (the “Underlying Index”). The Underlying Index seeks to provide more stable income through investments in stocks of profitable companies in developed markets outside of the United States with relatively high dividend yields or anticipated dividend yields and lower price and earnings volatility, while mitigating exposure to exchange-rate fluctuations between the U.S. dollar and other international currencies. The Underlying Index is designed to have higher returns than an equivalent unhedged investment when the currencies in which its component securities are denominated are weakening relative to the U.S. dollar. Conversely, the Underlying Index is designed to have lower returns than an equivalent unhedged investment when the currencies in which its component securities are denominated are rising relative to the U.S. dollar. The Underlying Index is based on a proprietary methodology created and sponsored by QS Investors, LLC (“QS Investors”), the Fund’s subadviser.
The Fund will invest at least 80% of its net assets, plus borrowings for investment purposes, if any, in securities that compose its Underlying Index. Securities that compose the Underlying Index include depositary receipts representing securities in the Underlying Index.
The Underlying Index is composed of equity securities in developed markets outside of the United States across a range of market capitalizations that are included in the MSCI World ex-US IMI Local Indexi. The Underlying Index’s components are reconstituted annually and rebalanced quarterly. The Fund’s securities portfolio is rebalanced when the Underlying Index is rebalanced or reconstituted. The composition of the Underlying Index and the Fund after reconstitution and rebalancing may fluctuate and exceed the Underlying Index limitations due to market movements. The components of the Underlying Index, and the degree to which these components represent certain sectors and industries, may change over time.
The Fund may invest up to 20% of its net assets in foreign currency forward contracts and other currency hedging instruments, certain index futures, options, options on index futures, swap contracts or other derivatives related to its Underlying Index and its component securities; cash and cash equivalents; other investment companies, including exchange-traded funds; exchange-traded notes; and in securities and other instruments not included in its Underlying Index, but which QS Investors believes will help the Fund track its Underlying Index.
The Fund invests in currency hedging instruments to offset the Fund’s exposure to the currencies in which the Fund’s holdings are denominated. The Fund may also invest in equity index futures and currency derivatives to gain exposure to local markets or segments of local markets for cash flow management purposes and as a portfolio management technique.
| | |
| Legg Mason International Low Volatility High Dividend ETF 2020 Annual Report | | 1 |
Fund overview (cont’d)
Q. What were the overall market conditions during the Fund’s reporting period?
A. Outside the U.S., equity returns were mixed across regions and sectors and generally negative for the twelve-month reporting period ending October 31, 2020. Returns were volatile by quarter, as the spread of COVID-19 and the prospects for a vaccine dominated the narrative. Historical lows were reached in the first quarter of 2020, but equity markets recovered in the second quarter of 2020 into the summer, before declining again in the final months of the reporting period with a new virus surge. Japan and continental Europe were the best performers regionally, while the U.K. posted a double-digit negative return.
Equity markets, both U.S. and International, remained strong during the final two months of 2019. Despite concerns regarding the softening of global economic growth, trade-related tensions between the U.S. and China, frictions in the Middle East, and uncertainty around Brexit, investors continued to favor global equities. Progress on the U.S. and China “phase one” trade deal boosted risk-on sentiment across the globe, leading many risk assets like certain international equities to rally.
The rapid spread of COVID-19 across the globe in the first quarter of 2020 fueled investors’ “risk off” sentiment, amid mounting concerns regarding global economic growth and public health. Equity markets fell for three months in a row, and many regions saw their largest declines since 2008. Governments across the globe implemented policies geared to maintain liquidity and support economies, as employment and demand significantly slowed down. All regions saw double digit declines in their equity markets.
Positive investor sentiment returned in the second quarter of 2020, driven by slowing infection rates across international developed countries and plans to incrementally reopen major economies. Supportive policies from central banks to offset economic decline, including the purchase of government and corporate bonds and keeping interest rates low, were coupled with massive fiscal stimulus, such as unemployment benefits and direct payments to consumers. Most major regions, both developed and emerging, experienced double-digit equity gains. Positive results generally persisted through August 2020, driven by better-than-expected economic data and positive earnings surprises as well as prospects of a COVID-19 vaccine.
COVID-19 numbers began surging again in September 2020 in the UK and the European Union, causing equity markets to decline on concerns of new lockdowns. This decline persisted in the final month of the reporting period as infections rose.
After being the worst performing region in the last quarter of 2019, Japan was the best performing region in the MSCI EAFE Indexii for the reporting period. Japan’s first quarter 2020 equity market decline was one of the lowest; one of the first countries outside of China hit by the coronavirus, it was one of least affected among developed nations in the quarter. Limitations on social and business activities due to COVID-19 remained far less restrictive than those seen in Europe. Nevertheless, the Japanese government continued to step up its fiscal response to the crisis and drew up a second supplementary budget as
| | |
| 2 | | Legg Mason International Low Volatility High Dividend ETF 2020 Annual Report |
expected in May 2020, and the Bank of Japaniii announced additional monetary policy initiatives. Japan was also the best performing region in the third calendar quarter of 2020. In September 2020, it was the only large developed country with positive equity market returns, having a smooth leadership transition with expected continuation of fiscal and monetary stimulus policies, and while the return was negative for October 2020, Japan was the best performing major developed region.
Continental Europe equity markets generally outperformed the MSCI EAFE Index overall, despite a decline in the first quarter of 2020 when Germany was especially hard hit by the pandemic; Germany implemented among the strictest coronavirus mitigation measures early on, but as an exports-based economy, it was impacted by a perceived slowing of global demand. In the second quarter of 2020 as countries began to lift lockdown restrictions and the European Central Bankiv announced a doubling of its monetary stimulus program, Continental Europe equity markets generally outperformed the MSCI EAFE Index overall. In addition, a European Union recovery plan for citizens and businesses suffering from the economic downturn was announced; the European Commission agreed to raise 750 billion euros for pandemic recovery by selling bonds backed by all 27 members of the European Union. By September 2020, COVID-19 cases began to surge again, and in October 2020, the returns on Continental European stocks overall were in negative territory.
After being the best performing international region in the final quarter of 2019 on an improving Brexit outlook, the U.K. was the hardest hit at the start of 2020, being slow to embrace social distancing in the face of COVID-19. Relatively weak performance persisted for the remainder of the reporting period, and the region was the laggard in the MSCI EAFE Index for the reporting period. The final four months of the reporting period were especially challenging, with the resurgence of COVID-19 cases. Banks were especially hard hit throughout, being especially leveraged to the economy.
The Fund uses a passive investment approach to achieve its investment objective, and therefore made no change in investment approach in response to market conditions.
Performance review
For the twelve month period ended October 31, 2020, Legg Mason International Low Volatility High Dividend ETF generated a -17.20% return on a net asset value (“NAV”)v basis and -17.97% based on its market pricevi per share.
The performance table shows the Fund’s total return for the twelve months ended October 31, 2020 based on its NAV and market price as of October 31, 2020. The Fund seeks to track the investment results of the QS International Low Volatility High Dividend Hedged Index, which returned -16.95% for the same period. The Fund’s broad-based market index, the MSCI World ex-US IMI Local Index (Net), returned -8.64% over the same time frame. The Lipper International Multi-Cap Value Funds Category Averagevii returned -13.06% for the period. Please note that Lipper performance returns are based on each fund’s NAV.
| | |
| Legg Mason International Low Volatility High Dividend ETF 2020 Annual Report | | 3 |
Fund overview (cont’d)
| | | | | | | | |
Performance Snapshot as of October 31, 2020
(unaudited) | |
| | 6 months | | | 12 months | |
| Legg Mason International Low Volatility High Dividend ETF: | | | | | | | | |
$21.25 (NAV) | | | 0.73 | % | | | -17.20 | %*† |
$21.28 (Market Price) | | | 1.64 | % | | | -17.97 | %*‡ |
| QS International Low Volatility High Dividend Hedged Index | | | 0.87 | % | | | -16.95 | % |
| MSCI World ex-US IMI Local Index (Net) | | | 5.00 | % | | | -8.64 | % |
| Lipper International Multi-Cap Value Funds Category Average | | | 7.41 | % | | | -13.06 | % |
The performance shown represents past performance. Past performance is no guarantee of future results and current performance may be higher or lower than the performance shown above. Principal value and investment returns will fluctuate so shares, when sold, may be worth more or less than their original cost. Performance data current to the most recent month-end is available at www.leggmason.com/etf.
Investors buy and sell shares of an exchange-traded fund (“ETF”) at market price (not NAV) in the secondary market throughout the trading day. These shares are not individually available for direct purchase from or direct redemption to the ETF. Effective July 1, 2020, market price returns are typically based upon the official closing price of the Fund’s shares. Prior to July 1, 2020, market price returns generally were based upon the mid-point between the bid and ask on the Fund’s principal trading market when the Fund’s NAV was determined, which was typically 4:00 p.m. Eastern time (US). Market price performance reported for periods prior to July 1, 2020 continues to reflect market prices calculated based upon the mid-point between the bid and ask on the Fund’s principal trading market typically as of 4:00 p.m. Eastern time (US). These returns do not represent investors’ returns had they traded shares at other times. Performance figures for periods shorter than one year represent cumulative figures and are not annualized.
Information showing the Fund’s net asset value, market price, premiums and discounts, and bid-ask spreads for various time periods is available by visiting the Fund’s website at www.leggmason.com/etf.
As of the Fund’s current prospectus dated March 1, 2020, as revised July 1, 2020, the gross total annual fund operating expense ratio for the Fund was 0.40%.
* Total returns are based on changes in NAV or market price, respectively. Returns reflect the deduction of all Fund expenses. Returns do not reflect the deduction of brokerage commissions or taxes that investors pay on distributions or the sale of shares.
† Total return assumes the reinvestment of all distributions, at NAV.
‡ Total return assumes the reinvestment of all distributions, at market price, which typically is based upon the official closing price of the Fund’s shares.
Q. What were the leading contributors to performance?
A. Looking at the performance of the Underlying Index by country for the reporting period, the leading contributors were the Denmark, Sweden, and the Netherlands components, all with generally positive returns in a largely negative return environment. At the sector level, the Materials, Information Technology and Consumer Staples sectors fared best, although the latter two posted modestly negative returns.
| | |
| 4 | | Legg Mason International Low Volatility High Dividend ETF 2020 Annual Report |
Q. What were the leading detractors from performance?
A. The leading detractors in the Underlying Index at the country level were generally the U.K., Canada, and France components by virtue of their negative returns and weights in the Underlying Index. At the sector level, the Financials, Communication Services and Energy sectors were the among the hardest hit and were leading detractors by virtue of return and weight in the Underlying Index.
Looking for additional information?
The Fund’s daily NAV is available on-line at www.leggmason.com/etf. The Fund is traded under the symbol “LVHI” and its closing market price is available on most financial websites. In a continuing effort to provide information concerning the Fund, shareholders may call 1-877-721-1926 (toll free), Monday through Friday from 8:00 a.m. to 5:30 p.m. Eastern time, for the Fund’s current NAV, market price and other information
Thank you for your investment in Legg Mason International Low Volatility High Dividend ETF. As always, we appreciate that you have chosen us to manage your assets and we remain focused on achieving the Fund’s investment goals.
Sincerely,
Michael LaBella, CFA
Portfolio Manager
QS Investors, LLC

Russell Shtern, CFA
Portfolio Manager
QS Investors, LLC
November 16, 2020
RISKS: Equity securities are subject to market and price fluctuations. Dividends are not guaranteed, and a company may reduce or eliminate its dividend at any time. International investments are subject to special risks including currency fluctuations, social, economic, and political uncertainties, which could increase volatility. Currency investing contains heightened risks that include market, political, regulatory, and national conditions, and may not be suitable for all investors. In rising markets, the value of large-cap stocks may not rise as much as smaller-cap stocks. Small- and mid-cap stocks involve greater risks and volatility than large-cap stocks.
| | |
| Legg Mason International Low Volatility High Dividend ETF 2020 Annual Report | | 5 |
Fund overview (cont’d)
The Fund may focus its investments in certain industries, increasing its vulnerability to market volatility. There is no guarantee that the Fund will achieve a high degree of correlation to the index it seeks to track. The Fund does not seek to outperform the index it tracks and does not seek temporary defensive positions when markets decline or appear overvalued. Derivatives, such as options and futures, can be illiquid, may disproportionately increase losses and have a potentially large impact on Fund performance. Distributions are not guaranteed and are subject to change. Please see the Fund’s prospectus for a more complete discussion of these and other risks and the Fund’s investment strategies.
The mention of sector breakdowns is for informational purposes only and should not be construed as a recommendation to purchase or sell any securities. The information provided regarding such sectors is not a sufficient basis upon which to make an investment decision. Investors seeking financial advice regarding the appropriateness of investing in any securities or investment strategies discussed should consult their financial professional. The Fund’s top five sector holdings (as a percentage of net assets) as of October 31, 2020 were: Financials (22.8%), Communication Services (20.4%), Consumer Staples (15.7%), Utilities (12.9%) and Industrials (10.5%). The Fund’s composition may differ over time.
All investments are subject to risk including the possible loss of principal. Past performance is no guarantee of future results. An index is a statistical composite that tracks a specified financial market, sector or rules-based investment process. Unlike a fund, an index does not actually hold a portfolio of securities and therefore does not incur the expenses incurred by a fund. These expenses negatively impact fund performance. All index performance reflects no deduction for fees, expenses or taxes. Please note that an investor cannot invest directly in an index.
The information provided is not intended to be a forecast of future events, a guarantee of future results or investment advice. Views expressed may differ from those of the firm as a whole.
| i | MSCI World ex-US IMI Index captures large, mid and small cap representation across 22 of 23 Developed Markets (DM) countries — excluding the United States. The MSCI World ex-US IMI Local Index calculates performance utilizing local currencies taking out the effect of the converting to the U.S. dollar. |
| ii | The MSCI EAFE Index is a free float-adjusted market capitalization index designed to measure developed market equity performance, excluding the U.S. and Canada. |
| iii | The Bank of Japan is the central bank of Japan. The bank is responsible for issuing and handling currency and treasury securities, implementing monetary policy, maintaining the stability of the Japanese financial system and the yen currency. |
| iv | The European Central Bank (“ECB”) is responsible for the monetary system of the European Union and the euro currency. |
| v | Net Asset Value (NAV) is calculated by subtracting total liabilities from total assets and dividing the results by the number of shares outstanding. |
| vi | Market Price is determined by supply and demand. It is the price at which an investor purchases or sells shares of the Fund. The Market Price may differ from the Fund’s NAV. |
| vii | Lipper, Inc., a wholly-owned subsidiary of Reuters, provides independent insight on global collective investments. Returns are based on the period ended October 31, 2020, including the reinvestment of all distributions, including returns of capital, if any, calculated among the 234 funds for the six-month period and 227 funds for the twelve-month period in the Fund’s Lipper category. |
| | |
| 6 | | Legg Mason International Low Volatility High Dividend ETF 2020 Annual Report |
Fund at a glance† (unaudited)
Investment breakdown (%) as a percent of total investments
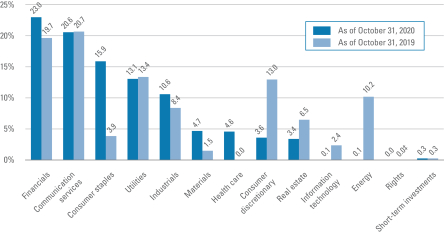
| † | The bar graph above represents the composition of the Fund’s investments as of October 31, 2020 and October 31, 2019 and does not include derivatives such as futures contracts and forward foreign currency contracts. The composition of the Fund’s investments is subject to change at any time. |
| ‡ | Represents less than 0.1%. |
| | |
| Legg Mason International Low Volatility High Dividend ETF 2020 Annual Report | | 7 |
Fund expenses (unaudited)
Example
As a shareholder of the Fund, you may incur two types of costs: (1) transaction costs, such as brokerage commissions paid on purchases and sales of Fund shares; and (2) ongoing costs, including management fees; and other Fund expenses. This example is intended to help you understand your ongoing costs (in dollars) of investing in the Fund and to compare these costs with the ongoing costs of investing in other funds.
This example is based on an investment of $1,000 invested on May 1, 2020 and held for the six months ended October 31, 2020.
Actual expenses
The table below titled “Based on Actual Total Return” provides information about actual account values and actual expenses. You may use the information provided in this table, together with the amount you invested, to estimate the expenses that you paid over the period. To estimate the expenses you paid on your account, divide your ending account value by $1,000 (for example, an $8,600 ending account value divided by $1,000 = 8.6), then multiply the result by the number under the heading entitled “Expenses Paid During the Period”.
Hypothetical example for comparison purposes
The table below titled “Based on Hypothetical Total Return” provides information about hypothetical account values and hypothetical expenses based on the actual expense ratio and an assumed rate of return of 5.00% per year before expenses, which is not the Fund’s actual return. The hypothetical account values and expenses may not be used to estimate the actual ending account balance or expenses you paid for the period. You may use the information provided in this table to compare the ongoing costs of investing in the Fund and other funds. To do so, compare the 5.00% hypothetical example relating to the Fund with the 5.00% hypothetical examples that appear in the shareholder reports of the other funds.
Please note that the expenses shown in the table below are meant to highlight your ongoing costs only and do not reflect any transactional costs, such as brokerage commissions paid on purchases and sales of Fund shares. Therefore, the table is useful in comparing ongoing costs only, and will not help you determine the relative total costs of owning different funds. In addition, if these transaction costs were included, your costs would have been higher.
| | | | | | | | | | | | | | | | | | | | | | | | | | | | | | | | | | | | | | | | | | | | | | | | | | |
| | | | |
| Based on actual total return1 | | | | | | Based on hypothetical total return1 | | |
Actual
Total
Return2 | | Beginning
Account
Value | | Ending
Account
Value | | Annualized
Expense
Ratio | | Expenses
Paid During
the Period3 | | | | Hypothetical
Annualized
Total Return | | Beginning
Account
Value | | Ending
Account
Value | | Annualized
Expense
Ratio | | Expenses
Paid During
the Period3 |
| | | 0.73% | | | | $ | 1,000.00 | | | | $ | 1,007.30 | | | | | 0.40 | % | | | $ | 2.02 | | | | | | | 5.00 | % | | | | $1,000.00 | | | | $ | 1,023.13 | | | | | 0.40 | % | | | $ | 2.03 | |
| 1 | For the six months ended October 31, 2020. |
| 2 | Assumes the reinvestment of all distributions, including returns of capital, if any, at net asset value. Total return is not annualized, as it may not be representative of the total return for the year. Performance figures may reflect fee waivers and/or expense reimbursements. In the absence of fee waivers and/or expense reimbursements, the total return would have been lower. Past performance is no guarantee of future results. |
| 3 | Expenses (net of fee waivers and/or expense reimbursements) are equal to the Fund’s annualized expense ratio multiplied by the average account value over the period, multiplied by the number of days in the most recent fiscal half-year (184), then divided by 366. |
| | |
| 8 | | Legg Mason International Low Volatility High Dividend ETF 2020 Annual Report |
Fund performance (unaudited)
| | | | |
| Net Asset Value | | | |
| Average annual total returns1 | | | |
| Twelve Months Ended 10/31/20 | | | -17.20 | % |
| Inception* through 10/31/20 | | | 1.75 | |
| Cumulative total returns1 | | | |
| Inception date of 7/27/16 through 10/31/20 | | | 7.70 | % |
| | | | |
| Market Price | | | |
| Average annual total returns2 | | | |
| Twelve Months Ended 10/31/20 | | | -17.97 | % |
| Inception* through 10/31/20 | | | 1.72 | |
| Cumulative total returns2 | | | |
| Inception date of 7/27/16 through 10/31/20 | | | 7.52 | % |
All figures represent past performance and are not a guarantee of future results. Investment returns and principal value of an investment will fluctuate so that an investor’s shares, when sold, may be worth more or less than their original cost. The returns shown do not reflect the deduction of brokerage commissions or taxes that investors would pay on distributions or the sale of shares. Performance figures may reflect fee waivers and/or expense reimbursements. In the absence of fee waivers and/or expense reimbursements, the total return would have been lower.
Investors buy and sell shares of the Fund at market price, not NAV, in the secondary market throughout the trading day. These shares are not individually available for direct purchase from or direct redemption to the Fund. The Fund’s per share NAV is the value of one share of the Fund and is calculated by dividing the value of total assets less total liabilities by the number of shares outstanding. The NAV return is based on the NAV of the Fund and effective July 1, 2020, market price returns typically will be based upon the official closing price of the Fund’s shares. Prior to July 1, 2020, market price returns generally were based upon the mid-point between the bid and ask on the Fund’s principal trading market when the Fund’s NAV was determined, which was typically 4:00 p.m. Eastern time (US). Market price performance reported for periods prior to July 1, 2020 will continue to reflect market prices calculated based upon the mid-point between the bid and ask on the Fund’s principal trading market typically as of 4:00 p.m. Eastern time (US). These returns do not represent investors’ returns had they traded shares at other times. NAV and market price returns assume that dividends and capital gain distributions have been reinvested in the Fund at NAV and market price, respectively. As with other exchange-traded funds, NAV returns and market price returns may differ because of factors such as the supply and demand for Fund shares and investors’ assessment of the underlying value of the Fund’s portfolio securities.
| 1 | Assumes the reinvestment of all distributions, including returns of capital, if any, at net asset value. |
| 2 | Assumes the reinvestment of all distributions, including returns of capital, if any, at market price. |
| * | Inception date of the Fund is July 27, 2016. |
| | |
| Legg Mason International Low Volatility High Dividend ETF 2020 Annual Report | | 9 |
Fund performance (unaudited) (cont’d)
Historical performance
Value of $10,000 invested in
Legg Mason International Low Volatility High Dividend ETF vs. QS International Low Volatility High Dividend Hedged Index and MSCI World ex-US IMI Local Index (Net)† — July 27, 2016 - October 31, 2020
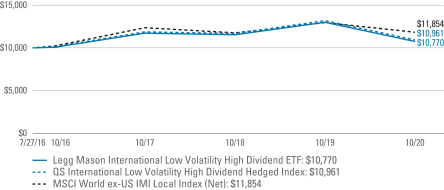
All figures represent past performance and are not a guarantee of future results. Investment returns and principal value of an investment will fluctuate so that an investor’s shares, when redeemed, may be worth more or less than their original cost. NAV returns assume that dividends and capital gain distributions have been reinvested in the Fund at NAV. The returns shown do not reflect the deduction of brokerage commissions or taxes that investors would pay on distributions or the sale of shares. Performance figures may reflect fee waivers and/or expense reimbursements. In the absence of fee waivers and/or expense reimbursements, the total return would have been lower.
| † | Hypothetical illustration of $10,000 invested Legg Mason International Low Volatility High Dividend ETF on July 27, 2016 (inception date), assuming the reinvestment of all distributions, including returns of capital, if any, at net asset value through October 31, 2020. The hypothetical illustration also assumes a $10,000 investment in the QS International Low Volatility High Dividend Hedged Index and MSCI World ex-US IMI Local Index (Net). The Fund’s per share NAV is the value of one share of the Fund and is calculated by dividing the value of total assets less total liabilities by the number of shares outstanding. The NAV return is based on the NAV of the Fund. The QS International Low Volatility High Dividend Hedged Index (the “Underlying Index”) is an index composed of publicly traded equity securities of developed markets outside of the United States with relatively high yield and low price and earnings volatility. The Underlying Index is based on a proprietary methodology created and sponsored by QS Investors, LLC, the Fund’s subadviser. The MSCI World ex-US IMI Local Index (Net) captures large-, mid- and small-cap representation across 22 of 23 developed markets. The local version of the index calculates performance utilizing local currencies taking out the effect of converting to the U.S. dollar. The indices are not subject to the same management and trading expenses as a fund. An index is a statistical composite that tracks a specified financial market, sector, or rules-based investment process. Unlike a fund, an index does not actually hold a portfolio of securities and therefore does not incur the expenses incurred by a fund. These expenses negatively impact fund performance. All index performance reflects no deduction for fees, expenses or taxes. Please note that an investor cannot invest directly in an index. |
| | |
| 10 | | Legg Mason International Low Volatility High Dividend ETF 2020 Annual Report |
Schedule of investments
October 31, 2020
Legg Mason International Low Volatility High Dividend ETF
| | | | | | | | | | | | | | | | |
| Security | | | | | | | | Shares | | | Value | |
| Common Stocks — 98.4% | | | | | | | | | | | | | | | | |
| Communication Services — 20.4% | | | | | | | | | | | | | | | | |
Diversified Telecommunication Services — 14.3% | | | | | | | | | | | | | | | | |
BCE Inc. | | | | | | | | | | | 35,077 | | | $ | 1,408,499 | |
CITIC Telecom International Holdings Ltd. | | | | | | | | | | | 104,220 | | | | 33,061 | |
Deutsche Telekom AG, Registered Shares | | | | | | | | | | | 85,389 | | | | 1,300,013 | |
Elisa oyj | | | | | | | | | | | 11,137 | | | | 547,977 | |
HKT Trust & HKT Ltd. | | | | | | | | | | | 235,525 | | | | 304,321 | |
Nippon Telegraph & Telephone Corp. | | | | | | | | | | | 16,100 | | | | 338,202 | |
Orange SA | | | | | | | | | | | 118,812 | | | | 1,332,774 | |
Proximus SADP | | | | | | | | | | | 13,662 | | | | 265,687 | |
Swisscom AG, Registered Shares | | | | | | | | | | | 2,583 | | | | 1,314,116 | |
TELUS Corp. | | | | | | | | | | | 47,207 | | | | 806,521 | |
Total Diversified Telecommunication Services | | | | | | | | | | | | | | | 7,651,171 | |
Media — 0.6% | | | | | | | | | | | | | | | | |
Eutelsat Communications SA | | | | | | | | | | | 26,210 | | | | 263,602 | |
Mediaset Espana Comunicacion SA | | | | | | | | | | | 11,546 | | | | 38,600 | * |
Total Media | | | | | | | | | | | | | | | 302,202 | |
Wireless Telecommunication Services — 5.5% | | | | | | | | | | | | | | | | |
NTT DOCOMO Inc. | | | | | | | | | | | 47,700 | | | | 1,773,579 | |
SoftBank Corp. | | | | | | | | | | | 100,100 | | | | 1,161,003 | |
StarHub Ltd. | | | | | | | | | | | 45,400 | | | | 38,900 | |
Total Wireless Telecommunication Services | | | | | | | | | | | | | | | 2,973,482 | |
Total Communication Services | | | | | | | | | | | | | | | 10,926,855 | |
| Consumer Discretionary — 3.3% | | | | | | | | | | | | | | | | |
Auto Components — 3.2% | | | | | | | | | | | | | | | | |
Bridgestone Corp. | | | | | | | | | | | 41,200 | | | | 1,336,025 | |
Xinyi Glass Holdings Ltd. | | | | | | | | | | | 176,123 | | | | 385,638 | |
Total Auto Components | | | | | | | | | | | | | | | 1,721,663 | |
Specialty Retail — 0.0%†† | | | | | | | | | | | | | | | | |
Mobilezone Holding AG, Registered Shares | | | | | | | | | | | 3,301 | | | | 30,937 | |
Textiles, Apparel & Luxury Goods — 0.1% | | | | | | | | | | | | | | | | |
Pacific Textiles Holdings Ltd. | | | | | | | | | | | 69,689 | | | | 39,541 | |
Total Consumer Discretionary | | | | | | | | | | | | | | | 1,792,141 | |
| Consumer Staples — 15.7% | | | | | | | | | | | | | | | | |
Food & Staples Retailing — 4.7% | | | | | | | | | | | | | | | | |
Koninklijke Ahold Delhaize NV | | | | | | | | | | | 45,557 | | | | 1,251,852 | |
Tesco PLC | | | | | | | | | | | 473,972 | | | | 1,259,399 | |
Total Food & Staples Retailing | | | | | | | | | | | | | | | 2,511,251 | |
See Notes to Financial Statements.
| | |
| Legg Mason International Low Volatility High Dividend ETF 2020 Annual Report | | 11 |
Schedule of investments (cont’d)
October 31, 2020
Legg Mason International Low Volatility High Dividend ETF
| | | | | | | | | | | | | | | | |
| Security | | | | | | | | Shares | | | Value | |
Food Products — 3.0% | | | | | | | | | | | | | | | | |
Danone SA | | | | | | | | | | | 5,167 | | | $ | 285,290 | |
Nestle SA, Registered Shares | | | | | | | | | | | 11,695 | | | | 1,315,536 | |
Total Food Products | | | | | | | | | | | | | | | 1,600,826 | |
Personal Products — 2.8% | | | | | | | | | | | | | | | | |
Unilever NV, CVA | | | | | | | | | | | 26,268 | | | | 1,485,547 | |
Tobacco — 5.2% | | | | | | | | | | | | | | | | |
British American Tobacco PLC | | | | | | | | | | | 42,070 | | | | 1,331,628 | |
Japan Tobacco Inc. | | | | | | | | | | | 74,800 | | | | 1,409,566 | |
Scandinavian Tobacco Group A/S | | | | | | | | | | | 5,161 | | | | 72,956 | |
Total Tobacco | | | | | | | | | | | | | | | 2,814,150 | |
Total Consumer Staples | | | | | | | | | | | | | | | 8,411,774 | |
| Energy — 0.1% | | | | | | | | | | | | | | | | |
Oil, Gas & Consumable Fuels — 0.1% | | | | | | | | | | | | | | | | |
Itochu Enex Co. Ltd. | | | | | | | | | | | 3,400 | | | | 31,775 | |
| Financials — 22.8% | | | | | | | | | | | | | | | | |
Banks — 14.1% | | | | | | | | | | | | | | | | |
Bank of Nova Scotia | | | | | | | | | | | 30,543 | | | | 1,267,900 | |
Banque Cantonale Vaudoise, Registered Shares | | | | | | | | | | | 2,821 | | | | 273,313 | |
BOC Hong Kong Holdings Ltd. | | | | | | | | | | | 332,098 | | | | 920,728 | |
Canadian Imperial Bank of Commerce | | | | | | | | | | | 19,261 | | | | 1,435,601 | |
Dah Sing Financial Holdings Ltd. | | | | | | | | | | | 13,600 | | | | 33,812 | |
DBS Group Holdings Ltd. | | | | | | | | | | | 93,100 | | | | 1,387,466 | |
Oversea-Chinese Banking Corp. Ltd. | | | | | | | | | | | 166,600 | | | | 1,027,295 | |
United Overseas Bank Ltd. | | | | | | | | | | | 83,100 | | | | 1,155,671 | |
Valiant Holding AG, Registered Shares | | | | | | | | | | | 545 | | | | 43,705 | |
Total Banks | | | | | | | | | | | | | | | 7,545,491 | |
Capital Markets — 0.4% | | | | | | | | | | | | | | | | |
IGM Financial Inc. | | | | | | | | | | | 5,222 | | | | 114,556 | |
Jupiter Fund Management PLC | | | | | | | | | | | 30,933 | | | | 92,872 | |
Total Capital Markets | | | | | | | | | | | | | | | 207,428 | |
Diversified Financial Services — 0.1% | | | | | | | | | | | | | | | | |
Banca Farmafactoring SpA | | | | | | | | | | | 9,440 | | | | 43,490 | * |
Insurance — 8.2% | | | | | | | | | | | | | | | | |
Admiral Group PLC | | | | | | | | | | | 23,676 | | | | 841,860 | |
Assicurazioni Generali SpA | | | | | | | | | | | 40,463 | | | | 542,505 | |
Hastings Group Holdings PLC | | | | | | | | | | | 23,387 | | | | 75,417 | |
Legal & General Group PLC | | | | | | | | | | | 287,275 | | | | 686,434 | |
MS&AD Insurance Group Holdings Inc. | | | | | | | | | | | 27,400 | | | | 745,545 | |
See Notes to Financial Statements.
| | |
| 12 | | Legg Mason International Low Volatility High Dividend ETF 2020 Annual Report |
Legg Mason International Low Volatility High Dividend ETF
| | | | | | | | | | | | | | | | |
| Security | | | | | | | | Shares | | | Value | |
Insurance — continued | | | | | | | | | | | | | | | | |
Power Corp. of Canada | | | | | | | | | | | 12,029 | | | $ | 228,879 | |
Zurich Insurance Group AG | | | | | | | | | | | 3,853 | | | | 1,277,958 | |
Total Insurance | | | | | | | | | | | | | | | 4,398,598 | |
Total Financials | | | | | | | | | | | | | | | 12,195,007 | |
| Health Care — 4.6% | | | | | | | | | | | | | | | | |
Pharmaceuticals — 4.6% | | | | | | | | | | | | | | | | |
GlaxoSmithKline PLC | | | | | | | | | | | 69,552 | | | | 1,161,726 | |
Novartis AG, Registered Shares | | | | | | | | | | | 16,521 | | | | 1,288,622 | |
Total Health Care | | | | | | | | | | | | | | | 2,450,348 | |
| Industrials — 10.5% | | | | | | | | | | | | | | | | |
Air Freight & Logistics — 0.2% | | | | | | | | | | | | | | | | |
Cia de Distribucion Integral Logista Holdings SA | | | | | | | | | | | 2,983 | | | | 50,314 | |
Oesterreichische Post AG | | | | | | | | | | | 2,424 | | | | 76,943 | |
Total Air Freight & Logistics | | | | | | | | | | | | | | | 127,257 | |
Commercial Services & Supplies — 0.4% | | | | | | | | | | | | | | | | |
Societe BIC SA | | | | | | | | | | | 3,961 | | | | 189,634 | |
Construction & Engineering — 2.1% | | | | | | | | | | | | | | | | |
ACS Actividades de Construccion y Servicios SA | | | | | | | | | | | 21,658 | | | | 514,658 | |
Bouygues SA | | | | | | | | | | | 19,419 | | | | 636,759 | |
Total Construction & Engineering | | | | | | | | | | | | | | | 1,151,417 | |
Industrial Conglomerates — 2.1% | | | | | | | | | | | | | | | | |
CK Hutchison Holdings Ltd. | | | | | | | | | | | 187,104 | | | | 1,126,747 | |
Marine — 1.7% | | | | | | | | | | | | | | | | |
Kuehne + Nagel International AG, Registered Shares | | | | | | | | | | | 4,453 | | | | 889,580 | |
Road & Rail — 1.2% | | | | | | | | | | | | | | | | |
Aurizon Holdings Ltd. | | | | | | | | | | | 237,665 | | | | 629,214 | |
Trading Companies & Distributors — 2.8% | | | | | | | | | | | | | | | | |
Mitsubishi Corp. | | | | | | | | | | | 64,900 | | | | 1,443,706 | |
Nippon Steel Trading Corp. | | | | | | | | | | | 1,300 | | | | 36,958 | |
Total Trading Companies & Distributors | | | | | | | | | | | | | | | 1,480,664 | |
Total Industrials | | | | | | | | | | | | | | | 5,594,513 | |
| Information Technology — 0.2% | | | | | | | | | | | | | | | | |
Communications Equipment — 0.2% | | | | | | | | | | | | | | | | |
VTech Holdings Ltd. | | | | | | | | | | | 12,062 | | | | 80,026 | |
| Materials — 4.6% | | | | | | | | | | | | | | | | |
Chemicals — 0.9% | | | | | | | | | | | | | | | | |
EMS-Chemie Holding AG, Registered Shares | | | | | | | | | | | 576 | | | | 506,526 | |
Metals & Mining — 2.2% | | | | | | | | | | | | | | | | |
BHP Group Ltd. | | | | | | | | | | | 50,335 | | | | 1,194,047 | |
See Notes to Financial Statements.
| | |
| Legg Mason International Low Volatility High Dividend ETF 2020 Annual Report | | 13 |
Schedule of investments (cont’d)
October 31, 2020
Legg Mason International Low Volatility High Dividend ETF
| | | | | | | | | | | | | | | | |
| Security | | | | | | | | Shares | | | Value | |
Paper & Forest Products — 1.5% | | | | | | | | | | | | | | | | |
UPM-Kymmene oyj | | | | | | | | | | | 27,522 | | | $ | 777,752 | |
Total Materials | | | | | | | | | | | | | | | 2,478,325 | |
| Real Estate — 3.3% | | | | | | | | | | | | | | | | |
Equity Real Estate Investment Trusts (REITs) — 2.4% | | | | | | | | | | | | | | | | |
AIMS APAC REIT | | | | | | | | | | | 36,200 | | | | 31,282 | |
Charter Hall Retail REIT | | | | | | | | | | | 20,527 | | | | 49,588 | |
Cromwell Property Group | | | | | | | | | | | 289,620 | | | | 177,963 | |
Daiwa House REIT Investment Corp. | | | | | | | | | | | 49 | | | | 113,383 | |
Frontier Real Estate Investment Corp. | | | | | | | | | | | 36 | | | | 120,356 | |
Hamborner REIT AG | | | | | | | | | | | 3,897 | | | | 36,374 | |
Kenedix Retail REIT Corp. | | | | | | | | | | | 44 | | | | 83,842 | |
Mapletree North Asia Commercial Trust | | | | | | | | | | | 84,700 | | | | 53,965 | |
RioCan Real Estate Investment Trust | | | | | | | | | | | 15,407 | | | | 166,162 | |
SmartCentres Real Estate Investment Trust | | | | | | | | | | | 22,831 | | | | 360,611 | |
Suntec Real Estate Investment Trust | | | | | | | | | | | 111,300 | | | | 109,222 | |
Total Equity Real Estate Investment Trusts (REITs) | | | | | | | | | | | | | | | 1,302,748 | |
Real Estate Management & Development — 0.9% | | | | | | | | | | | | | | | | |
Allreal Holding AG, Registered Shares | | | | | | | | | | | 410 | | | | 86,871 | |
Cibus Nordic Real Estate AB | | | | | | | | | | | 3,173 | | | | 55,110 | |
Henderson Land Development Co. Ltd. | | | | | | | | | | | 98,000 | | | | 346,893 | |
Total Real Estate Management & Development | | | | | | | | | | | | | | | 488,874 | |
Total Real Estate | | | | | | | | | | | | | | | 1,791,622 | |
| Utilities — 12.9% | | | | | | | | | | | | | | | | |
Electric Utilities — 5.0% | | | | | | | | | | | | | | | | |
CK Infrastructure Holdings Ltd. | | | | | | | | | | | 59,500 | | | | 280,051 | |
CLP Holdings Ltd. | | | | | | | | | | | 72,500 | | | | 666,583 | |
Fortum oyj | | | | | | | | | | | 37,835 | | | | 711,764 | |
Power Assets Holdings Ltd. | | | | | | | | | | | 78,377 | | | | 402,757 | |
Red Electrica Corp. SA | | | | | | | | | | | 35,676 | | | | 628,553 | |
Total Electric Utilities | | | | | | | | | | | | | | | 2,689,708 | |
Gas Utilities — 3.6% | | | | | | | | | | | | | | | | |
Enagas SA | | | | | | | | | | | 23,198 | | | | 500,721 | |
Naturgy Energy Group SA | | | | | | | | | | | 21,638 | | | | 402,020 | |
Snam SpA | | | | | | | | | | | 210,196 | | | | 1,025,909 | |
Total Gas Utilities | | | | | | | | | | | | | | | 1,928,650 | |
Multi-Utilities — 4.3% | | | | | | | | | | | | | | | | |
A2A SpA | | | | | | | | | | | 326,036 | | | | 414,533 | |
See Notes to Financial Statements.
| | |
| 14 | | Legg Mason International Low Volatility High Dividend ETF 2020 Annual Report |
Legg Mason International Low Volatility High Dividend ETF
| | | | | | | | | | | | | | | | |
| Security | | | | | | | | Shares | | | Value | |
Multi-Utilities — continued | | | | | | | | | | | | | | | | |
AGL Energy Ltd. | | | | | | | | | | | 69,380 | | | $ | 608,052 | |
E.ON SE | | | | | | | | | | | 123,723 | | | | 1,290,151 | |
Total Multi-Utilities | | | | | | | | | | | | | | | 2,312,736 | |
Total Utilities | | | | | | | | | | | | | | | 6,931,094 | |
Total Common Stocks (Cost — $58,771,651) | | | | | | | | | | | | | | | 52,683,480 | |
| | | | |
| | | Rate | | | | | | | | | | |
| Preferred Stocks — 0.2% | | | | | | | | | | | | | | | | |
| Consumer Discretionary — 0.2% | | | | | | | | | | | | | | | | |
Automobiles — 0.2% | | | | | | | | | | | | | | | | |
Bayerische Motoren Werke AG (Cost — $141,127) | | | — | | | | | | | | 1,990 | | | | 102,922 | |
Total Investments before Short-Term Investments (Cost — $58,912,778) | | | | | | | | 52,786,402 | |
| Short-Term Investments — 0.3% | | | | | | | | | | | | | | | | |
Invesco Treasury Portfolio, Institutional Class (Cost — $166,288) | | | 0.010 | % | | | | | | | 166,288 | | | | 166,288 | |
Total Investments — 98.9% (Cost — $59,079,066) | | | | | | | | | | | | | | | 52,952,690 | |
Other Assets in Excess of Liabilities — 1.1% | | | | | | | | | | | | | | | 599,741 | |
Total Net Assets — 100.0% | | | | | | | | | | | | | | $ | 53,552,431 | |
| †† | Represents less than 0.1%. |
| * | Non-income producing security. |
| | |
Abbreviation(s) used in this schedule: |
| |
| CVA | | — Certificaaten van aandelen (Share Certificates) |
| |
| REIT | | — Real Estate Investment Trust |
At October 31, 2020, the Fund had the following open futures contracts:
| | | | | | | | | | | | | | | | | | | | |
| | | Number of
Contracts | | | Expiration
Date | | | Notional
Amount | | | Market
Value | | | Unrealized
Depreciation | |
| Contracts to Buy: | | | | | | | | | | | | | | | | | | | | |
| MSCI EAFE Index Futures | | | 4 | | | | 12/20 | | | $ | 377,669 | | | $ | 356,780 | | | $ | (20,889) | |
At October 31, 2020, the Fund had the following open forward foreign currency contracts:
| | | | | | | | | | | | | | | | | | | | |
Currency
Purchased | | | Currency
Sold | | | Counterparty | | Settlement
Date | | | Unrealized
Appreciation
(Depreciation) | |
| USD | | | 7,418,495 | | | CHF | | | 6,803,331 | | | Bank of New York | | | 11/10/20 | | | $ | (6,400) | |
| USD | | | 15,928,371 | | | EUR | | | 13,550,421 | | | Bank of New York | | | 11/10/20 | | | | 140,699 | |
| USD | | | 8,777,155 | | | JPY | | | 930,384,576 | | | Bank of New York | | | 11/10/20 | | | | (123,669) | |
| USD | | | 2,937,546 | | | AUD | | | 4,104,030 | | | UBS Securities LLC | | | 11/10/20 | | | | 55,336 | |
| USD | | | 6,021,768 | | | CAD | | | 7,963,012 | | | UBS Securities LLC | | | 11/10/20 | | | | 49,405 | |
| USD | | | 5,807,899 | | | GBP | | | 4,491,805 | | | UBS Securities LLC | | | 11/10/20 | | | | (372) | |
See Notes to Financial Statements.
| | |
| Legg Mason International Low Volatility High Dividend ETF 2020 Annual Report | | 15 |
Schedule of investments (cont’d)
October 31, 2020
Legg Mason International Low Volatility High Dividend ETF
| | | | | | | | | | | | | | | | | | | | |
Currency
Purchased | | | Currency
Sold | | | Counterparty | | Settlement
Date | | | Unrealized
Appreciation
(Depreciation) | |
| USD | | | 4,706,418 | | | HKD | | | 36,481,918 | | | UBS Securities LLC | | | 11/10/20 | | | $ | 2,054 | |
| USD | | | 3,950,742 | | | SGD | | | 5,368,569 | | | UBS Securities LLC | | | 11/10/20 | | | | 19,155 | |
| Total | | | | | | | | | | | | | | | | | | $ | 136,208 | |
| | |
Abbreviation(s) used in this table: |
| |
| AUD | | — Australian Dollar |
| |
| CAD | | — Canadian Dollar |
| |
| CHF | | — Swiss Franc |
| |
| EUR | | — Euro |
| |
| GBP | | — British Pound |
| |
| HKD | | — Hong Kong Dollar |
| |
| JPY | | — Japanese Yen |
| |
| SGD | | — Singapore Dollar |
| |
| USD | | — United States Dollar |
| | | | |
| Summary of Investments by Country** (unaudited) | | | |
| Japan | | | 16.2 | % |
| United Kingdom | | | 15.2 | |
| Switzerland | | | 13.3 | |
| Canada | | | 10.9 | |
| Singapore | | | 7.2 | |
| Germany | | | 5.2 | |
| France | | | 5.1 | |
| Australia | | | 5.0 | |
| Hong Kong | | | 4.8 | |
| Spain | | | 4.0 | |
| Finland | | | 3.9 | |
| Italy | | | 3.8 | |
| Netherlands | | | 2.4 | |
| China | | | 1.8 | |
| Belgium | | | 0.5 | |
| Austria | | | 0.2 | |
| Denmark | | | 0.1 | |
| Sweden | | | 0.1 | |
| Short-Term Investments | | | 0.3 | |
| | | | 100.0 | % |
| ** | As a percentage of total investments. Please note that the Fund holdings are as of October 31, 2020 and are subject to change. |
See Notes to Financial Statements.
| | |
| 16 | | Legg Mason International Low Volatility High Dividend ETF 2020 Annual Report |
Statement of assets and liabilities
October 31, 2020
| | | | |
| |
| Assets: | | | | |
Investments, at value (Cost — $59,079,066) | | $ | 52,952,690 | |
Foreign currency, at value (Cost — $112,721) | | | 112,868 | |
Dividends and interest receivable | | | 337,922 | |
Unrealized appreciation on forward foreign currency contracts | | | 266,649 | |
Deposits with brokers for open futures contracts | | | 52,445 | |
Total Assets | | | 53,722,574 | |
| |
| Liabilities: | | | | |
Unrealized depreciation on forward foreign currency contracts | | | 130,441 | |
Payable to broker — net variation margin on open futures contracts | | | 20,889 | |
Investment management fee payable | | | 18,813 | |
Total Liabilities | | | 170,143 | |
| Total Net Assets | | $ | 53,552,431 | |
| |
| Net Assets: | | | | |
Par value (Note 5) | | $ | 25 | |
Paid-in capital in excess of par value | | | 69,797,201 | |
Total distributable earnings (loss) | | | (16,244,795) | |
| Total Net Assets | | $ | 53,552,431 | |
| |
| Shares Outstanding | | | 2,520,000 | |
| |
| Net Asset Value | | | $21.25 | |
See Notes to Financial Statements.
| | |
| Legg Mason International Low Volatility High Dividend ETF 2020 Annual Report | | 17 |
Statement of operations
For the Year Ended October 31, 2020
| | | | |
| |
| Investment Income: | | | | |
Dividends | | $ | 2,935,171 | |
Interest | | | 1,023 | |
Less: Foreign taxes withheld | | | (272,432) | |
Total Investment Income | | | 2,663,762 | |
| |
| Expenses: | | | | |
Investment management fee (Note 2) | | | 227,762 | |
Total Expenses | | | 227,762 | |
| Net Investment Income | | | 2,436,000 | |
| |
Realized and Unrealized Gain (Loss) on Investments, Futures Contracts, Forward
Foreign Currency Contracts and Foreign Currency Transactions (Notes 1, 3 and 4): | | | | |
Net Realized Gain (Loss) From: | | | | |
Investment transactions | | | (9,401,879) | |
Futures contracts | | | 88,789 | |
Forward foreign currency contracts | | | (1,622,299) | |
Foreign currency transactions | | | 28,994 | |
Net Realized Loss | | | (10,906,395) | |
Change in Net Unrealized Appreciation (Depreciation) From: | | | | |
Investments | | | (4,082,289) | |
Futures contracts | | | (32,074) | |
Forward foreign currency contracts | | | 810,719 | |
Foreign currencies | | | 8,515 | |
Change in Net Unrealized Appreciation (Depreciation) | | | (3,295,129) | |
| Net Loss on Investments, Futures Contracts, Forward Foreign Currency Contracts and Foreign Currency Transactions | | | (14,201,524) | |
| Decrease in Net Assets From Operations | | $ | (11,765,524) | |
See Notes to Financial Statements.
| | |
| 18 | | Legg Mason International Low Volatility High Dividend ETF 2020 Annual Report |
Statements of changes in net assets
| | | | | | | | |
| For the Years Ended October 31, | | 2020 | | | 2019 | |
| | |
| Operations: | | | | | | | | |
Net investment income | | $ | 2,436,000 | | | $ | 2,182,904 | |
Net realized gain (loss) | | | (10,906,395) | | | | 2,141,389 | |
Change in net unrealized appreciation (depreciation) | | | (3,295,129) | | | | 1,402,456 | |
Increase (Decrease) in Net Assets From Operations | | | (11,765,524) | | | | 5,726,749 | |
| | |
| Distributions to Shareholders From (Note 1): | | | | | | | | |
Total distributable earnings | | | (3,203,528) | | | | (4,262,512) | |
Decrease in Net Assets From Distributions to Shareholders | | | (3,203,528) | | | | (4,262,512) | |
| | |
| Fund Share Transactions (Note 5): | | | | | | | | |
Net proceeds from sale of shares (780,000 and 180,000 shares issued, respectively) | | | 19,938,679 | | | | 4,715,742 | |
Cost of shares repurchased (240,000 and 60,000 shares repurchased, respectively) | | | (5,167,707) | | | | (1,573,406) | |
Increase in Net Assets From Fund Share Transactions | | | 14,770,972 | | | | 3,142,336 | |
Increase (Decrease) in Net Assets | | | (198,080) | | | | 4,606,573 | |
| | |
| Net Assets: | | | | | | | | |
Beginning of year | | | 53,750,511 | | | | 49,143,938 | |
End of year | | $ | 53,552,431 | | | $ | 53,750,511 | |
See Notes to Financial Statements.
| | |
| Legg Mason International Low Volatility High Dividend ETF 2020 Annual Report | | 19 |
Financial highlights
| | | | | | | | | | | | | | | | | | | | |
For a share of beneficial interest outstanding throughout each year ended October 31,
unless otherwise noted: | | | | | |
| | | 20201 | | | 20191 | | | 20181 | | | 20171 | | | 20161,2 | |
| | | | | |
| Net asset value, beginning of year | | | $27.15 | | | | $26.42 | | | | $28.19 | | | | $25.25 | | | | $25.18 | |
| | | | | |
| Income (loss) from operations: | | | | | | | | | | | | | | | | | | | | |
Net investment income | | | 1.00 | | | | 1.18 | | | | 1.22 | | | | 0.85 | | | | 0.17 | |
Net realized and unrealized gain (loss) | | | (5.47) | | | | 1.85 | | | | (1.65) | | | | 3.21 | | | | 0.02 | |
Total income (loss) from operations | | | (4.47) | | | | 3.03 | | | | (0.43) | | | | 4.06 | | | | 0.19 | |
| | | | | |
| Less distributions from: | | | | | | | | | | | | | | | | | | | | |
Net investment income | | | (1.13) | | | | (1.16) | | | | (1.34) | | | | (0.90) | | | | (0.12) | |
Net realized gains | | | (0.30) | | | | (1.14) | | | | — | | | | (0.22) | | | | — | |
Total distributions | | | (1.43) | | | | (2.30) | | | | (1.34) | | | | (1.12) | | | | (0.12) | |
| | | | | |
| Net asset value, end of year | | | $21.25 | | | | $27.15 | | | | $26.42 | | | | $28.19 | | | | $25.25 | |
Total return, based on NAV3 | | | (17.20) | % | | | 12.65 | % | | | (1.49) | % | | | 16.35 | % | | | 0.75 | % |
| | | | | |
| Net assets, end of year (000s) | | | $53,552 | | | | $53,751 | | | | $49,144 | | | | $60,898 | | | | $3,030 | |
| | | | | |
| Ratios to average net assets: | | | | | | | | | | | | | | | | | | | | |
Gross expenses | | | 0.40 | % | | | 0.40 | % | | | 0.40 | % | | | 0.40 | % | | | 0.40 | %4 |
Net expenses | | | 0.40 | | | | 0.40 | | | | 0.40 | | | | 0.40 | | | | 0.40 | 4 |
Net investment income | | | 4.28 | | | | 4.54 | | | | 4.46 | | | | 3.13 | | | | 2.57 | 4 |
| | | | | |
| Portfolio turnover rate5 | | | 96 | % | | | 41 | % | | | 41 | % | | | 31 | % | | | 18 | % |
| 1 | Per share amounts have been calculated using the average shares method. |
| 2 | For the period July 27, 2016 (inception date) to October 31, 2016. |
| 3 | Performance figures may reflect fee waivers and/or expense reimbursements. In the absence of fee waivers and/or expense reimbursements, the total return would have been lower. The total return calculation assumes that distributions are reinvested at NAV. Past performance is no guarantee of future results. Total returns for periods of less than one year are not annualized. |
| 5 | Portfolio turnover excludes the value of portfolio securities received or delivered as a result of in-kind fund share transactions. |
See Notes to Financial Statements.
| | |
| 20 | | Legg Mason International Low Volatility High Dividend ETF 2020 Annual Report |
Notes to financial statements
1. Organization and significant accounting policies
Legg Mason International Low Volatility High Dividend ETF (the “Fund”) is a separate diversified investment series of Legg Mason ETF Investment Trust (the “Trust”). The Trust, a Maryland statutory trust, is registered under the Investment Company Act of 1940, as amended (the “1940 Act”), as an open-end management investment company.
The Fund is an exchange-traded fund (“ETF”). ETFs are funds that trade like other publicly-traded securities. The Fund is designed to track an index. Similar to shares of an index mutual fund, each share of the Fund represents an ownership interest in an underlying portfolio of securities intended to track an index. Unlike shares of a mutual fund, which can be bought from and redeemed by the issuing fund by all shareholders at a price based on net asset value (“NAV”), shares of the Fund may be directly purchased from and redeemed by the Fund at NAV solely by certain large institutional investors who have entered into agreements with the Fund’s distributor (“Authorized Participants”). Also unlike shares of a mutual fund, shares of the Fund are listed on a national securities exchange and trade in the secondary market at market prices that change throughout the day.
Shares of the Fund are listed and traded at market prices on the Cboe BZX Exchange, Inc. The market price for the Fund’s shares may be different from the Fund’s NAV. The Fund issues and redeems shares at NAV only in blocks of a specified number of shares or multiples thereof (“Creation Units”). Only Authorized Participants may purchase or redeem Creation Units directly with the Fund at NAV. Creation Units are issued and redeemed generally in-kind for a basket of securities and/or cash. Except when aggregated in Creation Units, shares of the Fund are not redeemable securities. Shareholders who are not Authorized Participants may not redeem shares directly from the Fund at NAV.
The Fund seeks to track the investment results of the QS International Low Volatility High Dividend Hedged Index (the “Underlying Index”). The Underlying Index seeks to provide more stable income through investments in stocks of profitable companies in developed markets outside of the United States with relatively high dividend yields or anticipated dividend yields and lower price and earnings volatility, while mitigating exposure to exchange-rate fluctuations between the U.S. dollar and other international currencies and is based on a proprietary methodology created and sponsored by QS Investors, LLC, the Fund’s subadviser.
The following are significant accounting policies consistently followed by the Fund and are in conformity with U.S. generally accepted accounting principles (“GAAP”). Estimates and assumptions are required to be made regarding assets, liabilities and changes in net assets resulting from operations when financial statements are prepared. Changes in the economic environment, financial markets and any other parameters used in determining these estimates could cause actual results to differ. Subsequent events have been evaluated through the date the financial statements were issued.
| | |
| Legg Mason International Low Volatility High Dividend ETF 2020 Annual Report | | 21 |
Notes to financial statements (cont’d)
(a) Investment valuation. Equity securities for which market quotations are available are valued at the last reported sales price or official closing price on the primary market or exchange on which they trade. The valuations for fixed income securities (which may include, but are not limited to, corporate, government, municipal, mortgage-backed, collateralized mortgage obligations and asset-backed securities) and certain derivative instruments are typically the prices supplied by independent third party pricing services, which may use market prices or broker/dealer quotations or a variety of valuation techniques and methodologies. The independent third party pricing services use inputs that are observable such as issuer details, interest rates, yield curves, prepayment speeds, credit risks/spreads, default rates and quoted prices for similar securities. Investments in open-end funds are valued at the closing net asset value per share of each fund on the day of valuation. Futures contracts are valued daily at the settlement price established by the board of trade or exchange on which they are traded. When the Fund holds securities or other assets that are denominated in a foreign currency, the Fund will use the currency exchange rates, generally determined as of 4:00 p.m. (London Time). If independent third party pricing services are unable to supply prices for a portfolio investment, or if the prices supplied are deemed by the manager to be unreliable, the market price may be determined by the manager using quotations from one or more broker/dealers or at the transaction price if the security has recently been purchased and no value has yet been obtained from a pricing service or pricing broker. When reliable prices are not readily available, such as when the value of a security has been significantly affected by events after the close of the exchange or market on which the security is principally traded, but before the Fund calculates its net asset value, the Fund values these securities as determined in accordance with procedures approved by the Fund’s Board of Trustees.
The Board of Trustees is responsible for the valuation process and has delegated the supervision of the daily valuation process to the Legg Mason North Atlantic Fund Valuation Committee (the “Valuation Committee”). The Valuation Committee, pursuant to the policies adopted by the Board of Trustees, is responsible for making fair value determinations, evaluating the effectiveness of the Fund’s pricing policies, and reporting to the Board of Trustees. When determining the reliability of third party pricing information for investments owned by the Fund, the Valuation Committee, among other things, conducts due diligence reviews of pricing vendors, monitors the daily change in prices and reviews transactions among market participants.
The Valuation Committee will consider pricing methodologies it deems relevant and appropriate when making fair value determinations. Examples of possible methodologies include, but are not limited to, multiple of earnings; discount from market of a similar freely traded security; discounted cash-flow analysis; book value or a multiple thereof; risk premium/yield analysis; yield to maturity; and/or fundamental investment analysis. The Valuation Committee will also consider factors it deems relevant and appropriate in light of the facts and circumstances. Examples of possible factors include, but are not limited to, the type of security; the issuer’s financial statements; the purchase price of the security; the
| | |
| 22 | | Legg Mason International Low Volatility High Dividend ETF 2020 Annual Report |
discount from market value of unrestricted securities of the same class at the time of purchase; analysts’ research and observations from financial institutions; information regarding any transactions or offers with respect to the security; the existence of merger proposals or tender offers affecting the security; the price and extent of public trading in similar securities of the issuer or comparable companies; and the existence of a shelf registration for restricted securities.
For each portfolio security that has been fair valued pursuant to the policies adopted by the Board of Trustees, the fair value price is compared against the last available and next available market quotations. The Valuation Committee reviews the results of such back testing monthly and fair valuation occurrences are reported to the Board of Trustees quarterly.
The Fund uses valuation techniques to measure fair value that are consistent with the market approach and/or income approach, depending on the type of security and the particular circumstance. The market approach uses prices and other relevant information generated by market transactions involving identical or comparable securities. The income approach uses valuation techniques to discount estimated future cash flows to present value.
GAAP establishes a disclosure hierarchy that categorizes the inputs to valuation techniques used to value assets and liabilities at measurement date. These inputs are summarized in the three broad levels listed below:
| • | | Level 1 — quoted prices in active markets for identical investments |
| • | | Level 2 — other significant observable inputs (including quoted prices for similar investments, interest rates, prepayment speeds, credit risk, etc.) |
| • | | Level 3 — significant unobservable inputs (including the Fund’s own assumptions in determining the fair value of investments) |
The inputs or methodologies used to value securities are not necessarily an indication of the risk associated with investing in those securities.
| | |
| Legg Mason International Low Volatility High Dividend ETF 2020 Annual Report | | 23 |
Notes to financial statements (cont’d)
The following is a summary of the inputs used in valuing the Fund’s assets and liabilities carried at fair value:
| | | | | | | | | | | | | | | | |
| ASSETS | |
| Description | | Quoted Prices (Level 1) | | | Other Significant Observable Inputs (Level 2) | | | Significant
Unobservable
Inputs
(Level 3) | | | Total | |
| Long-Term Investments†: | | | | | | | | | | | | | | | | |
Common Stocks: | | $ | 52,683,480 | | | | — | | | | — | | | $ | 52,683,480 | |
Preferred Stocks | | | 102,922 | | | | — | | | | — | | | | 102,922 | |
| Total Long-Term Investments | | | 52,786,402 | | | | — | | | | — | | | | 52,786,402 | |
| Short-Term Investments† | | | 166,288 | | | | — | | | | — | | | | 166,288 | |
| Total Investments | | $ | 52,952,690 | | | | — | | | | — | | | $ | 52,952,690 | |
| Other Financial Instruments: | | | | | | | | | | | | | | | | |
Forward Foreign Currency Contracts | | | — | | | $ | 266,649 | | | | — | | | $ | 266,649 | |
| Total | | $ | 52,952,690 | | | $ | 266,649 | | | | — | | | $ | 53,219,339 | |
|
| LIABILITIES | |
| Description | | Quoted Prices
(Level 1) | | | Other Significant
Observable Inputs
(Level 2) | | | Significant
Unobservable
Inputs
(Level 3) | | | Total | |
| Other Financial Instruments: | | | | | | | | | | | | | | | | |
Futures Contracts | | $ | 20,889 | | | | — | | | | — | | | $ | 20,889 | |
Forward Foreign Currency Contracts | | | — | | | $ | 130,441 | | | | — | | | | 130,441 | |
| Total | | $ | 20,889 | | | $ | 130,441 | | | | — | | | $ | 151,330 | |
| † | See Schedule of Investments for additional detailed categorizations. |
(b) Futures contracts. The Fund uses futures contracts generally to gain or manage exposure to certain asset classes, sectors, or markets or for cash management purposes. A futures contract represents a commitment for the future purchase or sale of an asset at a specified price on a specified date.
Upon entering into a futures contract, the Fund is required to deposit cash or securities with a broker in an amount equal to a certain percentage of the contract amount. This is known as the ‘‘initial margin’’ and subsequent payments (‘‘variation margin’’) are made or received by the Fund each day, depending on the daily fluctuation in the value of the contract. For certain futures, including foreign denominated futures, variation margin is not settled daily, but is recorded as a net variation margin payable or receivable. The daily changes in contract value are recorded as unrealized gains or losses in the Statement of Operations and the Fund recognizes a realized gain or loss when the contract is closed.
| | |
| 24 | | Legg Mason International Low Volatility High Dividend ETF 2020 Annual Report |
Futures contracts involve, to varying degrees, risk of loss in excess of the amounts reflected in the financial statements. In addition, there is the risk that the Fund may not be able to enter into a closing transaction because of an illiquid secondary market.
(c) Forward foreign currency contracts. The Fund enters into a forward foreign currency contract to hedge against foreign currency exchange rate risk on its non-U.S. dollar denominated securities or to facilitate settlement of a foreign currency denominated portfolio transaction. A forward foreign currency contract is an agreement between two parties to buy and sell a currency at a set price with delivery and settlement at a future date. The contract is marked-to-market daily and the change in value is recorded by the Fund as an unrealized gain or loss. When a forward foreign currency contract is closed, through either delivery or offset by entering into another forward foreign currency contract, the Fund recognizes a realized gain or loss equal to the difference between the value of the contract at the time it was opened and the value of the contract at the time it is closed.
Non-deliverable forward foreign currency exchange contracts are settled with the counterparty in cash without the delivery of foreign currency.
Forward foreign currency contracts involve elements of market risk in excess of the amounts reflected on the Statement of Assets and Liabilities. The Fund bears the risk of an unfavorable change in the foreign exchange rate underlying the forward foreign currency contract. Risks may also arise upon entering into these contracts from the potential inability of the counterparties to meet the terms of their contracts.
(d) Foreign currency translation. Investment securities and other assets and liabilities denominated in foreign currencies are translated into U.S. dollar amounts based upon prevailing exchange rates on the date of valuation. Purchases and sales of investment securities and income and expense items denominated in foreign currencies are translated into U.S. dollar amounts based upon prevailing exchange rates on the respective dates of such transactions.
The Fund does not isolate that portion of the results of operations resulting from fluctuations in foreign exchange rates on investments from the fluctuations arising from changes in market prices of securities held. Such fluctuations are included with the net realized and unrealized gain or loss on investments.
Net realized foreign exchange gains or losses arise from sales of foreign currencies, including gains and losses on forward foreign currency contracts, currency gains or losses realized between the trade and settlement dates on securities transactions, and the difference between the amounts of dividends, interest, and foreign withholding taxes recorded on the Fund’s books and the U.S. dollar equivalent of the amounts actually received or paid. Net unrealized foreign exchange gains and losses arise from changes in the values of assets and liabilities, other than investments in securities, on the date of valuation, resulting from changes in exchange rates.
| | |
| Legg Mason International Low Volatility High Dividend ETF 2020 Annual Report | | 25 |
Notes to financial statements (cont’d)
Foreign security and currency transactions may involve certain considerations and risks not typically associated with those of U.S. dollar denominated transactions as a result of, among other factors, the possibility of lower levels of governmental supervision and regulation of foreign securities markets and the possibility of political or economic instability.
(e) Foreign investment risks. The Fund’s investments in foreign securities may involve risks not present in domestic investments. Since securities may be denominated in foreign currencies, may require settlement in foreign currencies or pay interest or dividends in foreign currencies, changes in the relationship of these foreign currencies to the U.S. dollar can significantly affect the value of the investments and earnings of the Fund. Foreign investments may also subject the Fund to foreign government exchange restrictions, expropriation, taxation or other political, social or economic developments, all of which affect the market and/or credit risk of the investments.
(f) Counterparty risk and credit-risk-related contingent features of derivative instruments. The Fund may invest in certain securities or engage in other transactions, where the Fund is exposed to counterparty credit risk in addition to broader market risks. The Fund may invest in securities of issuers, which may also be considered counterparties as trading partners in other transactions. This may increase the risk of loss in the event of default or bankruptcy by the counterparty or if the counterparty otherwise fails to meet its contractual obligations. The Fund’s subadviser attempts to mitigate counterparty risk by (i) periodically assessing the creditworthiness of its trading partners, (ii) monitoring and/or limiting the amount of its net exposure to each individual counterparty based on its assessment and (iii) requiring collateral from the counterparty for certain transactions. Market events and changes in overall economic conditions may impact the assessment of such counterparty risk by the subadviser. In addition, declines in the values of underlying collateral received may expose the Fund to increased risk of loss.
With exchange traded and centrally cleared derivatives, there is less counterparty risk to the Fund since the exchange or clearinghouse, as counterparty to such instruments, guarantees against a possible default. The clearinghouse stands between the buyer and the seller of the contract; therefore, the credit risk is limited to failure of the clearinghouse. While offset rights may exist under applicable law, the Fund does not have a contractual right of offset against a clearing broker or clearinghouse in the event of a default of the clearing broker or clearinghouse.
The Fund has entered into master agreements, such as an International Swaps and Derivatives Association, Inc. Master Agreement (“ISDA Master Agreement”) or similar agreement, with certain of its derivative counterparties that govern over-the-counter derivatives and provide for general obligations, representations, agreements, collateral posting terms, netting provisions in the event of default or termination and credit related contingent features. The credit related contingent features include, but are not limited to, a percentage decrease in the Fund’s net assets or NAV over a specified period of time. If these credit related contingent features were triggered, the derivatives counterparty could terminate the positions and demand payment or require additional collateral.
| | |
| 26 | | Legg Mason International Low Volatility High Dividend ETF 2020 Annual Report |
Under an ISDA Master Agreement, the Fund may, under certain circumstances, offset with the counterparty certain derivative financial instruments’ payables and/or receivables with collateral held and/or posted and create one single net payment. However, absent an event of default by the counterparty or a termination of the agreement, the terms of the ISDA Master Agreements do not result in an offset of reported amounts of financial assets and financial liabilities in the Statement of Assets and Liabilities across transactions between the Fund and the applicable counterparty. The enforceability of the right to offset may vary by jurisdiction.
Collateral requirements differ by type of derivative. Collateral or margin requirements are set by the broker or exchange clearinghouse for exchange traded derivatives while collateral terms are contract specific for over-the-counter traded derivatives. Cash collateral that has been pledged to cover obligations of the Fund under derivative contracts, if any, will be reported separately in the Statement of Assets and Liabilities. Securities pledged as collateral, if any, for the same purpose are noted in the Schedule of Investments.
As of October 31, 2020, the Fund held forward foreign currency contracts with credit related contingent features which had a net liability position of $130,441. If a contingent feature in the master agreements would have been triggered, the Fund would have been required to pay this amount to its derivatives counterparties.
(g) Security transactions and investment income. Security transactions are accounted for on a trade date basis. Interest income (including interest income from payment-in-kind securities), adjusted for amortization of premium and accretion of discount, is recorded on the accrual basis. Dividend income is recorded on the ex-dividend date for dividends received in cash and/or securities. Foreign dividend income is recorded on the ex-dividend date or as soon as practicable after the Fund determines the existence of a dividend declaration after exercising reasonable due diligence. The cost of investments sold is determined by use of the specific identification method. To the extent any issuer defaults or a credit event occurs that impacts the issuer, the Fund may halt any additional interest income accruals and consider the realizability of interest accrued up to the date of default or credit event.
(h) Distributions to shareholders. Distributions from net investment income of the Fund, if any, are declared and paid on a quarterly basis. Distributions of net realized gains, if any, are declared at least annually. Distributions to shareholders of the Fund are recorded on the ex-dividend date and are determined in accordance with income tax regulations, which may differ from GAAP.
(i) Federal and other taxes. It is the Fund’s policy to comply with the federal income and excise tax requirements of the Internal Revenue Code of 1986 (the “Code”), as amended, applicable to regulated investment companies. Accordingly, the Fund intends to distribute
| | |
| Legg Mason International Low Volatility High Dividend ETF 2020 Annual Report | | 27 |
Notes to financial statements (cont’d)
its taxable income and net realized gains, if any, to shareholders in accordance with timing requirements imposed by the Code. Therefore, no federal or state income tax provision is required in the Fund’s financial statements.
Management has analyzed the Fund’s tax positions taken on income tax returns for all open tax years and has concluded that as of October 31, 2020, no provision for income tax is required in the Fund’s financial statements. The Fund’s federal and state income and federal excise tax returns for tax years for which the applicable statutes of limitations have not expired are subject to examination by the Internal Revenue Service and state departments of revenue.
Under the applicable foreign tax laws, a withholding tax may be imposed on interest, dividends and capital gains at various rates.
(j) Reclassification. GAAP requires that certain components of net assets be reclassified to reflect permanent differences between financial and tax reporting. These reclassifications have no effect on net assets or net asset value per share. During the current year, the following reclassifications have been made:
| | | | | | | | |
| | | Total Distributable
Earnings (Loss) | | | Paid-in
Capital | |
| (a) | | $ | (136,474) | | | $ | 136,474 | |
| (a) | Reclassifications are due to book/tax differences in the treatment of an in-kind distribution of securities. |
2. Investment management agreement and other transactions with affiliates
Legg Mason Partners Fund Advisor, LLC (“LMPFA”) is the Fund’s investment manager and QS Investors, LLC (“QS Investors”) is the Fund’s subadviser. Western Asset Management Company, LLC (“Western Asset”) manages the portion of the Fund’s cash and short-term instruments allocated to it. As of July 31, 2020, LMPFA, QS Investors and Western Asset are indirect, wholly-owned subsidiaries of Franklin Resources, Inc. (“Franklin Resources”). Prior to July 31, 2020, LMPFA, QS Investors and Western Asset were wholly-owned subsidiaries of Legg Mason, Inc. (“Legg Mason”). As of July 31, 2020, Legg Mason is a subsidiary of Franklin Resources.
LMPFA provides administrative and certain oversight services to the Fund. LMPFA delegates to the subadviser the day-to-day portfolio management of the Fund. The Fund is responsible for paying interest expenses, taxes, brokerage expenses, future 12b-1 fees (if any), acquired fund fees and expenses, extraordinary expenses and the management fee payable to LMPFA under the investment management agreement.
Under the investment management agreement and subject to the general supervision of the Fund’s Board of Trustees, LMPFA provides or causes to be furnished all investment management, supervisory, administrative and other services reasonably necessary for the operation of the Fund, including certain distribution services (provided pursuant to a separate distribution agreement) and investment advisory services (provided pursuant to separate subadvisory agreements) under a unitary fee structure. The Fund pays an investment management fee, calculated daily and paid monthly, at an annual rate of 0.40% of the Fund’s average daily net assets.
| | |
| 28 | | Legg Mason International Low Volatility High Dividend ETF 2020 Annual Report |
As compensation for its subadvisory services, LMPFA pays QS Investors 90% of the management fee paid by the Fund to LMPFA, net of (i) all fees and expenses incurred by LMPFA under the investment management agreement (including without limitation any subadvisory fee paid to another subadviser to the Fund) and (ii) expense waivers, if any, and reimbursements. LMPFA pays Western Asset monthly a fee of 0.02% of the portion of the Fund’s average daily net assets allocated to Western Asset for the management of cash and other short-term instruments, net of expense waivers, if any, and reimbursements.
As of July 31, 2020 Legg Mason Investor Services, LLC (“LMIS”) is an indirect, wholly-owned broker-dealer subsidiary of Franklin Resources and serves as the distributor of Creation Units for the Fund on an agency basis. Prior to July 31, 2020, LMIS was a wholly-owned broker-dealer subsidiary of Legg Mason.
The Fund’s Board of Trustees has adopted a Rule 12b-1 shareholder services and distribution plan and under that plan, the Fund is authorized to pay service and/or distribution fees calculated at an annual rate of up to 0.25% of its average daily net assets. No service and/or distribution fees are currently paid by the Fund, and there are no current plans to impose these fees.
As of July 31, 2020, all officers and one Trustee of the Trust are employees of Franklin Resources or its affiliates and do not receive compensation from the Trust. Prior to July 31, 2020, all officers and one Trustee of the Trust were employees of Legg Mason and did not receive compensation from the Trust.
3. Investments
During the year ended October 31, 2020, the aggregate cost of purchases and proceeds from sales of investments (excluding in-kind transactions and short-term investments) were as follows:
| | | | |
| Purchases | | $ | 53,840,459 | |
| Sales | | | 56,138,017 | |
During the year ended October 31, 2020, in-kind transactions (Note 5) were as follows:
| | | | |
| Contributions | | $ | 19,884,294 | |
| Redemptions | | | 5,195,821 | |
| Realized gain (loss)* | | | 225,901 | |
* Net realized gains on redemptions in-kind are not taxable to the remaining shareholders of the Fund.
The in-kind contributions and in-kind redemptions shown in this table may not agree with the Fund Share Transactions on the Statement of Changes in Net Assets. This table represents the accumulation of the Fund’s daily net shareholder transactions while the Statement of Changes in Net Assets reflects gross shareholder transactions including any cash component of the transactions.
| | |
| Legg Mason International Low Volatility High Dividend ETF 2020 Annual Report | | 29 |
Notes to financial statements (cont’d)
At October 31, 2020, the aggregate cost of investments and the aggregate gross unrealized appreciation and depreciation of investments for federal income tax purposes were as follows:
| | | | | | | | | | | | | | | | |
| | | Cost | | | Gross
Unrealized
Appreciation | | | Gross
Unrealized
Depreciation | | | Net
Unrealized
Appreciation
(Depreciation) | |
| Securities | | $ | 59,535,666 | | | $ | 1,368,056 | | | $ | (7,951,032) | | | $ | (6,582,976) | |
| Futures contracts | | | — | | | | — | | | | (20,889) | | | | (20,889) | |
| Forward foreign currency contracts | | | — | | | | 266,649 | | | | (130,441) | | | | 136,208 | |
4. Derivative instruments and hedging activities
Below is a table, grouped by derivative type, that provides information about the fair value and the location of derivatives within the Statement of Assets and Liabilities at October 31, 2020.
| | | | |
| ASSET DERIVATIVES1 | |
| | | Foreign
Exchange Risk | |
| Forward foreign currency contracts | | $ | 266,649 | |
| | | | | | | | | | | | |
| LIABILITY DERIVATIVES1 | |
| | | Foreign
Exchange Risk | | | Equity
Risk | | | Total | |
| Futures contracts2 | | | — | | | $ | 20,889 | | | $ | 20,889 | |
| Forward foreign currency contracts | | $ | 130,441 | | | | — | | | | 130,441 | |
| Total | | $ | 130,441 | | | $ | 20,889 | | | $ | 151,330 | |
| 1 | Generally, the balance sheet location for asset derivatives is receivables/net unrealized appreciation and for liability derivatives is payables/net unrealized depreciation. |
| 2 | Includes cumulative appreciation (depreciation) of futures contracts as reported in the Schedule of Investments. Only variation margin is reported within the receivables and/or payables on the Statement of Assets and Liabilities. |
| | |
| 30 | | Legg Mason International Low Volatility High Dividend ETF 2020 Annual Report |
The following tables provide information about the effect of derivatives and hedging activities on the Fund’s Statement of Operations for the year ended October 31, 2020. The first table provides additional detail about the amounts and sources of gains (losses) realized on derivatives during the period. The second table provides additional information about the change in unrealized appreciation (depreciation) resulting from the Fund’s derivatives and hedging activities during the period.
| | | | | | | | | | | | |
| AMOUNT OF REALIZED GAIN (LOSS) ON DERIVATIVES RECOGNIZED | |
| | | Foreign
Exchange Risk | | | Equity
Risk | | | Total | |
| Futures contracts | | | — | | | $ | 88,789 | | | $ | 88,789 | |
| Forward foreign currency contracts | | $ | (1,622,299) | | | | — | | | | (1,622,299) | |
| Total | | $ | (1,622,299) | | | $ | 88,789 | | | $ | (1,533,510) | |
|
| CHANGE IN UNREALIZED APPRECIATION (DEPRECIATION) ON DERIVATIVES RECOGNIZED | |
| | | Foreign
Exchange Risk | | | Equity
Risk | | | Total | |
| Futures contracts | | | — | | | $ | (32,074) | | | $ | (32,074) | |
| Forward foreign currency contracts | | $ | 810,719 | | | | — | | | | 810,719 | |
| Total | | $ | 810,719 | | | $ | (32,074) | | | $ | 778,645 | |
During the year ended October 31, 2020, the volume of derivative activity for the Fund was as follows:
| | | | |
| | | Average Market
Value | |
| Futures contracts (to buy) | | $ | 443,284 | |
| Forward foreign currency contracts (to buy) | | | 402,199 | |
| Forward foreign currency contracts (to sell) | | | 57,848,083 | |
The following table presents the Fund’s OTC derivative assets and liabilities by counterparty net of amounts available for offset under an ISDA Master Agreement and net of the related collateral pledged (received) by the Fund as of October 31, 2020.
| | | | | | | | | | | | | | | | | | | | |
| Counterparty | | Gross Assets
Subject to
Master
Agreements1 | | | Gross
Liabilities
Subject to
Master
Agreements1 | | | Net Assets
(Liabilities)
Subject to
Master
Agreements | | | Collateral
Pledged
(Received) | | | Net
Amount2 | |
| Bank of New York | | $ | 140,699 | | | $ | (130,069) | | | $ | 10,630 | | | | — | | | $ | 10,630 | |
| UBS Securities LLC | | | 125,950 | | | | (372) | | | | 125,578 | | | | — | | | | 125,578 | |
| Total | | $ | 266,649 | | | $ | (130,441) | | | $ | 136,208 | | | | — | | | $ | 136,208 | |
| 1 | Absent an event of default or early termination, derivative assets and liabilities are presented gross and not offset in the Statement of Assets and Liabilities. |
| 2 | Represents the net amount receivable (payable) from (to) the counterparty in the event of default. |
| | |
| Legg Mason International Low Volatility High Dividend ETF 2020 Annual Report | | 31 |
Notes to financial statements (cont’d)
5. Fund share transactions
At October 31, 2020, the Trust had an unlimited number of shares of beneficial interest authorized with a par value of $0.00001 per share. Fund shares are issued and redeemed by the Fund only in Creation Units or Creation Unit aggregations, where 60,000 shares of the Fund constitute a Creation Unit. Such transactions are generally on an in-kind basis, with a separate cash payment, which is a balancing cash component to equate the transaction to the net asset value per share of the Fund on the transaction date. Transactions in capital shares of the Fund are disclosed in detail in the Statement of Changes in Net Assets. Authorized Participants are subject to standard creation and redemption transaction fees to offset transfer and other transaction costs associated with the issuance and redemption of Creation Units. Creations and redemptions for cash (when cash creations and redemptions are available or specified) may be subject to an additional variable fee.
6. Income tax information and distributions to shareholders
The tax character of distributions paid during the fiscal years ended October 31, was as follows:
| | | | | | | | |
| | | 2020 | | | 2019 | |
| Distributions paid from: | | | | | | | | |
| Ordinary income | | $ | 2,978,894 | | | $ | 3,510,848 | |
| Net long-term capital gains | | | 224,634 | | | | 751,664 | |
| Total distributions paid | | $ | 3,203,528 | | | $ | 4,262,512 | |
As of October 31, 2020, the components of distributable earnings (loss) on a tax basis were as follows:
| | | | |
| Undistributed ordinary income — net | | $ | 859,153 | |
| Deferred capital losses* | | | (10,551,126) | |
| Other book/tax temporary differences(a) | | | (94,108) | |
| Unrealized appreciation (depreciation)(b) | | | (6,458,714) | |
| Total distributable earnings (loss) — net | | $ | (16,244,795) | |
| * | These capital losses have been deferred in the current year as either short-term or long-term losses. The losses will be deemed to occur on the first day of the next taxable year in the same character as they were originally deferred and will be available to offset future taxable capital gains. |
| (a) | Other book/tax temporary differences are attributable to the realization for tax purposes of unrealized gains (losses) on certain futures and foreign currency contracts. |
| (b) | The difference between book-basis and tax-basis unrealized appreciation (depreciation) is attributable to the tax deferral of losses on wash sales and the realization for tax purposes of unrealized gains on investments in passive foreign investment companies. |
7. Other matter
The outbreak of the respiratory illness COVID-19 (commonly referred to as “coronavirus”) has continued to rapidly spread around the world, causing considerable uncertainty for the global economy and financial markets. The ultimate economic fallout from the pandemic, and the long-term impact on economies, markets, industries and individual issuers, are not known. The COVID-19 pandemic could adversely affect the value and liquidity of the Fund’s
| | |
| 32 | | Legg Mason International Low Volatility High Dividend ETF 2020 Annual Report |
investments, impair the Fund’s ability to satisfy redemption requests, and negatively impact the Fund’s performance. In addition, the outbreak of COVID-19, and measures taken to mitigate its effects, could result in disruptions to the services provided to the Fund by its service providers.
| | |
| Legg Mason International Low Volatility High Dividend ETF 2020 Annual Report | | 33 |
Report of independent registered public accounting firm
To the Board of Trustees of Legg Mason ETF Investment Trust and Shareholders of Legg Mason International Low Volatility High Dividend ETF
Opinion on the Financial Statements
We have audited the accompanying statement of assets and liabilities, including the schedule of investments, of Legg Mason International Low Volatility High Dividend ETF (one of the funds constituting Legg Mason ETF Investment Trust, referred to hereafter as the “Fund”) as of October 31, 2020, the related statement of operations for the year ended October 31, 2020, the statement of changes in net assets for each of the two years in the period ended October 31, 2020, including the related notes, and the financial highlights for each of the four years in the period ended October 31, 2020 (collectively referred to as the “financial statements”). In our opinion, the financial statements present fairly, in all material respects, the financial position of the Fund as of October 31, 2020, the results of its operations for the year then ended, the changes in its net assets for each of the two years in the period ended October 31, 2020 and the financial highlights for each of the four years in the period ended October 31, 2020 in conformity with accounting principles generally accepted in the United States of America. The financial statements and financial highlights of the Fund as of October 31, 2016 and for the period July 27, 2016 (inception date) through October 31, 2016 (not presented herein, other than the financial highlights) were audited by other auditors whose report dated December 21, 2016 expressed an unqualified opinion on those financial statements and financial highlights.
Basis for Opinion
These financial statements are the responsibility of the Fund’s management. Our responsibility is to express an opinion on the Fund’s financial statements based on our audits. We are a public accounting firm registered with the Public Company Accounting Oversight Board (United States) (PCAOB) and are required to be independent with respect to the Fund in accordance with the U.S. federal securities laws and the applicable rules and regulations of the Securities and Exchange Commission and the PCAOB.
We conducted our audits of these financial statements in accordance with the standards of the PCAOB. Those standards require that we plan and perform the audit to obtain reasonable assurance about whether the financial statements are free of material misstatement, whether due to error or fraud.
Our audits included performing procedures to assess the risks of material misstatement of the financial statements, whether due to error or fraud, and performing procedures that respond to those risks. Such procedures included examining, on a test basis, evidence regarding the amounts and disclosures in the financial statements. Our audits also included evaluating the accounting principles used and significant estimates made by management, as well as evaluating the overall presentation of the financial statements. Our procedures included confirmation of securities owned as of October 31, 2020 by correspondence with the custodian and brokers; where replies were not received from brokers, we performed other auditing procedures. We believe that our audits provide a reasonable basis for our opinion.
/s/PricewaterhouseCoopers LLP
Baltimore, Maryland
December 17, 2020
We have served as the auditor of one or more investment companies in the Franklin Templeton Group of Funds since 1948.
| | |
| 34 | | Legg Mason International Low Volatility High Dividend ETF 2020 Annual Report |
Additional shareholder information (unaudited)
Results of special meeting of shareholders
On July 14, 2020 a special meeting of shareholders was held for the following purposes: 1) to approve a new management agreement between the Fund and its investment manager; and 2) to approve a new subadvisory agreement with respect to each of the Fund’s subadvisers. The following table provides the number of votes cast for or against, as well as the number of abstentions and broker non-votes as to each matter voted on at the special meeting of shareholders. Each item voted on was approved.
| | | | | | | | | | | | | | | | |
| Item Voted On | | Voted For | | | Voted
Against | | | Abstentions | | | Broker
Non-Votes | |
| To Approve a New Management Agreement with Legg Mason Partners Fund Advisor, LLC | | | 34,928,411.989 | | | | 362,857.168 | | | | 726,299.232 | | | | 0 | |
| To Approve a New Subadvisory Agreement with QS Investors, LLC | | | 34,908,344.017 | | | | 375,644.198 | | | | 733,580.175 | | | | 0 | |
| To Approve a New Subadvisory Agreement with Western Asset Management Company, LLC | | | 34,795,338.141 | | | | 441,797.914 | | | | 780,432.334 | | | | 0 | |
| | |
| Legg Mason International Low Volatility High Dividend ETF 2020 Annual Report | | 35 |
Statement regarding liquidity risk management program (unaudited)
As required by law, the fund has adopted and implemented a liquidity risk management program (the “Program”) that is designed to assess and manage liquidity risk. Liquidity risk is the risk that the fund could not meet requests to redeem its shares without significant dilution of remaining investors’ interests in the fund. Legg Mason Partners Fund Advisor, LLC (the “Manager”), the fund’s manager, is the administrator of the Program. The Manager has established a liquidity risk management committee (the “Committee”) to administer the Program on a day-to-day basis.
The Committee, on behalf of the Manager, provided the fund’s Board of Trustees with a report that addressed the operation of the Program, assessed its adequacy and effectiveness of implementation, including, if applicable, the operation of any highly liquid investment minimum (“HLIM”), and described any material changes that had been made to the Program or were recommended (the “Report”). The Report covered the period from December 1, 2018 through December 31, 2019 (the “Reporting Period”).
The Report confirmed that there were no material changes to the Program during the Reporting Period and that no changes were recommended.
The Report also confirmed that, throughout the Reporting Period, the Committee had monitored the fund’s portfolio liquidity and liquidity risk on an ongoing basis, as described in the Program and in Board reporting throughout the Reporting Period.
The Report discussed the Committee’s annual review of the Program, which addressed, among other things, the following elements of the Program:
Assessment, Management, and Periodic Review of Liquidity Risk. The Committee reviewed the fund’s investment strategy and liquidity of portfolio investments during both normal and reasonably foreseeable stressed conditions. The Committee noted that the fund’s investment strategy continues to be appropriate for an open-end fund, taking into account, among other things, whether and to what extent the fund held less liquid and illiquid assets and the extent to which any such investments affected the fund’s ability to meet redemption requests. In managing and reviewing the fund’s liquidity risk, the Committee also considered the extent to which the fund’s investment strategy involves a relatively concentrated portfolio or large positions in particular issuers, the extent to which the fund uses borrowing for investment purposes, and the extent to which the fund uses derivatives (including for hedging purposes). The Committee also reviewed the fund’s short-term and long-term cash flow projections during both normal and reasonably foreseeable stressed conditions. In assessing the fund’s cash flow projections, the Committee considered, among other factors, historical net redemption activity, redemption policies, ownership concentration, distribution channels, and the degree of certainty associated with the fund’s short-term and long-term cash flow projections. The Committee also considered the fund’s holdings of cash and cash equivalents, as well as borrowing arrangements and other funding sources, including, if applicable, the fund’s participation in a credit facility, as components of the fund’s ability to meet redemption requests.
| | |
| 36 | | Legg Mason International Low Volatility High Dividend ETF 2020 Annual Report |
The Committee considered the relationship between the fund’s portfolio liquidity and the way in which, and the prices and spreads at which, the fund’s shares trade, including the efficiency of the arbitrage function and the level of active participation by market participants, including authorized participants. The Committee also considered the effect of the composition of baskets on the overall liquidity of the fund’s portfolio.
Liquidity Classification. The Committee reviewed the Program’s liquidity classification methodology for categorizing the fund’s investments into one of four liquidity buckets. In reviewing the fund’s investments, the Committee considered, among other factors, whether trading varying portions of a position in a particular portfolio investment or asset class in sizes the fund would reasonably anticipate trading, would be reasonably expected to significantly affect liquidity.
Highly Liquid Investment Minimum. The Committee performed an analysis to determine whether the fund is required to maintain a Highly Liquid Investment Minimum, and determined that no such minimum is required because the fund primarily holds highly liquid investments.
Compliance with Limitation on Illiquid Investments. The Committee confirmed that during the Reporting Period, the fund did not acquire any illiquid investment such that, after the acquisition, the fund would have invested more than 15% of its assets in illiquid investments that are assets, in accordance with the Program and applicable SEC rules.
Redemptions in Kind. The Committee confirmed that no redemptions in-kind were effected by the fund during the Reporting Period.
The Report stated that the Committee concluded that the Program is reasonably designed and operated effectively to assess and manage the fund’s liquidity risk throughout the Reporting Period.
| | |
| Legg Mason International Low Volatility High Dividend ETF | | 37 |
Additional information (unaudited)
Information about Trustees and Officers
The business and affairs of Legg Mason International Low Volatility High Dividend ETF (the “Fund”) are conducted by management under the supervision and subject to the direction of its Board of Trustees. The business address of each Trustee is c/o Jane Trust, Legg Mason, 100 International Drive, 11th Floor, Baltimore, Maryland 21202. Information pertaining to the Trustees and officers of the Fund is set forth below.
The Statement of Additional Information includes additional information about Trustees and is available, without charge, upon request by calling the Fund at 1-877-721-1926.
| | |
| Independent Trustees† | | |
| |
| Paul R. Ades | | |
| |
| Year of birth | | 1940 |
| Position(s) with Trust | | Trustee |
| Term of office1 and length of time served2 | | Since 1983 |
| Principal occupation(s) during the past five years | | Paul R. Ades, PLLC (law firm) (since 2000) |
| Number of funds in fund complex overseen by Trustee | | 49 |
| Other board memberships held by Trustee during the past five years | | None |
| |
| Andrew L. Breech | | |
| |
| Year of birth | | 1952 |
| Position(s) with Trust | | Trustee |
| Term of office1 and length of time served2 | | Since 1991 |
| Principal occupation(s) during the past five years | | President, Dealer Operating Control Service, Inc. (automotive retail management) (since 1985) |
| Number of funds in fund complex overseen by Trustee | | 49 |
| Other board memberships held by Trustee during the past five years | | None |
| |
| Dwight B. Crane | | |
| |
| Year of birth | | 1937 |
| Position(s) with Trust | | Trustee |
| Term of office1 and length of time served2 | | Since 1981 |
| Principal occupation(s) during the past five years | | Professor Emeritus, Harvard Business School (since 2007); formerly, Professor, Harvard Business School (1969 to 2007); Independent Consultant (since 1969) |
| Number of funds in fund complex overseen by Trustee | | 49 |
| Other board memberships held by Trustee during the past five years | | None |
| | |
| 38 | | Legg Mason International Low Volatility High Dividend ETF |
| | |
| Independent Trustees† (cont’d) | | |
| |
| Althea L. Duersten | | |
| |
| Year of birth | | 1951 |
| Position(s) with Trust | | Trustee |
| Term of office1 and length of time served2 | | Since 2014 |
| Principal occupation(s) during the past five years | | Retired (since 2011); formerly, Chief Investment Officer, North America, JPMorgan Chase (investment bank) and member of JPMorgan Executive Committee (2007 to 2011) |
| Number of funds in fund complex overseen by Trustee | | 49 |
| Other board memberships held by Trustee during the past five years | | Non-Executive Director, Rokos Capital Management LLP (since 2019) |
| |
| Stephen R. Gross | | |
| |
| Year of birth | | 1947 |
| Position(s) with Trust | | Trustee |
| Term of office1 and length of time served2 | | Since 1986 |
| Principal occupation(s) during the past five years | | Chairman Emeritus (since 2011) and formerly, Chairman, HLB Gross Collins, P.C. (accounting and consulting firm) (1979 to 2011); Executive Director of Business Builders Team, LLC (since 2005); Principal, Gross Consulting Group, LLC (since 2011); CEO, Gross Capital Partners, LLC (since 2014); CEO, Trusted CFO Solutions, LLC (since 2011) |
| Number of funds in fund complex overseen by Trustee | | 49 |
| Other board memberships held by Trustee during the past five years | | None |
| |
| Susan M. Heilbron | | |
| |
| Year of birth | | 1945 |
| Position(s) with Trust | | Trustee |
| Term of office1 and length of time served2 | | Since 1991 |
| Principal occupation(s) during the past five years | | Retired; formerly, President, Lacey & Heilbron (communications consulting) (1990 to 2002); General Counsel and Executive Vice President, The Trump Organization (1986 to 1990); Senior Vice President, New York State Urban Development Corporation (1984 to 1986); Associate, Cravath, Swaine & Moore LLP (1980 to 1984) and (1977 to 1979) |
| Number of funds in fund complex overseen by Trustee | | 49 |
| Other board memberships held by Trustee during the past five years | | Formerly, Director, Lincoln Savings Bank, FSB (1991 to 1994); Director, Trump Shuttle, Inc. (air transportation) (1989 to 1990); Director, Alexander’s Inc. (department store) (1987 to 1990) |
| | |
| Legg Mason International Low Volatility High Dividend ETF | | 39 |
Additional information (unaudited) (cont’d)
Information about Trustees and Officers
| | |
| Independent Trustees† (cont’d) | | |
| |
| Frank G. Hubbard | | |
| |
| Year of birth | | 1937 |
| Position(s) with Trust | | Trustee |
| Term of office1 and length of time served2 | | Since 1993 |
| Principal occupation(s) during the past five years | | President, Fealds, Inc. (business development) (since 2016); formerly, President, Avatar International Inc. (business development) (1998 to 2015) |
| Number of funds in fund complex overseen by Trustee | | 49 |
| Other board memberships held by Trustee during the past five years | | None |
| |
| Howard J. Johnson | | |
| |
| Year of birth | | 1938 |
| Position(s) with Trust | | Trustee and Chairman |
| Term of office1 and length of time served2 | | From 1981 to 1998 and since 2000 (Chairman since 2013) |
| Principal occupation(s) during the past five years | | Retired; formerly, Chief Executive Officer, Genesis Imaging LLC (technology company) (2003 to 2012) |
| Number of funds in fund complex overseen by Trustee | | 49 |
| Other board memberships held by Trustee during the past five years | | None |
| |
| Jerome H. Miller | | |
| |
| Year of birth | | 1938 |
| Position(s) with Trust | | Trustee |
| Term of office1 and length of time served2 | | Since 1995 |
| Principal occupation(s) during the past five years | | Retired; formerly, President, Shearson Lehman Asset Management (1991 to 1993), Vice Chairman, Shearson Lehman Hutton Inc. (1989 to 1992) and Senior Executive Vice President, E.F. Hutton Group Inc. (1986 to 1989) |
| Number of funds in fund complex overseen by Trustee | | 49 |
| Other board memberships held by Trustee during the past five years | | None |
| |
| Ken Miller | | |
| |
| Year of birth | | 1942 |
| Position(s) with Trust | | Trustee |
| Term of office1 and length of time served2 | | Since 1983 |
| Principal occupation(s) during the past five years | | Retired; formerly, President, Young Stuff Apparel Group, Inc. (apparel manufacturer), division of Li & Fung (1963 to 2012) |
| Number of funds in fund complex overseen by Trustee | | 49 |
| Other board memberships held by Trustee during the past five years | | None |
| | |
| 40 | | Legg Mason International Low Volatility High Dividend ETF |
| | |
| Independent Trustees† (cont’d) | | |
| |
| Thomas F. Schlafly | | |
| |
| Year of birth | | 1948 |
| Position(s) with Trust | | Trustee |
| Term of office1 and length of time served2 | | Since 1983 |
| Principal occupation(s) during the past five years | | Chairman, The Saint Louis Brewery, LLC (brewery) (since 2012); formerly, President, The Saint Louis Brewery, Inc. (1989 to 2012); Senior Counsel (since 2017) and formerly, Partner (2009 to 2016), Thompson Coburn LLP (law firm) |
| Number of funds in fund complex overseen by Trustee | | 49 |
| Other board memberships held by Trustee during the past five years | | Director, CNB St. Louis Bank (since 2006) |
| | |
| Interested Trustee and Officer | | |
| |
| Jane Trust, CFA3 | | |
| |
| Year of birth | | 1962 |
| Position(s) with Trust | | Trustee, President and Chief Executive Officer |
| Term of office1 and length of time served2 | | Since 2015 |
| Principal occupation(s) during the past five years | | Senior Vice President, Fund Board Management, Franklin Templeton (since 2020); Officer and/or Trustee/Director of 150 funds associated with Legg Mason Partners Fund Advisor, LLC (“LMPFA”) or its affiliates (since 2015); President and Chief Executive Officer of LMPFA (since 2015); formerly, Senior Managing Director (2018 to 2020) and Managing Director (2016 to 2018) of Legg Mason & Co., LLC (“Legg Mason & Co.”); Senior Vice President of LMPFA (2015) |
| Number of funds in fund complex overseen by Trustee | | 147 |
| Other board memberships held by Trustee during the past five years | | None |
| | |
| Additional Officers | | |
| |
Ted P. Becker Legg Mason 620 Eighth Avenue, 47th Floor, New York, NY 10018 | | |
| Year of birth | | 1951 |
| Position(s) with Trust | | Chief Compliance Officer |
| Term of office1 and length of time served2 | | Since 2007 |
| Principal occupation(s) during the past five years | | Vice President, Global Compliance of Franklin Templeton (since 2020); Chief Compliance Officer of LMPFA (since 2006); Chief Compliance Officer of certain funds associated with Legg Mason & Co. or its affiliates (since 2006); formerly, Director of Global Compliance at Legg Mason, Inc. (2006 to 2020); Managing Director of Compliance of Legg Mason & Co. (2005 to 2020) |
| | |
| Legg Mason International Low Volatility High Dividend ETF | | 41 |
Additional information (unaudited) (cont’d)
Information about Trustees and Officers
| | |
| Additional Officers (cont’d) | | |
| |
| Susan Kerr | | |
| |
| Legg Mason 620 Eighth Avenue, 47th Floor, New York, NY 10018 | | |
| Year of birth | | 1949 |
| Position(s) with Trust | | Chief Anti-Money Laundering Compliance Officer |
| Term of office1 and length of time served2 | | Since 2013 |
| Principal occupation(s) during the past five years | | Senior Compliance Analyst, Franklin Templeton (since 2020); Chief Anti-Money Laundering Compliance Officer of certain funds associated with Legg Mason & Co. or its affiliates (since 2013) and Anti-Money Laundering Compliance Officer (since 2012), Senior Compliance Officer (since 2011) and Assistant Vice President (since 2010) of Legg Mason Investor Services, LLC (“LMIS”); formerly, Assistant Vice President of Legg Mason & Co. (2010 to 2020) |
| Jenna Bailey | | |
| |
| Legg Mason 100 First Stamford Place, 5th Floor, Stamford, CT 06902 | | |
| Year of birth | | 1978 |
| Position(s) with Trust | | Identity Theft Prevention Officer |
| Term of office1 and length of time served2 | | Since 2015 |
| Principal occupation(s) during the past five years | | Senior Compliance Analyst of Franklin Templeton (since 2020); Identity Theft Prevention Officer of certain funds associated with Legg Mason & Co. or its affiliates (since 2015); formerly, Compliance Officer of Legg Mason & Co. (2013 to 2020); Assistant Vice President of Legg Mason & Co. (2011 to 2020) |
| Marc A. De Oliveira* | | |
| |
| Legg Mason 100 First Stamford Place, 6th Floor, Stamford, CT 06902 | | |
| Year of birth | | 1971 |
| Position(s) with Trust | | Secretary and Chief Legal Officer |
| Term of office1 and length of time served2 | | Since 2020 |
| Principal occupation(s) during the past five years | | Associate General Counsel of Franklin Templeton (since 2020); Assistant Secretary of certain funds associated with Legg Mason & Co. or its affiliates (since 2006); formerly, Managing Director (2016 to 2020) and Associate General Counsel of Legg Mason & Co. (2005 to 2020) |
| | |
| 42 | | Legg Mason International Low Volatility High Dividend ETF |
| | |
| Additional Officers (cont’d) | | |
| |
| Thomas C. Mandia | | |
| |
| Legg Mason 100 First Stamford Place, 6th Floor, Stamford, CT 06902 | | |
| Year of birth | | 1962 |
| Position(s) with Trust | | Senior Vice President |
| Term of office1 and length of time served2 | | Since 2020 |
| Principal occupation(s) during the past five years | | Senior Associate General Counsel of Franklin Templeton (since 2020); Secretary of LMPFA (since 2006); Assistant Secretary of certain funds associated with Legg Mason & Co. or its affiliates (since 2006); Secretary of LM Asset Services, LLC (“LMAS”) (since 2002) and Legg Mason Fund Asset Management, Inc. (“LMFAM”) (since 2013) (formerly registered investment advisers); formerly, Managing Director and Deputy General Counsel of Legg Mason & Co. (2005 to 2020) |
| Christopher Berarducci | | |
| |
| Legg Mason 620 Eighth Avenue, 47th Floor, New York, NY 10018 | | |
| Year of birth | | 1974 |
| Position(s) with Trust | | Treasurer and Principal Financial Officer |
| Term of office1 and length of time served2 | | Since 2014 and 2019 |
| Principal occupation(s) during the past five years | | Vice President, Fund Administration and Reporting, Franklin Templeton (since 2020); Treasurer (since 2010) and Principal Financial Officer (since 2019) of certain funds associated with Legg Mason & Co. or its affiliates; formerly, Managing Director (2020), Director (2015 to 2020), and Vice President (2011 to 2015) of Legg Mason & Co. |
| Jeanne M. Kelly | | |
| |
| Legg Mason 620 Eighth Avenue, 47th Floor, New York, NY 10018 | | |
| Year of birth | | 1951 |
| Position(s) with Trust | | Senior Vice President |
| Term of office1 and length of time served2 | | Since 2007 |
| Principal occupation(s) during the past five years | | U.S. Fund Board Team Manager, Franklin Templeton (since 2020); Senior Vice President of certain funds associated with Legg Mason & Co. or its affiliates (since 2007); Senior Vice President of LMPFA (since 2006); President and Chief Executive Officer of LMAS and LMFAM (since 2015); formerly, Managing Director of Legg Mason & Co. (2005 to 2020); Senior Vice President of LMFAM (2013 to 2015) |
| † | Trustees who are not “interested persons” of the Fund within the meaning of Section 2(a)(19) of the Investment Company Act of 1940, as amended (the “1940 Act”). |
| * | Effective August 6, 2020, Mr. De Oliveira became Secretary and Chief Legal Officer. |
| 1 | Each Trustee and officer serves until his or her respective successor has been duly elected and qualified or until his or her earlier death, resignation, retirement or removal. |
| | |
| Legg Mason International Low Volatility High Dividend ETF | | 43 |
Additional information (unaudited) (cont’d)
Information about Trustees and Officers
| 2 | Indicates the earliest year in which the Trustee became a board member for a fund in the Legg Mason fund complex or the officer took such office. |
| 3 | Ms. Trust is an “interested person” of the Fund, as defined in the 1940 Act, because of her position with LMPFA and/or certain of its affiliates. |
| | |
| 44 | | Legg Mason International Low Volatility High Dividend ETF |
Important tax information (unaudited)
The following information is provided with respect to the distributions paid during the taxable year ended October 31, 2020:
| | | | | | | | | | | | | | | | | | | | |
| Record date: | | | 12/6/2019 | | | | 12/31/2019 | | | | 3/6/2020 | | | | 6/5/2020 | | | | 9/4/2020 | |
| Payable date: | | | 12/10/2019 | | | | 1/3/2020 | | | | 3/10/2020 | | | | 6/9/2020 | | | | 9/9/2020 | |
| Ordinary Income: | | | | | | | | | | | | | | | | | | | | |
Qualified Dividend Income for Individuals | | | 54.66 | % | | | 53.48 | % | | | 93.01 | % | | | 93.01 | % | | | 93.01 | % |
| Foreign Source Income* | | | 61.51 | % | | | 62.10 | % | | | 100.00 | % | | | 100.00 | % | | | 100.00 | % |
| Foreign Taxes Paid Per Share | | | $ 0.042451 | | | | — | | | | $0.009401 | | | | $0.029329 | | | | $0.013677 | |
| Long-Term Capital Gain Dividend | | | $ 0.106970 | | | | — | | | | — | | | | — | | | | — | |
| Qualified Short-Term Capital Gain Dividend** | | | $ 0.191690 | | | | — | | | | — | | | | — | | | | — | |
| * | Expressed as a percentage of the cash distribution grossed-up for foreign taxes. |
| ** | Qualified Short-Term Capital Gains eligible for exemption from U.S. withholding tax for nonresident shareholders and foreign corporations. |
The foreign taxes paid represent taxes incurred by the Fund on income received by the Fund from foreign sources. Foreign taxes paid may be included in taxable income with an offsetting deduction from gross income or may be taken as a credit for taxes paid to foreign governments. You should consult your tax adviser regarding the appropriate treatment of foreign taxes paid.
| | |
| Legg Mason International Low Volatility High Dividend ETF | | 45 |
Legg Mason
International Low Volatility High Dividend ETF
Trustees
Paul R. Ades
Andrew L. Breech
Dwight B. Crane
Althea L. Duersten
Stephen R. Gross
Susan M. Heilbron
Frank G. Hubbard
Howard J. Johnson
Chairman
Jerome H. Miller
Ken Miller
Thomas F. Schlafly
Jane Trust
Investment manager
Legg Mason Partners Fund Advisor, LLC
Subadviser
QS Investors, LLC
Custodian
The Bank of New York Mellon
Transfer agent
The Bank of New York Mellon
240 Greenwich Street
New York, NY 10286
Independent registered public accounting firm
PricewaterhouseCoopers LLP
Baltimore, MD
Legg Mason International Low Volatility High Dividend ETF
The Fund is a separate investment series of Legg Mason ETF Investment Trust, a Maryland statutory trust.
Legg Mason International Low Volatility High Dividend ETF
Legg Mason Funds
620 Eighth Avenue, 47th Floor
New York, NY 10018
The Fund files its complete schedule of portfolio holdings with the Securities and Exchange Commission (“SEC”) for the first and third quarters of each fiscal year as an exhibit to its reports on Form N-PORT. The Fund’s Forms N-PORT are available on the SEC’s website at www.sec.gov. To obtain information on Form N-PORT, shareholders can call the Fund at 1-877-721-1926.
Information on how the Fund voted proxies relating to portfolio securities during the prior 12-month period ended June 30th of each year and a description of the policies and procedures that the Fund uses to determine how to vote proxies related to portfolio transactions are available (1) without charge, upon request, by calling the Fund at 1-877-721-1926, (2) at www.leggmason.com/etf and (3) on the SEC’s website at www.sec.gov.
This report is submitted for the general information of the shareholders of Legg Mason International Low Volatility High Dividend ETF. This report is not authorized for distribution to prospective investors in the Fund unless preceded or accompanied by a current prospectus.
Investors should consider the Fund’s investment objectives, risks, charges and expenses carefully before investing. The prospectus contains this and other important information about the Fund. Please read the prospectus carefully before investing.
www.leggmason.com
© 2020 Legg Mason Investor Services, LLC
Member FINRA, SIPC
Legg Mason Funds Privacy and Security Notice
Your Privacy and the Security of Your Personal Information is Very Important to the Legg Mason Funds
This Privacy and Security Notice (the “Privacy Notice”) addresses the Legg Mason Funds’ privacy and data protection practices with respect to nonpublic personal information the Funds receive. The Legg Mason Funds include any funds sold by the Funds’ distributor, Legg Mason Investor Services, LLC, as well as Legg Mason-sponsored closed-end funds. The provisions of this Privacy Notice apply to your information both while you are a shareholder and after you are no longer invested with the Funds.
The Type of Nonpublic Personal Information the Funds Collect About You
The Funds collect and maintain nonpublic personal information about you in connection with your shareholder account. Such information may include, but is not limited to:
| • | | Personal information included on applications or other forms; |
| • | | Account balances, transactions, and mutual fund holdings and positions; |
| • | | Bank account information, legal documents, and identity verification documentation; |
| • | | Online account access user IDs, passwords, security challenge question responses; and |
| • | | Information received from consumer reporting agencies regarding credit history and creditworthiness (such as the amount of an individual’s total debt, payment history, etc.). |
How the Funds Use Nonpublic Personal Information About You
The Funds do not sell or share your nonpublic personal information with third parties or with affiliates for their marketing purposes, or with other financial institutions or affiliates for joint marketing purposes, unless you have authorized the Funds to do so. The Funds do not disclose any nonpublic personal information about you except as may be required to perform transactions or services you have authorized or as permitted or required by law. The Funds may disclose information about you to:
| • | | Employees, agents, and affiliates on a “need to know” basis to enable the Funds to conduct ordinary business, or to comply with obligations to government regulators; |
| • | | Service providers, including the Funds’ affiliates, who assist the Funds as part of the ordinary course of business (such as printing, mailing services, or processing or servicing your account with us) or otherwise perform services on the Funds’ behalf, including companies that may perform statistical analysis, market research and marketing services solely for the Funds; |
| • | | Permit access to transfer, whether in the United States or countries outside of the United States to such Funds’ employees, agents and affiliates and service providers as required to enable the Funds to conduct ordinary business, or to comply with obligations to government regulators; |
| • | | The Funds’ representatives such as legal counsel, accountants and auditors to enable the Funds to conduct ordinary business, or to comply with obligations to government regulators; |
|
| NOT PART OF THE ANNUAL REPORT |
Legg Mason Funds Privacy and Security Notice (cont’d)
| • | | Fiduciaries or representatives acting on your behalf, such as an IRA custodian or trustee of a grantor trust. |
Except as otherwise permitted by applicable law, companies acting on the Funds’ behalf, including those outside the United States, are contractually obligated to keep nonpublic personal information the Funds provide to them confidential and to use the information the Funds share only to provide the services the Funds ask them to perform. The Funds may disclose nonpublic personal information about you when necessary to enforce their rights or protect against fraud, or as permitted or required by applicable law, such as in connection with a law enforcement or regulatory request, subpoena, or similar legal process. In the event of a corporate action or in the event a Fund service provider changes, the Funds may be required to disclose your nonpublic personal information to third parties. While it is the Funds’ practice to obtain protections for disclosed information in these types of transactions, the Funds cannot guarantee their privacy policy will remain unchanged.
Keeping You Informed of the Funds’ Privacy and Security Practices
The Funds will notify you annually of their privacy policy as required by federal law. While the Funds reserve the right to modify this policy at any time they will notify you promptly if this privacy policy changes.
The Funds’ Security Practices
The Funds maintain appropriate physical, electronic and procedural safeguards designed to guard your nonpublic personal information. The Funds’ internal data security policies restrict access to your nonpublic personal information to authorized employees, who may use your nonpublic personal information for Fund business purposes only.
Although the Funds strive to protect your nonpublic personal information, they cannot ensure or warrant the security of any information you provide or transmit to them, and you do so at your own risk. In the event of a breach of the confidentiality or security of your nonpublic personal information, the Funds will attempt to notify you as necessary, so you can take appropriate protective steps. If you have consented to the Funds using electronic communications or electronic delivery of statements, they may notify you under such circumstances using the most current email address you have on record with them.
In order for the Funds to provide effective service to you, keeping your account information accurate is very important. If you believe that your account information is incomplete, not accurate or not current, if you have questions about the Funds’ privacy practices, or our use of your nonpublic personal information, write the Funds using the contact information on your account statements, email the Funds by clicking on the Contact Us section of the Funds’ website at www.leggmason.com, or contact the Fund at 1-877-721-1926.
Revised April 2018
|
| NOT PART OF THE ANNUAL REPORT |
Legg Mason Funds Privacy and Security Notice (cont’d)
Legg Mason California Consumer Privacy Act Policy
Although much of the personal information we collect is “nonpublic personal information” subject to federal law, residents of California may, in certain circumstances, have additional rights under the California Consumer Privacy Act (“CCPA”). For example, if you are a broker, dealer, agent, fiduciary, or representative acting by or on behalf of, or for, the account of any other person(s) or household, or a financial advisor, or if you have otherwise provided personal information to us separate from the relationship we have with personal investors, the provisions of this Privacy Policy apply to your personal information (as defined by the CCPA).
| • | | In addition to the provisions of the Legg Mason Funds Security and Privacy Notice, you may have the right to know the categories and specific pieces of personal information we have collected about you. |
| • | | You also have the right to request the deletion of the personal information collected or maintained by the Funds. |
If you wish to exercise any of the rights you have in respect of your personal information, you should advise the Funds by contacting them as set forth below. The rights noted above are subject to our other legal and regulatory obligations and any exemptions under the CCPA. You may designate an authorized agent to make a rights request on your behalf, subject to the identification process described below. We do not discriminate based on requests for information related to our use of your personal information, and you have the right not to receive discriminatory treatment related to the exercise of your privacy rights.
We may request information from you in order to verify your identity or authority in making such a request. If you have appointed an authorized agent to make a request on your behalf, or you are an authorized agent making such a request (such as a power of attorney or other written permission), this process may include providing a password/passcode, a copy of government issued identification, affidavit or other applicable documentation, i.e. written permission. We may require you to verify your identity directly even when using an authorized agent, unless a power of attorney has been provided. We reserve the right to deny a request submitted by an agent if suitable and appropriate proof is not provided.
For the 12-month period prior to the date of this Privacy Policy, the Legg Mason Funds have not sold any of your personal information; nor do we have any plans to do so in the future.
Contact Information
Address: Data Privacy Officer, 100 International Dr., Baltimore, MD 21202
Email: DataProtectionOfficer@franklintempleton.com
Phone: 1-800-396-4748
Revised October 2020
|
| NOT PART OF THE ANNUAL REPORT |
ETF Index Disclaimers
The MSCI World ex-US IMI Index (the “MSCI Index”) was used by QS Investors, LLC (“QS Investors”), the Fund’s subadviser, as the reference universe for selection of the component securities included in the QS International Low Volatility High Dividend Hedged Index (the “Underlying Index”). MSCI Inc. does not in any way sponsor, support, promote or endorse the Underlying Index or Legg Mason International Low Volatility High Dividend ETF (the “Fund”). MSCI Inc. was not and is not involved in any way in the creation, calculation, maintenance or review of the Underlying Index. The MSCI Index was provided on an “as is” basis. MSCI Inc., its affiliates and any other person or entity involved in or related to compiling, computing or creating the MSCI Index (collectively, the “MSCI Parties”) expressly disclaim all warranties (including, without limitation, any warranties of originality, accuracy, completeness, timeliness, non-infringement, merchantability and fitness for a particular purpose). Without limiting any of the foregoing, in no event shall any MSCI Party have any liability for any direct, indirect, special, incidental, punitive, consequential (including without limitation lost profits) or any other damages in connection with the MSCI Index, the Underlying Index or the Fund.
The Fund is not sponsored, promoted, sold or supported in any other manner by Solactive AG nor does Solactive AG offer any express or implicit guarantee or assurance either with regard to the results of using the Underlying Index and/or Underlying Index trade mark or the Underlying Index Price at any time or in any other respect. The Underlying Index is calculated and published by Solactive AG. Solactive AG uses its best efforts to ensure that the Underlying Index is calculated correctly. Irrespective of its obligations towards the Fund, Solactive AG has no obligation to point out errors in the Underlying Index to third parties including but not limited to investors and/or financial intermediaries of the Fund. Neither publication of the Underlying Index by Solactive AG nor the licensing of the Underlying Index or the Underlying Index trade mark for the purpose of use in connection with the Fund constitutes a recommendation by Solactive AG to invest capital in this Fund nor does it in any way represent an assurance or opinion of Solactive AG with regard to any investment in this Fund.
QS Investors does not guarantee the accuracy and/or the completeness of the Underlying Index or any data included therein, and QS Investors shall not have any liability for any errors, omissions or interruptions therein. QS Investors makes no warranty, express or implied, as to results to be obtained by the Fund, owners of the shares of the Fund or any other person or entity from the use of the Underlying Index, or any data included therein, either in connection with the Fund or for any other use. QS Investors makes no express or implied warranties, and expressly disclaims all warranties of merchantability or fitness for a particular purpose or use with respect to the Underlying Index or any data included therein. Without limiting any of the foregoing, in no event shall QS Investors have any liability for any special, punitive, direct, indirect or consequential damages (including lost profits) arising out of matters relating to the use of the Underlying Index, even if notified of the possibility of such damages.
www.leggmason.com
© 2020 Legg Mason Investor Services, LLC Member FINRA, SIPC
ETFF323385 12/20 SR20-4028
The registrant has adopted a code of ethics that applies to the registrant’s principal executive officer, principal financial officer, principal accounting officer or controller.
| ITEM 3. | AUDIT COMMITTEE FINANCIAL EXPERT. |
The Board of Trustees of the registrant has determined that Dwight B. Crane possesses the technical attributes identified in Instruction 2(b) of Item 3 to Form N-CSR to qualify as an “audit committee financial expert,” and has designated Dwight B. Crane as the Audit Committee’s financial expert Dwight B. Crane is an “independent” Trustees pursuant to paragraph (a)(2) of Item 3 to Form N-CSR.
| ITEM 4. | PRINCIPAL ACCOUNTANT FEES AND SERVICES. |
a) Audit Fees. The aggregate fees billed in the last two fiscal years ending October 31, 2019 and October 31, 2020 (the “Reporting Periods”) for professional services rendered by the Registrant’s principal accountant (the “Auditor”) for the audit of the Registrant’s annual financial statements, or services that are normally provided by the Auditor in connection with the statutory and regulatory filings or engagements for the Reporting Periods, were $90,000 in October 31, 2019 and $81,600 in October 31, 2020.
b) Audit-Related Fees. The aggregate fees billed in the Reporting Period for assurance and related services by the Auditor that are reasonably related to the performance of the Registrant’s financial statements were $0 in October 31, 2019 and $0 in October 31, 2020.
c) Tax Fees. The aggregate fees billed in the Reporting Periods for professional services rendered by the Auditor for tax compliance, tax advice and tax planning (“Tax Services”) were $0 in October 31, 2019 and $0 in October 31, 2020. These services consisted of (i) review or preparation of U.S. federal, state, local and excise tax returns; (ii) U.S. federal, state and local tax planning, advice and assistance regarding statutory, regulatory or administrative developments, and (iii) tax advice regarding tax qualification matters and/or treatment of various financial instruments held or proposed to be acquired or held.
There were no fees billed for tax services by the Auditors to service affiliates during the Reporting Periods that required pre-approval by the Audit Committee.
d) All Other Fees.
The aggregate fees billed in the Reporting Periods for products and services provided by the Auditor, other than the services reported in paragraphs (a) through (c) for the Item 4 for the Legg Mason ETF Investment Trust, were $0 in October 31, 2019 and $0 in October 31, 2020.
All Other Fees. There were no other non-audit services rendered by the Auditor to Legg Mason Partners Fund Advisors, LLC (“LMPFA”), and any entity controlling, controlled by or under common control with LMPFA that provided ongoing services to Legg Mason ETF Investment Trust requiring pre-approval by the Audit Committee in the Reporting Period.
(e) Audit Committee’s pre–approval policies and procedures described in paragraph (c) (7) of Rule 2-01 of Regulation S-X.
(1) The Charter for the Audit Committee (the “Committee”) of the Board of each registered investment company (the “Fund”) advised by LMPFA or one of their affiliates (each, an “Adviser”) requires that the Committee shall approve (a) all audit and permissible non-audit services to be provided to the Fund and (b) all permissible non-audit services to be provided by the Fund’s independent auditors to the Adviser and any Covered Service Providers if the engagement relates directly to the operations and financial reporting of the Fund. The Committee may implement policies and procedures by which such services are approved other than by the full Committee.
The Committee shall not approve non-audit services that the Committee believes may impair the independence of the auditors. As of the date of the approval of this Audit Committee Charter, permissible non-audit services include any professional services (including tax services), that are not prohibited services as described below, provided to the Fund by the independent auditors, other than those provided to the Fund in connection with an audit or a review of the financial statements of the Fund. Permissible non-audit services may not include: (i) bookkeeping or other services related to the accounting records or financial statements of the Fund; (ii) financial information systems design and implementation; (iii) appraisal or valuation services, fairness opinions or contribution-in-kind reports; (iv) actuarial services; (v) internal audit outsourcing services; (vi) management functions or human resources; (vii) broker or dealer, investment adviser or investment banking services; (viii) legal services and expert services unrelated to the audit; and (ix) any other service the Public Company Accounting Oversight Board determines, by regulation, is impermissible.
Pre-approval by the Committee of any permissible non-audit services is not required so long as: (i) the aggregate amount of all such permissible non-audit services provided to the Fund, the Adviser and any service providers controlling, controlled by or under common control with the Adviser that provide ongoing services to the Fund (“Covered Service Providers”) constitutes not more than 5% of the total amount of revenues paid to the independent auditors during the fiscal year in which the permissible non-audit services are provided to (a) the Fund, (b) the Adviser and (c) any entity controlling, controlled by or under common control with the Adviser that provides ongoing services to the Fund during the fiscal year in which the services are provided that would have to be approved by the Committee; (ii) the permissible non-audit services were not recognized by the Fund at the time of the engagement to be non-audit services; and (iii) such services are promptly brought to the attention of the Committee and approved by the Committee (or its delegate(s)) prior to the completion of the audit.
(2) For the Legg Mason ETF Investment Trust, the percentage of fees that were approved by the audit committee, with respect to: Audit-Related Fees were 100% and 100% for October 31, 2019 and October 31, 2020; Tax Fees were 100% and 100% for October 31, 2019 and October 31, 2020; and Other Fees were 100% and 100% for October 31, 2019 and October 31, 2020.
(f) N/A
(g) Non-audit fees billed by the Auditor for services rendered to Legg Mason ETF Investment Trust, LMPFA and any entity controlling, controlled by, or under common control with LMPFA that provides ongoing services to Legg Mason ETF Investment Trust during the reporting period were $472,562 in October 31, 2019 and $672,688 in October 31, 2020.
(h) Yes. Legg Mason ETF Investment Trust’s Audit Committee has considered whether the provision of non-audit services that were rendered to Service Affiliates, which were not pre-approved (not requiring pre-approval), is compatible with maintaining the Accountant’s independence. All services provided by the Auditor to the Legg Mason ETF Investment Trust or to Service Affiliates, which were required to be pre-approved, were pre-approved as required.
| ITEM 5. | AUDIT COMMITTEE OF LISTED REGISTRANTS. |
| | a) | The independent board members are acting as the registrant’s audit committee as specified in Section 3(a)(58)(B) of the Exchange Act. The Audit Committee consists of the following Board members: |
Paul R. Ades
Andrew L. Breech
Dwight B. Crane
Althea L. Duersten
Stephen R. Gross
Susan M. Heilbron
Frank G. Hubbard
Howard J. Johnson
Jerome H. Miller
Ken Miller
Thomas F. Schlafly
b) Not applicable.
| ITEM 6. | SCHEDULE OF INVESTMENTS. |
Included herein under Item 1.
| ITEM 7. | DISCLOSURE OF PROXY VOTING POLICIES AND PROCEDURES FOR CLOSED-END MANAGEMENT INVESTMENT COMPANIES. |
Not applicable.
| ITEM 8. | PORTFOLIO MANAGERS OF CLOSED-END MANAGEMENT INVESTMENT COMPANIES. |
Not applicable.
| ITEM 9. | PURCHASES OF EQUITY SECURITIES BY CLOSED-END MANAGEMENT INVESTMENT COMPANY AND AFFILIATED PURCHASERS. |
Not applicable.
| ITEM 10. | SUBMISSION OF MATTERS TO A VOTE OF SECURITY HOLDERS. |
Not applicable.
| ITEM 11. | CONTROLS AND PROCEDURES. |
| | (a) | The registrant’s principal executive officer and principal financial officer have concluded that the registrant’s disclosure controls and procedures (as defined in Rule 30a- 3(c) under the Investment Company Act of 1940, as amended (the “1940 Act”)) are effective as of a date within 90 days of the filing date of this report that includes the disclosure required by this paragraph, based on their evaluation of the disclosure controls and procedures required by Rule 30a-3(b) under the 1940 Act and 15d-15(b) under the Securities Exchange Act of 1934. |
| | (b) | There were no changes in the registrant’s internal control over financial reporting (as defined in Rule 30a-3(d) under the 1940 Act) that occurred during the second fiscal quarter of the period covered by this report that have materially affected, or are likely to materially affect the registrant’s internal control over financial reporting. |
| ITEM 12. | DISCLOSURE OF SECURITIES LENDING ACTIVITIES FOR CLOSED-END MANAGEMENT INVESTMENT COMPANIES. |
Not applicable.
(a) (1) Code of Ethics attached hereto.
Exhibit 99.CODE ETH
(a) (2) Certifications pursuant to section 302 of the Sarbanes-Oxley Act of 2002 attached hereto.
Exhibit 99.CERT
(b) Certifications pursuant to Section 906 of the Sarbanes-Oxley Act of 2002 attached hereto.
Exhibit 99.906CERT
SIGNATURES
Pursuant to the requirements of the Securities Exchange Act of 1934 and the Investment Company Act of 1940, the registrant has duly caused this Report to be signed on its behalf by the undersigned, there unto duly authorized.
| | |
| Legg Mason ETF Investment Trust |
| |
| By: | | /s/ Jane Trust |
| | Jane Trust |
| | Chief Executive Officer |
|
| Date: December 28, 2020 |
Pursuant to the requirements of the Securities Exchange Act of 1934 and the Investment Company Act of 1940, this report has been signed below by the following persons on behalf of the registrant and in the capacities and on the dates indicated.
| | |
| By: | | /s/ Jane Trust |
| | Jane Trust |
| | Chief Executive Officer |
|
| Date: December 28, 2020 |
| |
| By: | | /s/ Christopher Berarducci |
| | Christopher Berarducci |
| | Principal Financial Officer |
|
| Date: December 28, 2020 |