UNITED STATES
SECURITIES AND EXCHANGE COMMISSION
Washington, D.C. 20549
FORM N-CSR
CERTIFIED SHAREHOLDER REPORT OF REGISTERED
MANAGEMENT INVESTMENT COMPANIES
Investment Company Act file number 811-23096
Legg Mason ETF Investment Trust
(Exact name of registrant as specified in charter)
620 Eighth Avenue, 47th Floor, New York, NY 10018
(Address of principal executive offices) (Zip code)
Marc A. De Oliveira
Franklin Templeton
100 First Stamford Place
Stamford, CT 06902
(Name and address of agent for service)
Registrant’s telephone number, including area code: 1-877-721-1926
Date of fiscal year end: March 31
Date of reporting period: March 31, 2022
| ITEM 1. | REPORT TO STOCKHOLDERS. |
The Annual Report to Stockholders is filed herewith.

| | |
| Annual Report | | March 31, 2022 |
WESTERN ASSET
TOTAL RETURN ETF
WBND

|
| INVESTMENT PRODUCTS: NOT FDIC INSURED • NO BANK GUARANTEE • MAY LOSE VALUE |
Fund objective
The Fund seeks to maximize total return, consistent with prudent investment management and liquidity needs.
Letter from the president

Dear Shareholder,
We are pleased to provide the annual report of Western Asset Total Return ETF (the “Fund”) for a shortened reporting period ended March 31, 2022. The shortened reporting period is the result of a recent change to the Fund’s fiscal year end from December 31st to March 31st that was proposed by the Fund’s manager, Legg Mason Partners Fund Advisor, LLC, and approved by the Fund’s Board of Trustees. Please read on for a detailed look at prevailing economic and market conditions during the Fund’s reporting period and to learn how those conditions have affected Fund performance.
As always, we remain committed to providing you with excellent service and a full spectrum of investment choices. We also remain committed to supplementing the support you receive from your financial advisor. One way we accomplish this is through our website, www.franklintempleton.com. Here you can gain immediate access to market and investment information, including:
| • | | Fund net asset value and market price, |
| • | | Market insights and commentaries from our portfolio managers, and |
| • | | A host of educational resources. |
We look forward to helping you meet your financial goals.
Sincerely,

Patrick O’Connor
President and Chief Executive Officer - Investment Management President
April 29, 2022
| | |
II | | Western Asset Total Return ETF |
Fund overview
Q. What is the Fund’s investment strategy?
A. Western Asset Total Return ETF (the “Fund”) seeks to maximize total return, consistent with prudent investment management and liquidity needs. Under normal market conditions, the Fund will seek its investment objective by investing at least 80% of its assets in a portfolio comprised of fixed income securities, debt instruments, derivatives, equity securities of any type acquired in reorganizations of issuers of fixed income securities or debt instruments (“work out securities”), non-convertible preferred securities, warrants, cash and cash equivalents, foreign currencies, and exchange-traded funds (“ETFs”) that provide exposure to these investments (“Principal Investments”). Debt instruments include loans and similar debt instruments.
The fixed income securities and debt instruments in which the Fund may invest may pay fixed, variable or floating rates of interest. The Fund will not invest more than 20% of its portfolio in asset-backed securities (“ABS”) and non-agency, non-government sponsored enterprise and privately issued mortgage-backed securities (“MBS”) or more than 10% of the Fund’s total assets in collateralized debt obligations (“CDOs”). The Fund will also not invest more than 20% of its total assets in junior loans (e.g., debt instruments that are unsecured and subordinated).
Although the Fund may invest in securities and debt instruments of any maturity, the Fund expects the normal range of the Fund’s effective duration to be approximately 2 to 9 years.
The Fund may invest up to 30% of its assets in below investment grade fixed income securities or debt instruments commonly known as “junk bonds” or “high yield securities”.
The Fund may invest in securities issued by both U.S. and non-U.S. issuers (including issuers in emerging markets), but the Fund will not invest more than 30% of its total assets in securities or debt instruments of non-U.S. issuers or more than 25% of its total assets directly in non-U.S. dollar denominated securities or debt instruments.
At Western Asset Management Company, LLC (“Western Asset”), the Fund’s subadviser, we utilize a fixed income team approach, with decisions derived from interaction among various investment management sectors. The sector teams are comprised of Western Asset’s senior portfolio management personnel, research analysts and an in-house economist. Under this team approach, management of client fixed income portfolios will reflect a consensus of interdisciplinary views within the Western Asset organization.
Q. What were the overall market conditions during the Fund’s reporting period?
A. Fixed income markets experienced periods of volatility and, overall, declined over the three-month reporting period ended March 31, 2022. Volatility was driven by a number of factors, including the repercussions from the COVID-19 pandemic, rebounding global growth, sharply rising inflation and interest rates, central bank monetary policy tightening and the war in Ukraine.
| | | | | | |
| Western Asset Total Return ETF 2022 Annual Report | | | | | 1 | |
Fund overview (cont’d)
Short-term U.S. Treasury yields moved sharply higher as the Federal Reserve Board (the “Fed”) telegraphed that it expected to begin raising interest rates at its meeting in March 2022. The yield for the two-year Treasury note began the reporting period at 0.73% and ended the period at 2.28%. Long-term U.S. Treasury yields also moved higher given positive economic data and persistently inflation and expectations that the Fed would begin removing its monetary policy accommodation. The yield for the ten-year Treasury note began the reporting period at 1.52%, the low for the period, and ended the reporting period at 2.32%. The high of 2.48% took place on March 25, 2022.
All told, the Bloomberg U.S. Aggregate Indexi returned -5.93% for the three-month reporting period ended March 31, 2022. For comparison purposes, riskier fixed income securities, including high-yield bonds and emerging market debt, also generated weak results. Over the reporting period, the Bloomberg U.S. Corporate High Yield 2% Issuer Cap Indexii and the JPMorgan Emerging Markets Bond Index Globaliii returned -4.82% and -9.26%, respectively.
Q. How did we respond to these changing market conditions?
A. There were several adjustments made to the Fund during the reporting period. We tactically managed the Fund’s duration as yields significantly increased over the reporting period, generally increasing the Fund’s overall long duration position relative to the benchmark. Additionally, we increased the Fund’s exposure to investment-grade corporate bonds as investment-grade spreads widened in the course of the period. Later in the period we added exposure to agency MBS, thereby reducing the Fund’s underweight, focusing primarily on front-end issues with yield advantage and attractive spreads. We also reduced the Fund’s exposure to emerging markets, particularly in local positions that have done well year-to-date, as well as in Russian local bonds and ruble as geopolitical tensions escalated in February 2022 and as exchange rates improved in March.
During the reporting period, the Fund used interest rate futures, options, swaps and swaptions to manage its duration and yield curve exposure. In aggregate, these instruments detracted from results. Credit default swaps on both investment-grade and high-yield issuers and indices were used to manage the Fund’s credit exposures and had a minimal impact on relative performance. Finally, the Fund’s use of currency forwards, to take outright currency positions as well as to hedge non-U.S. dollar currency exposure, was a modest contributor to returns.
Performance review
For the three-month period from January 1,2022 through March 31, 2022, Western Asset Total Return ETF generated a -12.28% return on a net asset value (“NAV”)iv basis and -11.94% based on its market pricev per share.
The performance table shows the Fund’s total return for the three months ended March 31, 2022 based on its NAV and market price as of March 31, 2022. The Fund’s broad-based market index, the Bloomberg U.S. Aggregate Index, returned -5.93% over the same time
| | | | |
2 | | | | Western Asset Total Return ETF 2022 Annual Report |
frame. The Lipper Core Plus Bond Funds Category Averagevi returned -5.80% for the same period. Please note that Lipper performance returns are based on each fund’s NAV.
| | | | |
| Performance Snapshot as of March 31, 2022 (unaudited) | |
| | | 3 months | |
| Western Asset Total Return ETF: | | | | |
$22.88 (NAV) | | | -12.28 | %*† |
$23.02 (Market Price) | | | -11.94 | %*‡ |
| Bloomberg U.S. Aggregate Index | | | -5.93 | % |
| Lipper Core Plus Bond Funds Category Average | | | -5.80 | % |
The performance shown represents past performance. Past performance is no guarantee of future results and current performance may be higher or lower than the performance shown above. Principal value and investment returns will fluctuate so shares, when sold, may be worth more or less than their original cost. Performance data current to the most recent month-end is available at www.franklintempleton.com.
Investors buy and sell shares of an exchange-traded fund (“ETF”) at market price (not NAV) in the secondary market throughout the trading day. These shares are not individually available for direct purchase from or direct redemption to the ETF. Market price returns are typically based upon the official closing price of the Fund’s shares. These returns do not represent investors’ returns had they traded shares at other times. Performance figures for periods shorter than one year represent cumulative figures and are not annualized.
Information showing the Fund’s net asset value, market price, premiums and discounts, and bid-ask spreads for various time periods is available by visiting the Fund’s website at www.franklintempleton.com.
As of the Fund’s current prospectus dated May 1, 2022, the gross total annual fund operating expense ratio for the Fund was 0.49%.
The management agreement between Legg Mason ETF Investment Trust (the “Trust”) on behalf of the Fund and Legg Mason Partners Fund Advisor, LLC (the “manager” or “LMPFA”) (the “Management Agreement”) provides that LMPFA will pay all operating expenses of the Fund, other than interest expenses, taxes, brokerage expenses, future 12b-1 fees (if any), acquired fund fees and expenses, extraordinary expenses and the management fee payable to LMPFA under the Management Agreement. LMPFA will also pay all subadvisory fees of the Fund. The manager has agreed to waive and/or reimburse management fees so that the ratio of total annual fund operating expenses will not exceed 0.45% (subject to the same exclusions as the Management Agreement). Total annual fund operating expenses after waiving and/or reimbursing management fees exceed the expense cap as a result of acquired fund fees and expenses. This arrangement cannot be terminated prior to May 1, 2023 without the Board of Trustee’ consent.
* Total returns are based on changes in NAV or market price, respectively. Returns reflect the deduction of all Fund expenses. Returns do not reflect the deduction of brokerage commissions or taxes that investors pay on distributions or the sale of shares.
† Total return assumes the reinvestment of all distributions at NAV.
| | | | | | |
| Western Asset Total Return ETF 2022 Annual Report | | | | | 3 | |
Fund overview (cont’d)
‡ Total return assumes the reinvestment of all distributions at market price, which typically is based upon the official closing price of the Fund’s shares.
Q. What were the leading contributors to performance?
A. The largest contributor to the Fund’s relative performance during the reporting period was its underweight exposure to agency MBS, as the sector generated negative excess returns.
Q. What were the leading detractors from performance?
A. The largest detractor from performance was the Fund’s rates positioning. The Fund’s long duration and yield curve positioning detracted from returns as yields significantly rose, with front-end yields rising more than yields in the long end.
The Fund’s exposures to emerging markets were also a significant detractor, mainly due to the selloff in Russian assets due to financial and economic sanctions as a result of Russia’s invasion of Ukraine.
Additionally, the Fund’s inflation-linked exposures detracted as inflation expectations continued to rise. Non-U.S. developed markets also detracted from returns, due to positions in German and Japanese rates.
The Fund’s overweight exposures to corporate credit and structured product, in aggregate, was also a headwind for returns. High-yield corporate bond exposures modestly detracted as spreads widened, although tactical adds to investment-grade corporate credit provided partial offset their impact. The Fund’s exposures to structured products, including non-agency residential MBS, commercial MBS and ABS, also detracted during the reporting period.
Looking for additional information?
The Fund’s daily NAV is available online at www.franklintempleton.com. The Fund is traded under the symbol “WBND” and its closing market price is available on most financial websites. In a continuing effort to provide information concerning the Fund, shareholders may call 1-877-721-1926 (toll free), Monday through Friday from 8:00 a.m. to 5:30 p.m. Eastern time, for the Fund’s current NAV, market price and other information.
Thank you for your investment in Western Asset Total Return ETF. As always, we appreciate that you have chosen us to manage your assets and we remain focused on achieving the Fund’s investment goals.
Sincerely,
Western Asset Management Company, LLC
April 20, 2022
RISKS: Fixed income securities involve interest rate, credit, inflation and reinvestment risks. As interest rates rise, the value of fixed income securities falls. High-yield securities include greater
| | | | |
4 | | | | Western Asset Total Return ETF 2022 Annual Report |
price volatility, illiquidity and possibility of default. International investments are subject to special risks, including currency fluctuations, social, economic and political uncertainties, which could increase volatility. These risks are magnified in emerging markets. Emerging market countries tend to have economic, political and legal systems that are less developed and are less stable than those of more developed countries. Derivatives, such as options and futures, can be illiquid, may disproportionately increase losses, and have a potentially large impact on Fund performance. The use of leverage may increase volatility and possibility of loss. Potential active and frequent trading may result in higher transaction costs and increased investor liability. Asset-backed, mortgage-backed or mortgage-related securities are subject to prepayment and extension risks. Active management and diversification do not ensure gains or protect against market declines. Please see the Fund’s prospectus for a more complete discussion of these and other risks and the Fund’s investment strategies.
Portfolio holdings and breakdowns are as of March 31, 2022 and are subject to change and may not be representative of the portfolio managers’ current or future investments. Please refer to pages 12 through 54 for a list and percentage breakdown of the Fund’s holdings.
The mention of sector breakdowns is for informational purposes only and should not be construed as a recommendation to purchase or sell any securities. The information provided regarding such sectors is not a sufficient basis upon which to make an investment decision. Investors seeking financial advice regarding the appropriateness of investing in any securities or investment strategies discussed should consult their financial professional. Portfolio holdings are subject to change at any time and may not be representative of the portfolio managers’ current or future investments. The Fund’s top five sector holdings (as a percentage of net assets) as of March 31, 2022 were: corporate bonds & notes (38.7%), mortgage-backed securities (17.3%), collateralized mortgage obligations (10.3%), sovereign bonds (9.6%) and U.S. government & agency obligations (7.4%). The Fund’s portfolio composition is subject to change at any time.
All investments are subject to risk including the possible loss of principal. Past performance is no guarantee of future results. An index is a statistical composite that tracks a specified financial market, sector or rules-based investment process. Unlike a fund, an index does not actually hold a portfolio of securities and therefore does not incur the expenses incurred by a fund. These expenses negatively impact fund performance. All index performance reflects no deduction for fees, expenses or taxes. Please note that an investor cannot invest directly in an index.
The information provided is not intended to be a forecast of future events, a guarantee of future results or investment advice. Views expressed may differ from those of the firm as a whole.
| | | | | | |
| Western Asset Total Return ETF 2022 Annual Report | | | | | 5 | |
Fund overview (cont’d)
| i | The Bloomberg U.S. Aggregate Index is a broad-based bond index comprised of government, corporate, mortgage-and asset-backed issues, rated investment grade or higher, and having at least one year to maturity. |
| ii | The Bloomberg U.S. Corporate High Yield—2% Issuer Cap Index is an index of the 2% Issuer Cap component of the Bloomberg U.S. Corporate High Yield Index, which covers the U.S. dollar-denominated, non-investment grade, fixed-rate, taxable corporate bond market. |
| iii | The JPMorgan Emerging Markets Bond Index Global tracks total returns for U.S. dollar-denominated debt instruments issued by emerging market sovereign and quasi-sovereign entities: Brady bonds, loans, Eurobonds and local market instruments. |
| iv | Net Asset Value (“NAV”) is calculated by subtracting total liabilities from total assets and dividing the results by the number of shares outstanding. |
| V | Market price is determined by supply and demand. It is the price at which an investor purchases or sells shares of the Fund. The market price may differ from the Fund’s NAV. |
| vi | Lipper, Inc., a wholly-owned subsidiary of Refinitiv, provides independent insight on global collective investments. Returns are based on the three-month period ended March 31, 2022, including the reinvestment of all distributions, including returns of capital, if any, calculated among the 322 funds in the Fund’s Lipper category. |
| | | | |
6 | | | | Western Asset Total Return ETF 2022 Annual Report |
Fund at a glance† (unaudited)
Investment breakdown (%) as a percent of total investments
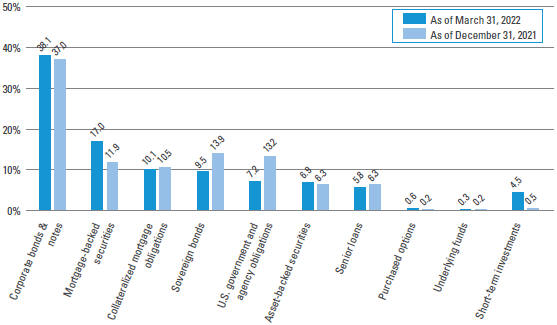
| † | The bar graph above represents the composition of the Fund’s investments as of March 31, 2022 and December 31, 2021 and does not include derivatives, such as written options, futures contracts, forward foreign currency contracts and swap contracts. The Fund is actively managed. As a result, the composition of the Fund’s investments is subject to change at any time. |
| | | | | | |
| Western Asset Total Return ETF 2022 Annual Report | | | | | 7 | |
Fund expenses (unaudited)
Example
As a shareholder of the Fund, you may incur two types of costs: (1) transaction costs, such as brokerage commissions paid on purchases and sales of Fund shares; and (2) ongoing costs, including management fees; and other Fund expenses. This example is intended to help you understand your ongoing costs (in dollars) of investing in the Fund and to compare these costs with the ongoing costs of investing in other funds.
This example is based on an investment of $1,000 invested on October 1, 2021 and held for the six months ended March 31, 2022, unless otherwise noted.
Actual expenses
The table below titled “Based on Actual Total Return” provides information about actual account values and actual expenses. You may use the information provided in this table, together with the amount you invested, to estimate the expenses that you paid over the period. To estimate the expenses you paid on your account, divide your ending account value by $1,000 (for example, an $8,600 ending account value divided by $1,000 = 8.6), then multiply the result by the number under the heading entitled “Expenses Paid During the Period”.
Hypothetical example for comparison purposes
The table below titled “Based on Hypothetical Total Return” provides information about hypothetical account values and hypothetical expenses based on the actual expense ratio and an assumed rate of return of 5.00% per year before expenses, which is not the Fund’s actual return. The hypothetical account values and expenses may not be used to estimate the actual ending account balance or expenses you paid for the period. You may use the information provided in this table to compare the ongoing costs of investing in the Fund and other funds. To do so, compare the 5.00% hypothetical example relating to the Fund with the 5.00% hypothetical examples that appear in the shareholder reports of the other funds.
Please note that the expenses shown in the table below are meant to highlight your ongoing costs only and do not reflect any transactional costs, such as brokerage commissions paid on purchases and sales of Fund shares. Therefore, the table is useful in comparing ongoing costs only, and will not help you determine the relative total costs of owning different funds. In addition, if these transaction costs were included, your costs would have been higher.
| | | | | | | | | | | | | | | | | | | | | | | | | | | | | | | | | | | | | | | | | | | | | | | | | | |
| | |
| Based on actual total return1 | | | | Based on hypothetical total return4 |
Actual Total Return2 | | Beginning
Account
Value | | Ending
Account
Value | | Annualized
Expense
Ratio | | Expenses
Paid During
the Period3 | | | | Hypothetical
Annualized
Total Return | | Beginning
Account
Value | | Ending
Account
Value | | Annualized
Expense
Ratio | | Expenses
Paid During
the Period5 |
| | | -12.28% | | | | $ | 1,000.00 | | | | $ | 877.20 | | | | | 0.45 | % | | | $ | 1.04 | | | | | | | 5.00 | % | | | | $1,000.00 | | | | $ | 1,022.69 | | | | | 0.45 | % | | | $ | 2.27 | |
| | | | |
8 | | | | Western Asset Total Return ETF 2022 Annual Report |
| 1 | For the period January 1, 2022 through March 31, 2022. |
| 2 | Assumes the reinvestment of all distributions, including returns of capital, if any, at net asset value. Total return is not annualized, as it may not be representative of the total return for the year. Performance figures may reflect fee waivers and/or expense reimbursements. In the absence of fee waivers and/or expense reimbursements, the total return would have been lower. Past performance is no guarantee of future results. |
| 3 | Expenses (net of fee waivers and/or expense reimbursements) are equal to fund’s annualized expense ratio multiplied by the average account value over the period, multiplied by the number of days in the most recent fiscal period (90), then divided by 365. |
| 4 | For the six months ended March 31, 2022. |
| 5 | Expenses (net of fee waivers and/or expense reimbursements) are equal to the Fund’s annualized expense ratio multiplied by the average account value over the period, multiplied by the number of days in the most recent fiscal half-year (182), then divided by 365. |
| | | | | | |
| Western Asset Total Return ETF 2022 Annual Report | | | | | 9 | |
Fund performance (unaudited)
| | | | |
| Net Asset Value | | | |
| Average annual total returns1 | | | |
| Twelve Months Ended 3/31/22 | | | -11.04 | % |
| Inception* through 3/31/22 | | | 2.05 | |
| |
| Cumulative total returns1 | | | |
| Inception date of 10/3/18 through 3/31/22 | | | 7.34 | % |
| | | | |
| Market Price | | | |
| Average annual total returns2 | | | |
| Twelve Months Ended 3/31/22 | | | -10.47 | % |
| Inception* through 3/31/22 | | | 2.22 | |
| |
| Cumulative total returns2 | | | |
| Inception date of 10/3/18 through 3/31/22 | | | 7.97 | % |
All figures represent past performance and are not a guarantee of future results. Investment returns and principal value of an investment will fluctuate so that an investor’s shares, when sold, may be worth more or less than their original cost. NAV returns assume that dividends and capital gain distributions have been reinvested in the Fund at NAV. The returns shown do not reflect the deduction of brokerage commissions or taxes that investors would pay on distributions or the sale of shares. Performance figures may reflect fee waivers and/or expense reimbursements. In the absence of fee waivers and/or expense reimbursements, the total return would have been lower.
Investors buy and sell shares of the Fund at market price, not NAV, in the secondary market throughout the trading day. These shares are not individually available for direct purchase from or direct redemption to the Fund. The Fund’s per share NAV is the value of one share of the Fund and is calculated by dividing the value of total assets less total liabilities by the number of shares outstanding. The NAV return is based on the NAV of the Fund and effective July 1, 2020, market price returns typically are based upon the official closing price of the Fund’s shares. Prior to July 1, 2020, market price returns generally were based upon the mid-point between the bid and ask on the Fund’s principal trading market when the Fund’s NAV was determined, which was typically 4:00 p.m. Eastern time (U.S.). Market price performance reported for periods prior to July 1, 2020 continue to reflect market prices calculated based upon the mid-point between the bid and ask on the Fund’s principal trading market typically as of 4:00 p.m. Eastern time (U.S.). These returns do not represent investors’ returns had they traded shares at other times. NAV and market price returns assume that dividends and capital gain distributions have been reinvested in the Fund at NAV and market price, respectively. As with other exchange-traded funds, NAV returns and market price returns may differ because of factors such as the supply and demand for Fund shares and investors’ assessment of the underlying value of the Fund’s portfolio securities.
| 1 | Assumes the reinvestment of all distributions, including returns of capital, if any, at net asset value. |
| 2 | Assumes the reinvestment of all distributions, including returns of capital, if any, at market price. |
| * | Inception date of the Fund is October 3, 2018. |
| | | | |
10 | | | | Western Asset Total Return ETF 2022 Annual Report |
Historical performance
Value of $10,000 invested in
Western Asset Total Return ETF vs. Bloomberg U.S. Aggregate Index† — October 3, 2018 - March 31, 2022
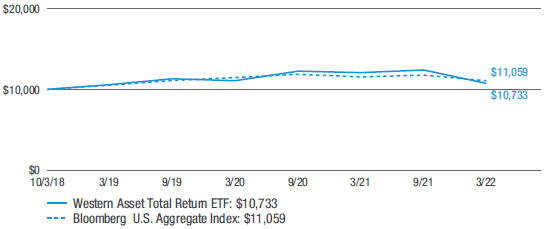
All figures represent past performance and are not a guarantee of future results. Investment returns and principal value of an investment will fluctuate so that an investor’s shares, when sold, may be worth more or less than their original cost. NAV returns assume that dividends and capital gain distributions have been reinvested in the Fund at NAV. The returns shown do not reflect the deduction of brokerage commissions or taxes that investors would pay on distributions or the sale of shares. Performance figures may reflect fee waivers and/or expense reimbursements. In the absence of fee waivers and/or expense reimbursements, the total return would have been lower.
| † | Hypothetical illustration of $10,000 invested in the Western Asset Total Return ETF on October 3, 2018 (inception date), assuming the reinvestment of all distributions, including returns of capital, if any, at net asset value through March 31, 2022. The hypothetical illustration also assumes a $10,000 investment in the Bloomberg U.S. Aggregate Index. The Fund’s per share NAV is the value of one share of the Fund and is calculated by dividing the value of total assets less total liabilities by the number of shares outstanding. The NAV return is based on the NAV of the Fund. The Bloomberg U.S. Aggregate Index (the “Index”) is a broad-based bond index comprised of government, corporate, mortgage and asset-backed issues, rated investment grade or higher, and having at least one year to maturity. The Index is not subject to the same management and trading expenses as a fund. An index is a statistical composite that tracks a specified financial market, sector, or rules-based investment process. Unlike a fund, an index does not actually hold a portfolio of securities and therefore does not incur the expenses incurred by a fund. These expenses negatively impact fund performance. All index performance reflects no deduction for fees, expenses or taxes. Please note that an investor cannot invest directly in an index. |
| | | | | | |
| Western Asset Total Return ETF 2022 Annual Report | | | | | 11 | |
Schedule of investments
March 31, 2022
Western Asset Total Return ETF
(Percentages shown based on Fund net assets)
| | | | | | | | | | | | | | | | |
| Security | | Rate | | | Maturity
Date | | | Face
Amount† | | | Value | |
| Corporate Bonds & Notes — 38.7% | | | | | | | | | | | | | | | | |
| Communication Services — 5.7% | | | | | | | | | | | | | | | | |
Diversified Telecommunication Services — 1.6% | | | | | | | | | | | | | | | | |
AT&T Inc., Senior Notes | | | 2.300 | % | | | 6/1/27 | | | | 90,000 | | | $ | 85,749 | |
AT&T Inc., Senior Notes | | | 1.650 | % | | | 2/1/28 | | | | 90,000 | | | | 82,000 | |
AT&T Inc., Senior Notes | | | 2.250 | % | | | 2/1/32 | | | | 30,000 | | | | 26,601 | |
AT&T Inc., Senior Notes | | | 2.550 | % | | | 12/1/33 | | | | 40,000 | | | | 35,538 | |
AT&T Inc., Senior Notes | | | 5.350 | % | | | 9/1/40 | | | | 20,000 | | | | 22,885 | |
AT&T Inc., Senior Notes | | | 5.550 | % | | | 8/15/41 | | | | 10,000 | | | | 11,636 | |
AT&T Inc., Senior Notes | | | 3.100 | % | | | 2/1/43 | | | | 200,000 | | | | 172,658 | |
AT&T Inc., Senior Notes | | | 4.350 | % | | | 6/15/45 | | | | 19,000 | | | | 19,178 | |
AT&T Inc., Senior Notes | | | 3.300 | % | | | 2/1/52 | | | | 20,000 | | | | 17,144 | |
AT&T Inc., Senior Notes | | | 3.500 | % | | | 9/15/53 | | | | 50,000 | | | | 43,872 | |
AT&T Inc., Senior Notes | | | 3.550 | % | | | 9/15/55 | | | | 67,000 | | | | 59,092 | |
AT&T Inc., Senior Notes | | | 3.650 | % | | | 9/15/59 | | | | 20,000 | | | | 17,538 | |
Verizon Communications Inc., Senior Notes | | | 3.000 | % | | | 3/22/27 | | | | 10,000 | | | | 9,883 | |
Verizon Communications Inc., Senior Notes | | | 2.100 | % | | | 3/22/28 | | | | 40,000 | | | | 37,283 | |
Verizon Communications Inc., Senior Notes | | | 3.150 | % | | | 3/22/30 | | | | 40,000 | | | | 39,339 | |
Verizon Communications Inc., Senior Notes | | | 1.750 | % | | | 1/20/31 | | | | 60,000 | | | | 52,312 | |
Verizon Communications Inc., Senior Notes | | | 2.550 | % | | | 3/21/31 | | | | 140,000 | | | | 130,067 | |
Verizon Communications Inc., Senior Notes | | | 2.355 | % | | | 3/15/32 | | | | 194,000 | | | | 175,224 | (a) |
Verizon Communications Inc., Senior Notes | | | 4.500 | % | | | 8/10/33 | | | | 340,000 | | | | 364,780 | |
Verizon Communications Inc., Senior Notes | | | 5.250 | % | | | 3/16/37 | | | | 30,000 | | | | 34,949 | |
Verizon Communications Inc., Senior Notes | | | 2.650 | % | | | 11/20/40 | | | | 150,000 | | | | 127,599 | |
Verizon Communications Inc., Senior Notes | | | 3.400 | % | | | 3/22/41 | | | | 10,000 | | | | 9,374 | |
Verizon Communications Inc., Senior Notes | | | 2.875 | % | | | 11/20/50 | | | | 265,000 | | | | 221,414 | |
Total Diversified Telecommunication Services | | | | | | | | 1,796,115 | |
Entertainment — 0.3% | | | | | | | | | | | | | | | | |
Magallanes Inc., Senior Notes | | | 3.755 | % | | | 3/15/27 | | | | 20,000 | | | | 19,964 | (a) |
Magallanes Inc., Senior Notes | | | 4.054 | % | | | 3/15/29 | | | | 30,000 | | | | 30,149 | (a) |
Magallanes Inc., Senior Notes | | | 4.279 | % | | | 3/15/32 | | | | 150,000 | | | | 150,667 | (a) |
Magallanes Inc., Senior Notes | | | 5.050 | % | | | 3/15/42 | | | | 10,000 | | | | 10,200 | (a) |
Magallanes Inc., Senior Notes | | | 5.141 | % | | | 3/15/52 | | | | 100,000 | | | | 102,310 | (a) |
Total Entertainment | | | | | | | | | | | | | | | 313,290 | |
Interactive Media & Services — 0.0%†† | | | | | | | | | | | | | | | | |
Alphabet Inc., Senior Notes | | | 0.800 | % | | | 8/15/27 | | | | 30,000 | | | | 27,087 | |
Alphabet Inc., Senior Notes | | | 1.100 | % | | | 8/15/30 | | | | 30,000 | | | | 26,217 | |
Total Interactive Media & Services | | | | | | | | | | | | | | | 53,304 | |
See Notes to Financial Statements.
| | | | |
12 | | | | Western Asset Total Return ETF 2022 Annual Report |
Western Asset Total Return ETF
(Percentages shown based on Fund net assets)
| | | | | | | | | | | | | | | | |
| Security | | Rate | | | Maturity
Date | | | Face
Amount† | | | Value | |
Media — 2.3% | | | | | | | | | | | | | | | | |
CCO Holdings LLC/CCO Holdings Capital Corp., Senior Notes | | | 5.125 | % | | | 5/1/27 | | | | 250,000 | | | $ | 250,369 | (a) |
CCO Holdings LLC/CCO Holdings Capital Corp., Senior Notes | | | 4.500 | % | | | 8/15/30 | | | | 10,000 | | | | 9,383 | (a) |
CCO Holdings LLC/CCO Holdings Capital Corp., Senior Notes | | | 4.250 | % | | | 2/1/31 | | | | 218,000 | | | | 197,835 | (a) |
CCO Holdings LLC/CCO Holdings Capital Corp., Senior Notes | | | 4.750 | % | | | 2/1/32 | | | | 30,000 | | | | 27,937 | (a) |
CCO Holdings LLC/CCO Holdings Capital Corp., Senior Notes | | | 4.500 | % | | | 5/1/32 | | | | 450,000 | | | | 411,615 | |
Charter Communications Operating LLC/ Charter Communications Operating Capital Corp., Senior Secured Notes | | | 4.908 | % | | | 7/23/25 | | | | 270,000 | | | | 279,993 | |
Charter Communications Operating LLC/ Charter Communications Operating Capital Corp., Senior Secured Notes | | | 5.050 | % | | | 3/30/29 | | | | 100,000 | | | | 105,882 | |
Charter Communications Operating LLC/ Charter Communications Operating Capital Corp., Senior Secured Notes | | | 2.800 | % | | | 4/1/31 | | | | 50,000 | | | | 45,065 | |
Charter Communications Operating LLC/ Charter Communications Operating Capital Corp., Senior Secured Notes | | | 4.400 | % | | | 4/1/33 | | | | 60,000 | | | | 59,823 | |
Charter Communications Operating LLC/ Charter Communications Operating Capital Corp., Senior Secured Notes | | | 5.375 | % | | | 4/1/38 | | | | 80,000 | | | | 82,173 | |
Charter Communications Operating LLC/ Charter Communications Operating Capital Corp., Senior Secured Notes | | | 3.500 | % | | | 3/1/42 | | | | 90,000 | | | | 74,406 | |
Charter Communications Operating LLC/ Charter Communications Operating Capital Corp., Senior Secured Notes | | | 5.750 | % | | | 4/1/48 | | | | 60,000 | | | | 63,788 | |
Charter Communications Operating LLC/ Charter Communications Operating Capital Corp., Senior Secured Notes | | | 4.800 | % | | | 3/1/50 | | | | 20,000 | | | | 18,998 | |
Charter Communications Operating LLC/ Charter Communications Operating Capital Corp., Senior Secured Notes | | | 5.500 | % | | | 4/1/63 | | | | 30,000 | | | | 30,178 | |
Comcast Corp., Senior Notes | | | 3.150 | % | | | 3/1/26 | | | | 20,000 | | | | 20,174 | |
Comcast Corp., Senior Notes | | | 3.300 | % | | | 4/1/27 | | | | 50,000 | | | | 50,586 | |
Comcast Corp., Senior Notes | | | 4.150 | % | | | 10/15/28 | | | | 45,000 | | | | 47,287 | |
Comcast Corp., Senior Notes | | | 4.250 | % | | | 10/15/30 | | | | 210,000 | | | | 224,020 | |
See Notes to Financial Statements.
| | | | | | |
| Western Asset Total Return ETF 2022 Annual Report | | | | | 13 | |
Schedule of investments (cont’d)
March 31, 2022
Western Asset Total Return ETF
(Percentages shown based on Fund net assets)
| | | | | | | | | | | | | | | | |
| Security | | Rate | | | Maturity
Date | | | Face
Amount† | | | Value | |
Media — continued | | | | | | | | | | | | | | | | |
Comcast Corp., Senior Notes | | | 3.750 | % | | | 4/1/40 | | | | 20,000 | | | $ | 20,132 | |
Comcast Corp., Senior Notes | | | 4.000 | % | | | 8/15/47 | | | | 10,000 | | | | 10,202 | |
Comcast Corp., Senior Notes | | | 3.450 | % | | | 2/1/50 | | | | 10,000 | | | | 9,355 | |
Comcast Corp., Senior Notes | | | 2.800 | % | | | 1/15/51 | | | | 20,000 | | | | 16,865 | |
DISH DBS Corp., Senior Notes | | | 5.875 | % | | | 11/15/24 | | | | 510,000 | | | | 508,725 | |
DISH DBS Corp., Senior Notes | | | 5.125 | % | | | 6/1/29 | | | | 50,000 | | | | 42,580 | |
DISH DBS Corp., Senior Secured Notes | | | 5.250 | % | | | 12/1/26 | | | | 20,000 | | | | 19,050 | (a) |
Time Warner Cable LLC, Senior Secured Notes | | | 6.550 | % | | | 5/1/37 | | | | 10,000 | | | | 11,500 | |
Total Media | | | | | | | | | | | | | | | 2,637,921 | |
Wireless Telecommunication Services — 1.5% | | | | | | | | | | | | | | | | |
CSC Holdings LLC, Senior Notes | | | 5.375 | % | | | 2/1/28 | | | | 200,000 | | | | 194,112 | (a) |
CSC Holdings LLC, Senior Notes | | | 4.500 | % | | | 11/15/31 | | | | 200,000 | | | | 179,254 | (a) |
Sprint Capital Corp., Senior Notes | | | 8.750 | % | | | 3/15/32 | | | | 340,000 | | | | 457,980 | |
Sprint Corp., Senior Notes | | | 7.875 | % | | | 9/15/23 | | | | 20,000 | | | | 21,250 | |
T-Mobile USA Inc., Senior Notes | | | 2.250 | % | | | 2/15/26 | | | | 10,000 | | | | 9,423 | |
T-Mobile USA Inc., Senior Notes | | | 2.625 | % | | | 2/15/29 | | | | 40,000 | | | | 36,509 | |
T-Mobile USA Inc., Senior Notes | | | 3.375 | % | | | 4/15/29 | | | | 10,000 | | | | 9,511 | |
T-Mobile USA Inc., Senior Notes | | | 2.875 | % | | | 2/15/31 | | | | 30,000 | | | | 27,028 | |
T-Mobile USA Inc., Senior Notes | | | 3.500 | % | | | 4/15/31 | | | | 90,000 | | | | 84,688 | |
T-Mobile USA Inc., Senior Notes | | | 3.500 | % | | | 4/15/31 | | | | 130,000 | | | | 122,327 | (a) |
T-Mobile USA Inc., Senior Secured Notes | | | 3.500 | % | | | 4/15/25 | | | | 210,000 | | | | 211,390 | |
T-Mobile USA Inc., Senior Secured Notes | | | 3.750 | % | | | 4/15/27 | | | | 10,000 | | | | 10,059 | |
T-Mobile USA Inc., Senior Secured Notes | | | 3.875 | % | | | 4/15/30 | | | | 30,000 | | | | 30,115 | |
T-Mobile USA Inc., Senior Secured Notes | | | 2.550 | % | | | 2/15/31 | | | | 40,000 | | | | 36,272 | |
Vmed O2 UK Financing I PLC, Senior Secured Notes | | | 4.750 | % | | | 7/15/31 | | | | 200,000 | | | | 188,500 | (a) |
Vodafone Group PLC, Senior Notes | | | 4.375 | % | | | 5/30/28 | | | | 80,000 | | | | 83,660 | |
Total Wireless Telecommunication Services | | | | | | | | 1,702,078 | |
Total Communication Services | | | | | | | | | | | | | | | 6,502,708 | |
| Consumer Discretionary — 3.7% | | | | | | | | | | | | | | | | |
Automobiles — 1.5% | | | | | | | | | | | | | | | | |
Ford Motor Co., Senior Notes | | | 3.250 | % | | | 2/12/32 | | | | 190,000 | | | | 169,695 | |
Ford Motor Credit Co. LLC, Senior Notes | | | 3.375 | % | | | 11/13/25 | | | | 500,000 | | | | 488,722 | |
Ford Motor Credit Co. LLC, Senior Notes | | | 4.950 | % | | | 5/28/27 | | | | 230,000 | | | | 233,864 | |
Ford Motor Credit Co. LLC, Senior Notes | | | 4.000 | % | | | 11/13/30 | | | | 200,000 | | | | 188,340 | |
General Motors Co., Senior Notes | | | 5.400 | % | | | 10/2/23 | | | | 20,000 | | | | 20,694 | |
General Motors Co., Senior Notes | | | 6.125 | % | | | 10/1/25 | | | | 130,000 | | | | 139,558 | |
General Motors Co., Senior Notes | | | 5.950 | % | | | 4/1/49 | | | | 10,000 | | | | 11,113 | |
See Notes to Financial Statements.
| | | | |
14 | | | | Western Asset Total Return ETF 2022 Annual Report |
Western Asset Total Return ETF
(Percentages shown based on Fund net assets)
| | | | | | | | | | | | | | | | |
| Security | | Rate | | | Maturity
Date | | | Face
Amount† | | | Value | |
Automobiles — continued | | | | | | | | | | | | | | | | |
General Motors Financial Co. Inc., Senior Notes | | | 3.100 | % | | | 1/12/32 | | | | 20,000 | | | $ | 17,976 | |
Nissan Motor Co. Ltd., Senior Notes | | | 3.522 | % | | | 9/17/25 | | | | 200,000 | | | | 196,010 | (a) |
Nissan Motor Co. Ltd., Senior Notes | | | 4.345 | % | | | 9/17/27 | | | | 240,000 | | | | 236,491 | (a) |
Total Automobiles | | | | | | | | | | | | | | | 1,702,463 | |
Hotels, Restaurants & Leisure — 1.0% | | | | | | | | | | | | | | | | |
Las Vegas Sands Corp., Senior Notes | | | 2.900 | % | | | 6/25/25 | | | | 160,000 | | | | 149,100 | |
McDonald’s Corp., Senior Notes | | | 3.700 | % | | | 1/30/26 | | | | 10,000 | | | | 10,239 | |
McDonald’s Corp., Senior Notes | | | 3.500 | % | | | 3/1/27 | | | | 10,000 | | | | 10,175 | |
McDonald’s Corp., Senior Notes | | | 3.800 | % | | | 4/1/28 | | | | 50,000 | | | | 51,444 | |
McDonald’s Corp., Senior Notes | | | 4.450 | % | | | 9/1/48 | | | | 230,000 | | | | 247,330 | |
NCL Corp. Ltd., Senior Notes | | | 5.875 | % | | | 3/15/26 | | | | 250,000 | | | | 237,540 | (a) |
Sands China Ltd., Senior Notes | | | 5.125 | % | | | 8/8/25 | | | | 200,000 | | | | 198,250 | |
Sands China Ltd., Senior Notes | | | 2.550 | % | | | 3/8/27 | | | | 200,000 | | | | 173,700 | (a) |
VOC Escrow Ltd., Senior Secured Notes | | | 5.000 | % | | | 2/15/28 | | | | 40,000 | | | | 37,200 | (a) |
Total Hotels, Restaurants & Leisure | | | | | | | | | | | | | | | 1,114,978 | |
Household Durables — 0.1% | | | | | | | | | | | | | | | | |
Lennar Corp., Senior Notes | | | 4.500 | % | | | 4/30/24 | | | | 40,000 | | | | 41,005 | |
MDC Holdings Inc., Senior Notes | | | 6.000 | % | | | 1/15/43 | | | | 10,000 | | | | 10,265 | |
Total Household Durables | | | | | | | | | | | | | | | 51,270 | |
Internet & Direct Marketing Retail — 1.0% | | | | | | | | | | | | | | | | |
Amazon.com Inc., Senior Notes | | | 1.500 | % | | | 6/3/30 | | | | 10,000 | | | | 8,948 | |
Amazon.com Inc., Senior Notes | | | 2.100 | % | | | 5/12/31 | | | | 20,000 | | | | 18,579 | |
Amazon.com Inc., Senior Notes | | | 3.875 | % | | | 8/22/37 | | | | 470,000 | | | | 497,467 | |
Amazon.com Inc., Senior Notes | | | 4.050 | % | | | 8/22/47 | | | | 90,000 | | | | 97,901 | |
Amazon.com Inc., Senior Notes | | | 3.100 | % | | | 5/12/51 | | | | 60,000 | | | | 56,309 | |
Prosus NV, Senior Notes | | | 3.061 | % | | | 7/13/31 | | | | 200,000 | | | | 166,137 | (a) |
Prosus NV, Senior Notes | | | 3.832 | % | | | 2/8/51 | | | | 400,000 | | | | 291,502 | (a) |
Total Internet & Direct Marketing Retail | | | | | | | | | | | | | | | 1,136,843 | |
Multiline Retail — 0.0%†† | | | | | | | | | | | | | | | | |
Target Corp., Senior Notes | | | 2.250 | % | | | 4/15/25 | | | | 50,000 | | | | 49,289 | |
Specialty Retail — 0.1% | | | | | | | | | | | | | | | | |
Home Depot Inc., Senior Notes | | | 2.700 | % | | | 4/15/30 | | | | 30,000 | | | | 29,065 | |
Home Depot Inc., Senior Notes | | | 3.350 | % | | | 4/15/50 | | | | 90,000 | | | | 84,799 | |
Total Specialty Retail | | | | | | | | | | | | | | | 113,864 | |
Textiles, Apparel & Luxury Goods — 0.0%†† | | | | | | | | | | | | | | | | |
NIKE Inc., Senior Notes | | | 2.750 | % | | | 3/27/27 | | | | 50,000 | | | | 49,749 | |
Total Consumer Discretionary | | | | | | | | | | | | | | | 4,218,456 | |
See Notes to Financial Statements.
| | | | | | |
| Western Asset Total Return ETF 2022 Annual Report | | | | | 15 | |
Schedule of investments (cont’d)
March 31, 2022
Western Asset Total Return ETF
(Percentages shown based on Fund net assets)
| | | | | | | | | | | | | | | | |
| Security | | Rate | | | Maturity
Date | | | Face
Amount† | | | Value | |
| Consumer Staples — 2.0% | | | | | | | | | | | | | | | | |
Beverages — 0.5% | | | | | | | | | | | | | | | | |
Anheuser-Busch Cos. LLC/Anheuser-Busch InBev Worldwide Inc., Senior Notes | | | 3.650 | % | | | 2/1/26 | | | | 90,000 | | | $ | 91,981 | |
Anheuser-Busch InBev Worldwide Inc., Senior Notes | | | 4.000 | % | | | 4/13/28 | | | | 40,000 | | | | 41,446 | |
Anheuser-Busch InBev Worldwide Inc., Senior Notes | | | 4.750 | % | | | 1/23/29 | | | | 10,000 | | | | 10,842 | |
Anheuser-Busch InBev Worldwide Inc., Senior Notes | | | 3.500 | % | | | 6/1/30 | | | | 20,000 | | | | 20,287 | |
Anheuser-Busch InBev Worldwide Inc., Senior Notes | | | 4.600 | % | | | 4/15/48 | | | | 10,000 | | | | 10,793 | |
Anheuser-Busch InBev Worldwide Inc., Senior Notes | | | 4.439 | % | | | 10/6/48 | | | | 30,000 | | | | 31,404 | |
Anheuser-Busch InBev Worldwide Inc., Senior Notes | | | 5.550 | % | | | 1/23/49 | | | | 10,000 | | | | 12,193 | |
Anheuser-Busch InBev Worldwide Inc., Senior Notes | | | 4.500 | % | | | 6/1/50 | | | | 80,000 | | | | 85,475 | |
Coca-Cola Co., Senior Notes | | | 3.375 | % | | | 3/25/27 | | | | 30,000 | | | | 30,697 | |
Coca-Cola Co., Senior Notes | | | 1.450 | % | | | 6/1/27 | | | | 50,000 | | | | 46,900 | |
Diageo Investment Corp., Senior Notes | | | 2.875 | % | | | 5/11/22 | | | | 50,000 | | | | 50,024 | |
PepsiCo Inc., Senior Notes | | | 2.250 | % | | | 3/19/25 | | | | 10,000 | | | | 9,895 | |
PepsiCo Inc., Senior Notes | | | 2.625 | % | | | 3/19/27 | | | | 60,000 | | | | 59,627 | |
PepsiCo Inc., Senior Notes | | | 1.625 | % | | | 5/1/30 | | | | 70,000 | | | | 62,937 | |
Total Beverages | | | | | | | | | | | | | | | 564,501 | |
Food & Staples Retailing — 0.0%†† | | | | | | | | | | | | | | | | |
Walmart Inc., Senior Notes | | | 1.500 | % | | | 9/22/28 | | | | 20,000 | | | | 18,363 | |
Walmart Inc., Senior Notes | | | 1.800 | % | | | 9/22/31 | | | | 10,000 | | | | 9,097 | |
Total Food & Staples Retailing | | | | | | | | | | | | | | | 27,460 | |
Food Products — 0.7% | | | | | | | | | | | | | | | | |
Hershey Co., Senior Notes | | | 0.900 | % | | | 6/1/25 | | | | 10,000 | | | | 9,414 | |
Kraft Heinz Foods Co., Senior Notes | | | 4.250 | % | | | 3/1/31 | | | | 10,000 | | | | 10,258 | |
Kraft Heinz Foods Co., Senior Notes | | | 5.000 | % | | | 6/4/42 | | | | 20,000 | | | | 21,362 | |
Kraft Heinz Foods Co., Senior Notes | | | 5.200 | % | | | 7/15/45 | | | | 260,000 | | | | 281,450 | |
Kraft Heinz Foods Co., Senior Notes | | | 4.375 | % | | | 6/1/46 | | | | 50,000 | | | | 49,382 | |
Kraft Heinz Foods Co., Senior Notes | | | 4.875 | % | | | 10/1/49 | | | | 30,000 | | | | 31,609 | |
Kraft Heinz Foods Co., Senior Notes | | | 5.500 | % | | | 6/1/50 | | | | 190,000 | | | | 215,751 | |
Mars Inc., Senior Notes | | | 2.700 | % | | | 4/1/25 | | | | 20,000 | | | | 19,822 | (a) |
Mars Inc., Senior Notes | | | 3.200 | % | | | 4/1/30 | | | | 30,000 | | | | 29,734 | (a) |
See Notes to Financial Statements.
| | | | |
16 | | | | Western Asset Total Return ETF 2022 Annual Report |
Western Asset Total Return ETF
(Percentages shown based on Fund net assets)
| | | | | | | | | | | | | | | | |
| Security | | Rate | | | Maturity
Date | | | Face
Amount† | | | Value | |
Food Products — continued | | | | | | | | | | | | | | | | |
Mars Inc., Senior Notes | | | 3.200 | % | | | 4/1/30 | | | | 10,000 | | | $ | 9,912 | (b) |
Mondelez International Inc., Senior Notes | | | 1.500 | % | | | 5/4/25 | | | | 90,000 | | | | 85,965 | |
Total Food Products | | | | | | | | | | | | | | | 764,659 | |
Household Products — 0.0%†† | | | | | | | | | | | | | | | | |
Procter & Gamble Co., Senior Notes | | | 2.800 | % | | | 3/25/27 | | | | 10,000 | | | | 10,005 | |
Procter & Gamble Co., Senior Notes | | | 3.000 | % | | | 3/25/30 | | | | 30,000 | | | | 30,164 | |
Total Household Products | | | | | | | | | | | | | | | 40,169 | |
Tobacco — 0.8% | | | | | | | | | | | | | | | | |
Altria Group Inc., Senior Notes | | | 2.350 | % | | | 5/6/25 | | | | 10,000 | | | | 9,713 | |
Altria Group Inc., Senior Notes | | | 5.375 | % | | | 1/31/44 | | | | 10,000 | | | | 10,336 | |
Altria Group Inc., Senior Notes | | | 3.875 | % | | | 9/16/46 | | | | 30,000 | | | | 25,402 | |
Altria Group Inc., Senior Notes | | | 5.950 | % | | | 2/14/49 | | | | 280,000 | | | | 303,115 | |
Altria Group Inc., Senior Notes | | | 6.200 | % | | | 2/14/59 | | | | 4,000 | | | | 4,459 | |
BAT Capital Corp., Senior Notes | | | 3.557 | % | | | 8/15/27 | | | | 70,000 | | | | 68,128 | |
BAT Capital Corp., Senior Notes | | | 3.734 | % | | | 9/25/40 | | | | 110,000 | | | | 90,126 | |
BAT Capital Corp., Senior Notes | | | 4.540 | % | | | 8/15/47 | | | | 80,000 | | | | 71,391 | |
Cargill Inc., Senior Notes | | | 1.375 | % | | | 7/23/23 | | | | 40,000 | | | | 39,502 | (a) |
Philip Morris International Inc., Senior Notes | | | 2.500 | % | | | 11/2/22 | | | | 140,000 | | | | 140,602 | |
Philip Morris International Inc., Senior Notes | | | 1.125 | % | | | 5/1/23 | | | | 30,000 | | | | 29,645 | |
Philip Morris International Inc., Senior Notes | | | 2.100 | % | | | 5/1/30 | | | | 60,000 | | | | 53,985 | |
Total Tobacco | | | | | | | | | | | | | | | 846,404 | |
Total Consumer Staples | | | | | | | | | | | | | | | 2,243,193 | |
| Energy — 5.7% | | | | | | | | | | | | | | | | |
Energy Equipment & Services — 0.0%†† | | | | | | | | | | | | | | | | |
Halliburton Co., Senior Notes | | | 3.800 | % | | | 11/15/25 | | | | 2,000 | | | | 2,042 | |
Oil, Gas & Consumable Fuels — 5.7% | | | | | | | | | | | | | | | | |
BP Capital Markets America Inc., Senior Notes | | | 3.790 | % | | | 2/6/24 | | | | 10,000 | | | | 10,173 | |
BP Capital Markets America Inc., Senior Notes | | | 3.410 | % | | | 2/11/26 | | | | 70,000 | | | | 70,780 | |
BP Capital Markets America Inc., Senior Notes | | | 3.937 | % | | | 9/21/28 | | | | 100,000 | | | | 103,499 | |
BP Capital Markets America Inc., Senior Notes | | | 3.633 | % | | | 4/6/30 | | | | 80,000 | | | | 81,461 | |
BP Capital Markets PLC, Senior Notes | | | 3.506 | % | | | 3/17/25 | | | | 20,000 | | | | 20,381 | |
Cameron LNG LLC, Senior Secured Notes | | | 2.902 | % | | | 7/15/31 | | | | 120,000 | | | | 114,614 | (a) |
Cameron LNG LLC, Senior Secured Notes | | | 3.302 | % | | | 1/15/35 | | | | 60,000 | | | | 56,389 | (a) |
Cheniere Energy Inc., Senior Secured Notes | | | 4.625 | % | | | 10/15/28 | | | | 30,000 | | | | 30,100 | |
Cheniere Energy Partners LP, Senior Notes | | | 4.000 | % | | | 3/1/31 | | | | 20,000 | | | | 19,388 | |
See Notes to Financial Statements.
| | | | | | |
| Western Asset Total Return ETF 2022 Annual Report | | | | | 17 | |
Schedule of investments (cont’d)
March 31, 2022
Western Asset Total Return ETF
(Percentages shown based on Fund net assets)
| | | | | | | | | | | | | | | | |
| Security | | Rate | | | Maturity
Date | | | Face
Amount† | | | Value | |
Oil, Gas & Consumable Fuels — continued | | | | | | | | | | | | | | | | |
Cheniere Energy Partners LP, Senior Notes | | | 3.250 | % | | | 1/31/32 | | | | 10,000 | | | $ | 9,093 | (a) |
Chevron Corp., Senior Notes | | | 1.554 | % | | | 5/11/25 | | | | 50,000 | | | | 48,238 | |
Chevron Corp., Senior Notes | | | 1.995 | % | | | 5/11/27 | | | | 10,000 | | | | 9,597 | |
Chevron Corp., Senior Notes | | | 2.236 | % | | | 5/11/30 | | | | 60,000 | | | | 56,739 | |
Continental Resources Inc., Senior Notes | | | 4.500 | % | | | 4/15/23 | | | | 20,000 | | | | 20,240 | |
Continental Resources Inc., Senior Notes | | | 2.268 | % | | | 11/15/26 | | | | 20,000 | | | | 18,675 | (a) |
Continental Resources Inc., Senior Notes | | | 4.375 | % | | | 1/15/28 | | | | 50,000 | | | | 50,690 | |
Continental Resources Inc., Senior Notes | | | 5.750 | % | | | 1/15/31 | | | | 50,000 | | | | 54,690 | (a) |
Continental Resources Inc., Senior Notes | | | 4.900 | % | | | 6/1/44 | | | | 30,000 | | | | 29,686 | |
Coterra Energy Inc., Senior Notes | | | 3.900 | % | | | 5/15/27 | | | | 110,000 | | | | 110,801 | (a) |
Coterra Energy Inc., Senior Notes | | | 4.375 | % | | | 3/15/29 | | | | 140,000 | | | | 145,879 | (a) |
Devon Energy Corp., Senior Notes | | | 5.850 | % | | | 12/15/25 | | | | 140,000 | | | | 151,515 | |
Devon Energy Corp., Senior Notes | | | 5.000 | % | | | 6/15/45 | | | | 330,000 | | | | 359,281 | |
Diamondback Energy Inc., Senior Notes | | | 3.250 | % | | | 12/1/26 | | | | 30,000 | | | | 29,955 | |
Diamondback Energy Inc., Senior Notes | | | 3.500 | % | | | 12/1/29 | | | | 30,000 | | | | 29,717 | |
Ecopetrol SA, Senior Notes | | | 5.875 | % | | | 5/28/45 | | | | 190,000 | | | | 166,459 | |
Energy Transfer LP, Junior Subordinated Notes (6.250% to 2/15/23 then 3 mo. USD LIBOR + 4.028%) | | | 6.250 | % | | | 2/15/23 | | | | 10,000 | | | | 8,562 | (c)(d) |
Energy Transfer LP, Junior Subordinated Notes (6.500% to 11/15/26 then 5 year Treasury Constant Maturity Rate + 5.694%) | | | 6.500 | % | | | 11/15/26 | | | | 20,000 | | | | 19,656 | (c)(d) |
Energy Transfer LP, Junior Subordinated Notes (6.750% to 5/15/25 then 5 year Treasury Constant Maturity Rate + 5.134%) | | | 6.750 | % | | | 5/15/25 | | | | 50,000 | | | | 48,625 | (c)(d) |
Energy Transfer LP, Junior Subordinated Notes (7.125% to 5/15/30 then 5 year Treasury Constant Maturity Rate + 5.306%) | | | 7.125 | % | | | 5/15/30 | | | | 30,000 | | | | 29,250 | (c)(d) |
Energy Transfer LP, Senior Notes | | | 2.900 | % | | | 5/15/25 | | | | 70,000 | | | | 68,471 | |
Energy Transfer LP, Senior Notes | | | 4.950 | % | | | 6/15/28 | | | | 10,000 | | | | 10,502 | |
Energy Transfer LP, Senior Notes | | | 5.250 | % | | | 4/15/29 | | | | 10,000 | | | | 10,671 | |
Energy Transfer LP, Senior Notes | | | 3.750 | % | | | 5/15/30 | | | | 150,000 | | | | 147,564 | |
Energy Transfer LP, Senior Notes | | | 6.250 | % | | | 4/15/49 | | | | 60,000 | | | | 68,849 | |
Energy Transfer LP, Senior Notes | | | 5.000 | % | | | 5/15/50 | | | | 80,000 | | | | 80,947 | |
Enterprise Products Operating LLC, Senior Notes | | | 4.150 | % | | | 10/16/28 | | | | 70,000 | | | | 72,792 | |
Enterprise Products Operating LLC, Senior Notes | | | 2.800 | % | | | 1/31/30 | | | | 140,000 | | | | 134,570 | |
Enterprise Products Operating LLC, Senior Notes | | | 3.700 | % | | | 1/31/51 | | | | 200,000 | | | | 182,999 | |
See Notes to Financial Statements.
| | | | |
18 | | | | Western Asset Total Return ETF 2022 Annual Report |
Western Asset Total Return ETF
(Percentages shown based on Fund net assets)
| | | | | | | | | | | | | | | | |
| Security | | Rate | | | Maturity
Date | | | Face
Amount† | | | Value | |
Oil, Gas & Consumable Fuels — continued | | | | | | | | | | | | | | | | |
Enterprise Products Operating LLC, Senior Notes (5.375% to 2/15/28 then 3 mo. USD LIBOR + 2.570%) | | | 5.375 | % | | | 2/15/78 | | | | 10,000 | | | $ | 9,291 | (d) |
EOG Resources Inc., Senior Notes | | | 4.375 | % | | | 4/15/30 | | | | 100,000 | | | | 108,271 | |
EOG Resources Inc., Senior Notes | | | 3.900 | % | | | 4/1/35 | | | | 40,000 | | | | 41,066 | |
EOG Resources Inc., Senior Notes | | | 4.950 | % | | | 4/15/50 | | | | 10,000 | | | | 12,239 | |
EQM Midstream Partners LP, Senior Notes | | | 6.000 | % | | | 7/1/25 | | | | 130,000 | | | | 132,606 | (a) |
EQT Corp., Senior Notes | | | 3.900 | % | | | 10/1/27 | | | | 285,000 | | | | 284,175 | |
EQT Corp., Senior Notes | | | 5.000 | % | | | 1/15/29 | | | | 20,000 | | | | 20,647 | |
EQT Corp., Senior Notes | | | 3.625 | % | | | 5/15/31 | | | | 40,000 | | | | 38,200 | (a) |
Exxon Mobil Corp., Senior Notes | | | 2.992 | % | | | 3/19/25 | | | | 50,000 | | | | 50,224 | |
Exxon Mobil Corp., Senior Notes | | | 3.482 | % | | | 3/19/30 | | | | 40,000 | | | | 41,051 | |
Exxon Mobil Corp., Senior Notes | | | 3.452 | % | | | 4/15/51 | | | | 140,000 | | | | 135,715 | |
Kinder Morgan Inc., Senior Notes | | | 4.300 | % | | | 3/1/28 | | | | 110,000 | | | | 113,987 | |
Kinder Morgan Inc., Senior Notes | | | 5.550 | % | | | 6/1/45 | | | | 20,000 | | | | 22,359 | |
Kinder Morgan Inc., Senior Notes | | | 5.050 | % | | | 2/15/46 | | | | 20,000 | | | | 21,202 | |
Kinder Morgan Inc., Senior Notes | | | 5.200 | % | | | 3/1/48 | | | | 50,000 | | | | 54,343 | |
MPLX LP, Senior Notes | | | 4.875 | % | | | 6/1/25 | | | | 90,000 | | | | 93,240 | |
MPLX LP, Senior Notes | | | 4.800 | % | | | 2/15/29 | | | | 60,000 | | | | 63,881 | |
MPLX LP, Senior Notes | | | 2.650 | % | | | 8/15/30 | | | | 150,000 | | | | 137,448 | |
MPLX LP, Senior Notes | | | 4.500 | % | | | 4/15/38 | | | | 100,000 | | | | 102,175 | |
MPLX LP, Senior Notes | | | 5.500 | % | | | 2/15/49 | | | | 10,000 | | | | 11,075 | |
Occidental Petroleum Corp., Senior Notes | | | 3.500 | % | | | 8/15/29 | | | | 80,000 | | | | 78,800 | |
Occidental Petroleum Corp., Senior Notes | | | 6.600 | % | | | 3/15/46 | | | | 110,000 | | | | 129,250 | |
Occidental Petroleum Corp., Senior Notes | | | 4.200 | % | | | 3/15/48 | | | | 60,000 | | | | 56,100 | |
Occidental Petroleum Corp., Senior Notes | | | 4.400 | % | | | 8/15/49 | | | | 100,000 | | | | 94,000 | |
Parsley Energy LLC/Parsley Finance Corp., Senior Notes | | | 4.125 | % | | | 2/15/28 | | | | 10,000 | | | | 9,946 | (a) |
Petrobras Global Finance BV, Senior Notes | | | 5.750 | % | | | 2/1/29 | | | | 610,000 | | | | 633,851 | |
Pioneer Natural Resources Co., Senior Notes | | | 1.125 | % | | | 1/15/26 | | | | 10,000 | | | | 9,274 | |
Pioneer Natural Resources Co., Senior Notes | | | 2.150 | % | | | 1/15/31 | | | | 60,000 | | | | 54,071 | |
Qatar Energy, Senior Notes | | | 3.300 | % | | | 7/12/51 | | | | 200,000 | | | | 183,564 | (a) |
Range Resources Corp., Senior Notes | | | 4.875 | % | | | 5/15/25 | | | | 70,000 | | | | 70,852 | |
Shell International Finance BV, Senior Notes | | | 4.375 | % | | | 5/11/45 | | | | 50,000 | | | | 53,937 | |
Shell International Finance BV, Senior Notes | | | 4.000 | % | | | 5/10/46 | | | | 30,000 | | | | 31,279 | |
Shell International Finance BV, Senior Notes | | | 3.250 | % | | | 4/6/50 | | | | 20,000 | | | | 18,761 | |
Southwestern Energy Co., Senior Notes | | | 5.375 | % | | | 3/15/30 | | | | 20,000 | | | | 20,324 | |
Southwestern Energy Co., Senior Notes | | | 4.750 | % | | | 2/1/32 | | | | 10,000 | | | | 9,987 | |
See Notes to Financial Statements.
| | | | | | |
| Western Asset Total Return ETF 2022 Annual Report | | | | | 19 | |
Schedule of investments (cont’d)
March 31, 2022
Western Asset Total Return ETF
(Percentages shown based on Fund net assets)
| | | | | | | | | | | | | | | | |
| Security | | Rate | | | Maturity
Date | | | Face
Amount† | | | Value | |
Oil, Gas & Consumable Fuels — continued | | | | | | | | | | | | | | | | |
Targa Resources Partners LP/Targa Resources Partners Finance Corp., Senior Notes | | | 5.000 | % | | | 1/15/28 | | | | 10,000 | | | $ | 10,135 | |
Targa Resources Partners LP/Targa Resources Partners Finance Corp., Senior Notes | | | 6.875 | % | | | 1/15/29 | | | | 20,000 | | | | 21,462 | |
Targa Resources Partners LP/Targa Resources Partners Finance Corp., Senior Notes | | | 4.875 | % | | | 2/1/31 | | | | 40,000 | | | | 40,400 | |
Transcontinental Gas Pipe Line Co. LLC, Senior Notes | | | 7.850 | % | | | 2/1/26 | | | | 140,000 | | | | 160,490 | |
Transcontinental Gas Pipe Line Co. LLC, Senior Notes | | | 3.250 | % | | | 5/15/30 | | | | 100,000 | | | | 97,522 | |
Western Midstream Operating LP, Senior Notes | | | 3.600 | % | | | 2/1/25 | | | | 40,000 | | | | 39,729 | |
Western Midstream Operating LP, Senior Notes | | | 4.500 | % | | | 3/1/28 | | | | 10,000 | | | | 10,200 | |
Western Midstream Operating LP, Senior Notes | | | 4.550 | % | | | 2/1/30 | | | | 120,000 | | | | 119,400 | |
Western Midstream Operating LP, Senior Notes | | | 5.500 | % | | | 8/15/48 | | | | 80,000 | | | | 79,000 | |
Western Midstream Operating LP, Senior Notes | | | 5.750 | % | | | 2/1/50 | | | | 120,000 | | | | 117,000 | |
Western Midstream Operating LP, Senior Notes (3 mo. USD LIBOR + 1.850%) | | | 1.844 | % | | | 1/13/23 | | | | 10,000 | | | | 9,900 | (d) |
Williams Cos. Inc., Senior Notes | | | 7.750 | % | | | 6/15/31 | | | | 80,000 | | | | 100,239 | |
Williams Cos. Inc., Senior Notes | | | 8.750 | % | | | 3/15/32 | | | | 40,000 | | | | 54,331 | |
Total Oil, Gas & Consumable Fuels | | | | | | | | | | | | | | | 6,488,497 | |
Total Energy | | | | | | | | | | | | | | | 6,490,539 | |
| Financials — 10.8% | | | | | | | | | | | | | | | | |
Banks — 7.5% | | | | | | | | | | | | | | | | |
Banco Santander SA, Senior Notes | | | 3.848 | % | | | 4/12/23 | | | | 200,000 | | | | 202,604 | |
Bank of America Corp., Senior Notes | | | 5.000 | % | | | 1/21/44 | | | | 100,000 | | | | 115,018 | |
Bank of America Corp., Senior Notes (2.572% to 10/20/31 then SOFR + 1.210%) | | | 2.572 | % | | | 10/20/32 | | | | 160,000 | | | | 145,386 | (d) |
Bank of America Corp., Senior Notes (2.687% to 4/22/31 then SOFR + 1.320%) | | | 2.687 | % | | | 4/22/32 | | | | 690,000 | | | | 634,549 | (d) |
Bank of America Corp., Senior Notes (2.972% to 2/4/32 then SOFR + 1.330%) | | | 2.972 | % | | | 2/4/33 | | | | 60,000 | | | | 56,220 | (d) |
See Notes to Financial Statements.
| | | | |
20 | | | | Western Asset Total Return ETF 2022 Annual Report |
Western Asset Total Return ETF
(Percentages shown based on Fund net assets)
| | | | | | | | | | | | | | | | |
| Security | | Rate | | | Maturity
Date | | | Face
Amount† | | | Value | |
Banks — continued | | | | | | | | | | | | | | | | |
Bank of America Corp., Senior Notes (3.004% to 12/20/22 then 3 mo. USD LIBOR + 0.790%) | | | 3.004 | % | | | 12/20/23 | | | | 50,000 | | | $ | 50,126 | (d) |
Bank of America Corp., Senior Notes (3.970% to 3/5/28 then 3 mo. USD LIBOR + 1.070%) | | | 3.970 | % | | | 3/5/29 | | | | 200,000 | | | | 203,043 | (d) |
Bank of America Corp., Senior Notes (4.330% to 3/15/49 then 3 mo. USD LIBOR + 1.520%) | | | 4.330 | % | | | 3/15/50 | | | | 70,000 | | | | 75,063 | (d) |
Bank of America Corp., Subordinated Notes | | | 4.200 | % | | | 8/26/24 | | | | 200,000 | | | | 204,861 | |
Bank of Montreal, Senior Notes | | | 1.850 | % | | | 5/1/25 | | | | 90,000 | | | | 86,491 | |
Bank of Nova Scotia, Senior Notes | | | 1.300 | % | | | 6/11/25 | | | | 50,000 | | | | 47,107 | |
Barclays Bank PLC, Senior Notes | | | 1.700 | % | | | 5/12/22 | | | | 200,000 | | | | 200,101 | |
BNP Paribas SA, Senior Notes (2.219% to 6/9/25 then SOFR + 2.074%) | | | 2.219 | % | | | 6/9/26 | | | | 200,000 | | | | 190,181 | (a)(d) |
BNP Paribas SA, Senior Notes (5.198% to 1/10/29 then 3 mo. USD LIBOR + 2.567%) | | | 5.198 | % | | | 1/10/30 | | | | 200,000 | | | | 213,204 | (a)(d) |
Canadian Imperial Bank of Commerce, Senior Notes | | | 0.950 | % | | | 6/23/23 | | | | 50,000 | | | | 49,066 | |
Citigroup Inc., Senior Notes | | | 8.125 | % | | | 7/15/39 | | | | 240,000 | | | | 363,339 | |
Citigroup Inc., Senior Notes (1.678% to 5/15/23 then SOFR + 1.667%) | | | 1.678 | % | | | 5/15/24 | | | | 50,000 | | | | 49,590 | (d) |
Citigroup Inc., Senior Notes (2.520% to 11/3/31 then SOFR + 1.177%) | | | 2.520 | % | | | 11/3/32 | | | | 440,000 | | | | 394,748 | (d) |
Citigroup Inc., Senior Notes (3.106% to 4/8/25 then SOFR + 2.842%) | | | 3.106 | % | | | 4/8/26 | | | | 100,000 | | | | 99,150 | (d) |
Citigroup Inc., Senior Notes (3.785% to 3/17/32 then SOFR + 1.939%) | | | 3.785 | % | | | 3/17/33 | | | | 90,000 | | | | 89,220 | (d) |
Citigroup Inc., Senior Notes (3.980% to 3/20/29 then 3 mo. USD LIBOR + 1.338%) | | | 3.980 | % | | | 3/20/30 | | | | 60,000 | | | | 60,915 | (d) |
Citigroup Inc., Senior Notes (4.412% to 3/31/30 then SOFR + 3.914%) | | | 4.412 | % | | | 3/31/31 | | | | 60,000 | | | | 62,289 | (d) |
Citigroup Inc., Subordinated Notes | | | 4.400 | % | | | 6/10/25 | | | | 150,000 | | | | 154,305 | |
Citigroup Inc., Subordinated Notes | | | 5.500 | % | | | 9/13/25 | | | | 150,000 | | | | 160,161 | |
Cooperatieve Rabobank UA, Senior Notes (1.339% to 6/24/25 then 1 year Treasury Constant Maturity Rate + 1.000%) | | | 1.339 | % | | | 6/24/26 | | | | 250,000 | | | | 233,333 | (a)(d) |
Credit Agricole SA, Senior Notes (1.907% to 6/16/25 then SOFR + 1.676%) | | | 1.907 | % | | | 6/16/26 | | | | 250,000 | | | | 235,990 | (a)(d) |
Fifth Third Bancorp, Senior Notes | | | 3.650 | % | | | 1/25/24 | | | | 10,000 | | | | 10,123 | |
See Notes to Financial Statements.
| | | | | | |
| Western Asset Total Return ETF 2022 Annual Report | | | | | 21 | |
Schedule of investments (cont’d)
March 31, 2022
Western Asset Total Return ETF
(Percentages shown based on Fund net assets)
| | | | | | | | | | | | | | | | |
| Security | | Rate | | | Maturity
Date | | | Face
Amount† | | | Value | |
Banks — continued | | | | | | | | | | | | | | | | |
HSBC Holdings PLC, Senior Notes (2.099%to 6/4/25 then SOFR + 1.929%) | | | 2.099 | % | | | 6/4/26 | | | | 200,000 | | | $ | 190,195 | (d) |
Intesa Sanpaolo SpA, Senior Notes | | | 3.125 | % | | | 7/14/22 | | | | 200,000 | | | | 200,298 | (a) |
Intesa Sanpaolo SpA, Senior Notes | | | 3.375 | % | | | 1/12/23 | | | | 200,000 | | | | 200,414 | (a) |
JPMorgan Chase & Co., Senior Notes (2.083% to 4/22/25 then SOFR + 1.850%) | | | 2.083 | % | | | 4/22/26 | | | | 90,000 | | | | 86,850 | (d) |
JPMorgan Chase & Co., Senior Notes (2.545% to 11/8/31 then SOFR + 1.180%) | | | 2.545 | % | | | 11/8/32 | | | | 80,000 | | | | 73,100 | (d) |
JPMorgan Chase & Co., Senior Notes (2.580% to 4/22/31 then SOFR + 1.250%) | | | 2.580 | % | | | 4/22/32 | | | | 130,000 | | | | 119,100 | (d) |
JPMorgan Chase & Co., Senior Notes (2.739% to 10/15/29 then SOFR + 1.510%) | | | 2.739 | % | | | 10/15/30 | | | | 200,000 | | | | 188,984 | (d) |
JPMorgan Chase & Co., Senior Notes (4.023% to 12/5/23 then 3 mo. USD LIBOR + 1.000%) | | | 4.023 | % | | | 12/5/24 | | | | 90,000 | | | | 91,441 | (d) |
JPMorgan Chase & Co., Senior Notes (4.452% to 12/5/28 then 3 mo. USD LIBOR + 1.330%) | | | 4.452 | % | | | 12/5/29 | | | | 100,000 | | | | 104,236 | (d) |
JPMorgan Chase & Co., Subordinated Notes | | | 4.950 | % | | | 6/1/45 | | | | 110,000 | | | | 124,435 | |
Lloyds Banking Group PLC, Senior Notes | | | 3.900 | % | | | 3/12/24 | | | | 200,000 | | | | 203,054 | |
Lloyds Banking Group PLC, Senior Notes | | | 4.375 | % | | | 3/22/28 | | | | 200,000 | | | | 204,375 | |
Royal Bank of Canada, Senior Notes | | | 1.600 | % | | | 4/17/23 | | | | 80,000 | | | | 79,597 | |
Royal Bank of Canada, Senior Notes | | | 1.150 | % | | | 6/10/25 | | | | 50,000 | | | | 47,187 | |
Swedbank AB, Senior Notes | | | 1.300 | % | | | 6/2/23 | | | | 200,000 | | | | 197,172 | (a) |
Toronto-Dominion Bank, Senior Notes | | | 0.750 | % | | | 6/12/23 | | | | 100,000 | | | | 98,186 | |
Toronto-Dominion Bank, Senior Notes | | | 1.150 | % | | | 6/12/25 | | | | 80,000 | | | | 75,501 | |
US Bancorp, Senior Notes | | | 1.450 | % | | | 5/12/25 | | | | 100,000 | | | | 95,588 | |
Wells Fargo & Co., Senior Notes | | | 3.750 | % | | | 1/24/24 | | | | 20,000 | | | | 20,365 | |
Wells Fargo & Co., Senior Notes | | | 3.000 | % | | | 10/23/26 | | | | 100,000 | | | | 98,609 | |
Wells Fargo & Co., Senior Notes | | | 4.150 | % | | | 1/24/29 | | | | 50,000 | | | | 51,863 | |
Wells Fargo & Co., Senior Notes (1.654% to 6/2/23 then SOFR + 1.600%) | | | 1.654 | % | | | 6/2/24 | | | | 40,000 | | | | 39,520 | (d) |
Wells Fargo & Co., Senior Notes (2.188% to 4/30/25 then SOFR + 2.000%) | | | 2.188 | % | | | 4/30/26 | | | | 180,000 | | | | 173,636 | (d) |
Wells Fargo & Co., Senior Notes (2.879% to 10/30/29 then SOFR + 1.432%) | | | 2.879 | % | | | 10/30/30 | | | | 310,000 | | | | 294,636 | (d) |
Wells Fargo & Co., Senior Notes (3.350% to 3/2/32 then SOFR + 1.500%) | | | 3.350 | % | | | 3/2/33 | | | | 30,000 | | | | 29,155 | (d) |
Wells Fargo & Co., Senior Notes (3.584% to 5/22/27 then 3 mo. USD LIBOR + 1.310%) | | | 3.584 | % | | | 5/22/28 | | | | 100,000 | | | | 99,837 | (d) |
See Notes to Financial Statements.
| | | | |
22 | | | | Western Asset Total Return ETF 2022 Annual Report |
Western Asset Total Return ETF
(Percentages shown based on Fund net assets)
| | | | | | | | | | | | | | | | |
| Security | | Rate | | | Maturity
Date | | | Face
Amount† | | | Value | |
Banks — continued | | | | | | | | | | | | | | | | |
Wells Fargo & Co., Senior Notes (5.013% to 4/4/50 then SOFR + 4.502%) | | | 5.013 | % | | | 4/4/51 | | | | 500,000 | | | $ | 593,385 | (d) |
Wells Fargo & Co., Subordinated Notes | | | 4.750 | % | | | 12/7/46 | | | | 270,000 | | | | 293,540 | |
Total Banks | | | | | | | | | | | | | | | 8,460,442 | |
Capital Markets — 2.3% | | | | | | | | | | | | | | | | |
Bank of New York Mellon Corp., Senior Notes | | | 1.600 | % | | | 4/24/25 | | | | 30,000 | | | | 28,918 | |
Credit Suisse AG, Senior Notes | | | 2.950 | % | | | 4/9/25 | | | | 250,000 | | | | 247,253 | |
Credit Suisse Group AG, Senior Notes (2.193% to 6/5/25 then SOFR + 2.044%) | | | 2.193 | % | | | 6/5/26 | | | | 250,000 | | | | 234,771 | (a)(d) |
Goldman Sachs Group Inc., Senior Notes | | | 3.200 | % | | | 2/23/23 | | | | 10,000 | | | | 10,089 | |
Goldman Sachs Group Inc., Senior Notes | | | 3.850 | % | | | 7/8/24 | | | | 80,000 | | | | 81,461 | |
Goldman Sachs Group Inc., Senior Notes | | | 3.500 | % | | | 4/1/25 | | | | 190,000 | | | | 191,417 | |
Goldman Sachs Group Inc., Senior Notes | | | 3.500 | % | | | 11/16/26 | | | | 50,000 | | | | 50,208 | |
Goldman Sachs Group Inc., Senior Notes (2.650% to 10/21/31 then SOFR + 1.264%) | | | 2.650 | % | | | 10/21/32 | | | | 330,000 | | | | 298,341 | (d) |
Goldman Sachs Group Inc., Senior Notes (3.615% to 3/15/27 then SOFR + 1.846%) | | | 3.615 | % | | | 3/15/28 | | | | 20,000 | | | | 19,972 | (d) |
Goldman Sachs Group Inc., Senior Notes (4.223% to 5/1/28 then 3 mo. USD LIBOR + 1.301%) | | | 4.223 | % | | | 5/1/29 | | | | 90,000 | | | | 92,150 | (d) |
Goldman Sachs Group Inc., Subordinated Notes | | | 5.150 | % | | | 5/22/45 | | | | 310,000 | | | | 346,369 | |
Morgan Stanley, Senior Notes (2.188% to 4/28/25 then SOFR + 1.990%) | | | 2.188 | % | | | 4/28/26 | | | | 130,000 | | | | 125,576 | (d) |
Morgan Stanley, Senior Notes (2.511% to 10/20/31 then SOFR + 1.200%) | | | 2.511 | % | | | 10/20/32 | | | | 230,000 | | | | 207,308 | (d) |
Morgan Stanley, Senior Notes (2.699% to 1/22/30 then SOFR + 1.143%) | | | 2.699 | % | | | 1/22/31 | | | | 50,000 | | | | 46,918 | (d) |
Morgan Stanley, Senior Notes (3.622% to 4/1/30 then SOFR + 3.120%) | | | 3.622 | % | | | 4/1/31 | | | | 110,000 | | | | 109,428 | (d) |
Morgan Stanley, Senior Notes (4.431% to 1/23/29 then 3 mo. USD LIBOR + 1.628%) | | | 4.431 | % | | | 1/23/30 | | | | 50,000 | | | | 52,279 | (d) |
Morgan Stanley, Subordinated Notes (2.484% to 9/16/31 then SOFR + 1.360%) | | | 2.484 | % | | | 9/16/36 | | | | 30,000 | | | | 25,720 | (d) |
UBS AG, Senior Notes | | | 4.500 | % | | | 6/26/48 | | | | 200,000 | | | | 220,908 | (a) |
UBS Group AG, Junior Subordinated Notes (7.000% to 1/31/24 then USD 5 year ICE Swap Rate + 4.344%) | | | 7.000 | % | | | 1/31/24 | | | | 200,000 | | | | 208,662 | (a)(c)(d) |
Total Capital Markets | | | | | | | | | | | | | | | 2,597,748 | |
See Notes to Financial Statements.
| | | | | | |
| Western Asset Total Return ETF 2022 Annual Report | | | | | 23 | |
Schedule of investments (cont’d)
March 31, 2022
Western Asset Total Return ETF
(Percentages shown based on Fund net assets)
| | | | | | | | | | | | | | | | |
| Security | | Rate | | | Maturity
Date | | | Face
Amount† | | | Value | |
Diversified Financial Services — 0.8% | | | | | | | | | | | | | | | | |
AerCap Ireland Capital DAC/AerCap Global Aviation Trust, Senior Notes | | | 2.450 | % | | | 10/29/26 | | | | 350,000 | | | $ | 323,733 | |
AerCap Ireland Capital DAC/AerCap Global Aviation Trust, Senior Notes | | | 3.000 | % | | | 10/29/28 | | | | 150,000 | | | | 138,328 | |
International Lease Finance Corp., Senior Notes | | | 5.875 | % | | | 8/15/22 | | | | 150,000 | | | | 151,832 | |
National Securities Clearing Corp., Senior Notes | | | 1.500 | % | | | 4/23/25 | | | | 250,000 | | | | 239,381 | (a) |
Park Aerospace Holdings Ltd., Senior Notes | | | 5.500 | % | | | 2/15/24 | | | | 90,000 | | | | 92,114 | (a) |
Total Diversified Financial Services | | | | | | | | | | | | | | | 945,388 | |
Insurance — 0.2% | | | | | | | | | | | | | | | | |
American International Group Inc., Senior Notes | | | 2.500 | % | | | 6/30/25 | | | | 30,000 | | | | 29,332 | |
American International Group Inc., Senior Notes | | | 3.750 | % | | | 7/10/25 | | | | 50,000 | | | | 50,806 | |
Berkshire Hathaway Finance Corp., Senior Notes | | | 4.250 | % | | | 1/15/49 | | | | 70,000 | | | | 76,658 | |
Guardian Life Global Funding, Secured Notes | | | 1.100 | % | | | 6/23/25 | | | | 20,000 | | | | 18,815 | (a) |
New York Life Global Funding, Senior Secured Notes | | | 0.950 | % | | | 6/24/25 | | | | 40,000 | | | | 37,352 | (a) |
Total Insurance | | | | | | | | | | | | | | | 212,963 | |
Total Financials | | | | | | | | | | | | | | | 12,216,541 | |
| Health Care — 3.4% | | | | | | | | | | | | | | | | |
Biotechnology — 0.7% | | | | | | | | | | | | | | | | |
AbbVie Inc., Senior Notes | | | 3.750 | % | | | 11/14/23 | | | | 10,000 | | | | 10,191 | |
AbbVie Inc., Senior Notes | | | 2.600 | % | | | 11/21/24 | | | | 240,000 | | | | 238,340 | |
AbbVie Inc., Senior Notes | | | 3.200 | % | | | 11/21/29 | | | | 340,000 | | | | 335,957 | |
AbbVie Inc., Senior Notes | | | 4.750 | % | | | 3/15/45 | | | | 60,000 | | | | 65,318 | |
AbbVie Inc., Senior Notes | | | 4.875 | % | | | 11/14/48 | | | | 10,000 | | | | 11,302 | |
AbbVie Inc., Senior Notes | | | 4.250 | % | | | 11/21/49 | | | | 40,000 | | | | 41,509 | |
Gilead Sciences Inc., Senior Notes | | | 3.650 | % | | | 3/1/26 | | | | 40,000 | | | | 40,680 | |
Total Biotechnology | | | | | | | | | | | | | | | 743,297 | |
Health Care Equipment & Supplies — 0.3% | | | | | | | | | | | | | | | | |
Abbott Laboratories, Senior Notes | | | 3.750 | % | | | 11/30/26 | | | | 130,000 | | | | 134,912 | |
Becton Dickinson and Co., Senior Notes | | | 3.363 | % | | | 6/6/24 | | | | 37,000 | | | | 37,308 | |
Roche Holdings Inc., Senior Notes | | | 2.607 | % | | | 12/13/51 | | | | 200,000 | | | | 173,235 | ��(a) |
Total Health Care Equipment & Supplies | | | | | | | | | | | | | | | 345,455 | |
Health Care Providers & Services — 1.2% | | | | | | | | | | | | | | | | |
Anthem Inc., Senior Notes | | | 3.650 | % | | | 12/1/27 | | | | 40,000 | | | | 40,824 | |
Centene Corp., Senior Notes | | | 4.250 | % | | | 12/15/27 | | | | 30,000 | | | | 30,113 | |
See Notes to Financial Statements.
| | | | |
24 | | | | Western Asset Total Return ETF 2022 Annual Report |
Western Asset Total Return ETF
(Percentages shown based on Fund net assets)
| | | | | | | | | | | | | | | | |
| Security | | Rate | | | Maturity
Date | | | Face
Amount† | | | Value | |
Health Care Providers & Services — continued | | | | | | | | | | | | | | | | |
Centene Corp., Senior Notes | | | 4.625 | % | | | 12/15/29 | | | | 80,000 | | | $ | 80,647 | |
Centene Corp., Senior Notes | | | 3.375 | % | | | 2/15/30 | | | | 20,000 | | | | 18,819 | |
Cigna Corp., Senior Notes | | | 3.750 | % | | | 7/15/23 | | | | 4,000 | | | | 4,058 | |
Cigna Corp., Senior Notes | | | 4.125 | % | | | 11/15/25 | | | | 30,000 | | | | 30,921 | |
Cigna Corp., Senior Notes | | | 4.375 | % | | | 10/15/28 | | | | 10,000 | | | | 10,519 | |
Cigna Corp., Senior Notes | | | 4.800 | % | | | 8/15/38 | | | | 160,000 | | | | 175,143 | |
Cigna Corp., Senior Notes | | | 4.900 | % | | | 12/15/48 | | | | 20,000 | | | | 22,411 | |
CVS Health Corp., Senior Notes | | | 3.625 | % | | | 4/1/27 | | | | 10,000 | | | | 10,165 | |
CVS Health Corp., Senior Notes | | | 1.875 | % | | | 2/28/31 | | | | 10,000 | | | | 8,805 | |
CVS Health Corp., Senior Notes | | | 2.125 | % | | | 9/15/31 | | | | 40,000 | | | | 35,739 | |
CVS Health Corp., Senior Notes | | | 2.700 | % | | | 8/21/40 | | | | 130,000 | | | | 110,838 | |
CVS Health Corp., Senior Notes | | | 5.050 | % | | | 3/25/48 | | | | 190,000 | | | | 215,173 | |
HCA Inc., Senior Notes | | | 5.625 | % | | | 9/1/28 | | | | 40,000 | | | | 43,250 | |
HCA Inc., Senior Notes | | | 3.500 | % | | | 9/1/30 | | | | 80,000 | | | | 77,285 | |
Humana Inc., Senior Notes | | | 4.500 | % | | | 4/1/25 | | | | 10,000 | | | | 10,355 | |
Humana Inc., Senior Notes | | | 3.950 | % | | | 3/15/27 | | | | 20,000 | | | | 20,314 | |
Humana Inc., Senior Notes | | | 3.125 | % | | | 8/15/29 | | | | 90,000 | | | | 87,113 | |
Humana Inc., Senior Notes | | | 2.150 | % | | | 2/3/32 | | | | 10,000 | | | | 8,762 | |
UnitedHealth Group Inc., Senior Notes | | | 1.250 | % | | | 1/15/26 | | | | 10,000 | | | | 9,401 | |
UnitedHealth Group Inc., Senior Notes | | | 3.875 | % | | | 12/15/28 | | | | 20,000 | | | | 20,970 | |
UnitedHealth Group Inc., Senior Notes | | | 2.875 | % | | | 8/15/29 | | | | 50,000 | | | | 49,142 | |
UnitedHealth Group Inc., Senior Notes | | | 2.000 | % | | | 5/15/30 | | | | 80,000 | | | | 73,631 | |
UnitedHealth Group Inc., Senior Notes | | | 2.300 | % | | | 5/15/31 | | | | 10,000 | | | | 9,392 | |
UnitedHealth Group Inc., Senior Notes | | | 5.700 | % | | | 10/15/40 | | | | 30,000 | | | | 37,681 | |
UnitedHealth Group Inc., Senior Notes | | | 2.900 | % | | | 5/15/50 | | | | 40,000 | | | | 35,455 | |
UnitedHealth Group Inc., Senior Notes | | | 3.250 | % | | | 5/15/51 | | | | 120,000 | | | | 112,712 | |
Total Health Care Providers & Services | | | | | | | | | | | | | | | 1,389,638 | |
Pharmaceuticals — 1.2% | | | | | | | | | | | | | | | | |
Bristol-Myers Squibb Co., Senior Notes | | | 2.600 | % | | | 5/16/22 | | | | 20,000 | | | | 20,019 | |
Bristol-Myers Squibb Co., Senior Notes | | | 3.200 | % | | | 6/15/26 | | | | 14,000 | | | | 14,215 | |
Bristol-Myers Squibb Co., Senior Notes | | | 3.400 | % | | | 7/26/29 | | | | 44,000 | | | | 44,783 | |
Bristol-Myers Squibb Co., Senior Notes | | | 4.250 | % | | | 10/26/49 | | | | 40,000 | | | | 43,620 | |
Johnson & Johnson, Senior Notes | | | 0.950 | % | | | 9/1/27 | | | | 80,000 | | | | 73,192 | |
Johnson & Johnson, Senior Notes | | | 3.625 | % | | | 3/3/37 | | | | 30,000 | | | | 31,015 | |
Merck & Co. Inc., Senior Notes | | | 1.450 | % | | | 6/24/30 | | | | 30,000 | | | | 26,636 | |
Merck & Co. Inc., Senior Notes | | | 2.750 | % | | | 12/10/51 | | | | 90,000 | | | | 78,394 | |
Pfizer Inc., Senior Notes | | | 0.800 | % | | | 5/28/25 | | | | 60,000 | | | | 56,741 | |
Teva Pharmaceutical Finance Co. BV, Senior Notes | | | 2.950 | % | | | 12/18/22 | | | | 280,000 | | | | 278,250 | |
See Notes to Financial Statements.
| | | | | | |
| Western Asset Total Return ETF 2022 Annual Report | | | | | 25 | |
Schedule of investments (cont’d)
March 31, 2022
Western Asset Total Return ETF
(Percentages shown based on Fund net assets)
| | | | | | | | | | | | | | | | |
| Security | | Rate | | | Maturity
Date | | | Face
Amount† | | | Value | |
Pharmaceuticals — continued | | | | | | | | | | | | | | | | |
Teva Pharmaceutical Finance Netherlands III BV, Senior Notes | | | 2.800 | % | | | 7/21/23 | | | | 90,000 | | | $ | 88,780 | |
Teva Pharmaceutical Finance Netherlands III BV, Senior Notes | | | 3.150 | % | | | 10/1/26 | | | | 340,000 | | | | 307,833 | |
Teva Pharmaceutical Finance Netherlands III BV, Senior Notes | | | 5.125 | % | | | 5/9/29 | | | | 320,000 | | | | 307,590 | |
Total Pharmaceuticals | | | | | | | | | | | | | | | 1,371,068 | |
Total Health Care | | | | | | | | | | | | | | | 3,849,458 | |
| Industrials — 3.6% | | | | | | | | | | | | | | | | |
Aerospace & Defense — 1.3% | | | | | | | | | | | | | | | | |
Boeing Co., Senior Notes | | | 1.433 | % | | | 2/4/24 | | | | 220,000 | | | | 212,786 | |
Boeing Co., Senior Notes | | | 4.875 | % | | | 5/1/25 | | | | 50,000 | | | | 51,584 | |
Boeing Co., Senior Notes | | | 2.196 | % | | | 2/4/26 | | | | 180,000 | | | | 170,175 | |
Boeing Co., Senior Notes | | | 3.200 | % | | | 3/1/29 | | | | 110,000 | | | | 104,822 | |
Boeing Co., Senior Notes | | | 5.150 | % | | | 5/1/30 | | | | 90,000 | | | | 95,981 | |
Boeing Co., Senior Notes | | | 3.250 | % | | | 2/1/35 | | | | 190,000 | | | | 169,651 | |
Boeing Co., Senior Notes | | | 3.550 | % | | | 3/1/38 | | | | 10,000 | | | | 8,789 | |
Boeing Co., Senior Notes | | | 5.705 | % | | | 5/1/40 | | | | 140,000 | | | | 156,443 | |
Boeing Co., Senior Notes | | | 5.805 | % | | | 5/1/50 | | | | 70,000 | | | | 80,832 | |
Boeing Co., Senior Notes | | | 5.930 | % | | | 5/1/60 | | | | 40,000 | | | | 46,183 | |
L3Harris Technologies Inc., Senior Notes | | | 4.854 | % | | | 4/27/35 | | | | 50,000 | | | | 54,310 | |
Lockheed Martin Corp., Senior Notes | | | 3.550 | % | | | 1/15/26 | | | | 50,000 | | | | 51,196 | |
Northrop Grumman Corp., Senior Notes | | | 3.250 | % | | | 1/15/28 | | | | 130,000 | | | | 130,006 | |
Raytheon Technologies Corp., Senior Notes | | | 2.250 | % | | | 7/1/30 | | | | 170,000 | | | | 157,463 | |
Total Aerospace & Defense | | | | | | | | | | | | | | | 1,490,221 | |
Airlines — 1.4% | | | | | | | | | | | | | | | | |
Delta Air Lines Inc., Senior Notes | | | 3.800 | % | | | 4/19/23 | | | | 30,000 | | | | 30,188 | |
Delta Air Lines Inc., Senior Notes | | | 2.900 | % | | | 10/28/24 | | | | 60,000 | | | | 58,650 | |
Delta Air Lines Inc., Senior Notes | | | 7.375 | % | | | 1/15/26 | | | | 490,000 | | | | 532,133 | |
Delta Air Lines Inc., Senior Secured Notes | | | 7.000 | % | | | 5/1/25 | | | | 390,000 | | | | 417,735 | (a) |
Delta Air Lines Inc./SkyMiles IP Ltd., Senior Secured Notes | | | 4.500 | % | | | 10/20/25 | | | | 90,000 | | | | 90,523 | (a) |
Delta Air Lines Inc./SkyMiles IP Ltd., Senior Secured Notes | | | 4.750 | % | | | 10/20/28 | | | | 70,000 | | | | 70,536 | (a) |
Mileage Plus Holdings LLC/Mileage Plus Intellectual Property Assets Ltd., Senior Secured Notes | | | 6.500 | % | | | 6/20/27 | | | | 60,000 | | | | 62,550 | (a) |
Spirit Loyalty Cayman Ltd./Spirit IP Cayman Ltd., Senior Secured Notes | | | 8.000 | % | | | 9/20/25 | | | | 42,000 | | | | 44,730 | (a) |
See Notes to Financial Statements.
| | | | |
26 | | | | Western Asset Total Return ETF 2022 Annual Report |
Western Asset Total Return ETF
(Percentages shown based on Fund net assets)
| | | | | | | | | | | | | | | | |
| Security | | Rate | | | Maturity
Date | | | Face
Amount† | | | Value | |
Airlines — continued | | | | | | | | | | | | | | | | |
United Airlines Inc., Senior Secured Notes | | | 4.375 | % | | | 4/15/26 | | | | 30,000 | | | $ | 29,510 | (a) |
United Airlines Inc., Senior Secured Notes | | | 4.625 | % | | | 4/15/29 | | | | 250,000 | | | | 237,737 | (a) |
Total Airlines | | | | | | | | | | | | | | | 1,574,292 | |
Building Products — 0.0%†† | | | | | | | | | | | | | | | | |
Carrier Global Corp., Senior Notes | | | 2.722 | % | | | 2/15/30 | | | | 20,000 | | | | 18,797 | |
Carrier Global Corp., Senior Notes | | | 2.700 | % | | | 2/15/31 | | | | 25,000 | | | | 23,329 | |
Total Building Products | | | | | | | | | | | | | | | 42,126 | |
Commercial Services & Supplies — 0.3% | | | | | | | | | | | | | | | | |
Allied Universal Holdco LLC/Allied Universal Finance Corp./Atlas Luxco 4 Sarl, Senior Secured Notes | | | 4.625 | % | | | 6/1/28 | | | | 360,000 | | | | 336,492 | (a) |
Cintas Corp. No 2, Senior Notes | | | 2.900 | % | | | 4/1/22 | | | | 50,000 | | | | 50,000 | |
Republic Services Inc., Senior Notes | | | 2.500 | % | | | 8/15/24 | | | | 10,000 | | | | 9,894 | |
Total Commercial Services & Supplies | | | | | | | | | | | | | | | 396,386 | |
Electrical Equipment — 0.1% | | | | | | | | | | | | | | | | |
Eaton Corp., Senior Notes | | | 2.750 | % | | | 11/2/22 | | | | 50,000 | | | | 50,272 | |
Vertiv Group Corp., Senior Secured Notes | | | 4.125 | % | | | 11/15/28 | | | | 10,000 | | | | 9,126 | (a) |
Total Electrical Equipment | | | | | | | | | | | | | | | 59,398 | |
Industrial Conglomerates — 0.1% | | | | | | | | | | | | | | | | |
3M Co., Senior Notes | | | 2.375 | % | | | 8/26/29 | | | | 10,000 | | | | 9,510 | |
3M Co., Senior Notes | | | 3.050 | % | | | 4/15/30 | | | | 40,000 | | | | 39,769 | |
General Electric Co., Senior Notes | | | 6.750 | % | | | 3/15/32 | | | | 6,000 | | | | 7,558 | |
Honeywell International Inc., Senior Notes | | | 1.350 | % | | | 6/1/25 | | | | 30,000 | | | | 28,897 | |
Total Industrial Conglomerates | | | | | | | | | | | | | | | 85,734 | |
Machinery — 0.0%†† | | | | | | | | | | | | | | | | |
Otis Worldwide Corp., Senior Notes | | | 2.056 | % | | | 4/5/25 | | | | 20,000 | | | | 19,470 | |
Road & Rail — 0.3% | | | | | | | | | | | | | | | | |
Burlington Northern Santa Fe LLC, Senior Notes | | | 2.875 | % | | | 6/15/52 | | | | 40,000 | | | | 35,434 | |
Canadian Pacific Railway Co., Senior Notes | | | 3.000 | % | | | 12/2/41 | | | | 20,000 | | | | 17,991 | |
Canadian Pacific Railway Co., Senior Notes | | | 3.100 | % | | | 12/2/51 | | | | 60,000 | | | | 53,049 | |
Union Pacific Corp., Senior Notes | | | 2.150 | % | | | 2/5/27 | | | | 40,000 | | | | 38,424 | |
Union Pacific Corp., Senior Notes | | | 2.891 | % | | | 4/6/36 | | | | 30,000 | | | | 28,032 | |
Union Pacific Corp., Senior Notes | | | 3.839 | % | | | 3/20/60 | | | | 70,000 | | | | 70,243 | |
Union Pacific Corp., Senior Notes | | | 3.750 | % | | | 2/5/70 | | | | 50,000 | | | | 48,681 | |
XPO Logistics Inc., Senior Notes | | | 6.250 | % | | | 5/1/25 | | | | 10,000 | | | | 10,336 | (a) |
Total Road & Rail | | | | | | | | | | | | | | | 302,190 | |
Trading Companies & Distributors — 0.1% | | | | | | | | | | | | | | | | |
Air Lease Corp., Senior Notes | | | 3.375 | % | | | 7/1/25 | | | | 30,000 | | | | 29,568 | |
See Notes to Financial Statements.
| | | | | | |
| Western Asset Total Return ETF 2022 Annual Report | | | | | 27 | |
Schedule of investments (cont’d)
March 31, 2022
Western Asset Total Return ETF
(Percentages shown based on Fund net assets)
| | | | | | | | | | | | | | | | |
| Security | | Rate | | | Maturity
Date | | | Face
Amount† | | | Value | |
Trading Companies & Distributors — continued | | | | | | | | | | | | | | | | |
H&E Equipment Services Inc., Senior Notes | | | 3.875 | % | | | 12/15/28 | | | | 10,000 | | | $ | 9,375 | (a) |
United Rentals North America Inc., Senior Notes | | | 3.875 | % | | | 2/15/31 | | | | 20,000 | | | | 18,850 | |
United Rentals North America Inc., Senior Notes | | | 3.750 | % | | | 1/15/32 | | | | 30,000 | | | | 27,975 | |
Total Trading Companies & Distributors | | | | | | | | | | | | | | | 85,768 | |
Total Industrials | | | | | | | | | | | | | | | 4,055,585 | |
| Information Technology — 1.4% | | | | | | | | | | | | | | | | |
Communications Equipment — 0.0%†† | | | | | | | | | | | | | | | | |
CommScope Inc., Senior Secured Notes | | | 6.000 | % | | | 3/1/26 | | | | 20,000 | | | | 20,232 | (a) |
IT Services — 0.3% | | | | | | | | | | | | | | | | |
International Business Machines Corp., Senior Notes | | | 3.000 | % | | | 5/15/24 | | | | 100,000 | | | | 100,661 | |
PayPal Holdings Inc., Senior Notes | | | 1.350 | % | | | 6/1/23 | | | | 40,000 | | | | 39,883 | |
PayPal Holdings Inc., Senior Notes | | | 1.650 | % | | | 6/1/25 | | | | 30,000 | | | | 28,845 | |
PayPal Holdings Inc., Senior Notes | | | 2.300 | % | | | 6/1/30 | | | | 40,000 | | | | 37,235 | |
Visa Inc., Senior Notes | | | 2.700 | % | | | 4/15/40 | | | | 115,000 | | | | 104,555 | |
Visa Inc., Senior Notes | | | 4.300 | % | | | 12/14/45 | | | | 40,000 | | | | 44,886 | |
Total IT Services | | | | | | | | | | | | | | | 356,065 | |
Semiconductors & Semiconductor Equipment — 0.3% | | | | | | | | | | | | | | | | |
Broadcom Inc., Senior Notes | | | 3.137 | % | | | 11/15/35 | | | | 170,000 | | | | 149,786 | (a) |
Intel Corp., Senior Notes | | | 1.600 | % | | | 8/12/28 | | | | 30,000 | | | | 27,342 | |
Intel Corp., Senior Notes | | | 4.750 | % | | | 3/25/50 | | | | 40,000 | | | | 46,581 | |
Intel Corp., Senior Notes | | | 3.050 | % | | | 8/12/51 | | | | 10,000 | | | | 8,891 | |
NVIDIA Corp., Senior Notes | | | 2.850 | % | | | 4/1/30 | | | | 20,000 | | | | 19,678 | |
NVIDIA Corp., Senior Notes | | | 3.500 | % | | | 4/1/40 | | | | 60,000 | | | | 60,437 | |
NXP BV/NXP Funding LLC/NXP USA Inc., Senior Notes | | | 2.700 | % | | | 5/1/25 | | | | 40,000 | | | | 38,770 | (a) |
Total Semiconductors & Semiconductor Equipment | | | | | | | | 351,485 | |
Software — 0.6% | | | | | | | | | | | | | | | | |
Microsoft Corp., Senior Notes | | | 3.300 | % | | | 2/6/27 | | | | 210,000 | | | | 215,410 | |
Oracle Corp., Senior Notes | | | 1.650 | % | | | 3/25/26 | | | | 110,000 | | | | 102,575 | |
Oracle Corp., Senior Notes | | | 2.950 | % | | | 4/1/30 | | | | 10,000 | | | | 9,226 | |
Oracle Corp., Senior Notes | | | 2.875 | % | | | 3/25/31 | | | | 130,000 | | | | 118,533 | |
salesforce.com Inc., Senior Notes | | | 3.250 | % | | | 4/11/23 | | | | 50,000 | | | | 50,623 | |
salesforce.com Inc., Senior Notes | | | 1.500 | % | | | 7/15/28 | | | | 50,000 | | | | 45,995 | |
Workday Inc., Senior Notes | | | 3.500 | % | | | 4/1/27 | | | | 20,000 | | | | 19,995 | (e) |
See Notes to Financial Statements.
| | | | |
28 | | | | Western Asset Total Return ETF 2022 Annual Report |
Western Asset Total Return ETF
(Percentages shown based on Fund net assets)
| | | | | | | | | | | | | | | | |
| Security | | Rate | | | Maturity
Date | | | Face
Amount† | | | Value | |
Software — continued | | | | | | | | | | | | | | | | |
Workday Inc., Senior Notes | | | 3.700 | % | | | 4/1/29 | | | | 30,000 | | | $ | 30,067 | (e) |
Workday Inc., Senior Notes | | | 3.800 | % | | | 4/1/32 | | | | 20,000 | | | | 19,962 | (e) |
Total Software | | | | | | | | | | | | | | | 612,386 | |
Technology Hardware, Storage & Peripherals — 0.2% | | | | | | | | | | | | | | | | |
Apple Inc., Senior Notes | | | 1.125 | % | | | 5/11/25 | | | | 160,000 | | | | 152,770 | |
Apple Inc., Senior Notes | | | 2.450 | % | | | 8/4/26 | | | | 80,000 | | | | 79,020 | |
Total Technology Hardware, Storage & Peripherals | | | | | | | | 231,790 | |
Total Information Technology | | | | | | | | | | | | | | | 1,571,958 | |
| Materials — 1.7% | | | | | | | | | | | | | | | | |
Chemicals — 0.1% | | | | | | | | | | | | | | | | |
Orbia Advance Corp. SAB de CV, Senior Notes | | | 2.875 | % | | | 5/11/31 | | | | 200,000 | | | | 176,998 | (a) |
Containers & Packaging — 0.0%†† | | | | | | | | | | | | | | | | |
Ball Corp., Senior Notes | | | 3.125 | % | | | 9/15/31 | | | | 50,000 | | | | 44,685 | |
Metals & Mining — 1.2% | | | | | | | | | | | | | | | | |
Anglo American Capital PLC, Senior Notes | | | 4.000 | % | | | 9/11/27 | | | | 200,000 | | | | 200,390 | (a) |
Barrick North America Finance LLC, Senior Notes | | | 5.750 | % | | | 5/1/43 | | | | 50,000 | | | | 60,930 | |
BHP Billiton Finance USA Ltd., Senior Notes | | | 5.000 | % | | | 9/30/43 | | | | 30,000 | | | | 35,577 | |
Freeport-McMoRan Inc., Senior Notes | | | 4.550 | % | | | 11/14/24 | | | | 460,000 | | | | 473,800 | |
Freeport-McMoRan Inc., Senior Notes | | | 4.625 | % | | | 8/1/30 | | | | 20,000 | | | | 20,450 | |
Freeport-McMoRan Inc., Senior Notes | | | 5.450 | % | | | 3/15/43 | | | | 125,000 | | | | 139,980 | |
Glencore Funding LLC, Senior Notes | | | 4.125 | % | | | 3/12/24 | | | | 150,000 | | | | 152,026 | (a) |
Glencore Funding LLC, Senior Notes | | | 4.000 | % | | | 3/27/27 | | | | 150,000 | | | | 150,460 | (a) |
Glencore Funding LLC, Senior Notes | | | 3.875 | % | | | 10/27/27 | | | | 80,000 | | | | 79,665 | (a) |
Total Metals & Mining | | | | | | | | | | | | | | | 1,313,278 | |
Paper & Forest Products — 0.4% | | | | | | | | | | | | | | | | |
Suzano Austria GmbH, Senior Notes | | | 3.750 | % | | | 1/15/31 | | | | 150,000 | | | | 141,225 | |
Suzano Austria GmbH, Senior Notes | | | 3.125 | % | | | 1/15/32 | | | | 310,000 | | | | 274,468 | |
Total Paper & Forest Products | | | | | | | | | | | | | | | 415,693 | |
Total Materials | | | | | | | | | | | | | | | 1,950,654 | |
| Real Estate — 0.0%†† | | | | | | | | | | | | | | | | |
Equity Real Estate Investment Trusts (REITs) — 0.0%†† | | | | | | | | | | | | | | | | |
CTR Partnership LP/CareTrust Capital Corp., Senior Notes | | | 3.875 | % | | | 6/30/28 | | | | 10,000 | | | | 9,427 | (a) |
MPT Operating Partnership LP/MPT Finance Corp., Senior Notes | | | 5.000 | % | | | 10/15/27 | | | | 10,000 | | | | 10,169 | |
See Notes to Financial Statements.
| | | | | | |
| Western Asset Total Return ETF 2022 Annual Report | | | | | 29 | |
Schedule of investments (cont’d)
March 31, 2022
Western Asset Total Return ETF
(Percentages shown based on Fund net assets)
| | | | | | | | | | | | | | | | |
| Security | | Rate | | | Maturity
Date | | | Face
Amount† | | | Value | |
Equity Real Estate Investment Trusts (REITs) — continued | | | | | | | | | | | | | | | | |
MPT Operating Partnership LP/MPT Finance Corp., Senior Notes | | | 4.625 | % | | | 8/1/29 | | | | 10,000 | | | $ | 9,900 | |
MPT Operating Partnership LP/MPT Finance Corp., Senior Notes | | | 3.500 | % | | | 3/15/31 | | | | 40,000 | | | | 37,148 | |
Total Real Estate | | | | | | | | | | | | | | | 66,644 | |
| Utilities — 0.7% | | | | | | | | | | | | | | | | |
Electric Utilities — 0.7% | | | | | | | | | | | | | | | | |
American Transmission Systems Inc., Senior Notes | | | 2.650 | % | | | 1/15/32 | | | | 240,000 | | | | 221,807 | (a) |
Duke Energy Ohio Inc., Secured Bonds | | | 3.650 | % | | | 2/1/29 | | | | 100,000 | | | | 101,646 | |
FirstEnergy Corp., Senior Notes | | | 7.375 | % | | | 11/15/31 | | | | 290,000 | | | | 357,674 | |
Pacific Gas and Electric Co., First Mortgage Bonds | | | 1.750 | % | | | 6/16/22 | | | | 70,000 | | | | 69,921 | |
Total Utilities | | | | | | | | | | | | | | | 751,048 | |
Total Corporate Bonds & Notes (Cost — $45,886,600) | | | | | | | | 43,916,784 | |
| Mortgage-Backed Securities — 17.3% | | | | | | | | | | | | | | | | |
FHLMC — 3.3% | | | | | | | | | | | | | | | | |
Federal Home Loan Mortgage Corp. (FHLMC) | | | 3.500 | % | | | 1/1/38-5/1/50 | | | | 464,407 | | | | 469,031 | |
Federal Home Loan Mortgage Corp. (FHLMC) | | | 2.000 | % | | | 9/1/41-5/1/51 | | | | 1,114,322 | | | | 1,040,140 | |
Federal Home Loan Mortgage Corp. (FHLMC) | | | 1.500 | % | | | 10/1/41 | | | | 38,790 | | | | 35,151 | |
Federal Home Loan Mortgage Corp. (FHLMC) | | | 4.500 | % | | | 5/1/47-7/1/49 | | | | 190,380 | | | | 199,629 | |
Federal Home Loan Mortgage Corp. (FHLMC) | | | 4.000 | % | | | 3/1/48 | | | | 56,143 | | | | 57,900 | |
Federal Home Loan Mortgage Corp. (FHLMC) | | | 5.000 | % | | | 11/1/49 | | | | 117,898 | | | | 125,436 | |
Federal Home Loan Mortgage Corp. (FHLMC) | | | 3.000 | % | | | 2/1/50 | | | | 128,574 | | | | 126,704 | |
Federal Home Loan Mortgage Corp. (FHLMC) | | | 2.500 | % | | | 12/1/50-11/1/51 | | | | 1,136,899 | | | | 1,089,531 | |
Federal Home Loan Mortgage Corp. (FHLMC) (12 mo. USD LIBOR + 1.619%) | | | 2.872 | % | | | 11/1/47 | | | | 75,032 | | | | 75,590 | (d) |
Federal Home Loan Mortgage Corp. (FHLMC) (12 mo. USD LIBOR + 1.623%) | | | 3.089 | % | | | 2/1/50 | | | | 90,645 | | | | 91,107 | (d) |
Federal Home Loan Mortgage Corp. (FHLMC) (12 mo. USD LIBOR + 1.628%) | | | 3.012 | % | | | 11/1/48 | | | | 165,669 | | | | 166,354 | (d) |
Federal Home Loan Mortgage Corp. (FHLMC) Gold | | | 3.000 | % | | | 10/1/46-5/1/47 | | | | 127,547 | | | | 126,858 | |
Federal Home Loan Mortgage Corp. (FHLMC) Gold | | | 4.000 | % | | | 6/1/47 | | | | 162,533 | | | | 168,005 | |
Total FHLMC | | | | | | | | | | | | | | | 3,771,436 | |
See Notes to Financial Statements.
| | | | |
30 | | | | Western Asset Total Return ETF 2022 Annual Report |
Western Asset Total Return ETF
(Percentages shown based on Fund net assets)
| | | | | | | | | | | | | | | | |
| Security | | Rate | | | Maturity
Date | | | Face
Amount† | | | Value | |
FNMA — 11.7% | | | | | | | | | | | | | | | | |
Federal National Mortgage Association (FNMA) | | | 3.160 | % | | | 5/1/29 | | | | 9,628 | | | $ | 9,799 | |
Federal National Mortgage Association (FNMA) | | | 2.930 | % | | | 6/1/30 | | | | 19,339 | | | | 19,366 | |
Federal National Mortgage Association (FNMA) | | | 2.150 | % | | | 2/1/32 | | | | 20,000 | | | | 18,788 | (d) |
Federal National Mortgage Association (FNMA) | | | 3.500 | % | | | 12/1/34-8/1/50 | | | | 974,517 | | | | 987,448 | |
Federal National Mortgage Association (FNMA) | | | 2.790 | % | | | 1/1/35 | | | | 49,489 | | | | 47,934 | (d) |
Federal National Mortgage Association (FNMA) | | | 3.000 | % | | | 7/1/35-3/1/52 | | | | 2,290,025 | | | | 2,263,799 | |
Federal National Mortgage Association (FNMA) | | | 2.500 | % | | | 9/1/36-3/1/52 | | | | 2,517,561 | | | | 2,414,252 | |
Federal National Mortgage Association (FNMA) | | | 6.000 | % | | | 7/1/41 | | | | 37,083 | | | | 41,408 | |
Federal National Mortgage Association (FNMA) | | | 2.000 | % | | | 10/1/41-2/1/52 | | | | 1,438,992 | | | | 1,339,798 | |
Federal National Mortgage Association (FNMA) | | | 4.500 | % | | | 6/1/47- 1/1/59 | | | | 271,410 | | | | 285,182 | |
Federal National Mortgage Association (FNMA) | | | 4.000 | % | | | 10/1/47-1/1/49 | | | | 769,282 | | | | 791,928 | |
Federal National Mortgage Association (FNMA) | | | 5.000 | % | | | 2/1/49 | | | | 94,736 | | | | 101,254 | |
Federal National Mortgage Association (FNMA) | | | 2.000 | % | | | 4/1/52 | | | | 1,000,000 | | | | 928,242 | (f) |
Federal National Mortgage Association (FNMA) | | | 2.500 | % | | | 4/1/52-5/1/52 | | | | 1,100,000 | | | | 1,049,073 | (f) |
Federal National Mortgage Association (FNMA) | | | 3.000 | % | | | 4/1/52-5/1/52 | | | | 1,000,000 | | | | 977,667 | (f) |
Federal National Mortgage Association (FNMA) | | | 4.500 | % | | | 4/1/52 | | | | 300,000 | | | | 310,875 | (f) |
Federal National Mortgage Association (FNMA) | | | 3.500 | % | | | 6/1/52 | | | | 1,400,000 | | | | 1,393,968 | (f) |
Federal National Mortgage Association (FNMA) | | | 4.000 | % | | | 6/1/52 | | | | 200,000 | | | | 202,681 | (f) |
Total FNMA | | | | | | | | | | | | | | | 13,183,462 | |
GNMA — 2.3% | | | | | | | | | | | | | | | | |
Government National Mortgage Association (GNMA) | | | 3.000 | % | | | 10/15/42 | | | | 51,780 | | | | 51,573 | |
See Notes to Financial Statements.
| | | | | | |
| Western Asset Total Return ETF 2022 Annual Report | | | | | 31 | |
Schedule of investments (cont’d)
March 31, 2022
Western Asset Total Return ETF
(Percentages shown based on Fund net assets)
| | | | | | | | | | | | | | | | |
| Security | | Rate | | | Maturity
Date | | | Face
Amount† | | | Value | |
GNMA — continued | | | | | | | | | | | | | | | | |
Government National Mortgage Association (GNMA) II | | | 3.500 | % | | | 2/20/46-1/20/50 | | | | 390,849 | | | $ | 396,240 | |
Government National Mortgage Association (GNMA) II | | | 3.000 | % | | | 11/20/46-2/20/50 | | | | 580,960 | | | | 584,973 | |
Government National Mortgage Association (GNMA) II | | | 4.500 | % | | | 4/20/48-4/20/50 | | | | 435,972 | | | | 453,893 | |
Government National Mortgage Association (GNMA) II | | | 5.000 | % | | | 11/20/48 | | | | 33,438 | | | | 35,110 | |
Government National Mortgage Association (GNMA) II | | | 4.000 | % | | | 3/20/49-4/20/50 | | | | 392,245 | | | | 403,971 | |
Government National Mortgage Association (GNMA) II | | | 3.500 | % | | | 5/1/52-6/1/52 | | | | 300,000 | | | | 300,078 | (f) |
Government National Mortgage Association (GNMA) II | | | 3.000 | % | | | 6/1/52 | | | | 300,000 | | | | 294,938 | (f) |
Government National Mortgage Association (GNMA) II | | | 4.000 | % | | | 6/1/52 | | | | 100,000 | | | | 101,207 | (f) |
Total GNMA | | | | | | | | | | | | | | | 2,621,983 | |
Total Mortgage-Backed Securities (Cost — $20,427,661) | | | | 19,576,881 | |
| Collateralized Mortgage Obligations (g) — 10.3% | | | | | | | | | | | | | | | | |
Alternative Loan Trust, 2005-81 A1 (1 mo. USD LIBOR + 0.560%) | | | 1.017 | % | | | 2/25/37 | | | | 146,422 | | | | 125,223 | (d) |
AREIT Trust, 2021-CRE5 A (1 mo. USD LIBOR + 1.080%) | | | 1.477 | % | | | 7/17/26 | | | | 200,000 | | | | 199,538 | (a)(d) |
BWAY Mortgage Trust, 2015-1740 E | | | 4.450 | % | | | 1/10/35 | | | | 500,000 | | | | 430,989 | (a)(d) |
BX Commercial Mortgage Trust, 2018-IND G (1 mo. USD LIBOR + 2.050%) | | | 2.447 | % | | | 11/15/35 | | | | 133,000 | | | | 131,997 | (a)(d) |
BX Commercial Mortgage Trust, 2019-IMC F (1 mo. USD LIBOR + 2.900%) | | | 3.297 | % | | | 4/15/34 | | | | 300,000 | | | | 292,440 | (a)(d) |
Cold Storage Trust, 2020-ICE5 A (1 mo. USD LIBOR + 0.900%) | | | 1.297 | % | | | 11/15/37 | | | | 501,325 | | | | 495,457 | (a)(d) |
CSAIL Commercial Mortgage Trust, 2017-C8 C | | | 4.434 | % | | | 6/15/50 | | | | 500,000 | | | | 460,926 | (d) |
CSAIL Commercial Mortgage Trust, 2021-C20 A3 | | | 2.805 | % | | | 3/15/54 | | | | 240,000 | | | | 227,702 | |
CSMC Trust, 2019-UVIL A | | | 3.160 | % | | | 12/15/41 | | | | 260,000 | | | | 251,625 | (a) |
CSMC Trust, 2021-NQM6 A3 | | | 1.585 | % | | | 7/25/66 | | | | 224,977 | | | | 212,264 | (a)(d) |
Deephaven Residential Mortgage Trust, 2022-1 A2 | | | 2.961 | % | | | 1/25/67 | | | | 240,000 | | | | 223,155 | (a)(d) |
See Notes to Financial Statements.
| | | | |
32 | | | | Western Asset Total Return ETF 2022 Annual Report |
Western Asset Total Return ETF
(Percentages shown based on Fund net assets)
| | | | | | | | | | | | | | | | |
| Security | | Rate | | | Maturity
Date | | | Face
Amount† | | | Value | |
| Collateralized Mortgage Obligations (g) — continued | | | | | | | | | | | | | | | | |
Federal Home Loan Mortgage Corp. (FHLMC) Multifamily Structured Pass-Through Certificates, K101 A1 | | | 2.190 | % | | | 7/25/29 | | | | 475,935 | | | $ | 467,181 | |
Federal Home Loan Mortgage Corp. (FHLMC) Multifamily Structured Pass-Through Certificates, K101 X1, IO | | | 0.835 | % | | | 10/25/29 | | | | 2,885,969 | | | | 153,785 | (d) |
Federal Home Loan Mortgage Corp. (FHLMC) REMIC, 5010 IK, IO | | | 2.500 | % | | | 9/25/50 | | | | 73,595 | | | | 11,083 | |
Federal Home Loan Mortgage Corp. (FHLMC) REMIC, 5010 JI, IO | | | 2.500 | % | | | 9/25/50 | | | | 86,712 | | | | 14,629 | |
Federal Home Loan Mortgage Corp. (FHLMC) REMIC, 5018 MI, IO | | | 2.000 | % | | | 10/25/50 | | | | 90,780 | | | | 12,643 | |
Federal Home Loan Mortgage Corp. (FHLMC) REMIC, 5140 NI, IO | | | 2.500 | % | | | 5/25/49 | | | | 97,248 | | | | 13,732 | |
Federal Home Loan Mortgage Corp. (FHLMC) REMIC, Structured Agency Credit Risk Debt Notes, 2021-DNA6 M2 (30 Day Average SOFR + 1.500%) | | | 1.599 | % | | | 10/25/41 | | | | 190,000 | | | | 180,692 | (a)(d) |
Federal Home Loan Mortgage Corp. (FHLMC) Seasoned Credit Risk Transfer Trust, 2018-1 M | | | 4.750 | % | | | 5/25/57 | | | | 550,000 | | | | 537,555 | (a)(d) |
Federal Home Loan Mortgage Corp. (FHLMC) Seasoned Credit Risk Transfer Trust, 2020-1 M | | | 4.250 | % | | | 8/25/59 | | | | 640,000 | | | | 606,697 | (a)(d) |
Federal National Mortgage Association (FNMA) — CAS, 2014-C01 M2 (1 mo. USD LIBOR + 4.400%) | | | 4.857 | % | | | 1/25/24 | | | | 46,772 | | | | 48,377 | (d) |
Federal National Mortgage Association (FNMA) — CAS, 2014-C02 1M2 (1 mo. USD LIBOR + 2.600%) | | | 3.057 | % | | | 5/25/24 | | | | 99,568 | | | | 99,692 | (d) |
Federal National Mortgage Association (FNMA) — CAS, 2015-C03 1M2 (1 mo. USD LIBOR + 5.000%) | | | 5.457 | % | | | 7/25/25 | | | | 22,461 | | | | 22,834 | (a)(d) |
Federal National Mortgage Association (FNMA) — CAS, 2016-C03 1M2 (1 mo. USD LIBOR + 5.300%) | | | 5.757 | % | | | 10/25/28 | | | | 119,626 | | | | 124,525 | (a)(d) |
Federal National Mortgage Association (FNMA) — CAS, 2017-C05 1M2 (1 mo. USD LIBOR + 2.200%) | | | 2.657 | % | | | 1/25/30 | | | | 76,233 | | | | 76,608 | (d) |
See Notes to Financial Statements.
| | | | | | |
| Western Asset Total Return ETF 2022 Annual Report | | | | | 33 | |
Schedule of investments (cont’d)
March 31, 2022
Western Asset Total Return ETF
(Percentages shown based on Fund net assets)
| | | | | | | | | | | | | | | | |
| Security | | Rate | | | Maturity
Date | | | Face
Amount† | | | Value | |
| Collateralized Mortgage Obligations (g) — continued | | | | | | | | | | | | | | | | |
Federal National Mortgage Association (FNMA) — CAS, 2017-C07 1M2 (1 mo. USD LIBOR + 2.400%) | | | 2.857 | % | | | 5/25/30 | | | | 323,077 | | | $ | 326,822 | (a)(d) |
Federal National Mortgage Association (FNMA) — CAS, 2018-C01 1B1 (1 mo. USD LIBOR + 3.550%) | | | 4.007 | % | | | 7/25/30 | | | | 230,000 | | | | 227,697 | (a)(d) |
Federal National Mortgage Association (FNMA) — CAS, 2018-C01 1M2 (1 mo. USD LIBOR + 2.250%) | | | 2.707 | % | | | 7/25/30 | | | | 251,175 | | | | 253,067 | (a)(d) |
Federal National Mortgage Association (FNMA) — CAS, 2018-C03 1B1 (1 mo. USD LIBOR + 3.750%) | | | 4.207 | % | | | 10/25/30 | | | | 320,000 | | | | 315,993 | (a)(d) |
Federal National Mortgage Association (FNMA) — CAS, 2018-C03 1M2 (1 mo. USD LIBOR + 2.150%) | | | 2.607 | % | | | 10/25/30 | | | | 210,312 | | | | 211,100 | (a)(d) |
Federal National Mortgage Association (FNMA) — CAS, 2019-R07 1M2 (1 mo. USD LIBOR + 2.100%) | | | 2.557 | % | | | 10/25/39 | | | | 70,116 | | | | 70,116 | (a)(d) |
Federal National Mortgage Association (FNMA) — CAS, 2021-R03 1 M2 (30 Day Average SOFR + 1.650%) | | | 1.749 | % | | | 12/25/41 | | | | 260,000 | | | | 246,107 | (a)(d) |
Federal National Mortgage Association (FNMA) ACES, 2018-M9 APT2 | | | 3.121 | % | | | 4/25/28 | | | | 97,518 | | | | 98,076 | (d) |
Federal National Mortgage Association (FNMA) REMIC, 2020-74 EI, IO | | | 2.500 | % | | | 10/25/50 | | | | 83,781 | | | | 13,680 | |
Federal National Mortgage Association (FNMA) REMIC, 2020-89 DI, IO | | | 2.500 | % | | | 12/25/50 | | | | 250,224 | | | | 36,154 | |
Federal National Mortgage Association (FNMA) REMIC, 2021-1 IG, IO | | | 2.500 | % | | | 2/25/51 | | | | 183,252 | | | | 30,150 | |
Government National Mortgage Association (GNMA), 2013-50 IO, IO | | | 0.057 | % | | | 10/16/48 | | | | 10,243,876 | | | | 27,135 | (d) |
Government National Mortgage Association (GNMA), 2014-17 AM | | | 3.356 | % | | | 6/16/48 | | | | 68,045 | | | | 68,563 | (d) |
Government National Mortgage Association (GNMA), 2016-14 H | | | 2.850 | % | | | 3/16/57 | | | | 326,961 | | | | 315,385 | |
Government National Mortgage Association (GNMA), 2020-123 NI, IO | | | 2.500 | % | | | 8/20/50 | | | | 87,565 | | | | 12,713 | |
Government National Mortgage Association (GNMA), 2020-160 YI, IO | | | 2.500 | % | | | 10/20/50 | | | | 181,410 | | | | 23,698 | |
Government National Mortgage Association (GNMA), 2020-181 WI, IO | | | 2.000 | % | | | 12/20/50 | | | | 438,453 | | | | 45,951 | |
See Notes to Financial Statements.
| | | | |
34 | | | | Western Asset Total Return ETF 2022 Annual Report |
Western Asset Total Return ETF
(Percentages shown based on Fund net assets)
| | | | | | | | | | | | | | | | |
| Security | | Rate | | | Maturity
Date | | | Face
Amount† | | | Value | |
| Collateralized Mortgage Obligations (g) — continued | | | | | | | | | | | | | | | | |
Government National Mortgage Association (GNMA), 2020-H13 FA (1 mo. USD LIBOR + 0.450%) | | | 0.899 | % | | | 7/20/70 | | | | 377,394 | | | $ | 375,364 | (d) |
Government National Mortgage Association (GNMA), 2020-H13 FC (1 mo. USD LIBOR + 0.450%) | | | 0.899 | % | | | 7/20/70 | | | | 385,632 | | | | 383,703 | (d) |
Government National Mortgage Association (GNMA), 2020-H13 FM (1 mo. USD LIBOR + 0.400%) | | | 0.849 | % | | | 8/20/70 | | | | 212,874 | | | | 212,155 | (d) |
Government National Mortgage Association (GNMA), 2022-3 IO, IO | | | 0.641 | % | | | 2/16/61 | | | | 99,699 | | | | 6,326 | (d) |
GS Mortgage Securities Corp. II, 2018-SRP5 C (1 mo. USD LIBOR + 4.000%) | | | 4.397 | % | | | 9/15/31 | | | | 375,703 | | | | 136,637 | (a)(d) |
GS Mortgage Securities Trust, 2017-GS8 C | | | 4.335 | % | | | 11/10/50 | | | | 401,000 | | | | 400,268 | (d) |
GS Mortgage Securities Trust, 2020-DUNE A (1 mo. USD LIBOR + 1.100%) | | | 1.497 | % | | | 12/15/36 | | | | 280,000 | | | | 278,059 | (a)(d) |
Impac CMB Trust, 2005-7 A1 (1 mo. USD LIBOR + 0.520%) | | | 0.977 | % | | | 11/25/35 | | | | 150,751 | | | | 140,159 | (d) |
IndyMac INDX Mortgage Loan Trust, 2005- AR10 A1 (1 mo. USD LIBOR + 0.520%) | | | 0.977 | % | | | 6/25/35 | | | | 182,977 | | | | 160,986 | (d) |
JPMorgan Chase Commercial Mortgage Securities Trust, 2019-BKWD D (1 mo. USD LIBOR + 1.850%) | | | 2.247 | % | | | 9/15/29 | | | | 400,000 | | | | 388,917 | (a)(d) |
Legacy Mortgage Asset Trust, 2019-GS7 A1, Step bond (3.250% to 10/25/22, 6.250% to 10/25/23 then 7.250%) | | | 3.250 | % | | | 11/25/59 | | | | 196,324 | | | | 195,435 | (a) |
MTRO Commercial Mortgage Trust, 2019- TECH D (1 mo. USD LIBOR + 1.800%) | | | 2.197 | % | | | 12/15/33 | | | | 100,000 | | | | 96,968 | (a)(d) |
New Residential Mortgage Loan Trust, 2016-3A A1B | | | 3.250 | % | | | 9/25/56 | | | | 255,661 | | | | 253,516 | (a)(d) |
Tharaldson Hotel Portfolio Trust, 2018-THL D (1 mo. USD LIBOR + 2.300%) | | | 2.590 | % | | | 11/11/34 | | | | 243,024 | | | | 237,245 | (a)(d) |
WaMu Mortgage Pass-Through Certificates Trust, 2005-AR8 2A1A (1 mo. USD LIBOR + 0.580%) | | | 1.037 | % | | | 7/25/45 | | | | 50,004 | | | | 48,697 | (d) |
Wells Fargo Commercial Mortgage Trust, 2017-C41 B | | | 4.188 | % | | | 11/15/50 | | | | 70,000 | | | | 67,385 | (d) |
Wells Fargo Commercial Mortgage Trust, 2018-C44 A5 | | | 4.212 | % | | | 5/15/51 | | | | 500,000 | | | | 521,428 | |
Total Collateralized Mortgage Obligations (Cost — $12,386,994) | | | | 11,647,004 | |
See Notes to Financial Statements.
| | | | | | |
| Western Asset Total Return ETF 2022 Annual Report | | | | | 35 | |
Schedule of investments (cont’d)
March 31, 2022
Western Asset Total Return ETF
(Percentages shown based on Fund net assets)
| | | | | | | | | | | | | | | | |
| Security | | Rate | | | Maturity
Date | | | Face
Amount† | | | Value | |
| Sovereign Bonds — 9.6% | | | | | | | | | | | | | | | | |
Argentina — 0.0%†† | | | | | | | | | | | | | | | | |
Argentine Republic Government International Bond, Senior Notes | | | 1.000 | % | | | 7/9/29 | | | | 4,443 | | | $ | 1,517 | |
Argentine Republic Government International Bond, Senior Notes, Step bond (0.500% to 7/9/23 then 0.750%) | | | 0.500 | % | | | 7/9/30 | | | | 145,500 | | | | 48,744 | |
Total Argentina | | | | | | | | | | | | | | | 50,261 | |
Brazil — 0.4% | | | | | | | | | | | | | | | | |
Brazilian Government International Bond, Senior Notes | | | 5.000 | % | | | 1/27/45 | | | | 550,000 | | | | 488,955 | |
Colombia — 0.3% | | | | | | | | | | | | | | | | |
Colombia Government International Bond, Senior Notes | | | 5.000 | % | | | 6/15/45 | | | | 330,000 | | | | 277,731 | |
Indonesia — 3.2% | | | | | | | | | | | | | | | | |
Indonesia Government International Bond, Senior Notes | | | 4.350 | % | | | 1/11/48 | | | | 900,000 | | | | 917,551 | |
Indonesia Treasury Bond | | | 7.000 | % | | | 5/15/27 | | | | 9,787,000,000 | IDR | | | 713,707 | |
Indonesia Treasury Bond | | | 6.500 | % | | | 2/15/31 | | | | 28,500,000,000 | IDR | | | 1,950,263 | |
Indonesia Treasury Bond | | | 6.375 | % | | | 4/15/32 | | | | 959,000,000 | IDR | | | 64,849 | |
Indonesia Treasury Bond | | | 7.500 | % | | | 6/15/35 | | | | 330,000,000 | IDR | | | 23,569 | |
Total Indonesia | | | | | | | | | | | | | | | 3,669,939 | |
Kenya — 0.2% | | | | | | | | | | | | | | | | |
Republic of Kenya Government International Bond, Senior Notes | | | 6.300 | % | | | 1/23/34 | | | | 200,000 | | | | 171,500 | (a) |
Kuwait — 0.4% | | | | | | | | | | | | | | | | |
Kuwait International Government Bond, Senior Notes | | | 3.500 | % | | | 3/20/27 | | | | 400,000 | | | | 416,120 | (a) |
Mexico — 3.8% | | | | | | | | | | | | | | | | |
Mexican Bonos, Bonds | | | 8.000 | % | | | 11/7/47 | | | | 8,800,000 | MXN | | | 420,421 | |
Mexican Bonos, Senior Notes | | | 8.500 | % | | | 5/31/29 | | | | 2,290,000 | MXN | | | 115,570 | |
Mexican Bonos, Senior Notes | | | 7.750 | % | | | 11/13/42 | | | | 67,020,000 | MXN | | | 3,131,745 | |
Mexico Government International Bond, Senior Notes | | | 4.750 | % | | | 3/8/44 | | | | 700,000 | | | | 687,834 | |
Total Mexico | | | | | | | | | | | | | | | 4,355,570 | |
Peru — 0.3% | | | | | | | | | | | | | | | | |
Peruvian Government International Bond, Senior Notes | | | 2.783 | % | | | 1/23/31 | | | | 400,000 | | | | 376,600 | |
Qatar — 0.5% | | | | | | | | | | | | | | | | |
Qatar Government International Bond, Senior Notes | | | 4.400 | % | | | 4/16/50 | | | | 540,000 | | | | 606,894 | (a) |
See Notes to Financial Statements.
| | | | |
36 | | | | Western Asset Total Return ETF 2022 Annual Report |
Western Asset Total Return ETF
(Percentages shown based on Fund net assets)
| | | | | | | | | | | | | | | | |
| Security | | Rate | | | Maturity
Date | | | Face
Amount† | | | Value | |
Russia — 0.1% | | | | | | | | | | | | | | | | |
Russian Federal Bond — OFZ | | | 6.000 | % | | | 10/6/27 | | | | 9,460,000 | RUB | | $ | 3,446 | *(h) |
Russian Federal Bond — OFZ | | | 6.900 | % | | | 5/23/29 | | | | 105,522,000 | RUB | | | 38,442 | *(h) |
Russian Federal Bond — OFZ | | | 7.650 | % | | | 4/10/30 | | | | 77,880,000 | RUB | | | 28,372 | *(h) |
Russian Federal Bond — OFZ | | | 7.250 | % | | | 5/10/34 | | | | 240,000 | RUB | | | 87 | *(h) |
Total Russia | | | | | | | | | | | | | | | 70,347 | |
South Africa — 0.4% | | | | | | | | | | | | | | | | |
Republic of South Africa Government Bond, Senior Notes | | | 6.250 | % | | | 3/31/36 | | | | 9,660,000 | ZAR | | | 465,267 | |
Total Sovereign Bonds (Cost — $14,375,585) | | | | | | | | 10,949,184 | |
| U.S. Government & Agency Obligations — 7.4% | | | | | | | | | | | | | | | | |
U.S. Government Obligations — 7.4% | | | | | | | | | | | | | | | | |
U.S. Treasury Bonds | | | 1.125 | % | | | 8/15/40 | | | | 850,000 | | | | 666,354 | |
U.S. Treasury Bonds | | | 3.625 | % | | | 2/15/44 | | | | 84,000 | | | | 97,689 | |
U.S. Treasury Bonds | | | 2.000 | % | | | 2/15/50 | | | | 1,320,000 | | | | 1,188,980 | |
U.S. Treasury Bonds | | | 1.250 | % | | | 5/15/50 | | | | 3,640,000 | | | | 2,714,928 | |
U.S. Treasury Bonds | | | 1.375 | % | | | 8/15/50 | | | | 2,060,000 | | | | 1,585,556 | |
U.S. Treasury Bonds | | | 1.625 | % | | | 11/15/50 | | | | 290,000 | | | | 237,641 | |
U.S. Treasury Bonds | | | 1.875 | % | | | 2/15/51 | | | | 50,000 | | | | 43,689 | |
U.S. Treasury Bonds | | | 2.375 | % | | | 5/15/51 | | | | 170,000 | | | | 166,587 | |
U.S. Treasury Bonds | | | 2.000 | % | | | 8/15/51 | | | | 100,000 | | | | 90,219 | |
U.S. Treasury Bonds | | | 1.875 | % | | | 11/15/51 | | | | 652,000 | | | | 571,926 | |
U.S. Treasury Bonds | | | 2.250 | % | | | 2/15/52 | | | | 892,000 | | | | 855,484 | |
U.S. Treasury Notes | | | 0.250 | % | | | 11/15/23 | | | | 10,000 | | | | 9,690 | |
U.S. Treasury Notes | | | 0.250 | % | | | 6/30/25 | | | | 100,000 | | | | 92,902 | |
U.S. Treasury Notes | | | 0.375 | % | | | 1/31/26 | | | | 30,000 | | | | 27,641 | |
Total U.S. Government & Agency Obligations (Cost — $9,922,498) | | | | 8,349,286 | |
| Asset-Backed Securities — 7.0% | | | | | | | | | | | | | | | | |
Allegany Park CLO Ltd., 2019-1A CR (1 mo. Term SOFR + 2.050%) | | | 2.309 | % | | | 1/20/35 | | | | 250,000 | | | | 247,528 | (a)(d) |
Applebee’s Funding LLC/IHOP Funding LLC, 2019-1A A2I | | | 4.194 | % | | | 6/5/49 | | | | 297,000 | | | | 294,740 | (a) |
ARES XLV CLO Ltd., 2017-45A E (3 mo. USD LIBOR + 6.100%) | | | 6.341 | % | | | 10/15/30 | | | | 250,000 | | | | 246,821 | (a)(d) |
Avis Budget Rental Car Funding AESOP LLC, 2020-2A B | | | 2.960 | % | | | 2/20/27 | | | | 200,000 | | | | 193,786 | (a) |
Dewolf Park CLO Ltd., 2017-1A DR (3 mo. USD LIBOR + 2.850%) | | | 3.091 | % | | | 10/15/30 | | | | 280,000 | | | | 275,881 | (a)(d) |
ECMC Group Student Loan Trust, 2020-2A A (1 mo. USD LIBOR + 1.150%) | | | 1.607 | % | | | 11/25/69 | | | | 156,976 | | | | 155,879 | (a)(d) |
See Notes to Financial Statements.
| | | | | | |
| Western Asset Total Return ETF 2022 Annual Report | | | | | 37 | |
Schedule of investments (cont’d)
March 31, 2022
Western Asset Total Return ETF
(Percentages shown based on Fund net assets)
| | | | | | | | | | | | | | | | |
| Security | | Rate | | | Maturity
Date | | | Face
Amount† | | | Value | |
| Asset-Backed Securities — continued | | | | | | | | | | | | | | | | |
FNA VI LLC, 2021-1A A | | | 1.350 | % | | | 1/10/32 | | | | 120,184 | | | $ | 114,708 | (a) |
Grippen Park CLO Ltd., 2017-1A E (3 mo. USD LIBOR + 5.700%) | | | 5.954 | % | | | 1/20/30 | | | | 250,000 | | | | 243,998 | (a)(d) |
Halsey Point CLO I Ltd., 2019-1A E (3 mo. USD LIBOR + 7.700%) | | | 7.954 | % | | | 1/20/33 | | | | 300,000 | | | | 291,206 | (a)(d) |
HalseyPoint CLO 3 Ltd., 2020-3A A1A (3 mo. USD LIBOR + 1.450%) | | | 1.749 | % | | | 11/30/32 | | | | 250,000 | | | | 248,022 | (a)(d) |
Hertz Vehicle Financing III LP, 2021-2A A | | | 1.680 | % | | | 12/27/27 | | | | 310,000 | | | | 282,652 | (a) |
Hildene Community Funding CDO Ltd., 2015-1A ARR | | | 2.600 | % | | | 11/1/35 | | | | 380,000 | | | | 363,850 | (a) |
Loanpal Solar Loan Ltd., 2021-2GS A | | | 2.220 | % | | | 3/20/48 | | | | 260,180 | | | | 241,141 | (a) |
Madison Park Funding XXVI Ltd., 2017-26A DR (3 mo. USD LIBOR + 3.000%) | | | 3.299 | % | | | 7/29/30 | | | | 275,000 | | | | 264,000 | (a)(d) |
Marathon CLO 14 Ltd., 2019-2A BA (3 mo. USD LIBOR + 3.300%) | | | 3.554 | % | | | 1/20/33 | | | | 250,000 | | | | 247,232 | (a)(d) |
MF1 Ltd., 2022-FL8 A (30 Day Average SOFR + 1.350%) | | | 1.400 | % | | | 2/19/37 | | | | 250,000 | | | | 247,982 | (a)(d) |
MKS CLO Ltd., 2017-2A D (3 mo. USD LIBOR + 2.650%) | | | 2.904 | % | | | 1/20/31 | | | | 250,000 | | | | 234,703 | (a)(d) |
Morgan Stanley ABS Capital I Inc. Trust, 2004-NC7 M1 (1 mo. USD LIBOR + 0.855%) | | | 1.312 | % | | | 7/25/34 | | | | 66,393 | | | | 64,501 | (d) |
Morgan Stanley ABS Capital I Inc. Trust, 2004-NC8 M1 (1 mo. USD LIBOR + 0.915%) | | | 1.372 | % | | | 9/25/34 | | | | 169,941 | | | | 165,948 | (d) |
NADG NNN Operating LP, 2019-1 A | | | 3.368 | % | | | 12/28/49 | | | | 148,313 | | | | 144,691 | (a) |
Nelnet Student Loan Trust, 2013-1A A (1 mo. USD LIBOR + 0.600%) | | | 1.057 | % | | | 6/25/41 | | | | 54,928 | | | | 53,873 | (a)(d) |
OZLM XVIII Ltd., 2018-18A D (3 mo. USD LIBOR + 2.850%) | | | 3.089 | % | | | 4/15/31 | | | | 250,000 | | | | 243,057 | (a)(d) |
RAMP Trust, 2006-NC3 M1 (1 mo. USD LIBOR + 0.340%) | | | 0.967 | % | | | 3/25/36 | | | | 270,000 | | | | 264,964 | (d) |
Regatta XI Funding Ltd., 2018-1A D (3 mo. USD LIBOR + 2.850%) | | | 3.091 | % | | | 7/17/31 | | | | 250,000 | | | | 247,224 | (a)(d) |
SMB Private Education Loan Trust, 2018-C A2A | | | 3.630 | % | | | 11/15/35 | | | | 73,234 | | | | 73,597 | (a) |
SMB Private Education Loan Trust, 2018-C A2B (1 mo. USD LIBOR + 0.750%) | | | 1.147 | % | | | 11/15/35 | | | | 153,853 | | | | 153,782 | (a)(d) |
SMB Private Education Loan Trust, 2019-B A2B (1 mo. USD LIBOR + 1.000%) | | | 1.397 | % | | | 6/15/37 | | | | 71,612 | | | | 72,222 | (a)(d) |
Structured Asset Investment Loan Trust, 2005-HE1 M2 (1 mo. USD LIBOR + 0.720%) | | | 1.177 | % | | | 7/25/35 | | | | 243,423 | | | | 239,139 | (d) |
Sunrun Atlas Issuer LLC, 2019-2 A | | | 3.610 | % | | | 2/1/55 | | | | 94,039 | | | | 92,164 | (a) |
See Notes to Financial Statements.
| | | | |
38 | | | | Western Asset Total Return ETF 2022 Annual Report |
Western Asset Total Return ETF
(Percentages shown based on Fund net assets)
| | | | | | | | | | | | | | | | |
| Security | | Rate | | | Maturity
Date | | | Face
Amount† | | | Value | |
| Asset-Backed Securities — continued | | | | | | | | | | | | | | | | |
Symphony CLO XIX Ltd., 2018-19A E (3 mo. USD LIBOR + 5.200%) | | | 5.441 | % | | | 4/16/31 | | | | 250,000 | | | $ | 233,328 | (a)(d) |
TICP CLO II-2 Ltd., 2018-IIA C (3 mo. USD LIBOR + 2.950%) | | | 3.204 | % | | | 4/20/28 | | | | 250,000 | | | | 246,927 | (a)(d) |
Trinitas CLO XIV Ltd., 2020-14A C (3 mo. USD LIBOR + 3.000%) | | | 3.258 | % | | | 1/25/34 | | | | 300,000 | | | | 299,036 | (a)(d) |
United States Small Business Administration, 2019-20D 1 | | | 2.980 | % | | | 4/1/39 | | | | 24,494 | | | | 24,571 | |
Voya CLO Ltd., 2020-3A DR (3 mo. USD LIBOR + 3.250%) | | | 3.504 | % | | | 10/20/34 | | | | 250,000 | | | | 245,519 | (a)(d) |
Wellfleet CLO Ltd., 2017-2A C (3 mo. USD LIBOR + 3.400%) | | | 3.654 | % | | | 10/20/29 | | | | 250,000 | | | | 245,085 | (a)(d) |
Wellfleet CLO Ltd., 2017-3A C (3 mo. USD LIBOR + 2.750%) | | | 2.991 | % | | | 1/17/31 | | | | 250,000 | | | | 243,298 | (a)(d) |
Wingstop Funding LLC, 2020-1A A2 | | | 2.841 | % | | | 12/5/50 | | | | 407,950 | | | | 378,364 | (a) |
Total Asset-Backed Securities (Cost — $8,071,861) | | | | | | | | 7,925,419 | |
| Senior Loans — 5.9% | | | | | | | | | | | | | | | | |
| Communication Services — 0.7% | | | | | | | | | | | | | | | | |
Diversified Telecommunication Services — 0.1% | | | | | | | | | | | | | | | | |
Zayo Group Holdings Inc., Initial Dollar Term Loan (1 mo. USD LIBOR + 3.000%) | | | 3.457 | % | | | 3/9/27 | | | | 61,621 | | | | 59,911 | (d)(i)(j) |
Interactive Media & Services — 0.1% | | | | | | | | | | | | | | | | |
Rackspace Technology Global Inc., Term Loan B (the greater of 3 mo. USD LIBOR or 0.750% + 2.750%) | | | 3.500 | % | | | 2/15/28 | | | | 168,300 | | | | 164,874 | (d)(i)(j) |
Media — 0.5% | | | | | | | | | | | | | | | | |
Charter Communications Operating LLC, Term Loan B2 (1 mo. USD LIBOR + 1.750%) | | | 2.210 | % | | | 2/1/27 | | | | 39,098 | | | | 38,729 | (d)(i)(j) |
Nexstar Broadcasting Inc., Term Loan B4 (1 mo. USD LIBOR + 2.500%) | | | 2.731 | % | | | 9/18/26 | | | | 146,753 | | | | 146,046 | (d)(i)(j) |
Virgin Media Bristol LLC, Term Loan Facility N (3 mo. USD LIBOR + 2.500%) | | | 2.897 | % | | | 1/31/28 | | | | 150,000 | | | | 147,961 | (d)(i)(j) |
Virgin Media Bristol LLC, Term Loan Facility Q (3 mo. USD LIBOR + 3.250%) | | | 3.647 | % | | | 1/31/29 | | | | 20,000 | | | | 19,863 | (d)(i)(j) |
Ziggo Financing Partnership, Term Loan I (3 mo. USD LIBOR + 2.500%) | | | 2.897 | % | | | 4/28/28 | | | | 250,000 | | | | 245,977 | (d)(i)(j) |
Total Media | | | | | | | | | | | | | | | 598,576 | |
Total Communication Services | | | | | | | | | | | | | | | 823,361 | |
See Notes to Financial Statements.
| | | | | | |
| Western Asset Total Return ETF 2022 Annual Report | | | | | 39 | |
Schedule of investments (cont’d)
March 31, 2022
Western Asset Total Return ETF
(Percentages shown based on Fund net assets)
| | | | | | | | | | | | | | | | |
| Security | | Rate | | | Maturity
Date | | | Face
Amount† | | | Value | |
| Consumer Discretionary — 1.0% | | | | | | | | | | | | | | | | |
Diversified Consumer Services — 0.1% | | | | | | | | | | | | | | | | |
Prime Security Services Borrower LLC, 2021 Refinancing Term Loan B1 | | | 3.500 | % | | | 9/23/26 | | | | 88,684 | | | $ | 87,945 | (d)(i)(j) |
Hotels, Restaurants & Leisure — 0.4% | | | | | | | | | | | | | | | | |
Caesars Resort Collection LLC, Term Loan B1 (1 mo. USD LIBOR + 3.500%) | | | 3.957 | % | | | 7/21/25 | | | | 246,250 | | | | 245,142 | (d)(i)(j) |
Hilton Worldwide Finance LLC, Refinance Term Loan B2 (1 mo. USD LIBOR + 1.750%) | | | 2.207 | % | | | 6/22/26 | | | | 140,000 | | | | 138,408 | (d)(i)(j) |
Scientific Games International Inc., Initial Term Loan B5 (1 mo. USD LIBOR + 2.750%) | | | 3.207 | % | | | 8/14/24 | | | | 117,679 | | | | 117,165 | (d)(i)(j) |
Total Hotels, Restaurants & Leisure | | | | | | | | | | | | | | | 500,715 | |
Specialty Retail — 0.5% | | | | | | | | | | | | | | | | |
Harbor Freight Tools USA Inc., 2021 Refinancing Term Loan (the greater of 1 mo. USD LIBOR or 0.500% + 2.750%) | | | 3.250 | % | | | 10/19/27 | | | | 246,875 | | | | 241,321 | (d)(i)(j) |
PetsMart LLC, Initial Term Loan (the greater of 3 mo. USD LIBOR or 0.750% + 3.750%) | | | 4.500 | % | | | 2/11/28 | | | | 99,500 | | | | 99,085 | (d)(i)(j) |
Whatabrands LLC, Initial Term Loan B (the greater of 1 mo. USD LIBOR or 0.500% + 3.250%) | | | 3.750 | % | | | 8/3/28 | | | | 229,425 | | | | 226,415 | (d)(i)(j) |
Total Specialty Retail | | | | | | | | | | | | | | | 566,821 | |
Total Consumer Discretionary | | | | | | | | | | | | | | | 1,155,481 | |
| Consumer Staples — 0.0%†† | | | | | | | | | | | | | | | | |
Food & Staples Retailing — 0.0%†† | | | | | | | | | | | | | | | | |
Froneri U.S. Inc., Term Loan Facility B2 (1 mo. USD LIBOR + 2.250%) | | | 2.707 | % | | | 1/29/27 | | | | 49,125 | | | | 48,169 | (d)(i)(j) |
Household Products — 0.0%†† | | | | | | | | | | | | | | | | |
Energizer Holdings Inc., Term Loan (the greater of 3 mo. USD LIBOR or 0.500% + 2.250%) | | | 2.750 | % | | | 12/22/27 | | | | 18,300 | | | | 17,980 | (d)(i)(j) |
Total Consumer Staples | | | | | | | | | | | | | | | 66,149 | |
| Energy — 0.2% | | | | | | | | | | | | | | | | |
Oil, Gas & Consumable Fuels — 0.2% | | | | | | | | | | | | | | | | |
Pilot Travel Centers LLC, Initial Term Loan B (1 mo. USD LIBOR + 2.000%) | | | 2.457 | % | | | 8/4/28 | | | | 199,000 | | | | 195,973 | (d)(i)(j) |
| Financials — 1.3% | | | | | | | | | | | | | | | | |
Diversified Financial Services — 1.1% | | | | | | | | | | | | | | | | |
Allied Universal Holdco LLC, Term Loan (the greater of 3 mo. USD LIBOR or 0.500% + 3.750%) | | | 4.250 | % | | | 5/12/28 | | | | 226,337 | | | | 222,577 | (d)(i)(j) |
See Notes to Financial Statements.
| | | | |
40 | | | | Western Asset Total Return ETF 2022 Annual Report |
Western Asset Total Return ETF
(Percentages shown based on Fund net assets)
| | | | | | | | | | | | | | | | |
| Security | | Rate | | | Maturity
Date | | | Face
Amount† | | | Value | |
Diversified Financial Services — continued | | | | | | | | | | | | | | | | |
Castlelake Aviation One Designated Activity Co., Initial Term Loan (3 mo. USD LIBOR + 2.750%) | | | 3.576 | % | | | 10/22/26 | | | | 119,401 | | | $ | 116,043 | (d)(i)(j) |
Citadel Securities LP, 2021 Term Loan (1 mo. Term SOFR + 2.500%) | | | 2.927 | % | | | 2/2/28 | | | | 137,214 | | | | 136,307 | (d)(i)(j) |
Deerfield Dakota Holding LLC, First Lien Initial Dollar Term Loan (the greater of 1 mo. USD LIBOR or 1.000% + 3.750%) | | | 4.750 | % | | | 4/9/27 | | | | 108,075 | | | | 107,400 | (d)(i)(j) |
Nexus Buyer LLC, Initial Term Loan (1 mo. USD LIBOR + 3.750%) | | | 4.207 | % | | | 11/9/26 | | | | 196,977 | | | | 194,860 | (d)(i)(j) |
Setanta Aircraft Leasing DAC, Term Loan (3 mo. USD LIBOR + 2.000%) | | | 3.006 | % | | | 11/5/28 | | | | 110,000 | | | | 108,259 | (d)(i)(j) |
UFC Holdings LLC, Term Loan B3 (the greater of 6 mo. USD LIBOR or 0.750% + 2.750%) | | | 3.500 | % | | | 4/29/26 | | | | 281,808 | | | | 278,638 | (d)(i)(j) |
VFH Parent LLC, Initial Term Loan (the greater of 1 week SOFR or 0.500% + 3.000%) | | | 3.500 | % | | | 1/13/29 | | | | 50,000 | | | | 49,437 | (d)(i)(j) |
Total Diversified Financial Services | | | | | | | | | | | | | | | 1,213,521 | |
Insurance — 0.0%†† | | | | | | | | | | | | | | | | |
Asurion LLC, Replacement Term Loan B6 (1 mo. USD LIBOR + 3.125%) | | | 3.582 | % | | | 11/3/23 | | | | 15,970 | | | | 15,858 | (d)(i)(j) |
Mortgage Real Estate Investment Trusts (REITs) — 0.2% | | | | | | | | | | | | | | | | |
Apollo Commercial Real Estate Finance Inc., Initial Term Loan (1 mo. USD LIBOR + 2.750%) | | | 3.207 | % | | | 5/15/26 | | | | 206,810 | | | | 202,674 | (d)(i)(j) |
Total Financials | | | | | | | | | | | | | | | 1,432,053 | |
| Health Care — 1.1% | | | | | | | | | | | | | | | | |
Health Care Providers & Services — 0.9% | | | | | | | | | | | | | | | | |
Global Medical Response Inc., 2020 Term Loan (the greater of 3 mo. USD LIBOR or 1.000% + 4.250%) | | | 5.250 | % | | | 10/2/25 | | | | 88,875 | | | | 88,125 | (d)(i)(j) |
Grifols Worldwide Operations USA Inc., Dollar Term Loan B (1 mo. USD LIBOR + 2.000%) | | | 2.457 | % | | | 11/15/27 | | | | 128,833 | | | | 126,514 | (d)(i)(j) |
LifePoint Health Inc., First Lien Term Loan B (1 mo. USD LIBOR + 3.750%) | | | 4.197 | % | | | 11/16/25 | | | | 19,255 | | | | 19,120 | (d)(i)(j) |
Phoenix Newco Inc., First Lien Initial Term Loan (the greater of 1 mo. USD LIBOR or 0.500% + 3.500%) | | | 4.000 | % | | | 11/15/28 | | | | 250,000 | | | | 247,948 | (d)(i)(j) |
Radiology Partners Inc., Replacement Term Loan B | | | 4.697-4.718 | % | | | 7/9/25 | | | | 250,000 | | | | 246,385 | (d)(i)(j) |
See Notes to Financial Statements.
| | | | | | |
| Western Asset Total Return ETF 2022 Annual Report | | | | | 41 | |
Schedule of investments (cont’d)
March 31, 2022
Western Asset Total Return ETF
(Percentages shown based on Fund net assets)
| | | | | | | | | | | | | | | | |
| Security | | Rate | | | Maturity
Date | | | Face
Amount† | | | Value | |
Health Care Providers & Services — continued | | | | | | | | | | | | | | | | |
Sterigenics-Nordion Holdings LLC, Term Loan (the greater of 3 mo. USD LIBOR or 0.500% + 2.750%) | | | 3.250 | % | | | 12/11/26 | | | | 110,000 | | | $ | 108,441 | (d)(i)(j) |
WP CityMD Bidco LLC, Refinance Term Loan (the greater of 6 mo. USD LIBOR or 0.500% + 3.250%) | | | 3.750 | % | | | 12/22/28 | | | | 227,700 | | | | 226,206 | (d)(i)(j) |
Total Health Care Providers & Services | | | | | | | | | | | | | | | 1,062,739 | |
Health Care Technology — 0.2% | | | | | | | | | | | | | | | | |
AthenaHealth Group Inc., Delayed Draw Term Loan | | | — | | | | 2/15/29 | | | | 23,188 | | | | 22,904 | (k) |
AthenaHealth Group Inc., Initial Term Loan (the greater of 1 mo. SOFR or 0.500% + 3.500%) | | | 4.000 | % | | | 2/15/29 | | | | 136,812 | | | | 135,136 | (d)(i)(j) |
Total Health Care Technology | | | | | | | | | | | | | | | 158,040 | |
Total Health Care | | | | | | | | | | | | | | | 1,220,779 | |
| Industrials — 1.2% | | | | | | | | | | | | | | | | |
Aerospace & Defense — 0.3% | | | | | | | | | | | | | | | | |
Avolon TLB Borrower 1 US LLC, Term Loan B5 (the greater of 1 mo. USD LIBOR or 0.500% + 2.250%) | | | 2.750 | % | | | 12/1/27 | | | | 207,375 | | | | 204,783 | (d)(i)(j) |
Transdigm Inc., Refinancing Term Loan F (1 mo. USD LIBOR + 2.250%) | | | 2.707 | % | | | 12/9/25 | | | | 88,640 | | | | 87,088 | (d)(i)(j) |
Total Aerospace & Defense | | | | | | | | | | | | | | | 291,871 | |
Airlines — 0.2% | | | | | | | | | | | | | | | | |
Air Canada, Term Loan (the greater of 3 mo. USD LIBOR or 0.750% + 3.500%) | | | 4.250 | % | | | 8/11/28 | | | | 40,000 | | | | 39,583 | (d)(i)(j) |
Delta Air Lines Inc., Initial Term Loan (the greater of 3 mo. USD LIBOR or 1.000% + 3.750%) | | | 4.750 | % | | | 10/20/27 | | | | 90,000 | | | | 92,798 | (d)(i)(j) |
United Airlines Inc., Term Loan B (the greater of 3 mo. USD LIBOR or 0.750% + 3.750%) | | | 4.500 | % | | | 4/21/28 | | | | 79,200 | | | | 78,145 | (d)(i)(j) |
Total Airlines | | | | | | | | | | | | | | | 210,526 | |
Building Products — 0.1% | | | | | | | | | | | | | | | | |
Hunter Douglas Inc., Term Loan B1 (the greater of 3 mo. SOFR or 0.250% + 3.750%) | | | 4.000 | % | | | 2/26/29 | | | | 150,000 | | | | 146,812 | (d)(i)(j) |
Commercial Services & Supplies — 0.4% | | | | | | | | | | | | | | | | |
Ali Group SRL, Term Loan B | | | — | | | | 10/13/28 | | | | 100,000 | | | | 98,417 | (k) |
APi Group DE Inc., Initial Term Loan (1 mo. USD LIBOR + 2.500%) | | | 2.709 | % | | | 10/1/26 | | | | 46,970 | | | | 46,383 | (d)(i)(j) |
See Notes to Financial Statements.
| | | | |
42 | | | | Western Asset Total Return ETF 2022 Annual Report |
Western Asset Total Return ETF
(Percentages shown based on Fund net assets)
| | | | | | | | | | | | | | | | |
| Security | | Rate | | | Maturity
Date | | | Face
Amount† | | | Value | |
Commercial Services & Supplies — continued | | | | | | | | | | | | | | | | |
Garda World Security Corp., Term Loan B2 (1 mo. USD LIBOR + 4.250%) | | | 4.710 | % | | | 10/30/26 | | | | 20,612 | | | $ | 20,340 | (d)(i)(j) |
GFL Environmental Inc., 2020 Term Loan (the greater of 3 mo. USD LIBOR or 0.500% + 3.000%) | | | 3.500 | % | | | 5/30/25 | | | | 214,774 | | | | 213,700 | (d)(i)(j) |
Mister Car Wash Holdings Inc., First Lien Initial Term Loan (3 mo. USD LIBOR + 3.000%) | | | 3.102 | % | | | 5/14/26 | | | | 51,586 | | | | 50,831 | (d)(i)(j) |
Total Commercial Services & Supplies | | | | | | | | | | | | | | | 429,671 | |
Road & Rail — 0.2% | | | | | | | | | | | | | | | | |
Genesee & Wyoming Inc., Initial Term Loan (3 mo. USD LIBOR + 2.000%) | | | 3.006 | % | | | 12/30/26 | | | | 245,788 | | | | 242,792 | (d)(i)(j) |
Total Industrials | | | | | | | | | | | | | | | 1,321,672 | |
| Information Technology — 0.3% | | | | | | | | | | | | | | | | |
Electronic Equipment, Instruments & Components — 0.1% | | | | | | | | | | | | | | | | |
II-VI Inc., Term Loan B | | | — | | | | 12/8/28 | | | | 80,000 | | | | 79,400 | (k) |
Software — 0.2% | | | | | | | | | | | | | | | | |
Cloudera Inc., Initial Term Loan (the greater of 1 mo. USD LIBOR or 0.500% + 3.750%) | | | 4.250 | % | | | 10/8/28 | | | | 40,000 | | | | 39,450 | (d)(i)(j) |
DCert Buyer Inc., First Lien Initial Term Loan (1 mo. USD LIBOR + 4.000%) | | | 4.457 | % | | | 10/16/26 | | | | 226,139 | | | | 224,223 | (d)(i)(j) |
Total Software | | | | | | | | | | | | | | | 263,673 | |
Total Information Technology | | | | | | | | | | | | | | | 343,073 | |
| Materials — 0.1% | | | | | | | | | | | | | | | | |
Construction Materials — 0.0%†† | | | | | | | | | | | | | | | | |
Summit Materials LLC, New Term Loan B (1 mo. USD LIBOR + 2.000%) | | | 2.457 | % | | | 11/21/24 | | | | 68,920 | | | | 68,601 | (d)(i)(j) |
Containers & Packaging — 0.1% | | | | | | | | | | | | | | | | |
Reynolds Consumer Products LLC, Initial Term Loan (1 mo. USD LIBOR + 1.750%) | | | 2.207 | % | | | 2/4/27 | | | | 95,273 | | | | 93,571 | (d)(i)(j) |
Total Materials | | | | | | | | | | | | | | | 162,172 | |
Total Senior Loans (Cost — $6,747,434) | | | | | | | | | | | | | | | 6,720,713 | |
| | | | |
| | | Expiration
Date | | | Contracts | | | Notional
Amount† | | | | |
| Purchased Options — 0.6% | | | | | | | | | | | | | | | | |
| Exchange-Traded Purchased Options — 0.3% | | | | | | | | | | | | | | | | |
90-Day Eurodollar Futures, Call @ $98.63 | | | 12/19/22 | | | | 117 | | | | 292,500 | | | | 20,475 | |
90-Day Eurodollar Futures, Call @ $98.50 | | | 6/19/23 | | | | 174 | | | | 435,000 | | | | 50,025 | |
90-Day Eurodollar Futures, Put @ $99.25 | | | 6/13/22 | | | | 1 | | | | 2,500 | | | | 1,981 | |
See Notes to Financial Statements.
| | | | | | |
| Western Asset Total Return ETF 2022 Annual Report | | | | | 43 | |
Schedule of investments (cont’d)
March 31, 2022
Western Asset Total Return ETF
(Percentages shown based on Fund net assets)
| | | | | | | | | | | | | | | | | | | | |
| Security | | | Expiration
Date | | | Contracts | | | Notional
Amount† | | | Value | |
| Exchange-Traded Purchased Options — continued | | | | | | | | | | | | | | | | | |
Eurodollar 1-Year Mid-Curve Options, Call @ $97.88 | | | | 6/10/22 | | | | 174 | | | | 435,000 | | | $ | 7,613 | |
SOFR 1-Year Mid-Curve Futures, Call @ $98.25 | | | | 4/14/22 | | | | 103 | | | | 257,500 | | | | 644 | |
U.S. Treasury 5-Year Notes Futures, Call @ $114.75 | | | | 4/1/22 | | | | 9 | | | | 9,000 | | | | 1,406 | |
U.S. Treasury 5-Year Notes Futures, Call @ $115.50 | | | | 4/8/22 | | | | 81 | | | | 81,000 | | | | 8,859 | |
U.S. Treasury 5-Year Notes Futures, Call @ $114.50 | | | | 4/22/22 | | | | 25 | | | | 25,000 | | | | 17,188 | |
U.S. Treasury 5-Year Notes Futures, Call @ $115.00 | | | | 4/22/22 | | | | 56 | | | | 56,000 | | | | 24,063 | |
U.S. Treasury 5-Year Notes Futures, Call @ $115.25 | | | | 4/22/22 | | | | 132 | | | | 132,000 | | | | 43,313 | |
U.S. Treasury 5-Year Notes Futures, Put @ $113.75 | | | | 4/1/22 | | | | 9 | | | | 9,000 | | | | 141 | |
U.S. Treasury 5-Year Notes Futures, Put @ $114.00 | | | | 4/8/22 | | | | 81 | | | | 81,000 | | | | 12,023 | |
U.S. Treasury 5-Year Notes Futures, Put @ $114.50 | | | | 4/22/22 | | | | 132 | | | | 132,000 | | | | 66,000 | |
U.S. Treasury 10-Year Notes Futures, Call @ $122.50 | | | | 4/22/22 | | | | 44 | | | | 44,000 | | | | 46,750 | |
U.S. Treasury 10-Year Notes Futures, Call @ $122.75 | | | | 4/22/22 | | | | 44 | | | | 44,000 | | | | 40,562 | |
U.S. Treasury 10-Year Notes Futures, Call @ $123.25 | | | | 4/22/22 | | | | 15 | | | | 15,000 | | | | 10,078 | |
U.S. Treasury 10-Year Notes Futures, Call @ $123.50 | | | | 4/22/22 | | | | 43 | | | | 43,000 | | | | 24,188 | |
Total Exchange-Traded Purchased Options (Cost — $505,685) | | | | 375,309 | |
| | | | | |
| | | Counterparty | | | | | | | | | | | | | |
| OTC Purchased Options — 0.3% | | | | | | | | | | | | | | | | | | | | |
Interest rate swaption, Put @ 189.00bps | | | Citibank N.A. | | | | 5/3/22 | | | | 3,350,000 | | | | 3,350,000 | | | | 152,547 | |
Interest rate swaption, Put @ 178.00bps | | | BNP Paribas SA | | | | 7/7/22 | | | | 780,000 | | | | 780,000 | | | | 53,530 | |
See Notes to Financial Statements.
| | | | |
44 | | | | Western Asset Total Return ETF 2022 Annual Report |
Western Asset Total Return ETF
(Percentages shown based on Fund net assets)
| | | | | | | | | | | | | | | | | | |
| Security | | Counterparty | | Expiration
Date | | | Contracts | | | Notional
Amount† | | | Value | |
| OTC Purchased Options — continued | | | | | | | | | |
Interest rate swaption, Put @ 180.00bps | | BNP Paribas SA | | | 7/7/22 | | | | 2,040,000 | | | | 2,040,000 | | | | $ 78,318 | |
U.S. Dollar/Japanese Yen, Put @ $120.65 | | Goldman Sachs Group Inc. | | | 4/5/22 | | | | 700,000 | | | | 700,000 | | | | 1,524 | |
Total OTC Purchased Options (Cost — $116,958) | | | | | | | | 285,919 | |
Total Purchased Options (Cost — $622,643) | | | | | | | | | | | | 661,228 | |
| | | | |
| | | | | | | | | Shares | | | | |
| Investments in Underlying Funds — 0.3% | | | | | | | | | |
Invesco Senior Loan ETF (Cost — $313,897) | | | | | | | | 14,600 | | | | 317,842 | |
Total Investments before Short-Term Investments (Cost — $118,755,173) | | | | 110,064,341 | |
| | | | | |
| | | | | Rate | | | Maturity
Date | | | Face
Amount† | | | | |
| Short-Term Investments — 4.6% | | | | | | | | | |
| U.S. Treasury Bills — 3.1% | | | | | | | | | | | | | | | | |
U.S. Cash Management Bill (Cost — $3,498,855) | | | 0.223% | | | | 5/17/22 | | | | 3,500,000 | | | | 3,498,994 | (l) |
| | | | | |
| | | | | | | | | | | Shares | | | | |
| Overnight Deposits — 1.5% | | | | | | | | | |
BNY Mellon Cash Reserve Fund (Cost — $1,693,663) | | | 0.010% | | | | | | | | 1,693,663 | | | | 1,693,663 | |
Total Short-Term Investments (Cost — $5,192,518) | | | | | | | | 5,192,657 | |
Total Investments — 101.7% (Cost — $123,947,691) | | | | | | | | 115,256,998 | |
Liabilities in Excess of Other Assets — (1.7)% | | | | | | | | | | | | (1,981,322 | ) |
Total Net Assets — 100.0% | | | | | | | | | | | | | | | $113,275,676 | |
See Notes to Financial Statements.
| | | | | | |
| Western Asset Total Return ETF 2022 Annual Report | | | | | 45 | |
Schedule of investments (cont’d)
March 31, 2022
Western Asset Total Return ETF
| † | Face amount/notional amount denominated in U.S. dollars, unless otherwise noted. |
| †† | Represents less than 0.1%. |
| * | Non-income producing security. |
| (a) | Security is exempt from registration under Rule 144A of the Securities Act of 1933. This security may be resold in transactions that are exempt from registration, normally to qualified institutional buyers. This security has been deemed liquid pursuant to guidelines approved by the Board of Trustees. |
| (b) | Security is exempt from registration under Regulation S of the Securities Act of 1933. Regulation S applies to securities offerings that are made outside of the United States and do not involve direct selling efforts in the United States. This security has been deemed liquid pursuant to guidelines approved by the Board of Trustees. |
| (c) | Security has no maturity date. The date shown represents the next call date. |
| (d) | Variable rate security. Interest rate disclosed is as of the most recent information available. Certain variable rate securities are not based on a published reference rate and spread but are determined by the issuer or agent and are based on current market conditions. These securities do not indicate a reference rate and spread in their description above. |
| (e) | Securities traded on a when-issued or delayed delivery basis. |
| (f) | This security is traded on a to-be-announced (“TBA”) basis. At March 31, 2022, the Fund held TBA securities with a total cost of $5,621,885. |
| (g) | Collateralized mortgage obligations are secured by an underlying pool of mortgages or mortgage pass-through certificates that are structured to direct payments on underlying collateral to different series or classes of the obligations. The interest rate may change positively or inversely in relation to one or more interest rates, financial indices or other financial indicators and may be subject to an upper and/or lower limit. |
| (h) | The coupon payment on this security is currently in default as of March 31, 2022. |
| (i) | Interest rates disclosed represent the effective rates on senior loans. Ranges in interest rates are attributable to multiple contracts under the same loan. |
| (j) | Senior loans may be considered restricted in that the Fund ordinarily is contractually obligated to receive approval from the agent bank and/or borrower prior to the disposition of a senior loan. |
| (k) | All or a portion of this loan is unfunded as of March 31, 2022. The interest rate for fully unfunded term loans is to be determined. |
| (l) | Rate shown represents yield-to-maturity. |
See Notes to Financial Statements.
| | | | |
46 | | | | Western Asset Total Return ETF 2022 Annual Report |
Western Asset Total Return ETF
| | |
Abbreviation(s) used in this schedule: |
| |
| ACES | | — Alternative Credit Enhancement Securities |
| |
| bps | | — basis point spread (100 basis points = 1.00%) |
| |
| CAS | | — Connecticut Avenue Securities |
| |
| CDO | | — Collateralized Debt Obligation |
| |
| CLO | | — Collateralized Loan Obligation |
| |
| ETF | | — Exchange-Traded Fund |
| |
| ICE | | — Intercontinental Exchange |
| |
| IDR | | — Indonesian Rupiah |
| |
| IO | | — Interest Only |
| |
| LIBOR | | — London Interbank Offered Rate |
| |
| MXN | | — Mexican Peso |
| |
| OFZ | | — Obligatsyi Federal’novo Zaima (Russian Federal Loan Obligation) |
| |
| REMIC | | — Real Estate Mortgage Investment Conduit |
| |
| RUB | | — Russian Ruble |
| |
| SOFR | | — Secured Overnight Financing Rate |
| |
| USD | | — United States Dollar |
| |
| ZAR | | — South African Rand |
| | | | | | | | | | | | | | | | | | | | |
| Schedule of Written Options | |
| Exchange-Traded Written Options | | | | | |
| Security | | Expiration
Date | | | Strike
Price | | | Contracts | | | Notional
Amount† | | | Value | |
| 90-Day Eurodollar Futures, Call | | | 12/19/22 | | | $ | 98.13 | | | | 47 | | | | 117,500 | | | $ | (17,625) | |
| 90-Day Eurodollar Futures, Call | | | 12/19/22 | | | | 98.38 | | | | 70 | | | | 175,000 | | | | (17,937) | |
| 90-Day Eurodollar Futures, Call | | | 12/19/22 | | | | 98.88 | | | | 214 | | | | 535,000 | | | | (24,075) | |
| 90-Day Eurodollar Futures, Call | | | 6/19/23 | | | | 98.00 | | | | 174 | | | | 435,000 | | | | (89,175) | |
| 90-Day Eurodollar Futures, Put | | | 6/13/22 | | | | 99.50 | | | | 1 | | | | 2,500 | | | | (2,581) | |
| 90-Day Eurodollar Futures, Put | | | 12/19/22 | | | | 98.13 | | | | 47 | | | | 117,500 | | | | (109,275) | |
| 90-Day Eurodollar Futures, Put | | | 12/19/22 | | | | 98.38 | | | | 117 | | | | 292,500 | | | | (330,525) | |
| 90-Day Eurodollar Futures, Put | | | 12/19/22 | | | | 98.50 | | | | 214 | | | | 535,000 | | | | (662,062) | |
| Eurodollar 1-Year Mid-Curve Options, Call | | | 6/10/22 | | | | 98.63 | | | | 174 | | | | 435,000 | | | | (1,087) | |
| SOFR 1-Year Mid-Curve Futures, Call | | | 4/14/22 | | | | 98.50 | | | | 103 | | | | 257,500 | | | | (644) | |
| U.S. Treasury 5-Year Notes Futures, Call | | | 4/1/22 | | | | 114.25 | | | | 3 | | | | 3,000 | | | | (1,477) | |
| U.S. Treasury 5-Year Notes Futures, Call | | | 4/8/22 | | | | 114.75 | | | | 27 | | | | 27,000 | | | | (9,703) | |
| U.S. Treasury 5-Year Notes Futures, Call | | | 4/22/22 | | | | 115.75 | | | | 24 | | | | 24,000 | | | | (4,500) | |
| U.S. Treasury 5-Year Notes Futures, Call | | | 4/22/22 | | | | 118.25 | | | | 10 | | | | 10,000 | | | | (234) | |
| U.S. Treasury 5-Year Notes Futures, Call | | | 4/22/22 | | | | 118.50 | | | | 6 | | | | 6,000 | | | | (141) | |
| U.S. Treasury 5-Year Notes Futures, Call | | | 5/20/22 | | | | 115.25 | | | | 88 | | | | 88,000 | | | | (52,250) | |
| U.S. Treasury 5-Year Notes Futures, Call | | | 5/20/22 | | | | 117.00 | | | | 72 | | | | 72,000 | | | | (11,250) | |
| U.S. Treasury 5-Year Notes Futures, Put | | | 4/1/22 | | | | 114.25 | | | | 3 | | | | 3,000 | | | | (164) | |
| U.S. Treasury 5-Year Notes Futures, Put | | | 4/8/22 | | | | 114.75 | | | | 27 | | | | 27,000 | | | | (11,391) | |
| U.S. Treasury 5-Year Notes Futures, Put | | | 5/20/22 | | | | 114.50 | | | | 88 | | | | 88,000 | | | | (68,063) | |
See Notes to Financial Statements.
| | | | | | |
| Western Asset Total Return ETF 2022 Annual Report | | | | | 47 | |
Schedule of investments (cont’d)
March 31, 2022
Western Asset Total Return ETF
| | | | | | | | | | | | | | | | | | | | | | |
| Schedule of Written Options (cont’d) | |
| Security | | | | Expiration
Date | | | Strike
Price | | | Contracts | | | Notional Amount† | | | Value | |
| U.S. Treasury 10-Year Notes Futures, Call | | | 4/22/22 | | | $ | 123.00 | | | | 11 | | | | 11,000 | | | $ | (8,766) | |
| U.S. Treasury 10-Year Notes Futures, Call | | | 4/22/22 | | | | 124.00 | | | | 15 | | | | 15,000 | | | | (5,859) | |
| U.S. Treasury 10-Year Notes Futures, Call | | | 4/22/22 | | | | 124.50 | | | | 8 | | | | 8,000 | | | | (2,125) | |
| U.S. Treasury 10-Year Notes Futures, Call | | | 4/22/22 | | | | 127.00 | | | | 12 | | | | 12,000 | | | | (750) | |
| U.S. Treasury 10-Year Notes Futures, Call | | | 4/22/22 | | | | 129.00 | | | | 63 | | | | 63,000 | | | | (1,969) | |
| U.S. Treasury 10-Year Notes Futures, Call | | | 5/20/22 | | | | 122.00 | | | | 44 | | | | 44,000 | | | | (79,062) | |
| U.S. Treasury 10-Year Notes Futures, Call | | | 5/20/22 | | | | 124.00 | | | | 15 | | | | 15,000 | | | | (11,719) | |
| U.S. Treasury 10-Year Notes Futures, Call | | | 5/20/22 | | | | 126.50 | | | | 86 | | | | 86,000 | | | | (20,156) | |
| U.S. Treasury 10-Year Notes Futures, Call | | | 5/20/22 | | | | 129.50 | | | | 43 | | | | 43,000 | | | | (3,359) | |
| U.S. Treasury 10-Year Notes Futures, Call | | | 5/20/22 | | | | 130.50 | | | | 31 | | | | 31,000 | | | | (2,422) | |
| U.S. Treasury 10-Year Notes Futures, Put | | | 4/22/22 | | | | 124.50 | | | | 128 | | | | 128,000 | | | | (242,000) | |
| U.S. Treasury 10-Year Notes Futures, Put | | | 4/22/22 | | | | 125.00 | | | | 4 | | | | 4,000 | | | | (9,250) | |
| U.S. Treasury 10-Year Notes Futures, Put | | | 5/20/22 | | | | 126.50 | | | | 43 | | | | 43,000 | | | | (165,953) | |
| Total Exchange-Traded Written Options (Premiums received — $1,034,363) | | | $ | (1,967,549) | |
| OTC Written Options | | | | | | | | | | | | | |
| | | | | | |
| | | Counterparty | | | | | | | | | | | | | | | |
| Interest rate swaption, Put | | Citibank N.A. | | | 5/3/22 | | | | 130.00 | bps | | | 15,900,000 | | | | 15,900,000 | | | $ | (404,848) | |
| Interest rate swaption, Put | | BNP Paribas SA | | | 7/7/22 | | | | 132.30 | bps | | | 10,300,000 | | | | 10,300,000 | | | | (240,345) | |
| Interest rate swaption, Put | | BNP Paribas SA | | | 7/7/22 | | | | 160.00 | bps | | | 3,830,000 | | | | 3,830,000 | | | | (129,033) | |
| U.S. Dollar/Euro, Call | | JPMorgan Chase & Co. | | | 4/7/22 | | | $ | 1.12 | | | | 611,540 | | | | 611,540 | | | | (9,758) | |
| U.S. Dollar/Euro, Put | | JPMorgan Chase & Co. | | | 4/7/22 | | | | 1.17 | | | | 611,540 | | | | 611,540 | | | | (2) | |
| U.S. Dollar/Mexican Peso, Put | | JPMorgan Chase & Co. | | | 5/13/22 | | | | 20.42 | MXN | | | 666,000 | | | | 666,000 | | | | (18,200) | |
| Total OTC Written Options (Premiums received — $122,232) | | | | | | | $ | (802,186) | |
| Total Written Options (Premiums received — $1,156,595) | | | | | | | $ | (2,769,735) | |
| † | Notional amount denominated in U.S. dollars, unless otherwise noted. |
| | |
Abbreviation(s) used in this schedule: |
| |
| bps | | — basis point spread (100 basis points = 1.00%) |
| |
| MXN | | — Mexican Peso |
| |
| SOFR | | — Secured Overnight Financing Rate |
At March 31, 2022, the Fund had the following open futures contracts:
| | | | | | | | | | | | | | | | | | | | |
| | | Number of
Contracts | | | Expiration
Date | | | Notional
Amount | | | Market
Value | | | Unrealized
Appreciation
(Depreciation) | |
| Contracts to Buy: | | | | | | | | | | | | | | | | | | | | |
| 3-Month SOFR | | | 22 | | | | 6/22 | | | $ | 5,428,159 | | | $ | 5,426,575 | | | $ | (1,584) | |
See Notes to Financial Statements.
| | | | |
48 | | | | Western Asset Total Return ETF 2022 Annual Report |
Western Asset Total Return ETF
| | | | | | | | | | | | | | | | | | | | |
| | | Number of
Contracts | | | Expiration
Date | | | Notional
Amount | | | Market
Value | | | Unrealized
Appreciation
(Depreciation) | |
Contracts to Buy continued | | | | | | | | | | | | | | | | | | | | |
| 90-Day Eurodollar | | | 257 | | | | 12/22 | | | $ | 63,413,302 | | | $ | 62,540,950 | | | $ | (872,352) | |
| 90-Day Eurodollar | | | 26 | | | | 6/23 | | | | 6,440,839 | | | | 6,296,550 | | | | (144,289) | |
| 90-Day Eurodollar | | | 121 | | | | 12/23 | | | | 29,772,067 | | | | 29,333,425 | | | | (438,642) | |
| Australian 10-Year Bonds | | | 11 | | | | 6/22 | | | | 1,087,629 | | | | 1,046,955 | | | | (40,674) | |
| Euro-Bobl | | | 4 | | | | 6/22 | | | | 583,380 | | | | 573,504 | | | | (9,876) | |
| Euro-OAT | | | 4 | | | | 6/22 | | | | 706,684 | | | | 674,310 | | | | (32,374) | |
| U.S. Treasury 2-Year Notes | | | 27 | | | | 6/22 | | | | 5,754,495 | | | | 5,721,891 | | | | (32,604) | |
| U.S. Treasury 5-Year Notes | | | 1,574 | | | | 6/22 | | | | 185,050,603 | | | | 180,518,125 | | | | (4,532,478) | |
| U.S. Treasury Long-Term Bonds | | | 21 | | | | 6/22 | | | | 3,272,345 | | | | 3,151,313 | | | | (121,032) | |
| U.S. Treasury Ultra Long- Term Bonds | | | 44 | | | | 6/22 | | | | 8,017,211 | | | | 7,793,500 | | | | (223,711) | |
| | | | | | | | | | | | | | | | | | | | (6,449,616) | |
| Contracts to Sell: | | | | | | | | | | | | | | | | | | | | |
| 3-Month Euribor | | | 21 | | | | 6/22 | | | | 5,869,768 | | | | 5,860,983 | | | | 8,785 | |
| 90-Day Eurodollar | | | 60 | | | | 3/25 | | | | 14,681,154 | | | | 14,609,250 | | | | 71,904 | |
| Euro-Bund | | | 13 | | | | 6/22 | | | | 2,391,493 | | | | 2,294,930 | | | | 96,563 | |
| Japanese 10-Year Bonds | | | 1 | | | | 6/22 | | | | 1,242,273 | | | | 1,233,368 | | | | 8,905 | |
| U.S. Treasury 10-Year Notes | | | 1,112 | | | | 6/22 | | | | 139,781,579 | | | | 136,637,000 | | | | 3,144,579 | |
| U.S. Treasury Ultra 10-Year Notes | | | 23 | | | | 6/22 | | | | 3,212,418 | | | | 3,115,781 | | | | 96,637 | |
| United Kingdom Long Gilt Bonds | | | 10 | | | | 6/22 | | | | 1,609,307 | | | | 1,596,175 | | | | 13,132 | |
| | | | | | | | | | | | | | | | | | | | 3,440,505 | |
| Net unrealized depreciation on open futures contracts | | | | | | | $ | (3,009,111) | |
| | |
Abbreviation(s) used in this table: |
| |
| OAT | | — Obligations Assimilables du Trésor (French Treasury Bonds) |
| |
| SOFR | | — Secured Overnight Financing Rate |
At March 31, 2022, the Fund had the following open forward foreign currency contracts:
| | | | | | | | | | | | | | | | | | | | |
Currency
Purchased | | | Currency Sold | | | Counterparty | | Settlement
Date | | | Unrealized
Appreciation
(Depreciation) | |
| BRL | | | 1,801,260 | | | USD | | | 376,337 | | | Bank of America N.A. | | | 4/19/22 | | | $ | 729 | |
| USD | | | 59,673 | | | RUB | | | 7,310,000 | | | Bank of America N.A. | | | 4/19/22 | | | | (27,111) | |
See Notes to Financial Statements.
| | | | | | |
| Western Asset Total Return ETF 2022 Annual Report | | | | | 49 | |
Schedule of investments (cont’d)
March 31, 2022
Western Asset Total Return ETF
| | | | | | | | | | | | | | | | | | | | |
Currency Purchased | | | Currency Sold | | | Counterparty | | Settlement
Date | | | Unrealized
Appreciation
(Depreciation) | |
| NOK | | | 5,642,000 | | | USD | | | 640,310 | | | BNP Paribas SA | | | 4/19/22 | | | $ | 4,771 | |
| AUD | | | 133,368 | | | USD | | | 98,720 | | | Citibank N.A. | | | 4/19/22 | | | | 1,455 | |
| BRL | | | 631,951 | | | USD | | | 129,525 | | | Citibank N.A. | | | 4/19/22 | | | | 2,764 | |
| CAD | | | 156,016 | | | USD | | | 123,644 | | | Citibank N.A. | | | 4/19/22 | | | | 1,251 | |
| EUR | | | 210,000 | | | USD | | | 237,980 | | | Citibank N.A. | | | 4/19/22 | | | | (4,192) | |
| EUR | | | 276,334 | | | USD | | | 312,744 | | | Citibank N.A. | | | 4/19/22 | | | | (5,108) | |
| EUR | | | 310,000 | | | USD | | | 341,239 | | | Citibank N.A. | | | 4/19/22 | | | | 3,877 | |
| IDR | | | 418,160,811 | | | USD | | | 29,138 | | | Citibank N.A. | | | 4/19/22 | | | | (45) | |
| INR | | | 2,545,106 | | | USD | | | 33,326 | | | Citibank N.A. | | | 4/19/22 | | | | 195 | |
| INR | | | 40,059,711 | | | USD | | | 531,543 | | | Citibank N.A. | | | 4/19/22 | | | | (3,933) | |
| JPY | | | 14,749,043 | | | USD | | | 123,782 | | | Citibank N.A. | | | 4/19/22 | | | | (2,221) | |
| MXN | | | 2,515,515 | | | USD | | | 122,517 | | | Citibank N.A. | | | 4/19/22 | | | | 3,208 | |
| USD | | | 171,451 | | | BRL | | | 882,293 | | | Citibank N.A. | | | 4/19/22 | | | | (13,243) | |
| USD | | | 271,516 | | | BRL | | | 1,586,199 | | | Citibank N.A. | | | 4/19/22 | | | | (60,529) | |
| USD | | | 47,923 | | | EUR | | | 44,000 | | | Citibank N.A. | | | 4/19/22 | | | | (1,061) | |
| USD | | | 60,932 | | | EUR | | | 55,000 | | | Citibank N.A. | | | 4/19/22 | | | | (298) | |
| USD | | | 1,055,759 | | | EUR | | | 949,061 | | | Citibank N.A. | | | 4/19/22 | | | | (808) | |
| USD | | | 52,737 | | | IDR | | | 764,760,000 | | | Citibank N.A. | | | 4/19/22 | | | | (470) | |
| USD | | | 113,400 | | | IDR | | | 1,646,960,215 | | | Citibank N.A. | | | 4/19/22 | | | | (1,183) | |
| USD | | | 293,741 | | | IDR | | | 4,259,680,000 | | | Citibank N.A. | | | 4/19/22 | | | | (2,618) | |
| USD | | | 1,442 | | | MXN | | | 30,000 | | | Citibank N.A. | | | 4/19/22 | | | | (58) | |
| USD | | | 201,839 | | | MXN | | | 4,200,000 | | | Citibank N.A. | | | 4/19/22 | | | | (8,077) | |
| USD | | | 270,025 | | | MXN | | | 5,660,000 | | | Citibank N.A. | | | 4/19/22 | | | | (12,861) | |
| USD | | | 850,591 | | | MXN | | | 17,612,357 | | | Citibank N.A. | | | 4/19/22 | | | | (29,672) | |
| USD | | | 1,003,712 | | | MXN | | | 21,657,731 | | | Citibank N.A. | | | 4/19/22 | | | | (78,739) | |
| USD | | | 161,503 | | | RUB | | | 22,344,000 | | | Citibank N.A. | | | 4/19/22 | | | | (103,765) | |
| GBP | | | 250,000 | | | USD | | | 339,308 | | | Goldman Sachs Group Inc. | | | 4/19/22 | | | | (10,184) | |
| RUB | | | 410,397 | | | USD | | | 5,354 | | | Goldman Sachs Group Inc. | | | 4/19/22 | | | | (482) | |
| RUB | | | 11,527,539 | | | USD | | | 147,865 | | | Goldman Sachs Group Inc. | | | 4/19/22 | | | | (11,010) | |
| RUB | | | 12,880,614 | | | USD | | | 120,945 | | | Goldman Sachs Group Inc. | | | 4/19/22 | | | | 31,974 | |
| RUB | | | 17,606,809 | | | USD | | | 228,853 | | | Goldman Sachs Group Inc. | | | 4/19/22 | | | | (19,825) | |
| USD | | | 255,641 | | | GBP | | | 188,546 | | | Goldman Sachs Group Inc. | | | 4/19/22 | | | | 7,421 | |
| USD | | | 621,448 | | | RUB | | | 47,898,726 | | | Goldman Sachs Group Inc. | | | 4/19/22 | | | | 52,794 | |
| AUD | | | 2,086,738 | | | USD | | | 1,496,133 | | | JPMorgan Chase & Co. | | | 4/19/22 | | | | 71,257 | |
| BRL | | | 949,170 | | | USD | | | 198,629 | | | JPMorgan Chase & Co. | | | 4/19/22 | | | | 65 | |
| BRL | | | 1,942,424 | | | USD | | | 402,341 | | | JPMorgan Chase & Co. | | | 4/19/22 | | | | 4,274 | |
| RUB | | | 8,160,493 | | | USD | | | 105,634 | | | JPMorgan Chase & Co. | | | 4/19/22 | | | | (8,752) | |
| USD | | | 48,110 | | | AUD | | | 64,000 | | | JPMorgan Chase & Co. | | | 4/19/22 | | | | 38 | |
| USD | | | 607,932 | | | CNH | | | 3,869,318 | | | JPMorgan Chase & Co. | | | 4/19/22 | | | | (833) | |
See Notes to Financial Statements.
| | | | |
50 | | | | Western Asset Total Return ETF 2022 Annual Report |
Western Asset Total Return ETF
| | | | | | | | | | | | | | | | | | | | |
Currency Purchased | | | Currency Sold | | | Counterparty | | Settlement
Date | | | Unrealized
Appreciation
(Depreciation) | |
| USD | | | 75,521 | | | MXN | | | 1,567,281 | | | JPMorgan Chase & Co. | | | 4/19/22 | | | $ | (2,812) | |
| CAD | | | 2,454,398 | | | USD | | | 1,928,573 | | | Morgan Stanley & Co. Inc. | | | 4/19/22 | | | | 36,251 | |
| COP | | | 508,148,260 | | | USD | | | 123,199 | | | Morgan Stanley & Co. Inc. | | | 4/19/22 | | | | 11,809 | |
| JPY | | | 230,743,058 | | | USD | | | 1,994,158 | | | Morgan Stanley & Co. Inc. | | | 4/19/22 | | | | (92,382) | |
| MXN | | | 10,407,208 | | | USD | | | 501,777 | | | Morgan Stanley & Co. Inc. | | | 4/19/22 | | | | 18,374 | |
| NZD | | | 470,000 | | | USD | | | 320,239 | | | Morgan Stanley & Co. Inc. | | | 4/19/22 | | | | 6,574 | |
| RUB | | | 5,899,510 | | | USD | | | 76,426 | | | Morgan Stanley & Co. Inc. | | | 4/19/22 | | | | (6,387) | |
| RUB | | | 11,772,259 | | | USD | | | 152,644 | | | Morgan Stanley & Co. Inc. | | | 4/19/22 | | | | (12,883) | |
| USD | | | 582,705 | | | BRL | | | 2,956,647 | | | Morgan Stanley & Co. Inc. | | | 4/19/22 | | | | (36,222) | |
| ZAR | | | 1,298,100 | | | USD | | | 81,554 | | | Morgan Stanley & Co. Inc. | | | 4/19/22 | | | | 7,065 | |
| Total | | | | | | $ | (291,618) | |
| | |
Abbreviation(s) used in this table: |
| |
| AUD | | — Australian Dollar |
| |
| BRL | | — Brazilian Real |
| |
| CAD | | — Canadian Dollar |
| |
| CNH | | — Chinese Offshore Yuan |
| |
| COP | | — Colombian Peso |
| |
| EUR | | — Euro |
| |
| GBP | | — British Pound |
| |
| IDR | | — Indonesian Rupiah |
| |
| INR | | — Indian Rupee |
| |
| JPY | | — Japanese Yen |
| |
| MXN | | — Mexican Peso |
| |
| NOK | | — Norwegian Krone |
| |
| NZD | | — New Zealand Dollar |
| |
| RUB | | — Russian Ruble |
| |
| USD | | — United States Dollar |
| |
| ZAR | | — South African Rand |
At March 31, 2022, the Fund had the following open swap contracts:
| | | | | | | | | | | | | | | | | | | | |
| CENTRALLY CLEARED INTEREST RATE SWAPS | |
| | Notional Amount | | | Termination Date | | | Payments Made by the Fund† | | Payments Received by the Fund† | | Upfront Premiums
Paid (Received) | | | Unrealized Appreciation (Depreciation) | |
| | | $ | 4,161,000 | | | | 6/15/22 | | | 3-Month LIBOR quarterly | | 0.190% semi-annually | | $ | (19) | | | $ | (5,511) | |
| | | | 6,330,000 | | | | 7/1/22 | | | 3.460%** | | CPURNSA** | | | 369 | | | | 293,915 | |
| | | | 3,140,000 | | | | 11/18/23 | | | 3.970%** | | CPURNSA** | | | (11,630) | | | | 97,598 | |
| | | | 11,054,000 | | | | 6/4/24 | | | 3-Month LIBOR quarterly | | 0.820% semi-annually | | | — | | | | (240,240) | |
See Notes to Financial Statements.
| | | | | | |
| Western Asset Total Return ETF 2022 Annual Report | | | | | 51 | |
Schedule of investments (cont’d)
March 31, 2022
Western Asset Total Return ETF
| | | | | | | | | | | | | | | | | | | | |
| CENTRALLY CLEARED INTEREST RATE SWAPS (cont’d) | |
| | | Notional Amount | | | Termination Date | | | Payments Made by the Fund† | | Payments Received by the Fund† | | Upfront Premiums
Paid (Received) | | | Unrealized Appreciation (Depreciation) | |
| | | $ | 6,330,000 | | | | 7/1/26 | | | CPURNSA** | | 2.620%** | | $ | 2,945 | | | $ | (531,830) | |
| | | | 15,730,000 | | | | 9/17/26 | | | CPURNSA** | | 2.723%** | | | 49,451 | | | | (1,033,283) | |
| | | | 1,170,000 | | | | 10/20/26 | | | 2.950%** | | CPURNSA** | | | (612) | | | | 58,151 | |
| | | | 3,140,000 | | | | 11/18/26 | | | CPURNSA** | | 3.370%** | | | 31,057 | | | | (116,049) | |
| | | | 3,570,000 | | | | 11/20/26 | | | 1.520% annually | | Daily SOFR annually | | | (6,176) | | | | 83,786 | |
| | | | 1,186,000 | | | | 3/4/27 | | | Daily SOFR annually | | 1.550% annually | | | (1,841) | | | | (34,749) | |
| | | | 12,500,000 | | | | 3/16/27 | | | 3-Month LIBOR quarterly | | 1.160% semi-annually | | | — | | | | (774,248) | |
| | | | 886,000 | | | | 5/15/27 | | | 0.710% annually | | Daily SOFR annually | | | — | | | | 64,121 | |
| | | | 6,990,000 | | | | 2/15/28 | | | 1.350% semi-annually | | 3-Month LIBOR quarterly | | | (25,647) | | | | 445,503 | |
| | | | 853,000 | | | | 8/15/28 | | | 1.130% annually | | Daily SOFR annually | | | (118) | | | | 52,481 | |
| | | | 763,000 | | | | 11/1/28 | | | 1.200% annually | | Daily SOFR annually | | | (45) | | | | 44,875 | |
| | | | 1,170,000 | | | | 10/20/31 | | | CPURNSA** | | 2.770%** | | | 963 | | | | (67,591) | |
| | | | 1,170,000 | | | | 10/20/31 | | | 1.733% annually | | Daily SOFR annually | | | 4,398 | | | | 9,856 | |
| | | | 583,000 | | | | 3/18/32 | | | 2.000% annually | | Daily SOFR annually | | | 4,706 | | | | 1,741 | |
| | | | 570,000 | | | | 7/20/45 | | | 0.560% annually | | Daily SOFR annually | | | — | | | | 158,992 | |
| | | | 1,729,000 | | | | 2/15/47 | | | 1.520% annually | | Daily SOFR annually | | | 417 | | | | 177,897 | |
| | | | 249,000 | | | | 2/15/47 | | | 1.729% annually | | Daily SOFR annually | | | 4,794 | | | | 10,298 | |
| | | | 900,000 | | | | 5/15/47 | | | 1.630% annually | | Daily SOFR annually | | | 44,610 | | | | 28,971 | |
| | | | 2,914,000 | | | | 8/15/47 | | | 1.650% annually | | Daily SOFR annually | | | 326,545 | | | | (92,371) | |
| | | | 172,000 | | | | 6/7/51 | | | 2.050% semi-annually | | 3-Month LIBOR quarterly | | | (22) | | | | 8,305 | |
| | | | 479,000 | | | | 7/9/51 | | | 1.671% semi-annually | | 3-Month LIBOR quarterly | | | (3,250) | | | | 65,929 | |
| Total | | $ | 87,739,000 | | | | | | | | | | | $ | 420,895 | | | $ | (1,293,453) | |
See Notes to Financial Statements.
| | | | |
52 | | | | Western Asset Total Return ETF 2022 Annual Report |
Western Asset Total Return ETF
| | | | | | | | | | | | | | | | | | | | | | | | | | |
| OTC CREDIT DEFAULT SWAPS ON CORPORATE ISSUES — SELL PROTECTION1 | |
Swap Counterparty (Reference Entity) | | Notional
Amount2 | | | Termination
Date | | | Implied
Credit
Spread at
March 31,
20223 | | | Periodic
Payments
Received by
the Fund† | | Market
Value | | | Upfront
Premiums
Paid
(Received) | | | Unrealized
Depreciation | |
| BNP Paribas SA (Volkswagen International Finance NV, 0.875%, due 1/16/23) | | | 530,000 | EUR | | | 12/20/24 | | | | 0.584 | % | | 1.000% quarterly | | $ | 6,691 | | | $ | 6,734 | | | $ | (43) | |
| | | | | | | | | | | | | | | | | | | | | | | | | | |
| OTC CREDIT DEFAULT SWAPS ON CORPORATE ISSUES — BUY PROTECTION4 | |
Swap Counterparty (Reference Entity) | | Notional
Amount2 | | | Termination
Date | | | Implied
Credit
Spread at
March 31,
20223 | | | Periodic
Payments
Made by
the Fund† | | Market
Value | | | Upfront
Premiums
Paid
(Received) | | | Unrealized
Depreciation | |
| BNP Paribas SA (Daimler AG, 1.400%, due 1/12/24 | | | 530,000 | EUR | | | 12/20/24 | | | | 0.384 | % | | 1.000% quarterly | | $ | (9,949) | | | $ | (6,921) | | | $ | (3,028) | |
| | | | | | | | | | | | | | | | | | | | | | |
| CENTRALLY CLEARED CREDIT DEFAULT SWAPS ON CREDIT INDICES — SELL PROTECTION1 | |
| Reference Entity | | Notional
Amount2 | | | Termination
Date | | | Periodic
Payments
Received by
the Fund† | | Market
Value5 | | | Upfront
Premiums
Paid
(Received) | | | Unrealized
Appreciation | |
| MARKIT CDX.NA.IG.38 Index | | $ | 11,905,000 | | | | 6/20/27 | | | 1.000% quarterly | | $ | 188,194 | | | $ | 164,129 | | | $ | 24,065 | |
| MARKIT CDX.NA.IG.38 Index | | | 3,762,000 | | | | 6/20/32 | | | 1.000% quarterly | | | (12,776) | | | | (21,894) | | | | 9,118 | |
| Total | | $ | 15,667,000 | | | | | | | | | $ | 175,418 | | | $ | 142,235 | | | $ | 33,183 | |
| | | | | | | | | | | | | | | | | | | | | | |
| CENTRALLY CLEARED CREDIT DEFAULT SWAPS ON CREDIT INDICES — BUY PROTECTION4 | |
| Reference Entity | | Notional
Amount2 | | | Termination
Date | | | Periodic
Payments
Made by
the Fund† | | Market
Value5 | | | Upfront
Premiums
Paid
(Received) | | | Unrealized
Depreciation | |
| MARKIT CDX.NA.HY.38 Index | | $ | 1,261,000 | | | | 6/20/27 | | | 5.000% quarterly | | $ | (67,895) | | | $ | (59,196) | | | $ | (8,699) | |
See Notes to Financial Statements.
| | | | | | |
| Western Asset Total Return ETF 2022 Annual Report | | | | | 53 | |
Schedule of investments (cont’d)
March 31, 2022
Western Asset Total Return ETF
| 1 | If the Fund is a seller of protection and a credit event occurs, as defined under the terms of that particular swap agreement, the Fund will either (i) pay to the buyer of protection an amount equal to the notional amount of the swap and take delivery of the referenced obligation or underlying securities comprising the referenced index or (ii) pay a net settlement amount in the form of cash or securities equal to the notional amount of the swap less the recovery value of the referenced obligation or underlying securities comprising the referenced index. |
| 2 | The maximum potential amount the Fund could be required to pay as a seller of credit protection or receive as a buyer of credit protection if a credit event occurs as defined under the terms of that particular swap agreement. |
| 3 | Implied credit spreads, utilized in determining the market value of credit default swap agreements on corporate or sovereign issues as of period end, serve as an indicator of the current status of the payment/performance risk and represent the likelihood or risk of default for the credit derivative. The implied credit spread of a particular referenced entity reflects the cost of buying/selling protection and may include upfront payments required to be made to enter into the agreement. Wider credit spreads represent a deterioration of the referenced entity’s credit soundness and a greater likelihood or risk of default or other credit event occurring as defined under the terms of the agreement. A credit spread identified as “Defaulted” indicates a credit event has occurred for the referenced entity or obligation. |
| 4 | If the Fund is a buyer of protection and a credit event occurs, as defined under the terms of that particular swap agreement, the Fund will either (i) receive from the seller of protection an amount equal to the notional amount of the swap and deliver the referenced obligation or the underlying securities comprising the referenced index or (ii) receive a net settlement amount in the form of cash or securities equal to the notional amount of the swap less the recovery value of the referenced obligation or the underlying securities comprising the referenced index. |
| 5 | The quoted market prices and resulting values for credit default swap agreements on asset-backed securities and credit indices serve as an indicator of the current status of the payment/performance risk and represent the likelihood of an expected loss (or profit) for the credit derivative had the notional amount of the swap agreement been closed/sold as of the period end. Decreasing market values (sell protection) or increasing market values (buy protection) when compared to the notional amount of the swap, represent a deterioration of the referenced entity’s credit soundness and a greater likelihood or risk of default or other credit event occurring as defined under the terms of the agreement. |
| † | Percentage shown is an annual percentage rate. |
| ** | One time payment made at termination date. |
| | | | |
Abbreviation(s) used in this table: |
| | |
| CPURNSA | | — | | U.S. CPI Urban Consumers NSA Index |
| | |
| EUR | | — | | Euro |
| | |
| LIBOR | | — | | London Interbank Offered Rate |
| | |
| SOFR | | — | | Secured Overnight Financing Rate |
See Notes to Financial Statements.
| | | | |
54 | | | | Western Asset Total Return ETF 2022 Annual Report |
Statement of assets and liabilities
March 31, 2022
| | | | |
| |
| Assets: | | | | |
Investments, at value (Cost — $123,947,691) | | $ | 115,256,998 | |
Foreign currency, at value (Cost — $635,100) | | | 676,789 | |
Deposits with brokers for open futures contracts and exchange-traded options | | | 3,046,277 | |
Deposits with brokers for centrally cleared swap contracts | | | 2,064,190 | |
Receivable for securities sold | | | 1,774,183 | |
Interest receivable | | | 745,554 | |
Foreign currency collateral for open futures contracts and exchange-traded options, at value (Cost — $294,537) | | | 309,963 | |
Unrealized appreciation on forward foreign currency contracts | | | 266,146 | |
Receivable from broker — net variation margin on open futures contracts | | | 24,277 | |
OTC swaps, at value (premiums paid — $6,734) | | | 6,691 | |
Receivable from broker — net variation margin on centrally cleared swap contracts | | | 1,133 | |
Total Assets | | | 124,172,201 | |
| |
| Liabilities: | | | | |
Payable for securities purchased | | | 7,492,774 | |
Written options, at value (premiums received — $1,156,595) | | | 2,769,735 | |
Unrealized depreciation on forward foreign currency contracts | | | 557,764 | |
Investment management fee payable | | | 42,622 | |
Due to custodian | | | 23,681 | |
OTC swaps, at value (net premiums received — $6,921) | | | 9,949 | |
Total Liabilities | | | 10,896,525 | |
| Total Net Assets | | $ | 113,275,676 | |
| |
| Net Assets: | | | | |
Par value (Note 5) | | $ | 50 | |
Paid-in capital in excess of par value | | | 133,026,022 | |
Total distributable earnings (loss) | | | (19,750,396) | |
| Total Net Assets | | | $113,275,676 | |
| |
| Shares Outstanding | | | 4,950,000 | |
| |
| Net Asset Value | | | $22.88 | |
See Notes to Financial Statements.
| | | | | | |
| Western Asset Total Return ETF 2022 Annual Report | | | | | 55 | |
Statements of operations
For the Period Ended March 31, 2022 and the Year Ended December 31, 2021
| | | | | | | | |
| | | 2022† | | | 2021 | |
| | |
| Investment Income: | | | | | | | | |
Dividends | | $ | 2,529 | | | $ | 11,763 | |
Interest | | | 884,836 | | | | 3,689,158 | |
Less: Foreign taxes withheld | | | — | | | | (1,785) | |
Total Investment Income | | | 887,365 | | | | 3,699,136 | |
| | |
| Expenses: | | | | | | | | |
Investment management fee (Note 2) | | | 141,575 | | | | 628,606 | |
Interest expense | | | 127 | | | | 9 | |
Total Expenses | | | 141,702 | | | | 628,615 | |
Less: Fee waivers and/or expense reimbursements (Note 2) | | | (11,557) | | | | (51,315) | |
Net Expenses | | | 130,145 | | | | 577,300 | |
| Net Investment Income | | | 757,220 | | | | 3,121,836 | |
|
| Realized and Unrealized Gain (Loss) on Investments, Futures Contracts, Written Options, Swap Contracts, Forward Foreign Currency Contracts and Foreign Currency Transactions (Notes 1, 3 and 4): | |
Net Realized Gain (Loss) From: | | | | | | | | |
Investment transactions | | | (1,872,030) | | | | (3,972,920) | |
Futures contracts | | | (2,629,896) | | | | (2,573,049) | |
Written options | | | 971,561 | | | | 3,548,698 | |
Swap contracts | | | 506,142 | | | | 1,396,002 | |
Forward foreign currency contracts | | | 307,061 | | | | 772,458 | |
Foreign currency transactions | | | (34,188) | | | | 74,195 | |
Net Realized Loss | | | (2,751,350) | | | | (754,616) | |
Change in Net Unrealized Appreciation (Depreciation) From: | | | | | | | | |
Investments | | | (7,795,700) | | | | (4,580,068) | |
Futures contracts | | | (2,763,986) | | | | (95,538) | |
Written options | | | (1,621,265) | | | | (23,857) | |
Swap contracts | | | (870,221) | | | | (1,447,907) | |
Forward foreign currency contracts | | | (239,850) | | | | (463,911) | |
Foreign currencies | | | 12,954 | | | | (139,274) | |
Change in Net Unrealized Appreciation (Depreciation) | | | (13,278,068) | | | | (6,750,555) | |
| Net Loss on Investments, Futures Contracts, Written Options, Swap Contracts, Forward Foreign Currency Contracts and Foreign Currency Transactions | | | (16,029,418) | | | | (7,505,171) | |
| Decrease in Net Assets From Operations | | $ | (15,272,198) | | | $ | (4,383,335) | |
| † | For the period January 1, 2022 through March 31, 2022. |
See Notes to Financial Statements.
| | | | |
56 | | | | Western Asset Total Return ETF 2022 Annual Report |
Statements of changes in net assets
| | | | | | | | | | | | |
For the Period Ended March 31, 2022
and the Years Ended December 31, | | 2022† | | | 2021 | | | 2020 | |
| | | |
| Operations: | | | | | | | | | | | | |
Net investment income | | $ | 757,220 | | | $ | 3,121,836 | | | $ | 2,904,364 | |
Net realized gain (loss) | | | (2,751,350) | | | | (754,616) | | | | 5,160,236 | |
Change in net unrealized appreciation (depreciation) | | | (13,278,068) | | | | (6,750,555) | | | | 3,446,064 | |
Increase (Decrease) in Net Assets From Operations | | | (15,272,198) | | | | (4,383,335) | | | | 11,510,664 | |
| | | |
| Distributions to Shareholders From (Note 1): | | | | | | | | | | | | |
Total distributable earnings | | | (627,413) | | | | (5,351,211) | | | | (6,693,676) | |
Decrease in Net Assets From Distributions to Shareholders | | | (627,413) | | | | (5,351,211) | | | | (6,693,676) | |
| | | |
| Fund Share Transactions (Note 5): | | | | | | | | | | | | |
Net proceeds from sale of shares (300,000, 550,000 and 3,250,000 shares issued, respectively) | | | 6,990,864 | | | | 15,044,884 | | | | 90,710,103 | |
Cost of shares repurchased (100,000, 800,000 and 2,250,000 shares repurchased, respectively) | | | (2,382,634) | | | | (21,685,482) | | | | (62,110,011) | |
Increase (Decrease) in Net Assets From Fund Share Transactions | | | 4,608,230 | | | | (6,640,598) | | | | 28,600,092 | |
Increase (Decrease) in Net Assets | | | (11,291,381) | | | | (16,375,144) | | | | 33,417,080 | |
| | | |
| Net Assets: | | | | | | | | | | | | |
Beginning of period | | | 124,567,057 | | | | 140,942,201 | | | | 107,525,121 | |
End of period | | $ | 113,275,676 | | | $ | 124,567,057 | | | $ | 140,942,201 | |
| † | For the period January 1, 2022 through March 31, 2022. |
See Notes to Financial Statements.
| | | | | | |
| Western Asset Total Return ETF 2022 Annual Report | | | | | 57 | |
Financial highlights
| | | | | | | | | | | | | | | | | | | | |
For a share of beneficial interest outstanding throughout each year ended March 31, unless otherwise noted: | |
| | | 20221,2 | | | 20211,3 | | | 20201,3 | | | 20191,3 | | | 20181,4 | |
| | | | | |
| Net asset value, beginning of period | | | $26.22 | | | | $28.19 | | | | $26.88 | | | | $25.16 | | | | $25.00 | |
| | | | | |
| Income (loss) from operations: | | | | | | | | | | | | | | | | | | | | |
Net investment income | | | 0.16 | | | | 0.66 | | | | 0.61 | | | | 0.82 | | | | 0.20 | |
Net realized and unrealized gain (loss) | | | (3.37) | | | | (1.49) | | | | 2.07 | | | | 2.45 | | | | 0.10 | |
Total income (loss) from operations | | | (3.21) | | | | (0.83) | | | | 2.68 | | | | 3.27 | | | | 0.30 | |
| | | | | |
| Less distributions from: | | | | | | | | | | | | | | | | | | | | |
Net investment income | | | (0.13) | | | | (0.87) | | | | (0.84) | | | | (0.90) | | | | (0.14) | |
Net realized gains | | | — | | | | (0.27) | | | | (0.53) | | | | (0.65) | | | | — | |
Total distributions | | | (0.13) | | | | (1.14) | | | | (1.37) | | | | (1.55) | | | | (0.14) | |
| | | | | |
| Net asset value, end of period | | | $22.88 | | | | $26.22 | | | | $28.19 | | | | $26.88 | | | | $25.16 | |
Total return, based on NAV5 | | | (12.28) | % | | | (2.98) | % | | | 10.12 | % | | | 13.19 | % | | | 1.19 | % |
| | | | | |
| Net assets, end of period (000s) | | | $113,276 | | | | $124,567 | | | | $140,942 | | | | $107,525 | | | | $25,162 | |
| | | | | |
| Ratios to average net assets: | | | | | | | | | | | | | | | | | | | | |
Gross expenses6 | | | 0.49 | %7 | | | 0.49 | % | | | 0.49 | % | | | 0.49 | % | | | 0.49 | %7 |
Net expenses6,8 | | | 0.45 | 7 | | | 0.45 | | | | 0.45 | | | | 0.45 | | | | 0.45 | 7 |
Net investment income | | | 2.62 | 7 | | | 2.43 | | | | 2.19 | | | | 3.09 | | | | 3.33 | 7 |
| | | | | |
| Portfolio turnover rate9 | | | 10 | % | | | 65 | % | | | 115 | % | | | 80 | % | | | 18 | % |
| 1 | Per share amounts have been calculated using the average shares method. |
| 2 | For the period January 1, 2022 through March 31, 2022. |
| 3 | For the Year Ended December 31. |
| 4 | For the period October 3, 2018 (inception date) to December 31, 2018. |
| 5 | Performance figures may reflect fee waivers and/or expense reimbursements. In the absence of fee waivers and/or expense reimbursements, the total return would have been lower. The total return calculation assumes that distributions are reinvested at NAV. Past performance is no guarantee of future results. Total returns for periods of less than one year are not annualized. |
| 6 | As a result of an expense limitation arrangement, the ratio of total annual fund operating expenses, other than interest expenses, taxes, brokerage expenses, future 12b-1 fees (if any), acquired fund fees and expenses, extraordinary expenses and the management fee payable to LMPFA under the investment management agreement, to the average net assets did not exceed 0.45%. This expense limitation arrangement cannot be terminated prior to May 1, 2022 without the Board of Trustees’ consent. |
| 8 | Reflects fee waivers and/or expense reimbursements. |
| 9 | Excluding mortgage dollar rolls transactions. If mortgage dollar roll transactions had been included, the portfolio turnover rate would have been 16% for the period ended March 31, 2022 and 103%, 193%, 285% and 97% for the years ended December 31, 2021, 2020, 2019 and the period ended December 31, 2018, respectively. |
See Notes to Financial Statements.
| | | | |
58 | | | | Western Asset Total Return ETF 2022 Annual Report |
Notes to financial statements
1. Organization and significant accounting policies
Western Asset Total Return ETF (the “Fund”) is a separate diversified investment series of Legg Mason ETF Investment Trust (the “Trust”). The Trust, a Maryland statutory trust, is registered under the Investment Company Act of 1940, as amended (the “1940 Act”), as an open-end management investment company. At a meeting held in September 2021, the Fund’s Board of Trustees approved changing the Fund’s fiscal year end from December 31st to March 31st. This change resulted in a short-period annual report for the three-month period from January 1, 2022 through March 31, 2022.
The Fund is an actively managed exchange-traded fund (“ETF”). ETFs are funds that trade like other publicly-traded securities. Unlike shares of a mutual fund, which can be bought from and redeemed by the issuing fund by all shareholders at a price based on net asset value (“NAV”), shares of the Fund may be directly purchased from and redeemed by the Fund at NAV solely by certain large institutional investors who have entered into agreements with the Fund’s distributor (“Authorized Participants”). Also unlike shares of a mutual fund, shares of the Fund are listed on a national securities exchange and trade in the secondary market at market prices that change throughout the day.
Shares of the Fund are listed and traded at market prices on NASDAQ. The market price for the Fund’s shares may be different from the Fund’s NAV. The Fund issues and redeems shares at NAV only in blocks of a specified number of shares or multiples thereof (“Creation Units”). Only Authorized Participants may purchase or redeem Creation Units directly with the Fund at NAV. Creation Units generally are issued and redeemed in cash. However, Creation Units may also be issued and redeemed partially in-kind for a basket of securities and partially in cash. Except when aggregated in Creation Units, shares of the Fund are not redeemable securities. Shareholders who are not Authorized Participants may not redeem shares directly from the Fund at NAV.
The Fund seeks to maximize total return, consistent with prudent investment management and liquidity needs.
The following are significant accounting policies consistently followed by the Fund and are in conformity with U.S. generally accepted accounting principles (“GAAP”). Estimates and assumptions are required to be made regarding assets, liabilities and changes in net assets resulting from operations when financial statements are prepared. Changes in the economic environment, financial markets and any other parameters used in determining these estimates could cause actual results to differ. Subsequent events have been evaluated through the date the financial statements were issued.
(a) Investment valuation. The valuations for fixed income securities (which may include, but are not limited to, corporate, government, municipal, mortgage-backed, collateralized mortgage obligations and asset-backed securities) and certain derivative instruments are typically the prices supplied by independent third party pricing services, which may use market prices or broker/dealer quotations or a variety of valuation techniques and
| | | | | | |
| Western Asset Total Return ETF 2022 Annual Report | | | | | 59 | |
Notes to financial statements (cont’d)
methodologies. The independent third party pricing services typically use inputs that are observable such as issuer details, interest rates, yield curves, prepayment speeds, credit risks/spreads, default rates and quoted prices for similar securities. Investments in open-end funds are valued at the closing net asset value per share of each fund on the day of valuation. Futures contracts are valued daily at the settlement price established by the board of trade or exchange on which they are traded. Equity securities for which market quotations are available are valued at the last reported sales price or official closing price on the primary market or exchange on which they trade. When the Fund holds securities or other assets that are denominated in a foreign currency, the Fund will use the currency exchange rates, generally determined as of 4:00 p.m. (London Time). If independent third party pricing services are unable to supply prices for a portfolio investment, or if the prices supplied are deemed by the manager to be unreliable, the market price may be determined by the manager using quotations from one or more broker/dealers or at the transaction price if the security has recently been purchased and no value has yet been obtained from a pricing service or pricing broker. When reliable prices are not readily available, such as when the value of a security has been significantly affected by events after the close of the exchange or market on which the security is principally traded, but before the Fund calculates its net asset value, the Fund values these securities as determined in accordance with procedures approved by the Fund’s Board of Trustees.
The Board of Trustees is responsible for the valuation process and has delegated the supervision of the daily valuation process to the Global Fund Valuation Committee (the “Valuation Committee”). The Valuation Committee, pursuant to the policies adopted by the Board of Trustees, is responsible for making fair value determinations, evaluating the effectiveness of the Fund’s pricing policies, and reporting to the Board of Trustees. When determining the reliability of third party pricing information for investments owned by the Fund, the Valuation Committee, among other things, conducts due diligence reviews of pricing vendors, monitors the daily change in prices and reviews transactions among market participants.
The Valuation Committee will consider pricing methodologies it deems relevant and appropriate when making fair value determinations. Examples of possible methodologies include, but are not limited to, multiple of earnings; discount from market of a similar freely traded security; discounted cash-flow analysis; book value or a multiple thereof; risk premium/yield analysis; yield to maturity; and/or fundamental investment analysis. The Valuation Committee will also consider factors it deems relevant and appropriate in light of the facts and circumstances. Examples of possible factors include, but are not limited to, the type of security; the issuer’s financial statements; the purchase price of the security; the discount from market value of unrestricted securities of the same class at the time of purchase; analysts’ research and observations from financial institutions; information regarding any transactions or offers with respect to the security; the existence of merger proposals or tender offers affecting the security; the price and extent of public trading in
| | | | |
60 | | | | Western Asset Total Return ETF 2022 Annual Report |
similar securities of the issuer or comparable companies; and the existence of a shelf registration for restricted securities.
For each portfolio security that has been fair valued pursuant to the policies adopted by the Board of Trustees, the fair value price is compared against the last available and next available market quotations. The Valuation Committee reviews the results of such back testing monthly and fair valuation occurrences are reported to the Board of Trustees quarterly.
The Fund uses valuation techniques to measure fair value that are consistent with the market approach and/or income approach, depending on the type of security and the particular circumstance. The market approach uses prices and other relevant information generated by market transactions involving identical or comparable securities. The income approach uses valuation techniques to discount estimated future cash flows to present value.
GAAP establishes a disclosure hierarchy that categorizes the inputs to valuation techniques used to value assets and liabilities at measurement date. These inputs are summarized in the three broad levels listed below:
| • | | Level 1 — quoted prices in active markets for identical investments |
| • | | Level 2 — other significant observable inputs (including quoted prices for similar investments, interest rates, prepayment speeds, credit risk, etc.) |
| • | | Level 3 — significant unobservable inputs (including the Fund’s own assumptions in determining the fair value of investments) |
The inputs or methodologies used to value securities are not necessarily an indication of the risk associated with investing in those securities.
| | | | | | |
| Western Asset Total Return ETF 2022 Annual Report | | | | | 61 | |
Notes to financial statements (cont’d)
The following is a summary of the inputs used in valuing the Fund’s assets and liabilities carried at fair value:
| | | | | | | | | | | | | | | | |
| ASSETS | |
| Description | | Quoted Prices
(Level 1) | | | Other Significant
Observable Inputs
(Level 2) | | | Significant
Unobservable
Inputs
(Level 3) | | | Total | |
| Long-Term Investments†: | | | | | | | | | | | | | | | | |
Corporate Bonds & Notes | | | — | | | $ | 43,916,784 | | | | — | | | $ | 43,916,784 | |
Mortgage-Backed Securities | | | — | | | | 19,576,881 | | | | — | | | | 19,576,881 | |
Collateralized Mortgage Obligations | | | — | | | | 11,647,004 | | | | — | | | | 11,647,004 | |
Sovereign Bonds | | | — | | | | 10,949,184 | | | | — | | | | 10,949,184 | |
U.S. Government & Agency Obligations | | | — | | | | 8,349,286 | | | | — | | | | 8,349,286 | |
Asset-Backed Securities | | | — | | | | 7,925,419 | | | | — | | | | 7,925,419 | |
Senior Loans | | | — | | | | 6,720,713 | | | | — | | | | 6,720,713 | |
Purchased Options: | | | | | | | | | | | | | | | | |
Exchange-Traded Purchased Options | | $ | 375,309 | | | | — | | | | — | | | | 375,309 | |
OTC Purchased Options | | | — | | | | 285,919 | | | | — | | | | 285,919 | |
Investments in Underlying Funds | | | 317,842 | | | | — | | | | — | | | | 317,842 | |
| Total Long-Term Investments | | | 693,151 | | | | 109,371,190 | | | | — | | | | 110,064,341 | |
| Short-Term Investments†: | | | | | | | | | | | | | | | | |
U.S. Treasury Bills | | | 3,498,994 | | | | — | | | | — | | | | 3,498,994 | |
Overnight Deposits | | | — | | | | 1,693,663 | | | | — | | | | 1,693,663 | |
| Total Short-Term Investments | | | 3,498,994 | | | | 1,693,663 | | | | — | | | | 5,192,657 | |
| Total Investments | | $ | 4,192,145 | | | $ | 111,064,853 | | | | — | | | $ | 115,256,998 | |
| Other Financial Instruments: | | | | | | | | | | | | | | | | |
Futures Contracts†† | | $ | 3,440,505 | | | | — | | | | — | | | $ | 3,440,505 | |
Forward Foreign Currency Contracts†† | | | — | | | $ | 266,146 | | | | — | | | | 266,146 | |
Centrally Cleared Interest Rate Swaps†† | | | — | | | | 1,602,419 | | | | — | | | | 1,602,419 | |
OTC Credit Default Swaps on Corporate Issues — Sell Protection‡ | | | — | | | | 6,691 | | | | — | | | | 6,691 | |
Centrally Cleared Credit Default Swaps on Credit Indices — Sell Protection†† | | | — | | | | 33,183 | | | | — | | | | 33,183 | |
| Total Other Financial Instruments | | $ | 3,440,505 | | | $ | 1,908,439 | | | | — | | | $ | 5,348,944 | |
| Total | | $ | 7,632,650 | | | $ | 112,973,292 | | | | — | | | $ | 120,605,942 | |
| | | | |
62 | | | | Western Asset Total Return ETF 2022 Annual Report |
| | | | | | | | | | | | | | |
| LIABILITIES | |
| Description | | Quoted Prices
(Level 1) | | | Other Significant
Observable Inputs
(Level 2) | | | Significant
Unobservable
Inputs
(Level 3) | | Total | |
| Other Financial Instruments: | | | | | | | | | | | | | | |
Written Options: | | | | | | | | | | | | | | |
Exchange-Traded Written Options | | $ | 1,967,549 | | | | — | | | — | | $ | 1,967,549 | |
OTC Written Options | | | — | | | $ | 802,186 | | | — | | | 802,186 | |
Futures Contracts†† | | | 6,449,616 | | | | — | | | — | | | 6,449,616 | |
Forward Foreign Currency Contracts†† | | | — | | | | 557,764 | | | — | | | 557,764 | |
Centrally Cleared Interest Rate Swaps†† | | | — | | | | 2,895,872 | | | — | | | 2,895,872 | |
OTC Credit Default Swaps on Corporate Issues — Buy Protection‡ | | | — | | | | 9,949 | | | — | | | 9,949 | |
Centrally Cleared Credit Default Swaps on Credit Indices — Buy Protection†† | | | — | | | | 8,699 | | | — | | | 8,699 | |
| Total | | $ | 8,417,165 | | | $ | 4,274,470 | | | — | | $ | 12,691,635 | |
| † | See Schedule of Investments for additional detailed categorizations. |
| †† | Reflects the unrealized appreciation (depreciation) of the instruments. |
| ‡ | Value includes any premium paid or received with respect to swap contracts. |
(b) Purchased options. When the Fund purchases an option, an amount equal to the premium paid by the Fund is recorded as an investment on the Statement of Assets and Liabilities, the value of which is marked-to-market to reflect the current market value of the option purchased. If the purchased option expires, the Fund realizes a loss equal to the amount of premium paid. When an instrument is purchased or sold through the exercise of an option, the related premium paid is added to the basis of the instrument acquired or deducted from the proceeds of the instrument sold. The risk associated with purchasing put and call options is limited to the premium paid.
(c) Written options. When the Fund writes an option, an amount equal to the premium received by the Fund is recorded as a liability, the value of which is marked-to-market daily to reflect the current market value of the option written. If the option expires, the premium received is recorded as a realized gain. When a written call option is exercised, the difference between the premium received plus the option exercise price and the Fund’s basis in the underlying security (in the case of a covered written call option), or the cost to purchase the underlying security (in the case of an uncovered written call option), including brokerage commission, is recognized as a realized gain or loss. When a written put option is exercised, the amount of the premium received is subtracted from the cost of the security purchased by the Fund from the exercise of the written put option to form the Fund’s basis in the underlying security purchased. The writer or buyer of an option traded on an
| | | | | | |
| Western Asset Total Return ETF 2022 Annual Report | | | | | 63 | |
Notes to financial statements (cont’d)
exchange can liquidate the position before the exercise of the option by entering into a closing transaction. The cost of a closing transaction is deducted from the original premium received resulting in a realized gain or loss to the Fund.
The risk in writing a covered call option is that the Fund may forego the opportunity of profit if the market price of the underlying security increases and the option is exercised. The risk in writing a put option is that the Fund may incur a loss if the market price of the underlying security decreases and the option is exercised. The risk in writing an uncovered call option is that the Fund is exposed to the risk of loss if the market price of the underlying security increases. In addition, there is the risk that the Fund may not be able to enter into a closing transaction because of an illiquid secondary market.
(d) Options on futures contracts. An option on a futures contract gives the purchaser the right, in return for the premium paid, to assume a position in the underlying futures contract at the specified option exercise price at any time prior to the expiration date of the option. Upon exercise of an option, the delivery of the futures position by the writer of the option to the holder of the option will be accompanied by delivery of the accumulated balance in the writer’s futures margin account that represents the amount by which the market price of the futures contract exceeds (in the case of a call) or is less than (in the case of a put) the exercise price of the option on the futures contract. The potential for loss related to the purchase of an option on a futures contract is limited to the premium paid for the option plus transaction costs. Because the value of the option is fixed at the point of purchase, there are no daily cash payments by the purchaser to reflect changes in the value of the underlying contract; however, the value of the option changes daily and that change would be reflected in the net asset value of the Fund. The potential for loss related to writing call options is unlimited. The potential for loss related to writing put options is limited only by the aggregate strike price of the put option less the premium received.
(e) Futures contracts. The Fund uses futures contracts generally to gain exposure to, or hedge against, changes in interest rates or gain exposure to, or hedge against, changes in certain asset classes or in an attempt to increase the Fund’s return. A futures contract represents a commitment for the future purchase or sale of an asset at a specified price on a specified date.
Upon entering into a futures contract, the Fund is required to deposit cash or securities with a broker in an amount equal to a certain percentage of the contract amount. This is known as the ‘‘initial margin’’ and subsequent payments (‘‘variation margin’’) are made or received by the Fund each day, depending on the daily fluctuation in the value of the contract. For certain futures, including foreign denominated futures, variation margin is not settled daily, but is recorded as a net variation margin payable or receivable. The daily changes in contract value are recorded as unrealized appreciation or depreciation in the Statements of Operations and the Fund recognizes a realized gain or loss when the contract is closed.
| | | | |
64 | | | | Western Asset Total Return ETF 2022 Annual Report |
Futures contracts involve, to varying degrees, risk of loss in excess of the amounts reflected in the financial statements. In addition, there is the risk that the Fund may not be able to enter into a closing transaction because of an illiquid secondary market.
(f) Forward foreign currency contracts. The Fund enters into a forward foreign currency contract to hedge exposure of bond positions or in an attempt to increase the Fund’s return. A forward foreign currency contract is an agreement between two parties to buy and sell a currency at a set price with delivery and settlement at a future date. The contract is marked-to-market daily and the change in value is recorded by the Fund as an unrealized gain or loss. When a forward foreign currency contract is closed, through either delivery or offset by entering into another forward foreign currency contract, the Fund recognizes a realized gain or loss equal to the difference between the value of the contract at the time it was opened and the value of the contract at the time it is closed.
Non-deliverable forward foreign currency exchange contracts are settled with the counterparty in cash without the delivery of foreign currency.
Forward foreign currency contracts involve elements of market risk in excess of the amounts reflected on the Statement of Assets and Liabilities. The Fund bears the risk of an unfavorable change in the foreign exchange rate underlying the forward foreign currency contract. Risks may also arise upon entering into these contracts from the potential inability of the counterparties to meet the terms of their contracts.
(g) Swap agreements. The Fund invests in swaps for the purpose of managing its exposure to interest rate, credit or market risk, or for other purposes. The use of swaps involves risks that are different from those associated with other portfolio transactions. Swap agreements are privately negotiated in the over-the-counter market and may be entered into as a bilateral contract (“OTC Swaps”) or centrally cleared (“Centrally Cleared Swaps”). Unlike Centrally Cleared Swaps, the Fund has credit exposure to the counterparties of OTC Swaps.
In a Centrally Cleared Swap, immediately following execution of the swap, the swap agreement is submitted to a clearinghouse or central counterparty (the “CCP”) and the CCP becomes the ultimate counterparty of the swap agreement. The Fund is required to interface with the CCP through a broker, acting in an agency capacity. All payments are settled with the CCP through the broker. Upon entering into a Centrally Cleared Swap, the Fund is required to deposit initial margin with the broker in the form of cash or securities.
Swap contracts are marked-to-market daily and changes in value are recorded as unrealized appreciation (depreciation). The daily change in valuation of Centrally Cleared Swaps, if any, is recorded as a net receivable or payable for variation margin on the Statement of Assets and Liabilities. Gains or losses are realized upon termination of the swap agreement. Collateral, in the form of restricted cash or securities, may be required to be held in segregated accounts with the Fund’s custodian in compliance with the terms of the swap contracts. Securities posted as collateral for swap contracts are identified in the
| | | | | | |
| Western Asset Total Return ETF 2022 Annual Report | | | | | 65 | |
Notes to financial statements (cont’d)
Schedule of Investments and restricted cash, if any, is identified on the Statement of Assets and Liabilities. Risks may exceed amounts recorded in the Statement of Assets and Liabilities. These risks include changes in the returns of the underlying instruments, failure of the counterparties to perform under the contracts’ terms, and the possible lack of liquidity with respect to the swap agreements.
OTC Swap payments received or made at the beginning of the measurement period are reflected as a premium or deposit, respectively, on the Statement of Assets and Liabilities. These upfront payments are amortized over the life of the swap and are recognized as realized gain or loss in the Statements of Operations. Net periodic payments received or paid by the Fund are recognized as a realized gain or loss in the Statements of Operations.
The Fund’s maximum exposure in the event of a defined credit event on a credit default swap to sell protection is the notional amount. As of March 31, 2022, the total notional value of all credit default swaps to sell protection was EUR 530,000 and $15,667,000. These amounts would be offset by the value of the swap’s reference entity, upfront premiums received on the swap and any amounts received from the settlement of a credit default swap where the Fund bought protection for the same referenced entity.
For average notional amounts of swaps held during the period ended March 31, 2022, see Note 4.
Credit default swaps
The Fund enters into credit default swap (“CDS”) contracts for investment purposes, to manage its credit risk or to add leverage. CDS agreements involve one party making a stream of payments to another party in exchange for the right to receive a specified return in the event of a default by a third party, typically corporate or sovereign issuers, on a specified obligation, or in the event of a write-down, principal shortfall, interest shortfall or default of all or part of the referenced entities comprising a credit index. The Fund may use a CDS to provide protection against defaults of the issuers (i.e., to reduce risk where the Fund has exposure to an issuer) or to take an active long or short position with respect to the likelihood of a particular issuer’s default. As a seller of protection, the Fund generally receives an upfront payment or a stream of payments throughout the term of the swap provided that there is no credit event. If the Fund is a seller of protection and a credit event occurs, as defined under the terms of that particular swap agreement, the maximum potential amount of future payments (undiscounted) that the Fund could be required to make under a CDS agreement would be an amount equal to the notional amount of the agreement. These amounts of potential payments will be partially offset by any recovery of values from the respective referenced obligations. As a seller of protection, the Fund effectively adds leverage to its portfolio because, in addition to its total net assets, the Fund is subject to investment exposure on the notional amount of the swap. As a buyer of protection, the Fund generally receives an amount up to the notional value of the swap if a credit event occurs.
| | | | |
66 | | | | Western Asset Total Return ETF 2022 Annual Report |
Implied spreads are the theoretical prices a lender receives for credit default protection. When spreads rise, market perceived credit risk rises and when spreads fall, market perceived credit risk falls. The implied credit spread of a particular referenced entity reflects the cost of buying/selling protection and may include upfront payments required to enter into the agreement. Wider credit spreads and decreasing market values, when compared to the notional amount of the swap, represent a deterioration of the referenced entity’s credit soundness and a greater likelihood or risk of default or other credit event occurring as defined under the terms of the agreement. Credit spreads utilized in determining the period end market value of CDS agreements on corporate or sovereign issues are disclosed in the Schedule of Investments and serve as an indicator of the current status of the payment/ performance risk and represent the likelihood or risk of default for credit derivatives. For CDS agreements on asset-backed securities and credit indices, the quoted market prices and resulting values, particularly in relation to the notional amount of the contract as well as the annual payment rate, serve as an indication of the current status of the payment/ performance risk.
The Fund’s maximum risk of loss from counterparty risk, as the protection buyer, is the fair value of the contract (this risk is mitigated by the posting of collateral by the counterparty to the Fund to cover the Fund’s exposure to the counterparty). As the protection seller, the Fund’s maximum risk is the notional amount of the contract. CDS are considered to have credit risk-related contingent features since they require payment by the protection seller to the protection buyer upon the occurrence of a defined credit event.
Entering into a CDS agreement involves, to varying degrees, elements of credit, market and documentation risk in excess of the related amounts recognized on the Statement of Assets and Liabilities. Such risks involve the possibility that there will be no liquid market for these agreements, that the counterparty to the agreement may default on its obligation to perform or disagree as to the meaning of the contractual terms in the agreement, and that there will be unfavorable changes in net interest rates.
Interest rate swaps
The Fund enters into interest rate swap contracts to manage its exposure to interest rate risk. Interest rate swaps are agreements between two parties to exchange cash flows based on a notional principal amount. The Fund may elect to pay a fixed rate and receive a floating rate, or receive a fixed rate and pay a floating rate, on a notional principal amount. Interest rate swaps are marked-to-market daily based upon quotations from market makers and the change, if any, is recorded as an unrealized appreciation or depreciation in the Statement of Operations. When a swap contract is terminated early, the Fund records a realized gain or loss equal to the difference between the original cost and the settlement amount of the closing transaction.
The risks of interest rate swaps include changes in market conditions that will affect the value of the contract or changes in the present value of the future cash flow streams and the possible inability of the counterparty to fulfill its obligations under the agreement. The
| | | | | | |
| Western Asset Total Return ETF 2022 Annual Report | | | | | 67 | |
Notes to financial statements (cont’d)
Fund’s maximum risk of loss from counterparty credit risk is the discounted net value of the cash flows to be received from the counterparty over the contract’s remaining life, to the extent that amount is positive. This risk is mitigated by the posting of collateral by the counterparty to the Fund to cover the Fund’s exposure to the counterparty.
(h) Swaptions. The Fund may purchase or write swaption contracts to manage exposure to fluctuations in interest rates or to enhance yield. The Fund may also purchase and write swaption contracts to manage exposure to an underlying instrument. Swaption contracts written by the Fund represent an option that gives the purchaser the right, but not the obligation, to enter into a previously agreed upon swap contract at a future date. Swaption contracts purchased by the Fund represent an option that gives the Fund the right, but not the obligation, to enter into a previously agreed upon swap contract at a future date.
When the Fund writes a swaption, an amount equal to the premium received by the Fund is recorded as a liability, the value of which is marked-to-market daily to reflect the current market value of the swaption written. If the swaption expires, the Fund realizes a gain equal to the amount of the premium received.
When the Fund purchases a swaption, an amount equal to the premium paid by the Fund is recorded as an investment on the Statement of Assets and Liabilities, the value of which is marked-to-market daily to reflect the current market value of the swaption purchased. If the swaption expires, the Fund realizes a loss equal to the amount of the premium paid.
Swaptions are marked-to-market daily based upon quotations from market makers. Changes in the value of the swaption are reported as unrealized gains or losses in the Statement of Operations.
(i) Loan participations. The Fund may invest in loans arranged through private negotiation between one or more financial institutions. The Fund’s investment in any such loan may be in the form of a participation in or an assignment of the loan. In connection with purchasing participations, the Fund generally will have no right to enforce compliance by the borrower with the terms of the loan agreement related to the loan, or any rights of off-set against the borrower and the Fund may not benefit directly from any collateral supporting the loan in which it has purchased the participation.
The Fund assumes the credit risk of the borrower, the lender that is selling the participation and any other persons interpositioned between the Fund and the borrower. In the event of the insolvency of the lender selling the participation, the Fund may be treated as a general creditor of the lender and may not benefit from any off-set between the lender and the borrower.
(j) Unfunded loan commitments. The Fund may enter into certain credit agreements where all or a portion of the total amount committed may be unfunded. The Fund is obligated to fund these commitments at the borrower’s discretion. The commitments are
| | | | |
68 | | | | Western Asset Total Return ETF 2022 Annual Report |
disclosed in the accompanying Schedule of Investments. At March 31, 2022, the Fund had sufficient cash and/or securities to cover these commitments.
(k) Stripped securities. The Fund may invest in ‘‘Stripped Securities,’’ a term used collectively for components, or strips, of fixed income securities. Stripped Securities can be principal only securities (“PO”), which are debt obligations that have been stripped of unmatured interest coupons, or interest only securities (“IO”), which are unmatured interest coupons that have been stripped from debt obligations. The market value of Stripped Securities will fluctuate in response to changes in economic conditions, rates of prepayment, interest rates and the market’s perception of the securities. However, fluctuations in response to interest rates may be greater in Stripped Securities than for debt obligations of comparable maturities that pay interest currently. The amount of fluctuation may increase with a longer period of maturity.
The yield to maturity on IO’s is sensitive to the rate of principal repayments (including prepayments) on the related underlying debt obligation and principal payments may have a material effect on yield to maturity. If the underlying debt obligation experiences greater than anticipated prepayments of principal, the Fund may not fully recoup its initial investment in IO’s.
(l) Securities traded on a when-issued and delayed delivery basis. The Fund may trade securities on a when-issued or delayed delivery basis. In when-issued and delayed delivery transactions, the securities are purchased or sold by the Fund with payment and delivery taking place in the future in order to secure what is considered to be an advantageous price and yield to the Fund at the time of entering into the transaction.
Purchasing such securities involves risk of loss if the value of the securities declines prior to settlement. These securities are subject to market fluctuations and their current value is determined in the same manner as for other securities.
(m) Securities traded on a to-be-announced basis. The Fund may trade securities on a to-be-announced (“TBA”) basis. In a TBA transaction, the Fund commits to purchasing or selling securities which have not yet been issued by the issuer and for which specific information, such as the face amount, maturity date and underlying pool of investments in U.S. government agency mortgage pass-through securities, is not announced. Securities purchased on a TBA basis are not settled until they are delivered to the Fund. Beginning on the date the Fund enters into a TBA transaction, cash, U.S. government securities or other liquid high-grade debt obligations are segregated in an amount equal in value to the purchase price of the TBA security. These securities are subject to market fluctuations and their current value is determined in the same manner as for other securities.
(n) Mortgage dollar rolls. The Fund may enter into mortgage dollar rolls in which the Fund sells mortgage-backed securities for delivery in the current month, realizing a gain or loss, and simultaneously entering into contracts to repurchase substantially similar (same type, coupon and maturity) securities to settle on a specified future date.
| | | | | | |
| Western Asset Total Return ETF 2022 Annual Report | | | | | 69 | |
Notes to financial statements (cont’d)
The Fund executes its mortgage dollar rolls entirely in the TBA market, whereby the Fund makes a forward commitment to purchase a security and, instead of accepting delivery, the position is offset by a sale of the security with a simultaneous agreement to repurchase at a future date. The Fund accounts for mortgage dollar rolls as purchases and sales.
The risk of entering into mortgage dollar rolls is that the market value of the securities the Fund is obligated to repurchase under the agreement may decline below the repurchase price. In the event the buyer of securities under a mortgage dollar roll files for bankruptcy or becomes insolvent, the Fund’s use of the proceeds of the mortgage dollar roll may be restricted pending a determination by the counterparty, or its trustee or receiver, whether to enforce the Fund’s obligation to repurchase the securities.
(o) Inflation-indexed bonds. Inflation-indexed bonds are fixed income securities whose principal value or interest rate is periodically adjusted according to the rate of inflation. As the index measuring inflation changes, the principal value or interest rate of inflation-indexed bonds will be adjusted accordingly. Inflation adjustments to the principal amount of inflation-indexed bonds are reflected as an increase or decrease to investment income on the Statement of Operations. Repayment of the original bond principal upon maturity (as adjusted for inflation) is guaranteed in the case of U.S. Treasury inflation-indexed bonds. For bonds that do not provide a similar guarantee, the adjusted principal value of the bond repaid at maturity may be less than the original principal.
(p) Foreign currency translation. Investment securities and other assets and liabilities denominated in foreign currencies are translated into U.S. dollar amounts based upon prevailing exchange rates on the date of valuation. Purchases and sales of investment securities and income and expense items denominated in foreign currencies are translated into U.S. dollar amounts based upon prevailing exchange rates on the respective dates of such transactions.
The Fund does not isolate that portion of the results of operations resulting from fluctuations in foreign exchange rates on investments from the fluctuations arising from changes in market prices of securities held. Such fluctuations are included with the net realized and unrealized gain or loss on investments.
Net realized foreign exchange gains or losses arise from sales of foreign currencies, including gains and losses on forward foreign currency contracts, currency gains or losses realized between the trade and settlement dates on securities transactions, and the difference between the amounts of dividends, interest, and foreign withholding taxes recorded on the Fund’s books and the U.S. dollar equivalent of the amounts actually received or paid. Net unrealized foreign exchange gains and losses arise from changes in the values of assets and liabilities, other than investments in securities, on the date of valuation, resulting from changes in exchange rates.
Foreign security and currency transactions may involve certain considerations and risks not typically associated with those of U.S. dollar denominated transactions as a result of,
| | | | |
70 | | | | Western Asset Total Return ETF 2022 Annual Report |
among other factors, the possibility of lower levels of governmental supervision and regulation of foreign securities markets and the possibility of political or economic instability.
(q) Credit and market risk. The Fund invests in high-yield and emerging market instruments that are subject to certain credit and market risks. The yields of high-yield and emerging market debt obligations reflect, among other things, perceived credit and market risks. The Fund’s investments in securities rated below investment grade typically involve risks not associated with higher rated securities including, among others, greater risk related to timely and ultimate payment of interest and principal, greater market price volatility and less liquid secondary market trading. The consequences of political, social, economic or diplomatic changes may have disruptive effects on the market prices of investments held by the Fund. The Fund’s investments in non-U.S. dollar denominated securities may also result in foreign currency losses caused by devaluations and exchange rate fluctuations.
Investments in securities that are collateralized by real estate mortgages are subject to certain credit and liquidity risks. When market conditions result in an increase in default rates of the underlying mortgages and the foreclosure values of underlying real estate properties are materially below the outstanding amount of these underlying mortgages, collection of the full amount of accrued interest and principal on these investments may be doubtful. Such market conditions may significantly impair the value and liquidity of these investments and may result in a lack of correlation between their credit ratings and values.
(r) Foreign investment risks. The Fund’s investments in foreign securities may involve risks not present in domestic investments. Since securities may be denominated in foreign currencies, may require settlement in foreign currencies or may pay interest or dividends in foreign currencies, changes in the relationship of these foreign currencies to the U.S. dollar can significantly affect the value of the investments and earnings of the Fund. Foreign investments may also subject the Fund to foreign government exchange restrictions, expropriation, taxation or other political, social or economic developments, all of which affect the market and/or credit risk of the investments.
(s) Counterparty risk and credit-risk-related contingent features of derivative instruments. The Fund may invest in certain securities or engage in other transactions where the Fund is exposed to counterparty credit risk in addition to broader market risks. The Fund may invest in securities of issuers, which may also be considered counterparties as trading partners in other transactions. This may increase the risk of loss in the event of default or bankruptcy by the counterparty or if the counterparty otherwise fails to meet its contractual obligations. The Fund’s subadviser attempts to mitigate counterparty risk by (i) periodically assessing the creditworthiness of its trading partners, (ii) monitoring and/or limiting the amount of its net exposure to each individual counterparty based on its assessment and (iii) requiring collateral from the counterparty for certain transactions. Market events and changes in overall economic conditions may impact the assessment of
| | | | | | |
| Western Asset Total Return ETF 2022 Annual Report | | | | | 71 | |
Notes to financial statements (cont’d)
such counterparty risk by the subadviser. In addition, declines in the values of underlying collateral received may expose the Fund to increased risk of loss.
With exchange traded and centrally cleared derivatives, there is less counterparty risk to the Fund since the exchange or clearinghouse, as counterparty to such instruments, guarantees against a possible default. The clearinghouse stands between the buyer and the seller of the contract; therefore, the credit risk is limited to failure of the clearinghouse. While offset rights may exist under applicable law, the Fund does not have a contractual right of offset against a clearing broker or clearinghouse in the event of a default of the clearing broker or clearinghouse.
The Fund has entered into master agreements, such as an International Swaps and Derivatives Association, Inc. Master Agreement (“ISDA Master Agreement”) or similar agreement, with certain of its derivative counterparties that govern over-the-counter (“OTC”) derivatives and provide for general obligations, representations, agreements, collateral posting terms, netting provisions in the event of default or termination and credit related contingent features. The credit related contingent features include, but are not limited to, a percentage decrease in the Fund’s net assets or net asset value per share over a specified period of time. If these credit related contingent features were triggered, the derivatives counterparty could terminate the positions and demand payment or require additional collateral.
Under an ISDA Master Agreement, the Fund may, under certain circumstances, offset with the counterparty certain derivative financial instruments’ payables and/or receivables with collateral held and/or posted and create one single net payment. However, absent an event of default by the counterparty or a termination of the agreement, the terms of the ISDA Master Agreements do not result in an offset of reported amounts of financial assets and financial liabilities in the Statement of Assets and Liabilities across transactions between the Fund and the applicable counterparty. The enforceability of the right to offset may vary by jurisdiction.
Collateral requirements differ by type of derivative. Collateral or margin requirements are set by the broker or exchange clearinghouse for exchange traded derivatives while collateral terms are contract specific for OTC traded derivatives. Cash collateral that has been pledged to cover obligations of the Fund under derivative contracts, if any, will be reported separately in the Statement of Assets and Liabilities. Securities pledged as collateral, if any, for the same purpose are noted in the Schedule of Investments.
As of March 31, 2022, the Fund held OTC written options, OTC swap contracts and forward foreign currency contracts with credit related contingent features which had a net liability-position of $1,369,899. If a contingent feature would have been triggered, the Fund would-have been required to pay this amount to its derivatives counterparties.
(t) Security transactions and investment income. Security transactions are accounted for on a trade date basis. Interest income (including interest income from payment-in-kind
| | | | |
72 | | | | Western Asset Total Return ETF 2022 Annual Report |
securities), adjusted for amortization of premium and accretion of discount, is recorded on the accrual basis. Paydown gains and losses on mortgage- and asset-backed securities are recorded as adjustments to interest income. Dividend income is recorded on the ex-dividend date for dividends received in cash and/or securities. The cost of investments sold is determined by use of the specific identification method. To the extent any issuer defaults or a credit event occurs that impacts the issuer, the Fund may halt any additional interest income accruals and consider the realizability of interest accrued up to the date of default or credit event.
(u) Distributions to shareholders. Distributions from net investment income of the Fund, if any, are declared and paid on a monthly basis. Distributions of net realized gains, if any, are declared at least annually. Distributions to shareholders of the Fund are recorded on the ex-dividend date and are determined in accordance with income tax regulations, which may differ from GAAP.
(v) Federal and other taxes. It is the Fund’s policy to comply with the federal income and excise tax requirements of the Internal Revenue Code of 1986 (the “Code”), as amended, applicable to regulated investment companies. Accordingly, the Fund intends to distribute its taxable income and net realized gains, if any, to shareholders in accordance with timing requirements imposed by the Code. Therefore, no federal or state income tax provision is required in the Fund’s financial statements.
Management has analyzed the Fund’s tax positions taken on income tax returns for all open tax years and has concluded that as of March 31, 2022, no provision for income tax is required in the Fund’s financial statements. The Fund’s federal and state income and federal excise tax returns for tax years for which the applicable statutes of limitations have not expired are subject to examination by the Internal Revenue Service and state departments of revenue.
Under the applicable foreign tax laws, a withholding tax may be imposed on interest, dividends and capital gains at various rates.
(w) Reclassification. GAAP requires that certain components of net assets be reclassified to reflect permanent differences between financial and tax reporting. These reclassifications have no effect on net assets or net asset value per share. During the current period, the Fund had no reclassifications.
2. Investment management agreement and other transactions with affiliates
Legg Mason Partners Fund Advisor, LLC (“LMPFA”) is the Fund’s investment manager. Western Asset Management Company, LLC (“Western Asset”), is the Fund’s subadviser and Western Asset Management Company Pte. Ltd. in Singapore (“Western Asset Singapore”), Western Asset Management Company Ltd in Japan (“Western Asset Japan”) and Western Asset Management Company Limited in London (“Western Asset London”) are the Fund’s subadvisers. LMPFA, Western Asset, Western Asset Singapore, Western Asset Japan and
| | | | | | |
| Western Asset Total Return ETF 2022 Annual Report | | | | | 73 | |
Notes to financial statements (cont’d)
Western Asset London are indirect, wholly-owned subsidiaries of Franklin Resources, Inc. (“Franklin Resources”).
LMPFA provides administrative and certain oversight services to the Fund. LMPFA delegates to the subadviser the day-to-day portfolio management of the Fund. The Fund is responsible for paying interest expenses, taxes, brokerage expenses, future 12b-1 fees (if any), acquired fund fees and expenses, extraordinary expenses and the management fee payable to LMPFA under the investment management agreement.
Under the investment management agreement and subject to the general supervision of the Fund’s Board of Trustees, LMPFA provides or causes to be furnished all investment management, supervisory, administrative and other services reasonably necessary for the operation of the Fund, including certain distribution services (provided pursuant to a separate distribution agreement) and investment advisory services (provided pursuant to separate subadvisory agreements) under a unitary fee structure. The Fund pays an investment management fee, calculated daily and paid monthly, at an annual rate of 0.49% of the Fund’s average daily net assets.
LMPFA has agreed to waive fees and/or reimburse investment manager fees, so that the ratio of total annual fund operating expenses will not exceed 0.45% of the Fund’s average daily net assets (subject to the same exclusions as the investment management agreement). This arrangement cannot be terminated prior to May 1, 2022 without the Board of Trustees consent.
During the period ended March 31, 2022, fees waived and/or expenses reimbursed amounted to $11,557.
As compensation for its subadvisory services, LMPFA pays Western Asset monthly 70% of the management fee paid by the Fund to LMPFA, net of (i) all fees and expenses incurred by LMPFA under the investment management agreement (including without limitation any subadvisory fee paid to another subadviser to the Fund) and (ii) expense waivers, if any, and reimbursements. Western Asset pays Western Asset Singapore, Western Asset Japan and Western Asset London a monthly subadvisory fee in an amount equal to 100% of the management fee paid to Western Asset on the assets that Western Asset allocates to each such non-U.S. subadviser to manage.
Franklin Distributors, LLC (“Franklin Distributors”) serves as the distributor of Creation Units for the Fund on an agency basis. Franklin Distributors is an indirect, wholly-owned broker-dealer subsidiary of Franklin Resources.
The Fund’s Board of Trustees has adopted a Rule 12b-1 shareholder services and distribution plan and under that plan, the Fund is authorized to pay service and/or distribution fees calculated at an annual rate of up to 0.25% of its average daily net assets. No service and/or distribution fees are currently paid by the Fund, and there are no current plans to impose these fees.
| | | | |
74 | | | | Western Asset Total Return ETF 2022 Annual Report |
All officers and one Trustee of the Trust are employees of Franklin Resources or its affiliates and do not receive compensation from the Trust.
3. Investments
During the period ended March 31, 2022, the aggregate cost of purchases and proceeds from sales of investments (excluding short-term investments) and U.S. Government & Agency Obligations were as follows:
| | | | | | | | |
| | | Investments | | | U.S. Government &
Agency Obligations | |
| Purchases | | | $6,514,597 | | | | $11,910,689 | |
| Sales | | | 7,876,943 | | | | 13,124,451 | |
At March 31, 2022, the aggregate cost of investments and the aggregate gross unrealized appreciation and depreciation of investments for federal income tax purposes were as follows:
| | | | | | | | | | | | | | | | |
| | | Cost/Premiums
Paid (Received) | | | Gross
Unrealized
Appreciation | | | Gross
Unrealized
Depreciation | | | Net
Unrealized
Depreciation | |
| Securities | | $ | 124,067,965 | | | $ | 516,322 | | | $ | (9,327,289) | | | $ | (8,810,967) | |
| Written options | | | (1,156,595) | | | | 280,417 | | | | (1,893,557) | | | | (1,613,140) | |
| Futures contracts | | | — | | | | 3,440,505 | | | | (6,449,616) | | | | (3,009,111) | |
| Forward foreign currency contracts | | | — | | | | 266,146 | | | | (557,764) | | | | (291,618) | |
| Swap contracts | | | 503,747 | | | | 1,635,602 | | | | (2,907,642) | | | | (1,272,040) | |
4. Derivative instruments and hedging activities
Below is a table, grouped by derivative type, that provides information about the fair value and the location of derivatives within the Statement of Assets and Liabilities at March 31, 2022.
| | | | | | | | | | | | | | | | |
| ASSET DERIVATIVES1 | |
| | | Interest
Rate Risk | | | Foreign
Exchange Risk | | | Credit
Risk | | | Total | |
| Purchased options2 | | $ | 659,704 | | | $ | 1,524 | | | | — | | | $ | 661,228 | |
| Futures contracts3 | | | 3,440,505 | | | | — | | | | — | | | | 3,440,505 | |
| Forward foreign currency contracts | | | — | | | | 266,146 | | | | — | | | | 266,146 | |
| OTC swap contracts4 | | | — | | | | — | | | $ | 6,691 | | | | 6,691 | |
| Centrally cleared swap contracts5 | | | 1,602,419 | | | | — | | | | 33,183 | | | | 1,635,602 | |
| Total | | $ | 5,702,628 | | | $ | 267,670 | | | $ | 39,874 | | | $ | 6,010,172 | |
| | | | | | |
| Western Asset Total Return ETF 2022 Annual Report | | | | | 75 | |
Notes to financial statements (cont’d)
| | | | | | | | | | | | | | | | |
| LIABILITY DERIVATIVES1 | |
| �� | | Interest
Rate Risk | | | Foreign
Exchange Risk | | | Credit
Risk | | | Total | |
| Written options | | $ | 2,741,775 | | | $ | 27,960 | | | | — | | | $ | 2,769,735 | |
| Futures contracts3 | | | 6,449,616 | | | | — | | | | — | | | | 6,449,616 | |
| Forward foreign currency contracts | | | — | | | | 557,764 | | | | — | | | | 557,764 | |
| OTC swap contracts4 | | | — | | | | — | | | $ | 9,949 | | | | 9,949 | |
| Centrally cleared swap contracts5 | | | 2,895,872 | | | | — | | | | 8,699 | | | | 2,904,571 | |
| Total | | $ | 12,087,263 | | | $ | 585,724 | | | $ | 18,648 | | | $ | 12,691,635 | |
| 1 | Generally, the balance sheet location for asset derivatives is receivables/net unrealized appreciation and for liability derivatives is payables/net unrealized depreciation. |
| 2 | Market value of purchased options is reported in Investments at value in the Statement of Assets and Liabilities. |
| 3 | Includes cumulative unrealized appreciation (depreciation) of futures contracts as reported in the Schedule of Investments. Only net variation margin is reported within the receivables and/or payables on the Statement of Assets and Liabilities. |
| 4 | Values include premiums paid (received) on swap contracts which are shown separately in the Statement of Assets and Liabilities. |
| 5 | Includes cumulative unrealized appreciation (depreciation) of centrally cleared swap contracts as reported in the Schedule of Investments. Only net variation margin is reported within the receivables and/or payables on the Statement of Assets and Liabilities. |
The following tables provide information about the effect of derivatives and hedging activities on the Fund’s Statements of Operations for the period ended March 31, 2022. The first table provides additional detail about the amounts and sources of gains (losses) realized on derivatives during the period. The second table provides additional information about the change in unrealized appreciation (depreciation) resulting from the Fund’s derivatives and hedging activities during the period.
| | | | | | | | | | | | | | | | |
| AMOUNT OF REALIZED GAIN (LOSS) ON DERIVATIVES RECOGNIZED | |
| | | Interest
Rate Risk | | | Foreign
Exchange Risk | | | Credit
Risk | | | Total | |
| Purchased options1 | | $ | (557,800) | | | $ | (7,027) | | | | — | | | $ | (564,827) | |
| Futures contracts | | | (2,629,896) | | | | — | | | | — | | | | (2,629,896) | |
| Written options | | | 871,813 | | | | 21,171 | | | | — | | | | 892,984 | |
| Swap contracts | | | 530,540 | | | | — | | | $ | (24,398) | | | | 506,142 | |
| Forward foreign currency contracts | | | — | | | | 307,061 | | | | — | | | | 307,061 | |
| Total | | $ | (1,785,343) | | | $ | 321,205 | | | $ | (24,398) | | | $ | (1,488,536) | |
| 1 | Net realized gain (loss) from purchased options is reported in Net Realized Gain (Loss) From Investment transactions in the Statements of Operations. |
| | | | |
76 | | | | Western Asset Total Return ETF 2022 Annual Report |
| | | | | | | | | | | | | | | | |
| CHANGE IN UNREALIZED APPRECIATION (DEPRECIATION) ON DERIVATIVES RECOGNIZED | |
| | | Interest
Rate Risk | | | Foreign
Exchange Risk | | | Credit
Risk | | | Total | |
| Purchased options1 | | $ | 55,681 | | | $ | (12,860) | | | | — | | | $ | 42,821 | |
| Futures contracts | | | (2,763,986) | | | | — | | | | — | | | | (2,763,986) | |
| Written options | | | (1,583,357) | | | | (37,908) | | | | — | | | | (1,621,265) | |
| Swap contracts | | | (878,452) | | | | — | | | $ | 8,231 | | | | (870,221) | |
| Forward foreign currency contracts | | | — | | | | (239,850) | | | | — | | | | (239,850) | |
| Total | | $ | (5,170,114) | | | $ | (290,618) | | | $ | 8,231 | | | $ | (5,452,501) | |
| 1 | The change in unrealized appreciation (depreciation) from purchased options is reported in the Change in Net Unrealized Appreciation (Depreciation) From Investments in the Statements of Operations. |
The following tables provide information about the effect of derivatives and hedging activities on the Fund’s Statement of Operations for the period ended December 31, 2021. The first table provides additional detail about the amounts and sources of gains (losses) realized on derivatives during the period. The second table provides additional information about the change in unrealized appreciation (depreciation) resulting from the Fund’s derivatives and hedging activities during the period.
| | | | | | | | | | | | | | | | |
| AMOUNT OF REALIZED GAIN (LOSS) ON DERIVATIVES RECOGNIZED | |
| | | Interest
Rate Risk | | | Foreign
Exchange Risk | | | Credit
Risk | | | Total | |
| Purchased options1 | | $ | (2,755,054) | | | $ | (285,173) | | | $ | (99,771) | | | $ | (3,139,998) | |
| Futures contracts | | | (2,573,049) | | | | — | | | | — | | | | (2,573,049) | |
| Written options | | | 3,235,881 | | | | 176,953 | | | | 135,864 | | | | 3,548,698 | |
| Swap contracts | | | 1,112,744 | | | | — | | | | 283,258 | | | | 1,396,002 | |
| Forward foreign currency contracts | | | — | | | | 772,458 | | | | — | | | | 772,458 | |
| Total | | $ | (979,478) | | | $ | 664,238 | | | $ | 319,351 | | | $ | 4,111 | |
| 1 | Net realized gain (loss) from purchased options is reported in Net Realized Gain (Loss) From Investment transactions in the Statement of Operations. |
| | | | | | | | | | | | | | | | |
| CHANGE IN UNREALIZED APPRECIATION (DEPRECIATION) ON DERIVATIVES RECOGNIZED | |
| | | Interest
Rate Risk | | | Foreign
Exchange Risk | | | Credit
Risk | | | Total | |
| Purchased options1 | | $ | (12,667) | | | $ | 10,521 | | | $ | 8,522 | | | $ | 6,376 | |
| Futures contracts | | | (95,538) | | | | — | | | | — | | | | (95,538) | |
| Written options | | | (119,026) | | | | 33,227 | | | | 61,942 | | | | (23,857) | |
| Swap contracts | | | (1,165,368) | | | | — | | | | (282,539) | | | | (1,447,907) | |
| Forward foreign currency contracts | | | — | | | | (463,911) | | | | — | | | | (463,911) | |
| Total | | $ | (1,392,599) | | | $ | (420,163) | | | $ | (212,075) | | | $ | (2,024,837) | |
| 1 | The change in unrealized appreciation (depreciation) from purchased options is reported in the Change in Net Unrealized Appreciation (Depreciation) From Investments in the Statement of Operations. |
| | | | | | |
| Western Asset Total Return ETF 2022 Annual Report | | | | | 77 | |
Notes to financial statements (cont’d)
During the period ended March 31, 2022, the volume of derivative activity for the Fund was as follows:
| | | | |
| | | Average Market
Value | |
| Purchased options | | $ | 652,333 | |
| Written options | | | 1,646,964 | |
| Futures contracts (to buy) | | | 305,760,453 | |
| Futures contracts (to sell) | | | 135,236,362 | |
| Forward foreign currency contracts (to buy) | | | 942,469,681 | |
| Forward foreign currency contracts (to sell) | | | 6,781,039,227 | |
| |
| | | Average Notional
Balance | |
| Interest rate swap contracts | | $ | 75,717,306 | |
| Credit default swap contracts (buy protection) | | | 1,998,961 | |
| Credit default swap contracts (sell protection) | | | 12,535,711 | |
The following table presents the Fund’s OTC derivative assets and liabilities by counterparty net of amounts available for offset under an ISDA Master Agreement and net of the related collateral pledged (received) by the Fund as of March 31, 2022.
| | | | | | | | | | | | | | | | | | |
| Counterparty | | Gross Assets
Subject to
Master
Agreements1 | | | Gross Liabilities
Subject to
Master Agreements1 | | | Net Assets
(Liabilities)
Subject to
Master Agreements | | | Collateral
Pledged (Received)2 | | Net Amount3,4 | |
| Bank of America N.A. | | $ | 729 | | | $ | (27,111) | | | $ | (26,382) | | | — | | $ | (26,382) | |
| BNP Paribas SA | | | 143,310 | | | | (379,327) | | | | (236,017) | | | — | | | (236,017) | |
| Citibank N.A. | | | 165,297 | | | | (733,729) | | | | (568,432) | | | — | | | (568,432) | |
| Goldman Sachs Group Inc. | | | 93,713 | | | | (41,501) | | | | 52,212 | | | — | | | 52,212 | |
| JPMorgan Chase & Co. | | | 75,634 | | | | (40,357) | | | | 35,277 | | | — | | | 35,277 | |
| Morgan Stanley & Co. Inc. | | | 80,073 | | | | (147,874) | | | | (67,801) | | | — | | | (67,801) | |
| Total | | $ | 558,756 | | | $ | (1,369,899) | | | $ | (811,143) | | | — | | $ | (811,143) | |
| 1 | Absent an event of default or early termination, derivative assets and liabilities are presented gross and not offset in the Statement of Assets and Liabilities. |
| 2 | Gross amounts are not offset in the Statement of Assets and Liabilities. |
| 3 | Net amount may also include forward foreign currency exchange contracts that are not required to be collateralized. |
| 4 | Represents the net amount receivable (payable) from (to) the counterparty in the event of default. |
5. Fund share transactions
At March 31, 2022, the Trust had an unlimited number of shares of beneficial interest authorized with a par value of $0.00001 per share. Fund shares are issued and redeemed by the Fund only in Creation Units or Creation Unit aggregations, where 50,000 shares of the Fund constitute a Creation Unit. Such transactions are generally on a cash basis. However, Creation Units may also be issued and redeemed partially in-kind for a basket of securities and partially in cash. Transactions in capital shares of the Fund are disclosed in detail in the
| | | | |
78 | | | | Western Asset Total Return ETF 2022 Annual Report |
Statement of Changes in Net Assets. Authorized Participants are subject to standard creation and redemption transaction fees to offset transfer and other transaction costs associated with the issuance and redemption of Creation Units. Creations and redemptions for cash (when cash creations and redemptions are available or specified) may be subject to an additional variable fee.
6. Redemption facility
On February 4, 2022, the Fund, together with other U.S. registered and foreign investment funds (collectively, the “Borrowers”) managed by Franklin Resources or its affiliates, became a borrower in a joint syndicated senior unsecured credit facility totaling $2.675 billion (the “Global Credit Facility”). The Global Credit Facility provides a source of funds to the Borrowers for temporary and emergency purposes, including the ability to meet future unanticipated or unusually large redemption requests. Unless renewed, the Global Credit Facility will terminate on February 3, 2023.
Under the terms of the Global Credit Facility, the Fund shall, in addition to interest charged on any borrowings made by the Fund and other costs incurred by the Fund, pay its share of fees and expenses incurred in connection with the implementation and maintenance of the Global Credit Facility, based upon its relative share of the aggregate net assets of all the Borrowers, including an annual commitment fee of 0.15% based upon the unused portion of the Global Credit Facility. These fees are reflected in the Statement of Operations. The Fund did not utilize the Global Credit Facility during the year ended March 31, 2022.
7. Income tax information and distributions to shareholders
The tax character of distributions paid during the fiscal period ended March 31 and fiscal years ended December 31, 2021 and 2020, was as follows:
| | | | | | | | | | | | |
| | | 2022 | | | 2021 | | | 2020 | |
| Distributions paid from: | | | | | | | | | | | | |
| Ordinary income | | $ | 627,413 | | | $ | 4,700,119 | | | $ | 4,753,191 | |
| Net long-term capital gains | | | — | | | | 651,092 | | | | 1,940,485 | |
| Total distributions paid | | $ | 627,413 | | | $ | 5,351,211 | | | $ | 6,693,676 | |
As of March 31, 2022, the components of distributable earnings (loss) on a tax basis were as follows:
| | | | | | | | |
| Undistributed ordinary income — net | | | $ 203,692 | |
| Deferred capital losses* | | | (9,333,578) | |
| Other book/tax temporary differences(a) | | | 4,316,444 | |
| Unrealized appreciation (depreciation)(b) | | | (14,936,954) | |
| Total distributable earnings (loss) — net | | | $(19,750,396) | |
| | | | | | |
| Western Asset Total Return ETF 2022 Annual Report | | | | | 79 | |
Notes to financial statements (cont’d)
| * | These capital losses have been deferred in the current year as either short-term or long-term losses. The losses will be deemed to occur on the first day of the next taxable year in the same character as they were originally deferred and will be available to offset future taxable capital gains. |
| (a) | Other book/tax temporary differences are attributable to the tax deferral of losses on straddles and the realization for tax purposes of unrealized gains (losses) on certain futures, options and foreign currency contracts. |
| (b) | The difference between book-basis and tax-basis unrealized appreciation (depreciation) is attributable to the tax deferral of losses on wash sales and other book/tax basis adjustments. |
8. Concentration of risk
Russia’s military invasion of Ukraine in February 2022, the resulting responses by the United States and other countries, and the potential for wider conflict could increase volatility and uncertainty in the financial markets and adversely affect regional and global economies. The United States and other countries have imposed broad-ranging economic sanctions on Russia and certain Russian individuals, banking entities and corporations as a response to its invasion of Ukraine. The United States and other countries have also imposed economic sanctions on Belarus and may impose sanctions on other countries that support Russia’s military invasion. These sanctions, as well as any other economic consequences related to the invasion, such as additional sanctions, boycotts or changes in consumer or purchaser preferences or cyberattacks on governments, companies or individuals, may further decrease the value and liquidity of certain Russian securities and securities of issuers in other countries that are subject to economic sanctions related to the invasion. To the extent that the Fund has exposure to Russian investments or investments in countries affected by the invasion, the Fund’s ability to price, buy, sell, receive or deliver such investments was impaired. The Fund could determine at any time that certain of the most affected securities have little or no value. In addition, any exposure that the Fund may have to counterparties in Russia or in countries affected by the invasion could negatively impact the Fund’s portfolio. The extent and duration of Russia’s military actions and the repercussions of such actions (including any retaliatory actions or countermeasures that may be taken by those subject to sanctions) are impossible to predict, but could result in significant market disruptions, including in the oil and natural gas markets, and may negatively affect global supply chains, inflation and global growth. These and any related events could significantly impact the Fund’s performance and the value of an investment in the Fund, even beyond any direct exposure the Fund may have to Russian issuers or issuers in other countries affected by the invasion. At March 31, 2022, the Western Asset Total Return ETF had 0.06% of its net assets invested in securities with significant economic risk or exposure to Russia.
9. Recent accounting pronouncement
In March 2020, the Financial Accounting Standards Board (FASB) issued Accounting Standards Update (ASU) No. 2020-04, Reference Rate Reform (Topic 848) – Facilitation of the Effects of Reference Rate Reform on Financial Reporting. In January 2021, the FASB issued ASU No. 2021-01, with further amendments to Topic 848. The amendments in the
| | | | |
80 | | | | Western Asset Total Return ETF 2022 Annual Report |
ASUs provide optional temporary accounting recognition and financial reporting relief from the effect of certain types of contract modifications due to the planned discontinuation of the LIBOR and other interbank-offered based reference rates as of the end of 2021 and 2023. The ASUs are effective for certain reference rate-related contract modifications that occur during the period March 12, 2020 through December 31, 2022. Management has reviewed the requirements and believes the adoption of these ASUs will not have a material impact on the financial statements.
10. Other matters
The outbreak of the respiratory illness COVID-19 (commonly referred to as “coronavirus”) has continued to rapidly spread around the world, causing considerable uncertainty for the global economy and financial markets. The ultimate economic fallout from the pandemic, and the long-term impact on economies, markets, industries and individual issuers, are not known. The COVID-19 pandemic could adversely affect the value and liquidity of the Fund’s investments, impair the Fund’s ability to satisfy redemption requests, and negatively impact the Fund’s performance. In addition, the outbreak of COVID-19, and measures taken to mitigate its effects, could result in disruptions to the services provided to the Fund by its service providers.
* * *
The Fund’s investments, payment obligations, and financing terms may be based on floating rates, such as the London Interbank Offered Rate, or “LIBOR,” which is the offered rate for short-term Eurodollar deposits between major international banks. On March 5, 2021, the ICE Benchmark Administration, the administrator of LIBOR, stated that it will cease the publication of the overnight and one-, three-, six- and twelve-month USD LIBOR settings immediately following the LIBOR publication on Friday, June 30, 2023. All other LIBOR settings, including the one-week and two-month USD LIBOR settings, have ceased publication as of January 1, 2022. There remains uncertainty regarding the nature of any replacement rate and the impact of the transition from LIBOR on the Fund’s transactions and the financial markets generally. As such, the potential effect of a transition away from LIBOR on the Fund or the Fund’s investments cannot yet be determined.
| | | | | | |
| Western Asset Total Return ETF 2022 Annual Report | | | | | 81 | |
Report of independent registered public accounting firm
To the Board of Trustees of Legg Mason ETF Investment Trust and Shareholders of Western Asset Total Return ETF
Opinion on the Financial Statements
We have audited the accompanying statement of assets and liabilities, including the schedule of investments, of Western Asset Total Return ETF (one of the funds constituting Legg Mason ETF Investment Trust, referred to hereafter as the “Fund”) as of March 31, 2022, the related statement of operations for the period January 1, 2022 through March 31, 2022 and the year ended December 31, 2021, the statement of changes in net assets for the period January 1, 2022 through March 31, 2022 and each of the two years in the period ended December 31, 2021, including the related notes, and the financial highlights for the period January 1, 2022 through March 31, 2022, each of the three years in the period ended December 31, 2021 and the period October 3, 2018 (inception date) to December 31, 2018 (collectively referred to as the “financial statements”). In our opinion, the financial statements present fairly, in all material respects, the financial position of the Fund as of March 31, 2022, the results of its operations for the period January 1, 2022 through March 31, 2022 and the year ended December 31, 2021, the changes in its net assets for the period January 1, 2022 through March 31, 2022 and each of the two years in the period ended December 31, 2021, and the financial highlights for the period January 1, 2022 through March 31, 2022, each of the three years in the period ended December 31, 2021 and the period October 3, 2018 (inception date) to December 31, 2018 in conformity with accounting principles generally accepted in the United States of America.
Basis for Opinion
These financial statements are the responsibility of the Fund’s management. Our responsibility is to express an opinion on the Fund’s financial statements based on our audits. We are a public accounting firm registered with the Public Company Accounting Oversight Board (United States) (PCAOB) and are required to be independent with respect to the Fund in accordance with the U.S. federal securities laws and the applicable rules and regulations of the Securities and Exchange Commission and the PCAOB.
We conducted our audits of these financial statements in accordance with the standards of the PCAOB. Those standards require that we plan and perform the audit to obtain reasonable assurance about whether the financial statements are free of material misstatement, whether due to error or fraud.
Our audits included performing procedures to assess the risks of material misstatement of the financial statements, whether due to error or fraud, and performing procedures that respond to those risks. Such procedures included examining, on a test basis, evidence regarding the amounts and disclosures in the financial statements. Our audits also included evaluating the accounting principles used and significant estimates made by management, as well as evaluating the overall presentation of the financial statements. Our procedures included confirmation of securities owned as of March 31, 2022 by correspondence with the custodian and brokers; when replies were not received from brokers, we performed other auditing procedures. We believe that our audits provide a reasonable basis for our opinion.
PricewaterhouseCoopers LLP
San Francisco, California
May 19, 2022
We have served as the auditor of one or more investment companies in the Franklin Templeton Group of Funds since 1948.
| | | | |
82 | | | | Western Asset Total Return ETF 2022 Annual Report |
Statement regarding liquidity risk management program (unaudited)
Each of the Funds has adopted and implemented a written Liquidity Risk Management Program (the “LRMP”) as required by Rule 22e-4 under the Investment Company Act of 1940 (the “Liquidity Rule”). The LRMP is designed to assess and manage each Fund’s liquidity risk, which is defined as the risk that the Fund could not meet requests to redeem shares issued by the Fund without significant dilution of remaining investors’ interests in the Fund. Each of the Funds is an exchange-traded fund (“ETF”) that is considered an “In-Kind ETF” under the Liquidity Rule, which means that the Fund satisfies requests for redemption through in-kind transfers of portfolio securities, positions, and other assets, except for a de minimis amount of cash, and publishes its portfolio holdings daily. In accordance with the Liquidity Rule, the LRMP includes policies and procedures that provide for: (1) assessment, management, and review (no less frequently than annually) of each Fund’s liquidity risk; (2) prohibiting the Fund’s acquisition of Illiquid investments that would result in the Fund holding more than 15% of its net assets in Illiquid assets. The LRMP also requires reporting to the SEC (on a non-public basis) and to the Board if the Fund’s holdings of Illiquid assets exceed 15% of the Fund’s net assets. As an In-Kind ETF, the Fund is not required to include in the LRMP policies and procedures relating to classification of portfolio holdings into four liquidity categories or establishing a highly liquid investment minimum (“HLIM”).
The Funds’ Board of Trustees approved the appointment of the Director of Liquidity Risk within the Investment Risk Management Group (the “IRMG”) as the Administrator of the LRMP. The IRMG maintains the Investment Liquidity Committee (the “ILC”) to provide oversight and administration of policies and procedures governing liquidity risk management for FT products and portfolios. The ILC includes representatives from Franklin Templeton’s Risk, Trading, Global Compliance, Legal, Investment Compliance, Investment Operations, Valuation Committee, Product Management and Global Product Strategy.
In assessing and managing each Fund’s liquidity risk, the ILC considers, as relevant, a variety of factors, including the Fund’s investment strategy and the liquidity of its portfolio investments during both normal and reasonably foreseeable stressed conditions; its short and long-term cash flow projections; and its cash holdings and access to other funding sources including the Funds’ interfund lending facility and line of credit. Because the Funds are ETFs, the ILC also considers, as relevant, (1) the relationship between the Fund’s portfolio liquidity and the way in which, and the prices and spread at which, Fund shares trade, including the efficiency of the arbitrage function and the level of active participation by market participants, including authorized participants and (2) the effect of the composition of baskets on the overall liquidity of the Fund’s portfolio.
| | | | | | |
| Western Asset Total Return ETF | | | | | 83 | |
Additional information (unaudited)
Information about Trustees and Officers
The business and affairs of Western Asset Total Return ETF (the “Fund”) are conducted by management under the supervision and subject to the direction of its Board of Trustees. The business address of each Trustee is One Franklin Parkway, San Mateo, California 94403-1906. Information pertaining to the Trustees and officers of the Fund is set forth below.
The Statement of Additional Information includes additional information about Trustees and is available, without charge, upon request by calling the Fund at 1-877-721-1926.
| | |
| Independent Trustees† | | |
| |
| Rohit Bhagat | | |
| |
| Year of birth | | 1964 |
| Position(s) with Trust | | Lead Independent Trustee |
| Term of office1 and length of time served2 | | Since July 2021 |
| Principal occupation(s) during the past five years | | Managing Member, Mukt Capital, LLC (private investment firm) (2014-present); Advisor, Optimal Asset Management (investment technology and advisory services company) (2015- present); and formerly, Chairman, Asia Pacific, BlackRock (2009- 2012); Global Chief Operating Officer, Barclays Global Investors (investment management) (2005-2009); and Senior Partner, The Boston Consulting Group (management consulting) (1992-2005) |
| Number of funds in fund complex overseen by Trustee | | 58 |
| Other Directorships held by Trustee during the past five years | | AssetMark Financial Holdings, Inc. (investment solutions) (2018- present) and PhonePe (payment and financial services) (2020- present); and formerly, Axis Bank (financial) (2013-2021), FlipKart Limited (eCommerce company) (2019-2020), CapFloat Financial Services Pvt., Ltd. (non-banking finance company) (2018) and Zentific Investment Management (hedge fund) (2015-2018) |
| |
| Deborah D. McWhinney | | |
| Year of birth | | 1955 |
| Position(s) with Trust | | Trustee |
| Term of office1 and length of time served2 | | Since July 2021 |
| Principal occupation(s) during the past five years | | Director of various companies; and formerly, Board Member, Lloyds Banking Group (2015-2018) (financial institution) and Fresenius Medical Group (2016-2018) (healthcare); Chief Executive Officer (2013-2014) and Chief Operating Officer (2011- 2013), CitiGroup Global Enterprise Payments (financial services); and President, Citi’s Personal Banking and Wealth Management (2009-2011) |
| Number of funds in fund complex overseen by Trustee | | 58 |
| Other Directorships held by Trustee during the past five years | | IHS Markit (information services) (2015-present), Borg Warner (automotive) (2018-present) and LegalShield (consumer services) (2020-present); and formerly, Fluor Corporation (construction and engineering) (2014-2020) and Focus Financial Partners, LLC (financial services) (2018-2020) |
| | | | |
84 | | | | Western Asset Total Return ETF |
| | |
| Independent Trustees† (cont’d) | | |
| |
| Anantha K. Pradeep | | |
| |
| Year of birth | | 1963 |
| Position(s) with Trust | | Trustee |
| Term of office1 and length of time served2 | | Since July 2021 |
| Principal occupation(s) during the past five years | | Chief Executive Officer, Smilable, Inc. (technology company) (2014-present); Chief Executive Officer, MachineVantage (technology company) (2018-present); Founder and Managing Partner, Consult Meridian, LLC (consulting company) (2009- present); and formerly, Founder, BoardVantage (board portal solutions provider delivering paperless process for boards and leadership) (2000-2002) |
| Number of funds in fund complex overseen by Trustee | | 58 |
| Other Directorships held by Trustee during the past five years | | None |
| | |
| Interested Trustee and Officer | | |
| |
| Jennifer M. Johnson3 | | |
| |
| Year of birth | | 1964 |
| Position(s) with Trust | | Trustee and Chairperson of the Board |
| Term of office1 and length of time served2 | | Since July 2021 |
| Principal occupation(s) during the past five years | | Chief Executive Officer, President and Director, Franklin Resources, Inc.; officer and/or director or trustee, as the case may be, of some of the other subsidiaries of Franklin Resources, Inc. and of eight of the investment companies in Franklin Templeton; and formerly, Chief Operating Officer and Executive Vice President, Franklin Resources, Inc. (1994-2015); Executive Vice President of Operations and Technology, Franklin Resources, Inc. (2005-2010); and Senior Vice President, Franklin Resources, Inc. (2003-2005) |
| Number of funds in fund complex overseen by Trustee | | 69 |
| Other Directorships held by Trustee during the past five years | | None |
| | |
| Additional Officers | | |
| |
| Alison E. Baur | | |
Franklin Templeton One Franklin Parkway, San Mateo, CA 94403-1906 Year of birth | | 1964 |
| |
| Position(s) with Trust | | Vice President |
| |
| Term of office1 and length of time served2 | | Since July 2021 |
| |
| Principal occupation(s) during the past five years | | Deputy General Counsel, Franklin Templeton; and officer of some of the other subsidiaries of Franklin Resources, Inc. and of 43 of the investment companies in Franklin Templeton |
| | | | | | |
| Western Asset Total Return ETF | | | | | 85 | |
Additional information (unaudited) (cont’d)
Information about Trustees and Officers
| | |
| Additional Officers (cont’d) | | |
| |
| Fred Jensen | | |
Franklin Templeton 620 Eighth Avenue, 47th Floor, New York, NY 10018 Year of birth | | 1963 |
| |
| Position(s) with Trust | | Chief Compliance Officer |
| |
| Term of office1 and length of time served2 | | Since July 2021 |
| |
| Principal occupation(s) during the past five years | | Director - Global Compliance of Franklin Templeton (since 2020); Managing Director of Legg Mason & Co. (2006 to 2020); Director of Compliance, Legg Mason Office of the Chief Compliance Officer (2006 to 2020); formerly, Chief Compliance Officer of Legg Mason Global Asset Allocation (prior to 2014); Chief Compliance Officer of Legg Mason Private Portfolio Group (prior to 2013); formerly, Chief Compliance Officer of The Reserve Funds (investment adviser, funds and broker-dealer) (2004) and Ambac Financial Group (investment adviser, funds and broker-dealer) (2000 to 2003) |
| |
| Harris Goldblat | | |
Franklin Templeton 100 First Stamford Place, 6th Floor, Stamford, CT 06902 Year of birth | | 1969 |
| |
| Position(s) with Trust | | Vice President and Assistant Secretary |
| |
| Term of office1 and length of time served2 | | Since July 2021 |
| |
| Principal occupation(s) during the past five years | | Associate General Counsel to Franklin Templeton (since 2020); Assistant Secretary of certain funds associated with Legg Mason & Co. or its affiliates (since 2006); formerly, Managing Director and Associate General Counsel of Legg Mason & Co. (2005 to 2020) |
| |
| Steven J. Gray | | |
Franklin Templeton One Franklin Parkway, San Mateo, CA 94403-1906 Year of birth | | 1955 |
| Position(s) with Trust | | Vice President |
| Term of office1 and length of time served2 | | Since July 2021 |
| Principal occupation(s) during the past five years | | Senior Associate General Counsel, Franklin Templeton; Vice President, Franklin Templeton Distributors, Inc. and FASA, LLC; and officer of 43 of the investment companies in Franklin Templeton |
| | | | |
86 | | | | Western Asset Total Return ETF |
| | |
| Additional Officers (cont’d) | | |
| |
| Matthew T. Hinkle | | |
Franklin Templeton One Franklin Parkway, San Mateo, CA 94403-1906 Year of birth | | 1971 |
| Position(s) with Trust | | Chief Executive Officer – Finance and Administration |
| Term of office1 and length of time served2 | | Since July 2021 |
| Principal occupation(s) during the past five years | | Senior Vice President, Franklin Templeton Services, LLC; officer of 43 of the investment companies in Franklin Templeton; and formerly, Vice President, Global Tax (2012-April 2017) and Treasurer/Assistant Treasurer, Franklin Templeton (2009-2017) |
| |
| Susan Kerr | | |
Franklin Templeton 620 Eighth Avenue, 47th Floor, New York, NY 10018 Year of birth | | 1949 |
| Position(s) with Trust | | Vice President – AML Compliance |
| Term of office1 and length of time served2 | | Since July 2021 |
| Principal occupation(s) during the past five years | | Senior Compliance Analyst, Franklin Templeton (since 2020); Chief Anti-Money Laundering Compliance Officer of certain funds associated with Legg Mason & Co. or its affiliates (since 2013) and Anti-Money Laundering Compliance Officer (since 2012), Senior Compliance Officer (since 2011) and Assistant Vice President (since 2010) of Franklin Distributors, LLC; formerly, Assistant Vice President of Legg Mason & Co. (2010 to 2020) |
| |
| Thomas C. Mandia | | |
Franklin Templeton 100 First Stamford Place, 6th Floor, Stamford, CT 06902 Year of birth | | 1962 |
| Position(s) with Trust | | Vice President and Assistant Secretary |
| Term of office1 and length of time served2 | | Since July 2021 |
| Principal occupation(s) during the past five years | | Senior Associate General Counsel to Franklin Templeton (since 2020); Secretary of LMPFA (since 2006); Assistant Secretary of certain funds associated with Legg Mason & Co. or its affiliates (since 2006); Secretary of LMAS (since 2002) and LMFAM (formerly registered investment advisers) (since 2013); formerly, Managing Director and Deputy General Counsel of Legg Mason & Co. (2005 to 2020) |
| | | | | | |
| Western Asset Total Return ETF | | | | | 87 | |
Additional information (unaudited) (cont’d)
Information about Trustees and Officers
| | |
| Additional Officers (cont’d) | | |
| |
| Patrick O’Connor | | |
Franklin Templeton One Franklin Parkway, San Mateo, CA 94403-1906 Year of birth | | 1967 |
| Position(s) with Trust | | President and Chief Executive Officer – Investment Management |
| Term of office1 and length of time served2 | | Since July 2021 |
| Principal occupation(s) during the past five years | | President and Chief Investment Officer, Franklin Advisory Services, LLC; Senior Vice President, Franklin Advisers, Inc.; officer of five of the investment companies in Franklin Templeton; and formerly, Managing Director, Head of iShares Product Canada, BlackRock (1998-2014) |
| |
| Vivek Pai | | |
Franklin Templeton 300 S.E. 2nd Street, Fort Lauderdale, FL 33301-1923 Year of birth | | 1970 |
| Position(s) with Trust | | Treasurer, Chief Financial Officer and Chief Accounting Officer |
| Term of office1 and length of time served2 | | Since July 2021 |
| Principal occupation(s) during the past five years | | Treasurer, U.S. Fund Administration & Reporting and officer of five of the investment companies in Franklin Templeton |
| |
| Navid J. Tofigh | | |
Franklin Templeton One Franklin Parkway, San Mateo, CA 94403-1906 Year of birth | | 1972 |
| Position(s) with Trust | | Vice President and Secretary |
| Term of office1 and length of time served2 | | Since July 2021 |
| Principal occupation(s) during the past five years | | Associate General Counsel and officer of 43 of the investment companies in Franklin Templeton |
| |
| Craig S. Tyle | | |
Franklin Templeton One Franklin Parkway, San Mateo, CA 94403-1906 Year of birth | | 1960 |
| Position(s) with Trust | | Vice President |
| Term of office1 and length of time served2 | | Since July 2021 |
| Principal occupation(s) during the past five years | | General Counsel and Executive Vice President, Franklin Resources, Inc.; and officer of some of the other subsidiaries of Franklin Resources, Inc. and of 43 of the investment companies in Franklin Templeton |
| | | | |
88 | | | | Western Asset Total Return ETF |
| | |
| Additional Officers (cont’d) | | |
| |
| Lori A. Weber | | |
Franklin Templeton 300 S.E. 2nd Street, Fort Lauderdale, FL 33301-1923 Year of birth | | 1964 |
| Position(s) with Trust | | Vice President |
| Term of office1 and length of time served2 | | Since July 2021 |
| Principal occupation(s) during the past five years | | Senior Associate General Counsel, Franklin Templeton; Assistant Secretary, Franklin Resources, Inc.; Vice President and Secretary, Templeton Investment Counsel, LLC; and officer of 43 of the investment companies in Franklin Templeton |
| † | Trustees who are not “interested persons” of the Fund within the meaning of Section 2(a)(19) of the Investment Company Act of 1940, as amended (the “1940 Act”). |
| 1 | Each Trustee and officer serves until his or her respective successor has been duly elected and qualified or until his or her earlier death, resignation, retirement or removal. |
| 2 | Indicates the earliest year in which the Trustee became a board member for a fund in the Legg Mason fund complex or the officer took such office. |
| 3 | Ms. Johnson is an “interested person” of the Fund, as defined in the 1940 Act, because of her position with LMPFA and/or certain of its affiliates. |
| | | | | | |
| Western Asset Total Return ETF | | | | | 89 | |
Important tax information (unaudited)
By mid-February, tax information related to a shareholder’s proportionate share of distributions paid during the preceding calendar year will be received, if applicable. Please also refer to www.franklintempleton.com for per share tax information related to any distributions paid during the preceding calendar year. Shareholders are advised to consult with their tax advisors for further information on the treatment of these amounts on their tax returns.
The following tax information for the Fund is required to be furnished to shareholders with respect to income earned and distributions paid during its fiscal year.
The Fund hereby reports the following amounts, or if subsequently determined to be different, the maximum allowable amounts, for the fiscal period ended March 31, 2022:
| | | | | | | | |
| | | Pursuant to: | | | Amount Reported | |
| Qualified Net Interest Income (QII) | | | §871(k)(1)(C) | | | | $47,127 | |
| Section 163(j) Interest Earned | | | §163(j) | | | | $796,075 | |
| Interest Earned from Federal Obligations | | | Note (1) | | | | $54,068 | |
Note (1) - The Law varies in each state as to whether and what percentage of dividend income attributable to Federal obligations is exempt from state income tax. Shareholders are advised to consult with their tax advisors to determine if any portion of the dividends received is exempt from state income taxes.
| | | | |
90 | | | | Western Asset Total Return ETF |
Western
Asset Total Return ETF
Trustees
Rohit Bhagat
Deborah D. McWhinney
Anantha K. Pradeep
Jennifer M. Johnson
Chair
Investment manager
Legg Mason Partners Fund Advisor, LLC
Subadviser
Western Asset Management Company, LLC
Western Asset Management Company Limited
Western Asset Management Company Ltd
Western Asset Management Company Pte. Ltd.
Custodian
The Bank of New York Mellon
Transfer agent
The Bank of New York Mellon
240 Greenwich Street
New York, NY 10286
Independent registered public accounting firm
PricewaterhouseCoopers LLP
Baltimore, MD
Western Asset Total Return ETF
The Fund is a separate investment series of Legg Mason ETF Investment Trust, a Maryland statutory trust.
Western Asset Total Return ETF
Legg Mason Funds
620 Eighth Avenue, 47th Floor
New York, NY 10018
The Fund files its complete schedule of portfolio holdings with the Securities and Exchange Commission (“SEC”) for the first and third quarters of each fiscal year as an exhibit to its reports on Form N-PORT. The Fund’s Forms N-PORT are available on the SEC’s website at www.sec.gov.To obtain information on Form N-PORT, shareholders can call the Fund at 1-877-721-1926.
Information on how the Fund voted proxies relating to portfolio securities during the prior 12-month period ended June 30th of each year and a description of the policies and procedures that the Fund uses to determine how to vote proxies related to portfolio transactions are available (1) without charge, upon request, by calling the Fund at 1-877-721-1926, (2) at www.franklintempleton.com and (3) on the SEC’s website at www.sec.gov.
This report is submitted for the general information of the shareholders of Western Asset Total Return ETF. This report is not authorized for distribution to prospective investors in the Fund unless preceded or accompanied by a current prospectus.
Investors should consider the Fund’s investment objectives, risks, charges and expenses carefully before investing. The prospectus contains this and other important information about the Fund. Please read the prospectus carefully before investing.
www.franklintempleton.com
© 2022 Franklin Distributors, LLC, Member FINRA/SIPC. All rights reserved.
www.franklintempleton.com
© 2022 Franklin Distributors, LLC, Member FINRA/SIPC. All rights reserved.
ETFF483609 5/22 SR22-4410
The registrant has adopted a code of ethics that applies to the registrant’s principal executive officer, principal financial officer, principal accounting officer or controller.
| ITEM 3. | AUDIT COMMITTEE FINANCIAL EXPERT. |
The Board of Trustees of the registrant has determined that Rohit Bhagat possesses the technical attributes identified in Instruction 2(b) of Item 3 to Form N-CSR to qualify as an “audit committee financial expert,” and has designated Rohit Bhagat as the Audit Committee’s financial expert. Rohit Bhagat is an “independent” Trustees pursuant to paragraph (a)(2) of Item 3 to Form N-CSR.
| ITEM 4. | PRINCIPAL ACCOUNTANT FEES AND SERVICES. |
a) Audit Fees. The aggregate fees billed in the previous fiscal year and the current fiscal year March 31, 2022 (the “Reporting Periods”) for professional services rendered by the Registrant’s principal accountant (the “Auditor”) for the audit of the Registrant’s annual financial statements, or services that are normally provided by the Auditor in connection with the statutory and regulatory filings or engagements for the Reporting Periods, were $203,200 in the previous fiscal year and $146,240 in March 31, 2022.
b) Audit-Related Fees. The aggregate fees billed in the Reporting Period for assurance and related services by the Auditor that are reasonably related to the performance of the Registrant’s financial statements were $0 in the previous fiscal year and $0 in March 31, 2022.
(c) Tax Fees. The aggregate fees billed in the Reporting Periods for professional services rendered by the Auditor for tax compliance, tax advice and tax planning (“Tax Services”) were $71,000 in the previous fiscal year and $82,000 in March 31, 2022. These services consisted of (i) review or preparation of U.S. federal, state, local and excise tax returns; (ii) U.S. federal, state and local tax planning, advice and assistance regarding statutory, regulatory or administrative developments, and (iii) tax advice regarding tax qualification matters and/or treatment of various financial instruments held or proposed to be acquired or held.
There were no fees billed for tax services by the Auditors to service affiliates during the Reporting Periods that required pre-approval by the Audit Committee.
d) All Other Fees.
The aggregate fees billed in the Reporting Periods for products and services provided by the Auditor, other than the services reported in paragraphs (a) through (c) for the Item 4 for the Legg Mason ETF Investment Trust, were $0 in the previous fiscal year and $0 in March 31, 2022.
All Other Fees. There were no other non-audit services rendered by the Auditor to Legg Mason Partners Fund Advisors, LLC (“LMPFA”), and any entity controlling, controlled by or under common control with LMPFA that provided ongoing services to Legg Mason ETF Investment Trust requiring pre-approval by the Audit Committee in the Reporting Period.
(e) Audit Committee’s pre–approval policies and procedures described in paragraph (c) (7) of Rule 2-01 of Regulation S-X.
(1) The Charter for the Audit Committee (the “Committee”) of the Board of each registered investment company (the “Fund”) advised by LMPFA or one of their affiliates (each, an “Adviser”) requires that the Committee shall approve (a) all audit and permissible non-audit services to be provided to the Fund and (b) all permissible non-audit services to be provided by the Fund’s independent auditors to the Adviser and any Covered Service Providers if the engagement relates directly to the operations and financial reporting of the Fund. The Committee may implement policies and procedures by which such services are approved other than by the full Committee.
The Committee shall not approve non-audit services that the Committee believes may impair the independence of the auditors. As of the date of the approval of this Audit Committee Charter, permissible non-audit services include any professional services (including tax services), that are not prohibited services as described below, provided to the Fund by the independent auditors, other than those provided to the Fund in connection with an audit or a review of the financial statements of the Fund. Permissible non-audit services may not include: (i) bookkeeping or other services related to the accounting records or financial statements of the Fund; (ii) financial information systems design and implementation; (iii) appraisal or valuation services, fairness opinions or contribution-in-kind reports; (iv) actuarial services; (v) internal audit outsourcing services; (vi) management functions or human resources; (vii) broker or dealer, investment adviser or investment banking services; (viii) legal services and expert services unrelated to the audit; and (ix) any other service the Public Company Accounting Oversight Board determines, by regulation, is impermissible.
Pre-approval by the Committee of any permissible non-audit services is not required so long as: (i) the aggregate amount of all such permissible non-audit services provided to the Fund, the Adviser and any service providers controlling, controlled by or under common control with the Adviser that provide ongoing services to the Fund (“Covered Service Providers”) constitutes not more than 5% of the total amount of revenues paid to the independent auditors during the fiscal year in which the permissible non-audit services are provided to (a) the Fund, (b) the Adviser and (c) any entity controlling, controlled by or under common control with the Adviser that provides ongoing services to the Fund during the fiscal year in which the services are provided that would have to be approved by the Committee; (ii) the permissible non-audit services were not recognized by the Fund at the time of the engagement to be non-audit services; and (iii) such services are promptly brought to the attention of the Committee and approved by the Committee (or its delegate(s)) prior to the completion of the audit.
(2) For the Legg Mason ETF Investment Trust, the percentage of fees that were approved by the audit committee, with respect to: Audit-Related Fees were 100% and 100% for the previous fiscal year and March 31, 2022; Tax Fees were 100% and 100% for the previous fiscal year and March 31, 2022; and Other Fees were 100% and 100% for the previous fiscal year and March 31, 2022.
(f) N/A
(g) Non-audit fees billed by the Auditor for services rendered to Legg Mason ETF Investment Trust, LMPFA and any entity controlling, controlled by, or under common control with LMPFA that provides ongoing services to Legg Mason ETF Investment Trust during the reporting period were $3,664,300 in the previous fiscal year and $1,558,348 in March 31, 2022.
(h) Yes. Legg Mason ETF Investment Trust’s Audit Committee has considered whether the provision of non-audit services that were rendered to Service Affiliates, which were not pre-approved (not requiring pre-approval), is compatible with maintaining the Accountant’s independence. All services provided by the Auditor to the Legg Mason ETF Investment Trust or to Service Affiliates, which were required to be pre-approved, were pre-approved as required.
| ITEM 5. | AUDIT COMMITTEE OF LISTED REGISTRANTS. |
| | a) | The independent board members are acting as the registrant’s audit committee as specified in Section 3(a)(58)(B) of the Exchange Act. The Audit Committee consists of the following Board members: |
Rohit Bhagat
Deborah D. McWhinney
Anantha K. Pradeep
Jennifer M. Johnson
| ITEM 6. | SCHEDULE OF INVESTMENTS. |
Included herein under Item 1.
| ITEM 7. | DISCLOSURE OF PROXY VOTING POLICIES AND PROCEDURES FOR CLOSED-END MANAGEMENT INVESTMENT COMPANIES. |
Not applicable.
| ITEM 8. | PORTFOLIO MANAGERS OF CLOSED-END MANAGEMENT INVESTMENT COMPANIES. |
Not applicable.
| ITEM 9. | PURCHASES OF EQUITY SECURITIES BY CLOSED-END MANAGEMENT INVESTMENT COMPANY AND AFFILIATED PURCHASERS. |
Not applicable.
| ITEM 10. | SUBMISSION OF MATTERS TO A VOTE OF SECURITY HOLDERS. |
Not applicable.
| ITEM 11. | CONTROLS AND PROCEDURES. |
| | (a) | The registrant’s principal executive officer and principal financial officer have concluded that the registrant’s disclosure controls and procedures (as defined in Rule 30a- 3(c) under the Investment Company Act of 1940, as amended (the “1940 Act”)) are effective as of a date within 90 days of the filing date of this report that includes the disclosure required by this paragraph, based on their evaluation of the disclosure controls and procedures required by Rule 30a-3(b) under the 1940 Act and 15d-15(b) under the Securities Exchange Act of 1934. |
| | (b) | There were no changes in the registrant’s internal control over financial reporting (as defined in Rule 30a-3(d) under the 1940 Act) that occurred during the second fiscal quarter of the period covered by this report that have materially affected, or are likely to materially affect the registrant’s internal control over financial reporting. |
| ITEM 12. | DISCLOSURE OF SECURITIES LENDING ACTIVITIES FOR CLOSED-END MANAGEMENT INVESTMENT COMPANIES. |
Not applicable.
(a) (1) Code of Ethics attached hereto.
Exhibit 99.CODE ETH
(a) (2) Certifications pursuant to section 302 of the Sarbanes-Oxley Act of 2002 attached hereto.
Exhibit 99.CERT
(b) Certifications pursuant to Section 906 of the Sarbanes-Oxley Act of 2002 attached hereto.
Exhibit 99.906CERT
SIGNATURES
Pursuant to the requirements of the Securities Exchange Act of 1934 and the Investment Company Act of 1940, the registrant has duly caused this Report to be signed on its behalf by the undersigned, there unto duly authorized.
Legg Mason ETF Investment Trust
| | |
| By: | | /s/ Matthew T. Hinkle |
| | Matthew T. Hinkle |
| | Chief Executive Officer |
| |
| Date: | | May 25, 2022 |
Pursuant to the requirements of the Securities Exchange Act of 1934 and the Investment Company Act of 1940, this report has been signed below by the following persons on behalf of the registrant and in the capacities and on the dates indicated.
| | |
| By: | | /s/ Matthew T. Hinkle |
| | Matthew T. Hinkle |
| | Chief Executive Officer |
| |
| Date: | | May 25, 2022 |
| |
| By: | | /s/ Vivek Pai |
| | Vivek Pai |
| | Principal Financial Officer |
| |
| Date: | | May 25, 2022 |