UNITED STATES
SECURITIES AND EXCHANGE COMMISSION
Washington, D.C. 20549
FORM N-CSR
CERTIFIED SHAREHOLDER REPORT OF REGISTERED
MANAGEMENT INVESTMENT COMPANIES
Investment Company Act file number 811-23096
Legg Mason ETF Investment Trust
(Exact name of registrant as specified in charter)
620 Eighth Avenue, 47th Floor, New York, NY 10018
(Address of principal executive offices) (Zip code)
Harris Goldblat
Franklin Templeton
100 First Stamford Place
Stamford, CT 06902
(Name and address of agent for service)
Registrant’s telephone number, including area code: 1-877-721-1926
Date of fiscal year end: March 31
Date of reporting period: March 31, 2023
| ITEM 1. | REPORT TO STOCKHOLDERS. |
The Annual Report to Stockholders is filed herewith.

| | |
| Annual Report | | March 31, 2023 |
Franklin Low Volatility High Dividend Index ETFs
Franklin International Low Volatility High Dividend Index ETF
Franklin U.S. Low Volatility High Dividend Index ETF
|
| INVESTMENT PRODUCTS: NOT FDIC INSURED • NO BANK GUARANTEE • MAY LOSE VALUE |
| | |
| II | | Franklin Low Volatility High Dividend Index ETFs |
Letter from the president

Dear Shareholder,
We are pleased to provide the annual report of Franklin International Low Volatility High Dividend Index ETF and Franklin U.S. Low Volatility High Dividend Index ETF for the twelve-month reporting period ended March 31, 2023. Please read on for a detailed look at prevailing economic and market conditions during the Funds’ reporting period and to learn how those conditions have affected each Fund’s performance.
As always, we remain committed to providing you with excellent service and a full spectrum of investment choices. We also remain committed to supplementing the support you receive from your financial advisor. One way we accomplish this is through our website, www.franklintempleton.com. Here you can gain immediate access to market and investment information, including:
| • | | Fund net asset value and market price, |
| • | | Market insights and commentaries from our portfolio managers, and |
| • | | A host of educational resources. |
We look forward to helping you meet your financial goals.
Sincerely,

|
| Patrick O’Connor |
| President and Chief Executive Officer - Investment Management President |
April 28, 2023 |
| | |
| Franklin Low Volatility High Dividend Index ETFs | | III |
Funds overview
Franklin International Low Volatility High Dividend Index ETF
Q. What is the Fund’s investment strategy?
A. The Fund seeks to track the investment results of the QS International Low Volatility High Dividend Hedged Index (the “Underlying Index”). The Underlying Index seeks to provide more stable income through investments in stocks of profitable companies in developed markets outside of the United States with relatively high dividend yields or anticipated dividend yields and lower price and earnings volatility, while mitigating exposure to exchange-rate fluctuations between the U.S. dollar and other international currencies. The Underlying Index is designed to have higher returns than an equivalent unhedged investment when the currencies in which its component securities are denominated are weakening relative to the U.S. dollar. Conversely, the Underlying Index is designed to have lower returns than an equivalent unhedged investment when the currencies in which its component securities are denominated are rising relative to the U.S. dollar. The Underlying Index is based on a proprietary methodology created and sponsored by Franklin Advisers, Inc. (“Franklin Advisers”), the Fund’s subadviser. Franklin Advisers is affiliated with both LMPFA and the Fund. The Fund will invest at least 80% of its net assets, plus borrowings for investment purposes, if any, in securities that compose its Underlying Index. Securities that compose the Underlying Index include depositary receipts representing securities in the Underlying Index.
The Underlying Index is composed of equity securities in developed markets outside of the United States across a range of market capitalizations that are included in the MSCI World ex-US IMI Local Indexi. Stocks in the Underlying Index must have demonstrated profitability over the last four fiscal quarters as a whole. Only stocks that have paid or are anticipated to pay a dividend are included in the Underlying Index. The methodology calculates a composite “stable yield” score, with the yield of stocks with relatively high price volatility (as measured over the past 12 months based on the standard deviation of daily returns) and earnings volatility (as measured by the variation of past earnings and projected earnings) and from countries with relatively high interest rates adjusted downward and the yield of stocks with relatively low price volatility and earnings volatility and from countries with relatively low interest rates adjusted upward. The Underlying Index will also take into account foreign withholding taxes on dividend payments to minimize their impact on distribution yield. Underlying Index weights are calculated to maximize its stable yield score subject to concentration limits, liquidity requirements and turnover restraints. Franklin Advisers anticipates that the number of component securities in the Underlying Index will range from 50 to 200 but this number may vary due to market conditions. At the time of each reconstitution, no individual component of the Underlying Index will exceed 2.5% of the Underlying Index, no individual sector will exceed 25% of the Underlying Index, no country will exceed 15% of the Underlying Index, no region will exceed 50% of the Underlying Index and real estate investment trust (“REIT”) components as a whole will not exceed 15% of the Underlying Index. The Underlying Index’s components are reconstituted annually and rebalanced quarterly. The fund’s securities portfolio is rebalanced when the Underlying Index is rebalanced or reconstituted. The composition of the Underlying Index and the fund after reconstitution and rebalancing may fluctuate and exceed the above Underlying Index limitations due to market movements. As of June 30, 2022, the Underlying Index consisted of securities from the following 18 countries: Australia, Austria, Belgium, Canada, Denmark, Finland, France, Germany, Hong Kong, Italy, Japan, Netherlands, Norway, Singapore, Spain, Sweden, Switzerland and the United Kingdom. The Underlying Index may include large-, mid- or small-capitalization companies.
The Fund may invest up to 20% of its net assets in foreign currency forward contracts and other currency hedging instruments, certain index futures, options, options on index futures, swap contracts or other derivatives (“Financial Instruments”) related to its Underlying Index and its component securities; cash and cash equivalents; other investment companies, including ETFs; and in securities and other instruments not included in its Underlying Index, but which Franklin Advisers believes will help the fund track its Underlying Index. As noted below, the Fund invests in currency hedging instruments to offset the Fund’s exposure to the currencies in which the Fund’s holdings are denominated. The Fund may also invest in equity index futures and currency derivatives to gain exposure to local markets or segments of local markets for cash flow management purposes and as a portfolio management technique.
Q. What were the overall market conditions during the Fund’s reporting period?
A. International equity returns were volatile and modestly positive across major regions for the one-year period from April 1, 2022, through March 31, 2023, with sector level results mixed. Throughout the period, markets were influenced by concerns about inflation, monetary policy tightening by many central banks, the Russia-Ukraine war, China’s COVID-19 policy and slowing corporate profits. The MSCI World ex US Indexii had positive returns in US-dollar terms, led at the country level by Denmark, Spain and Italy. Israel was the laggard. At the sector level, Energy, Consumer Discretionary and Consumer Staples led the way, while the Real Estate sector saw the steepest decline.
The period began with record-high inflation in multiple countries — driven by consumer demand and continued supply-chain disruptions — which prompted many central banks to raise interest rates in the second quarter of 2022. Additionally, the ongoing Russia-Ukraine war and resulting sanctions continued to disrupt trade and pushed crude oil and natural gas prices to record highs, though natural gas prices ended
| | | | | | |
| Franklin Low Volatility High Dividend Index ETFs 2023 Annual Report | | | | | 1 | |
Funds overview (cont’d)
the quarter lower. Recession fears increased along with high inflation, rising interest rates and surging government bond yields, dampening consumer sentiment in many countries. In this environment, during 2022’s second quarter, the MSCI World ex US Index generated negative returns in US-dollar terms, the worst quarterly decline since the beginning of the COVID-19 pandemic in early 2020. All major regions posted double-digit percentage losses.
Following a strong rally during the first half of the third quarter 2022, global equities fell sharply during the remainder of the period, marking a third consecutive quarterly decline. Investors worried that the global economy would weaken further or enter a recession as many central banks tighten monetary policy. Global manufacturing activity contracted in September 2022 for the first time since June 2020 as output fell, new orders decreased, and international trade contracted. Although inflationary pressures began to ease as the price of many commodities declined, annual inflation rates remained near or at record highs in multiple regions, prompting many central banks to continue raising interest rates. The release of the U.S. Federal Reserve’s (Fed) July meeting minutes included hawkish comments by Fed officials and other central bankers at the Jackson Hole Economic Symposium in late August prompted an equity market selloff which intensified in September as the Fed raised rates for the fifth time in 2022. In this environment, the MSCI World ex US Index generated negative net returns in US-dollar terms for 2022’s third quarter.
Global equities collectively advanced in the fourth quarter of 2022 as gains in October and November more than offset losses in December, and the MSCI World ex US Index generated positive returns. However, as the quarter wound down, a return of investor concerns about slower global economic growth driven by the aggressive rate-hiking actions of many central banks during the year led global equities to retreat; they closed 2022 with their worst annual loss since the 2008 global financial crisis. The ongoing Russia-Ukraine war and a COVID-19 surge in China after the country’s easing of its zero-COVID policy also weighed on investor sentiment. On the economic front, global manufacturing activity continued to contract in December as output declined in four of the largest industrial economies — the U.S., China, the eurozone and Japan — and international trade volumes fell.
Global equities collectively rose during the first quarter of 2023 amid signs of economic resilience and investor optimism about an approaching end to the worldwide rate-hiking cycle. After a strong rally in January, global stocks declined in February as strong employment reports and high inflation in certain regions prompted hawkish comments from many central banks. Financial markets experienced heightened volatility in March due to banking turmoil in the United States and Switzerland. However, quick action by authorities in both countries to stem potential contagion reassured many investors, driving global stocks higher. In economic data, global manufacturing activity contracted in March after stabilizing in February, although output rose for the second consecutive month.
Q. How did we respond to these changing market conditions?
A. The Fund uses a passive investment approach to achieve its investment objective, and therefore made no change in investment approach in response to market conditions.
Performance review
For the twelve months ended March 31, 2023, Franklin International Low Volatility High Dividend Index ETF generated a +6.90% return on a net asset value (“NAV”)iii basis and +7.89% based on its market priceiv per share.
The performance table shows the Fund’s total return for the twelve months ended March 31, 2023, based on its NAV and market price as of March 31, 2023. The Fund seeks to track the investment results of the QS International Low Volatility High Dividend Hedged Index (NR), which returned +7.44% for the same period. The Fund’s secondary benchmark, the MSCI World ex-US IMI local Index (NR), returned +1.75% over the same time frame. The Lipper International Large-Cap Value Funds Category Averagev returned +1.36% for the period. Please note that Lipper performance returns are based on each fund’s NAV.
| | | | | | | | |
Performance Snapshot as of March 31, 2023
(unaudited) | |
| | | 6 months | | | 12 months | |
| Franklin International Low Volatility High Dividend Index ETF: | | | | | | | | |
$26.81 (NAV) | | | 16.33 | % | | | 6.90 | %*† |
$26.96 (Market Price) | | | 16.81 | % | | | 7.89 | %*‡ |
| QS International Low Volatility High Dividend Hedged Index (NR) | | | 16.48 | % | | | 7.44 | % |
| MSCI World ex-US IMI Local Index (NR) | | | 15.59 | % | | | 1.75 | % |
| Lipper International Large-Cap Value Funds Category Average | | | 28.93 | % | | | 1.36 | % |
The performance shown represents past performance. Past performance is no guarantee of future results and current performance may be higher or lower than the performance shown above. Principal value and investment returns will fluctuate so shares, when sold, may be worth more or less than their original cost. Performance data current to the most recent month-end is available at www.franklintempleton.com.
| | | | |
| 2 | | | | Franklin Low Volatility High Dividend Index ETFs 2023 Annual Report |
Investors buy and sell shares of an exchange-traded fund (“ETF”) at market price (not NAV) in the secondary market throughout the trading day. These shares are not individually available for direct purchase from or direct redemption to the ETF. Market price returns are typically based upon the official closing price of the Fund’s shares. These returns do not represent investors’ returns had they traded shares at other times. Performance figures for periods shorter than one year represent cumulative figures and are not annualized.
Information showing the Fund’s net asset value, market price, premiums and discounts, and bid-ask spreads for various time periods is available by visiting the Fund’s website at www.franklintempleton.com.
As of the Fund’s current prospectus dated July 29, 2022, the gross total annual fund operating expense ratio for the Fund was 0.40%.
* Total returns are based on changes in NAV or market price, respectively. Returns reflect the deduction of all Fund expenses. Returns do not reflect the deduction of brokerage commissions or taxes that investors pay on distributions or the sale of shares.
† Total return assumes the reinvestment of all distributions at NAV.
‡ Total return assumes the reinvestment of all distributions at market price, which typically is based upon the official closing price of the Fund’s shares.
Q. What were the leading contributors to performance?
A. Looking at the performance of the Underlying Index by country for the reporting period and considering both returns and weights in the Underlying Index, the leading contributors were Switzerland, Germany and Japan. From a sector perspective, Utilities, Consumer Staples and Materials fared best, with positive returns in the Underlying Index.
Q. What were the leading detractors from performance?
A. By virtue of negative returns for the period and their weight in the Underlying Index, the leading detractors at the country level were Canada, Australia and the U.K. The leading detractors at the sector level, again by virtue of return and weight, were the Financials, Real Estate and Industrials sectors.
Looking for additional information?
The Fund’s daily NAV is available online at www.franklintempleton.com. The Fund is traded under the symbol “LVHI” and its closing market price is available on most financial websites. In a continuing effort to provide information concerning the Fund, shareholders may call 1-877-721-1926 (toll free), Monday through Friday from 8:00 a.m. to 5:30 p.m. Eastern time, for the Fund’s current NAV, market price and other information.
Thank you for your investment in Franklin International Low Volatility High Dividend Index ETF. As always, we appreciate that you have chosen us to manage your assets and we remain focused on achieving the Fund’s investment goals.
Sincerely,
Michael LaBella, CFA
Portfolio Manager
Franklin Advisers, Inc.
Vaneet Chadha, CFA
Portfolio Manager
Franklin Advisers, Inc.

Christopher W. Floyd, CFA
Portfolio Manager
Franklin Advisers, Inc.
| | | | | | |
| Franklin Low Volatility High Dividend Index ETFs 2023 Annual Report | | | | | 3 | |
Funds overview (cont’d)

Jose Maldonado, CFA
Portfolio Manager
Franklin Advisers, Inc.
April 13, 2023
RISKS: The market values of securities or other assets will fluctuate, sometimes sharply and unpredictably, due to changes in general market conditions, overall economic trends or events, governmental actions or intervention, actions taken by the U.S. Federal Reserve or foreign central banks, market disruptions caused by trade disputes or other factors, political developments, armed conflicts, economic sanctions and countermeasures in response to sanctions, major cybersecurity events, investor sentiment, the global and domestic effects of a pandemic, and other factors that may or may not be related to the issuer of the security or other asset.
Equity securities are subject to market and price fluctuations. Dividends are not guaranteed, and a company may reduce or eliminate its dividend at any time. In rising markets, the value of large-cap stocks may not rise as much as smaller-cap stocks. Small- and mid-cap stocks involve greater risks and volatility than large-cap stocks. The Fund may focus its investments in certain industries, increasing its vulnerability to market volatility. There is no guarantee that the Fund will achieve a high degree of correlation to the index it seeks to track. The Fund does not seek to outperform the index it tracks and does not seek temporary defensive positions when markets decline or appear overvalued. Derivatives, such as options and futures, can be illiquid, may disproportionately increase losses and have a potentially large impact on Fund performance. Please see the Fund’s prospectus for a more complete discussion of these and other risks and the Fund’s investment strategies.
The mention of sector breakdowns is for informational purposes only and should not be construed as a recommendation to purchase or sell any securities. The information provided regarding such sectors is not a sufficient basis upon which to make an investment decision. Investors seeking financial advice regarding the appropriateness of investing in any securities or investment strategies discussed should consult their financial professional. The Fund’s top five sector holdings (as a percentage of net assets) as of March 31, 2023, were: financials (19.1%), utilities (15.2%), materials (12.5%), consumer discretionary (12.1%) and consumer staples (10.4%). The Fund’s composition may differ over time.
All investments are subject to risk including the possible loss of principal. Past performance is no guarantee of future results. An index is a statistical composite that tracks a specified financial market, sector or rules-based investment process. Unlike a fund, an index does not actually hold a portfolio of securities and therefore does not incur the expenses incurred by a fund. These expenses negatively impact fund performance. All index performance reflects no deduction for fees, expenses or taxes. Please note that an investor cannot invest directly in an index.
The information provided is not intended to be a forecast of future events, a guarantee of future results or investment advice. Views expressed may differ from those of the firm as a whole.
| i | MSCI World ex-US IMI Local Index (NR) captures large-, mid- and small-cap representation across 22 of 23 Developed Markets (DM) countries — excluding the United States. With 3,491 constituents, the index covers approximately 99% of the free float-adjusted market capitalization in each country. The index calculates performance utilizing local currencies taking out the effect of the converting to the U.S. dollar. Net Returns (NR) include income net of tax withholding when dividends are paid. |
| ii | The MSCI World ex USA Index captures large and mid-cap representation across 22 of 23 Developed Markets countries — excluding the United States. With 913 constituents, the index covers approximately 85% of the free float-adjusted market capitalization in each country. |
| iii | Net Asset Value (NAV) is calculated by subtracting total liabilities from total assets and dividing the results by the number of shares outstanding. |
| iv | Market price is determined by supply and demand. It is the price at which an investor purchases or sells shares of the Fund. The market price may differ from the Fund’s NAV. |
| v | Lipper, Inc., a wholly-owned subsidiary of Refinitiv, provides independent insight on global collective investments. Returns are based on the twelve-month period ended March 31, 2023, including the reinvestment of all distributions, including returns of capital, if any, calculated among the 75 funds in the Fund’s Lipper category. |
| | | | |
| 4 | | | | Franklin Low Volatility High Dividend Index ETFs 2023 Annual Report |
Franklin U.S. Low Volatility High Dividend Index ETF
Q. What is the Fund’s investment strategy?
A. The Fund seeks to track the investment results of the QS Low Volatility High Dividend Index (the “Underlying Index”). The Underlying Index seeks to provide more stable income through investments in stocks of profitable U.S. companies with relatively high dividend yields and lower price and earnings volatility. The Underlying Index is based on a proprietary methodology created and sponsored by Franklin Advisers, Inc. (“Franklin Advisers”), the Fund’s subadviser. Franklin Advisers is affiliated with both LMPFA and the fund. The Underlying Index is composed of stocks of U.S. companies across a wide range of market capitalizations, including the largest 3,000 U.S. stocks as determined by the Solactive US Broad Market Index. Stocks in the Underlying Index must have demonstrated profitability over the last four fiscal quarters as a whole. Stocks whose yields are not supported by earnings are excluded from the Underlying Index. The methodology calculates a composite “stable yield” score, with the yield of stocks with relatively higher price volatility and earnings volatility adjusted downward and the yield of stocks with relatively lower price volatility and earnings volatility adjusted upward. Franklin Advisers anticipates that the number of component securities in the Underlying Index will range from 50 to 100. At the time of each reconstitution, no individual component of the Underlying Index will exceed 2.5% of the Underlying Index, no individual sector will exceed 25% of the Underlying Index, and real estate investment trust (“REIT”) components as a whole will not exceed 15% of the Underlying Index. The Underlying Index’s components are reconstituted annually and rebalanced quarterly. The composition of the Underlying Index and the fund after reconstitution and rebalancing may fluctuate and exceed the above Underlying Index limitations due to market movements. The Underlying Index may include large-, mid- or small-capitalization companies.
The Fund’s portfolio is rebalanced when the Underlying Index is rebalanced or reconstituted. The Fund may trade at times other than when the Underlying Index is rebalanced or reconstituted for a variety of reasons, including when adjustments may be made to its representative sampling process from time to time or when investing cash.
The Fund will invest at least 80% of its net assets, plus borrowings for investment purposes, if any, in securities that compose the Underlying Index.
The Fund may invest up to 20% of its net assets in certain index futures, options, options on index futures, swap contracts or other derivatives (“Financial Instruments”) related to its Underlying Index and its component securities; cash and cash equivalents; other investment companies, including exchange-traded funds; and in securities and other instruments not included in its Underlying Index but which Franklin Advisers believes will help the Fund track its Underlying Index. The Fund may invest in exchange-traded equity index futures to manage sector exposure and for cash management purposes.
Q. What were the overall market conditions during the Fund’s reporting period?
A. U.S. equities as measured by the Russell 3000® Indexi were volatile but negative for the twelve-month period ended March 31, 2023, returning -8.58%. The Real Estate, Communication Services and Consumer Discretionary sectors were especially hard hit, each with a negative return significantly worse than the Russell 3000® Index overall. Only the Energy and Consumer Staples sectors were in positive territory.
U.S. equities suffered broad-based losses during the second quarter of 2022. Investors unloaded riskier assets amid persistently elevated inflation and interest-rate hikes by the U.S. Federal Reserve (Fed) that grew in size with each meeting. The market reflected a growing fear that the Fed might push the country into a recession before price stability is restored. A comparatively minor stock market rally in late June occurred despite the release of worsening economic data. The quarter capped a volatile first half of the year that saw U.S. and non-U.S. stocks, bonds and currencies jolted by surging inflation, central bank moves and the Russia-Ukraine war. Consumer expectations sank amid the worst inflation shock since the early 1970s and drew market attention toward the possibility that corporate profit margins may come under pressure in the coming quarters.
The U.S. equity market rose during the first half of the 2022’s third quarter but ended down as investors feared that the Fed’s aggressive rate hikes to combat persistently high inflation could lead to a recession. Standard & Poor’s® 500 (S&P 500®)ii stocks fell for a third consecutive quarter to 22-month lows, capped by the worst September (-9.21%) in two decades. To cool stubbornly high inflation, the Fed lifted the federal funds target rate range by 75 basis points (bps) in both July and September, and the Fed indicated the latest increase would not be the last. Stocks sold off further in September as Fed Chair Jerome Powell reiterated the main points he made in his hawkish speech at Jackson Hole in late August 2022. He stressed that monetary policy may have to be restrictive for a while to bring inflation down and that the process may be painful. He also warned of a housing market correction and said a soft landing for the economy may be less likely.
| | | | | | |
Franklin Low Volatility High Dividend Index ETFs 2023 Annual Report | | | | | 5 | |
Funds overview (cont’d)
Following a solid rebound in October and November as inflation data improved, the U.S. equity market pulled back broadly in December, leaving major indexes with their strongest quarter of 2022 but their worst calendar-year performance since 2008. Even as the U.S. economy returned to growth in the third quarter and supply chains continued improving through December 2022, investor sentiment oscillated between expectations of a soft and a hard economic landing, driven by what was the fastest pace of interest-rate hikes since the early 1980s. And although markets initially cheered as China began rapidly phasing out pandemic lockdowns tied to its zero-COVID policies, by mid-December U.S. investors grew at least equally worried about the global implications of a dramatic surge in COVID-19 cases across China.
Key U.S. equity indexes ended the first quarter of 2023 with gains despite a bout of heightened financial market volatility in March due to turmoil in the banking industry. Two mid-sized U.S. banks collapsed, and a Swiss bank was forced into a merger. However, quick intervention by the authorities helped to calm these fears, while better-than-feared corporate earnings reports and smaller interest-rate increases from the US Federal Reserve also supported investor sentiment.
Against this backdrop, the Fed raised interest rates eight times during the reporting period in its fight against inflation (four of those raises by 75bp) which fell from a June 2022 high of 9.1% to 6% by the end of the period. While the most recent 25bp increase in March 2023 brought the target rate to the highest level since 2007, the pace of the increases has been slowing, and signs of gathering headwinds including the bank crisis may impact the likelihood of future increases.
Q. How did we respond to these changing market conditions?
A. The Fund uses a passive investment approach to achieve its investment objective, and therefore made no change in investment approach in response to market conditions.
Performance review
For the twelve months ended March 31, 2023, Franklin U.S. Low Volatility High Dividend Index ETF generated a -2.85% return on a net asset value (“NAV”)iii basis and -3.01% based on its market priceiv per share.
The performance table shows the Fund’s total return for the twelve months ended March 31, 2023, based on its NAV and market price as of March 31, 2023. The Fund seeks to track the investment results of the QS Low Volatility High Dividend Index (NR), which returned -2.61% for the same period. The Fund’s broad-based market index, the Russell 3000® Index returned -8.58% over the same time frame. The Lipper Multi-Cap Value Funds Category Averagev returned -5.30% for the period. Please note that Lipper performance returns are based on each fund’s NAV.
| | | | | | | | |
Performance Snapshot as of March 31, 2023
(unaudited) | |
| | | 6 months | | | 12 months | |
| Franklin U.S. Low Volatility High Dividend Index ETF: | | | | | | | | |
$37.30 (NAV) | | | 11.26 | % | | | -2.85 | %*† |
$37.28 (Market Price) | | | 11.07 | % | | | -3.01 | %*‡ |
| QS Low Volatility High Dividend Index (NR) | | | 16.78 | % | | | -2.61 | % |
| Russell 3000® Index | | | 14.88 | % | | | -8.58 | % |
| Lipper Multi-Cap Value Funds Category Average | | | 13.85 | % | | | -5.30 | % |
The performance shown represents past performance. Past performance is no guarantee of future results and current performance may be higher or lower than the performance shown above. Principal value and investment returns will fluctuate so shares, when sold, may be worth more or less than their original cost. Performance data current to the most recent month-end is available at www.franklintempleton.com.
Investors buy and sell shares of an exchange-traded fund (“ETF”) at market price (not NAV) in the secondary market throughout the trading day. These shares are not individually available for direct purchase from or direct redemption to the ETF. Market price returns are typically based upon the official closing price of the Fund’s shares. These returns do not represent investors’ returns had they traded shares at other times. Performance figures for periods shorter than one year represent cumulative figures and are not annualized.
Information showing the Fund’s net asset value, market price, premiums and discounts, and bid-ask spreads for various time periods is available by visiting the Fund’s website at www.franklintempleton.com.
As of the Fund’s current prospectus dated July 29, 2022, the gross total annual fund operating expense ratio for the Fund was 0.27%.
* Total returns are based on changes in NAV or market price, respectively. Returns reflect the deduction of all Fund expenses. Returns do not reflect the deduction of brokerage commissions or taxes that investors pay on distributions or the sale of shares.
† Total return assumes the reinvestment of all distributions at NAV.
‡ Total return assumes the reinvestment of all distributions at market price, which typically is based upon the official closing price of the Fund’s shares.
| | | | |
| 6 | | | | Franklin Low Volatility High Dividend Index ETFs 2023 Annual Report |
Q. What were the leading contributors to performance?
A. The leading contributors to performance in the Underlying Index (the “Index”) for the reporting period were the Consumer Staples, Health Care and Consumer Discretionary sectors, by virtue of their weight in the Index and positive returns.
Q. What were the leading detractors from performance?
A. The leading detractors from performance were the Utilities, Real Estate and Financials sectors, all with returns more negative than the portfolio average.
Looking for additional information?
The Fund’s daily NAV is available online at www.franklintempleton.com. The Fund is traded under the symbol “LVHD” and its closing market price is available on most financial websites. In a continuing effort to provide information concerning the Fund, shareholders may call 1-877-721-1926 (toll free), Monday through Friday from 8:00 a.m. to 5:30 p.m. Eastern time, for the Fund’s current NAV, market price and other information.
Thank you for your investment in Franklin U.S Low Volatility High Dividend Index ETF. As always, we appreciate that you have chosen us to manage your assets and we remain focused on achieving the Fund’s investment goals.
Sincerely,
Michael LaBella, CFA
Portfolio Manager
Franklin Advisers, Inc.
Vaneet Chadha, CFA
Portfolio Manager
Franklin Advisers, Inc.

Christopher W. Floyd, CFA
Portfolio Manager
Franklin Advisers, Inc.

Jose Maldonado, CFA
Portfolio Manager
Franklin Advisers, Inc.
April 13, 2023
RISKS: The market values of securities or other assets will fluctuate, sometimes sharply and unpredictably, due to changes in general market conditions, overall economic trends or events, governmental actions or intervention, actions taken by the U.S. Federal Reserve or foreign central banks, market disruptions caused by trade disputes or other factors, political developments, armed conflicts, economic sanctions and countermeasures in response to sanctions, major cybersecurity events, investor sentiment, the global and domestic effects of a pandemic, and other factors that may or may not be related to the issuer of the security or other asset.
Equity securities are subject to market and price fluctuations. Dividends are not guaranteed, and a company may reduce or eliminate its dividend at any time. International investments are subject to special risks including currency fluctuations, social, economic, and political uncertainties, which could increase volatility. Currency investing contains heightened risks that include market, political, regulatory, and national conditions, and may not
| | | | | | |
| Franklin Low Volatility High Dividend Index ETFs 2023 Annual Report | | | | | 7 | |
Funds overview (cont’d)
be suitable for all investors. In rising markets, the value of large-cap stocks may not rise as much as smaller-cap stocks. Small- and mid-cap stocks involve greater risks and volatility than large-cap stocks. The Fund may focus its investments in certain industries, increasing its vulnerability to market volatility. There is no guarantee that the Fund will achieve a high degree of correlation to the index it seeks to track. The Fund does not seek to outperform the index it tracks and does not seek temporary defensive positions when markets decline or appear overvalued. Derivatives, such as options and futures, can be illiquid, may disproportionately increase losses and have a potentially large impact on Fund performance. Distributions are not guaranteed and are subject to change. Please see the Fund’s prospectus for a more complete discussion of these and other risks and the Fund’s investment strategies.
The mention of sector breakdowns is for informational purposes only and should not be construed as a recommendation to purchase or sell any securities. The information provided regarding such sectors is not a sufficient basis upon which to make an investment decision. Investors seeking financial advice regarding the appropriateness of investing in any securities or investment strategies discussed should consult their financial professional. The Fund’s top five sector holdings (as a percentage of net assets) as of March 31, 2023, were: utilities (25.9%), consumer staples (22.2%), real estate (11.6%), industrials (10.1%) and communication services (7.8%). The Fund’s composition may differ over time.
All investments are subject to risk including the possible loss of principal. Past performance is no guarantee of future results. An index is a statistical composite that tracks a specified financial market, sector or rules-based investment process. Unlike a fund, an index does not actually hold a portfolio of securities and therefore does not incur the expenses incurred by a fund. These expenses negatively impact fund performance. All index performance reflects no deduction for fees, expenses or taxes. Please note that an investor cannot invest directly in an index.
The information provided is not intended to be a forecast of future events, a guarantee of future results or investment advice. Views expressed may differ from those of the firm as a whole.
| i | The Russell 3000® Index is market capitalization weighted and measures the performance of the largest 3,000 U.S. companies representing the majority of the U.S. market’s total capitalization. Frank Russell Company is the source and owner of the trademarks, service marks and copyrights related to the Russell Indexes. Russell® is a trademark of Frank Russell Company. |
| ii | Standard & Poor’s® 500 Index (S&P 500®) is a market capitalization-weighted index of 500 stocks designed to measure total U.S. equity market performance. |
| iii | Net Asset Value (NAV) is calculated by subtracting total liabilities from total assets and dividing the results by the number of shares outstanding. |
| iv | Market price is determined by supply and demand. It is the price at which an investor purchases or sells shares of the Fund. The market price may differ from the Fund’s NAV. |
| v | Lipper, Inc., a wholly-owned subsidiary of Refinitiv, provides independent insight on global collective investments. Returns are based on the five-month period ended March 31, 2023, including the reinvestment of all distributions, including returns of capital, if any, calculated among the 660 funds in the Fund’s Lipper category. |
| | | | |
| 8 | | | | Franklin Low Volatility High Dividend Index ETFs 2023 Annual Report |
Funds at a glance (unaudited)
Franklin International Low Volatility High Dividend Index ETF Investment Breakdown† (%) as a percent of total investments
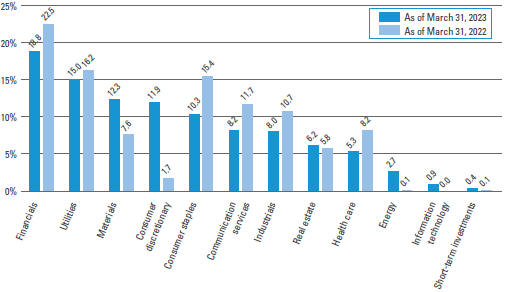
| † | The bar graph above represents the composition of the Fund’s investments as of March 31, 2023 and March 31, 2022 and does not include derivatives, such as futures contracts and forward foreign currency contracts. The composition of the Fund’s investments is subject to change at any time. |
| | | | |
| Franklin Low Volatility High Dividend Index ETFs 2023 Annual Report | | | | 9 |
Funds at a glance (unaudited) (cont’d)
Franklin U.S. Low Volatility High Dividend Index ETF Investment Breakdown† (%) as a percent of total investments
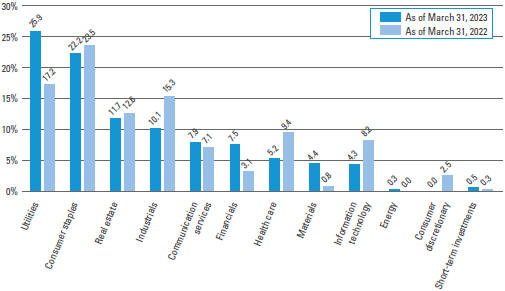
| † | The bar graph above represents the composition of the Fund’s investments as of March 31, 2023 and March 31, 2022 and does not include derivatives, such as futures contracts. The composition of the Fund’s investments is subject to change at any time. |
| | | | |
| 10 | | | | Franklin Low Volatility High Dividend Index ETFs 2023 Annual Report |
Funds expenses (unaudited)
Franklin International Low Volatility High Dividend Index ETF
Example
As a shareholder of the Fund, you may incur two types of costs: (1) transaction costs, such as brokerage commissions paid on purchases and sales of Fund shares; and (2) ongoing costs, including management fees; and other Fund expenses. This example is intended to help you understand your ongoing costs (in dollars) of investing in the Fund and to compare these costs with the ongoing costs of investing in other funds.
This example is based on an investment of $1,000 invested on October 1, 2022 and held for the six months ended March 31, 2023.
Actual expenses
The table below titled “Based on actual total return” provides information about actual account values and actual expenses. You may use the information provided in this table, together with the amount you invested, to estimate the expenses that you paid over the period. To estimate the expenses you paid on your account, divide your ending account value by $1,000 (for example, an $8,600 ending account value divided by $1,000 = 8.6), then multiply the result by the number under the heading entitled “Expenses Paid During the Period”.
Hypothetical example for comparison purposes
The table below titled “Based on hypothetical total return” providesinformationabouthypotheticalaccountvaluesandhypothetical expenses based on the actual expense ratio and an assumed rate of return of 5.00% per year before expenses, which is not the Fund’s actual return. The hypothetical account values and expenses may not be used to estimate the actual ending account balance or expenses you paid for the period. You may use the information provided in this table to compare the ongoing costs of investing in the Fund and other funds. To do so, compare the 5.00% hypothetical example relating to the Fund with the 5.00% hypothetical examples that appear in the shareholder reports of the other funds.
Please note that the expenses shown in the table below are meant to highlight your ongoing costs only and do not reflect any transactional costs, such as brokerage commissions paid on purchases and sales of Fund shares. Therefore, the table is useful in comparing ongoing costs only, and will not help you determine the relative total costs of owning different funds. In addition, if these transaction costs were included, your costs would have been higher.
| | | | | | | | | | | | | | | | | | | | | | | | | | | | | | | | | | | | | | | | | | | | | | | | | | |
| | |
| Based on actual total return1 | | | | Based on hypothetical total return1 |
Actual
Total
Return2 | | Beginning
Account Value | | Ending Account Value | | Annualized
Expense
Ratio3 | | Expenses
Paid During
the Period3,4 | | | | Hypothetical
Annualized
Total Return | | Beginning
Account Value | | Ending Account Value | | Annualized
Expense
Ratio3 | | Expenses
Paid During
the Period3,4 |
| | | 16.33% | | | | $ | 1,000.00 | | | | $ | 1,163.30 | | | | | 0.41 | % | | | $ | 2.21 | | | | | | | 5.00 | % | | | | $1,000.00 | | | | $ | 1,022.89 | | | | | 0.41 | % | | | $ | 2.07 | |
| 1 | For the six months ended March 31, 2023. |
| 2 | Assumes the reinvestment of all distributions, including returns of capital, if any, at net asset value. Total return is not annualized, as it may not be representative of the total return for the year. Performance figures may reflect fee waivers and/or expense reimbursements. In the absence of fee waivers and/or expense reimbursements, the total return would have been lower. Past performance is no guarantee of future results. |
| 3 | Included in the expense ratio are “Other fees” described in Note 1 under Federal and other taxes which are not annualized. Without these expenses, the expense ratio would have been 0.40% and the actual and hypothetical expenses paid during the period would have been $2.16 and $2.02, respectively. |
| 4 | Expenses (net of fee waivers and/or expense reimbursements) are equal to the Fund’s annualized expense ratio (except for non-recurring expenses, if any) multiplied by the average account value over the period, multiplied by the number of days in the most recent fiscal half-year (182), then divided by 365. |
| | | | | | |
| Franklin Low Volatility High Dividend Index ETFs 2023 Annual Report | | | | | 11 | |
Funds expenses (unaudited) (cont’d)
Franklin U.S. Low Volatility High Dividend Index ETF
Example
As a shareholder of the Fund, you may incur two types of costs: (1) transaction costs, such as brokerage commissions paid on purchases and sales of Fund shares; and (2) ongoing costs, including management fees; and other Fund expenses. This example is intended to help you understand your ongoing costs (in dollars) of investing in the Fund and to compare these costs with the ongoing costs of investing in other funds.
This example is based on an investment of $1,000 invested on October 1, 2022 and held for the six months ended March 31, 2023.
Actual expenses
The table below titled “Based on actual total return” provides information about actual account values and actual expenses. You may use the information provided in this table, together with the amount you invested, to estimate the expenses that you paid over the period. To estimate the expenses you paid on your account, divide your ending account value by $1,000 (for example, an $8,600 ending account value divided by $1,000 = 8.6), then multiply the result by the number under the heading entitled “Expenses Paid During the Period”.
Hypothetical example for comparison purposes
The table below titled “Based on hypothetical total return” providesinformationabouthypotheticalaccountvaluesandhypothetical expenses based on the actual expense ratio and an assumed rate of return of 5.00% per year before expenses, which is not the Fund’s actual return. The hypothetical account values and expenses may not be used to estimate the actual ending account balance or expenses you paid for the period. You may use the information provided in this table to compare the ongoing costs of investing in the Fund and other funds. To do so, compare the 5.00% hypothetical example relating to the Fund with the 5.00% hypothetical examples that appear in the shareholder reports of the other funds.
Please note that the expenses shown in the table below are meant to highlight your ongoing costs only and do not reflect any transactional costs, such as brokerage commissions paid on purchases and sales of Fund shares. Therefore, the table is useful in comparing ongoing costs only, and will not help you determine the relative total costs of owning different funds. In addition, if these transaction costs were included, your costs would have been higher.
| | | | | | | | | | | | | | | | | | | | | | | | | | | | | | | | | | | | | | | | | | | | | | | | | | |
| | |
| Based on actual total return1 | | | | Based on hypothetical total return1 |
Actual
Total Return2 | | Beginning Account Value | | Ending Account Value | | Annualized Expense Ratio | | Expenses Paid During
the Period3 | | | | Hypothetical Annualized Total Return | | Beginning Account Value | | Ending Account Value | | Annualized Expense Ratio | | Expenses Paid During
the Period3 |
| | | 11.26% | | | | $ | 1,000.00 | | | | $ | 1,112.60 | | | | | 0.27 | % | | | $ | 1.42 | | | | | | | 5.00 | % | | | | $1,000.00 | | | | $ | 1,023.59 | | | | | 0.27 | % | | | $ | 1.36 | |
| 1 | For the six months ended March 31, 2023. |
| 2 | Assumes the reinvestment of all distributions, including returns of capital, if any, at net asset value. Total return is not annualized, as it may not be representative of the total return for the year. Performance figures may reflect fee waivers and/or expense reimbursements. In the absence of fee waivers and/or expense reimbursements, the total return would have been lower. Past performance is no guarantee of future results. |
| 3 | Expenses (net of fee waivers and/or expense reimbursements) are equal to the Fund’s annualized expense ratio multiplied by the average account value over the period, multiplied by the number of days in the most recent fiscal half-year (182), then divided by 365. |
| | | | |
| 12 | | | | Franklin Low Volatility High Dividend Index ETFs 2023 Annual Report |
Funds performance (unaudited)
Franklin International Low Volatility High Dividend Index ETF
| | | | |
| Net Asset Value | | | |
| Average annual total returns1 | | | |
| Twelve Months Ended 3/31/23 | | | 6.90 | % |
| Five Years Ended 3/31/23 | | | 6.65 | |
| Inception date of 7/27/16 through 3/31/23 | | | 6.94 | |
| |
| Cumulative total returns1 | | | |
| Inception date of 7/27/16 through 3/31/23 | | | 56.52 | % |
| | | | |
| Market Price | | | |
| Average annual total returns2 | | | |
| Twelve Months Ended 3/31/23 | | | 7.89 | % |
| Five Years Ended 3/31/23 | | | 6.60 | |
| Inception date of 7/27/16 through 3/31/23 | | | 6.97 | |
| |
| Cumulative total returns2 | | | |
| Inception date of 7/27/16 through 3/31/23 | | | 56.84 | % |
All figures represent past performance and are not a guarantee of future results. Investment returns and principal value of an investment will fluctuate so that an investor’s shares, when sold, may be worth more or less than their original cost. NAV returns assume that dividends and capital gain distributions have been reinvested in the Fund at NAV. The returns shown do not reflect the deduction of brokerage commissions or taxes that investors would pay on distributions or the sale of shares. Performance figures may reflect fee waivers and/or expense reimbursements. In the absence of fee waivers and/or expense reimbursements, the total return would have been lower.
Investors buy and sell shares of the Fund at market price, not NAV, in the secondary market throughout the trading day. These shares are not individually available for direct purchase from or direct redemption to the Fund. The Fund’s per share NAV is the value of one share of the Fund and is calculated by dividing the value of total assets less total liabilities by the number of shares outstanding. The NAV return is based on the NAV of the Fund and effective July 1, 2020, market price returns typically are based upon the official closing price of the Fund’s shares. Prior to July 1, 2020, market price returns generally were based upon the mid-point between the bid and ask on the Fund’s principal trading market when the Fund’s NAV was determined, which was typically 4:00 p.m. Eastern time (U.S.). Market price performance reported for periods prior to July 1, 2020 continue to reflect market prices calculated based upon the mid-point between the bid and ask on the Fund’s principal trading market typically as of 4:00 p.m. Eastern time (U.S.). These returns do not represent investors’ returns had they traded shares at other times. NAV and market price returns assume that dividends and capital gain distributions have been reinvested in the Fund at NAV and market price, respectively. As with other exchange-traded funds, NAV returns and market price returns may differ because of factors such as the supply and demand for Fund shares and investors’ assessment of the underlying value of the Fund’s portfolio securities.
| 1 | Assumes the reinvestment of all distributions, including returns of capital, if any, at net asset value. |
| 2 | Assumes the reinvestment of all distributions, including returns of capital, if any, at market price. |
| | | | | | |
| Franklin Low Volatility High Dividend Index ETFs 2023 Annual Report | | | | | 13 | |
Funds performance (unaudited) (cont’d)
Franklin International Low Volatility High Dividend Index ETF
Historical performance
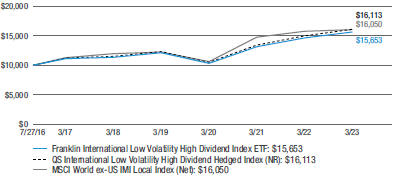
Value of $10,000 invested in
Franklin International Low Volatility High Dividend Index ETF vs. QS International Low Volatility High Dividend Hedged Index (NR) and MSCI World ex-US IMI Local Index (Net)† — July 27, 2016 - March 31, 2023
All figures represent past performance and are not a guarantee of future results. Investment returns and principal value of an Investment will fluctuate so that an investor’s shares, when sold, may be worth more or less than their original cost. NAV returns assume that dividends and capital gain distributions have been reinvested in the Fund at NAV. The returns shown do not reflect the deduction of brokerage commissions or taxes that investors would pay on distributions or the sale of shares. Performance figures may reflect fee waivers and/or expense reimbursements. In the absence of fee waivers and/or expense reimbursements, the total return would have been lower.
| † | Hypothetical illustration of $10,000 invested in Franklin International Low Volatility High Dividend Index ETF on July 27, 2016 (inception date), assuming the reinvestment of all distributions, including returns of capital, if any, at net asset value through March 31, 2023. The hypothetical illustration also assumes a $10,000 investment in the QS International Low Volatility High Dividend Hedged Index (NR) and MSCI World ex-US IMI Local Index (Net). The Fund’s per share NAV is the value of one share of the Fund and is calculated by dividing the value of total assets less total liabilities by the number of shares outstanding. The NAV return is based on the NAV of the Fund. The QS International Low Volatility High Dividend Hedged Index (NR) (the “Underlying Index”) is an index composed of publicly traded equity securities of developed markets outside of the United States with relatively high yield and low price and earnings volatility. The Underlying Index is based on a proprietary methodology created and sponsored by Franklin Advisers, Inc., the Fund’s subadviser. The MSCI World ex-US IMI Local Index (Net) captures large-, mid- and small-cap representation across 22 of 23 developed markets. The local version of the index calculates performance utilizing local currencies taking out the effect of converting to the U.S. dollar. The indices are not subject to the same management and trading expenses as a fund. An index is a statistical composite that tracks a specified financial market, sector, or rules-based investment process. Unlike a fund, an index does not actually hold a portfolio of securities and therefore does not incur the expenses incurred by a fund. These expenses negatively impact fund performance. All index performance reflects no deduction for fees, expenses or taxes. Please note that an investor cannot invest directly in an index. |
| | | | |
| 14 | | | | Franklin Low Volatility High Dividend Index ETFs 2023 Annual Report |
Franklin U.S. Low Volatility High Dividend Index ETF
| | | | |
| Net Asset Value | | | |
| Average annual total returns1 | | | |
| Twelve Months Ended 3/31/23 | | | -2.85 | % |
| Five Years Ended 3/31/23 | | | 8.20 | |
| Inception date of 12/28/15 through 3/31/23 | | | 9.07 | |
| |
| Cumulative total returns1 | | | |
| Inception date of 12/28/15 through 3/31/23 | | | 87.80 | % |
| | | | |
| Market Price | | | |
| Average annual total returns2 | | | |
| Twelve Months Ended 3/31/23 | | | -3.01 | % |
| Five Years Ended 3/31/23 | | | 8.18 | |
| Inception date of 12/28/15 through 3/31/23 | | | 9.06 | |
| |
| Cumulative total returns2 | | | |
| Inception date of 12/28/15 through 3/31/23 | | | 87.68 | % |
All figures represent past performance and are not a guarantee of future results. Investment returns and principal value of an investment will fluctuate so that an investor’s shares, when sold, may be worth more or less than their original cost. NAV returns assume that dividends and capital gain distributions have been reinvested in the Fund at NAV. The returns shown do not reflect the deduction of brokerage commissions or taxes that investors would pay on distributions or the sale of shares. Performance figures may reflect fee waivers and/or expense reimbursements. In the absence of fee waivers and/or expense reimbursements, the total return would have been lower.
Investors buy and sell shares of the Fund at market price, not NAV, in the secondary market throughout the trading day. These shares are not individually available for direct purchase from or direct redemption to the Fund. The Fund’s per share NAV is the value of one share of the Fund and is calculated by dividing the value of total assets less total liabilities by the number of shares outstanding. The NAV return is based on the NAV of the Fund and effective July 1, 2020, market price returns typically are based upon the official closing price of the Fund’s shares. Prior to July 1, 2020, market price returns generally were based upon the mid-point between the bid and ask on the Fund’s principal trading market when the Fund’s NAV was determined, which was typically 4:00 p.m. Eastern time (U.S.). Market price performance reported for periods prior to July 1, 2020 continue to reflect market prices calculated based upon the mid-point between the bid and ask on the Fund’s principal trading market typically as of 4:00 p.m. Eastern time (U.S.). These returns do not represent investors’ returns had they traded shares at other times. NAV and market price returns assume that dividends and capital gain distributions have been reinvested in the Fund at NAV and market price, respectively. As with other exchange-traded funds, NAV returns and market price returns may differ because of factors such as the supply and demand for Fund shares and investors’ assessment of the underlying value of the Fund’s portfolio securities.
| 1 | Assumes the reinvestment of all distributions, including returns of capital, if any, at net asset value. |
| 2 | Assumes the reinvestment of all distributions, including returns of capital, if any, at market price. |
| | | | |
| Franklin Low Volatility High Dividend Index ETFs 2023 Annual Report | | | | 15 |
Funds performance (unaudited) (cont’d)
Franklin U.S. Low Volatility High Dividend Index ETF
Historical performance
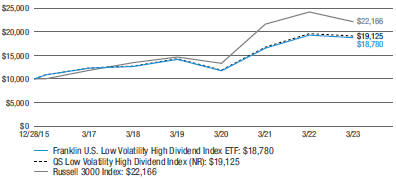
Value of $10,000 invested in
Franklin U.S. Low Volatility High Dividend Index ETF vs. QS Low Volatility High Dividend Index (NR) and Russell 3000 Index† — December 28, 2015 - March 31, 2023
All figures represent past performance and are not a guarantee of future results. Investment returns and principal value of an Investment will fluctuate so that an investor’s shares, when sold, may be worth more or less than their original cost. NAV returns assume that dividends and capital gain distributions have been reinvested in the Fund at NAV. The returns shown do not reflect the deduction of brokerage commissions or taxes that investors would pay on distributions or the sale of shares. Performance figures may reflect fee waivers and/or expense reimbursements. In the absence of fee waivers and/or expense reimbursements, the total return would have been lower.
| † | Hypothetical illustration of $10,000 invested in Franklin U.S. Low Volatility High Dividend Index ETF on December 28, 2015 (inception date), assuming the reinvestment of all distributions, including returns of capital, if any, at net asset value through March 31, 2023. The hypothetical illustration also assumes a $10,000 investment in the QS Low Volatility High Dividend Index (NR) and the Russell 3000 Index (the “Index”). The Fund’s per share NAV is the value of one share of the Fund and is calculated by dividing the value of total assets less total liabilities by the number of shares outstanding. The NAV return is based on the NAV of the Fund. QS Low Volatility High Dividend Index (NR) (the “Underlying Index”) is an index composed of equity securities of U.S. companies with relatively high yield and low price and earnings volatility. The Underlying Index is based on a proprietary methodology created and sponsored by Franklin Advisers, Inc., the Fund’s subadviser. The Underlying Index is composed of stocks of U.S. companies across a wide range of market capitalizations, including the largest 3,000 U.S. stocks as determined by the Solactive US Broad Market Index. The Index measures the performance of the 3,000 largest U.S. companies based on total market capitalization, which represents approximately 98% of the U.S. equity market. The indices are not subject to the same management and trading expenses as a fund. An index is a statistical composite that tracks a specified financial market, sector, or rules-based investment process. Unlike a fund, an index does not actually hold a portfolio of securities and therefore does not incur the expenses incurred by a fund. These expenses negatively impact fund performance. All index performance reflects no deduction for fees, expenses or taxes. Please note that an investor cannot invest directly in an index. |
| | | | |
| 16 | | | | Franklin Low Volatility High Dividend Index ETFs 2023 Annual Report |
Schedules of investments
March 31, 2023
Franklin International Low Volatility High Dividend Index ETF
(Percentages shown based on Fund net assets)
| | | | | | | | |
| Security | | Shares | | | Value | |
| Common Stocks — 98.4% | | | | | | | | |
| Communication Services — 8.3% | | | | | | | | |
Diversified Telecommunication Services — 5.6% | | | | | | | | |
Koninklijke KPN NV | | | 1,152,203 | | | $ | 4,075,898 | |
Orange SA | | | 794,739 | | | | 9,456,445 | |
Proximus SADP | | | 167,616 | | | | 1,619,655 | |
Singapore Telecommunications Ltd. | | | 2,878,800 | | | | 5,326,500 | |
Total Diversified Telecommunication Services | | | | | | | 20,478,498 | |
Media — 0.2% | | | | | | | | |
Metropole Television SA | | | 20,074 | | | | 326,051 | |
Telenet Group Holding NV | | | 13,386 | | | | 304,535 | |
Total Media | | | | | | | 630,586 | |
Wireless Telecommunication Services — 2.5% | | | | | | | | |
SoftBank Corp. | | | 799,900 | | | | 9,189,624 | |
Total Communication Services | | | | | | | 30,298,708 | |
| Consumer Discretionary — 9.6% | | | | | | | | |
Automobiles — 5.2% | | | | | | | | |
Bayerische Motoren Werke AG | | | 88,331 | | | | 9,686,935 | |
Mercedes-Benz Group AG | | | 120,783 | | | | 9,288,088 | |
Total Automobiles | | | | | | | 18,975,023 | |
Broadline Retail — 0.4% | | | | | | | | |
Harvey Norman Holdings Ltd. | | | 615,976 | | | | 1,476,929 | |
Household Durables — 2.9% | | | | | | | | |
Barratt Developments PLC | | | 616,718 | | | | 3,557,256 | |
Haseko Corp. | | | 188,700 | | | | 2,182,052 | |
Taylor Wimpey PLC | | | 2,194,369 | | | | 3,227,387 | |
Vistry Group PLC | | | 157,969 | | | | 1,525,456 | |
Total Household Durables | | | | | | | 10,492,151 | |
Specialty Retail — 1.1% | | | | | | | | |
JB Hi-Fi Ltd. | | | 139,718 | | | | 3,974,179 | |
T-Gaia Corp. | | | 20,600 | | | | 258,487 | |
Total Specialty Retail | | | | | | | 4,232,666 | |
Total Consumer Discretionary | | | | | | | 35,176,769 | |
| Consumer Staples — 10.4% | | | | | | | | |
Consumer Staples Distribution & Retail — 2.2% | | | | | | | | |
Tesco PLC | | | 2,439,235 | | | | 8,013,497 | |
Food Products — 0.9% | | | | | | | | |
Golden Agri-Resources Ltd. | | | 2,861,200 | | | | 613,322 | |
Orkla ASA | | | 155,930 | | | | 1,105,629 | |
Wilmar International Ltd. | | | 548,600 | | | | 1,737,133 | |
Total Food Products | | | | | | | 3,456,084 | |
Tobacco — 7.3% | | | | | | | | |
British American Tobacco PLC | | | 244,673 | | | | 8,593,255 | |
Imperial Brands PLC | | | 376,455 | | | | 8,676,325 | |
Japan Tobacco Inc. | | | 452,200 | | | | 9,506,767 | |
Total Tobacco | | | | | | | 26,776,347 | |
Total Consumer Staples | | | | | | | 38,245,928 | |
See Notes to Financial Statements.
| | | | | | |
| Franklin Low Volatility High Dividend Index ETFs 2023 Annual Report | | | | | 17 | |
Schedules of investments (cont’d)
March 31, 2023
Franklin International Low Volatility High Dividend Index ETF
(Percentages shown based on Fund net assets)
| | | | | | | | |
| Security | | Shares | | | Value | |
| Energy — 2.7% | | | | | | | | |
Oil, Gas & Consumable Fuels — 2.7% | | | | | | | | |
Itochu Enex Co. Ltd. | | | 24,900 | | | $ | 211,226 | |
Pembina Pipeline Corp. | | | 262,444 | | | | 8,489,894 | |
Viva Energy Group Ltd. | | | 653,396 | | | | 1,325,965 | |
Total Energy | | | | | | | 10,027,085 | |
| Financials — 19.1% | | | | | | | | |
Banks — 10.2% | | | | | | | | |
Bank of Nova Scotia | | | 135,379 | | | | 6,809,213 | |
BOC Hong Kong Holdings Ltd. | | | 1,266,781 | | | | 3,945,604 | |
Canadian Imperial Bank of Commerce | | | 154,554 | | | | 6,544,862 | |
DBS Group Holdings Ltd. | | | 350,400 | | | | 8,697,078 | |
Oversea-Chinese Banking Corp. Ltd. | | | 503,600 | | | | 4,685,444 | |
United Overseas Bank Ltd. | | | 288,900 | | | | 6,466,597 | |
Total Banks | | | | | | | 37,148,798 | |
Insurance — 8.9% | | | | | | | | |
Assicurazioni Generali SpA | | | 239,998 | | | | 4,792,510 | |
Great-West Lifeco Inc. | | | 253,468 | | | | 6,708,703 | |
Japan Post Holdings Co. Ltd. | | | 1,059,000 | | | | 8,565,734 | |
Legal & General Group PLC | | | 394,750 | | | | 1,166,045 | |
Poste Italiane SpA | | | 208,404 | | | | 2,131,071 | |
Zurich Insurance Group AG | | | 19,477 | | | | 9,331,819 | |
Total Insurance | | | | | | | 32,695,882 | |
Total Financials | | | | | | | 69,844,680 | |
| Health Care — 5.3% | | | | | | | | |
Pharmaceuticals — 5.3% | | | | | | | | |
Novartis AG, Registered Shares | | | 103,475 | | | | 9,487,238 | |
Sanofi | | | 92,606 | | | | 10,085,330 | |
Total Health Care | | | | | | | 19,572,568 | |
| Industrials — 8.1% | | | | | | | | |
Construction & Engineering — 2.9% | | | | | | | | |
ACS Actividades de Construccion y Servicios SA | | | 64,228 | | | | 2,048,059 | |
Bouygues SA | | | 121,697 | | | | 4,110,650 | |
Chudenko Corp. | | | 14,500 | | | | 232,497 | |
Kumagai Gumi Co. Ltd. | | | 36,700 | | | | 733,228 | |
NCC AB, Class B Shares | | | 26,410 | | | | 234,058 | |
Nishimatsu Construction Co. Ltd. | | | 85,500 | | | | 2,200,297 | |
Okumura Corp. | | | 27,100 | | | | 637,336 | |
Peab AB, Class B Shares | | | 69,719 | | | | 348,610 | |
Total Construction & Engineering | | | | | | | 10,544,735 | |
Electrical Equipment — 0.1% | | | | | | | | |
Nippon Carbon Co. Ltd. | | | 13,900 | | | | 428,206 | |
Ground Transportation — 0.2% | | | | | | | | |
ComfortDelGro Corp. Ltd. | | | 1,035,700 | | | | 919,203 | |
See Notes to Financial Statements.
| | | | |
| 18 | | | | Franklin Low Volatility High Dividend Index ETFs 2023 Annual Report |
Franklin International Low Volatility High Dividend Index ETF
(Percentages shown based on Fund net assets)
| | | | | | | | |
| Security | | Shares | | | Value | |
Industrial Conglomerates — 1.3% | | | | | | | | |
CK Hutchison Holdings Ltd. | | | 495,106 | | | $ | 3,071,569 | |
Keppel Corp. Ltd. | | | 376,600 | | | | 1,594,718 | |
Total Industrial Conglomerates | | | | | | | 4,666,287 | |
Machinery — 0.2% | | | | | | | | |
Sembcorp Marine Ltd. | | | 7,188,506 | | | | 643,400 | * |
Professional Services — 0.7% | | | | | | | | |
Adecco Group AG, Registered Shares | | | 50,299 | | | | 1,825,201 | |
SmartGroup Corp. Ltd. | | | 163,622 | | | | 702,445 | |
Total Professional Services | | | | | | | 2,527,646 | |
Trading Companies & Distributors — 2.7% | | | | | | | | |
Kanematsu Corp. | | | 46,300 | | | | 571,227 | |
Mitsubishi Corp. | | | 264,900 | | | | 9,456,307 | |
Total Trading Companies & Distributors | | | | | | | 10,027,534 | |
Total Industrials | | | | | | | 29,757,011 | |
| Information Technology — 0.9% | | | | | | | | |
Communications Equipment — 0.1% | | | | | | | | |
VTech Holdings Ltd. | | | 34,167 | | | | 204,350 | |
Electronic Equipment, Instruments & Components — 0.8% | | | | | | | | |
Nippon Electric Glass Co. Ltd. | | | 161,600 | | | | 3,095,037 | |
Total Information Technology | | | | | | | 3,299,387 | |
| Materials — 12.5% | | | | | | | | |
Chemicals — 3.2% | | | | | | | | |
Evonik Industries AG | | | 182,613 | | | | 3,841,024 | |
Incitec Pivot Ltd. | | | 2,539,464 | | | | 5,323,524 | |
Toyo Ink SC Holdings Co. Ltd. | | | 28,600 | | | | 441,818 | |
Yara International ASA | | | 47,329 | | | | 2,051,220 | |
Total Chemicals | | | | | | | 11,657,586 | |
Construction Materials — 3.1% | | | | | | | | |
CSR Ltd. | | | 433,399 | | | | 1,378,778 | |
Holcim AG | | | 153,059 | | | | 9,868,289 | |
Total Construction Materials | | | | | | | 11,247,067 | |
Containers & Packaging — 0.2% | | | | | | | | |
Transcontinental Inc., Class A Shares | | | 61,313 | | | | 635,624 | |
Metals & Mining — 4.8% | | | | | | | | |
BHP Group Ltd. | | | 278,252 | | | | 8,801,751 | |
Labrador Iron Ore Royalty Corp. | | | 15,101 | | | | 357,064 | |
Rio Tinto PLC | | | 126,486 | | | | 8,567,248 | |
Total Metals & Mining | | | | | | | 17,726,063 | |
Paper & Forest Products — 1.2% | | | | | | | | |
Navigator Co. SA | | | 144,268 | | | | 516,615 | |
UPM-Kymmene oyj | | | 122,287 | | | | 4,111,979 | |
Total Paper & Forest Products | | | | | | | 4,628,594 | |
Total Materials | | | | | | | 45,894,934 | |
See Notes to Financial Statements.
| | | | | | |
| Franklin Low Volatility High Dividend Index ETFs 2023 Annual Report | | | | | 19 | |
Schedules of investments (cont’d)
March 31, 2023
Franklin International Low Volatility High Dividend Index ETF
(Percentages shown based on Fund net assets)
| | | | | | | | |
| Security | | Shares | | | Value | |
| Real Estate — 6.3% | | | | | | | | |
Diversified REITs — 0.3% | | | | | | | | |
Charter Hall Long Wale REIT | | | 185,812 | | | | $ 521,436 | |
Takara Leben Real Estate Investment Corp. | | | 802 | | | | 539,929 | |
Total Diversified REITs | | | | | | | 1,061,365 | |
Health Care REITs — 0.3% | | | | | | | | |
Cofinimmo SA | | | 4,348 | | | | 385,233 | |
NorthWest Healthcare Properties Real Estate Investment Trust | | | 107,938 | | | | 675,535 | |
Total Health Care REITs | | | | | | | 1,060,768 | |
Industrial REITs — 0.9% | | | | | | | | |
CapitaLand Ascendas REIT | | | 1,094,800 | | | | 2,355,029 | |
Mapletree Industrial Trust | | | 533,300 | | | | 950,638 | |
Total Industrial REITs | | | | | | | 3,305,667 | |
Office REITs — 0.3% | | | | | | | | |
Cromwell Property Group | | | 738,020 | | | | 274,330 | |
Ichigo Office REIT Investment Corp. | | | 1,139 | | | | 828,426 | |
Total Office REITs | | | | | | | 1,102,756 | |
Real Estate Management & Development — 3.0% | | | | | | | | |
Cibus Nordic Real Estate AB | | | 15,991 | | | | 167,011 | |
Daiwa House Industry Co. Ltd. | | | 191,000 | | | | 4,468,961 | |
Henderson Land Development Co. Ltd. | | | 245,256 | | | | 848,247 | |
Kerry Properties Ltd. | | | 100,276 | | | | 256,121 | |
Sun Hung Kai Properties Ltd. | | | 377,945 | | | | 5,296,078 | |
Total Real Estate Management & Development | | | | | | | 11,036,418 | |
Retail REITs — 1.5% | | | | | | | | |
AEON REIT Investment Corp. | | | 1,062 | | | | 1,156,238 | |
CT Real Estate Investment Trust | | | 43,176 | | | | 511,406 | |
Frasers Centrepoint Trust | | | 279,800 | | | | 481,924 | |
Frontier Real Estate Investment Corp. | | | 217 | | | | 774,476 | |
SmartCentres Real Estate Investment Trust | | | 95,072 | | | | 1,866,526 | |
Waypoint REIT Ltd. | | | 469,981 | | | | 815,254 | |
Total Retail REITs | | | | | | | 5,605,824 | |
Total Real Estate | | | | | | | 23,172,798 | |
| Utilities — 15.2% | | | | | | | | |
Electric Utilities — 7.8% | | | | | | | | |
CK Infrastructure Holdings Ltd. | | | 172,981 | | | | 940,934 | |
Emera Inc. | | | 225,602 | | | | 9,255,125 | |
Iberdrola SA | | | 803,198 | | | | 10,022,211 | |
Power Assets Holdings Ltd. | | | 298,324 | | | | 1,599,939 | |
Red Electrica Corp. SA | | | 116,928 | | | | 2,057,991 | |
SSE PLC | | | 90,483 | | | | 2,017,156 | |
Terna — Rete Elettrica Nazionale SpA | | | 343,072 | | | | 2,820,081 | |
Total Electric Utilities | | | | | | | 28,713,437 | |
Gas Utilities — 1.2% | | | | | | | | |
Italgas SpA | | | 115,211 | | | | 704,087 | |
See Notes to Financial Statements.
| | | | |
| 20 | | | | Franklin Low Volatility High Dividend Index ETFs 2023 Annual Report |
Franklin International Low Volatility High Dividend Index ETF
(Percentages shown based on Fund net assets)
| | | | | | | | | | | | |
| Security | | | | | Shares | | | Value | |
Gas Utilities — continued | | | | | | | | | | | | |
Rubis SCA | | | | | | | 18,010 | | | $ | 482,717 | |
Snam SpA | | | | | | | 602,960 | | | | 3,202,717 | |
Total Gas Utilities | | | | | | | | | | | 4,389,521 | |
Multi-Utilities — 6.2% | | | | | | | | | | | | |
A2A SpA | | | | | | | 1,047,069 | | | | 1,672,255 | |
E.ON SE | | | | | | | 860,362 | | | | 10,749,519 | |
Iren SpA | | | | | | | 179,528 | | | | 344,260 | |
National Grid PLC | | | | | | | 721,856 | | | | 9,786,695 | |
Total Multi-Utilities | | | | | | | | | | | 22,552,729 | |
Total Utilities | | | | | | | | | | | 55,655,687 | |
Total Common Stocks (Cost — $341,228,439) | | | | | | | | | | | 360,945,555 | |
| | | |
| | | Rate | | | | | | | |
| Preferred Stocks — 2.5% | | | | | | | | | | | | |
| Consumer Discretionary — 2.5% | | | | | | | | | | | | |
Automobiles — 2.5% | | | | | | | | | | | | |
Volkswagen AG (Cost — $9,113,994) | | | 6.972 | % | | | 66,310 | | | | 9,051,424 | (a) |
Total Investments before Short-Term Investments (Cost — $350,342,433) | | | | | | | | | | | 369,996,979 | |
| Short-Term Investments — 0.4% | | | | | | | | | | | | |
Invesco Treasury Portfolio, Institutional Class (Cost — $1,608,465) | | | 4.716 | % | | | 1,608,465 | | | | 1,608,465 | (b) |
Total Investments — 101.3% (Cost — $351,950,898) | | | | | | | | | | | 371,605,444 | |
Liabilities in Excess of Other Assets — (1.3)% | | | | | | | | | | | (4,810,801) | |
Total Net Assets — 100.0% | | | | | | | | | | $ | 366,794,643 | |
| * | Non-income producing security. |
| (a) | The rate shown represents the yield as of March 31, 2023. |
| (b) | Rate shown is one-day yield as of the end of the reporting period. |
| | |
Abbreviation(s) used in this schedule: |
| |
| REIT | | — Real Estate Investment Trust |
At March 31, 2023, the Fund had the following open futures contracts:
| | | | | | | | | | | | | | | | | | | | |
| | | Number of
Contracts | | | Expiration
Date | | | Notional
Amount | | | Market
Value | | | Unrealized
Appreciation | |
| Contracts to Buy: | | | | | | �� | | | | | | | | | | | | | | |
| MSCI EAFE Index | | | 15 | | | | 6/23 | | | $ | 1,470,581 | | | $ | 1,572,375 | | | $ | 101,794 | |
At March 31, 2023, the Fund had the following open forward foreign currency contracts:
| | | | | | | | | | | | | | | | | | | | |
Currency
Purchased | | | Currency
Sold | | | Counterparty | | Settlement
Date | | | Unrealized
Appreciation
(Depreciation) | |
| USD | | | 127,983 | | | CHF | | | 117,957 | | | Bank of New York | | | 4/11/23 | | | $ | (1,289) | |
| USD | | | 131,120 | | | CHF | | | 122,892 | | | Bank of New York | | | 4/11/23 | | | | (3,561) | |
| USD | | | 132,805 | | | CHF | | | 120,733 | | | Bank of New York | | | 4/11/23 | | | | 490 | |
| USD | | | 256,457 | | | CHF | | | 235,516 | | | Bank of New York | | | 4/11/23 | | | | (1,651) | |
| USD | | | 257,986 | | | CHF | | | 235,516 | | | Bank of New York | | | 4/11/23 | | | | (123) | |
| USD | | | 510,315 | | | CHF | | | 472,148 | | | Bank of New York | | | 4/11/23 | | | | (7,124) | |
| USD | | | 27,915,583 | | | CHF | | | 26,178,843 | | | Bank of New York | | | 4/11/23 | | | | (774,492) | |
See Notes to Financial Statements.
| | | | | | |
| Franklin Low Volatility High Dividend Index ETFs 2023 Annual Report | | | | | 21 | |
Schedules of investments (cont’d)
March 31, 2023
Franklin International Low Volatility High Dividend Index ETF
| | | | | | | | | | | | | | | | | | | | |
Currency
Purchased | | | Currency
Sold | | | Counterparty | | Settlement
Date | | | Unrealized
Appreciation
(Depreciation) | |
| USD | | | 448,976 | | | EUR | | | 415,648 | | | Bank of New York | | | 4/11/23 | | | $ | (2,883) | |
| USD | | | 457,479 | | | EUR | | | 425,508 | | | Bank of New York | | | 4/11/23 | | | | (5,099) | |
| USD | | | 459,353 | | | EUR | | | 433,118 | | | Bank of New York | | | 4/11/23 | | | | (11,498) | |
| USD | | | 899,593 | | | EUR | | | 830,048 | | | Bank of New York | | | 4/11/23 | | | | (2,770) | |
| USD | | | 902,124 | | | EUR | | | 830,048 | | | Bank of New York | | | 4/11/23 | | | | (238) | |
| USD | | | 1,772,340 | | | EUR | | | 1,664,027 | | | Bank of New York | | | 4/11/23 | | | | (36,658) | |
| USD | | | 98,469,357 | | | EUR | | | 92,614,805 | | | Bank of New York | | | 4/11/23 | | | | (2,214,138) | |
| USD | | | 239,476 | | | GBP | | | 195,733 | | | Bank of New York | | | 4/11/23 | | | | (2,593) | |
| USD | | | 242,121 | | | GBP | | | 203,790 | | | Bank of New York | | | 4/11/23 | | | | (9,913) | |
| USD | | | 243,548 | | | GBP | | | 200,209 | | | Bank of New York | | | 4/11/23 | | | | (4,057) | |
| USD | | | 480,880 | | | GBP | | | 390,552 | | | Bank of New York | | | 4/11/23 | | | | (2,129) | |
| USD | | | 482,949 | | | GBP | | | 390,552 | | | Bank of New York | | | 4/11/23 | | | | (59) | |
| USD | | | 951,993 | | | GBP | | | 782,953 | | | Bank of New York | | | 4/11/23 | | | | (16,311) | |
| USD | | | 52,043,452 | | | GBP | | | 43,505,425 | | | Bank of New York | | | 4/11/23 | | | | (1,761,105) | |
| USD | | | 14,046 | | | NOK | | | 147,162 | | | Bank of New York | | | 4/11/23 | | | | (13) | |
| USD | | | 14,304 | | | NOK | | | 150,329 | | | Bank of New York | | | 4/11/23 | | | | (58) | |
| USD | | | 14,398 | | | NOK | | | 153,017 | | | Bank of New York | | | 4/11/23 | | | | (220) | |
| USD | | | 28,009 | | | NOK | | | 293,250 | | | Bank of New York | | | 4/11/23 | | | | (5) | |
| USD | | | 28,145 | | | NOK | | | 293,250 | | | Bank of New York | | | 4/11/23 | | | | 131 | |
| USD | | | 54,865 | | | NOK | | | 587,888 | | | Bank of New York | | | 4/11/23 | | | | (1,297) | |
| USD | | | 3,143,207 | | | NOK | | | 32,732,281 | | | Bank of New York | | | 4/11/23 | | | | 16,233 | |
| USD | | | 3,530 | | | SEK | | | 36,497 | | | Bank of New York | | | 4/11/23 | | | | 8 | |
| USD | | | 3,533 | | | SEK | | | 37,321 | | | Bank of New York | | | 4/11/23 | | | | (68) | |
| USD | | | 3,565 | | | SEK | | | 37,989 | | | Bank of New York | | | 4/11/23 | | | | (101) | |
| USD | | | 6,996 | | | SEK | | | 72,804 | | | Bank of New York | | | 4/11/23 | | | | (29) | |
| USD | | | 7,024 | | | SEK | | | 72,804 | | | Bank of New York | | | 4/11/23 | | | | (2) | |
| USD | | | 13,904 | | | SEK | | | 145,952 | | | Bank of New York | | | 4/11/23 | | | | (180) | |
| USD | | | 774,615 | | | SEK | | | 8,114,354 | | | Bank of New York | | | 4/11/23 | | | | (8,395) | |
| USD | | | 108,643 | | | AUD | | | 162,398 | | | UBS Securities LLC | | | 4/11/23 | | | | (166) | |
| USD | | | 111,219 | | | AUD | | | 166,245 | | | UBS Securities LLC | | | 4/11/23 | | | | (168) | |
| USD | | | 111,925 | | | AUD | | | 169,218 | | | UBS Securities LLC | | | 4/11/23 | | | | (1,453) | |
| USD | | | 216,828 | | | AUD | | | 324,297 | | | UBS Securities LLC | | | 4/11/23 | | | | (456) | |
| USD | | | 217,249 | | | AUD | | | 324,297 | | | UBS Securities LLC | | | 4/11/23 | | | | (34) | |
| USD | | | 434,911 | | | AUD | | | 650,130 | | | UBS Securities LLC | | | 4/11/23 | | | | (686) | |
| USD | | | 24,373,124 | | | AUD | | | 36,179,028 | | | UBS Securities LLC | | | 4/11/23 | | | | 132,646 | |
| USD | | | 182,789 | | | CAD | | | 250,769 | | | UBS Securities LLC | | | 4/11/23 | | | | (2,536) | |
| USD | | | 187,442 | | | CAD | | | 256,539 | | | UBS Securities LLC | | | 4/11/23 | | | | (2,147) | |
| USD | | | 190,358 | | | CAD | | | 261,127 | | | UBS Securities LLC | | | 4/11/23 | | | | (2,622) | |
| USD | | | 368,423 | | | CAD | | | 500,436 | | | UBS Securities LLC | | | 4/11/23 | | | | (1,412) | |
| USD | | | 369,811 | | | CAD | | | 500,436 | | | UBS Securities LLC | | | 4/11/23 | | | | (24) | |
| USD | | | 729,765 | | | CAD | | | 1,003,242 | | | UBS Securities LLC | | | 4/11/23 | | | | (11,656) | |
| USD | | | 40,833,733 | | | CAD | | | 55,539,104 | | | UBS Securities LLC | | | 4/11/23 | | | | (211,088) | |
| USD | | | 70,856 | | | HKD | | | 555,576 | | | UBS Securities LLC | | | 4/11/23 | | | | 41 | |
| USD | | | 72,623 | | | HKD | | | 568,642 | | | UBS Securities LLC | | | 4/11/23 | | | | 142 | |
| USD | | | 73,847 | | | HKD | | | 578,813 | | | UBS Securities LLC | | | 4/11/23 | | | | 70 | |
| USD | | | 141,369 | | | HKD | | | 1,109,263 | | | UBS Securities LLC | | | 4/11/23 | | | | (21) | |
| USD | | | 141,386 | | | HKD | | | 1,109,263 | | | UBS Securities LLC | | | 4/11/23 | | | | (4) | |
| USD | | | 283,654 | | | HKD | | | 2,223,780 | | | UBS Securities LLC | | | 4/11/23 | | | | 203 | |
| USD | | | 15,683,668 | | | HKD | | | 122,888,002 | | | UBS Securities LLC | | | 4/11/23 | | | | 19,926 | |
| USD | | | 245,736 | | | JPY | | | 32,516,898 | | | UBS Securities LLC | | | 4/11/23 | | | | 974 | |
| USD | | | 248,607 | | | JPY | | | 33,849,314 | | | UBS Securities LLC | | | 4/11/23 | | | | (6,185) | |
See Notes to Financial Statements.
| | | | |
| 22 | | | | Franklin Low Volatility High Dividend Index ETFs 2023 Annual Report |
Franklin International Low Volatility High Dividend Index ETF
| | | | | | | | | | | | | | | | | | | | |
Currency
Purchased | | | Currency
Sold | | | Counterparty | | Settlement
Date | | | Unrealized
Appreciation
(Depreciation) | |
| USD | | | 250,768 | | | JPY | | | 33,254,534 | | | UBS Securities LLC | | | 4/11/23 | | | $ | 453 | |
| USD | | | 487,897 | | | JPY | | | 64,870,397 | | | UBS Securities LLC | | | 4/11/23 | | | | (398) | |
| USD | | | 490,380 | | | JPY | | | 64,870,397 | | | UBS Securities LLC | | | 4/11/23 | | | | 2,085 | |
| USD | | | 987,416 | | | JPY | | | 130,047,982 | | | UBS Securities LLC | | | 4/11/23 | | | | 8,514 | |
| USD | | | 53,149,869 | | | JPY | | | 7,228,695,707 | | | UBS Securities LLC | | | 4/11/23 | | | | (1,262,259) | |
| USD | | | 147,945 | | | SGD | | | 197,179 | | | UBS Securities LLC | | | 4/11/23 | | | | (412) | |
| USD | | | 149,857 | | | SGD | | | 201,804 | | | UBS Securities LLC | | | 4/11/23 | | | | (1,980) | |
| USD | | | 152,094 | | | SGD | | | 205,413 | | | UBS Securities LLC | | | 4/11/23 | | | | (2,458) | |
| USD | | | 296,145 | | | SGD | | | 393,663 | | | UBS Securities LLC | | | 4/11/23 | | | | (46) | |
| USD | | | 296,252 | | | SGD | | | 393,663 | | | UBS Securities LLC | | | 4/11/23 | | | | 61 | |
| USD | | | 588,140 | | | SGD | | | 789,190 | | | UBS Securities LLC | | | 4/11/23 | | | | (5,645) | |
| USD | | | 32,577,326 | | | SGD | | | 43,860,906 | | | UBS Securities LLC | | | 4/11/23 | | | | (423,499) | |
| Net unrealized depreciation on open forward foreign currency contracts | | | $ | (6,623,437) | |
| | |
Abbreviation(s) used in this table: |
| |
| AUD | | — Australian Dollar |
| |
| CAD | | — Canadian Dollar |
| |
| CHF | | — Swiss Franc |
| |
| EUR | | — Euro |
| |
| GBP | | — British Pound |
| |
| HKD | | — Hong Kong Dollar |
| |
| JPY | | — Japanese Yen |
| |
| NOK | | — Norwegian Krone |
| |
| SEK | | — Swedish Krona |
| |
| SGD | | — Singapore Dollar |
| |
| USD | | — United States Dollar |
| | | | |
| Summary of Investments by Country** (unaudited) | | | |
| Japan | | | 14.9 | % |
| United Kingdom | | | 13.4 | |
| Germany | | | 11.5 | |
| Canada | | | 11.3 | |
| Australia | | | 8.9 | |
| Singapore | | | 8.6 | |
| Switzerland | | | 5.6 | |
| United States | | | 5.4 | |
| Italy | | | 4.2 | |
| France | | | 3.9 | |
| Spain | | | 3.8 | |
| Hong Kong | | | 2.5 | |
| China | | | 1.5 | |
| Finland | | | 1.1 | |
| Netherlands | | | 1.1 | |
| Belgium | | | 0.6 | |
| Brazil | | | 0.5 | |
| Norway | | | 0.3 | |
| Sweden | | | 0.2 | |
| Indonesia | | | 0.2 | |
| Portugal | | | 0.1 | |
| Short-Term Investments | | | 0.4 | |
| | | | 100.0 | % |
| ** | As a percentage of total investments. Please note that the Fund holdings are as of March 31, 2023 and are subject to change. |
See Notes to Financial Statements.
| | | | | | |
| Franklin Low Volatility High Dividend Index ETFs 2023 Annual Report | | | | | 23 | |
Schedules of investments (cont’d)
March 31, 2023
Franklin U.S. Low Volatility High Dividend Index ETF
(Percentages shown based on Fund net assets)
| | | | | | | | |
| Security | | Shares | | | Value | |
| Common Stocks — 99.2% | | | | | | | | |
| Communication Services — 7.8% | | | | | | | | |
Diversified Telecommunication Services — 4.9% | | | | | | | | |
AT&T Inc. | | | 1,391,512 | | | $ | 26,786,606 | |
Verizon Communications Inc. | | | 721,109 | | | | 28,043,929 | |
Total Diversified Telecommunication Services | | | | | | | 54,830,535 | |
Media — 2.9% | | | | | | | | |
Interpublic Group of Cos. Inc. | | | 405,355 | | | | 15,095,420 | |
Omnicom Group Inc. | | | 190,870 | | | | 18,006,676 | |
Total Media | | | | | | | 33,102,096 | |
Total Communication Services | | | | | | | 87,932,631 | |
| Consumer Staples — 22.2% | | | | | | | | |
Beverages — 5.1% | | | | | | | | |
Coca-Cola Co. | | | 481,813 | | | | 29,886,860 | |
PepsiCo Inc. | | | 151,554 | | | | 27,628,294 | |
Total Beverages | | | | | | | 57,515,154 | |
Food Products — 6.3% | | | | | | | | |
Campbell Soup Co. | | | 241,084 | | | | 13,254,799 | |
Flowers Foods Inc. | | | 126,527 | | | | 3,468,105 | |
General Mills Inc. | | | 367,505 | | | | 31,406,977 | |
Kellogg Co. | | | 329,050 | | | | 22,033,188 | |
Total Food Products | | | | | | | 70,163,069 | |
Household Products — 8.0% | | | | | | | | |
Colgate-Palmolive Co. | | | 373,184 | | | | 28,044,778 | |
Kimberly-Clark Corp. | | | 222,627 | | | | 29,880,996 | |
Procter & Gamble Co. | | | 202,781 | | | | 30,151,507 | |
Reynolds Consumer Products Inc. | | | 47,659 | | | | 1,310,622 | |
Total Household Products | | | | | | | 89,387,903 | |
Tobacco — 2.8% | | | | | | | | |
Philip Morris International Inc. | | | 317,315 | | | | 30,858,884 | |
Universal Corp. | | | 17,107 | | | | 904,789 | |
Total Tobacco | | | | | | | 31,763,673 | |
Total Consumer Staples | | | | | | | 248,829,799 | |
| Energy — 0.3% | | | | | | | | |
Oil, Gas & Consumable Fuels — 0.3% | | | | | | | | |
DT Midstream Inc. | | | 62,591 | | | | 3,090,118 | |
| Financials — 7.5% | | | | | | | | |
Banks — 3.8% | | | | | | | | |
Bank of Hawaii Corp. | | | 24,525 | | | | 1,277,262 | |
First Financial Bancorp | | | 38,947 | | | | 847,876 | |
First Hawaiian Inc. | | | 68,018 | | | | 1,403,211 | |
New York Community Bancorp Inc. | | | 1,445,868 | | | | 13,070,647 | |
Old National Bancorp | | | 474,625 | | | | 6,844,093 | |
Provident Financial Services Inc. | | | 42,596 | | | | 816,991 | |
United Bankshares Inc. | | | 80,429 | | | | 2,831,101 | |
See Notes to Financial Statements.
| | | | |
| 24 | | | | Franklin Low Volatility High Dividend Index ETFs 2023 Annual Report |
Franklin U.S. Low Volatility High Dividend Index ETF
(Percentages shown based on Fund net assets)
| | | | | | | | |
| Security | | Shares | | | Value | |
Banks — continued | | | | | | | | |
US Bancorp | | | 426,977 | | | $ | 15,392,521 | |
WesBanco Inc. | | | 26,862 | | | | 824,663 | |
Total Banks | | | | | | | 43,308,365 | |
Capital Markets — 0.1% | | | | | | | | |
Cohen & Steers Inc. | | | 10,746 | | | | 687,314 | |
Financial Services — 0.6% | | | | | | | | |
Western Union Co. | | | 620,674 | | | | 6,920,515 | |
Insurance — 1.6% | | | | | | | | |
CNA Financial Corp. | | | 20,839 | | | | 813,346 | |
Fidelity National Financial Inc. | | | 301,789 | | | | 10,541,490 | |
First American Financial Corp. | | | 104,568 | | | | 5,820,255 | |
Safety Insurance Group Inc. | | | 7,810 | | | | 582,001 | |
Total Insurance | | | | | | | 17,757,092 | |
Mortgage Real Estate Investment Trusts (REITs) — 1.4% | | | | | | | | |
Annaly Capital Management Inc. | | | 777,357 | | | | 14,855,292 | |
Starwood Property Trust Inc. | | | 28,385 | | | | 502,131 | |
Total Mortgage Real Estate Investment Trusts (REITs) | | | | | | | 15,357,423 | |
Total Financials | | | | | | | 84,030,709 | |
| Health Care — 5.2% | | | | | | | | |
Biotechnology — 0.9% | | | | | | | | |
AbbVie Inc. | | | 23,845 | | | | 3,800,178 | |
Amgen Inc. | | | 24,180 | | | | 5,845,515 | |
Total Biotechnology | | | | | | | 9,645,693 | |
Pharmaceuticals — 4.3% | | | | | | | | |
Johnson & Johnson | | | 167,475 | | | | 25,958,625 | |
Pfizer Inc. | | | 556,269 | | | | 22,695,775 | |
Total Pharmaceuticals | | | | | | | 48,654,400 | |
Total Health Care | | | | | | | 58,300,093 | |
| Industrials — 10.1% | | | | | | | | |
Aerospace & Defense — 2.5% | | | | | | | | |
Lockheed Martin Corp. | | | 59,736 | | | | 28,238,999 | |
Industrial Conglomerates — 2.2% | | | | | | | | |
3M Co. | | | 231,682 | | | | 24,352,095 | |
Machinery — 3.4% | | | | | | | | |
Cummins Inc. | | | 116,831 | | | | 27,908,589 | |
PACCAR Inc. | | | 133,307 | | | | 9,758,073 | |
Total Machinery | | | | | | | 37,666,662 | |
Trading Companies & Distributors — 2.0% | | | | | | | | |
Fastenal Co. | | | 349,129 | | | | 18,832,018 | |
MSC Industrial Direct Co. Inc., Class A Shares | | | 48,467 | | | | 4,071,228 | |
Total Trading Companies & Distributors | | | | | | | 22,903,246 | |
Total Industrials | | | | | | | 113,161,002 | |
| Information Technology — 4.3% | | | | | | | | |
Communications Equipment — 2.7% | | | | | | | | |
Cisco Systems Inc. | | | 580,425 | | | | 30,341,717 | |
See Notes to Financial Statements.
| | | | | | |
| Franklin Low Volatility High Dividend Index ETFs 2023 Annual Report | | | | | 25 | |
Schedules of investments (cont’d)
March 31, 2023
Franklin U.S. Low Volatility High Dividend Index ETF
(Percentages shown based on Fund net assets)
| | | | | | | | |
| Security | | Shares | | | Value | |
Technology Hardware, Storage & Peripherals — 1.6% | | | | | | | | |
Seagate Technology Holdings PLC | | | 273,017 | | | | $18,051,884 | |
Total Information Technology | | | | | | | 48,393,601 | |
| Materials — 4.3% | | | | | | | | |
Chemicals — 2.4% | | | | | | | | |
Air Products & Chemicals Inc. | | | 95,130 | | | | 27,322,288 | |
Containers & Packaging — 1.9% | | | | | | | | |
International Paper Co. | | | 352,419 | | | | 12,708,229 | |
Packaging Corp. of America | | | 64,236 | | | | 8,917,884 | |
Total Containers & Packaging | | | | | | | 21,626,113 | |
Total Materials | | | | | | | 48,948,401 | |
| Real Estate — 11.6% | | | | | | | | |
Diversified REITs — 1.2% | | | | | | | | |
Armada Hoffler Properties Inc. | | | 59,746 | | | | 705,600 | |
Broadstone Net Lease Inc. | | | 144,322 | | | | 2,454,917 | |
WP Carey Inc. | | | 134,244 | | | | 10,397,198 | |
Total Diversified REITs | | | | | | | 13,557,715 | |
Health Care REITs — 2.4% | | | | | | | | |
CareTrust REIT Inc. | | | 98,287 | | | | 1,924,460 | |
Healthcare Realty Trust Inc. | | | 274,278 | | | | 5,301,794 | |
Medical Properties Trust Inc. | | | 1,705,247 | | | | 14,017,130 | |
National Health Investors Inc. | | | 31,142 | | | | 1,606,304 | |
Physicians Realty Trust | | | 301,646 | | | | 4,503,575 | |
Total Health Care REITs | | | | | | | 27,353,263 | |
Industrial REITs — 0.6% | | | | | | | | |
LXP Industrial Trust | | | 160,260 | | | | 1,652,281 | |
STAG Industrial Inc. | | | 165,717 | | | | 5,604,549 | |
Total Industrial REITs | | | | | | | 7,256,830 | |
Office REITs — 0.5% | | | | | | | | |
Corporate Office Properties Trust | | | 91,958 | | | | 2,180,324 | |
Easterly Government Properties Inc. | | | 108,748 | | | | 1,494,198 | |
Highwoods Properties Inc. | | | 88,776 | | | | 2,058,715 | |
Total Office REITs | | | | | | | 5,733,237 | |
Retail REITs — 4.9% | | | | | | | | |
Agree Realty Corp. | | | 100,381 | | | | 6,887,140 | |
Getty Realty Corp. | | | 32,137 | | | | 1,157,896 | |
Kimco Realty Corp. | | | 469,471 | | | | 9,168,769 | |
National Retail Properties Inc. | | | 134,814 | | | | 5,952,038 | |
Realty Income Corp. | | | 436,018 | | | | 27,608,660 | |
Spirit Realty Capital Inc. | | | 95,939 | | | | 3,822,210 | |
Total Retail REITs | | | | | | | 54,596,713 | |
Specialized REITs — 2.0% | | | | | | | | |
CubeSmart | | | 187,171 | | | | 8,651,043 | |
Four Corners Property Trust Inc. | | | 56,422 | | | | 1,515,495 | |
Gaming and Leisure Properties Inc. | | | 230,580 | | | | 12,003,995 | |
Total Specialized REITs | | | | | | | 22,170,533 | |
Total Real Estate | | | | | | | 130,668,291 | |
See Notes to Financial Statements.
| | | | |
| 26 | | | | Franklin Low Volatility High Dividend Index ETFs 2023 Annual Report |
Franklin U.S. Low Volatility High Dividend Index ETF
(Percentages shown based on Fund net assets)
| | | | | | | | | | | | |
| Security | | | | | Shares | | | Value | |
| Utilities — 25.9% | | | | | | | | | | | | |
Electric Utilities — 19.1% | | | | | | | | | | | | |
ALLETE Inc. | | | | | | | 41,971 | | | $ | 2,701,673 | |
Alliant Energy Corp. | | | | | | | 204,041 | | | | 10,895,789 | |
American Electric Power Co. Inc. | | | | | | | 311,667 | | | | 28,358,580 | |
Avangrid Inc. | | | | | | | 93,628 | | | | 3,733,885 | |
Duke Energy Corp. | | | | | | | 291,191 | | | | 28,091,196 | |
Entergy Corp. | | | | | | | 168,776 | | | | 18,183,926 | |
Evergy Inc. | | | | | | | 253,998 | | | | 15,524,358 | |
Eversource Energy | | | | | | | 213,683 | | | | 16,722,832 | |
Exelon Corp. | | | | | | | 661,046 | | | | 27,691,217 | |
FirstEnergy Corp. | | | | | | | 378,398 | | | | 15,158,624 | |
Hawaiian Electric Industries Inc. | | | | | | | 41,454 | | | | 1,591,834 | |
OGE Energy Corp. | | | | | | | 139,092 | | | | 5,238,205 | |
Pinnacle West Capital Corp. | | | | | | | 104,493 | | | | 8,280,025 | |
Portland General Electric Co. | | | | | | | 125,251 | | | | 6,123,521 | |
Southern Co. | | | | | | | 41,369 | | | | 2,878,455 | |
Xcel Energy Inc. | | | | | | | 346,750 | | | | 23,384,820 | |
Total Electric Utilities | | | | | | | | | | | 214,558,940 | |
Gas Utilities — 0.8% | | | | | | | | | | | | |
Northwest Natural Holding Co. | | | | | | | 29,788 | | | | 1,416,717 | |
UGI Corp. | | | | | | | 223,729 | | | | 7,776,820 | |
Total Gas Utilities | | | | | | | | | | | 9,193,537 | |
Multi-Utilities — 6.0% | | | | | | | | | | | | |
Avista Corp. | | | | | | | 85,593 | | | | 3,633,423 | |
Black Hills Corp. | | | | | | | 36,601 | | | | 2,309,523 | |
Consolidated Edison Inc. | | | | | | | 207,530 | | | | 19,854,395 | |
Dominion Energy Inc. | | | | | | | 376,115 | | | | 21,028,590 | |
NorthWestern Corp. | | | | | | | 58,688 | | | | 3,395,688 | |
WEC Energy Group Inc. | | | | | | | 172,997 | | | | 16,398,385 | |
Total Multi-Utilities | | | | | | | | | | | 66,620,004 | |
Total Utilities | | | | | | | | | | | 290,372,481 | |
Total Investments before Short-Term Investments (Cost — $1,131,122,586) | | | | | | | | | | | 1,113,727,126 | |
| | | |
| | | Rate | | | | | | | |
| Short-Term Investments — 0.5% | | | | | | | | | | | | |
Invesco Treasury Portfolio, Institutional Class (Cost — $5,249,031) | | | 4.716 | % | | | 5,249,031 | | | | 5,249,031 | (a) |
Total Investments — 99.7% (Cost — $1,136,371,617) | | | | | | | | | | | 1,118,976,157 | |
Other Assets in Excess of Liabilities — 0.3% | | | | | | | | | | | 3,616,954 | |
Total Net Assets — 100.0% | | | | | | | | | | $ | 1,122,593,111 | |
| (a) | Rate shown is one-day yield as of the end of the reporting period. |
|
Abbreviation(s) used in this schedule: |
|
| REIT — Real Estate Investment Trust |
See Notes to Financial Statements.
| | | | | | |
| Franklin Low Volatility High Dividend Index ETFs 2023 Annual Report | | | | | 27 | |
Schedules of investments (cont’d)
March 31, 2023
Franklin U.S. Low Volatility High Dividend Index ETF
At March 31, 2023, the Fund had the following open futures contracts:
| | | | | | | | | | | | | | | | | | | | |
| | | Number of Contracts | | | Expiration Date | | | Notional Amount | | | Market Value | | | Unrealized Appreciation | |
| Contracts to Buy: | | | | | | | | | | | | | | | | | | | | |
| E-mini S&P 500 Index | | | 21 | | | | 6/23 | | | $ | 4,164,838 | | | $ | 4,344,637 | | | $ | 179,799 | |
See Notes to Financial Statements.
| | | | |
| 28 | | | | Franklin Low Volatility High Dividend Index ETFs 2023 Annual Report |
Statements of assets and liabilities
March 31, 2023
| | | | | | | | |
| | | Franklin International Low Volatility High Dividend Index ETF | | | Franklin U.S. Low Volatility High Dividend Index ETF | |
| | |
| Assets: | | | | | | | | |
Investments, at value (Cost — $351,950,898 and $1,136,371,617, respectively) | | $ | 371,605,444 | | | $ | 1,118,976,157 | |
Foreign currency, at value (Cost — $629,095 and $0, respectively) | | | 630,692 | | | | — | |
Dividends receivable | | | 2,182,387 | | | | 3,827,541 | |
Receivable for securities sold | | | 1,882,567 | | | | — | |
Unrealized appreciation on forward foreign currency contracts | | | 181,977 | | | | — | |
Receivable for Fund shares sold | | | 145,202 | | | | 1,509 | |
Receivable from brokers — net variation margin on open futures contracts | | | 101,794 | | | | 179,799 | |
European Union tax reclaims receivable (Note 1) | | | 64,921 | | | | — | |
Deposits with brokers for open futures contracts | | | — | | | | 115,963 | |
Total Assets | | | 376,794,984 | | | | 1,123,100,969 | |
| | |
| Liabilities: | | | | | | | | |
Unrealized depreciation on forward foreign currency contracts | | | 6,805,414 | | | | — | |
Distributions payable | | | 1,599,999 | | | | — | |
Payable for securities purchased | | | 1,418,956 | | | | — | |
Investment management fee payable | | | 118,717 | | | | 234,580 | |
Deposits from brokers for open futures contracts | | | 41,024 | | | | — | |
European Union tax reclaim contingent fees payable (Note 1) | | | 16,231 | | | | — | |
Due to custodian | | | — | | | | 268,750 | |
Payable for Fund shares repurchased | | | — | | | | 4,528 | |
Total Liabilities | | | 10,000,341 | | | | 507,858 | |
| Total Net Assets | | $ | 366,794,643 | | | $ | 1,122,593,111 | |
| | |
| Net Assets: | | | | | | | | |
Par value (Note 5) | | $ | 137 | | | $ | 301 | |
Paid-in capital in excess of par value | | | 361,633,624 | | | | 1,259,110,291 | |
Total distributable earnings (loss) | | | 5,160,882 | | | | (136,517,481) | |
| Total Net Assets | | | $366,794,643 | | | | $1,122,593,111 | |
| | |
| Shares Outstanding | | | 13,680,000 | | | | 30,100,000 | |
| | |
| Net Asset Value | | | $26.81 | | | | $37.30 | |
See Notes to Financial Statements.
| | | | | | |
| Franklin Low Volatility High Dividend Index ETFs 2023 Annual Report | | | | | 29 | |
Statements of operations
For the Year Ended March 31, 2023
| | | | | | | | |
| | | Franklin International Low Volatility High Dividend Index ETF | | | Franklin U.S. Low Volatility High Dividend Index ETF | |
| | |
| Investment Income: | | | | | | | | |
Dividends | | $ | 10,256,504 | | | $ | 30,256,375 | |
European Union tax reclaims (Note 1) | | | 64,921 | | | | — | |
Less: Foreign taxes withheld | | | (665,859) | | | | — | |
Total Investment Income | | | 9,655,566 | | | | 30,256,375 | |
| | |
| Expenses: | | | | | | | | |
Investment management fee (Note 2) | | | 740,768 | | | | 2,143,746 | |
European Union tax reclaim contingent fees (Note 1) | | | 16,231 | | | | — | |
Total Expenses | | | 756,999 | | | | 2,143,746 | |
| Net Investment Income | | | 8,898,567 | | | | 28,112,629 | |
|
| Realized and Unrealized Gain (Loss) on Investments, Futures Contracts, Forward Foreign Currency Contracts and Foreign Currency Transactions (Notes 1, 3 and 4): | |
Net Realized Gain (Loss) From: | | | | | | | | |
Investment transactions | | | (2,068,303) | | | | 84,554,368 | |
Futures contracts | | | 653,475 | | | | 71,693 | |
Forward foreign currency contracts | | | 7,702,452 | | | | — | |
Foreign currency transactions | | | (1,281,969) | | | | — | |
Net Realized Gain | | | 5,005,655 | | | | 84,626,061 | |
Change in Net Unrealized Appreciation (Depreciation) From: | | | | | | | | |
Investments | | | 15,193,537 | | | | (124,311,973) | |
Futures contracts | | | 73,000 | | | | 23,404 | |
Forward foreign currency contracts | | | (6,992,205) | | | | — | |
Foreign currencies | | | 10,985 | | | | — | |
Change in Net Unrealized Appreciation (Depreciation) | | | 8,285,317 | | | | (124,288,569) | |
| Net Gain (Loss) on Investments, Futures Contracts, Forward Foreign Currency Contracts and Foreign Currency Transactions | | | 13,290,972 | | | | (39,662,508) | |
| Increase (Decrease) in Net Assets From Operations | | $ | 22,189,539 | | | $ | (11,549,879) | |
See Notes to Financial Statements.
| | | | |
| 30 | | | | Franklin Low Volatility High Dividend Index ETFs 2023 Annual Report |
Statements of changes in net assets
Franklin International Low Volatility High Dividend Index ETF
| | | | | | | | | | | | |
For the Year Ended March 31, 2023, the Period Ended March 31, 2022 and the Year Ended October 31, 2021 | | 2023 | | | 2022† | | | 2021 | |
| | | |
| Operations: | | | | | | | | | | | | |
Net investment income | | $ | 8,898,567 | | | $ | 1,362,130 | | | $ | 2,953,235 | |
Net realized gain | | | 5,005,655 | | | | 1,442,589 | | | | 2,706,473 | |
Change in net unrealized appreciation (depreciation) | | | 8,285,317 | | | | 1,892,546 | | | | 8,966,631 | |
Increase in Net Assets From Operations | | | 22,189,539 | | | | 4,697,265 | | | | 14,626,339 | |
| | | |
| Distributions to Shareholders From (Note 1): | | | | | | | | | | | | |
Total distributable earnings | | | (13,829,462) | | | | (996,904) | | | | (3,400,710) | |
Decrease in Net Assets From Distributions to Shareholders | | | (13,829,462) | | | | (996,904) | | | | (3,400,710) | |
| | | |
| Fund Share Transactions (Note 5): | | | | | | | | | | | | |
Net proceeds from sale of shares (10,620,000, 660,000 and 780,000 shares issued, respectively) | | | 276,034,141 | | | | 18,014,305 | | | | 20,032,871 | |
Cost of shares repurchased (720,000, 0 and 180,000 shares repurchased, respectively) | | | (19,890,389) | | | | — | | | | (4,234,783) | |
Increase in Net Assets From Fund Share Transactions | | | 256,143,752 | | | | 18,014,305 | | | | 15,798,088 | |
Increase in Net Assets | | | 264,503,829 | | | | 21,714,666 | | | | 27,023,717 | |
| | | |
| Net Assets: | | | | | | | | | | | | |
Beginning of year | | | 102,290,814 | | | | 80,576,148 | | | | 53,552,431 | |
End of year | | $ | 366,794,643 | | | $ | 102,290,814 | | | $ | 80,576,148 | |
| † | For the period November 1, 2021 through March 31, 2022. |
See Notes to Financial Statements.
| | | | | | |
| Franklin Low Volatility High Dividend Index ETFs 2023 Annual Report | | | | | 31 | |
Statements of changes in net assets (cont’d)
Franklin U.S. Low Volatility High Dividend Index ETF
| | | | | | | | | | | | |
For the Year Ended March 31, 2023, the Period Ended March 31, 2022 and the Year Ended October 31, 2021 | | 2023 | | | 2022† | | | 2021 | |
| | | |
| Operations: | | | | | | | | | | | | |
Net investment income | | $ | 28,112,629 | | | $ | 8,350,472 | | | $ | 20,565,556 | |
Net realized gain | | | 84,626,061 | | | | 32,474,944 | | | | 71,720,894 | |
Change in net unrealized appreciation (depreciation) | | | (124,288,569) | | | | 14,718,658 | | | | 98,709,612 | |
Increase (Decrease) in Net Assets From Operations | | | (11,549,879) | | | | 55,544,074 | | | | 190,996,062 | |
| | | |
| Distributions to Shareholders From (Note 1): | | | | | | | | | | | | |
Total distributable earnings | | | (25,402,005) | | | | (10,500,011) | | | | (22,234,998) | |
Decrease in Net Assets From Distributions to Shareholders | | | (25,402,005) | | | | (10,500,011) | | | | (22,234,998) | |
| | | |
| Fund Share Transactions (Note 5): | | | | | | | | | | | | |
Net proceeds from sale of shares (24,300,000, 2,450,000 and 7,350,000 shares issued, respectively) | | | 917,020,304 | | | | 96,197,933 | | | | 259,815,707 | |
Cost of shares repurchased (12,550,000, 4,000,000 and 10,300,000 shares repurchased, respectively) | | | (485,111,246) | | | | (156,109,527) | | | | (357,062,815) | |
Increase (Decrease) in Net Assets From Fund Share Transactions | | | 431,909,058 | | | | (59,911,594) | | | | (97,247,108) | |
Increase (Decrease) in Net Assets | | | 394,957,174 | | | | (14,867,531) | | | | 71,513,956 | |
| | | |
| Net Assets: | | | | | | | | | | | | |
Beginning of year | | | 727,635,937 | | | | 742,503,468 | | | | 670,989,512 | |
End of year | | $ | 1,122,593,111 | | | $ | 727,635,937 | | | $ | 742,503,468 | |
| † | For the period November 1, 2021 through March 31, 2022. |
See Notes to Financial Statements.
| | | | |
| 32 | | | | Franklin Low Volatility High Dividend Index ETFs 2023 Annual Report |
Financial highlights
Franklin International Low Volatility High Dividend Index ETF
| | | | | | | | | | | | | | | | | | | | | | | | |
For a share of beneficial interest outstanding throughout each year ended March 31, unless otherwise noted: | |
| | | 20231 | | | 20221,2 | | | 20211,3 | | | 20201,3 | | | 20191,3 | | | 20181,3 | |
| | | | | | |
| Net asset value, beginning of year | | | $27.06 | | | | $25.83 | | | | $21.25 | | | | $27.15 | | | | $26.42 | | | | $28.19 | |
| | | | | | |
| Income (loss) from operations: | | | | | | | | | | | | | | | | | | | | | | | | |
Net investment income | | | 1.25 | | | | 0.41 | | | | 1.13 | | | | 1.00 | | | | 1.18 | | | | 1.22 | |
Net realized and unrealized gain (loss) | | | 0.50 | | | | 1.12 | | | | 4.78 | | | | (5.47) | | | | 1.85 | | | | (1.65) | |
Total income (loss) from operations | | | 1.75 | | | | 1.53 | | | | 5.91 | | | | (4.47) | | | | 3.03 | | | | (0.43) | |
| | | | | | |
| Less distributions from: | | | | | | | | | | | | | | | | | | | | | | | | |
Net investment income | | | (1.06) | | | | (0.30) | | | | (1.33) | | | | (1.13) | | | | (1.16) | | | | (1.34) | |
Net realized gains | | | (0.94) | | | | — | | | | — | | | | (0.30) | | | | (1.14) | | | | — | |
Total distributions | | | (2.00) | | | | (0.30) | | | | (1.33) | | | | (1.43) | | | | (2.30) | | | | (1.34) | |
| | | | | | |
| Net asset value, end of year | | | $26.81 | | | | $27.06 | | | | $25.83 | | | | $21.25 | | | | $27.15 | | | | $26.42 | |
Total return, based on NAV4 | | | 6.90 | % | | | 5.98 | % | | | 28.28 | % | | | (17.20) | % | | | 12.65 | % | | | (1.49) | % |
| | | | | | |
| Net assets, end of year (000s) | | | $366,795 | | | | $102,291 | | | | $80,576 | | | | $53,552 | | | | $53,751 | | | | $49,144 | |
| | | | | | |
| Ratios to average net assets: | | | | | | | | | | | | | | | | | | | | | | | | |
Gross expenses | | | 0.41 | %5 | | | 0.40 | %6 | | | 0.40 | % | | | 0.40 | % | | | 0.40 | % | | | 0.40 | % |
Net expenses | | | 0.41 | 5 | | | 0.40 | 6 | | | 0.40 | | | | 0.40 | | | | 0.40 | | | | 0.40 | |
Net investment income | | | 4.81 | | | | 3.75 | 6 | | | 4.51 | | | | 4.28 | | | | 4.54 | | | | 4.46 | |
| | | | | | |
| Portfolio turnover rate7 | | | 78 | % | | | 24 | % | | | 54 | % | | | 96 | % | | | 41 | % | | | 41 | % |
| 1 | Per share amounts have been calculated using the average shares method. |
| 2 | For the period November 1, 2021 through March 31, 2022. |
| 3 | For the year ended October 31. |
| 4 | Performance figures may reflect fee waivers and/or expense reimbursements. In the absence of fee waivers and/or expense reimbursements, the total return would have been lower. The total return calculation assumes that distributions are reinvested at NAV. Past performance is no guarantee of future results. Total returns for periods of less than one year are not annualized. |
| 5 | Expense ratios are including non-recurring European Union tax reclaim contingent fees that were incurred by the Fund during the period. Without these fees, the gross and net expense ratios would have been 0.40% and 0.40%, respectively, for the year ended March 31, 2023. |
| 7 | Portfolio turnover excludes the value of portfolio securities received or delivered as a result of in-kind fund share transactions. |
See Notes to Financial Statements.
| | | | | | |
| Franklin Low Volatility High Dividend Index ETFs 2023 Annual Report | | | | | 33 | |
Financial highlights (cont’d)
Franklin U.S. Low Volatility High Dividend Index ETF
| | | | | | | | | | | | | | | | | | | | | | | | |
For a share of beneficial interest outstanding throughout each year ended March 31, unless otherwise noted: | |
| | | 20231 | | | 20221,2 | | | 20211,3 | | | 20201,3 | | | 20191,3 | | | 20181,3 | |
| | | | | | |
| Net asset value, beginning of year | | | $39.65 | | | | $37.31 | | | | $29.36 | | | | $33.77 | | | | $30.19 | | | | $30.60 | |
| | | | | | |
| Income (loss) from operations: | | | | | | | | | | | | | | | | | | | | | | | | |
Net investment income | | | 1.33 | | | | 0.43 | | | | 0.99 | | | | 1.13 | | | | 1.11 | | | | 1.09 | |
Net realized and unrealized gain (loss) | | | (2.46) | | | | 2.45 | | | | 8.01 | | | | (4.45) | | | | 3.36 | | | | (0.41) | |
Total income (loss) from operations | | | (1.13) | | | | 2.88 | | | | 9.00 | | | | (3.32) | | | | 4.47 | | | | 0.68 | |
| | | | | | |
| Less distributions from: | | | | | | | | | | | | | | | | | | | | | | | | |
Net investment income | | | (1.22) | | | | (0.54) | | | | (1.05) | | | | (1.09) | | | | (0.89) | | | | (1.09) | |
Total distributions | | | (1.22) | | | | (0.54) | | | | (1.05) | | | | (1.09) | | | | (0.89) | | | | (1.09) | |
| | | | | | |
| Net asset value, end of year | | | $37.30 | | | | $39.65 | | | | $37.31 | | | | $29.36 | | | | $33.77 | | | | $30.19 | |
Total return, based on NAV4 | | | (2.85) | % | | | 7.76 | % | | | 31.07 | % | | | (9.90) | % | | | 15.15 | % | | | 2.25 | % |
| | | | | | |
| Net assets, end of year (millions) | | | $1,123 | | | | $728 | | | | $743 | | | | $671 | | | | $824 | | | | $578 | |
| | | | | | |
| Ratios to average net assets: | | | | | | | | | | | | | | | | | | | | | | | | |
Gross expenses | | | 0.27 | % | | | 0.27 | %5 | | | 0.27 | % | | | 0.27 | % | | | 0.27 | % | | | 0.27 | % |
Net expenses | | | 0.27 | | | | 0.27 | 5 | | | 0.27 | | | | 0.27 | | | | 0.27 | | | | 0.27 | |
Net investment income | | | 3.54 | | | | 2.71 | 5 | | | 2.84 | | | | 3.69 | | | | 3.50 | | | | 3.60 | |
| | | | | | |
| Portfolio turnover rate6 | | | 52 | % | | | 14 | % | | | 52 | % | | | 48 | % | | | 29 | % | | | 44 | % |
| 1 | Per share amounts have been calculated using the average shares method. |
| 2 | For the period November 1, 2021 through March 31, 2022. |
| 3 | For the year ended October 31. |
| 4 | Performance figures may reflect fee waivers and/or expense reimbursements. In the absence of fee waivers and/or expense reimbursements, the total return would have been lower. The total return calculation assumes that distributions are reinvested at NAV. Past performance is no guarantee of future results. Total returns for periods of less than one year are not annualized. |
| 6 | Portfolio turnover excludes the value of portfolio securities received or delivered as a result of in-kind fund share transactions. |
See Notes to Financial Statements.
| | | | |
| 34 | | | | Franklin Low Volatility High Dividend Index ETFs 2023 Annual Report |
Notes to financial statements
1. Organization and significant accounting policies
Franklin International Low Volatility High Dividend Index ETF (“International Low Volatility High Dividend Index ETF”) and Franklin U.S. Low Volatility High Dividend Index ETF (“U.S. Low Volatility High Dividend Index ETF”) (the “Funds”) (prior to June 22, 2022, the Funds were known as Legg Mason International Low Volatility High Dividend ETF and Legg Mason Low Volatility High Dividend ETF) are separate diversified investment series of Legg Mason ETF Investment Trust (the “Trust”). The Trust, a Maryland statutory trust, is registered under the Investment Company Act of 1940, as amended (the “1940 Act”), as an open-end management investment company.
The Funds are exchange-traded funds (“ETFs”). ETFs are funds that trade like other publicly-traded securities. The Funds are designed to track an index. Similar to shares of an index mutual fund, each share of the Funds represents an ownership interest in an underlying portfolio of securities intended to track an index. Unlike shares of a mutual fund, which can be bought from and redeemed by the issuing fund by all shareholders at a price based on net asset value (“NAV”), shares of the Funds may be directly purchased from and redeemed by the Funds at NAV solely by certain large institutional investors who have entered into agreements with the Funds’ distributor (“Authorized Participants”). Also unlike shares of a mutual fund, shares of the Funds are listed on a national securities exchange and trade in the secondary market at market prices that change throughout the day.
Shares of the Funds are listed and traded at market prices on the Cboe BZX Exchange, Inc. for International Low Volatility High Dividend Index ETF and NASDAQ for U.S. Low Volatility High Dividend Index ETF. The market price for a Fund’s shares may be different from a Fund’s NAV. The Funds issue and redeem shares at NAV only in blocks of a specified number of shares or multiples thereof (“Creation Units”). Only Authorized Participants may purchase or redeem Creation Units directly with the Funds at NAV. Creation Units are issued and redeemed generally in-kind for a basket of securities and/or cash. Except when aggregated in Creation Units, shares of the Funds are not redeemable securities. Shareholders who are not Authorized Participants may not redeem shares directly from the Funds at NAV.
International Low Volatility High Dividend Index ETF and U.S. Low Volatility High Dividend Index ETF seek to track the investment results of the QS International Low Volatility High Dividend Hedged Index and QS Low Volatility High Dividend Index, respectively (together, the “Indices”). The QS International Low Volatility High Dividend Hedged Index seeks to provide more stable income through investments in stocks of profitable companies in developed markets outside of the United States with relatively high dividend yields or anticipated dividend yields and lower price and earnings volatility while mitigating exposure to exchange-rate fluctuations between the U.S. dollar and other international currencies. The QS Low Volatility High Dividend Index seeks to provide more stable income through investments in stocks of profitable U.S. companies with relatively high dividend yields and lower price and earnings volatility. The Indices are based on a proprietary methodology created and sponsored by Franklin Advisers, Inc. (“Franklin Advisers”), the Funds’ subadviser.
The Funds follow the accounting and reporting guidance in Financial Accounting Standards Board (“FASB”) Accounting Standards Codification Topic 946, Financial Services – Investment Companies (“ASC 946”). The following are significant accounting policies consistently followed by the Funds and are in conformity with U.S. generally accepted accounting principles (“GAAP”), including, but not limited to, ASC 946. Estimates and assumptions are required to be made regarding assets, liabilities and changes in net assets resulting from operations when financial statements are prepared. Changes in the economic environment, financial markets and any other parameters used in determining these estimates could cause actual results to differ. Subsequent events have been evaluated through the date the financial statements were issued.
(a) Investment valuation. Equity securities for which market quotations are available are valued at the last reported sales price or official closing price on the primary market or exchange on which they trade. The valuations for fixed income securities (which may include, but are not limited to, corporate, government, municipal, mortgage-backed, collateralized mortgage obligations and asset-backed securities) and certain derivative instruments are typically the prices supplied by independent third party pricing services, which may use market prices or broker/dealer quotations or a variety of valuation techniques and methodologies. The independent third party pricing services typically use inputs that are observable such as issuer details, interest rates, yield curves, prepayment speeds, credit risks/spreads, default rates and quoted prices for similar securities. Investments in open-end funds are valued at the closing net asset value per share of each fund on the day of valuation. Futures contracts are valued daily at the settlement price established by the board of trade or exchange on which they are traded. When the Funds hold securities or other assets that are denominated in a foreign currency, the Funds will use the currency exchange rates, generally determined as of 4:00 p.m. (London Time). If independent third party pricing services are unable to supply prices for a portfolio investment, or if the prices supplied are deemed by the manager to be unreliable, the market price may be determined by the manager using quotations from one or more broker/dealers or at the transaction price if the security has recently been purchased and no value has yet been obtained from a pricing service or pricing broker. When reliable prices are not readily available, such as when the value of a security has been significantly affected by events after the close of the exchange or market on which the security is principally traded, but before each Fund calculates its net asset value, the Funds value these securities as determined in accordance with procedures approved by the Funds’ Board of Trustees.
| | | | | | |
| Franklin Low Volatility High Dividend Index ETFs 2023 Annual Report | | | | | 35 | |
Notes to financial statements (cont’d)
Pursuant to policies adopted by the Board of Trustees, the Funds’ manager has been designated as the valuation designee and is responsible for the oversight of the daily valuation process. The Funds’ manager is assisted by the Global Fund Valuation Committee (the “Valuation Committee”). The Valuation Committee is responsible for making fair value determinations, evaluating the effectiveness of the Funds’ pricing policies, and reporting to the Funds’ manager and the Board of Trustees. When determining the reliability of third party pricing information for investments owned by the Funds, the Valuation Committee, among other things, conducts due diligence reviews of pricing vendors, monitors the daily change in prices and reviews transactions among market participants.
The Valuation Committee will consider pricing methodologies it deems relevant and appropriate when making fair value determinations. Examples of possible methodologies include, but are not limited to, multiple of earnings; discount from market of a similar freely traded security; discounted cash-flow analysis; book value or a multiple thereof; risk premium/yield analysis; yield to maturity; and/or fundamental investment analysis. The Valuation Committee will also consider factors it deems relevant and appropriate in light of the facts and circumstances. Examples of possible factors include, but are not limited to, the type of security; the issuer’s financial statements; the purchase price of the security; the discount from market value of unrestricted securities of the same class at the time of purchase; analysts’ research and observations from financial institutions; information regarding any transactions or offers with respect to the security; the existence of merger proposals or tender offers affecting the security; the price and extent of public trading in similar securities of the issuer or comparable companies; and the existence of a shelf registration for restricted securities.
For each portfolio security that has been fair valued pursuant to the policies adopted by the Board of Trustees, the fair value price is compared against the last available and next available market quotations. The Valuation Committee reviews the results of such back testing monthly and fair valuation occurrences are reported to the Board of Trustees quarterly.
The Funds use valuation techniques to measure fair value that are consistent with the market approach and/or income approach, depending on the type of security and the particular circumstance. The market approach uses prices and other relevant information generated by market transactions involving identical or comparable securities. The income approach uses valuation techniques to discount estimated future cash flows to present value.
GAAP establishes a disclosure hierarchy that categorizes the inputs to valuation techniques used to value assets and liabilities at measurement date. These inputs are summarized in the three broad levels listed below:
| • | | Level 1 — unadjusted quoted prices in active markets for identical investments |
| • | | Level 2 — other significant observable inputs (including quoted prices for similar investments, interest rates, prepayment speeds, credit risk, etc.) |
| • | | Level 3 — significant unobservable inputs (including the Funds’ own assumptions in determining the fair value of investments) |
The inputs or methodologies used to value securities are not necessarily an indication of the risk associated with investing in those securities.
The following is a summary of the inputs used in valuing the Funds’ assets and liabilities carried at fair value:
International Low Volatility High Dividend Index ETF
| | | | | | | | | | | | | | | | |
| ASSETS | |
| Description | | Quoted Prices (Level 1) | | | Other Significant Observable Inputs (Level 2) | | | Significant Unobservable Inputs (Level 3) | | | Total | |
| Long-Term Investments†: | | | | | | | | | | | | | | | | |
Common Stocks | | $ | 360,945,555 | | | | — | | | | — | | | $ | 360,945,555 | |
Preferred Stocks | | | 9,051,424 | | | | — | | | | — | | | | 9,051,424 | |
| Total Long-Term Investments | | | 369,996,979 | | | | — | | | | — | | | | 369,996,979 | |
| Short-Term Investments† | | | 1,608,465 | | | | — | | | | — | | | | 1,608,465 | |
| Total Investments | | $ | 371,605,444 | | | | — | | | | — | | | $ | 371,605,444 | |
| Other Financial Instruments: | | | | | | | | | | | | | | | | |
Futures Contracts†† | | $ | 101,794 | | | | — | | | | — | | | $ | 101,794 | |
Forward Foreign Currency Contracts†† | | | — | | | $ | 181,977 | | | | — | | | | 181,977 | |
| Total Other Financial Instruments | | $ | 101,794 | | | $ | 181,977 | | | | — | | | $ | 283,771 | |
| Total | | $ | 371,707,238 | | | $ | 181,977 | | | | — | | | $ | 371,889,215 | |
| | | | |
| 36 | | | | Franklin Low Volatility High Dividend Index ETFs 2023 Annual Report |
| | | | | | | | | | | | | | | | |
|
| LIABILITIES | |
| Description | | Quoted Prices (Level 1) | | | Other Significant Observable Inputs (Level 2) | | | Significant Unobservable Inputs (Level 3) | | | Total | |
| Other Financial Instruments: | | | | | | | | | | | | | | | | |
Forward Foreign Currency Contracts†† | | | — | | | $ | 6,805,414 | | | | — | | | $ | 6,805,414 | |
| † | See Schedule of Investments for additional detailed categorizations. |
| †† | Reflects the unrealized appreciation (depreciation) of the instruments. |
U.S. Low Volatility High Dividend Index ETF
| | | | | | | | | | | | | | | | |
| ASSETS | |
| Description | | Quoted Prices (Level 1) | | | Other Significant Observable Inputs (Level 2) | | | Significant Unobservable Inputs (Level 3) | | | Total | |
| Common Stocks† | | $ | 1,113,727,126 | | | | — | | | | — | | | $ | 1,113,727,126 | |
| Short-Term Investments† | | | 5,249,031 | | | | — | | | | — | | | | 5,249,031 | |
| Total Investments | | $ | 1,118,976,157 | | | | — | | | | — | | | $ | 1,118,976,157 | |
| Other Financial Instruments: | | | | | | | | | | | | | | | | |
Futures Contracts†† | | $ | 179,799 | | | | — | | | | — | | | $ | 179,799 | |
| Total | | $ | 1,119,155,956 | | | | — | | | | — | | | $ | 1,119,155,956 | |
| † | See Schedule of Investments for additional detailed categorizations. |
| †† | Reflects the unrealized appreciation (depreciation) of the instruments. |
(b) Futures contracts. The Funds use futures contracts generally to gain or manage exposure to certain asset classes, sectors, or markets or for cash management purposes. A futures contract represents a commitment for the future purchase or sale of an asset at a specified price on a specified date.
Upon entering into a futures contract, the Funds are required to deposit cash or securities with a broker in an amount equal to a certain percentage of the contract amount. This is known as the ‘‘initial margin’’ and subsequent payments (‘‘variation margin’’) are made or received by the Funds each day, depending on the daily fluctuation in the value of the contract. For certain futures, including foreign denominated futures, variation margin is not settled daily, but is recorded as a net variation margin payable or receivable. The daily changes in contract value are recorded as unrealized appreciation or depreciation in the Statements of Operations and the Funds recognize a realized gain or loss when the contract is closed.
Futures contracts involve, to varying degrees, risk of loss in excess of the amounts reflected in the financial statements. In addition, there is the risk that the Funds may not be able to enter into a closing transaction because of an illiquid secondary market.
(c) Forward foreign currency contracts. The Funds enter into a forward foreign currency contract to hedge against foreign currency exchange rate risk on its non-U.S. dollar denominated securities or to facilitate settlement of a foreign currency denominated portfolio transaction. A forward foreign currency contract is an agreement between two parties to buy and sell a currency at a set price with delivery and settlement at a future date. The contract is marked-to-market daily and the change in value is recorded by the Funds as an unrealized gain or loss. When a forward foreign currency contract is closed, through either delivery or offset by entering into another forward foreign currency contract, the Funds recognize a realized gain or loss equal to the difference between the value of the contract at the time it was opened and the value of the contract at the time it is closed.
Forward foreign currency contracts involve elements of market risk in excess of the amounts reflected on the Statements of Assets and Liabilities. The Funds bear the risk of an unfavorable change in the foreign exchange rate underlying the forward foreign currency contract. Risks may also arise upon entering into these contracts from the potential inability of the counterparties to meet the terms of their contracts.
(d) Foreign currency translation. Investment securities and other assets and liabilities denominated in foreign currencies are translated into U.S. dollar amounts based upon prevailing exchange rates on the date of valuation. Purchases and sales of investment securities and income and expense items denominated in foreign currencies are translated into U.S. dollar amounts based upon prevailing exchange rates on the respective dates of such transactions.
| | | | | | |
| Franklin Low Volatility High Dividend Index ETFs 2023 Annual Report | | | | | 37 | |
Notes to financial statements (cont’d)
The Funds do not isolate that portion of the results of operations resulting from fluctuations in foreign exchange rates on investments from the fluctuations arising from changes in market prices of securities held. Such fluctuations are included with the net realized and unrealized gain or loss on investments.
Net realized foreign exchange gains or losses arise from sales of foreign currencies, including gains and losses on forward foreign currency contracts, currency gains or losses realized between the trade and settlement dates on securities transactions, and the difference between the amounts of dividends, interest, and foreign withholding taxes recorded on the Funds’ books and the U.S. dollar equivalent of the amounts actually received or paid. Net unrealized foreign exchange gains and losses arise from changes in the values of assets and liabilities, other than investments in securities, on the date of valuation, resulting from changes in exchange rates.
Foreign security and currency transactions may involve certain considerations and risks not typically associated with those of U.S. dollar denominated transactions as a result of, among other factors, the possibility of lower levels of governmental supervision and regulation of foreign securities markets and the possibility of political or economic instability.
(e) Foreign investment risks. The Funds’ investments in foreign securities may involve risks not present in domestic investments. Since securities may be denominated in foreign currencies, may require settlement in foreign currencies or may pay interest or dividends in foreign currencies, changes in the relationship of these foreign currencies to the U.S. dollar can significantly affect the value of the investments and earnings of the Funds. Foreign investments may also subject the Funds to foreign government exchange restrictions, expropriation, taxation or other political, social or economic developments, all of which affect the market and/or credit risk of the investments.
(f) Counterparty risk and credit-risk-related contingent features of derivative instruments. The Funds may invest in certain securities or engage in other transactions where the Funds are exposed to counterparty credit risk in addition to broader market risks. The Funds may invest in securities of issuers, which may also be considered counterparties as trading partners in other transactions. This may increase the risk of loss in the event of default or bankruptcy by the counterparty or if the counterparty otherwise fails to meet its contractual obligations. The Funds’ subadviser attempts to mitigate counterparty risk by (i) periodically assessing the creditworthiness of its trading partners, (ii) monitoring and/or limiting the amount of its net exposure to each individual counterparty based on its assessment and (iii) requiring collateral from the counterparty for certain transactions. Market events and changes in overall economic conditions may impact the assessment of such counterparty risk by the subadviser. In addition, declines in the values of underlying collateral received may expose the Funds to increased risk of loss.
With exchange traded and centrally cleared derivatives, there is less counterparty risk to the Funds since the exchange or clearinghouse, as counterparty to such instruments, guarantees against a possible default. The clearinghouse stands between the buyer and the seller of the contract; therefore, the credit risk is limited to failure of the clearinghouse. While offset rights may exist under applicable law, the Funds do not have a contractual right of offset against a clearing broker or clearinghouse in the event of a default of the clearing broker or clearinghouse.
The Funds have entered into master agreements, such as an International Swaps and Derivatives Association, Inc. Master Agreement (“ISDA Master Agreement”) or similar agreement, with certain of its derivative counterparties that govern over-the-counter (“OTC”) derivatives and provide for general obligations, representations, agreements, collateral posting terms, netting provisions in the event of default or termination and credit related contingent features. The credit related contingent features include, but are not limited to, a percentage decrease in the Funds’ net assets or net asset value per share over a specified period of time. If these credit related contingent features were triggered, the derivatives counterparty could terminate the positions and demand payment or require additional collateral.
Under an ISDA Master Agreement, the Funds may, under certain circumstances, offset with the counterparty certain derivative financial instruments’ payables and/or receivables with collateral held and/or posted and create one single net payment. However, absent an event of default by the counterparty or a termination of the agreement, the terms of the ISDA Master Agreements do not result in an offset of reported amounts of financial assets and financial liabilities in the Statements of Assets and Liabilities across transactions between the Funds and the applicable counterparty. The enforceability of the right to offset may vary by jurisdiction.
Collateral requirements differ by type of derivative. Collateral or margin requirements are set by the broker or exchange clearinghouse for exchange traded derivatives while collateral terms are contract specific for OTC traded derivatives. Cash collateral that has been pledged to cover obligations of the Funds under derivative contracts, if any, will be reported separately in the Statements of Assets and Liabilities. Securities pledged as collateral, if any, for the same purpose are noted in the Schedules of Investments.
As of March 31, 2023, International Low Volatility High Dividend Index ETF held forward foreign currency contracts with credit related contingent features which had a liability position of $6,805,414. If a contingent feature in the master agreements would have been triggered, the Fund would have been required to pay this amount to its derivatives counterparties.
| | | | |
| 38 | | | | Franklin Low Volatility High Dividend Index ETFs 2023 Annual Report |
(g) Security transactions and investment income. Security transactions are accounted for on a trade date basis. Interest income (including interest income from payment-in-kind securities), adjusted for amortization of premium and accretion of discount, is recorded on the accrual basis. Dividend income is recorded on the ex-dividend date for dividends received in cash and/or securities. Foreign dividend income is recorded on the ex-dividend date or as soon as practicable after International Low Volatility High Dividend Index ETF determines the existence of a dividend declaration after exercising reasonable due diligence. The cost of investments sold is determined by use of the specific identification method. To the extent any issuer defaults or a credit event occurs that impacts the issuer, the Funds may halt any additional interest income accruals and consider the realizability of interest accrued up to the date of default or credit event.
(h) REIT distributions. The character of distributions received from Real Estate Investment Trusts (‘‘REITs’’) held by the Funds is generally comprised of net investment income, capital gains, and return of capital. It is the policy of the Funds to estimate the character of distributions received from underlying REITs based on historical data provided by the REITs. After each calendar year end, REITs report the actual tax character of these distributions. Differences between the estimated and actual amounts reported by the REITs are reflected in the Funds’ records in the year in which they are reported by the REITs by adjusting related investment cost basis, capital gains and income, as necessary.
(i) Distributions to shareholders. Distributions from net investment income of the Funds, if any, are declared and paid on a quarterly basis. Distributions of net realized gains, if any, are declared at least annually. Distributions to shareholders of the Funds are recorded on the ex-dividend date and are determined in accordance with income tax regulations, which may differ from GAAP.
(j) Federal and other taxes. It is the Funds’ policy to comply with the federal income and excise tax requirements of the Internal Revenue Code of 1986 (the “Code”), as amended, applicable to regulated investment companies. Accordingly, the Funds intend to distribute their taxable income and net realized gains, if any, to shareholders in accordance with timing requirements imposed by the Code. Therefore, no federal or state income tax provision is required in the Funds’ financial statements.
Management has analyzed the Funds’ tax positions taken on income tax returns for all open tax years and has concluded that as of March 31, 2023, no provision for income tax is required in the Funds’ financial statements. The Funds’ federal and state income and federal excise tax returns for tax years for which the applicable statutes of limitations have not expired are subject to examination by the Internal Revenue Service and state departments of revenue.
Under the applicable foreign tax laws, a withholding tax may be imposed on interest, dividends and capital gains at various rates.
As a result of several court cases, in certain countries across the European Union, International Low Volatility High Dividend Index ETF filed additional tax reclaims for previously withheld taxes on dividends earned in those countries (“EU reclaims”). Income recognized, if any, for EU reclaims is reflected as European Union tax reclaims in the Statements of Operations and any related receivable is reflected as European Union tax reclaims receivable in the Statements of Assets and Liabilities. Any fees associated with these filings are reflected as European Union tax reclaim contingent fees in the Statements of Operations. When uncertainty exists as to the ultimate resolution of these proceedings, the likelihood of receipt of these EU reclaims, and the potential timing of payment, no amounts are reflected in the financial statements. For U.S. income tax purposes, EU reclaims received by International Low Volatility High Dividend Index ETF, if any, reduce the amount of foreign taxes Fund shareholders can use as tax deductions or credits on their income tax returns.
(k) Reclassification. GAAP requires that certain components of net assets be reclassified to reflect permanent differences between financial and tax reporting. These reclassifications have no effect on net assets or net asset value per share. During the current year, the following reclassifications have been made:
| | | | | | | | |
| | | Total Distributable
Earnings (Loss) | | | Paid-in Capital | |
| International Low Volatility High Dividend Index ETF(a) | | $ | (1,766,133) | | | $ | 1,766,133 | |
| U.S. Low Volatility High Dividend Index ETF(a) | | | (84,657,800) | | | | 84,657,800 | |
| (a) | Reclassifications are due to book/tax differences in the treatment of an in-kind distribution of securities. |
2. Investment management agreement and other transactions with affiliates
Legg Mason Partners Fund Advisor, LLC (“LMPFA”) is each Fund’s investment manager. Franklin Advisers is each Fund’s subadviser. Western Asset Management Company, LLC (“Western Asset”) manages the portion of each Fund’s cash and short-term instruments allocated to it. LMPFA, Franklin Advisers and Western Asset are indirect, wholly-owned subsidiaries of Franklin Resources, Inc. (“Franklin Resources”).
| | | | | | |
| Franklin Low Volatility High Dividend Index ETFs 2023 Annual Report | | | | | 39 | |
Notes to financial statements (cont’d)
LMPFA provides administrative and certain oversight services to the Funds. LMPFA delegates to the subadviser the day-to-day portfolio management of the Funds. Each Fund is responsible for paying interest expenses, taxes, brokerage expenses, future 12b-1 fees (if any), acquired fund fees and expenses, extraordinary expenses and the management fee payable to LMPFA under the investment management agreement.
Under the investment management agreement and subject to the general supervision of the Funds’ Board of Trustees, LMPFA as to each Fund provides or causes to be furnished all investment management, supervisory, administrative and other services reasonably necessary for the operation of the Fund, including certain distribution services (provided pursuant to a separate distribution agreement) and investment advisory services (provided pursuant to separate subadvisory agreements) under a unitary fee structure.
Each Fund pays an investment management fee, calculated daily and paid monthly, at an annual rate of the Fund’s average daily net assets as follows:
| | | | |
| | | Annualized Fee Rate | |
| International Low Volatility High Dividend Index ETF | | | 0.40 | % |
| U.S. Low Volatility High Dividend Index ETF | | | 0.27 | % |
As compensation for its subadvisory services, LMPFA as to each Fund pays Franklin Advisers 90% of the management fee paid by the Fund to LMPFA, net of (i) all fees and expenses incurred by LMPFA under the investment management agreement (including without limitation any subadvisory fee paid to another subadviser to the Fund) and (ii) expense waivers, if any, and reimbursements. LMPFA as to each Fund pays Western Asset monthly a fee of 0.02% of the portion of each Fund’s average daily net assets allocated to Western Asset for the management of cash and other short-term instruments, net of expense waivers, if any, and reimbursements.
Franklin Distributors, LLC (“Franklin Distributors”) serves as the distributor of Creation Units for the Funds on an agency basis. Franklin Distributors is an indirect, wholly-owned broker-dealer subsidiary of Franklin Resources.
The Funds’ Board of Trustees has adopted a Rule 12b-1 shareholder services and distribution plan and under that plan, each Fund is authorized to pay service and/or distribution fees calculated at an annual rate of up to 0.25% of its average daily net assets. No service and/or distribution fees are currently paid by the Funds, and there are no current plans to impose these fees.
All officers and one Trustee of the Trust are employees of Franklin Resources or its affiliates and do not receive compensation from the Trust.
3. Investments
During the year ended March 31, 2023, the aggregate cost of purchases and proceeds from sales of investments (excluding in-kind transactions and short-term investments) were as follows:
| | | | | | | | |
| | | Purchases | | | Sales | |
| International Low Volatility High Dividend Index ETF | | $ | 163,247,928 | | | $ | 148,308,701 | |
| U.S. Low Volatility High Dividend Index ETF | | | 418,084,073 | | | | 419,752,578 | |
During the year ended March 31, 2023, in-kind transactions (Note 5) were as follows:
| | | | | | | | | | | | |
| | | Contributions | | | Redemptions | | | Realized gain (loss)* | |
| International Low Volatility High Dividend Index ETF | | $ | 261,573,941 | | | $ | 20,069,445 | | | $ | 2,049,404 | |
| U.S. Low Volatility High Dividend Index ETF | | | 916,867,202 | | | | 482,805,801 | | | | 88,039,266 | |
| * | Net realized gains on redemptions in-kind are not taxable to the remaining shareholders of the Fund. |
The in-kind contributions and in-kind redemptions shown in this table may not agree with the Funds’ Share Transactions on the Statements of Changes in Net Assets. This table represents the accumulation of each Fund’s daily net shareholder transactions while the Statements of Changes in Net Assets reflects gross shareholder transactions including any cash component of the transactions.
| | | | |
| 40 | | | | Franklin Low Volatility High Dividend Index ETFs 2023 Annual Report |
At March 31, 2023, the aggregate cost of investments and the aggregate gross unrealized appreciation and depreciation of investments for federal income tax purposes were as follows:
| | | | | | | | | | | | | | | | |
| | | International Low Volatility High Dividend Index ETF | |
| | | Cost | | | Gross
Unrealized
Appreciation | | | Gross
Unrealized
Depreciation | | | Net
Unrealized
Appreciation
(Depreciation) | |
| Securities | | $ | 357,073,092 | | | $ | 20,345,577 | | | $ | (5,813,225) | | | $ | 14,532,352 | |
| Futures contracts | | | — | | | | 101,794 | | | | — | | | | 101,794 | |
| Forward foreign currency contracts | | | — | | | | 181,977 | | | | (6,805,414) | | | | (6,623,437) | |
| |
| | | U.S. Low Volatility High Dividend Index ETF | |
| | | Cost | | | Gross
Unrealized
Appreciation | | | Gross
Unrealized
Depreciation | | | Net
Unrealized
Appreciation
(Depreciation) | |
| Securities | | $ | 1,143,315,070 | | | $ | 41,346,994 | | | $ | (65,685,907) | | | $ | (24,338,913) | |
| Futures contracts | | | — | | | | 179,799 | | | | — | | | | 179,799 | |
4. Derivative instruments and hedging activities
Below is a table, grouped by derivative type, that provides information about the fair value and the location of derivatives within the Statements of Assets and Liabilities at March 31, 2023.
International Low Volatility High Dividend Index ETF
| | | | | | | | | | | | | | | | |
| ASSET DERIVATIVES1 | |
| | | | | | Foreign
Exchange Risk | | | Equity
Risk | | | Total | |
| Futures contracts2 | | | | | | | — | | | $ | 101,794 | | | $ | 101,794 | |
| Forward foreign currency contracts | | | | | | $ | 181,977 | | | | — | | | | 181,977 | |
| Total | | | | | | $ | 181,977 | | | $ | 101,794 | | | $ | 283,771 | |
|
| LIABILITY DERIVATIVES1 | |
| | | | | | | | | | | | Foreign Exchange Risk | |
| Forward foreign currency contracts | | | | | | | | | | | | | | $ | 6,805,414 | |
| 1 | Generally, the balance sheet location for asset derivatives is receivables/net unrealized appreciation and for liability derivatives is payables/net unrealized depreciation. |
| 2 | Includes cumulative unrealized appreciation (depreciation) of futures contracts as reported in the Schedules of Investments. Only net variation margin is reported within the receivables and/or payables on the Statements of Assets and Liabilities. |
The following tables provide information about the effect of derivatives and hedging activities on the Fund’s Statement of Operations for the year ended March 31, 2023. The first table provides additional detail about the amounts and sources of gains (losses) realized on derivatives during the period. The second table provides additional information about the change in net unrealized appreciation (depreciation) resulting from the Fund’s derivatives and hedging activities during the period.
| | | | | | | | | | | | |
| AMOUNT OF NET REALIZED GAIN (LOSS) ON DERIVATIVES RECOGNIZED | |
| | | Foreign
Exchange Risk | | | Equity Risk | | | Total | |
| Futures contracts | | $ | 501,421 | | | $ | 152,054 | | | $ | 653,475 | |
| Forward foreign currency contracts | | | 7,702,452 | | | | — | | | | 7,702,452 | |
| Total | | $ | 8,203,873 | | | $ | 152,054 | | | $ | 8,355,927 | |
|
| CHANGE IN NET UNREALIZED APPRECIATION (DEPRECIATION) ON DERIVATIVES RECOGNIZED | |
| | | Foreign
Exchange Risk | | | Equity
Risk | | | Total | |
| Futures contracts | | | — | | | $ | 73,000 | | | $ | 73,000 | |
| Forward foreign currency contracts | | $ | (6,992,205) | | | | — | | | | (6,992,205) | |
| Total | | $ | (6,992,205) | | | $ | 73,000 | | | $ | (6,919,205) | |
| | | | | | |
| Franklin Low Volatility High Dividend Index ETFs 2023 Annual Report | | | | | 41 | |
Notes to financial statements (cont’d)
During the year ended March 31, 2023, the volume of derivative activity for the Fund was as follows:
| | | | |
| | | Average Market
Value | |
| Futures contracts (to buy) | | $ | 914,227 | |
| Futures contracts (to sell)† | | | 1,728,936 | |
| Forward foreign currency contracts (to buy) | | | 1,968,557 | |
| Forward foreign currency contracts (to sell) | | | 188,790,332 | |
| † | At March 31, 2023, there were no open positions held in this derivative. |
The following table presents the Fund’s OTC derivative assets and liabilities by counterparty net of amounts available for offset under an ISDA Master Agreement and net of the related collateral pledged (received) by the Fund as of March 31, 2023.
| | | | | | | | | | | | | | | | | | | | |
| Counterparty | | Gross Assets
Subject to
Master
Agreements1 | | | Gross
Liabilities
Subject to
Master
Agreements1 | | | Net Assets
(Liabilities)
Subject to
Master
Agreements | | | Collateral
Pledged
(Received) | | | Net
Amount2 | |
| Bank of New York | | $ | 16,862 | | | $ | (4,868,059) | | | $ | (4,851,197) | | | | — | | | $ | (4,851,197) | |
| UBS Securities LLC | | | 165,115 | | | | (1,937,355) | | | | (1,772,240) | | | | — | | | | (1,772,240) | |
| Total | | $ | 181,977 | | | $ | (6,805,414) | | | $ | (6,623,437) | | | | — | | | $ | (6,623,437) | |
| 1 | Absent an event of default or early termination, derivative assets and liabilities are presented gross and not offset in the Statements of Assets and Liabilities. |
| 2 | Represents the net amount receivable (payable) from (to) the counterparty in the event of default. |
Below is a table, grouped by derivative type, that provides information about the fair value and the location of derivatives within the Statements of Assets and Liabilities at March 31, 2023.
U.S. Low Volatility High Dividend Index ETF
| | | | | | | | |
| ASSET DERIVATIVES1 | |
| | | | | | Equity
Risk | |
| Futures contracts2 | | | | | | $ | 179,799 | |
| 1 | Generally, the balance sheet location for asset derivatives is receivables/net unrealized appreciation and for liability derivatives is payables/net unrealized depreciation. |
| 2 | Includes cumulative unrealized appreciation (depreciation) of futures contracts as reported in the Schedules of Investments. Only net variation margin is reported within the receivables and/or payables on the Statements of Assets and Liabilities. |
The following tables provide information about the effect of derivatives and hedging activities on the Fund’s Statement of Operations for the year ended March 31, 2023. The first table provides additional detail about the amounts and sources of gains (losses) realized on derivatives during the period. The second table provides additional information about the change in net unrealized appreciation (depreciation) resulting from the Fund’s derivatives and hedging activities during the period.
| | | | | | | | |
| AMOUNT OF NET REALIZED GAIN (LOSS) ON DERIVATIVES RECOGNIZED | |
| | | | | | Equity
Risk | |
| Futures contracts | | | | | | $ | 71,693 | |
|
| CHANGE IN NET UNREALIZED APPRECIATION (DEPRECIATION) ON DERIVATIVES RECOGNIZED | |
| | | | | | Equity
Risk | |
| Futures contracts | | | | | | $ | 23,404 | |
During the year ended March 31, 2023, the volume of derivative activity for the Fund was as follows:
| | | | |
| | | Average Market
Value | |
| Futures contracts (to buy) | | $ | 3,516,203 | |
| | | | |
| 42 | | | | Franklin Low Volatility High Dividend Index ETFs 2023 Annual Report |
5. Fund share transactions
At March 31, 2023, the Trust had an unlimited number of shares of beneficial interest authorized with a par value of $0.00001 per share. Each Fund’s shares are issued and redeemed by the Funds only in Creation Units or Creation Unit aggregations, where 60,000 and 50,000 shares of International Low Volatility High Dividend Index ETF and U.S. Low Volatility High Dividend Index ETF, respectively, constitute a Creation Unit. Such transactions are generally on an in-kind basis, with a separate cash payment, which is a balancing cash component to equate the transaction to the net asset value per share of each Fund on the transaction date. Transactions in capital shares of the Funds are disclosed in detail in the Statements of Changes in Net Assets. Authorized Participants are subject to standard creation and redemption transaction fees to offset transfer and other transaction costs associated with the issuance and redemption of Creation Units. Such transactions fees are treated as increases in capital and are disclosed in the Funds’ Statements of Changes in Net Assets. Creations and redemptions for cash (when cash creations and redemptions are available or specified) may be subject to an additional variable fee.
6. Income tax information and distributions to shareholders
The tax character of distributions paid during the fiscal year ended March 31, 2023 was as follows:
| | | | | | | | |
| | | International
Low Volatility High
Dividend Index ETF | | | U.S. Low Volatility High
Dividend Index ETF | |
| Distributions paid from: | | | | | | | | |
| Ordinary income | | $ | 11,244,948 | | | $ | 25,402,005 | |
| Net long-term capital gains | | | 2,584,514 | | | | — | |
| Total distributions paid | | $ | 13,829,462 | | | $ | 25,402,005 | |
|
| The tax character of distributions paid during the fiscal period ended March 31, 2022 was as follows: | |
| | |
| | | International
Low Volatility High
Dividend Index ETF | | | U.S. Low Volatility High
Dividend Index ETF | |
| Distributions paid from: | | | | | | | | |
| Ordinary income | | $ | 996,904 | | | $ | 10,500,011 | |
|
| The tax character of distributions paid during the fiscal year ended 2021 was as follows: | |
| | |
| | | International
Low Volatility High
Dividend Index ETF October 31 | | | U.S. Low Volatility High
Dividend Index ETF October 31 | |
| Distributions paid from: | | | | | | | | |
| Ordinary income | | $ | 3,400,710 | | | $ | 22,234,998 | |
|
| As of March 31, 2023, the components of distributable earnings (loss) on a tax basis were as follows: | |
| | |
| | | International
Low Volatility High
Dividend Index ETF | | | U.S. Low Volatility High
Dividend Index ETF | |
| Undistributed ordinary income — net | | $ | 3,379,358 | | | $ | 5,964,073 | |
| Deferred capital losses* | | | (12,345,535) | | | | (118,142,640) | |
| Other book/tax temporary differences(a) | | | 6,106,873 | | | | (179,800) | |
| Unrealized appreciation (depreciation)(b) | | | 8,020,186 | | | | (24,159,114) | |
| Total distributable earnings (loss) — net | | $ | 5,160,882 | | | $ | (136,517,481) | |
| * | These capital losses have been deferred in the current year as either short-term or long-term losses. The losses will be deemed to occur on the first day of the next taxable year in the same character as they were originally deferred and will be available to offset future taxable capital gains. |
| (a) | Other book/tax temporary differences are attributable to the realization for tax purposes of unrealized gains (losses) on certain futures and foreign currency contracts. |
| (b) | The difference between book-basis and tax-basis unrealized appreciation (depreciation) is attributable to the tax deferral of losses on wash sales and other book/tax basis adjustments. |
7. Recent accounting pronouncement
In June 2022, the Financial Accounting Standards Board (FASB) issued Accounting Standards Update (ASU) No. 2022-03, Fair Value Measurement (Topic 820) – Fair Value Measurement of Equity Securities Subject to Contractual Sale Restrictions. The amendments in the ASU clarify that a contractual restriction on the sale of an equity security is not considered part
| | | | | | |
| Franklin Low Volatility High Dividend Index ETFs 2023 Annual Report | | | | | 43 | |
Notes to financial statements (cont’d)
of the unit of account of the equity security and, therefore, should not be considered in measuring fair value. The ASU is effective for interim and annual reporting periods beginning after December 15, 2023, with the option of early adoption. Management has reviewed the requirements and believes that the adoption of the ASU will not have a material impact on the financial statements.
| | | | |
| 44 | | | | Franklin Low Volatility High Dividend Index ETFs 2023 Annual Report |
Report of independent registered public accounting firm
To the Board of Trustees of Legg Mason ETF Investment Trust and Shareholders of Franklin International Low Volatility High Dividend Index ETF and Franklin U.S. Low Volatility High Dividend Index ETF
Opinions on the Financial Statements
We have audited the accompanying statements of assets and liabilities, including the schedules of investments, of Franklin International Low Volatility High Dividend Index ETF and Franklin U.S. Low Volatility High Dividend Index ETF (two of the funds constituting Legg Mason ETF Investment Trust, hereafter collectively referred to as the “Funds”) as of March 31, 2023, the related statements of operations for the year ended March 31, 2023, the statements of changes in net assets for the year ended March 31, 2023, the period November 1, 2022 through March 31, 2022 and the year ended October 31, 2021, including the related notes, and the financial highlights for each of the periods indicated therein (collectively referred to as the “financial statements”). In our opinion, the financial statements present fairly, in all material respects, the financial position of the Fund as of March 31, 2023, the results of its operations for the year ended March 31, 2023, the changes in its net assets for the year ended March 31, 2023, the period November 1, 2022 through March 31, 2022 and the year ended October 31, 2021, and the financial highlights for each of the periods indicated therein in conformity with accounting principles generally accepted in the United States of America.
Basis for Opinions
These financial statements are the responsibility of the Fund’s management. Our responsibility is to express an opinion on the Fund’s financial statements based on our audits. We are a public accounting firm registered with the Public Company Accounting Oversight Board (United States) (PCAOB) and are required to be independent with respect to the Fund in accordance with the U.S. federal securities laws and the applicable rules and regulations of the Securities and Exchange Commission and the PCAOB.
We conducted our audits of these financial statements in accordance with the standards of the PCAOB. Those standards require that we plan and perform the audit to obtain reasonable assurance about whether the financial statements are free of material misstatement, whether due to error or fraud.
Our audits included performing procedures to assess the risks of material misstatement of the financial statements, whether due to error or fraud, and performing procedures that respond to those risks. Such procedures included examining, on a test basis, evidence regarding the amounts and disclosures in the financial statements. Our audits also included evaluating the accounting principles used and significant estimates made by management, as well as evaluating the overall presentation of the financial statements. Our procedures included confirmation of securities owned as of March 31, 2023 by correspondence with the custodian and broker; when replies were not received from brokers, we performed other auditing procedures. We believe that our audits provide a reasonable basis for our opinion.
/s/PricewaterhouseCoopers LLP
San Francisco, California
May 17, 2023
We have served as the auditor of one or more investment companies in the Franklin Templeton Group of Funds since 1948.
| | | | | | |
| Franklin Low Volatility High Dividend Index ETFs 2023 Annual Report | | | | | 45 | |
Additional information (unaudited)
Information about Trustees and Officers
The business and affairs of Franklin Low Volatility High Dividend Index ETFs (the “Funds”) are conducted by management under the supervision and subject to the direction of its Board of Trustees. The business address of each Trustee is One Franklin Parkway, San Mateo, California 94403-1906.
Information pertaining to the Trustees and officers of the Funds is set forth below. The Statement of Additional Information includes additional information about Trustees and is available, without charge, upon request by calling the Funds at 1-877-721-1926.
| | |
| Independent Trustees† |
| |
Rohit Bhagat Year of birth | | 1964 |
| Position(s) with Trust | | Lead Independent Trustee |
| Term of office1 and length of time served2 | | Since 2021 |
| Principal occupation(s) during the past five years | | Managing Member, Mukt Capital, LLC (private investment firm) (2014-present); Advisor, Optimal Asset Management (investment technology and advisory services company) (2015- present); and formerly, Chairman, Asia Pacific, BlackRock (2009-2012); Global Chief Operating Officer, Barclays Global Investors (investment management) (2005-2009); and Senior Partner, The Boston Consulting Group (management consulting) (1992-2005) |
| Number of funds in fund complex overseen by Trustee | | 59 |
| Other Directorships held by Trustee during the past five years | | AssetMark Financial Holdings, Inc. (investment solutions) (2018-present) and PhonePe (payment and financial services) (2020-present); and formerly, Axis Bank (financial) (2013- 2021), FlipKart Limited (eCommerce company) (2019-2020), CapFloat Financial Services Pvt., Ltd. (non-banking finance company) (2018) and Zentific Investment Management (hedge fund) (2015-2018) |
| |
Deborah D. McWhinney Year of birth | | 1955 |
| Position(s) with Trust | | Trustee |
| Term of office1 and length of time served2 | | Since 2021 |
| Principal occupation(s) during the past five years | | Director of various companies; and formerly, Board Member, Lloyds Banking Group (2015- 2018) (financial institution) and Fresenius Medical Group (2016-2018) (healthcare); Chief Executive Officer (2013-2014) and Chief Operating Officer (2011-2013), CitiGroup Global Enterprise Payments (financial services); and President, Citi’s Personal Banking and Wealth Management (2009-2011) |
| Number of funds in fund complex overseen by Trustee | | 59 |
| Other Directorships held by Trustee during the past five years | | S&P Global, Inc. (financial information services) (2022-present), Borg Warner (automotive) (2018-present), LegalShield (consumer services) (2020-present); and formerly, IHS Markit (information services) (2015-2022), Fluor Corporation (construction and engineering) (2014- 2020) and Focus Financial Partner, LLC (financial services) (2018-2020) |
| |
Anantha K. Pradeep Year of birth | | 1963 |
| Position(s) with Trust | | Trustee |
| Term of office1 and length of time served2 | | Since 2021 |
| Principal occupation(s) during the past five years | | Chief Executive Officer, Smilable, Inc. (technology company) (2014-present); Chief Executive Officer, MachineVantage (technology company) (2018-present); Founder and Managing Partner, Consult Meridian, LLC (consulting company) (2009-present); and formerly, Founder, BoardVantage (board portal solutions provider delivering paperless process for boards and leadership) (2000-2002) |
| Number of funds in fund complex overseen by Trustee | | 59 |
| Other Directorships held by Trustee during the past five years | | None |
| | | | |
| 46 | | | | Franklin Low Volatility High Dividend Index ETFs |
| | |
| Interested Trustee and Officer |
| |
| Jennifer M. Johnson3 | | |
| Year of birth | | 1964 |
| Position(s) with Trust | | Trustee and Chairperson of the Board |
| Term of office1 and length of time served2 | | Since 2021 |
| Principal occupation(s) during the past five years | | Chief Executive Officer, President and Director, Franklin Resources, Inc.; officer and/or director or trustee, of some of the other subsidiaries of Franklin Resources, Inc. and of certain funds in the Franklin Templeton/Legg Mason fund complex; and formerly, Chief Operating Officer and Executive Vice President, Franklin Resources, Inc. (1994-2015); Executive Vice President of Operations and Technology, Franklin Resources, Inc. (2005-2010); and Senior Vice President, Franklin Resources, Inc. (2003-2005) |
| Number of funds in fund complex overseen by Trustee | | 70 |
| Other Directorships held by Trustee during the past five years | | None |
| | |
| Additional Officers | | |
|
Alison E. Baur Franklin Templeton One Franklin Parkway, San Mateo, CA 94403-1906 |
| Year of birth | | 1964 |
| Position(s) with Trust | | Vice President |
| Term of office1 and length of time served2 | | Since 2021 |
| Principal occupation(s) during the past five years | | Deputy General Counsel, Franklin Templeton; and officer of some of the other subsidiaries of Franklin Resources, Inc. and of certain funds in the Franklin Templeton/Legg Mason fund complex |
|
Fred Jensen Franklin Templeton 280 Park Avenue, 8th Floor, New York, NY 10017 |
| Year of birth | | 1963 |
| Position(s) with Trust | | Chief Compliance Officer |
| Term of office1 and length of time served2 | | Since 2021 |
| Principal occupation(s) during the past five years | | Director - Global Compliance of Franklin Templeton; Managing Director of Legg Mason & Co.; Director of Compliance, Legg Mason Office of the Chief Compliance Officer; Chief Compliance Officer, Franklin Advisory Services, LLC; Compliance Officer, Franklin Advisers, Inc.; officer of certain funds in the Franklin Templeton/Legg Mason fund complex; formerly, Chief Compliance Officer of Legg Mason Global Asset Allocation; Chief Compliance Officer, Legg Mason Private Portfolio; Chief Compliance Officer to The Reserves Funds (investment adviser, funds and broker-dealer) and Ambac Financial Group (investment adviser, funds and broker-dealer) |
|
Harris Goldblat Franklin Templeton 100 First Stamford Place, 6th Floor, Stamford, CT 06902 |
| Year of birth | | 1969 |
| Position(s) with Trust | | Vice President and Assistant Secretary |
| Term of office1 and length of time served2 | | Since 2021 |
| Principal occupation(s) during the past five years | | Associate General Counsel to Franklin Templeton (since 2020); Assistant Secretary of certain funds associated with Legg Mason & Co. or its affiliates (since 2006); formerly, Managing Director and Associate General Counsel of Legg Mason & Co. (2005 to 2020) |
| | | | | | |
| Franklin Low Volatility High Dividend Index ETFs | | | | | 47 | |
Additional information (unaudited) (cont’d)
Information about Trustees and Officers
| | |
| Additional Officers (cont’d) |
|
Steven J. Gray Franklin Templeton One Franklin Parkway, San Mateo, CA 94403-1906 |
| Year of birth | | 1955 |
| Position(s) with Trust | | Vice President |
| Term of office1 and length of time served2 | | Since 2021 |
| Principal occupation(s) during the past five years | | Senior Associate General Counsel, Franklin Templeton; Assistant Secretary, Franklin Distributors, LLC; and officer of certain funds in the Franklin Templeton/Legg Mason fund complex |
|
Matthew T. Hinkle Franklin Templeton One Franklin Parkway, San Mateo, CA 94403-1906 |
| Year of birth | | 1971 |
| Position(s) with Trust | | Chief Executive Officer – Finance and Administration |
| Term of office1 and length of time served2 | | Since 2021 |
| Principal occupation(s) during the past five years | | Senior Vice President, Franklin Templeton Services, LLC; officer of certain funds in the Franklin Templeton/Legg Mason fund complex; and formerly, Vice President, Global Tax (2012-April 2017) and Treasurer/Assistant Treasurer, Franklin Templeton (2009-2017) |
|
Susan Kerr Franklin Templeton 280 Park Avenue, 8th Floor, New York, NY 10017 |
| Year of birth | | 1949 |
| Position(s) with Trust | | Vice President – AML Compliance |
| Term of office1 and length of time served2 | | Since 2021 |
| Principal occupation(s) during the past five years | | Senior Compliance Analyst, Franklin Templeton; Chief Anti-Money Laundering Compliance Officer, Legg Mason & Co., or its affiliates; Anti Money Laundering Compliance Officer; Senior Compliance Officer, LMIS; and officer of certain funds in the Franklin Templeton/Legg Mason fund complex |
|
Thomas C. Mandia Franklin Templeton 100 First Stamford Place, 6th Floor, Stamford, CT 06902 |
| Year of birth | | 1962 |
| Position(s) with Trust | | Vice President and Assistant Secretary |
| Term of office1 and length of time served2 | | Since 2021 |
| Principal occupation(s) during the past five years | | Senior Associate General Counsel to Franklin Templeton (since 2020); Secretary of LMPFA (since 2006); Assistant Secretary of certain funds associated with Legg Mason & Co. or its affiliates (since 2006); Secretary of LMAS (since 2002) and LMFAM (formerly registered investment advisers) (since 2013); formerly, Managing Director and Deputy General Counsel of Legg Mason & Co. (2005 to 2020) |
|
David Mann Franklin Templeton One Franklin Parkway, San Mateo, CA 94403-1906 |
| Year of birth | | 1973 |
| Position(s) with Trust | | Vice President |
| Term of office1 and length of time served2 | | Since March 2023 |
| Principal occupation(s) during the past five years | | Head of Global ETF Product and Capital Markets, Franklin Templeton; and officer of certain funds in the Franklin Templeton/Legg Mason fund complex |
| | | | |
| 48 | | | | Franklin Low Volatility High Dividend Index ETFs |
| | |
| Additional Officers (cont’d) |
Todd Mathias Franklin Templeton One Franklin Parkway, San Mateo, CA 94403-1906 |
| Year of birth | | 1983 |
| Position(s) with Trust | | Vice President |
| Term of office1 and length of time served2 | | Since March 2023 |
| Principal occupation(s) during the past five years | | Head of US ETF Product Strategy, Franklin Templeton; and officer of certain funds in the Franklin Templeton/Legg Mason fund complex |
|
Patrick O’Connor Franklin Templeton One Franklin Parkway, San Mateo, CA 94403-1906 |
| Year of birth | | 1967 |
| Position(s) with Trust | | President and Chief Executive Officer – Investment Management |
| Term of office1 and length of time served2 | | Since 2021 |
| Principal occupation(s) during the past five years | | President and Chief Investment Officer, Franklin Advisory Services, LLC; Senior Vice President, Franklin Advisers, Inc.; and officer of certain funds in the Franklin Templeton/Legg Mason fund complex |
|
Vivek Pai Franklin Templeton 300 S.E. 2nd Street, Fort Lauderdale, FL 33301-1923 |
| Year of birth | | 1970 |
| Position(s) with Trust | | Treasurer, Chief Financial Officer and Chief Accounting Officer |
| Term of office1 and length of time served2 | | Since 2021 |
| Principal occupation(s) during the past five years | | Treasurer, U.S. Fund Administration & Reporting and officer of certain funds in the Franklin Templeton/Legg Mason fund complex |
|
Navid J. Tofigh Franklin Templeton One Franklin Parkway, San Mateo, CA 94403-1906 |
| Year of birth | | 1972 |
| Position(s) with Trust | | Vice President and Secretary |
| Term of office1 and length of time served2 | | Since 2021 |
| Principal occupation(s) during the past five years | | Senior Associate General Counsel, Franklin Templeton; and officer of certain funds in the Franklin Templeton/Legg Mason fund complex |
|
Lori A. Weber Franklin Templeton 300 S.E. 2nd Street, Fort Lauderdale, FL 33301-1923 |
| Year of birth | | 1964 |
| Position(s) with Trust | | Vice President |
| Term of office1 and length of time served2 | | Since 2021 |
| Principal occupation(s) during the past five years | | Senior Associate General Counsel, Franklin Templeton; Assistant Secretary, Franklin Resources, Inc.; Vice President and Secretary, Templeton Investment Counsel, LLC; and officer of certain funds in the Franklin Templeton/Legg Mason fund complex |
| † | Trustees who are not “interested persons” of the Funds within the meaning of Section 2(a)(19) of the Investment Company Act of 1940, as amended (the “1940 Act”). |
| 1 | Each Trustee and officer serves until his or her respective successor has been duly elected and qualified or until his or her earlier death, resignation, retirement or removal. |
| 2 | Indicates the earliest year in which the Trustee became a board member for a fund in the Legg Mason fund complex or the officer took such office. |
| 3 | Ms. Johnson is an “interested person” of the Funds, as defined in the 1940 Act, because of her position with LMPFA and/or certain of its affiliates. |
| | | | | | |
| Franklin Low Volatility High Dividend Index ETFs | | | | | 49 | |
Important tax information (unaudited)
By mid-February, tax information related to a shareholder’s proportionate share of distributions paid during the preceding calendar year will be received, if applicable. Please also refer to www.franklintempleton.com for per share tax information related to any distributions paid during the preceding calendar year. Shareholders are advised to consult with their tax advisors for further information on the treatment of these amounts on their tax returns.
The following tax information for the Funds is required to be furnished to shareholders with respect to income earned and distributions paid during its fiscal year.
The Funds hereby report the following amounts, or if subsequently determined to be different, the maximum allowable amounts, for the fiscal year ended March 31, 2023:
| | | | | | | | | | | | |
| | | Pursuant to: | | | International
Low Volatility High Dividend Index ETF | | | U.S. Low Volatility High Dividend Index ETF | |
| Long-Term Capital Gain Dividends Distributed | | § | 852(b)(3)(C) | | | $ | 2,584,514 | | | | — | |
| Income Eligible for Dividends Received Deduction (DRD) | | § | 854(b)(1)(A) | | | $ | 2,426,253 | | | $ | 25,680,585 | |
| Qualified Dividend Income Earned (QDI) | | § | 854(b)(1)(B) | | | $ | 7,738,567 | | | $ | 26,210,863 | |
| Short-Term Capital Gain Dividends Distributed | | § | 871(k)(2)(C) | | | $ | 5,465,693 | | | | — | |
| Qualified Business Income Dividends Earned | | § | 199A | | | | — | | | $ | 3,810,790 | |
Under Section 853 of the Internal Revenue Code, the Funds intend to elect to pass through to their shareholders the following amounts, or amounts as finally determined, of foreign taxes paid and foreign source income earned by the Funds during the fiscal year ended March 31, 2023:
| | | | | | | | |
| | | International
Low Volatility High Dividend Index ETF | | | U.S. Low Volatility High
Dividend Index ETF | |
| Foreign Taxes Paid | | $ | 433,513 | | | | — | |
| Foreign Source Income Earned | | $ | 6,899,115 | | | | — | |
| | | | |
| 50 | | | | Franklin Low Volatility High Dividend Index ETFs |
Franklin Low Volatility High Dividend Index ETFs
Trustees
Rohit Bhagat
Deborah D. McWhinney
Anantha K. Pradeep
Jennifer M. Johnson
Chair
Investment manager
Legg Mason Partners Fund Advisor, LLC
Subadviser
Franklin Advisers, Inc.
Custodian
The Bank of New York Mellon
Transfer agent
The Bank of New York Mellon
240 Greenwich Street
New York, NY 10286
Independent registered public accounting firm
PricewaterhouseCoopers LLP Baltimore, MD
Franklin Low Volatility High Dividend Index ETFs
Franklin International Low Volatility High Dividend Index ETF
Franklin U.S. Low Volatility High Dividend Index ETF
The Funds are separate investment series of Legg Mason ETF Investment Trust, a Maryland statutory trust.
Franklin Low Volatility High Dividend Index ETFs
Legg Mason Funds
620 Eighth Avenue, 47th Floor
New York, NY 10018
The Funds file their complete schedule of portfolio holdings with the Securities and Exchange Commission (“SEC”) for the first and third quarters of each fiscal year as an exhibit to their reports on Form N-PORT. The Funds’ Forms N-PORT are available on the SEC’s website at www.sec.gov. To obtain information on Form N-PORT, shareholders can call the Funds at 1-877-721-1926.
Information on how the Funds voted proxies relating to portfolio securities during the prior 12-month period ended June 30th of each year and a description of the policies and procedures that the Funds use to determine how to vote proxies related to portfolio transactions are available (1) without charge, upon request, by calling the Funds at 1-877-721-1926, (2) at www.franklintempleton.com and (3) on the SEC’s website at www.sec.gov.
This report is submitted for the general information of the shareholders of Franklin International Low Volatility High Dividend Index ETF and Franklin U.S. Low Volatility High Dividend Index ETF. This report is not authorized for distribution to prospective investors in the Funds unless preceded or accompanied by a current prospectus.
Investors should consider each Fund’s investment objectives, risks, charges and expenses carefully before investing. Each prospectus contains this and other important information about the Funds. Please read the prospectuses carefully before investing.
www.franklintempleton.com
© 2023 Franklin Distributors, LLC, Member FINRA/SIPC. All rights reserved.
ETF Index Disclaimers
Franklin International Low Volatility High Dividend Index ETF
The MSCI World ex-US IMI Index (the “MSCI Index”) was used by Franklin Advisers, Inc. (“Franklin Advisers”), the Fund’s subadviser, as the reference universe for selection of the component securities included in the QS International Low Volatility High Dividend Hedged Index (the “Underlying Index”). MSCI Inc. does not in any way sponsor, support, promote or endorse the Underlying Index or Franklin International Low Volatility High Dividend Index ETF (the “Fund”). MSCI Inc. was not and is not involved in any way in the creation, calculation, maintenance or review of the Underlying Index. The MSCI Index was provided on an “as is” basis. MSCI Inc., its affiliates and any other person or entity involved in or related to compiling, computing or creating the MSCI Index (collectively, the “MSCI Parties”) expressly disclaim all warranties (including, without limitation, any warranties of originality, accuracy, completeness, timeliness, non-infringement, merchantability and fitness for a particular purpose). Without limiting any of the foregoing, in no event shall any MSCI Party have any liability for any direct, indirect, special, incidental, punitive, consequential (including without limitation lost profits) or any other damages in connection with the MSCI Index, the Underlying Index or the Fund.
The Fund is not sponsored, promoted, sold or supported in any other manner by Solactive AG nor does Solactive AG offer any express or implicit guarantee or assurance either with regard to the results of using the Underlying Index and/or Underlying Index trade mark or the Underlying Index Price at any time or in any other respect. The Underlying Index is calculated and published by Solactive AG. Solactive AG uses its best efforts to ensure that the Underlying Index is calculated correctly. Irrespective of its obligations towards the Fund, Solactive AG has no obligation to point out errors in the Underlying Index to third parties including but not limited to investors and/or financial intermediaries of the Fund. Neither publication of the Underlying Index by Solactive AG nor the licensing of the Underlying Index or the Underlying Index trade mark for the purpose of use in connection with the Fund constitutes a recommendation by Solactive AG to invest capital in this Fund nor does it in any way represent an assurance or opinion of Solactive AG with regard to any investment in this Fund.
Franklin Advisers does not guarantee the accuracy and/or the completeness of the Underlying Index or any data included therein, and Franklin Advisers shall not have any liability for any errors, omissions or interruptions therein. Franklin Advisers makes no warranty, express or implied, as to results to be obtained by the Fund, owners of the shares of the Fund or any other person or entity from the use of the Underlying Index, or any data included therein, either in connection with the Fund or for any other use. Franklin Advisers makes no express or implied warranties, and expressly disclaims all warranties of merchantability or fitness for a particular purpose or use with respect to the Underlying Index or any data included therein. Without limiting any of the foregoing, in no event shall Franklin Advisers have any liability for any special, punitive, direct, indirect or consequential damages (including lost profits) arising out of matters relating to the use of the Underlying Index, even if notified of the possibility of such damages.
Franklin U.S. Low Volatility High Dividend Index ETF
Solactive AG does not sponsor, promote, sell or support in any manner the Franklin Low Volatility High Dividend Index ETF (the “Fund”). Solactive AG does not offer any express or implicit guarantee or assurance either with regard to the results of using the Solactive US Broad Market Index (the “Solactive Index” or the “Underlying Index”) and/or Solactive Index trade mark or the Solactive Index Price at any time or in any other respect. The Solactive Index is calculated and published by Solactive AG. Solactive AG uses its best efforts to ensure that the Solactive Index is calculated correctly. Irrespective of its obligations towards the Fund, Solactive AG has no obligation to point out errors in the Solactive Index to third parties including but not limited to investors and/or financial intermediaries of the Fund. Neither publication of the Solactive Index by Solactive AG nor the licensing of the Solactive Index or Solactive Index trade mark for the purpose of use in connection with the Fund constitutes a recommendation by Solactive AG to invest capital in the Fund nor does it in any way represent an assurance or opinion of Solactive AG with regard to any investment in the Fund.
Solactive AG does not offer any express or implicit guarantee or assurance either with regard to the results of using the Fund’s Underlying Index and/or Underlying Index trade mark or the Underlying Index Price at any time or in any other respect. The Fund’s Underlying Index is calculated and published by Solactive AG. Solactive AG uses its best efforts to ensure that the Underlying Index is calculated correctly. Irrespective of its obligations towards the Fund, Solactive AG has no obligation to point out errors in the Underlying Index to third parties including but not limited to investors and/or financial intermediaries of the Fund. Neither publication of the Underlying Index by Solactive AG nor the licensing of the Underlying Index or Underlying Index trade mark for the purpose of use in connection with the Fund constitutes a recommendation by Solactive AG to invest capital in the Fund nor does it in any way represent an assurance or opinion of Solactive AG with regard to any investment in the Fund.
Franklin Advisers, Inc. (“Franklin Advisers”) does not guarantee the accuracy and/or the completeness of the Underlying Index or any data included therein, and Franklin Advisers shall not have any liability for any errors, omissions or interruptions therein. Franklin Advisers makes no warranty, express or implied, as to results to be obtained by the Fund, owners of the shares of the Fund or any other person or entity from the use of the Underlying Index, or any data included therein, either in connection with the Fund or for any other use. Franklin Advisers makes no express or implied warranties, and expressly disclaims all warranties of merchantability or fitness for a particular purpose or use with respect to the Underlying Index or any data included therein. Without limiting any of the foregoing, in no event shall Franklin Advisers have any liability for any special, punitive, direct, indirect or consequential damages (including lost profits) arising out of matters relating to the use of the Underlying Index, even if notified of the possibility of such damages.
www.franklintempleton.com
© 2023 Franklin Distributors, LLC, Member FINRA/SIPC. All rights reserved.
LMETF A 05/23
The registrant has adopted a code of ethics that applies to the registrant’s principal executive officer, principal financial officer, principal accounting officer or controller.
| ITEM 3. | AUDIT COMMITTEE FINANCIAL EXPERT. |
The Board of Trustees of the registrant has determined that Rohit Bhagat and Deborah D. McWhinney possesses the technical attributes identified in Instruction 2(b) of Item 3 to Form N-CSR to qualify as an “audit committee financial expert,” and has designated Mr. Bhagat and Ms. McWhinney as its the Audit Committee’s financial experts. Mr. Bhagat and Ms. McWhinney are “independent” Trustees pursuant to paragraph (a)(2) of Item 3 to Form N-CSR.
| ITEM 4. | PRINCIPAL ACCOUNTANT FEES AND SERVICES. |
a) Audit Fees. The aggregate fees billed in the last two fiscal years ending March 31, 2022 and March 31, 2023 (the “Reporting Periods”) for professional services rendered by the Registrant’s principal accountant (the “Auditor”) for the audit of the Registrant’s annual financial statements, or services that are normally provided by the Auditor in connection with the statutory and regulatory filings or engagements for the Reporting Periods, were $146,240 in March 31, 2022 and $146,240 in March 31, 2023.
b) Audit-Related Fees. The aggregate fees billed in the Reporting Period for assurance and related services by the Auditor that are reasonably related to the performance of the Registrant’s financial statements were $0 in March 31, 2022 and $0 in March 31, 2023.
(c) Tax Fees. The aggregate fees billed in the Reporting Periods for professional services rendered by the Auditor for tax compliance, tax advice and tax planning (“Tax Services”) were $82,000 in March 31, 2022 and $82,000 in March 31, 2023. These services consisted of (i) review or preparation of U.S. federal, state, local and excise tax returns; (ii) U.S. federal, state and local tax planning, advice and assistance regarding statutory, regulatory or administrative developments, and (iii) tax advice regarding tax qualification matters and/or treatment of various financial instruments held or proposed to be acquired or held.
There were no fees billed for tax services by the Auditors to service affiliates during the Reporting Periods that required pre-approval by the Audit Committee.
d) All Other Fees.
The aggregate fees billed in the Reporting Periods for products and services provided by the Auditor, other than the services reported in paragraphs (a) through (c) for the Item 4 for the Legg Mason ETF Investment Trust, were $0 in the previous fiscal year and $0 in March 31, 2023.
All Other Fees. There were no other non-audit services rendered by the Auditor to Legg Mason Partners Fund Advisors, LLC (“LMPFA”), and any entity controlling, controlled by or under common control with LMPFA that provided ongoing services to Legg Mason ETF Investment Trust requiring pre-approval by the Audit Committee in the Reporting Period.
(e) Audit Committee’s pre–approval policies and procedures described in paragraph (c) (7) of Rule 2-01 of Regulation S-X.
(1) The Charter for the Audit Committee (the “Committee”) of the Board of each registered investment company (the “Fund”) advised by LMPFA or one of their affiliates (each, an
“Adviser”) requires that the Committee shall approve (a) all audit and permissible non-audit services to be provided to the Fund and (b) all permissible non-audit services to be provided by the Fund’s independent auditors to the Adviser and any Covered Service Providers if the engagement relates directly to the operations and financial reporting of the Fund. The Committee may implement policies and procedures by which such services are approved other than by the full Committee.
The Committee shall not approve non-audit services that the Committee believes may impair the independence of the auditors. As of the date of the approval of this Audit Committee Charter, permissible non-audit services include any professional services (including tax services), that are not prohibited services as described below, provided to the Fund by the independent auditors, other than those provided to the Fund in connection with an audit or a review of the financial statements of the Fund. Permissible non-audit services may not include: (i) bookkeeping or other services related to the accounting records or financial statements of the Fund; (ii) financial information systems design and implementation; (iii) appraisal or valuation services, fairness opinions or contribution-in-kind reports; (iv) actuarial services; (v) internal audit outsourcing services; (vi) management functions or human resources; (vii) broker or dealer, investment adviser or investment banking services; (viii) legal services and expert services unrelated to the audit; and (ix) any other service the Public Company Accounting Oversight Board determines, by regulation, is impermissible.
Pre-approval by the Committee of any permissible non-audit services is not required so long as: (i) the aggregate amount of all such permissible non-audit services provided to the Fund, the Adviser and any service providers controlling, controlled by or under common control with the Adviser that provide ongoing services to the Fund (“Covered Service Providers”) constitutes not more than 5% of the total amount of revenues paid to the independent auditors during the fiscal year in which the permissible non-audit services are provided to (a) the Fund, (b) the Adviser and (c) any entity controlling, controlled by or under common control with the Adviser that provides ongoing services to the Fund during the fiscal year in which the services are provided that would have to be approved by the Committee; (ii) the permissible non-audit services were not recognized by the Fund at the time of the engagement to be non-audit services; and (iii) such services are promptly brought to the attention of the Committee and approved by the Committee (or its delegate(s)) prior to the completion of the audit.
(2) None of the services described in paragraphs (b) through (d) of this Item were performed in reliance on paragraph (c)(7)(i)(C) of Rule 2-01 of Regulation S-X.
(f) Not applicable.
(g) Non-audit fees billed by the Auditor for services rendered to Legg Mason ETF Investment Trust, LMPFA and any entity controlling, controlled by, or under common control with LMPFA that provides ongoing services to Legg Mason ETF Investment Trust during the reporting period were $1,558,348 in the previous fiscal year and $785,604 in March 31, 2023.
(h) Yes. Legg Mason ETF Investment Trust’s Audit Committee has considered whether the provision of non-audit services that were rendered to Service Affiliates, which were not pre-approved (not requiring pre-approval), is compatible with maintaining the Accountant’s independence. All services provided by the Auditor to the Legg Mason ETF Investment Trust or to Service Affiliates, which were required to be pre-approved, were pre-approved as required.
(i) Not applicable.
(j) Not applicable.
| ITEM 5. | AUDIT COMMITTEE OF LISTED REGISTRANTS. |
| | a) | The independent board members are acting as the registrant’s audit committee as specified in Section 3(a)(58)(B) of the Exchange Act. The Audit Committee consists of the following Board members: |
Rohit Bhagat
Jennifer M. Johnson
Deborah D. McWhinney
Anantha K. Pradeep
| ITEM 6. | SCHEDULE OF INVESTMENTS. |
Included herein under Item 1.
| ITEM 7. | DISCLOSURE OF PROXY VOTING POLICIES AND PROCEDURES FOR CLOSED-END MANAGEMENT INVESTMENT COMPANIES. |
Not applicable.
| ITEM 8. | PORTFOLIO MANAGERS OF CLOSED-END MANAGEMENT INVESTMENT COMPANIES. |
Not applicable.
| ITEM 9. | PURCHASES OF EQUITY SECURITIES BY CLOSED-END MANAGEMENT INVESTMENT COMPANY AND AFFILIATED PURCHASERS. |
Not applicable.
| ITEM 10. | SUBMISSION OF MATTERS TO A VOTE OF SECURITY HOLDERS. |
Not applicable.
| ITEM 11. | CONTROLS AND PROCEDURES. |
| | (a) | The registrant’s principal executive officer and principal financial officer have concluded that the registrant’s disclosure controls and procedures (as defined in Rule 31a- 3(c) under the Investment Company Act of 1940, as amended (the “1940 Act”)) are effective as of a date within 90 days of the filing date of this report that includes the disclosure required by this paragraph, based on their evaluation of the disclosure controls and procedures required by Rule 31a-3(b) under the 1940 Act and 15d-15(b) under the Securities Exchange Act of 1934. |
| | (b) | There were no changes in the registrant’s internal control over financial reporting (as defined in Rule 31a-3(d) under the 1940 Act) that occurred during the period covered by this report that have materially affected, or are likely to materially affect the registrant’s internal control over financial reporting. |
| ITEM 12. | DISCLOSURE OF SECURITIES LENDING ACTIVITIES FOR CLOSED-END MANAGEMENT INVESTMENT COMPANIES. |
Not applicable.
(a) (1) Code of Ethics attached hereto.
Exhibit 99.CODE ETH
(a) (2) Certifications pursuant to section 312 of the Sarbanes-Oxley Act of 2002 attached hereto.
Exhibit 99.CERT
(b) Certifications pursuant to Section 906 of the Sarbanes-Oxley Act of 2002 attached hereto.
Exhibit 99.906CERT
SIGNATURES
Pursuant to the requirements of the Securities Exchange Act of 1934 and the Investment Company Act of 1940, the registrant has duly caused this Report to be signed on its behalf by the undersigned, there unto duly authorized.
| | |
| Legg Mason ETF Investment Trust |
| |
| By: | | /s/ Matthew T. Hinkle |
| | Matthew T. Hinkle |
| | Chief Executive Officer |
Date: May 22, 2023
Pursuant to the requirements of the Securities Exchange Act of 1934 and the Investment Company Act of 1940, this report has been signed below by the following persons on behalf of the registrant and in the capacities and on the dates indicated.
| | |
| By: | | /s/ Matthew T. Hinkle |
| | Matthew T. Hinkle |
| | Chief Executive Officer |
|
| Date: May 22, 2023 |
| |
| By: | | /s/ Vivek Pai |
| | Vivek Pai |
| | Principal Financial Officer |
Date: May 22, 2023