UNITED STATES
SECURITIES AND EXCHANGE COMMISSION
Washington, D.C. 20549
FORM N-CSR
CERTIFIED SHAREHOLDER REPORT OF REGISTERED
MANAGEMENT INVESTMENT COMPANIES
Investment Company Act file number 811-23096
Legg Mason ETF Investment Trust
(Exact name of registrant as specified in charter)
620 Eighth Avenue, 47th Floor, New York, NY 10018
(Address of principal executive offices) (Zip code)
Harris Goldblat
Franklin Templeton
100 First Stamford Place
Stamford, CT 06902
(Name and address of agent for service)
Registrant’s telephone number, including area code: 1-877-721-1926
Date of fiscal year end: March 31
Date of reporting period: March 31, 2023
| ITEM 1. | REPORT TO STOCKHOLDERS. |
The Annual Report to Stockholders is filed herewith.

| | |
| Annual Report | | March 31, 2023 |
ROYCE QUANT
SMALL-CAP QUALITY
VALUE ETF
SQLV

|
| INVESTMENT PRODUCTS: NOT FDIC INSURED • NO BANK GUARANTEE • MAY LOSE VALUE |
Fund objective
The Fund seeks to achieve long-term growth of capital.
Letter from the president

Dear Shareholder,
We are pleased to provide the annual report of Royce Quant Small-Cap Quality Value ETF for the twelve-month reporting period ended March 31, 2023. Please read on for a detailed look at prevailing economic and market conditions during the Fund’s reporting period and to learn how those conditions have affected Fund performance.
As always, we remain committed to providing you with excellent service and a full spectrum of investment choices. We also remain committed to supplementing the support you receive from your financial advisor. One way we accomplish this is through our website, www.franklintempleton.com. Here you can gain immediate access to market and investment information, including:
| • | | Fund net asset value and market price, |
| • | | Market insights and commentaries from our portfolio managers, and |
| • | | A host of educational resources. |
We look forward to helping you meet your financial goals.
Sincerely,

Patrick O’Connor
President and Chief Executive Officer - Investment Management President
April 28, 2023
| | |
| II | | Royce Quant Small-Cap Quality Value ETF |
Fund overview
Q. What is the Fund’s investment strategy?
A. Royce Quant Small-Cap Quality ETF primarily invests in equity securities of small-capitalization companies that are traded in the United States and meet certain criteria using a proprietary methodology created by the Fund’s subadviser, Royce & Associates, LP (Royce & Associates, LP primarily conducts its business under the name Royce Investment Partners (“Royce” or the “subadviser”)). Under normal market conditions, the Fund invests at least 80% of its net assets, plus borrowings for investment purposes, if any, in equity securities of small-capitalization companies or other instruments with similar characteristics. Small-capitalization companies are U.S.-headquartered companies listed on U.S. exchanges with market capitalizations that are between the 1001st and 3000th largest companies based on descending market capitalization at the time of investment. As of March 31, 2023, the universe was comprised of companies with capitalizations ranging from $50 million to $3.9 billion.
Royce uses a quantitative investment process that seeks to identify stocks with lower than average valuation, higher than average profitability, and higher than average debt coverage (i.e., available cash flow to pay current debt obligations) as compared with other stocks included in the investment universe while maintaining a comparable risk profile. The Fund’s investment universe includes common stocks of U.S.-headquartered companies listed on U.S. exchanges, and excludes royalty companies, American depositary receipts and global depositary receipts, master limited partnerships, stocks with a share price less than or equal to $1.00 at the time of purchase, and stocks deemed by Royce to have insufficient trading volume. The universe is then refined to include stocks with market capitalizations that are between the 1001st and 3000th largest companies based on descending market capitalization at the time of investment. From that universe, real estate investment trusts are excluded.
From the universe of eligible companies, Royce selects securities using its proprietary, rules-based multi-factor scoring system, with all factors described herein measured and determined by Royce, in an effort to identify companies which combine favorable attributes of quality and value, as defined by Royce, compared with companies within the same market sector. Royce ranks the securities in the investment universe within each sector according to the quality and value factors, which yields a model score that determines the securities that are selected for inclusion in the Fund’s portfolio. Sector allocations are determined by the number of companies in each sector. For quality factors, Royce focuses on a company’s profitability (as measured by return on invested capital), the historic stability of its profitability (as measured by variance of return on assets), and debt coverage (as measured by cash flow relative to debt). The debt coverage ratio is used in an attempt to limit the Fund’s exposure to companies that Royce believes may have higher financial risk. For value factors, Royce focuses on the free cash flow of a company (i.e., net cash from operating activities minus capital expenditures) compared to its enterprise value. Enterprise value is determined by adding the company’s outstanding debt (including preferred stock
| | | | | | |
| Royce Quant Small-Cap Quality Value ETF 2023 Annual Report | | | | | 1 | |
Fund overview (cont’d)
and minority interests) to the company’s market capitalization and then subtracting cash and cash equivalents from the total value.
After the securities are scored by quality and value factors, each security’s momentum score, which is based on the price performance over the most recent 30 days, is used to determine the timing of when the security may be bought or sold for the Fund (i.e., the momentum score is used by Royce to try to determine the opportune time to buy or sell). For example, if a security selected for inclusion in the Fund’s portfolio according to the quality and value factors has exhibited high momentum, Royce may temporarily delay purchasing such security. Conversely, if a security selected for removal from the Fund’s portfolio according to the quality and value factors has exhibited high momentum, Royce will typically sell such security as soon as is practicable.
Position weights of securities within the Fund’s portfolio are determined by Royce by calculating a composite score based on company fundamentals that include book value, revenue, free cash flow, and dividends paid. By using fundamental factors to weight stocks rather than market capitalization, Royce seeks to have lower exposure to overvalued companies while still maintaining broad diversification within the Fund’s portfolio. Royce generally seeks to limit the weight of individual securities in the Fund’s portfolio to no more than 3% of its net assets and to limit sector exposures within the portfolio to no more than 25% of its net assets, each measured at time of investment. Although the Fund primarily invests in equity securities of small-capitalization companies, the Fund may continue to hold or, in some cases, build positions in companies with higher market capitalizations.
Royce’s proprietary, rules-based multi-factor scoring system may incorporate information and data obtained from third-party providers as supplementary to Royce’s own proprietary research and analysis. Royce has the right to change the third-party service providers that support this process at any time.
Royce may seek to sell a security if: (i) the security no longer meets its quality and value criteria; (ii) the security reaches its position size limit in the Fund’s portfolio; (iii) there are adverse policy changes that could affect the security’s outlook; or (iv) better investment opportunities become available. The Fund may engage in active and frequent trading to achieve its investment objective, resulting in high portfolio turnover.
Q. What were the overall market conditions during the Fund’s reporting period?
A. The reporting period from March 31, 2022, through March 31, 2023 was negative for U.S. small-caps as inflation, a hawkish U.S. Federal Reserve (Fed), the ongoing war in Ukraine, and the threat of recession combined to keep investors selling. The Russell 2000® Indexi was down 11.61% for the period and fell 24.71% from its November 8, 2021, peak through March 31, 2023. During the 12-month reporting period, large-cap stocks fared better, with the Russell 1000® Indexii losing 8.39%. Both mega-cap and growth stocks lost more than the large-cap index for the period, with the Russell Top 50® Indexiii falling 9.84% and the Nasdaq Composite Indexiv tumbling 13.25%. The Russell Microcap® Indexv had the most
| | | | |
| 2 | | | | Royce Quant Small-Cap Quality Value ETF 2023 Annual Report |
difficult 12-month period, falling 17.93%. Thanks to a significant advantage in 2023’s first quarter, the Russell 2000® Growth Indexvi outpaced the Russell 2000® Value Indexvii, down 10.60% versus 12.96% for the period. The first quarter of 2023 reversed a span of outperformance for small-cap value, which had beaten its small-cap growth sibling in eight of the last nine quarters prior to 2023’s first quarter. Within the Russell 2000® Index, results at the sector level were driven by negative returns — and corresponding large detractions from the index’s performance — from the financials, health care sectors, and real estate sectors for the 12-month period. Consumer staples made the only positive contribution, while utilities and materials made the smallest detractions. The three industries that detracted most from performance for the period were banks (financials), software (information technology), and biotechnology (health care). The industries that made the biggest positive contribution were construction & engineering (industrials), beverages (consumer staples), and energy equipment & services (energy).
The second quarter of 2022 offered no safe havens for investors in the U.S. (or anywhere else) as these same factors, along with higher energy prices, conspired to drive stock prices lower — regardless of asset class, style, or geography. The Russell 2000® lost 17.20% for 2022’s second quarter, slightly lagging the large-cap Russell 1000® Index, which fell 16.67% for the same period. For historical context, the second quarter of 2022 ranked eleventh out of 60 down quarters for the Russell 2000® Index since its inception on December 31, 1978. The most notable spreads in performance were not based on capitalization but on style, as growth stocks suffered more than their value siblings across asset classes. With interest rates rising sharply in the quarter, these relative results were consistent with our view that growth stocks face considerable duration exposure, arguably more than investors appreciate. Within small-cap, the Russell 2000® Value Index was down 15.28%, outperforming the Russell 2000® Growth Index — which fell 19.25% — and recording small-cap value’s seventh consecutive quarter of outperformance.
After equity prices moved downward in volatile fashion through the first six months of 2022, the third quarter saw a spirited, but ultimately short-lived, rally that ran through July and into mid-August 2022 before down days returned, negating its midsummer gains. Unlike large-caps, however, small-caps did not reach a new low in 2022’s third quarter as the June 16, 2022 low held in spite of the 17.45% decline for the Russell 2000® from August 15 through September 30, 2022. For 2022’s third quarter as a whole, the Russell 2000® was down 2.19%, ahead of the Russell 1000®, which was down 4.61% for the same period. Negative third-quarter 2022 performance contributed to near-record losses for the small- and large-cap indexes for the first nine months of a calendar year, as the Russell 2000® was down 25.10%, while the Russell 1000® fell 24.59%. The Russell 2000® Value Index lost more than the Russell 2000® Growth Index in 2022’s third quarter, down 4.61% versus a gain of 0.24%. Small-cap value lagging reversed the previous trend of value having the advantage. Additionally, both the brief rally and the quarter overall were dominated by lower-quality small-caps: Companies with negative earnings before interest
| | | | | | |
| Royce Quant Small-Cap Quality Value ETF 2023 Annual Report | | | | | 3 | |
Fund overview (cont’d)
and taxes (EBIT) outpaced those with earnings, while dividend payers underperformed non-dividend payers. This pattern contrasted with higher-quality small caps leading during the first half of 2022.
Stocks rallied across much of the globe through the first two months of 2022’s fourth quarter before shares began to fall again in December. Still, 2022’s last quarter ended as the only positive quarter of the year for both the Russell 2000®, which rose 6.23%, and Russell 1000® Index, which gained 7.24%. The Russell 2000® Value Index more than doubled the performance of Russell 2000® Growth Index in 2022’s fourth quarter, up 8.42% versus 4.13%. In addition, high-quality small-cap companies — that is, those in the highest quintile of return on invested capital (“ROIC”) within the Russell 2000® Index — had the highest returns in 2022’s fourth quarter, while those in the lowest ROIC quintile had the lowest. This advantage for quality came in a quarter that encompassed a brief rally derailed by a correction. While a similar up and down pattern characterized 2022’s third quarter, that period saw lower-quality small-caps — specifically those with negative earnings before interest and taxes (“EBIT”) — beat companies with earnings. As small-caps with both higher ROIC and earnings also led in 2022’s first half, these stocks generally held up better in 2022 overall compared to their lower-quality, non-earning siblings.
The Russell 2000® gained 2.74% in 2023’s first quarter, a small gain that masked some noteworthy extremes. Small caps first advanced 13.69% year-to-date through February 2, 2023 before continued Fed hawkishness and a resurgence of recession fears combined to drive stock prices lower. These losses were then exacerbated by the failures of Silicon Valley Bank and Signature Bank, along with related worries over the fragile condition of First Republic Bank and Credit Suisse. Investors were concerned, for understandable reasons, that the banking industry might be facing the kind of contagion that threatened the stability of the global economy and financial markets in 2008. Their sizable weightings in regional banks pressured quarterly returns for both the Russell 2000® and Russell 2000® Value indexes. Of course, these wide-ranging moves are becoming something of a norm for the Russell 2000®: in five of the last six quarters, the index experienced an increase of at least 10% and a decline of at least 10% each quarter, while for the last six consecutive quarters small caps have seen either an advance or a loss of at least 10%. With Treasury yields behaving with the sort of high volatility we are used to seeing in speculative equities, it was perhaps not surprising that investors flocked back to the — perceived in our view — safety of mega-cap stocks, such as Meta Platforms, Apple, Microsoft, and Alphabet, all of which rallied through the end of March 2023. The upshot was that small caps were behind their larger and more growth-oriented peers for the quarter, with the Russell 1000® Index up 7.46%, the Russell Top 50® Mega Cap Indexviii up 12.92%, and the Nasdaq Composite up 17.05%. After a mostly steady run of outperforming its growth sibling over the last eight quarters, the Russell 2000® Value took a back seat in 2023’s first quarter, down 0.66% versus a gain of 6.07% for the Russell 2000® Growth Index. This led to the small-cap value index losing, at least for now, certain longer-term advantages. While the Russell 2000® Value Index beat the Russell 2000® Growth Index for the three- and five-year
| | | | |
| 4 | | | | Royce Quant Small-Cap Quality Value ETF 2023 Annual Report |
periods ended 3/31/23, it trailed small-cap growth for the one- and 10-year periods ended March 31, 2023.
Performance review
For the 12 months ended March 31, 2023, Royce Quant Small-Cap Quality Value ETF generated a -6.88% return on a net asset value (“NAV”)ix basis and -7.17% based on its market pricex per share.
The performance table shows the Fund’s total return for the 12 months ended March 31, 2023 based on its NAV and market price as of March 31, 2023. The Fund’s broad-based market index, the Russell 2000 Index, returned -11.61% over the same time frame. The Lipper Small-Cap Core Funds Category Averagexi returned -7.66% for the same period. Prior to May 10, 2022, the Fund operated as an index based ETF that sought to track the investment results of the Royce Small-Cap Quality Value Index. Please note that Lipper performance returns are based on each fund’s NAV.
| | | | | | | | |
Performance Snapshot as of March 31, 2023
(unaudited) | |
| Royce Quant Small-Cap Quality Value ETF: | | 6 months | | | 12 months | |
$35.50 (NAV) | | | 13.08 | % | | | -6.88 | %*† |
$35.38 (Market Price) | | | 12.30 | % | | | -7.17 | %*‡ |
| Russell 2000 Index | | | 9.13 | % | | | -11.61 | % |
| Lipper Small-Cap Core Funds Category Average | | | 12.83 | % | | | -7.66 | % |
The performance shown represents past performance. Past performance is no guarantee of future results and current performance may be higher or lower than the performance shown above. Principal value and investment returns will fluctuate so shares, when sold, may be worth more or less than their original cost. Performance data current to the most recent month-end is available at www.franklintempleton.com.
Investors buy and sell shares of an exchange-traded fund (“ETF”) at market price (not NAV) in the secondary market throughout the trading day. These shares are not individually available for direct purchase from or direct redemption to the ETF. Market price returns shown are typically based upon the official closing price of the Fund’s shares. These returns do not represent investors’ returns had they traded shares at other times. Performance figures for periods shorter than one year represent cumulative figures and are not annualized.
Information showing the Fund’s net asset value, market price, premiums and discounts, and bid-ask spreads for various time periods is available by visiting the Fund’s website at www.franklintempleton.com.
As of the Fund’s current prospectus dated July 29, 2022, the gross total annual fund operating expense ratio for the Fund was 0.61%.
* Total returns are based on changes in NAV or market price, respectively. Returns reflect the deduction of all Fund expenses. Returns do not reflect the deduction of brokerage commissions or taxes that investors pay on distributions or the sale of shares.
| | | | | | |
| Royce Quant Small-Cap Quality Value ETF 2023 Annual Report | | | | | 5 | |
Fund overview (cont’d)
† Total return assumes the reinvestment of all distributions, including returns of capital, if any, at NAV.
‡ Total return assumes the reinvestment of all distributions, including returns of capital, if any, at market price, which typically is based upon the official closing price of the Fund’s shares.
Q. What were the leading contributors to performance?
A. Four of the 11 equity sectors in which the Fund held investments finished the 12-month reporting period ended March 31, 2023, in the black, with the largest contributions coming from information technology, industrials, and energy. At the industry level, semiconductors & semiconductor equipment, and electronic equipment, instruments & components (both in information technology), and diversified consumer services (consumer discretionary) contributed most for the 12-month period. Relative to the Russell 2000® Index, the Fund benefited from positive stock selection within the information technology and industrials sectors. Additionally, the Fund benefited relative to the Russell 2000® Index due to exposure to stocks with lower valuation and higher profitability within the small-cap universe.
Q. What were the leading detractors from performance?
A. Seven of the 11 equity sectors in which the Fund held investments finished the 12-month reporting period ended March 31, 2023, in the red, with the largest performance detractions coming from financials and health care, with materials detracting modestly. At the industry level, banks (financials), health care equipment & supplies, and biotechnology (both in health care) detracted most for the 12-month period. Relative to the Russell 2000® Index, health care was the largest detractor due to negative stock selection. The Fund’s relative performance was also hindered slightly by using the short-term momentum factor for timing trades.
Looking for additional information?
The Fund’s daily NAV is available online at www.franklintempleton.com. The Fund is traded under the symbol “SQLV” and its closing market price is available on most financial websites. In a continuing effort to provide information concerning the Fund, shareholders may call 1-877-721-1926 (toll free), Monday through Friday from 8:00 a.m. to 5:30 p.m. Eastern time, for the Fund’s current NAV, market price and other information.
Thank you for your investment in Royce Quant Small-Cap Quality Value ETF. As always, we appreciate that you have chosen us to manage your assets and we remain focused on achieving the Fund’s investment goals.
Sincerely,
Royce & Associates, LP
April 11, 2023
RISKS: The market values of securities or other assets will fluctuate, sometimes sharply and unpredictably, due to changes in general market conditions, overall economic trends or events,
| | | | |
| 6 | | | | Royce Quant Small-Cap Quality Value ETF 2023 Annual Report |
governmental actions or intervention, actions taken by the U.S. Federal Reserve or foreign central banks, market disruptions caused by trade disputes or other factors, political developments, armed conflicts, economic sanctions and countermeasures in response to sanctions, major cybersecurity events, investor sentiment, the global and domestic effects of a pandemic, and other factors that may or may not be related to the issuer of the security or other asset. The market values of securities or other assets will fluctuate, sometimes sharply and unpredictably, due to changes in general market conditions, overall economic trends or events, governmental actions or intervention, actions taken by the U.S. Federal Reserve or foreign central banks, market disruptions caused by trade disputes or other factors, political developments, armed conflicts, economic sanctions and countermeasures in response to sanctions, major cybersecurity events, investor sentiment, the global and domestic effects of a pandemic, and other factors that may or may not be related to the issuer of the security or other asset. Equity securities are subject to market and price fluctuations. The Fund invests primarily in small-cap stocks, which may involve considerably more risk than investing in larger-cap stocks. The Fund has significant exposure to U.S. issuers. A decrease in imports or exports, changes in trade regulations and/or an economic recession in the United States may have a material adverse effect on the U.S. economy and the securities listed on U.S. exchanges. Diversification does not ensure gains or protect against market declines. Please see the Fund’s prospectus for a more complete discussion of these and other risks and the Fund’s investment strategies.
Portfolio holdings and breakdowns are as of March 31, 2023 and are subject to change and may not be representative of the portfolio managers’ current or future investments. Please refer to pages 13 through 22 for a list and percentage breakdown of the Fund’s holdings.
The mention of sector breakdowns is for informational purposes only and should not be construed as a recommendation to purchase or sell any securities. The information provided regarding such sectors is not a sufficient basis upon which to make an investment decision. Investors seeking financial advice regarding the appropriateness of investing in any securities or investment strategies discussed should consult their financial professional. The Fund’s top five sector holdings (as a percentage of net assets) as of March 31, 2023 were: [sector1] (19.4%), [sector2] (18.4%), [sector3] (15.1%), [sector4] (14.3%) and [sector5] (12.3%). The Fund’s composition may differ over time.
All investments are subject to risk including the possible loss of principal. Past performance is no guarantee of future results. An index is a statistical composite that tracks a specified financial market, sector or rules-based investment process. Unlike a fund, an index does not actually hold a portfolio of securities and therefore does not incur the expenses incurred by a fund. These expenses negatively impact fund performance. All index performance reflects no deduction for fees, expenses or taxes. Please note that an investor cannot invest directly in an index.
The information provided is not intended to be a forecast of future events, a guarantee of future results or investment advice. Views expressed may differ from those of the firm as a whole.
| | | | | | |
| Royce Quant Small-Cap Quality Value ETF 2023 Annual Report | | | | | 7 | |
Fund overview (cont’d)
| i | The Russell 2000® Index measures the performance of the small-cap segment of the U.S. equity universe. The Russell 2000® Index is a subset of the Russell 3000® Index representing approximately 10% of the total market capitalization of that index. It includes approximately 2,000 of the smallest securities based on a combination of their market cap and current index membership. The Russell 3000® Index measures the performance of the 3,000 largest U.S. companies based on total market capitalization, which represents approximately 98% of the U.S. equity market. |
| ii | The Russell 1000® Index measures the performance of the large-cap segment of the U.S. equity universe. It is a subset of the Russell 3000® Index and includes approximately 1,000 of the largest securities based on a combination of their market cap and current index membership. The Russell 1000® Index represents approximately 90% of the U.S. market. |
| iii | The Russell Top 50® Index is a market capitalization weighted index of the 50 largest stocks in the Russell 3000® universe of U.S.-based equities. The index can be considered a representation of mega cap stocks. |
| iv | The Nasdaq Composite Index is a stock market index that consists of the stocks that are listed on the Nasdaq stock exchange. |
| v | The Russell Microcap Index measures the performance of the microcap segment of the U.S. equity market. It makes up less than 3% of the U.S. equity market. It includes 1,000 of the smallest securities in the Russell 2000® Index based on a combination of their market cap and current index membership and it also includes up to the next 1,000 stocks. |
| vi | The Russell 2000® Growth Index measures the performance of the small-cap growth segment of the U.S. equity universe. It includes those Russell 2000 Index companies with higher price-to-book ratios and higher forecasted growth values. |
| vii | The Russell 2000® Value Index measures the performance of those Russell 2000® Index companies with lower price to-book ratios and lower forecasted growth values. (A price-to-book ratio is the price of a stock compared to the difference between a company’s assets and liabilities. |
| viii | The Russell Top 50® Mega Cap Index is a market-capitalization-weighted index of the 50 largest stocks in the broad-based Russell 3000® universe of U.S.-based equities. The Top 50 index therefore is a mega-cap index. |
| ix | Net Asset Value (“NAV”) is calculated by subtracting total liabilities from total assets and dividing the results by the number of shares outstanding. |
| x | Market Price is determined by supply and demand. It is the price at which an investor purchases or sells shares of the Fund. The Market Price may differ from the Fund’s NAV. |
| xi | Lipper, Inc., a wholly-owned subsidiary of Refinitiv, provides independent insight on global collective investments. Returns are based on the period ended March 31, 2023, including the reinvestment of all distributions, including the returns of capital, if any, calculated among the 925 funds for the six-month period and among the 919 funds for the 12-month period in the Fund’s Lipper category. |
| | | | |
| 8 | | | | Royce Quant Small-Cap Quality Value ETF 2023 Annual Report |
Fund at a glance† (unaudited)
Investment breakdown (%) as a percent of total investments
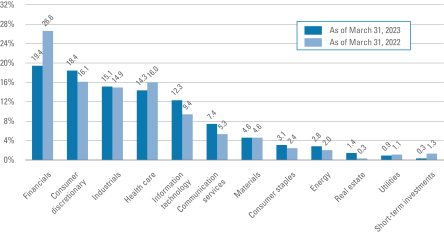
| † | The bar graph above represents the composition of the Fund’s investments as of March 31, 2023 and March 31, 2022. Effective May 10, 2022, the fund is actively managed. As a result, the composition of the Fund’s investments is subject to change at any time. |
| | | | | | |
| Royce Quant Small-Cap Quality Value ETF 2023 Annual Report | | | | | 9 | |
Fund expenses (unaudited)
Example
As a shareholder of the Fund, you may incur two types of costs: (1) transaction costs, such as brokerage commissions paid on purchases and sales of Fund shares; and (2) ongoing costs, including management fees; and other Fund expenses. This example is intended to help you understand your ongoing costs (in dollars) of investing in the Fund and to compare these costs with the ongoing costs of investing in other funds.
This example is based on an investment of $1,000 invested on October 1, 2022 and held for the six months ended March 31, 2023.
Actual expenses
The table below titled “Based on actual total return” provides information about actual account values and actual expenses. You may use the information provided in this table, together with the amount you invested, to estimate the expenses that you paid over the period. To estimate the expenses you paid on your account, divide your ending account value by $1,000 (for example, an $8,600 ending account value divided by $1,000 = 8.6), then multiply the result by the number under the heading entitled “Expenses Paid During the Period”.
Hypothetical example for comparison purposes
The table below titled “Based on hypothetical total return” provides information about hypothetical account values and hypothetical expenses based on the actual expense ratio and an assumed rate of return of 5.00% per year before expenses, which is not the Fund’s actual return. The hypothetical account values and expenses may not be used to estimate the actual ending account balance or expenses you paid for the period. You may use the information provided in this table to compare the ongoing costs of investing in the Fund and other funds. To do so, compare the 5.00% hypothetical example relating to the Fund with the 5.00% hypothetical examples that appear in the shareholder reports of the other funds.
Please note that the expenses shown in the table below are meant to highlight your ongoing costs only and do not reflect any transactional costs, such as brokerage commissions paid on purchases and sales of Fund shares. Therefore, the table is useful in comparing ongoing costs only, and will not help you determine the relative total costs of owning different funds. In addition, if these transaction costs were included, your costs would have been higher.
| | | | | | | | | | | | | | | | | | | | | | | | | | | | | | | | | | | | | | | | | | | | | | | | | | |
| | |
| Based on actual total return1 | | | | Based on hypothetical total return1 |
Actual
Total
Return2 | | Beginning
Account
Value | | Ending Account Value | | Annualized
Expense
Ratio | | Expenses
Paid
During
the
Period3 | | | | Hypothetical
Annualized
Total Return | | Beginning
Account
Value | | Ending
Account Value | | Annualized
Expense
Ratio | | Expenses
Paid
During
the
Period3 |
| | | 13.08% | | | | $ | 1,000.00 | | | | $ | 1,130.80 | | | | | 0.60 | % | | | $ | 3.19 | | | | | | | 5.00 | % | | | | $1,000.00 | | | | $ | 1,021.94 | | | | | 0.60 | % | | | $ | 3.02 | |
| 1 | For the six months ended March 31, 2023. |
| 2 | Assumes the reinvestment of all distributions, including returns of capital, if any, at net asset value. Total return is not annualized, as it may not be representative of the total return for the year. Performance figures may reflect fee waivers and/or expense reimbursements. In the absence of fee waivers and/or expense reimbursements, the total return would have been lower. Past performance is no guarantee of future results. |
| 3 | Expenses (net of fee waivers and/or expense reimbursements) are equal to the Fund’s annualized expense ratio multiplied by the average account value over the period, multiplied by the number of days in the most recent fiscal half-year (182), then divided by 365. |
| | | | |
| 10 | | | | Royce Quant Small-Cap Quality Value ETF 2023 Annual Report |
Fund performance (unaudited)
| | | | |
| Net Asset Value | | | |
| Average annual total returns1 | | | |
| Twelve Months Ended 3/31/23 | | | -6.88 | % |
| Five Years Ended 3/31/23 | | | 6.97 | |
| Inception date of 7/12/17 through 3/31/23 | | | 7.54 | |
| |
| Cumulative total returns1 | | | |
| Inception date of 7/12/17 through 3/31/23 | | | 51.54 | % |
| | | | |
| Market Price | | | |
| |
| Average annual total returns2 | | | |
| Twelve Months Ended 3/31/23 | | | -7.17 | % |
| Five Years Ended 3/31/23 | | | 6.90 | |
| Inception date of 7/12/17 through 3/31/23 | | | 7.48 | |
| |
| Cumulative total returns2 | | | |
| Inception date of 7/12/17 through 3/31/23 | | | 51.03 | % |
All figures represent past performance and are not a guarantee of future results. Investment returns and principal value of an investment will fluctuate so that an investor’s shares, when sold, may be worth more or less than their original cost. NAV returns assume that dividends and capital gain distributions have been reinvested in the Fund at NAV. The returns shown do not reflect the deduction of brokerage commissions or taxes that investors would pay on distributions or the sale of shares. Performance figures may reflect fee waivers and/or expense reimbursements. In the absence of fee waivers and/or expense reimbursements, the total return would have been lower.
Investors buy and sell shares of the Fund at market price, not NAV, in the secondary market throughout the trading day. These shares are not individually available for direct purchase from or direct redemption to the Fund. The Fund’s per share NAV is the value of one share of the Fund and is calculated by dividing the value of total assets less total liabilities by the number of shares outstanding. The NAV return is based on the NAV of the Fund and effective July 1, 2020, market price returns typically are based upon the official closing price of the Fund’s shares. Prior to July 1, 2020, market price returns generally were based upon the mid-point between the bid and ask on the Fund’s principal trading market when the Fund’s NAV was determined, which was typically 4:00 p.m. Eastern time (U.S.). Market price performance reported for periods prior to July 1, 2020 continue to reflect market prices calculated based upon the mid-point between the bid and ask on the Fund’s principal trading market typically as of 4:00 p.m. Eastern time (U.S.). These returns do not represent investors’ returns had they traded shares at other times. NAV and market price returns assume that dividends and capital gain distributions have been reinvested in the Fund at NAV and market price, respectively. As with other exchange-traded funds, NAV returns and market price returns may differ because of factors such as the supply and demand for Fund shares and investors’ assessment of the underlying value of the Fund’s portfolio securities.
| 1 | Assumes the reinvestment of all distributions, including returns of capital, if any, at net asset value. |
| 2 | Assumes the reinvestment of all distributions, including returns of capital, if any, at market price. |
| | | | | | |
| Royce Quant Small-Cap Quality Value ETF 2023 Annual Report | | | | | 11 | |
Fund performance (unaudited) (cont’d)
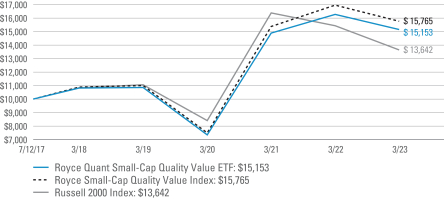
Value of $10,000 invested in
Royce Quant Small-Cap Quality Value ETF vs. Royce Small-Cap Quality Value Index and Russell 2000 Index† — July 12, 2017 - March 31, 2023
All figures represent past performance and are not a guarantee of future results. Investment returns and principal value of an investment will fluctuate so that an investor’s shares, when sold, may be worth more or less than their original cost. NAV returns assume that dividends and capital gain distributions have been reinvested in the Fund at NAV. The returns shown do not reflect the deduction of brokerage commissions or taxes that investors would pay on distributions or the sale of shares. Performance figures may reflect fee waivers and/or expense reimbursements. In the absence of fee waivers and/or expense reimbursements, the total return would have been lower.
| † | Hypothetical illustration of $10,000 invested in Royce Quant Small-Cap Quality Value ETF on July 12, 2017 (inception date), assuming the reinvestment of all distributions, including returns of capital, if any, at net asset value through March 31, 2023. The hypothetical illustration also assumes a $10,000 investment in the Royce Small-Cap Quality Value Index and the Russell 2000 Index. The Fund’s per share NAV is the value of one share of the Fund and is calculated by dividing the value of total assets less total liabilities by the number of shares outstanding. The NAV return is based on the NAV of the Fund. The Royce Small-Cap Quality Value Index (the “Underlying Index”) is an index composed of equity securities that meet certain criteria – lower than average valuation, higher than average profitability and higher than average debt coverage. The Underlying Index is based on a proprietary methodology created and sponsored by Royce & Associates, LP, the Fund’s subadviser. Effective May 10, 2022, the Fund became actively managed with a new investment objective and management policies. The Fund is no longer managed to track the performance of the Royce Small-Cap Quality Value Index. The Russell 2000 Index measures the 2000 smallest companies in the Russell 3000 Index. The indices are not subject to the same management and trading expenses as a fund. An index is a statistical composite that tracks a specified financial market, sector, or rules-based investment process. Unlike a fund, an index does not actually hold a portfolio of securities and therefore does not incur the expenses incurred by a fund. These expenses negatively impact fund performance. All index performance reflects no deduction for fees, expenses or taxes. Please note that an investor cannot invest directly in an index. |
| | | | |
| 12 | | | | Royce Quant Small-Cap Quality Value ETF 2023 Annual Report |
Schedule of investments
March 31, 2023
Royce Quant Small-Cap Quality Value ETF
(Percentages shown based on Fund net assets)
| | | | | | | | |
| Security | | Shares | | | Value | |
| Common Stocks — 99.7% | | | | | | | | |
| Communication Services — 7.4% | | | | | | | | |
Diversified Telecommunication Services — 0.5% | | | | | | | | |
EchoStar Corp., Class A Shares | | | 7,252 | | | | $132,639 | * |
Entertainment — 1.0% | | | | | | | | |
Playstudios Inc. | | | 17,332 | | | | 63,955 | * |
Sciplay Corp., Class A Shares | | | 6,999 | | | | 118,703 | * |
Vivid Seats Inc., Class A Shares | | | 8,495 | | | | 64,817 | * |
Total Entertainment | | | | | | | 247,475 | |
Interactive Media & Services — 3.1% | | | | | | | | |
Cargurus Inc. | | | 4,988 | | | | 93,176 | * |
MediaAlpha Inc., Class A Shares | | | 7,238 | | | | 108,425 | * |
Outbrain Inc. | | | 17,779 | | | | 73,427 | * |
Shutterstock Inc. | | | 1,816 | | | | 131,842 | |
TripAdvisor Inc. | | | 4,519 | | | | 89,747 | * |
Yelp Inc. | | | 2,732 | | | | 83,872 | * |
Ziff Davis Inc. | | | 1,526 | | | | 119,105 | * |
ZipRecruiter Inc., Class A Shares | | | 3,923 | | | | 62,533 | * |
Total Interactive Media & Services | | | | | | | 762,127 | |
Media — 2.8% | | | | | | | | |
Entravision Communications Corp., Class A Shares | | | 17,191 | | | | 104,006 | |
PubMatic Inc., Class A Shares | | | 3,422 | | | | 47,292 | * |
Scholastic Corp. | | | 2,457 | | | | 84,079 | |
Sinclair Broadcast Group Inc., Class A Shares | | | 11,040 | | | | 189,446 | |
TEGNA Inc. | | | 10,683 | | | | 180,649 | |
Thryv Holdings Inc. | | | 3,676 | | | | 84,769 | * |
Total Media | | | | | | | 690,241 | |
Total Communication Services | | | | | | | 1,832,482 | |
| Consumer Discretionary — 18.4% | | | | | | | | |
Automobile Components — 0.7% | | | | | | | | |
LCI Industries | | | 1,625 | | | | 178,539 | |
Diversified Consumer Services — 1.6% | | | | | | | | |
American Public Education Inc. | | | 7,910 | | | | 42,872 | * |
Frontdoor Inc. | | | 3,761 | | | | 104,857 | * |
Grand Canyon Education Inc. | | | 1,166 | | | | 132,807 | * |
Perdoceo Education Corp. | | | 8,250 | | | | 110,798 | * |
Total Diversified Consumer Services | | | | | | | 391,334 | |
Hotels, Restaurants & Leisure — 1.9% | | | | | | | | |
Bloomin’ Brands Inc. | | | 5,857 | | | | 150,232 | |
Golden Entertainment Inc. | | | 2,152 | | | | 93,634 | * |
See Notes to Financial Statements.
| | | | | | |
| Royce Quant Small-Cap Quality Value ETF 2023 Annual Report | | | | | 13 | |
Schedule of investments (cont’d)
March 31, 2023
Royce Quant Small-Cap Quality Value ETF
(Percentages shown based on Fund net assets)
| | | | | | | | |
| Security | | Shares | | | Value | |
Hotels, Restaurants & Leisure — continued | | | | | | | | |
Red Rock Resorts Inc., Class A Shares | | | 3,264 | | | $ | 145,476 | |
SeaWorld Entertainment Inc. | | | 1,548 | | | | 94,908 | * |
Total Hotels, Restaurants & Leisure | | | | | | | 484,250 | |
Household Durables — 4.2% | | | | | | | | |
Ethan Allen Interiors Inc. | | | 4,332 | | | | 118,957 | |
GoPro Inc., Class A Shares | | | 15,496 | | | | 77,945 | * |
Installed Building Products Inc. | | | 1,214 | | | | 138,432 | |
La-Z-Boy Inc. | | | 4,592 | | | | 133,535 | |
MDC Holdings Inc. | | | 4,630 | | | | 179,968 | |
Skyline Champion Corp. | | | 1,900 | | | | 142,937 | * |
Taylor Morrison Home Corp., Class A Shares | | | 5,758 | | | | 220,301 | * |
Tupperware Brands Corp. | | | 9,205 | | | | 23,013 | * |
Total Household Durables | | | | | | | 1,035,088 | |
Leisure Products — 2.1% | | | | | | | | |
MasterCraft Boat Holdings Inc. | | | 3,080 | | | | 93,724 | * |
Smith & Wesson Brands Inc. | | | 8,002 | | | | 98,504 | |
Sturm Ruger & Co. Inc. | | | 2,163 | | | | 124,243 | |
Vista Outdoor Inc. | | | 4,053 | | | | 112,309 | * |
YETI Holdings Inc. | | | 2,506 | | | | 100,240 | * |
Total Leisure Products | | | | | | | 529,020 | |
Specialty Retail — 6.4% | | | | | | | | |
Asbury Automotive Group Inc. | | | 983 | | | | 206,430 | * |
Big 5 Sporting Goods Corp. | | | 8,304 | | | | 63,858 | |
Buckle Inc. | | | 4,551 | | | | 162,425 | |
Chico’s FAS Inc. | | | 19,528 | | | | 107,404 | * |
Children’s Place Inc. | | | 2,679 | | | | 107,830 | * |
Group 1 Automotive Inc. | | | 1,045 | | | | 236,609 | |
Haverty Furniture Cos. Inc. | | | 3,829 | | | | 122,183 | |
MarineMax Inc. | | | 3,241 | | | | 93,179 | * |
OneWater Marine Inc., Class A Shares | | | 2,573 | | | | 71,967 | * |
Revolve Group Inc. | | | 3,130 | | | | 82,319 | * |
Shoe Carnival Inc. | | | 4,074 | | | | 104,498 | |
Torrid Holdings Inc. | | | 11,210 | | | | 48,876 | * |
Winmark Corp. | | | 337 | | | | 107,985 | |
Zumiez Inc. | | | 3,735 | | | | 68,873 | * |
Total Specialty Retail | | | | | | | 1,584,436 | |
Textiles, Apparel & Luxury Goods — 1.5% | | | | | | | | |
Kontoor Brands Inc. | | | 3,573 | | | | 172,897 | |
See Notes to Financial Statements.
| | | | |
| 14 | | | | Royce Quant Small-Cap Quality Value ETF 2023 Annual Report |
Royce Quant Small-Cap Quality Value ETF
(Percentages shown based on Fund net assets)
| | | | | | | | |
| Security | | Shares | | | Value | |
Textiles, Apparel & Luxury Goods — continued | | | | | | | | |
Movado Group Inc. | | | 2,980 | | | $ | 85,735 | |
Oxford Industries Inc. | | | 1,166 | | | | 123,118 | |
Total Textiles, Apparel & Luxury Goods | | | | | | | 381,750 | |
Total Consumer Discretionary | | | | | | | 4,584,417 | |
| Consumer Staples — 3.1% | | | | | | | | |
Beverages — 0.7% | | | | | | | | |
National Beverage Corp. | | | 3,368 | | | | 177,561 | * |
Personal Care Products — 1.7% | | | | | | | | |
BellRing Brands Inc. | | | 3,422 | | | | 116,348 | * |
Medifast Inc. | | | 887 | | | | 91,955 | |
Olaplex Holdings Inc. | | | 28,475 | | | | 121,588 | * |
USANA Health Sciences Inc. | | | 1,473 | | | | 92,652 | * |
Total Personal Care Products | | | | | | | 422,543 | |
Tobacco — 0.7% | | | | | | | | |
Vector Group Ltd. | | | 14,887 | | | | 178,793 | |
Total Consumer Staples | | | | | | | 778,897 | |
| Energy — 2.8% | | | | | | | | |
Energy Equipment & Services — 1.1% | | | | | | | | |
Cactus Inc., Class A Shares | | | 2,298 | | | | 94,747 | |
Helix Energy Solutions Group Inc. | | | 22,430 | | | | 173,608 | * |
Total Energy Equipment & Services | | | | | | | 268,355 | |
Oil, Gas & Consumable Fuels — 1.7% | | | | | | | | |
Chord Energy Corp. | | | 985 | | | | 132,581 | |
Peabody Energy Corp. | | | 6,417 | | | | 164,275 | * |
REX American Resources Corp. | | | 2,636 | | | | 75,364 | * |
SandRidge Energy Inc. | | | 3,664 | | | | 52,798 | * |
Total Oil, Gas & Consumable Fuels | | | | | | | 425,018 | |
Total Energy | | | | | | | 693,373 | |
| Financials — 19.4% | | | | | | | | |
Banks — 5.9% | | | | | | | | |
Bankwell Financial Group Inc. | | | 2,050 | | | | 50,963 | |
Civista Bancshares Inc. | | | 3,400 | | | | 57,392 | |
Customers Bancorp Inc. | | | 3,048 | | | | 56,449 | * |
Financial Institutions Inc. | | | 3,278 | | | | 63,200 | |
First Business Financial Services Inc. | | | 2,031 | | | | 61,966 | |
First Internet Bancorp | | | 1,794 | | | | 29,870 | |
FS Bancorp Inc. | | | 2,268 | | | | 68,063 | |
Hanmi Financial Corp. | | | 3,798 | | | | 70,529 | |
HomeStreet Inc. | | | 2,522 | | | | 45,371 | |
See Notes to Financial Statements.
| | | | | | |
| Royce Quant Small-Cap Quality Value ETF 2023 Annual Report | | | | | 15 | |
Schedule of investments (cont’d)
March 31, 2023
Royce Quant Small-Cap Quality Value ETF
(Percentages shown based on Fund net assets)
| | | | | | | | |
| Security | | Shares | | | Value | |
Banks — continued | | | | | | | | |
Independent Bank Corp. | | | 4,118 | | | $ | 73,177 | |
Luther Burbank Corp. | | | 7,193 | | | | 68,190 | |
Metrocity Bankshares Inc. | | | 3,927 | | | | 67,112 | |
Midland States Bancorp Inc. | | | 3,800 | | | | 81,396 | |
MidWestOne Financial Group Inc. | | | 2,818 | | | | 68,815 | |
Northeast Bank | | | 1,534 | | | | 51,634 | |
PacWest Bancorp | | | 6,259 | | | | 60,900 | |
Parke Bancorp Inc. | | | 3,160 | | | | 56,185 | |
PCB Bancorp | | | 3,517 | | | | 50,961 | |
RBB Bancorp | | | 3,772 | | | | 58,466 | |
Summit Financial Group Inc. | | | 2,629 | | | | 54,552 | |
Unity Bancorp Inc. | | | 2,390 | | | | 54,516 | |
Western Alliance Bancorp | | | 6,134 | | | | 218,002 | |
Total Banks | | | | | | | 1,467,709 | |
Capital Markets — 4.1% | | | | | | | | |
Artisan Partners Asset Management Inc., Class A Shares | | | 4,840 | | | | 154,783 | |
Cohen & Steers Inc. | | | 1,873 | | | | 119,797 | |
Diamond Hill Investment Group Inc. | | | 589 | | | | 96,938 | |
Donnelley Financial Solutions Inc. | | | 2,150 | | | | 87,849 | * |
Evercore Inc., Class A Shares | | | 1,668 | | | | 192,454 | |
Moelis & Co., Class A Shares | | | 4,223 | | | | 162,332 | |
Open Lending Corp., Class A Shares | | | 9,726 | | | | 68,471 | * |
Victory Capital Holdings Inc., Class A Shares | | | 4,249 | | | | 124,368 | |
Total Capital Markets | | | | | | | 1,006,992 | |
Consumer Finance — 0.7% | | | | | | | | |
Atlanticus Holdings Corp. | | | 3,048 | | | | 82,692 | * |
Green Dot Corp., Class A Shares | | | 4,871 | | | | 83,684 | * |
Total Consumer Finance | | | | | | | 166,376 | |
Financial Services — 4.4% | | | | | | | | |
Cass Information Systems Inc. | | | 2,161 | | | | 93,593 | |
Enact Holdings Inc. | | | 7,372 | | | | 168,524 | |
Jackson Financial Inc., Class A Shares | | | 7,434 | | | | 278,106 | |
Merchants Bancorp | | | 4,013 | | | | 104,498 | |
MGIC Investment Corp. | | | 13,280 | | | | 178,218 | |
NMI Holdings Inc., Class A Shares | | | 5,105 | | | | 113,995 | * |
Radian Group Inc. | | | 7,332 | | | | 162,037 | |
Total Financial Services | | | | | | | 1,098,971 | |
Insurance — 4.3% | | | | | | | | |
American Equity Investment Life Holding Co. | | | 4,793 | | | | 174,897 | |
Brighthouse Financial Inc. | | | 3,744 | | | | 165,148 | * |
See Notes to Financial Statements.
| | | | |
| 16 | | | | Royce Quant Small-Cap Quality Value ETF 2023 Annual Report |
Royce Quant Small-Cap Quality Value ETF
(Percentages shown based on Fund net assets)
| | | | | | | | |
| Security | | Shares | | | Value | |
Insurance — continued | | | | | | | | |
F&G Annuities & Life Inc. | | | 10,133 | | | $ | 183,610 | |
Genworth Financial Inc., Class A Shares | | | 48,192 | | | | 241,924 | * |
Investors Title Co. | | | 617 | | | | 93,167 | |
Oscar Health Inc., Class A Shares | | | 17,110 | | | | 111,899 | * |
Stewart Information Services Corp. | | | 2,492 | | | | 100,552 | |
Total Insurance | | | | | | | 1,071,197 | |
Total Financials | | | | | | | 4,811,245 | |
| Health Care — 14.3% | | | | | | | | |
Biotechnology — 3.3% | | | | | | | | |
Anika Therapeutics Inc. | | | 2,641 | | | | 75,849 | * |
Arcus Biosciences Inc. | | | 3,308 | | | | 60,338 | * |
Catalyst Pharmaceuticals Inc. | | | 4,152 | | | | 68,840 | * |
Dynavax Technologies Corp. | | | 6,328 | | | | 62,078 | * |
Eagle Pharmaceuticals Inc. | | | 2,068 | | | | 58,669 | * |
Emergent BioSolutions Inc. | | | 4,654 | | | | 48,215 | * |
Ironwood Pharmaceuticals Inc. | | | 8,088 | | | | 85,086 | * |
Organogenesis Holdings Inc. | | | 17,968 | | | | 38,272 | * |
REGENXBIO Inc. | | | 2,671 | | | | 50,509 | * |
Vir Biotechnology Inc. | | | 5,572 | | | | 129,660 | * |
Xencor Inc. | | | 2,677 | | | | 74,662 | * |
XOMA Corp. | | | 2,901 | | | | 61,240 | * |
Total Biotechnology | | | | | | | 813,418 | |
Health Care Equipment & Supplies — 4.8% | | | | | | | | |
AngioDynamics Inc. | | | 2,993 | | | | 30,948 | * |
Atrion Corp. | | | 121 | | | | 75,977 | |
Avanos Medical Inc. | | | 3,664 | | | | 108,967 | * |
Embecta Corp. | | | 3,130 | | | | 88,016 | |
Heska Corp. | | | 722 | | | | 70,482 | * |
Inogen Inc. | | | 2,346 | | | | 29,278 | * |
iRadimed Corp. | | | 1,631 | | | | 64,180 | |
LeMaitre Vascular Inc. | | | 1,400 | | | | 72,058 | |
Merit Medical Systems Inc. | | | 1,592 | | | | 117,728 | * |
NuVasive Inc. | | | 1,913 | | | | 79,026 | * |
Orthofix Medical Inc. | | | 3,302 | | | | 55,309 | * |
QuidelOrtho Corp. | | | 1,488 | | | | 132,566 | * |
Semler Scientific Inc. | | | 976 | | | | 26,157 | * |
Sensus Healthcare Inc. | | | 2,453 | | | | 12,780 | * |
Surmodics Inc. | | | 1,516 | | | | 34,534 | * |
Utah Medical Products Inc. | | | 678 | | | | 64,254 | |
See Notes to Financial Statements.
| | | | | | |
| Royce Quant Small-Cap Quality Value ETF 2023 Annual Report | | | | | 17 | |
Schedule of investments (cont’d)
March 31, 2023
Royce Quant Small-Cap Quality Value ETF
(Percentages shown based on Fund net assets)
| | | | | | | | |
| Security | | Shares | | | Value | |
Health Care Equipment & Supplies — continued | | | | | | | | |
Varex Imaging Corp. | | | 3,575 | | | $ | 65,029 | * |
Zynex Inc. | | | 5,145 | | | | 61,740 | * |
Total Health Care Equipment & Supplies | | | | | | | 1,189,029 | |
Health Care Providers & Services — 1.4% | | | | | | | | |
Enhabit Inc. | | | 5,658 | | | | 78,703 | * |
Fulgent Genetics Inc. | | | 2,380 | | | | 74,303 | * |
National Research Corp. | | | 1,862 | | | | 81,016 | |
US Physical Therapy Inc. | | | 1,067 | | | | 104,470 | |
Total Health Care Providers & Services | | | | | | | 338,492 | |
Health Care Technology — 1.2% | | | | | | | | |
Computer Programs & Systems Inc. | | | 2,294 | | | | 69,279 | * |
HealthStream Inc. | | | 2,985 | | | | 80,894 | * |
NextGen Healthcare Inc. | | | 4,696 | | | | 81,757 | * |
Veradigm Inc. | | | 5,729 | | | | 74,763 | * |
Total Health Care Technology | | | | | | | 306,693 | |
Life Sciences Tools & Services — 0.4% | | | | | | | | |
Cytek Biosciences Inc. | | | 4,414 | | | | 40,565 | * |
Maravai LifeSciences Holdings Inc., Class A Shares | | | 3,833 | | | | 53,700 | * |
OmniAb Inc., $12.50 EARNOUT | | | 298 | | | | 0 | *(a)(b)(c)(d) |
OmniAb Inc., $15.00 EARNOUT | | | 298 | | | | 0 | *(a)(b)(c)(d) |
OmniAb Inc., NASDAQ | | | 4,158 | | | | 15,301 | * |
Total Life Sciences Tools & Services | | | | | | | 109,566 | |
Pharmaceuticals — 3.2% | | | | | | | | |
Amphastar Pharmaceuticals Inc. | | | 2,556 | | | | 95,850 | * |
Corcept Therapeutics Inc. | | | 3,181 | | | | 68,900 | * |
Harmony Biosciences Holdings Inc. | | | 1,356 | | | | 44,273 | * |
Innoviva Inc. | | | 7,214 | | | | 81,158 | * |
Ligand Pharmaceuticals Inc. | | | 848 | | | | 62,379 | * |
Pacira BioSciences Inc. | | | 1,481 | | | | 60,440 | * |
Phibro Animal Health Corp., Class A Shares | | | 5,973 | | | | 91,506 | |
Prestige Consumer Healthcare Inc. | | | 2,072 | | | | 129,769 | * |
ProPhase Labs Inc. | | | 5,142 | | | | 39,182 | |
SIGA Technologies Inc. | | | 5,282 | | | | 30,372 | |
Supernus Pharmaceuticals Inc. | | | 2,586 | | | | 93,691 | * |
Total Pharmaceuticals | | | | | | | 797,520 | |
Total Health Care | | | | | | | 3,554,718 | |
| Industrials — 15.1% | | | | | | | | |
Building Products — 1.8% | | | | | | | | |
Apogee Enterprises Inc. | | | 2,426 | | | | 104,924 | |
Insteel Industries Inc. | | | 3,280 | | | | 91,250 | |
See Notes to Financial Statements.
| | | | |
| 18 | | | | Royce Quant Small-Cap Quality Value ETF 2023 Annual Report |
Royce Quant Small-Cap Quality Value ETF
(Percentages shown based on Fund net assets)
| | | | | | | | |
| Security | | Shares | | | Value | |
Building Products — continued | | | | | | | | |
Quanex Building Products Corp. | | | 4,550 | | | $ | 97,962 | |
Simpson Manufacturing Co. Inc. | | | 1,403 | | | | 153,825 | |
Total Building Products | | | | | | | 447,961 | |
Commercial Services & Supplies — 0.9% | | | | | | | | |
Ennis Inc. | | | 4,357 | | | | 91,889 | |
Heritage-Crystal Clean Inc. | | | 2,310 | | | | 82,259 | * |
Liquidity Services Inc. | | | 3,598 | | | | 47,386 | * |
Total Commercial Services & Supplies | | | | | | | 221,534 | |
Construction & Engineering — 1.8% | | | | | | | | |
Comfort Systems USA Inc. | | | 1,160 | | | | 169,314 | |
MYR Group Inc. | | | 1,128 | | | | 142,139 | * |
Sterling Infrastructure Inc. | | | 3,701 | | | | 140,194 | * |
Total Construction & Engineering | | | | | | | 451,647 | |
Electrical Equipment — 1.9% | | | | | | | | |
Atkore Inc. | | | 1,436 | | | | 201,729 | * |
Encore Wire Corp. | | | 946 | | | | 175,322 | |
GrafTech International Ltd. | | | 20,172 | | | | 98,036 | |
Total Electrical Equipment | | | | | | | 475,087 | |
Ground Transportation — 1.3% | | | | | | | | |
ArcBest Corp. | | | 1,593 | | | | 147,225 | |
Covenant Logistics Group Inc. | | | 2,723 | | | | 96,449 | |
PAM Transportation Services Inc. | | | 2,389 | | | | 68,397 | * |
Total Ground Transportation | | | | | | | 312,071 | |
Machinery — 2.7% | | | | | | | | |
Allison Transmission Holdings Inc. | | | 3,855 | | | | 174,400 | |
Hillenbrand Inc. | | | 3,338 | | | | 158,655 | |
Kadant Inc. | | | 529 | | | | 110,307 | |
Mueller Industries Inc. | | | 2,091 | | | | 153,647 | |
Omega Flex Inc. | | | 714 | | | | 79,568 | |
Total Machinery | | | | | | | 676,577 | |
Marine Transportation — 1.3% | | | | | | | | |
Eagle Bulk Shipping Inc. | | | 2,044 | | | | 93,002 | |
Genco Shipping & Trading Ltd. | | | 7,330 | | | | 114,788 | |
Matson Inc. | | | 1,984 | | | | 118,385 | |
Total Marine Transportation | | | | | | | 326,175 | |
Professional Services — 2.0% | | | | | | | | |
CRA International Inc. | | | 901 | | | | 97,146 | |
Forrester Research Inc. | | | 1,859 | | | | 60,139 | * |
Heidrick & Struggles International Inc. | | | 3,278 | | | | 99,520 | |
See Notes to Financial Statements.
| | | | | | |
| Royce Quant Small-Cap Quality Value ETF 2023 Annual Report | | | | | 19 | |
Schedule of investments (cont’d)
March 31, 2023
Royce Quant Small-Cap Quality Value ETF
(Percentages shown based on Fund net assets)
| | | | | | | | |
| Security | | Shares | | | Value | |
Professional Services — continued | | | | | | | | |
Kforce Inc. | | | 1,647 | | | $ | 104,156 | |
Korn Ferry | | | 2,378 | | | | 123,038 | |
Total Professional Services | | | | | | | 483,999 | |
Trading Companies & Distributors — 1.4% | | | | | | | | |
BlueLinx Holdings Inc. | | | 1,694 | | | | 115,124 | * |
Boise Cascade Co. | | | 2,809 | | | | 177,669 | |
Hudson Technologies Inc. | | | 7,378 | | | | 64,410 | * |
Total Trading Companies & Distributors | | | | | | | 357,203 | |
Total Industrials | | | | | | | 3,752,254 | |
| Information Technology — 12.3% | | | | | | | | |
Communications Equipment — 0.4% | | | | | | | | |
NetScout Systems Inc. | | | 3,337 | | | | 95,605 | * |
Electronic Equipment, Instruments & Components — 2.8% | | | | | | | | |
Belden Inc. | | | 1,690 | | | | 146,641 | |
Methode Electronics Inc. | | | 2,643 | | | | 115,975 | |
Sanmina Corp. | | | 2,948 | | | | 179,798 | * |
TTM Technologies Inc. | | | 7,324 | | | | 98,801 | * |
Vishay Intertechnology Inc. | | | 6,993 | | | | 158,182 | |
Total Electronic Equipment, Instruments & Components | | | | | | | 699,397 | |
IT Services — 0.3% | | | | | | | | |
Hackett Group Inc. | | | 3,912 | | | | 72,294 | |
Semiconductors & Semiconductor Equipment — 4.9% | | | | | | | | |
Alpha & Omega Semiconductor Ltd. | | | 2,516 | | | | 67,806 | * |
Axcelis Technologies Inc. | | | 1,296 | | | | 172,692 | * |
Cohu Inc. | | | 3,312 | | | | 127,148 | * |
Kulicke & Soffa Industries Inc. | | | 2,792 | | | | 147,110 | |
MaxLinear Inc. | | | 2,548 | | | | 89,715 | * |
NVE Corp. | | | 1,464 | | | | 121,497 | |
Photronics Inc. | | | 5,628 | | | | 93,312 | * |
Power Integrations Inc. | | | 1,564 | | | | 132,377 | |
Semtech Corp. | | | 2,779 | | | | 67,085 | * |
SiTime Corp. | | | 791 | | | | 112,504 | * |
SMART Global Holdings Inc. | | | 5,044 | | | | 86,959 | * |
Total Semiconductors & Semiconductor Equipment | | | | | | | 1,218,205 | |
Software — 3.3% | | | | | | | | |
Adeia Inc. | | | 7,855 | | | | 69,595 | |
American Software Inc., Class A Shares | | | 4,532 | | | | 57,148 | |
CommVault Systems Inc. | | | 1,557 | | | | 88,344 | * |
Consensus Cloud Solutions Inc. | | | 2,982 | | | | 101,656 | * |
CoreCard Corp. | | | 1,598 | | | | 48,148 | * |
See Notes to Financial Statements.
| | | | |
| 20 | | | | Royce Quant Small-Cap Quality Value ETF 2023 Annual Report |
Royce Quant Small-Cap Quality Value ETF
(Percentages shown based on Fund net assets)
| | | | | | | | |
| Security | | Shares | | | Value | |
Software — continued | | | | | | | | |
InterDigital Inc. | | | 2,264 | | | $ | 165,046 | |
Progress Software Corp. | | | 2,206 | | | | 126,735 | |
Rimini Street Inc. | | | 12,097 | | | | 49,840 | * |
Teradata Corp. | | | 3,158 | | | | 127,204 | * |
Total Software | | | | | | | 833,716 | |
Technology Hardware, Storage & Peripherals — 0.6% | | | | | | | | |
Avid Technology Inc. | | | 2,261 | | | | 72,307 | * |
Immersion Corp. | | | 7,986 | | | | 71,395 | |
Total Technology Hardware, Storage & Peripherals | | | | | | | 143,702 | |
Total Information Technology | | | | | | | 3,062,919 | |
| Materials — 4.6% | | | | | | | | |
Chemicals — 2.2% | | | | | | | | |
AdvanSix Inc. | | | 2,760 | | | | 105,625 | |
American Vanguard Corp. | | | 3,740 | | | | 81,831 | |
Chase Corp. | | | 919 | | | | 96,247 | |
Intrepid Potash Inc. | | | 1,793 | | | | 49,487 | * |
Tronox Holdings PLC | | | 9,823 | | | | 141,255 | |
Valhi Inc. | | | 3,756 | | | | 65,392 | |
Total Chemicals | | | | | | | 539,837 | |
Metals & Mining — 1.5% | | | | | | | | |
Alpha Metallurgical Resources Inc. | | | 834 | | | | 130,104 | |
TimkenSteel Corp. | | | 5,804 | | | | 106,445 | * |
Warrior Met Coal Inc. | | | 3,713 | | | | 136,304 | |
Total Metals & Mining | | | | | | | 372,853 | |
Paper & Forest Products — 0.9% | | | | | | | | |
Clearwater Paper Corp. | | | 2,370 | | | | 79,206 | * |
Sylvamo Corp. | | | 3,186 | | | | 147,384 | |
Total Paper & Forest Products | | | | | | | 226,590 | |
Total Materials | | | | | | | 1,139,280 | |
| Real Estate — 1.4% | | | | | | | | |
Real Estate Management & Development — 1.4% | | | | | | | | |
Douglas Elliman Inc. | | | 19,990 | | | | 62,169 | |
Forestar Group Inc. | | | 7,580 | | | | 117,945 | * |
Marcus & Millichap Inc. | | | 2,632 | | | | 84,513 | |
Newmark Group Inc., Class A Shares | | | 11,452 | | | | 81,080 | |
Total Real Estate | | | | | | | 345,707 | |
See Notes to Financial Statements.
| | | | | | |
| Royce Quant Small-Cap Quality Value ETF 2023 Annual Report | | | | | 21 | |
Schedule of investments (cont’d)
March 31, 2023
Royce Quant Small-Cap Quality Value ETF
(Percentages shown based on Fund net assets)
| | | | | | | | | | | | |
| Security | | | | | Shares | | | Value | |
| Utilities — 0.9% | | | | | | | | | | | | |
Electric Utilities — 0.9% | | | | | | | | | | | | |
Genie Energy Ltd., Class B Shares | | | | | | | 7,411 | | | $ | 102,420 | |
Otter Tail Corp. | | | | | | | 1,593 | | | | 115,126 | |
Total Utilities | | | | | | | | | | | 217,546 | |
Total Investments before Short-Term Investments (Cost — $24,887,907) | | | | | | | | 24,772,838 | |
| | | |
| | | Rate | | | | | | | |
| Short-Term Investments — 0.3% | | | | | | | | | | | | |
Dreyfus Treasury Cash Management, Institutional Class (Cost — $79,274) | | | 4.694 | % | | | 79,274 | | | | 79,274 | (e) |
Total Investments — 100.0% (Cost — $24,967,181) | | | | | | | | | | | 24,852,112 | |
Liabilities in Excess of Other Assets — (0.0)%†† | | | | | | | | | | | (3,192 | ) |
Total Net Assets — 100.0% | | | | | | | | | | $ | 24,848,920 | |
| †† | Represents less than 0.1%. |
| * | Non-income producing security. |
| (a) | Security is valued in good faith in accordance with procedures approved by the Board of Trustees (Note 1). |
| (b) | Security is valued using significant unobservable inputs (Note 1). |
| (c) | Value is less than $1. |
| (d) | Restricted security (Note 6). |
| (e) | Rate shown is one-day yield as of the end of the reporting period. |
See Notes to Financial Statements.
| | | | |
| 22 | | | | Royce Quant Small-Cap Quality Value ETF 2023 Annual Report |
Statement of assets and liabilities
March 31, 2023
| | | | |
| |
| Assets: | | | | |
Investments, at value (Cost — $24,967,181) | | $ | 24,852,112 | |
Dividends and interest receivable | | | 11,004 | |
Total Assets | | | 24,863,116 | |
| |
| Liabilities: | | | | |
Investment management fee payable | | | 14,196 | |
Total Liabilities | | | 14,196 | |
| Total Net Assets | | $ | 24,848,920 | |
| |
| Net Assets: | | | | |
Par value (Note 5) | | $ | 7 | |
Paid-in capital in excess of par value | | | 31,271,613 | |
Total distributable earnings (loss) | | | (6,422,700) | |
| Total Net Assets | | $ | 24,848,920 | |
| |
| Shares Outstanding | | | 700,000 | |
| |
| Net Asset Value | | | $35.50 | |
See Notes to Financial Statements.
| | | | | | |
| Royce Quant Small-Cap Quality Value ETF 2023 Annual Report | | | | | 23 | |
Statement of operations
For the Year Ended March 31, 2023
| | | | |
| |
| Investment Income: | | | | |
Dividends | | $ | 425,197 | |
Interest | | | 1,750 | |
Total Investment Income | | | 426,947 | |
| |
| Expenses: | | | | |
Investment management fee (Note 2) | | | 132,687 | |
Miscellaneous expenses | | | 6 | |
Total Expenses | | | 132,693 | |
| Net Investment Income | | | 294,254 | |
| |
| Realized and Unrealized Loss on Investments (Notes 1 and 3): | | | | |
Net Realized Loss From Investment Transactions | | | (887,964) | |
Change in Net Unrealized Appreciation (Depreciation) From Investments | | | (918,740) | |
| Net Loss on Investments | | | (1,806,704) | |
| Decrease in Net Assets From Operations | | $ | (1,512,450) | |
See Notes to Financial Statements.
| | | | |
| 24 | | | | Royce Quant Small-Cap Quality Value ETF 2023 Annual Report |
Statements of changes in net assets
| | | | | | | | | | | | |
For the Year Ended March 31, 2023, the Period Ended
March 31, 2022 and the Year Ended July 31, 2021 | | 2023 | | | 2022† | | | 2021 | |
| | | |
| Operations: | | | | | | | | | | | | |
Net investment income | | $ | 294,254 | | | $ | 173,880 | | | $ | 158,928 | |
Net realized gain (loss) | | | (887,964) | | | | 1,242,720 | | | | 4,272,828 | |
Change in net unrealized appreciation (depreciation) | | | (918,740) | | | | (951,866) | | | | 2,429,356 | |
Increase (Decrease) in Net Assets From Operations | | | (1,512,450) | | | | 464,734 | | | | 6,861,112 | |
| | | |
| Distributions to Shareholders From (Note 1): | | | | | | | | | | | | |
Total distributable earnings | | | (300,658) | | | | (189,000) | | | | (142,575) | |
Return of capital | | | (11,796) | | | | — | | | | — | |
Decrease in Net Assets From Distributions to Shareholders | | | (312,454) | | | | (189,000) | | | | (142,575) | |
| | | |
| Fund Share Transactions (Note 5): | | | | | | | | | | | | |
Net proceeds from sale of shares (450,000, 200,000 and 350,000 shares issued, respectively) | | | 16,112,292 | | | | 7,717,633 | | | | 10,982,654 | |
Cost of shares repurchased (250,000, 150,000 and 400,000 shares repurchased, respectively) | | | (8,758,342) | | | | (5,704,571) | | | | (12,071,990) | |
Increase (Decrease) in Net Assets From Fund Share Transactions | | | 7,353,950 | | | | 2,013,062 | | | | (1,089,336) | |
Increase in Net Assets | | | 5,529,046 | | | | 2,288,796 | | | | 5,629,201 | |
| | | |
| Net Assets: | | | | | | | | | | | | |
Beginning of period | | | 19,319,874 | | | | 17,031,078 | | | | 11,401,877 | |
End of period | | $ | 24,848,920 | | | $ | 19,319,874 | | | $ | 17,031,078 | |
| † | For the period August 1, 2021 through March 31, 2022. |
See Notes to Financial Statements.
| | | | | | |
| Royce Quant Small-Cap Quality Value ETF 2023 Annual Report | | | | | 25 | |
Financial highlights
| | | | | | | | | | | | | | | | | | | | | | | | |
For a share of beneficial interest outstanding throughout each year ended March 31,
unless otherwise noted: | |
| | | 20231 | | | 20221,2 | | | 20211,3 | | | 20201,3 | | | 20191,3 | | | 20181,3 | |
| | | | | | |
| Net asset value, beginning of period | | | $38.64 | | | | $37.85 | | | | $22.80 | | | | $26.21 | | | | $30.06 | | | | $24.95 | |
| | | | | | |
| Income (loss) from operations: | | | | | | | | | | | | | | | | | | | | | | | | |
Net investment income | | | 0.47 | | | | 0.36 | | | | 0.35 | | | | 0.35 | | | | 0.35 | | | | 0.31 | |
Net realized and unrealized gain (loss) | | | (3.15) | | | | 0.82 | | | | 15.03 | | | | (3.42) | | | | (3.77) | | | | 4.91 | |
Total income (loss) from operations | | | (2.68) | | | | 1.18 | | | | 15.38 | | | | (3.07) | | | | (3.42) | | | | 5.22 | |
| | | | | | |
| Less distributions from: | | | | | | | | | | | | | | | | | | | | | | | | |
Net investment income | | | (0.44) | | | | (0.39) | | | | (0.33) | | | | (0.34) | | | | (0.43) | | | | (0.11) | |
Return of capital | | | (0.02) | | | | — | | | | — | | | | — | | | | — | | | | — | |
Total distributions | | | (0.46) | | | | (0.39) | | | | (0.33) | | | | (0.34) | | | | (0.43) | | | | (0.11) | |
| | | | | | |
| Net asset value, end of period | | | $35.50 | | | | $38.64 | | | | $37.85 | | | | $22.80 | | | | $26.21 | | | | $30.06 | |
Total return, based on NAV4 | | | (6.88) | % | | | 3.15 | % | | | 67.77 | % | | | (11.71) | % | | | (11.29) | % | | | 20.97 | % |
| | | | | | |
| Net assets, end of period (000s) | | | $24,849 | | | | $19,320 | | | | $17,031 | | | | $11,402 | | | | $10,483 | | | | $4,509 | |
| | | | | | |
| Ratios to average net assets: | | | | | | | | | | | | | | | | | | | | | | | | |
Gross expenses | | | 0.60 | % | | | 0.60 | %5 | | | 0.60 | % | | | 0.60 | % | | | 0.60 | % | | | 0.60 | % |
Net expenses | | | 0.60 | | | | 0.60 | 5 | | | 0.60 | | | | 0.60 | | | | 0.60 | | | | 0.60 | |
Net investment income | | | 1.33 | | | | 1.39 | 5 | | | 1.13 | | | | 1.46 | | | | 1.30 | | | | 1.12 | |
| | | | | | |
| Portfolio turnover rate6 | | | 51 | % | | | 73 | % | | | 99 | % | | | 95 | % | | | 87 | % | | | 80 | % |
| 1 | Per share amounts have been calculated using the average shares method. |
| 2 | For the period August 1, 2021 through March 31, 2022. |
| 3 | For the year ended July 31. |
| 4 | Performance figures may reflect fee waivers and/or expense reimbursements. In the absence of fee waivers and/or expense reimbursements, the total return would have been lower. The total return calculation assumes that distributions are reinvested at NAV. Past performance is no guarantee of future results. Total returns for periods of less than one year are not annualized. |
| 6 | Portfolio turnover excludes the value of portfolio securities received or delivered as a result of in-kind fund share transactions. |
See Notes to Financial Statements.
| | | | |
| 26 | | | | Royce Quant Small-Cap Quality Value ETF 2023 Annual Report |
Notes to financial statements
1. Organization and significant accounting policies
Royce Quant Small-Cap Quality Value ETF (the “Fund”) is a separate diversified investment series of Legg Mason ETF Investment Trust (the “Trust”). The Trust, a Maryland statutory trust, is registered under the Investment Company Act of 1940, as amended (the “1940 Act”), as an open-end management investment company.
The Fund is an actively managed exchange-traded fund (“ETF”). ETFs are funds that trade like other publicly-traded securities. Unlike shares of a mutual fund, which can be bought from and redeemed by the issuing fund by all shareholders at a price based on net asset value (“NAV”), shares of the Fund may be directly purchased from and redeemed by the Fund at NAV solely by certain large institutional investors who have entered into agreements with the Fund’s distributor (“Authorized Participants”). Also unlike shares of a mutual fund, shares of the Fund are listed on a national securities exchange and trade in the secondary market at market prices that change throughout the day.
Shares of the Fund are listed and traded at market prices on NASDAQ. The market price for the Fund’s shares may be different from the Fund’s NAV. The Fund issues and redeems shares at NAV only in blocks of a specified number of shares or multiples thereof (“Creation Units”). Only Authorized Participants may purchase or redeem Creation Units directly with the Fund at NAV. Creation Units are created and redeemed principally in-kind (although under some circumstances its shares are created and redeemed partially for cash). Except when aggregated in Creation Units, shares of the Fund are not redeemable securities. Shareholders who are not Authorized Participants may not redeem shares directly from the Funds at NAV.
The Fund seeks to achieve long-term growth of capital.
The Fund follows the accounting and reporting guidance in Financial Accounting Standards Board (“FASB”) Accounting Standards Codification Topic 946, Financial Services – Investment Companies (“ASC 946”). The following are significant accounting policies consistently followed by the Fund and are in conformity with U.S. generally accepted accounting principles (“GAAP”), including, but not limited to, ASC 946. Estimates and assumptions are required to be made regarding assets, liabilities and changes in net assets resulting from operations when financial statements are prepared. Changes in the economic environment, financial markets and any other parameters used in determining these estimates could cause actual results to differ. Subsequent events have been evaluated through the date the financial statements were issued.
(a) Investment valuation. Equity securities for which market quotations are available are valued at the last reported sales price or official closing price on the primary market or exchange on which they trade. The valuations for fixed income securities (which may include, but are not limited to, corporate, government, municipal, mortgage-backed, collateralized mortgage obligations and asset-backed securities) and certain derivative instruments are typically the prices supplied by independent third party pricing services, which may use market prices or broker/dealer quotations or a variety of valuation techniques and methodologies. The independent third party pricing services typically use
| | | | | | |
| Royce Quant Small-Cap Quality Value ETF 2023 Annual Report | | | | | 27 | |
Notes to financial statements (cont’d)
inputs that are observable such as issuer details, interest rates, yield curves, prepayment speeds, credit risks/spreads, default rates and quoted prices for similar securities. Investments in open-end funds are valued at the closing net asset value per share of each fund on the day of valuation. When the Fund holds securities or other assets that are denominated in a foreign currency, the Fund will use the currency exchange rates, generally determined as of 4:00 p.m. (London Time). If independent third party pricing services are unable to supply prices for a portfolio investment, or if the prices supplied are deemed by the manager to be unreliable, the market price may be determined by the manager using quotations from one or more broker/dealers or at the transaction price if the security has recently been purchased and no value has yet been obtained from a pricing service or pricing broker. When reliable prices are not readily available, such as when the value of a security has been significantly affected by events after the close of the exchange or market on which the security is principally traded, but before the Fund calculates its net asset value, the Fund values these securities as determined in accordance with procedures approved by the Fund’s Board of Trustees.
Pursuant to policies adopted by the Board of Trustees, the Fund’s manager has been designated as the valuation designee and is responsible for the oversight of the daily valuation process. The Fund’s manager is assisted by the Global Fund Valuation Committee (the “Valuation Committee”). The Valuation Committee is responsible for making fair value determinations, evaluating the effectiveness of the Fund’s pricing policies, and reporting to the Fund’s manager and the Board of Trustees. When determining the reliability of third party pricing information for investments owned by the Fund, the Valuation Committee, among other things, conducts due diligence reviews of pricing vendors, monitors the daily change in prices and reviews transactions among market participants.
The Valuation Committee will consider pricing methodologies it deems relevant and appropriate when making fair value determinations. Examples of possible methodologies include, but are not limited to, multiple of earnings; discount from market of a similar freely traded security; discounted cash-flow analysis; book value or a multiple thereof; risk premium/yield analysis; yield to maturity; and/or fundamental investment analysis. The Valuation Committee will also consider factors it deems relevant and appropriate in light of the facts and circumstances. Examples of possible factors include, but are not limited to, the type of security; the issuer’s financial statements; the purchase price of the security; the discount from market value of unrestricted securities of the same class at the time of purchase; analysts’ research and observations from financial institutions; information regarding any transactions or offers with respect to the security; the existence of merger proposals or tender offers affecting the security; the price and extent of public trading in similar securities of the issuer or comparable companies; and the existence of a shelf registration for restricted securities.
For each portfolio security that has been fair valued pursuant to the policies adopted by the Board of Trustees, the fair value price is compared against the last available and next
| | | | |
| 28 | | | | Royce Quant Small-Cap Quality Value ETF 2023 Annual Report |
available market quotations. The Valuation Committee reviews the results of such back testing monthly and fair valuation occurrences are reported to the Board of Trustees quarterly.
The Fund uses valuation techniques to measure fair value that are consistent with the market approach and/or income approach, depending on the type of security and the particular circumstance. The market approach uses prices and other relevant information generated by market transactions involving identical or comparable securities. The income approach uses valuation techniques to discount estimated future cash flows to present value.
GAAP establishes a disclosure hierarchy that categorizes the inputs to valuation techniques used to value assets and liabilities at measurement date. These inputs are summarized in the three broad levels listed below:
| • | | Level 1 — unadjusted quoted prices in active markets for identical investments |
| • | | Level 2 — other significant observable inputs (including quoted prices for similar investments, interest rates, prepayment speeds, credit risk, etc.) |
| • | | Level 3 — significant unobservable inputs (including the Fund’s own assumptions in determining the fair value of investments) |
The inputs or methodologies used to value securities are not necessarily an indication of the risk associated with investing in those securities.
The following is a summary of the inputs used in valuing the Fund’s assets carried at fair value:
| | | | | | | | | | | | | | | | |
ASSETS | |
| Description | | Quoted Prices
(Level 1) | | | Other Significant
Observable Inputs
(Level 2) | | | Significant
Unobservable
Inputs
(Level 3) | | | Total | |
| Long-Term Investments†: | | | | | | | | | | | | | | | | |
Common Stocks: | | | | | | | | | | | | | | | | |
Health Care | | $ | 3,554,718 | | | | — | | | $ | 0 | * | | $ | 3,554,718 | |
Other Common Stocks | | | 21,218,120 | | | | — | | | | — | | | | 21,218,120 | |
| Total Long-Term Investments | | | 24,772,838 | | | | — | | | | 0 | * | | | 24,772,838 | |
| Short-Term Investments† | | | 79,274 | | | | — | | | | — | | | | 79,274 | |
| Total Investments | | $ | 24,852,112 | | | | — | | | $ | 0 | * | | $ | 24,852,112 | |
| † | See Schedule of Investments for additional detailed categorizations. |
| * | Amount represents less than $1. |
(b) Foreign investment risks. The Fund’s investments in foreign securities may involve risks not present in domestic investments. Since securities may be denominated in foreign currencies, may require settlement in foreign currencies or may pay interest or dividends in foreign currencies, changes in the relationship of these foreign currencies to the U.S. dollar can significantly affect the value of the investments and earnings of the Fund. Foreign investments may also subject the Fund to foreign government exchange restrictions,
| | | | | | |
| Royce Quant Small-Cap Quality Value ETF 2023 Annual Report | | | | | 29 | |
Notes to financial statements (cont’d)
expropriation, taxation or other political, social or economic developments, all of which affect the market and/or credit risk of the investments.
(c) Security transactions and investment income. Security transactions are accounted for on a trade date basis. Interest income (including interest income from payment-in-kind securities), adjusted for amortization of premium and accretion of discount, is recorded on the accrual basis. Dividend income is recorded on the ex-dividend date for dividends received in cash and/or securities. Foreign dividend income is recorded on the ex-dividend date or as soon as practicable after the Fund determines the existence of a dividend declaration after exercising reasonable due diligence. The cost of investments sold is determined by use of the specific identification method. To the extent any issuer defaults or a credit event occurs that impacts the issuer, the Fund may halt any additional interest income accruals and consider the realizability of interest accrued up to the date of default or credit event.
(d) Distributions to shareholders. Distributions from net investment income of the Fund, if any, are declared and paid on a quarterly basis. Distributions of net realized gains, if any, are declared at least annually. Distributions to shareholders of the Fund are recorded on the ex-dividend date and are determined in accordance with income tax regulations, which may differ from GAAP.
(e) Federal and other taxes. It is the Fund’s policy to comply with the federal income and excise tax requirements of the Internal Revenue Code of 1986 (the “Code”), as amended, applicable to regulated investment companies. Accordingly, the Fund intends to distribute its taxable income and net realized gains, if any, to shareholders in accordance with timing requirements imposed by the Code. Therefore, no federal or state income tax provision is required in the Fund’s financial statements.
Management has analyzed the Fund’s tax positions taken on income tax returns for all open tax years and has concluded that as of March 31, 2023, no provision for income tax is required in the Fund’s financial statements. The Fund’s federal and state income and federal excise tax returns for tax years for which the applicable statutes of limitations have not expired are subject to examination by the Internal Revenue Service and state departments of revenue.
(f) Reclassification. GAAP requires that certain components of net assets be reclassified to reflect permanent differences between financial and tax reporting. These reclassifications have no effect on net assets or net asset value per share. During the current year, the following reclassifications have been made:
| | | | | | | | |
| | | Total Distributable
Earnings (Loss) | | | Paid-in
Capital | |
| (a) | | $ | (1,367,212) | | | $ | 1,367,212 | |
| (a) | Reclassifications are due to book/tax differences in the treatment of an in-kind distribution of securities. |
| | | | |
| 30 | | | | Royce Quant Small-Cap Quality Value ETF 2023 Annual Report |
2. Investment management agreement and other transactions with affiliates
Legg Mason Partners Fund Advisor, LLC (“LMPFA”) is the Fund’s investment manager and Royce & Associates, LP (“Royce”) is the Fund’s subadviser. Western Asset Management Company, LLC (“Western Asset”) manages the portion of the Fund’s cash and short-term instruments allocated to it. LMPFA, Western Asset, and Royce are subsidiaries of Franklin Resources, Inc. (“Franklin Resources”).
LMPFA provides administrative and certain oversight services to the Fund. LMPFA delegates to the subadviser the day-to-day portfolio management of the Fund. The Fund is responsible for paying interest expenses, taxes, brokerage expenses, future 12b-1 fees (if any), acquired fund fees and expenses, extraordinary expenses and the management fee payable to LMPFA under the investment management agreement.
Under the investment management agreement and subject to the general supervision of the Fund’s Board of Trustees, LMPFA provides or causes to be furnished all investment management, supervisory, administrative and other services reasonably necessary for the operation of the Fund, including certain distribution services (provided pursuant to a separate distribution agreement) and investment advisory services (provided pursuant to separate subadvisory agreements) under a unitary fee structure. The Fund pays an investment management fee, calculated daily and paid monthly, at an annual rate of 0.60% of the Fund’s average daily net assets.
As compensation for its subadvisory services, LMPFA pays Royce monthly 90% of the management fee paid by Fund to LMPFA, net of (i) all fees and expenses incurred by LMPFA under the investment management agreement (including without limitation any subadvisory fee paid to another subadviser to the Fund) and (ii) expense waivers, if any, and reimbursements. LMPFA pays Western Asset monthly a fee of 0.02% of the portion of the Fund’s average daily net assets allocated to Western Asset for the management of cash and other short-term instruments, net of expense waivers, if any, and reimbursements.
Franklin Distributors, LLC (“Franklin Distributors”) serves as the distributor of Creation Units for the Fund on an agency basis. Franklin Distributors is an indirect, wholly-owned broker-dealer subsidiary of Franklin Resources.
The Fund’s Board of Trustees has adopted a Rule 12b-1 shareholder services and distribution plan and under that plan, the Fund is authorized to pay service and/or distribution fees calculated at an annual rate of up to 0.25% of its average daily net assets. No service and/or distribution fees are currently paid by the Fund, and there are no current plans to impose these fees.
All officers and one Trustee of the Trust are employees of Franklin Resources or its affiliates and do not receive compensation from the Trust.
| | | | | | |
| Royce Quant Small-Cap Quality Value ETF 2023 Annual Report | | | | | 31 | |
Notes to financial statements (cont’d)
3. Investments
During the year ended March 31, 2023, the aggregate cost of purchases and proceeds from sales of investments (excluding in-kind transactions and short-term investments) were as follows:
| | | | |
| Purchases | | $ | 11,372,054 | |
| Sales | | | 11,069,272 | |
During the year ended March 31, 2023, in-kind transactions (Note (Note 5)) were as follows:
| | | | |
| Contributions | | $ | 15,977,123 | |
| Redemptions | | | 8,675,341 | |
| Realized gain (loss)* | | | 1,471,490 | |
| * | Net realized gains on redemptions in-kind are not taxable to the remaining shareholders of the Fund. |
The in-kind contributions and in-kind redemptions shown in this table may not agree with the Fund Share Transactions on the Statement of Changes in Net Assets. This table represents the accumulation of the Fund’s daily net shareholder transactions while the Statement of Changes in Net Assets reflects gross shareholder transactions including any cash component of the transactions.
At March 31, 2023, the aggregate cost of investments and the aggregate gross unrealized appreciation and depreciation of investments for federal income tax purposes were as follows:
| | | | | | | | | | | | | | | | |
| | | Cost | | | Gross
Unrealized
Appreciation | | | Gross
Unrealized
Depreciation | | | Net
Unrealized
Depreciation | |
| Securities | | $ | 25,489,475 | | | $ | 1,824,771 | | | $ | (2,462,134) | | | $ | (637,363) | |
4. Derivative instruments and hedging activities
During the year ended March 31, 2023, the Fund did not invest in derivative instruments.
| | | | |
| 32 | | | | Royce Quant Small-Cap Quality Value ETF 2023 Annual Report |
5. Fund share transactions
At March 31, 2023, the Trust had an unlimited number of shares of beneficial interest authorized with a par value of $0.00001 per share. Fund shares are issued and redeemed by the Fund only in Creation Units or Creation Unit aggregations, where 50,000 shares of the Fund constitute a Creation Unit. Such transactions are generally on an in-kind basis, with a separate cash payment, which is a balancing cash component to equate the transaction to the net asset value per share of the Fund on the transaction date. Transactions in capital shares of the Fund are disclosed in detail in the Statement of Changes in Net Assets. Authorized Participants are subject to standard creation and redemption transaction fees to offset transfer and other transaction costs associated with the issuance and redemption of Creation Units. Such transactions fees are treated as increases in capital and are disclosed in the Funds’ Statements of Changes in Net Assets. Creations and redemptions for cash (when cash creations and redemptions are available or specified) may be subject to an additional variable fee.
6. Restricted securities
The following Fund investments are restricted as to resale and, in the absence of readily ascertainable market values, are valued in good faith in accordance with procedures approved by the Board of Trustees.
| | | | | | | | | | | | | | | | | | | | | | | | |
| Security | | Number of
Shares | | | Acquisition
Date | | | Cost | | | Fair Value
at 3/31/2023 | | | Value Per
Share | | | Percent of
Net Assets | |
| OmniAb Inc., $12.50 EARNOUT, Common Shares | | | 298 | | | | 11/22 | | | $ | 0 | (a) | | $ | 0 | (a) | | $ | 0.00 | (b) | | | 0.00 | (c)% |
| OmniAb Inc., $15.00 EARNOUT, Common Shares | | | 298 | | | | 11/22 | | | | 0 | (a) | | | 0 | (a) | | | 0.00 | (b) | | | 0.00 | (c) |
| | | | | | | | | | | $ | 0 | (a) | | $ | 0 | (a) | | | | | | | 0.00 | (c)% |
| (a) | Amount represents less than $1. |
| (b) | Amount represents less than $0.005 per share. |
| (c) | Amount represents less than 0.005%. |
7. Income tax information and distributions to shareholders
The tax character of distributions paid during the fiscal year ended March 31 and fiscal period ended March 31, 2022 and fiscal year ended July 31, 2021, was as follows:
| | | | | | | | | | | | |
| | | 2023 | | | 2022 | | | 2021 | |
| Distributions paid from: | | | | | | | | | | | | |
| Ordinary income | | $ | 300,658 | | | $ | 189,000 | | | $ | 142,575 | |
| Tax return of capital | | | 11,796 | | | | — | | | | — | |
| Total distributions paid | | $ | 312,454 | | | $ | 189,000 | | | $ | 142,575 | |
| | | | | | |
| Royce Quant Small-Cap Quality Value ETF 2023 Annual Report | | | | | 33 | |
Notes to financial statements (cont’d)
As of March 31, 2023, the components of distributable earnings (loss) on a tax basis were as follows:
| | | | |
| Deferred capital losses* | | $ | (5,785,337) | |
| Unrealized appreciation (depreciation)(a) | | | (637,363) | |
| Total distributable earnings (loss) — net | | $ | (6,422,700) | |
| * | These capital losses have been deferred in the current year as either short-term or long-term losses. The losses will be deemed to occur on the first day of the next taxable year in the same character as they were originally deferred and will be available to offset future taxable capital gains. |
| (a) | The difference between book-basis and tax-basis unrealized appreciation (depreciation) is attributable to the tax deferral of losses on wash sales and other book/tax basis adjustments. |
8. Recent accounting pronouncement
In June 2022, the Financial Accounting Standards Board (FASB) issued Accounting Standards Update (ASU) No. 2022-03, Fair Value Measurement (Topic 820) – Fair Value Measurement of Equity Securities Subject to Contractual Sale Restrictions. The amendments in the ASU clarify that a contractual restriction on the sale of an equity security is not considered part of the unit of account of the equity security and, therefore, should not be considered in measuring fair value. The ASU is effective for interim and annual reporting periods beginning after December 15, 2023, with the option of early adoption. Management has reviewed the requirements and believes that the adoption of the ASU will not have a material impact on the financial statements.
| | | | |
| 34 | | | | Royce Quant Small-Cap Quality Value ETF 2023 Annual Report |
Report of independent registered public accounting firm
To the Board of Trustees of Legg Mason ETF Investment Trust and Shareholders of Royce Quant Small-Cap Quality Value ETF
Opinion on the Financial Statements
We have audited the accompanying statement of assets and liabilities, including the schedule of investments, of Royce Quant Small-Cap Quality Value ETF (one of the funds constituting Legg Mason ETF Investment Trust, referred to hereafter as the “Fund”) as of March 31, 2023, the related statement of operations for the year ended March 31, 2023, the statements of changes in net assets for the year ended March 31, 2023, the period August 1, 2021 through March 31, 2022 and the year ended July 31, 2021, including the related notes, and the financial highlights for the year ended March 31, 2023, the period August 1, 2021 through March 31, 2022, and each of the each of the four years in the period ended July 31, 2021 (collectively referred to as the “financial statements”). In our opinion, the financial statements present fairly, in all material respects, the financial position of the Fund as of March 31, 2023, the results of its operations for the year ended March 31, 2023, the changes in its net assets for the year ended March 31, 2023, the period August 1, 2021 through March 31, 2022 and the year ended July 31, 2021, and the financial highlights for the year ended March 31, 2023, the period August 1, 2021 through March 31, 2022, and each of the each of the four years in the period ended July 31, 2021 in conformity with accounting principles generally accepted in the United States of America.
Basis for Opinion
These financial statements are the responsibility of the Fund’s management. Our responsibility is to express an opinion on the Fund’s financial statements based on our audits. We are a public accounting firm registered with the Public Company Accounting Oversight Board (United States) (PCAOB) and are required to be independent with respect to the Fund in accordance with the U.S. federal securities laws and the applicable rules and regulations of the Securities and Exchange Commission and the PCAOB.
We conducted our audits of these financial statements in accordance with the standards of the PCAOB. Those standards require that we plan and perform the audit to obtain reasonable assurance about whether the financial statements are free of material misstatement, whether due to error or fraud.
Our audits included performing procedures to assess the risks of material misstatement of the financial statements, whether due to error or fraud, and performing procedures that respond to those risks. Such procedures included examining, on a test basis, evidence regarding the amounts and disclosures in the financial statements. Our audits also included evaluating the accounting principles used and significant estimates made by management, as well as evaluating the overall presentation of the financial statements. Our procedures included confirmation of securities owned as of March 31, 2023 by correspondence with the custodian. We believe that our audits provide a reasonable basis for our opinion.
PricewaterhouseCoopers LLP
San Francisco, California
May 17, 2023
We have served as the auditor of one or more investment companies in the Franklin Templeton Group of Funds since 1948.
| | | | | | |
| Royce Quant Small-Cap Quality Value ETF 2023 Annual Report | | | | | 35 | |
Additional information (unaudited)
Information about Trustees and Officers
The business and affairs of Royce Quant Small-Cap Quality Value ETF (the “Fund”) are conducted by management under the supervision and subject to the direction of its Board of Trustees. The business address of each Trustee is One Franklin Parkway, San Mateo, California 94403-1906.
Information pertaining to the Trustees and officers of the Fund is set forth below. The Statement of Additional Information includes additional information about Trustees and is available, without charge, upon request by calling the Fund at 1-877-721-1926.
| | |
| Independent Trustees† | | |
| |
| Rohit Bhagat | | |
| |
| Year of birth | | 1964 |
| Position(s) with Trust | | Lead Independent Trustee |
| Term of office1 and length of time served2 | | Since 2021 |
| Principal occupation(s) during the past five years | | Managing Member, Mukt Capital, LLC (private investment firm) (2014-present); Advisor, Optimal Asset Management (investment technology and advisory services company) (2015-present); and formerly, Chairman, Asia Pacific, BlackRock (2009- 2012); Global Chief Operating Officer, Barclays Global Investors (investment management) (2005-2009); and Senior Partner, The Boston Consulting Group (management consulting) (1992-2005) |
| Number of funds in fund complex overseen by Trustee | | 59 |
| Other Directorships held by Trustee during the past five years | | AssetMark Financial Holdings, Inc. (investment solutions) (2018- present) and PhonePe (payment and financial services) (2020-present); and formerly, Axis Bank (financial) (2013-2021), FlipKart Limited (eCommerce company) (2019-2020), CapFloat Financial Services Pvt., Ltd. (non-banking finance company) (2018) and Zentific Investment Management (hedge fund) (2015-2018) |
| |
| Deborah D. McWhinney | | |
| |
| Year of birth | | 1955 |
| Position(s) with Trust | | Trustee |
| Term of office1 and length of time served2 | | Since 2021 |
| Principal occupation(s) during the past five years | | Director of various companies; and formerly, Board Member, Lloyds Banking Group (2015-2018) (financial institution) and Fresenius Medical Group (2016-2018) (healthcare); Chief Executive Officer (2013-2014) and Chief Operating Officer (2011- 2013), CitiGroup Global Enterprise Payments (financial services); and President, Citi’s Personal Banking and Wealth Management (2009-2011) |
| Number of funds in fund complex overseen by Trustee | | 59 |
| Other Directorships held by Trustee during the past five years | | S&P Global, Inc. (financial information services) (2022-present), Borg Warner (automotive) (2018-present), LegalShield (consumer services) (2020-present); and formerly, IHS Markit (information services) (2015-2022), Fluor Corporation (construction and engineering) (2014-2020) and Focus Financial Partner, LLC (financial services) (2018-2020) |
| | | | |
| 36 | | | | Royce Quant Small-Cap Quality Value ETF |
| | |
| Independent Trustees† (cont’d) | | |
| |
| Anantha K. Pradeep | | |
| Year of birth | | 1963 |
| Position(s) with Trust | | Trustee |
| Term of office1 and length of time served2 | | Since 2021 |
| Principal occupation(s) during the past five years | | Chief Executive Officer, Smilable, Inc. (technology company) (2014-present); Chief Executive Officer, MachineVantage (technology company) (2018-present); Founder and Managing Partner, Consult Meridian, LLC (consulting company) (2009-present); and formerly, Founder, BoardVantage (board portal solutions provider delivering paperless process for boards and leadership) (2000-2002) |
| Number of funds in fund complex overseen by Trustee | | 59 |
| Other Directorships held by Trustee during the past five years | | None |
| | |
| Interested Trustee and Officer | | |
| |
| Jennifer M. Johnson3 | | |
| |
| Year of birth | | 1964 |
| Position(s) with Trust | | Trustee and Chairperson of the Board |
| Term of office1 and length of time served2 | | Since 2021 |
| Principal occupation(s) during the past five years | | Chief Executive Officer, President and Director, Franklin Resources, Inc.; officer and/or director or trustee, of some of the other subsidiaries of Franklin Resources, Inc. and of certain funds in the Franklin Templeton/Legg Mason fund complex; and formerly, Chief Operating Officer and Executive Vice President, Franklin Resources, Inc. (1994-2015); Executive Vice President of Operations and Technology, Franklin Resources, Inc. (2005-2010); and Senior Vice President, Franklin Resources, Inc. (2003-2005) |
| Number of funds in fund complex overseen by Trustee | | 70 |
| Other Directorships held by Trustee during the past five years | | None |
| | |
| Additional Officers | | |
| |
| Alison E. Baur | | |
| Franklin Templeton | | |
| One Franklin Parkway, San Mateo, CA 94403-1906 | | |
| |
| Year of birth | | 1964 |
| Position(s) with Trust | | Vice President |
| Term of office1 and length of time served2 | | Since 2021 |
| Principal occupation(s) during the past five years | | Deputy General Counsel, Franklin Templeton; and officer of some of the other subsidiaries of Franklin Resources, Inc. and of certain funds in the Franklin Templeton/Legg Mason fund complex |
| | | | | | |
| Royce Quant Small-Cap Quality Value ETF | | | | | 37 | |
Additional information (unaudited) (cont’d)
Information about Trustees and Officers
| | |
| Additional Officers (cont’d) | | |
| |
| Fred Jensen | | |
| Franklin Templeton | | |
| 280 Park Avenue, 8th Floor, New York, NY 10017 | | |
| |
| Year of birth | | 1963 |
| Position(s) with Trust | | Chief Compliance Officer |
| Term of office1 and length of time served2 | | Since 2021 |
| Principal occupation(s) during the past five years | | Director - Global Compliance of Franklin Templeton; Managing Director of Legg Mason & Co.; Director of Compliance, Legg Mason Office of the Chief Compliance Officer; Chief Compliance Officer, Franklin Advisory Services, LLC; Compliance Officer, Franklin Advisers, Inc.; officer of certain funds in the Franklin Templeton/Legg Mason fund complex; formerly, Chief Compliance Officer of Legg Mason Global Asset Allocation; Chief Compliance Officer, Legg Mason Private Portfolio; Chief Compliance Officer to The Reserves Funds (investment adviser, funds and broker-dealer) and Ambac Financial Group (investment adviser, funds and broker-dealer) |
| |
| Harris Goldblat | | |
| Franklin Templeton | | |
| 100 First Stamford Place, 6th Floor, Stamford, CT 06902 | | |
| |
| Year of birth | | 1969 |
| Position(s) with Trust | | Vice President and Assistant Secretary |
| Term of office1 and length of time served2 | | Since 2021 |
| Principal occupation(s) during the past five years | | Associate General Counsel to Franklin Templeton (since 2020); Assistant Secretary of certain funds associated with Legg Mason & Co. or its affiliates (since 2006); formerly, Managing Director and Associate General Counsel of Legg Mason & Co. (2005 to 2020) |
| |
| Steven J. Gray | | |
| Franklin Templeton | | |
| One Franklin Parkway, San Mateo, CA 94403-1906 | | |
| |
| Year of birth | | 1955 |
| Position(s) with Trust | | Vice President |
| Term of office1 and length of time served2 | | Since 2021 |
| Principal occupation(s) during the past five years | | Senior Associate General Counsel, Franklin Templeton; Assistant Secretary, Franklin Distributors, LLC; and officer of certain funds in the Franklin Templeton/Legg Mason fund complex |
| | | | |
| 38 | | | | Royce Quant Small-Cap Quality Value ETF |
| | |
| Additional Officers (cont’d) | | |
| |
| Matthew T. Hinkle | | |
| Franklin Templeton | | |
| One Franklin Parkway, San Mateo, CA 94403-1906 | | |
| |
| Year of birth | | 1971 |
| Position(s) with Trust | | Chief Executive Officer – Finance and Administration |
| Term of office1 and length of time served2 | | Since 2021 |
| Principal occupation(s) during the past five years | | Senior Vice President, Franklin Templeton Services, LLC; officer of certain funds in the Franklin Templeton/Legg Mason fund complex; and formerly, Vice President, Global Tax (2012- April 2017) and Treasurer/Assistant Treasurer, Franklin Templeton (2009-2017) |
| |
| Susan Kerr | | |
| Franklin Templeton | | |
| 280 Park Avenue, 8th Floor, New York, NY 10017 | | |
| |
| Year of birth | | 1949 |
| Position(s) with Trust | | Vice President – AML Compliance |
| Term of office1 and length of time served2 | | Since 2021 |
| Principal occupation(s) during the past five years | | Senior Compliance Analyst, Franklin Templeton; Chief Anti-Money Laundering Compliance Officer, Legg Mason & Co., or its affiliates; Anti Money Laundering Compliance Officer; Senior Compliance Officer, LMIS; and officer of certain funds in the Franklin Templeton/Legg Mason fund complex |
| |
| Thomas C. Mandia | | |
| Franklin Templeton | | |
| 100 First Stamford Place, 6th Floor, Stamford, CT 06902 | | |
| |
| Year of birth | | 1962 |
| Position(s) with Trust | | Vice President and Assistant Secretary |
| Term of office1 and length of time served2 | | Since 2021 |
| Principal occupation(s) during the past five years | | Senior Associate General Counsel to Franklin Templeton (since 2020); Secretary of LMPFA (since 2006); Assistant Secretary of certain funds associated with Legg Mason & Co. or its affiliates (since 2006); Secretary of LMAS (since 2002) and LMFAM (formerly registered investment advisers) (since 2013); formerly, Managing Director and Deputy General Counsel of Legg Mason & Co. (2005 to 2020) |
| |
| David Mann | | |
| Franklin Templeton | | |
| One Franklin Parkway, San Mateo, CA 94403-1906 | | |
| |
| Year of birth | | 1973 |
| Position(s) with Trust | | Vice President |
| Term of office1 and length of time served2 | | Since March 2023 |
| Principal occupation(s) during the past five years | | Head of Global ETF Product and Capital Markets, Franklin Templeton; and officer of certain funds in the Franklin Templeton/Legg Mason fund complex |
| | | | | | |
| Royce Quant Small-Cap Quality Value ETF | | | | | 39 | |
Additional information (unaudited) (cont’d)
Information about Trustees and Officers
| | |
| Additional Officers (cont’d) | | |
| |
| Todd Mathias | | |
| Franklin Templeton | | |
| One Franklin Parkway, San Mateo, CA 94403-1906 | | |
| |
| Year of birth | | 1983 |
| Position(s) with Trust | | Vice President |
| Term of office1 and length of time served2 | | Since March 2023 |
| Principal occupation(s) during the past five years | | Head of US ETF Product Strategy, Franklin Templeton; and officer of certain funds in the Franklin Templeton/Legg Mason fund complex |
| |
| Patrick O’Connor | | |
| Franklin Templeton | | |
| One Franklin Parkway, San Mateo, CA 94403-1906 | | |
| |
| Year of birth | | 1967 |
| Position(s) with Trust | | President and Chief Executive Officer – Investment Management |
| Term of office1 and length of time served2 | | Since 2021 |
| Principal occupation(s) during the past five years | | President and Chief Investment Officer, Franklin Advisory Services, LLC; Senior Vice President, Franklin Advisers, Inc.; and officer of certain funds in the Franklin Templeton/Legg Mason fund complex |
| |
| Vivek Pai | | |
| Franklin Templeton | | |
| 300 S.E. 2nd Street, Fort Lauderdale, FL 33301-1923 | | |
| |
| Year of birth | | 1970 |
| Position(s) with Trust | | Treasurer, Chief Financial Officer and Chief Accounting Officer |
| Term of office1 and length of time served2 | | Since 2021 |
| Principal occupation(s) during the past five years | | Treasurer, U.S. Fund Administration & Reporting and officer of certain funds in the Franklin Templeton/Legg Mason fund complex |
| |
| Navid J. Tofigh | | |
| Franklin Templeton | | |
| One Franklin Parkway, San Mateo, CA 94403-1906 | | |
| |
| Year of birth | | 1972 |
| Position(s) with Trust | | Vice President and Secretary |
| Term of office1 and length of time served2 | | Since 2021 |
| Principal occupation(s) during the past five years | | Senior Associate General Counsel, Franklin Templeton; and officer of certain funds in the Franklin Templeton/Legg Mason fund complex |
| | | | |
| 40 | | | | Royce Quant Small-Cap Quality Value ETF |
| | |
| Additional Officers (cont’d) | | |
| |
| Lori A. Weber | | |
| Franklin Templeton | | |
| 300 S.E. 2nd Street, Fort Lauderdale, FL 33301-1923 | | |
| |
| Year of birth | | 1964 |
| Position(s) with Trust | | Vice President |
| Term of office1 and length of time served2 | | Since 2021 |
| Principal occupation(s) during the past five years | | Senior Associate General Counsel, Franklin Templeton; Assistant Secretary, Franklin Resources, Inc.; Vice President and Secretary, Templeton Investment Counsel, LLC; and officer of certain funds in the Franklin Templeton/Legg Mason fund complex |
| † | Trustees who are not “interested persons” of the Fund within the meaning of Section 2(a)(19) of the Investment Company Act of 1940, as amended (the “1940 Act”). |
| 1 | Each Trustee and officer serves until his or her respective successor has been duly elected and qualified or until his or her earlier death, resignation, retirement or removal. |
| 2 | Indicates the earliest year in which the Trustee became a board member for a fund in the Legg Mason fund complex or the officer took such office. |
| 3 | Ms. Johnson is an “interested person” of the Fund, as defined in the 1940 Act, because of her position with LMPFA and/or certain of its affiliates. |
| | | | | | |
| Royce Quant Small-Cap Quality Value ETF | | | | | 41 | |
Important tax information (unaudited)
By mid-February, tax information related to a shareholder’s proportionate share of distributions paid during the preceding calendar year will be received, if applicable. Please also refer to www.franklintempleton.com for per share tax information related to any distributions paid during the preceding calendar year. Shareholders are advised to consult with their tax advisors for further information on the treatment of these amounts on their tax returns.
The following tax information for the Fund is required to be furnished to shareholders with respect to income earned and distributions paid during its fiscal year.
The Fund hereby reports the following amounts, or if subsequently determined to be different, the maximum allowable amounts, for the fiscal year ended March 31, 2023:
| | | | | | | | |
| | | Pursuant to: | | | Amount Reported | |
| Income Eligible for Dividends Received Deduction (DRD) | | § | 854(b)(1)(A) | | | $ | 401,857 | |
| Qualified Dividend Income Earned (QDI) | | § | 854(b)(1)(B) | | | $ | 419,638 | |
| | | | |
| 42 | | | | Royce Quant Small-Cap Quality Value ETF |
Royce Quant
Small-Cap Quality Value ETF
Trustees
Rohit Bhagat
Deborah D. McWhinney
Anantha K. Pradeep
Jennifer M. Johnson
Chair
Investment manager
Legg Mason Partners Fund Advisor, LLC
Subadviser
Royce & Associates, LP
Custodian
The Bank of New York Mellon
Transfer agent
The Bank of New York Mellon
240 Greenwich Street
New York, NY 10286
Independent registered public accounting firm
PricewaterhouseCoopers LLP
Baltimore, MD
Royce Quant Small-Cap Quality Value ETF
The Fund is a separate investment series of Legg Mason ETF Investment Trust, a Maryland statutory trust.
Royce Quant Small-Cap Quality Value ETF
Legg Mason Funds
620 Eighth Avenue, 47th Floor
New York, NY 10018
The Fund files its complete schedule of portfolio holdings with the Securities and Exchange Commission (“SEC”) for the first and third quarters of each fiscal year as an exhibit to its reports on Form N-PORT. The Fund’s Forms N-PORT are available on the SEC’s website at www.sec.gov. To obtain information on Form N-PORT, shareholders can call the Fund at 1-877-721-1926.
Information on how the Fund voted proxies relating to portfolio securities during the prior 12-month period ended June 30th of each year and a description of the policies and procedures that the Fund uses to determine how to vote proxies related to portfolio transactions are available (1) without charge, upon request, by calling the Fund at 1-877-721-1926, (2) at www.franklintempleton.com and (3) on the SEC’s website at www.sec.gov.
This report is submitted for the general information of the shareholders of Royce Quant Small-Cap Quality Value ETF. This report is not authorized for distribution to prospective investors in the Fund unless preceded or accompanied by a current prospectus.
Investors should consider the Fund’s investment objectives, risks, charges and expenses carefully before investing. The prospectus contains this and other important information about the Fund. Please read the prospectus carefully before investing.
www.franklintempleton.com
© 2023 Franklin Distributors, LLC, Member FINRA/SIPC. All rights reserved.
www.franklintempleton.com
© 2023 Franklin Distributors, LLC, Member FINRA/SIPC. All rights reserved.
ETFF399959 05/23 SR23-
The registrant has adopted a code of ethics that applies to the registrant’s principal executive officer, principal financial officer, principal accounting officer or controller.
| ITEM 3. | AUDIT COMMITTEE FINANCIAL EXPERT. |
The Board of Trustees of the registrant has determined that Rohit Bhagat and Deborah D. McWhinney possesses the technical attributes identified in Instruction 2(b) of Item 3 to Form N-CSR to qualify as an “audit committee financial expert,” and has designated Mr. Bhagat and Ms. McWhinney as its the Audit Committee’s financial experts. Mr. Bhagat and Ms. McWhinney are “independent” Trustees pursuant to paragraph (a)(2) of Item 3 to Form N-CSR.
| ITEM 4. | PRINCIPAL ACCOUNTANT FEES AND SERVICES. |
a) Audit Fees. The aggregate fees billed in the last two fiscal years ending March 31, 2022 and March 31, 2023 (the “Reporting Periods”) for professional services rendered by the Registrant’s principal accountant (the “Auditor”) for the audit of the Registrant’s annual financial statements, or services that are normally provided by the Auditor in connection with the statutory and regulatory filings or engagements for the Reporting Periods, were $146,240 in March 31, 2022 and $146,240 in March 31, 2023.
b) Audit-Related Fees. The aggregate fees billed in the Reporting Period for assurance and related services by the Auditor that are reasonably related to the performance of the Registrant’s financial statements were $0 in March 31, 2022 and $0 in March 31, 2023.
(c) Tax Fees. The aggregate fees billed in the Reporting Periods for professional services rendered by the Auditor for tax compliance, tax advice and tax planning (“Tax Services”) were $82,000 in March 31, 2022 and $82,000 in March 31, 2023. These services consisted of (i) review or preparation of U.S. federal, state, local and excise tax returns; (ii) U.S. federal, state and local tax planning, advice and assistance regarding statutory, regulatory or administrative developments, and (iii) tax advice regarding tax qualification matters and/or treatment of various financial instruments held or proposed to be acquired or held.
There were no fees billed for tax services by the Auditors to service affiliates during the Reporting Periods that required pre-approval by the Audit Committee.
d) All Other Fees.
The aggregate fees billed in the Reporting Periods for products and services provided by the Auditor, other than the services reported in paragraphs (a) through (c) for the Item 4 for the Legg Mason ETF Investment Trust, were $0 in the previous fiscal year and $0 in March 31, 2023.
All Other Fees. There were no other non-audit services rendered by the Auditor to Legg Mason Partners Fund Advisors, LLC (“LMPFA”), and any entity controlling, controlled by or under common control with LMPFA that provided ongoing services to Legg Mason ETF Investment Trust requiring pre-approval by the Audit Committee in the Reporting Period.
(e) Audit Committee’s pre–approval policies and procedures described in paragraph (c) (7) of Rule 2-01 of Regulation S-X.
(1) The Charter for the Audit Committee (the “Committee”) of the Board of each registered investment company (the “Fund”) advised by LMPFA or one of their affiliates (each, an
“Adviser”) requires that the Committee shall approve (a) all audit and permissible non-audit services to be provided to the Fund and (b) all permissible non-audit services to be provided by the Fund’s independent auditors to the Adviser and any Covered Service Providers if the engagement relates directly to the operations and financial reporting of the Fund. The Committee may implement policies and procedures by which such services are approved other than by the full Committee.
The Committee shall not approve non-audit services that the Committee believes may impair the independence of the auditors. As of the date of the approval of this Audit Committee Charter, permissible non-audit services include any professional services (including tax services), that are not prohibited services as described below, provided to the Fund by the independent auditors, other than those provided to the Fund in connection with an audit or a review of the financial statements of the Fund. Permissible non-audit services may not include: (i) bookkeeping or other services related to the accounting records or financial statements of the Fund; (ii) financial information systems design and implementation; (iii) appraisal or valuation services, fairness opinions or contribution-in-kind reports; (iv) actuarial services; (v) internal audit outsourcing services; (vi) management functions or human resources; (vii) broker or dealer, investment adviser or investment banking services; (viii) legal services and expert services unrelated to the audit; and (ix) any other service the Public Company Accounting Oversight Board determines, by regulation, is impermissible.
Pre-approval by the Committee of any permissible non-audit services is not required so long as: (i) the aggregate amount of all such permissible non-audit services provided to the Fund, the Adviser and any service providers controlling, controlled by or under common control with the Adviser that provide ongoing services to the Fund (“Covered Service Providers”) constitutes not more than 5% of the total amount of revenues paid to the independent auditors during the fiscal year in which the permissible non-audit services are provided to (a) the Fund, (b) the Adviser and (c) any entity controlling, controlled by or under common control with the Adviser that provides ongoing services to the Fund during the fiscal year in which the services are provided that would have to be approved by the Committee; (ii) the permissible non-audit services were not recognized by the Fund at the time of the engagement to be non-audit services; and (iii) such services are promptly brought to the attention of the Committee and approved by the Committee (or its delegate(s)) prior to the completion of the audit.
(2) None of the services described in paragraphs (b) through (d) of this Item were performed in reliance on paragraph (c)(7)(i)(C) of Rule 2-01 of Regulation S-X.
(f) Not applicable.
(g) Non-audit fees billed by the Auditor for services rendered to Legg Mason ETF Investment Trust, LMPFA and any entity controlling, controlled by, or under common control with LMPFA that provides ongoing services to Legg Mason ETF Investment Trust during the reporting period were $1,558,348 in the previous fiscal year and $785,604 in March 31, 2023.
(h) Yes. Legg Mason ETF Investment Trust’s Audit Committee has considered whether the provision of non-audit services that were rendered to Service Affiliates, which were not pre-approved (not requiring pre-approval), is compatible with maintaining the Accountant’s independence. All services provided by the Auditor to the Legg Mason ETF Investment Trust or to Service Affiliates, which were required to be pre-approved, were pre-approved as required.
(i) Not applicable.
(j) Not applicable.
| ITEM 5. | AUDIT COMMITTEE OF LISTED REGISTRANTS. |
| | a) | The independent board members are acting as the registrant’s audit committee as specified in Section 3(a)(58)(B) of the Exchange Act. The Audit Committee consists of the following Board members: |
Rohit Bhagat
Jennifer M. Johnson
Deborah D. McWhinney
Anantha K. Pradeep
| ITEM 6. | SCHEDULE OF INVESTMENTS. |
Included herein under Item 1.
| ITEM 7. | DISCLOSURE OF PROXY VOTING POLICIES AND PROCEDURES FOR CLOSED-END MANAGEMENT INVESTMENT COMPANIES. |
Not applicable.
| ITEM 8. | PORTFOLIO MANAGERS OF CLOSED-END MANAGEMENT INVESTMENT COMPANIES. |
Not applicable.
| ITEM 9. | PURCHASES OF EQUITY SECURITIES BY CLOSED-END MANAGEMENT INVESTMENT COMPANY AND AFFILIATED PURCHASERS. |
Not applicable.
| ITEM 10. | SUBMISSION OF MATTERS TO A VOTE OF SECURITY HOLDERS. |
Not applicable.
| ITEM 11. | CONTROLS AND PROCEDURES. |
| | (a) | The registrant’s principal executive officer and principal financial officer have concluded that the registrant’s disclosure controls and procedures (as defined in Rule 31a- 3(c) under the Investment Company Act of 1940, as amended (the “1940 Act”)) are effective as of a date within 90 days of the filing date of this report that includes the disclosure required by this paragraph, based on their evaluation of the disclosure controls and procedures required by Rule 31a-3(b) under the 1940 Act and 15d-15(b) under the Securities Exchange Act of 1934. |
| | (b) | There were no changes in the registrant’s internal control over financial reporting (as defined in Rule 31a-3(d) under the 1940 Act) that occurred during the period covered by this report that have materially affected, or are likely to materially affect the registrant’s internal control over financial reporting. |
| ITEM 12. | DISCLOSURE OF SECURITIES LENDING ACTIVITIES FOR CLOSED-END MANAGEMENT INVESTMENT COMPANIES. |
Not applicable.
(a) (1) Code of Ethics attached hereto.
Exhibit 99.CODE ETH
(a) (2) Certifications pursuant to section 312 of the Sarbanes-Oxley Act of 2002 attached hereto.
Exhibit 99.CERT
(b) Certifications pursuant to Section 906 of the Sarbanes-Oxley Act of 2002 attached hereto.
Exhibit 99.906CERT
SIGNATURES
Pursuant to the requirements of the Securities Exchange Act of 1934 and the Investment Company Act of 1940, the registrant has duly caused this Report to be signed on its behalf by the undersigned, there unto duly authorized.
Legg Mason ETF Investment Trust
| | |
| By: | | /s/ Matthew T. Hinkle |
| | Matthew T. Hinkle |
| | Chief Executive Officer |
| |
| Date: | | May 22, 2023 |
Pursuant to the requirements of the Securities Exchange Act of 1934 and the Investment Company Act of 1940, this report has been signed below by the following persons on behalf of the registrant and in the capacities and on the dates indicated.
| | |
| By: | | /s/ Matthew T. Hinkle |
| | Matthew T. Hinkle |
| | Chief Executive Officer |
| |
| Date: | | May 22, 2023 |
| | |
By: | | /s/ Vivek Pai |
| | Vivek Pai |
| | Principal Financial Officer |
| |
Date: | | May 22, 2023 |