Table of Contents
As filed with the Securities and Exchange Commission on April 3, 2023
File No.[●]
UNITED STATES
SECURITIES AND EXCHANGE COMMISSION
Washington, D.C. 20549
FORM 10
GENERAL FORM FOR REGISTRATION OF SECURITIES
Pursuant to Section 12(b) or 12(g) of
the Securities Exchange Act of 1934
Silver Point Specialty Lending Fund
(Exact name of registrant as specified in its charter)
| Maryland | 47-1577585 | |
| (State or other jurisdiction of incorporation or organization) | (I.R.S. Employer Identification No.) |
Two Greenwich Plaza, First Floor Greenwich, Connecticut | 06830 | |
| (Address of principal executive offices) | (Zip Code) |
Registrant’s telephone number, including area code:
(203) 542-4200
with copies to:
| Michael K. Hoffman, Esq. Skadden, Arps, Slate, Meagher & Flom LLP One Manhattan West New York, New York 10001 (212) 735-3000 | Kenneth Burdon, Esq. Skadden, Arps, Slate, Meagher & Flom LLP 500 Boylston Street Boston, Massachusetts 02116 (617) 573-4800 |
Securities to be registered pursuant to Section 12(b) of the Act:
None
Securities to be registered pursuant to Section 12(g) of the Act:
Common shares of beneficial interest, par value $0.001 per share
(Title of class)
Indicate by check mark whether the registrant is a large accelerated filer, an accelerated filer, a non-accelerated filer, a smaller reporting company, or an emerging growth company. See the definitions of “large accelerated filer,” “accelerated filer,” “smaller reporting company” and “emerging growth company” in Rule 12b-2 of the Exchange Act.
| Large accelerated filer | ☐ | Accelerated filer | ☐ | |||
| Non-accelerated filer | ☐ | Smaller reporting company | ☐ | |||
| Emerging growth company | ☒ | |||||
If an emerging growth company, indicate by check mark if the registrant has elected not to use the extended transition period for complying with any new or revised financial accounting standards provided pursuant to Section 7(a)(2)(B) of the Securities Act. ☐
Table of Contents
Table of Contents
Silver Point Specialty Lending Fund is filing this registration statement on Form 10 (the “Registration Statement”), under the Securities Exchange Act of 1934, as amended (the “Exchange Act”), on a voluntary basis in connection with its election to be regulated as a business development company (a “BDC”) under the Investment Company Act of 1940, as amended (the “Investment Company Act”), and in order to provide current public information to the investment community. Once this Registration Statement is effective, the Company will be subject to the requirements of Section 13(a) of the Exchange Act, including the rules and regulations promulgated thereunder, which will require the Company, among other things, to file annual reports on Form 10-K, quarterly reports on Form 10-Q and current reports on Form 8-K, and the Company will be required to comply with all other obligations of the Exchange Act applicable to issuers filing registration statements pursuant to Section 12(g) of the Exchange Act. The Securities and Exchange Commission (the “SEC”) maintains an internet website (http://www.sec.gov) that contains the reports mentioned in this section.
In this Registration Statement, unless otherwise specified, the terms:
| • | “we,” “us,” “the Fund,” and “the Company” refer to Silver Point Specialty Lending Fund, a Maryland statutory trust, and its consolidated subsidiaries and predecessor entities; |
| • | “Private Fund” refers to the Fund and its consolidated subsidiaries and predecessor entities prior to the conversion of the Fund into a Maryland statutory trust; |
| • | “Board of Trustees” refers to the Board of Trustees of the Company and, each member thereof, a “Trustee”; |
| • | “Adviser” refers to Silver Point Specialty Credit Fund Management, LLC, a Delaware limited liability company and wholly owned subsidiary of Silver Point Capital, L.P. (“Silver Point”); |
| • | “common shares” refers to the Company’s common shares of beneficial interest, par value $0.001; |
| • | “Governing Documents” refers to the Company’s Agreement and Declaration of Trust, dated November 15, 2021 and the Company’s Bylaws, dated November 15, 2021; and |
| • | “Shareholders” refers to the holders of beneficial interest of the Company’s common shares. |
The Company is an “emerging growth company,” as defined in the Jumpstart Our Business Startups Act of 2012. As a result, the Company is eligible to take advantage of certain reduced disclosure and other requirements that are otherwise applicable to public companies including, but not limited to, not being subject to the auditor attestation requirements of Section 404(b) of the Sarbanes-Oxley Act of 2002. See “Item 1. Business—Regulation—Compliance with the JOBS Act.”
Investing in our common shares may be considered speculative and involves a high degree of risk, including the following:
| • | An investment in our common shares is not suitable for you if you might need access to the money you invest in the foreseeable future. |
| • | You should not expect to be able to sell your common shares regardless of how we perform. |
| • | Since you are unable to sell your common shares, you will be unable to reduce your exposure on any market downturn. |
| • | We will invest in securities that are rated below investment grade by rating agencies or that would be rated below investment grade if they were rated. Below investment grade securities, which are often referred to as “junk,” have predominantly speculative characteristics with respect to the issuer’s capacity to pay interest or repay principal. They may also be difficult to value and illiquid. |
1
Table of Contents
| • | Investing in our common shares may be considered speculative and involves a high degree of risk, including the risk of a substantial loss of investment. See “Item 1A. Risk Factors” to read about the risks you should consider before buying our common shares. |
2
Table of Contents
Some of the statements in this Registration Statement may constitute forward-looking statements because they relate to future events or our future financial conditions. Forward-looking statements are typically identified by words or phrases such as “trend,” “opportunity,” “pipeline,” “believe,” “comfortable,” “expect,” “anticipate,” “current,” “intention,” “estimate,” “position,” “assume,” “potential,” “outlook,” “continue,” “remain,” “maintain,” “sustain,” “seek,” “achieve” and similar expressions, or future or conditional verbs such as “will,” “would,” “should,” “could,” “may” or similar expressions. The use of forecasts in this Registration Statement is prohibited. Any representations to the contrary or any predictions, written or oral, as to the amount or certainty of any present or future cash benefit or tax consequence which may flow from an investment in our common shares is not permitted. The forward-looking statements contained in this Registration Statement involve risks and uncertainties, including, but not limited to, statements as to:
| • | our future operating results; |
| • | our business prospects and the prospects of our portfolio companies; |
| • | changes in the economy; |
| • | risk associated with possible disruptions in our operations or the economy generally; |
| • | the impact of global health epidemics, including, but not limited to, the recent and ongoing COVID-19 pandemic, on our and our portfolio companies’ business and the global economy; |
| • | the effect of investments that we expect to make; |
| • | our contractual arrangements and relationships with third parties; |
| • | actual and potential conflicts of interest with our Adviser and its affiliates; |
| • | the dependence of our future success on the general economy and its effect on the industries in which we invest, including as a result of inflation; |
| • | the ability of our portfolio companies to achieve their objectives; |
| • | the use of borrowed money to finance a portion of our investments, including the consequences of interest rate increases; |
| • | the adequacy of our financing sources and working capital; |
| • | the timing of cash flows, if any, from the operations of our portfolio companies; |
| • | the ability of our Adviser to locate suitable investments for us and to monitor and administer our investments; |
| • | the ability of our Adviser and its affiliates to attract and retain highly talented professionals; |
| • | our ability to qualify and maintain its qualification as a BDC; and |
| • | the effect of changes in laws or regulations affecting our operations or to tax legislation and its tax position. |
Forward-looking statements are subject to numerous assumptions, risks and uncertainties, which change over time. Forward-looking statements speak only as of the date they are made, and the Company assumes no duty to and do not undertake to update forward-looking statements. These forward-looking statements do not meet the safe harbor for forward-looking statements pursuant to Section 27A of the Securities Act of 1933 (the “Securities Act”) or Section 21E of the Exchange Act. Actual results could differ materially from those anticipated in forward-looking statements and future results could differ materially from historical performance.
3
Table of Contents
Statistical and market data used in this Registration Statement has been obtained from governmental and independent industry sources and publications. The Company has not independently verified the data obtained from these sources. Forward-looking information obtained from these sources is subject to the same qualifications and the additional uncertainties regarding the other forward-looking statements contained in this Registration Statement, for which the safe harbor provided in Section 27A of the Securities Act and Section 21E of the Exchange Act is not available.
4
Table of Contents
The Company
We are a specialty finance company focused on investing in senior secured loans to private U.S. middle market companies. Our investment objective is to achieve stable income generation with attractive risk-adjusted returns by investing primarily in U.S. middle market lending opportunities, and specialty asset based financings. We define “middle market companies” to generally mean companies with earnings before interest expense, income tax expense, depreciation and amortization (“EBITDA”) between $30 million and $150 million annually, annual revenue of $80 million to $1 billion at the time of investment, and/or enterprise value between $150 million and $2 billion at the time of investment. There is no minimum or maximum limit on the amount of our assets that may be invested in any single such asset class. We may also, from time to time, invest in larger or smaller companies. In seeking to achieve our investment objective, we may also invest across a broad range of industries. We will invest primarily in first-lien debt, but may also invest in second lien debt, mezzanine and unsecured debt, equity, structured credit, and derivatives depending on the opportunity set and market environment.
In addition to investments in U.S. middle-market companies, we may invest a portion of our capital in opportunistic investments, including, but not limited to, equity and debt securities (secured or unsecured) and loans. The proportion of these types of investments will change over time given our views on, among other things, the economic and credit environment in which we are operating.
We are a closed-end, management investment company that has elected to be regulated as a BDC under the Investment Company Act. We reserve the right to operate as a non-diversified company within the meaning of the Investment Company Act. However, our portfolio currently meets, and may from time to time in the future meet, the diversification standards of a diversified company as defined in the Investment Company Act.
Silver Point Specialty Credit Fund Management, LLC, a Delaware limited liability company, serves as our investment adviser and administrator. Subject to the supervision of our Board of Trustees, our Adviser manages our day-to-day operations and provides us with investment advisory and management services. Our Adviser is responsible for sourcing, researching and structuring potential investments, monitoring portfolio companies, and providing operating and managerial assistance to us and to our portfolio companies as required. We believe our Adviser will be able to leverage Silver Point’s existing relationships across advisors, intermediaries, investment banks, financial sponsors, broker-dealers, lawyers, and investors to source attractive investment opportunities.
We seek to accomplish our investment objective through leveraging the $17.9 billion Silver Point investment platform and Silver Point’s significant credit investing expertise, which enables us to source and identify less competitive and/or mispriced market opportunities. We target secured, floating rate loans with stable income that are structured with significant downside protection, which we believe includes strong covenant packages and comprehensive collateral packages. We prioritize investments in first lien debt, which we believe offers more attractive risk-adjusted return characteristics.
We focus on U.S. middle market opportunities that have barriers to entry because they entail in-depth due diligence, valuation and collateral analyses; involve complexity; and require speed and certainty of execution and similar features that limit the participation of traditional financing sources. These opportunities are often less competitive and allow us to require more favorable structural and economic terms than available in broader public markets.
Our Adviser believes the middle market lending environment is attractive throughout the credit cycle as a result of the following (i) growing demand for non-traditional lenders, (ii) trajectory of the middle market environment, (iii) dynamics of middle market lending conditions and (iv) the niches of the specialty lending market, which we believe our Adviser has the credit expertise and sourcing relationships to capitalize on. The reduced competition and barriers to entry within these deals may allow us to originate and purchase loans at
5
Table of Contents
premium economics and with better creditor protections than those available in the broader market. Please refer to “—Market Opportunity” for more information on our Adviser’s views on the middle market lending environment.
If we are successful in achieving our investment objective, we believe that we will be able to provide our Shareholders with consistent dividend distributions and attractive risk-adjusted total returns, although there can be no assurances in this regard. Since our inception on July 1, 2015, through December 31, 2022, we have invested over $3.0 billion in 203 portfolio companies, excluding any subsequent exits or repayments. As of December 31, 2022, the fair value of our portfolio was invested approximately 94.8% in first lien secured debt, 1.8% in second lien debt, 2.3% in equity investments and 1.1% in other investments.
We are an “emerging growth company” under the Jumpstart Our Business Startups Act of 2012 (the “JOBS Act”). For so long as we remain an emerging growth company under the JOBS Act, we will be subject to reduced public company reporting requirements.
We were formed as a Delaware limited liability company under the name SPCP Group VII, LLC on July 31, 2014. On April 1, 2015, we changed our name to Silver Point Specialty Credit Fund, L.P. and converted to a Delaware limited partnership. On July 1, 2015, we commenced our investment activities as a private investment fund. Effective November 15, 2021, we changed our name to Silver Point Specialty Lending Fund and converted our form of organization from a Delaware limited partnership to a statutory trust organized under the laws of the State of Maryland (the “Trust Conversion”).
Investment Adviser
Our Adviser will utilize Silver Point’s investment team, including its founders, Edward A. Mulé and Robert J. O’Shea, which has significant experience in direct loan origination and investing in and managing loan portfolios across multiple credit cycles. Silver Point’s direct lending platform was formed in 2002, seeking to replicate the success the founders had in building and managing Goldman Sachs’ credit and special situations investing businesses together in the mid-to-late 1990s and in creating Goldman Sachs’ direct lending business in 1996 to focus on middle market loans. Mr. O’Shea was hired by Goldman in 1990 to establish its global bank loan trading business, which he built from the ground up. He also led all of Goldman’s high yield bond and bank loan underwriting, trading, sales, capital markets, and research businesses.
Since its inception, Silver Point designed and built its business model for its credit investing platform, including its direct lending platform, to have the deep resources, expertise and capital to invest in global credit markets. In the direct lending business, we believe our Adviser will be able to leverage Silver Point’s broad and longstanding sourcing relationships, rigorous underwriting process, structuring expertise, and portfolio monitoring and asset management capabilities to originate and manage attractive middle market loans throughout credit cycles on terms that are better than those available in the broader market.
As of December 31, 2022, Silver Point managed approximately $17.9 billion of invested and committed capital across its funds. As of December 31, 2022, Silver Point had over 255 employees, of which 81 are investment professionals who may have responsibilities to the Fund and to other investment vehicles. Silver Point has a highly experienced infrastructure team of over 150 professionals in legal and compliance, operations, accounting and finance, investor relations and human resources.
Our Adviser is registered as an investment adviser under the Investment Advisers Act of 1940. The principal executive office of our Adviser is located at Two Greenwich Plaza, First Floor, Greenwich, Connecticut 06830. Subject to the supervision of our Board of Trustees, our Adviser manages our day-to-day operations and provides us with investment advisory and management services. Our Adviser is responsible for sourcing, researching and structuring potential investments, monitoring portfolio companies, and providing operating and managerial assistance to us and to our portfolio companies as required.
6
Table of Contents
Investment Strategy
We seek to achieve stable income generation with attractive risk-adjusted returns by investing primarily in U.S. middle market lending opportunities, and specialty asset based financings.
While co-managing Goldman Sachs’ global special situations businesses in the mid-to-late 1990s, Mr. Mulé and Mr. O’Shea identified and capitalized on what they believed to be a distinct opportunity in specialty lending. Mr. Mulé and Mr. O’Shea found that having the ability to conduct independent credit analysis, understand and underwrite complex situations, offer customized and creative solutions, and provide borrowers speed and certainty of execution enabled them to source and underwrite what they believed to be attractive loans. In their experience, the necessity of these particular skills created barriers to entry for other lenders and thereby reduced competition, which offered the opportunity to negotiate more favorable downside protection, and/or enhanced economic terms than available in the broader markets.
Our strategy is much the same as Mr. Mulé’s and Mr. O’Shea’s in the mid-to-late 1990s. We are generally opportunistic in our investment approach in the specialty lending space and specifically seek to source less competitive investment opportunities. We leverage our differentiated and longstanding sourcing relationships across advisors, intermediaries, investment banks, financial sponsors, broker-dealers, lawyers, and investors, and seek to capitalize on our reputation as an experienced and sophisticated investor within the credit markets. These opportunities typically exist for the Fund because of our Adviser’s ability to (i) conduct independent in-depth due diligence, valuation, and collateral analyses and understand complexity, (ii) offer creative and/or single-lender solutions that are responsive to a borrower’s unique needs; and (iii) provide speed and certainty of execution, all of which can limit the number of lenders able to underwrite the loan. We believe the barriers to entry and therefore reduced competition in specialty lending allow us to originate loans with downside protection at better economic terms, and we seek to deliver better risk-adjusted returns than generally available in the broader market.
We typically seek to originate senior secured, performing, floating rate loans. We invest opportunistically across industries and target borrowers that typically have some or all of the following characteristics: consistent income and stable cash flow generation; a business of strategic importance or with a dependent customer base; attractive loan-to-values; strong collateral value; and expected ability to preserve capital in a downturn. As fundamental credit investors, with experience in successfully managing portfolios through declining market environments, we generally approach structuring our loans with a focus on understanding the risk of loss, analyzing these risks through comprehensive due diligence, assessing the potential severity of loss of principal, and mitigating risk where possible through customized structure and documentation, through which we seek to implement creditor protections that we believe are necessary, but often overlooked by our competitors.
Investment Portfolio
Our investment portfolio is primarily composed of middle market companies that may utilize our investment to support their businesses in a variety of ways, including enhancing organic growth, pursuing acquisitions, recapitalizing their businesses, and expanding product offerings.
As of December 31, 2022, we had investments in 74 portfolio companies with an aggregate fair value of $815.4 million. The corresponding average investment size of our portfolio at fair value was approximately $11.0 million. As of December 31, 2022, the largest single investment based on fair value represented 3.3% of our total investment portfolio. We generally target investments in first lien debt, which we believe offers attractive risk-adjusted return characteristics. As of December 31, 2022, based on fair value, our portfolio consisted of 94.8% first lien debt investments, 1.8% second lien debt investments, 2.3% equity investments and 1.1% in other investments. As of December 31, 2022, based on fair value, approximately 85.9% of our investments were in U.S. companies.
The gross unlevered yield on our debt portfolio as of December 31, 2022, was 11.9% with a remaining weighted average term of 3.4 years. As of December 31, 2022, approximately 89.9% of our performing debt
7
Table of Contents
investments based on fair value were floating rate investments, which had an average spread over the Secured Overnight Financing Rate (“SOFR”) of 699 basis points, and 10.1% of our performing debt investments were fixed rate investments, which had an average interest rate of 8.4% (without considering the impact of the interest swaps). From time to time, the Fund seeks to mitigate interest rate risk associated with fixed rate investments by entering into interest rate swaps (refer to Item 2. Financial Information—Management’s Discussion and Analysis of Financial Condition and Results of Operations—Derivatives and Hedging” for further details). With the impact of the interest rate swaps, approximately 94.9% of our performing debt investments based on fair value were effectively floating rate investments at December 31, 2022. As of December 31, 2022, there was 1 non-accrual loan, representing 1.8% of cost and 1.9% of fair value in our portfolio, respectively.
For the year ended December 31, 2022, we funded $187.2 million in 21 new portfolio companies and $50.6 million in existing portfolio companies. For this period, we received $340.9 million of aggregate repayments, paydowns and sales.
Since commencement of our investment operations on July 1, 2015 through December 31, 2022, we have fully exited investments in 129 portfolio companies, which have resulted in an unlevered internal rate of return (gross of expenses) of 13.6%. The internal rate of return is the percentage rate of return earned on each dollar invested related to realized investments, based on the amounts and effective dates of each funding and repayment related to each realized investment. Please see “Item 2. Financial Information—Management’s Discussion and Analysis of Financial Condition and Results of Operations—Results of Operations—Expenses” for more information regarding Fund expenses. The Fund expects to use leverage and, to the extent that returns on investments are greater than the interest the Fund pays on leverage, returns to Shareholders will be increased. During the period from our formation through December 31, 2022, in excess of 70% of the Fund’s assets were “qualifying assets” under Section 55(a) of the Investment Company Act.
Market Opportunity
We seek to accomplish our investment objective through leveraging the $17.9 billion Silver Point investment platform and Silver Point’s significant expertise investing in credit markets, which we believe enable us to source and identify less competitive and/or mispriced market opportunities, regardless of market conditions. We believe the middle market lending environment, and in particular our focus area within middle market lending, is attractive throughout the credit cycle as a result of a combination of the following:
Size of the Middle Market Environment and Resulting Demand for Capital. The middle market is a critical portion of the U.S. economy and serves an outsized role in terms of GDP and revenues. According to the National Center for The Middle Market Year-End 2022 Middle Market Indicator, there are nearly 200,000 businesses in the U.S. middle market which represents one-third of private sector GDP and employment. Moreover, middle market companies reported continued strong year-over-year average rate of revenue growth holding steady at approximately 12% in 2022. The Middle Market Indicator defines U.S. middle market companies as those with annual revenue between $10 million and $1 billion, significantly overlapping with our definition of U.S. middle market companies. The contribution from middle market companies to the economy has grown over time, and as the sector continues to expand, we believe there will be a similarly outsized need for capital. Historically, U.S. commercial and regional banks were traditional lenders to the middle market. However, regulatory and structural changes have taken place in the lending space that have resulted in less supply of capital for middle market companies from these traditional lenders. This has created an attractive lending opportunity for direct lenders to fill the void of traditional lenders.
Specialty Lending Market. We believe that middle market lending opportunities yield higher returns with better creditor protections when compared to broadly syndicated loan opportunities and that a unique opportunity exists for specialty lenders with differentiated sourcing channels and underwriting expertise to structure deals with more favorable terms than the broader market. We believe there persists a void in the market for deals where the borrower is in an industry or position that requires the lender to (i) conduct independent in-depth
8
Table of Contents
enterprise and collateral analysis and /or understand complexity, (ii) offer creative customized solutions and/or (iii) provide capital with speed and certainty of execution. We believe the reduced competition and barriers to entry within these deals allow us to originate loans at a risk-adjusted return premium to the broader market and to secure relatively stronger covenant packages, which provides our loans with significant downside protection.
Specialty Lending Expertise. Successfully lending within the middle market space requires a specialized skill set, particularly in assessing credit quality and risk, assessing business valuations, structuring and documentation, and asset management. Lenders in the middle market space have the ability to enhance value through intricate knowledge of capital structures and business dynamics, and through thoughtful structuring of financial covenants. Furthermore, lenders who engage in robust asset monitoring and management can successfully enhance returns throughout the business and credit cycle. We believe Silver Point is well-positioned to extract value from middle market opportunities given its platform, deep credit expertise, and experience managing portfolios of loans across cycles.
Attractive Opportunities to Invest in Senior Secured and Floating Rate Loans. We believe that opportunities to invest in senior secured loans are attractive because of the floating rate structure of most senior secured debt issuances and the defensive characteristics of these types of investments in a rising rate environment. We believe that floating rate debt investments can offer a superior return profile relative to fixed-rate investments, since floating rate structures are generally less susceptible to declines in value in a rising rate environment. In addition, senior secured debt possesses attractive defensive characteristics given its priority in payment relative to junior debt holders and equity holders.
Periods of economic uncertainty present both significant opportunities and risks. Increased volatility and market dislocation often result in a weakened capital base for new loan supply, and an increase in lending opportunities that require private capital to be accretive solution providers. We believe that the current macroeconomic backdrop represents an attractive opportunity as, in addition to the borrowers that were already prioritizing private credit for their capital needs, there may be significantly increased demand for private credit from the dislocated public markets and we believe this will continue well into 2023. Given our capabilities and expertise in the specialty lending market, we believe we have built an all-cycle business model and we are well positioned to take advantage of this shift in the operating landscape. We believe that the best loans, characterized by favorable economics and enhanced lender protections, are often underwritten in these times of uncertainty. Refer to “Item 1A. Risk Factors” for further information on related risks.
Competitive Advantages
As a wholly owned subsidiary of Silver Point, a multi-billion dollar global credit investment firm founded in 2002, our Adviser shares the same management team and is engaged in lines of business that provide it advantages to origination, credit underwriting and risk assessment of markets and relative value. Accordingly, we believe our Adviser’s advantages over other middle market lenders are effectively those of Silver Point, including:
Experienced Investment Team. Silver Point’s founders each have over 30 years of experience in financial markets, and have worked together since the mid-1990s building and managing businesses and investing capital in the global credit markets, including originating loans to middle market companies. Additionally, the members of the senior leadership team that are dedicated to the Fund have, on average, over 20 years of industry experience, predominately in middle market lending roles.
Differentiated Origination Strategy. The investment team originates opportunities from a variety of differentiated sources, and typically seeks to focus on less competitive investments. Silver Point’s sourcing network has grown out of the relationships that it has built over 20+ years across a global credit investment platform of approximately $17.9 billion, including advisors, intermediaries, investment banks, financial sponsors, broker-dealers, lawyers, and investors. These sourcing relationships are honed through Silver Point’s dedicated
9
Table of Contents
origination team, its broad investment platform and a dedicated trading desk that informs the market on Silver Point’s capabilities as a value-added financing source. Silver Point has established deep relationships with a broad range of financial intermediaries as a lender with differentiated abilities to understand complex financing needs and customize solutions. Silver Point’s ability to provide creative, customized solutions increases the scope of potential lending opportunities and positions us to work directly and flexibly with borrowers.
Strong Credit Analytics. Given Silver Point’s and its founders’ background and long track record of investing in the global credit markets, with a particular focus on areas of the market with high barriers to entry which require strong credit expertise, we believe the Silver Point team possesses deeper credit analysis and underwriting skills than many direct lending peers. We believe Silver Point’s ability to analyze companies and capital structures and its experience investing across industries and cycles allow us to conduct independent fundamental analyses on companies and company valuations.
Benefit of Sitting Within a Large, Sophisticated Credit Platform. We believe we benefit from sitting within a sophisticated, multi-billion dollar credit platform. The investment team originates opportunities from a variety of differentiated sources, and typically seeks to focus on financings where we believe we have an edge. We will leverage (i) Silver Point’s industry-focused investment analysts for sector expertise, and (ii) Silver Point’s dedicated trading desk, which has well established relationships with Wall Street. We benefit from Silver Point’s active credit trading business, which consistently has a view of where relative risk across the entire capital structure is pricing in public markets, to appropriately price our directly originated loans and opportunistically purchase mispriced performing loans in the secondary market. Additionally, while Silver Point’s core middle market origination strategy is focused on corporate cash flow lending, the platform includes a dedicated team with an expertise on sourcing specialty asset based financings, which are loans collateralized by hard assets, typically real estate. Silver Point also has a team whose role is to study and inform Silver Point’s top-down views of markets, including having a view of where we are in a business and credit cycle. The work done by this team, and Silver Point more broadly, creates insight into important cyclical patterns or macro developments and potential risks to the lending portfolio.
Business Valuation. Silver Point’s deep investment team, which includes sector-focused analysts, possesses significant insight across industries, encompassing both company-specific and top-down views on the sector. We believe Silver Point’s extensive credit underwriting experience through multiple credit cycles provides unique capabilities in understanding and valuing companies, allowing it to identify attractive risk/reward opportunities, reach judgments quickly compared to traditional lending sources, and deliver attractive financing solutions.
Structuring Skills. Enhanced by its restructuring and asset management background, Silver Point approaches its due diligence process for lending opportunities with a primary emphasis on understanding the drivers of potential risk of loss, assessing the likelihood of occurrence and resulting risk and severity of principal loss, and determining whether it can mitigate these risks through additional diligence and/or structuring. As such, Silver Point emphasizes strong credit facility structuring and documentation through protections such as strong financial and negative covenant packages, complete and customized events of default, scheduled amortization, and comprehensive collateral packages. Silver Point will often act as the sole or lead lender, and seeks to take an active role in asset management when necessary. We believe our Adviser’s experience and dedicated capital increases our ability to provide creative, customized, “one-stop” solutions, which broadens the scope of potential lending opportunities and positions us to work directly and flexibly with borrowers.
Portfolio Monitoring and Asset Management Skills. The Silver Point team has a successful track record of managing originated loans and credit investments throughout multiple credit cycles. We believe strong asset monitoring and management capabilities are a core component to successfully investing through business and credit cycles. The team constantly reviews and evaluates investment fundamentals and performance, current and expected catalysts, covenants, cash flows, and other relevant events. To the extent a loan in the portfolio underperforms, Silver Point’s strong up-front structuring and documentation coupled with its extensive asset management expertise enhances its ability to successfully manage the loan.
10
Table of Contents
Access to our Adviser’s Deep Restructuring and Workout Expertise. The team also benefits from access to Silver Point’s extensive experience in leading company reorganizations and workout situations. We believe this expertise provides the team with an edge when structuring a loan; we believe it gives Silver Point an advantage in understanding the potential risk of loss, assessing the likelihood of occurrence, and determining structural ways to mitigate against those potential risks. We believe that through thoughtfully established covenants and structure, Silver Point is better able to see early warning signs in our loans, allowing it to proactively address issues that may arise. In instances where a company may encounter financial trouble, the team has access to Silver Point’s dedicated workout team, which we believe is a point of differentiation for Silver Point. We believe that this background in restructurings and workouts allows Silver Point to better understand how to protect the downside upfront, mitigate risk of loss, and maximize investment returns.
Strong Alignment of Interest. Silver Point’s affiliates currently beneficially own, and immediately following completion of this offering will beneficially own approximately 18% of our common shares, which we believe provides a strong alignment of interest with our Shareholders.
Investment Criteria
Silver Point seeks to identify attractive risk-adjusted lending opportunities with stable income generation. It seeks to be opportunistic in identifying companies that align with our mandate, but generally targets companies that it believes have some or all of the following characteristics:
| • | Companies that it believes operate in stable or more predictable industries; |
| • | Companies it believes have strong competitive market positions, either as broad market leaders or leaders of the immediately relevant market such companies operate in; |
| • | Companies it believes have a high likelihood of long-term sustainability, and those that provide critical products or services to customers; |
| • | Companies it believes have stable free cash flow profile, allowing for consistent reduction in leverage and ability to repay debt over time; |
| • | Companies it believes have strong management and an alignment of interest between management, ownership and its lenders; or |
| • | Companies it believes allow for the preservation of value in downside scenarios, which may include: |
| • | a likelihood that there are strategic buyers for the company; |
| • | multiple business lines and/or uncorrelated sources of value allowing for multiple ways for a secured lender to recover value; or |
| • | significant hard or monetizable assets that can cover the secured loan or reduce the severity of loss in a downside scenario. |
Silver Point also seeks to make investments in companies where it is able to influence the terms of such investments through the creation of customized documentation at underwriting, and also where it is a sole or large lender thereby giving us a meaningful control position in the event of future underperformance and necessity for a restructuring or workout. We believe that Silver Point’s investment professionals have differentiated experience with complex credit documentation and restructurings/workouts. We therefore value lending opportunities where Silver Point will have the necessary control to leverage its expertise to create better downside protection through documentation and structuring, consistent with our overall goal of preserving capital.
11
Table of Contents
Investment Process
Silver Point’s investment process is robust. Its organization is populated with experienced, senior professionals in each of the following functional areas of the investment process: deal sourcing and origination, due diligence and analysis, structuring and documentation, portfolio monitoring, asset management and investment committee review.
Sourcing and Originations. Silver Point has a broad sourcing network, as well as a dedicated sourcing team, consisting of (i) dedicated originators calling on advisors, intermediaries, investment banks, financial sponsors, broker-dealers, lawyers, and investors; (ii) investment analysts covering sectors and companies, seeking to identify unique lending opportunities; (iii) a dedicated trading desk in regular dialogue with broker-dealers on primary market opportunities for deals where Silver Point can act as an anchor order and thereby influence and improve deal terms, and opportunistically purchase mispriced performing loans; and (iv) an asset management team working closely with the advisory community. Silver Point leverages all of these networks with the goal of receiving an exclusive invitation to conduct diligence on potential deals and/or to identify less competitive situations where our capital and our involvement are valued by the counterparty.
Due Diligence and Analysis. Rigorous analysis and diligence are performed on all high-potential investment ideas, including a review of the strength, quality, stability and cyclicality of the business and industry, financial performance, capital structures, risks, collateral value, catalysts, indicative terms, key structural protections, severity of potential loss in a downside, and ultimately risk-adjusted returns. Silver Point typically leverages private information from prospective borrowers to conduct due diligence, allowing it to perform more granular due diligence than is possible when relying solely on public information. Silver Point complements private level diligence with a review of relevant available public information on the company, and its competitors and/or relevant industry. Depending on the specific circumstances surrounding the company or investment opportunity, Silver Point’s work may include:
| • | Multiple in-person meetings with management to review the company, the market(s) it operates in, its competitive positioning within such markets, key business or market risks, and other company-specific factors, and to assess management’s abilities to operate the business; |
| • | An independent review of these same issues, often with the assistance of independent market experts, including current and former executives, to corroborate, validate and challenge the critical issues and conclusions; |
| • | A review of historical and projected financial information, including main drivers of revenue, expenses and free cash flow, and assessment of fixed versus variable costs; |
| • | A review of all potential collateral, which may include third-party appraisals or valuations if determined to be appropriate; |
| • | Direct discussions with key customers, suppliers, and other constituents critical to the company’s success; |
| • | A review of significant contracts that have the potential to impact revenue or profitability, with a specific focus on potential risks surrounding such contracts in a potential future downside scenario; |
| • | An assessment of exogenous factors that could impact the company, including challenges to existing laws or regulations that may be of critical importance to the company; |
| • | A review of loan documentation, and in instances of shared collateral, inter-creditor or collateral management agreements; and |
| • | Background checks on key management and principal ownership. |
Structuring and Documentation. We believe that Silver Point’s credit and restructuring background gives it an advantage as it seeks to create documentation to protect against downside risks. Silver Point’s investment team is disciplined in structuring investments, seeking to protect capital across credit cycles. Credit and collateral
12
Table of Contents
agreements are prepared with a focus on the key risks that are identified through due diligence, along with Silver Point’s analysis of how these risks can be mitigated through the documentation process. These strategies may include (i) bespoke or customized financial covenants or events of default specifically designed to address a leading indicator of future performance volatility, (ii) scheduled amortization payments and mandatory prepayment provisions designed to ensure the loan is appropriately de-levering, and / or (iii) comprehensive collateral packages with a focus on ensuring proper lien perfection for us as a prospective secured creditor and insulating key sources of value from other potential future creditors. Silver Point believes having appropriate loan documentation is important in protecting one’s creditor interests and preserving a lender’s equity cushion. Consequently, the structuring and documentation process is considered a key part of Silver Point’s underwriting and ultimate investment decision, rather than a perfunctory step in the process of closing a loan.
Portfolio Monitoring. Silver Point stresses the importance of portfolio monitoring, with a focus on tracking a borrower’s monthly and quarterly financial and operating reporting obligations. These responsibilities include reviewing and reporting to management of our Adviser on the financial and operating performance of portfolio companies, in addition to frequent communication with management teams. Silver Point’s investment analysts track competitors, suppliers, and key customers as well as peer activity in the capital markets, valuation multiples for relevant transactions, and pricing for relevant financings. The goal of Silver Point’s portfolio monitoring is to track actual performance relative to our original underwriting thesis on an ongoing basis and to maintain a real-time view of the credit so that we can act decisively if an amendment or modification is required.
Asset Management. Silver Point focuses on asset management as a means to protect capital. We believe the combination of intelligent underwriting decisions, properly structured loans, and early and active management of a loan in the event of potential or actual covenant breach allows us to minimize risk of loss and protect capital. Silver Point re-underwrites our risk with every loan amendment, with the investment team assessing (i) whether we would originate the loan again at the current exposure and risk levels at that point in time, and if so, (ii) where the current risks should be priced today. Silver Point’s answers to these questions will influence our willingness to extend further credit or de-risk our exposure to the economic terms we require as a part of a potential amendment. Additionally, we believe Silver Point’s due diligence process and its ability to maintain an independent view on credit risk and value is critical to informing capital preservation decisions.
Investment Committee. Silver Point has an experienced and established committee-driven investment process, with a focus on maximizing value and reducing risk. Silver Point’s investment process includes both a bottom-up credit evaluation of individual positions and a top-down view on markets and macro risk. Edward A. Mulé, our portfolio manager, has primary investment authority, with the Investment Committee providing input. In addition to Mr. Mulé, the Investment Committee includes Michael Gatto, a partner of our Adviser, Anthony DiNello, a Managing Director of our Adviser and President of the Fund, and Matt Sheahan, a Managing Director of our Adviser. When appropriate, a senior industry-focused investment analyst also participates in the Investment Committee.
Members of our Adviser’s Investment Committee will generally meet both prior to the undertaking of due diligence on a prospective investment, as well as following the completion of due diligence. Investment committee meetings are conducted in a discussion format, on the basis of a comprehensive investment memorandum prepared by the execution deal team. These memoranda will review, among other things, the merits of the investment opportunity, the primary areas of diligence conducted or to be conducted, the key risks and potential outcomes to the proposed investments in downside scenarios, multiple financial projection cases constructed by the execution deal team, our independent perspective of the borrower, and a comprehensive review of key document provisions and structural considerations and/or enhancements. The Investment Committee engages in discussion and debate on all prospective investments, as well as assessing relative value and risk-adjusted return compared to the existing portfolio and other opportunities in the market. Investment decisions require approval of the Investment Committee.
13
Table of Contents
The Investment Committee also is involved in:
| • | Determining position sizing; |
| • | Monitoring portfolio level diversity, including position, industry and asset type concentrations and diversification; |
| • | Periodic investment monitoring; |
| • | Any increase in commitment to an existing portfolio company; |
| • | Reviewing existing positions for potential disposition if appropriate; and |
| • | Approving material amendments to credit documents. |
Additionally, the Investment Committee benefits from Silver Point’s separate Markets Committee, which maintains a real-time top-down view on markets and macroeconomic risks, which are applied across all of Silver Point’s investment strategies. The Markets Committee helps the Investment Committee form a view on the stage of the current business and credit cycles and the outlook for credit risk assets. This top-down, macro view helps inform the underwriting decisions of specific industries and companies, and how Silver Point expects they will perform given the current business and credit cycles, and also helps us appropriately price the risks we are underwriting.
Formation History and the Trust Conversion
We were formed as a Delaware limited liability company under the name SPCP Group VII, LLC on July 31, 2014. On April 1, 2015, we changed our name to Silver Point Specialty Credit Fund, L.P. and converted to a Delaware limited partnership. We commenced our investment activities as a private investment fund on July 1, 2015. Effective November 15, 2021, we changed our name to Silver Point Specialty Lending Fund and converted to a statutory trust organized under the laws of the State of Maryland in preparation for our election to be treated as a BDC under the Investment Company Act. On December 30, 2021, we made an election to be treated as a BDC under the Investment Company Act. The Fund’s Trust Conversion was a change in legal form only, and there were no material changes to the Fund’s fee structures, underlying portfolio or accounting policies.
Upon the Fund’s Trust Conversion, the limited partners prior to the Trust Conversion received common shares with an aggregate net asset value equal to the aggregate net asset value of their limited partner interests on the Trust Conversion date. Based on our aggregate net asset value at November 15, 2021 of approximately $553.6 million, the Fund issued 36,907,451.43 common shares. Silver Point Specialty Credit Fund GP, LLC, the general partner prior to the Trust Conversion, received its pro rata share of the Fund, equaling 3,366.47 of the Fund’s common shares, which represented 0.01% of the common shares outstanding immediately after the Trust Conversion. Our limited partners prior to the Trust Conversion received 36,904,084.96 common shares, which represented 99.99% of our common shares outstanding immediately after the Trust Conversion. Each of our outstanding partner interests was converted into common shares having a net asset value of $15 per share, which represented 100% of the dollar amount of our aggregate net asset value with respect to the limited partner interests and 100% of the dollar amount of our aggregate net asset value with respect to the general partner interests. The shares received by the partners and any other affiliates do not provide any registration rights. The Trust Conversion was primarily a change in legal form and there were no material changes to fee structures, underlying portfolio or accounting policies as a result of the Trust Conversion.
We elected to be regulated as a BDC under the Investment Company Act on December 30, 2021. There are no material differences between the underwriting standards used to originate our existing investments and the underwriting standards implemented following our election to be treated as a BDC. After the effectiveness of our registration under the Exchange Act, we will be required to file periodic reports, proxy statements and other information with the SEC.
14
Table of Contents
As of December 31, 2022, approximately 80.1% of the fair value of our portfolio was considered Level 3. For a discussion of the significance of assets being considered Level 3 and the related risks, see Note 2 “Summary of Significant Accounting Policies” to our consolidated financial statements included in this Registration Statement.
Shareholder Agreements
We have entered into agreements with each of our Shareholders (the “Shareholder Agreements”).
Limited Life and Liquidity Event. Pursuant to the Shareholder Agreements, among other things, the Fund may make investments through June 30, 2025 (the “Investment Period”). After the end of the Investment Period, the Fund may only make (i) temporary investments; (ii) follow-on investments in existing investments; and (iii) investments (a) for which the Adviser has received internal approval prior to the end of the Investment Period, (b) which are substantially in process or under active consideration by the Adviser prior to the end of the Investment Period, or (c) as to which the Fund has entered into a definitive agreement, letter of intent, memorandum of understanding or similar document prior to the end of the Investment Period; provided, that the Fund shall not make any new investments pursuant to clauses (a) and (b) after June 30, 2026.
Additionally, the Shareholder Agreements provide that prior to the end of the Investment Period one or more of the Fund, the Adviser or any of their affiliates or third parties may provide each Shareholder who is not an affiliated person of the Fund, the Adviser or any of their affiliates the opportunity to sell for cash all of their shares of the Fund at a price not less than the then-current NAV per share (a “Liquidity Event”). If a Liquidity Event does not occur prior to the end of the Investment Period, the Fund will use its best efforts to wind down, liquidate and dissolve commencing on July 1, 2027 (which may be extended to July 1, 2028 by the Adviser); however, if a Liquidity Event occurs prior to the end of the Investment Period, the Fund shall continue to exist and make investments until the Board of Trustees or Shareholders determine to liquidate and dissolve the Fund in accordance with our Governing Documents.
Pursuant to the Shareholder Agreements, each Shareholder has agreed that, in connection with the winding down of the Fund or following a Liquidity Event, the Board of Trustees may elect in its sole discretion to (i) cause the Fund or any successor entity to cease to be regulated as a BDC under the Investment Company Act and (ii) effect a restructuring of the Fund by causing the Fund to convert to, merge with, and/or directly or indirectly transfer all or any portion of its assets to a successor entity, provided that if a Shareholder does not elect to sell of its shares in connection with the Liquidity Event, such Shareholder shall be entitled to receive equity interests in the successor entity with the same value as its shares of the Fund.
Use of Leverage
We are a party to debt financing arrangements that allow us to borrow money and lever our investment portfolio, subject to the limitations of the Investment Company Act, with the objective of increasing our yield. This is known as “leverage” and could increase or decrease returns to our Shareholders. The use of leverage involves significant risks. As a BDC, pursuant to the Investment Company Act, our total borrowings are limited so that we cannot incur additional borrowings if immediately after such borrowing, the ratio of our total assets (less total liabilities other than indebtedness represented by senior securities) to our total indebtedness represented by senior securities plus preferred shares, if any, is at or above 200%. This means that we can borrow up to $1 for every $1 of investor equity. The amount of leverage that we employ will depend on our Adviser’s and our Board of Trustees’ assessment of market conditions and other factors at the time of any proposed borrowing.
Potential Conflicts of Interest
We may have conflicts of interest arising out of the investment advisory activities and other operations of Silver Point. Silver Point, and certain of its principals, investment professionals, employees and investment
15
Table of Contents
committee members currently do, and in the future expect to, serve as investment advisers, officers, trustees or principals of entities or private funds that operate in the same or a related line of business as us and/or of private funds managed by our Adviser or its affiliates. Accordingly, these individuals expect to have obligations to investors in those entities or private funds, the fulfillment of which might not be in our best interests or the best interests of our Shareholders. In addition, we note that existing affiliated investment vehicles managed by our Adviser or its affiliates have, and those formed in the future expect to have, substantially similar and/or overlapping investment objectives with our own and, accordingly, our Adviser and/or its affiliates expect to face conflicts in allocating investment opportunities between us and such other entities. In certain circumstances, negotiated co-investments by us and Silver Point, certain of its affiliates and certain funds managed and controlled by our Adviser may be made pursuant to an exemptive order from the SEC permitting us to do so. Although Silver Point will endeavor to allocate investment opportunities in a fair and equitable manner over time, it is possible that we will not be given the opportunity to participate in investments made by other clients managed by our Adviser. We and our Adviser have received an exemptive order from the SEC that allows us greater flexibility to negotiate the terms of co-investments if our Board of Trustees determines that it would be advantageous for us to co-invest with other affiliated funds managed by our Adviser or its affiliates in a manner consistent with our investment objectives, positions, policies, strategies and restrictions as well as regulatory requirements and other pertinent factors. See “Item 1A. Risk Factors—Silver Point, its principals, investment professionals and employees and the members of its investment committee have certain conflicts of interest.”
Competition
Our primary competitors provide financing to middle-market companies and include other business development companies, commercial and investment banks, commercial financing companies, collateralized loan obligations, private funds, including hedge funds, and, to the extent they provide an alternative form of financing, private equity funds. Certain of these competitors may be substantially larger, have considerably greater financial, technical and marketing resources than we will have and offer a wider array of financial services. For example, some competitors may have a lower cost of funds and access to funding sources that are not available to us. In addition, some competitors may have higher risk tolerances or different risk assessments, which could allow them to consider a wider variety of investments and establish more relationships.
In addition, certain of our competitors are not subject to the regulatory restrictions that the Investment Company Act imposes on us as a BDC. Our investment strategy depends in part on our ability to source investment opportunities in which the participation of traditional financing sources is limited. We believe that the relationships of the senior members of our Adviser enable us to learn about, and compete effectively for, financing opportunities with attractive middle-market companies in the industries in which we seek to invest.
Summary of Risk Factors
The risk factors described below are a summary of the principal risk factors associated with an investment in us. These are not the only risks we face. You should carefully consider these risk factors, together with the risk factors set forth in Item 1A of this Registration Statement and the other reports and documents filed by us with the SEC.
Risks Related to Current Market Conditions
| • | We are subject to risks associated with general economic and market conditions. |
| • | We are subject to risks related to inflation. |
| • | Market disruptions and other geopolitical events could create market volatility that negatively impacts our business, financial condition and results of operations. |
16
Table of Contents
Risks Relating to Our Business and Structure
| • | Capital markets may experience periods of disruption and instability. Such market conditions may materially and adversely affect debt and equity capital markets in the United States and abroad, which may have a negative impact on our business and operations. |
| • | Our operation as a BDC imposes numerous constraints on us and significantly reduces our operating flexibility. In addition, if we fail to maintain our status as a BDC, we might be regulated as a registered investment company, which would subject us to additional regulatory restrictions. |
| • | We are dependent upon management personnel of our Adviser for our future success. |
| • | Our business model depends upon the development and maintenance of strong referral relationships with other asset managers and investment banking firms. |
| • | Silver Point, its principals, investment professionals and employees and the members of its investment committee have certain conflicts of interest because they manage other investment vehicles and accounts to which they have obligations and duties that may not be in our best interests. |
| • | Our financial condition and results of operations depend on our ability to manage future growth effectively. |
| • | Our ability to grow depends on our ability to raise additional capital. |
| • | Regulations governing our operation as a BDC affect our ability to, and the way in which we, raise additional capital. |
| • | We may use leverage, which may magnify the potential for gain or loss and may increase the risk of investing in us. |
| • | Substantially all of our assets are subject to security interests under our borrowings and if we default on our obligations, we may suffer adverse consequences, including the lenders foreclosing on our assets. |
| • | Any inability to renew, extend or replace the secured revolving credit facility entered into in October 2017 (the “Revolving Credit Facility”) prior to its maturity could adversely impact our liquidity and ability to find new investments or maintain distributions to our Shareholders. |
| • | Failure to refinance the 2026 Notes could have a material adverse effect on our results of operations and financial position. |
| • | In addition to regulatory restrictions that restrict our ability to raise capital, the Revolving Credit Facility contains various covenants which, if not complied with, could accelerate repayment, thereby materially and adversely affecting our liquidity, financial condition and results of operations. |
| • | We may enter into reverse repurchase agreements, which are another form of leverage. |
| • | We operate in a highly competitive market for investment opportunities. |
| • | Our Adviser will be paid a management fee even if the value of your investment declines and our Adviser’s incentive fees may create incentives for the portfolio management team to make certain kinds of investments. |
| • | Beneficial owners of our equity securities may be subject to certain regulatory requirements based on their ownership percentages. |
| • | As a regulated BDC, we are subject to regulatory risks. |
| • | We may incur significant costs as a result of registering our common shares under the Exchange Act. |
| • | Efforts to comply with Section 404 of the Sarbanes-Oxley Act will involve significant expenditures, and non-compliance with Section 404 of the Sarbanes-Oxley Act may adversely affect us. |
| • | Our Board of Trustees may change our investment objective, operating policies and strategies without prior notice or Shareholder approval. |
17
Table of Contents
| • | Changes in legal, tax and regulatory regimes could negatively impact our business, financial condition and earnings. |
| • | Changes to U.S. tariff and import/export regulations may have a negative effect on our portfolio companies and, in turn, harm us. |
| • | Our Adviser can resign on 60 days’ notice. We may not be able to find a suitable replacement within that time, resulting in a disruption in our operations that could adversely affect our financial condition, business and results of operations. |
| • | Our Adviser’s responsibilities and its liability to us are limited under our investment advisory agreement (the “Advisory Agreement”), which may lead our Adviser to act in a riskier manner on our behalf than it would when acting for its own account. |
| • | Our ability to enter into transactions with our affiliates is restricted. |
| • | Material non-public information may restrict our ability to make some investments. |
| • | The Agreement and Declaration of Trust’s anti-takeover provisions may inhibit a change of control in circumstances that could give the holders of common shares the opportunity to realize a premium over the value of common shares. |
| • | Certain investors are limited in their ability to make significant investments in us. |
| • | We may experience fluctuations in our quarterly results. |
| • | We are exposed to risks associated with changes in interest rates. |
| • | Changes relating to the phase-out of London Interbank Offer Rate (“LIBOR”) and the use of replacement rates for LIBOR may adversely affect the value of our portfolio securities. |
| • | Commodity Futures Trading Commission rulemaking may have a negative impact on us and our Adviser. |
| • | New market structure requirements applicable to derivatives could significantly increase the costs of utilizing OTC derivatives. |
| • | Proposed position aggregation requirements may restrict the swap positions that our Adviser may enter into. |
| • | We may be required to dispose of investments at an inopportune time if a Liquidity Event does not occur prior to the end of the Investment Period. |
| • | We are dependent on information systems, and systems failures could significantly disrupt our business, which may, in turn, negatively affect our liquidity, financial condition or results of operations. |
| • | Cybersecurity risks and cyber incidents may adversely affect our business by causing a disruption to our operations, a compromise or corruption of our confidential information and/or damage to our business relationships, all of which could negatively impact our business, financial condition and operating results. |
| • | Terrorist attacks, acts of war, or natural disasters may impact the businesses in which we invest, and harm our business, operating results, and financial conditions. |
| • | Uncertainty regarding the impact of the United Kingdom’s departure from the European Union could negatively impact our business, financial condition and earnings. |
Risks Relating to Our Investments
| • | Our investments are speculative and involve significant risk. |
18
Table of Contents
| • | Our portfolio companies may incur debt or issue equity securities that rank equally with, or senior to, our investments in such companies. |
| • | Investing in middle market companies involves a number of significant risks. |
| • | Our investments in sub-investment grade (also known as “junk” securities) and non-rated securities are speculative. |
| • | We may invest in U.S. government issued or guaranteed securities that involve special risks. |
| • | Investing in real estate related investments involves a number of significant risks. |
| • | Certain loan investments may be subject to the risks inherent in the ownership of real property to the extent that real property may be underlying collateral for such investments. |
| • | Our Adviser and our sourcing channels may not present us with a sufficient volume of investments. |
| • | Our due diligence investigation may not reveal or highlight all relevant facts that may be necessary or helpful in evaluating an investment opportunity. |
| • | Our portfolio securities may not have a readily available market price and, in such a case, we will value these securities at fair value as determined in good faith under procedures adopted for the Fund, which valuation is inherently subjective and may not reflect what we may actually realize for the sale of the investment. |
| • | The lack of liquidity in our investments may adversely affect our business. |
| • | Our portfolio may be focused in a limited number of portfolio companies, which will subject us to a risk of significant loss if any of these companies default on their obligations under any of their debt instruments or if there is a downturn in a particular industry. |
| • | We may not be in a position to exercise control over our portfolio companies or to prevent decisions by management of our portfolio companies that could decrease the value of our investments. |
| • | Securitization of our assets subjects us to various risks. |
| • | The application of the risk retention rules under Section 941 of the Dodd-Frank Act to CLOs may have broader effects on the CLO and loan markets in general, potentially resulting in fewer or less desirable investment opportunities for us. |
| • | Our failure to make follow-on investments in our portfolio companies could impair the value of our portfolio. |
| • | Our portfolio companies may prepay loans, which may reduce stated yields in the future if the capital returned cannot be invested in transactions with equal or greater expected yields. |
| • | Investments in equity securities, many of which are illiquid with no readily available market, involve a substantial degree of risk. |
| • | There may be circumstances in which our debt investments could be subordinated to claims of other creditors or we could be subject to lender liability claims. |
| • | We may be required to obtain various state licenses in connection with our investments, including to originate commercial loans. |
| • | Significant risks that could affect financial institutions to which we are exposed may affect our business. |
| • | Repurchase programs and bank obligations involve significant risks. |
| • | Our investments in non-traded equity may involve a high degree of business and financial risk. |
| • | By originating loans to companies that are experiencing significant financial or business difficulties, we may be exposed to distressed lending risks. |
19
Table of Contents
| • | We invest in “covenant-lite” loans, which could have reduced creditor protections. |
| • | We may be exposed to special risks associated with bankruptcy cases. |
| • | Declines in market prices and liquidity in the corporate debt markets can result in significant net unrealized depreciation of our portfolio, which in turn would reduce our net asset value (“NAV”). |
| • | Economic recessions or downturns could impair our portfolio companies and harm our operating results. |
| • | Our portfolio companies may be highly leveraged. |
| • | Our investments in non-U.S. companies may involve significant risks in addition to the risks inherent in U.S. investments. |
| • | We will be exposed to risks if we engage in hedging transactions. |
| • | There are special risks associated with derivative instruments we may enter into. |
| • | Original Issue Discount and Payment-in-kind Interest may affect our incentive fees. |
| • | We may initially invest a portion of the net proceeds of this offering primarily in high-quality short-term investments, which will generate lower rates of return than those expected from the interest generated on first and second lien senior secured loans and mezzanine debt. |
Risks Relating to Our Common Shares
| • | Investing in our common shares involves a significant degree of risk. |
| • | The common shares will not be insured or guaranteed by any person or entity. |
| • | Affiliates of Silver Point have significant influence over us, including having approximately 18% of the vote for matters that require the approval of Shareholders, which could limit your ability to influence the outcome of matters submitted to Shareholders for a vote. |
| • | Two of our current Shareholders beneficially own 31.7% of our common shares. They will be able to exert significant control over matters submitted to our Shareholders for approval. |
| • | Common shares are not registered under the securities laws of any jurisdiction and therefore are subject to restrictions on transfer under the Securities Act and any similar U.S. state or non-U.S. laws, as applicable. |
| • | No market exists for the common shares of the Company, and it is possible that none develops. |
| • | We may in the future determine to issue preferred shares, which could adversely affect the rights of holders of our common shares. |
| • | We may not be able to pay you distributions on our common shares, and our distributions to you may not grow over time. |
| • | Changes in tax laws could affect our business or an investment in our common shares. |
| • | We and our Shareholders may recognize taxable income without a corresponding receipt of cash. |
| • | An investment in the Fund may have adverse consequences for tax-exempt and Non-U.S. Shareholders. |
| • | You may be required to obtain extensions of the time to file tax returns. |
Investment Management Agreement
The Company is party to an Advisory Agreement, pursuant to which the Company pays its Adviser a fee for investment management services consisting of a management fee and an incentive fee, which costs are ultimately borne by our Shareholders.
20
Table of Contents
Subject to the overall supervision of our Board of Trustees and in accordance with the Investment Company Act, our Adviser will manage our day-to-day operations and provide investment advisory services to us. Under the terms of the Advisory Agreement, our Adviser will be responsible for the following:
| • | managing our assets in accordance with our investment objective, policies and restrictions; |
| • | determining the composition of our portfolio, the nature and timing of the changes to our portfolio and the manner of implementing such changes; |
| • | identifying, sourcing, researching evaluate and negotiating the terms of investments in, and dispositions of, portfolio securities and other instruments on our behalf; |
| • | closing and monitoring our investments; |
| • | determining the securities and other assets that we will purchase, retain or sell; |
| • | performing due diligence on prospective portfolio companies; and |
| • | providing such other investment advisory, research and related services as we may, from time to time, reasonably require for the investment of funds, including providing operating and managerial assistance to us and our portfolio companies, as required. |
The Adviser’s services under the Advisory Agreement are not exclusive, and it is free to furnish similar services to other entities, and it intends to do so, so long as its services to us are not impaired.
Pursuant to the Advisory Agreement, we will agree to pay our Adviser a fee for its investment advisory and management services consisting of two components—a base management fee (the “Management Fee”) and an incentive fee (the “Incentive Fee”). The cost of both the Management Fee and the Incentive Fee will ultimately be borne by our Shareholders.
Management Fee
The Management Fee is calculated at an annual rate of 0.75% (0.1875% per quarter) of our Shareholders’ aggregate net capital contributions. The Management Fee is payable quarterly in arrears. The Management Fee for any partial quarter will be appropriately prorated.
For the years ended December 31, 2022, 2021, and 2020, the Management Fees were $4.1 million, $3.3 million, and $3.0 million, respectively, at an annual rate of 0.75% of drawn capital commitments and, during the commitment period, 0.25% of unfunded commitments.
Incentive Fee
The Incentive Fee consists of two components that are determined independent of each other, with the result that one component may be payable even if the other is not. A portion of the Incentive Fee is based on our income (“Income Incentive Compensation”), and a portion is based on our capital gains (“Capital Gains Incentive Compensation”).
Quarterly Income Incentive Compensation. For purposes of calculating the Income Incentive Compensation, pre-incentive compensation net investment income means interest income, dividend income and any other income accrued or earned, minus operating expenses (including Management Fees, expenses payable under any advisory agreement or sub-administration agreement, and any interest expense and dividends paid on any issued and outstanding preferred shares, but excluding Incentive Fees) for the applicable period. Pre-incentive compensation net investment income includes, in the case of investments with a deferred interest feature (such as original issue discount, debt instruments with pay in kind interest and zero-coupon securities), accrued income that the Fund has not yet received in cash; there is no clawback of such amounts that are ultimately not received in cash. However, to the extent that such accruals are not received in cash and are written off, they will be treated
21
Table of Contents
as a realized capital loss for the purpose of Capital Gains Incentive Compensation discussed herein. Pre-incentive compensation net investment income does not include any realized capital gains, realized capital losses or unrealized capital appreciation or depreciation. To determine whether the pre-incentive compensation net investment income exceeds the hurdle rate, the pre-incentive compensation net investment income is expressed as a percentage rate of return on the Fund’s net assets (total assets less indebtedness).
Income Incentive Compensation will be paid to our Adviser quarterly in arrears with respect to the Fund’s pre-incentive compensation net investment income in each calendar quarter as follows:
(1) no amount in any calendar quarter in which the Fund’s pre-incentive compensation net investment income in the current calendar quarter and each of the 11 preceding calendar quarters (the “Trailing Twelve Quarters”) does not exceed the “Hurdle Rate Amount”, which is determined on a quarterly basis by multiplying 1.75% (7.00% annualized) by the value of the Fund’s net assets (total assets less indebtedness) at the beginning of each applicable calendar quarter comprising the relevant Trailing Twelve Quarters;
(2) 100% of the Fund’s pre-incentive compensation net investment income for the Trailing Twelve Quarters, if any, that exceeds the Hurdle Rate Amount but is less than or equal to an amount (the “Catch-Up Amount”) determined on a quarterly basis by multiplying 2.0588% (8.2353% annualized) and the value of the Fund’s net assets (total assets less indebtedness) at the beginning of each applicable calendar quarter comprising the relevant Trailing Twelve Quarters; and
(3) for any calendar quarter in which the Fund’s pre-incentive compensation net investment income for the Trailing Twelve Quarters exceeds the Catch-Up Amount, 15% of the amount of the Fund’s pre-incentive compensation net investment income, if any, that exceeds the Catch-Up Amount for such Trailing Twelve Quarters.
The Catch-Up Amount is intended to provide our Adviser with incentive compensation of 15% on all of the pre-incentive compensation net investment income during the relevant Trailing Twelve Quarters.
These calculations will be appropriately adjusted for any share issuances or repurchases during the quarter (based on the actual number of days elapsed relative to the total number of days in such calendar quarter) and shall be appropriately prorated for any period of less than three months.
The following is a graphical representation of the calculation of the Income Incentive Compensation assuming no Unreceived Interest Offset:
Pre-incentive compensation net investment income
(expressed as a percentage of total net assets in respect of the
applicable Trailing Twelve Quarters)
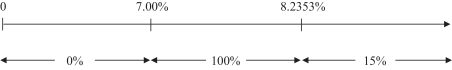
For the years ended December 31, 2022, 2021, and 2020, the Fund accrued income based incentive fees of $9.2 million, $7.2 million, and $7.4 million, respectively.
Annual Incentive Fee Based on Capital Gains. Capital Gains Incentive Compensation is calculated on an annual basis. For each Annual Period, we will pay our Adviser an Incentive Fee equal to (A) 15% of the difference, if positive, of the sum of our aggregate realized capital gains, if any, computed net of our aggregate realized capital losses, if any, and our aggregate unrealized capital depreciation, in each case from the inception of the Fund until the end of such Annual Period minus (B) the cumulative amount of Incentive Fees based on capital gains previously paid or allocated to our Adviser since the launch of the Fund (including amounts waived
22
Table of Contents
or reduced). For the avoidance of doubt, unrealized capital gains are excluded from the calculation in clause (A), above. As of December 31, 2022, the Fund has $13.6 million of gross unrealized capital gains, which amount may be higher or lower at the date of this Registration Statement.
We will accrue, but not pay, a portion of the Capital Gains Incentive Compensation with respect to net unrealized appreciation. Under GAAP, we are required to accrue any Capital Gains Incentive Compensation that includes net realized capital gains and losses and net unrealized capital appreciation and depreciation on investments held at the end of each period. In calculating the accrual for the Capital Gains Incentive Compensation, we consider the cumulative aggregate unrealized capital appreciation in the calculation, because Capital Gains Incentive Compensation would be payable if such unrealized capital appreciation were realized, even though such unrealized capital appreciation is not permitted to be considered in calculating the fee actually payable under the Advisory Agreement. This accrual is calculated using the aggregate cumulative realized capital gains and losses and aggregate cumulative unrealized capital appreciation or depreciation. If such amount is positive at the end of a period, then we record a capital gains incentive fee equal to 15% of such amount, minus the aggregate amount of actual Capital Gains Incentive Compensation paid in all prior periods. If such amount is negative, then there is no accrual for such period. There can be no assurance that such unrealized capital appreciation will be realized in the future.
For purposes of computing the Capital Gains Incentive Compensation and the Income Incentive Compensation, our Adviser will treat total return swaps or derivatives on a “look through” basis as if the Fund held the loans directly. Under this “look through” methodology, the portion of the net settlement payments received by the Fund pursuant to the total return swap which would have represented net investment income to the Fund had we held the loans or securities underlying the total return swap directly, will be treated as net investment income subject to the Income Incentive Compensation payable to our Adviser pursuant to the Advisory Agreement, rather than as realized capital gains in accordance with GAAP, and any unrealized depreciation on individual loans or securities underlying the total return swap will further reduce the Capital Gains Incentive Compensation payable to our Adviser with respect to realized gains.
For the years ended December 31, 2022, 2021, and 2020, the Fund accrued capital gains based incentive fees of $(1.4) million, $1.4 million, and $0, respectively.
The following examples have been included for illustrative purposes, including rounded numbers, only and should not be interpreted as the actual or anticipated performance of the Fund. Example 1 illustrates the calculation of the Income Incentive Compensation and Example 2 illustrates the calculation of the Capital Gains Incentive Compensation.
Example 1: Income Incentive Compensation
Alternative 1.1 — Pre-incentive compensation net investment income does not exceed hurdle:
Assumptions
Investment income* (including interest, dividends, fees, etc.) = 1.25%
Hurdle rate = 1.75%
Management fee(1) = 0.1875%
Other fund operating expenses(2) = 0.20%
Pre-incentive compensation net investment income*
(investment income – (management fee + other expenses)) = 0.8625%
23
Table of Contents
Pre-incentive compensation net investment income does not exceed hurdle rate, therefore there is no incentive compensation.
Alternative 1.2 — Pre-incentive compensation net investment income exceeds hurdle, subject to “catch-up”:
Assumptions
Investment income* (including interest, dividends, fees, etc.) = 2.25%
Hurdle rate(1) = 1.75%
Management fee(1) = 0.1875%
Other fund operating expenses(2) = 0.20%
Pre-incentive compensation net investment income*
(investment income – (management fee + other expenses)) = 1.8625%
Incentive compensation = 100% × pre-incentive compensation net investment income, subject to the “catch-up”(3)
= 100% × (1.8625% – 1.75%)
= 0.1125%
Alternative 1.3 — Pre-incentive compensation net investment income exceeds hurdle and “catch-up”:
Assumptions
Investment income* (including interest, dividends, fees, etc.) = 3.00%
Hurdle rate = 1.75%
Management fee (1) = 0.1875%
Other fund operating expenses(3) = 0.20%
Pre-incentive compensation net investment income*
(investment income – (management fee + other expenses)) = 2.6125%
Incentive compensation = 15% × pre-incentive compensation net investment income, subject to “catch-up”(3)
Incentive compensation = 100% × “catch-up” + (15% × (pre-incentive compensation net investment income – 2.0588%))
Catch-up = 2.0588% – 1.75%
= 0.3088%
Incentive compensation = (100% × 0.3088%) + (15% × (2.6125% – 2.0588%))
= 0.3088% + (15% × 0.5537%)
24
Table of Contents
= 0.3088% + 0.0831%
= 0.3919%
| (*) | The hypothetical amount of investment income and pre-incentive compensation net investment income shown is based on a percentage of total net assets. |
| (1) | Represents 0.75% annualized management fee on drawn capital. |
| (2) | Excludes financing expenses. |
| (3) | The “catch-up” provision is intended to provide our Adviser with incentive compensation of 15% on all pre-incentive compensation net investment income as if a hurdle rate did not apply when pre-incentive compensation net investment income equals or exceeds 2.0588% in any calendar quarter. |
Example 2: Capital Gains Incentive Compensation
Alternative 2.1:
Assumptions
| • | Year 1: $20 million investment made in Company A (“Investment A”), and $30 million investment made in Company B (“Investment B”) |
| • | Year 2: Investment A sold for $50 million and fair market value (“FMV”) of Investment B determined to be $30 million |
| • | Year 3: FMV of Investment B determined to be $25 million |
| • | Year 4: Investment B sold for $31 million |
The Capital Gains Incentive Compensation would be:
| • | Year 1: None |
| • | Year 2: $4.5 million |
| • | Cumulative Capital Gains of $30 million (realized gain on the sale of Investment A) multiplied by 15%, equals $4.5 million |
| • | Year 3: None |
| • | Cumulative Capital Gains of $25 million ($30 million from above less unrealized loss of $5 million on Investment B) multiplied by 15% equals $3.75 million. Since the $3.75 million is less than $4.5 million (paid in year 2), no Capital Gains Incentive Compensation is paid in Year 3. |
| • | Year 4: $150,000 |
| • | Cumulative Capital Gains of $31 million ($30 million from Year 2 plus $1 million realized gain on the sale of Investment B) multiplied by 15% equals $4.65 million. $4.65 million less $4.5 million (paid in year 2) equals $150,000 of Capital Gains Incentive Compensation paid in Year 4. |
Alternative 2.2:
Assumptions
| • | Year 1: $20 million investment made in Company A (“Investment A”), $30 million investment made in Company B (“Investment B”) and $25 million investment made in Company C (“Investment C”) |
| • | Year 2: Investment A sold for $50 million, FMV of Investment B determined to be $25 million and FMV of Investment C determined to be $25 million |
| • | Year 3: FMV of Investment B determined to be $27 million and Investment C sold for $30 million |
25
Table of Contents
| • | Year 4: FMV of Investment B determined to be $24 million |
| • | Year 5: Investment B sold for $33 million |
The capital gains incentive compensation, if any, would be:
| • | Year 1: None |
| • | Year 2: $3.75 million |
| • | Cumulative Capital Gains of $25 million ($30 million realized gain on the sale of Investment A less unrealized loss of $5 million on Investment B) multiplied by 15%, equals $3.75 million |
| • | Year 3: $1.05 million |
| • | Cumulative Capital Gains of $32 million ($30 million realized gain on the sale of Investment A plus $5 million realized gain on the sale of Investment C (“Realized Gains” totaling $35 million) less unrealized loss of $3 million on Investment B) multiplied by 15% equals $4.8 million. $4.8 million less $3.75 million equals $1.05 million. |
| • | Year 4: None |
| • | Cumulative Capital Gains of $29 million ($35 million Realized Gains from above less unrealized loss of $6.0 million on Investment B) multiplied by 15% equals $4.35 million. Since $4.35 million is less than $4.8 million ($3.75 million paid in Year 2 and $1.05 million paid in Year 3), no Capital Gains Incentive Compensation is paid in Year 4. |
| • | Year 5: 0.9 million |
| • | Cumulative Capital Gains of $38 million ($35 million Realized Gains from above plus $3 million realized gain on Investment B) multiplied by 15% equals $5.7 million. $5.7 million less $4.8 million (the sum of the $3.75 million paid in Year 2 and the $1.05 million paid in Year 3) equals $0.9 million. |
Indemnification
We have agreed to the fullest extent permitted by law to provide indemnification and the right to the advancement of expenses to each person who was or is made a party or is threatened to be made a party to or is involved (including as a witness) in any actual or threatened action, suit or proceeding, whether civil, criminal, administrative or investigative, because such person is or was a member, trustee, officer, partner, member, shareholder, controlling person, employee, agent, consultant, representative or any other person or entity affiliated with our Adviser with respect to all claims, damages, liabilities, costs and expenses resulting from acts of our Adviser in the performance of the person’s duties under the Advisory Agreement. Our obligation to provide indemnification and advancement of expenses is subject to the requirements of the Investment Company Act and Investment Company Act Release No. 11330, which, among other things, preclude indemnification for any liability (whether or not there is an adjudication of liability or the matter has been settled) arising by reason of willful misfeasance, bad faith, gross negligence, or reckless disregard of duties, and require reasonable and fair means for determining whether indemnification will be made. Despite these limitations, the rights to indemnification and advancement of expenses may lead our Adviser and its members, managers, officers, employees, agents, controlling persons and other persons and entities affiliated with our Adviser to act in a riskier manner than they would when acting for their own account.
Board Approval of the Advisory Agreement
Our Board of Trustees approved the Advisory Agreement on March 1, 2023, and our Shareholders approved the Advisory Agreement on March 31, 2023. In connection with approving the Advisory Agreement, the Board of Trustees focused on information it had received relating to, among other things: (a) the capabilities of the
26
Table of Contents
Adviser; (b) the nature, quality and extent of the advisory and other services provided to us by the Adviser; (c) comparative data with respect to advisory fees paid by other BDCs with similar investment objectives; (d) our investment performance compared to the performance of other BDCs with similar investment objectives; (e) the potential for economies of scale to be realized as our assets grow; and (f) other benefits that may accrue to the Adviser and its affiliates as a result of their relationship with us following the potential completion of this offering. Based on the information reviewed and the discussion thereof, the Board, including the Trustees who are not “interested persons” of our Adviser, Silver Point or their respective affiliates as defined in Section 2(a)(19) of the Investment Company Act (“Independent Trustees”), determined that the compensation payable to the Adviser is reasonable in relation to the services provided by the Adviser and unanimously approved the Advisory Agreement.
Duration and Termination
The Advisory Agreement will remain in full force and effect for two years initially, and will continue for periods of one year thereafter, but only so long as such continuance is specifically approved at least annually by (a) the vote of a majority of our Independent Trustees and (b) by a vote of a majority of our Board of Trustees or of a majority of our outstanding voting securities. The Advisory Agreement may, on 60 days’ written notice to the other party, be terminated in its entirety at any time without the payment of any penalty, by our Board of Trustees, by vote of a majority of our outstanding voting share, as defined in the Investment Company Act, or by our Adviser. The Advisory Agreement shall automatically terminate in the event of its assignment as defined in the Investment Company Act.
Administrative Services
Pursuant to the Advisory Agreement, our Adviser is responsible for providing various accounting and administrative services to us. These services include providing office space, equipment and office services, maintaining financial records, preparing reports to Shareholders and reports filed with the SEC, and managing the payment of expenses and the performance of administrative and professional services rendered by others.
Our Adviser is entitled to receive reimbursement equal to an amount that reimburses our Adviser for its costs and expenses and the Fund’s allocable portion of overhead incurred by our Adviser in performing its administrative obligations under the Advisory Agreement, including the Fund’s allocable portion of the compensation paid to or compensatory distributions received by the Fund’s officers (including its Chief Financial Officer, Chief Compliance Officer and Chief Legal Officer) and respective staff who provide services to the Fund, operations staff who provide services to the Fund, and any internal audit staff, to the extent internal audit performs a role in the Fund’s Sarbanes-Oxley Act internal control assessment.
The terms of any administration agreement that we may enter with any subsequent administrator may differ materially from the terms of the administrative services provisions in our Advisory Agreement as in effect prior to such retention, including, without limitation, providing for a fee structure that results in us, directly or indirectly, bearing higher fees for similar services and other terms that are potentially less advantageous to us. Our Shareholders will not be entitled to receive prior notice of the engagement of an alternate administrator or of the terms of any agreement that is entered into with such administrator.
Sub-Administration Agreement
On November 15, 2021, our Adviser entered into a new Master Servicing Agreement (the “Sub-Administration Agreement”) with U.S. Bancorp Fund Services, LLC (the “Sub-Administrator”) for certain administrative and professional services for which our Adviser is primarily responsible under the Advisory Agreement. Prior to November 15, 2021, we were also contracted with U.S. Bancorp Fund Services to act as the Private Fund administrator. For the years ended December 31, 2022, 2021 and 2020, the Adviser incurred expenses of approximately $1.9 million, $0.4 million and $0.4 million, respectively, under the Administration and Sub-Administration Agreement.
27
Table of Contents
Our Adviser is not obligated to retain the Sub-Administrator as a sub-administrator. The Sub-Administration Agreement may be terminated by either party without penalty upon 180 days’ written notice to the other party.
Custodian
U.S. Bank National Association (the “Custodian”) provides custodian services to the Fund pursuant to a custodian services agreement. For the services provided to the Fund by the Custodian, the Custodian is entitled to fees as agreed upon from time to time. The address of the Custodian is 8 Greenway Plaza, Suite 1100, Houston, Texas.
Regulation
The Fund has filed an election to be regulated as a BDC under the Investment Company Act. The Investment Company Act contains prohibitions and restrictions relating to transactions between BDCs and their affiliates (including any investment advisers or co-advisers), principal underwriters and affiliates of those affiliates or underwriters and requires that a majority of the Trustees be persons other than “interested persons,” as that term is defined in the Investment Company Act. In addition, the Investment Company Act provides that the Fund may not change the nature of the Fund’s business so as to cease to be, or to withdraw the Fund’s election as, a BDC unless approved by a majority of the Fund’s outstanding voting securities, which is defined in the Investment Company Act as the lesser of (i) 67% or more of the voting securities present at such meeting, if the holders of more than 50% of the outstanding voting securities of such company are present or represented by proxy or (ii) of more than 50% of the outstanding voting securities of such company.
The Fund may invest up to 100% of its assets in securities acquired directly from issuers in privately negotiated transactions. With respect to such securities, the Fund may, for the purpose of public resale, be deemed an “underwriter” as that term is defined in the Securities Act.
The Fund may acquire securities issued by other investment companies in accordance with the limits of the Investment Company Act and the rules and regulations promulgated thereunder. The Fund generally may acquire up to 3% of the voting shares of any investment company, may invest in up to 5% of the value of its total assets in the securities of one investment company and may invest up to 10% of the value of its total assets in the securities of more than one investment company. Subject to certain exemptive rules, including Rule 12d1-4, the Fund may, subject to certain conditions, invest in other investment companies in excess of such thresholds. With regard to that portion of the Fund’s portfolio invested in securities issued by investment companies, it should be noted that such investments might indirectly subject Shareholders to additional expenses as they will indirectly be responsible for the costs and expenses of such companies. None of the Fund’s investment policies are fundamental and any may be changed without Shareholder approval.
Qualifying Assets
Under the Investment Company Act, a BDC may not acquire any asset other than assets of the type listed in section 55(a) of the Investment Company Act, which are referred to as qualifying assets, unless, at the time the acquisition is made, qualifying assets represent at least 70% of the company’s total assets. The principal categories of qualifying assets relevant to the Fund’s proposed business are the following:
| • | Securities purchased in transactions not involving any public offering from the issuer of such securities, which issuer (subject to certain limited exceptions) is an eligible portfolio company, or from any person who is, or has been during the preceding 13 months, an affiliated person of an eligible portfolio company, or from any other person, subject to such rules as may be prescribed by the SEC. An eligible portfolio company is defined in the Investment Company Act as any issuer which: |
| • | is organized under the laws of, and has its principal place of business in, the United States; |
28
Table of Contents
| • | is not an investment company (other than a small business investment company wholly owned by the BDC) or a company that would be an investment company but for certain exclusions under the Investment Company Act; and |
| • | satisfies any of the following: |
| • | has a market capitalization of less than $250.0 million or does not have any class of securities listed on a national securities exchange; |
| • | is controlled by a BDC or a group of companies including a BDC, the BDC actually exercises a controlling influence over the management or policies of the eligible portfolio company, and, as a result thereof, the BDC has an affiliated person who is a trustee of the eligible portfolio company; or |
| • | is a small and solvent company having total assets of not more than $4 million and capital and surplus of not less than $2 million. |
| • | Securities of any eligible portfolio company which the Fund controls. |
| • | Securities purchased in a private transaction from a U.S. issuer that is not an investment company or from an affiliated person of the issuer, or in transactions incident thereto, if the issuer is in bankruptcy and subject to reorganization or if the issuer, immediately prior to the purchase of its securities was unable to meet its obligations as they came due without material assistance other than conventional lending or financing arrangements. |
| • | Securities of an eligible portfolio company purchased from any person in a private transaction if there is no ready market for such securities and the Fund already owns 60% of the outstanding equity of the eligible portfolio company. |
| • | Securities received in exchange for or distributed on or with respect to securities described above, or pursuant to the exercise of options, warrants or rights relating to such securities. |
| • | Cash, cash equivalents, U.S. government securities or high-quality debt securities maturing in one year or less from the time of investment. |
Temporary Investments
As a BDC, pending investment in other types of “qualifying assets,” as described above, our investments may consist of cash, cash items, U.S. government securities or high-quality debt securities maturing in one year or less from the time of investment, which we refer to, collectively, as temporary investments, so that 70% of our assets are qualifying assets. Typically, we will invest in U.S. Treasury bills or in repurchase agreements, provided that such agreements are fully collateralized by cash or securities issued by the U.S. government or its agencies. A repurchase agreement involves the purchase by an investor, such as us, of a specified security and the simultaneous agreement by the seller to repurchase it at an agreed-upon future date and at a price which is greater than the purchase price by an amount that reflects an agreed-upon interest rate. There is no percentage restriction on the proportion of our assets that may be invested in such repurchase agreements. Our Adviser will monitor the creditworthiness of the counterparties with which we enter into repurchase agreement transactions.
Managerial Assistance to Portfolio Companies
As a BDC, other than CLOs, we must limit our investments in any types of entities that rely on the exceptions set forth in Section 3(c)(1) or Section 3(c)(7) of the Investment Company Act (including, but not limited to, hedge funds and private equity funds) to no more than 15% of our net assets. Since formation, in excess of 70% of the Fund’s assets were “qualifying assets” under Section 55(a) of the Investment Company Act. As of December 31, 2022, the fair value of the Fund’s total assets was comprised of approximately 81.6% of “qualifying assets”.
29
Table of Contents
A BDC must be organized and have its principal place of business in the United States and must be operated for the purpose of making investments in the types of securities described in (1), (2) or (3) above under “Qualifying Assets.” However, in order to count portfolio securities as qualifying assets for the purpose of the 70% test, the BDC must also either control the issuer of the securities or offer to make available to the issuer of the securities (other than small and solvent companies described above) significant managerial assistance; except that, where the BDC purchases such securities in conjunction with one or more other persons acting together, one of the other persons in the group may make available such managerial assistance (as long as the BDC does not make available significant managerial assistance solely in this fashion). Making available significant managerial assistance means, among other things, any arrangement whereby the BDC, through its trustees, officers or employees, offers to provide, and, if accepted, does so provide, significant guidance and counsel concerning the management, operations or business objectives and policies of a portfolio company.
Brokerage Allocations and other Practices
Any use of brokers will be subject to policies established by our Board of Trustees. Our Adviser will be primarily responsible for the execution of the publicly traded securities portion of our portfolio transactions and the allocation of brokerage commissions.
All orders for the purchase or sale of portfolio securities will be placed by our Adviser. Our Adviser will also be responsible for the placement of transaction orders for other accounts for which it acts as investment advisor. In selecting broker-dealers, our Adviser will, subject to applicable legal limitations, consider various relevant factors, including, but not limited to, all or any of the following: overall cost of the transaction; the size and type of the transaction; the nature of the market for the financial instrument; execution capability, speed and efficiency; market intelligence regarding the transaction; the extent to which the broker-dealer makes a market in the financial instrument involved or has access to such markets; the broker-dealer’s financial stability; the broker-dealer’s reputation for diligence, fairness and integrity; quality of service rendered by the broker-dealer in other transactions for our Adviser; confidentiality considerations; the quality and usefulness of research services and investment ideas presented by the broker-dealer; the broker-dealer’s willingness to correct errors; the broker-dealer’s ability to accommodate any special execution or order handling requirements in connection with any particular transaction; and other factors deemed appropriate by our Adviser. Commissions for non-U.S. investments traded on non-U.S. exchanges generally will be higher than for U.S. investments and may not be subject to negotiation. Our Adviser need not solicit competitive bids and does not have an obligation to seek the lowest available commission cost or spread.
Accordingly, if our Adviser concludes that the commissions charged by a broker or the spreads applied by a dealer are reasonable in relation to the overall quality of services rendered by such broker or dealer (including, without limitation, the value of the brokerage and research products or services provided by such broker or dealer), we may pay commissions to or be subject to spreads applied by such broker-dealer in an amount greater than the amount another broker-dealer might charge or apply. At times, our Adviser may select a broker to execute a transaction and request that the executing broker “step-out” of a portion of the transaction (and, thus, a portion of the commission) to another broker (a “Step-Out Transaction”) in such circumstances where our Adviser makes a good faith determination that the Step-Out Transaction is reasonable in relation to the value of the services provided (including research services) viewed in terms of either that particular transaction or our Adviser’s overall responsibilities with respect to all of its accounts.
Although our Adviser does not have any formal “soft dollar” arrangements, from time to time our Adviser may pay a broker-dealer commissions (or markups or markdowns with respect to certain types of riskless principal transactions) for effecting our transactions in excess of those which another broker-dealer might have charged for effecting the transaction in recognition of the value of the brokerage and research services provided by the broker-dealer. The use of “soft dollars”, if any, generated by us to pay for research and research-related products or services will fall within the safe harbor created by Section 28(e) of the Exchange Act and will be subject to prevailing interpretations of Section 28(e) by the SEC. Under Section 28(e), research obtained with
30
Table of Contents
soft dollars generated by us, if any, may be used by our Adviser to service other accounts, including accounts that may not have paid for the soft dollar benefits. Our Adviser does not seek to allocate soft dollar benefits, if any, to accounts in proportion to the soft dollar credits such accounts generate. Where a product or service provides both research and non-research assistance to us, our Adviser will make a reasonable allocation of the cost that may be paid for with soft dollars. Research-related products and services may be paid for either with soft dollars or directly by us.
Our Adviser reviews, on at least a quarterly basis, its order execution practices, the quality of brokerage services (including research) and the costs associated with such services. In no case will our Adviser make binding commitments as to the level of brokerage commissions it will allocate to a broker-dealer, nor will it commit to pay cash if any informal targets are not met. A broker is not excluded from receiving business because it has not been identified as providing brokerage or research products or services.
Our Adviser may open “average price” accounts with brokers. In an “average price” account, purchase and sale orders placed during a trading day on our behalf, the Silver Point Accounts or affiliates of our Adviser are combined, and securities bought and sold pursuant to such orders are allocated among such accounts on an average price basis.
Our transactions may generate brokerage commissions and other compensation, which we, not our Adviser, will be obligated to pay. Our Adviser has complete discretion in deciding what brokers and dealers we will use and in negotiating the rates of compensation we will pay. In addition to using brokers as agents and paying commissions, we may buy or sell securities directly from or to dealers acting as principals at prices that include markups or markdowns, and may buy securities from underwriters or dealers in public offerings at prices that include compensation to the underwriters and dealers.
From time to time, our Adviser may execute over-the-counter trades on an agency basis rather than on a principal basis. In these situations, the broker used by our Adviser may acquire or dispose of a security through a market-maker (a practice known as “interpositioning”). The transaction may thus be subject to both a commission and a markup or markdown. Our Adviser believes that the use of a broker in such instances is consistent with its duty of obtaining best execution for us. The use of a broker can provide anonymity in connection with a transaction. In addition, a broker may, in certain cases, have greater expertise or greater capability in connection with both accessing the market and executing a transaction.
Indebtedness and Senior Securities
Under Section 61(a) of the Investment Company Act, the Fund is generally not permitted to issue senior securities unless after giving effect thereto the Fund met a coverage ratio of total assets, less liabilities and indebtedness not represented by senior securities, to total senior securities, which includes all borrowings of the Fund, of at least 200%.
Codes of Ethics
We and our Adviser have adopted a code of ethics pursuant to Rule 17j-1 under the Investment Company Act and Rule 204A-1 under the Investment Advisers Act of 1940. This code of ethics establishes, among other things, procedures for personal investments and restricts certain personal securities transactions, including transactions in securities that are held by us. Personnel subject to the code may invest in securities for their personal investment accounts, so long as such investments are made in accordance with the code’s requirements.
Proxy Voting Policies and Procedures
The Fund has delegated proxy voting responsibility to the Adviser. A summary of the Proxy Voting Policies and Procedures of the Adviser is set forth below. The guidelines are reviewed periodically by the Adviser and the Fund’s Independent Trustees, and, accordingly, are subject to change.
31
Table of Contents
The Adviser is registered under the Advisers Act and has a fiduciary duty to act solely in the best interests of its clients. As part of this duty, it recognizes that it must vote securities held by its clients in a timely manner free of conflicts of interest. These policies and procedures for voting proxies for investment advisory clients are intended to comply with Section 206 of, and Rule 206(4)-6 under, the Advisers Act.
The Adviser votes proxies relating to the Fund’s portfolio securities in the best interest of Shareholders. The Adviser reviews on a case-by-case basis each proposal submitted for a proxy vote to determine its impact on the Fund’s investments. Although it generally votes against proposals that may have a negative impact on the Fund’s investments, it may vote for such a proposal if there are compelling long-term reasons to do so.
You may obtain information about how the Fund voted proxies by making a written request for proxy voting information to the Fund, Two Greenwich Plaza, First Floor, Greenwich, Connecticut 06830, Attention: Investor Relations.
Other
The Fund may also be prohibited under the Investment Company Act from knowingly participating in certain transactions with the Fund’s affiliates without the prior approval of the Board of Trustees who are not interested persons and, in some cases, prior approval by the SEC.
The Fund is subject to periodic examination by the SEC for compliance with the Investment Company Act.
The Fund is required to provide and maintain a bond issued by a reputable fidelity insurance company to protect the Fund against larceny and embezzlement. Furthermore, as a BDC, the Fund is prohibited from protecting any trustee or officer, investment adviser or underwriter against any liability to the Fund or Shareholders arising from willful misfeasance, bad faith, gross negligence or reckless disregard of the duties involved in the conduct of such person’s office.
The Fund and our Adviser are required to adopt and implement written policies and procedures reasonably designed to prevent violation of relevant federal securities laws, review these policies and procedures annually for their adequacy and the effectiveness of their implementation, and designate a chief compliance officer to be responsible for administering these policies and procedures.
Compliance with the Sarbanes-Oxley Act
The Sarbanes-Oxley Act of 2002 imposes a wide variety of regulatory requirements on publicly-held companies and their insiders. While certain of these requirements are not applicable to the Fund (see “—Compliance with the JOBS Act”), many of these requirements affect the Fund. For example:
| • | Pursuant to Rule 13a-14 of the 1934 Act, the Fund’s Chief Executive Officer and Chief Financial Officer must certify the accuracy of the financial statements contained in the Fund’s periodic reports; |
| • | Pursuant to Item 307 of Regulation S-K, the Fund’s periodic reports must disclose the Fund’s conclusions about the effectiveness of disclosure controls and procedures; |
| • | Pursuant to Rule 13a-15 of the 1934 Act, Fund management must prepare a report regarding its assessment of internal control over financial reporting (with the exception of the Fund’s first annual filing); and |
| • | Pursuant to Item 308 of Regulation S-K and Rule 13a-15 of the 1934 Act, the Fund’s periodic reports must disclose whether there were significant changes in internal controls or in other factors that could significantly affect these controls subsequent to the date of their evaluation, including any corrective actions with regard to significant deficiencies and material weaknesses. |
32
Table of Contents
The Sarbanes-Oxley Act requires the Fund to review its current policies and procedures to determine whether the Fund complies with the Sarbanes-Oxley Act and the regulations promulgated thereunder. The Fund will continue to monitor compliance with all regulations that are adopted under the Sarbanes-Oxley Act and will take actions necessary to ensure that the Fund is in compliance therewith.
Compliance with the JOBS Act
The Fund currently is and expects to remain an “emerging growth company,” as defined in the Jumpstart Our Business Startups Act (the “JOBS Act”), until the earliest of:
| • | The last day of the Fund’s fiscal year in which the fifth anniversary of an initial public offering of common shares occurs; |
| • | The end of the fiscal year in which the Fund’s total annual gross revenues first exceed $1.235 billion; |
| • | The date on which the Fund has, during the prior three-year period, issued more than $1.0 billion in non-convertible debt securities; and |
| • | The last day of a fiscal year in which the Fund (1) has an aggregate worldwide market value of common shares held by non-affiliates of $700 million or more, computed at the end of each fiscal year as of the last business day of the Fund’s most recently completed second fiscal quarter and (2) has been an Exchange Act reporting company for at least one year (and filed at least one annual report under the Exchange Act). |
Under the JOBS Act and the Dodd-Frank Act, the Fund is exempt from the provisions of Section 404(b) of the Sarbanes-Oxley Act, which would require that the Fund’s independent registered public accounting firm provide an attestation report on the effectiveness of internal control over financial reporting, until such time as the Fund ceases to be an emerging growth company and becomes an accelerated filer as defined in Rule 12b-2 under the Exchange Act. This may increase the risk that material weaknesses or other deficiencies in the Fund’s internal control over financial reporting go undetected. See “Item 1A. Risk Factors—Risks Relating to Our Business and Structure—Efforts to comply with Section 404 of the Sarbanes-Oxley Act will involve significant expenditures, and non-compliance with Section 404 of the Sarbanes-Oxley Act may adversely affect us and the market price of our common shares.”
Under the JOBS Act, emerging growth companies can delay adopting new or revised accounting standards until such time as those standards apply to private companies. The Fund has made an election to take advantage of this exemption from new or revised accounting standards. The Fund therefore is not subject to the same new or revised accounting standards as other public companies that are not emerging growth companies.
Reporting Obligations
Subsequent to the effectiveness of this Registration Statement, the Company will be required to file annual reports, quarterly reports and current reports with the SEC. This information will be available at the SEC’s public reference room at 100 F Street, N.E., Washington, D.C. 20549 and on the SEC’s website at www.sec.gov. Information on the operation of the SEC’s public reference room may be obtained by calling the SEC at (202) 551-8090 or (800) SEC-0330.
CERTAIN U.S. FEDERAL INCOME TAX CONSIDERATIONS
The following is a summary of certain U.S. federal income tax consequences to Shareholders of the Fund. The discussion is based upon the Internal Revenue Code of 1986, as amended (the “Code”), Treasury Regulations, judicial authorities, published positions of the Internal Revenue Service (the “IRS”) and other applicable authorities, all as in effect on the date hereof and all of which are subject to change or differing
33
Table of Contents
interpretations (possibly with retroactive effect). The discussion does not address all of the tax consequences that may be relevant to a particular Shareholder or to Shareholders subject to special treatment under U.S. federal income tax laws (including Shareholders subject to the alternative minimum tax, insurance companies, dealers in securities, pension plans and trusts, financial institutions, U.S. Shareholders whose functional currency is not the U.S. dollar, regulated investment companies, real estate investment trusts, partnerships or other pass-through entities and their owners, and, except as expressly set forth below, non-U.S. and tax-exempt Shareholders). This discussion is limited to Shareholders who hold their common shares as capital assets. No ruling has been or will be sought from the IRS regarding any matter discussed herein. Counsel to the Fund has not rendered any legal opinion regarding any tax consequences relating to the Fund or an investment in the Fund. No assurance can be given that the IRS would not assert, or that a court would not sustain, a position contrary to any of the tax aspects set forth below. Shareholders are strongly advised to consult their tax advisors as to the U.S. federal income tax consequences of acquiring, holding and disposing of common shares of the Fund, as well as the effects of state, local and non-U.S. tax laws.
For purposes of the following discussion, a “U.S. Shareholder” is a Shareholder who, for U.S. federal income tax purposes, is (i) a citizen or resident of the United States, (ii) a corporation created or organized under the laws of the United States or any state thereof, (iii) an estate, the income of which is subject to U.S. federal income taxation regardless of its source or (iv) a trust (a) the administration over which a U.S. court can exercise primary supervision and all of the substantial decisions of which one or more U.S. persons have the authority to control or (b) that has a valid election in effect to be treated as a U.S. person. A “non-U.S. Shareholder” is Shareholder that for U.S. income tax purposes is neither a partnership nor a U.S. Shareholder. The tax treatment of a partner in a partnership (including an entity or arrangement treated as a partnership for U.S. federal income tax purposes) that is a Shareholder generally depends on the status of the partner and the activities of the partnership, and is not specifically addressed herein. A “tax-exempt Shareholder” is a U.S. Shareholder that is generally exempt from U.S. federal income tax on certain types of income, such as a qualified pension or profit sharing plan exempt under Section 501(a) of the Code.
Tax Status of the Fund. Unlike most BDCs (which are treated as “regulated investment companies” (“RICs”) for U.S. federal income tax purposes), the Fund expects to be treated as a partnership and not as a “publicly traded partnership” taxable as a corporation for U.S. federal income tax purposes under Section 7704 of the Code. In order not to be so treated as a “publicly traded partnership”, interests in the Fund must not be treated as traded on an established securities market or secondary market or the substantial equivalent thereof. In order to comply with this requirement, the common shares are subject to significant limitations on transfer. However, no assurance can be given that the Fund will not be treated a “publicly traded partnership” taxable as a corporation. If the Fund were so treated, material adverse consequences for the Shareholders would result and the consequences discussed herein would be significantly different. In addition, although the Fund currently has no plan to, the Fund could choose to convert to a RIC in the future, in which case the consequences to Shareholders would also differ from those discussed herein. The remainder of this discussion assumes the Fund will be treated as a partnership that is not a “publicly traded partnership” or a RIC for U.S. federal income tax purposes. As discussed in more detail below, the Fund’s treatment as a partnership could cause adverse consequences for certain Shareholders, including non-U.S. Shareholders and tax-exempt Shareholders.
Taxation of Shareholders. By reason of its treatment as a partnership for U.S. federal income tax purposes, the Fund itself will generally not be subject to U.S. federal income tax. Rather, each Shareholder in computing its U.S. federal income tax will include its allocable share of Fund items of income, gain, loss, deduction and expense for the taxable year of the Fund ending within or with the taxable year of the Shareholder, regardless of whether such Shareholder has received any distributions from the Fund. The Fund may derive taxable income from an investment that is not matched by a corresponding receipt of cash or may make cash expenditures for which deductions are not allowed. Accordingly, it is possible that a Shareholder’s U.S. federal income tax liability with respect to its allocable share of the Fund earnings in a particular taxable year could exceed the cash distributions to the Shareholder for the year, thus requiring an out-of-pocket payment by the Shareholder.
34
Table of Contents
For U.S. federal income tax purposes, a Shareholder’s allocable share of Fund items of income, gain, loss, deduction and expense will be determined by the provisions of the Agreement and Declaration of Trust of the Fund (the “Declaration of Trust”) if such allocations are in accordance with Section 704 of the Code and the Treasury Regulations thereunder. No assurances can be made in this regard. If the IRS successfully challenged the Fund’s allocations of income, gain, loss, deduction and expense, the redetermination of the allocations to a particular Shareholder may be less favorable than the allocations set forth in the Declaration of Trust.
Nature of Fund Investments. Certain of the Fund’s investments are subject to special and complex U.S. federal income tax provisions that may, among other things, (i) disallow, suspend or otherwise limit the allowance of certain losses or deductions, (ii) convert lower taxed long-term capital gain or “qualified dividend income” into higher taxed short-term capital gain or ordinary income, (iii) convert an ordinary loss or a deduction into a capital loss (the deductibility of which is more limited), (iv) cause the Fund to recognize income or gain without a corresponding receipt of cash, (v) adversely affect the timing as to when a purchase or sale of stock or securities is deemed to occur and (vi) adversely alter the characterization of certain complex financial transactions.
Tax Basis Rules. Fund distributions generally will not be taxable to a Shareholder to the extent of such Shareholder’s adjusted tax basis in its common shares. In addition, a Shareholder is allowed to deduct its allocable share of Fund losses (if any) only to the extent of such Shareholder’s adjusted tax basis in its shares at the end of the taxable year in which the losses occur. A Shareholder’s adjusted tax basis is equal to its aggregate capital contributions to the Fund as adjusted by certain items. Basis is generally increased by the Shareholder’s allocable share of Fund profits (and items of income and gain) and Fund nonrecourse borrowings (as defined for U.S. federal income tax purposes), if any. Basis is generally decreased by the Shareholder’s allocable share of Fund losses (and items of loss, deduction and expense), the amount of cash distributed by the Fund to the Shareholder, the Fund’s tax basis of property (other than cash) distributed by the Fund to the Shareholder and any reduction in the Shareholder’s allocable share of Fund nonrecourse borrowings (as defined for U.S. federal income tax purposes), if any.
To the extent that a Shareholder’s allocable share of Fund losses are not allowed because the Shareholder has insufficient adjusted tax basis in its shares, such disallowed losses may be carried over by the Shareholder to subsequent taxable years and will be allowed if and to the extent of the Shareholder’s adjusted tax basis in subsequent years.
Loss Limitations. In addition to the basis limitation noted above, various other limitations may prevent a Shareholder from deducting certain Fund losses. These include the “at risk” rules, the “passive activity loss” rules, the limitations on the deductibility of investment interest, the Section 163(j) limitation on deductions of business interest expense, and the limitation on the deduction of “excess business losses.” Miscellaneous itemized deductions (which may include management fees paid by the Fund) are not deductible for taxable years that begin before January 1, 2026, and thereafter generally (i) will be deductible only the extent that they exceed 2% of the adjusted gross income of the taxpayer, (ii) will not be deductible for purposes of the alternative minimum tax, and (iii) will be subject to the overall limitation on itemized deductions under Section 68 of the Code. Moreover, for taxable years beginning before January 1, 2026, individuals are generally not entitled to a U.S. federal income tax deduction for state and local taxes in excess of $10,000. In addition, capital losses are deductible only to the extent of capital gains (subject to an exception for individuals under which a limited amount of capital losses may be offset against ordinary income).
Prospective investors are advised to consult their tax advisors regarding the potential application of these and other limitations in connection with an investment in the Fund.
Investments in Non-U.S. Corporations. The Fund could invest in non-U.S. corporations that are classified as passive foreign investment companies and/or controlled foreign corporations (“CFCs”) (each as defined for U.S. federal income tax purposes). For U.S. federal income tax purposes, these investments may, among other things,
35
Table of Contents
cause the Fund, and thus Shareholders, to recognize taxable income without a corresponding receipt of cash, to incur an interest charge on taxable income that is deemed to have been deferred and/or to recognize ordinary income that would have otherwise been treated as capital gains.
Non-U.S. Taxes. Certain dividends, interest and other income received by the Fund from sources outside of the United States may be subject to withholding taxes imposed by other countries. The Fund may also be subject to capital gains taxes in certain other countries where it purchases and sells stocks and securities. Tax treaties between the United States and other countries may affect, reduce or eliminate such taxes. There may, however, be limitations on the ability of the Fund and the Shareholders to claim the benefits of such treaties.
Medicare Tax. Shareholders who are individuals, estates or trusts and whose income exceeds certain thresholds will be required to pay a 3.8% Medicare tax on all or a portion of their “net investment income,” which may include all or a portion of any investment income allocated to them from the Fund. The application of these rules to gain recognized on the disposition of an interest in a partnership such as the Fund are complex and in many respects uncertain. Shareholders are urged to consult their tax advisors regarding the applicability and calculation of the 3.8% Medicare tax to any gain or income recognized by them with respect to the Fund.
Distributions; Sales of Shares. Cash distributions by the Fund with respect to common shares or in redemption of less than all of a Shareholder’s common shares generally will not be taxable to such Shareholder to the extent of its basis in its shares. Instead, such distributions will reduce, but not below zero, the adjusted tax basis in all of the Shares held by such Shareholder immediately before the distribution. If such distributions by the Fund exceed the Shareholder’s adjusted tax basis in its shares, the excess will be taxable to it as though it were a gain from a sale or exchange of the shares.
A Shareholder who sells its shares (including in redemption for cash of all of the Shareholder’ shares) will recognize gain or loss measured by the difference between the amount realized on the sale and the Shareholder’s adjusted tax basis in the shares sold (as described above). Such gain or loss generally will be long-term capital gain or loss if the Shareholder held the sold shares for more than one year (except as otherwise provided by Section 751 of the Code discussed below). The amount realized will include the Shareholder’s allocable share of Fund nonrecourse borrowings (as defined for U.S. federal income tax purposes), if any, as well as any proceeds from the sale.
Gains recognized upon cash distributions, redemptions or sales may be treated as ordinary income, taxable at ordinary income tax rates, to the extent that the cash proceeds are attributable to the Shareholder’s allocable share of the Fund’s “unrealized receivables” or “substantially appreciated inventory,” each defined in Section 751 of the Code.
Qualified Dividends and Certain Capital Gains. Reduced U.S. federal income tax rates apply to (a) long-term capital gains received by individuals and (b) “qualified dividend income” received by individuals from certain domestic and foreign corporations. The reduced rates applicable to capital gains will also apply to capital gains recognized by Shareholders who sell shares that they have held for more than one year (except as otherwise provided by Section 751 of the Code, as discussed above).
Reports to Shareholders. The Fund may not deliver Schedules K-1 to Shareholders prior to April 15 of each year. Accordingly, Shareholders will likely be required to obtain extensions for filing their federal, state and local income tax returns each year.
Tax Audits. As part of legislation adopted in 2015, which is effective for the Fund’s taxable years beginning after December 31, 2017 (the “New Partnership Audit Provisions”), among other changes (i) any audit adjustment to items of income, gain, loss, deduction or credit of the Fund (and any partner’s distributive share thereof) shall be determined, any tax attributable thereto shall be assessed and collected, and the applicability of any penalty, addition to tax, or additional amount which relates to an adjustment to any such item or share shall
36
Table of Contents
be determined, at the Fund level, and (ii) the prior role of the “tax matters partner” is repealed and instead the Fund will designate an individual through which it acts on behalf of the “partnership representative” who will be the only person permitted to act for the Fund in audit (or ensuing litigation) matters. It is possible the New Partnership Audit Provisions could result in the Fund being required to pay additional taxes, interest and possibly penalties and additions to tax, which, if assessed, could adversely affect the Fund’s value and its ability to make distributions. Such liabilities could, potentially, be attributed to tax years prior to a partner joining the Fund.
At the option of the Board, any taxes paid by the Fund pursuant to the New Partnership Audit Provisions may be apportioned to a Shareholder (as determined by the Board in its discretion) and may (i) be required to be paid by the Shareholder to the Fund or (ii) be withheld from distributions to the Shareholder. Prospective investors are urged to consult their tax advisors in respect of these changes and their potential impact.
Reportable Transactions and Certain Tax Filing Requirements. Treasury Regulations require that certain taxpayers participating in a “reportable transaction” must disclose such participation to the IRS. The scope and application of these rules is not completely clear. An investment in the Fund may be considered participation in a “reportable transaction” if, for example, the Fund recognizes certain significant losses in the future or in other circumstances. If an investment in the Fund constitutes participation in a “reportable transaction”, the Fund and the Shareholders may be required to file IRS Form 8886 with the IRS. In addition, the Fund and its advisors may be required to maintain a list of the Shareholders and to furnish this list and certain other information to the IRS upon its written request. Prospective investors are urged to consult their tax advisors regarding the applicability of these rules to an investment in the Fund.
Certain Considerations for Tax-Exempt Shareholders. A Shareholder that is a tax-exempt organization for U.S. federal income tax purposes and, therefore, generally exempt from U.S. federal income taxation may nevertheless be subject to tax on “unrelated business taxable income” (“UBTI”) to the extent, if any, that its allocable share of the Fund’s income consists of UBTI. A tax-exempt partner of a partnership that engages in a trade or business that is unrelated to the exempt function of the tax-exempt partner must compute its UBTI based on, among other things, its pro rata share (whether or not distributed) of such partnership’s gross income derived from such unrelated trade or business. Moreover, a tax-exempt partner of a partnership could be treated as earning UBTI to the extent such partnership derives income from “debt-financed property.” Debt-financed property means property held to produce income with respect to which there is “acquisition indebtedness” (generally indebtedness incurred in acquiring or holding property). A tax-exempt Shareholder that is subject to tax on its UBTI will be required to segregate its taxable income and loss for each unrelated trade or business activity for purposes of determining its UBTI.
The Fund expects to generate income that is treated as UBTI for U.S. federal income tax purposes as a result of directly or indirectly incurring leverage in a manner that generates income from “debt-financed property.” In addition, it is possible that certain income of the Fund could be treated as UBTI as a result of the Fund directly or indirectly engaging in a “trade or business.” An investment in the Fund thus may result in adverse tax consequences for a tax-exempt Shareholder. Tax-exempt Shareholders are urged to consult their own tax advisors regarding the tax consequences to them of an investment in the Fund.
Certain Considerations for Non-U.S. Shareholders. Non-U.S. Shareholders may be subject to adverse tax consequences with respect to an investment in the Fund, including those consequences described below.
The Fund is expected to engage in activities that will cause it (and thus each non-U.S. Shareholder) to be treated as engaged in a “U.S. trade or business” for U.S. federal income tax purposes. In that event, each non-U.S. Shareholder generally would be required to file a U.S. federal income tax return reporting its allocable share of the Fund’s income or loss that is treated as “effectively connected” with such trade or business and would be required to pay U.S. federal income tax at regular U.S. tax rates on that income. In addition, the Fund would generally be required to withhold at the highest applicable tax rate on effectively connected income allocable to a non-U.S. Shareholder, which withholding would be creditable against the non-U.S. Shareholder’s
37
Table of Contents
tax liability, provided that the appropriate information is provided to the IRS. Moreover, a portion of any gain or loss recognized by a non-U.S. Shareholder on the sale or exchange of its Shares would be treated for U.S. federal income tax purposes as effectively connected income, in which case such non-U.S. Shareholder would be subject to U.S. federal income tax and tax return filing requirements on the sale or exchange. In that event, the buyer would also generally be required to withhold at a rate of 10% of the amount realized (regardless of the amount of gain or loss recognized) by such non-U.S. Shareholder on the sale (and, if it did not withhold, the Fund would have a withholding obligation with respect to such buyer). Finally, the Fund could own, directly or indirectly, interests in U.S. real property, which could subject non-U.S. Shareholder to U.S. federal income tax, withholding tax, and tax return filing obligations similar to those described above on any gain realized by the Fund on the disposition of such investments, or on any gain realized by the non-U.S. Shareholder on the sale or exchange of its Shares. A corporate non-U.S. Shareholder may be subject to an additional U.S. branch profits tax on any income treated as effectively connected with a U.S. trade or business, including gain recognized on the disposition of U.S. real property interests.
With respect to non-U.S. Shareholders that are foreign governments or affiliates thereof, the investments and activities of the Fund may also cause such non-U.S. Shareholder to be engaged in “commercial activity” within the meaning of Section 892 of the Code.
In addition to the foregoing, non-U.S. persons are generally subject to U.S. withholding tax at a 30% rate (or such lower rate as may apply under an applicable treaty) on the gross amount of U.S.-source non-portfolio interest, dividends, rents, royalties and other fixed or determinable annual or periodical income if such income is not treated as effectively connected with a U.S. trade or business. The Fund expects that certain of its income will consist of income that would be subject to such withholding tax to the extent not treated as effectively connected with a U.S. trade or business. Various limitations apply to the ability of non-U.S. Shareholders to claim the benefits of a tax treaty with the United States.
An investment in the Fund thus may result in adverse tax consequences for a non-U.S. Shareholder. Non-U.S. Shareholders are urged to consult their own tax advisors regarding the U.S. federal income and other tax consequences to them of investing in the Fund.
FATCA. The Foreign Account Tax Compliance Act (“FATCA”) substantially changed the information reporting requirements imposed on many non-U.S. entities. Under FATCA, withholding will be required with respect to interest, dividend, and certain other income allocable to common shares held by or through certain foreign financial institutions (including investment funds) and non-financial foreign entities, unless the institution or entity complies with the disclosure, reporting, and withholding obligations under FATCA. Shareholders are encouraged to consult their tax advisors regarding the possible implications of the legislation on their investment in common shares.
State, Local and Non-U.S. Tax Consequences. The Shareholders, as well as the Fund itself, may be subject to various state, local and non-U.S. taxes and tax return filing obligations. Prospective investors are urged to consult their tax advisors with respect to the state, local and non-U.S. tax consequences of acquiring, holding and disposing of common shares.
38
Table of Contents
CERTAIN PROVISIONS IN THE AGREEMENT AND DECLARATION OF TRUST AND BYLAWS
The Declaration of Trust and the Bylaws include provisions that could have the effect of limiting the ability of other entities or persons to acquire control of the Fund or to change the composition of the Board. This could have the effect of depriving Shareholders of an opportunity to sell their shares at a premium over prevailing market prices by discouraging a third party from seeking to obtain control over the Fund. Such attempts could have the effect of increasing the expenses of the Fund and disrupting the normal operation of the Fund. The Board is divided into three classes. At each annual meeting of Shareholders the term of only one class of Trustees expires and only the Trustees in that one class stand for re-election. Trustees standing for election at an annual meeting of Shareholders are elected to serve until the third annual meeting of Shareholders following their election and when their successors are duly elected and qualify. This provision could delay for up to two years the replacement of a majority of the Board. A Trustee may be removed from office with or without cause, and only by the action of a majority of the remaining Trustees or a vote of the holders of at least 80% of the shares then entitled to vote for the election of the respective Trustee.
In addition, the following extraordinary actions and amendments to the Declaration of Trust generally require the approval of 80% of outstanding Shares entitled to vote on the matter:
| (1) | any amendment to the Declaration of Trust to make the Fund’s common shares “redeemable securities” and any other proposal to convert the Fund from a “closed-end company” to an “open-end company” (as defined in the Investment Company Act); |
| (2) | the liquidation or dissolution of the Fund and any amendment to the Declaration of Trust to effect such liquidation or dissolution; |
| (3) | any amendment to, or any amendment inconsistent with the provisions of the following articles or sections of the Declaration of Trust: |
| • | Article II — which relate to the powers and rights of the trustees; |
| • | Section 3.9 — which grants the Board of Trustees the exclusive right to amend or repeal the Fund’s bylaws; |
| • | Section 4.1 — which limits the personal liability of Shareholders of the Fund; |
| • | Section 4.2 — which requires the indemnification of certain persons; or |
| • | Section 9.1 — which sets forth these super-voting requirements; and |
| (4) | any merger, consolidation, conversion, share exchange or sale or exchange of all or substantially all of the assets of the Fund. |
Notwithstanding the foregoing, if the Board of Trustees and at least 80% of the initial trustees named in the Declaration of Trust and those trustees nominated for election or appointed to fill a vacancy that has been approved by a majority of the sitting trustees (the “Continuing Trustees”) approves any such proposal, transaction or amendment, then the approval of only a “majority of the outstanding voting securities” (as defined in the Investment Company Act) entitled to vote on such proposal, transaction or amendment is required. However, with respect to any transaction referred to in (2) above, if such transaction is approved by at least majority of the Continuing Trustees, no Shareholder approval of the transaction is required. In addition, with respect to any merger referred to in (4) above (x) that is with an affiliated investment company and that does not require a Shareholder vote under the Investment Company Act or (y) in which the Fund is the surviving entity and no Shareholder approval is required by any exchange or market on which the Fund’s common shares are listed for trading, no Shareholder approval of such merger is required. The Fund’s Bylaws generally require that advance notice be given to the Fund in the event a Shareholder desires to nominate a person for election to the Board or propose to transact any other business at an annual meeting of Shareholders. Notice of any such nomination or business must be delivered to or received at the principal executive offices of the Fund not less
39
Table of Contents
than 120 calendar days nor more than 150 calendar days prior to the anniversary date of the prior year’s annual meeting (subject to certain exceptions). Any notice by a Shareholder must be accompanied by certain information as provided in the Bylaws. Reference should be made to the Bylaws on file with the SEC for the full text of these provisions.
The 80% voting threshold for the matters discussed in foregoing paragraphs is higher than that imposed by state or federal law, but has been determined by our Board of Trustees to be in the best interest of our Shareholders.
Derivative Actions
No person who is not a Shareholder shall be entitled to bring any derivative action, suit or other proceeding on behalf of the Fund. A Shareholder or Shareholders seeking to bring a derivative action must make a pre-suit demand upon the Board of Trustees to bring the subject action and such demand shall not be excused to the maximum extent permitted by Maryland law. The Board of Trustees shall be afforded a reasonable amount of time to consider such Shareholder request and to investigate the basis of such claim; and the Board of Trustees or a committee thereof shall be entitled to retain counsel or other advisors in considering the merits of the request and may require an undertaking by the Shareholders making such request to reimburse the Fund for the expense of any such advisors in the event that the Board of Trustees determines not to bring such action; provided, however that no such undertaking shall apply to claims arising under the federal securities laws. The Shareholders shall have no power to vote as to whether or not a court action, legal proceeding or claim should or should not be brought or maintained derivatively or as a class action on behalf of the Fund or the Shareholders.
Unless the Fund consents in writing to the selection of an alternative forum, the Circuit Court for Baltimore City, Maryland, or, if that Court does not have jurisdiction, the United States District Court for the District of Maryland, Baltimore Division, shall be the sole and exclusive forum for (a) any derivative action or proceeding brought on behalf of the Fund, (b) any Internal Corporate Claim, as such term is defined in Section 1-101(p) of the Maryland General Corporation Law with regard to a Maryland corporation provided, however, that for the purposes of the Fund all references to “director” or “stockholder” shall be replaced with “trustee” and “shareholder,” or (c) any other action asserting a claim against the Fund or any Trustee or officer or other employee of the Fund that is governed by the internal affairs doctrine under Maryland law. For the avoidance of doubt, (1) the foregoing shall not apply to claims arising under the federal securities laws and (2) any of the following claims shall be subject to the foregoing: (i) any action asserting a claim of breach of any duty owed by any Trustee or officer or other employee of the Fund to the Fund or to the Shareholders of the Fund or (ii) any action asserting a claim against the Fund or any Trustee or officer or other employee of the Fund arising pursuant to any provision of the Maryland Statutory Trust Act, the Declaration of Trust or the Bylaws.
Investing in our common shares involves a number of significant risks. In addition to the other information contained in this Registration Statement, you should consider carefully the following information before making an investment in our common shares. The risks below are not the only risks we face. Additional risks and uncertainties not presently known to us or not presently deemed material by us may also impair our operations and performance. If any of the following events occur, our business, financial condition and results of operations could be materially and adversely affected. In such case, the net asset value of our common shares could decline, and you may lose all or part of your investment. Nonetheless, this section describes the special risks of investing in a business development company, including the risks associated with investing in a portfolio of small to midsize companies.
40
Table of Contents
Risks Related to Current Market Conditions
We are subject to risks associated with general economic and market conditions.
The success of the activities of the Fund will be affected by general economic and market conditions, such as interest rates, availability of credit, inflation rates, economic uncertainty, supply chain disruptions, labor shortages, energy and other resource shortages, changes in laws, trade barriers, currency exchange controls and national and international political circumstances (such as changes in foreign investment policies). These factors may affect the level and volatility of securities prices and the liquidity of the investments. Volatility or illiquidity could impair the Fund’s profitability or result in losses.
Various social and political tensions around the world may contribute to increased market volatility, may have long-term effects on the worldwide financial markets and may cause further economic uncertainties worldwide. Market disruptions and the dramatic increase in the capital allocated to alternative investment strategies during recent years have led to increased governmental as well as self-regulatory scrutiny of the private investment fund industry in general. Certain legislation proposing greater regulation of the industry periodically is considered by various jurisdictions. It is impossible to predict what, if any, changes in the regulations applicable to the Fund and/or our Adviser, the markets in which they trade and invest, or the counterparties with which they do business, may be instituted in the future. Any such regulation could have a material adverse impact on the profit potential of the Fund.
The current contentious domestic political environment, as well as political and diplomatic events within the United States and abroad, such as the U.S. government’s inability at times to agree on a long-term budget and deficit reduction plan, may in the future result in government shutdowns or defaults on U.S. debt securities, which could have a material adverse effect on the Fund’s investments and operations. In addition, the Fund’s ability to raise additional capital in the future through the sale of securities could be materially affected by a government shutdown. Additional and/or prolonged U.S. government shutdowns may affect investor and consumer confidence and may adversely impact financial markets and the broader economy, perhaps suddenly and to a significant degree.
We are subject to risks related to inflation.
Inflation risk is the risk that the value of assets or income from investments will be worth less in the future as inflation decreases the value of money. Recently, inflation has increased to its highest level in decades, and the Federal Reserve has been raising the federal funds rate in response. Inflation rates may change frequently and significantly as a result of various factors, including unexpected shifts in the domestic or global economy and changes in economic policies, and the Fund’s investments may not keep pace with inflation, which may result in losses to Shareholders. As inflation increases, the inflation-adjusted value of our shares and dividends therefore may decline. In addition, during any periods of rising inflation, interest rates of any debt securities issued by the Fund would likely increase, which would tend to further reduce returns to Shareholders. Inflation rates may change frequently and significantly as a result of various factors, including unexpected shifts in the domestic or global economy and changes in economic policies, and our investments may not keep pace with inflation, which may result in losses to our Shareholders. This risk is greater for fixed-income instruments with longer maturities.
Market disruptions and other geopolitical or macroeconomic events could create market volatility that negatively impacts our business, financial condition and earnings.
General economic and market conditions, such as interest rates, availability of credit, inflation rates, economic uncertainty, supply chain disruptions, labor shortages, energy and other resource shortages, changes in laws, trade barriers, currency exchange controls and national and international political circumstances, may have long-term negative effects on the U.S. and worldwide financial markets and economy. These conditions have resulted in, and in many cases continue to result in, greater price volatility, less liquidity, widening credit spreads and a lack of price transparency, with many securities remaining illiquid and of uncertain value. Such market
41
Table of Contents
conditions may adversely affect the Fund, including by making valuation of some of the Fund’s investments uncertain and/or result in sudden and significant valuation increases or declines in the Fund’s holdings. If there is a significant decline in the value of the Fund’s portfolio, this may impact the asset coverage levels for the Fund’s outstanding leverage.
Risks resulting from any future debt or other economic crisis could also have a detrimental impact on the global economy, the financial condition of financial institutions and our business, financial condition and results of operation. Market and economic disruptions have affected, and may in the future affect, consumer confidence levels and spending, personal bankruptcy rates, levels of incurrence and default on consumer debt and home prices, among other factors. To the extent uncertainty regarding the U.S. or global economy negatively impacts consumer confidence and consumer credit factors, our business, financial condition and results of operations could be significantly and adversely affected. Downgrades to the credit ratings of major banks could result in increased borrowing costs for such banks and negatively affect the broader economy. Moreover, Federal Reserve policy, including with respect to certain interest rates, may also adversely affect the value, volatility and liquidity of dividend- and interest-paying securities. Market volatility, rising interest rates and/or a return to unfavorable economic conditions could impair the Fund’s ability to achieve its investment objective.
The occurrence of events similar to those in recent years, such as localized wars, instability, new and ongoing pandemics (such as COVID-19), epidemics or outbreaks of infectious diseases in certain parts of the world, and catastrophic events such as fires, floods, earthquakes, tornadoes, hurricanes and global health epidemics, terrorist attacks in the U.S. and around the world, social and political discord, debt crises sovereign debt downgrades, increasingly strained relations between the U.S. and a number of foreign countries, new and continued political unrest in various countries, the exit or potential exit of one or more countries from the European Union or the European Monetary Union, continued changes in the balance of political power among and within the branches of the U.S. government, a default on U.S. debt and government shutdowns, among others, may result in market volatility, may have long term effects on the U.S. and worldwide financial markets, and may cause further economic uncertainties in the U.S. and worldwide.
In particular, the consequences of the Russian military invasion of Ukraine, the impact on inflation and increased disruption to supply chains and energy resources may impact our portfolio companies, result in an economic downturn or recession either globally or locally in the U.S. or other economies, reduce business activity, spawn additional conflicts (whether in the form of traditional military action, reignited “cold” wars or in the form of virtual warfare such as cyberattacks) with similar and perhaps wider ranging impacts and consequences and have an adverse impact on the Fund’s returns and net asset value. In response to the conflict between Russia and Ukraine, the U.S. and other countries have imposed sanctions or other restrictive actions against Russia, Russian-backed separatist regions in Ukraine, and certain banks, companies, government officials and other individuals in Russia and Belarus. Any of the above factors, including sanctions, export controls, tariffs, trade wars and other governmental actions, could have a material adverse effect on our business, financial condition, cash flows and results of operations and could cause the market value of our common shares and/or debt securities to decline. We have no way to predict the duration or outcome of the situation, as the conflict and government reactions are rapidly developing and beyond our control. Prolonged unrest, military activities, or broad-based sanctions could have a material adverse effect on our portfolio companies. Such consequences also may increase our funding cost or limit our access to the capital markets.
The current political climate has intensified concerns about a potential trade war between China and the U.S., as each country has imposed tariffs on the other country’s products. These actions may trigger a significant reduction in international trade, the oversupply of certain manufactured goods, substantial price reductions of goods and possible failure of individual companies and/or large segments of China’s export industry, which could have a negative impact on our performance. U.S. companies that source material and goods from China and those that make large amounts of sales in China would be particularly vulnerable to an escalation of trade tensions. Uncertainty regarding the outcome of the trade tensions and the potential for a trade war could cause the U.S. dollar to decline against safe haven currencies, such as the Japanese yen and the euro. Events such as
42
Table of Contents
these and their consequences are difficult to predict and it is unclear whether further tariffs may be imposed or other escalating actions may be taken in the future. Any of these effects could have a material adverse effect on our business, financial condition and results of operations.
In addition, risks arising from the differences in expressed policy preferences among the various constituencies in the branches of the U.S. government have led in the past, and may lead in the future, to short-term or prolonged policy impasses, including, among other things, related to the U.S. federal debt ceiling. Current legislation suspends the debt ceiling through early 2023, unless Congress takes legislative action to further extend or defer it. If Congress fails to act with respect to the federal debt ceiling, it is possible that the United States may default on its debt. A default on U.S. debt could have negative consequences for interest rates, the ability of our portfolio companies to finance their operations and our business. See “—Risks Relating to Our Business and Structure—Changes in legal, tax and regulatory regimes could negatively impact our business, financial condition and earnings.”
The effects described above on our portfolio companies could impact their ability to make payments on their loans on a timely basis and may impact their ability to continue meeting their loan covenants. The inability of portfolio companies to make timely payments or meet loan covenants may in the future require us to undertake amendment actions with respect to our investments or to restructure our investments, which may include the need for us to make additional investments in our portfolio companies (including debt or equity investments) beyond any existing commitments, exchange debt for equity, or change the payment terms of our investments to permit a portfolio company to pay a portion of its interest through payment-in-kind, which would defer the cash collection of such interest and add it to the principal balance, which would generally be due upon repayment of the outstanding principal.
Risks Relating to Our Business and Structure
Capital markets may experience periods of disruption and instability. Such market conditions may materially and adversely affect debt and equity capital markets in the United States and abroad, which may have a negative impact on our business and operations.
From time to time, capital markets may experience periods of disruption and instability, which may be evidenced by a lack of liquidity in debt capital markets, write-offs in the financial services sector, re-pricing of credit risk and failure of certain major financial institutions. While the extreme volatility and disruption that U.S. and global markets experienced for an extended period of time beginning in 2007 and 2008 had, until the recent coronavirus (COVID-19) outbreak, generally subsided, uncertainty and periods of volatility still remain, and risks to a robust resumption of growth persist.
Equity capital may be difficult to raise because, subject to some limited exceptions, as a BDC, we are generally not able to issue additional shares of common stock at a price less than net asset value without first obtaining approval for such issuance from our stockholders and our independent trustees. In addition, our ability to incur indebtedness (including by issuing preferred stock) is limited by applicable regulations such that our asset coverage ratio, as calculated in accordance with the Investment Company Act, must equal at least 200% immediately after each time we incur indebtedness. The debt capital that will be available to us in the future, if at all, may be at a higher cost and on less favorable terms and conditions than our current leverage. Any inability to raise capital could have a negative effect on our business, financial condition and results of operations.
Market conditions may in the future make it difficult to extend the maturity of or refinance our existing indebtedness and any failure to do so could have a material adverse effect on our business. The debt capital that will be available to us in the future, if at all, may be at a higher cost and on less favorable terms and conditions than what we currently experience. Further, if we are unable to raise or refinance debt, then our Shareholders may not benefit from the potential for increased returns on equity resulting from leverage and we may be limited in our ability to make new commitments or to fund existing commitments to our portfolio companies.
43
Table of Contents
The illiquidity of our investments may make it difficult for us to sell such investments if required. As a result, we may realize significantly less than the value at which we have recorded our investments. While most of our investments are not publicly traded, applicable accounting standards require us to assume as part of our valuation process that our investments are sold in a principal market to market participants (even if we plan on holding an investment through its maturity) In addition, significant changes in the capital markets, including disruption and volatility, have had, and may in the future have, a negative effect on the valuations of our investments and on the potential for liquidity events involving our investments. An inability to raise capital, and any required sale of our investments for liquidity purposes, could have a material adverse impact on our business, financial condition and results of operations.
Given the extreme volatility and dislocation that the capital markets have historically experienced, many BDCs have faced, and may in the future face, a challenging environment in which to raise capital. We may in the future have difficulty accessing debt and equity capital, and a severe disruption in the global financial markets or deterioration in credit and financing conditions could have a material adverse effect on our business, financial condition and results of operations. In addition, significant changes in the capital markets, including the extreme volatility and disruption, have had, and may in the future have, a negative effect on the valuations of our investments and on the potential for liquidity events involving our investments. An inability to raise capital, and any required sale of our investments for liquidity purposes, could have a material adverse impact on our business, financial condition or results of operations.
Our Adviser cannot predict the effects of these or similar events in the future on the United States economy and securities markets or on our investments. Our Adviser monitors developments and seeks to manage our investments in a manner consistent with achieving our investment objective, but there can be no assurance that it will be successful in doing so; and our Adviser may not timely anticipate or manage existing, new or additional risks, contingencies or developments, including regulatory developments in the current or future market environment.
We are required to record certain of our assets at fair value, as determined in good faith by our Adviser, as the Fund’s valuation designee, in accordance with our valuation policy. As a result, volatility in the capital markets may have a material adverse effect on our investment valuations and our net asset value, even if we plan to hold investments to maturity.
Our operation as a BDC imposes numerous constraints on us and significantly reduces our operating flexibility. In addition, if we fail to maintain our status as a BDC, we might be regulated as a registered investment company, which would subject us to additional regulatory restrictions.
The Investment Company Act imposes numerous constraints on the operations of BDCs. For example, BDCs generally are required to invest at least 70% of their total assets primarily in securities of qualifying U.S. private companies or thinly traded public companies, cash, cash equivalents, U.S. government securities and other high-quality debt investments that mature in one year or less from the time of investment. Furthermore, any failure to comply with the requirements imposed on BDCs by the Investment Company Act could cause the SEC to bring an enforcement action against us and/or expose us to claims of private litigants.
We may be precluded from investing in what our Adviser believes are attractive investments if such investments are not qualifying assets for purposes of the Investment Company Act. If we do not invest a sufficient portion of our assets in qualifying assets, we will be prohibited from making any additional investment that is not a qualifying asset and could be forced to forgo attractive investment opportunities. Similarly, these rules could prevent us from making follow-on investments in existing portfolio companies (which could result in the dilution of our position).
In addition, if we fail to maintain our status as a BDC, we might be regulated as a closed-end investment company that is required to register under the Investment Company Act, which would subject us to additional
44
Table of Contents
regulatory restrictions and significantly decrease our operating flexibility. In addition, any such failure could cause an event of default under any outstanding indebtedness we might have, which could have a material adverse effect on our business, financial condition or results of operations.
We are dependent upon management personnel of our Adviser for our future success.
Our success depends in substantial part on the skill and expertise of the officers and employees of Silver Point and the sourcing relationships for loans and other assets that are targeted by us maintained by Silver Point. There can be no assurance that the employees or officers of Silver Point will continue to be employed by or provide services to our Adviser or that such relationships will continue to be maintained. The loss of key personnel or such relationships could have a material adverse effect on us. Shareholders should be aware that the officers and employees of Silver Point have significant other responsibilities and activities.
Our business model depends upon the development and maintenance of strong referral relationships with other asset managers and investment banking firms.
We are substantially dependent on our relationships, which we use to help identify and gain access to investment opportunities. If we fail to maintain our relationships with key firms, or if we fail to establish strong referral relationships with other firms or other sources of investment opportunities, we will not be able to grow our portfolio of investments and achieve our investment objective. In addition, persons with whom we have relationships are not obligated to inform us of investment opportunities, and therefore such relationships may not lead to the origination of investments. Any loss or diminishment of such relationships could effectively reduce our ability to identify attractive portfolio companies that meet our investment criteria, either for direct investments or for investments through private secondary market transactions or other secondary transactions.
Silver Point, its principals, investment professionals and employees and the members of its investment committee have certain conflicts of interest because they manage other investment vehicles and accounts to which they have obligations and duties that may not be in our best interests.
Silver Point, and certain of its principals, investment professionals, employees and investment committee members currently do, and in the future may, serve as investment advisers, officers, Trustees or principals of entities or private funds that operate in the same or a related line of business as us and/or of private funds managed by our Adviser or its affiliates. Accordingly, these individuals may have obligations to investors in those entities or private funds, the fulfillment of which might not be in our best interests or the best interests of our Shareholders. In addition, we note that existing affiliated investment vehicles managed by our Adviser or its affiliates have, and those formed in the future may have, substantially similar and/or overlapping investment objectives with our own and, accordingly, our Adviser and/or its affiliates may face conflicts in allocating investment opportunities between us and such other entities. Although our Adviser and its affiliates will endeavor to allocate investment opportunities in a fair and equitable manner over time and consistent with applicable allocation procedures, it is possible that, in the future, we may not be given the opportunity to participate in investments made by other clients or entities managed by our Adviser or its affiliates. In any such case, if our Adviser forms other affiliates in the future, we may co-invest on a concurrent basis with such other affiliates, subject to compliance with applicable regulations and regulatory guidance, as well as applicable allocation procedures. In certain circumstances, negotiated co-investments may be made pursuant to an exemptive order from the SEC permitting us to do so. See “Item 1A. Risk Factors—Risks Relating to Our Business and Structure—Our ability to enter into transactions with our affiliates is restricted” and “Item 7. Certain Relationships, Related Party Transactions and Potential Conflicts of Interest.”
Our financial condition and results of operations depend on our ability to manage future growth effectively.
Our ability to achieve our investment objective depends on Silver Point’s ability to identify, invest in and monitor companies that meet our investment criteria.
45
Table of Contents
Accomplishing this result on a cost-effective basis is largely a function of the structuring of our investment process and the ability of Silver Point to provide competent, attentive and efficient services to us. Our executive officers and the members of Silver Point’s investment committee have substantial responsibilities in connection with their roles at our Adviser and with other clients of our Adviser, as well as responsibilities under the Advisory Agreement. We may also be called upon to provide significant managerial assistance to certain of our portfolio companies. These demands on their time, which will increase as the number of investments grow, may distract them or slow the rate of investment. In order to grow, Silver Point may need to hire, train, supervise, manage and retain new employees. However, we cannot assure you that they will be able to do so effectively. Any failure to manage our future growth effectively could have a material adverse effect on our business, financial condition and results of operations.
Our ability to grow depends on our ability to raise additional capital.
We expect to need to periodically access the capital markets to raise cash to fund new investments. If we do not have adequate capital available for investment, our performance could be adversely affected. We expect to use debt financing and issue additional securities to fund our growth, if any. Unfavorable economic or capital market conditions may increase our funding costs, limit our access to the capital markets or result in a decision by lenders not to extend credit to us. An inability to successfully access the capital markets could limit our ability to grow our business and fully execute our business strategy and could decrease our earnings, if any.
In addition, pursuant to the Investment Company Act, our total borrowings are limited so that we cannot incur additional borrowings if immediately after such borrowing, the ratio of our total assets (less total liabilities other than indebtedness represented by senior securities) to our total indebtedness represented by senior securities plus preferred shares, if any, is at or above 200%. This means that we can borrow up to $1 for every $1 of investor equity. If this ratio declines below 200%, we may not be able to incur additional debt and may need to sell a portion of our investments to repay some debt when it is disadvantageous to do so, and we may not be able to make distributions. Further, other BDCs may be better positioned to take advantage of such changes, potentially leaving the Fund at a competitive disadvantage. The amount of leverage that we will employ will depend on our Adviser’s and our Board of Trustees’ assessments of market conditions and other factors at the time of any proposed borrowing or issuance of senior securities. We cannot assure you that we will be able to obtain lines of credit in the future or issue senior securities at all or on terms acceptable to us.
Moreover, increased leverage could increase the risks associated with investing in the Fund’s common shares. For example, if the value of the Fund’s assets decreases, leverage will cause the Fund’s net asset value to decline more sharply than it otherwise would have without leverage or with lower leverage. Similarly, any decrease in the Fund’s revenue would cause its net income to decline more sharply than it would have if the Fund had not borrowed or had borrowed less. Such a decline could also negatively affect our ability to make dividend payments on our common shares or preferred shares, if any. In addition, common Shareholders will bear the burden of any increase in the Fund’s expenses as a result of its use of leverage, including interest expenses and any increase in the Management Fee payable to the Adviser.
Regulations governing our operation as a BDC affect our ability to, and the way in which we, raise additional capital.
The Investment Company Act imposes numerous constraints on the operations of BDCs. See “Item 1. Business—Regulation” for a discussion of BDC limitations. For example, BDCs are required to invest at least 70% of their total assets in qualifying assets, as defined under the Investment Company Act. Qualifying assets include investments in securities of qualifying U.S. private or thinly traded public companies, cash, cash equivalents, U.S. government securities and other high-quality debt investments that mature in one year or less from the time of investment. The failure to comply with these provisions in a timely manner could prevent us from qualifying as a BDC, which could be material.
46
Table of Contents
These constraints may hinder our Adviser’s ability to take advantage of attractive investment opportunities and to achieve our investment objective.
Regulations governing our operation as a BDC affect our ability to raise additional capital, and the ways in which we can do so. Raising additional capital may expose us to risks, including the typical risks associated with leverage, and may result in dilution to our current Shareholders. The Investment Company Act limits our ability to issue senior securities as described above under “Our ability to grow depends on our ability to raise additional capital”. If the value of our assets declines, we may be required to sell a portion of our investments and, depending on the nature of our leverage, repay a portion of our indebtedness at a time when this may be disadvantageous to us and, as a result, our Shareholders.
We are generally not able to issue and sell our common shares at a price per share below NAV per share. We may, however, sell our common shares, or warrants, options or rights to acquire our common shares at a price below the then-current NAV per common shares with the consent of a majority of our Shareholders. If our common shares trade at a discount to NAV, this restriction could adversely affect our ability to raise capital.
We may use leverage, which may magnify the potential for gain or loss and may increase the risk of investing in us.
As part of our business strategy, we may directly or indirectly leverage our investments through borrowings and may utilize leverage embedded in derivative instruments. This will result is us controlling more assets than we have capital from our Shareholders. Direct leverage increases our returns if we earn a greater return on investments purchased with borrowed funds than our cost of borrowing such funds. However, the use of leverage exposes us to additional levels of risk, including (i) net asset value declining more sharply than it otherwise would have had we not borrowed to make the investments, (ii) margin calls or interim margin requirements which may force premature liquidations of investment positions, (iii) losses on investments where the investment fails to earn a return that equals or exceeds our cost of borrowing such funds and (iv) general interest rate fluctuations, which may adversely impact the rate of return on invested capital. If our assets and liabilities are not appropriately matched, adverse changes in interest rates could reduce or eliminate the incremental income created through the use of leverage. In the event of a sudden, precipitous drop in the value of our assets, we may not be able to liquidate assets quickly enough to repay our borrowings, further magnifying our losses, and may not be able to make distributions. Our ability to service any debt that we incur will depend largely on our financial performance and will be subject to prevailing economic conditions and competitive pressures. The financing costs of direct leverage will reduce cash available for distribution to our Shareholders.
We may, in accordance with regulatory guidance or SEC approval, be able to indirectly obtain leverage in excess of the Investment Company Act’s asset coverage requirements through off-balance sheet arrangements, including non-controlling investments in a joint venture or similar investment vehicle which itself has direct exposure to leverage or other off-balance sheet financings. If approved by the SEC, leverage incurred by the joint venture or investment vehicle generally would not be included in the calculation of debt for the purposes of the asset coverage test described above. In addition, if we, indirectly through a subsidiary, are licensed as an SBIC, the limitations on leverage applicable to BDCs under the Investment Company Act may be exceeded. We have not applied to the SBA for approval and have not applied for exemptive relief from the SEC to exclude leverage incurred by any such SBIC from the leverage limits under the Investment Company Act.
Any debt facility into which we may enter may impose financial and operating covenants that restrict business activities, ability to call capital, remedies on default and similar matters. In connection with borrowings, our lenders may also require us to pledge assets. Debt facilities into which we enter may be subject to periodic renewal by lenders and there can be no guarantee that lenders will continue to extend credit to us.
Lastly, we may be unable to obtain our desired leverage, which would, in turn, affect your return on investment.
47
Table of Contents
The following table illustrates the effect of leverage on returns from an investment in our common shares assuming various annual returns on our portfolio, net of expenses. The calculations in the table below are hypothetical, and actual returns may be higher or lower than those appearing in the table below.
Assumed Return on Portfolio (net of expenses) | -10 | % | -5 | % | 0 | % | 5 | % | 10 | % | ||||||||||
|
|
|
|
|
|
|
|
|
| |||||||||||
Corresponding Return to Common Stockholder | -23.5 | % | -14.0 | % | -4.6 | % | 4.8 | % | 14.3 | % |
| (1) | Assumes, as of December 31, 2022, (i) $1.00 billion in total assets, (ii) $463.0 million in outstanding indebtedness, at par and excluding unamortized debt issuance cost, (iii) $531.0 million in net assets and (iv) interest rate, excluding fees (such as fees on undrawn and amortization of financing costs), of 5.3%. |
Based on an outstanding indebtedness of $463.0 million as of December 31, 2022, the effective annual interest rate of 5.82% (inclusive of fees and amortization of financing costs) as of that date, our investment portfolio of $815.4 million, at fair value, would have had to produce an annual return of approximately 3.31% to cover annual interest payments on the outstanding debt.
Substantially all of our assets are subject to security interests under our borrowings and if we default on our obligations, we may suffer adverse consequences, including the lenders foreclosing on our assets.
Substantially all of our assets are pledged under the Revolving Credit Facility and to secure the debt offered in connection with our securitization of $288 million of our term debt portfolio assets (the “2021 CLO”), including, without limitation, all loans, bonds or participation interests owned by us (each, a “Collateral Obligation”) and any property or other assets designated and pledged or mortgaged as collateral to secure the repayment of any such Collateral Obligation. Assets pledged under the Revolving Credit Facility also include unfunded exposure accounts, principal collection accounts and interest collection accounts and any funds held in any such accounts (collectively, the “Accounts” and each, an “Account”) and all investments of amounts in the Accounts. If we default on our obligations under the Revolving Credit Facility and fail to cure such default in a timely manner, the lenders may institute proceedings for the collection of all obligations, which may include foreclosing upon and selling the collateral at a public or private sale and enforcing any judgment obtained or any other remedy or legal or equitable right under applicable law or any of the loan documents. In such event, we may be forced to sell certain of our investments in order to repay our obligations in order to avoid foreclosure. Moreover, if the lenders exercise their right to sell the foreclosed assets, such sales may be completed at distressed sale prices, diminishing or potentially eliminating the amount of cash available to us after all creditors have been repaid.
Any inability to renew, extend or replace the Revolving Credit Facility prior to its maturity could adversely impact our liquidity and ability to find new investments or maintain distributions to our Shareholders.
We currently have $200 million of revolving credit under the Revolving Credit Facility. As of December 31, 2022, we had approximately $30.0 million outstanding in loans and $170.0 million available. Currently, we do not know whether we will renew, extend or replace the Revolving Credit Facility upon its maturity or whether we will be able to do so at all. Furthermore, upon the termination of the Revolving Credit Facility, there can be no assurance that we will be able to enter into a replacement facility on terms that are favorable to us, if at all. Our ability to replace or extend the facility may be constrained by then-current economic conditions affecting the credit markets. In the event we are unable to replace the Revolving Credit Facility at the time of maturity, the inability to access credit could have a material adverse effect on our liquidity and ability to fund new investments, make distributions or other activities. See “Item 2. Financial Information—Financial Condition, Liquidity and Capital Resources—Revolving Credit Facility.”
48
Table of Contents
Failure to refinance the 2026 Notes could have a material adverse effect on our results of operations and financial position.
If we are unable to refinance the 2026 Notes prior to maturity or find a new source of borrowing on acceptable terms, we will be required to pay down the amounts outstanding at maturity through one or more of the following: (1) borrowing additional funds under our then current credit facility, (2) issuance of additional securities or (3) possible liquidation of some or all of our investments and other assets, any of which could have a material adverse effect on our results of operations and financial position. See “Item 2. Financial Information—Financial Condition, Liquidity and Capital Resources—2026 Notes.”
In addition to regulatory restrictions that restrict our ability to raise capital, the Revolving Credit Facility contains various covenants which, if not complied with, could accelerate repayment, thereby materially and adversely affecting our liquidity, financial condition and results of operations.
The Revolving Credit Facility contains customary affirmative and negative covenants, subject to certain agreed upon exceptions. The Revolving Credit Facility contains affirmative covenants related to: the creation and perfection of security interest; notices of defaults and events of default; the production of certain information, document, records or reports upon request from the Facility Agent, the Collateral Agent or any lender; the conduct of the Fund’s business; maintenance of books of accounts and records; maintenance of bank accounts and other depository accounts; financial statements; compliance with organizational formalities to maintain the Fund’s separate existence from any other persons or affiliates; maintenance of adequate capital in light of the Fund’s transactions and liabilities; delivering updated collateral schedules; and maintenance of a minimum level of equity.
Negative covenants include customary covenants such as: limitations on changes to the Fund’s name, jurisdiction, identity or corporate structure, limitations on selling, pledging, assigning or transferring or creating, granting, incurring or assuming any lien on the collateral; limitations on guaranteeing other persons; limitations on amendments to the Fund’s constituent documents; certain limitations on transactions with affiliates; limitations on the acquisition of any obligation or securities of the Fund’s members or any other affiliate; certain limitations on the incurrence of debt (which shall permit investments permitted under the Revolving Credit Facility); limitations on extraordinary events, such as dissolution, liquidation, consolidation, merger, sale or transfer of all or substantially all of its assets other than as permitted under the Revolving Credit Facility; limitations on the ownership of assets and property other than the collateral as permitted under the Revolving Credit Facility; limitations on the declaring or making of any payments or distributions on or in respect of any equity interests; and other limitations on the Fund and the Servicer as set forth in the Revolving Credit Facility.
The various covenants place limitations on investments and diversification of such investments. Such limitations may cause us to be unable to make certain potentially attractive investments or to be forced to sell others, potentially impairing our profitability. As of December 31, 2022, we were in compliance with these covenants. Continued compliance with the covenants depends on numerous factors, some of which are beyond our control. Failure to comply with covenants may result in a default under the Revolving Credit Facility, which if not cured or waived, could result in an acceleration of repayments under the Revolving Credit Facility.
We may enter into reverse repurchase agreements, which are another form of leverage.
We may enter into reverse repurchase agreements as part of our management of our investment portfolio. Under a reverse repurchase agreement, we will effectively pledge our assets as collateral to secure a short-term loan. Generally, the other party to the agreement makes the loan in an amount equal to a percentage of the fair value of the pledged collateral. At the maturity of the reverse repurchase agreement, the payor will be required to repay the loan and correspondingly receive back its collateral. While used as collateral, the assets continue to pay principal and interest which are for our benefit.
Our use of reverse repurchase agreements, if any, involves many of the same risks involved in our use of leverage, as the proceeds from reverse repurchase agreements generally will be invested in additional securities.
49
Table of Contents
There is a risk that the market value of the securities acquired with the proceeds of a reverse repurchase agreement may decline below the price of the securities that we have sold but remain obligated to repurchase under the reverse repurchase agreement. In addition, there is a risk that the market value of the securities effectively pledged by us may decline. If a buyer of securities under a reverse repurchase agreement were to file for bankruptcy protection or experience insolvency, we may be adversely affected. Also, in entering into reverse repurchase agreements, we would bear the risk of loss to the extent that the proceeds of such agreements at settlement are more than the fair value of the underlying securities being pledged. In addition, due to the interest costs associated with reverse repurchase agreements transactions, our net asset value would decline, and, in some cases, we may be worse off than if such instruments had not been used.
We may also enter into buy/sell-back transactions (a form of delayed delivery agreement). In a buy/sell-back transaction, we enter a trade to sell securities at one price and simultaneously enter a trade to buy the same securities at another price for settlement at a future date. Although we generally intend to acquire or dispose of securities on a forward commitment, when-issued or delayed delivery basis, we may sell these securities or its commitment before the settlement date if deemed advisable.
We operate in a highly competitive market for investment opportunities.
Other public and private entities, including commercial banks, commercial financing companies, BDCs, insurance companies and other private investment funds compete with us to make the types of investments that we plan to make. We may also compete for investments with alternative investment vehicles such as hedge funds, whose investment in this area has increased. As a result of these new entrants, competition for investment opportunities has intensified in recent years and may continue to intensify in the future. Certain of these competitors may be substantially larger, have considerably greater financial, technical and marketing resources than we will have and offer a wider array of financial services. For example, some competitors may have a lower cost of funds and access to funding sources that are not available to us. In addition, some competitors may have higher risk tolerances or different risk assessments, which could allow them to consider a wider variety of investments and establish more relationships. We may lose investment opportunities if we do not match our competitors’ pricing, terms and structure. If we do match competitors’ pricing, terms and structure, however, we may experience decreased net interest income and increased risk of credit loss. Furthermore, certain of our competitors are not subject to the regulatory restrictions that the Investment Company Act imposes on us as a BDC. Our investment strategy depends in part on our ability to source investment opportunities in which the participation of traditional financing sources is limited. As a result, we cannot assure you that the competitive pressures we face will not have a material adverse effect on our business, financial condition and results of operations.
We do not seek to compete primarily based on the interest rates we offer and our Adviser believes that some of our competitors may make loans with interest rates that are comparable to or lower than the rates we offer. Rather, we compete with our competitors based on our reputation in the market, our existing investment platform, our experience and focus on middle market companies, our disciplined investment philosophy, our extensive industry focus and relationships and our flexible transaction structuring. For a more detailed discussion of these competitive advantages, see “Item 1. Business—Competitive Advantages.”
Our Adviser will be paid a management fee even if the value of your investment declines and our Adviser’s incentive fees may create incentives for the portfolio management team to make certain kinds of investments.
Even in the event the value of your investment declines, the management fee will still be payable. The management fee is calculated as a percentage of drawn capital. Accordingly, the management fee is payable regardless of whether the value of our assets and/or your investment has decreased and creates an incentive for our Adviser to incur leverage.
The Incentive Fee consist of two parts, one based on our income, or the Income Incentive Compensation, and the other based on our capital gains, or the Capital Gains Incentive Compensation. Income Incentive
50
Table of Contents
Compensation is calculated as a percentage of pre-incentive compensation net investment income. Since pre-incentive compensation net investment income does not include any realized capital gains, realized capital losses or unrealized capital appreciation or depreciation, it is possible that we may pay our Adviser Income Incentive Compensation in a quarter where we incur a loss. For example, if we receive pre-incentive compensation net investment income in excess of the minimum hurdle rate, we will pay the applicable Income Incentive Compensation even if we have incurred a loss in the applicable period due to realized and unrealized capital losses. In addition, because the minimum hurdle rate is calculated based on our net assets, decreases in net assets due to realized or unrealized capital losses in any given quarter may increase the likelihood that the hurdle rate is reached in that period and, as a result, that Income Incentive Compensation is paid.
Capital Gains Incentive Compensation is calculated annually based upon our realized capital gains, computed net of realized capital losses and unrealized capital depreciation on a cumulative basis. As a result, we may owe our Adviser Capital Gains Incentive Compensation during one year as a result of realized capital gains on certain investments, and then later incur significant realized capital losses and unrealized capital depreciation on the remaining investments in our portfolio during subsequent years.
In addition, the incentive fee payable by us to our Adviser may create an incentive for our Adviser to make investments on our behalf that are risky or more speculative than would be the case in the absence of such a compensation arrangement and also to incur leverage. Our Adviser receives the Incentive Fee based, in part, upon capital gains realized on our investments. As a result, our Adviser may have an incentive to invest more in companies whose securities are likely to yield capital gains, as compared to income producing securities. Such a practice could result in our investing in more speculative securities than would otherwise be the case, which could result in higher investment losses, particularly during cyclical economic downturns.
The Incentive Fee payable by us to our Adviser also may create an incentive for our Adviser to invest on our behalf in instruments that have a deferred interest feature. Under these investments, we accrue the interest over the life of the investment but do not receive the cash income from the investment until the end of the term. Our net investment income used to calculate the income portion of our Incentive Fee, however, includes accrued interest. Thus, a portion of this incentive fee is based on income that we have not yet received in cash.
Beneficial owners of our equity securities may be subject to certain regulatory requirements based on their ownership percentages.
A beneficial owner, either directly or indirectly, of more than 25% of our voting securities is presumed to control us under the Investment Company Act. Certain events beyond an investor’s control may result in an increase in the percentage of such investor’s beneficial ownership of our shares, including the repurchase by us of shares from other Shareholders. Control of us would also arise under the Investment Company Act if a person has the power to exercise a controlling influence over our management or policies, unless that power is solely the result of an official position with us. In the event you are or become a person that controls us, you and certain of your affiliated persons will be subject to, among other things, prohibitions or restrictions on engaging in certain transactions with us and certain of our affiliated persons. A beneficial owner of a large number of our equity securities will also become subject to public reporting obligations.
As a regulated BDC we are subject to regulatory risks.
We were formed in July 2014, converted to a limited partnership in April 2015 and converted to a Maryland statutory trust in November 2021. Our Adviser was formed in March 2015. Prior to our election to be regulated as a BDC, we were not operated as a BDC regulated under the Investment Company Act. As a BDC, we are subject to the regulatory requirements of the SEC, in addition to the specific regulatory requirements applicable to BDCs under the Investment Company Act. Although our Adviser generally has managed our portfolio as if we were regulated as a BDC since we commenced investment operations, we have not previously been subject to the full range of regulation applicable to a BDC and may incur substantial additional costs, and expend significant time or other resources operating under this regulatory framework.
51
Table of Contents
We may incur significant costs as a result of registering our common shares under the Exchange Act.
Once our common shares become registered under the Exchange Act, we will incur significant additional costs. The Exchange Act requires that we file annual, quarterly and current reports with respect to our business and financial condition. The Sarbanes-Oxley Act requires that we maintain effective disclosure controls and procedures and internal controls over financial reporting, which are discussed herein. See “Item 1. Business—Regulation—Compliance with the Sarbanes-Oxley Act.” In order to maintain and improve the effectiveness of our disclosure controls and procedures and internal controls, significant resources and management oversight will be required. We will be implementing additional procedures, processes, policies and practices for the purpose of addressing the standards and requirements applicable to companies whose securities are registered under the Exchange Act. These activities may divert management’s attention from other business concerns, which could have a material adverse effect on our business, financial condition, results of operations and cash flows. We expect to incur significant additional annual expenses related to these steps and, among other things, trustees’ and officers’ liability insurance, trustee fees, reporting requirements of the SEC, additional fees payable to our Sub-Administrator, increased auditing and legal fees and similar expenses.
The systems and resources necessary to comply with Exchange Act reporting requirements will increase further if we cease to be an “emerging growth company” under the JOBS Act. As long as we remain an emerging growth company, we intend to take advantage of certain exemptions from various reporting requirements that are applicable to other companies whose securities are registered under the Exchange Act.
Efforts to comply with Section 404 of the Sarbanes-Oxley Act will involve significant expenditures, and non-compliance with Section 404 of the Sarbanes-Oxley Act may adversely affect us.
We have not previously been required to comply with the requirements of the Sarbanes-Oxley Act, including the internal control evaluation and certification requirements of Section 404 of that statute (“Section 404”), and we will not be required to comply with certain of those requirements until we have been subject to the reporting requirements of the Exchange Act for a specified period of time. We will be required to evaluate and disclose changes in our internal control over financial reporting on a quarterly and annual basis. Accordingly, our internal controls over financial reporting do not currently meet all of the standards contemplated by Section 404 that we will eventually be required to meet.
Our independent registered public accounting firm will not be required to formally attest to the effectiveness of our internal control over financial reporting until the date we are no longer an emerging growth company under the JOBS Act. Because we do not currently have comprehensive documentation of our internal controls and have not yet tested our internal controls in accordance with Section 404, we cannot conclude in accordance with Section 404 that we do not have a material weakness in our internal controls or a combination of significant deficiencies that could result in the conclusion that we have a material weakness in our internal controls. As a registered entity, we will be required to complete our initial assessment in a timely manner. If we are not able to implement the requirements of Section 404 in a timely manner or with adequate compliance, our operations, financial reporting or financial results could be adversely affected. Matters impacting our internal controls may cause us to be unable to report our financial information on a timely basis and thereby subject us to adverse regulatory consequences, including sanctions by the SEC or violations of applicable share exchange listing rules, and result in a breach of the covenants under the agreements governing any of our financing arrangements. There could also be a negative reaction due to a loss of investor confidence in us and the reliability of our financial statements. This could materially adversely affect us.
Our Board of Trustees may change our investment objective, operating policies and strategies without prior notice or shareholder approval.
Our Board of Trustees has the authority to modify or waive certain of our operating policies and strategies without prior notice (except as required by the Investment Company Act) and without Shareholder approval as neither our investment objective nor our operating policies and/or strategies are deemed “fundamental”. However, absent Shareholder approval, we may not change the nature of our business so as to cease to be, or
52
Table of Contents
withdraw our election as, a BDC. We cannot predict the effect any changes to our current operating policies and strategies would have on our business, operating results and value of our share. Nevertheless, the effects may adversely affect our business and impact our ability to make distributions.
Changes in legal, tax and regulatory regimes could negatively impact our business, financial condition and earnings.
Changes enacted by the current presidential administration could significantly impact the regulation of financial markets in the U.S. Areas subject to potential change, amendment or repeal include trade and foreign policy, corporate tax rates, energy and infrastructure policies, the environment and sustainability, criminal and social justice initiatives, immigration, healthcare and the oversight of certain federal financial regulatory agencies and the Federal Reserve. Certain of these changes can, and have, been effectuated through executive order. For example, the current administration has taken steps to rejoin the Paris climate accord of 2015 and incentivize certain clean energy technologies, cancel the Keystone XL pipeline, provide military support to Ukraine and change immigration enforcement priorities. Other potential changes that could be pursued by the current presidential administration could include an increase in the corporate income tax rate; changes to regulatory enforcement priorities; and spending on clean energy and infrastructure. It is not possible to predict which, if any, of these actions will be taken or, if taken, their effect on the economy, securities markets or the financial stability of the U.S. The Fund may be affected by governmental action in ways that are not foreseeable, and there is a possibility that such actions could have a significant adverse effect on the Fund and its ability to achieve its investment objective.
Additional risks arising from the differences in expressed policy preferences among the various constituencies in the branches of the U.S. government have led in the past, and may lead in the future, to short-term or prolonged policy impasses, including, among other things, related to the U.S. federal debt ceiling. Current legislation suspends the debt ceiling through early 2023, unless Congress takes legislative action to further extend or defer it. If Congress fails to act with respect to the federal debt ceiling, it is possible that the United States may default on its debt. As a result, ratings agencies may lower or threaten to lower the long-term sovereign credit rating on the United States. These developments could cause interest rates and borrowing costs to rise, which may negatively impact our business, financial condition and results of operations. Similar policy impasses within the U.S. government could, and have, resulted in shutdowns of the U.S. federal government. U.S. federal government shutdowns, especially prolonged shutdowns, could have a significant adverse impact on the economy in general and could impair the ability of issuers to raise capital in the securities markets. Any of these effects could have a material adverse effect on our business, financial condition and results of operations.
Changes to U.S. tariff and import/export regulations may have a negative effect on our portfolio companies and, in turn, harm us.
There has been ongoing discussion and commentary regarding potential significant changes to U.S. trade policies, treaties and tariffs. There remains uncertainty about the future relationship between the U.S. and other countries with respect to the trade policies, treaties and tariffs. These developments, or the perception that any of them could occur, may have a material adverse effect on global economic conditions and the stability of global financial markets, and may significantly reduce global trade and, in particular, trade between the impacted nations and the U.S. Any of these factors could depress economic activity and restrict our portfolio companies’ access to suppliers or customers and have a material adverse effect on their business, financial condition and results of operations, which in turn would negatively impact us.
Our Adviser can resign on 60 days’ notice. We may not be able to find a suitable replacement within that time, resulting in a disruption in our operations that could adversely affect our financial condition, business and results of operations.
Our Adviser has the right, under the Advisory Agreement, to resign at any time upon 60 days’ written notice, regardless of whether we have found a replacement. If our Adviser resigns, we may not be able to find a
53
Table of Contents
new external investment adviser or hire internal management with similar expertise and ability to provide the same or equivalent services on acceptable terms within 60 days, or at all. If we are unable to do so quickly, our operations are likely to experience a disruption, our financial condition, business and results of operations as well as our ability to pay distributions are likely to be adversely affected, and the net asset value of our common shares may decline.
Any new investment advisory agreement would be subject to approval by our Shareholders. Even if we are able to enter into comparable management or administrative arrangements, the integration of a new adviser or administrator and their lack of familiarity with our investment objective may result in additional costs and time delays that may adversely affect our business, financial condition and results of operations. In addition, if our Adviser resigns or is terminated, we would lose the benefits of our relationship with Silver Point, including Silver Point’s broad and longstanding sourcing relationships, rigorous underwriting process, structuring expertise, and portfolio monitoring and asset management capabilities to originate and manage attractive middle market loans throughout credit cycles on terms that are better than those available to the broader market.
Our Adviser’s responsibilities and its liability to us are limited under the Advisory Agreement, which may lead our Adviser to act in a riskier manner on our behalf than it would when acting for its own account.
Our Adviser has not assumed any responsibility to us other than to render the services described in the Advisory Agreement, and it will not be responsible for any action of our Board of Trustees in declining to follow our Adviser’s advice or recommendations. Pursuant to the Advisory Agreement, our Adviser, its affiliates, and their respective trustees, partners, officers, members, shareholders, controlling persons, employees, agents, consultants and representatives will not be liable to us for their acts under the Advisory Agreement, absent fraud, willful misfeasance or gross negligence, the knowing or material breach of the Advisory Agreement or a violation of the antifraud provisions of any U.S. federal securities law, in each case, as finally determined by a court of competent jurisdiction. These protections may lead our Adviser to act in a riskier manner when acting on our behalf than it would when acting for its own account. See “Item 1A. Risk Factors—Risks Relating to Our Investments—Our Adviser will be paid a management fee even if the value of your investment declines and our Adviser’s incentive fees may create incentives for them to make certain kinds of investments.”
Our ability to enter into transactions with our affiliates is restricted.
As a BDC, we are prohibited under the Investment Company Act from knowingly participating in certain transactions with our affiliates without, among other things, the prior approval of a majority of our Independent Trustees who have no financial interest in the transaction, or in some cases, the prior approval of the SEC. For example, any person that owns, directly or indirectly, 5% or more of our outstanding voting securities is deemed our affiliate for purposes of the Investment Company Act and, if this is the only reason such person is our affiliate, we are generally prohibited from buying any asset from or selling any asset (other than our capital shares) to such affiliate, absent the prior approval of a majority of our Independent Trustees. The Investment Company Act also prohibits “joint” transactions with an affiliate, which could include joint investments in the same portfolio company, without approval of our Independent Trustees or in some cases the prior approval of the SEC. Moreover, except in certain limited circumstances, we are prohibited from buying any asset from or selling any asset to a holder of more than 25% of our voting securities, absent prior approval of the SEC. The analysis of whether a particular transaction constitutes a joint transaction requires a review of the relevant facts and circumstances then existing.
We have received an exemptive order from the SEC that permits us to, among other things, co-invest with certain other affiliated funds, including certain funds managed by Silver Point Capital, L.P. This order is subject to certain terms and conditions. Accordingly, we cannot assure you that we will be permitted to co-invest with other accounts or other entities managed by the Silver Point investment team, other than in the limited circumstances currently permitted by applicable SEC staff guidance and interpretations or in the absence of a joint transaction.
54
Table of Contents
Material non-public information may restrict our ability to make some investments.
By reason of their responsibilities in connection with their other activities, Silver Point and its investment professionals may acquire confidential or material non-public information or be otherwise restricted from initiating transactions in certain securities. Silver Point will not be free to act upon any such information. Due to these restrictions, we may not be able to initiate a transaction that it otherwise might have initiated and may not be able to sell an investment that it otherwise might have sold.
The Fund’s anti-takeover provisions may inhibit a change of control in circumstances that could give the holders of common shares the opportunity to realize a premium over the value of common shares.
The Fund’s Declaration of Trust and Bylaws include provisions that could limit the ability of other entities or persons to acquire control of the Fund or convert the Fund to open-end status or to change the composition of the Board of Trustees. These anti-takeover provisions may inhibit a change of control in circumstances that could give the holders of common shares the opportunity to realize a premium over the value of common shares.
Certain investors are limited in their ability to make significant investments in us.
Investment companies registered under the Investment Company Act are restricted from acquiring directly or through a controlled entity more than 3% of our total outstanding voting stock (measured at the time of the acquisition), unless these funds comply with certain requirements under the Investment Company Act that would restrict the amount that they are able to invest in our securities. Private funds that are excluded from the definition of “investment company” either pursuant to Section 3(c)(1) or 3(c)(7) of the Investment Company Act are also subject to these restrictions. As a result, certain investors may be precluded from acquiring additional shares at a time that they might desire to do so.
We may experience fluctuations in our quarterly results.
We could experience fluctuations in our quarterly operating results due to a number of factors, including interest rates payable on debt investments we make, default rates on such investments, the level of our expenses, variations in and the timing of the recognition of realized and unrealized gains or losses, the degree to which we encounter competition in certain markets and general economic conditions. As a result of these factors, results for any period should not be relied upon as being indicative of performance in future periods.
There is a risk that Shareholders may not receive distributions or that our distributions may decrease over time.
We may not achieve investment results that will allow us to make a specified or stable level of cash distributions and our distributions may decrease over time. In addition, due to the asset coverage test applicable to us as a BDC, we may be limited in our ability to make distributions.
We are exposed to risks associated with changes in interest rates.
Our debt investments may be based on floating rates, such as SOFR, LIBOR, EURIBOR, Sterling Overnight Index Average (“SONIA”), the Federal Funds Rate or the Prime Rate. General interest rate fluctuations may have a substantial negative impact on our investments, the net asset value of our common shares and our rate of return on invested capital.
A reduction in the interest rates on new investments relative to interest rates on current investments could also have an adverse impact on our net interest income. An increase in interest rates could decrease the value of any investments we hold which earn fixed interest rates, including subordinated loans, senior and junior secured and unsecured debt securities and loans and high yield bonds, and also could increase our interest expense, thereby decreasing our net income. Also, an increase in interest rates available to investors could make investment in our common shares less attractive if we are not able to increase our dividend rate.
55
Table of Contents
Because we intend to borrow money, and may issue preferred shares to finance investments, our net investment income will depend, in part, upon the difference between the rate at which we borrow funds or pay distributions on preferred shares and the rate that our investments yield. As a result, we can offer no assurance that a significant change in market interest rates will not have a material adverse effect on our net investment income. In periods of rising interest rates, our cost of funds would increase except to the extent we have issued fixed rate debt or preferred shares, which could reduce our net investment income.
A rise in the general level of interest rates typically leads to higher interest rates applicable to our debt investments. Accordingly, an increase in interest rates may result in an increase in the amount of the Incentive Fee payable to our Adviser. To the extent that the floating interest rates applicable to our debt investments are subject to a negotiated cap or floor, we may be unable to capitalize upon favorable market fluctuations of interest rates. These risks are more pronounced in the current environment because, while interest rates were historically low in recent years, the Federal Reserve has begun aggressively increasing the federal funds rate to address inflation.
Changes relating to the LIBOR calculation process, the phase-out of LIBOR and the use of replacement rates for LIBOR may adversely affect the value of our portfolio securities.
The United Kingdom’s Financial Conduct Authority announced a phase out the use of LIBOR by the end of 2021. The announcement indicates that the continuation of LIBOR on the current basis cannot and will not be guaranteed. Since December 31, 2021, all sterling, euro, Swiss franc and Japanese yen LIBOR settings and the 1-week and 2-month U.S. dollar LIBOR settings have ceased to be published or are no longer representative, and after June 30, 2023, the overnight, 1-month, 3-month, 6-month and 12-month U.S. dollar LIBOR settings will cease to be published or will no longer be representative. The Fund may have investments linked to other interbank offered rates, such as the Euro Overnight Index Average (“EONIA”), which may also cease to be published. Various financial industry groups have begun planning for the transition away from LIBOR, but there are challenges to converting certain securities and transactions to a new reference rate (e.g., SOFR, which is intended to replace the U.S. dollar LIBOR).
As an alternative to LIBOR, the Financial Reporting Counsel, in conjunction with the Alternative Reference Rates Committee, a steering committee comprised of large U.S. financial institutions, recommended replacing U.S. dollar LIBOR with SOFR, a new index calculated by reference to short-term repurchase agreements, backed by Treasury securities. Abandonment of, or modifications to, LIBOR could have adverse impacts on newly issued financial instruments and any of our existing financial instruments which reference LIBOR. Given the inherent differences between LIBOR and SOFR, or any other alternative benchmark rate that may be established, there are many uncertainties regarding a transition from LIBOR, including, but not limited to, the need to amend all contracts with LIBOR as the referenced rate and how this will impact the cost of variable rate debt and certain derivative financial instruments. In addition, SOFR or other replacement rates may fail to gain market acceptance. Any failure of SOFR or alternative reference rates to gain market acceptance could adversely affect the return on, value of and market for securities linked to such rates.
Neither the effect of the LIBOR transition process nor its ultimate success can yet be known. The transition process might lead to increased volatility and illiquidity in markets for, and reduce the effectiveness of, new hedges placed against, instruments whose terms currently include LIBOR. While some existing LIBOR-based instruments may contemplate a scenario where LIBOR is no longer available by providing for an alternative rate-setting methodology, there may be significant uncertainty regarding the effectiveness of any such alternative methodologies to replicate LIBOR. Not all existing LIBOR-based instruments may have alternative rate-setting provisions and there remains uncertainty regarding the willingness and ability of issuers to add alternative rate-setting provisions in certain existing instruments. Moreover, these alternative rate-setting provisions may not be designed for regular use in an environment where LIBOR ceases to be published and may be an ineffective fallback following the discontinuation of LIBOR. On March 15, 2022, President Biden signed into law the Consolidated Appropriations Act of 2022, which among other things, provides for the use of interest rates based
56
Table of Contents
on SOFR in certain contracts currently based on LIBOR and a safe harbor from liability for utilizing SOFR-based interest rates as a replacement for LIBOR. The elimination of LIBOR could have an adverse impact on the market value of and/or transferability of any LIBOR-linked securities, loans, and other financial obligations or extensions of credit held by or due to us or on our overall financial condition or results of operations.
In addition, a liquid market for newly-issued instruments that use a reference rate other than LIBOR still may be developing. There may also be challenges for Silver Point to enter into hedging transactions against such newly-issued instruments as the market for such hedging transactions develops. All of the aforementioned may adversely affect our performance or net asset value.
Commodity Futures Trading Commission rulemaking may have a negative impact on us and our Adviser.
The Fund may engage in “commodity interest” transactions (generally, transactions in futures, certain options, certain currency transactions and certain types of swaps) only for bona fide hedging, yield enhancement and risk management purposes, in each case in accordance with the rules and regulations of the CFTC. With respect to the Fund, the Investment Adviser relies on an exclusion from the definition of “commodity pool operator” pursuant to CFTC Rule 4.5 which imposes certain commodity interest trading restrictions on the Fund. These trading restrictions permit the Fund to engage in commodity interest transactions that include (i) “bona fide hedging” transactions, as that term is defined and interpreted by the CFTC and its staff, without regard to the percentage of the Fund’s assets committed to margin and option premiums and (ii) non-bona fide hedging transactions, provided that the Fund does not enter into such non-bona fide hedging transactions if, immediately thereafter, (a) the sum of the amount of initial margin and premiums required to establish the Fund’s commodity interest positions would exceed 5% of the Fund’s liquidation value, after taking into account unrealized profits and unrealized losses on any such transactions, and (b) the aggregate net notional value of the Fund’s commodity interest positions would exceed 100% of the Fund’s liquidation value, after taking into account unrealized profits and unrealized losses on any such positions. In addition to meeting one of the foregoing trading limitations, interests in the Fund may not be marketed as or in a commodity pool or otherwise as a vehicle for trading in the futures, options or swaps markets. If the Investment Adviser was required to register as a commodity pool operator with respect to the Fund, compliance with additional registration and regulatory requirements would increase the Fund expenses. Other potentially adverse regulatory initiatives could also develop.
New market structure requirements applicable to derivatives could significantly increase the costs of utilizing OTC derivatives.
The Dodd-Frank Act enacted, and the CFTC and the SEC have issued or proposed rules to implement, both broad new regulatory requirements and broad new structural requirements applicable to OTC derivative markets and, to a lesser extent, listed commodity futures (and futures options) markets. Similar changes are in the process of being adopted in the European Union, Japan, and other major financial markets.
These changes include, but are not limited to: requirements that many categories of the most liquid OTC derivatives (currently limited to specified interest rate swaps and index credit default swaps) be executed on qualifying, regulated exchanges and be submitted for clearing; real-time public and regulatory reporting of specified information regarding OTC derivative transactions; and enhanced documentation requirements and recordkeeping requirements. Margin requirements for uncleared OTC derivatives and position limits are also expected to be adopted by the CFTC and other regulators in the future.
While these changes are intended to mitigate systemic risk and to enhance transparency and execution quality in the OTC derivative markets, the impact of these changes is not known at this time. For instance, cleared OTC derivatives are subject to margin requirements established by regulated clearinghouses, including daily exchanges of cash variation (or mark-to-market) margin and an upfront posting of cash or securities initial margin to cover the clearinghouse’s potential future exposure to the default of a party to a particular OTC derivative transaction. Furthermore, “financial end users,” such as us, that enter into OTC derivatives that are not
57
Table of Contents
cleared will, pending finalization of the applicable regulations, generally be required to provide margin to collateralize their obligations under such derivatives. Under current proposed rules, the level of margin that would be required to be collected in connection with uncleared OTC derivatives is in many cases substantially greater than the level currently required by market participants or clearinghouses.
These changes could significantly increase the costs to us of utilizing OTC derivatives, reduce the level of exposure that we are able to obtain (whether for risk management or investment purposes) through OTC derivatives, and reduce the amounts available to us to make non-derivative investments. These changes could also impair liquidity in certain OTC derivatives and adversely affect the quality of execution pricing that we are able to obtain, all of which could adversely impact our investment returns. Furthermore, the margin requirements for cleared and uncleared OTC derivatives may require that our Adviser, in order to maintain its exclusion from the definition of CPO under CFTC Rule 4.5, limit our ability to enter into hedging transactions or to obtain synthetic investment exposures, in either case adversely affecting our ability to mitigate risk.
Proposed position aggregation requirements may restrict the swap positions that our Adviser may enter into.
The Dodd-Frank Act significantly expanded the scope of the CFTC’s authority and obligation to require reporting of, and adopt limits on, the size of positions that market participants may own or control in commodity futures and futures options contracts and swaps. The Dodd-Frank Act also narrowed existing exemptions from such position limits for a broad range of risk management transactions.
In accordance with the requirements of the Dodd-Frank Act, the CFTC recently established speculative position limits on additional listed futures and options on futures and economically equivalent OTC derivatives. Such limits generally apply in the aggregate across contracts based on the same underlying commodity. The CFTC may, in the future, adopt additional position limits on swaps including those that are economically equivalent to United States listed futures and options on futures contracts, on non-physical commodities, such as rates, currencies, equities and credit default swaps. The CFTC has adopted rules which narrow past precedents and guidance that permit market participants to disaggregate for position limit purposes, positions that are independently controlled. While certain persons, contracts or transactions or classes thereof are exempt from the speculative position limit requirements, such broadened position aggregation requirements may further restrict the swap positions that our Adviser may enter into on our behalf.
The full impact of these recent changes is not known at this time. Individually and collectively, these and any future changes could increase our costs of maintaining positions in commodity futures and options on futures contracts and swaps and reduce the level of exposure we are able to obtain (whether for risk management or investment purposes) through commodity futures and futures option contracts and swaps. These changes could also impair liquidity in certain swaps and adversely affect the quality of execution pricing that we are able to obtain, all of which could adversely impact our investment returns.
We may be required to dispose of investments at an inopportune time if a Liquidity Event does not occur prior to the end of the Investment Period.
Pursuant to our Shareholder Agreements, if a Liquidity Event does not occur prior to the end of the Investment Period, we will be required to use our best efforts to wind down, liquidate and dissolve the Fund, which may require us to dispose of investments at an inopportune time and/or price. Such an occurrence could adversely effect our business, financial condition and results of operation and may create additional risk of loss. See “Item 1. Business—Formation History and Trust Conversion—Shareholder Agreements.”
We are dependent on information systems, and systems failures could significantly disrupt our business, which may, in turn, negatively affect our liquidity, financial condition or results of operations.
Our business is dependent on our and third parties’ communications and information systems. Any failure or interruption of those systems, including as a result of the termination of an agreement with any third-party
58
Table of Contents
service providers, could cause delays or other problems in our activities. Our financial, accounting, data processing, backup or other operating systems and facilities may fail to operate properly or become disabled or damaged as a result of a number of factors including events that are wholly or partially beyond our control and adversely affect our business. There could be:
| • | sudden electrical or telecommunications outages; |
| • | natural disasters such as earthquakes, tornadoes and hurricanes; |
| • | disease pandemics; |
| • | events arising from local or larger scale political or social matters, including terrorist acts; and |
| • | cyber-attacks. |
These events, in turn, could have a material adverse effect on our operating results and negatively affect the market price of our common shares and our ability to pay distributions to our Shareholders.
Cybersecurity risks and cyber incidents may adversely affect our business by causing a disruption to our operations, a compromise or corruption of our confidential information and/or damage to our business relationships, all of which could negatively impact our business, financial condition and operating results.
A cyber incident is considered to be any adverse event that threatens the confidentiality, integrity or availability of our information resources. These incidents may be an intentional attack or an unintentional event and could involve gaining unauthorized access to our information systems for purposes of misappropriating assets, stealing confidential information, corrupting data or causing operational disruption. Cyber attacks are becoming increasingly common and more sophisticated, and may be perpetrated by computer hackers, cyber-terrorists or others engaged in corporate espionage. The result of these incidents may include disrupted operations, misstated or unreliable financial data, liability for stolen assets or information, increased cybersecurity protection and insurance costs, litigation and damage to our business relationships. In addition, cybersecurity risks may also impact issuers of securities in which the Fund invests, which may cause the Fund’s investment in such issuers to lose value. There have been a number of recent cases of companies reporting the unauthorized disclosure of client or customer information, as well as cyberattacks involving the dissemination, theft and destruction of corporate information or other assets, as a result of failure to follow procedures by employees or contractors or as a result of actions by third parties, including actions by terrorist organizations and hostile foreign governments.
As part of our business, we store and transmit large amounts of electronic information, including information relating to our transactions. Similarly, our service providers may process, store and transmit such information. The Fund has systems in place to protect such information and prevent data loss and security breaches. However, such measures cannot provide absolute security. The techniques used to obtain unauthorized access to data, disable or degrade service, or sabotage systems change frequently and may be difficult to detect. Hardware or software acquired from third parties may contain defects in design or manufacture or other problems that could compromise information security. Network connected services provided by third parties to the Fund may be susceptible to compromise, leading to a breach of the Fund’s network. The systems or facilities may be susceptible to employee error or malfeasance, government surveillance, or other security threats. On-line services provided by the Fund may also be susceptible to compromise. Breach of the information systems may cause information relating to our transactions and other confidential information to be lost or improperly accessed, used or disclosed.
The Fund’s service providers are subject to the same electronic information security threats as the Adviser. If a service provider fails to adopt or adhere to adequate data security policies, or in the event of a breach of its networks, information relating to our transactions and other confidential information may be lost or improperly accessed, used or disclosed. Furthermore, the Fund cannot control the cybersecurity policies, plans and systems
59
Table of Contents
put in place by its service providers or any other third parties whose operations may affect the Fund or its Shareholders. There can be no assurance that the Fund or its service providers will not suffer losses relating to cyber attacks or other information security breaches in the future.
The loss or improper access, use or disclosure of the Fund’s proprietary information may cause the Fund to suffer, among other things, financial loss, the disruption of its business, liability to third parties, regulatory intervention or reputational damage. Any of the foregoing events could have a material adverse effect on our results of operations, financial conditions and business.
Terrorist attacks, acts of war, or natural disasters may impact the businesses in which we invest, and harm our business, operating results, and financial conditions.
Terrorist acts, acts of war, or natural disasters have created, and continue to create, economic and political uncertainties and have contributed to global economic instability. Future terrorist activities, military or security operations, or natural disasters could further weaken the domestic/global economies and create additional uncertainties, which may negatively impact the businesses in which we invest directly or indirectly and, in turn, could have a material adverse impact on our business, operating results, and financial condition. Losses from terrorist attacks and natural disasters are generally uninsurable.
Uncertainty regarding the impact of the United Kingdom’s departure from the European Union could negatively impact our business, financial condition and earnings.
On January 31, 2020, the United Kingdom officially withdrew from the EU, commonly referred to as “Brexit.” Following a transition period, the United Kingdom and the EU entered into a Trade and Cooperation Agreement (the “TCA”), which came into full force on May 1, 2021 and set out the foundation of the economic and legal framework for trade between the United Kingdom and the EU. As the TCA is a new legal framework, the implementation of the TCA may result in uncertainty in its application and periods of volatility in both the United Kingdom and wider European markets. The United Kingdom’s exit from the EU is expected to result in additional trade costs and disruptions in this trading relationship. A number of issues, particularly in relation to the financial services sector, remain to be resolved through further bilateral negotiation. Furthermore, there is the possibility that either party may impose tariffs on trade in the future in the event that regulatory standards between the EU and the UK diverge. The terms of the future relationship may cause continued uncertainty in the global financial markets and may adversely affect our business, financial condition and earnings.
Risks Relating to Our Investments
Our investments are speculative and involve significant risk.
All investments risk the loss of capital. Our investment program involves, without limitation, risks associated with investments in speculative assets and the use of speculative investment strategies and techniques, interest rates, volatility, credit deterioration or default risks, currency risks, systems risks and other risks inherent in our activities. Our investments may be materially affected by conditions in the financial markets and overall economic conditions occurring globally and in particular markets where we may invest. Although we intend to enter into hedging and other arrangements to mitigate certain of such risks (including, for example, currency exposure), hedging and other such arrangements are not expected to play a significant role in our overall investment strategy.
Our methods of minimizing such risks may not accurately predict future risk exposures. Risk management techniques are based in part on the observation of historical market behavior, which may not predict market divergences that are larger than historical indicators. Also, information used to manage risks may not be accurate, complete or current, and such information may be misinterpreted. Although we intend to utilize appropriate risk management strategies, such strategies cannot fully insulate us from the risks inherent in its planned activities. Moreover, in certain situations we may be unable to, or may choose not to, implement risk management strategies because of the costs involved or other relevant factors.
60
Table of Contents
We intend to invest in loans, bonds and similar debt obligations. The value of debt obligations can fluctuate in response to actual and perceived changes in creditworthiness, non-U.S. exchange rates, political stability or soundness of economic policies. Debt obligations are subject to the risk of the issuer’s inability to meet principal and interest payments on its obligations (i.e., credit risk) and are subject to price volatility due to such factors as interest rate sensitivity, market perception of the creditworthiness of the issuer and general market liquidity (i.e., market risk). These obligations are subject to other risks, including, without limitation: (i) declines in the value of collateral securing the obligations, if any; (ii) declines in the enterprise value of the obligor; (iii) failure of restrictive covenants, if any, to adequately protect the interests of the creditor; (iv) the failure of the bankruptcy process (or other determination of creditors’ rights) to produce the outcome anticipated by the investor; (v) the possible invalidation of an investment transaction as a preference or fraudulent conveyance under relevant creditors’ rights laws; (vi) so-called lender-liability claims by the issuer of the obligations; and (vii) environmental or other liabilities that may arise with respect to collateral securing the obligations.
We intend to invest a substantial portion of our assets in senior secured loans and secondary purchases of debt issued by small and middle market companies, and to a lesser extent, preferred shares and equity investments.
Senior Secured Loans. When we make a “unitranche” or senior secured term loan investment in a portfolio company, we generally take a security interest in the available assets of the portfolio company, including the equity interests of its subsidiaries, which we expected to help mitigate the risk that we will not be repaid. However, there is a risk that the collateral securing the loans may decrease in value over time, may be difficult to sell in a timely manner, may be difficult to appraise, and may fluctuate in value based upon the success of the business and market conditions, including as a result of the inability of the portfolio company to raise additional capital. In some circumstances, the lien could be subordinated to claims of other creditors. In addition, deterioration in a portfolio company’s financial condition and prospects, including its inability to raise additional capital, may be accompanied by deterioration in the value of the collateral for the loan. Consequently, the fact that a loan is secured does not guarantee that we will receive principal and interest payments according to the loan’s terms, or at all, or that we will be able to collect on the loan should we be forced to enforce its remedies.
Unsecured Debt, including Mezzanine Debt. To the extent we invest in mezzanine or other junior debt, we may incur additional risks. Junior debt investments, including mezzanine debt investments, generally will be subordinated to senior loans and will either have junior security interests or be unsecured. As such, other creditors may rank senior to us in the event of an insolvency. This may result in greater risk and loss of principal.
Equity Investments. When we invest in senior secured loans or mezzanine loans, we may acquire equity securities, including warrants, as well. In addition, we may invest directly in the equity securities of portfolio companies. The goal is ultimately to dispose of such equity interests and realize gains upon the disposition of such interests. However, the equity interests we receive may not appreciate in value and, in fact, may decline in value. Accordingly, we may not be able to realize gains from our equity interests, and any gains that we do realize on the disposition of any equity interests may not be sufficient to offset any other losses.
Preferred Securities. To the extent we invest in preferred securities, we may incur particular risks, including:
| • | preferred shares and preferred securities generally include provisions that permit the issuer, at its discretion, to defer distributions for a stated period without any adverse consequences to the issuer; |
| • | if we own a preferred security that is deferring its distributions or paying interest in-kind, we may be required to report income for U.S. federal income tax purposes before we receive such distributions and we may be required to pay incentive compensation on non-cash accruals that ultimately may not be realized; |
��
| • | preferred securities are subordinated to bonds and other debt instruments in a company’s capital structure in terms of priority to corporate income and liquidation payments, and therefore are subject to |
61
Table of Contents
greater credit risk than more senior debt instruments, and preferred shares are similarly subordinated to preferred securities; and |
| • | generally, preferred shares and preferred security holders have no voting rights with respect to the issuing company unless preferred distributions or dividends have been in arrears for a specified number of periods, at which time the holders may elect a number of trustees to the issuer’s board, but only until all the arrearages have been paid. |
Our portfolio companies may incur debt or issue equity securities that rank equally with, or senior to, our investments in such companies.
Our portfolio companies may have, or may be permitted to incur, other debt, or issue other equity securities, that rank equally with, or senior to, our investments. By their terms, such instruments may provide that the holders are entitled to receive payment of dividends, interest or principal on or before the dates on which we are entitled to receive payments in respect of our investments. These debt instruments would usually prohibit the portfolio companies from paying interest on or repaying our investments in the event and during the continuance of a default under such debt. Also, in the event of insolvency, liquidation, dissolution, reorganization or bankruptcy of a portfolio company, holders of securities ranking senior to our investment in that portfolio company typically are entitled to receive payment in full before we receive any distribution in respect of our investment. After repaying such holders, the portfolio company may not have any remaining assets to use for repaying its obligation to us. In the case of securities ranking equally with our investments, we would have to share on an equal basis any distributions with other security holders in the event of an insolvency, liquidation, dissolution, reorganization or bankruptcy of the relevant portfolio company.
The rights we may have with respect to the collateral securing any junior priority loans we make to our portfolio companies may also be limited pursuant to the terms of one or more intercreditor agreements that we enter into with the holders of senior debt. Under such an intercreditor agreement, at any time that senior obligations are outstanding, we may forfeit certain rights with respect to the collateral to the holders of the senior obligations. These rights may include the right to commence enforcement proceedings against the collateral, the right to control the conduct of such enforcement proceedings, the right to approve amendments to collateral documents, the right to release liens on the collateral and the right to waive past defaults under collateral documents. We may not have the ability to control or direct such actions, even if our rights as junior lenders are adversely affected.
Investing in middle market companies involves a number of significant risks.
We intend to invest primarily in middle market companies which involves a number of significant risks, including:
| • | such issuers may have limited financial resources and may be unable to meet their obligations under their debt securities that we hold, which may be accompanied by a deterioration in the value of any collateral and a reduction in the likelihood of us realizing any guarantees we may have obtained in connection with our investment; |
| • | they typically have shorter operating histories, narrower product lines and smaller market shares than larger businesses, which tend to render them more vulnerable to competitors’ actions and market conditions, as well as general economic downturns; |
| • | they are more likely to depend on the management talents and efforts of a small group of persons; therefore, the death, disability, resignation or termination of one or more of these persons could have a material adverse impact on the portfolio company and, in turn, on our results of operations; |
| • | they generally have less predictable operating results, may from time to time be parties to litigation, may be engaged in rapidly changing businesses with products subject to a substantial risk of obsolescence, and may require substantial additional capital to support their operations, finance expansion or maintain their competitive position; |
62
Table of Contents
| • | our Adviser and our executive officers or Trustees may, in the ordinary course of business, be named as defendants in litigation arising from our investments in the portfolio companies; |
| • | they generally have less publicly available information about their businesses, operations and financial condition and, if we are unable to uncover all material information about these companies, we may not make a fully informed investment decision; and |
| • | they may have difficulty accessing the capital markets to meet future capital needs, which may limit their ability to grow or to repay their outstanding indebtedness upon maturity. |
Our investments in sub-investment grade (also known as “junk” securities) and non-rated securities are speculative.
The instruments in which we invest typically are not rated by any rating agency, but our Adviser believes that if such instruments were rated, they would be below investment grade (rated lower than “Baa3” by Moody’s Investors Service and lower than “BBB-” by Fitch Ratings or Standard & Poor’s Rating Services). These securities, which are often referred to as “junk bonds” or “high yield bonds,” have predominantly speculative characteristics with respect to the issuer’s capacity to pay interest and repay principal. They may also be difficult to value and illiquid. We may invest without limit in debt or other securities of any rating, as well as debt or other securities that have not been rated by any nationally recognized statistical rating organization.
We anticipate that a substantial portion of our portfolio will consist of investments that have been given either a below investment grade rating from Moody’s Investors Service, Inc. and Standard & Poor’s Corporation or have not been rated by any ratings agency. Securities in the lower-rated categories and comparable non-rated securities are subject to greater risk of loss of principal and interest than higher-rated and comparable non-rated securities, and are generally considered to be predominantly speculative with respect to the issuer’s capacity to pay interest and repay principal. They are also generally considered to be subject to greater risk than securities with higher ratings or comparable non-rated securities in the case of deterioration of general economic conditions. Because investors generally perceive that there are greater risks associated with lower-rated and comparable non-rated securities, the yields and prices of such securities may be more volatile than those for higher-rated and comparable non-rated securities. The market for lower-rated and comparable non-rated securities is thinner, often less liquid, and less active than that for higher-rated or comparable securities, which can adversely affect the prices at which these securities can be sold and may even make it impractical to sell such securities.
We may invest in U.S. government issued or guaranteed securities that involve special risks.
Obligations issued or guaranteed by the U.S. government, its agencies, authorities and instrumentalities and backed by the full faith and credit of the U.S. guarantee only that principal and interest will be timely paid to holders of the securities. These entities do not guarantee that the value of such obligations will increase, and, in fact, the market values of such obligations may fluctuate. In addition, not all U.S. government securities are backed by the full faith and credit of the United States; some are the obligation solely of the entity through which they are issued. There is no guarantee that the U.S. government would provide financial support to its agencies and instrumentalities if not required to do so by law.
In 2011, S&P lowered its long term sovereign credit rating on the U.S. to “AA+” from “AAA.” The downgrade by S&P increased volatility in both shares and bond markets, resulting in higher interest rates and higher Treasury yields, and increased the costs of all kinds of debt. Repeat occurrences of similar events could have significant adverse effects on the U.S. economy generally and could result in significant adverse impacts on issuers of securities held by the Fund itself. Our Adviser cannot predict the effects of similar events in the future on the U.S. economy and securities markets or on the Fund’s portfolio. Our Adviser monitors developments and seeks to manage the Fund’s portfolio in a manner consistent with achieving the Fund’s investment objective, but there can be no assurance that it will be successful in doing so and our Adviser may not timely anticipate or manage existing, new or additional risks, contingencies or development.
63
Table of Contents
Investing in real estate related investments involves a number of significant risks.
Our real estate investments are comprised primarily of debt instruments secured by real estate-related assets. Deterioration of real estate fundamentals generally, and in North America in particular, could negatively impact our performance by making it more difficult for borrowers, or borrower entities, to satisfy their debt payment obligations, increasing the default risk applicable to these borrower entities. Changes in general economic conditions may affect the value of underlying real estate collateral relating to our investments and may include economic and/or market fluctuations, casualty or condemnation losses, decreases in property values, changes in the appeal of properties to tenants, changes in supply and demand, fluctuations in real estate fundamentals, the financial resources of borrower entities, various uninsured or uninsurable risks, natural disasters, changes in real property tax rates and/or tax credits, changes in operating expenses, changes in interest rates, changes in inflation rates, changes in the availability of debt financing and/or mortgage funds which may render the sale or refinancing of properties difficult or impracticable.
Certain loan investments may be subject to the risks inherent in the ownership of real property to the extent that real property may be underlying collateral for such investments.
Certain loan investments may be subject to the risks inherent in the ownership of real property to the extent that real property may be underlying collateral for such investments. While we will typically value such assets based on their real estate liquidation value alone for underwriting purposes, a property’s tenant(s), a property’s attributes and the quality of the neighborhood each may adversely impact the ability of the borrower to repay the loan and the value of the property. Factors that can affect the value of loans that are targeted for investment by us include, without limitation, (i) the diversity and quality of a property’s tenants, including whether the owner relies on a single or dominant tenant and the creditworthiness of any such tenant; (ii) the terms, including duration, of a property’s leases with tenants; (iii) an economic decline in the business that occupies a property; (iv) a decline in a particular business segment, which thereby reduces demand for a particular type of space; (v) the physical attributes of a property (both individually and in comparison to competing properties), including, but not limited to, a property’s age, its physical condition, design and appearance, its location and access to transportation, and its ability to offer amenities (e.g., sophisticated systems and/or wiring requirements); (vi) a property’s technological attributes and adaptability to changes in a tenant’s technological needs; (vii) the desirability of the neighborhood as a location; (viii) continued expenses for maintenance, refurbishment and modernization of existing facilities, even prior to their useful life; (ix) a decline in the managerial capacity or prowess of a business operator; (x) the strength of the local economy, including the cost of labor, quality of life and the tax environment; (xi) an adverse impact on the neighborhood’s population, including employment growth (thereby creating demand for office space), each influence the ability of the borrower to repay the loan and the underlying value of the business occupying the property and (xii) acts of God and other factors beyond our control.
Our Adviser and our sourcing channels may not present us with a sufficient volume of investments.
The identification of investments suitable for us is difficult and involves significant uncertainty. There can be no guarantee that our Adviser will identify such investment opportunities. Even if such investments are identified there can be no assurance that they will not decline in value considerably while held by us including, without limitation, as a result of weakness in the credit or other markets (including the commercial real estate market), or other circumstances.
Our Adviser expects to source a substantial volume of our investment opportunities through Silver Point’s investment professionals, internal sourcing platform and external relationships. To the extent these sourcing channels do not present us with a sufficient volume of investment opportunities, or the opportunities presented are not suitable for investment, our results of operations, financial conditions and business may be adversely affected.
64
Table of Contents
Our due diligence investigation may not reveal or highlight all relevant facts that may be necessary or helpful in evaluating an investment opportunity.
Although we will make every effort to conduct appropriate due diligence prior to making an investment, the due diligence process will be subject to inherent limitations. Due diligence may be required to be undertaken on an expedited basis in order to take advantage of available investment opportunities and may require us to rely on limited resources that are available, including information provided by the target of the investment and third-party consultants, legal advisers, accountants and investment banks. As a result, it is uncertain whether the due diligence investigation will reveal or highlight all relevant facts that may be necessary or helpful in evaluating such investment opportunity, and it is likely that there will be cases in which important information was not available or obtained.
Our portfolio securities may not have a readily available market price and, in such a case, we will value these securities at fair value as determined in good faith under procedures adopted for the Fund, which valuation is inherently subjective and may not reflect what we may actually realize for the sale of the investment.
The majority of our investments are expected to be in debt instruments that do not have readily ascertainable market prices. The fair value of such debt investments, and other portfolio securities that are not publicly traded or whose market prices are not readily available will be determined in good faith by our Adviser, as the Fund’s valuation designee, under procedures approved by our Board of Trustees. Our Adviser is expected to utilize the services of independent third-party valuation firms in determining the fair value of any securities. Investment professionals from our Adviser may be asked to prepare portfolio company valuations using sources and/or proprietary models depending on the availability of information on our assets and the type of asset being valued, all in accordance with our valuation policy. The participation of our Adviser in our valuation process could result in a conflict of interest, because our Adviser is receiving a performance-based incentive fee.
Because fair valuations, and particularly fair valuations of private securities and private companies, are inherently uncertain, may fluctuate over short periods of time and are often based to a large extent on estimates, comparisons and qualitative evaluations of private information, it could make it more difficult for investors to value accurately our investments and could lead to undervaluation or overvaluation of our common shares. In addition, the valuation of these types of securities may not reflect what we may actually realize for the sale of the investment and may result in substantial write-downs and earnings volatility.
Our NAV as of a particular date may be materially greater than or less than the value that would be realized if our assets were to be liquidated as of such date. For example, if we were required to sell a certain asset or all or a substantial portion of its assets on a particular date, the actual price that we would realize upon the disposition of such asset or assets could be materially less than the value of such asset or assets as reflected in our NAV. Volatile market conditions could also cause reduced liquidity in the market for certain assets, which could result in liquidation values that are materially less than the values of such assets as reflected in our NAV.
The lack of liquidity in our investments may adversely affect our business.
We expect that a substantial portion of our portfolio will consist of investments in private companies and companies with attributes that may be perceived as more risky or speculative by loan counterparties. These attributes include, but are not limited to: (i) borrowers with an imminent need for capital; (ii) borrowers with complex capital structures; (iii) borrowers undergoing corporate reorganizations or restructurings; (iv) borrowers in out-of-favor or misunderstood industries; and/or (v) borrowers pledging non-traditional assets as security. Our ability to make a fully informed investment decision may be constrained, as there is little public information available about private companies, which also may not have third-party debt ratings or audited financial statements. Insufficient access to information about market comparables may also constrain the quality of the investment decision process. We will be dependent on our Adviser to obtain adequate information through due diligence to evaluate the creditworthiness and potential returns from investing in these companies. If we are unable to obtain sufficient material information about the companies in which we invest, we may not make a fully informed investment decision and we may suffer losses.
65
Table of Contents
The illiquidity of our investments in loans to private companies may make it difficult for us to sell such investments if the need arises. Therefore, if we are required to or desire to liquidate all or a portion of our portfolio quickly, we could realize significantly less than the value at which we have recorded our investments. In addition, we may face other restrictions on our ability to liquidate an investment in a business entity to the extent that we hold a significant portion of a business entity’s equity or if we or our Adviser have or could be deemed to have material non-public information regarding that business entity.
Our portfolio may be focused in a limited number of portfolio companies, which will subject us to a risk of significant loss if any of these companies default on their obligations under any of their debt instruments or if there is a downturn in a particular industry.
Our portfolio may be focused in a limited number of portfolio companies and industries. We do not have fixed guidelines for diversification, and while we are not targeting any specific industries, from time to time our investments may be focused on a relatively few industries. As a result, the aggregate returns that we realize may be significantly adversely affected if a small number of investments perform poorly or if we need to write down the value of any one investment. Additionally, a downturn in any particular industry in which we are invested could significantly affect its aggregate returns. Market conditions, including increased competition, may also cause our portfolio to be comprised of assets that differ significantly from our expectations.
We may not be in a position to exercise control over our portfolio companies or to prevent decisions by management of our portfolio companies that could decrease the value of our investments.
The loans and other investments we make will generally be non-controlling investments, meaning we will not be in a position to control the management, operation and strategic decision-making of the companies in which we invest. To the extent that we do not hold a controlling equity interest in a portfolio company, we are subject to the risk that such portfolio company may make business decisions with which we disagree, and the shareholders and management of such portfolio company may take risks or otherwise act in ways that are adverse to our interests. Due to the lack of liquidity for the debt and equity investments that we typically hold in our portfolio companies, we may not be able to dispose of our investments in the event we disagree with the actions of a portfolio company, and may therefore suffer a decrease in the value of our investments.
In addition, we may not be in a position to control any portfolio company by investing in its debt securities. As a result, we are subject to the risk that a portfolio company in which we invest may make business decisions with which we disagree and the management of such company, as representatives of the holders of their common equity, may take risks or otherwise act in ways that do not serve our interests as debt investors.
Securitization of our assets subjects us to various risks.
We have securitized assets to generate cash for funding new investments. We refer to the term “securitize” to describe a form of leverage under which a company such as us (sometimes referred to as an “originator” or “sponsor”) transfers income producing assets to a single-purpose, bankruptcy-remote subsidiary (also referred to as a “special purpose entity” or “SPE”), which is established solely for the purpose of holding such assets and entering into a structured finance transaction. The SPE then issues notes secured by such assets. The special purpose entity issues the notes in the capital markets either publicly or privately to a variety of investors, including banks, non-bank financial institutions and other investors. There may be a single class of notes or multiple classes of notes, the most senior of which carries less credit risk and the most junior of which may carry substantially the same credit risk as the equity of the SPE.
An important aspect of most debt securitization transactions is that the sale and/or contribution of assets into the SPE be considered a true sale and/or contribution for accounting purposes and that a reviewing court would not consolidate the SPE with the operations of the originator in the event of the originator’s bankruptcy based on equitable principles. Viewed as a whole, a debt securitization seeks to lower risk to the note purchasers by
66
Table of Contents
isolating the assets collateralizing the securitization in an SPE that is not subject to the credit and bankruptcy risks of the originator. As a result of this perceived reduction of risk, debt securitization transactions frequently achieve lower overall leverage costs for originators as compared to traditional secured lending transactions.
In accordance with the above description, to securitize loans, we have created and, may in future, create one or more wholly-owned subsidiaries and contribute a pool of our assets to such subsidiaries. The SPE is funded with, among other things, whole loans or interests from other pools and such loans may or may not be rated. The SPE then sells its notes to purchasers who are willing to accept a lower interest rate and the absence of any recourse against us to invest in a pool of income producing assets to which none of our creditors would have access. We retain all of the equity in the SPE. An inability to successfully securitize portions of our portfolio or otherwise leverage our portfolio through secured and unsecured borrowings could limit our ability to grow our business and fully execute our business strategy, and could decrease our earnings. However, the successful securitization of portions of our portfolio exposes us to a risk of loss for the equity we retain in the SPE and might expose us to greater risk on our remaining portfolio because the assets we retain may tend to be those that are riskier and more likely to generate losses. A successful securitization may also impose financial and operating covenants that restrict our business activities and may include limitations that could hinder our ability to finance additional loans and investments. The Investment Company Act may also impose restrictions on the structure of any securitizations.
Interests we hold in the SPE are subordinated to the other interests issued by the SPE. As such, we only receive cash distributions on such interests if the SPE has made all cash interest and other required payments on all other interests it has issued. In addition, our subordinated interests are unsecured and rank behind all of the secured creditors, known or unknown, of the SPE, including the holders of the senior interests it has issued. Consequently, to the extent that the value of the SPE’s portfolio of assets has been reduced as a result of conditions in the credit markets, or as a result of defaults, the value of the subordinated interests we retain would be reduced. Securitization imposes on us the same risks as borrowing except that our risk in a securitization is limited to the amount of subordinated interests we retain, whereas in a borrowing or debt issuance by us directly we would be at risk for the entire amount of the borrowing or debt issuance.
We may also engage in transactions utilizing SPEs and securitization techniques where the assets sold or contributed to the SPE remain on our balance sheet for accounting purposes. If, for example, we sell the assets to the SPE with recourse or provide a guarantee or other credit support to the SPE, its assets will remain on our balance sheet. Consolidation would also generally result if we, in consultation with the SEC, determine that consolidation would result in a more accurate reflection of our assets, liabilities and results of operations. In these structures, the risks will be essentially the same as in other securitization transactions but the assets will remain our assets for purposes of the limitations described above on investing in assets that are not qualifying assets and the leverage incurred by the SPE will be treated as borrowings incurred by us for purposes of our limitation on the issuance of senior securities.
We will attribute the borrowing of any SPE that we wholly-own or primarily control that primarily engages in investment activities in securities or other assets to our own borrowings for purposes of the leverage limits under the Investment Company Act, though we will not be a primary control person of any joint venture we may enter into if each joint venture party has equal control of the joint venture.
Our Adviser may have conflicts of interest with respect to potential securitizations in as much as securitizations that are not consolidated may reduce our assets for purposes of determining its investment advisory fee although in some circumstances our Adviser may be paid certain fees for managing the assets of the SPE so as to reduce or eliminate any potential bias against securitizations.
67
Table of Contents
The application of the risk retention rules under Section 941 of the Dodd-Frank Act to CLOs may have broader effects on the CLO and loan markets in general, potentially resulting in fewer or less desirable investment opportunities for us.
Section 941 of the Wall Street Reform and Consumer Protection Act (“Dodd-Frank Act”) added a provision to the Exchange Act, requiring the seller, sponsor or securitizer of a securitization vehicle to retain no less than five percent of the credit risk in assets it sells into a securitization and prohibiting such securitizer from directly or indirectly hedging or otherwise transferring the retained credit risk. The responsible federal agencies adopted final rules implementing these restrictions on October 22, 2014. The risk retention rules became effective with respect to CLOs two years after publication in the Federal Register. Under the final rules, the asset manager of a CLO is considered the sponsor of a securitization vehicle and is required to retain five percent of the credit risk in the CLO, which may be retained horizontally in the equity tranche of the CLO or vertically as a five percent interest in each tranche of the securities issued by the CLO. Although the final rules contain an exemption from such requirements for the asset manager of a CLO if, among other things, the originator or lead arranger of all of the loans acquired by the CLO retain such risk at the asset level and, at origination of such asset, takes a loan tranche of at least 20% of the aggregate principal balance, it is possible that the originators and lead arrangers of loans in this market will not agree to assume this risk or provide such retention at origination of the asset in a manner that would provide meaningful relief from the risk retention requirements for CLO managers.
We believe that the U.S. risk retention requirements imposed for CLO managers under Section 941 of the Dodd-Frank Act has created some uncertainty in the market in regard to future CLO issuance. Given that certain CLO managers may require capital provider partners to satisfy this requirement, we believe that this may create additional risks for us in the future.
On February 9, 2018, a panel of the United States Court of Appeals for the District of Columbia Circuit ruled (the “D.C. Circuit Ruling”) that the federal agencies exceeded their authority under the Dodd-Frank Act in adopting the final rules as applied to asset managers of open-market CLOs. On April 5, 2018, the United States District Court for the District of Columbia entered an order implementing the D.C. Circuit Ruling and thereby vacated the U.S. Risk Retention Rules insofar as they apply to CLO managers of “open market CLOs”.
As of the date of hereof, there has been no petition for writ of certiorari filed requesting the case to be heard by the United States Supreme Court. Since there hasn’t been a successful challenge to the D.C. Circuit Ruling and the United States District Court for the District of Columbia has issued the above described order implementing the D.C. Circuit Ruling, collateral managers of open market CLOs are no longer required to comply with the U.S. risk retention rules at this time. As such, it is possible that some collateral managers of open market CLOs will decide to dispose of the notes constituting the “eligible vertical interest” or “eligible horizontal interest” they were previously required to retain, or decide to take other action with respect to such notes that is not otherwise permitted by the U.S. risk retention rules. As a result of this decision, certain CLO managers of “open market CLOs” will no longer be required to comply with the U.S. risk retention rules solely because of their roles as managers of “open market CLOs”, and there may be no “sponsor” of such securitization transactions and no party may be required to acquire and retain an economic interest in the credit risk of the securitized assets of such transactions.
There can be no assurance or representation that any of the transactions, structures or arrangements currently under consideration by or currently used by CLO market participants will comply with the U.S. risk retention rules to the extent such rules are reinstated or otherwise become applicable to open market CLOs. The ultimate impact of the U.S. risk retention rules on the loan securitization market and the leveraged loan market generally remains uncertain, and any negative impact on secondary market liquidity for securities comprising a CLO may be experienced due to the effects of the U.S. risk retention rules on market expectations or uncertainty, the relative appeal of other investments not impacted by the U.S. risk retention rules and other factors.
68
Table of Contents
Our failure to make follow-on investments in our portfolio companies could impair the value of our portfolio.
Following an initial investment in a portfolio company, we may make additional investments in that portfolio company as “follow-on” investments, in order to increase or maintain in whole or in part our equity ownership percentage, exercise warrants, options or convertible securities that were acquired in the original or subsequent financing or attempt to preserve or enhance the value of our investment.
We have discretion to make any follow-on investments, subject to the availability of capital resources. However, doing so could be placing even more capital at risk in existing portfolio companies. We may elect not to make follow-on investments, may be constrained in our ability to employ available funds, or otherwise may lack sufficient funds to make those investments.
The failure to make follow-on investments may, in some circumstances, jeopardize the continued viability of a portfolio company and our initial investment, or may result in a missed opportunity to increase our participation in a successful operation. Even if we have sufficient capital to make a desired follow-on investment, we may elect not to make a follow-on investment because we may not want to increase our concentration of risk, because we prefer other opportunities or because we are inhibited by compliance with BDC requirements.
Our portfolio companies may prepay loans, which may reduce stated yields in the future if the capital returned cannot be invested in transactions with equal or greater expected yields.
Certain of the loans we make are prepayable at any time, with some prepayable at no premium to par. We cannot predict when such loans may be prepaid. Whether a loan is prepaid will depend both on the continued positive performance of the portfolio company and the existence of favorable financing market conditions that permit such company to replace existing financing with less expensive capital. As market conditions change frequently, it is unknown when, and if, this may be possible for each portfolio company. In the case of some of these loans, having the loan prepaid early may reduce the achievable yield for us in the future below the current yield disclosed for our portfolio if the capital returned cannot be invested in transactions with equal or greater expected yields.
Investments in equity securities, many of which are illiquid with no readily available market, involve a substantial degree of risk.
We may purchase common and other equity securities. Although common shares have historically generated higher average total returns than fixed income securities over the long term, common shares also have experienced significantly more volatility in those returns. The equity securities we acquire may fail to appreciate and may decline in value or become worthless, and our ability to recover our investment will depend on our portfolio company’s success. Investments in equity securities involve a number of significant risks, including:
| • | any equity investment we make in a portfolio company could be subject to further dilution as a result of the issuance of additional equity interests and to serious risks as a junior security that will be subordinate to all indebtedness (including trade creditors) or senior securities in the event that the issuer is unable to meet its obligations or becomes subject to a bankruptcy process; |
| • | to the extent that the portfolio company requires additional capital and is unable to obtain it, we may not recover our investment; and |
| • | in some cases, equity securities in which we invest will not pay current dividends, and our ability to realize a return on our investment, as well as to recover our investment, will be dependent on the success of the portfolio company. |
Even if the portfolio company is successful, our ability to realize the value of our investment may be dependent on the occurrence of a liquidity event, such as a public offering or the sale of the portfolio company. It is likely to take a significant amount of time before a liquidity event occurs or we can otherwise sell our investment. In addition, the equity securities we receive or invest in may be subject to restrictions on resale during periods in which it could be advantageous to sell them.
69
Table of Contents
There are special risks associated with investing in preferred securities, including:
| • | preferred securities may include provisions that permit the issuer, at its discretion, to defer distributions for a stated period without any adverse consequences to the issuer. If we own a preferred security that is deferring its distributions, we may be required to report income for tax purposes before we receive such distributions; |
| • | preferred securities are subordinated to debt in terms of priority to income and liquidation payments, and therefore will be subject to greater credit risk than debt; |
| • | preferred securities may be substantially less liquid than many other securities, such as common shares or U.S. government securities; and |
| • | generally, preferred security holders have no voting rights with respect to the issuing company, subject to limited exceptions. |
Additionally, when we invest in first lien senior secured loans, second lien senior secured loans or mezzanine debt, we may acquire warrants or other equity securities as well. Our goal is ultimately to dispose of such equity interests and realize gains upon our disposition of such interests. However, the equity interests we receive may not appreciate in value and, in fact, may decline in value. Accordingly, we may not be able to realize gains from our equity interests and any gains that we do realize on the disposition of any equity interests may not be sufficient to offset any other losses we experience.
We may invest, to the extent permitted by law, in the equity securities of investment funds that are operating pursuant to certain exceptions to the Investment Company Act and, to the extent we so invest, will bear our ratable share of any such company’s expenses, including management and performance fees. We will also remain obligated to pay the management fee and incentive fee to our Adviser with respect to the assets invested in the securities and instruments of such companies. With respect to each of these investments, each of our Shareholders will bear his or her share of the management fee and incentive fee due to our Adviser as well as indirectly bearing the management and performance fees and other expenses of any such investment funds or advisers.
There may be circumstances in which our debt investments could be subordinated to claims of other creditors or we could be subject to lender liability claims.
If one of our portfolio companies were to go bankrupt, even though we may have structured our interest as senior debt, depending on the facts and circumstances, a bankruptcy court might recharacterize our debt holding as an equity investment and subordinate all or a portion of our claim to that of other creditors. In addition, lenders can be subject to lender liability claims for actions taken by them where they become too involved in the borrower’s business or exercise control over the borrower. For example, we could become subject to a lender’s liability claim, if, among other things, we actually render significant managerial assistance.
We may be required to obtain various state licenses in connection with our investments, including to originate commercial loans.
We may be required to obtain various state licenses in order to, among other things, originate commercial loans, and may also be required to obtain similar licenses from other authorities, including outside the United States in connection with one or more investments. Applying for and obtaining required licenses can be costly and take several months. There is no assurance that we will obtain all of the licenses that we need on a timely basis. Furthermore, we will be subject to various information and other requirements in order to obtain and maintain these licenses, and there is no assurance that we will satisfy those requirements. The failure to obtain or maintain licenses might restrict investment options and have other adverse consequences.
70
Table of Contents
Significant risks that could affect financial institutions to which we are exposed may affect our business.
We may invest in financial instruments issued by financial institutions, such as investment and commercial banks, insurance companies, savings and loan associations, mortgage originators and other companies engaged in the financial services industry (collectively, “financial institutions”). In addition, financial institutions will act as counterparties in connection with our investment activities. We may also gain exposure to these entities through derivative transactions, including, without limitation, options, credit default swaps and credit linked notes, and through long and short strategies. In the course of conducting their business operations, financial institutions are exposed to a variety of risks that are inherent to the financial services industry. Significant risks that could affect the financial condition and results of operations of financial institutions include, but are not limited to, fluctuations in interest rates, exchange rates, equity and commodity prices and credit spreads caused by global and local market and economic conditions; credit-related losses that can occur as a result of an individual, counterparty or issuer being unable or unwilling to honor its contractual obligations; the potential inability to repay short-term borrowings with new borrowings or assets that can be quickly converted into cash while meeting other obligations; operational failures or unfavorable external events; potential changes to the established rules and policies of various U.S. and non-U.S. legislative bodies and regulatory and exchange authorities, such as federal and state securities, bank regulators and industry participants; risks associated with litigation, investigations and/or proceedings by private claimants and governmental and self-regulatory agencies arising in connection with a financial institution’s activities; and its continuing ability to compete effectively in the market. The impact of these risks on financial institutions to which we are exposed may have an adverse effect on our business.
On March 10, 2023, Silicon Valley Bank (“SVB”), was closed by the California Department of Financial Protection and Innovation, which appointed the Federal Deposit Insurance Corporation, or the FDIC, as receiver. Similarly, on March 12, 2023, Signature Bank and Silvergate Capital Corp. were each swept into receivership. Although a statement by the Department of the Treasury, the Federal Reserve and the FDIC stated that all depositors of SVB would have access to all of their money after only one business day of closure, including funds held in uninsured deposit accounts, borrowers under credit agreements, letters of credit and certain other financial instruments with SVB, Signature Bank or any other financial institution that is placed into receivership by the FDIC may be unable to access undrawn amounts thereunder. If any of our counterparties to any such instruments were to be placed into receivership, we may be unable to access such funds. In addition, if any of our portfolio companies are unable to access funds pursuant to such instruments or lending arrangements with such a financial institution, such portfolio companies’ ability to pay their obligations to us could be adversely affected. In this regard, counterparties to SVB credit agreements and arrangements, and third parties such as beneficiaries of letters of credit (among others), might experience direct impacts from the closure of SVB, and uncertainty remains over liquidity concerns in the broader financial services industry. As of the date of this Registration Statement, we had no direct exposure to SVB or Signature Bank. Our Adviser will continue to assess the impact of these events on the Fund’s portfolio companies and the Fund.
Repurchase programs and bank obligations involve significant risks.
Repurchase agreements are subject to the risk of failure of the seller to repurchase the investment purchased by us, or delays or limitations on realization of the purchase obligation in the event of the initiation of bankruptcy or other proceedings involving the seller. Certain types of bank obligations which we may acquire may not be covered by insurance from the Federal Deposit Insurance Corporation or the Federal Savings and Loan Insurance Corporation.
Subject to our investment objectives and policies, we may invest in repurchase agreements as a buyer for investment purposes. Repurchase agreements typically involve the acquisition by us of debt securities from a selling financial institution such as a bank, savings and loan association or broker-dealer. The agreement provides that we will sell the securities back to the institution at a fixed time in the future for the purchase price plus premium (which often reflects the interests). We do not bear the risk of a decline in the value of the underlying security unless the seller defaults under its repurchase obligation. In the event of the bankruptcy or
71
Table of Contents
other default of a seller of a repurchase agreement, we could experience both delays in liquidating the underlying securities and losses, including (1) possible decline in the value of the underlying security during the period in which we seek to enforce its rights thereto; (2) possible lack of access to income on the underlying security during this period; and (3) expenses of enforcing its rights. In addition, as described above, the value of the collateral underlying the repurchase agreement will be at least equal to the repurchase price, including any accrued interest earned on the repurchase agreement. In the event of a default or bankruptcy by a selling financial institution, we generally will seek to liquidate such collateral. However, the exercise of our right to liquidate such collateral could involve certain costs or delays and, to the extent that proceeds from any sale upon a default of the obligation to repurchase were less than the repurchase price, we could suffer a loss.
Subject to our investment objectives and policies, we invest in repurchase agreements as a seller, also knowns as a “reverse repurchase agreement.” Our use of reverse repurchase agreements involves many of the same risks involved in our use of leverage, as the proceeds from reverse repurchase agreements generally will be invested in additional portfolio investments. There is a risk that the market value of the securities acquired in the reverse repurchase agreement may decline below the price of the securities that we have sold but remains obligated to repurchase. If the buyer of securities under a reverse repurchase agreement were to file for bankruptcy protection or experience insolvency, we may be adversely affected. Also, in entering into reverse repurchase agreements, we would bear the risk of loss to the extent that the proceeds of the reverse repurchase agreement are less than the value of the underlying securities. In addition, due to the interest costs associated with reverse repurchase agreements transactions, our NAV will decline, and, in some cases, we may be worse off than if we had not used such instruments.
Our investments in non-traded equity may involve a high degree of business and financial risk.
We may make investments in non-traded equity. These investments may occur as a result of, among other things, direct equity investments and our purchase of debt instruments that convert to equity interests in the event of a reorganization of an entity’s capital structure. Our investments in non-traded equity involve a high degree of business and financial risk. The entities in which we invest in may be financially distressed or have recently emerged from bankruptcy, they may require substantial additional capital to support expansion or to achieve or maintain a competitive position, they may produce substantial variations in operating results from period to period and they may operate at a loss. Such risks may adversely affect the performance of such investments and result in substantial losses. In addition, these entities may require governmental approvals or be subject to licensing procedures in order to operate in their markets. We could be adversely affected by delays in, or refusals to grant, such approvals or licenses.
By originating loans to companies that are experiencing significant financial or business difficulties, we may be exposed to distressed lending risks.
As part of our lending activities, we may originate loans to companies that are experiencing significant financial or business difficulties, including companies involved in bankruptcy or other reorganization and liquidation proceedings. Although the terms of such financing may result in significant financial returns to us, they involve a substantial degree of risk. The level of analytical sophistication, both financial and legal, necessary for successful financing to companies experiencing significant business and financial difficulties is unusually high. There is no assurance that we will correctly evaluate the value of the assets collateralizing our loans or the prospects for a successful reorganization or similar action. In any reorganization or liquidation proceeding relating to a company that we fund, we may lose all or part of the amounts advanced to the borrower or may be required to accept collateral with a value less than the amount of the loan advanced by us to the borrower.
We invest in “covenant-lite” loans, which could have reduced creditor protections.
We invest in, or obtain exposure to, obligations that are “covenant-lite,” which means such obligations lack, or possess fewer, financial covenants that protect lenders. Covenant-lite agreements feature incurrence
72
Table of Contents
covenants, as opposed to more restrictive maintenance covenants. Under a maintenance covenant, the borrower would need to meet regular, specific financial tests, while under an incurrence covenant, the borrower only would be required to comply with the financial tests at the time it takes certain actions (e.g., issuing additional debt, paying a dividend, making an acquisition). A covenant-lite obligation contains fewer maintenance covenants than other obligations, or no maintenance covenants, and may not include terms that allow the lender to monitor the performance of the borrower and declare a default if certain criteria are breached. Furthermore, in the event of default, covenant-lite loans may exhibit diminished recovery values as the lender may not have the opportunity to negotiate with the borrower prior to default.
We may be exposed to special risks associated with bankruptcy cases.
Many of the events within a bankruptcy case are adversarial and often beyond the control of the creditors. While creditors generally are afforded an opportunity to object to significant actions, there can be no assurance that a bankruptcy court would not approve actions that may be contrary to our interests. Furthermore, there are instances where creditors can lose their ranking and priority if they are considered to have taken over management of a borrower.
Generally, the duration of a bankruptcy case can only be roughly estimated. The reorganization of a company can involve substantial legal, professional and administrative costs to a lender and the borrower; it is subject to unpredictable and lengthy delays; and during the process a company’s competitive position may erode, key management may depart and a company may not be able to invest its capital adequately. In some cases, the debtor company may not be able to reorganize and may be required to liquidate assets. The debt of companies in financial reorganization will, in most cases, not pay current interest, may not accrue interest during reorganization and may be adversely affected by an erosion of the issuer’s fundamental value.
U.S. bankruptcy law permits the classification of “substantially similar” claims in determining the classification of claims in reorganization for purposes of voting on a plan of reorganization. Because the standard for classification is vague, there exists a significant risk that our influence with respect to a class of securities can be lost by the inflation of the number and amount of claims in, or other gerrymandering of, the class. In addition, certain administrative costs and claims that have priority by law over the claims of certain creditors (for example, claims for taxes) may be quite high.
Furthermore, there are instances where creditors and equity holders lose their ranking and priority as such when they take over management and functional operating control of a debtor. In those cases where we, by virtue of such action, are found to exercise “domination and control” of a debtor, we may lose our priority if the debtor can demonstrate that its business was adversely impacted or other creditors and equity holders were harmed by us.
Our representatives may serve on creditors’ committees or other groups to ensure preservation or enhancement of our position as a creditor or equity holder. A member of any such committee or group may owe certain obligations generally to all parties similarly situated that the committee represents. If our representatives conclude that the obligations the representatives owe to other parties as a committee or group member conflict with the duties it owes to us, it will resign from that committee or group, and we will not realize the benefits, if any, of participating on the committee or group. In addition, if we are represented on a committee or group, we may be restricted or prohibited under applicable law from, disposing of or increasing our investments in such debtor company while we continue to be represented on such committee or group.
In addition, lenders can be subject to lender liability claims for actions taken by them where they become too involved in the borrower’s business or exercise control over the borrower. For example, we could become subject to a lender’s liability claim, if, among other things, the borrower requests significant managerial assistance from us and we provide such assistance as contemplated by the Investment Company Act.
73
Table of Contents
Declines in market prices and liquidity in the corporate debt markets can result in significant net unrealized depreciation of our portfolio, which in turn would reduce our NAV.
As a BDC, we are required to carry our investments at market value or, if no market value is ascertainable, at fair value as determined in good faith by our Adviser, as the Fund’s valuation designee, under procedures approved by our Board of Trustees. We may take into account the following types of factors, if relevant, in determining the fair value of our investments: the enterprise value of a portfolio company (the entire value of the portfolio company to a market participant, including the sum of the values of debt and equity securities used to capitalize the enterprise at a point in time), the nature and realizable value of any collateral, the portfolio company’s ability to make payments and its earnings and discounted cash flow, the markets in which the portfolio company does business, a comparison of the portfolio company’s securities to similar publicly traded securities and other relevant factors. When an external event such as a purchase transaction, public offering or subsequent equity sale occurs, we use the pricing indicated by the external event to corroborate our valuation. While most of our investments are not publicly traded, applicable accounting standards require us to assume as part of our valuation process that our investments are sold in a principal market to market participants (even if we plan on holding an investment through its maturity). As a result, volatility in the capital markets can also adversely affect our investment valuations. Decreases in the market values or fair values of our investments are recorded as unrealized depreciation. The effect of all of these factors on our portfolio can reduce our NAV by increasing net unrealized depreciation in our portfolio. Depending on market conditions, we could incur substantial realized losses and may suffer unrealized losses, which could have a material adverse impact on our business, financial condition and results of operations.
Economic recessions or downturns could impair our portfolio companies and harm our operating results.
Our portfolio companies are susceptible to economic downturns or recessions and may be unable to repay our loans during these periods. During these periods our non-performing assets may increase and the value of our portfolio may decrease if we are required to write down the values of our investments. Adverse economic conditions may also decrease the value of collateral securing some of our loans and the value of our equity investments. Economic slowdowns or recessions could lead to financial losses in our portfolio and a decrease in revenues, net income and assets. Unfavorable economic conditions also could increase our funding costs, limit our access to the capital markets or result in a decision by lenders not to extend credit to us. These events could prevent us from increasing investments and harm our operating results.
A portfolio company’s failure to satisfy financial or operating covenants imposed by us or other lenders could lead to defaults and, potentially, acceleration of the time when the loans are due and foreclosure on the portfolio company’s assets representing collateral for its obligations. This could trigger cross defaults under other agreements and jeopardize our portfolio company’s ability to meet its obligations under the debt that we hold and the value of any equity securities we own. We may incur expenses to the extent necessary to seek recovery upon default or to negotiate new terms with a defaulting portfolio company. In addition, if one of our portfolio companies were to file for bankruptcy protection, even though we or one of our affiliates may have structured our interest in such portfolio company as senior debt, depending on the facts and circumstances, including the extent to which we provided managerial assistance to such portfolio company, a bankruptcy court might re-characterize our debt holding as equity and subordinate all or a portion of our claim to claims of other creditors.
Recently, central banks such as the Federal Reserve Bank have been increasing interest rates in an effort to slow the rate of inflation. There is a risk that increased interest rates may cause the economy to enter a recession. Any such recession would negatively impact the businesses in which we invest and our business. These impacts may include:
| • | severe declines in the market price of our securities or net asset value; |
| • | inability of the Fund to accurately or reliably value its portfolio; |
74
Table of Contents
| • | inability of the Fund to comply with certain asset coverage ratios that would prevent the Fund from paying dividends to our stockholders and that could result breaches of covenants or events of default under our credit agreement or debt indentures; |
| • | inability of the Fund to pay any dividends and distributions or service its debt; |
| • | declines in the value of our investments; |
| • | increased risk of default or bankruptcy by the companies in which we invest; |
| • | increased risk of companies in which we invest being unable to weather an extended cessation of normal economic activity and thereby impairing their ability to continue functioning as a going concern; |
| • | limited availability of new investment opportunities; |
| • | inability for us to replace our existing leverage when it becomes due or replace it on terms as favorable as our existing leverage; and |
| • | general threats to the Fund’s ability to continue investment operations and to operate successfully as a BDC. |
Our portfolio companies may be highly leveraged.
Some of our portfolio companies may be highly leveraged, which may have adverse consequences to these companies and to us as an investor. This leverage may impair these companies’ ability to finance their future operations and capital needs. As a result, these companies’ flexibility to respond to changing business and economic conditions and to take advantage of business opportunities may be limited. Further, a leveraged company’s income and net assets will tend to increase or decrease at a greater rate than if borrowed money were not used.
Our investments in non-U.S. companies may involve significant risks in addition to the risks inherent in U.S. investments.
Our investment strategy, to the extent permissible under the Investment Company Act, may include potential investments in foreign companies and in companies whose principal assets, including real estate, are located in foreign countries. Investing in non-U.S. companies may expose us to additional risks not typically associated with investing in U.S. companies. These risks include changes in exchange control regulations, political and social instability, expropriation, imposition of non-U.S. taxes (potentially at confiscatory levels), less liquid markets, less available information than is generally the case in the United States, higher transaction costs, less government supervision of exchanges, brokers and issuers, less developed bankruptcy laws, difficulty in enforcing contractual obligations, lack of uniform accounting and auditing standards and greater price volatility.
Our investments that are denominated in a non-U.S. currency will be subject to the risk that the value of a particular currency will change in relation to the U.S. dollar. Among the factors that may affect currency values are trade balances, the level of short-term interest rates, differences in relative values of similar assets in different currencies, long-term opportunities for investment and capital appreciation and political developments. We may employ hedging techniques to minimize these risks, but we cannot assure you that such strategies will be effective or without risk to us.
We will be exposed to risks if we engage in hedging transactions.
Subject to application of the Investment Company Act and applicable CFTC regulations, we may enter into hedging transactions, which may expose us to risks associated with such transactions. However, such hedging
75
Table of Contents
transactions are not expected to play a significant role in our overall investment strategy. Such hedging may utilize instruments such as forward contracts, currency options and interest rate swaps, caps, collars and floors to seek to hedge against fluctuations in the relative values of our portfolio positions from changes in currency exchange rates and market interest rates. Use of these hedging instruments may include counter-party credit risk.
Hedging against a decline in the values of our portfolio positions does not eliminate the possibility of fluctuations in the values of such positions or prevent losses if the values of such positions decline. However, such hedging can establish other positions designed to gain from those same developments, thereby offsetting the decline in the value of such portfolio positions. Such hedging transactions may also limit the opportunity for gain if the values of the underlying portfolio positions should increase. Moreover, it may not be possible to hedge against an exchange rate or interest rate fluctuation that is so generally anticipated that we are not able to enter into a hedging transaction at an acceptable price.
The success of any hedging transactions we may enter into will depend on our ability to correctly predict movements in currencies and interest rates. Therefore, while we may enter into such transactions to seek to reduce currency exchange rate and interest rate risks, unanticipated changes in currency exchange rates or interest rates may result in poorer overall investment performance than if we had not engaged in any such hedging transactions. In addition, the degree of correlation between price movements of the instruments used in a hedging strategy and price movements in the portfolio positions being hedged may vary. Moreover, for a variety of reasons, we may not seek to (or be able to) establish a perfect correlation between such hedging instruments and the portfolio holdings being hedged. Any such imperfect correlation may prevent us from achieving the intended hedge and expose us to risk of loss. In addition, it may not be possible to hedge fully or perfectly against currency fluctuations affecting the value of securities denominated in non-U.S. currencies because the value of those securities is likely to fluctuate as a result of factors not related to currency fluctuations. See also “—Risk Relating to Our Business—We are exposed to risks associated with changes in interest rates.”
Other risks associated with such transactions include, among others, the possible default by the counterparty to the transaction and the illiquidity of the instrument acquired by us relating thereto. Although such transactions may reduce our exposure to, among other things, decreases in the value of investments, the costs and risks associated with these arrangements may reduce the returns that we would have otherwise achieved if we had not entered into these transactions. In addition, although such hedging transactions may hedge economic risks, they may not be effective hedges for tax purposes. For example, the tax character of the gain or loss on the hedging transaction may differ from the character of the gain or loss on the investment or the timing of the gain or loss for tax purposes may differ between the hedging transaction and the investment. Changes to the regulations applicable to the financial instruments we use to accomplish our hedging strategy could affect the effectiveness of that strategy. For additional information on these regulatory changes, see “—Risks Relating to Our Business and Structure—New market structure requirements applicable to derivatives could significantly increase the costs of utilizing OTC derivatives.”
With respect to any investments in synthetic instruments, we will have a contractual relationship only with the synthetic instrument counterparty, and no direct rights with respect to the underlying asset. We may not have any voting, information, or other rights of ownership with respect to the underlying asset. In addition, we will be subject to the credit risk of the synthetic instrument counterparty, and, in the event of the insolvency of such counterparty, we generally will be treated as a general creditor of such counterparty, and will not have any claim of title with respect to the underlying asset.
There are special risks associated with derivative instruments we may enter into.
We may enter into derivative transactions, including total return swaps (“TRSs”) and other derivative instruments for hedging and other investment purposes. Derivative instruments come in many varieties, including futures and forward contracts, options (both written and purchased), swaps and swaptions. For example, in certain situations, we expect to enter into currency hedges with such instruments. The derivatives may be exchange-listed, centrally-cleared or traded over the counter (“OTC”). In connection with trading in exchange-listed
76
Table of Contents
or centrally-cleared instruments, we are subject to the risk of failure of any of the clearinghouses or clearing members through which its positions are cleared. OTC derivative instruments may be subject to the risk that a counterparty will default on its payment obligations or that one party will not be able to meet its obligations to the other. Furthermore, in certain derivative transactions, we will be required to post collateral to secure our obligations to a counterparty or clearing member under the transaction. The counterparty or clearing member, however, may not be required to collateralize any of its obligations to us. Requirements to post collateral may expose us to the risk that we will not have sufficient unencumbered cash or securities to satisfy those collateral requirements and the risk that our counterparty or clearing member will fail to return excess collateral. Depending on the extent to which we are required to collateralize our derivatives positions, those positions may effectively add leverage to our portfolio by exposing us to changes in the value of the derivative’s underlier in excess of the amount that we have invested in the derivative. Furthermore, an OTC derivative instrument may contain optional early termination provisions that require a cash settlement. It is possible that we will owe more to the counterparty or, alternatively, will be entitled to receive less from the counterparty than if we controlled the timing of such termination due to the existence of adverse market conditions at the time of such termination.
With respect to leverage embedded in derivative instruments, we may be subject to major losses in the event that we are forced to liquidate positions at a disadvantageous time. Furthermore, the credit extended to us by dealers to maintain our leveraged positions can be terminated by the dealers largely in their discretion, forcing liquidation at potentially material losses.
Changes to the regulations applicable to derivatives, including TRSs, could affect our ability to use these instruments and the costs of doing so. For additional information on these regulatory changes, see “—Risks Relating to Our Business and Structure—New market structure requirements applicable to derivatives could significantly increase the costs of utilizing OTC derivatives”.
Original Issue Discount and Payment-in-kind Interest may affect our Incentive Fees.
Original issue discount (“OID”) may arise if we hold securities issued at a discount (interest income will be accrued that will not be received in cash until maturity or sale). Also, certain loans may include contractual payment-in-kind (“PIK”) interest (interest paid in the form of additional principal amount of the loan instead of in cash). Income Incentive Compensation will be calculated and paid on income that may include OID or PIK provisions. Additionally, the market prices of PIK instruments are more volatile because they are affected to a greater extent by interest rate changes than instruments that pay interest periodically in cash. The higher yields and interest rates of both OID and PIK securities reflect the payment deferral and increased credit risk associated with such securities, and OID and PIK investments may represent a significantly higher credit risk than coupon loans. Even if the accounting conditions for income accrual are met, the borrower could still default when actual payment to us is supposed to occur at the maturity of the obligation. OID and PIK securities may have unreliable valuations because their continuing accruals require continuing judgments about the collectability of the deferred payments and the value of any associated collateral. PIK interest has the effect of generating investment income at a compounding rate and increasing the incentive fees payable on the same basis. In addition, the deferral of PIK interest may increase the loan to value at a compounding rate, assuming no change in the underlying value of the borrower. Depending on the amount of noncash income generated by OID and PIK, we may have difficulty making distributions. OID and PIK securities create the risk that incentive fees will be paid to our Adviser based on non-cash accruals that ultimately may not be realized, but our Adviser will be under no obligation to reimburse the Fund for these fees. However, to extent we write off any non-cash accruals, such accruals will be treated as a capital loss for purposes of the Capital Gains Incentive Compensation.
We may initially invest a portion of the net proceeds of offerings primarily in high-quality short-term investments, which will generate lower rates of return than those expected from the interest generated on first and second lien senior secured loans and mezzanine debt.
We may initially invest a portion of the net proceeds of offerings primarily in cash, cash equivalents, U.S. government securities and other high-quality short-term investments. These securities generally earn yields
77
Table of Contents
substantially lower than the income that we anticipate receiving once we are fully invested in accordance with our investment objective. As a result, we may not, for a time, be able to achieve our investment objective and/or we may need to, for a time, decrease the amount of any dividend that we may pay to our Shareholders to a level that is substantially lower than the level that we expect to pay when the net proceeds of offerings are fully invested in accordance with our investment objective. If we do not realize yields in excess of our expenses, we may incur operating losses and the market price of our shares may decline.
Risks Relating to Our Common Shares
Investing in our common shares involves a significant degree of risk.
The investments we make in accordance with our investment objective may result in a higher amount of risk than alternative investment options and volatility or loss of principal. Our investments in portfolio companies may be speculative and involve significant risk, and therefore an investment in our common shares may not be suitable for some investors.
Our common shares will not be insured or guaranteed by any person or entity.
The Fund will have no substantial assets other than the Fund’s investments. In the event of the dissolution of the Fund or otherwise, if the proceeds of the Fund’s assets are insufficient to repay capital contributions made to the Fund by the Shareholders, no other assets will be available for the payment of any deficiency. Neither our Adviser nor its affiliates has any liability for the repayment of capital contributions made to the Fund by the Shareholders. Shareholders could experience a total loss of their investment in the Fund.
Affiliates of Silver Point have significant influence over us, including having approximately 18% of the vote for matters that require the approval of Shareholders, which could limit your ability to influence the outcome of matters submitted to Shareholders for a vote.
Affiliates of Silver Point hold approximately 18% of our common shares and have the ability to vote their shares in connection with any actions requiring Shareholder approval, including the election and removal of Trustees, certain amendments of our Declaration of Trust, and the approval of any merger or other extraordinary corporate action. These affiliates may have different motivations for their voting decisions than other Shareholders.
Two of our current Shareholders beneficially own 31.7% of our common shares. They will be able to exert significant control over matters submitted to our Shareholders for approval.
As of the date of this Registration Statement, two of our current Shareholders beneficially own 31.7% of our common shares. They will be able to exert significant control over matters submitted to our Shareholders for approval. These Shareholders, if they acted together, could significantly influence matters requiring approval by our Shareholders, including the election of Trustees and the approval of certain business combination transactions. The interests of these Shareholders may not always coincide with our interests or the interests of other Shareholders.
Our common shares are not registered for sale under the securities laws of any jurisdiction and therefore are subject to restrictions on transfer under the Securities Act and any similar U.S. state or non-U.S. laws, as applicable.
The Fund is under no obligation to register the common shares under the Securities Act. Common shares may not be transferred, assigned, pledged or otherwise disposed of without the prior written consent of the Fund. Common shares may be transferred only to other qualified investors. The Fund may, in its discretion, choose not to permit a transfer of common shares to the extent that such transfer would create a risk that the assets of the Fund could be deemed to be “plan assets” within the meaning of the regulation promulgated by the United States
78
Table of Contents
Department of Labor at 29 C.F.R. Section 2510.3-101 (as modified by Section 3(42) of ERISA), which assets are subject to Title I of ERISA or Section 4975 of the Internal Revenue Code of 1986, as amended. Consequently, a Shareholder cannot expect to liquidate its investment readily and must bear the economic risk of its investment for an indefinite period of time.
No market exists for the common shares of the Fund, and it is possible that none develops.
Neither the Adviser, any placement agent nor any other person is under any obligation to make a market in the common shares of the Fund. Consequently, a purchaser must be prepared to hold the shares for an indefinite period of time or until the termination date of the Fund. In addition, the common shares are subject to certain transfer restrictions and can only be transferred to certain transferees as described herein. Such restrictions on the transfer of the common shares may further limit the liquidity of the common shares.
We may in the future determine to issue preferred shares, which could adversely affect the market value of our common shares.
The issuance of preferred shares with dividend or conversion rights, liquidation preferences or other economic terms favorable to the holders of preferred shares could adversely affect the market value of our common shares by making an investment in the common shares less attractive. In addition, the dividends on any preferred shares we issue must be cumulative. Payment of dividends and repayment of the liquidation preference of preferred shares must take preference over any distributions or other payments to our common Shareholders, and holders of preferred shares are not subject to any of our expenses or losses and are not entitled to participate in any income or appreciation in excess of their stated preference (other than convertible preferred shares that convert into common shares). If the dividend rate on the preferred shares were to exceed the net rate of return on our portfolio, the leverage would result in a lower rate of return to the holders of common shares than if we had not issued preferred shares. Any decline in the net asset value of our investments would be borne entirely by the holders of common shares. Therefore, if the market value of our portfolio were to decline, the leverage would result in a greater decrease in net asset value to the holders of common shares than if we were not leveraged through the issuance of preferred shares. This greater net asset value decrease would also tend to cause a greater decline in the market value for the common shares. We might be in danger of failing to maintain the required asset coverage of the preferred shares or of losing our rating on the preferred shares or, in an extreme case, our current investment income might not be sufficient to meet the dividend requirements on the preferred shares, In order to counteract such an event, we might need to liquidate investments in order to fund a redemption of some or all of the preferred shares. In addition, under the Investment Company Act, participating preferred shares and preferred shares each constitute a “senior security” for purposes of the asset coverage test.
Although we do not currently intend to issue preferred shares, we may seek to do so in the future. If we issue preferred shares, the preferred shares would rank “senior” to common shares in our capital structure, holders of preferred shares would have separate voting rights on certain matters and might have other rights, preferences, or privileges more favorable than those of our Shareholders, and the issuance of preferred shares could have the effect of delaying, deferring or preventing a transaction or a change of control that might involve a premium price for holders of our common shares or otherwise be in their best interest. Should we issue preferred shares, the cost of issuing and servicing such preferred shares will be borne solely by our Shareholders.
We may not be able to pay you distributions on our common shares, and our distributions to you may not grow over time.
We intend to pay quarterly distributions to our Shareholders out of assets legally available for distribution. We cannot assure you that we will achieve investment results that will allow us to make a specified level of cash distributions or year-to-year increases in cash distributions. If we are unable to satisfy the asset coverage test applicable to us as a BDC, or if we violate certain covenants under our credit agreements and other debt financing agreements, our ability to pay distributions to our Shareholders could be limited. All distributions will
79
Table of Contents
be paid at the discretion of our Board of Trustees and will depend on our earnings, financial condition, compliance with applicable BDC regulations, compliance with covenants under our credit agreements and other debt financing agreements and such other factors as our Board of Trustees may deem relevant from time to time.
Changes in tax laws could affect our business or an investment in our common shares.
Developments in the tax laws of the United States or other jurisdictions, which may be applied retroactively, could have an adverse effect on the tax consequences to the Fund and its common shares. The rules dealing with U.S. federal income taxation are constantly under review by persons involved in the legislative process and by the IRS and the U.S. Treasury Department. Recent or future legislation, U.S. Treasury regulations, administrative interpretations or court decisions, with or without retroactive application, could significantly and negatively affect the U.S. federal income tax consequences to the Fund and its investors. You are urged to consult with your tax advisor with respect to the status of legislative, regulatory or administrative developments and proposals and their potential effect on an investment in the Fund.
We and our shareholders may recognize taxable income without a corresponding receipt of cash.
Unlike most BDCs (which are treated as “regulated investment companies” (“RICs”) for U.S. federal income tax purposes), the Fund intends to be treated as a partnership, and not as an “publicly traded partnership”, taxable as a corporation for U.S. federal income tax purposes. By reason of its treatment as a partnership for U.S. federal income tax purposes, the Fund will generally not itself be subject to U.S. federal income tax. Rather, each Shareholder in computing its U.S. federal income tax will include its allocable share of Fund items of income, gain, loss, deduction and expense, regardless of whether such Shareholder has received any distributions from the Fund. The Fund may be required to recognize taxable income from certain investments prior to or without the receipt of corresponding amounts of cash. A Shareholder’s U.S. federal and other income tax liabilities with respect to its allocable share of the Fund’s income in a particular tax year thus could exceed the cash distributions to such Shareholder for such year, thereby giving rise to an out-of-pocket payment by such Shareholder.
An investment in the Fund may have adverse consequences for tax-exempt and Non-U.S. Shareholders.
The Fund is expected to engage in activities that, directly or indirectly, will cause it (and thus each Non-U.S. Shareholder) to be engaged in a “U.S. trade or business” for U.S. federal income tax purposes. In that event, among other consequences, each Non-U.S. Shareholder generally would be required to file a U.S. federal income tax return reporting its allocable share of the Fund’s income or loss that is treated as “effectively connected” with such trade or business and would be required to pay U.S. federal income tax at regular U.S. tax rates on that income. An investment in the Fund will also cause a Non-U.S. Shareholder to be engaged in “commercial activity” for purposes of Section 892 of the Code. An investment in the Fund thus may result in adverse tax consequences for a Non-U.S. Shareholder. Non-U.S. Shareholders are urged to consult their own tax advisors regarding the tax consequences to them of an investment in the Fund.
The Fund expects to generate income that is treated as UBTI with respect to tax-exempt Shareholders. Tax-exempt Shareholders are urged to consult their own tax advisors regarding the tax consequences to them of an investment in the Fund.
You may be required to obtain extensions of the time to file tax returns.
The Fund will deliver Schedules K-1 to Shareholders for any given fiscal year; however, Shareholders may not receive such Schedules K-1 until after April 15th of the following year. Accordingly, Shareholders should anticipate being required to obtain extensions of the filing date for their income tax returns at the U.S. federal, state and local levels. Shareholders are urged to consult their tax advisors with respect to applying for such extension.
80
Table of Contents
Item 2. Financial Information.
Management’s Discussion and Analysis of Financial Condition and Results of Operations
The information in this section contains forward-looking statements that involve risks and uncertainties. You can identify these statements by the use of forward-looking terminology such as “may,” “will,” “should,” “expect,” “anticipate,” “project,” “estimate,” “intend,” “continue” or “believe” or the negatives thereof or other variations thereon or comparable terminology. Please see “Item 1A. Risk Factors” and “Special Note Regarding Forward-Looking Statements” for a discussion of the uncertainties, risks and assumptions associated with these statements. You should read the following discussion in conjunction with the consolidated financial statements and related notes and other financial information appearing elsewhere in this Registration Statement.
Overview
We are a specialty finance company that is a closed-end management investment company. We have elected to be regulated as a BDC under the Investment Company Act. We reserve the right to operate as a non-diversified company within the meaning of the Investment Company Act. However, our portfolio currently meets, and may from time to time in the future meet, the diversification standards of a diversified company as defined in the Investment Company Act.
At the time of the Trust Conversion, our partners received common shares with an aggregate net asset value equal to the aggregate net asset value of the partner interests owned by them on the Trust Conversion date. Based on our aggregate net asset value at November 15, 2021 of approximately $553.6 million, the Fund issued 36,907,451.43 common shares. Silver Point Specialty Credit Fund GP, LLC, our general partner prior to the Trust Conversion, received its pro rata share of the Fund, equaling 3,366.47 of our common shares, which represented 0.01% of our common shares outstanding immediately after the Trust Conversion. Our limited partners prior to the Trust Conversion received 36,904,084.96 common shares, which represented 99.99% of our common shares outstanding immediately after the Trust Conversion. Each of our outstanding partner interests was converted into common shares having a net asset value of $15 per share, and the shares received by the partners and any other affiliates do not provide any registration rights.
Our investment objective is to achieve stable income generation with attractive risk-adjusted returns by investing primarily in U.S. middle market lending opportunities, and specialty asset based financings. We define “middle market companies” to generally mean companies with earnings before interest expense, income tax expense, depreciation and amortization (“EBITDA”) between $30 million and $150 million annually, annual revenue of $80 million to $1 billion at the time of investment, and/or enterprise value between $150 million and $2 billion at the time of investment. There is no minimum or maximum limit on the amount of our assets that may be invested in any single such asset class. We may also, from time to time invest in larger or smaller companies. In seeking to achieve our investment objective, we may also invest across a broad range of industries.
If we are successful in achieving our investment objective, we believe that we will be able to provide our Shareholders with consistent dividend distributions and attractive risk-adjusted total returns, although there can be no assurances in this regard. Since we commenced investment operations on July 1, 2015, through December 31, 2022, we have invested over $3.0 billion in 203 portfolio companies, excluding any subsequent exits or repayments. As of December 31, 2022, the fair value of our portfolio was invested approximately 94.8% in first lien secured debt, 1.8% in second lien debt, 2.3% in equity investments and 1.1% in other investments.
The following table displays our performance from July 1, 2015, the date that the Private Fund commenced investment activities, through December 31, 2022 and the full year performance of the BDC as of December 31, 2022. During such period, we operated as the Private Fund until our election to be regulated as a BDC on December 30, 2021. The investment objectives, policies, guidelines and restrictions of the Private Fund are in all material respects equivalent to those of the Fund. The Private Fund was not subject to limitations, diversification requirements and other restrictions imposed by the Investment Company Act and the Internal Revenue Code,
81
Table of Contents
which, if applicable, may have adversely affected its performance results. Since the Private Fund was taxed as a partnership, before and after-tax returns were the same.
| Year ended December 31, 2022 | July 1, 2015* to December 31, 2022 | |||
Net internal rate of return | 2.4% | 12.2% |
| * | Date of the commencement of investment operations. |
The “net internal rate of return” of the Private Fund represents the percentage rate of return earned on each dollar invested by the fee paying limited partners for each period invested, based on the amounts and effective dates of capital called from and distributed to fee paying limited partners and the fee paying limited partners’ capital accounts at the end of each respective year adjusted for the effects of the subsequent closes. The “net internal rate of return” is net of management fees and incentive compensation paid by the Private Fund and all other expenses of the Private Fund. The “net internal rate of return” does not reflect the impact of federal, state or local taxes. Since the Private Fund was taxed as a partnership, before and after-tax returns were the same. This method of calculating performance is different than the SEC’s standard methodology that is used to calculate performance.
Additionally, the following table displays our total return over the past five years. This table should be read in conjunction with our consolidated financial statements and related notes thereto, which are included elsewhere in this Registration Statement.
| 2022 | 2021 | 2020 | 2019 | 2018 | ||||||||||||||||
Total return based on net asset value | 2.3 | % | 16.0 | % | 13.1 | % | 12.3 | % | 15.4 | % | ||||||||||
For the period of January 1, 2017 to November 14, 2021, total return based on net asset value is calculated as limited partners’ total increase (decrease) in partners’ capital resulting from operations divided by limited partners’ capital during the year, adjusted for capital inflows, outflows and items of income and expense as presented in the consolidated statements of operations. For the period from November 15, 2021 to December 31, 2021 and beyond, total return based on net asset value is calculated as the percent change in net asset value per share.
Key Components of Our Results of Operations
Investments
We focus primarily on targeting direct lending opportunities to U.S. middle market companies throughout the business cycle. Our level of investment activity can and does vary substantially from period to period depending on many factors, including the amount of debt and equity capital available to middle-market companies, the level of merger and acquisition activity for such companies, the prevailing economic and market environment, the amount of capital we have available to us and the competitive environment for the type of investments we make.
As a BDC, we must not acquire any assets other than “qualifying assets” specified in the Investment Company Act unless, at the time the acquisition is made, at least 70% of our total assets are qualifying assets (with certain limited exceptions). Qualifying assets include investments in “eligible portfolio companies.” Pursuant to rules adopted by the SEC, “eligible portfolio companies” include certain U.S. companies that do not have any securities listed on a national securities exchange and public companies whose securities are listed on a national securities exchange but whose market capitalization is less than $250 million. See “Item 1. Business—Regulation.”
Because our shares will not be limited to accredited investors with an initial investment of at least $25,000, other than CLOs, we must limit our investments in any types of entities that rely on the exceptions set forth in Section 3(c)(1) or Section 3(c)(7) of the Investment Company Act (including, but not limited to, hedge funds and private equity funds) to no more than 15% of our net assets.
82
Table of Contents
Since formation, in excess of 70% of the Fund’s assets have been “qualifying assets” under Section 55(a) of the Investment Company Act. As of December 31, 2022, the fair value of the Fund’s total assets was comprised of approximately 81.6% of “qualifying assets.”
Revenues
We generate revenue primarily in the form of interest income on the investments we hold and, to a lesser extent, capital gains on the sales of loans and debt and equity securities and dividend income on direct equity investments. In addition, we generate revenue in the form of commitment, origination, structuring or diligence fees, fees for providing managerial assistance, consulting fees and prepayment fees.
Interest and dividend income are recorded on an accrual basis. Loan origination fees, original issue discount and market discounts or premiums are capitalized, and we accrete or amortize such amounts to income. We record contractual prepayment premiums and the acceleration of unamortized premiums or discounts on loans and debt securities as income, which can cause investment income to vary quarter by quarter.
Interest on debt investments is generally payable monthly or quarterly. Some of our investments provide for deferred interest payments or payment-in-kind (“PIK”) interest. The principal amount of debt investments and any accrued but unpaid interest generally becomes due at the maturity date. Generally a small but varied number of portfolio companies may make voluntary prepayments in any quarter, meaning that changes in the amount of prepayment fees received can vary significantly between periods and can vary without regard to underlying credit trends. Repayments of our debt investments can reduce interest income from period to period.
We recognize realized gains or losses on sales of investments based on the difference between the net proceeds from the disposition and the amortized cost basis of the investment at time of disposition, without regard to unrealized gains or losses previously recorded. We record changes in unrealized gain or loss on investments based on the current period changes in fair value of investments inclusive of the reversal of previously recorded unrealized gains or losses with respect to investments realized during the current period.
Expenses
Our primary operating expenses include the payment of fees to our Adviser under the Advisory Agreement and interest and financing costs incurred from our credit facilities. Additionally we bear other costs and expenses of our operations, administration and transactions, including, but not limited to, the following:
| • | our operational expenses; |
| • | investment advisory and management fees; |
| • | expenses, including travel expenses, incurred by our Adviser, or members of our investment team, or payable to third parties, in respect of prospective or consummated investments; |
| • | amounts payable to third parties relating to, or associated with, making or holding investments, including legal, tax, consulting and other professional expenses; |
| • | commissions and other compensation payable to brokers or dealers; |
| • | custodial fees; |
| • | certain taxes; |
| • | direct costs and expenses of administration, including audit, accounting, consulting and legal costs; |
| • | errors and omissions liability for Trustees and officers; |
| • | interest payable on debt, if any, incurred to finance our investments; |
83
Table of Contents
| • | calculation of our net asset value (including the costs and expenses of any independent valuation firms); |
| • | Independent Trustee fees and expenses; |
| • | certain costs and expenses relating to distributions paid on our shares; |
| • | the costs of any reports, proxy statements or other notices to our Shareholders, the SEC and other regulatory authorities (including printing and mailing costs), the costs of any Shareholders’ meetings and the compensation of investor relations personnel responsible for the preparation of the foregoing and related matters; and |
| • | our fidelity bond. |
We bear other costs and expenses of our operations and transactions in accordance with and as set forth in more detail in our Advisory Agreement. See “Item 1. Business—Investment Management Agreement” and “—Administrative Services.”
Portfolio and Investment Activity
As of December 31, 2022, our investment portfolio consisted of secured debt with an aggregate fair value of $787.8 million and an aggregate amortized cost of $810.6 million, equities with an aggregate fair value of $18.3 million and an aggregate cost of $11.4 million and other investments with an aggregate fair value of $9.3 million and an aggregate cost of $9.5 million. As of that date, our portfolio on a fair value basis was invested 96.6% in secured debt (94.8% in first lien debt and 1.8% in second lien debt), 2.3% in equities and 1.1% in other investments.
As of December 31, 2021, our investment portfolio consisted of secured debt with an aggregate fair value of $890.8 million and an aggregate amortized cost of $890.1 million, equities with an aggregate fair value of $39.4 million and an aggregate cost of $17.1 million and other investments with an aggregate fair value of $20.9 million and an aggregate cost of $21.1 million. As of that date, our portfolio on a fair value basis was invested 93.7% in secured debt (90.7% in first lien debt and 3.0% in second lien debt), 4.1% in equities and 2.2% in other investments.
Our average investment portfolio size based on fair value was $874.8 million and $851.4 million for the years ended December 31, 2022 and 2021, respectively.
The table below summarizes our investments as of December 31, 2022 and 2021.
| December 31, 2022 | December 31, 2021 | |||||||||||||||||||||||
| ($ in millions) | Fair Value | Amortized Cost | Percentage of Total Fair Value | Fair Value | Amortized Cost | Percentage of Total Fair Value | ||||||||||||||||||
First-lien debt | $ | 773.1 | $ | 795.8 | 94.8 | % | $ | 862.3 | $ | 861.2 | 90.7 | % | ||||||||||||
Second-lien debt | 14.7 | 14.8 | 1.8 | % | 28.5 | 28.9 | 3.0 | % | ||||||||||||||||
Equities | 18.3 | 11.4 | 2.3 | % | 39.4 | 17.1 | 4.1 | % | ||||||||||||||||
Other investments | 9.3 | 9.5 | 1.1 | % | 20.9 | 21.0 | 2.2 | % | ||||||||||||||||
|
|
|
|
|
|
|
|
|
|
|
| |||||||||||||
Total | $ | 815.4 | $ | 831.5 | 100.0 | % | $ | 951.1 | $ | 928.2 | 100.0 | % | ||||||||||||
|
|
|
|
|
|
|
|
|
|
|
| |||||||||||||
As of December 31, 2022 and 2021, our weighted average total yield of debt securities at fair value (which includes interest income and amortization of fees and discounts) was 11.9% and 8.9%, respectively.
As of December 31, 2022 and 2021, we had investments in 74 and 69 portfolio companies, respectively, with an aggregate fair value of $815.4 million and $951.1 million, respectively. As of December 31, 2022 and 2021, our portfolio has an average portfolio company investment size of $11.0 million and $13.8 million based on fair value, respectively.
84
Table of Contents
For the year ended December 31, 2022, we funded $187.2 million in 21 new portfolio companies and $50.6 million in existing portfolio companies. For this period, the weighted average term for new investments in new portfolio companies was 4.8 years, and we received $340.9 million of aggregate repayments, paydowns and sales.
For the year ended December 31, 2021, we funded $702.8 million in 51 new portfolio companies and $42.0 million in existing portfolio companies. For this period, the weighted average term for new investments in new portfolio companies was 4.4 years, and we received $586.9 million of aggregate principal amount of dispositions and repayments.
Our investment activity for the years ended December 31, 2022 and December 31, 2021 is presented below:
| For the years ended December 31, | ||||||||
| ($ in millions) | 2022 | 2021 | ||||||
Investment Fundings: | ||||||||
New purchases | $ | 187.2 | $ | 702.8 | ||||
Follow-ons | 50.6 | 42.0 | ||||||
|
|
|
| |||||
Total Investment Fundings | $ | 237.8 | $ | 744.8 | ||||
Investments funded: | ||||||||
First-lien debt | $ | 234.5 | $ | 686.5 | ||||
Second-lien debt | 2.6 | 42.5 | ||||||
Other secured debt | — | 1.6 | ||||||
Equities | 0.7 | 9.0 | ||||||
Other investments | 0.1 | 5.2 | ||||||
|
|
|
| |||||
Total | $ | 237.8 | $ | 744.8 | ||||
| For the years ended December 31, | ||||||||
| ($ in millions) | 2022 | 2021 | ||||||
Investments sold or repaid: | ||||||||
First-lien debt | $ | 307.9 | $ | 530.4 | ||||
Second-lien debt | 14.4 | 28.3 | ||||||
Other secured debt | — | 19.5 | ||||||
Equities | 10.2 | 4.4 | ||||||
Other investments | 8.3 | 4.3 | ||||||
|
|
|
| |||||
Total | $ | 340.9 | $ | 586.9 | ||||
|
|
|
| |||||
Number of new investment commitments in new portfolio companies | 21 | 51 | ||||||
Average new investment fundings in new portfolio companies | $ | 8.9 | $ | 13.8 | ||||
Weighted average term (years) for new investments in new portfolio companies | 4.8 | 4.4 | ||||||
Percentage of new floating rate investments at fair value(1) | 84.6 | % | 91.3 | % | ||||
Percentage of new fixed rate investments at fair value(1) | 15.4 | % | 8.7 | % | ||||
Weighted average yield of new investments at fair value | 12.0 | % | 8.4 | % | ||||
Weighted average spread over SOFR of new floating rate investments at fair value | 7.0 | % | 7.8 | % | ||||
| (1) | With the impact of the interest rate swaps, substantially all of our new debt investments were effectively floating rates for the year ended December 31, 2022 (refer to “—Derivatives and Hedging” below for further details). |
85
Table of Contents
The weighted average yields and interest rates of our debt investments at fair value, as of December 31, 2022 and 2021 were as follows:
| December 31, 2022 | December 31, 2021 | |||||||
Weighted average total yield of debt investments | 11.9 | % | 8.9 | % | ||||
Weighted average interest rate of debt investments | 11.0 | % | 7.9 | % | ||||
Weighted average spread over LIBOR of floating rate investments(1) | 6.8 | % | 7.7 | % | ||||
| (1) | Weighted average spread over SOFR of floating rate investments was 7.0%, as of December 31, 2022. |
Portfolio Monitoring
Our Adviser monitors our portfolio companies on an ongoing basis. Our Adviser has several methods of evaluating and monitoring the performance and fair value of our investments, which may include the following:
| • | Assessment of success in adhering to the portfolio company’s business plan and compliance with covenants; |
| • | Periodic or regular contact with portfolio company management and, if appropriate, the financial or strategic sponsor to discuss financial position, requirements and accomplishments; |
| • | Comparisons to our other portfolio companies in the industry, if any; |
| • | Attendance at and participation in board meetings or presentations by portfolio companies; |
| • | Review of monthly and quarterly financial statements and financial projections of portfolio companies; and |
| • | Quarterly portfolio review process to review performance and outlook relative to the original investment thesis and expectations. |
Results of Operations
Results of Operations for the years ended December 31, 2022 and 2021 were as follows:
| For the years ended December 31, | ||||||||
| ($ in millions) | 2022 | 2021 | ||||||
Total investment income | $ | 96.3 | $ | 79.9 | ||||
Less: Net expenses | 42.9 | 31.7 | ||||||
|
|
|
| |||||
Net investment income | 53.4 | 48.2 | ||||||
Net realized gain (loss) | (2.5 | ) | 8.9 | |||||
Net change in unrealized gain (loss) | (37.7 | ) | 15.6 | |||||
|
|
|
| |||||
Net increase in net assets and partners’ capital resulting from operations | $ | 13.2 | $ | 72.7 | ||||
|
|
|
| |||||
86
Table of Contents
Results of Operations for the years ended December 31, 2021 and 2020 were as follows:
| For the years ended December 31, | ||||||||
| ($ in millions) | 2021 | 2020 | ||||||
Total investment income | $ | 79.9 | $ | 81.5 | ||||
Less: Net expenses | 31.7 | 29.1 | ||||||
|
|
|
| |||||
Net investment income | 48.2 | 52.4 | ||||||
Net realized gain (loss) | 8.9 | (4.7 | ) | |||||
Net change in unrealized gain (loss) | 15.6 | 5.1 | ||||||
|
|
|
| |||||
Net increase in partners’ capital resulting from operations | $ | 72.7 | $ | 52.8 | ||||
|
|
|
| |||||
Investment income is comprised primarily of interest from debt investments, which includes PIK, amortization of upfront fees and prepayment fees.
For the year ended December 31, 2022, total investment income of $96.3 million, increased by $16.4 million, from $79.9 for the year ended December 31, 2021. The increase was primarily due to an increase in average investment portfolio of $23.4 million, at fair value, and an increase in weighted average portfolio yield of approximately 1.6% driven primarily by increase in base rates for the year ended December 31, 2022, compared to same period in the prior year, as well as an increase in dividend income of $3.3 million from certain non-controlled equity investments.
For the year ended December 31, 2021, gross investment income of $79.9 million slightly decreased from $81.5 for the year ended December 31, 2020 primarily from lower average yields partially driven by a reduction in LIBOR rates and from the roll off of some higher yielding fixed rate positions. Our average investment portfolio size for the years ended December 31, 2021 and December 31, 2020 was $851.4 million and $764.7 million, respectively. During those same years, our weighted average yield was 9.4% and 10.7%, respectively.
Expenses
Operating expenses for the years ended December 31, 2022 and 2021 were as follows:
| For the years ended December 31, | ||||||||
| ($ in millions) | 2022 | 2021 | ||||||
Interest and financing expenses | $ | 24.0 | $ | 14.8 | ||||
Management fee (net of offsets) | 4.1 | 2.7 | ||||||
Income incentive compensation | 9.2 | 7.2 | ||||||
Capital gains incentive compensation | (1.4 | ) | 1.4 | |||||
Professional fees | 3.0 | 3.9 | ||||||
Administration fees | 1.9 | 0.4 | ||||||
Trustee fees | 0.4 | 0.1 | ||||||
Other general and administrative expenses | 1.7 | 1.2 | ||||||
|
|
|
| |||||
Total expenses, net of management fee offset | $ | 42.9 | $ | 31.7 | ||||
|
|
|
| |||||
Operating expenses increased $11.2 million from $31.7 million for the year ended December 31, 2021 to $42.9 million for the year ended December 31, 2022. Interest and financing expenses for the year ended December 31, 2022 increased $9.2 million over the same period in the prior year primarily due to an increase in
87
Table of Contents
average debt of $104.1 million and an increase in annualized weighted average borrowing rate of approximately 107 basis points driven primarily by increase in base rates for the year ended December 31, 2022 compared to same period in the prior year.
Management fee (net of offsets) and income incentive compensation increased by $1.4 million and $2.0 million, respectively, for the year ended December 31, 2022 compared to prior year. Prior to the Trust Conversion, our Adviser waived incentive compensation and management fees attributable to affiliates, and, accordingly, incentive compensation and management fees that would have otherwise been calculated and included as components of net investment income, are not included in the financial results for the period from January 1, 2021 through November 14, 2021. Following the Trust Conversion, these waivers were eliminated, without recoupment. Post-Conversion, all investors became fee paying which, along with growth of called capital and income, contributed to the increase in management fees and income incentive compensation for the year ended December 31, 2022. Capital gains incentive compensation reversed from the prior year by $1.4 million due to net unrealized losses in the portfolio at December 31, 2022.
Administration fees for the year ended December 31, 2022 increased $1.5 million compared to prior year primarily due to costs incurred with the Conversion and operating as a BDC. Other general and administrative expenses for the year ended December 31, 2022 increased $0.5 million compared to prior year due to investment specific expenses.
Certain prior period amounts may be reclassified to conform to the current presentation with no effect on total expenses, net of management fee offset.
Operating expenses for the years ended December 31, 2021 and December 31, 2020 were as follows:
| For the years ended December 31, | ||||||||
| ($ in millions) | 2021 | 2020 | ||||||
Interest and financing | $ | 14.8 | $ | 15.9 | ||||
Income incentive compensation | 7.2 | 7.4 | ||||||
Management fees (net of offsets) | 2.7 | 2.9 | ||||||
Capital gains incentive compensation | 1.4 | — | ||||||
Professional fees | 3.9 | 1.9 | ||||||
Administration fees | 0.4 | 0.4 | ||||||
Trustee fees | 0.1 | — | ||||||
Other general and administrative expenses | 1.2 | 0.6 | ||||||
|
|
|
| |||||
Net Expenses, net of management fee offset | $ | 31.7 | $ | 29.1 | ||||
|
|
|
| |||||
Operating expenses increased $2.6 million from $29.1 million for the year ended December 31, 2020 to $31.7 million for the year ended December 31, 2021. Professional fees for the year ended December 31, 2021 increased $2.0 million over the same period in the prior year primarily due to legal costs associated with the Conversion as well as an increase in deal driven legal and consulting costs. Post-Conversion, capital gains incentive compensation became an expense on the consolidated statements of operations from its previous presentation as an allocation on the consolidated statements of changes, resulting in a $1.4 million increase in expenses. Interest and financing was down $1.1 million due to a reduction in average financing costs of 71 basis points, partially offset by an increase in average debt of $37.9 million.
Prior to the Trust Conversion, our Adviser waived incentive compensation and management fees attributable to affiliates. Accordingly, incentive compensation and management fees that would have otherwise been calculated and included as components of net investment income were not included in the financial results for the period from January 1, 2021 through November 14, 2021 and for the year ended December 31, 2020. Following the Trust Conversion, these waivers were eliminated without recoupment.
88
Table of Contents
Certain prior period amounts may be reclassified to conform to the current presentation with no effect on total expenses, net of management fee offset.
Net Realized Gain (Loss) and Net Change in Unrealized Appreciation (Depreciation)
We fair value our portfolio investments quarterly and any changes in fair value are recorded as unrealized appreciation or depreciation. Upon exit of an investment, we reverse the unrealized appreciation or depreciation and recognize realized gain or loss, if any.
For the years ended December 31, 2022 and 2021, net gain (loss) is summarized below:
| For the years ended | ||||||||||||||||||||||||
| December 31, 2022 | December 31, 2021 | |||||||||||||||||||||||
| ($ in millions) | Gains / Appreciation | Losses / Depreciation | Net Capital Gains / Losses | Gains / Appreciation | Losses / Depreciation | Net Capital Gains / Losses | ||||||||||||||||||
Realized | $ | 12.8 | $ | (15.4 | ) | $ | (2.6 | ) | $ | 21.0 | $ | (12.1 | ) | $ | 8.9 | |||||||||
Change in Unrealized | 10.4 | (48.1 | ) | (37.7 | ) | 29.7 | (14.1 | ) | 15.6 | |||||||||||||||
|
|
|
|
|
|
|
|
|
|
|
| |||||||||||||
Net Capital Gains / Losses | $ | 23.2 | $ | (63.5 | ) | $ | (40.3 | ) | $ | 50.7 | $ | (26.2 | ) | $ | 24.5 | |||||||||
|
|
|
|
|
|
|
|
|
|
|
| |||||||||||||
For the years ended December 31, 2021 and 2020, net gain (loss) is summarized below:
| For the years ended | ||||||||||||||||||||||||
| December 31, 2021 | December 31, 2020 | |||||||||||||||||||||||
| ($ in millions) | Gains / Appreciation | Losses / Depreciation | Net Capital Gains / Losses | Gains / Appreciation | Losses / Depreciation | Net Capital Gains / Losses | ||||||||||||||||||
Realized | $ | 21.0 | $ | (12.1 | ) | $ | 8.9 | $ | 9.0 | $ | (13.7 | ) | $ | (4.7 | ) | |||||||||
Change in Unrealized | 29.7 | (14.1 | ) | 15.6 | 21.5 | (16.4 | ) | 5.1 | ||||||||||||||||
|
|
|
|
|
|
|
|
|
|
|
| |||||||||||||
Net Capital Gains / Losses | $ | 50.7 | $ | (26.2 | ) | $ | 24.5 | $ | 30.5 | $ | (30.1 | ) | $ | 0.4 | ||||||||||
|
|
|
|
|
|
|
|
|
|
|
| |||||||||||||
Realized Gross Internal Rate of Return
Since commencement of our investment operations on July 1, 2015 through December 31, 2022, we have fully exited investments in 129 portfolio companies, which have resulted in an unlevered internal rate of return (gross of expenses) of 13.6%. The internal rate of return is the percentage rate of return earned on each dollar invested related to realized investments, based on the amounts and effective dates of each funding and repayment related to each realized investment. Please see ““Item 2. Financial Information—Management’s Discussion and Analysis of Financial Condition and Results of Operations—Key Components of Our Results of Operations—Expenses” and “—Results of Operations—Expenses” for more information regarding Fund expenses. The Fund expects to use leverage and, to the extent that returns on investments are greater than the interest the Fund pays on leverage, returns to Shareholders will be increased. Since formation, in excess of 70% of the Fund’s assets were “qualifying assets” under Section 55(a) of the Investment Company Act.
Derivatives and Hedging
In the normal course of business, the Fund has commitments and risks resulting from its investment transactions, which may include those involving derivative instruments. Derivative instruments are measured in terms of the notional contract amount and derive their value based upon one or more underlying instruments. While the notional amount gives some indication of the Fund’s derivative activity, it generally is not exchanged, but is only used as the basis on which interest and other payments are exchanged. Derivative instruments are subject to various risks similar to non-derivative instruments including market, credit, liquidity, and operational risks. The Fund manages these risks on an aggregate basis as part of its risk management process.
89
Table of Contents
The Fund seeks to manage the currency risks associated with investments denominated in currencies other than U.S. dollars by using foreign currencies and entering into foreign currency forward contracts. In a foreign currency forward contract, the Fund agrees to recover or deliver a fixed quantity of one currency for another at a pre-determined price at a future date. The foreign currency forward contracts are recorded at fair value. The Fund does not utilize hedge accounting and as such, realized and unrealized gains and losses on foreign currency forward contracts are included on the consolidated statements of operations.
Additionally, the Fund seeks to mitigate interest rate risk associated with fixed rate investments by entering into interest rate swaps. Interest rate swaps are recorded at fair value and are presented either as a derivative asset or a derivative liability on the Fund’s consolidated statements of assets and liabilities, depending on the nature of the balance at period end. Changes in the fair value of the interest rate swaps are presented as part of change in unrealized appreciation (depreciation) on the consolidated statements of operations for interest rate swaps not designated as hedging instruments. Interest rate swap agreements are derived using daily swap curves and models that incorporate a number of market data factors, such as discounted cash flows, trades and values of the underlying reference instruments. The fair value of the interest rate swaps does not take into account collateral posted which is recorded separately as due to or due from broker on the Fund’s consolidated statements of assets and liabilities, depending on the nature of the balance at period end.
Financial Condition, Liquidity and Capital Resources
Our liquidity and capital resources are derived primarily from advances from our credit facilities, cash flows from operations and through the Commitment Period, proceeds from investor capital calls. The primary uses of our cash and cash equivalents are investments, costs of operations, debt service, repayment and other financing costs and distributions to investors.
We may from time to time enter into additional credit facilities, increase the size of existing facilities or issue debt and convertible debt securities. Any such incurrence or issuance would be subject to prevailing market conditions, our liquidity requirements, contractual and regulatory restrictions and other factors. As of December 31, 2022 and December 31, 2021, our asset coverage ratio was 2.15 and 2.07, respectively. We have carefully considered our unfunded portfolio commitments for the purpose of planning our capital resources and liquidity including our financial leverage. As of December 31, 2022 and December 31, 2021, our unfunded portfolio commitments were approximately $25.4 million and $45.4 million, respectively. Further, we maintain sufficient cash and borrowing capacity to cover any short term funding requirements.
Cash as of December 31, 2022, taken together with cash available from our credit facilities, is expected to be sufficient for our investing activities and to conduct our operations in the near term. As of December 31, 2022, we had approximately $170.0 million of availability on our third-party debt facilities, subject to asset coverage limitations.
As of December 31, 2022, we had $171.8 million in cash, restricted cash and cash equivalents. During the year ended December 31, 2022, cash provided by operating activities was $159.2 million, primarily driven by proceeds from investments of $340.9 million, unsettled transactions of $24.5 million, other operating activity of $18.4 million and an increase in net assets resulting from operations of $13.2 million, offset by purchases of investments of $237.8 million. Lastly, cash used in financing activities was $115.4 million, primarily due to repayments of debt of $148.5 million, dividends paid of $45.9 million and debt issuance and offering costs of $2.3 million, partially offset by borrowings of debt of $81.3 million.
As of December 31, 2021, we had $127.9 million in cash and restricted cash. During the year ended December 31, 2021, cash used in operating activities was $146.4 million, primarily driven by purchases of investments of $744.8 million, unsettled transactions of $21.2 million and other operating activity of $40.0 million, offset by proceeds from investments of $586.9 million and an increase in net assets resulting from operations of $72.7 million. Lastly, cash provided by financing activities was $241.9 million, primarily due to
90
Table of Contents
borrowings of debt of $847.6 million and capital contributions from partners of $93.2 million, partially offset by repayments of debt of $613.9 million, distributions paid of $69.7 million, unwinding of reverse repos of $7.6 million and payment of debt issuance costs of approximately $7.7 million.
Debt
Debt obligations consisted of the following as of December 31, 2022 and December 31, 2021:
| December 31, 2022 | ||||||||||||||||||||
| Facility | Total Principal Amount Committed | Principal Amount Outstanding | Interest Rate | Maturity Date | Maturity Term | |||||||||||||||
2021 CLO | $ | 288,000,000 | $ | 288,000,000 | 5.74 | % | 10/15/2032 | 9.8 years | ||||||||||||
Revolving Credit Facility | $ | 200,000,000 | $ | 29,974,938 | 7.11 | % | 04/17/2026 | 3.3 years | ||||||||||||
2026 Notes | $ | 145,000,000 | $ | 145,000,000 | 4.00 | % | 11/4/2026 | 3.8 years | ||||||||||||
| December 31, 2021 | ||||||||||||||||||||
| Facility | Total Principal Amount Committed | Principal Amount Outstanding | Interest Rate | Maturity Date | Maturity Term | |||||||||||||||
2021 CLO | $ | 288,000,000 | $ | 288,000,000 | 2.13 | % | 10/15/2032 | 10.8 years | ||||||||||||
Revolving Credit Facility | $ | 200,000,000 | $ | 142,174,938 | 2.45 | % | 10/17/2025 | 3.8 years | ||||||||||||
2026 Notes | $ | 100,000,000 | $ | 100,000,000 | 4.00 | % | 11/4/2026 | 4.8 years | ||||||||||||
As of December 31, 2022 and December 31, 2021, we were in compliance with the terms of our debt arrangements. We intend to continue to utilize our credit facilities to fund investments and for other general operating purposes.
2021 Debt Securitization
On September 9, 2021, the Fund completed a $400 million term debt securitization (the “2021 Debt Securitization”). The debt offered in the 2021 Debt Securitization (the “2021 CLO”) was issued by Silver Point SCF CLO I, Ltd., a wholly-owned, consolidated subsidiary of the Fund, and is backed by a diversified portfolio of senior secured and second lien loans and senior secured bonds. In connection with the 2021 CLO, the Fund has pledged collateral consisting of investments and cash valued at approximately $356.6 million and $35.9 million as of December 31, 2022, respectively. The Fund owns $112 million of Class D and Subordinated Notes. All transactions and balances associated with these two classes of notes have been eliminated in consolidation.
The 2021 CLO consists of the following:
| December 31, 2022 | ||||||||||||||||
| 2021 CLO | Total Principal Amount Committed | Principal Amount Outstanding | Coupon | Interest Rate | ||||||||||||
Class A-1 Loans | $ | 100,000,000 | $ | 100,000,000 | 3ML+ 1.72 | % | 5.80 | % | ||||||||
Class A-1a Notes | 104,500,000 | 104,500,000 | 3ML+ 1.72 | % | 5.80 | % | ||||||||||
Class A-1b Notes | 7,500,000 | 7,500,000 | 2.45 | % | 2.45 | % | ||||||||||
Class A-2a Notes | 6,000,000 | 6,000,000 | 3ML+ 1.90 | % | 5.98 | % | ||||||||||
Class A-2b Notes | 10,000,000 | 10,000,000 | 2.81 | % | 2.81 | % | ||||||||||
Class B-1 Notes | 8,000,000 | 8,000,000 | 3ML+ 2.00 | % | 6.08 | % | ||||||||||
Class B-2 Notes | 8,000,000 | 8,000,000 | 2.94 | % | 2.94 | % | ||||||||||
Class C Notes | 44,000,000 | 44,000,000 | 3ML+ 3.00 | % | 7.08 | % | ||||||||||
|
|
|
|
|
| |||||||||||
Total 2021 CLO | $ | 288,000,000 | $ | 288,000,000 | 5.74 | % | ||||||||||
|
|
|
|
|
| |||||||||||
91
Table of Contents
Revolving Credit Facility
On October 17, 2017, Specialty Credit Facility, LLC, a wholly-owned subsidiary of the Fund, entered into a secured revolving credit facility (the “Revolving Credit Facility”) with Deutsche Bank AG, as facility agent (the “Facility Agent”) and U.S. Bank National Association as collateral agent (the “Collateral Agent”). On October 6, 2022, the Fund entered into an amendment to the Revolving Credit Facility, which, among other matters, extended the maturity date on loans made under the Revolving Credit Facility from October 17, 2025 to April 17, 2026, and increased the applicable margin by 25 basis points.
As of December 31, 2022, the commitment under the Revolving Credit Facility was $200 million and amounts drawn under the Revolving Credit Facility bore interest at 3-month SOFR plus a margin of 2.45% per annum and an applicable credit adjustment spread. We also pay a commitment fee of 0.40% per annum on any undrawn amount. Amounts borrowed under the Revolving Credit Facility are secured by the assets of the borrower.
In connection with the Revolving Credit Facility, the Fund has pledged collateral consisting of investments and cash valued at approximately $201.6 million and $5.7 million, respectively, as of December 31, 2022. The Revolving Credit Facility does not have recourse to any other assets of the Fund. Such pledged assets may accordingly be restricted as to resale. Amounts available to borrow under the Revolving Credit Facility are subject to compliance with a borrowing base that applies different advance rates to different types of assets in the Fund’s portfolio that are pledged as collateral, as well as an aggregate leverage restriction based on asset diversity. The Revolving Credit Facility includes customary covenants, including certain financial covenants related to asset and interest coverage, certain limitations on collateral, as well as usual and customary events of default for senior secured revolving credit facilities of this nature. As of December 31, 2022, we were in compliance in all material respects with the terms of the Revolving Credit Facility.
2026 Notes
On November 4, 2021, the Fund placed $145 million aggregate principal amount of notes that mature on November 4, 2026 (the “2026 Notes”). The 2026 Notes were issued in two tranches, with $100 million of tranche A notes funded on November 4, 2021 and $45 million of tranche B notes funded on January 21, 2022. The 2026 Notes bear interest at a rate of 4.00% per year, payable semi-annually on November 4 and May 4, of each year, commencing on May 4, 2022. The 2026 Notes are governed by a purchase agreement, dated November 4, 2021, by and among the Fund and the purchasers named therein (the “Note Purchase Agreement”).
The Fund may prepay at any time all or any part of the 2026 Notes, in an amount not less than 5% of the aggregate principal amount of the 2026 Notes then outstanding, in the case of a partial prepayment, at 100% of the principal amount so prepaid, together with interest accrued thereon, plus a make-whole or settlement amount. The Fund may also prepay the 2026 Notes pursuant to an offer to purchase made by the Fund or an affiliate pro rata to the holders of all 2026 Notes at the time outstanding upon the same terms and conditions. The Fund must offer to prepay all of the 2026 Notes in connection with a change of control, and if an IPO has not occurred, the Fund must offer to prepay the 2026 Notes on a pro rata basis each time the Fund makes a distribution in the form of a return of capital, in an amount of cash equal to such distribution.
The Fund is required to maintain the following asset ratios pursuant to the Note Purchase Agreement:
| • | The Fund must maintain an Asset Coverage Ratio (as defined in the Note Purchase Agreement) of at least 200%; provided that the minimum asset coverage ratio shall be reduced to 150% as provided in the Note Purchase Agreement from and after the date on which such reduced ratio is permitted pursuant to applicable law. |
| • | The Fund must maintain an Unencumbered Asset Ratio (as defined in the Note Purchase Agreement) of at least 1.25 to 1.00, so long as the Fund is not a party to a secured credit facility, with recourse to |
92
Table of Contents
the Fund, incurred pursuant to documentation containing financial covenants, covenants governing the borrowing base, if any, portfolio valuations and events of default other terms (other than interest) that are not materially more restrictive upon the Fund and its subsidiaries than those set forth in similar credit facilities for borrowers the general nature of the business of which is not substantially different from the general nature of the business of the Fund and its subsidiaries, taken as a whole (such secured credit facility, a “Corporate Facility”). |
| • | The Fund’s Asset Coverage Ratio (as defined in the Note Purchase Agreement) must be at least 1.50 to 1.00, so long as it is not a party to a Corporate Facility. |
| • | The Fund’s Shareholders’ equity must be at least 60% of Shareholders’ equity for the last fiscal quarter plus 25% of the net proceeds of the sale of equity interests by the Fund and its subsidiaries after the date of closing in the prior fiscal quarter. |
The Note Purchase Agreement and the 2026 Notes may be amended with the written consent of the Fund and at least 50% of the holders of outstanding 2026 Notes. Certain amendments, however, require the written consent of each holder of 2026 Notes outstanding, including amendments relating to acceleration, amount or timing of prepayment or payment of principal, reduction of interest rate and timing of payment of interest or make-whole of prepayment amounts, and the percentage of holders of 2026 Notes required to consent to any amendment or waiver.
Refer to the consolidated financial statements and respective footnotes thereto included in this Registration Statement for further details on credit facilities.
Off-Balance Sheet Arrangements
Portfolio Fund Commitments
From time to time, we may enter into commitments to fund investments. We incorporate these commitments into our assessment of our liquidity position. Our senior secured revolving loan commitments are generally available on a borrower’s demand and may remain outstanding until the maturity date of the applicable loan. Our senior secured term loan commitments generally require certain criteria to be met to be released, and, once drawn, generally have the same remaining term as the associated Revolving Credit Facility.
As of December 31, 2022 and December 31, 2021, we had the following commitments to fund investments in current portfolio companies:
| ($ in millions) | December 31, 2022 | December 31, 2021 | ||||||
First Lien Secured Debt | $ | 22.2 | $ | 39.7 | ||||
Second Lien Secured Debt | 2.9 | 5.4 | ||||||
Other Investments | 0.3 | 0.3 | ||||||
|
|
|
| |||||
Total Portfolio Fund Commitments | $ | 25.4 | $ | 45.4 | ||||
|
|
|
| |||||
Derivatives as Financing Arrangements
From time to time, we may enter into total return swap contracts (“TRS”) for financing purposes. A TRS is a notionalized contract, in which one party agrees to make payments to another party based on the increase, if any, in the market value of the asset(s) underlying the TRS, and the other party agrees to make payments to the first party based on the decrease, if any, in the market value of such underlying assets plus periodic payments based on a fixed or variable interest rate. A TRS effectively adds leverage to a portfolio by providing investment exposure to an underlying asset without owning or taking physical custody of the underlying asset. A TRS often offers lower financing costs than are offered through more traditional borrowing arrangements.
93
Table of Contents
Under the terms of the TRS, we may be required to post additional collateral, on a dollar-for-dollar basis, in certain circumstances, including in the event of depreciation or appreciation in the value of the underlying loans. The limit on the additional collateral that we may be required to post pursuant to the TRS is equal to the difference between the full notional amount of the loans underlying the TRS and the amount of cash collateral already posted. As of December 31, 2022 and December 31, 2021, we did not hold any investments financed via TRS.
Reverse Repurchase Agreements and Buy/Sell-back Transactions
From time to time, we may enter into reverse repurchase transactions (“Repo”) in order to obtain financing on certain investments. In Repo agreements, one party sells assets to another party and agrees to repurchase the same assets at an agreed upon price and date. Under Repo transactions, one party agrees to make payments to another party based on the increase, if any, in the market value of the underlying asset(s), and the other party agrees to make payments to the first party based on the decrease, if any, in the market value of such underlying assets plus periodic payments based on a fixed or variable interest rate. A Repo often offers lower financing costs than are offered through more traditional borrowing arrangements and terms are customizable for each asset.
Under the terms of the Repo, we may be required to post additional collateral in certain circumstances, including in the event of depreciation or appreciation in the value of the underlying loans. The limit on the additional collateral that we may be required to post pursuant to the Repo is equal to the difference between the repurchase price and the amount of cash collateral already posted. As of December 31, 2022 and December 31, 2021 we had had no outstanding Repo financing.
We may also enter into buy/sell-back transactions (a form of delayed delivery agreement). In a buy/sell-back transaction, we enter a trade to sell securities at one price and simultaneously enter a trade to buy the same securities at another price for settlement at a future date. Although the Fund generally intends to acquire or dispose of securities on a forward commitment, when-issued or delayed delivery basis, the Fund may sell these securities or its commitment before the settlement date if deemed advisable. As of December 31, 2022 and December 31, 2021, we had no outstanding buy/sell-back financing.
Other Commitments, Contingencies and Contractual Obligations
Contractual Obligations
As of December 31, 2022, our contractual payment obligations are as follows:
| Payments Due by Period | ||||||||||||||||||||
| ($ in millions) | Total | Less than 1 year | 1-3 years | 3-5 years | After 5 years | |||||||||||||||
2021 CLO | $ | 288.0 | $ | — | $ | — | $ | — | $ | 288.0 | ||||||||||
2026 Notes | 145.0 | — | — | 145.0 | — | |||||||||||||||
Revolving Credit Facility | 30.0 | — | — | 30.0 | — | |||||||||||||||
|
|
|
|
|
|
|
|
|
| |||||||||||
Total Contractual Obligations | $ | 463.0 | $ | — | $ | — | $ | 175.0 | $ | 288.0 | ||||||||||
|
|
|
|
|
|
|
|
|
| |||||||||||
Contracts
We have entered into two contracts under which we have future commitments: the Advisory Agreement and the Sub-Administration Agreement. See “Item 1. Business—Investment Management Agreement” and “—Sub-Administration Agreement.” Payments under the Advisory Agreement are equal to (1) a percentage of the value of our average gross assets (including assets purchased with borrowed amounts) and (2) a two-part incentive fee and (3) reimbursements equal to an amount that the Administrator incurs for costs and expenses and the Fund’s allocable portion of overhead incurred by our Adviser in performing its obligations as Administrator under the Advisory Agreement, either party may terminate the Advisory Agreement without penalty upon at least 60 days’ written notice to the other.
94
Table of Contents
Financial Instruments
We may become a party to financial instruments with off-balance sheet risk in the normal course of our business to meet the financial needs of our portfolio companies. These instruments may include commitments to extend credit and involve, to varying degrees, elements of liquidity and credit risk in excess of the amount recognized in the balance sheet.
Quantitative and Qualitative Disclosures About Market Risk
We are subject to financial market risks, including changes in interest rates and the valuations of our investment portfolio.
Interest rate sensitivity refers to the change in our earnings that may result from changes in the level of interest rates. Because we expect to fund a portion of our investments with borrowings, our net investment income is expected to be affected by the difference between the rate at which we invest and the rate at which we borrow. As a result, there can be no assurance that a significant change in market interest rates will not have a material adverse effect on our net investment income. See “Item 1A. Risk Factors—Risks Relating to Our Business and Structure—We are exposed to risks associated with changes in interest rates.”
As of December 31, 2022, approximately 89.9% of our performing debt investments at fair value in our portfolio bore interest at variable rates with interest rate floors and approximately 10.1% bore interest at fixed rates. From time to time, the Fund seeks to mitigate interest rate risk associated with fixed rate investments by entering into interest rate swaps (refer to “Item 2. Financial Information—Management’s Discussion and Analysis of Financial Conditions and Results of Operations—Derivatives and Hedging” for further details). With the impact of the interest rate swaps, approximately 94.9% of our performing debt investments based on fair value were effectively floating rate investments at December 31, 2022.
We regularly measure our exposure to interest rate risk. We assess interest rate risk and manage our interest rate exposure on an ongoing basis by comparing our interest rate sensitive assets to our interest rate sensitive liabilities.
We may hedge against interest rate fluctuations by using standard hedging instruments such as futures, options and forward contracts subject to the requirements of the Investment Company Act and the Volcker Rule. While hedging activities may insulate us against adverse changes in interest rates, they may also limit our ability to participate in benefits of lower interest rates with respect to our portfolio of investments with fixed interest rates. During the periods covered by this Registration Statement, we did not engage in material interest rate hedging activities.
Based on our December 31, 2022 balance sheet values for floating rate portfolio investments and outstanding debt, the following table shows the annual impact on net income of base rate changes in interest rates (considering interest rate floors and caps for variable rate instruments and excluding the impact of interest rate swaps, if any), assuming no changes in our investment and borrowing structure:
| ($ in millions) | December 31, 2022 | |||||||||||
| Basis Point Change | Change in Interest Income | Change in Interest Expense | Change in Net Investment Income | |||||||||
Up 300 basis points | $ | 21.7 | $ | (8.8 | ) | $ | 12.9 | |||||
Up 200 basis points | 14.5 | (5.8 | ) | 8.7 | ||||||||
Up 100 basis points | 7.3 | (2.9 | ) | 4.4 | ||||||||
Up 50 basis points | 3.7 | (1.5 | ) | 2.2 | ||||||||
Down 50 basis points | (3.5 | ) | 1.5 | (2.0 | ) | |||||||
Down 100 basis points | (7.0 | ) | 2.9 | (4.1 | ) | |||||||
Down 200 basis points | (13.7 | ) | 5.8 | (7.9 | ) | |||||||
Down 300 basis points | (19.5 | ) | 8.8 | (10.7 | ) | |||||||
95
Table of Contents
Critical Accounting Policies
Our discussion and analysis of our financial condition and results of operations are based upon our consolidated financial statements, which have been prepared in accordance with accounting principles generally accepted in the United States of America, or GAAP. The preparation of the consolidated financial statements requires management to make estimates and assumptions that affect the reported amounts of assets, liabilities, revenues and expenses. Changes in the economic environment, financial markets and any other parameters used in determining such estimates could cause actual results to differ materially.
For a description of our critical accounting policies, see Note 2 “Summary of Significant Accounting Policies” to our consolidated financial statements included in this Registration Statement. We consider the most significant accounting policies to be those related to i) Valuation of Investments and Derivative Contracts and ii) Investment Transaction and Related Income and Expense.
Valuation of Investments and Derivative Contracts
Investments owned at fair value consist primarily of secured loans, bonds, real estate properties and equities. Derivative contracts consist of foreign currency forward contracts and interest rate swaps.
Effective August 10, 2022, the Board designated our Adviser as the Fund’s valuation designee pursuant to Rule 2a-5 under the Investment Company Act, which establishes requirements for determining fair value in good faith for purposes of the Investment Company Act. Accordingly, our Adviser has appointed its BDC Valuation Committee with the responsibility for fair value determinations pursuant to valuation procedures adopted for the Fund. The Board oversees the Adviser in its role as valuation designee in accordance with the requirements of Rule 2a-5 under the Investment Company Act.
Investments and derivative contracts are valued in good faith by the Adviser, as the Fund’s valuation designee, at fair value pursuant to the valuation policy, which considers quotations provided by independent pricing sources, when such quotations are available and deemed reliable.
Investments that are not listed on an exchange but are actively traded over-the-counter are generally valued at the representative “bid” quotation if held long and the representative “ask” quotation if held short or, in the case of equities that trade in over-the-counter marketplaces, at the last deemed reliable sale price provided by independent pricing sources. Derivative contracts not listed on an exchange are generally valued through industry-standard valuation models using inputs obtained from pricing vendors and from the relevant derivative contract.
Investments for which independent pricing sources or recent transaction activity are either not readily available or are not deemed reliable (“Non-quoted Investments”) are fair valued as determined in good faith by the Adviser, as the Fund’s valuation designee. Non-Quoted Investments are valued in a multi-step process:
| 1. | The BDC valuation team within the Fund Accounting team of the Adviser (“Fund Accounting”) provides recent portfolio company financial statements and other reporting materials to independent valuation firm(s) (“IVF”) approved by the BDC Valuation Committee. |
| 2. | The IVF evaluates this information along with relevant observable market data to conduct independent valuations each quarter, and their valuation recommendations are documented and discussed with the BDC Valuation Committee, Fund Accounting and the relevant investment professionals, as appropriate. |
| 3. | The valuation recommendations for certain investments may be determined by the BDC Valuation Committee in good faith in accordance with the valuation policy for the Fund without the employment of an IVF, based on immateriality or other considerations as appropriate. |
96
Table of Contents
| 4. | The BDC Valuation Committee discusses the valuations and approves the fair value of the investments in good faith based on the input and advice provided by the IVF, the BDC valuation team and relevant investment professionals of the Adviser, as necessary. |
The Fund conducts this valuation process on a quarterly basis.
The estimated fair value of financial instruments is based upon available information and may not be the amount that the Fund would realize in a current transaction or might be ultimately realized, since such amounts depend on future circumstances, and the differences could be material.
We apply the authoritative guidance on fair value measurements and disclosures under ASC Topic 820, Fair Value Measurements and Disclosures (“ASC 820”) which establishes a framework for measuring fair value in accordance with U.S. GAAP and required disclosures of fair value measurements. ASC 820 determines fair value to be the price that would be received for an investment in a current sale, which assumes an orderly transaction between market participants on the measurement date. Market participants are defined as buyers and sellers in the principal or most advantageous market (which may be a hypothetical market) that are independent, knowledgeable, and willing and able to transact. Consistent with ASC 820, we disclose the fair value of investments according to a hierarchy that prioritizes the inputs used to measure the fair value. The hierarchy gives the highest priority to valuations based upon unadjusted quoted prices in active markets for identical assets or liabilities (level 1 measurements) and the lowest priority to valuations based upon unobservable inputs that are significant to the valuation (level 3 measurements). The guidance establishes three levels of the fair value hierarchy as follows:
Level 1: Inputs that reflect unadjusted quoted prices on a securities exchange in active markets for identical assets or liabilities;
Level 2: Inputs other than quoted prices on a securities exchange that are observable for the asset or liability either directly or indirectly in active markets, or unadjusted prices on a securities exchange in markets that are not considered to be active;
Level 3: Significant inputs that may be unobservable or inputs, including market quotations other than quoted prices on a securities exchange, in markets that are not considered to be active.
Inputs are used in applying the various valuation techniques and broadly refer to the assumptions that market participants use to make valuation decisions including assumptions about risk. Inputs may include price information, volatility statistics, specific and broad credit data, liquidity statistics and other factors. An investment’s level within the fair value hierarchy is based on the lowest level of any input that is significant to the fair value measurement. However, the determination of what constitutes “observable” requires judgment by the Adviser. The Adviser considers observable data to be that market data which is readily available, regularly distributed or updated, reliable and verifiable, not proprietary, and provided by multiple independent sources that are actively involved in the relevant market. The categorization of an investment within the hierarchy is based upon the pricing transparency of the investment and does not necessarily correspond to the Adviser’s perceived risk of that instrument.
See Note 2 to our consolidated financial statements included in this registration statement for more information on the fair value of our investments.
Our accounting policy on the fair value of our investments is critical because the determination of fair value involves subjective judgments and estimates. Under current auditing standards the notes to our consolidated financial statements express the uncertainty with respect to the possible effect of these valuations, and any change in these valuations, on the consolidated financial statements.
97
Table of Contents
Income Recognition
Interest income is recognized on an accrual basis. Loan origination fees, original issue discount and market discounts are capitalized and accreted into interest income over the contractual life of the loan. The amortized cost of investments represents the original cost adjusted for accretion of fees, if any. Upon the prepayment of a loan, prepayment premiums and any unamortized fees are recorded as interest income. For loans that contain PIK provisions, PIK interest is computed at the contractual rate specified in each loan agreement and is recorded as interest income on an accrual basis. On the specified capitalization date, PIK interest is added to the cost of the loan and principal balance due at maturity.
Debt investments are generally placed on non-accrual status when payments are past due and there is reasonable doubt that principal or interest will be collected. Generally, accrued interest is reversed against interest income when a debt investment is placed on non-accrual status. Interest payments received on debt investments on non-accrual status may be recognized as interest income or treated as a reduction of cost basis of the debt investment based on management’s judgment on ultimate recovery.
Investment transactions are recorded on a trade date basis. Realized gains or losses are determined on a specific identification basis and are measured by the difference between the net proceeds received in a sale and the amortized cost basis of the investment at time of disposition. The net change in unrealized gains or losses primarily reflects the change in investment values and also includes the reversal of previously recorded unrealized gains or losses with respect to investments realized during the period.
Our accounting policy on income recognition is critical because it involves the primary source of our revenue and accordingly is significant to the financial results as disclosed in our consolidated financial statements.
Distributions
We intend to pay quarterly dividends to our Shareholders out of assets legally available for distribution. All dividends will be paid at the discretion of our Board and will depend on our earnings, financial condition, compliance with applicable BDC regulations and such other factors as our Board may deem relevant from time to time.
Federal Income Taxes
We follow the authoritative guidance on accounting for and disclosure of uncertainty in tax positions, which require us to determine whether each of our tax positions is more likely than not to be sustained upon examination, including resolution of any related appeals or litigation processes, based on the technical merits of the position. For tax positions meeting the more likely than not threshold, the tax amount recognized is reduced by the largest benefit that has a greater than fifty percent likelihood of being realized upon ultimate settlement with the relevant taxing authority.
We file tax returns as prescribed by the tax laws of the jurisdictions in which we operate and invest, if required. In the normal course of business, the Fund is subject to examination by U.S. federal, state, local and foreign jurisdictions, where applicable. The Fund may be subject to examination by such jurisdictions for all open tax years, the earliest of which is 2019. Interest and penalties, if any, related to unrecognized tax positions, are recorded as income tax expense. For the years ended December 31, 2022 and December 31, 2021, there were no interest and penalties and there was no impact to the consolidated financial statements related to accounting for uncertainty in income taxes.
As a partnership for U.S. federal income tax purposes, we are generally not subject to U.S. federal income taxes as each partner is individually liable for income taxes, if any, on its share of net taxable income on a flow
98
Table of Contents
through basis. Interest, dividends, and other income realized from non-U.S. sources and capital gains realized on the sale of securities of non-U.S. issuers may be subject to withholding and other taxes levied by the jurisdiction in which the income is sourced. Such withholding taxes are accrued when incurred as withholding taxes against the relevant income stream.
Exemptive Relief
We and our Adviser have obtained an exemptive order from the SEC to permit greater flexibility to negotiate the terms of co-investments if our Board of Trustees determines that it would be advantageous for us to co-invest with other affiliated funds managed by our Adviser or its affiliates in a manner consistent with our investment objectives, positions, policies, strategies and restrictions as well as regulatory requirements and other pertinent factors.
We do not own any real estate or other properties materially important to our operations. Our principal executive office is located at Two Greenwich Plaza, First Floor, Greenwich, Connecticut 06830.
99
Table of Contents
Item 4. Security Ownership of Certain Beneficial Owners and Management.
As of December 31, 2022, there were 36,907,451 common shares outstanding. The following table sets forth information with respect to the expected beneficial ownership of our common shares as of the date of this Registration Statement, by:
| • | each person known to us to be expected to beneficially own more than 5% of the outstanding shares of our common shares; |
| • | each of our Trustees and executive officers; and |
| • | all of our Trustees and executive officers as a group. |
Beneficial ownership is determined in accordance with the rules of the SEC and includes voting or investment power with respect to the securities. There are no common shares subject to options that are currently exercisable or exercisable within 60 days of the date of this Registration Statement.
Name and address(1) | Type of ownership | Shares owned | Percentage of common stock currently outstanding | |||||||||
Edward Mulé(2) | Beneficial | 3,962,477 | 10.7 | % | ||||||||
Anthony DiNello | Record and Beneficial | 13,469 | * | % | ||||||||
Jesse Dorigo | Record and Beneficial | 3,367 | * | % | ||||||||
James Kasmarcik | None | None | * | % | ||||||||
Kristen Clark | None | None | * | % | ||||||||
Laurence M. Austin | None | None | * | % | ||||||||
Steven E. Brown | None | None | * | % | ||||||||
Paul Shang | None | None | * | % | ||||||||
All executive officers and Trustees as a group (8 persons) | Record and Beneficial | 3,979,313 | 10.8 | % | ||||||||
Texas County & District Retirement System | Beneficial | 6,673,213 | 18.1 | % | ||||||||
The Board of Regents of the University of Texas System | Beneficial | 5,004,910 | 13.6 | % | ||||||||
Houston Police Officers’ Pension System | Beneficial | 3,336,607 | 9.0 | % | ||||||||
Illinois State Board of Investment | Beneficial | 3,336,607 | 9.0 | % | ||||||||
Cliffwater LLC & Stephen Nesbitt(3) | Beneficial | 2,135,428 | 5.8 | % | ||||||||
| * | Represents less than 1%. |
| (1) | The address for each Trustee and executive officer is Two Greenwich Plaza, First Floor, Greenwich, Connecticut 06830. |
| (2) | Beneficial ownership of shares held through affiliated entities. |
| (3) | In a Schedule 13G filed with the SEC on February 10, 2023, Cliffwater LLC reported that it is the discretionary manager of several managed accounts holding securities of the Fund. Additionally, Mr. Nesbitt may be deemed to beneficially own such securities due to his position as Chief Executive Officer of Cliffwater LLC. |
100
Table of Contents
Item 5. Trustees and Executive Officers.
Overall responsibility for our oversight rests with our Board of Trustees. We have engaged our Adviser to manage us on a day-to-day basis. Our Board of Trustees is responsible for overseeing our Adviser and other service providers in our operations in accordance with the provisions of the Investment Company Act, applicable provisions of state and other laws and our charter. Our Board of Trustees is currently composed of five members, three of whom are not “interested persons” of our Fund or our Adviser as defined in the Investment Company Act. Our Board of Trustees meets in-person at regularly scheduled quarterly meetings each year. In addition, our Board of Trustees may hold special in-person or telephonic meetings or informal conference calls to discuss specific matters that may arise or require action between regular meetings. As described below, our Board of Trustees has established an Audit Committee, a Governance, Nominating and Compensation Committee, and a Co-Investment Committee and may establish ad hoc committees or working groups from time to time, to assist our Board of Trustees in fulfilling its oversight responsibilities.
Board of Trustees
Our Board of Trustees is divided into three classes, Class I, Class II and Class III. Each class will hold office for a three-year term. However, the initial members of the three classes have initial terms of one, two and three years, respectively, the Class I Trustees serving until the 2023 annual meeting of Shareholders, the Class II Trustees serving until the 2024 annual meeting of Shareholders, and the Class III Trustees serving until the 2025 annual meeting of Shareholders. At each annual meeting of our Shareholders, the successors to the class of Trustees whose terms expire at such meeting will be elected to hold office for a term expiring at the annual meeting of Shareholders held in the third year following the year of their election. Each Trustee will hold office for the term to which he or she is elected and until his or her successor is duly elected and qualifies.
Trustees
Certain information regarding the Board of Trustees is set forth in the table below. Trustees who are not interested persons (as defined in Section 2(a)(19) of the Investment Company Act) of the Fund are referred to herein as “Independent Trustees.”
Name, Business | Position(s) | Term of | Principal Occupations During the Past Five Years | Number of Portfolios in Fund Complex(2) Overseen by Trustee | Other Directorships | |||||
| INDEPENDENT TRUSTEES: | ||||||||||
Laurence M. Austin Year of Birth: 1957 | Trustee | Trustee since November 15,
Term of Office - Class I | Current: Chairman and Portfolio Manager, Endeavour Capital Advisors (1994-Present). | 1 | Former: Mexico Tower Partners, Holdco (2014-2019) (telecommunications infrastructure). | |||||
Steven E. Brown Year of Birth: 1962 | Trustee | Trustee since November 15,
Term of Office - Class III | Current: Vice President, Treasury and Risk Management | 1 | None. | |||||
101
Table of Contents
Name, Business | Position(s) | Term of | Principal Occupations During the Past Five Years | Number of Portfolios in Fund Complex(2) Overseen by Trustee | Other Directorships | |||||||||
| INDEPENDENT TRUSTEES: | ||||||||||||||
Paul Shang Year of Birth: 1956 | Trustee | Trustee since November 15,
Term of Office - Class II | | Current: Managing Director, Chief Executive Officer of Standard NY and Vice Chairman of Global Corporate & Investment Banking, Standard Bank (2010-Present) | | 1 | None. | |||||||
INTERESTED TRUSTEES(3): | ||||||||||||||
Edward Mulé Year of Birth: 1962 | Trustee (Chair of the Board), President and Chief Executive Officer | Trustee since
Term of Office - Class III | | Current: Chief Executive Officer, Silver Point Capital | | 1 | None. | |||||||
| Kristen Clark Year of Birth: 1972 | Trustee | Trustee since
Term of Office - Class II | | Current: Senior Controller, Silver Point Capital | | 1 | None. | |||||||
| (1) | The business address of each Trustee is c/o Silver Point Specialty Lending Fund, Two Greenwich Plaza, First Floor, Greenwich, Connecticut 06830. |
| (2) | The Trust is the only fund in the “Fund Complex.” |
| (3) | Mr. Mulé and Ms. Clark are each deemed to be an “interested person” of the Fund under the Investment Company Act because of their affiliations with our Adviser. |
Laurence Austin
Mr. Austin is the Chairman and Portfolio Manager of Endeavour Capital Advisors, a financial services sector investment firm he co-founded in 1994. Prior to building Endeavour Capital, Mr. Austin was a senior member of the research team of Adams, Cohen Securities Inc., a boutique investment banking firm focused on financial institutions from 1987 to 1993. Before joining Adams Cohen, Mr. Austin was at Merrill, Lynch, Pierce, Fenner & Smith, Inc. from 1981 to 1986. He received a B.A. from the State University of New York at Albany.
Steven Brown
Mr. Brown has over 30 years’ experience in Treasury and Risk Operations in the energy sector. He is currently Vice President of Treasury and Risk Management at Mansfield Energy Corp. in Gainesville, GA. Prior to his employment at Mansfield, Mr. Brown held various positions in risk management at GenOn Energy, Inc. (formerly Mirant Energy Corporation), including Director of Counterparty Risk and Director of Trading Control. Mr. Brown holds a bachelor’s degree in Economics from the Wharton School, University of Pennsylvania and a master’s degree in Accounting and Finance from the London School of Economics.
102
Table of Contents
Kristen Clark
Ms. Clark has over 20 years’ experience in accounting and reporting in the investment management space. She is currently a Senior Controller of Silver Point Capital, having joined the firm in 2013. Prior to Silver Point, she was a Senior Vice President and Controller with Magnitude Capital and a Vice President and Assistant Controller with Tudor Investment Corporation where she worked for 12 years. Before Tudor, Ms. Clark was an auditor at Arthur Andersen and accountant with Robinson, Silverman, Pearce, Aronsohn, and Berman. She received a B.B.A. in Accounting from Siena College.
Edward Mulé
Mr. Mulé is the CEO of Silver Point Capital and Portfolio Manager of Silver Point’s funds, having built and run the Firm since inception in 2002. Prior to founding Silver Point, Mr. Mulé worked for more than 16 years at Goldman Sachs. Mr. Mulé co-led Goldman’s special situations businesses, including establishing a proprietary middle market direct lending business for the firm. He headed or co-headed Goldman’s Special Situations Investing Business from 1999 to 2001, and co-founded and headed or co-headed the Asian Special Situations Investing Business (“ASSG”) and associated funds, including the Goldman Sachs Special Opportunities (Asia) Fund, from 1998 to 2001. In 1996, Mr. Mulé established a proprietary middle market lending business for Goldman. Mr. Mulé was elected general partner in 1994. Before joining Goldman’s special situations efforts in 1995, Mr. Mulé worked for Jon Corzine and Henry Paulson in 1994 and Robert E. Rubin and Stephen Friedman from 1991 to 1994 in the Office of the Chairman. In this role, he assisted the chairmen on strategy and its implementation, as well as reengineering, setting up control and compliance infrastructure and cost cutting. Prior to that, Mr. Mulé was an investment banker in the Mergers and Acquisitions Department from 1984 to 1991, specializing in a number of areas, including telecommunications, consumer products and forest products. He was a member of Goldman’s Senior Traders Committee. Mr. Mulé graduated magna cum laude from the University of Pennsylvania’s Wharton School, contemporaneously receiving both his M.B.A. and B.S. degrees at the age of 21.
Paul Shang
Mr. Shang is the Vice Chairman of Corporate and Investment Banking at Standard Bank, where he also currently serves as the Chief Executive of Standard New York and was the Global Head of Investment Banking from 2010 to 2015. Mr. Shang worked for more than 22 years at Lehman Brothers from 1983 to 2005, holding senior positions in Lehman’s investment banking department across its New York, London, Tokyo and Hong Kong offices. He ran a variety of businesses including Asian investment banking, European Media, Communications and Technology investment banking, and European Real Estate. From 2005 to 2010, Mr. Shang was the Founding Partner of PRC Venture Partners, a private equity firm investing in growth companies in China. Mr. Shang received his B.A. from Cornell University and his M.B.A. from Columbia University, Graduate School of Business.
Executive Officers Who Are Not Also Trustees
Information regarding our executive officers who are not also Trustees is as follows:
| Name | Year of Birth | Position | ||||
Anthony DiNello | 1981 | President and Managing Director | ||||
Jesse Dorigo | 1983 | Chief Financial Officer | ||||
James Kasmarcik | 1976 | Chief Compliance Officer | ||||
The address for each executive officer is c/o Silver Point Specialty Lending Fund, Two Greenwich Plaza, First Floor, Greenwich, Connecticut 06830.
103
Table of Contents
Anthony DiNello
Mr. DiNello joined Silver Point Capital in January 2006 and is currently the Head of Lending and President of the Fund. Mr. DiNello joined Silver Point Capital as an Investment Analyst having spent time on both the private lending and restructuring teams. In 2015, when Silver Point raised Silver Point Specialty Credit Fund, L.P., Mr. DiNello began focusing full time on private lending as a Senior Analyst, before assuming his current role of overseeing the Firm’s Specialty Credit team on a day to day basis. Before joining Silver Point, Mr. DiNello worked in the Global Industrials & Services Group of Credit Suisse First Boston. Mr. DiNello graduated with highest honors from the University of Michigan Business School with a Bachelor’s degree in Business Administration, with an emphasis in finance and accounting.
Jesse Dorigo
Mr. Dorigo joined Silver Point Capital in June 2005. He is the Chief Financial Officer, overseeing all operations, accounting, financing, analysis and reporting related to the Silver Point Funds. Mr. Dorigo initially joined Silver Point in 2005 on the Accounting and Valuation teams, ultimately leading and developing the Valuation team, Reporting team, and the Financing team. He was named Deputy CFO in 2017 and CFO of the Funds in January 2020. Mr. Dorigo graduated from New York University’s College of Arts and Science with a B.A. in Economics.
James Kasmarcik
Mr. Kasmarcik joined Silver Point Capital in April 2008. He is the Chief Compliance Officer. Prior to joining Silver Point, James worked for the Enforcement Division of the United States Securities and Exchange Commission from July 1999 to April 2008. Mr. Kasmarcik earned a JD from Pace Law School and a BS in Business Administration – Finance from Binghamton University.
Independent Trustee Securities Ownership in Investment Advisers or Principal Underwriters of the Trust and their Affiliates
The table below sets forth information about securities owned by our Independent Trustees and their respective immediate family members, as of December 31, 2022, in the Adviser, principal underwriters of the Fund and entities directly or indirectly controlling, controlled by, or under common control with, the Adviser or principal underwriters of the Fund.
| Trustee | Name of Owners and Relationships to Trustee | Company/Partnership | Title of Class | Value of Securities ($ millions) | Percent of Class | |||||||||
Laurence M. Austin | Laurence M. Austin Family LLC, affiliate Endeavor Capital Advisors, affiliate | Silver Point Capital Fund, L.P.(1) | Partnership interests | $ | 5.2 | 0.2 | % | |||||||
Steven E. Brown | None | N/A | N/A | N/A | N/A | |||||||||
Paul Shang | None | N/A | N/A | N/A | N/A | |||||||||
| (1) | Silver Point Capital Fund, L.P. is under common control with the Adviser. |
Other Trustee Interests in Investment Advisers or Principal Underwriters of the Trust and Their Affiliates
Mr. Mulé and members of his immediate family beneficially own interests in Endeavour Capital Private Investments I LP, an affiliate of Mr. Austin. As of December 31, 2022, these beneficial ownership interests had an approximate aggregate value of $9.7 million.
104
Table of Contents
Leadership Structure and Oversight Responsibilities
Overall responsibility for our oversight rests with our Board of Trustees. We have engaged our Adviser to manage us on a day-to-day basis. Our Board of Trustees is responsible for overseeing our Adviser and other service providers in our operations in accordance with the provisions of the Investment Company Act, applicable provisions of state and other laws and our charter. Our Board of Trustees is currently composed of 5 members, 3 of whom are Trustees who are not “interested persons” of our Fund or our Adviser as defined in the Investment Company Act. Our Board of Trustees meets in-person at regularly scheduled quarterly meetings each year. In addition, our Board of Trustees may hold special in-person or telephonic meetings or informal conference calls to discuss specific matters that may arise or require action between regular meetings. As described below, our Board of Trustees has established an Audit Committee and a Governance, Nominating and Compensation Committee, and may establish ad hoc committees or working groups from time to time, to assist our Board of Trustees in fulfilling its oversight responsibilities.
Our Board of Trustees has appointed Edward Mulé to serve in the role of Chair of our Board of Trustees. The Chair’s role is to preside at all meetings of our Board of Trustees and to act as a liaison with our Adviser, counsel and other Trustees generally between meetings. The Chair serves as a key point person for dealings between management and the Trustees. The Chair also may perform such other functions as may be delegated by our Board of Trustees from time to time. Our Board of Trustees reviews matters related to its leadership structure annually. Our Board of Trustees has determined that our Board of Trustees’ leadership structure is appropriate because it allows our Board of Trustees to exercise informed and independent judgment over the matters under its purview and it allocates areas of responsibility among committees of Trustees and the full Board in a manner that enhances effective oversight. The Board has not appointed a Lead Independent Trustee.
We are subject to a number of risks, including investment, compliance, operational and valuation risks, among others. Risk oversight forms part of our Board of Trustees’ general oversight of us and is addressed as part of various Board and committee activities. Day-to-day risk management functions are subsumed within the responsibilities of our Adviser and other service providers (depending on the nature of the risk), which carry out our investment management and business affairs. Our Adviser and other service providers employ a variety of processes, procedures and controls to identify various events or circumstances that give rise to risks, to lessen the probability of their occurrence and/or to mitigate the effects of such events or circumstances if they do occur. Each of our Adviser and other service providers has their own independent interest in risk management, and their policies and methods of risk management will depend on their functions and business models. Our Board of Trustees recognizes that it is not possible to identify all of the risks that may affect us or to develop processes and controls to eliminate or mitigate their occurrence or effects. As part of its regular oversight of us, our Board of Trustees interacts with and reviews reports from, among others, our Adviser, our Chief Compliance Officer, our independent registered public accounting firm and counsel, as appropriate, regarding risks faced by us and applicable risk controls. Our Board of Trustees may, at any time and in its discretion, change the manner in which it conducts risk oversight.
Audit Committee
The members of the Audit Committee are Laurence Austin, Paul Shang and Steve Brown, each of whom meets the current independence and experience requirements of Rule 10A-3 of the Exchange Act and none of whom would be an “interested person” of the Fund as defined in Section 2(a)(19) of the Investment Company Act. Steve Brown is expected to serve as Chair of the Audit Committee. The Fund’s Board of Trustees has determined that each member of the Audit Committee is an “audit committee financial expert” as defined under Item 407 of Regulation S-K of the Exchange Act. The Audit Committee is responsible for overseeing matters relating to the appointment and activities of the Fund’s auditors, audit plans and procedures, various accounting and financial reporting issues and changes in accounting policies, and reviewing the results and scope of the audit and other services provided by the Fund’s independent public accountants.
105
Table of Contents
Governance, Nominating and Compensation Committee
The Governance, Nominating and Compensation Committee members are Laurence Austin, Paul Shang and Steve Brown, none of whom would be an “interested person” as defined in Section 2(a)(19) of the Investment Company Act. Laurence Austin is expected to serve as the Chair of the Governance, Nominating and Compensation Committee. The Governance, Nominating and Compensation Committee is responsible for identifying, researching and nominating trustees for election by our Shareholders, selecting nominees to fill vacancies on our Board of Trustees or a committee of the Board of Trustees, developing and recommending to the Board of Trustees a set of corporate governance principles and overseeing the evaluation of the Board of Trustees and our management. The Governance, Nominating and Compensation Committee considers nominees properly recommended by our Shareholders. Our bylaws provide that for any nomination to be properly brought by a Shareholder for a meeting, such request me be (i) pursuant to the Trust’s notice of meeting, (ii) by or at the direction of the Board of Trustees or (iii) by any Shareholder of the Trust who was a Shareholder of record both at the time of giving of notice by the Shareholder as provided for in this Section 9(a) and at the time of the annual meeting (and any postponement or adjournment thereof), who is entitled to vote on the applicable matter at the meeting and who has complied with this Section 9(a). Also, for any nomination or other business to be properly brought before an annual meeting by a Shareholder pursuant to clause (iii) of paragraph (a)(1) of this Section 9, the Shareholder must have given timely notice thereof in writing to the Secretary and, in the case of any such other business, such other business must otherwise be a proper matter for action by the Shareholders. Our bylaws further provide that, nominations of persons for election to the Board of Trustees at a special meeting may be made only by or at the direction of the Board of Trustees, and provided that the Board of Trustees has determined that trustees will be elected at the meeting, by a Shareholder who is entitled to vote at the meeting and who has complied with the advance notice provisions of the bylaws.
Co-Investment Committee
The Co-Investment Committee’s members are Laurence Austin, Paul Shang and Steve Brown. The Co-Investment Committee is responsible for reviewing and approving certain co-investment transactions pursuant to the co-investment exemptive order we and the Adviser obtained from the Securities and Exchange Commission.
Our Adviser
Silver Point Specialty Credit Fund Management, LLC, a limited liability company organized under the laws of the State of Delaware, serves as our Adviser. Our Adviser is a wholly owned subsidiary of Silver Point Capital, L.P., a limited partnership organized under the laws of the State of Delaware.
Subject to the supervision of our Board of Trustees, our Adviser provides day-to-day advice regarding our portfolio transactions and is responsible for our business affairs and other administrative matters.
Founding Principals
Edward A. Mulé is our portfolio manager and leads our Adviser’s investment committee. The investment committee is responsible for approving all of our investments. The investment committee also monitors investments in our portfolio and approves all asset dispositions. We expect to benefit from the extensive and varied expertise of the investment professionals serving on the investment committee, including experience in primary and secondary leveraged credit, distressed investing, special situations, mergers and acquisitions, and private equity.
Biographical information for Silver Point’s Founding Principals is set forth below.
Edward A. Mulé — Founding Partner, CEO & Portfolio Manager
Mr. Mulé is the CEO of Silver Point Capital and Portfolio Manager of Silver Point’s funds, having built and run the firm since inception in 2002. Prior to founding Silver Point, Mr. Mulé worked for more than 16 years at
106
Table of Contents
Goldman Sachs. Mr. Mulé, together with Mr. O’Shea, led Goldman’s special situations businesses, including establishing a proprietary middle market direct lending business for the firm. He headed or co-headed Goldman’s Special Situations Investing Business from 1999 to 2001, and co-founded and headed or co-headed the Asian Special Situations Investing Business (“ASSG”) and associated funds, including the Goldman Sachs Special Opportunities (Asia) Fund, from 1998 to 2001. In 1996. Mr. Mulé and Mr. O’Shea established a proprietary middle market lending business for Goldman. Mr. Mulé was elected general partner in 1994. Before joining Goldman’s special situations efforts in 1995, Mr. Mulé worked for Jon Corzine and Henry Paulson in 1994 and Robert E. Rubin and Stephen Friedman from 1991 to 1994 in the Office of the Chairman. In this role, he assisted the chairmen on strategy and its implementation, as well as reengineering, setting up control and compliance infrastructure and cost cutting. Prior to that, Mr. Mulé was an investment banker in the Mergers and Acquisitions Department from 1984 to 1991, specializing in a number of areas, including telecommunications, consumer products and forest products. He was a member of Goldman’s Senior Traders Committee. Mr. Mulé graduated magna cum laude from the University of Pennsylvania’s Wharton School, contemporaneously receiving both his M.B.A. and B.S. degrees at the age of 21.
Robert J. O’Shea — Founding Partner & Chairman
Mr. O’Shea is the Chairman of Silver Point Capital, having built and run the firm since inception in 2002. Prior to founding Silver Point, Mr. O’Shea worked for almost 10 years at Goldman Sachs. Mr. O’Shea joined Goldman Sachs in 1990 to found and build the firm’s global bank loan business. Mr. O’Shea, together with Mr. Mulé, led Goldman Sachs’ special situations businesses, including establishing a proprietary middle market direct lending business. When he retired from Goldman Sachs’ Mr. O’Shea was the Global Head of the High Yield Business Unit leading all of the firm’s high yield bond and bank loan underwriting, trading, sales, capital markets and research and the collateralized debt obligation (“CDO”) business. Mr. O’Shea was a member of Goldman’s Risk Committee, which was comprised of approximately 15 partners, including the CEO, who were responsible for managing the firm’s global risk exposure. He was also on the Board of Goldman Sachs International Bank and Senior Traders Committee. He was elected general partner in 1994. Prior to working at Goldman Sachs’ he worked at Bear Stearns in the High Yield and Bankruptcy Department and Security Pacific Bank in the Merchant Banking Group. Mr. O’Shea graduated from Fordham University with a B.S. in Finance.
Portfolio Management
Edward A. Mulé is our portfolio manager and leads our Adviser’s investment committee. As of December 31, 2022, our portfolio manager, who is primarily responsible for our day-to-day management, manages 23 pooled investment vehicles or other accounts with a total amount of approximately $17.9 billion in assets under management. Biographical information for Mr. Mulé is set forth under “Management – Founding Principals”. The table below shows the dollar range of common shares to be beneficially owned by our portfolio manager.
Name | Aggregate Dollar Range of Equity Securities (1) | |
Edward A. Mulé | Over $1,000,000 |
| (1) | Dollar ranges are as follows: none, $1-$10,000, $10,001-$50,000, $50,001-$100,000, $100,001-$500,000, $500,001-$1,000,000 or over $1,000,000. |
107
Table of Contents
Other Accounts Managed. The information below lists the number of other accounts for which Edward A. Mulé, the Fund’s portfolio manager was primarily responsible for the day-to-day management as of December 31, 2022:
Type of Accounts | Total Number of Accounts Managed | Total Assets (in millions) | Number of Accounts Managed for which Advisory Fee is Based on Performance | Total Assets for which Advisory Fee is based on Performance (in millions) | ||||||||||||
Pooled Investments | 21 | $ | 17,370 | 21 | $ | 17,370 | ||||||||||
Other | 2 | $ | 557 | 2 | $ | 557 | ||||||||||
Total Assets includes the net asset value of funds managed by Silver Point, as well as (i) for drawdown funds that are in their investment period, unfunded capital commitments; (ii) for drawdown funds outside their investment period, the lesser of unfunded capital commitments and amounts available to make follow-on investments; and (iii) capital activity as of January 1, 2023. Total unfunded capital commitments included in Total Assets is $2.53 billion.
Item 6. Executive Compensation.
Compensation of Executive Officers
None of our executive officers is currently compensated by us. We do not currently have any employees. Our day-to-day operations are managed by our Adviser.
Compensation of Trustees
Each Independent Trustee is compensated with an annual fee of $110,000 for his or her services as one of the Trustees. In addition, the Chair of the Audit Committee receives an annual fee of $15,000 and the Chair of the Governance, Nominating and Compensation Committee receives an annual fee of $5,000 for their additional services in these capacities. The Fund may also pay the incidental costs of a Trustee to attend training or other types of conferences relating to the business development company industry. No compensation is paid to Trustees who are “interested persons,” as such term is defined in Section 2(a)(19) of the Investment Company Act. In addition, the Fund has purchased Trustees’ and officers’ liability insurance on behalf of its Trustees and officers.
108
Table of Contents
Item 7. Certain Relationships and Related Transactions, and Trustee Independence.
Co-Investment Opportunities and Exemptive Order
Our Adviser and the Fund believe that, in certain circumstances, it may be in the Fund’s best interests to be able to co-invest with registered funds, unregistered funds and business development companies managed now or in the future by our Adviser and its affiliates in order to be able to participate in a wider range of transactions. Currently, SEC regulations and interpretations would permit the Fund to co-invest with registered and unregistered funds that are affiliated with our Adviser in publicly traded securities and also in private placements where (i) our Adviser negotiates only the price, interest rate and similar price-related terms (as a percentage of offering price) of the securities and not matters such as covenants, collateral or management rights and (ii) each relevant account acquires and sells the securities at the same time in pro rata amounts (subject to exceptions approved by compliance personnel after considering the reasons for the requested exception). Such regulations and interpretations also permit the Fund to co-invest in other private placements with registered investment funds affiliated with our Adviser in certain circumstances, some of which would require certain findings by the Fund’s Trustees who are not “interested persons” of our Adviser, Silver Point or their respective affiliates as defined in Section 2(a)(19) of the Investment Company Act (“Independent Trustees”) and the independent trustees of each other eligible registered fund. However, current SEC regulations and interpretations would not permit co-investment by the Fund with unregistered funds affiliated with our Adviser in private placements where our Adviser negotiates non-pricing terms such as covenants, collateral and management rights. Accordingly, under current SEC regulations, in the absence of an exemption the Fund would be prohibited from co-investing in certain private placements with any unregistered fund or account managed now or in the future by our Adviser or its affiliates.
The Fund, our Adviser and various funds managed by our Adviser have applied for, and received, an exemption from such regulations. Under the SEC order granting such exemption, each time our Adviser proposes that an unregistered fund, business development company or registered fund acquire private placement securities that are suitable for the Fund, our Adviser will prepare a recommendation as to the proportion to be allocated to the Fund taking into account a variety of factors such as the investment objectives, size of transaction, investable assets, alternative investments potentially available, prior allocations, liquidity, maturity, expected holding period, diversification, lender covenants and other limitations. The Fund’s Independent Trustees will review the proposed transaction and may authorize co-investment by the Fund of up to its pro rata amount of such securities based on its total available capital if a majority of them conclude that: (i) the transaction is consistent with the Fund’s investment objective and policies; (ii) the terms of co-investment are fair to the Fund and Shareholders and do not involve overreaching; and (iii) participation by the Fund would not disadvantage the Fund or be on a basis different from or less advantageous than that of the participating unregistered accounts and other registered funds. If our Adviser determines that the Fund should not participate in the co-investment opportunity that would otherwise be suitable in light of the Fund’s investment objective, this determination must also be submitted to the Independent Trustees for their approval. The Trustees may also approve a lower amount or determine that the Fund should not invest. The Trustees may also approve a higher amount to the extent that other accounts managed by our Adviser decline to participate. In addition, private placement follow-on investments and disposition opportunities must be made available in the same manner on a pro rata basis and no co-investment (other than permitted follow-on investments) is permitted where the Fund, on the one hand, or any other account advised by our Adviser or an affiliate, on the other hand, already hold securities of the issuer.
The Adviser seeks to allocate purchases and sales of securities among the Fund and other Silver Point accounts in a manner that complies with regulatory requirements. It is expected that investment opportunities that are consistent with the investment strategies of the Fund and other Silver Point accounts will be allocated in such manner as the Adviser and its affiliates deem to be fair and equitable over time. Among other considerations in keeping with principles of fiduciary responsibility, the Adviser and its affiliates may consider the following factors when allocating an investment among the Fund and other Silver Point accounts: (i) an account’s investment objectives and limitations; (ii) the relative amounts of capital available for new investments in the relevant strategy, asset class or other investment characteristics; (iii) the amount of assets targeted to be invested
109
Table of Contents
in a vehicle, inclusive of anticipated leverage (“Target Assets”); (iv) the terms, structure and availability of financing in respect of an investment; (v) the diversification of a fund’s overall holdings; (vi) the size, liquidity and anticipated duration of the proposed investment; (vii) tax or legal issues; and (viii) any requirements under the Investment Company Act applicable to business development companies or registered investment companies, including the requirements of any exemptive order obtained from the Securities and Exchange Commission with respect to the Fund and any other Silver Point account. Such considerations, among others, may result in allocations among the Fund and one or more other Silver Point accounts on a basis other than available capital or Target Assets. The Fund may also, among other things, be allocated an investment based on Target Assets or available capital, subject to an available capital floor (calculated as a percentage of the net asset value or commitments of a Silver Point account participating in the investment).
The foregoing restrictions and limitations may affect the manner in which investment opportunities (including follow-on investments) are allocated among the Fund and other Silver Point accounts. For example, a full investment opportunity could be allocated to the Fund or to one or more other Silver Point accounts, as applicable, where otherwise such opportunity would have been allocated in a pro rata or other manner in accordance with the allocation policies of our Adviser and its affiliates. As a general matter, therefore, these restrictions may prohibit the Fund from effecting transactions (including restructurings) or participating in negotiations that might otherwise benefit the Fund if it involves simultaneous or related investments in, or in different parts of the capital structure of, the same issuer as that held by another Silver Point account. Similarly, for defensive or other reasons, the Fund may seek to gain exposure to, or otherwise participate in, transactions (including restructurings) by acquiring or disposing of financial instruments in which it might not otherwise desire to transact.
The Fund and other Silver Point accounts will make investments in the same issuers and conflicts of interest (or perceived conflicts of interest) may arise in connection with such investments or the sale of such investments, including as a result of the Fund and such other Silver Point accounts investing or having invested in different levels of an issuer’s capital structure or otherwise in different classes of an issuer’s financial instruments. For example, if the Fund is investing in debt instruments, it may have an interest in negotiating financial or other terms (including repayment terms, covenants or events of default) that are more restrictive than another Silver Point account, as an equity owner or a holder of a debt instrument with a different level of seniority, may desire. In addition, other Silver Point accounts may make follow-on or other investments (including with respect to issuers in which the Fund has an investment, subject to the restrictions and limitations in the Investment Company Act and summarized herein) in which the Fund will not participate. Furthermore, our Adviser’s ability to implement the Fund’s strategies effectively may be limited to the extent that the restrictions and limitations of the Investment Company Act impose restrictions on the Fund engaging in transactions that our Adviser may be interested in otherwise pursuing. The Fund and the other Silver Point accounts may also have different risk-return profiles associated with their investments in an issuer and our Adviser may be incentivized to enter or exit investments in a manner that is more beneficial to the Fund or other Silver Point accounts as a result.
While these conflicts cannot be eliminated, our Adviser and its affiliates endeavor to address, and have policies and procedures in place to review, manage and resolve potential conflicts in a manner that is fair and equitable to the Fund and the other Silver Point accounts over time. For example, in addressing certain of the potential conflicts of interest described herein, to avoid a potential conflict of interest, or to address the changing nature or character of an investment in an issuer, our Adviser or its affiliates may, but shall not be obligated to, cause the Fund or another Silver Point account to divest itself of (or not purchase) a security or financial instrument in a particular class, series or tranche of an issuer’s capital structure it might otherwise have, in some circumstances, held (or purchased). The application by our Adviser and its affiliates of its policies and procedures is expected to vary based on the particular facts and circumstances surrounding each investment. Our Adviser and its affiliates’ policies and procedures for addressing the conflicts between the Fund and the other Silver Point accounts in these situations are intended to resolve the conflicts in a fair and equitable manner over time. Conflict resolution may result in the Fund receiving less consideration than it may have otherwise received in the absence of such a conflict of interest.
110
Table of Contents
Our Adviser and its affiliates may spend substantial time on other business activities, including investment management and advisory activities for entities with the same or overlapping investment objectives, investing for their own account with the Fund, financial advisory services (including services for entities in which the Fund invests), and acting as trustees, officers, creditor committee members or in similar capacities. Subject to the requirements of the Investment Company Act, our Adviser and its affiliates and associates intend to engage in such activities and may receive compensation from third parties for their services. Subject to the same requirements, such compensation may be payable by entities in which the Fund invests in connection with actual or contemplated investments, and our Adviser may receive fees and other compensation in connection with structuring investments which they will share.
Our Adviser and its partners, officers, trustees, shareholders, members, managers, employees, affiliates and agents may be subject to certain potential or actual conflicts of interest in connection with the activities of, and investments by, the Fund.
Trustee Independence
Please see “Item 5. Trustees and Executive Officers” for disclosure regarding Trustee independence.
Material Non-Public Information
Our senior management and other investment professionals from our Adviser may serve as trustees of, or in a similar capacity with, companies in which we invest or in which we are considering making an investment. Through these and other relationships with a company and by reason of their responsibilities in connection with the other activities undertaken for us, our Adviser and certain of its affiliates and certain funds managed and controlled by our Adviser, these individuals may obtain material, non-public information that might restrict our ability to buy or sell securities of such company under our policies or applicable law.
Investment Management Agreement
The Fund is party to an Advisory Agreement, pursuant to which the Fund pays its Adviser a fee for investment management services consisting of a management fee and an incentive fee, which costs are ultimately borne by our Shareholders. Our fee structure may create an incentive for our Adviser to invest in certain types of securities. The Adviser relies on third-party valuation services to assist with the valuation of the Fund’s portfolio investments and may call on investment professionals from Silver Point for support. Because the management fee and incentive fee paid to our Adviser are based on the value of its investments, and there may be a conflict of interest when personnel of our Adviser are involved in the valuation process for its portfolio investments. See “Item 1. Business—Investment Management Agreement.”
From time to time, in the normal course of business, we and our Adviser are party to certain lawsuits. Furthermore, third parties may try to seek to impose liability on us in connection with the activities of our portfolio companies. While the outcome of any such open legal proceedings cannot at this time be predicted with certainty, we do not expect these matters will have a material adverse impact on our financial condition or results of operations or those of our Adviser.
Item 9. Market Price of, and Dividends on, the Registrant’s Common Equity and Related Shareholder Matters.
Market Information
Common shares were offered and sold in transactions exempt from registration under the Securities Act under Section 4(a)(2) and Regulation D. There is no public market for the common shares.
111
Table of Contents
Because common shares were acquired by investors in one or more transactions “not involving a public offering,” they are “restricted securities” and may be required to be held indefinitely. Shareholders may not sell, assign, transfer or otherwise dispose of any common shares unless (i) the Company gives consent, and (ii) the transfer is made in accordance with applicable securities laws and the Governing Documents. The Company will not unreasonably withhold its consent to the transfer of all or a portion of a Shareholder’s common shares to an affiliate of such Shareholder on at least 30 days’ prior written notice; provided that the conditions in the Governing Documents are otherwise satisfied.
Distributions
Please see “Item 2. Financial Information—Critical Accounting Policies—Distributions” for disclosure regarding our intended distributions on common shares.
Holders
As of March 31, 2023, there were approximately 75 holders of our common shares. Please see “Item 4. Security Ownership of Certain Beneficial Owners and Management” for disclosure regarding the holders of common shares.
Item 10. Recent Sales of Unregistered Securities.
Upon the Fund’s Trust Conversion, the limited partners prior to the Trust Conversion received common shares with an aggregate net asset value equal to the aggregate net asset value of the limited partner interests owned by them on the Trust Conversion date. Based on our aggregate net asset value at November 15, 2021 of approximately $553.6 million, the Fund issued 36,907,451.43 common shares. Silver Point Specialty Credit Fund GP, LLC, our general partner prior to the Trust Conversion, received its pro rata share of the Fund, equaling 3,366.47 of our common shares, which represented 0.01% of our common shares outstanding immediately after the Trust Conversion. Our limited partners prior to the Trust Conversion received 36,904,084.96 common shares, which represented 99.99% of our common shares outstanding immediately after the Trust Conversion. Each of our outstanding partner interests was converted into common shares having a net asset value of $15 per share, which represented 100% of the dollar amount of our aggregate net asset value with respect to the limited partner interests and 100% of the dollar amount of our aggregate net asset value with respect to the general partner interests. The shares received by the partners and any other affiliates do not provide any registration rights. The Trust Conversion was primarily a change in legal form and there were no material changes to fees, underlying portfolio or accounting policies as a result of the Trust Conversion.
Item 11. Description of Registrant’s Securities to be Registered.
The following description is based on relevant portions of Maryland Law, the Company’s Governing Documents and the Investment Company Act. This summary is not complete, and the Company refers you to Title 12 of the Corporations and Associations Article of the Maryland Code (the “Maryland Statutory Trust Act”), the Governing Documents and the Investment Company Act for a more detailed description of the provisions summarized below.
General
Our authorized stock consists of an unlimited number of common shares of beneficial interest, par value $0.001 per share. There are no outstanding options or warrants to purchase our stock. Under Maryland law and our Declaration of Trust, our Shareholders will generally not be personally liable for our debts or obligations. Unless our Board of Trustees determines otherwise, we will issue all shares of our capital stock in uncertificated form.
112
Table of Contents
Common Shares
All common shares of beneficial interest have equal rights as to earnings, assets, dividends and other distributions and voting and, when they are issued, will be duly authorized, validly issued, fully paid and nonassessable. Distributions may be made or paid to the holders of our common shares if, as and when declared by our Board of Trustees out of funds legally available therefor, subject to the rights of holders of our preferred shares of any series then outstanding. Our common shares have no exchange, conversion or redemption rights. In the event of our liquidation, dissolution or winding up, each common shares would be entitled to share ratably in all of our assets that are legally available for distribution after we pay all debts and other liabilities and subject to any preferential rights of holders of preferred shares of any series then outstanding. Each holder of common shares is entitled to one vote for each common shares held on all matters submitted to a vote of Shareholders generally, including the election of Trustees elected by a vote of Shareholders generally. Except as provided with respect to any other class or series of shares, including our preferred shares, as more fully described below, the holders of our common shares possess exclusive voting power. There is no cumulative voting in the election of our Board of Trustees, which means that holders of a majority of the common shares entitled to vote in the election of such Trustees and present at a meeting at which a quorum of Shareholders is present are entitled to elect that number of nominees equal to the number of Trustees to be elected by such holders, and holders of less than such a majority will be unable to elect one or more specific Trustees for any available Trusteeship. A majority of the shares entitled to vote on a matter at a meeting and present in person or by proxy constitutes a quorum for the meeting.
Transfers of Shares
Our common shares are “restricted securities” under the meaning of Rule 144 promulgated under the Securities Act and may not be sold in the absence of registration under the Securities Act unless an exemption from registration is available, including exemptions contained in Rule 144.
Sales under Rule 144 by our efforts also are subject to certain manners of sale provisions, notice requirements, volume limitations and the availability of current public information about us. No assurance can be given as to (a) the likelihood that an active market for our common shares will develop, (b) the liquidity of any such market, (c) the ability of our Shareholders to sell our securities or (d) the prices that Shareholders may obtain for any of our securities. No prediction can be made as to the effect, if any, that future sales of securities, or the availability of securities for future sales, will have on the market price prevailing from time to time.
In addition to the foregoing restrictions, Shareholders may not transfer any common shares of the Company unless (i) the Company gives consent, and (ii) the transfer is made in accordance with applicable securities laws and the Governing Documents. The Company will not unreasonably withhold its consent to the transfer of all or a portion of a Shareholder’s common shares to an affiliate of such Shareholder on at least 30 days’ prior written notice; provided that the conditions in the Governing Documents of the Company are otherwise satisfied; provided, further, that with respect to any requirement of the Shareholder to deliver an opinion of counsel, in-house counsel of the Shareholder or outside legal counsel selected by the Shareholder if admitted to practice under the laws of the relevant jurisdiction covered by the opinion (or otherwise qualified to provide the opinion) and having sufficient experience with the relevant subject matter will be acceptable.
Preferred Shares
Our Declaration of Trust authorizes, unless otherwise provided in our bylaws, our Board of Trustees to create and issue one or more series of preferred shares to the extent permitted by the Investment Company Act. The Board of Trustees may authorize and cause the Trust to issue such other securities of the Trust as they determine to be necessary, desirable or appropriate, having such terms, preferences, conversion or other rights, voting powers, restrictions, limitations as to dividends or other distributions, qualifications and terms and conditions of redemption for each series or class as the Board of Trustees see fit, including preferred interests,
113
Table of Contents
debt securities or other senior securities. The Board of Trustees may classify and reclassify any unissued Shares of any series or class from time to time, in one or more series or classes of Shares. To the extent that the Board of Trustees authorizes and causes the Trust to issue preferred shares of any class or series, they are hereby authorized and empowered to amend or supplement the Declaration of Trust as they deem necessary or appropriate, all without the approval of Shareholders. Any such supplement or amendment shall be filed as is necessary. The Board of Trustees are also authorized to take such actions and retain such persons as they see fit to offer and sell such securities.
Provisions of Maryland law, Our Declaration of Trust and Bylaws
Limitation on Liability of Trustees; Indemnification and Advancement of Expenses
The indemnification of the Fund’s officers and Trustees is governed by Section 12-403 of the Maryland Statutory Trust Act and the Declaration of Trust. Section 12-403(a)(1) of the Maryland Statutory Trust Act empowers the Fund to “[i]ndemnify and hold harmless, and to obligate itself to indemnify and hold harmless, any trustee, officer, employee, or agent from and against any and all claims and demands whatsoever.” Section 12-403(b) of the Maryland Statutory Trust Act provides that “[e]xcept as provided in the governing instrument of a statutory trust, a trustee shall be indemnified to the same extent as a trustee of a corporation under [Section 2-418 of the Maryland General Corporation Law].”
The Declaration of Trust requires the Fund to indemnify each person who at any time serves or has served as a Trustee or officer of the Trust against any liabilities and expenses, including amounts paid in satisfaction of judgments, in compromise or as fines and penalties, and reasonable counsel fees reasonably incurred in connection with the defense or disposition of any action, suit or other proceeding, whether civil or criminal, before any court or administrative or investigative body in which such indemnitee may be or may have been involved as a party or otherwise or with which he or she may be or may have been threatened by reason of such indemnitee having acted in any such capacity. Notwithstanding the foregoing, no person may be indemnified by the Fund against any liability to any person or any expense of such indemnitee arising by reason of (i) intentional acts of willful misfeasance, (ii) bad faith, (iii) gross negligence, or (iv) reckless disregard of the duties of involved in the conduct of his position.
Further, with respect to any action, suit or other proceeding voluntarily prosecuted by any indemnitee as plaintiff, indemnification shall be mandatory only if the prosecution of such action, suit or other proceeding by such indemnitee (1) was authorized by a majority of the Trustees or (2) was instituted by the indemnitee to enforce his or her rights to indemnification and the indemnitee is found to be entitled to such indemnification. No indemnification may be made by the Fund unless there has been a determination (i) by a final decision on the merits by a court or other body of competent jurisdiction before whom the issue of entitlement to indemnification hereunder was brought that such indemnitee is entitled to indemnification hereunder or, (ii) in the absence of such a decision, by (1) a majority vote of a quorum of those Trustees who are neither ‘‘interested persons’’ of the Trust (as defined in Section 2(a)(19) of the Investment Company Act) nor parties to the proceeding, or (2) if such quorum is not obtainable or even if obtainable, independent legal counsel in a written opinion concludes that the indemnitee should be entitled to indemnification hereunder.
As permitted by the Maryland Statutory Trust Act, the Declaration of Trust provides that the Fund shall make advance payments in connection with the expenses of defending any action with respect to which indemnification might be sought if the Fund receives a written affirmation by the indemnitee of the indemnitee’s good faith belief that the standards of conduct necessary for indemnification have been met and a written undertaking to reimburse the Fund unless it is subsequently determined that the indemnitee is entitled to such indemnification and if a majority of the Trustees determine that the applicable standards of conduct necessary for indemnification appear to have been met. In addition, at least one of the following conditions must be met: (i) the indemnitee shall provide adequate security for his undertaking, (ii) the Trust shall be insured against losses arising by reason of any lawful advances, or (iii) a majority of a quorum of the disinterested, non-party Trustees or independent legal counsel in a written opinion, shall conclude, based on a review of readily available facts (as
114
Table of Contents
opposed to a full trial-type inquiry), that there is substantial reason to believe that the indemnitee ultimately will be found entitled to indemnification.
Any indemnification or payment or reimbursement of expenses made pursuant to such provisions of the Declaration of Trust will be subject to the applicable requirements of the Investment Company Act.
Election of Trustees
Our Declaration of Trust provides that, unless otherwise provided in our bylaws (including with respect to the special rights of holders of one or more series of our preferred shares to elect Trustees), our Trustees will be elected by the affirmative vote of the holders of a majority of the votes cast by Shareholders entitled to vote thereon present in person or by proxy at a meeting of Shareholders called for the purpose of electing Trustees.
Classified Board of Trustees
Under our Declaration of Trust, unless otherwise provided in our bylaws, subject to the special right of the holders of one or more series of preferred shares to elect additional preferred Trustees, our Trustees will be divided into three classes of Trustees, with the classes to be as nearly equal in number as possible, serving staggered three-year terms, with the term of office of Trustees in only one of the three classes expiring each year. As a result, approximately one-third of such Trustees will then be elected each year. A classified board may render a change in control of us or removal of our incumbent management more difficult. We believe, however, that, the longer time required to elect a majority of a classified Board of Trustees will help to ensure the continuity and stability of our management and policies.
Number of Trustees; Removal; Vacancies
Our Declaration of Trust provides that, unless otherwise provided in our bylaws, the total number of Trustees will initially be set to five, which number may be increased or decreased only by the Board of Trustees. Our Declaration of Trust also provides that, unless otherwise provided in our bylaws, our Trustees may be removed for cause (i) by action taken by a majority of the Trustees or (ii) by the holders of at least seventy-five percent (75%) of the Shares then entitled to vote in an election of such Trustee. Our Declaration of Trust provides that, unless otherwise provided in our bylaws, any and all vacancies on the Board of Trustees, including any vacancy resulting from an increase in the number of Trustees, may be filled only by the affirmative vote of a majority of the remaining Trustees in office, even if the remaining Trustees do not constitute a quorum, and any Trustee elected to fill a vacancy will serve for the remainder of the full term of the Trusteeship in which the vacancy occurred and until a successor is elected and qualifies, subject to any applicable requirements of the Investment Company Act. Any such limitations on the ability of our Shareholders to remove Trustees and fill vacancies could make it more difficult for a third party to acquire, or discourage a third party from seeking to acquire, control of us.
Action by Shareholders
Our Declaration of Trust provides that, unless otherwise provided in the bylaws, any action required or permitted to be taken at any annual or special meeting of Shareholders may be taken without a meeting by consent in any manner and by any vote permitted by the bylaws.
Advance Notice Provisions for Shareholder Nominations and Shareholder Proposals
Our bylaws provide that, unless otherwise provided in Declaration of Trust, with respect to an annual meeting of Shareholders, nominations of persons for election to the Board of Trustees and the proposal of other business to be considered by Shareholders may be made only (1) by or at the direction of the Board of Trustees (or a duly authorized committee thereof), (2) pursuant to our notice of meeting or (3) by a Shareholder who is
115
Table of Contents
entitled to vote at the meeting and who has complied with the advance notice procedures of the bylaws. For any nomination or business proposal to be properly brought by a Shareholder for a meeting, such Shareholder will have to comply with advance notice requirements and provide us with certain information. Generally, to be timely, a Shareholder’s notice must be received at our principal executive offices not less than 120 days nor more than 150 days prior to the first anniversary date of the immediately preceding annual meeting of Shareholders. Our bylaws specify requirements as to the form and content of any such Shareholder’s notice. Our bylaws also allow the presiding officer at a meeting of the Shareholders to adopt rules and regulations for the conduct of meetings which may have the effect of precluding the conduct of certain business at a meeting if the rules and regulations are not followed. Our bylaws further provide that nominations of persons for election to the Board of Trustees at a special meeting may be made only by or at the direction of the Board of Trustees, and provided that the Board of Trustees has determined that Trustees will be elected at the meeting, by a Shareholder who is entitled to vote at the meeting and who has complied with the advance notice provisions of the bylaws.
The purpose of requiring Shareholders to give us advance notice of nominations and other business is to afford our Board of Trustees a meaningful opportunity to consider the qualifications of the proposed nominees and the advisability of any other proposed business and, to the extent deemed necessary or desirable by our Board of Trustees, to inform Shareholders and make recommendations about such qualifications or business, as well as to provide a more orderly procedure for conducting meetings of Shareholders. Although our bylaws do not give our Board of Trustees any power to disapprove Shareholder nominations for the election of Trustees or proposals recommending certain action that are made in compliance with applicable advance notice procedures, they may have the effect of precluding a contest for the election of Trustees or the consideration of Shareholder proposals if proper procedures are not followed and of discouraging or deterring a third party from conducting a solicitation of proxies to elect its own slate of Trustees or to approve its own proposal without regard to whether consideration of such nominees or proposals might be harmful or beneficial to us and our Shareholders.
Shareholder Meetings
Our bylaws provide that, unless otherwise provided in Declaration of Trust, any action required or permitted to be taken by Shareholders at an annual meeting or special meeting of Shareholders may only be taken if it is properly brought before such meeting. Shareholders at an annual meeting may only consider proposals or nominations specified in the notice of meeting or brought before the meeting by or at the direction of the Board of Trustees, or by a Shareholder of record on the record date for the meeting who is entitled to vote at the meeting and who has delivered timely written notice in proper form to the secretary of the Shareholder’s intention to bring such business before the meeting. These provisions could have the effect of delaying until the next Shareholder meeting Shareholder actions that are favored by the holders of a majority of our outstanding voting securities.
Calling of Special Meetings of Shareholders
Our bylaws, unless otherwise provided in Declaration of Trust, provide that special meetings of Shareholders may be called by our Board of Trustees, the chair of the Board of Trustees, our president and our chief executive officer, and not by any other person.
Amendments to the Governing Documents and Certain Voting Requirements
Except specifically set forth in the Declaration of Trust or in the terms of any series or class of Shares, the Trustees, by a vote of at least eighty percent (80%) of the Trustees and by a vote of at least 80% of the Continuing Trustees may amend, amend and restate, or supplement, the Declaration of Trust in any respect from time to time, without any action by the Shareholders. The Board of Trustees also may amend the Declaration of Trust without any vote of Shareholders of any class or series to divide the Shares of the Trust into one or more classes or additional classes, or one or more series or additional series, to determine the rights, powers, preferences, limitations and restrictions of any class or series of Shares, to change the name of the Trust or any
116
Table of Contents
class or series of Shares, to make any change that does not adversely affect the relative rights or preferences of any Shareholder, as they may deem necessary.
Shareholders are entitled to vote on amendments to the Declaration of Trust only to the extent:
| • | submitted to them for their consideration by the Board of Trustees; |
| • | to the extent that the amendment would change any rights with respect to any shares of the Fund by reducing the amount payable thereon upon liquidation of the Fund or by diminishing or eliminating any voting rights pertaining thereto; or |
| • | the following extraordinary actions and amendments to the Declaration of Trust generally require the approval of 80% of outstanding shares entitled to vote on the matter: |
| (1) | any amendment to the Declaration of Trust to make the Fund’s common shares “redeemable securities” and any other proposal to convert the Trust from a “closed-end company” to an “open-end company” (as defined in the Investment Company Act); |
| (2) | the liquidation or dissolution of the Fund and any amendment to the Declaration of Trust to effect such liquidation or dissolution; |
| (3) | any amendment to, or any amendment inconsistent with the provisions of the following articles or sections of the Declaration of Trust: |
| • | Article II—which relate to the powers and rights of the trustees; |
| • | Section 3.9—which grants the Board of Trustees the exclusive right to amend or repeal the Trust’s bylaws; |
| • | Section 4.1—which limits the personal liability of Shareholders of the Fund; |
| • | Section 4.2—which requires the indemnification of certain persons; or |
| • | Section 9.1—which sets forth these super-voting requirements; and |
| (4) | any merger, consolidation, conversion, share exchange or sale or exchange of all or substantially all of the assets of the Fund. |
Notwithstanding the foregoing, if the Board of Trustees and at least 80% of the Continuing Trustees approve any such proposal, transaction or amendment, then the approval of only a “majority of the outstanding voting securities” (as defined in the Investment Company Act) entitled to vote on such proposal, transaction or amendment is required. However, with respect to any transaction referred to in (2) above, if such transaction is approved by at least majority of the Continuing Trustees, no Shareholder approval of the transaction is required. In addition, with respect to any merger referred to in (4) above (x) that is with an affiliated investment company and that does not require a Shareholder vote under the Investment Company Act or (y) in which the Fund is the surviving entity and no Shareholder approval is required by any exchange or market on which the Fund’s common shares are listed for trading, no Shareholder approval of such merger is required.
Our Governing Documents provide that the Board of Trustees will have the exclusive power to adopt, alter, amend or repeal any provision of our Bylaws without Shareholder approval.
Conflict with Investment Company Act
Our Declaration of Trust provides that if any provision is in conflict with the Investment Company Act or with other applicable laws and regulations, the conflicting provision shall be deemed never to have constituted a part of the Governing Documents; provided, however, that such determination shall not affect any of the remaining provisions of this Declaration or render invalid or improper any action taken or omitted prior to such determination.
117
Table of Contents
Item 12. Indemnification of Trustees and Officers.
Insofar as indemnification for liability arising under the Securities Act may be permitted to trustees, officers and controlling persons of the registrant pursuant to the foregoing provisions, or otherwise, the registrant has been advised that in the opinion of the SEC such indemnification is against public policy as expressed in the Act and is, therefore, unenforceable. In the event that a claim for indemnification against such liabilities (other than the payment by the registrant of expenses incurred or paid by a trustee, officer or controlling person of the registrant in the successful defense of any action, suit or proceeding) is asserted by such trustee, officer or controlling person in connection with the securities being registered, the registrant will, unless in the opinion of its counsel the matter has been settled by controlling precedent, submit to a court of appropriate jurisdiction the question whether such indemnification by it is against public policy as expressed in the Securities Act and will be governed by the final adjudication of such issue.
Item 13. Financial Statements and Supplementary Data.
Set forth below is a list of our audited financial statements included in this Registration Statement.
| Consolidated Financial Statements for the Years Ended December 31, 2021 and December 31, 2020 | Page | |||
| F-1 | ||||
| F-2 | ||||
Consolidated Statements of Assets and Liabilities as of December 31, 2021 and 2020 | F-3 | |||
Consolidated Statements of Operations for the years ended December 31, 2021 and 2020 | F-4 | |||
Consolidated Statements of Changes in Net Assets for the years ended December 31, 2021 and 2020 | F-5 | |||
Consolidated Statements of Cash Flows for the years ended December 31, 2021 and 2020 | F-6 | |||
Consolidated Schedules of Investments as of December 31, 2021 and 2020 | F-8 | |||
| F-29 | ||||
| Consolidated Financial Statements for the Years Ended December 31, 2022 and December 31, 2021 | Page | |||
| F-60 | ||||
| F-61 | ||||
Consolidated Statements of Assets and Liabilities as of December 31, 2022 and 2021 | F-62 | |||
Consolidated Statements of Operations for the years ended December 31, 2022 and 2021 | F-63 | |||
Consolidated Statements of Changes in Net Assets for the years ended December 31, 2022 and 2021 | F-64 | |||
Consolidated Statements of Cash Flows for the years ended December 31, 2022 and 2021 | F-65 | |||
Consolidated Schedules of Investments as of December 31, 2022 and 2021 | F-67 | |||
| F-88 | ||||
Item 14. Changes in and Disagreements with Accountants on Accounting and Financial Disclosure.
Not applicable.
Item 15. Financial Statements and Exhibits.
| (a) | Financial Statements |
The financial statements included in this Registration Statement are listed in Item 13 and commence on page F-1.
118
Table of Contents
| (b) | Exhibits |
The following documents are filed as exhibits hereto:
| * | Filed herewith. |
119
Table of Contents
SIGNATURES
Pursuant to the requirements of Section 12 of the Securities Exchange Act of 1934, the registrant has duly caused this registration statement to be signed on its behalf by the undersigned, thereunto duly authorized.
| Silver Point Specialty Lending Fund | ||
| By: | /s/ Jesse Dorigo | |
| Name: Jesse Dorigo | ||
| Title: Chief Financial Officer | ||
Date: April 3, 2023
120
Table of Contents
Silver Point Specialty Lending Fund
Years ended December 31, 2021 and December 31, 2020
F-1
Table of Contents
Report of Independent Registered Public Accounting Firm
To the Board of Trustees and Shareholders of Silver Point Specialty Lending Fund
Opinion on the Financial Statements
We have audited the accompanying consolidated statements of assets and liabilities, including the consolidated schedules of investments, of Silver Point Specialty Lending Fund and its subsidiaries (the “Fund”) as of December 31, 2021 and 2020, and the related consolidated statements of operations, changes in net assets and cash flows for each of the two years in the period ended December 31, 2021, including the related notes (collectively referred to as the “consolidated financial statements”). In our opinion, the consolidated financial statements present fairly, in all material respects, the financial position of the Fund as of December 31, 2021 and 2020, and the results of its operations, changes in its net assets and its cash flows for each of the two years in the period ended December 31, 2021 in conformity with accounting principles generally accepted in the United States of America.
Basis for Opinion
These consolidated financial statements are the responsibility of the Fund’s management. Our responsibility is to express an opinion on the Fund’s consolidated financial statements based on our audits. We are a public accounting firm registered with the Public Company Accounting Oversight Board (United States) (PCAOB) and are required to be independent with respect to the Fund in accordance with the U.S. federal securities laws and the applicable rules and regulations of the Securities and Exchange
Commission and the PCAOB.
We conducted our audits of these consolidated financial statements in accordance with the standards of the PCAOB and in accordance with auditing standards generally accepted in the United States of America. Those standards require that we plan and perform the audit to obtain reasonable assurance about whether the consolidated financial statements are free of material misstatement, whether due to error or fraud.
Our audits included performing procedures to assess the risks of material misstatement of the consolidated financial statements, whether due to error or fraud, and performing procedures that respond to those risks. Such procedures included examining, on a test basis, evidence regarding the amounts and disclosures in the consolidated financial statements. Our audits also included evaluating the accounting principles used and significant estimates made by management, as well as evaluating the overall presentation of the consolidated financial statements. Our procedures included confirmation of securities owned as of December 31, 2021 and 2020 by correspondence with the custodians, brokers and portfolio companies; when replies were not received from brokers, we performed other auditing procedures. We believe that our audits provide a reasonable basis for our opinion.
/s/ PricewaterhouseCoopers LLP
New York, New York
March 16, 2022
We have served as the Fund’s auditor since 2015.
F-2
Table of Contents
Silver Point Specialty Lending Fund
Consolidated Statements of Assets and Liabilities
(in U.S. Dollars)
| December 31, 2021 | December 31, 2020 | |||||||
Assets | ||||||||
Investments owned, at fair value: | ||||||||
Non-controlled, non-affiliated investments (amortized cost of $877,365,765 and $745,847,113, respectively), (pledged collateral of $632,167,439 and $557,963,226, respectively) | $ | 900,939,824 | $ | 752,890,207 | ||||
Controlled investments (amortized cost of $50,879,305 and $3,433,474, respectively) | 50,209,406 | 2,898,644 | ||||||
Total return swaps and interest rate cap, at fair value (cost $0 and $90,000, respectively) | — | 428,081 | ||||||
Foreign currency forward contracts, at fair value | 10,606 | — | ||||||
Cash held at banks | 29,586,805 | 2,667,961 | ||||||
Foreign cash held at banks (cost $8,013,153 and $1,842,228, respectively) | 7,996,689 | 1,739,364 | ||||||
Restricted cash (Note 2) | 90,359,610 | 28,039,084 | ||||||
Due from broker | — | 1,769,418 | ||||||
Receivable for unsettled transactions | 24,464,754 | 3,289,470 | ||||||
Interest receivable | 5,916,223 | 7,735,133 | ||||||
Deferred financing costs (net of accumulated amortization of $10,755,843 and $8,507,298, respectively) | 849,549 | 864,164 | ||||||
Deferred offering costs | 612,542 | 381,843 | ||||||
Other assets | 804,023 | 1,058,918 | ||||||
|
|
|
| |||||
Total assets | $ | 1,111,750,031 | $ | 803,762,287 | ||||
|
|
|
| |||||
Liabilities | ||||||||
Debt (Note 7) (net of unamortized debt issuance costs of $4,982,608 and $0, respectively) | $ | 525,192,330 | $ | 296,416,690 | ||||
Foreign currency forward contracts, at fair value | 1,000,310 | 34,504 | ||||||
Reverse repurchase agreements | — | 7,569,334 | ||||||
Due to broker | 480,000 | — | ||||||
Payable for unsettled transactions | 10,922,414 | 28,234,480 | ||||||
Interest payable | 2,692,458 | 391,613 | ||||||
Management fees payable to an affiliate (Note 9) | 526,221 | 682,768 | ||||||
Income incentive compensation payable to an affiliate (Note 9) | 4,556,926 | 1,926,404 | ||||||
Capital gains incentive compensation payable to an affiliate (Note 9) | 1,411,001 | — | ||||||
Payable to Trustees | 34,453 | — | ||||||
Accrued expenses and other liabilities | 1,248,942 | 1,008,410 | ||||||
|
|
|
| |||||
Total liabilities | $ | 548,065,055 | $ | 336,264,203 | ||||
|
|
|
| |||||
Commitments and contingencies (Note 11) | ||||||||
Net assets and partners’ capital | ||||||||
Partners’ capital | $ | — | $ | 455,999,954 | ||||
Common shares $0.001 par value, unlimited shares authorized; 36,907,451 and 0 shares issued and outstanding as of December 31, 2021 and December 31, 2020, respectively* | 36,907 | — | ||||||
Paid-in-capital in excess of par | 553,574,864 | — | ||||||
Distributable earnings | 10,073,205 | 11,498,130 | ||||||
|
|
|
| |||||
Total net assets | $ | 563,684,976 | $ | 467,498,084 | ||||
|
|
|
| |||||
Total liabilities and net assets | $ | 1,111,750,031 | $ | 803,762,287 | ||||
|
|
|
| |||||
Net asset value per share* | $ | 15.27 | ||||||
|
| |||||||
| * | The Fund converted to a unitized trust effective November 15, 2021. Prior to November 15, 2021, the Fund was a non-unitized partnership (See Note 1). |
The accompanying notes are an integral part of these consolidated financial statements.
F-3
Table of Contents
Silver Point Specialty Lending Fund
Consolidated Statements of Operations
(in U.S. Dollars)
| For the Year Ended December 31, 2021 | For the Year Ended December 31, 2020 | |||||||
Investment income: | ||||||||
Non-controlled/non-affiliated investments: | ||||||||
Interest income | $ | 73,250,199 | $ | 69,387,867 | ||||
Interest income payment-in-kind | 5,687,630 | 11,471,657 | ||||||
Other income | 53,227 | — | ||||||
Dividend income | — | 61,666 | ||||||
Controlled investments: | ||||||||
Interest income | 796,355 | — | ||||||
Interest income payment-in-kind | 73,871 | — | ||||||
Dividend income | 72,373 | 578,424 | ||||||
|
|
|
| |||||
Total investment income | $ | 79,933,655 | $ | 81,499,614 | ||||
|
|
|
| |||||
Expenses: | ||||||||
Interest and financing expenses | 14,797,393 | 15,864,597 | ||||||
Management fee (Note 9) | 3,310,511 | 2,986,468 | ||||||
Income incentive compensation (Note 9) | 7,219,959 | 7,422,634 | ||||||
Capital gains incentive compensation (Note 9) | 1,429,874 | — | ||||||
Professional fees | 4,170,966 | 1,921,044 | ||||||
Administration expenses | 388,551 | 373,844 | ||||||
Trustee fees | 90,000 | — | ||||||
Other | 926,550 | 631,122 | ||||||
|
|
|
| |||||
Expenses before management fee offset | 32,333,804 | 29,199,709 | ||||||
Management fee offset (Note 9) | (630,007 | ) | (111,795 | ) | ||||
|
|
|
| |||||
Total expenses, net of management fee offset | 31,703,797 | 29,087,914 | ||||||
|
|
|
| |||||
Net investment income (loss) | $ | 48,229,858 | $ | 52,411,700 | ||||
|
|
|
| |||||
Net gain (loss): | ||||||||
Net realized gain (loss): | ||||||||
Non-controlled/non-affiliated investments | 2,486,181 | (6,266,417 | ) | |||||
Controlled investments | — | (1,085,865 | ) | |||||
Foreign currency transactions | 1,302,450 | (42,091 | ) | |||||
Foreign currency forward contracts | 4,378,260 | (552,935 | ) | |||||
Interest rate cap | (90,000 | ) | — | |||||
Total return swaps | 826,438 | 3,226,523 | ||||||
|
|
|
| |||||
Total net realized gain (loss) | 8,903,329 | (4,720,785 | ) | |||||
|
|
|
| |||||
Net change in unrealized appreciation (depreciation): | ||||||||
Non-controlled/non-affiliated investments | 16,530,965 | 4,727,950 | ||||||
Controlled investments | (135,069 | ) | (3,148 | ) | ||||
Translation of assets and liabilities in foreign currencies | 466,879 | (449,918 | ) | |||||
Foreign currency forward contracts | (955,200 | ) | (34,504 | ) | ||||
Interest rate cap | 90,000 | — | ||||||
Total return swaps | (428,081 | ) | 856,235 | |||||
|
|
|
| |||||
Total net change in unrealized appreciation (depreciation) | 15,569,494 | 5,096,615 | ||||||
|
|
|
| |||||
Net gain (loss) | 24,472,823 | 375,830 | ||||||
|
|
|
| |||||
Net increase (decrease) in net assets and partners’ capital resulting from operations | $ | 72,702,681 | $ | 52,787,530 | ||||
|
|
|
| |||||
Net increase (decrease) in net assets from operations for the period November 15, 2021 through December 31, 2021* | $ | 10,073,205 | ||||||
|
| |||||||
Net investment income per share (Basic and Dilutive)* | $ | 0.20 | ||||||
|
| |||||||
Earnings per share (Basic and Dilutive)* | $ | 0.27 | ||||||
|
| |||||||
Weighted average shares outstanding* | 36,907,451 | |||||||
|
| |||||||
| * | The Fund converted to a unitized trust effective November 15, 2021. Prior to November 15, 2021, the Fund was a non-unitized partnership (See Note 1). |
The accompanying notes are an integral part of these consolidated financial statements.
F-4
Table of Contents
Silver Point Specialty Lending Fund
Consolidated Statements of Changes in Net Assets
(in U.S. Dollars)
| Limited Partners | General Partner | Shareholders | Total | |||||||||||||
Partners’ capital, January 1, 2020 | $ | 462,283,027 | $ | 23,275 | $ | — | $ | 462,306,302 | ||||||||
Allocation of net increase (decrease) in partners’ capital resulting from operations: | ||||||||||||||||
Net investment income (loss) | 52,406,022 | 5,678 | — | 52,411,700 | ||||||||||||
Net realized gain (loss) | (4,720,358 | ) | (427 | ) | — | (4,720,785 | ) | |||||||||
Net change in unrealized appreciation (depreciation) | 5,096,153 | 462 | — | 5,096,615 | ||||||||||||
|
|
|
|
|
|
|
| |||||||||
Net increase (decrease) in partners’ capital resulting from operations | 52,781,817 | 5,713 | — | 52,787,530 | ||||||||||||
Contributions (Note 9) | 67,894,727 | 5,886 | — | 67,900,613 | ||||||||||||
Distributions (Note 9) | (115,485,183 | ) | (11,178 | ) | — | (115,496,361 | ) | |||||||||
|
|
|
|
|
|
|
| |||||||||
Net increase (decrease) in partners’ capital | 5,191,361 | 421 | — | 5,191,782 | ||||||||||||
|
|
|
|
|
|
|
| |||||||||
Partners’ capital, December 31, 2020 | $ | 467,474,388 | $ | 23,696 | $ | — | $ | 467,498,084 | ||||||||
|
|
|
|
|
|
|
| |||||||||
Partners’ capital, January 1, 2021 | $ | 467,474,388 | $ | 23,696 | $ | — | $ | 467,498,084 | ||||||||
Allocation of net increase (decrease) in partners’ capital resulting from operations: | ||||||||||||||||
Net investment income (loss) | 40,974,452 | 4,522 | — | 40,978,974 | ||||||||||||
Net realized gain (loss) | 7,186,886 | 651 | — | 7,187,537 | ||||||||||||
Net change in unrealized appreciation (depreciation) | 14,461,662 | 1,303 | — | 14,462,965 | ||||||||||||
|
|
|
|
|
|
|
| |||||||||
Net increase (decrease) in partners’ capital resulting from operations | 62,623,000 | 6,476 | — | 62,629,476 | ||||||||||||
Contributions (Note 9) | 93,148,816 | 27,118 | — | 93,175,934 | ||||||||||||
Distributions (Note 9) | (69,684,930 | ) | (6,793 | ) | — | (69,691,723 | ) | |||||||||
|
|
|
|
|
|
|
| |||||||||
Net increase (decrease) in partners’ capital | 86,086,886 | 26,801 | — | 86,113,687 | ||||||||||||
Conversion of partnership interests to issuance of common shares | (553,561,274 | ) | (50,497 | ) | 553,611,771 | — | ||||||||||
Net investment income (loss) | — | — | 7,250,884 | 7,250,884 | ||||||||||||
Net realized gain (loss) | — | — | 1,715,792 | 1,715,792 | ||||||||||||
Net change in unrealized appreciation (depreciation) | — | — | 1,106,529 | 1,106,529 | ||||||||||||
|
|
|
|
|
|
|
| |||||||||
Net increase (decrease) in net assets from operations for the period November 15, 2021 through December 31, 2021 | — | — | 10,073,205 | 10,073,205 | ||||||||||||
|
|
|
|
|
|
|
| |||||||||
Net assets, December 31, 2021 | $ | — | $ | — | $ | 563,684,976 | $ | 563,684,976 | ||||||||
|
|
|
|
|
|
|
| |||||||||
| * | The Fund converted to a unitized trust effective November 15, 2021. Prior to November 15, 2021, the Fund was a non-unitized partnership (See Note 1). |
The accompanying notes are an integral part of these consolidated financial statements.
F-5
Table of Contents
Silver Point Specialty Lending Fund
Consolidated Statements of Cash Flows
(in U.S. Dollars)
| For the Year Ended December 31, 2021 | For the Year Ended December 31, 2020 | |||||||
Cash flows from operating activities | ||||||||
Net increase (decrease) in Net Assets resulting from operations | $ | 72,702,681 | $ | 52,787,530 | ||||
Adjustments to reconcile net increase (decrease) in net assets resulting from operations to net cash provided by (used in) operating activities | ||||||||
Accretion of discounts | (12,775,398 | ) | (10,004,002 | ) | ||||
Amortization of deferred financing costs and debt issuance costs | 2,606,768 | 2,150,090 | ||||||
Payments for purchase of investments | (744,805,483 | ) | (350,519,649 | ) | ||||
Proceeds from sales, paydowns and resolutions of investments | 586,915,927 | 398,494,091 | ||||||
Interest paid-in-kind | (5,813,348 | ) | (11,462,518 | ) | ||||
Net realized (gain) loss from investments | (2,486,181 | ) | 7,352,282 | |||||
Net realized (gain) loss from interest rate cap | 90,000 | — | ||||||
Net change in unrealized (appreciation) depreciation from investments | (16,395,896 | ) | (4,724,802 | ) | ||||
Net change in unrealized (appreciation) depreciation from total returns swaps | 428,081 | (856,235 | ) | |||||
Net change in unrealized (appreciation) depreciation from interest rate cap | (90,000 | ) | — | |||||
Net change in unrealized (appreciation) depreciation from foreign currency forward contracts | 955,200 | 34,504 | ||||||
Net (increase) decrease in operating assets and increase (decrease) in operating liabilities | ||||||||
Due from broker | 1,769,418 | 7,582,080 | ||||||
Receivable for unsettled transactions | (21,175,284 | ) | (2,409,024 | ) | ||||
Interest receivable | 1,818,910 | 2,805,672 | ||||||
Deferred offering costs | (230,699 | ) | — | |||||
Other assets | 254,895 | 904,686 | ||||||
Due to broker | 480,000 | — | ||||||
Payable for unsettled transactions | (17,312,066 | ) | 28,234,480 | |||||
Interest payable | 2,300,845 | (344,876 | ) | |||||
Management fees payable to an affiliate | (156,547 | ) | (26,011 | ) | ||||
Income incentive compensation payable to an affiliate | 2,630,522 | (515,891 | ) | |||||
Capital gains incentive compensation payable to an affiliate | 1,411,001 | — | ||||||
Payable to Trustees | 34,453 | — | ||||||
Accrued expenses and other liabilities | 240,532 | (494,938 | ) | |||||
|
|
|
| |||||
Net cash provided by (used in) operating activities | (146,601,669 | ) | 118,987,469 | |||||
|
|
|
| |||||
Cash flows from financing activities | ||||||||
Proceeds from debt borrowings | 847,621,385 | 315,642,694 | ||||||
Principal debt payments | (613,863,137 | ) | (406,600,000 | ) | ||||
Payment of deferred financing costs and debt issuance costs | (7,574,761 | ) | (1,653,141 | ) | ||||
Reverse repurchase agreements, net | (7,569,334 | ) | 7,569,334 | |||||
Capital contributions | 93,175,934 | 67,900,613 | ||||||
Capital distributions | (69,691,723 | ) | (115,496,361 | ) | ||||
|
|
|
| |||||
Net cash provided by (used in) financing activities | 242,098,364 | (132,636,861 | ) | |||||
|
|
|
| |||||
Net increase (decrease) in cash held at banks, foreign cash held at banks and restricted cash | 95,496,695 | (13,649,392 | ) | |||||
|
|
|
| |||||
Cash held at banks, foreign cash held at banks and restricted cash, beginning of year | 32,446,409 | 46,095,801 | ||||||
|
|
|
| |||||
Cash held at banks, foreign cash held at banks and restricted cash, end of year | $ | 127,943,104 | $ | 32,446,409 | ||||
|
|
|
| |||||
Supplemental cash flow information | ||||||||
Cash paid during the year for interest | $ | 9,889,780 | $ | 14,059,383 | ||||
|
|
|
| |||||
Cash paid during the year for income taxes | $ | 48,283 | $ | 23,712 | ||||
|
|
|
| |||||
Supplemental disclosure of non-cash information | ||||||||
Conversion of partnership interests to issuance of common shares | $ | 553,611,771 | $ | — | ||||
F-6
Table of Contents
Silver Point Specialty Lending Fund
Consolidated Statements of Cash Flows
(in U.S. Dollars)
| For the Year Ended December 31, 2021 | For the Year Ended December 31, 2020 | |||||||
Cash held at banks | $ | 29,586,805 | $ | 2,667,961 | ||||
Foreign cash held at banks | 7,996,689 | 1,739,364 | ||||||
Restricted cash | 90,359,610 | 28,039,084 | ||||||
|
|
|
| |||||
Total cash held at banks and restricted cash shown in the consolidated statements of cash flows | $ | 127,943,104 | $ | 32,446,409 | ||||
|
|
|
| |||||
The accompanying notes are an integral part of these consolidated financial statements.
F-7
Table of Contents
Silver Point Specialty Lending Fund
Consolidated Schedule of Investments
December 31, 2021
(in U.S. Dollars)
Portfolio Company(1) | Industry | Rate(2) | Interest Rate | Original Acquisition Date | Maturity Date | Par Amount ($) / Shares or Ownership % / Notional ($)(3) | Cost / Amortized Cost(4) | Fair Value | % of Net Assets(5) | |||||||||||||||||||||||||
Non-Controlled/Non-Affiliated Investments | ||||||||||||||||||||||||||||||||||
Secured Loans | ||||||||||||||||||||||||||||||||||
1st Lien Term Loan | ||||||||||||||||||||||||||||||||||
United States of America | ||||||||||||||||||||||||||||||||||
8800 Austin, LLC and 8900 Austin, LLC(6)(7)(8) | Multi-Family | L+5.50%, 0.50% Floor | 6.00 | % | 6/24/2021 | 12/24/2022 | $ | 15,000,000 | $ | 12,246,536 | $ | 12,230,896 | 2.17 | % | ||||||||||||||||||||
Accurate Background LLC(7)(8)(9) | Business Services | L+6.00%, 1.00% Floor | 7.00 | 10/18/2021 | 3/26/2027 | 16,621,453 | 15,091,880 | 15,291,737 | 2.71 | |||||||||||||||||||||||||
ADS Tactical Inc(7)(9) | Aerospace & Defense | L+5.75%, 1.00% Floor | 6.75 | 3/4/2021 | 3/19/2026 | 7,218,750 | 7,087,178 | 7,142,087 | 1.27 | |||||||||||||||||||||||||
Alpine US Bidco LLC(8)(9) | Food Products | L+5.25%, 0.75% Floor | 6.00 | 4/28/2021 | 5/3/2028 | 8,544,355 | 8,384,570 | 8,480,272 | 1.50 | |||||||||||||||||||||||||
Amerijet Holdings Inc(7)(8)(9) | Airline & Airport Services | L+6.75%, 1.00% Floor | 7.75 | 12/28/2021 | 12/28/2025 | 17,643,981 | 17,115,575 | 17,114,662 | 3.04 | |||||||||||||||||||||||||
Ampler Restaurant Group(7)(9) | Restaurants | L+5.88%, 1.00% Floor | 6.88 | 7/20/2021 | 7/21/2027 | 4,987,500 | 4,892,330 | 4,852,089 | 0.86 | |||||||||||||||||||||||||
Azurity Pharmaceuticals Inc(8)(9) | | Pharmaceuticals & Life Sciences | | L+6.00%, 0.75% Floor | 6.75 | 9/28/2021 | 9/20/2027 | 7,860,000 | 7,630,479 | 7,683,956 | 1.36 | |||||||||||||||||||||||
BayMark Health Services Inc(6)(7) | | Healthcare Providers & Services | | L+5.00%, 1.00% Floor (1.00% on unfunded) | 6.00 | 11/19/2021 | 6/11/2027 | 4,520,000 | 1,199,032 | 1,198,298 | 0.21 | |||||||||||||||||||||||
BayMark Health Services Inc(7)(9) | | Healthcare Providers & Services | | L+5.00%, 1.00% Floor | 6.00 | 6/10/2021 | 6/11/2027 | 4,279,250 | 4,239,349 | 4,236,457 | 0.75 | |||||||||||||||||||||||
BEL USA LLC(7)(9) | E-Commerce | L+8.00%, 1.50% Floor | 9.50 | 2/1/2021 | 11/2/2023 | 224,782 | 221,666 | 172,632 | 0.03 | |||||||||||||||||||||||||
BEL USA LLC(7)(9)(12) | E-Commerce | L+7.00%, 1.50% Floor | 8.50 | 12/13/2018 | 11/2/2023 | 13,657,449 | 13,563,448 | 10,488,920 | 1.86 | |||||||||||||||||||||||||
Buck Global LLC(6)(7)(18)(19) | Professional Services | L+6.75%, 1.00% Floor (1.00% on unfunded) | 1.00 | 9/29/2021 | 9/29/2026 | 3,679,245 | (34,897 | ) | (93,453 | ) | (0.02 | ) | ||||||||||||||||||||||
Buck Global LLC(7)(8)(9) | Professional Services | L+6.75%, 1.00% Floor | 7.75 | 9/29/2021 | 9/29/2026 | 13,579,175 | 13,318,258 | 13,234,263 | 2.35 | |||||||||||||||||||||||||
Circle Graphics Inc(6)(7)(18)(19) | E-Commerce | L+5.75%, 2.25% Floor (1.00% on unfunded) | 1.00 | 7/12/2021 | 9/30/2024 | 1,611,723 | (27,564 | ) | (26,996 | ) | (0.00 | ) | ||||||||||||||||||||||
Circle Graphics Inc(7)(8)(9) | E-Commerce | L+5.75%, 2.25% Floor | 8.00 | 2/17/2021 | 9/30/2024 | 19,486,897 | 19,486,897 | 19,160,492 | 3.40 | |||||||||||||||||||||||||
Circle Graphics Inc(7)(8) | E-Commerce | L+5.75%, 2.25% Floor | 8.00 | 7/12/2021 | 9/30/2024 | 2,952,118 | 2,899,905 | 2,902,670 | 0.51 | |||||||||||||||||||||||||
Columbia Helicopters Inc.(7) | Aerospace & Defense | L+7.50%, 1.50% Floor | 9.00 | 8/20/2019 | 8/20/2024 | 15,935,229 | 15,729,441 | 14,470,781 | 2.57 | |||||||||||||||||||||||||
DexYP(8)(9)(10) | Media: Advertising | L+8.50%, 1.00% Floor | 9.50 | 2/18/2021 | 3/1/2026 | 15,485,714 | 15,078,498 | 15,691,364 | 2.78 | |||||||||||||||||||||||||
DMT Solutions Global Corp (dba Bluecrest)(7)(8)(9) | | Industrial Products & Services | | L+7.00%, 1.00% Floor | 8.00 | 12/15/2020 | 7/2/2024 | 18,993,374 | 18,138,319 | 18,518,539 | 3.29 | |||||||||||||||||||||||
Form Technologies Inc(9) | Automobiles & Components | L+4.75%, 1.00% Floor | 5.75 | 2/19/2021 | 7/22/2025 | 3,546,846 | 3,499,507 | 3,531,347 | 0.63 | |||||||||||||||||||||||||
Form Technologies Inc(9) | Automobiles & Components | L+9.25%, 1.00% Floor | 10.25 | �� | 2/19/2021 | 10/22/2025 | 1,434,812 | 1,416,651 | 1,456,334 | 0.26 | ||||||||||||||||||||||||
Heligear Acquisition Co(7)(8)(9) | Aerospace & Defense | L+7.00%, 1.50% Floor | 8.50 | 9/6/2019 | 7/30/2024 | 28,752,188 | 28,588,549 | 28,654,430 | 5.08 | |||||||||||||||||||||||||
Iconix Brand Group Inc(7)(8)(9) | Consumer Brands | L+7.50%, 1.00% Floor | 8.50 | 8/4/2021 | 8/4/2025 | 22,866,797 | 21,918,276 | 22,304,274 | 3.96 | |||||||||||||||||||||||||
Impala RGIS Holdings LLC(9) | Business Services | L+7.50%, 1.00% Floor | 8.50 | 6/25/2020 | 6/25/2025 | 3,452,305 | 3,452,306 | 3,521,352 | 0.62 | |||||||||||||||||||||||||
The accompanying notes are an integral part of these consolidated financial statements.
F-8
Table of Contents
Silver Point Specialty Lending Fund
Consolidated Schedule of Investments
December 31, 2021
(in U.S. Dollars)
Portfolio Company(1) | Industry | Rate(2) | Interest Rate | Original Acquisition Date | Maturity Date | Par Amount ($) / Shares or Ownership % / Notional ($)(3) | Cost / Amortized Cost(4) | Fair Value | % of Net Assets(5) | |||||||||||||||||||||||
Inotiv Inc(8)(9)(10) | Pharmaceuticals & Life Sciences | L+6.25%, 1.00% Floor | 7.25 | % | 11/3/2021 | 11/5/2026 | $ | 11,348,368 | $ | 11,129,115 | $ | 11,121,401 | 1.97 | % | ||||||||||||||||||
Inotiv Inc(6)(10)(18)(19) | Pharmaceuticals & Life Sciences | L+6.25% (1.00% on unfunded) | 1.00 | 11/3/2021 | 11/5/2026 | 2,407,230 | (46,737 | ) | (48,145 | ) | (0.01 | ) | ||||||||||||||||||||
JUUL Labs Inc(7) | Consumer Products | L+7.00%, 1.50% Floor | 8.50 | 8/2/2019 | 8/2/2023 | 26,102,995 | 25,874,572 | 25,980,311 | 4.61 | |||||||||||||||||||||||
Kaplan Woodland Hills Property Company, LLC(6)(7)(8) | Real Estate Development & Management | L+6.00%, 1.65% Floor | 7.65 | 2/14/2020 | 2/14/2023 | 16,325,000 | 15,697,440 | 15,740,958 | 2.79 | |||||||||||||||||||||||
Kleinfelder Group Inc(7)(8)(9) | Professional Services | L+5.25%, 1.00% Floor | 6.25 | 11/15/2021 | 11/29/2024 | 6,666,667 | 6,602,493 | 6,591,333 | 1.17 | |||||||||||||||||||||||
Kleinfelder Group Inc(7)(9) | Professional Services | L+5.75%, 1.00% Floor | 6.75 | 10/13/2020 | 11/29/2024 | 4,859,742 | 4,819,502 | 4,809,444 | 0.85 | |||||||||||||||||||||||
LAC Acquisition LLC d/b/a Lighthouse Autism Center(6)(7)(18)(19) | Healthcare Providers & Services | L+6.00%, 1.00% Floor (1.00% on unfunded) | 1.00 | 7/23/2021 | 7/23/2026 | 3,500,000 | (31,933 | ) | (75,775 | ) | (0.01 | ) | ||||||||||||||||||||
LAC Acquisition LLC d/b/a Lighthouse Autism Center(7)(8)(9) | Healthcare Providers & Services | L+6.00%, 1.00% Floor | 7.00 | 7/23/2021 | 7/23/2026 | 19,950,000 | 19,575,282 | 19,416,337 | 3.44 | |||||||||||||||||||||||
LMG Holdings(7)(8)(9) | Manufacturing | L+6.50%, 1.00% Floor | 7.50 | 4/30/2021 | 4/30/2026 | 12,301,169 | 12,207,826 | 12,182,463 | 2.16 | |||||||||||||||||||||||
Mad Engine Global, LLC(8)(9) | Consumer Apparel | L+7.00%, 1.00% Floor | 8.00 | 6/30/2021 | 7/15/2027 | 11,925,000 | 11,643,256 | 11,626,875 | 2.06 | |||||||||||||||||||||||
Manchester Acquisition Sub LLC(9) | Specialty Chemicals | S+5.75%, 0.75% Floor | 6.50 | 11/16/2021 | 12/1/2026 | 6,616,493 | 6,257,368 | 6,368,375 | 1.13 | |||||||||||||||||||||||
Masterwork Electronics, Inc.(7)(8)(9) | Technology Hardware & Equipment | L+8.00%, 1.00% Floor | 9.00 | 7/27/2018 | 7/27/2023 | 39,951,685 | 39,612,118 | 39,102,712 | 6.94 | |||||||||||||||||||||||
Mountaineer Merger Corp(7)(9) | Specialty Retail | L+7.00%, 0.75% Floor | 7.75 | 10/22/2021 | 10/26/2028 | 5,000,000 | 4,853,755 | 4,850,000 | 0.86 | |||||||||||||||||||||||
National Dentex Corp(7)(8) | Healthcare Providers & Services | L+7.00%, 1.00% Floor (1.00% on unfunded) | 8.00 | 10/26/2020 | 10/3/2025 | 4,796,171 | 4,717,902 | 4,716,075 | 0.84 | |||||||||||||||||||||||
National Dentex Corp(7)(8)(9) | Healthcare Providers & Services | L+7.00%, 1.00% Floor | 8.00 | 4/1/2021 | 10/3/2025 | 1,475,745 | 1,443,691 | 1,451,100 | 0.26 | |||||||||||||||||||||||
National Dentex Corp(6)(7)(8) | Healthcare Providers & Services | L+7.00%, 1.00% Floor (1.00% on unfunded) | 8.00 | 4/1/2021 | 10/3/2025 | 1,484,759 | 826,463 | 828,033 | 0.15 | |||||||||||||||||||||||
National Dentex Corp(7)(9) | Healthcare Providers & Services | L+7.00%, 1.00% Floor | 8.00 | 10/26/2020 | 10/3/2025 | 9,752,183 | 9,596,295 | 9,589,321 | 1.70 | |||||||||||||||||||||||
Nine West Holdings Inc(8) | Consumer Brands | L+8.00% | 8.22 | 3/19/2019 | 3/20/2024 | 2,362,839 | 2,269,522 | 1,856,802 | 0.33 | |||||||||||||||||||||||
Northstar Group Services Inc(7)(9) | Business Services | L+5.50%, 1.00% Floor | 6.50 | 9/29/2021 | 11/12/2026 | 9,935,483 | 9,887,423 | 9,947,902 | 1.76 | |||||||||||||||||||||||
Odlum Data Lender, LLC(7)(10) | Telecommunications | L+6.10%, 0.15% Floor | 6.25 | 6/23/2021 | 6/23/2022 | 15,000,000 | 15,000,000 | 15,000,000 | 2.66 | |||||||||||||||||||||||
Pacira BioSciences Inc(7)(8)(9)(10) | Pharmaceuticals & Life Sciences | S+7.00%, 0.75% Floor | 7.75 | 12/6/2021 | 12/7/2026 | 31,014,810 | 30,090,546 | 30,549,588 | 5.42 | |||||||||||||||||||||||
The accompanying notes are an integral part of these consolidated financial statements.
F-9
Table of Contents
Silver Point Specialty Lending Fund
Consolidated Schedule of Investments
December 31, 2021
(in U.S. Dollars)
Portfolio Company(1) | Industry | Rate(2) | Interest Rate | Original Acquisition Date | Maturity Date | Par Amount ($) / Shares or Ownership % / Notional ($)(3) | Cost / Amortized Cost(4) | Fair Value | % of Net Assets(5) | |||||||||||||||||||||||||
PaperWorks Industries Holding Corp.(7)(8)(9) | Paper & Packaging | L+8.00%, 1.00% Floor | 9.00 | % | 12/18/2020 | 12/18/2025 | $ | 25,333,333 | $ | 24,709,806 | $ | 24,872,267 | 4.41 | % | ||||||||||||||||||||
Speedstar Holding LLC(7)(8)(9) | | Automobiles & Components | | L+7.00%, 1.00% Floor | 8.00 | 1/22/2021 | 1/22/2027 | 21,762,931 | 21,384,780 | 21,527,891 | 3.82 | |||||||||||||||||||||||
Speedstar Holding LLC(6)(7)(18)(19) | | Automobiles & Components | | L+7.00%, 1.00% Floor (1.00% on unfunded) | 1.00 | 1/22/2021 | 1/22/2027 | 3,017,241 | (51,165 | ) | (32,586 | ) | (0.01 | ) | ||||||||||||||||||||
STV Group, Inc(7)(9) | Professional Services | L+5.25%, | 5.35 | 8/3/2020 | 12/11/2026 | 9,982,030 | 9,759,384 | 9,932,120 | 1.76 | |||||||||||||||||||||||||
Sutherland Global Services Inc(7)(8)(9) | Business Services | L+7.25%, 1.00% Floor | 8.25 | 10/23/2020 | 10/23/2025 | 18,851,629 | 18,522,368 | 18,881,791 | 3.35 | |||||||||||||||||||||||||
Thunder Grandparent Inc. (dba Telestream, Inc)(7)(8)(9) | Software & Services | L+8.75%, 1.00% Floor | 9.75 | 10/15/2020 | 10/15/2025 | 13,569,828 | 13,352,047 | 13,435,486 | 2.38 | |||||||||||||||||||||||||
Tops MBO Corp(7) | Staples Retail | L+8.00%, 1.25% Floor | 9.25 | 11/8/2021 | 5/8/2026 | 10,792,453 | 10,501,952 | 10,501,057 | 1.86 | |||||||||||||||||||||||||
Touchstone Acquisition Inc (aka Team Technologies)(7)(9) | | Healthcare Equipment & Supplies | | L+6.00%, 0.75% Floor | 6.75 | 12/23/2021 | 12/31/2028 | 6,615,698 | 6,483,384 | 6,483,384 | 1.15 | |||||||||||||||||||||||
UC Tower Hillside Crossing(6)(7)(8) | Multi-Family | L+7.25%, 0.50% Floor | 7.75 | 9/21/2017 | 8/31/2022 | 17,732,050 | 17,106,373 | 17,127,988 | 3.04 | |||||||||||||||||||||||||
Welldyne Inc(9) | | Healthcare Providers & Services | | L+5.50%, 1.00% Floor | 6.50 | 2/22/2017 | 8/16/2022 | 18,015,176 | 17,598,392 | 17,474,721 | 3.10 | |||||||||||||||||||||||
WIS Holdings Inc(8)(9) | Business Services | L+7.75%, 1.00% Floor | 8.75 | 5/20/2021 | 5/20/2025 | 21,267,853 | 20,801,081 | 20,842,496 | 3.70 | |||||||||||||||||||||||||
WPG Holdings LLC(9) | | Real Estate Development & Management | | L+5.00%, 0.75% Floor | 5.75 | 10/21/2021 | 10/20/2025 | 9,867,959 | 9,982,910 | 9,949,370 | 1.77 | |||||||||||||||||||||||
|
|
|
|
|
| |||||||||||||||||||||||||||||
Total United States of America 1st Lien Term Loan | 637,313,400 | 634,818,498 | 112.60 | |||||||||||||||||||||||||||||||
|
|
|
|
|
| |||||||||||||||||||||||||||||
Canada | ||||||||||||||||||||||||||||||||||
Dye & Durham Corp(7)(8)(10) | Software & Services | C+5.75%, 0.75% Floor | 6.50 | 12/3/2021 | 12/3/2027 | C$ | 8,404,236 | 6,465,940 | 6,666,071 | 1.18 | ||||||||||||||||||||||||
Dye & Durham Corp(6)(7)(10)(19) | Software & Services | C+5.75%, (1.00% on unfunded) | 1.00 | 12/3/2021 | 12/3/2027 | C$ | 1,105,821 | (6,382 | ) | 5,512 | 0.00 | |||||||||||||||||||||||
Gateway Casinos & Entertainment Ltd(10) | Gaming & Leisure | C+8.00%, 0.75% Floor | 8.75 | 10/21/2021 | 10/22/2027 | C$ | 3,524,625 | 2,804,436 | 2,778,818 | 0.49 | ||||||||||||||||||||||||
Gateway Casinos & Entertainment Ltd(10) | Gaming & Leisure | S+8.00%, 0.75% Floor | 8.75 | 10/21/2021 | 10/22/2027 | 12,005,971 | 11,774,217 | 11,963,470 | 2.12 | |||||||||||||||||||||||||
|
|
|
|
|
| |||||||||||||||||||||||||||||
Total Canada 1st Lien Term Loan | 21,038,211 | 21,413,871 | 3.79 | |||||||||||||||||||||||||||||||
|
|
|
|
|
| |||||||||||||||||||||||||||||
The accompanying notes are an integral part of these consolidated financial statements.
F-10
Table of Contents
Silver Point Specialty Lending Fund
Consolidated Schedule of Investments
December 31, 2021
(in U.S. Dollars)
Portfolio Company(1) | Industry | Rate(2) | Interest Rate | Original Acquisition Date | Maturity Date | Par Amount ($) / Shares or Ownership % / Notional ($)(3) | Cost / Amortized Cost(4) | Fair Value | % of Net Assets(5) | |||||||||||||||||||||||
Cayman Islands | ||||||||||||||||||||||||||||||||
JO ET Holdings Limited (Grindr HoldCo)(7)(9)(10)(11) | Technology | S+13.00%, 1.00% Floor | 14.00 | % | 12/15/2021 | 12/15/2026 | $ | 5,954,844 | $ | 5,836,919 | $ | 5,835,747 | 1.04 | % | ||||||||||||||||||
|
|
|
|
|
| |||||||||||||||||||||||||||
Total Cayman Islands 1st Lien Term Loan | 5,836,919 | 5,835,747 | 1.04 | |||||||||||||||||||||||||||||
|
|
|
|
|
| |||||||||||||||||||||||||||
Luxembourg | ||||||||||||||||||||||||||||||||
Mallinckrodt PLC(8) | Pharmaceuticals & Life Sciences | L+5.25%, 0.75% Floor | 6.00 | 10/13/2020 | 9/24/2024 | 15,098,491 | 14,139,329 | 14,110,220 | 2.50 | |||||||||||||||||||||||
Steenbok Lux Finco 2 SARL(10)(13) | Staples Retail | 7.88% | 7.88 | 10/16/2020 | 12/31/2022 | € | 4,721,975 | 5,588,209 | 5,366,980 | 0.95 | ||||||||||||||||||||||
Steenbok Lux Finco 2 SARL(10)(13) | Staples Retail | 7.88% | 7.88 | 1/28/2021 | 12/31/2022 | € | 1,525,883 | 1,846,789 | 1,731,138 | 0.31 | ||||||||||||||||||||||
Steenbok Lux Finco 1 SARL(10)(14) | Staples Retail | 10.00% | 10.00 | 6/21/2021 | 12/31/2022 | € | 13,128,503 | 12,982,300 | 13,381,555 | 2.37 | ||||||||||||||||||||||
|
|
|
|
|
| |||||||||||||||||||||||||||
Total Luxembourg 1st Lien Term Loan | 34,556,627 | 34,589,893 | 6.13 | |||||||||||||||||||||||||||||
|
|
|
|
|
| |||||||||||||||||||||||||||
Netherlands | ||||||||||||||||||||||||||||||||
OLA Netherlands BV (aka Olacabs / ANI Tech)(8)(10) | Technology | S+6.25%, 0.75% Floor | 7.00 | 12/3/2021 | 12/15/2026 | 7,100,550 | 6,959,573 | 7,136,053 | 1.27 | |||||||||||||||||||||||
|
|
|
|
|
| |||||||||||||||||||||||||||
Total Netherlands 1st Lien Term Loan | 6,959,573 | 7,136,053 | 1.27 | |||||||||||||||||||||||||||||
|
|
|
|
|
| |||||||||||||||||||||||||||
Singapore | ||||||||||||||||||||||||||||||||
Oravel Stays Singapore Pte Ltd(8)(10) | Technology | L+8.25%, 0.75% Floor | 9.00 | 6/9/2021 | 6/23/2026 | 4,975,000 | 4,826,414 | 5,155,344 | 0.91 | |||||||||||||||||||||||
|
|
|
|
|
| |||||||||||||||||||||||||||
Total Singapore 1st Lien Term Loan | 4,826,414 | 5,155,344 | 0.91 | |||||||||||||||||||||||||||||
|
|
|
|
|
| |||||||||||||||||||||||||||
Total 1st Lien Term Loan | 710,531,144 | 708,949,406 | 125.74 | |||||||||||||||||||||||||||||
|
|
|
|
|
| |||||||||||||||||||||||||||
1st Lien Revolver | ||||||||||||||||||||||||||||||||
United States of America | ||||||||||||||||||||||||||||||||
Amerijet Holdings Inc(6)(7) | Airline & Airport Services | L+6.75%, 1.00% Floor (0.50% on unfunded) | 7.75 | 12/28/2021 | 12/28/2025 | 2,756,872 | 1,020,269 | 1,020,043 | 0.18 | |||||||||||||||||||||||
Buck Global LLC(6)(7) | Professional Services | L+6.75%, 1.00% Floor (0.50% on unfunded) | 7.75 | 9/29/2021 | 9/29/2026 | 2,207,547 | 399,633 | 385,217 | 0.07 | |||||||||||||||||||||||
The accompanying notes are an integral part of these consolidated financial statements.
F-11
Table of Contents
Silver Point Specialty Lending Fund
Consolidated Schedule of Investments
December 31, 2021
(in U.S. Dollars)
Portfolio Company(1) | Industry | Rate(2) | Interest Rate | Original Acquisition Date | Maturity Date | Par Amount ($) / Shares or Ownership % / Notional ($)(3) | Cost / Amortized Cost(4) | Fair Value | % of Net Assets(5) | |||||||||||||||||||||||
Inotiv Inc(6)(10)(18)(19) | Pharmaceuticals & Life Sciences | L+6.25% (0.50% on unfunded) | 0.50 | % | 11/3/2021 | 11/5/2026 | $ | 1,244,402 | $ | (24,160 | ) | $ | (29,990 | ) | (0.01 | ) % | ||||||||||||||||
LAC Acquisition LLC d/b/a Lighthouse Autism Center(6)(7)(18)(19) | Healthcare Providers & Services | L+6.00%, 1.00% Floor (0.50% on unfunded) | 0.50 | 7/23/2021 | 7/23/2026 | 1,500,000 | (27,338 | ) | (40,350 | ) | (0.01 | ) | ||||||||||||||||||||
LMG Holdings(6)(7)(18)(19) | Manufacturing | L+6.50%, 1.00% Floor (0.50% on unfunded) | 0.50 | 4/30/2021 | 4/30/2026 | 690,670 | (4,866 | ) | (6,596 | ) | (0.00 | ) | ||||||||||||||||||||
Masterwork Electronics, Inc.(6)(7) | Technology Hardware & Equipment | L+8.00%, 1.00% Floor (0.50% on unfunded) | 9.00 | 7/27/2018 | 7/27/2023 | 3,688,500 | 1,816,035 | 1,746,505 | 0.31 | |||||||||||||||||||||||
National Dentex Corp(6)(7) | Healthcare Providers & Services | L+7.00%, 1.00% Floor (0.50% on unfunded) | 8.00 | 10/26/2020 | 10/3/2025 | 1,486,897 | 460,629 | 458,559 | 0.08 | |||||||||||||||||||||||
STV Group, Inc(6)(7)(18)(19) | Professional Services | L+4.50%, (0.50% on unfunded) | 0.50 | 9/30/2021 | 12/13/2024 | 1,300,000 | (130,000 | ) | (78,000 | ) | (0.01 | ) | ||||||||||||||||||||
Sutherland Global Services Inc(6)(7)(17)(18) | Business Services | L+7.25%, 1.00% Floor (0.75% on unfunded) | 0.75 | 10/23/2020 | 10/23/2025 | 1,332,943 | (22,641 | ) | (9,597 | ) | (0.00 | ) | ||||||||||||||||||||
Talen Energy Supply LLC | Power Generation | L+8.00%, 1.00% Floor | 9.00 | 12/14/2021 | 9/30/2024 | 25,767,422 | 25,134,593 | 26,540,445 | 4.71 | |||||||||||||||||||||||
Thunder Grandparent Inc. (dba Telestream, Inc)(6)(7) | Software & Services | L+8.75%, 1.00% Floor (0.50% on unfunded) | 9.75 | 10/15/2020 | 10/15/2025 | 1,293,103 | 497,654 | 504,633 | 0.09 | |||||||||||||||||||||||
|
|
|
|
|
| |||||||||||||||||||||||||||
Total United States of America 1st Lien Revolver | 29,119,808 | 30,490,869 | 5.41 | |||||||||||||||||||||||||||||
|
|
|
|
|
| |||||||||||||||||||||||||||
Canada | ||||||||||||||||||||||||||||||||
Dye & Durham Corp(6)(7)(10)(18)(19) | Software & Services | C+5.75%, (0.50% on unfunded) | 0.50 | 12/3/2021 | 12/3/2026 | C$ | 414,683 | (4,780 | ) | (2,461 | ) | (0.00 | ) | |||||||||||||||||||
|
|
|
|
|
| |||||||||||||||||||||||||||
Total Canada 1st Lien Revolver | (4,780 | ) | (2,461 | ) | (0.00 | ) | ||||||||||||||||||||||||||
|
|
|
|
|
| |||||||||||||||||||||||||||
Luxembourg | ||||||||||||||||||||||||||||||||
Mallinckrodt PLC(8) | Pharmaceuticals & Life Sciences | L+4.25% | 4.38 | 1/11/2021 | 2/28/2022 | 4,900,000 | 4,825,934 | 4,786,687 | 0.85 | |||||||||||||||||||||||
|
|
|
|
|
| |||||||||||||||||||||||||||
Total Luxembourg 1st Lien Revolver | 4,825,934 | 4,786,687 | 0.85 | |||||||||||||||||||||||||||||
|
|
|
|
|
| |||||||||||||||||||||||||||
Total 1st Lien Revolver | 33,940,962 | 35,275,095 | 6.26 | |||||||||||||||||||||||||||||
|
|
|
|
|
| |||||||||||||||||||||||||||
The accompanying notes are an integral part of these consolidated financial statements.
F-12
Table of Contents
Silver Point Specialty Lending Fund
Consolidated Schedule of Investments
December 31, 2021
(in U.S. Dollars)
Portfolio Company(1) | Industry | Rate(2) | Interest Rate | Original Acquisition Date | Maturity Date | Par Amount ($) / Shares or Ownership % / Notional ($)(3) | Cost / Amortized Cost(4) | Fair Value | % of Net Assets(5) | |||||||||||||||||||||||||
2nd Lien Term Loan | ||||||||||||||||||||||||||||||||||
United States of America | ||||||||||||||||||||||||||||||||||
Alpine US Bidco LLC(8)(9) | Food Products | L+9.00%, 0.75% Floor | 9.75 | % | 4/28/2021 | 5/3/2029 | $ | 8,642,861 | $ | 8,396,657 | $ | 8,556,432 | 1.52 | % | ||||||||||||||||||||
BayMark Health Services Inc(6)(7)(18)(19) | | Healthcare Providers & Services | | L+8.50%, 1.00% Floor (2.00% on unfunded) | 2.00 | 11/19/2021 | 6/11/2028 | 5,486,667 | (79,735 | ) | (54,867 | ) | (0.01 | ) | ||||||||||||||||||||
BayMark Health Services Inc(7)(9) | | Healthcare Providers & Services | | L+8.50%, 1.00% Floor | 9.50 | 6/10/2021 | 6/11/2028 | 3,333,333 | 3,285,865 | 3,300,000 | 0.59 | |||||||||||||||||||||||
Tops MBO Corp(7) | Staples Retail | L+13.50%, 2.00% Floor | 15.50 | 11/8/2021 | 5/8/2026 | 468,557 | 469,715 | 468,791 | 0.08 | |||||||||||||||||||||||||
|
|
|
|
|
| |||||||||||||||||||||||||||||
Total United States of America 2nd Lien Term Loan | 12,072,502 | 12,270,356 | 2.18 | |||||||||||||||||||||||||||||||
|
|
|
|
|
| |||||||||||||||||||||||||||||
Luxembourg | ||||||||||||||||||||||||||||||||||
Steenbok Lux Finco 2 SARL(8)(10)(15) | Staples Retail | 10.75% | 10.75 | 5/6/2021 | 12/31/2022 | € | 15,839,091 | 16,798,465 | 16,241,954 | 2.88 | ||||||||||||||||||||||||
|
|
|
|
|
| |||||||||||||||||||||||||||||
Total Luxembourg 2nd Lien Term Loan | 16,798,465 | 16,241,954 | 2.88 | |||||||||||||||||||||||||||||||
|
|
|
|
|
| |||||||||||||||||||||||||||||
Total 2nd Lien Term Loan | 28,870,967 | 28,512,310 | 5.06 | |||||||||||||||||||||||||||||||
|
|
|
|
|
| |||||||||||||||||||||||||||||
Total Secured Loans | 773,343,073 | 772,736,811 | 137.06 | |||||||||||||||||||||||||||||||
|
|
|
|
|
| |||||||||||||||||||||||||||||
Secured Bonds | ||||||||||||||||||||||||||||||||||
Senior Secured Bonds | ||||||||||||||||||||||||||||||||||
United States of America | ||||||||||||||||||||||||||||||||||
Incora (aka Wolverine Escrow LLC)(9) | | Industrial Products & Services | | 8.50% | 8.50 | 10/15/2020 | 11/15/2024 | 6,538,000 | 5,716,465 | 6,107,173 | 1.08 | |||||||||||||||||||||||
Incora (aka Wolverine Escrow LLC)(9) | | Industrial Products & Services | | 9.00% | 9.00 | 10/15/2020 | 11/15/2026 | 2,653,000 | 2,331,760 | 2,518,314 | 0.45 | |||||||||||||||||||||||
|
|
|
|
|
| |||||||||||||||||||||||||||||
Total United States of America Senior Secured Bonds | 8,048,225 | 8,625,487 | 1.53 | |||||||||||||||||||||||||||||||
|
|
|
|
|
| |||||||||||||||||||||||||||||
Japan | ||||||||||||||||||||||||||||||||||
Universal Entertainment Corp(10) | Gaming & Leisure | 8.50% | 8.50 | 10/29/2020 | 12/11/2024 | 23,278,000 | 23,997,684 | 24,537,398 | 4.35 | |||||||||||||||||||||||||
|
|
|
|
|
| |||||||||||||||||||||||||||||
Total Japan Senior Secured Bonds | 23,997,684 | 24,537,398 | 4.35 | |||||||||||||||||||||||||||||||
|
|
|
|
|
| |||||||||||||||||||||||||||||
The accompanying notes are an integral part of these consolidated financial statements.
F-13
Table of Contents
Silver Point Specialty Lending Fund
Consolidated Schedule of Investments
December 31, 2021
(in U.S. Dollars)
Portfolio Company(1) | Industry | Rate(2) | Interest Rate | Original Acquisition Date | Maturity Date | Par Amount ($) / Shares or Ownership % / Notional ($)(3) | Cost / Amortized Cost(4) | Fair Value | % of Net Assets(5) | |||||||||||||||||||||||
Luxembourg | ||||||||||||||||||||||||||||||||
Takko Fashion GmbH(10) | Specialty Retail | 5.38% | 5.38 | % | 9/14/2020 | 11/15/2023 | € | 12,533,000 | $ | 13,460,834 | $ | 13,623,964 | 2.42 | % | ||||||||||||||||||
Takko Fashion GmbH(10) | Specialty Retail | E+5.38%, 0.00% Floor | 5.38 | 9/16/2020 | 11/15/2023 | € | 6,179,000 | 6,526,672 | 6,721,493 | 1.19 | ||||||||||||||||||||||
|
|
|
|
|
| |||||||||||||||||||||||||||
Total Luxembourg Senior Secured Bonds | 19,987,506 | 20,345,457 | 3.61 | |||||||||||||||||||||||||||||
|
|
|
|
|
| |||||||||||||||||||||||||||
Netherlands | ||||||||||||||||||||||||||||||||
Promontoria Holding(10) | Airline & Airport Services | 6.75% | 6.75 | 10/16/2020 | 8/15/2023 | € | 7,623,000 | 8,653,743 | 8,636,068 | 1.53 | ||||||||||||||||||||||
Promontoria Holding(10) | Airline & Airport Services | E+6.25%, 0.00% Floor | 6.25 | 11/12/2020 | 8/15/2023 | € | 5,526,000 | 6,400,040 | 6,241,175 | 1.11 | ||||||||||||||||||||||
|
|
|
|
|
| |||||||||||||||||||||||||||
Total Netherlands Senior Secured Bonds | 15,053,783 | 14,877,243 | 2.64 | |||||||||||||||||||||||||||||
|
|
|
|
|
| |||||||||||||||||||||||||||
United Kingdom | ||||||||||||||||||||||||||||||||
AVIANCA MIDCO 2 LTD(10) | Airline & Airport Services | 9.00% | 9.00 | 12/1/2021 | 12/1/2028 | 13,237,342 | 13,237,342 | 13,267,126 | 2.35 | |||||||||||||||||||||||
Inspired Entertainment Inc(10) | Technology | 7.88% | 7.88 | 5/13/2021 | 6/1/2026 | £ | 3,616,000 | 5,081,928 | 4,993,887 | 0.89 | ||||||||||||||||||||||
Mclaren Group Ltd(9)(10) | Automobiles & Components | 7.50% | 7.50 | 7/22/2021 | 8/1/2026 | 7,500,000 | 7,500,000 | 7,580,656 | 1.34 | |||||||||||||||||||||||
|
|
|
|
|
| |||||||||||||||||||||||||||
Total United Kingdom Senior Secured Bonds | 25,819,270 | 25,841,669 | 4.58 | |||||||||||||||||||||||||||||
|
|
|
|
|
| |||||||||||||||||||||||||||
Total Senior Secured Bonds | 92,906,468 | 94,227,254 | 16.71 | |||||||||||||||||||||||||||||
|
|
|
|
|
| |||||||||||||||||||||||||||
Equities | ||||||||||||||||||||||||||||||||
Common Equities | ||||||||||||||||||||||||||||||||
United States of America | ||||||||||||||||||||||||||||||||
Gadsden Development Company I, LLC(7)(17) | Multi-Family | N/A | N/A | 8/10/2016 | N/A | 312 | — | 1,555,856 | 0.28 | |||||||||||||||||||||||
Impala RGIS Holdings LLC(7)(17) | Business Services | N/A | N/A | 6/25/2020 | N/A | 325,652 | 2,115,903 | 9,932,386 | 1.76 | |||||||||||||||||||||||
LCP Edge Holdco, LLC(7)(17) | Consumer Services | N/A | N/A | 8/24/2018 | N/A | 1,148 | — | 12,657,607 | 2.25 | |||||||||||||||||||||||
Welsh Acquisition LLC(7)(17) | Industrial | N/A | N/A | 12/6/2017 | N/A | 20 | % | — | 141,754 | 0.03 | ||||||||||||||||||||||
|
|
|
|
|
| |||||||||||||||||||||||||||
Total Common Equities | 2,115,903 | 24,287,603 | 4.32 | |||||||||||||||||||||||||||||
|
|
|
|
|
| |||||||||||||||||||||||||||
The accompanying notes are an integral part of these consolidated financial statements.
F-14
Table of Contents
Silver Point Specialty Lending Fund
Consolidated Schedule of Investments
December 31, 2021
(in U.S. Dollars)
Portfolio Company(1) | Industry | Rate(2) | Interest Rate | Original Acquisition Date | Maturity Date | Par Amount ($) / Shares or Ownership % / Notional ($)(3) | Cost / Amortized Cost(4) | Fair Value | % of Net Assets(5) | |||||||||||||||||||||||||
Preferred Equities | ||||||||||||||||||||||||||||||||||
United States of America | ||||||||||||||||||||||||||||||||||
Gadsden Development Company I, LLC(7)(17) | Multi-Family | N/A | N/A | 8/10/2016 | N/A | 89 | $ | — | $ | — | — | % | ||||||||||||||||||||||
Sutherland Global Services Inc(7)(17) | Business Services | N/A | N/A | 8/17/2021 | N/A | 9,184 | 9,000,321 | 9,688,156 | 1.72 | |||||||||||||||||||||||||
|
|
|
|
|
| |||||||||||||||||||||||||||||
Total Preferred Equities | 9,000,321 | 9,688,156 | 1.72 | |||||||||||||||||||||||||||||||
|
|
|
|
|
| |||||||||||||||||||||||||||||
Total Equities | 11,116,224 | 33,975,759 | 6.04 | |||||||||||||||||||||||||||||||
|
|
|
|
|
| |||||||||||||||||||||||||||||
Total Non-Controlled/Non-Affiliated Investments | $ | 877,365,765 | $ | 900,939,824 | 159.81 | % | ||||||||||||||||||||||||||||
|
|
|
|
|
| |||||||||||||||||||||||||||||
Controlled Investments(20) | ||||||||||||||||||||||||||||||||||
Secured Loans | ||||||||||||||||||||||||||||||||||
1st Lien Term Loan | ||||||||||||||||||||||||||||||||||
United States of America | ||||||||||||||||||||||||||||||||||
SP-CREH 19 Highline LLC(7) | Multi-Family | 7.00% | 7.00 | 6/28/2021 | 7/1/2024 | $ | 21,000,000 | 21,000,000 | 21,006,300 | 3.73 | ||||||||||||||||||||||||
|
|
|
|
|
| |||||||||||||||||||||||||||||
Total 1st Lien Term Loan | 21,000,000 | 21,006,300 | 3.73 | |||||||||||||||||||||||||||||||
|
|
|
|
|
| |||||||||||||||||||||||||||||
1st Lien Revolver | ||||||||||||||||||||||||||||||||||
United States of America | ||||||||||||||||||||||||||||||||||
SP-CREH 19 Highline LLC(6)(7) | Multi-Family | 5.00% | 5.00 | 6/28/2021 | 7/1/2024 | $ | 6,125,000 | 2,819,674 | 2,826,718 | 0.50 | ||||||||||||||||||||||||
|
|
|
|
|
| |||||||||||||||||||||||||||||
Total 1st Lien Revolver | 2,819,674 | 2,826,718 | 0.50 | |||||||||||||||||||||||||||||||
|
|
|
|
|
| |||||||||||||||||||||||||||||
| Total Secured Loans | 23,819,674 | 23,833,018 | 4.23 | |||||||||||||||||||||||||||||||
|
|
|
|
|
| |||||||||||||||||||||||||||||
Equities | ||||||||||||||||||||||||||||||||||
Common Equities | ||||||||||||||||||||||||||||||||||
United States of America | ||||||||||||||||||||||||||||||||||
SP-CREH 19 Highline LLC(7)(17) | Multi-Family | N/A | N/A | 6/28/2021 | N/A | 70 | % | 5,950,000 | 5,436,667 | 0.96 | ||||||||||||||||||||||||
|
|
|
|
|
| |||||||||||||||||||||||||||||
Total Equities | 5,950,000 | 5,436,667 | 0.96 | |||||||||||||||||||||||||||||||
|
|
|
|
|
| |||||||||||||||||||||||||||||
Trust Interest | ||||||||||||||||||||||||||||||||||
United States of America | ||||||||||||||||||||||||||||||||||
TH Liquidating Trust(6)(7)(17) | Other | N/A | N/A | 10/9/2020 | 12/6/2024 | 14 | % | — | — | — | ||||||||||||||||||||||||
TH Liquidating Trust(7)(17) | Other | N/A | N/A | 12/7/2019 | 12/6/2024 | 14 | % | 3,153,474 | 2,578,113 | 0.46 | ||||||||||||||||||||||||
TH Liquidating Trust(7)(16) | Other | L+10.50%, 0.50% Floor | 11.00 | 12/7/2019 | 12/6/2024 | $ | 353,871 | 353,871 | 348,745 | 0.06 | ||||||||||||||||||||||||
|
|
|
|
|
| |||||||||||||||||||||||||||||
Total Trust Interest | 3,507,345 | 2,926,858 | 0.52 | |||||||||||||||||||||||||||||||
|
|
|
|
|
| |||||||||||||||||||||||||||||
The accompanying notes are an integral part of these consolidated financial statements.
F-15
Table of Contents
Silver Point Specialty Lending Fund
Consolidated Schedule of Investments
December 31, 2021
(in U.S. Dollars)
Portfolio Company(1) | Industry | Rate(2) | Interest Rate | Original Acquisition Date | Maturity Date | Par Amount ($) / Shares or Ownership % / Notional ($)(3) | Cost / Amortized Cost(4) | Fair Value | % of Net Assets(5) | |||||||||||||||||||||||
Real Estate Properties | ||||||||||||||||||||||||||||||||
United States of America | ||||||||||||||||||||||||||||||||
30 South Broadway, Irvington, New York(7)(10)(17) | Industrial | N/A | N/A | 12/14/2021 | N/A | 100 | % | $ | 9,537,532 | $ | 9,486,863 | 1.68 | % | |||||||||||||||||||
16415 Tuckerton Road, Houston, Texas(7)(10)(17) | Healthcare Providers & Services | N/A | N/A | 9/7/2021 | N/A | 100 | % | 8,064,754 | 8,526,000 | 1.51 | ||||||||||||||||||||||
|
|
|
|
|
| |||||||||||||||||||||||||||
Total Real Estate Properties | 17,602,286 | 18,012,863 | 3.19 | |||||||||||||||||||||||||||||
|
|
|
|
|
| |||||||||||||||||||||||||||
Total Controlled Investments | $ | 50,879,305 | $ | 50,209,406 | 8.90 | % | ||||||||||||||||||||||||||
|
|
|
|
|
| |||||||||||||||||||||||||||
Total Investments, December 31, 2021 | $ | 928,245,070 | $ | 951,149,230 | 168.71 | % | ||||||||||||||||||||||||||
|
|
|
|
|
| |||||||||||||||||||||||||||
| (1) | All of our investments are issued by eligible portfolio companies, as defined in the Investment Company Act of 1940 (the “1940 Act”), unless otherwise noted. |
| (2) | The majority of the investments bear interest at a rate that may be determined by reference to London Interbank Offered Rate (“LIBOR” or “L”) or Prime Rate (“Prime” or “P”) which reset monthly or quarterly. For each such investment, the Fund has provided the spread over LIBOR or Prime and the current contractual interest rate in effect at December 31, 2021. Certain investments are subject to a LIBOR or Prime interest rate floor or cap. As of December 31, 2021, rates for 1M L, 3M L and Prime are 0.08%, 0.13% and 3.25%, respectively. LIBOR represents the average interest rate that leading banks in London estimate they would charge for lending to other banks, the Euro Interbank Offered Rate, known as EURIBOR (“EURIBOR” or “E”), is a similar reference rate derived from banks across the Eurozone. As of December 31, 2021, rates for 1M E and 3M E are (0.59) % and (0.57) %, respectively. Certain investments can also bear interest at a rate that may be determined by reference to the Canadian Dollar Offer Rate (“CDOR” or “C”) which resets monthly. For each such investment, the Fund has provided the spread over CDOR and the current contractual interest rate in effect at December 31, 2021. As of December 31, 2021, the rate for 1M CDOR is 0.45%. Additionally, investments can bear interest at a rate that may be determined by reference to the Secured Overnight Financing Rate Data (“SOFR” or “S”). SOFR is a broad measure of the cost of borrowing cash overnight collateralized by Treasury securities. As of December 31, 2021, the rate for SOFR is 0.05%. |
| (3) | Par amount includes unfunded commitments, accumulated payment-in-kind (“PIK”) interest and is net of repayments. Equity investments are recorded as number of shares owned or ownership percentage. |
| (4) | Cost represents amortized cost for debt investments less payments, plus capitalized PIK if any. As of December 31, 2021, the aggregate gross unrealized appreciation for all investments in which there was an excess of fair value over tax cost was $35.7 million; the aggregate gross unrealized depreciation for all investments in which there was an excess of tax cost over fair value was $8.8 million; the net unrealized appreciation was $26.9 million; the aggregate tax cost of securities for Federal income tax purposes was $923.3 million. |
| (5) | Percentage is based on net assets of $563,684,976 as of December 31, 2021. |
| (6) | The investment has an unfunded commitment as of December 31, 2021 (see Note 11 in the accompanying notes to the consolidated financial statements). |
| (7) | Fair value was determined using significant unobservable inputs (see Note 6 in the accompanying notes to the consolidated financial statements). |
| (8) | Some or all of these investments are pledged as collateral to the Revolving Credit Facility (see Note 7 in the accompanying notes to the consolidated financial statements). |
| (9) | Some or all of these investments are pledged as collateral to the 2021 CLO (see Note 7 in the accompanying notes to the consolidated financial statements). |
| (10) | These investments are treated as non-qualifying investments under Section 55(a) of the 1940 Act. Under the 1940 Act, the Fund may not acquire any non-qualifying asset unless, at the time the acquisition is made, qualifying assets represent at least 70% of the Fund’s total assets. As of December 31, 2021, qualifying assets totaled 77.11% of the Fund’s total assets. |
The accompanying notes are an integral part of these consolidated financial statements.
F-16
Table of Contents
Silver Point Specialty Lending Fund
Consolidated Schedule of Investments
December 31, 2021
(in U.S. Dollars)
| (11) | The underlying credit agreement or indenture contains a PIK provision, whereby the issuer has either the option or the obligation to make a portion of the interest payments with the issuance of additional investments. The PIK portion of the coupon is 7.00%. |
| (12) | The underlying credit agreement or indenture contains a PIK provision, whereby the issuer has either the option or the obligation to make a portion of the interest payments with the issuance of additional investments. The PIK portion of the coupon is 2.67%. |
| (13) | The underlying credit agreement or indenture contains a PIK provision, whereby the issuer has either the option or the obligation to make a portion of the interest payments with the issuance of additional investments. The PIK portion of the coupon is 7.88%. |
| (14) | The underlying credit agreement or indenture contains a PIK provision, whereby the issuer has either the option or the obligation to make a portion of the interest payments with the issuance of additional investments. The PIK portion of the coupon is 10.75%. |
| (15) | The underlying credit agreement or indenture contains a PIK provision, whereby the issuer has either the option or the obligation to make a portion of the interest payments with the issuance of additional investments. The PIK portion of the coupon is 10.75%. |
| (16) | The underlying credit agreement or indenture contains a PIK provision, whereby the issuer has either the option or the obligation to make a portion of the interest payments with the issuance of additional investments. The PIK portion of the coupon is 2.00%. |
| (17) | Represents a non-income producing investment. |
| (18) | The negative fair value is the result of the original discount on the loan. |
| (19) | The negative amortized cost is the result of the original discount being greater than the principal amount outstanding on the loan. |
| (20) | Controlled Investments are defined by the 1940 Act, as investments in companies in which the Fund owns more than 25% of the voting securities or maintains greater than 50% of the board representation. Transactions during the period ended December 31, 2021 with these controlled investments were as follows: |
Portfolio Company | Type of Investment | Fair Value at December 31, 2020 | Gross additions* | Gross reductions | Net change in unrealized appreciation (depreciation) | Net realized gains (losses) | Fair Value at December 31, 2021 | Interest income | Dividend income | Par Amount ($) / Number Of Units/ Ownership % | ||||||||||||||||||||||||||||||
30 South Broadway, Irvington, New York | Real Estate Properties | $ | — | $ | 9,537,533 | $ | — | $ | (50,670 | ) | $ | — | $ | 9,486,863 | $ | — | $ | — | 100 | % | ||||||||||||||||||||
SP Harvest Mill, LLC | Equities | — | — | — | — | — | — | — | 72,373 | — | ||||||||||||||||||||||||||||||
SP-CREH 19 Highline LLC | Secured Loans | — | 21,000,000 | — | 6,300 | — | 21,006,300 | 763,584 | — | 21,000,000 | ||||||||||||||||||||||||||||||
SP-CREH 19 Highline LLC | Equities | — | 5,950,000 | — | (513,333 | ) | — | 5,436,667 | — | — | 70 | % | ||||||||||||||||||||||||||||
SP-CREH 19 Highline LLC | Secured Loans | — | 2,819,673 | — | 7,045 | — | 2,826,718 | 32,663 | — | 6,125,000 | ||||||||||||||||||||||||||||||
TH Liquidating Trust | Trust Interest | 2,622,900 | — | — | (44,787 | ) | — | 2,578,113 | — | — | 14 | % | ||||||||||||||||||||||||||||
TH Liquidating Trust | Trust Interest | 275,744 | 73,871 | — | (870 | ) | — | 348,745 | 108 | — | 353,871 | |||||||||||||||||||||||||||||
TH Liquidating Trust | Trust Interest | — | — | — | — | — | — | — | — | 14 | % | |||||||||||||||||||||||||||||
16415 Tuckerton Road, Houston, Texas | | Real Estate Properties | | — | 8,064,754 | — | 461,246 | — | 8,526,000 | — | — | 100 | % | |||||||||||||||||||||||||||
|
|
|
|
|
|
|
|
|
|
|
|
|
|
|
| |||||||||||||||||||||||||
Total | $ | 2,898,644 | $ | 47,445,831 | $ | — | $ | (135,069 | ) | $ | — | $ | 50,209,406 | $ | 796,355 | $ | 72,373 | |||||||||||||||||||||||
|
|
|
|
|
|
|
|
|
|
|
|
|
|
|
| |||||||||||||||||||||||||
| * | Gross additions include increases in the cost basis of the investments resulting from new portfolio investments, accretion of discounts, PIK interest, and the exchange of one or more existing securities for one or more new investments. |
The accompanying notes are an integral part of these consolidated financial statements.
F-17
Table of Contents
Silver Point Specialty Lending Fund
Consolidated Schedule of Investments
December 31, 2021
(in U.S. Dollars)
Additional Information
Derivative Counterparty | Settlement Date | Amount Purchased | Amount Sold | Fair Value | % Net Assets(1) | |||||||||||||||
Foreign Currency Forward Contracts | ||||||||||||||||||||
JPMorgan Chase Bank | 3/31/2022 | $ | 11,505,603 | C$ | 14,785,954 | $ | (192,532 | ) | (0.03 | )% | ||||||||||
JPMorgan Chase Bank | 3/31/2022 | $ | 2,145,001 | € | 1,900,000 | (19,152 | ) | (0.00 | ) | |||||||||||
JPMorgan Chase Bank | 3/31/2022 | $ | 2,371,721 | € | 2,100,000 | (20,238 | ) | (0.00 | ) | |||||||||||
JPMorgan Chase Bank | 3/31/2022 | $ | 79,074,848 | € | 69,965,977 | (618,363 | ) | (0.11 | ) | |||||||||||
JPMorgan Chase Bank | 3/31/2022 | $ | 252,414 | € | 223,216 | (1,835 | ) | (0.00 | ) | |||||||||||
JPMorgan Chase Bank | 3/31/2022 | $ | 261,324 | € | 231,063 | (1,863 | ) | (0.00 | ) | |||||||||||
JPMorgan Chase Bank | 3/31/2022 | $ | 314,931 | € | 278,429 | (2,207 | ) | (0.00 | ) | |||||||||||
JPMorgan Chase Bank | 3/31/2022 | $ | 478,990 | € | 421,913 | (1,581 | ) | (0.00 | ) | |||||||||||
JPMorgan Chase Bank | 3/31/2022 | $ | 264,895 | € | 232,841 | (318 | ) | (0.00 | ) | |||||||||||
JPMorgan Chase Bank | 3/31/2022 | $ | 6,461,474 | £ | 4,879,880 | (139,324 | ) | (0.02 | ) | |||||||||||
JPMorgan Chase Bank | 3/31/2022 | € | 1,200,000 | $ | 1,356,228 | 10,606 | 0.00 | |||||||||||||
JPMorgan Chase Bank | 3/31/2022 | € | 804,462 | R | 14,800,000 | (2,897 | ) | (0.00 | ) | |||||||||||
| �� |
|
|
|
| ||||||||||||||||
Total | $ | (989,704 | ) | (0.16 | )% | |||||||||||||||
|
|
|
| |||||||||||||||||
| (1) | Percentage is based on net assets of $563,684,976 as of December 31, 2021. |
The accompanying notes are an integral part of these consolidated financial statements.
F-18
Table of Contents
Silver Point Specialty Lending Fund
Consolidated Schedule of Investments
December 31, 2020
(in U.S. Dollars)
Portfolio Company(1) | Industry | Rate(2) | Interest Rate | Original Acquisition Date | Maturity Date | Par Amount ($) / Shares or Ownership % / Notional ($)(3) | Cost / Amortized Cost(4) | Fair Value | % of Partners’ capital(5) | |||||||||||||||||||||||||
Non-Controlled/Non-Affiliated Investments | ||||||||||||||||||||||||||||||||||
Secured Loans | ||||||||||||||||||||||||||||||||||
1st Lien Term Loan | ||||||||||||||||||||||||||||||||||
United States of America | ||||||||||||||||||||||||||||||||||
4501 Woodhaven Holding LLC(6)(7)(10) | | Multi-Purpose Building | | L+6.09%, 2.08% Floor | 8.17 | % | 7/18/2018 | 1/18/2021 | $ | 6,285,210 | $ | 6,192,306 | $ | 6,214,066 | 1.33 | % | ||||||||||||||||||
Acima Credit, LLC(7)(8)(9) | Financial Services | L+6.00%, 1.25% Floor | 7.25 | 12/26/2018 | 4/27/2021 | 20,000,000 | 19,974,538 | 19,975,423 | 4.27 | |||||||||||||||||||||||||
APEG Maxey, LP(6)(7)(19)(25) | Multi-Family | L+10.35%, 2.15% Cap (11.33% on unfunded) | 10.50 | 9/26/2016 | 6/30/2020 | 20,128,003 | 19,146,665 | 19,055,000 | 4.08 | |||||||||||||||||||||||||
ARIAM Partners, LLC(6)(7)(25) | Multi-Family | L+10.50%, 1.22% Floor | 11.72 | 8/31/2017 | 6/30/2019 | 682,000 | 341,102 | 85,000 | 0.02 | |||||||||||||||||||||||||
Baylor United, LLC(7)(11) | | Real Estate Development & Management | | L+7.25%, 1.76% Floor | 9.01 | 12/20/2019 | 12/21/2021 | 8,728,059 | 8,726,119 | 8,596,265 | 1.84 | |||||||||||||||||||||||
BEL USA LLC(7)(8)(12) | E-Commerce | L+6.53%, 1.50% Floor | 8.03 | 12/13/2018 | 11/2/2023 | 13,953,855 | 13,809,528 | 12,828,993 | 2.74 | |||||||||||||||||||||||||
BH Chamblee LLC(7)(8) | Multi-Family | L+8.67%, 1.33% Floor | 10.00 | 7/1/2015 | 6/30/2021 | 8,226,679 | 8,174,682 | 8,229,970 | 1.76 | |||||||||||||||||||||||||
Branford Place Medical Specialists, LLC(7)(24)(28) | | Healthcare Providers & Services | | L+8.25%, 1.96% Floor | 10.21 | 1/6/2020 | 7/3/2020 | 621,570 | 621,570 | 620,140 | 0.13 | |||||||||||||||||||||||
Citgo Holding, Inc.(8) | Energy | L+7.00%, 1.00% Floor | 8.00 | 7/24/2019 | 8/1/2023 | 4,418,813 | 4,374,398 | 4,068,070 | 0.87 | |||||||||||||||||||||||||
Columbia Helicopters Inc.(7)(8) | | Aerospace & Defense | | L+7.50%, 1.50% Floor | 9.00 | 8/20/2019 | 8/20/2024 | 18,888,354 | 18,599,433 | 18,582,740 | 3.97 | |||||||||||||||||||||||
Denardo Capital II LLC(7)(13)(25) | Industrial | L+10.00%, 2.40% Floor | 12.40 | 12/28/2018 | 12/31/2020 | 9,498,358 | 9,497,538 | 8,153,116 | 1.74 | |||||||||||||||||||||||||
DexYP(8) | Media: Advertising | L+9.00%, 1.00% Floor | 10.00 | 1/17/2019 | 12/29/2023 | 13,624,545 | 13,499,018 | 13,071,048 | 2.80 | |||||||||||||||||||||||||
DMT Solutions Global Corp (dba Bluecrest)(8) | | Industrial Products & Services | | L+7.00%, 1.00% Floor | 8.00 | 12/15/2020 | 7/2/2024 | 20,000,000 | 18,802,761 | 19,100,000 | 4.09 | |||||||||||||||||||||||
Engineered Controls International, LLC(7)(8) | | Industrial Products & Services | | L+7.00%, 1.50% Floor | 8.50 | 11/5/2019 | 11/5/2024 | 29,250,000 | 28,718,358 | 28,733,036 | 6.15 | |||||||||||||||||||||||
Form Technologies Inc | | Automobiles & Components | | L+3.25%, 1.00% Floor | 4.25 | 6/9/2020 | 1/28/2022 | 4,770,023 | 4,197,371 | 4,510,056 | 0.96 | |||||||||||||||||||||||
Giga Data Center - 1 LLC(7)(28) | Telecommunications | L+7.75%, 2.16% Floor | 9.91 | 9/13/2018 | 11/30/2020 | 16,483,371 | 16,738,373 | 16,277,329 | 3.48 | |||||||||||||||||||||||||
Heligear Acquisition Co(7)(8) | | Aerospace & Defense | | L+7.00%, 1.50% Floor | 8.50 | 9/6/2019 | 7/30/2024 | 30,800,000 | 30,566,144 | 30,551,567 | 6.54 | |||||||||||||||||||||||
Impala RGIS Holdings LLC(21) | Business Services | L+7.50%, 1.00% Floor | 8.50 | 6/25/2020 | 6/25/2025 | 8,418,494 | 8,418,494 | 7,913,384 | 1.69 | |||||||||||||||||||||||||
JUUL Labs Inc(7)(18) | Consumer Products | L+8.00%, 1.50% Floor | 9.50 | 8/2/2019 | 8/2/2023 | 26,452,995 | 26,075,180 | 26,172,540 | 5.60 | |||||||||||||||||||||||||
Kaplan Woodland Hills Property Company, LLC(6)(7)(8) | | Real Estate Development & Management | | L+6.00%, 1.65% Floor (5.95% on unfunded) | 7.65 | 2/14/2020 | 2/14/2023 | 14,000,000 | 13,723,370 | 13,701,476 | 2.93 | |||||||||||||||||||||||
The accompanying notes are an integral part of these consolidated financial statements.
F-19
Table of Contents
Silver Point Specialty Lending Fund
Consolidated Schedule of Investments
December 31, 2020
(in U.S. Dollars)
Portfolio Company(1) | Industry | Rate(2) | Interest Rate | Original Acquisition Date | Maturity Date | Par Amount ($) / Shares or Ownership % / Notional ($)(3) | Cost / Amortized Cost(4) | Fair Value | % of Partners’ capital(5) | |||||||||||||||||||||||
Kleinfelder Group Inc(7)(8) | Professional Services | L+5.75%, 1.00% Floor | 6.75 | % | 10/13/2020 | 11/29/2024 | $ | 4,987,500 | $ | 4,938,449 | $ | 4,939,326 | 1.06 | % | ||||||||||||||||||
LCP Edge Holdco, LLC(7)(8)(14) | Consumer Services | L+7.75%, 1.00% Floor | 8.75 | 8/24/2018 | 8/24/2022 | 57,554,886 | 57,159,449 | 57,554,885 | 12.31 | |||||||||||||||||||||||
LMG Holdings(7)(8) | Manufacturing | L+8.00%, 1.50% Floor | 9.50 | 12/24/2019 | 12/24/2024 | 28,687,500 | 28,208,926 | 28,215,964 | 6.04 | |||||||||||||||||||||||
Masterwork Electronics, Inc.(7)(8) | Technology Hardware & Equipment | L+8.00%, 1.00% Floor | 9.00 | 7/27/2018 | 7/27/2023 | 40,381,698 | 39,870,755 | 37,353,071 | 7.99 | |||||||||||||||||||||||
Mattress Firm Inc(8) | Specialty Retail | L+5.25%, 1.00% Floor | 6.25 | 11/24/2020 | 11/25/2027 | 13,750,000 | 13,406,250 | 13,818,750 | 2.96 | |||||||||||||||||||||||
National Dentex Corp(6)(7)(8) | Healthcare Providers & Services | L+7.00%, 1.00% Floor (1.00% on unfunded) | 8.00 | 10/26/2020 | 10/3/2025 | 14,683,103 | 9,612,224 | 9,615,454 | 2.06 | |||||||||||||||||||||||
Nine West Holdings Inc(8)(20) | Consumer Brands | L+8.00% | 8.24 | 3/19/2019 | 3/20/2024 | 2,362,839 | 2,216,343 | 1,546,927 | 0.33 | |||||||||||||||||||||||
PaperWorks Industries Holding Corp.(7)(8) | Paper & Packaging | L+7.25%, 1.00% Floor | 8.25 | 12/18/2020 | 12/18/2025 | 30,000,000 | 29,107,051 | 29,134,590 | 6.23 | |||||||||||||||||||||||
Patientpoint LLC(7)(8) | Healthcare Technology | L+7.50%, 1.00% Floor | 8.50 | 6/26/2017 | 6/26/2022 | 36,509,270 | 36,362,194 | 36,373,163 | 7.78 | |||||||||||||||||||||||
Phoenix House Foundation, Inc(6)(7)(8) | Healthcare Providers & Services | L+7.85%, 1.00% Floor, 3.00% Cap | 8.85 | 10/29/2015 | 4/30/2021 | 16,820,351 | 16,520,753 | 16,492,480 | 3.53 | |||||||||||||||||||||||
Project 19 Highline LLC(7)(25)(26) | Multi-Family | L+11.50%, 1.50% Floor | 13.00 | 2/20/2018 | 8/20/2019 | 16,355,051 | 16,355,051 | 13,866,110 | 2.97 | |||||||||||||||||||||||
Revlon Inc(9)(14) | Consumer Brands | L+10.50%, 1.50% Floor | 14.00 | 10/29/2020 | 6/30/2025 | 496,747 | 501,045 | 525,310 | 0.11 | |||||||||||||||||||||||
Revlon Inc(9) | Consumer Brands | L+3.50%, 0.75% Floor | 4.25 | 12/1/2020 | 6/30/2025 | 1,539 | — | 873 | 0.00 | |||||||||||||||||||||||
STV Group, Inc(7)(8) | Professional Services | L+5.25% | 5.40 | 8/3/2020 | 12/11/2026 | 4,863,205 | 4,631,824 | 4,607,887 | 0.99 | |||||||||||||||||||||||
Sutherland Global Services Inc(7)(8) | Business Services | L+7.25%, 1.00% Floor | 8.25 | 10/23/2020 | 10/23/2025 | 19,042,049 | 18,671,473 | 18,676,518 | 3.99 | |||||||||||||||||||||||
Thunder Grandparent Inc. (dba Telestream, Inc)(7)(8) | Software & Services | L+8.75%, 1.00% Floor | 9.75 | 10/15/2020 | 10/15/2025 | 13,706,897 | 13,440,527 | 13,443,436 | 2.88 | |||||||||||||||||||||||
Tops MBO Corp | Staples Retail | L+8.50%, 1.00% Floor | 9.50 | 12/18/2020 | 11/19/2023 | 696,613 | 662,074 | 710,545 | 0.15 | |||||||||||||||||||||||
Total Safety LLC(8) | Industrial Products & Services | L+6.00%, 1.00% Floor | 7.00 | 8/14/2019 | 8/16/2025 | 9,251,645 | 8,727,726 | 8,880,806 | 1.90 | |||||||||||||||||||||||
The accompanying notes are an integral part of these consolidated financial statements.
F-20
Table of Contents
Silver Point Specialty Lending Fund
Consolidated Schedule of Investments
December 31, 2020
(in U.S. Dollars)
Portfolio Company(1) | Industry | Rate(2) | Interest Rate | Original Acquisition Date | Maturity Date | Par Amount ($) / Shares or Ownership % / Notional ($)(3) | Cost / Amortized Cost(4) | Fair Value | % of Partners’ capital(5) | |||||||||||||||||||||||
Trico Group nka First Brands(8) | Automobiles & Components | L+7.50%, 1.00% Floor | 8.50 | % | 7/23/2020 | 2/2/2024 | $ | 4,937,400 | $ | 4,673,584 | $ | 4,912,713 | 1.05 | % | ||||||||||||||||||
UC Tower Hillside Crossing(6)(7)(8) | Multi-Family | L+9.00%, 0.50% Floor | 9.50 | 9/21/2017 | 5/31/2021 | 17,732,050 | 17,340,111 | 17,376,859 | 3.72 | |||||||||||||||||||||||
Union Crossing Development, LP(6)(7)(8)(23)(28) | Industrial | L+8.25%, 1.96% Floor | 10.21 | 5/23/2018 | 7/3/2020 | 7,246,899 | 7,289,596 | 7,294,197 | 1.56 | |||||||||||||||||||||||
Welldyne Inc(8) | Healthcare Providers & Services | L+5.50%, 1.00% Floor | 6.50 | 2/22/2017 | 8/16/2022 | 16,573,306 | 15,519,931 | 15,993,240 | 3.42 | |||||||||||||||||||||||
|
|
|
|
|
| |||||||||||||||||||||||||||
Total United States of America 1st Lien Term Loan | 615,412,284 | 607,772,323 | 130.02 | |||||||||||||||||||||||||||||
|
|
|
|
|
| |||||||||||||||||||||||||||
United Kingdom | ||||||||||||||||||||||||||||||||
Debenhams PLC(9) | Specialty Retail | L+12.00% | 12.05 | 9/22/2020 | 6/30/2021 | £ | 2,114,975 | 2,699,909 | 2,747,014 | 0.59 | ||||||||||||||||||||||
Debenhams PLC(9) | Specialty Retail | L+12.00% | 12.04 | 9/22/2020 | 6/30/2021 | £ | 2,190,231 | 2,795,962 | 2,844,760 | 0.61 | ||||||||||||||||||||||
|
|
|
|
|
| |||||||||||||||||||||||||||
Total United Kingdom 1st Lien Term Loan | 5,495,871 | 5,591,774 | 1.20 | |||||||||||||||||||||||||||||
|
|
|
|
|
| |||||||||||||||||||||||||||
Luxembourg | ||||||||||||||||||||||||||||||||
Mallinckrodt PLC | Pharmaceuticals & Life Sciences | L+4.75%, 0.75% Floor | 5.50 | 10/13/2020 | 9/24/2024 | 4,984,394 | 4,490,786 | 4,683,162 | 1.00 | |||||||||||||||||||||||
Steenbok Lux Finco 2 SARL(9)(22) | Staples Retail | 7.88% | 7.88 | 10/16/2020 | 12/31/2021 | € | 6,230,584 | 7,255,869 | 7,562,769 | 1.62 | ||||||||||||||||||||||
|
|
|
|
|
| |||||||||||||||||||||||||||
Total Luxembourg 1st Lien Term Loan | 11,746,655 | 12,245,931 | 2.62 | |||||||||||||||||||||||||||||
|
|
|
|
|
| |||||||||||||||||||||||||||
Total 1st Lien Term Loan | 632,654,810 | 625,610,028 | 133.84 | |||||||||||||||||||||||||||||
|
|
|
|
|
| |||||||||||||||||||||||||||
1st Lien Revolver | ||||||||||||||||||||||||||||||||
United States of America | ||||||||||||||||||||||||||||||||
LCP Edge Holdco, LLC(6)(7)(30) | Consumer Services | L+7.75%, 1.00% Floor (0.50% on unfunded) | 0.50 | 8/24/2018 | 8/24/2022 | 4,643,152 | (30,097 | ) | — | — | ||||||||||||||||||||||
LMG Holdings(6)(7)(8) | Manufacturing | P+7.00%, 2.50% Floor (1.00% on unfunded) | 10.25 | 12/24/2019 | 12/24/2024 | 2,307,692 | 977,726 | 978,300 | 0.21 | |||||||||||||||||||||||
Masterwork Electronics, Inc.(6)(7) | Technology Hardware & Equipment | L+8.00%, 1.00% Floor (0.50% on unfunded) | 9.00 | 7/27/2018 | 7/27/2023 | 3,688,500 | 1,799,846 | 1,567,613 | 0.34 | |||||||||||||||||||||||
The accompanying notes are an integral part of these consolidated financial statements.
F-21
Table of Contents
Silver Point Specialty Lending Fund
Consolidated Schedule of Investments
December 31, 2020
(in U.S. Dollars)
Portfolio Company(1) | Industry | Rate(2) | Interest Rate | Original Acquisition Date | Maturity Date | Par Amount ($) / Shares or Ownership % / Notional ($)(3) | Cost / Amortized Cost(4) | Fair Value | % of Partners’ capital(5) | |||||||||||||||||||||||
National Dentex Corp(6)(7) | Healthcare Providers & Services | L+7.00%, 1.00% Floor (0.50% on unfunded) | 8.00 | % | 10/26/2020 | 10/3/2025 | $ | 1,486,897 | $ | 528,953 | $ | 529,071 | 0.11 | % | ||||||||||||||||||
Owens & Minor Inc(6)(9) | Healthcare Equipment & Supplies | P+1.75% (0.25% on unfunded) | 5.00 | 1/27/2020 | 7/27/2022 | 35,000,000 | 89,583 | 542,500 | 0.12 | |||||||||||||||||||||||
Patientpoint LLC(6)(7)(8)(29)(30) | Healthcare Technology | L+7.50%, 1.00% Floor (1.00% on unfunded) | 1.00 | 6/26/2017 | 6/26/2022 | 2,027,250 | (7,702 | ) | (7,331 | ) | (0.00 | ) | ||||||||||||||||||||
Sutherland Global Services Inc(6)(7)(29)(30) | Business Services | L+7.25%, 0.75% Floor (0.75% on unfunded) | 0.75 | 10/23/2020 | 10/23/2025 | 1,332,943 | (25,637 | ) | (25,587 | ) | (0.01 | ) | ||||||||||||||||||||
Thunder Grandparent Inc. (dba Telestream, Inc)(6)(7) | Software & Services | L+8.75%, 0.50% Floor (0.50% on unfunded) | 0.50 | 10/15/2020 | 10/15/2025 | 1,293,103 | (24,757 | ) | (24,855 | ) | (0.01 | ) | ||||||||||||||||||||
|
|
|
|
|
| |||||||||||||||||||||||||||
Total 1st Lien Revolver | 3,307,915 | 3,559,711 | 0.76 | |||||||||||||||||||||||||||||
|
|
|
|
|
| |||||||||||||||||||||||||||
2nd Lien Term Loan | ||||||||||||||||||||||||||||||||
United States of America | ||||||||||||||||||||||||||||||||
Denardo Capital II LLC(6)(7)(13)(25) | Industrial | L+10.00%, 2.40% Floor | 12.40 | 12/28/2018 | 12/31/2020 | 7,582,440 | 7,489,056 | 6,415,080 | 1.37 | |||||||||||||||||||||||
LCP Edge Holdco, LLC(7)(15) | Consumer Services | 15.00% | 15.00 | 4/13/2020 | 8/24/2023 | 812,968 | 812,968 | 812,950 | 0.17 | |||||||||||||||||||||||
Project 19 Highline LLC(7)(25)(26) | Multi-Family | L+11.50%, 1.50% Floor | 13.00 | 2/20/2018 | 8/20/2019 | 8,309,449 | 8,309,449 | 7,044,902 | 1.51 | |||||||||||||||||||||||
|
|
|
|
|
| |||||||||||||||||||||||||||
Total 2nd Lien Term Loan | 16,611,473 | 14,272,932 | 3.05 | |||||||||||||||||||||||||||||
|
|
|
|
|
| |||||||||||||||||||||||||||
Mezzanine | ||||||||||||||||||||||||||||||||
United States of America | ||||||||||||||||||||||||||||||||
Denardo Capital II LLC(7)(13)(25) | Industrial | L+10.00%, 2.40% Floor | 12.40 | 12/28/2018 | 12/31/2020 | 947,805 | 947,815 | 813,568 | 0.17 | |||||||||||||||||||||||
NY / Texas Mixed-Use Portfolio 1(7)(9)(16)(27) | Multi-Family | 13.00% | 13.00 | 3/11/2019 | 7/10/2021 | 7,655,033 | 7,640,957 | 7,565,482 | 1.62 | |||||||||||||||||||||||
NY / Texas Mixed-Use Portfolio 2(7)(9)(17)(27) | Multi-Family | 12.64% | 12.64 | 6/27/2019 | 7/10/2021 | 5,193,163 | 5,176,511 | 5,142,705 | 1.10 | |||||||||||||||||||||||
Project 19 Highline LLC(7)(25)(26) | Multi-Family | L+11.50%, 1.50% Floor | 13.00 | 2/20/2018 | 8/20/2019 | 2,800,000 | 2,800,000 | 2,373,891 | 0.51 | |||||||||||||||||||||||
|
|
|
|
|
| |||||||||||||||||||||||||||
Total Mezzanine | 16,565,283 | 15,895,646 | 3.40 | |||||||||||||||||||||||||||||
|
|
|
|
|
| |||||||||||||||||||||||||||
3rd Lien Term Loan | ||||||||||||||||||||||||||||||||
United States of America | ||||||||||||||||||||||||||||||||
Branford Place Medical Specialists, LLC(7)(15)(25) | Healthcare Providers & Services | 15.00% | 15.00 | 1/6/2020 | 7/3/2020 | 1,719,037 | 1,719,037 | 934,094 | 0.20 | |||||||||||||||||||||||
The accompanying notes are an integral part of these consolidated financial statements.
F-22
Table of Contents
Silver Point Specialty Lending Fund
Consolidated Schedule of Investments
December 31, 2020
(in U.S. Dollars)
Portfolio Company(1) | Industry | Rate(2) | Interest Rate | Original Acquisition Date | Maturity Date | Par Amount ($) / Shares or Ownership % / Notional ($)(3) | Cost / Amortized Cost(4) | Fair Value | % of Partners’ capital(5) | |||||||||||||||||||||||
Project 19 Highline LLC(7)(25)(26) | Multi-Family | L+11.50%, 1.50% Floor | 13.00 | % | 2/20/2018 | 8/20/2019 | $ | 2,586,661 | $ | 2,586,662 | $ | 2,193,019 | 0.47 | % | ||||||||||||||||||
|
|
|
|
|
| |||||||||||||||||||||||||||
Total 3rd Lien Term Loan | 4,305,699 | 3,127,113 | 0.67 | |||||||||||||||||||||||||||||
|
|
|
|
|
| |||||||||||||||||||||||||||
Total Secured Loans | 673,445,180 | 662,465,430 | 141.72 | |||||||||||||||||||||||||||||
|
|
|
|
|
| |||||||||||||||||||||||||||
Secured Bonds | ||||||||||||||||||||||||||||||||
Senior Secured Bonds | ||||||||||||||||||||||||||||||||
United States of America | ||||||||||||||||||||||||||||||||
Cooper-Standard Holding, Inc(8) | Automobiles & Components | 13.00% | 13.00 | 5/21/2020 | 6/1/2024 | 9,614,000 | 9,444,557 | 11,203,314 | 2.40 | |||||||||||||||||||||||
Incora (aka Wolverine Escrow LLC)(31) | Industrial Products & Services | 8.50% | 8.50 | 10/15/2020 | 11/15/2024 | 6,389,000 | 5,338,037 | 6,095,298 | 1.30 | |||||||||||||||||||||||
Incora (aka Wolverine Escrow LLC)(31) | Industrial Products & Services | 9.00% | 9.00 | 10/15/2020 | 11/15/2026 | 1,934,000 | 1,576,034 | 1,824,584 | 0.39 | |||||||||||||||||||||||
|
|
|
|
|
| |||||||||||||||||||||||||||
Total United States of America Senior Secured Bonds | 16,358,628 | 19,123,196 | 4.09 | |||||||||||||||||||||||||||||
|
|
|
|
|
| |||||||||||||||||||||||||||
Japan | ||||||||||||||||||||||||||||||||
Universal Entertainment Corp(8)(9) | Gaming & Leisure | 8.50% | 8.50 | 10/29/2020 | 12/11/2024 | 35,000,000 | 36,218,780 | 37,100,000 | 7.94 | |||||||||||||||||||||||
|
|
|
|
|
| |||||||||||||||||||||||||||
Total Japan Senior Secured Bonds | 36,218,780 | 37,100,000 | 7.94 | |||||||||||||||||||||||||||||
|
|
|
|
|
| |||||||||||||||||||||||||||
Luxembourg | ||||||||||||||||||||||||||||||||
Takko Fashion GmbH(9) | Specialty Retail | 5.38% | 5.38 | 9/14/2020 | 11/15/2023 | € | 5,266,000 | 5,017,209 | 5,779,400 | 1.24 | ||||||||||||||||||||||
Takko Fashion GmbH(9)(31) | Specialty Retail | E+5.38%, 0.00% Floor | 5.38 | 9/16/2020 | 11/15/2023 | € | 3,529,000 | 3,338,748 | 3,839,747 | 0.82 | ||||||||||||||||||||||
|
|
|
|
|
| |||||||||||||||||||||||||||
Total Luxembourg Senior Secured Bonds | 8,355,957 | 9,619,147 | 2.06 | |||||||||||||||||||||||||||||
|
|
|
|
|
| |||||||||||||||||||||||||||
Netherlands | ||||||||||||||||||||||||||||||||
Promontoria Holding(9)(31) | Airline & Airport Services | 6.75% | 6.75 | 10/16/2020 | 8/15/2023 | € | 2,913,000 | 2,948,656 | 3,277,865 | 0.70 | ||||||||||||||||||||||
Promontoria Holding(9) | Airline & Airport Services | E+6.25%, 0.00% Floor | 6.25 | 11/12/2020 | 8/15/2023 | € | 100,000 | 103,518 | 111,908 | 0.02 | ||||||||||||||||||||||
|
|
|
|
|
| |||||||||||||||||||||||||||
Total Netherlands Senior Secured Bonds | 3,052,174 | 3,389,773 | 0.72 | |||||||||||||||||||||||||||||
|
|
|
|
|
| |||||||||||||||||||||||||||
Total Senior Secured Bonds | 63,985,539 | 69,232,116 | 14.81 | |||||||||||||||||||||||||||||
|
|
|
|
|
| |||||||||||||||||||||||||||
The accompanying notes are an integral part of these consolidated financial statements.
F-23
Table of Contents
Silver Point Specialty Lending Fund
Consolidated Schedule of Investments
December 31, 2020
(in U.S. Dollars)
Portfolio Company(1) | Industry | Rate(2) | Interest Rate | Original Acquisition Date | Maturity Date | Par Amount ($) / Shares or Ownership % / Notional ($)(3) | Cost / Amortized Cost(4) | Fair Value | % of Partners’ capital(5) | |||||||||||||||||||||||||
Subordinated Secured Bonds | ||||||||||||||||||||||||||||||||||
United States of America | ||||||||||||||||||||||||||||||||||
Tops MBO Corp | Staples Retail | 13.00% | 13.00 | % | 12/18/2020 | 11/19/2024 | $ | 609,681 | $ | 580,991 | $ | 606,633 | 0.13 | % | ||||||||||||||||||||
Triumph Group Inc(9)(31) | | Aerospace & Defense | | 6.25% | 6.25 | 10/27/2020 | 9/15/2024 | 4,184,000 | 3,679,886 | 4,140,417 | 0.89 | |||||||||||||||||||||||
|
|
|
|
|
| |||||||||||||||||||||||||||||
Total United States of America Subordinated Secured Bonds | 4,260,877 | 4,747,050 | 1.02 | |||||||||||||||||||||||||||||||
|
|
|
|
|
| |||||||||||||||||||||||||||||
Total Secured Bonds | 68,246,416 | 73,979,166 | 15.83 | |||||||||||||||||||||||||||||||
|
|
|
|
|
| |||||||||||||||||||||||||||||
Equities | ||||||||||||||||||||||||||||||||||
Common Equities | ||||||||||||||||||||||||||||||||||
United States of America | ||||||||||||||||||||||||||||||||||
4501 Woodhaven Holding LLC(7)(26) | | Multi- Purpose Building | N/A | N/A | 7/18/2018 | N/A | 20 | % | 880,743 | 1,085,401 | 0.23 | |||||||||||||||||||||||
Gadsden Development Company I, LLC(7)(26) | Multi-Family | N/A | N/A | 8/10/2016 | N/A | 312 | — | 1,768,226 | 0.38 | |||||||||||||||||||||||||
Impala RGIS Holdings LLC(7)(26) | | Business Services | | N/A | N/A | 6/25/2020 | N/A | 407,065 | 3,077,411 | 5,902,443 | 1.26 | |||||||||||||||||||||||
LCP Edge Holdco, LLC(7)(26) | | Consumer Services | | N/A | N/A | 8/24/2018 | N/A | 1,148 | 114,754 | 7,212,295 | 1.54 | |||||||||||||||||||||||
Welsh Acquisition LLC(7) | Industrial | N/A | N/A | 12/6/2017 | N/A | 20 | % | — | 241,754 | 0.05 | ||||||||||||||||||||||||
|
|
|
|
|
| |||||||||||||||||||||||||||||
Total Common Equities | 4,072,908 | 16,210,119 | 3.46 | |||||||||||||||||||||||||||||||
|
|
|
|
|
| |||||||||||||||||||||||||||||
Preferred Equities | ||||||||||||||||||||||||||||||||||
United States of America | ||||||||||||||||||||||||||||||||||
Gadsden Development Company I, LLC(7)(26) | Multi-Family | N/A | N/A | 8/10/2016 | N/A | 89 | — | — | — | |||||||||||||||||||||||||
LCP Edge Holdco, LLC(7)(16)(26) | | Consumer Services | | N/A | N/A | 8/24/2018 | N/A | 22 | 82,609 | 235,492 | 0.05 | |||||||||||||||||||||||
|
|
|
|
|
| |||||||||||||||||||||||||||||
Total Preferred Equities | 82,609 | 235,492 | 0.05 | |||||||||||||||||||||||||||||||
|
|
|
|
|
| |||||||||||||||||||||||||||||
Total Equities | 4,155,517 | 16,445,611 | 3.51 | |||||||||||||||||||||||||||||||
|
|
|
|
|
| |||||||||||||||||||||||||||||
Total Non-Controlled/Non-Affiliated Investments | $ | 745,847,113 | $ | 752,890,207 | 161.06 | % | ||||||||||||||||||||||||||||
|
|
|
|
|
| |||||||||||||||||||||||||||||
The accompanying notes are an integral part of these consolidated financial statements.
F-24
Table of Contents
Silver Point Specialty Lending Fund
Consolidated Schedule of Investments
December 31, 2020
(in U.S. Dollars)
Portfolio Company(1) | Industry | Rate(2) | Interest Rate | Original Acquisition Date | Maturity Date | Par Amount ($) / Shares or Ownership % / Notional ($)(3) | Cost / Amortized Cost(4) | Fair Value | % of Partners’ capital(5) | |||||||||||||||||||||||||
Controlled Investments(32) | ||||||||||||||||||||||||||||||||||
Equities | ||||||||||||||||||||||||||||||||||
Common Equities | ||||||||||||||||||||||||||||||||||
United States of America | ||||||||||||||||||||||||||||||||||
SP Harvest Mill, LLC(7)(9) | | Single Family | | N/A | N/A | 7/1/2015 | N/A | 1,286,000 | $ | — | $ | — | — | % | ||||||||||||||||||||
|
|
|
|
|
| |||||||||||||||||||||||||||||
Total Equities | — | — | — | |||||||||||||||||||||||||||||||
|
|
|
|
|
| |||||||||||||||||||||||||||||
Trust Interest | ||||||||||||||||||||||||||||||||||
United States of America | ||||||||||||||||||||||||||||||||||
TH Liquidating Trust(6)(7)(26) | Other | N/A | N/A | 10/9/2020 | 12/6/2024 | 14 | % | — | — | — | ||||||||||||||||||||||||
TH Liquidating Trust(7)(14)(25)(26) | Other | L+10.50% | 11.00 | 12/7/2019 | 12/6/2024 | 280,000 | 280,000 | 275,744 | 0.06 | |||||||||||||||||||||||||
TH Liquidating Trust(7)(26) | Other | N/A | N/A | 12/7/2019 | 12/6/2024 | 14 | % | 3,153,474 | 2,622,900 | 0.56 | ||||||||||||||||||||||||
|
|
|
|
|
| |||||||||||||||||||||||||||||
Total Trust Interest | 3,433,474 | 2,898,644 | 0.62 | |||||||||||||||||||||||||||||||
|
|
|
|
|
| |||||||||||||||||||||||||||||
Total Controlled Investments | $ | 3,433,474 | $ | 2,898,644 | 0.62 | % | ||||||||||||||||||||||||||||
|
|
|
|
|
| |||||||||||||||||||||||||||||
Total Investments, December 31, 2020 | $ | 749,280,587 | $ | 755,788,851 | 161.68 | % | ||||||||||||||||||||||||||||
|
|
|
|
|
| |||||||||||||||||||||||||||||
Derivative contracts | ||||||||||||||||||||||||||||||||||
Interest Rate Cap | ||||||||||||||||||||||||||||||||||
Interest Rate Cap 3mLibor, 4.5%(8)(9)(26) | 5/16/2018 | 5/18/2021 | 100,000,000 | 90,000 | — | — | ||||||||||||||||||||||||||||
|
|
|
|
|
| |||||||||||||||||||||||||||||
Total Interest Rate Cap, December 31, 2020 | 90,000 | — | — | |||||||||||||||||||||||||||||||
|
|
|
|
|
| |||||||||||||||||||||||||||||
Total Return Swaps | ||||||||||||||||||||||||||||||||||
Steenbok Lux Finco 2 SARL(9) | E+1.50%, 0.00% Floor | 1.50 | % | 7/13/2020 | 1/8/2021 | € | 4,681,446 | — | 225,144 | 0.05 | ||||||||||||||||||||||||
Steenbok Lux Finco 2 SARL(9) | E+1.50%, 0.00% Floor | 1.50 | % | 9/29/2020 | 3/26/2021 | € | 2,080,500 | — | 94,554 | 0.02 | ||||||||||||||||||||||||
Steenbok Lux Finco 2 SARL(9) | E+1.50%, 0.00% Floor | 1.50 | % | 10/1/2020 | 3/30/2021 | € | 2,600,625 | — | 108,383 | 0.02 | ||||||||||||||||||||||||
|
|
|
|
|
| |||||||||||||||||||||||||||||
Total Total Return Swaps, December 31, 2020 | — | 428,081 | 0.09 | |||||||||||||||||||||||||||||||
|
|
|
|
|
| |||||||||||||||||||||||||||||
Total Derivative Contracts, December 31, 2020 | $ | 90,000 | $ | 428,081 | 0.09 | % | ||||||||||||||||||||||||||||
|
|
|
|
|
| |||||||||||||||||||||||||||||
The accompanying notes are an integral part of these consolidated financial statements.
F-25
Table of Contents
Silver Point Specialty Lending Fund
Consolidated Schedule of Investments
December 31, 2020
(in U.S. Dollars)
| (1) | All of our investments are issued by eligible portfolio companies, as defined in the Investment Company Act of 1940 (the “1940 Act”), unless otherwise noted. |
| (2) | The majority of the investments bear interest at a rate that may be determined by reference to London Interbank Offered Rate (“LIBOR” or “L”) or Prime Rate (“Prime” or “P”) which reset monthly or quarterly. For each such investment, the Fund has provided the spread over LIBOR or Prime and the current contractual interest rate in effect at December 31, 2020. Certain investments are subject to a LIBOR or Prime interest rate floor or cap. As of December 31, 2020, rates for 1M L, 3M L and Prime are 0.14%, 0.24% and 3.25%, respectively. LIBOR represents the average interest rate that leading banks in London estimate they would charge for lending to other banks, the Euro Interbank Offered Rate, known as EURIBOR (“EURIBOR” or “E”), is a similar reference rate derived from banks across the Eurozone. As of December 31, 2020, rates for 1M E and 3M E are (0.57) % and (0.55) %, respectively. |
| (3) | Par amount includes unfunded commitments, accumulated payment-in-kind (“PIK”) interest and is net of repayments. Equity investments are recorded as number of shares owned or ownership percentage. Derivative contracts reflect notional value. |
| (4) | Cost represents amortized cost for debt investments less payments, plus capitalized PIK if any. As of December 31, 2020, the aggregate gross unrealized appreciation for all investments in which there was an excess of fair value over tax cost was $23.9 million; the aggregate gross unrealized depreciation for all investments in which there was an excess of tax cost over fair value was $24.8 million; the net unrealized depreciation was $0.9 million; the aggregate tax cost of securities for Federal income tax purposes was $757.1 million. |
| (5) | Percentage is based on partners’ capital of $467,498,084 as of December 31, 2020. |
| (6) | The investment has an unfunded commitment as of December 31, 2020 (see Note 11 in the accompanying notes to the consolidated financial statements). |
| (7) | Fair value was determined using significant unobservable inputs (see Note 6 in the accompanying notes to the consolidated financial statements). |
| (8) | Some or all of these investments are pledged as collateral to the Revolving Credit Facility (see Note 7 in the accompanying notes to the consolidated financial statements). |
| (9) | These investments are treated as non-qualifying investments under Section 55(a) of the 1940 Act. Under the 1940 Act, the Fund may not acquire any non-qualifying asset unless, at the time the acquisition is made, qualifying assets represent at least 70% of the Fund’s total assets. As of December 31, 2020, qualifying assets totaled 87.12% of the Fund’s total assets. |
| (10) | The underlying credit agreement or indenture contains a PIK provision, whereby the issuer has either the option or the obligation to make a portion of the interest payments with the issuance of additional investments. The PIK portion of the coupon is 0.79%. |
| (11) | The underlying credit agreement or indenture contains a PIK provision, whereby the issuer has either the option or the obligation to make a portion of the interest payments with the issuance of additional investments. The PIK portion of the coupon is 2.75%. |
| (12) | The underlying credit agreement or indenture contains a PIK provision, whereby the issuer has either the option or the obligation to make a portion of the interest payments with the issuance of additional investments. The PIK portion of the coupon is 2.67%. |
| (13) | The underlying credit agreement or indenture contains a PIK provision, whereby the issuer has either the option or the obligation to make a portion of the interest payments with the issuance of additional investments. The PIK portion of the coupon is 3.40%. |
| (14) | The underlying credit agreement or indenture contains a PIK provision, whereby the issuer has either the option or the obligation to make a portion of the interest payments with the issuance of additional investments. The PIK portion of the coupon is 2.00%. |
| (15) | The underlying credit agreement or indenture contains a PIK provision, whereby the issuer has either the option or the obligation to make a portion of the interest payments with the issuance of additional investments. The PIK portion of the coupon is 15.00%. |
| (16) | The underlying credit agreement or indenture contains a PIK provision, whereby the issuer has either the option or the obligation to make a portion of the interest payments with the issuance of additional investments. The PIK portion of the coupon is 10.85%. |
| (17) | The underlying credit agreement or indenture contains a PIK provision, whereby the issuer has either the option or the obligation to make a portion of the interest payments with the issuance of additional investments. The PIK portion of the coupon is 10.89%. |
| (18) | The underlying credit agreement or indenture contains a PIK provision, whereby the issuer has either the option or the obligation to make a portion of the interest payments with the issuance of additional investments. The PIK portion of the coupon is 0.50%. |
| (19) | The underlying credit agreement or indenture contains a PIK provision, whereby the issuer has either the option or the obligation to make a portion of the interest payments with the issuance of additional investments. The PIK portion of the coupon is 8.50%. |
The accompanying notes are an integral part of these consolidated financial statements.
F-26
Table of Contents
Silver Point Specialty Lending Fund
Consolidated Schedule of Investments
December 31, 2020
(in U.S. Dollars)
| (20) | The underlying credit agreement or indenture contains a PIK provision, whereby the issuer has either the option or the obligation to make a portion of the interest payments with the issuance of additional investments. The PIK portion of the coupon is 1.50%. |
| (21) | The underlying credit agreement or indenture contains a PIK provision, whereby the issuer has either the option or the obligation to make a portion of the interest payments with the issuance of additional investments. The PIK portion of the coupon is 4.50%. |
| (22) | The underlying credit agreement or indenture contains a PIK provision, whereby the issuer has either the option or the obligation to make a portion of the interest payments with the issuance of additional investments. The PIK portion of the coupon is 7.88%. |
| (23) | The underlying credit agreement or indenture contains a PIK provision, whereby the issuer has either the option or the obligation to make a portion of the interest payments with the issuance of additional investments. The PIK portion of the coupon is L+8.13%, 1.96% Floor. |
| (24) | The underlying credit agreement or indenture contains a PIK provision, whereby the issuer has either the option or the obligation to make a portion of the interest payments with the issuance of additional investments. The PIK portion of the coupon is L+7.70%, 1.96% Floor. |
| (25) | These investments, representing 9.27% of cost and 8.09% of fair value, respectively, were on non-accrual status as of December 31, 2020, meaning that the Fund has ceased accruing interest income on these investments and they are past maturity. See Note 2 in the accompanying notes to the consolidated financial statements for additional information on the Fund’s accounting policies. |
| (26) | Represents a non-income producing investment. |
| (27) | Borrowers under the consolidated loans include Zaidys LLC, Zaidys Manhattanville LLC, Zaidys Stone Ranch Managing Member LLC, Zaidys Indigo Managing Member LLC and others which hold interests in 44 properties across Arizona, New York, New Jersey, Ohio, Texas, and Florida. |
| (28) | Investment is in default but still accruing interest. Interest payments are past due however, there is reasonable certainty that interest will be collected. |
| (29) | The negative fair value is the result of the original discount on the loan. |
| (30) | The negative amortized cost is the result of the original discount being greater than the principal amount outstanding on the loan. |
| (31) | Some or all of these investments are pledged as collateral under reverse repurchase agreements (see Note 3 in the accompanying notes to the consolidated financial statements). |
| (32) | Controlled Investments are defined by the 1940 Act, as investments in companies in which the Fund owns more than 25% of the voting securities or maintains greater than 50% of the board representation. Transactions during the period ended December 31, 2020 with these controlled investments were as follows: |
Portfolio Company | Type of Investment | Fair Value at December 31, 2019 | Gross Additions | Gross Reductions* | Net change in unrealized appreciation (depreciation) | Net realized gains (losses) | Fair Value at December 31, 2020 | Interest income | Dividend income | Par Amount ($) / Number Of Units/ Ownership % | ||||||||||||||||||||||||||||||
Arlington Park | Real Estate Properties | $ | 1,966,998 | $ | — | $ | (1,744,860 | ) | $ | 442,111 | $ | (664,249 | ) | $ | — | $ | — | $ | — | — | ||||||||||||||||||||
Campbellton Road | Real Estate Properties | — | — | (9,915 | ) | — | 9,915 | — | — | — | — | |||||||||||||||||||||||||||||
Virginia Manor | Real Estate Properties | 1,162,198 | — | (1,014,535 | ) | 283,868 | (431,531 | ) | — | — | — | — | ||||||||||||||||||||||||||||
TH Liquidating Trust | Trust Interest | — | — | — | — | — | — | — | — | 14 | % | |||||||||||||||||||||||||||||
TH Liquidating Trust | Trust Interest | 275,800 | — | — | (56 | ) | — | 275,744 | — | — | 280,000 | |||||||||||||||||||||||||||||
TH Liquidating Trust | Trust Interest | 2,902,900 | — | — | (280,000 | ) | — | 2,622,900 | — | — | 14 | % | ||||||||||||||||||||||||||||
SP Harvest Mill, LLC | Equities | 449,071 | — | — | (449,071 | ) | — | — | — | 578,424 | 1,286,000 | |||||||||||||||||||||||||||||
|
|
|
|
|
|
|
|
|
|
|
|
|
|
|
| |||||||||||||||||||||||||
Total | $ | 6,756,967 | $ | — | $ | (2,769,310 | ) | $ | (3,148 | ) | $ | (1,085,865 | ) | $ | 2,898,644 | $ | — | $ | 578,424 | |||||||||||||||||||||
|
|
|
|
|
|
|
|
|
|
|
|
|
|
|
| |||||||||||||||||||||||||
| * | Gross reductions include decreases in the cost basis of investments resulting from principal collections related to investments repayments and sales. |
The accompanying notes are an integral part of these consolidated financial statements.
F-27
Table of Contents
Silver Point Specialty Lending Fund
Consolidated Schedule of Investments
December 31, 2020
(in U.S. Dollars)
Additional Information
Derivative Counterparty | Settlement Date | Amount Purchased | Amount Sold | Fair Value | % of Partners’ capital(1) | |||||||||||||||
Foreign Currency Forward Contracts |
| |||||||||||||||||||
JPMorgan Chase Bank | 3/31/2021 | $ | (544,103 | ) | € | (447,271 | ) | $ | (3,359 | ) | (0.00 | )% | ||||||||
JPMorgan Chase Bank | 3/31/2021 | $ | (13,430,909 | ) | € | (10,998,349 | ) | (31,145 | ) | (0.00 | ) | |||||||||
|
|
|
| |||||||||||||||||
| $ | (34,504 | ) | (0.00 | )% | ||||||||||||||||
|
|
|
| |||||||||||||||||
| (1) | Percentage is based on partners’ capital of $467,498,084 as of December 31, 2020. |
The accompanying notes are an integral part of these consolidated financial statements.
F-28
Table of Contents
Silver Point Specialty Lending Fund
Notes to Consolidated Financial Statements
(in U.S. Dollars)
1. Organization and Business
Silver Point Specialty Lending Fund, a statutory trust organized under the laws of the state of Maryland (the “Fund”), was formed on November 15, 2021 (the “Conversion Date”). The Fund’s predecessor entity was originally formed as a Delaware limited liability company under the name SPCP Group VII, LLC on July 31, 2014. On April 1, 2015, the Fund was converted to a Delaware limited partnership under the name Silver Point Specialty Credit Fund, L.P. and entered into the initial limited partnership agreement. On July 1, 2015, additional limited partners were admitted to the Fund (the “Initial Closing” or the “Initial Closing Date”) and subsequent closings occurred on various dates until the final closing on December 29, 2016. On the Conversion Date, Silver Point Specialty Credit Fund, L.P. transferred all of its assets and liabilities to the Fund and converted to a Maryland statutory trust (the “Conversion”) in connection with the Fund’s intention to be treated as a Business Development Company (“BDC”) under the Investment Company of 1940 (the “1940 Act”), as amended. Prior to the Conversion, owners of beneficial interest in the Fund are collectively referred to herein as the “Limited Partners” and together with the general partner as the “Partners”, and following the Conversion, the owners of beneficial interest in the Fund are collectively referred to herein as the “Shareholders”, and together the Partners and the Shareholders are referred to herein as the “Investors”.
On December 30, 2021, the Fund elected to be treated as a BDC, and if market conditions permit, expects (i) to conduct an initial public offering (an “IPO”) and (ii) to be treated as a regulated investment company for U.S. federal income tax purposes.
Prior to the Conversion Date, Silver Point Specialty Credit Fund GP, LLC, a Delaware limited liability company, served as the general partner (the “General Partner”) of the Fund. Following the Conversion Date, the business and affairs of the Fund are managed exclusively by or under the direction of the board of trustees (the “Board”). Silver Point Specialty Credit Fund Management, LLC, a Delaware limited liability company, serves as the Fund’s adviser (the “Adviser”) and is registered with the U.S. Securities and Exchange Commission (the “SEC”) as an investment adviser. The Adviser provides certain management and administrative services to the Fund and is an affiliate of the General Partner. All references to the General Partner herein shall, where applicable, be inclusive of the General Partner or its designee, which includes but is not limited to the Adviser.
The Fund’s investment objective is to achieve stable income generation with attractive risk-adjusted returns primarily in U.S. middle market lending opportunities and specialty asset based financings and secondary purchases of loans and other credit-related assets. It is anticipated that the majority of the loans will be secured, floating rate investments. In seeking to achieve its investment objective, the Fund may invest across a broad range of asset classes, instruments and industries as the Board deems appropriate and may make investments in companies and issuers domiciled outside of the United States.
In the event that the Fund has not conducted an IPO by July 1, 2022 (the “IPO Outside Date”), subject to a nine month extension, then commencing on such date, the Fund will use its best efforts to wind down, liquidate and dissolve; provided that the IPO Outside Date may be extended by the Adviser for an additional nine month period if (i) the Fund has filed an IPO registration statement with the SEC and (ii) the Adviser reasonably expects such registration statement to be effective within nine months of the seventh anniversary of the Initial Closing Date. Following an IPO, the Fund’s existence will continue unless and until the Board determines to wind up the Fund.
2. Summary of Significant Accounting Policies
Basis of Presentation
The accompanying consolidated financial statements have been prepared in accordance with generally accepted accounting principles in the United States of America (“U.S. GAAP”), are presented in U.S. dollars and include the
F-29
Table of Contents
Silver Point Specialty Lending Fund
Notes to Consolidated Financial Statements (continued)
(in U.S. Dollars)
accounts of the Fund and its wholly owned subsidiaries. All material intercompany balances and transactions have been eliminated. All references to the Fund include the accounts of its consolidated subsidiaries. Additionally, the accompanying audited consolidated financial statements of the Fund and related financial information have been prepared pursuant to the requirements of Article 6 of Regulation S-X of the Securities Act of 1933.
The Fund qualifies as an investment company under the provisions outlined in Accounting Standards Codification 946, Financial Services — Investment Companies.
Basis of Consolidation
The Fund generally consolidates any wholly, or substantially, owned subsidiary when the design and purpose of the subsidiary is to act as an extension of the Fund’s investment operations and to facilitate the execution of the Fund’s investment strategy. Accordingly, the Fund has consolidated the results of its subsidiaries Silver Point SCF CLO I, Ltd., Specialty Credit Facility, LLC, Specialty Credit Holdings, LLC, Specialty Credit Fund Cayman, Ltd., Silver Point Specialty Credit Depositor, LLC, SCF West, LLC, SCF APEG Holdings, LLC and SCF Union Crossing Holdings, LLC in its consolidated financial statements. All intercompany transactions and balances have been eliminated in consolidation. Since the Fund is an investment company, portfolio investments held by the Fund are not consolidated into the consolidated financial statements. The portfolio investments held by the Fund (including its investments held by consolidated subsidiaries) are included on the consolidated statements of assets and liabilities as investments at fair value.
Use of Estimates
The preparation of consolidated financial statements in accordance with U.S. GAAP requires management to make estimates and assumptions that affect the fair value of investments, the reported amounts of assets and liabilities, the disclosure of contingent assets and liabilities at the date of the consolidated financial statements, and the reported amounts of income and expenses during the reporting period. Actual results could differ from those estimates and such differences could be material.
The fair values of the Fund’s assets and liabilities that qualify as financial instruments under U.S. GAAP approximate the carrying amounts presented in the consolidated financial statements.
Reclassifications
Certain prior period amounts may be reclassified to conform to the current presentation with no effect on our financial condition, results of operations or cash flows.
Investment Classification
The Fund operates as a non-diversified company within the meaning of the 1940 Act. However, the Fund’s investment portfolio may, from time to time, meet the diversification standards of a diversified company within the meaning of the 1940 Act. As required by the 1940 Act, the Fund classifies its investments by level of control. As defined in the 1940 Act, “Control Investments” are those where there is the ability or power to exercise a controlling influence over the management or policies of a company. Control is generally deemed to exist when a company or individual possesses or has the right to acquire within 60 days or less, a beneficial ownership of more than 25% of the voting securities of an investee company. Under the 1940 Act, “Affiliate Investments” are defined by a lesser degree of influence and are deemed to exist through the possession outright or via the right to acquire within 60 days or less, beneficial ownership of 5% or more of the outstanding voting securities of another person. “Non-Control/Non-Affiliate Investments” are those that are neither Control Investments nor Affiliate Investments.
F-30
Table of Contents
Silver Point Specialty Lending Fund
Notes to Consolidated Financial Statements (continued)
(in U.S. Dollars)
The following table presents the composition of the investment portfolio by industry classifications at amortized cost and fair value as of December 31, 2021 and December 31, 2020 with corresponding percentages of total fair value:
| December 31, 2021 | December 31, 2020 | |||||||||||||||||||||||
Industry Classification | Cost / Amortized Cost | Fair Value | % of Fair Value | Cost / Amortized Cost | Fair Value | % of Fair Value | ||||||||||||||||||
Aerospace & Defense | $ | 51,405,168 | $ | 50,267,298 | 5.28 | % | $ | 52,845,463 | $ | 53,274,724 | 7.05 | % | ||||||||||||
Airline & Airport Services | 46,426,969 | 46,279,074 | 4.87 | 3,052,174 | 3,389,773 | 0.45 | ||||||||||||||||||
Automobiles & Components | 33,749,773 | 34,063,642 | 3.58 | 18,315,512 | 20,626,083 | 2.73 | ||||||||||||||||||
Business Services | 78,848,641 | 88,096,223 | 9.26 | 30,141,741 | 32,466,758 | 4.30 | ||||||||||||||||||
Consumer Apparel | 11,643,256 | 11,626,875 | 1.22 | — | — | — | ||||||||||||||||||
Consumer Brands | 24,187,798 | 24,161,076 | 2.54 | 2,717,388 | 2,073,110 | 0.27 | ||||||||||||||||||
Consumer Products | 25,874,572 | 25,980,311 | 2.73 | 26,075,180 | 26,172,540 | 3.46 | ||||||||||||||||||
Consumer Services | — | 12,657,607 | 1.33 | 58,139,683 | 65,815,622 | 8.71 | ||||||||||||||||||
E-Commerce | 36,144,352 | 32,697,718 | 3.44 | 13,809,528 | 12,828,993 | 1.70 | ||||||||||||||||||
Energy | — | — | — | 4,374,398 | 4,068,070 | 0.54 | ||||||||||||||||||
Financial Services | — | — | — | 19,974,538 | 19,975,423 | 2.64 | ||||||||||||||||||
Food Products | 16,781,227 | 17,036,704 | 1.79 | — | — | — | ||||||||||||||||||
Gaming & Leisure | 38,576,337 | 39,279,686 | 4.13 | 36,218,780 | 37,100,000 | 4.91 | ||||||||||||||||||
Healthcare Equipment & Supplies | 6,483,384 | 6,483,384 | 0.68 | 89,583 | 542,500 | 0.07 | ||||||||||||||||||
Healthcare Providers & Services | 70,868,648 | 71,023,909 | 7.47 | 44,522,468 | 44,184,479 | 5.85 | ||||||||||||||||||
Healthcare Technology | — | — | — | 36,354,492 | 36,365,832 | 4.81 | ||||||||||||||||||
Industrial | 9,537,532 | 9,628,617 | 1.01 | 25,224,005 | 22,917,715 | 3.03 | ||||||||||||||||||
Industrial Products & Services | 26,186,544 | 27,144,026 | 2.85 | 63,162,916 | 64,633,724 | 8.55 | ||||||||||||||||||
Manufacturing | 12,202,960 | 12,175,867 | 1.28 | 29,186,652 | 29,194,264 | 3.86 | ||||||||||||||||||
Media: Advertising | 15,078,498 | 15,691,364 | 1.65 | 13,499,018 | 13,071,048 | 1.73 | ||||||||||||||||||
Multi-Family | 59,122,583 | 60,184,425 | 6.33 | 87,871,190 | 84,701,164 | 11.21 | ||||||||||||||||||
Multi-Purpose Building | — | — | — | 7,073,049 | 7,299,467 | 0.97 | ||||||||||||||||||
Other | 3,507,345 | 2,926,858 | 0.31 | 3,433,474 | 2,898,644 | 0.38 | ||||||||||||||||||
Paper & Packaging | 24,709,806 | 24,872,267 | 2.61 | 29,107,051 | 29,134,590 | 3.86 | ||||||||||||||||||
Pharmaceuticals & Life Sciences | 67,744,506 | 68,173,717 | 7.17 | 4,490,786 | 4,683,162 | 0.62 | ||||||||||||||||||
Power Generation | 25,134,593 | 26,540,445 | 2.79 | — | — | — | ||||||||||||||||||
Professional Services | 34,734,373 | 34,780,924 | 3.66 | 9,570,273 | 9,547,213 | 1.26 | ||||||||||||||||||
Real Estate Development & Management | 25,680,350 | 25,690,328 | 2.70 | 22,449,489 | 22,297,741 | 2.95 | ||||||||||||||||||
Restaurants | 4,892,330 | 4,852,089 | 0.51 | — | — | — | ||||||||||||||||||
Single Family | — | — | — | — | — | — | ||||||||||||||||||
Software & Services | 20,304,479 | 20,609,241 | 2.17 | 13,415,770 | 13,418,581 | 1.78 | ||||||||||||||||||
Specialty Chemicals | 6,257,368 | 6,368,375 | 0.67 | — | — | — | ||||||||||||||||||
Specialty Retail | 24,841,261 | 25,195,457 | 2.65 | 27,258,078 | 29,029,671 | 3.84 | ||||||||||||||||||
Staples Retail | 48,187,430 | 47,691,475 | 5.01 | 8,498,934 | 8,879,947 | 1.17 | ||||||||||||||||||
Technology | 22,704,834 | 23,121,031 | 2.43 | — | — | — | ||||||||||||||||||
Technology Hardware & Equipment | 41,428,153 | 40,849,217 | 4.30 | 41,670,601 | 38,920,684 | 5.15 | ||||||||||||||||||
Telecommunications | 15,000,000 | 15,000,000 | 1.58 | 16,738,373 | 16,277,329 | 2.15 | ||||||||||||||||||
|
|
|
|
|
|
|
|
|
|
| �� | |||||||||||||
Total | $ | 928,245,070 | $ | 951,149,230 | 100.00 | % | $ | 749,280,587 | $ | 755,788,851 | 100.00 | % | ||||||||||||
|
|
|
|
|
|
|
|
|
|
|
| |||||||||||||
F-31
Table of Contents
Silver Point Specialty Lending Fund
Notes to Consolidated Financial Statements (continued)
(in U.S. Dollars)
The following table presents the composition of the investment portfolio by geographic dispersion at amortized cost and fair value as of December 31, 2021 and December 31, 2020 with corresponding percentages of total fair value:
| December 31, 2021 | December 31, 2020 | |||||||||||||||||||||||
Geographic Dispersion(1) | Cost / Amortized Cost | Fair Value | % of Fair Value | Cost / Amortized Cost | Fair Value | % of Fair Value | ||||||||||||||||||
Canada | $ | 21,033,431 | $ | 21,411,410 | 2.25 | % | $ | — | $ | — | — | % | ||||||||||||
Cayman Islands | 5,836,919 | 5,835,747 | 0.61 | — | — | — | ||||||||||||||||||
Japan | 23,997,684 | 24,537,398 | 2.58 | 36,218,780 | 37,100,000 | 4.91 | ||||||||||||||||||
Luxembourg | 76,168,532 | 75,963,991 | 7.99 | 20,102,612 | 21,865,078 | 2.89 | ||||||||||||||||||
Netherlands | 22,013,356 | 22,013,296 | 2.31 | 3,052,174 | 3,389,773 | 0.45 | ||||||||||||||||||
Singapore | 4,826,414 | 5,155,344 | 0.54 | — | — | — | ||||||||||||||||||
United Kingdom | 25,819,270 | 25,841,669 | 2.72 | 5,495,871 | 5,591,774 | 0.74 | ||||||||||||||||||
United States of America | 748,549,464 | 770,390,375 | 81.00 | 684,411,150 | 687,842,226 | 91.01 | ||||||||||||||||||
|
|
|
|
|
|
|
|
|
|
|
| |||||||||||||
Total | $ | 928,245,070 | $ | 951,149,230 | 100.00 | % | $ | 749,280,587 | $ | 755,788,851 | 100.00 | % | ||||||||||||
|
|
|
|
|
|
|
|
|
|
|
| |||||||||||||
| (1) | Geographic Dispersion represents the country of the issuer and may not represent the operating domicile. |
Cash Held at Banks
The Fund considers cash on deposit at a major financial institution as cash held at banks in the consolidated statements of and assets and liabilities. At times, cash held at banks may exceed Federal Deposit Insurance Corporation (“FDIC”) insured limits. Management believes that the credit risk to these deposits is minimal.
Foreign Cash Held at Banks
The Fund considered foreign cash held at banks as cash denominated in currencies other than the U.S. dollar. Management believes that the credit risk to these deposits is minimal.
Restricted Cash
Restricted cash consists of cash on deposit with major U.S. financial institutions in connection with the credit facility with Deutsche Bank AG and the 2021 debt securitization (Note 7). Restricted cash is generally restricted to the purchase of investments, as well as payment of expenses and interest. Restricted cash is available for monthly withdrawal subject to certain restrictions.
Due from and Due to broker
Due to broker consists of $480,000 of cash collateral related to foreign currency forward contracts (Note 5) as of December 31, 2021. Due from broker consists of $730,057 of cash collateral related to foreign currency forward contracts (Note 5) and $1,039,361 of cash collateral related to total return swaps (Note 5) as of December 31, 2020.
The Fund is a party to International Swap and Derivatives Association, Inc. (“ISDA”) Master Agreements (“Master Agreements”) with certain counterparties that govern over-the-counter derivative contracts entered into from time to time. The Master Agreements may contain provisions regarding, among other things, the parties’
F-32
Table of Contents
Silver Point Specialty Lending Fund
Notes to Consolidated Financial Statements (continued)
(in U.S. Dollars)
general obligations, representations, agreements, collateral requirements, events of default and early termination. With respect to certain counterparties, in accordance with the terms of the Master Agreements, collateral posted to the Fund is held by the Fund’s custodian and with respect to those amounts that can be sold or repledged, are presented in the Fund’s portfolio. Collateral can be in the form of cash and U.S. government securities as agreed to by the Fund and the applicable counterparty. Cash collateral pledged by the Fund is segregated by the Fund’s custodian and the collateral requirements are determined based on the Fund’s net position with each counterparty.
Investment Transactions and Related Income and Expense
Investments, including derivative and foreign currency forward contracts, are carried at fair value, with resulting unrealized appreciation and depreciation reflected in the consolidated statements of operations. Purchases and sales of investments are recorded on a trade date basis. Net gains or losses on investments, derivative and foreign currency forward contracts are included on the consolidated statements of operations. Realized gains and losses on investments and derivative contracts are determined on the specific cost identification basis. Amounts received or paid related to derivative contracts are recognized on a net basis as realized gain (loss), except upfront payments made or received upon entering a derivative contract, which are treated as a part of the cost basis of the derivative contract. Purchases and settlements of foreign currency forward contracts having the same settlement date and counterparty are generally settled net and any realized gains or losses are recognized on the settlement date.
Loans including revolving credit agreements are generally recorded on the consolidated statements of assets and liabilities as a component of investments owned at fair value, net of the unfunded portion of the related revolving credit agreement.
Interest income and expense are recognized on an accrual basis. Debt investments are generally placed on non-accrual status when payments are past due and there is reasonable doubt that principal or interest will be collected. Generally, accrued interest is reversed against interest income when a debt investment is placed on non-accrual status. Interest payments received on debt investments on non-accrual status may be recognized as interest income or treated as a reduction of cost basis of the debt investment based on management’s judgment. Loan origination and commitment fees received in-full at the inception of a loan or bond and fees earned in full upfront and to be paid at the termination of the loan are deferred and accreted into interest income, using the effective yield method as an enhancement to the related loan’s yield over the contractual life of the loan. The amortized cost of investments represents the original cost adjusted for accretion of fees, if any. For the years ended December 31, 2021 and December 31, 2020, non-cash interest income related to such accretion amounts to $12,775,398 and $10,004,002, respectively. Upon the prepayment of a loan, prepayment premiums and any unamortized fees are recorded as interest income.
The Fund has loans in its portfolio that contain payment-in-kind (“PIK”) provisions. PIK interest, computed at the contractual rate specified in each loan agreement, is generally recorded as interest income on an accrual basis. On the specified capitalization date, PIK interest is added to the principal balance and cost of the loan.
Other Income
From time to time, the Fund may receive fees for services provided to portfolio companies by the Adviser. The services that the Adviser provides vary by investment, but may include syndication, structuring, diligence fees, or other service-based fees and fees for providing managerial assistance to our portfolio companies and are recognized as revenue when earned. These fees are recorded as other income.
F-33
Table of Contents
Silver Point Specialty Lending Fund
Notes to Consolidated Financial Statements (continued)
(in U.S. Dollars)
Foreign Currency Transactions
Net realized gain (loss) from foreign currency transactions as reported in the consolidated statements of operations arises from sales of foreign currencies; currency gains or losses realized between the trade and settlement dates on investment transactions; and the difference between the amounts of dividends, interest, and foreign withholding taxes recorded on the Fund’s books and the U.S. dollar equivalent of the amounts actually received or paid. Net change in unrealized appreciation (depreciation) from foreign currency translations as reported in the consolidated statements of operations arises from changes in the fair values of assets and liabilities, other than investments at fiscal period-end, resulting from changes in exchange rates.
Investments and other assets and liabilities denominated in foreign currencies are translated into U.S. dollar amounts at the date of valuation. Purchases and sales of investments and income and expense items denominated in foreign currencies are translated into U.S. dollar amounts on the respective dates of such transactions.
The Fund does not isolate realized and unrealized gains and losses on investments and derivative contracts resulting from changes in foreign currency exchange rates on the consolidated statements of operations. Such fluctuations are reflected on the consolidated statements of operations together with net realized gain (loss) and net change in unrealized gain (loss) on investments and derivative contracts. The Fund generally attempts to hedge its foreign currency exposure through currency contracts.
Derivatives
The Fund seeks to manage the currency risks associated with investments denominated in currencies other than U.S. dollars by entering into hedging transactions using foreign currencies and foreign currency forward contracts, but there can be no assurance that such measures, even if implemented, will be effective. In a foreign currency forward contract, the Fund agrees to recover or deliver a fixed quantity of one currency for another at a pre-determined price at a future date. The terms of foreign currency forward contracts are not standardized, they are not traded on organized exchanges and generally can only be terminated or closed out before the specified date by agreement of both parties to the contract. These contracts are recorded at fair value. Realized and unrealized gains and losses on foreign currency forward contracts are included on the consolidated statements of operations.
Distributions from Equity Investments
Distributions received from equity investments in limited liability companies (“LLCs”) and limited partnerships (“LPs”) are evaluated to determine if the distribution should be recorded as dividend income, return of capital or realized gain (loss). Generally, the Fund will not record distributions from equity investments in LLCs and LPs as dividend income unless there are sufficient accumulated tax basis earnings and profits in the LLCs or LPs prior to the distribution. Prior to the ex-dividend date, the value of a dividend may be reflected in the fair value of the equity investment. Distributions that are classified as a return of capital are recorded as a reduction in the cost basis of the equity investment.
Deferred Financing Costs and Debt Issuance Costs
Deferred financing costs represent fees and other direct costs incurred in connection with the Fund’s borrowings. For revolving credit facilities, these amounts are capitalized as an asset within the consolidated statements of assets and liabilities are amortized using the straight-line methodology over the expected term of the borrowing which is generally expected to be at the end of the revolving period. The Fund records costs related to the
F-34
Table of Contents
Silver Point Specialty Lending Fund
Notes to Consolidated Financial Statements (continued)
(in U.S. Dollars)
issuance of term debt obligations as debt issuance costs. These costs are deferred and amortized using the effective interest method. These costs are presented as a reduction to the outstanding principal amount of the term debt obligations on the consolidated statements of assets and liabilities.
Deferred Offering Costs
The Fund may incur legal, accounting, regulatory, investment banking and other costs in relation to equity offerings. IPO offering costs are recorded as deferred offering costs and are charged against paid-in capital in excess of par on completion of the related offering or written off if the offering does not occur.
Expenses
Expenses are recorded on an accrual basis.
Capital Activity
Prior to the Fund’s Conversion, contributions and distributions were recorded as an increase and decrease to partners’ capital based on the effective date of the related capital call or distribution (Note 9).
Valuation of Investments and Derivative Contracts
Investments owned at fair value consist primarily of secured loans, bonds and equities. Derivative contracts consist of foreign currency forward contracts. Investments and derivative contracts are valued in good faith by the Fund’s Board at fair value pursuant to the valuation policy of the Fund, which considers quotations provided by independent pricing sources, when such quotations are available and deemed reliable.
Investments for which independent pricing sources or recent transaction activity are either not readily available or are not deemed reliable (“Non-quoted Investments”) are valued at fair value as determined in good faith by or under the direction of the Board. Non-Quoted Investments are valued in a multi-step process:
| 1. | The Fund Accounting team of the Adviser (“Fund Accounting”) provides recent portfolio company financial statements and other reporting materials to independent valuation firms (“IVF”) approved by the Board. |
| 2. | The IVF evaluates this information along with relevant observable market data to conduct independent valuations each quarter, and their valuation recommendations are documented and discussed with the Valuation Committee, Fund Accounting and the relevant investment professionals, as appropriate. |
| 3. | The valuation recommendations for certain investments may be determined by the Adviser in good faith in accordance with this valuation policy without the employment of an IVF, as appropriate. |
| 4. | The Audit Committee discusses the valuations, and the Board approves the fair value of the investments in good faith based upon the input and advice provided by the IVF, the Adviser and the Audit Committee, as necessary. |
Investments that are not listed on an exchange but are traded over-the-counter are generally valued at the representative “bid” quotation if held long and the representative “ask” quotation if held short or, in the case of equities that trade in over-the-counter marketplaces, at the last deemed reliable sale price provided by independent pricing sources. Derivative contracts not listed on an exchange are generally valued through industry-standard valuation models using inputs obtained from pricing vendors and from the relevant derivative contract.
F-35
Table of Contents
Silver Point Specialty Lending Fund
Notes to Consolidated Financial Statements (continued)
(in U.S. Dollars)
The Fund conducts this valuation process on a quarterly basis.
The estimated fair value of financial instruments determined by the Adviser is based upon available information and may not be the amount that the Fund would realize in a current transaction or might be ultimately realized, since such amounts depend on future circumstances, and the differences could be material.
In accordance with the authoritative guidance on fair value measurements and disclosures under U.S. GAAP, the Fund discloses the fair value of its investments according to a hierarchy that prioritizes the inputs used to measure the fair value. The hierarchy gives the highest priority to valuations based upon unadjusted quoted prices on a securities exchange in active markets for identical assets or liabilities (level 1 measurements) and the lowest priority to valuations based upon unobservable inputs that are significant to the valuation (level 3 measurements). In accordance with GAAP, these inputs are summarized in the three broad levels listed below:
Level 1: Inputs that reflect unadjusted quoted prices on a securities exchange in active markets for identical assets or liabilities.
Level 2: Inputs other than quoted prices on a securities exchange that are observable for the asset or liability either directly or indirectly in active markets, or unadjusted prices on a securities exchange in markets that are not considered to be active;
Level 3: Significant inputs that may be unobservable or inputs, including market quotations other than quoted prices on a securities exchange, in markets that are not considered to be active.
Inputs are used in applying the various valuation techniques and broadly refer to the assumptions that market participants use to make valuation decisions including assumptions about risk. Inputs may include price information, volatility statistics, specific and broad credit data, liquidity statistics and other factors. An investment’s level within the fair value hierarchy is based on the lowest level of any input that is significant to the fair value measurement. However, the determination of what constitutes “observable” requires judgment by the Adviser. The Adviser considers observable data to be that market data which is readily available, regularly distributed or updated, reliable and verifiable, not proprietary, and provided by multiple independent sources that are actively involved in the relevant market. The categorization of an investment within the hierarchy is based upon the pricing transparency of the investment and does not necessarily correspond to the Adviser’s perceived risk of that instrument.
In determining an instrument’s placement within the hierarchy, the Adviser separates the Fund’s investment portfolio into two categories: investments and derivative contracts. Each of these categories can further be divided between assets and liabilities and further by investment type.
There were no investments classified within level 1 as of December 31, 2021, or December 31, 2020.
Investments that are valued based on dealer quotations or alternative pricing sources supported by observable inputs are generally classified within level 2. These may include certain bonds or bank loans.
Investments classified within level 3 have significant unobservable inputs. Level 3 instruments may include certain bank loans, trust interests, private equity and real estate properties. When observable prices are not available for these investments, one or more valuation techniques (e.g., market approach or income approach) for which sufficient and reliable data is available may be used. Within level 3, the use of the market approach technique generally consists of using comparable market data, while the use of the income approach technique generally consists of the net present value of estimated future cash flows, adjusted as appropriate for liquidity,
F-36
Table of Contents
Silver Point Specialty Lending Fund
Notes to Consolidated Financial Statements (continued)
(in U.S. Dollars)
credit, market and/or other factors. Quotations provided by independent pricing sources may also be considered, if available and deemed reliable, in determining the value of level 3 investments.
The inputs used in estimating the value of level 3 investments that are not valued using quotations provided by independent pricing sources may include but are not limited to the original transaction price, recent transactions in the same or similar instruments, completed or pending third party transactions in the underlying investment or comparable issuers, subsequent rounds of financing, recapitalizations and other transactions across the capital structure, offerings in the equity or debt capital markets, discount rates, durations and changes in financial ratios or cash flows. Comparable public companies may also be identified based on industry, size, strategy, etc. and determine a trading multiple or yield for each comparable company. Additionally, level 3 investments may also be adjusted to reflect illiquidity and/or non-transferability, with the amount of such discount estimated in the absence of market information. The fair value measurement of level 3 investments does not include transaction costs that the Fund may incur in the sale of such investments. Assumptions used due to the lack of observable inputs may significantly impact the resulting fair value and therefore the Fund’s consolidated results of operations.
Derivative contracts can be exchange-traded or privately negotiated over-the-counter (“OTC”). OTC derivatives, including foreign currency forward contracts are generally valued using observable inputs. In instances where models are used, the value of an OTC derivative depends upon the contractual terms of, and specific risks inherent in the instrument as well as the availability and reliability of observable inputs. OTC derivatives are typically classified within level 2 of the fair value hierarchy depending on their liquidity or the observability of their inputs.
Income Taxes
The Fund is treated as a Partnership for tax purposes until the IPO date, at which time the Fund will become a regulated investment company for U.S. federal income tax purposes. The Fund itself is not subject to U.S. federal income taxes; each investor is individually liable for income taxes, if any, on its share of the Fund’s net taxable income. The Fund may be subject to entity level taxes with respect to certain state sourced income, as well as other income allocable to underlying resident investors; such taxes may be treated as entity level expenses or, to the extent such taxes are determined based on the identity or jurisdiction of each investor, specially charged to investors based on their allocable share, if any, of such income. This state and local tax withholding paid by the Fund on behalf of these investors is recorded in other assets until the time at which it is netted against each relevant investor’s current income distribution. Interest, dividends and other income realized by the Fund from non-U.S. sources and capital gains realized on the sale of securities of non-U.S. issuers may be subject to withholding and other taxes levied by the jurisdiction in which the income is sourced. Such withholding taxes are accrued when incurred and are shown on the consolidated statements of operations, where applicable, as withholding taxes. For the year ended December 31, 2021, the Fund incurred a net tax expense of $44,731 which is included on the statement of operations as noted therein. There were no such taxes withheld during the year ended December 31, 2020. The General Partner conducts the business of the Fund to the maximum extent practicable so that the Fund’s activities do not create a taxable presence in any non-U.S. jurisdiction in which the Fund or the General Partner do not have offices.
The Fund is subject to partnership audit rules enacted as part of the Bipartisan Budget Act of 2015 (the “Centralized Partnership Audit Regime”). Under the Centralized Partnership Audit Regime, any IRS audit of the Fund would be conducted at the Fund level rather than in separate proceedings involving each Partner. Adjustments to partnership items will generally be determined at the Fund level, and the Fund may be required to pay taxes (and associated interest and penalties) imposed as a result of such adjustments. In certain cases, the
F-37
Table of Contents
Silver Point Specialty Lending Fund
Notes to Consolidated Financial Statements (continued)
(in U.S. Dollars)
Fund may be able to elect to have the tax assessed or collected at the investor level. In the event of an audit, these new rules, and any elections thereunder, may significantly affect the amount and timing of tax (and associated interest and penalties) that is required to be borne by the Fund and its investors, as well as the manner in which such amounts are allocated among its Partners (including former Partners).
The Fund follows the authoritative guidance on accounting for and disclosure of uncertainty in tax positions, which require the General Partner to determine whether a tax position of the Fund is more likely than not to be sustained upon examination, including resolution of any related appeals or litigation processes, based on the technical merits of the position. For tax positions meeting the more likely than not threshold, the tax amount recognized in the consolidated financial statements is reduced by the largest benefit that has a greater than fifty percent likelihood of being realized upon ultimate settlement with the relevant taxing authority. For the years ended December 31, 2021 and December 31, 2020, there were no liabilities related to accounting for uncertainty in tax positions.
The Fund files tax returns as prescribed by the tax laws of the jurisdictions in which it operates and invests, if required. In the normal course of business, the Fund is subject to examination by federal, state, local and foreign jurisdictions, where applicable. The Fund may be subject to examination by such jurisdictions for all open tax years, the earliest of which is 2017. The Fund recognizes interest and penalties, when known, related to realized tax positions on the consolidated statements of operations. For the years ended December 31, 2021 and December 31, 2020, there were no interest and penalties.
Recent Accounting Pronouncements
In January 2021, the Financial Accounting Standards Board issued Accounting Standards Update No. 2021-01 (“ASU 2021-01”), “Reference Rate Reform (Topic 848)”. ASU 2021-01 is an update of ASU 2020-04, which is in response to concerns about structural risks of interbank offered rates, and particularly the risk of cessation of LIBOR, regulators have undertaken reference rate reform initiatives to identify alternative reference rates that are more observable or transaction based and less susceptible to manipulation. ASU 2020-04 provides optional guidance for a limited period of time to ease the potential burden in accounting for (or recognizing the effects of) reference rate reform on financial reporting. ASU 2020-04 is elective and applies to all entities, subject to meeting certain criteria, that have contracts, hedging relationships, and other transactions that reference LIBOR or another reference rate expected to be discontinued because of reference rate reform. The ASU 2021-01 update clarifies that certain optional expedients and exceptions in Topic 848 for contract modifications and hedge accounting apply to derivatives that are affected by the discounting transition. The amendments in this update are effective immediately through December 31, 2022, for all entities. The adoption of this guidance has not had a material impact on the Fund’s consolidated financial statements.
Good Faith Determinations of Fair Value (“Rule 2a-5”) under the 1940 Act was adopted by the SEC in December 2020 and establishes requirements for determining fair value in good faith for purposes of the 1940 Act. The Fund is evaluating the impact of adopting Rule 2a-5 on the consolidated financial statements and intends to comply with the new rule’s requirements on or before the compliance date in September 2022.
3. Reverse Repurchase Agreements
The Fund enters into reverse repurchase transactions in order to finance certain investments. In reverse repurchase agreements, the Fund sells investments to a counterparty and the Fund agrees to repurchase the same investments at an agreed upon price and date. These agreements are carried at the amounts at which the investments will be subsequently repurchased from the counterparties, plus initial margin. The associated
F-38
Table of Contents
Silver Point Specialty Lending Fund
Notes to Consolidated Financial Statements (continued)
(in U.S. Dollars)
investments collateral is reflected in investments owned, at fair value on the consolidated statements of assets and liabilities. As the valuation of the underlying investments increases, variation margin is posted as collateral by the counterparty to the Fund and as the valuation decreases, variation margin is returned and posted as collateral by the Fund to the counterparty, in each case to secure the repurchase obligations of the parties. Fluctuations arising from the translation of foreign currency on the Reverse Repurchase agreements are included within the net change in unrealized appreciation (depreciation) on translation of assets and liabilities in foreign currencies on the consolidated statements of operations.
The Fund is party to Global Master Repurchase Agreements and/or Master Repurchase Agreements with counterparties which govern the repurchase and reverse repurchase transactions, including settlement in the event of default. In the event of default of the counterparty’s obligation to repurchase the investment in a repurchase agreement, the Fund generally has the right to retain or sell the purchased investment, liquidate any additional collateral and apply the proceeds in satisfaction of the repurchase obligation. The use of repurchase agreements involves the potential risk of loss by the Fund of the investments pledged as collateral. In addition, in the event the buyer of the investments under a reverse repurchase agreement files for bankruptcy or becomes insolvent, the Fund’s use of the proceeds of the agreement may be restricted pending a determination by the party, or its trustee, whether to enforce the Fund’s obligation to repurchase the investments. To manage these risks, the Adviser actively monitors its use of leverage and seeks to maintain sufficient liquid assets to meet the demands of the counterparties to these agreements in the event of adverse changes in market conditions.
The Fund pledged collateral consisting of asset-backed investments valued at $12,267,602 as of December 31, 2020. These reverse repurchase agreements had maturities of January 2021 and interest rates ranging from (1.70)% to 1.13%. The following table presents gross and net information about reverse repurchase agreements on the consolidated statements of assets and liabilities as of December 31, 2020:
| Gross amounts not offset in the Consolidated Statements of Assets and Liabilities | ||||||||||||||||||||||||
Description | Gross Amounts of Recognized Assets and Liabilities | Gross Amounts Offset in the Consolidated Statements of Assets and Liabilities | Net Amounts Presented in the Consolidated Statements of Assets and Liabilities | Financial Instruments | Collateral | Net Amount | ||||||||||||||||||
Investments sold under agreements to repurchase | $ | 7,569,334 | $ | — | $ | 7,569,334 | $ | (7,569,334 | ) | $ | — | $ | — | |||||||||||
All reverse repurchase agreements were terminated as of December 31, 2021.
4. Sell / Buy-back Agreements
The Fund may also finance the purchase of certain investments through sell / buy-back agreements, which are similar to repurchase agreements. In a sell / buy-back agreement, the Fund enters into a trade to sell an investment and contemporaneously enters into a trade to buy the same investment back on a specified date in the future with the same counterparty. The Fund uses sell/buy-back agreements as a short-term financing alternative to its existing revolving credit facilities with terms generally 90 days or less. Under U.S. GAAP, the Fund treats its sell/buy-back agreements as secured borrowings and continues to present the investment as an asset and the obligation to return the cash received as a liability on the consolidated statements of assets and liabilities. The amount borrowed is generally equal to the cost of the assets pledged. Interest income earned on investments pledged as collateral and financing charges associated with the sell / buy-back agreements are included within
F-39
Table of Contents
Silver Point Specialty Lending Fund
Notes to Consolidated Financial Statements (continued)
(in U.S. Dollars)
interest income and interest and financing expenses, respectively, on the consolidated statements of operations. Accrued interest receivable on investments and accrued financing charges on the sell / buy-back agreements are included within interest receivable and interest payable, respectively, on the consolidated statements of assets and liabilities. As of December 31, 2021 and December 31, 2020, there were no outstanding borrowings under the sell / buy-back agreements.
5. Derivative Contracts
The Fund may enter into total return swap contracts, foreign currency forward contracts, and interest rate caps as part of its investment strategy. Total return swaps involve an agreement to exchange cash flows based on the total return of underlying financial instruments and a stated interest rate. The Fund may also enter into foreign currency forward contracts to reduce the exposure to foreign currency exchange rate fluctuations in the value of foreign currencies and interest rate caps for hedging purposes.
The following table presents the details of the gross derivative contracts as of and for the years ending December 31, 2021 and December 31, 2020.
| December 31, 2021 | December 31, 2020 | |||||||||||||||||||||||
| Interest Rate Cap | Total Return Swaps | Foreign Currency Forward Contracts | Interest Rate Cap | Total Return Swaps | Foreign Currency Forward Contracts | |||||||||||||||||||
Average notional value(1) | $ | 80,000,000 | $ | 5,816,215 | $ | (55,214,222 | ) | $ | 100,000,000 | $ | 23,589,290 | $ | (10,073,365 | ) | ||||||||||
Derivative contracts, at fair value | — | — | (989,704 | ) | — | 428,081 | (34,504 | ) | ||||||||||||||||
Net realized gain (loss) on derivatives | (90,000 | ) | 826,438 | 4,378,260 | — | 3,226,523 | (552,935 | ) | ||||||||||||||||
Net change in unrealized appreciation (depreciation) on derivatives | 90,000 | (428,081 | ) | (955,200 | ) | (28 | ) | 856,263 | (34,504 | ) | ||||||||||||||
Cash collateral | — | — | (480,000 | ) | — | 1,039,361 | 730,057 | |||||||||||||||||
Risk exposure | | Interest Rate | | | Credit Risk | | | Foreign Currency | | Interest Rate | Credit Risk | | Foreign Currency | | ||||||||||
| (1) | Calculated based on month end amounts during the year for the various contract types. |
F-40
Table of Contents
Silver Point Specialty Lending Fund
Notes to Consolidated Financial Statements (continued)
(in U.S. Dollars)
6. Fair Value Measurements
The following table presents the investments carried on the consolidated statements of assets and liabilities by level within the fair value hierarchy as of December 31, 2021.
| Fair Value Measurements as of December 31, 2021 | ||||||||||||||||
| Level 1 | Level 2 | Level 3 | Total | |||||||||||||
Investments: | ||||||||||||||||
Secured loans | $ | — | $ | 237,275,625 | $ | 559,294,204 | $ | 796,569,829 | ||||||||
Secured bonds | — | 94,227,254 | — | 94,227,254 | ||||||||||||
Equities | — | — | 39,412,426 | 39,412,426 | ||||||||||||
Real estate properties | — | — | 18,012,863 | 18,012,863 | ||||||||||||
Trust interest | — | — | 2,926,858 | 2,926,858 | ||||||||||||
|
|
|
|
|
|
|
| |||||||||
Total investments | $ | — | $ | 331,502,879 | $ | 619,646,351 | $ | 951,149,230 | ||||||||
|
|
|
|
|
|
|
| |||||||||
Derivative contracts: | ||||||||||||||||
Foreign currency forward contracts | $ | — | $ | (989,704 | ) | $ | — | $ | (989,704 | ) | ||||||
|
|
|
|
|
|
|
| |||||||||
Total derivative contracts | $ | — | $ | (989,704 | ) | $ | — | $ | (989,704 | ) | ||||||
|
|
|
|
|
|
|
| |||||||||
The following table presents the investments carried on the consolidated statements assets and liabilities by level within the fair value hierarchy as of December 31, 2020.
| Fair Value Measurements as of December 31, 2020 | ||||||||||||||||
| Level 1 | Level 2 | Level 3 | Total | |||||||||||||
Investments: | ||||||||||||||||
Secured loans | $ | — | $ | 113,431,927 | $ | 549,033,503 | $ | 662,465,430 | ||||||||
Secured bonds | — | 73,979,166 | — | 73,979,166 | ||||||||||||
Equities | — | — | 16,445,611 | 16,445,611 | ||||||||||||
Trust interest | — | — | 2,898,644 | 2,898,644 | ||||||||||||
|
|
|
|
|
|
|
| |||||||||
Total investments | $ | — | $ | 187,411,093 | $ | 568,377,758 | $ | 755,788,851 | ||||||||
|
|
|
|
|
|
|
| |||||||||
Derivative contracts: | ||||||||||||||||
Foreign currency forward contracts | $ | — | $ | (34,504 | ) | $ | — | $ | (34,504 | ) | ||||||
Interest rate cap | — | — | — | — | ||||||||||||
Total return swaps | — | 428,081 | — | 428,081 | ||||||||||||
|
|
|
|
|
|
|
| |||||||||
Total derivative contracts | $ | — | $ | 393,577 | $ | — | $ | 393,577 | ||||||||
|
|
|
|
|
|
|
| |||||||||
F-41
Table of Contents
Silver Point Specialty Lending Fund
Notes to Consolidated Financial Statements (continued)
(in U.S. Dollars)
The following table includes a roll forward of the amounts for the year ended December 31, 2021 for investments classified within level 3. The classification of an investment within level 3 is based upon the significance of the unobservable inputs to the overall fair value measurement.
| Fair Value Measurements of Level 3 Investments | ||||||||||||||||||||||||
| Secured Loans | Secured Bonds | Equities | Trust Interest | Real Estate Properties | Total | |||||||||||||||||||
Balance at January 1, 2021 | $ | 549,033,503 | $ | — | $ | 16,445,611 | $ | 2,898,644 | $ | — | $ | 568,377,758 | ||||||||||||
Transfer in(1) | 19,100,000 | 606,633 | — | — | — | 19,706,633 | ||||||||||||||||||
Transfer out | — | — | — | — | — | — | ||||||||||||||||||
Accretion/amortization of discounts/premiums | 4,471,604 | 28,690 | — | — | — | 4,500,294 | ||||||||||||||||||
Interest paid-in-kind | 3,523,476 | — | — | 73,871 | — | 3,597,347 | ||||||||||||||||||
Purchases(2) | 327,598,176 | — | 14,950,321 | — | 17,602,287 | 360,150,784 | ||||||||||||||||||
Sales, paydowns and resolutions(2) | (342,509,877 | ) | (609,681 | ) | (10,394,478 | ) | — | (1,084 | ) | (353,515,120 | ) | |||||||||||||
Net realized gain/(loss) | (10,986,984 | ) | — | 8,354,864 | — | 1,084 | (2,631,036 | ) | ||||||||||||||||
Net change in unrealized appreciation/(depreciation) | 9,064,306 | (25,642 | ) | 10,056,108 | (45,657 | ) | 410,576 | 19,459,691 | ||||||||||||||||
|
|
|
|
|
|
|
|
|
|
|
| |||||||||||||
Balance at December 31, 2021 | $ | 559,294,204 | $ | — | $ | 39,412,426 | $ | 2,926,858 | $ | 18,012,863 | $ | 619,646,351 | ||||||||||||
|
|
|
|
|
|
|
|
|
|
|
| |||||||||||||
Change in net unrealized appreciation/(depreciation) on investments held as of December 31, 2021 | $ | 617,675 | $ | — | $ | 10,413,650 | $ | (45,657 | ) | $ | 410,576 | $ | 11,396,244 | |||||||||||
|
|
|
|
|
|
|
|
|
|
|
| |||||||||||||
| (1) | Investment was transferred in from level 2 to level 3 due to a lack of observable market data. |
| (2) | Includes the effects of reorganizations. |
F-42
Table of Contents
Silver Point Specialty Lending Fund
Notes to Consolidated Financial Statements (continued)
(in U.S. Dollars)
The following table includes a roll forward of the amounts for the year ended December 31, 2020 for investments classified within level 3. The classification of an investment within level 3 is based upon the significance of the unobservable inputs to the overall fair value measurement.
| Fair Value Measurements of Level 3 Investments | ||||||||||||||||||||||||
| Secured Loans | Secured Bonds | Equities | Trust Interest | Real Estate Properties | Total | |||||||||||||||||||
Balance at January 1, 2020 | $ | 643,197,997 | $ | — | $ | 9,993,289 | $ | 3,178,700 | $ | 3,129,196 | $ | 659,499,182 | ||||||||||||
Transfer in | — | — | — | — | — | — | ||||||||||||||||||
Transfer out | — | — | — | — | — | — | ||||||||||||||||||
Accretion/amortization of discounts/premiums | 6,237,733 | — | — | — | — | 6,237,733 | ||||||||||||||||||
Interest paid-in-kind | 11,103,205 | — | — | — | — | 11,103,205 | ||||||||||||||||||
Purchases(1) | 118,056,527 | — | 3,077,412 | — | — | 121,133,939 | ||||||||||||||||||
Sales, paydowns and resolutions(1) | (218,646,529 | ) | — | — | — | (2,769,455 | ) | (221,415,984 | ) | |||||||||||||||
Net realized gain/(loss) | — | — | — | — | (1,085,720 | ) | (1,085,720 | ) | ||||||||||||||||
Net change in unrealized appreciation/(depreciation) | (10,915,430 | ) | — | 3,374,910 | (280,056 | ) | 725,979 | (7,094,597 | ) | |||||||||||||||
|
|
|
|
|
|
|
|
|
|
|
| |||||||||||||
Balance at December 31, 2020 | $ | 549,033,503 | $ | — | $ | 16,445,611 | $ | 2,898,644 | $ | — | $ | 568,377,758 | ||||||||||||
|
|
|
|
|
|
|
|
|
|
|
| |||||||||||||
Change in net unrealized appreciation/(depreciation) on investments held as of December 31, 2020 | $ | (10,109,705 | ) | $ | — | $ | 3,374,910 | $ | (280,056 | ) | $ | — | $ | (7,014,851 | ) | |||||||||
|
|
|
|
|
|
|
|
|
|
|
| |||||||||||||
| (1) | Includes the effects of reorganizations. |
All realized gains (losses) and change in unrealized appreciation (depreciation) in the tables above are reflected in the accompanying consolidated statements of operations. Transfers between levels 1, 2 or 3, if any, are recognized at the beginning value on January 1.
F-43
Table of Contents
Silver Point Specialty Lending Fund
Notes to Consolidated Financial Statements (continued)
(in U.S. Dollars)
The following tables provide quantitative information about the Fund’s level 3 fair value measurements for the Fund’s investments as of December 31, 2021 and December 31, 2020. In addition to the techniques and inputs noted in the tables below, the Fund may also use, in accordance with the valuation policy, other valuation techniques and methodologies when determining the Fund’s fair value measurements. The below tables are not intended to be inclusive of all unobservable inputs, but rather provide information on the significant level 3 inputs as they relate to the Fund’s fair value measurements.
| Quantitative Information about Level 3 Value Investments | ||||||||||||||||||||
Investment Type | Fair Value at December 31, 2021 | Valuation Technique(s) | Unobservable Input(s) | Range (Weighted Average) | Impact to Valuation from an Increase in Input(1) | |||||||||||||||
Secured Loans | $ | 424,006,508 | Income Approach | Yield | 5.3% - 19.1% (9.7%) | Decrease | ||||||||||||||
| | Duration | | | 1.3 yrs. - 3.3 yrs. (2.0 yrs.) | | | Decrease | | ||||||||||||
| 89,542,125 | Market Quotation | Market Quotation | N/A | N/A | ||||||||||||||||
| 45,745,571 | Recent Transaction | Recent Transaction | N/A | N/A | ||||||||||||||||
|
|
|
|
|
|
|
|
|
| |||||||||||
Equities | 12,657,607 | | Discount to Market Quotation | | Discount | 30.5% | Decrease | |||||||||||||
| 7,134,277 | Income Approach | Discount Rate | 15.0% - 16.0% (15.8%) | Decrease | ||||||||||||||||
| | Duration | | | 0.5 yrs - 1.8 yrs. (1.5 yrs.) | | | Decrease | | ||||||||||||
| 9,932,386 | Market Quotation | Market Quotation | N/A | N/A | ||||||||||||||||
|
|
|
|
|
|
|
|
|
| |||||||||||
Real Estate Properties | 9,486,863 | Income Approach | Discount Rate | 13.8% | Decrease | |||||||||||||||
| Duration | 0.8 yrs. | Decrease | ||||||||||||||||||
| 8,526,000 | | Market Comparables | | Price Per Unit | $200k/ac | Increase | ||||||||||||||
|
|
|
|
|
|
|
|
|
| |||||||||||
Preferred Equities | 9,688,156 | Income Approach | Yield | 17.6% | Decrease | |||||||||||||||
|
|
|
|
|
|
|
|
|
| |||||||||||
Trust Interest | 2,926,858 | Asset Approach | Recovery Rate | 4.7% | Increase | |||||||||||||||
|
|
|
|
|
|
|
|
|
| |||||||||||
Total Level 3 Investments | $ | 619,646,351 | ||||||||||||||||||
|
| |||||||||||||||||||
F-44
Table of Contents
Silver Point Specialty Lending Fund
Notes to Consolidated Financial Statements (continued)
(in U.S. Dollars)
| Quantitative Information about Level 3 Value Investments | ||||||||||||||||||||
Investment Type | Fair Value at December 31, 2020 | Valuation Technique(s) | Unobservable Input(s) | Range (Weighted Average) | Impact to Valuation from an Increase in Input(1) | |||||||||||||||
Secured Loans | $ | 544,425,616 | Income Approach | Yield | 7.0% - 15.0% (10.0%) | Decrease | ||||||||||||||
| Discount Rate | 12.0% - 20.7% (14.2%) | Decrease | ||||||||||||||||||
| Duration | | 6 mos. - 2.2 yrs. (1.7 yrs.) | | Decrease | ||||||||||||||||
| 4,607,887 | Market Quotation | Market Quotation | N/A | N/A | ||||||||||||||||
|
|
|
|
|
|
|
|
|
| |||||||||||
Equities | 10,543,168 | Income Approach | Discount Rate | 15.6% - 18.9% (18.5%) | Decrease | |||||||||||||||
| Duration | | 10 mos. - 1.8 yrs. (1.6 yrs.) | | Decrease | ||||||||||||||||
| 5,902,443 | Market Quotation | Market Quotation | N/A | N/A | ||||||||||||||||
|
|
|
|
|
|
|
|
|
| |||||||||||
Trust Interest | 2,898,644 | Asset Approach | Recovery Rate | 5.6% | Increase | |||||||||||||||
|
|
|
|
|
|
|
|
|
| |||||||||||
Total Level 3 Investments | $ | 568,377,758 | ||||||||||||||||||
|
| |||||||||||||||||||
| (1) | This column represents the directional change in the fair value of the Level 3 investments that would result from an increase to the corresponding unobservable input. A decrease to the unobservable input would have the opposite effect. Significant changes in these outputs in isolation could result in significantly higher or lower fair value measurements. |
7. Debt
The Fund is party to a secured revolving credit facility with Deutsche Bank AG (the “Revolving Credit Facility”), which allows the Fund to borrow an amount up to $200 million. The stated maturity for the Revolving Credit Facility is October 17, 2025. The interest rate is 3-Month LIBOR plus 220 basis points per annum on the drawn portion and a commitment fee of 40 basis points per annum on any unused portion. The Fund is also charged a facility agent fee of 30 basis points per annum on the total facility amount. As of December 31, 2021 and December 31, 2020, $142.2 million and $296.2 million, respectively, of the Revolving Credit Facility was outstanding. In connection with the Revolving Credit Facility, the Fund has pledged collateral consisting of investments valued at approximately $285.1 million and $545.7 million as of December 31, 2021 and December 31, 2020, respectively, which is included in investments owned, at fair value, on the consolidated statements of assets and liabilities. Such pledged assets may accordingly be restricted as to resale. Certain specified revaluation events related to pledged assets may result in a decrease in the borrowing base, and could incent or require the Fund to pledge additional collateral.
The Fund was party to a revolving credit facility with Signature Bank (the “Signature Facility”), which was terminated on September 29, 2021. The Signature Facility was secured by the unfunded commitments of investors and allows the Fund to borrow an amount up to $80 million. The interest rate on the drawn portion of the Signature Facility was Daily LIBOR plus 195 basis points per annum with a 50 basis point floor. The commitment fee on any unused portion of the Signature Facility was 20 basis points per annum. As of December 31, 2020, $0.2 million was outstanding for the Signature Facility.
F-45
Table of Contents
Silver Point Specialty Lending Fund
Notes to Consolidated Financial Statements (continued)
(in U.S. Dollars)
On September 9, 2021, the Fund completed a $400 million term debt securitization (the “2021 Debt Securitization”), also know as a collateralized loan obligation transaction, which is a form of secured financing incurred by the Fund. The debt offered in the 2021 Debt Securitization (the “2021 CLO”) was issued by Silver Point SCF CLO I, Ltd., a wholly owned subsidiary of the Fund, and is backed by a diversified portfolio of senior secured bonds and loans and second lien loans. The Fund owns $112 million of Class D and Subordinated Notes. All transactions and balances associated with these two classes of notes have been eliminated in consolidation. In connection with the 2021 CLO, the Fund has pledged collateral consisting of investments valued at approximately, $347.1 million as of December 31, 2021. The stated maturity for the 2021 CLO is October 15, 2032. The 2021 CLO consists of the following:
| December 31, 2021 | ||||||||||||||||||||||||
2021 CLO | Total Principal Amount Committed | Principal Amount Outstanding | Carrying Value(1) | Fair Value | Coupon | Interest Rate | ||||||||||||||||||
Class A-1 Loans | $ | 100,000,000 | $ | 100,000,000 | $ | 99,041,934 | $ | 100,240,000 | 3ML+1.72% | 1.84 | % | |||||||||||||
Class A-1a Notes | 104,500,000 | 104,500,000 | 103,498,821 | 104,750,800 | 3ML+1.72% | 1.84 | % | |||||||||||||||||
Class A-1b Notes | 7,500,000 | 7,500,000 | 7,428,145 | 7,517,250 | 2.45% | 2.45 | % | |||||||||||||||||
Class A-2a Notes | 6,000,000 | 6,000,000 | 5,942,516 | 6,028,200 | 3ML+1.90% | 2.02 | % | |||||||||||||||||
Class A-2b Notes | 10,000,000 | 10,000,000 | 9,904,193 | 10,032,000 | 2.81% | 2.81 | % | |||||||||||||||||
Class B-1 Notes | 8,000,000 | 8,000,000 | 7,923,355 | 8,025,600 | 3ML+2.00% | 2.12 | % | |||||||||||||||||
Class B-2 Notes | 8,000,000 | 8,000,000 | 7,923,355 | 8,028,000 | 2.94% | 2.94 | % | |||||||||||||||||
Class C Notes | 44,000,000 | 44,000,000 | 43,578,450 | 44,220,000 | 3ML+3.00% | 3.12 | % | |||||||||||||||||
|
|
|
|
|
|
|
|
|
| |||||||||||||||
Total 2021 CLO | $ | 288,000,000 | $ | 288,000,000 | $ | 285,240,769 | $ | 288,841,850 | 2.13 | % | ||||||||||||||
|
|
|
|
|
|
|
|
|
| |||||||||||||||
| (1) | Carrying value represents aggregate principal amount outstanding less unamortized debt issuance costs. |
On November 4, 2021, the Fund placed $145 million in aggregate principal of unsecured notes that mature on November 4, 2026 (the “2026 Notes”). The 2026 Notes were issued in two tranches, with $100 million of tranche A notes funded on November 4, 2021 and $45 million of tranche B notes funded on January 21, 2022. The 2026 Notes bear interest at a rate of 4.00% per year, payable semi-annually on November 4 and May 4, of each year, commencing on May 4, 2022. The 2026 Notes are subject to various repayment and redemption provisions. Additionally, in connection with the 2026 Notes, the Fund is required to maintain certain asset ratios.
The following tables present the details of the Fund’s borrowings as of December 31, 2021 and December 31, 2020:
| December 31, 2021 | ||||||||||||||||||||||||||||
Facility | Total Principal Amount Committed | Principal Amount Outstanding | Carrying Value | Fair Value | Coupon | Interest Rate | Maturity Date | |||||||||||||||||||||
Revolving Credit Facility(1) | $ | 200,000,000 | $ | 142,174,938 | $ | 142,174,938 | $ | 142,174,938 | L+2.20 | % | 2.45 | % | 10/17/2025 | |||||||||||||||
2021 CLO(2)(4) | 288,000,000 | 288,000,000 | 285,240,769 | 288,841,850 | Various | 2.13 | % | 10/15/2032 | ||||||||||||||||||||
2026 Notes(4) | 100,000,000 | 100,000,000 | 97,776,623 | 100,000,000 | 4.00 | % | 4.00 | % | 11/4/2026 | |||||||||||||||||||
F-46
Table of Contents
Silver Point Specialty Lending Fund
Notes to Consolidated Financial Statements (continued)
(in U.S. Dollars)
| December 31, 2020 | ||||||||||||||||||||||||||||
Facility | Total Principal Amount Committed | Principal Amount Outstanding | Carrying Value | Fair Value | Coupon | Interest Rate | Maturity Date | |||||||||||||||||||||
Revolving Credit Facility(1) | $ | 400,000,000 | $ | 296,216,690 | $ | 296,216,690 | $ | 296,216,690 | L+2.80 | % | 3.05 | % | 4/17/2024 | |||||||||||||||
Signature Facility(3) | 80,000,000 | 200,000 | 200,000 | 200,000 | L+1.95 | % | 2.45 | % | 10/23/2021 | |||||||||||||||||||
| (1) | Interest rates as of December 31, 2021 and December 31, 2020 were 3-Month LIBOR+2.20% and 3-Month LIBOR+2.80%, respectively, and the base interest rate (i.e., 3-Month LIBOR) are subject to quarterly changes. Interest rate does not include the amortization of upfront fees, facility agent fee, unfunded fees and expenses that were incurred in connection with the Revolving Credit Facility. |
| (2) | Interest rate as of December 31, 2021 was calculated using the weighted average interest rate based on the 2021 CLO. Interest rate does not include the amortization of upfront fees. Refer to 2021 CLO table above for coupon rate. |
| (3) | Interest rate as of December 31, 2020 was 1-Month LIBOR+1.95% with a 0.50% floor. Interest rate resets daily and does not include the amortization of upfront fees, unfunded fees and expenses that were incurred in connection with the Signature Facility. |
| (4) | Carrying value represents aggregate principal amount outstanding less unamortized debt issuance costs. |
The fair value of the Fund’s credit facilities are categorized as Level 3 within the fair value hierarchy as of December 31, 2021 and December 31, 2020.
The components of the Fund’s interest and financing expenses for the years ended December 31, 2021 and December 31, 2020 were as follows:
| For the Years Ended December 31, | ||||||||
| 2021 | 2020 | |||||||
Stated interest expense | $ | 11,403,673 | $ | 12,858,981 | ||||
Unfunded fees | 786,952 | 855,526 | ||||||
Amortization of deferred financing costs and debt issuance costs | 2,606,768 | 2,150,090 | ||||||
|
|
|
| |||||
Total interest expense | $ | 14,797,393 | $ | 15,864,597 | ||||
|
|
|
| |||||
Weighted average interest rate | 3.78 | % | 4.49 | % | ||||
Average borrowings | $ | 391,358,864 | $ | 353,507,339 | ||||
| (1) | Interest expense includes the portion of the facility agent fee applicable to the drawn portion of the Revolving Credit Facility and the unfunded fee includes the portion of the facility agent fee applicable to the undrawn portion of the Revolving Credit Facility. Rates as of December 31, 2021 and December 31, 2020 were 3-Month LIBOR+2.20% and 3-Month LIBOR+2.80%, respectively, and the base interest rate (i.e., 3-Month LIBOR) are subject to quarterly changes. Interest rate does not include the amortization of upfront fees, facility agent fee, non-usage fees and expenses that were incurred in connection with the Revolving Credit Facility. |
F-47
Table of Contents
Silver Point Specialty Lending Fund
Notes to Consolidated Financial Statements (continued)
(in U.S. Dollars)
8. Certain Risk Factors
The following summary of certain risk factors is not intended to be a comprehensive explanation of all the risks related to investing in the Fund. In the ordinary course of business, the Fund seeks to manage a variety of risks, which may include market risk, credit risk, liquidity risk and off-balance sheet risk. The Fund may seek to identify measure and monitor risk through various control mechanisms. There can be no assurance that the Fund will implement practices to account for all of the risks of investing in the Fund or that the Fund’s risk management practices will be effective.
The Fund’s activities may be affected by general economic and market conditions, such as interest rates, availability of credit, credit defaults, inflation rates, economic uncertainty and changes in laws (including laws relating to taxation of the Fund’s investments), trade barriers, commodity prices, currency exchange rates and controls and national and international political circumstances. These factors may affect the level and volatility of financial instruments’ prices and liquidity of the Fund’s investments. Market conditions, including increased competition, may also cause the Fund’s portfolio to be comprised of assets that differ significantly from the Adviser’s expectations at the time of the initial offering of interests.
The Fund may be subject to the risk of loss arising from direct or indirect exposure to various catastrophic events, including the following: hurricanes, earthquakes and other natural disasters; terrorism; wars; and public health crises, including the occurrence of a contagious disease. To the extent that any such event occurs and has a material effect on global financial markets or specific markets in which the Fund participates (or has a material effect on locations in which Silver Point operates) the risks of loss can be substantial and could have a material adverse effect on the Fund and the investors’ investments therein.
Beginning in January 2020, global financial markets have experienced and may continue to experience significant volatility resulting from the spread of a novel coronavirus known as COVID-19. The outbreak of COVID-19 has resulted in, among other things, travel and border restrictions, quarantines, supply chain disruptions, lower consumer demand and general market uncertainty. The effects of COVID-19 have and may continue to adversely affect the global economy, the economies of certain nations and individual issuers, all of which may impact the Fund’s performance.
Investment results may vary substantially over time, and investors could lose some or all of their investment. No guarantee or representation is made that the Fund’s investment program will be successful. The Fund’s investment program involves, without limitation, risks associated with limited diversification and concentration, investments in speculative assets and the use of speculative investment strategies and techniques, interest rates, volatility, credit deterioration or default risks, systems risks and other risks inherent in the Fund’s activities. The Fund’s investments may be materially affected by conditions in the financial markets and overall economic conditions occurring globally and in particular markets where the Fund may invest its assets. The Fund’s methods of minimizing such risks may not be successful.
The Fund’s portfolio may be concentrated in a limited number of portfolio companies and industries. As a result, the aggregate returns the Fund realizes may be significantly adversely affected if a small number of investments perform poorly or if the Fund needs to write down the value of any one investment. Additionally, a downturn in any particular industry in which the Fund is invested could significantly affect its aggregate returns.
There is no guarantee that the fair value determined for any investment will ultimately represent the value that will be realized by the Fund on the disposition of the investment. In the event there is no readily available market for any of the Fund’s investments, such investments may be difficult to value.
F-48
Table of Contents
Silver Point Specialty Lending Fund
Notes to Consolidated Financial Statements (continued)
(in U.S. Dollars)
The Fund intends to invest in loans, bonds and similar debt obligations, including senior secured loans and secondary purchases of debt issued by small and middle market companies. Debt obligations are subject to the risk of the issuer’s inability to meet principal and interest payments on its obligations (i.e., credit risk) and are subject to price volatility due to such factors as interest rate sensitivity, market perception of the creditworthiness of the issuer and general market liquidity (i.e., market risk). These obligations are subject to other risks, including, without limitation: (i) declines in the value of collateral securing the obligations, if any; (ii) declines in the enterprise value of the obligor; (iii) failure of restrictive covenants, if any, to adequately protect the interests of the creditor; (iv) the failure of the bankruptcy process (or other determination of creditors’ rights) to produce the outcome anticipated by the investor; (v) the possible invalidation of an investment transaction as a preference or fraudulent conveyance under relevant creditors’ rights laws; (vi) so-called lender-liability claims by the issuer of the obligations; and (vii) environmental or other liabilities that may arise with respect to collateral securing the obligations. When the Fund makes a “unitranche” or senior secured term loan investment in a portfolio company, it generally takes a security interest in the available assets of the portfolio company, including the equity interests of its subsidiaries, which is expected to help mitigate the risk that the Fund will not be repaid. However, the fact that a loan is secured, does not guarantee that the Fund will receive principal and interest payments according to the loan’s terms, or at all, or that the Fund will be able to collect on the loan, should it be forced to enforce its remedies. To the extent the Fund invests in mezzanine or other junior debt, it may incur additional risks. Other creditors may rank senior to the Fund in the event of an insolvency, which may result in greater risk and loss of principal.
To the extent the Fund’s debt investments are based on floating rates, such as LIBOR, EURIBOR, the Federal Funds Rate or the Prime Rate, general interest rate fluctuations may have a substantial negative impact on the Fund’s investments, the value of an investment in the Fund and the rate of return on invested capital. Additionally, to the extent that the floating interest rates applicable to the Fund’s debt investments are subject to a negotiated cap or floor, the Fund may be unable to capitalize upon favorable market fluctuations of interest rates.
Many financial instruments use or may use a floating rate based on LIBOR, which is the offered rate for short- term Eurodollar deposits between major international banks. On July 27, 2017, the U.K. Financial Conduct Authority announced that it intends to stop compelling banks to submit rates for the calculation of LIBOR after 2021. Additionally, on November 30, 2020, International Exchange, Inc. (“ICE”) announced that the ICE Benchmark Administration Limited, a wholly-owned subsidiary of ICE and the administrator of LIBOR, will consider extending the LIBOR transition deadline to June 30, 2023. There remains uncertainty regarding the future utilization of LIBOR and the nature of any replacement rate. The expected discontinuation of LIBOR could have a significant impact on the financial markets and may present a risk for certain market participants, including public companies, investment advisers, investment companies and broker-dealers. The risks associated with this discontinuation and transition will be exacerbated if the work necessary to effect an orderly transition to an alternative reference rate is not completed in a timely manner. Transition away from LIBOR as a benchmark reference for interest rates may (i) affect the cost of capital, (ii) require amending or restructuring debt instruments and related hedging arrangements for the Fund and its issuers and (iii) impact the value of floating rate securities and/or loans based on LIBOR that are held or may be held by the Fund in the future, which could result in additional costs or adversely affect the Fund’s liquidity, results of operations and financial condition. Industry participants continue to consider alternatives to LIBOR, and it is unclear what the prevailing reference rate will be following LIBOR’s expected unavailability after 2023.
As an alternative to LIBOR, the U.S. Federal Reserve has announced that it recommends replacing U.S.-dollar LIBOR with the Secured Overnight Financing Rate (“SOFR”), a new index calculated by short-term repurchase agreements, backed by U.S. Treasury securities. However, it remains unclear whether SOFR will attain wide
F-49
Table of Contents
Silver Point Specialty Lending Fund
Notes to Consolidated Financial Statements (continued)
(in U.S. Dollars)
acceptance among all market participants as the replacement rate for LIBOR. As such, it is not possible to predict all potential effects of these changes on U.S. and global credit markets, the Fund or its ability to obtain favorable financing terms for its portfolio investments.
In connection with an investment in senior secured loans or mezzanine loans, the Fund may also acquire equity securities, including warrants. In addition, the Fund may invest directly in the equity securities of portfolio companies. However, the equity interests the Fund receives may not appreciate in value and, in fact, may decline in value. Accordingly, the Fund may not be able to realize gains from its equity interests, and any gains that it does realize on the disposition of any equity interests may not be sufficient to offset any other losses. Additionally, the Fund’s investment in non-quoted equity involves a high degree of business and financial risk which may adversely affect the performance of such investment and result in substantial losses. The Fund’s portfolio may consist of non-U.S. securities, financial instruments and other assets. Such investments require consideration of certain risks typically not associated with investing in the U.S., including, among other things, trade balances and imbalances and related economic policies, political difficulties, unfavorable currency exchange rate fluctuations, imposition of exchange control regulation by the U.S. or non-U.S. governments, greater market volatility, differing securities market structures and various administrative difficulties.
The Adviser anticipates that a substantial portion of the Fund’s portfolio may consist of investments that have been given a below investment grade rating by a ratings agency or have not been rated by any ratings agency. Securities in the lower-rated categories and comparable non-rated securities may be subject to greater risk of loss of principal and interest than higher-rated and comparable non-rated securities, and are generally considered to be predominantly speculative with respect to the issuer’s capacity to pay interest and repay principal. Because investors generally perceive that there are greater risks associated with lower-rated and comparable non-rated securities, the yields and prices of such securities may be more volatile than those for higher-rated and comparable non-rated securities.
The Fund may find it necessary or desirable to foreclose on certain loans and take possession of collateral. The foreclosure process can be lengthy and expensive. Borrowers may resist foreclosure actions by asserting numerous claims, counterclaims and defenses against the Fund, including, without limitation, numerous lender liability claims and defenses, even when such assertions may have no basis of fact in an effort to prolong the foreclosure action and force the lender into a modification of the loan or a favorable buy-out of the borrower’s position. Further, there can be no assurance that the Adviser or any management team established by the Adviser will be able to successfully operate, hold or maintain the collateral in accordance with the Fund’s expectations, or that the Fund will be able to profit from its investment in such collateral. In addition, there may be significant expenditures associated with holding real property, including real estate taxes and maintenance costs. The liquidation proceeds upon sale of the collateral may be less than the amount invested in the loan, resulting in a loss to the Fund. Any costs or delays involved in the liquidation of the collateral may further reduce proceeds received and thus, may increase any loss.
The Fund may make investments which may not be advantageously disposed of prior to the date scheduled for dissolution of the Fund. Although the Adviser expects that investments (and their underlying collateral, if applicable) will be able to be disposed of prior to dissolution, the Fund may have to sell, distribute or otherwise dispose of investments (or collateral) at a disadvantageous time for a price which is less than the price that could have been obtained if they were held for a longer period of time. Additionally, due to the illiquid nature of the collateral that underlies many of the positions which the Fund is expected to acquire, as well as the uncertainties of the reorganization and active management process, the Adviser is unable to predict with confidence what the exit strategy will ultimately be for any given position.
F-50
Table of Contents
Silver Point Specialty Lending Fund
Notes to Consolidated Financial Statements (continued)
(in U.S. Dollars)
The Fund may directly or indirectly leverage its investments through borrowings and may utilize leverage embedded in derivative instruments. The Fund may secure such leverage with one or more assets of the Fund, and pre-Conversion, a pledge of the Partners’ undrawn capital commitments or the General Partner’s right to call capital. Fund leverage will result in the Fund controlling more assets than the Fund has capital contributions from Partners. Direct leverage increases the Fund’s returns if the Fund earns a greater return on investments purchased with borrowed funds than the Fund’s cost of borrowing such funds. However, the use of leverage exposes the Fund to additional levels of risk, including (i) net asset value declining more sharply than it otherwise would have had the Fund not borrowed to make the investments, (ii) margin calls or interim margin requirements which may force premature liquidations of investment positions, (iii) losses on investments where the investment fails to earn a return that equals or exceeds the Fund’s cost of borrowing such funds and (iv) general interest rate fluctuations, which may adversely impact the rate of return on invested capital. For the years ended December 31, 2021 and December 31, 2020, the Fund has leveraged its investments through the credit facilities.
There can be no assurance that the principals or other employees or affiliated investors will continue to be employed by, or associated with the Adviser, General Partner or their respective affiliates throughout the life of the Fund. The loss of key personnel could have a material adverse effect on the Fund.
Legal, tax and regulatory changes could occur during the term of the Fund that may adversely affect the Fund. Regulatory changes and scrutiny may increase the Fund’s exposure to potential liabilities and to legal, compliance and other related costs. Increased regulatory oversight may also impose additional administrative burdens on the Adviser, including, without limitation, responding to investigations and implementing new policies and procedures.
From time to time, the Fund and its affiliates are subject to litigation arising in the normal course of business. While it is not possible to predict the results of such litigation, the Adviser does not believe the ultimate outcome of these types of matters will have a material adverse effect on the Fund’s financial position or results of operations or cash flows.
Investors with interests greater than 10% of the Fund’s total interests are considered significant. Two Investors own significant interests which, in the aggregate, comprise 31.7% of the Fund’s total net assets. The Fund could be materially affected by the actions of individual investors with significant balances such as the pre-Conversion risk of default for unfunded capital commitments; however, given these Investors are large institutional investors, the Fund believes this risk to be minimal.
9. Net Assets
Committed Capital
The capital commitment of each Limited Partner was drawn down from time to time over the life of the Fund through September 30, 2021, which was the expiration of the limited partnership’s commitment period (the “Commitment Period”). As of December 31, 2020, approximately 17% of commitments remained unfunded. On September 28, 2021, the Fund called all remaining unfunded capital, releasing all Partners from their unfunded commitments. During the Commitment Period there were no defaulting Partners.
In connection with the Conversion on November 15, 2021, the Fund issued approximately 36.9 million shares to existing Investors at a value of $15 per share.
The combined invested capital of Investors affiliated with the Fund is approximately 18% of the Fund at December 31, 2021 and December 31, 2020.
F-51
Table of Contents
Silver Point Specialty Lending Fund
Notes to Consolidated Financial Statements (continued)
(in U.S. Dollars)
Distributions
Pre-Conversion
The General Partner generally distributed Current Income (as defined below) and realization proceeds with respect to an investment or any portion thereof, other than certain amounts withheld in accordance with the Fund’s distribution provisions, at least quarterly and within 45 days of the calendar quarter end. “Current Income” (i.e. cash received by the Fund from investments other than realization proceeds, reduced by Fund expenses, other than Temporary Investment Income (as defined below), was distributed pro rata in proportion to the capital contributions with respect to such investment. “Temporary Investment Income” (i.e. investments in high grade instruments lasting less than one year, commercial paper with maturities less than six months, bank deposit accounts, money market funds, and certificates of deposit) were distributed pro rata in proportion to their aggregate capital contributions to the Fund. Realization proceeds with respect to an investment or any portion thereof, after consideration of the Capital Gains Incentive Compensation (see below), any priority distributions to which the General Partner is entitled, and other permitted withholdings for investments and expenses, was distributed pro rata in proportion to the capital contributions to such investment.
Post-Conversion
The Board may, in its discretion, authorize the Fund to distribute ratably among the Shareholders of any class or series of shares in the Fund in accordance with the number of outstanding full and fractional shares of such class or series as the Board may deem proper or as may otherwise be determined in accordance with the governing documents of the Fund. Any such distribution may be made in cash or property (including without limitation any type of obligations of the Fund or any assets thereof) or shares of any class or series or any combination thereof. It is expected that the Board will authorize quarterly distributions of the majority of the Fund’s net investment income. The Board may always retain such amount as it may deem necessary to pay the debts or expenses or meet other obligations of the Fund, or as it may otherwise deem desirable to use in the conduct of its affairs or to retain for future requirements or extensions of the business. Once the Fund becomes a regulated investment company, inasmuch as the computation of net income and gains for Federal income tax purposes may vary from the computation thereof on the books, the above provisions shall be interpreted to give the Board the power in their discretion to distribute for any fiscal year as ordinary dividends and as capital gains distributions, respectively, additional amounts sufficient to enable the Fund to avoid or reduce liability for taxes.
Management Fee
During the Commitment Period of the limited partnership, the Fund paid the Adviser, in respect of each Limited Partner, a management fee, payable quarterly in arrears, equal to the sum of (x) 0.0625% (0.25% annualized) of such Limited Partner’s unfunded commitment and (y) 0.1875% (0.75% annualized) of such Limited Partner’s aggregate drawn Commitment. After the expiration or termination of the Commitment Period, the Fund paid the Adviser, in respect of each Limited Partner, a management fee, payable quarterly in arrears, equal to 0.1875% (0.75% annualized) of such Limited Partner’ net capital contributions. If the Fund commences winding up in connection with the expiration of the Fund’s term, the management fee will be payable until the final termination of the Fund following the complete realization of the Fund’s investments. Following an IPO, the management fee calculation is proposed to change to 1.25% per annum of the average of the Fund’s total gross assets (excluding cash and temporary investments in cash equivalents) at the end of the two most recently completed calendar quarters. Additionally, following the time at which the Fund is permitted to reduce its asset coverage, the Management Fee charged on assets financed using leverage over a 1.0x debt-to-equity ratio is expected to be 1.00%. The proposed Management Fee changes are subject to Shareholder vote.
F-52
Table of Contents
Silver Point Specialty Lending Fund
Notes to Consolidated Financial Statements (continued)
(in U.S. Dollars)
If the Adviser or its affiliates or their respective officers, directors, partners, members, shareholders or employees (other than the Fund, any alternative investment vehicle, any subsidiary or any parallel investment entity) receive any compensation in the form of directors’ fees, transaction fees, monitoring fees, financial advisory fees, investment management fees, origination fees, arrangement fees, commitment fees, broken deal fees and other fees for similar or related services and any other compensation in connection with lending or other financial transactions or investments (including, without limitation, acquisitions, dispositions, recapitalizations and restructurings), the portion of such compensation ratably attributable to investments made (or, in the case of broken deal fees, proposed) either directly by the Fund or indirectly through an alternative investment vehicle or a subsidiary will be either (a) paid to the Fund (or such alternative investment vehicle, as applicable) or (b) prior to Conversion, applied as an offset to the management fee. During the period from January 1, 2021 through November 14, 2021 and for the year ended December 31, 2020, the Fund’s management fees were reduced by $630,007 and $111,795, respectively, in connection with such compensation. Prior to Conversion, if the management fee was not sufficient to offset any such fees, any shortfall was be carried forward to reduce future management fees until the earlier of such time as (i) such shortfall is fully offset or (ii) the Adviser is no longer entitled to receive the management fee from the Fund. Upon Conversion or such time that the Adviser is no longer entitled to receive the management fee from the Fund, any remaining shortfall will be paid by the Adviser or its affiliates to the Fund. As of November 15, 2021 there was no shortfall and all such fees were fully offset against the management fee. Any fees received by the Adviser or its affiliates in connection with or arising from providing administrative, collateral management or similar or related services in respect of lending or other financial transactions or investments will be retained by the Adviser and will not be applied as an offset to the management fee.
The Adviser, in its sole discretion, was permitted to waive or reduce the management fee with respect to any Limited Partner prior to Conversion. The capital accounts of the General Partner and affiliated individuals and entities were not charged a management fee prior to Conversion.
Income Incentive Compensation
Prior to the first public offering and sale of equity securities of the Fund resulting in aggregate net proceeds to the Fund and/or any selling stockholders, in combination with any previous public offerings, in excess of the lesser of $65,000,000 and 15% of aggregate commitments to the Fund at the time of such offering (“a Qualified IPO”), Income incentive compensation is calculated and payable to the Adviser (“Income Incentive Compensation”) quarterly in arrears based on the amount by which Pre-Incentive Compensation Net Investment Income (as defined below) in respect of the current calendar quarter and the eleven preceding calendar quarters (beginning with the calendar quarter that commences on July 1, 2015) (the “Trailing Twelve Quarters”) exceeds the Hurdle Rate Amount (as defined below). Income Incentive Compensation is calculated and paid as follows:
No amount in any calendar quarter in which the Fund’s Pre-Incentive Compensation Net Investment Income for the Trailing Twelve Quarters does not exceed the Hurdle Rate Amount.
100% of the Fund’s Pre-Incentive Compensation Net Investment Income, if any, that exceeds the Hurdle Rate Amount but is less than or equal to the Catch-up Amount (as defined below).
For any calendar quarter in which the Fund’s Pre-Incentive Compensation Net Investment Income for the Trailing Twelve Quarters exceeds the Catch-up Amount, 15% of the excess will be paid.
The “Hurdle Rate Amount” is calculated on a quarterly basis by multiplying 1.75% (7.00% annualized) and the Fund’s net asset value (total assets less indebtedness) at the beginning of each applicable calendar quarter comprising the relevant Trailing Twelve Quarters. The “Catch-up Amount” is calculated on a quarterly basis by
F-53
Table of Contents
Silver Point Specialty Lending Fund
Notes to Consolidated Financial Statements (continued)
(in U.S. Dollars)
multiplying 2.0588% (8.2353% annualized) and the Fund’s net asset value at the beginning of each applicable calendar quarter comprising the relevant Trailing Twelve Quarters. The above calculations are appropriately adjusted for capital contributions and distributions during the quarter. “Pre-Incentive Compensation Net Investment Income” means, with respect to any period, (a) interest income, dividend income and any other income accrued or earned by the Fund during such period minus (b) operating expenses for that period (including Management Fee, expenses payable under any Administration Agreement, and any interest expense and dividends paid on any issued and outstanding preferred stock, but excluding incentive compensation); provided that Pre-Incentive Compensation Net Investment Income also includes net interest income, if any, from derivative financial instruments or swaps on a look-through basis as if the Fund owned the reference assets directly (where such net interest income is defined as the difference between (A) the interest income and fees received in respect of the reference assets of the derivative financial instrument or swap and (B) the interest expense or financing charges paid by the Fund to the derivative or swap counterparty); provided further that Pre-Incentive Compensation Net Investment Income does not include any realized capital gains, realized capital losses or unrealized capital appreciation or depreciation; and provided further that if the resulting amount is negative, then Pre-Incentive Compensation Net Investment Income will be expressed as zero (0).
Following a Qualified IPO, the Income Incentive Compensation rate is expected to be 17.5%, subject to Shareholder vote.
Capital Gains Incentive Compensation
Prior to Conversion, the General Partner is entitled to receive Capital Gains Incentive Compensation which is determined in arrears at the end of each Fiscal Year and equal to 15% of the Fund’s Cumulative Capital Gains through the end of such Fiscal Year, less the amount of any Capital Gains Incentive Compensation previously distributed to the General Partner for any prior period. Following Conversion, but prior to a Qualified IPO, the Capital Gains Incentive Compensation will be paid by the Fund to the Adviser. Following a Qualified IPO, the Capital Gains Compensation rate is expected to be 17.5%, subject to Shareholder vote. Capital Gains Incentive Compensation together with Income Incentive Compensation is collectively referred to as “Incentive Compensation”. The General Partner may, in its sole discretion, waive or reduce the Incentive Compensation with respect to any Limited Partner prior to Conversion. The capital accounts of the General Partner and affiliated individuals and entities were not charged Incentive Compensation prior to Conversion.
Upon Conversion, all management fee and Incentive Compensation waivers were eliminated.
Clawback
Immediately prior to Conversion or if a Qualified IPO has not occurred by the IPO Outside Date and the Fund’s term expires (including or after an extension), the General Partner and the Adviser will pay to the Fund, if necessary, an aggregate amount equal to the “Clawback Amount” as of such date, subject to certain tax limitations as described in the governing Fund documents. The Clawback Amount is equal to (i) the cumulative Incentive Compensation received by the Adviser since the Initial Closing though the date of determination of the Clawback Amount minus (ii) the product of 15% (adjusted for any waiver or reduction of Incentive Compensation paid by Limited Partners) and the sum of the aggregate amount of Cumulative Capital Gains (without giving consideration to any unrealized gains) and Pre-Incentive Compensation Net Investment Income generated since the Initial Closing and through the date of determination of the Clawback Amount. Immediately prior to Conversion, the Adviser paid the Fund and the Fund distributed to investors $2,515,797. There is no additional accrued clawback for the period from November 15, 2021 through December 31, 2021.
F-54
Table of Contents
Silver Point Specialty Lending Fund
Notes to Consolidated Financial Statements (continued)
(in U.S. Dollars)
Income and Expense Allocation
Pre-conversion
As a limited partnership, items of income and expense (other than the management fee and Incentive Compensation) generally are shared by all of the Partners pro rata in accordance with their Commitments; provided, however, that the Fund may specially allocate expenses incurred on behalf of, or in respect of, a particular Partner by virtue of such partner’s specific regulatory, legal or tax status to such partner.
Post-conversion
As a unitized trust, income and expenses are generally shared by all of the Shareholders pro rata in accordance with their number of shares; provided that if for legal, regulatory or tax reasons that could materially affect the Fund, the Fund may require a Shareholder to withdraw from the Trust and to be admitted as a shareholder of a parallel investment entity and transfer such a proportionate share of the Trust’s assets and liabilities, and the expenses of such transfer shall be borne by such Shareholder.
10. Related Party Transactions
The Adviser, or its affiliates, is authorized to pay expenses in the name of and on behalf of the Fund which they deem necessary or advisable. To the extent that expenses borne by or reimbursements due to the Fund are paid by the Adviser, or an affiliate, the Fund will reimburse or seek reimbursement from such party. As of December 31, 2021 and December 31, 2020, the Fund owed $19,048 and $903 to an affiliate, respectively.
11. Commitments and Contingencies
In the normal course of its operations, the Fund enters into contracts that contain a variety of representations and warranties which provide general indemnifications. The Fund’s maximum exposure under these arrangements is unknown as this would involve future claims that may be made against the Fund that have not yet occurred. However, based on experience, the Fund expects the risk of significant loss to be remote.
F-55
Table of Contents
Silver Point Specialty Lending Fund
Notes to Consolidated Financial Statements (continued)
(in U.S. Dollars)
The Fund has commitments to fund investments in its portfolio. These unfunded commitments are not recorded in the Fund’s consolidated statements of assets and liabilities since these commitments may have contingencies and expire without being drawn upon, the total commitment amount does not necessarily represent future cash requirements. A summary of the composition of the Fund’s revolving, delayed draw, and equity unfunded commitments as of December 31, 2021 and December 31, 2020 is shown in the table below:
| December 31, 2021 | December 31, 2020 | |||||||||||
4501 Woodhaven Holding LLC | 1st Lien Term Loan | $ | — | $ | 90,000 | |||||||
Amerijet Holdings Inc | 1st Lien Revolver | 1,654,123 | — | |||||||||
APEG Maxey, LP | 1st Lien Term Loan | — | 981,338 | |||||||||
ARIAM Partners, LLC | 1st Lien Term Loan | — | 405,514 | |||||||||
8800 Austin, LLC and 8900 Austin, LLC | 1st Lien Term Loan | 2,731,604 | — | |||||||||
BayMark Health Services Inc | 1st Lien Term Loan | 3,276,502 | — | |||||||||
BayMark Health Services Inc | 2nd Lien Term Loan | 5,486,667 | — | |||||||||
Buck Global LLC | 1st Lien Revolver | 1,766,038 | — | |||||||||
Buck Global LLC | 1st Lien Term Loan | 3,679,245 | — | |||||||||
Circle Graphics Inc | 1st Lien Term Loan | 1,611,723 | — | |||||||||
Denardo Capital II LLC | 2nd Lien Term Loan | — | 93,467 | |||||||||
Dye & Durham Corp | 1st Lien Revolver | 323,844 | — | |||||||||
Dye & Durham Corp | 1st Lien Term Loan | 863,585 | — | |||||||||
Inotiv Inc | 1st Lien Revolver | 1,244,402 | — | |||||||||
Inotiv Inc | 1st Lien Term Loan | 2,407,230 | — | |||||||||
Kaplan Woodland Hills Property Company, LLC | 1st Lien Term Loan | 665,667 | 210,886 | |||||||||
LAC Acquisition LLC d/b/a Lighthouse Autism Center | 1st Lien Revolver | 1,500,000 | — | |||||||||
LAC Acquisition LLC d/b/a Lighthouse Autism Center | 1st Lien Term Loan | 3,500,000 | — | |||||||||
LCP Edge Holdco, LLC | 1st Lien Revolver | — | 4,643,152 | |||||||||
LMG Holdings | 1st Lien Revolver | 690,670 | 1,292,308 | |||||||||
Masterwork Electronics, Inc. | 1st Lien Revolver | 1,844,250 | 1,844,250 | |||||||||
National Dentex Corp | 1st Lien Revolver | 1,003,655 | 929,310 | |||||||||
National Dentex Corp | 1st Lien Term Loan | 631,931 | 4,832,414 | |||||||||
Owens & Minor Inc | 1st Lien Revolver | — | 32,532,500 | |||||||||
Patientpoint LLC | 1st Lien Revolver | — | 2,027,250 | |||||||||
Phoenix House Foundation, Inc | 1st Lien Term Loan | — | 492,711 | |||||||||
Speedstar Holding LLC | 1st Lien Term Loan | 3,017,241 | — | |||||||||
STV Group, Inc | 1st Lien Revolver | 1,300,000 | — | |||||||||
Sutherland Global Services Inc | 1st Lien Revolver | 1,332,943 | 1,332,943 | |||||||||
Thunder Grandparent Inc. (dba Telestream, Inc) | 1st Lien Revolver | 775,862 | 1,293,103 | |||||||||
TH Liquidating Trust | Trust Interest | 285,563 | 285,563 | |||||||||
UC Tower Hillside Crossing | 1st Lien Term Loan | 541,999 | 328,593 | |||||||||
Union Crossing Development, LP | 1st Lien Term Loan | — | 4,879 | |||||||||
SP-CREH 19 Highline LLC | 1st Lien Revolver | 3,305,326 | — | |||||||||
|
|
|
| |||||||||
Total | $ | 45,440,070 | $ | 53,620,181 | ||||||||
|
|
|
| |||||||||
The Adviser determines the manner and extent in which the Fund invests based on various factors which may change over time. The Fund’s investment objectives and obligations may result in financial support provided to
F-56
Table of Contents
Silver Point Specialty Lending Fund
Notes to Consolidated Financial Statements (continued)
(in U.S. Dollars)
investee companies through funding of debt instruments and equity. During the years ended December 31, 2021 and December 31, 2020, the Fund funded contractually required revolving credit facility and equity obligations of $34,588,598 and $29,082,148, respectively. During the years ended December 31, 2021 and December 31, 2020, the Fund made follow-on investments of $7,397,779 and $28,425,776, respectively, directly with issuers where it had existing positions in such issuer.
From time to time, the Fund and its affiliates are subject to litigation arising in the normal course of business. While it is not possible to predict the results of such litigation, the Adviser does not believe the ultimate outcome of these types of matters will have a material adverse effect on the Fund’s financial position or results of operations or cash flows.
12. Financial Highlights
The following summarizes the financial highlights for the Fund for the years ended December 31, 2021 through December 31, 2017:
| 2021 | 2020 | 2019 | 2018 | 2017 | ||||||||||||||||
Per Share Data(1) | ||||||||||||||||||||
Net asset value, beginning of period | $ | 15.00 | N/A | N/A | N/A | N/A | ||||||||||||||
Net investment income | 0.20 | N/A | N/A | N/A | N/A | |||||||||||||||
Net realized and unrealized gain/(loss) | 0.07 | N/A | N/A | N/A | N/A | |||||||||||||||
|
|
|
|
|
|
|
|
|
| |||||||||||
Total from operations | 0.27 | N/A | N/A | N/A | N/A | |||||||||||||||
|
|
|
|
|
|
|
|
|
| |||||||||||
Total increase/(decrease) in net assets | 0.27 | N/A | N/A | N/A | N/A | |||||||||||||||
|
|
|
|
|
|
|
|
|
| |||||||||||
Net asset value, end of period | $ | 15.27 | N/A | N/A | N/A | N/A | ||||||||||||||
|
|
|
|
|
|
|
|
|
| |||||||||||
Shares outstanding, end of period(2) | 36,907,451 | N/A | N/A | N/A | N/A | |||||||||||||||
Total Return, based on net asset value(3) | 15.98 | % | 13.11 | % | 12.26 | % | 15.35 | % | 18.87 | % | ||||||||||
Ratios / Supplemental Data | ||||||||||||||||||||
Net assets, end of period | $ | 563,684,976 | $ | 467,498,084 | $ | 462,306,302 | $ | 459,385,074 | $ | 329,923,972 | ||||||||||
Weighted-average shares outstanding(2) | 36,907,451 | N/A | N/A | N/A | N/A | |||||||||||||||
Ratio of net expenses (including incentive fees) to average net assets(4) | 6.51 | % | 6.78 | % | 8.98 | % | 9.50 | % | 7.07 | % | ||||||||||
Ratio of net investment income to average net assets(4)(5) | 9.90 | % | 12.23 | % | 13.12 | % | 15.98 | % | 17.00 | % | ||||||||||
Ratio of incentive fees to average net assets(4)(5) | 1.78 | % | 1.73 | % | 1.83 | % | 2.22 | % | 2.30 | % | ||||||||||
Ratio of net expenses before management fee offsets and incentive compensation(4) | 4.86 | % | 5.08 | % | 7.17 | % | 7.30 | % | 4.87 | % | ||||||||||
Ratio of management fee offsets(4) | (0.13 | )% | (0.03 | )% | (0.02 | )% | (0.02 | )% | (0.10 | )% | ||||||||||
F-57
Table of Contents
Silver Point Specialty Lending Fund
Notes to Consolidated Financial Statements (continued)
(in U.S. Dollars)
| 2021 | 2020 | 2019 | 2018 | 2017 | ||||||||||||||||
Ratio of net expenses (excluding incentive fees) to average net assets(4) | 4.73 | % | 5.05 | % | 7.15 | % | 7.28 | % | 4.77 | % | ||||||||||
Ratio of interest and financing related expenses to average net assets(7) | 3.04 | % | 3.70 | % | 5.65 | % | 5.66 | % | 3.00 | % | ||||||||||
Portfolio turnover rate(7) | 69.55 | % | 47.01 | % | 51.55 | % | 41.81 | % | 40.77 | % | ||||||||||
Asset coverage ratio(8) | 2.07 | 2.55 | 2.19 | 2.21 | 2.11 | |||||||||||||||
Total capital commitments, end of period(6) | N/A | $ | 552,165,000 | $ | 552,165,000 | $ | 552,165,000 | $ | 552,165,000 | |||||||||||
Ratio of total contributed capital to total committed capital, end of period(6) | N/A | 82.58 | % | 81.15 | % | 80.08 | % | 57.47 | % | |||||||||||
IRR(9) | 14.81 | % | 14.57 | % | 15.24 | % | 16.78 | % | 18.18 | % | ||||||||||
The information presented in the financial highlights includes both affiliated and non-affiliated Limited Partners. |
| (1) | Per share data is only applicable to the period of November 15, 2021 to December 31, 2021, when the Fund was a unitized trust. Prior to November 15, 2021, the Fund was non-unitized Partnership (See Note 1). |
| (2) | Shares outstanding are only applicable to the period of November 15, 2021 to December 31, 2021, when the Fund was a unitized trust. Prior to November 15, 2021, the Fund was non-unitized Partnership (See Note 1). |
| (3) | For the periods ended December 31, 2017 to November 14, 2021, total return based on net asset value is calculated as Investors total increase (decrease) in net assets and partners’ capital resulting from operations divided by Investors capital during the year, adjusted for capital inflows, outflows and items of income and expense as presented in the consolidated statements of operations. The total return until November 14, 2021 was calculated by geometrically linking weighted fund monthly returns. For the period November 15, 2021 to December 31, 2021, total return is calculated as the change in net asset value during the respective periods, assuming dividends and distributions, if any, are reinvested. The total return for the year ended 2021 was calculated by geometrically linking the return for each period. |
| (4) | The ratios above are calculated and based upon the weighted average Limited Partners’ capital during the year and items of income and expense as presented in the consolidated statements of operations. Individual Limited Partner’s ratios may vary from the ratios listed above. |
| (5) | The net investment income (loss) ratio is presented after the effects of expenses (including interest expense on the Signature Facility, Revolving Credit Facility, 2021 CLO and 2026 Notes, the management fee and Incentive Compensation). Individual Limited Partner’s ratios may vary from the ratios listed above. |
| (6) | Capital commitments and the ratio of total contributed capital to total committed capital is only applicable for the years ended December 31, 2020, 2019, 2018 and 2017. The Fund converted to a unitized trust effective November 15, 2021. Prior to November 15, 2021, the Fund was non-unitized Partnership (See Note 1). |
| (7) | Portfolio turnover is calculated as the lesser of (i) purchases of portfolio investments or (ii) the aggregate total of sales of portfolio investments plus any prepayments received, divided by the monthly average of the value of portfolio investments owned by the Fund during the year. |
| (8) | Asset coverage ratio is equal to (i) the sum of (A) net assets/ partners’ capital at the end of the period and (B) total debt, net of unamortized debt issuance costs, including reverse repurchase agreements with maturity dates greater than 60 days issued at the end of the period, divided by (ii) total debt, net of unamortized debt issuance costs, including reverse repurchase agreements with maturity dates greater than 60 days at the end of the period. |
F-58
Table of Contents
Silver Point Specialty Lending Fund
Notes to Consolidated Financial Statements (continued)
(in U.S. Dollars)
| (9) | For the years ended December 31, 2017 through 2021, the internal rate of return for the Fund’s Limited Partners from the Initial Closing are net of management fee and Incentive Compensation and have been computed based on the amounts and effective dates of capital called from and distributed to Limited Partners and the ending partners’ capital at the end of each respective year of the Limited Partners’capital accounts, adjusted for the effects of the subsequent closes. |
13. Subsequent Events
Management has performed an evaluation of subsequent events through March 16, 2022 which is the date the consolidated financial statements were available to be issued and has determined that no additional items require adjustments to, or disclosure in the consolidated financial statements other than those items described below.
On January 21, 2022, the Fund issued the $45 million of Tranche B aggregate principal of the 2026 Notes.
On February 14, 2022, the Board declared, and the Fund paid, a dividend of $0.25 per share for Shareholders of record on December 31, 2021.
F-59
Table of Contents
Silver Point Specialty Lending Fund
For the years ended December 31, 2022 and December 31, 2021
F-60
Table of Contents
Report of Independent Registered Public Accounting Firm
To the Board of Trustees and Shareholders of Silver Point Specialty Lending Fund
Opinion on the Financial Statements
We have audited the accompanying consolidated statements of assets and liabilities, including the consolidated schedules of investments, of Silver Point Specialty Lending Fund and its subsidiaries (the “Fund”) as of December 31, 2022 and 2021, and the related consolidated statements of operations, changes in net assets and cash flows for each of the two years in the period ended December 31, 2022, including the related notes (collectively referred to as the “consolidated financial statements”). In our opinion, the consolidated financial statements present fairly, in all material respects, the financial position of the Fund as of December 31, 2022 and 2021, and the results of its operations, changes in its net assets and its cash flows for each of the two years in the period ended December 31, 2022 in conformity with accounting principles generally accepted in the United States of America.
Basis for Opinion
These consolidated financial statements are the responsibility of the Fund’s management. Our responsibility is to express an opinion on the Fund’s consolidated financial statements based on our audits. We are a public accounting firm registered with the Public Company Accounting Oversight Board (United States) (PCAOB) and are required to be independent with respect to the Fund in accordance with the U.S. federal securities laws and the applicable rules and regulations of the Securities and Exchange Commission and the PCAOB.
We conducted our audits of these consolidated financial statements in accordance with the standards of the PCAOB and in accordance with auditing standards generally accepted in the United States of America. Those standards require that we plan and perform the audit to obtain reasonable assurance about whether the consolidated financial statements are free of material misstatement, whether due to error or fraud.
Our audits included performing procedures to assess the risks of material misstatement of the consolidated financial statements, whether due to error or fraud, and performing procedures that respond to those risks. Such procedures included examining, on a test basis, evidence regarding the amounts and disclosures in the consolidated financial statements. Our audits also included evaluating the accounting principles used and significant estimates made by management, as well as evaluating the overall presentation of the consolidated financial statements. Our procedures included confirmation of securities owned as of December 31, 2022 and 2021 by correspondence with the custodians, brokers and portfolio companies; when replies were not received from brokers, we performed other auditing procedures. We believe that our audits provide a reasonable basis for our opinion.
/s/ PricewaterhouseCoopers LLP
New York, New York
March 29, 2023
We have served as the Fund’s auditor since 2015.
F-61
Table of Contents
Silver Point Specialty Lending Fund
Consolidated Statements of Assets and Liabilities
(in U.S. Dollars)
| December 31, 2022 | December 31, 2021 | |||||||
Assets | ||||||||
Investments owned, at fair value: | ||||||||
Non-controlled, non-affiliated investments (amortized cost of $784,623,099 and $877,365,765, respectively), (pledged collateral of $558,258,229 and $632,167,439, respectively) | $ | 772,797,091 | $ | 900,939,824 | ||||
Controlled investments (amortized cost of $46,857,175 and $50,879,305, respectively) | 42,627,570 | 50,209,406 | ||||||
Foreign currency forward contracts, at fair value | 242,373 | 10,606 | ||||||
Interest rate swaps, at fair value | 165,747 | — | ||||||
Cash and cash equivalents | 126,670,529 | 29,586,805 | ||||||
Foreign cash held at banks (cost $3,506,000 and $8,013,153, respectively) | 3,490,954 | 7,996,689 | ||||||
Restricted cash | 41,633,237 | 90,359,610 | ||||||
Due from broker | 2,969,179 | — | ||||||
Receivable for unsettled transactions | — | 24,464,754 | ||||||
Interest receivable | 9,464,884 | 5,916,223 | ||||||
Deferred financing costs | 326,646 | 849,549 | ||||||
Deferred offering costs | 1,272,403 | 612,542 | ||||||
Other assets | 1,313,540 | 804,023 | ||||||
|
|
|
| |||||
Total assets | $ | 1,002,974,153 | $ | 1,111,750,031 | ||||
|
|
|
| |||||
Liabilities | ||||||||
Debt (Note 7) (net of unamortized debt issuance costs of $4,392,436 and $4,982,608, respectively) | $ | 458,582,502 | $ | 525,192,330 | ||||
Foreign currency forward contracts, at fair value | 125,230 | 1,000,310 | ||||||
Due to broker | — | 480,000 | ||||||
Payable for unsettled transactions | 2,618,673 | 10,922,414 | ||||||
Interest payable | 4,848,329 | 2,692,458 | ||||||
Management fees payable to an affiliate (Note 9) | 1,029,726 | 526,221 | ||||||
Income incentive compensation payable to an affiliate (Note 9) | 2,147,321 | 4,556,926 | ||||||
Capital gains incentive compensation payable to an affiliate (Note 9) | — | 1,411,001 | ||||||
Payable to Trustees | — | 34,453 | ||||||
Accrued expenses and other liabilities | 2,645,540 | 1,248,942 | ||||||
|
|
|
| |||||
Total liabilities | $ | 471,997,321 | $ | 548,065,055 | ||||
|
|
|
| |||||
Commitments and contingencies (Note 11) | ||||||||
Net assets | ||||||||
Common shares $0.001 par value, unlimited shares authorized; 36,907,451 and 36,907,451 shares issued and outstanding, respectively | $ | 36,907 | $ | 36,907 | ||||
Paid-in-capital in excess of par | 553,574,864 | 553,574,864 | ||||||
Distributable earnings (losses) | (22,634,939 | ) | 10,073,205 | |||||
|
|
|
| |||||
Total net assets | $ | 530,976,832 | $ | 563,684,976 | ||||
|
|
|
| |||||
Total liabilities and net assets | $ | 1,002,974,153 | $ | 1,111,750,031 | ||||
|
|
|
| |||||
Net asset value per share | $ | 14.39 | $ | 15.27 | ||||
|
|
|
| |||||
The accompanying notes are an integral part of these consolidated financial statements.
F-62
Table of Contents
Silver Point Specialty Lending Fund
Consolidated Statements of Operations
(in U.S. Dollars)
| For the Year Ended December 31, 2022 | For the Year Ended December 31, 2021 | |||||||
Investment income: | ||||||||
Non-controlled/non-affiliated investments: | ||||||||
Interest income | $ | 87,062,137 | $ | 73,250,199 | ||||
Interest income payment-in-kind | 2,414,053 | 5,687,630 | ||||||
Dividend income | 3,306,442 | — | ||||||
Other income | 1,780,433 | 53,227 | ||||||
Controlled investments: | ||||||||
Interest income | 1,675,487 | 796,355 | ||||||
Interest income payment-in-kind | 46,540 | 73,871 | ||||||
Dividend income | — | 72,373 | ||||||
|
|
|
| |||||
Total investment income | $ | 96,285,092 | $ | 79,933,655 | ||||
|
|
|
| |||||
Expenses: | ||||||||
Interest and financing expenses | 24,040,294 | 14,797,393 | ||||||
Management fee (Note 9) | 4,118,679 | 3,310,511 | ||||||
Income incentive compensation (Note 9) | 9,160,228 | 7,219,959 | ||||||
Capital gains incentive compensation (Note 9) | (1,429,874 | ) | 1,429,874 | |||||
Professional fees | 3,028,258 | 3,943,465 | ||||||
Administration fees | 1,912,572 | 388,551 | ||||||
Trustee fees | 357,500 | 90,000 | ||||||
Other general and administrative expenses | 1,663,242 | 1,154,051 | ||||||
|
|
|
| |||||
Expenses before management fee offset | 42,850,899 | 32,333,804 | ||||||
Management fee offset (Note 9) | — | (630,007 | ) | |||||
|
|
|
| |||||
Total expenses, net of management fee offset | $ | 42,850,899 | $ | 31,703,797 | ||||
|
|
|
| |||||
Net investment income | $ | 53,434,193 | $ | 48,229,858 | ||||
|
|
|
| |||||
Net gain (loss): | ||||||||
Net realized gain (loss): | ||||||||
Non-controlled/non-affiliated investments | (5,855,478 | ) | 2,486,181 | |||||
Controlled investments | 202,974 | — | ||||||
Foreign currency transactions | (1,683,719 | ) | 1,302,450 | |||||
Foreign currency forward contracts | 4,628,392 | 4,378,260 | ||||||
Interest rate cap | — | (90,000 | ) | |||||
Interest rate swaps | (827 | ) | — | |||||
Total return swaps | 163,071 | 826,438 | ||||||
|
|
|
| |||||
Total net realized gain (loss) | (2,545,587 | ) | 8,903,329 | |||||
|
|
|
| |||||
Net change in unrealized appreciation (depreciation): | ||||||||
Non-controlled/non-affiliated investments | (35,400,067 | ) | 16,530,965 | |||||
Controlled investments | (3,559,706 | ) | (135,069 | ) | ||||
Translation of assets and liabilities in foreign currencies | (32,263 | ) | 466,879 | |||||
Foreign currency forward contracts | 1,106,847 | (955,200 | ) | |||||
Interest rate cap | — | 90,000 | ||||||
Interest rate swaps | 165,747 | — | ||||||
Total return swaps | — | (428,081 | ) | |||||
|
|
|
| |||||
Total net change in unrealized appreciation (depreciation) | (37,719,442 | ) | 15,569,494 | |||||
|
|
|
| |||||
Net gain (loss) | (40,265,029 | ) | 24,472,823 | |||||
|
|
|
| |||||
Net increase (decrease) in net assets and partners’ capital resulting from operations* | $ | 13,169,164 | $ | 72,702,681 | ||||
|
|
|
| |||||
Net increase (decrease) in net assets from operations for the period November 15, 2021 through December 31, 2021* | $ | 10,073,205 | ||||||
|
| |||||||
Net investment income per share (Basic and Dilutive)* | $ | 1.45 | $ | 0.20 | ||||
|
|
|
| |||||
Earnings per share (Basic and Dilutive)* | $ | 0.36 | $ | 0.27 | ||||
|
|
|
| |||||
Weighted average shares outstanding* | 36,907,451 | 36,907,451 | ||||||
|
|
|
| |||||
| * | The Fund converted to a unitized trust effective November 15, 2021. Prior to November 15, 2021, the Fund was a non-unitized partnership (See Note 1). |
The accompanying notes are an integral part of these consolidated financial statements.
F-63
Table of Contents
Silver Point Specialty Lending Fund
Consolidated Statements of Changes in Net Assets
(in U.S. Dollars)
| Limited Partners | General Partner | Shareholders | Total | |||||||||||||
Partners’ capital, January 1, 2021 | $ | 467,474,388 | $ | 23,696 | $ | — | $ | 467,498,084 | ||||||||
Allocation of net increase (decrease) in partners’ capital resulting from operations: | ||||||||||||||||
Net investment income | 40,974,452 | 4,522 | — | 40,978,974 | ||||||||||||
Net realized gain (loss) | 7,186,886 | 651 | — | 7,187,537 | ||||||||||||
Net change in unrealized appreciation (depreciation) | 14,461,662 | 1,303 | — | 14,462,965 | ||||||||||||
|
|
|
|
|
|
|
| |||||||||
Net increase (decrease) in partners’ capital resulting from operations | 62,623,000 | 6,476 | — | 62,629,476 | ||||||||||||
Contributions (Note 9) | 93,148,816 | 27,118 | — | 93,175,934 | ||||||||||||
Distributions (Note 9) | (69,684,930 | ) | (6,793 | ) | — | (69,691,723 | ) | |||||||||
|
|
|
|
|
|
|
| |||||||||
Net increase (decrease) in partners’ capital | 86,086,886 | 26,801 | — | 86,113,687 | ||||||||||||
Conversion of partnership interests to issuance of common shares* | (553,561,274 | ) | (50,497 | ) | 553,611,771 | — | ||||||||||
Net investment income | — | — | 7,250,884 | 7,250,884 | ||||||||||||
Net realized gain (loss) | — | — | 1,715,792 | 1,715,792 | ||||||||||||
Net change in unrealized appreciation (depreciation) | — | — | 1,106,529 | 1,106,529 | ||||||||||||
|
|
|
|
|
|
|
| |||||||||
Net increase (decrease) in net assets from operations for the period November 15, 2021 through December 31, 2021* | — | — | 10,073,205 | 10,073,205 | ||||||||||||
|
|
|
|
|
|
|
| |||||||||
Net Assets, December 31, 2021 | $ | — | $ | — | $ | 563,684,976 | $ | 563,684,976 | ||||||||
|
|
|
|
|
|
|
| |||||||||
Net Assets, January 1, 2022 | $ | — | $ | — | $ | 563,684,976 | $ | 563,684,976 | ||||||||
Net increase (decrease) in net assets resulting from operations: | ||||||||||||||||
Net investment income | — | — | 53,434,193 | 53,434,193 | ||||||||||||
Net realized gain (loss) | — | — | (2,545,587 | ) | (2,545,587 | ) | ||||||||||
Net change in unrealized appreciation (depreciation) | — | — | (37,719,442 | ) | (37,719,442 | ) | ||||||||||
|
|
|
|
|
|
|
| |||||||||
Net increase (decrease) in net assets resulting from operations | — | — | 13,169,164 | 13,169,164 | ||||||||||||
Dividends paid to shareholders (Note 9) | — | — | (45,877,308 | ) | (45,877,308 | ) | ||||||||||
|
|
|
|
|
|
|
| |||||||||
Net increase (decrease) in net assets | — | — | (32,708,144 | ) | (32,708,144 | ) | ||||||||||
|
|
|
|
|
|
|
| |||||||||
Net Assets, December 31, 2022 | $ | — | $ | — | $ | 530,976,832 | $ | 530,976,832 | ||||||||
|
|
|
|
|
|
|
| |||||||||
| * | The Fund converted to a unitized trust effective November 15, 2021. Prior to November 15, 2021, the Fund was a non-unitized partnership (See Note 1). |
The accompanying notes are an integral part of these consolidated financial statements.
F-64
Table of Contents
Silver Point Specialty Lending Fund
Consolidated Statements of Cash Flows
(in U.S. Dollars)
| For the Year Ended December 31, 2022 | For the Year Ended December 31, 2021 | |||||||
Cash flows from operating activities | ||||||||
Net increase (decrease) in net assets resulting from operations | $ | 13,169,164 | $ | 72,702,681 | ||||
Adjustments to reconcile net increase (decrease) in net assets resulting from operations to net cash provided by (used in) operating activities | ||||||||
Accretion of discount on investments | (10,271,953 | ) | (12,775,398 | ) | ||||
Amortization of deferred financing costs and debt issuance costs | 2,750,773 | 2,606,768 | ||||||
Payments for purchase of investments | (237,845,487 | ) | (744,805,483 | ) | ||||
Proceeds from sales, paydowns and resolutions of investments | 340,910,843 | 586,915,927 | ||||||
Interest paid-in-kind | (1,681,111 | ) | (5,813,348 | ) | ||||
Net realized (gain) loss from investments | 5,652,504 | (2,486,181 | ) | |||||
Net realized (gain) loss from interest rate cap | — | 90,000 | ||||||
Net change in unrealized (appreciation) depreciation from investments | 38,959,773 | (16,395,896 | ) | |||||
Net change in unrealized (appreciation) depreciation from interest rate swaps | (165,747 | ) | — | |||||
Net change in unrealized (appreciation) depreciation from total returns swaps | — | 428,081 | ||||||
Net change in unrealized (appreciation) depreciation from interest rate cap | — | (90,000 | ) | |||||
Net change in unrealized (appreciation) depreciation from foreign currency forward contracts | (1,106,847 | ) | 955,200 | |||||
Net (increase) decrease in operating assets and increase (decrease) in operating liabilities | ||||||||
Due from broker | (2,969,179 | ) | 1,769,418 | |||||
Receivable for unsettled transactions | 24,464,754 | (21,175,284 | ) | |||||
Interest receivable | (3,548,661 | ) | 1,818,910 | |||||
Other assets | (509,517 | ) | 254,895 | |||||
Due to broker | (480,000 | ) | 480,000 | |||||
Payable for unsettled transactions | (8,303,741 | ) | (17,312,066 | ) | ||||
Interest payable | 2,155,871 | 2,300,845 | ||||||
Management fees payable to an affiliate | 503,505 | (156,547 | ) | |||||
Income incentive compensation payable to an affiliate | (2,409,605 | ) | 2,630,522 | |||||
Capital gains incentive compensation payable to an affiliate | (1,411,001 | ) | 1,411,001 | |||||
Payable to Trustees | (34,453 | ) | 34,453 | |||||
Accrued expenses and other liabilities | 1,396,598 | 240,532 | ||||||
|
|
|
| |||||
Net cash provided by (used in) operating activities | 159,226,483 | (146,370,970 | ) | |||||
|
|
|
| |||||
Cash flows from financing activities | ||||||||
Proceeds from debt borrowings | 81,300,000 | 847,621,385 | ||||||
Principal debt payments | (148,500,000 | ) | (613,863,137 | ) | ||||
Payment of deferred financing costs and debt issuance costs | (1,637,698 | ) | (7,574,761 | ) | ||||
Payment of deferred offering costs | (659,861 | ) | (230,699 | ) | ||||
Reverse repurchase agreements, net | — | (7,569,334 | ) | |||||
Capital contributions | — | 93,175,934 | ||||||
Capital distributions / dividends paid | (45,877,308 | ) | (69,691,723 | ) | ||||
|
|
|
| |||||
Net cash provided by (used in) financing activities | (115,374,867 | ) | 241,867,665 | |||||
|
|
|
| |||||
Net increase (decrease) in cash and cash equivalents, foreign cash held at banks and restricted cash | 43,851,616 | 95,496,695 | ||||||
|
|
|
| |||||
Cash and cash equivalents, foreign cash held at banks and restricted cash, beginning of year | 127,943,104 | 32,446,409 | ||||||
|
|
|
| |||||
Cash and cash equivalents, foreign cash held at banks and restricted cash, end of year | $ | 171,794,720 | $ | 127,943,104 | ||||
|
|
|
| |||||
Supplemental cash flow information | ||||||||
Cash paid during the year for interest | $ | 19,133,650 | $ | 9,889,780 | ||||
Cash paid during the year for income taxes | $ | 28,455 | $ | 48,283 | ||||
Supplemental disclosure of non-cash information | ||||||||
Conversion of partnership interests to issuance of common shares | $ | — | $ | 553,611,771 | ||||
F-65
Table of Contents
Silver Point Specialty Lending Fund
Consolidated Statements of Cash Flows
(in U.S. Dollars)
| For the Year Ended December 31, 2022 | For the Year Ended December 31, 2021 | |||||||
Cash and cash equivalents | $ | 126,670,529 | $ | 29,586,805 | ||||
Foreign cash held at banks | 3,490,954 | 7,996,689 | ||||||
Restricted cash | 41,633,237 | 90,359,610 | ||||||
|
|
|
| |||||
Total cash and cash equivalents, foreign cash held at banks and restricted cash shown in the consolidated statements of cash flows | $ | 171,794,720 | $ | 127,943,104 | ||||
|
|
|
| |||||
The accompanying notes are an integral part of these consolidated financial statements.
F-66
Table of Contents
Silver Point Specialty Lending Fund
Consolidated Schedule of Investments
December 31, 2022
(in U.S. Dollars)
Portfolio Company(1) | Industry | Rate(2) | Interest Rate | Original Acquisition Date | Maturity Date | Par Amount ($) / Shares or Ownership % / Notional ($)(3) | Cost / Amortized Cost(4) | Fair Value | % of Net Assets(5) | |||||||||||||||||||||||||
Non-Controlled/Non-Affiliated Investments | ||||||||||||||||||||||||||||||||||
Secured Loans | ||||||||||||||||||||||||||||||||||
1st Lien Term Loan | ||||||||||||||||||||||||||||||||||
United States of America | ||||||||||||||||||||||||||||||||||
48Forty Solutions LLC(7)(9) | Industrial Products & Services | S+5.65%, 1.00% Floor | 9.76 | % | 4/8/2022 | 11/30/2026 | $ | 6,560,948 | $ | 6,446,421 | $ | 6,332,299 | 1.19 | % | ||||||||||||||||||||
8800 Austin, LLC and 8900 Austin, LLC(6)(7)(8) | Multi-Family | L+5.50%, 0.50% Floor | 9.62 | 6/24/2021 | 6/24/2023 | 15,000,000 | 12,533,279 | 12,543,794 | 2.36 | |||||||||||||||||||||||||
A Stucki TopCo Holdings LLC & Intermediate Holdings LLC(7)(9) | Manufacturing | S+7.01%, 1.00% Floor | 11.59 | 11/23/2022 | 11/23/2027 | 8,787,796 | 8,572,260 | 8,568,951 | 1.61 | |||||||||||||||||||||||||
Accurate Background LLC(7)(8) | Business Services | L+6.00%, 1.00% Floor | 10.73 | 9/7/2022 | 3/26/2027 | 3,299,976 | 3,035,087 | 3,129,331 | 0.59 | |||||||||||||||||||||||||
Accurate Background LLC(7)(8)(9) | Business Services | L+6.00%, 1.00% Floor | 10.73 | 10/18/2021 | 3/26/2027 | 16,452,278 | 15,171,312 | 15,601,516 | 2.94 | |||||||||||||||||||||||||
ADS Tactical Inc(7)(9) | Aerospace & Defense | L+5.75%, 1.00% Floor | 10.14 | 3/4/2021 | 3/19/2026 | 6,843,750 | 6,773,263 | 6,601,243 | 1.24 | |||||||||||||||||||||||||
Advanced Integration Technology LP(7)(9) | Aerospace & Defense | S+6.85%, 1.00% Floor | 11.51 | 5/24/2022 | 5/24/2027 | 13,690,843 | 13,318,565 | 13,291,135 | 2.50 | |||||||||||||||||||||||||
Allentown LLC(7)(9) | Healthcare Equipment & Supplies | S+6.00%, 1.00% Floor | 10.32 | 4/22/2022 | 4/22/2027 | 9,797,681 | 9,622,438 | 9,628,399 | 1.81 | |||||||||||||||||||||||||
Allentown LLC(6)(7)(18)(19) | Healthcare Equipment & Supplies | S+6.10%, 1.00% Floor (0.50% on unfunded) | 0.50 | 4/22/2022 | 4/22/2027 | 1,737,691 | (12,814 | ) | (30,023 | ) | (0.01 | ) | ||||||||||||||||||||||
Alpine US Bidco LLC(7)(8)(9) | Food Products | L+5.25%, 0.75% Floor | 9.54 | 4/28/2021 | 5/3/2028 | 8,522,940 | 8,384,561 | 8,171,860 | 1.54 | |||||||||||||||||||||||||
Amerijet Holdings Inc(7)(8)(9) | Airline & Airport Services | L+6.75%, 1.00% Floor | 11.13 | 12/28/2021 | 12/28/2025 | 16,558,988 | 16,172,431 | 16,112,727 | 3.03 | |||||||||||||||||||||||||
Ampler Restaurant Group(7)(9) | Restaurants | L+5.88%, 1.00% Floor | 10.60 | 7/20/2021 | 7/21/2027 | 4,937,500 | 4,856,954 | 4,769,625 | 0.90 | |||||||||||||||||||||||||
Aprimo Inc(7)(8) | Technology | S+6.44%, 0.75% Floor | 10.76 | 5/26/2022 | 5/26/2028 | 2,204,956 | 2,164,242 | 2,165,967 | 0.41 | |||||||||||||||||||||||||
Azurity Pharmaceuticals Inc(7)(9) | Pharmaceuticals & Life Sciences | L+6.00%, 0.75% Floor | 10.75 | 9/28/2021 | 9/20/2027 | 17,337,130 | 16,655,922 | 16,511,883 | 3.11 | |||||||||||||||||||||||||
BayMark Health Services Inc(6)(7) | Healthcare Providers & Services | L+5.00%, 2.00% Floor (2.00% on unfunded) | 9.73 | 11/19/2021 | 6/11/2027 | 4,505,062 | 2,605,557 | 2,554,491 | 0.48 | |||||||||||||||||||||||||
BayMark Health Services Inc(7)(9) | Healthcare Providers & Services | L+5.00%, 1.00% Floor | 9.73 | 6/10/2021 | 6/11/2027 | 4,236,255 | 4,202,349 | 4,154,086 | 0.78 | |||||||||||||||||||||||||
BEL USA LLC(7)(9) | E-Commerce | S+6.10%, 1.00% Floor | 10.38 | 2/1/2021 | 2/2/2025 | 172,371 | 170,898 | 170,687 | 0.03 | |||||||||||||||||||||||||
BEL USA LLC(7)(9) | E-Commerce | S+6.10%, 1.00% Floor | 10.38 | 12/13/2018 | 2/2/2025 | 10,474,011 | 10,408,426 | 10,370,697 | 1.95 | |||||||||||||||||||||||||
Buck Global LLC(6)(7)(19) | Professional Services | L+7.00%, 1.00% Floor (1.00% on unfunded) | 1.00 | 9/29/2021 | 9/29/2026 | 3,679,245 | (27,539 | ) | 23,915 | 0.00 | ||||||||||||||||||||||||
Buck Global LLC(7)(8)(9) | Professional Services | L+7.00%, 1.00% Floor | 10.75 | 9/29/2021 | 9/29/2026 | 13,391,993 | 13,178,726 | 13,479,041 | 2.54 | |||||||||||||||||||||||||
Circle Graphics Inc(6)(7) | E-Commerce | S+7.25%, 2.25% Floor (1.00% on unfunded) | 11.92 | 7/12/2021 | 9/30/2024 | 1,601,975 | 482,806 | 508,080 | 0.10 | |||||||||||||||||||||||||
Circle Graphics Inc(7)(8)(9) | E-Commerce | S+7.25%, 2.25% Floor | 11.92 | 2/17/2021 | 9/30/2024 | 18,973,479 | 18,804,444 | 18,948,812 | 3.57 | |||||||||||||||||||||||||
Circle Graphics Inc(7)(8) | E-Commerce | S+7.25%, 2.25% Floor | 11.92 | 7/12/2021 | 9/30/2024 | 2,877,381 | 2,817,603 | 2,873,640 | 0.54 | |||||||||||||||||||||||||
Columbia Helicopters Inc.(7)(13) | Aerospace & Defense | S+10.51%, 1.50% Floor | 15.09 | 8/20/2019 | 8/20/2024 | 12,393,013 | 12,234,582 | 12,075,132 | 2.27 | |||||||||||||||||||||||||
The accompanying notes are an integral part of these consolidated financial statements.
F-67
Table of Contents
Silver Point Specialty Lending Fund
Consolidated Schedule of Investments
December 31, 2022
(in U.S. Dollars)
Portfolio Company(1) | Industry | Rate(2) | Interest Rate | Original Acquisition Date | Maturity Date | Par Amount ($) / Shares or Ownership % / Notional ($)(3) | Cost / Amortized Cost(4) | Fair Value | % of Net Assets(5) | |||||||||||||||||||||||
DMT Solutions Global Corp (dba Bluecrest)(7)(8)(9) | Industrial Products & Services | L+7.00%, 1.00% Floor | 11.01 | % | 12/15/2020 | 7/2/2024 | $ | 17,999,643 | $ | 17,479,666 | $ | 17,096,961 | 3.22 | % | ||||||||||||||||||
Evolution Well Services Holdings LLC(7)(8)(9) | Oilfield Services | S+7.40%, 0.75% Floor | 11.98 | 3/2/2022 | 3/4/2027 | 22,718,096 | 22,318,148 | 22,278,501 | 4.20 | |||||||||||||||||||||||
Form Technologies Inc(9) | Automobiles & Components | L+4.50%, 1.00% Floor | 9.20 | 2/19/2021 | 7/22/2025 | 3,511,110 | 3,477,424 | 3,023,943 | 0.57 | |||||||||||||||||||||||
Form Technologies Inc(9) | Automobiles & Components | L+9.00%, 1.00% Floor | 13.70 | 2/19/2021 | 10/22/2025 | 1,420,355 | 1,406,880 | 1,122,080 | 0.21 | |||||||||||||||||||||||
Grindr Capital LLC (fka San Vicente Capital LLC)(7)(8)(9) | Technology | S+8.26%, 1.50% Floor | 12.52 | 11/14/2022 | 11/15/2027 | 10,040,791 | 9,941,625 | 10,013,089 | 1.89 | |||||||||||||||||||||||
Heligear Acquisition Co(7)(8)(9) | Aerospace & Defense | L+7.75%, 2.00% Floor | 12.33 | 9/6/2019 | 7/30/2024 | 26,980,459 | 26,793,157 | 26,698,717 | 5.03 | |||||||||||||||||||||||
HOA Finance Two, LLC / HOA II Finance Two, LLC(6)(7) | Real Estate Development & Management | S+6.95%, 3.47% Floor | 11.08 | 10/17/2022 | 11/1/2025 | 14,926,857 | 14,619,475 | 14,613,045 | 2.75 | |||||||||||||||||||||||
Inotiv Inc(7)(8)(10) | Pharmaceuticals & Life Sciences | L+6.25%, 1.00% Floor | 11.46 | 11/3/2021 | 11/5/2026 | 16,677,181 | 16,414,183 | 15,967,524 | 3.01 | |||||||||||||||||||||||
iPark Riverdale (aka Rising Ground Yonkers)(6)(7)(8) | Real Estate Development & Management | S+6.00%, 3.75% Floor | 10.32 | 12/23/2022 | 12/31/2024 | 6,526,401 | 6,006,624 | 6,005,807 | 1.13 | |||||||||||||||||||||||
Kleinfelder Group Inc(7)(8)(9) | Professional Services | L+5.25%, 1.00% Floor | 9.98 | 11/15/2021 | 11/29/2024 | 6,600,000 | 6,557,064 | 6,531,021 | 1.23 | |||||||||||||||||||||||
Kleinfelder Group Inc(7)(9) | Professional Services | L+5.75%, 1.00% Floor | 10.48 | 10/13/2020 | 11/29/2024 | 4,809,742 | 4,786,052 | 4,769,739 | 0.90 | |||||||||||||||||||||||
LAC Acquisition LLC d/b/a Lighthouse Autism Center(7)(8)(12) | Healthcare Providers & Services | S+11.10%, 2.50% Floor | 15.12 | 7/23/2021 | 7/23/2026 | 18,249,907 | 17,973,400 | 18,251,301 | 3.44 | |||||||||||||||||||||||
LeVecke Real Estate Holdings, LLC(6)(7) | Real Estate Development & Management | S+7.50%, 3.75% Floor | 11.68 | 12/1/2022 | 5/29/2026 | 4,568,481 | 4,223,115 | 4,223,007 | 0.80 | |||||||||||||||||||||||
Lightstone Holdco LLC | Power Generation | S+5.75%, 1.00% Floor | 10.07 | 3/29/2022 | 1/30/2027 | 5,976,994 | 5,422,670 | 5,458,490 | 1.03 | |||||||||||||||||||||||
LMG Holdings(7)(8)(9) | Manufacturing | L+6.50%, 1.00% Floor | 11.23 | 4/30/2021 | 4/30/2026 | 12,177,540 | 12,102,118 | 12,045,572 | 2.27 | |||||||||||||||||||||||
Mad Engine Global, LLC(7)(8)(9) | Consumer Apparel | L+7.00%, 1.00% Floor | 11.73 | 6/30/2021 | 7/15/2027 | 11,625,000 | 11,384,974 | 10,109,100 | 1.90 | |||||||||||||||||||||||
Manchester Acquisition Sub LLC(7)(9) | Specialty Chemicals | S+5.90%, 0.75% Floor | 10.30 | 11/16/2021 | 12/1/2026 | 6,550,328 | 6,257,827 | 6,146,173 | 1.16 | |||||||||||||||||||||||
MMS BidCo LLC(7)(9) | Healthcare Providers & Services | S+6.75%, 1.00% Floor | 11.20 | 6/30/2022 | 6/30/2027 | 8,776,720 | 8,614,091 | 8,620,615 | 1.62 | |||||||||||||||||||||||
Mountaineer Merger Corp(7)(9) | Specialty Retail | L+7.00%, 0.75% Floor | 11.44 | 10/22/2021 | 10/26/2028 | 4,875,000 | 4,748,415 | 3,644,550 | 0.69 | |||||||||||||||||||||||
National Dentex Corp(7)(8)(12) | Healthcare Providers & Services | L+8.00%, 1.00% Floor (1.00% on unfunded) | 12.73 | 10/26/2020 | 10/3/2025 | 4,783,970 | 4,716,709 | 4,689,487 | 0.88 | |||||||||||||||||||||||
National Dentex Corp(7)(8)(9)(12) | Healthcare Providers & Services | L+8.00%, 1.00% Floor | 12.73 | 4/1/2021 | 10/3/2025 | 1,471,966 | 1,444,641 | 1,442,895 | 0.27 | |||||||||||||||||||||||
National Dentex Corp(7)(8)(12) | Healthcare Providers & Services | L+8.00%, 1.00% Floor (1.00% on unfunded) | 12.73 | 4/1/2021 | 10/3/2025 | 864,194 | 848,239 | 847,126 | 0.16 | |||||||||||||||||||||||
National Dentex Corp(7)(9)(12) | Healthcare Providers & Services | L+8.00%, 1.00% Floor | 12.73 | 10/26/2020 | 10/3/2025 | 9,727,086 | 9,589,071 | 9,534,976 | 1.80 | |||||||||||||||||||||||
Nine West Holdings Inc(8) | Consumer Brands | L+8.00% | 12.39 | 3/19/2019 | 3/20/2024 | 2,362,839 | 2,323,088 | 1,919,075 | 0.36 | |||||||||||||||||||||||
Northstar Group Services Inc(7)(9) | Business Services | L+5.50%, 1.00% Floor | 9.82 | 9/29/2021 | 11/12/2026 | 9,677,416 | 9,639,115 | 9,517,254 | 1.79 | |||||||||||||||||||||||
Odlum Data Lender, LLC(7)(10)(20) | Telecommunications | L+6.35%, 0.15% Floor | 10.47 | 6/23/2021 | 12/23/2022 | 15,000,000 | 15,000,000 | 15,097,500 | 2.84 | |||||||||||||||||||||||
The accompanying notes are an integral part of these consolidated financial statements.
F-68
Table of Contents
Silver Point Specialty Lending Fund
Consolidated Schedule of Investments
December 31, 2022
(in U.S. Dollars)
Portfolio Company(1) | Industry | Rate(2) | Interest Rate | Original Acquisition Date | Maturity Date | Par Amount ($) / Shares or Ownership % / Notional ($)(3) | Cost / Amortized Cost(4) | Fair Value | % of Net Assets(5) | |||||||||||||||||||||||||
Pacira BioSciences Inc(7)(8)(9)(10) | Pharmaceuticals & Life Sciences | S+7.00%, 0.75% Floor | 10.77 | % | 12/6/2021 | 12/7/2026 | $ | 24,553,391 | $ | 23,947,738 | $ | 24,062,324 | 4.53 | % | ||||||||||||||||||||
PaperWorks Industries Holding Corp.(7)(8)(9) | Paper & Packaging | L+6.75%, 1.00% Floor | 11.16 | 12/18/2020 | 12/18/2025 | 22,666,667 | 22,144,786 | 22,379,063 | 4.21 | |||||||||||||||||||||||||
Paycom Acquisition LLC/Corp (aka Onyx CenterSource, Inc)(7)(9) | Business Services | S+7.90%, 1.00% Floor | 12.48 | 12/6/2022 | 12/7/2027 | 4,871,586 | 4,726,472 | 4,725,439 | 0.89 | |||||||||||||||||||||||||
Peloton Interactive Inc(8)(10) | Consumer Products | S+7.10%, 0.50% Floor | 11.76 | 5/17/2022 | 5/25/2027 | 9,791,316 | 9,388,616 | 9,604,449 | 1.81 | |||||||||||||||||||||||||
ProFrac Holdings II LLC(7)(9)(10) | Oilfield Services | S+7.51%, 1.00% Floor | 11.10 | 7/25/2022 | 3/4/2025 | 3,189,908 | 3,109,368 | 3,172,603 | 0.60 | |||||||||||||||||||||||||
ProFrac Holdings II LLC(7)(9)(10) | Oilfield Services | S+7.51%, 1.00% Floor | 11.10 | 9/1/2022 | 3/4/2025 | 1,275,963 | 1,247,461 | 1,269,041 | 0.24 | |||||||||||||||||||||||||
Smarsh Inc(7)(9) | Software & Services | S+6.50%, 0.75% Floor | 11.29 | 2/18/2022 | 2/18/2029 | 3,781,071 | 3,713,038 | 3,712,185 | 0.70 | |||||||||||||||||||||||||
Smarsh Inc(6)(7) | Software & Services | S+6.50%, 0.75% Floor (1.00% on unfunded) | 11.29 | 2/18/2022 | 2/18/2029 | 945,268 | 459,706 | 455,412 | 0.09 | |||||||||||||||||||||||||
Spectrum Group Buyer Inc (Pixelle)(8)(9) | Specialty Chemicals | S+6.50%, 0.75% Floor | 9.44 | 5/11/2022 | 5/19/2028 | 19,461,605 | 19,097,875 | 18,326,312 | 3.45 | |||||||||||||||||||||||||
Speedstar Holding LLC(7)(8)(9) | Automobiles & Components | L+7.00%, 1.00% Floor | 11.73 | 1/22/2021 | 1/22/2027 | 21,338,276 | 21,035,423 | 20,897,952 | 3.94 | |||||||||||||||||||||||||
STV Group, Inc(7)(9) | Professional Services | L+5.35% | 9.67 | 8/3/2020 | 12/11/2026 | 4,982,030 | 4,816,485 | 4,889,862 | 0.92 | |||||||||||||||||||||||||
Thunder Grandparent Inc. (dba Telestream, Inc)(7)(8)(9) | Software & Services | S+9.40%, 1.00% Floor | 13.67 | 10/15/2020 | 10/15/2025 | 13,432,759 | 13,265,929 | 13,433,436 | 2.53 | |||||||||||||||||||||||||
Tops MBO Corp(7)(8)(9) | Staples Retail | L+8.00%, 1.25% Floor | 12.41 | 11/8/2021 | 5/8/2026 | 10,522,642 | 10,297,633 | 10,243,180 | 1.93 | |||||||||||||||||||||||||
Touchstone Acquisition Inc (aka Team Technologies)(7)(9) | Healthcare Equipment & Supplies | L+6.00%, 0.75% Floor | 10.38 | 12/23/2021 | 12/31/2028 | 6,566,081 | 6,453,307 | 6,445,468 | 1.21 | |||||||||||||||||||||||||
Voyant Beauty(7)(9)(15) | Consumer Products | S+10.50%, 1.00% Floor | 14.12 | 5/13/2022 | 5/13/2027 | 8,840,811 | 8,601,902 | 8,631,726 | 1.63 | |||||||||||||||||||||||||
WIS Holdings Inc(7)(8)(9) | Business Services | L+7.75%, 1.00% Floor | 12.48 | 5/20/2021 | 5/20/2025 | 20,461,409 | 20,126,626 | 19,768,543 | 3.72 | |||||||||||||||||||||||||
WPG Holdings LLC(9) | | Real Estate Development & Management | | L+6.00%, 0.75% Floor | 10.38 | 10/21/2021 | 10/20/2025 | 9,754,661 | 9,827,613 | 9,787,973 | 1.84 | |||||||||||||||||||||||
|
|
|
|
|
| |||||||||||||||||||||||||||||
Total United States of America 1st Lien Term Loan | 614,919,522 | 610,029,804 | 114.87 | |||||||||||||||||||||||||||||||
|
|
|
|
|
| |||||||||||||||||||||||||||||
Canada | ||||||||||||||||||||||||||||||||||
Dye & Durham Corp(7)(10) | Software & Services | C+5.75%, 0.75% Floor | 10.69 | 12/3/2021 | 12/3/2027 | C$ | 5,003,838 | 3,857,558 | 3,642,835 | 0.69 | ||||||||||||||||||||||||
Dye & Durham Corp(6)(7)(10)(18)(19) | Software & Services | C+5.75%, 0.75% Floor (1.00% on unfunded) | 1.00 | 12/3/2021 | 12/3/2027 | C$ | 1,105,821 | (5,396 | ) | (10,953 | ) | (0.00 | ) | |||||||||||||||||||||
Gateway Casinos & Entertainment Ltd(10) | Gaming & Leisure | C+8.00%, 0.75% Floor | 12.57 | 10/21/2021 | 10/22/2027 | C$ | 3,489,291 | 2,782,432 | 2,526,093 | 0.48 | ||||||||||||||||||||||||
Gateway Casinos & Entertainment Ltd(9)(10) | Gaming & Leisure | S+8.15%, 0.75% Floor | 12.14 | 10/21/2021 | 10/22/2027 | 12,977,304 | 12,784,847 | 12,733,980 | 2.40 | |||||||||||||||||||||||||
|
|
|
|
|
| |||||||||||||||||||||||||||||
Total Canada 1st Lien Term Loan | 19,419,441 | 18,891,955 | 3.57 | |||||||||||||||||||||||||||||||
|
|
|
|
|
| |||||||||||||||||||||||||||||
The accompanying notes are an integral part of these consolidated financial statements.
F-69
Table of Contents
Silver Point Specialty Lending Fund
Consolidated Schedule of Investments
December 31, 2022
(in U.S. Dollars)
Portfolio Company(1) | Industry | Rate(2) | Interest Rate | Original Acquisition Date | Maturity Date | Par Amount ($) / Shares or Ownership % / Notional ($)(3) | Cost / Amortized Cost(4) | Fair Value | % of Net Assets(5) | |||||||||||||||||||||||||
Cayman Islands | ||||||||||||||||||||||||||||||||||
JO ET Holdings Limited (Grindr HoldCo)(7)(9)(10)(11) | Technology | S+13.00%, 1.00% Floor | 17.53 | % | 12/15/2021 | 12/15/2026 | $ | 6,327,833 | $ | 6,231,778 | $ | 6,253,666 | 1.18 | % | ||||||||||||||||||||
|
|
|
|
|
| |||||||||||||||||||||||||||||
Total Cayman Islands 1st Lien Term Loan | 6,231,778 | 6,253,666 | 1.18 | |||||||||||||||||||||||||||||||
|
|
|
|
|
| |||||||||||||||||||||||||||||
Luxembourg | ||||||||||||||||||||||||||||||||||
Mallinckrodt International Finance S.A.(8) | Pharmaceuticals & Life Sciences | L+5.25%, 0.75% Floor | 9.99 | 10/13/2020 | 9/30/2027 | 13,433,943 | 12,741,930 | 10,103,467 | 1.90 | |||||||||||||||||||||||||
|
|
|
|
|
| |||||||||||||||||||||||||||||
Total Luxembourg 1st Lien Term Loan | 12,741,930 | 10,103,467 | 1.90 | |||||||||||||||||||||||||||||||
|
|
|
|
|
| |||||||||||||||||||||||||||||
Netherlands | ||||||||||||||||||||||||||||||||||
OLA Netherlands BV (aka Olacabs / ANI Tech)(7)(8)(10) | Technology | S+6.35%, 0.75% Floor | 10.67 | 12/3/2021 | 12/15/2026 | 4,167,180 | 4,097,618 | 3,984,281 | 0.75 | |||||||||||||||||||||||||
|
|
|
|
|
| |||||||||||||||||||||||||||||
Total Netherlands 1st Lien Term Loan | �� | 4,097,618 | 3,984,281 | 0.75 | ||||||||||||||||||||||||||||||
|
|
|
|
|
| |||||||||||||||||||||||||||||
Singapore | ||||||||||||||||||||||||||||||||||
Oravel Stays Singapore Pte Ltd(7)(8)(10) | Technology | L+8.25%, 0.75% Floor | 12.98 | 6/9/2021 | 6/23/2026 | 4,925,000 | 4,806,116 | 4,653,224 | 0.88 | |||||||||||||||||||||||||
|
|
|
|
|
| |||||||||||||||||||||||||||||
Total Singapore 1st Lien Term Loan | 4,806,116 | 4,653,224 | 0.88 | |||||||||||||||||||||||||||||||
|
|
|
|
|
| |||||||||||||||||||||||||||||
Total 1st Lien Term Loan | 662,216,405 | 653,916,397 | 123.15 | |||||||||||||||||||||||||||||||
|
|
|
|
|
| |||||||||||||||||||||||||||||
1st Lien Revolver | ||||||||||||||||||||||||||||||||||
United States of America | ||||||||||||||||||||||||||||||||||
A Stucki TopCo Holdings LLC & Intermediate Holdings LLC(6)(7)(18)(19) | Manufacturing | S+7.01%, 1.00% Floor (0.50% on unfunded) | 0.50 | 11/23/2022 | 11/23/2027 | 878,780 | (21,500 | ) | (21,873 | ) | 0.00 | |||||||||||||||||||||||
Allentown LLC(6)(7) | Healthcare Equipment & Supplies | P+5.00%, 1.00% Floor (0.50% on unfunded) | 12.50 | 4/22/2022 | 4/22/2027 | 1,158,461 | 385,515 | 381,115 | 0.07 | |||||||||||||||||||||||||
Amerijet Holdings Inc(6)(7)(18)(19) | Airline & Airport Services | L+6.75%, 1.00% Floor (0.04% on unfunded) | 0.38 | 12/28/2021 | 12/28/2025 | 2,756,872 | (61,817 | ) | (71,197 | ) | (0.01 | ) | ||||||||||||||||||||||
Buck Global LLC(6)(7) | Professional Services | L+7.00%, 1.00% Floor (0.50% on unfunded) | 11.50 | 9/29/2021 | 9/29/2026 | 2,207,547 | 1,365,067 | 1,412,573 | 0.27 | |||||||||||||||||||||||||
Inotiv Inc(6)(7)(10)(18)(19) | Pharmaceuticals & Life Sciences | L+6.25%, (0.50% on unfunded) | 0.50 | 11/3/2021 | 11/5/2026 | 1,244,402 | (19,048 | ) | (53,740 | ) | (0.01 | ) | ||||||||||||||||||||||
The accompanying notes are an integral part of these consolidated financial statements.
F-70
Table of Contents
Silver Point Specialty Lending Fund
Consolidated Schedule of Investments
December 31, 2022
(in U.S. Dollars)
Portfolio Company(1) | Industry | Rate(2) | Interest Rate | Original Acquisition Date | Maturity Date | Par Amount ($) / Shares or Ownership % / Notional ($)(3) | Cost / Amortized Cost(4) | Fair Value | % of Net Assets(5) | |||||||||||||||||||||||||
LMG Holdings(6)(7)(18)(19) | Manufacturing | L+6.50%, 1.00% Floor (0.50% on unfunded) | 0.50 | % | 4/30/2021 | 4/30/2026 | $ | 690,670 | $ | (3,745 | ) | $ | (7,389 | ) | 0.00 | % | ||||||||||||||||||
National Dentex Corp(6)(7) | Healthcare Providers & Services | L+7.00%, 1.00% Floor (0.50% on unfunded) | 11.65 | 10/26/2020 | 10/3/2025 | 1,486,897 | 1,440,191 | 1,429,725 | 0.27 | |||||||||||||||||||||||||
Paycom Acquisition LLC/Corp (aka Onyx CenterSource, Inc)(6)(7)(18)(19) | Business Services | S+7.90%, 1.00% Floor (0.50% on unfunded) | 0.50 | 12/6/2022 | 12/7/2027 | 389,727 | (11,527 | ) | (11,692 | ) | 0.00 | |||||||||||||||||||||||
Smarsh Inc(6)(7)(18)(19) | Software & Services | S+6.50%, 0.75% Floor (0.50% on unfunded) | 0.50 | 2/18/2022 | 2/18/2029 | 236,317 | (4,140 | ) | (4,305 | ) | (0.00 | ) | ||||||||||||||||||||||
STV Group, Inc(6)(7) | Professional Services | P+3.50%, (0.50% on unfunded) | 11.00 | 9/30/2021 | 12/13/2024 | 1,300,000 | 428,830 | 528,385 | 0.10 | |||||||||||||||||||||||||
Thunder Grandparent Inc. (dba Telestream, Inc)(6)(7) | Software & Services | S+9.35%, 1.00% Floor (0.50% on unfunded) | 13.56 | 10/15/2020 | 10/15/2025 | 1,293,103 | 890,754 | 905,239 | 0.17 | |||||||||||||||||||||||||
|
|
|
|
|
| |||||||||||||||||||||||||||||
Total United States of America 1st Lien Revolver | 4,388,580 | 4,486,841 | 0.86 | |||||||||||||||||||||||||||||||
|
|
|
|
|
| |||||||||||||||||||||||||||||
Canada | ||||||||||||||||||||||||||||||||||
Dye & Durham Corp(6)(7)(10) | Software & Services | C+5.75%, 0.75% Floor (0.50% on unfunded) | 10.69 | 12/3/2021 | 12/3/2026 | C$ | 414,683 | 168,850 | 158,720 | 0.03 | ||||||||||||||||||||||||
|
|
|
|
|
| |||||||||||||||||||||||||||||
Total Canada 1st Lien Revolver | 168,850 | 158,720 | 0.03 | |||||||||||||||||||||||||||||||
|
|
|
|
|
| |||||||||||||||||||||||||||||
Total 1st Lien Revolver | 4,557,430 | 4,645,561 | 0.89 | |||||||||||||||||||||||||||||||
|
|
|
|
|
| |||||||||||||||||||||||||||||
2nd Lien Term Loan | ||||||||||||||||||||||||||||||||||
United States of America | ||||||||||||||||||||||||||||||||||
Alpine US Bidco LLC(7)(8)(9) | Food Products | L+9.00%, 0.75% Floor | 13.29 | 4/28/2021 | 5/3/2029 | 8,642,861 | 8,419,437 | 8,463,392 | 1.59 | |||||||||||||||||||||||||
BayMark Health Services Inc(6)(7) | Healthcare Providers & Services | L+8.50%, 1.00% Floor (4.00% on unfunded) | 13.23 | 11/19/2021 | 6/11/2028 | 5,486,667 | 2,503,488 | 2,440,871 | 0.46 | |||||||||||||||||||||||||
BayMark Health Services Inc(7)(9) | Healthcare Providers & Services | L+8.50%, 1.00% Floor | 13.23 | 6/10/2021 | 6/11/2028 | 3,333,333 | 3,291,448 | 3,253,494 | 0.61 | |||||||||||||||||||||||||
Tops MBO Corp(7)(16) | Staples Retail | L+13.50%, 2.00% Floor | 18.06 | 11/8/2021 | 5/8/2026 | 547,803 | 548,699 | 538,933 | 0.10 | |||||||||||||||||||||||||
|
|
|
|
|
| |||||||||||||||||||||||||||||
Total United States of America 2nd Lien Term Loan | 14,763,072 | 14,696,690 | 2.76 | |||||||||||||||||||||||||||||||
|
|
|
|
|
| |||||||||||||||||||||||||||||
Total 2nd Lien Term Loan | 14,763,072 | 14,696,690 | 2.76 | |||||||||||||||||||||||||||||||
|
|
|
|
|
| |||||||||||||||||||||||||||||
Total Secured Loans | 681,536,907 | 673,258,648 | 126.80 | |||||||||||||||||||||||||||||||
|
|
|
|
|
| |||||||||||||||||||||||||||||
The accompanying notes are an integral part of these consolidated financial statements.
F-71
Table of Contents
Silver Point Specialty Lending Fund
Consolidated Schedule of Investments
December 31, 2022
(in U.S. Dollars)
Portfolio Company(1) | Industry | Rate(2) | Interest Rate | Original Acquisition Date | Maturity Date | Par Amount ($) / Shares or Ownership % / Notional ($)(3) | Cost / Amortized Cost(4) | Fair Value | % of Net Assets(5) | |||||||||||||||||||||||||
Secured Bonds | ||||||||||||||||||||||||||||||||||
Senior Secured Bonds | ||||||||||||||||||||||||||||||||||
United States of America | ||||||||||||||||||||||||||||||||||
Wesco Aircraft Holdings Inc(12) | Industrial Products & Services | 10.50% | 10.50 | % | 3/28/2022 | 11/15/2026 | $ | 18,388,429 | $ | 17,112,611 | $ | 16,653,021 | 3.14 | % | ||||||||||||||||||||
|
|
|
|
|
| |||||||||||||||||||||||||||||
Total United States of America Senior Secured Bonds | 17,112,611 | 16,653,021 | 3.14 | |||||||||||||||||||||||||||||||
|
|
|
|
|
| |||||||||||||||||||||||||||||
Japan | ||||||||||||||||||||||||||||||||||
Universal Entertainment Corp(9)(10) | Gaming & Leisure | 8.50% | 8.50 | 10/29/2020 | 12/11/2024 | 21,652,000 | 22,404,546 | 20,200,955 | 3.80 | |||||||||||||||||||||||||
|
|
|
|
|
| |||||||||||||||||||||||||||||
Total Japan Senior Secured Bonds | 22,404,546 | 20,200,955 | 3.80 | |||||||||||||||||||||||||||||||
|
|
|
|
|
| |||||||||||||||||||||||||||||
Luxembourg | ||||||||||||||||||||||||||||||||||
Takko Fashion GmbH(10) | Specialty Retail | 5.38% | 5.38 | 9/14/2020 | 11/15/2023 | € | 11,900,000 | 13,338,395 | 10,285,339 | 1.94 | ||||||||||||||||||||||||
Takko Fashion GmbH(10) | Specialty Retail | E+5.38%, 0.00% Floor | 7.14 | 9/16/2020 | 11/15/2023 | € | 6,544,000 | 7,145,620 | 5,687,773 | 1.07 | ||||||||||||||||||||||||
|
|
|
|
|
| |||||||||||||||||||||||||||||
Total Luxembourg Senior Secured Bonds | 20,484,015 | 15,973,112 | 3.01 | |||||||||||||||||||||||||||||||
|
|
|
|
|
| |||||||||||||||||||||||||||||
Netherlands | ||||||||||||||||||||||||||||||||||
Promontoria Holding(10) | Airline & Airport Services | 6.38% | 6.38 | 2/3/2022 | 3/1/2027 | € | 2,168,000 | 2,350,550 | 2,158,830 | 0.41 | ||||||||||||||||||||||||
Promontoria Holding(9)(10) | Airline & Airport Services | 7.88% | 7.88 | 2/3/2022 | 3/1/2027 | 12,170,000 | 12,170,000 | 11,259,985 | 2.12 | |||||||||||||||||||||||||
Promontoria Holding(10) | Airline & Airport Services | E+6.13%, 0.00% Floor | 8.11 | 2/3/2022 | 3/1/2027 | € | 3,970,000 | 4,488,085 | 4,035,148 | 0.76 | ||||||||||||||||||||||||
|
|
|
|
|
| |||||||||||||||||||||||||||||
Total Netherlands Senior Secured Bonds | 19,008,635 | 17,453,963 | 3.29 | |||||||||||||||||||||||||||||||
|
|
|
|
|
| |||||||||||||||||||||||||||||
United Kingdom | ||||||||||||||||||||||||||||||||||
AVIANCA MIDCO 2 LTD(10) | Airline & Airport Services | 9.00% | 9.00 | 12/1/2021 | 12/1/2028 | 13,237,342 | 13,237,342 | 9,794,806 | 1.84 | |||||||||||||||||||||||||
Inspired Entertainment Inc(10) | Technology | 7.88% | 7.88 | 5/13/2021 | 6/1/2026 | £ | 3,616,000 | 5,081,928 | 4,059,155 | 0.76 | ||||||||||||||||||||||||
Mclaren Group Ltd(10) | Automobiles & Components | 7.50% | 7.50 | 7/22/2021 | 8/1/2026 | 4,594,000 | 4,594,000 | 3,383,353 | 0.64 | |||||||||||||||||||||||||
|
|
|
|
|
| |||||||||||||||||||||||||||||
Total United Kingdom Senior Secured Bonds | 22,913,270 | 17,237,314 | 3.24 | |||||||||||||||||||||||||||||||
|
|
|
|
|
| |||||||||||||||||||||||||||||
Total Senior Secured Bonds | 101,923,077 | 87,518,365 | 16.48 | |||||||||||||||||||||||||||||||
|
|
|
|
|
| |||||||||||||||||||||||||||||
The accompanying notes are an integral part of these consolidated financial statements.
F-72
Table of Contents
Silver Point Specialty Lending Fund
Consolidated Schedule of Investments
December 31, 2022
(in U.S. Dollars)
Portfolio Company(1) | Industry | Rate(2) | Interest Rate | Original Acquisition Date | Maturity Date | Par Amount ($) / Shares or Ownership % / Notional ($)(3) | Cost / Amortized Cost(4) | Fair Value | % of Net Assets(5) | |||||||||||||||||||||||||
Equities | ||||||||||||||||||||||||||||||||||
Common Equities | ||||||||||||||||||||||||||||||||||
United States of America | ||||||||||||||||||||||||||||||||||
Impala RGIS Holdings LLC(7) | Business Services | N/A | N/A | 6/25/2020 | N/A | $ | 325,652 | $ | 1,163,115 | $ | 6,122,258 | 1.15 | % | |||||||||||||||||||||
LCP Edge Holdco, LLC(7)(17) | Consumer Services | N/A | N/A | 8/24/2018 | N/A | 1,148 | — | 5,756,066 | 1.08 | |||||||||||||||||||||||||
Welsh Acquisition LLC (7)(17) | Industrial | N/A | N/A | 12/6/2017 | N/A | 20 | % | — | 141,754 | 0.03 | ||||||||||||||||||||||||
|
|
|
|
|
| |||||||||||||||||||||||||||||
Total United States of America Common Equities | 1,163,115 | 12,020,078 | 2.26 | |||||||||||||||||||||||||||||||
|
|
|
|
|
| |||||||||||||||||||||||||||||
Total Common Equities | 1,163,115 | 12,020,078 | 2.26 | |||||||||||||||||||||||||||||||
|
|
|
|
|
| |||||||||||||||||||||||||||||
Total Equities | 1,163,115 | 12,020,078 | 2.26 | |||||||||||||||||||||||||||||||
|
|
|
|
|
| |||||||||||||||||||||||||||||
Total Non-Controlled/Non-Affiliated Investments | $ | 784,623,099 | $ | 772,797,091 | 145.54 | % | ||||||||||||||||||||||||||||
|
|
|
|
|
| |||||||||||||||||||||||||||||
Controlled Investments(21) | ||||||||||||||||||||||||||||||||||
Secured Loans | ||||||||||||||||||||||||||||||||||
1st Lien Term Loan | ||||||||||||||||||||||||||||||||||
United States of America | ||||||||||||||||||||||||||||||||||
SP-CREH 19 Highline LLC(7) | Multi-Family | S+2.00%, 3.00% Floor, 5.00% Cap | 6.38 | 6/28/2021 | 7/1/2024 | $ | 21,000,000 | 21,000,000 | 20,909,700 | 3.94 | ||||||||||||||||||||||||
|
|
|
|
|
| |||||||||||||||||||||||||||||
Total 1st Lien Term Loan | 21,000,000 | 20,909,700 | 3.94 | |||||||||||||||||||||||||||||||
|
|
|
|
|
| |||||||||||||||||||||||||||||
1st Lien Revolver | ||||||||||||||||||||||||||||||||||
United States of America | ||||||||||||||||||||||||||||||||||
SP-CREH 19 Highline LLC(7) | Multi-Family | S+2.00%, 3.00% Floor, 5.00% Cap | 6.38 | 6/28/2021 | 7/1/2024 | 6,125,000 | 6,125,000 | 6,107,544 | 1.15 | |||||||||||||||||||||||||
|
|
|
|
|
| |||||||||||||||||||||||||||||
Total 1st Lien Revolver | 6,125,000 | 6,107,544 | 1.15 | |||||||||||||||||||||||||||||||
|
|
|
|
|
| |||||||||||||||||||||||||||||
Total Secured Loans | 27,125,000 | 27,017,244 | 5.09 | |||||||||||||||||||||||||||||||
|
|
|
|
|
| |||||||||||||||||||||||||||||
Equities | ||||||||||||||||||||||||||||||||||
Common Equities | ||||||||||||||||||||||||||||||||||
United States of America | ||||||||||||||||||||||||||||||||||
SP-CREH 19 Highline LLC(7)(17) | Multi-Family | N/A | N/A | 6/28/2021 | N/A | 70 | % | 6,640,758 | 4,037,355 | 0.76 | ||||||||||||||||||||||||
|
|
|
|
|
| |||||||||||||||||||||||||||||
Total Equities | 6,640,758 | 4,037,355 | 0.76 | |||||||||||||||||||||||||||||||
|
|
|
|
|
| |||||||||||||||||||||||||||||
Trust Interest | ||||||||||||||||||||||||||||||||||
The accompanying notes are an integral part of these consolidated financial statements.
F-73
Table of Contents
Silver Point Specialty Lending Fund
Consolidated Schedule of Investments
December 31, 2022
(in U.S. Dollars)
Portfolio Company(1) | Industry | Rate(2) | Interest Rate | Original Acquisition Date | Maturity Date | Par Amount ($) / Shares or Ownership % / Notional ($)(3) | Cost / Amortized Cost(4) | Fair Value | % of Net Assets(5) | |||||||||||||||||||||||
United States of America | ||||||||||||||||||||||||||||||||
TH Liquidating Trust(6)(7)(17) | Other | N/A | N/A | 10/9/2020 | 12/6/2024 | 14 | % | $ | — | $ | — | — | % | |||||||||||||||||||
TH Liquidating Trust(7)(17) | Other | N/A | N/A | 12/7/2019 | 12/6/2024 | 14 | % | 3,153,474 | 1,878,114 | 0.35 | ||||||||||||||||||||||
TH Liquidating Trust(7)(14) | Other | L+10.50%, 0.50% Floor | 14.88 | 12/7/2019 | 12/6/2024 | $ | 400,410 | 400,410 | 394,610 | 0.07 | ||||||||||||||||||||||
|
|
|
|
|
| |||||||||||||||||||||||||||
Total Trust Interest | 3,553,884 | 2,272,724 | 0.42 | |||||||||||||||||||||||||||||
|
|
|
|
|
| |||||||||||||||||||||||||||
Real Estate Properties | ||||||||||||||||||||||||||||||||
United States of America | ||||||||||||||||||||||||||||||||
30 South Broadway, Irvington, New York(7)(10)(17) | Industrial | N/A | N/A | 12/14/2021 | N/A | 90 | % | 9,537,533 | 9,300,247 | 1.75 | ||||||||||||||||||||||
|
|
|
|
|
| |||||||||||||||||||||||||||
Total Real Estate Properties | 9,537,533 | 9,300,247 | 1.75 | |||||||||||||||||||||||||||||
|
|
|
|
|
| |||||||||||||||||||||||||||
Total Controlled Investments | $ | 46,857,175 | $ | 42,627,570 | 8.02 | % | ||||||||||||||||||||||||||
|
|
|
|
|
| |||||||||||||||||||||||||||
Total Investments, December 31, 2022 | $ | 831,480,274 | $ | 815,424,661 | 153.56 | % | ||||||||||||||||||||||||||
|
|
|
|
|
| |||||||||||||||||||||||||||
| (1) | All of our investments are issued by eligible portfolio companies, as defined in the Investment Company Act of 1940 (the “1940 Act”), unless otherwise noted. |
| (2) | Investments may contain a variable rate structure, subject to an interest rate floor or cap. Variable rate investments bear interest at a rate that may be determined by reference to either Secured Overnight Financing Rate (“SOFR” or “S”), London Interbank Offered Rate (“LIBOR” or “L”), Euro Interbank Offer Rate (“Euribor” or “E”), Canadian Dollar Offered Rate (“CDOR” or “C”), or Prime Rate (“P”), all of which can include one-, three- or six-month tenor, at the borrower’s option, which reset periodically based on the terms of the credit agreement. For investments with multiple interest rate contracts, the interest rate shown is the weighted average interest rate in effect at December 31, 2022. |
| (3) | Par amount includes unfunded commitments, accumulated payment-in-kind (“PIK”) interest and is net of repayments. Equity investments are recorded as number of shares owned or economic ownership percentage. |
| (4) | Cost represents amortized cost for debt investments less principal payments, plus capitalized PIK if any. As of December 31, 2022, the aggregate gross unrealized appreciation for all investments in which there was an excess of fair value over tax cost was $16.7 million; the aggregate gross unrealized depreciation for all investments in which there was an excess of tax cost over fair value was $23.3 million; the net unrealized depreciation was $6.6 million; the aggregate tax cost of securities for Federal income tax purposes was $822.3 million. |
| (5) | Percentage is based on net assets of $530,976,832 as of December 31, 2022. |
| (6) | The investment has an unfunded commitment as of December 31, 2022 (see Note 11 in the accompanying notes to the consolidated financial statements). |
| (7) | Fair value was determined using significant unobservable inputs (see Note 6 in the accompanying notes to the consolidated financial statements). |
| (8) | Some or all of these investments are pledged as collateral to the Revolving Credit Facility (see Note 7 in the accompanying notes to the consolidated financial statements). |
| (9) | Some or all of these investments are pledged as collateral to the 2021 CLO (see Note 7 in the accompanying notes to the consolidated financial statements). |
| (10) | These investments are treated as non-qualifying investments under Section 55(a) of the 1940 Act. Under the 1940 Act, the Fund may not acquire any non-qualifying asset unless, at the time the acquisition is made, qualifying assets represent at least 70% of the Fund’s total assets. As of December 31, 2022, qualifying assets totaled 81.61% of the Fund’s total assets. |
The accompanying notes are an integral part of these consolidated financial statements.
F-74
Table of Contents
Silver Point Specialty Lending Fund
Consolidated Schedule of Investments
December 31, 2022
(in U.S. Dollars)
| (11) | The underlying credit agreement or indenture contains a PIK provision, whereby the issuer has either the option or the obligation to make a portion of the interest payments with the issuance of additional investments. The PIK portion of the coupon is 7.00%. |
| (12) | The underlying credit agreement or indenture contains a PIK provision, whereby the issuer has either the option or the obligation to make a portion of the interest payments with the issuance of additional investments. The PIK portion of the coupon is 3.00%. |
| (13) | The underlying credit agreement or indenture contains a PIK provision, whereby the issuer has either the option or the obligation to make a portion of the interest payments with the issuance of additional investments. The PIK portion of the coupon is 2.75%. |
| (14) | The underlying credit agreement or indenture contains a PIK provision, whereby the issuer has either the option or the obligation to make a portion of the interest payments with the issuance of additional investments. The PIK portion of the coupon is 2.00%. |
| (15) | The underlying credit agreement or indenture contains a PIK provision, whereby the issuer has either the option or the obligation to make a portion of the interest payments with the issuance of additional investments. The PIK portion of the coupon is S+10.50%. |
| (16) | The underlying credit agreement or indenture contains a PIK provision, whereby the issuer has either the option or the obligation to make a portion of the interest payments with the issuance of additional investments. The PIK portion of the coupon is L+13.50%. |
| (17) | Represents a non-income producing investment. |
| (18) | The negative fair value is the result of the original discount on the loan. |
| (19) | The negative amortized cost is the result of the original discount being greater than the principal amount outstanding on the loan. |
| (20) | Investment, representing 1.80% of cost and 1.85% of fair value, respectively, was on non-accrual status as of December 31, 2022, meaning that the Fund has ceased accruing interest income on this investment. See Note 2 in the accompanying notes to the consolidated financial statements for additional information on the Fund’s accounting policies. |
The accompanying notes are an integral part of these consolidated financial statements.
F-75
Table of Contents
Silver Point Specialty Lending Fund
Consolidated Schedule of Investments
December 31, 2022
(in U.S. Dollars)
| (21) | Controlled Investments are defined by the 1940 Act, as investments in companies in which the Fund owns more than 25% of the voting securities. Transactions during the year ended December 31, 2022 with these controlled investments were as follows: |
Portfolio Company | Type of Investment | Fair Value at December 31, 2021 | Gross additions* | Gross reductions** | Net change in unrealized appreciation (depreciation) | Net realized gains (losses) | Fair Value at December 31, 2022 | Interest income | Dividend income | Par Amount ($) / Number Of Units/ Ownership % | ||||||||||||||||||||||||||||||
SP-CREH 19 Highline LLC | Secured Loans | $ | 21,006,300 | $ | — | $ | — | $ | (96,600 | ) | $ | — | $ | 20,909,700 | $ | 1,423,119 | $ | — | $ | 21,000,000 | ||||||||||||||||||||
SP-CREH 19 Highline LLC | Secured Loans | 2,826,718 | 3,305,326 | — | (24,500 | ) | — | 6,107,544 | 252,368 | — | 6,125,000 | |||||||||||||||||||||||||||||
SP-CREH 19 Highline LLC | Equities | 5,436,667 | 690,758 | — | (2,090,070 | ) | — | 4,037,355 | — | — | 70 | % | ||||||||||||||||||||||||||||
16415 Tuckerton Road, Houston, Texas | Real Estate Properties | 8,526,000 | 80,772 | (8,348,500 | ) | (461,246 | ) | 202,974 | — | — | — | — | ||||||||||||||||||||||||||||
TH Liquidating Trust | Trust Interest | 2,578,113 | — | — | (699,999 | ) | — | 1,878,114 | — | — | 14 | % | ||||||||||||||||||||||||||||
TH Liquidating Trust | Trust Interest | — | — | — | — | — | — | — | — | 14 | % | |||||||||||||||||||||||||||||
TH Liquidating Trust | Trust Interest | 348,745 | 46,540 | — | (675 | ) | — | 394,610 | 46,540 | — | $ | 400,410 | ||||||||||||||||||||||||||||
30 South Broadway, Irvington, New York | Real Estate Properties | 9,486,863 | — | — | (186,616 | ) | — | 9,300,247 | — | — | 90 | % | ||||||||||||||||||||||||||||
|
|
|
|
|
|
|
|
|
|
|
|
|
|
|
| |||||||||||||||||||||||||
Total | $ | 50,209,406 | $ | 4,123,396 | $ | (8,348,500 | ) | $ | (3,559,706 | ) | $ | 202,974 | $ | 42,627,570 | $ | 1,722,027 | $ | — | ||||||||||||||||||||||
|
|
|
|
|
|
|
|
|
|
|
|
|
|
|
| |||||||||||||||||||||||||
| * | Gross additions include increases in the cost basis of the investments resulting from new portfolio investments, accretion of discounts, PIK interest, and the exchange of one or more existing securities for one or more new investments. |
| ** | Gross reductions include decreases in the cost basis of investments resulting from principal collections related to investments repayments and sales. |
Additional Information
Interest Rate Swaps | Pay/Receive Floating Rate | Floating Rate Index | Floating Payment Frequency | Fixed Pay Rate | Fixed Payment Frequency | Maturity Date | Counterparty | Notional Amount | Upfront Premiums Paid | Unrealized appreciation/ (depreciation) | ||||||||||||||||||||||||||||||
Derivative contracts | ||||||||||||||||||||||||||||||||||||||||
Euro Interest Rate Swaps | Receive | EuroSTR | Annual | 2.249 | % | Annual | 9/21/2027 | Goldman Sachs | € | 600,000 | $ | — | 18,070 | |||||||||||||||||||||||||||
Euro Interest Rate Swaps | Receive | EuroSTR | Annual | 2.773 | % | Annual | 9/30/2027 | Goldman Sachs | € | 800,000 | — | 3,626 | ||||||||||||||||||||||||||||
US Interest Rate Swaps | Pay | SOFR | Annual | 4.106 | % | Annual | 10/6/2024 | Goldman Sachs | $ | (2,100,000 | ) | — | (55,523 | ) | ||||||||||||||||||||||||||
US Interest Rate Swaps | Receive | SOFR | Annual | 4.012 | % | Annual | 9/20/2024 | Goldman Sachs | $ | 21,170,000 | — | 182,363 | ||||||||||||||||||||||||||||
US Interest Rate Swaps | Pay | SOFR | Annual | 3.590 | % | Annual | 10/6/2027 | Goldman Sachs | $ | (1,640,000 | ) | — | (41,404 | ) | ||||||||||||||||||||||||||
US Interest Rate Swaps | Receive | SOFR | Annual | 3.444 | % | Annual | 9/20/2027 | Goldman Sachs | $ | 14,460,000 | — | 207,475 | ||||||||||||||||||||||||||||
US Interest Rate Swaps | Receive | SOFR | Annual | 3.927 | % | Annual | 9/28/2027 | Goldman Sachs | $ | 2,500,000 | — | (22,784 | ) | |||||||||||||||||||||||||||
UK Interest Rate Swaps | Receive | SONIA | Annual | 4.992 | % | Annual | 9/28/2027 | Goldman Sachs | £ | 2,300,000 | — | (126,076 | ) | |||||||||||||||||||||||||||
|
| |||||||||||||||||||||||||||||||||||||||
Total | $ | 165,747 | ||||||||||||||||||||||||||||||||||||||
|
| |||||||||||||||||||||||||||||||||||||||
The accompanying notes are an integral part of these consolidated financial statements.
F-76
Table of Contents
Silver Point Specialty Lending Fund
Consolidated Schedule of Investments
December 31, 2022
(in U.S. Dollars)
Foreign Currency Forward Contracts | Settlement Date | Amount Purchased | Amount Sold | Fair Value | ||||||||||||
Derivative Counterparty | ||||||||||||||||
JPMorgan Chase Bank | 3/31/2023 | $ | 6,604,321 | C$ | 9,008,360 | $ | (47,167 | ) | ||||||||
JPMorgan Chase Bank | 1/4/2023 | $ | 21,935,000 | € | 23,418,300 | 70,186 | ||||||||||
JPMorgan Chase Bank | 3/31/2023 | $ | 255,674 | € | 240,923 | (3,865 | ) | |||||||||
JPMorgan Chase Bank | 3/31/2023 | € | 438,091 | $ | 412,681 | (6,479 | ) | |||||||||
JPMorgan Chase Bank | 3/31/2023 | $ | 526,239 | € | 492,305 | (4,107 | ) | |||||||||
JPMorgan Chase Bank | 3/31/2023 | $ | 22,352,598 | € | 20,808,309 | (63,612 | ) | |||||||||
JPMorgan Chase Bank | 1/4/2023 | £ | 1,515,000 | $ | 1,827,146 | 3,632 | ||||||||||
JPMorgan Chase Bank | 3/31/2023 | $ | 6,078,159 | £ | 4,879,880 | 168,555 | ||||||||||
|
| |||||||||||||||
Total | $ | 117,143 | ||||||||||||||
|
| |||||||||||||||
The accompanying notes are an integral part of these consolidated financial statements.
F-77
Table of Contents
Silver Point Specialty Lending Fund
Consolidated Schedule of Investments
December 31, 2021
(in U.S. Dollars)
Portfolio Company(1) | Industry | Rate(2) | Interest Rate | Original Acquisition Date | Maturity Date | Par Amount ($) / Shares or Ownership % / Notional ($)(3) | Cost / Amortized Cost(4) | Fair Value | % of Net Assets(5) | |||||||||||||||||||||||||
Non-Controlled/Non-Affiliated Investments | ||||||||||||||||||||||||||||||||||
Secured Loans | ||||||||||||||||||||||||||||||||||
1st Lien Term Loan | ||||||||||||||||||||||||||||||||||
United States of America | ||||||||||||||||||||||||||||||||||
8800 Austin, LLC and 8900 Austin, LLC(6)(7)(8) | Multi-Family | L+5.50%, 0.50% Floor | 6.00 | % | 6/24/2021 | 12/24/2022 | $ | 15,000,000 | $ | 12,246,536 | $ | 12,230,896 | 2.17 | % | ||||||||||||||||||||
Accurate Background LLC(7)(8)(9) | Business Services | L+6.00%, 1.00% Floor | 7.00 | 10/18/2021 | 3/26/2027 | 16,621,453 | 15,091,880 | 15,291,737 | 2.71 | |||||||||||||||||||||||||
ADS Tactical Inc(7)(9) | Aerospace & Defense | L+5.75%, 1.00% Floor | 6.75 | 3/4/2021 | 3/19/2026 | 7,218,750 | 7,087,178 | 7,142,087 | 1.27 | |||||||||||||||||||||||||
Alpine US Bidco LLC(8)(9) | Food Products | L+5.25%, 0.75% Floor | 6.00 | 4/28/2021 | 5/3/2028 | 8,544,355 | 8,384,570 | 8,480,272 | 1.50 | |||||||||||||||||||||||||
Amerijet Holdings Inc(7)(8)(9) | Airline & Airport Services | L+6.75%, 1.00% Floor | 7.75 | 12/28/2021 | 12/28/2025 | 17,643,981 | 17,115,575 | 17,114,662 | 3.04 | |||||||||||||||||||||||||
Ampler Restaurant Group(7)(9) | Restaurants | L+5.88%, 1.00% Floor | 6.88 | 7/20/2021 | 7/21/2027 | 4,987,500 | 4,892,330 | 4,852,089 | 0.86 | |||||||||||||||||||||||||
Azurity Pharmaceuticals Inc(8)(9) | | Pharmaceuticals & Life Sciences | | L+6.00%, 0.75% Floor | 6.75 | 9/28/2021 | 9/20/2027 | 7,860,000 | 7,630,479 | 7,683,956 | 1.36 | |||||||||||||||||||||||
BayMark Health Services Inc(6)(7) | | Healthcare Providers & Services | | L+5.00%, 1.00% Floor (1.00% on unfunded) | 6.00 | 11/19/2021 | 6/11/2027 | 4,520,000 | 1,199,032 | 1,198,298 | 0.21 | |||||||||||||||||||||||
BayMark Health Services Inc(7)(9) | | Healthcare Providers & Services | | L+5.00%, 1.00% Floor | 6.00 | 6/10/2021 | 6/11/2027 | 4,279,250 | 4,239,349 | 4,236,457 | 0.75 | |||||||||||||||||||||||
BEL USA LLC(7)(9) | E-Commerce | L+8.00%, 1.50% Floor | 9.50 | 2/1/2021 | 11/2/2023 | 224,782 | 221,666 | 172,632 | 0.03 | |||||||||||||||||||||||||
BEL USA LLC(7)(9)(12) | E-Commerce | L+7.00%, 1.50% Floor | 8.50 | 12/13/2018 | 11/2/2023 | 13,657,449 | 13,563,448 | 10,488,920 | 1.86 | |||||||||||||||||||||||||
Buck Global LLC(6)(7)(18)(19) | Professional Services | L+6.75%, 1.00% Floor (1.00% on unfunded) | 1.00 | 9/29/2021 | 9/29/2026 | 3,679,245 | (34,897 | ) | (93,453 | ) | (0.02 | ) | ||||||||||||||||||||||
Buck Global LLC(7)(8)(9) | Professional Services | L+6.75%, 1.00% Floor | 7.75 | 9/29/2021 | 9/29/2026 | 13,579,175 | 13,318,258 | 13,234,263 | 2.35 | |||||||||||||||||||||||||
Circle Graphics Inc(6)(7)(18)(19) | E-Commerce | L+5.75%, 2.25% Floor (1.00% on unfunded) | 1.00 | 7/12/2021 | 9/30/2024 | 1,611,723 | (27,564 | ) | (26,996 | ) | (0.00 | ) | ||||||||||||||||||||||
Circle Graphics Inc(7)(8)(9) | E-Commerce | L+5.75%, 2.25% Floor | 8.00 | 2/17/2021 | 9/30/2024 | 19,486,897 | 19,486,897 | 19,160,492 | 3.40 | |||||||||||||||||||||||||
Circle Graphics Inc(7)(8) | E-Commerce | L+5.75%, 2.25% Floor | 8.00 | 7/12/2021 | 9/30/2024 | 2,952,118 | 2,899,905 | 2,902,670 | 0.51 | |||||||||||||||||||||||||
Columbia Helicopters Inc.(7) | Aerospace & Defense | L+7.50%, 1.50% Floor | 9.00 | 8/20/2019 | 8/20/2024 | 15,935,229 | 15,729,441 | 14,470,781 | 2.57 | |||||||||||||||||||||||||
DexYP(8)(9)(10) | Media: Advertising | L+8.50%, 1.00% Floor | 9.50 | 2/18/2021 | 3/1/2026 | 15,485,714 | 15,078,498 | 15,691,364 | 2.78 | |||||||||||||||||||||||||
DMT Solutions Global Corp (dba Bluecrest)(7)(8)(9) | | Industrial Products & Services | | L+7.00%, 1.00% Floor | 8.00 | 12/15/2020 | 7/2/2024 | 18,993,374 | 18,138,319 | 18,518,539 | 3.29 | |||||||||||||||||||||||
Form Technologies Inc(9) | Automobiles & Components | L+4.75%, 1.00% Floor | 5.75 | 2/19/2021 | 7/22/2025 | 3,546,846 | 3,499,507 | 3,531,347 | 0.63 | |||||||||||||||||||||||||
Form Technologies Inc(9) | Automobiles & Components | L+9.25%, 1.00% Floor | 10.25 | 2/19/2021 | 10/22/2025 | 1,434,812 | 1,416,651 | 1,456,334 | 0.26 | |||||||||||||||||||||||||
Heligear Acquisition Co(7)(8)(9) | Aerospace & Defense | L+7.00%, 1.50% Floor | 8.50 | 9/6/2019 | 7/30/2024 | 28,752,188 | 28,588,549 | 28,654,430 | 5.08 | |||||||||||||||||||||||||
Iconix Brand Group Inc(7)(8)(9) | Consumer Brands | L+7.50%, 1.00% Floor | 8.50 | 8/4/2021 | 8/4/2025 | 22,866,797 | 21,918,276 | 22,304,274 | 3.96 | |||||||||||||||||||||||||
Impala RGIS Holdings LLC(9) | Business Services | L+7.50%, 1.00% Floor | 8.50 | 6/25/2020 | 6/25/2025 | 3,452,305 | 3,452,306 | 3,521,352 | 0.62 | |||||||||||||||||||||||||
The accompanying notes are an integral part of these consolidated financial statements.
F-78
Table of Contents
Silver Point Specialty Lending Fund
Consolidated Schedule of Investments
December 31, 2021
(in U.S. Dollars)
Portfolio Company(1) | Industry | Rate(2) | Interest Rate | Original Acquisition Date | Maturity Date | Par Amount ($) / Shares or Ownership % / Notional ($)(3) | Cost / Amortized Cost(4) | Fair Value | % of Net Assets(5) | |||||||||||||||||||||||
Inotiv Inc(8)(9)(10) | Pharmaceuticals & Life Sciences | L+6.25%, 1.00% Floor | 7.25 | % | 11/3/2021 | 11/5/2026 | $ | 11,348,368 | $ | 11,129,115 | $ | 11,121,401 | 1.97 | % | ||||||||||||||||||
Inotiv Inc(6)(10)(18)(19) | Pharmaceuticals & Life Sciences | L+6.25%, (1.00% on unfunded) | 1.00 | 11/3/2021 | 11/5/2026 | 2,407,230 | (46,737 | ) | (48,145 | ) | (0.01 | ) | ||||||||||||||||||||
JUUL Labs Inc(7) | Consumer Products | L+7.00%, 1.50% Floor | 8.50 | 8/2/2019 | 8/2/2023 | 26,102,995 | 25,874,572 | 25,980,311 | 4.61 | |||||||||||||||||||||||
Kaplan Woodland Hills Property Company, LLC(6)(7)(8) | Real Estate Development & Management | L+6.00%, 1.65% Floor | 7.65 | 2/14/2020 | 2/14/2023 | 16,325,000 | 15,697,440 | 15,740,958 | 2.79 | |||||||||||||||||||||||
Kleinfelder Group Inc(7)(8)(9) | Professional Services | L+5.25%, 1.00% Floor | 6.25 | 11/15/2021 | 11/29/2024 | 6,666,667 | 6,602,493 | 6,591,333 | 1.17 | |||||||||||||||||||||||
Kleinfelder Group Inc(7)(9) | Professional Services | L+5.75%, 1.00% Floor | 6.75 | 10/13/2020 | 11/29/2024 | 4,859,742 | 4,819,502 | 4,809,444 | 0.85 | |||||||||||||||||||||||
LAC Acquisition LLC d/b/a Lighthouse Autism Center(6)(7)(18)(19) | Healthcare Providers & Services | L+6.00%, 1.00% Floor (1.00% on unfunded) | 1.00 | 7/23/2021 | 7/23/2026 | 3,500,000 | (31,933 | ) | (75,775 | ) | (0.01 | ) | ||||||||||||||||||||
LAC Acquisition LLC d/b/a Lighthouse Autism Center(7)(8)(9) | Healthcare Providers & Services | L+6.00%, 1.00% Floor | 7.00 | 7/23/2021 | 7/23/2026 | 19,950,000 | 19,575,282 | 19,416,337 | 3.44 | |||||||||||||||||||||||
LMG Holdings(7)(8)(9) | Manufacturing | L+6.50%, 1.00% Floor | 7.50 | 4/30/2021 | 4/30/2026 | 12,301,169 | 12,207,826 | 12,182,463 | 2.16 | |||||||||||||||||||||||
Mad Engine Global, LLC(8)(9) | Consumer Apparel | L+7.00%, 1.00% Floor | 8.00 | 6/30/2021 | 7/15/2027 | 11,925,000 | 11,643,256 | 11,626,875 | 2.06 | |||||||||||||||||||||||
Manchester Acquisition Sub LLC(9) | Specialty Chemicals | S+5.75%, 0.75% Floor | 6.50 | 11/16/2021 | 12/1/2026 | 6,616,493 | 6,257,368 | 6,368,375 | 1.13 | |||||||||||||||||||||||
Masterwork Electronics, Inc.(7)(8)(9) | Technology Hardware & Equipment | L+8.00%, 1.00% Floor | 9.00 | 7/27/2018 | 7/27/2023 | 39,951,685 | 39,612,118 | 39,102,712 | 6.94 | |||||||||||||||||||||||
Mountaineer Merger Corp(7)(9) | Specialty Retail | L+7.00%, 0.75% Floor | 7.75 | 10/22/2021 | 10/26/2028 | 5,000,000 | 4,853,755 | 4,850,000 | 0.86 | |||||||||||||||||||||||
National Dentex Corp(7)(8) | Healthcare Providers & Services | L+7.00%, 1.00% Floor (1.00% on unfunded) | 8.00 | 10/26/2020 | 10/3/2025 | 4,796,171 | 4,717,902 | 4,716,075 | 0.84 | |||||||||||||||||||||||
National Dentex Corp(7)(8)(9) | Healthcare Providers & Services | L+7.00%, 1.00% Floor | 8.00 | 4/1/2021 | 10/3/2025 | 1,475,745 | 1,443,691 | 1,451,100 | 0.26 | |||||||||||||||||||||||
National Dentex Corp(6)(7)(8) | Healthcare Providers & Services | L+7.00%, 1.00% Floor (1.00% on unfunded) | 8.00 | 4/1/2021 | 10/3/2025 | 1,484,759 | 826,463 | 828,033 | 0.15 | |||||||||||||||||||||||
National Dentex Corp(7)(9) | Healthcare Providers & Services | L+7.00%, 1.00% Floor | 8.00 | 10/26/2020 | 10/3/2025 | 9,752,183 | 9,596,295 | 9,589,321 | 1.70 | |||||||||||||||||||||||
Nine West Holdings Inc(8) | Consumer Brands | L+8.00% | 8.22 | 3/19/2019 | 3/20/2024 | 2,362,839 | 2,269,522 | 1,856,802 | 0.33 | |||||||||||||||||||||||
Northstar Group Services Inc(7)(9) | Business Services | L+5.50%, 1.00% Floor | 6.50 | 9/29/2021 | 11/12/2026 | 9,935,483 | 9,887,423 | 9,947,902 | 1.76 | |||||||||||||||||||||||
Odlum Data Lender, LLC(7)(10) | Telecommunications | L+6.10%, 0.15% Floor | 6.25 | 6/23/2021 | 6/23/2022 | 15,000,000 | 15,000,000 | 15,000,000 | 2.66 | |||||||||||||||||||||||
Pacira BioSciences Inc(7)(8)(9)(10) | Pharmaceuticals & Life Sciences | S+7.00%, 0.75% Floor | 7.75 | 12/6/2021 | 12/7/2026 | 31,014,810 | 30,090,546 | 30,549,588 | 5.42 | |||||||||||||||||||||||
PaperWorks Industries Holding Corp.(7)(8)(9) | Paper & Packaging | L+8.00%, 1.00% Floor | 9.00 | 12/18/2020 | 12/18/2025 | 25,333,333 | 24,709,806 | 24,872,267 | 4.41 | |||||||||||||||||||||||
Speedstar Holding LLC(7)(8)(9) | Automobiles & Components | L+7.00%, 1.00% Floor | 8.00 | 1/22/2021 | 1/22/2027 | 21,762,931 | 21,384,780 | 21,527,891 | 3.82 | |||||||||||||||||||||||
Speedstar Holding LLC(6)(7)(18)(19) | Automobiles & Components | L+7.00%, 1.00% Floor (1.00% on unfunded) | 1.00 | 1/22/2021 | 1/22/2027 | 3,017,241 | (51,165 | ) | (32,586 | ) | (0.01 | ) | ||||||||||||||||||||
STV Group, Inc(7)(9) | Professional Services | L+5.25% | 5.35 | 8/3/2020 | 12/11/2026 | 9,982,030 | 9,759,384 | 9,932,120 | 1.76 | |||||||||||||||||||||||
The accompanying notes are an integral part of these consolidated financial statements.
F-79
Table of Contents
Silver Point Specialty Lending Fund
Consolidated Schedule of Investments
December 31, 2021
(in U.S. Dollars)
Portfolio Company(1) | Industry | Rate(2) | Interest Rate | Original Acquisition Date | Maturity Date | Par Amount ($) / Shares or Ownership % / Notional ($)(3) | Cost / Amortized Cost(4) | Fair Value | % of Net Assets(5) | |||||||||||||||||||||||||
Sutherland Global Services Inc(7)(8)(9) | Business Services | L+7.25%, 1.00% Floor | 8.25 | % | 10/23/2020 | 10/23/2025 | $ | 18,851,629 | $ | 18,522,368 | $ | 18,881,791 | 3.35 | % | ||||||||||||||||||||
Thunder Grandparent Inc. (dba Telestream, Inc)(7)(8)(9) | Software & Services | L+8.75%, 1.00% Floor | 9.75 | 10/15/2020 | 10/15/2025 | 13,569,828 | 13,352,047 | 13,435,486 | 2.38 | |||||||||||||||||||||||||
Tops MBO Corp(7) | Staples Retail | L+8.00%, 1.25% Floor | 9.25 | 11/8/2021 | 5/8/2026 | 10,792,453 | 10,501,952 | 10,501,057 | 1.86 | |||||||||||||||||||||||||
Touchstone Acquisition Inc (aka Team Technologies)(7)(9) | | Healthcare Equipment & Supplies | | L+6.00%, 0.75% Floor | 6.75 | 12/23/2021 | 12/31/2028 | 6,615,698 | 6,483,384 | 6,483,384 | 1.15 | |||||||||||||||||||||||
UC Tower Hillside Crossing(6)(7)(8) | Multi-Family | L+7.25%, 0.50% Floor | 7.75 | 9/21/2017 | 8/31/2022 | 17,732,050 | 17,106,373 | 17,127,988 | 3.04 | |||||||||||||||||||||||||
Welldyne Inc (9) | | Healthcare Providers & Services | | L+5.50%, 1.00% Floor | 6.50 | 2/22/2017 | 8/16/2022 | 18,015,176 | 17,598,392 | 17,474,721 | 3.10 | |||||||||||||||||||||||
WIS Holdings Inc(8)(9) | Business Services | L+7.75%, 1.00% Floor | 8.75 | 5/20/2021 | 5/20/2025 | 21,267,853 | 20,801,081 | 20,842,496 | 3.70 | |||||||||||||||||||||||||
WPG Holdings LLC(9) | | Real Estate Development & Management | | L+5.00%, 0.75% Floor | 5.75 | 10/21/2021 | 10/20/2025 | 9,867,959 | 9,982,910 | 9,949,370 | 1.77 | |||||||||||||||||||||||
|
|
|
|
|
| |||||||||||||||||||||||||||||
Total United States of America 1st Lien Term Loan | 637,313,400 | 634,818,498 | 112.60 | |||||||||||||||||||||||||||||||
|
|
|
|
|
| |||||||||||||||||||||||||||||
Canada | ||||||||||||||||||||||||||||||||||
Dye & Durham Corp(7)(8)(10) | Software & Services | C+5.75%, 0.75% Floor | 6.50 | 12/3/2021 | 12/3/2027 | C$ | 8,404,236 | 6,465,940 | 6,666,071 | 1.18 | ||||||||||||||||||||||||
Dye & Durham Corp(6)(7)(10)(19) | Software & Services | C+5.75%, (1.00% on unfunded) | 1.00 | 12/3/2021 | 12/3/2027 | C$ | 1,105,821 | (6,382 | ) | 5,512 | 0.00 | |||||||||||||||||||||||
Gateway Casinos & Entertainment Ltd(10) | Gaming & Leisure | C+8.00%, 0.75% Floor | 8.75 | 10/21/2021 | 10/22/2027 | C$ | 3,524,625 | 2,804,436 | 2,778,818 | 0.49 | ||||||||||||||||||||||||
Gateway Casinos & Entertainment Ltd(10) | Gaming & Leisure | S+8.00%, 0.75% Floor | 8.75 | 10/21/2021 | 10/22/2027 | 12,005,971 | 11,774,217 | 11,963,470 | 2.12 | |||||||||||||||||||||||||
|
|
|
|
|
| |||||||||||||||||||||||||||||
Total Canada 1st Lien Term Loan | 21,038,211 | 21,413,871 | 3.79 | |||||||||||||||||||||||||||||||
|
|
|
|
|
| |||||||||||||||||||||||||||||
Cayman Islands | ||||||||||||||||||||||||||||||||||
JO ET Holdings Limited (Grindr HoldCo)(7)(9)(10)(11) | Technology | S+13.00%, 1.00% Floor | 14.00 | 12/15/2021 | 12/15/2026 | 5,954,844 | 5,836,919 | 5,835,747 | 1.04 | |||||||||||||||||||||||||
|
|
|
|
|
| |||||||||||||||||||||||||||||
Total Cayman Islands 1st Lien Term Loan | 5,836,919 | 5,835,747 | 1.04 | |||||||||||||||||||||||||||||||
|
|
|
|
|
| |||||||||||||||||||||||||||||
Luxembourg | ||||||||||||||||||||||||||||||||||
Mallinckrodt PLC(8) | | Pharmaceuticals & Life Sciences | | L+5.25%, 0.75% Floor | 6.00 | 10/13/2020 | 9/24/2024 | 15,098,491 | 14,139,329 | 14,110,220 | 2.50 | |||||||||||||||||||||||
The accompanying notes are an integral part of these consolidated financial statements.
F-80
Table of Contents
Silver Point Specialty Lending Fund
Consolidated Schedule of Investments
December 31, 2021
(in U.S. Dollars)
Portfolio Company(1) | Industry | Rate(2) | Interest Rate | Original Acquisition Date | Maturity Date | Par Amount ($) / Shares or Ownership % / Notional ($)(3) | Cost / Amortized Cost(4) | Fair Value | % of Net Assets(5) | |||||||||||||||||||||||
Steenbok Lux Finco 2 SARL(10)(13) | Staples Retail | 7.88% | 7.88 | % | 10/16/2020 | 12/31/2022 | € | 4,721,975 | $ | 5,588,209 | $ | 5,366,980 | 0.95 | % | ||||||||||||||||||
Steenbok Lux Finco 2 SARL(10)(13) | Staples Retail | 7.88% | 7.88 | 1/28/2021 | 12/31/2022 | € | 1,525,883 | 1,846,789 | 1,731,138 | 0.31 | ||||||||||||||||||||||
Steenbok Lux Finco 1 SARL(10)(14) | Staples Retail | 10.00% | 10.00 | 6/21/2021 | 12/31/2022 | € | 13,128,503 | 12,982,300 | 13,381,555 | 2.37 | ||||||||||||||||||||||
|
|
|
|
|
| |||||||||||||||||||||||||||
Total Luxembourg 1st Lien Term Loan | 34,556,627 | 34,589,893 | 6.13 | |||||||||||||||||||||||||||||
|
|
|
|
|
| |||||||||||||||||||||||||||
Netherlands | ||||||||||||||||||||||||||||||||
OLA Netherlands BV (aka Olacabs / ANI Tech)(8)(10) | Technology | S+6.25%, 0.75% Floor | 7.00 | 12/3/2021 | 12/15/2026 | 7,100,550 | 6,959,573 | 7,136,053 | 1.27 | |||||||||||||||||||||||
|
|
|
|
|
| |||||||||||||||||||||||||||
Total Netherlands 1st Lien Term Loan | 6,959,573 | 7,136,053 | 1.27 | |||||||||||||||||||||||||||||
|
|
|
|
|
| |||||||||||||||||||||||||||
Singapore | ||||||||||||||||||||||||||||||||
Oravel Stays Singapore Pte Ltd(8)(10) | Technology | L+8.25%, 0.75% Floor | 9.00 | 6/9/2021 | 6/23/2026 | 4,975,000 | 4,826,414 | 5,155,344 | 0.91 | |||||||||||||||||||||||
|
|
|
|
|
| |||||||||||||||||||||||||||
Total Singapore 1st Lien Term Loan | 4,826,414 | 5,155,344 | 0.91 | |||||||||||||||||||||||||||||
|
|
|
|
|
| |||||||||||||||||||||||||||
Total 1st Lien Term Loan | 710,531,144 | 708,949,406 | 125.74 | |||||||||||||||||||||||||||||
|
|
|
|
|
| |||||||||||||||||||||||||||
1st Lien Revolver | ||||||||||||||||||||||||||||||||
United States of America | ||||||||||||||||||||||||||||||||
Amerijet Holdings Inc(6)(7) | Airline & Airport Services | L+6.75%, 1.00% Floor (0.50% on unfunded) | 7.75 | 12/28/2021 | 12/28/2025 | 2,756,872 | 1,020,269 | 1,020,043 | 0.18 | |||||||||||||||||||||||
Buck Global LLC(6)(7) | Professional Services | L+6.75%, 1.00% Floor (0.50% on unfunded) | 7.75 | 9/29/2021 | 9/29/2026 | 2,207,547 | 399,633 | 385,217 | 0.07 | |||||||||||||||||||||||
Inotiv Inc(6)(10)(18)(19) | Pharmaceuticals & Life Sciences | L+6.25%, (0.50% on unfunded) | 0.50 | 11/3/2021 | 11/5/2026 | 1,244,402 | (24,160 | ) | (29,990 | ) | (0.01 | ) | ||||||||||||||||||||
LAC Acquisition LLC d/b/a Lighthouse Autism Center(6)(7)(18)(19) | Healthcare Providers & Services | L+6.00%, 1.00% Floor (0.50% on unfunded) | 0.50 | 7/23/2021 | 7/23/2026 | 1,500,000 | (27,338 | ) | (40,350 | ) | (0.01 | ) | ||||||||||||||||||||
LMG Holdings(6)(7)(18)(19) | Manufacturing | L+6.50%, 1.00% Floor (0.50% on unfunded) | 0.50 | 4/30/2021 | 4/30/2026 | 690,670 | (4,866 | ) | (6,596 | ) | (0.00 | ) | ||||||||||||||||||||
Masterwork Electronics, Inc.(6)(7) | Technology Hardware & Equipment | L+8.00%, 1.00% Floor (0.50% on unfunded) | 9.00 | 7/27/2018 | 7/27/2023 | 3,688,500 | 1,816,035 | 1,746,505 | 0.31 | |||||||||||||||||||||||
National Dentex Corp(6)(7) | Healthcare Providers & Services | L+7.00%, 1.00% Floor (0.50% on unfunded) | 8.00 | 10/26/2020 | 10/3/2025 | 1,486,897 | 460,629 | 458,559 | 0.08 | |||||||||||||||||||||||
STV Group, Inc(6)(7)(18)(19) | Professional Services | L+4.50%, (0.50% on unfunded) | 0.50 | 9/30/2021 | 12/13/2024 | 1,300,000 | (130,000 | ) | (78,000 | ) | (0.01 | ) | ||||||||||||||||||||
The accompanying notes are an integral part of these consolidated financial statements.
F-81
Table of Contents
Silver Point Specialty Lending Fund
Consolidated Schedule of Investments
December 31, 2021
(in U.S. Dollars)
Portfolio Company(1) | Industry | Rate(2) | Interest Rate | Original Acquisition Date | Maturity Date | Par Amount ($) / Shares or Ownership % / Notional ($)(3) | Cost / Amortized Cost(4) | Fair Value | % of Net Assets(5) | |||||||||||||||||||||||
Sutherland Global Services Inc(6)(7)(18)(19) | Business Services | L+7.25%, 1.00% Floor (0.75% on unfunded) | 0.75 | % | 10/23/2020 | 10/23/2025 | $ | 1,332,943 | $ | (22,641 | ) | $ | (9,597 | ) | (0.00 | ) % | ||||||||||||||||
Talen Energy Supply LLC | Power Generation | L+8.00%, 1.00% Floor | 9.00 | 12/14/2021 | 9/30/2024 | 25,767,422 | 25,134,593 | 26,540,445 | 4.71 | |||||||||||||||||||||||
Thunder Grandparent Inc. (dba Telestream, Inc)(6)(7) | Software & Services | L+8.75%, 1.00% Floor (0.50% on unfunded) | 9.75 | 10/15/2020 | 10/15/2025 | 1,293,103 | 497,654 | 504,633 | 0.09 | |||||||||||||||||||||||
|
|
|
|
|
| |||||||||||||||||||||||||||
Total United States of America 1st Lien Revolver | 29,119,808 | 30,490,869 | 5.41 | |||||||||||||||||||||||||||||
|
|
|
|
|
| |||||||||||||||||||||||||||
Canada | ||||||||||||||||||||||||||||||||
Dye & Durham Corp(6)(7)(10)(18)(19) | Software & Services | C+5.75%, (0.50% on unfunded) | 0.50 | 12/3/2021 | 12/3/2026 | C$ | 414,683 | (4,780 | ) | (2,461 | ) | (0.00 | ) | |||||||||||||||||||
|
|
|
|
|
| |||||||||||||||||||||||||||
Total Canada 1st Lien Revolver | (4,780 | ) | (2,461 | ) | (0.00 | ) | ||||||||||||||||||||||||||
|
|
|
|
|
| |||||||||||||||||||||||||||
Luxembourg | ||||||||||||||||||||||||||||||||
Mallinckrodt PLC(8) | Pharmaceuticals & Life Sciences | L+4.25% | 4.38 | 1/11/2021 | 2/28/2022 | 4,900,000 | 4,825,934 | 4,786,687 | 0.85 | |||||||||||||||||||||||
|
|
|
|
|
| |||||||||||||||||||||||||||
Total Luxembourg 1st Lien Revolver | 4,825,934 | 4,786,687 | 0.85 | |||||||||||||||||||||||||||||
|
|
|
|
|
| |||||||||||||||||||||||||||
Total 1st Lien Revolver | 33,940,962 | 35,275,095 | 6.26 | |||||||||||||||||||||||||||||
|
|
|
|
|
| |||||||||||||||||||||||||||
2nd Lien Term Loan | ||||||||||||||||||||||||||||||||
United States of America | ||||||||||||||||||||||||||||||||
Alpine US Bidco LLC(8)(9) | Food Products | L+9.00%, 0.75% Floor | 9.75 | 4/28/2021 | 5/3/2029 | 8,642,861 | 8,396,657 | 8,556,432 | 1.52 | |||||||||||||||||||||||
BayMark Health Services Inc(6)(7)(18)(19) | Healthcare Providers & Services | L+8.50%, 1.00% Floor (2.00% on unfunded) | 2.00 | 11/19/2021 | 6/11/2028 | 5,486,667 | (79,735 | ) | (54,867 | ) | (0.01 | ) | ||||||||||||||||||||
BayMark Health Services Inc(7)(19) | Healthcare Providers & Services | L+8.50%, 1.00% Floor | 9.50 | 6/10/2021 | 6/11/2028 | 3,333,333 | 3,285,865 | 3,300,000 | 0.59 | |||||||||||||||||||||||
Tops MBO Corp(7) | Staples Retail | L+13.50%, 2.00% Floor | 15.50 | 11/8/2021 | 5/8/2026 | 468,557 | 469,715 | 468,791 | 0.08 | |||||||||||||||||||||||
|
|
|
|
|
| |||||||||||||||||||||||||||
Total United States of America 2nd Lien Term Loan | 12,072,502 | 12,270,356 | 2.18 | |||||||||||||||||||||||||||||
|
|
|
|
|
| |||||||||||||||||||||||||||
Luxembourg | ||||||||||||||||||||||||||||||||
Steenbok Lux Finco 2 SARL(8)(10)(15) | Staples Retail | 10.75% | 10.75 | 5/6/2021 | 12/31/2022 | € | 15,839,091 | 16,798,465 | 16,241,954 | 2.88 | ||||||||||||||||||||||
|
|
|
|
|
| |||||||||||||||||||||||||||
Total Luxembourg 2nd Lien Term Loan | 16,798,465 | 16,241,954 | 2.88 | |||||||||||||||||||||||||||||
|
|
|
|
|
| |||||||||||||||||||||||||||
Total 2nd Lien Term Loan | 28,870,967 | 28,512,310 | 5.06 | |||||||||||||||||||||||||||||
|
|
|
|
|
| |||||||||||||||||||||||||||
Total Secured Loans | 773,343,073 | 772,736,811 | 137.06 | |||||||||||||||||||||||||||||
|
|
|
|
|
| |||||||||||||||||||||||||||
The accompanying notes are an integral part of these consolidated financial statements.
F-82
Table of Contents
Silver Point Specialty Lending Fund
Consolidated Schedule of Investments
December 31, 2021
(in U.S. Dollars)
Portfolio Company(1) | Industry | Rate(2) | Interest Rate | Original Acquisition Date | Maturity Date | Par Amount ($) / Shares or Ownership % / Notional ($)(3) | Cost / Amortized Cost(4) | Fair Value | % of Net Assets(5) | |||||||||||||||||||||||
Secured Bonds | ||||||||||||||||||||||||||||||||
Senior Secured Bonds | ||||||||||||||||||||||||||||||||
United States of America | ||||||||||||||||||||||||||||||||
Incora (aka Wolverine Escrow LLC)(9) | Industrial Products & Services | 8.50% | 8.50 | % | 10/15/2020 | 11/15/2024 | $ | 6,538,000 | $ | 5,716,465 | $ | 6,107,173 | 1.08 | % | ||||||||||||||||||
Incora (aka Wolverine Escrow LLC)(9) | Industrial Products & Services | 9.00% | 9.00 | 10/15/2020 | 11/15/2026 | 2,653,000 | 2,331,760 | 2,518,314 | 0.45 | |||||||||||||||||||||||
|
|
|
|
|
| |||||||||||||||||||||||||||
Total United States of America Senior Secured Bonds | 8,048,225 | 8,625,487 | 1.53 | |||||||||||||||||||||||||||||
|
|
|
|
|
| |||||||||||||||||||||||||||
Japan | ||||||||||||||||||||||||||||||||
Universal Entertainment Corp(10) | Gaming & Leisure | 8.50% | 8.50 | 10/29/2020 | 12/11/2024 | 23,278,000 | 23,997,684 | 24,537,398 | 4.35 | |||||||||||||||||||||||
|
|
|
|
|
| |||||||||||||||||||||||||||
Total Japan Senior Secured Bonds | 23,997,684 | 24,537,398 | 4.35 | |||||||||||||||||||||||||||||
|
|
|
|
|
| |||||||||||||||||||||||||||
Luxembourg | ||||||||||||||||||||||||||||||||
Takko Fashion GmbH(10) | Specialty Retail | 5.38% | 5.38 | 9/14/2020 | 11/15/2023 | € | 12,533,000 | 13,460,834 | 13,623,964 | 2.42 | ||||||||||||||||||||||
Takko Fashion GmbH(10) | Specialty Retail | E+5.38%, 0.00% Floor | 5.38 | 9/16/2020 | 11/15/2023 | € | 6,179,000 | 6,526,672 | 6,721,493 | 1.19 | ||||||||||||||||||||||
|
|
|
|
|
| |||||||||||||||||||||||||||
Total Luxembourg Senior Secured Bonds | 19,987,506 | 20,345,457 | 3.61 | |||||||||||||||||||||||||||||
|
|
|
|
|
| |||||||||||||||||||||||||||
Netherlands | ||||||||||||||||||||||||||||||||
Promontoria Holding(10) | Airline & Airport Services | 6.75% | 6.75 | 10/16/2020 | 8/15/2023 | € | 7,623,000 | 8,653,743 | 8,636,068 | 1.53 | ||||||||||||||||||||||
Promontoria Holding(10) | Airline & Airport Services | E+6.25%, 0.00% Floor | 6.25 | 11/12/2020 | 8/15/2023 | € | 5,526,000 | 6,400,040 | 6,241,175 | 1.11 | ||||||||||||||||||||||
|
|
|
|
|
| |||||||||||||||||||||||||||
Total Netherlands Senior Secured Bonds | 15,053,783 | 14,877,243 | 2.64 | |||||||||||||||||||||||||||||
|
|
|
|
|
| |||||||||||||||||||||||||||
United Kingdom | ||||||||||||||||||||||||||||||||
AVIANCA MIDCO 2 LTD(10) | Airline & Airport Services | 9.00% | 9.00 | 12/1/2021 | 12/1/2028 | 13,237,342 | 13,237,342 | 13,267,126 | 2.35 | |||||||||||||||||||||||
Inspired Entertainment Inc(10) | Technology | 7.88% | 7.88 | 5/13/2021 | 6/1/2026 | £ | 3,616,000 | 5,081,928 | 4,993,887 | 0.89 | ||||||||||||||||||||||
Mclaren Group Ltd(9)(10) | Automobiles & Components | 7.50% | 7.50 | 7/22/2021 | 8/1/2026 | 7,500,000 | 7,500,000 | 7,580,656 | 1.34 | |||||||||||||||||||||||
|
|
|
|
|
| |||||||||||||||||||||||||||
Total United Kingdom Senior Secured Bonds | 25,819,270 | 25,841,669 | 4.58 | |||||||||||||||||||||||||||||
|
|
|
|
|
| |||||||||||||||||||||||||||
Total Senior Secured Bonds | 92,906,468 | 94,227,254 | 16.71 | |||||||||||||||||||||||||||||
|
|
|
|
|
| |||||||||||||||||||||||||||
The accompanying notes are an integral part of these consolidated financial statements.
F-83
Table of Contents
Silver Point Specialty Lending Fund
Consolidated Schedule of Investments
December 31, 2021
(in U.S. Dollars)
Portfolio Company(1) | Industry | Rate(2) | Interest Rate | Original Acquisition Date | Maturity Date | Par Amount ($) / Shares or Ownership % / Notional ($)(3) | Cost / Amortized Cost(4) | Fair Value | % of Net Assets(5) | |||||||||||||||||||||||
Equities | ||||||||||||||||||||||||||||||||
Common Equities | ||||||||||||||||||||||||||||||||
United States of America | ||||||||||||||||||||||||||||||||
Gadsden Development Company I, LLC(7)(17) | Multi-Family | N/A | N/A | 8/10/2016 | N/A | 312 | $ | — | $ | 1,555,856 | 0.28 | % | ||||||||||||||||||||
Impala RGIS Holdings LLC(7)(17) | Business Services | N/A | N/A | 6/25/2020 | N/A | 325,652 | 2,115,903 | 9,932,386 | 1.76 | |||||||||||||||||||||||
LCP Edge Holdco, LLC(7)(17) | Consumer Services | N/A | N/A | 8/24/2018 | N/A | 1,148 | — | 12,657,607 | 2.25 | |||||||||||||||||||||||
Welsh Acquisition LLC(7)(17) | Industrial | N/A | N/A | 12/6/2017 | N/A | 20 | % | — | 141,754 | 0.03 | ||||||||||||||||||||||
|
|
|
|
|
| |||||||||||||||||||||||||||
Total Common Equities | 2,115,903 | 24,287,603 | 4.32 | |||||||||||||||||||||||||||||
|
|
|
|
|
| |||||||||||||||||||||||||||
Preferred Equities | ||||||||||||||||||||||||||||||||
United States of America | ||||||||||||||||||||||||||||||||
Gadsden Development Company I, LLC(7)(17) | Multi-Family | N/A | N/A | 8/10/2016 | N/A | 89 | — | — | — | |||||||||||||||||||||||
Sutherland Global Services Inc(7)(17) | Business Services | N/A | N/A | 8/17/2021 | N/A | 9,184 | 9,000,321 | 9,688,156 | 1.72 | |||||||||||||||||||||||
|
|
|
|
|
| |||||||||||||||||||||||||||
Total Preferred Equities | 9,000,321 | 9,688,156 | 1.72 | |||||||||||||||||||||||||||||
|
|
|
|
|
| |||||||||||||||||||||||||||
Total Equities | 11,116,224 | 33,975,759 | 6.04 | |||||||||||||||||||||||||||||
|
|
|
|
|
| |||||||||||||||||||||||||||
Total Non-Controlled/Non-Affiliated Investments | $ | 877,365,765 | $ | 900,939,824 | 159.81 | % | ||||||||||||||||||||||||||
|
|
|
|
|
| |||||||||||||||||||||||||||
Controlled Investments(20) | ||||||||||||||||||||||||||||||||
Secured Loans | ||||||||||||||||||||||||||||||||
1st Lien Term Loan | ||||||||||||||||||||||||||||||||
United States of America | ||||||||||||||||||||||||||||||||
SP-CREH 19 Highline LLC(7) | Multi-Family | 7.00% | 7.00 | 6/28/2021 | 7/1/2024 | $ | 21,000,000 | 21,000,000 | 21,006,300 | 3.73 | ||||||||||||||||||||||
|
|
|
|
|
| |||||||||||||||||||||||||||
Total 1st Lien Term Loan | 21,000,000 | 21,006,300 | 3.73 | |||||||||||||||||||||||||||||
|
|
|
|
|
| |||||||||||||||||||||||||||
1st Lien Revolver | ||||||||||||||||||||||||||||||||
United States of America | ||||||||||||||||||||||||||||||||
SP-CREH 19 Highline LLC(6)(7) | Multi-Family | 5.00% | 5.00 | 6/28/2021 | 7/1/2024 | $ | 6,125,000 | 2,819,674 | 2,826,718 | 0.50 | ||||||||||||||||||||||
|
|
|
|
|
| |||||||||||||||||||||||||||
Total 1st Lien Revolver | 2,819,674 | 2,826,718 | 0.50 | |||||||||||||||||||||||||||||
|
|
|
|
|
| |||||||||||||||||||||||||||
Total Secured Loans | 23,819,674 | 23,833,018 | 4.23 | |||||||||||||||||||||||||||||
|
|
|
|
|
| |||||||||||||||||||||||||||
The accompanying notes are an integral part of these consolidated financial statements.
F-84
Table of Contents
Silver Point Specialty Lending Fund
Consolidated Schedule of Investments
December 31, 2021
(in U.S. Dollars)
Portfolio Company(1) | Industry | Rate(2) | Interest Rate | Original Acquisition Date | Maturity Date | Par Amount ($) / Shares or Ownership % / Notional ($)(3) | Cost / Amortized Cost(4) | Fair Value | % of Net Assets(5) | |||||||||||||||||||||||
Equities | ||||||||||||||||||||||||||||||||
Common Equities | ||||||||||||||||||||||||||||||||
United States of America | ||||||||||||||||||||||||||||||||
SP-CREH 19 Highline LLC(7)(17) | Multi-Family | N/A | N/A | 6/28/2021 | N/A | 70 | % | $ | 5,950,000 | $ | 5,436,667 | 0.96 | % | |||||||||||||||||||
|
|
|
|
|
| |||||||||||||||||||||||||||
Total Equities | 5,950,000 | 5,436,667 | 0.96 | |||||||||||||||||||||||||||||
|
|
|
|
|
| |||||||||||||||||||||||||||
Trust Interest | ||||||||||||||||||||||||||||||||
United States of America | ||||||||||||||||||||||||||||||||
TH Liquidating Trust(6)(7)(17) | Other | N/A | N/A | 10/9/2020 | 12/6/2024 | 14 | % | — | — | — | ||||||||||||||||||||||
TH Liquidating Trust(7)(17) | Other | N/A | N/A | 12/7/2019 | 12/6/2024 | 14 | % | 3,153,474 | 2,578,113 | 0.46 | ||||||||||||||||||||||
TH Liquidating Trust(7)(16) | Other | L+10.50%, 0.50% Floor | 11.00 | 12/7/2019 | 12/6/2024 | $ | 353,871 | 353,871 | 348,745 | 0.06 | ||||||||||||||||||||||
|
|
|
|
|
| |||||||||||||||||||||||||||
Total Trust Interest | 3,507,345 | 2,926,858 | 0.52 | |||||||||||||||||||||||||||||
|
|
|
|
|
| |||||||||||||||||||||||||||
Real Estate Properties | ||||||||||||||||||||||||||||||||
United States of America | ||||||||||||||||||||||||||||||||
30 South Broadway, Irvington, New York(7)(10)(17) | Industrial | N/A | N/A | 12/14/2021 | N/A | 90 | % | 9,537,532 | 9,486,863 | 1.68 | ||||||||||||||||||||||
16415 Tuckerton Road, Houston, Texas(7)(10)(17) | Healthcare Providers & Services | N/A | N/A | 9/7/2021 | N/A | 100 | % | 8,064,754 | 8,526,000 | 1.51 | ||||||||||||||||||||||
|
|
|
|
|
| |||||||||||||||||||||||||||
Total Real Estate Properties | 17,602,286 | 18,012,863 | 3.19 | |||||||||||||||||||||||||||||
|
|
|
|
|
| |||||||||||||||||||||||||||
Total Controlled Investments | $ | 50,879,305 | $ | 50,209,406 | 8.90 | % | ||||||||||||||||||||||||||
|
|
|
|
|
| |||||||||||||||||||||||||||
Total Investments, December 31, 2021 | $ | 928,245,070 | $ | 951,149,230 | 168.71 | % | ||||||||||||||||||||||||||
|
|
|
|
|
| |||||||||||||||||||||||||||
| (1) | All of our investments are issued by eligible portfolio companies, as defined in the Investment Company Act of 1940 (the “1940 Act”), unless otherwise noted. |
| (2) | Investments may contain a variable rate structure, subject to an interest rate floor or cap. Variable rate investments bear interest at a rate that may be determined by reference to either London Interbank Offered Rate (“LIBOR” or “L”), Euro Interbank Offer Rate (“Euribor” or “E”), Canadian Dollar Offered Rate (“CDOR” or “C”), Secured Overnight Financing Rate (“SOFR” or “S”), or Prime Rate (“P”), all of which can include one-, three- or six-month tenor, at the borrower’s option, which reset periodically based on the terms of the credit agreement. For investments with multiple interest rate contracts, the interest rate shown is the weighted average interest rate in effect at December 31, 2021. |
| (3) | Par amount includes unfunded commitments, accumulated payment-in-kind (“PIK”) interest and is net of repayments. Equity investments are recorded as number of shares owned or ownership percentage. |
| (4) | Cost represents amortized cost for debt investments less principal payments, plus capitalized PIK, if any. As of December 31, 2021, the aggregate gross unrealized appreciation for all investments in which there was an excess of fair value over tax cost was $35.7 million; the aggregate gross unrealized depreciation for all investments in which there was an excess of tax cost over fair value was $8.8 million; the net unrealized appreciation was $26.9 million; the aggregate tax cost of securities for Federal income tax purposes was $923.3 million. |
| (5) | Percentage is based on net assets of $563,684,976 as of December 31, 2021. |
| (6) | The investment has an unfunded commitment as of December 31, 2021 (see Note 11 in the accompanying notes to the consolidated financial statements). |
The accompanying notes are an integral part of these consolidated financial statements.
F-85
Table of Contents
Silver Point Specialty Lending Fund
Consolidated Schedule of Investments
December 31, 2021
(in U.S. Dollars)
| (7) | Fair value was determined using significant unobservable inputs (see Note 6 in the accompanying notes to the consolidated financial statements). |
| (8) | Some or all of these investments are pledged as collateral to the Revolving Credit Facility (see Note 7 in the accompanying notes to the consolidated financial statements). |
| (9) | Some or all of these investments are pledged as collateral to the 2021 CLO (see Note 7 in the accompanying notes to the consolidated financial statements). |
| (10) | These investments are treated as non-qualifying investments under Section 55(a) of the 1940 Act. Under the 1940 Act, the Fund may not acquire any non-qualifying asset unless, at the time the acquisition is made, qualifying assets represent at least 70% of the Fund’s total assets. As of December 31, 2021, qualifying assets totaled 77.11% of the Fund’s total assets. |
| (11) | The underlying credit agreement or indenture contains a PIK provision, whereby the issuer has either the option or the obligation to make a portion of the interest payments with the issuance of additional investments. The PIK portion of the coupon is 7.00%. |
| (12) | The underlying credit agreement or indenture contains a PIK provision, whereby the issuer has either the option or the obligation to make a portion of the interest payments with the issuance of additional investments. The PIK portion of the coupon is 2.67%. |
| (13) | The underlying credit agreement or indenture contains a PIK provision, whereby the issuer has either the option or the obligation to make a portion of the interest payments with the issuance of additional investments. The PIK portion of the coupon is 7.88%. |
| (14) | The underlying credit agreement or indenture contains a PIK provision, whereby the issuer has either the option or the obligation to make a portion of the interest payments with the issuance of additional investments. The PIK portion of the coupon is 10.00%. |
| (15) | The underlying credit agreement or indenture contains a PIK provision, whereby the issuer has either the option or the obligation to make a portion of the interest payments with the issuance of additional investments. The PIK portion of the coupon is 10.75%. |
| (16) | The underlying credit agreement or indenture contains a PIK provision, whereby the issuer has either the option or the obligation to make a portion of the interest payments with the issuance of additional investments. The PIK portion of the coupon is 2.00%. |
| (17) | Represents a non-income producing investment. |
| (18) | The negative fair value is the result of the original discount on the loan. |
| (19) | The negative amortized cost is the result of the original discount being greater than the principal amount outstanding on the loan. |
| (20) | Controlled Investments are defined by the 1940 Act, as investments in companies in which the Fund owns more than 25% of the voting securities or maintains greater than 50% of the board representation. Transactions during the year ended December 31, 2021 with these controlled investments were as follows: |
Portfolio Company | Type of Investment | Fair Value at December 31, 2020 | Gross additions* | Gross reductions | Net change in unrealized appreciation (depreciation) | Net realized gains (losses) | Fair Value at December 31, 2021 | Interest income | Dividend income | Par Amount ($) / Number Of Units / Ownership % | ||||||||||||||||||||||||||||||
30 South Broadway, Irvington, New York | Real Estate Properties | $ | — | $ | 9,537,533 | $ | — | $ | (50,670 | ) | $ | — | $ | 9,486,863 | $ | — | $ | — | 90 | % | ||||||||||||||||||||
SP Harvest Mill, LLC | Equities | — | — | — | — | — | — | — | 72,373 | — | ||||||||||||||||||||||||||||||
SP-CREH 19 Highline LLC | Secured Loans | — | 21,000,000 | — | 6,300 | — | 21,006,300 | 763,584 | — | 21,000,000 | ||||||||||||||||||||||||||||||
SP-CREH 19 Highline LLC | Equities | — | 5,950,000 | — | (513,333 | ) | — | 5,436,667 | — | — | 70 | % | ||||||||||||||||||||||||||||
SP-CREH 19 Highline LLC | Secured Loans | — | 2,819,673 | — | 7,045 | — | 2,826,718 | 32,663 | — | 6,125,000 | ||||||||||||||||||||||||||||||
TH Liquidating Trust | Trust Interest | 2,622,900 | — | — | (44,787 | ) | — | 2,578,113 | — | — | 14 | % | ||||||||||||||||||||||||||||
TH Liquidating Trust | Trust Interest | 275,744 | 73,871 | — | (870 | ) | — | 348,745 | 108 | — | 353,871 | |||||||||||||||||||||||||||||
TH Liquidating Trust | Trust Interest | — | — | — | — | — | — | — | — | 14 | % | |||||||||||||||||||||||||||||
16415 Tuckerton Road, Houston, Texas | Real Estate Properties | — | 8,064,754 | — | 461,246 | — | 8,526,000 | — | — | 100 | % | |||||||||||||||||||||||||||||
|
|
|
|
|
|
|
|
|
|
|
|
|
|
|
| |||||||||||||||||||||||||
Total | $ | 2,898,644 | $ | 47,445,831 | $ | — | $ | (135,069 | ) | $ | — | $ | 50,209,406 | $ | 796,355 | $ | 72,373 | |||||||||||||||||||||||
|
|
|
|
|
|
|
|
|
|
|
|
|
|
|
| |||||||||||||||||||||||||
The accompanying notes are an integral part of these consolidated financial statements.
F-86
Table of Contents
Silver Point Specialty Lending Fund
Consolidated Schedule of Investments
December 31, 2021
(in U.S. Dollars)
| * | Gross additions include increases in the cost basis of the investments resulting from new portfolio investments, accretion of discounts, PIK interest, and the exchange of one or more existing securities for one or more new investments. |
Additional Information
Foreign Currency Forward Contracts | Settlement Date | Amount Purchased | Amount Sold | Fair Value | ||||||||||||
Derivative Counterparty | ||||||||||||||||
JPMorgan Chase Bank | 3/31/2022 | $ | 11,505,603 | C$ | 14,785,954 | $ | (192,532 | ) | ||||||||
JPMorgan Chase Bank | 3/31/2022 | $ | 2,145,001 | € | 1,900,000 | (19,152 | ) | |||||||||
JPMorgan Chase Bank | 3/31/2022 | $ | 2,371,721 | € | 2,100,000 | (20,238 | ) | |||||||||
JPMorgan Chase Bank | 3/31/2022 | $ | 79,074,848 | € | 69,965,977 | (618,363 | ) | |||||||||
JPMorgan Chase Bank | 3/31/2022 | $ | 252,414 | € | 223,216 | (1,835 | ) | |||||||||
JPMorgan Chase Bank | 3/31/2022 | $ | 261,324 | € | 231,063 | (1,863 | ) | |||||||||
JPMorgan Chase Bank | 3/31/2022 | $ | 314,931 | € | 278,429 | (2,207 | ) | |||||||||
JPMorgan Chase Bank | 3/31/2022 | $ | 478,990 | € | 421,913 | (1,581 | ) | |||||||||
JPMorgan Chase Bank | 3/31/2022 | $ | 264,895 | € | 232,841 | (318 | ) | |||||||||
JPMorgan Chase Bank | 3/31/2022 | $ | 6,461,474 | £ | 4,879,880 | (139,324 | ) | |||||||||
JPMorgan Chase Bank | 3/31/2022 | € | 1,200,000 | $ | 1,356,228 | 10,606 | ||||||||||
JPMorgan Chase Bank | 3/31/2022 | € | 804,462 | R | 14,800,000 | (2,897 | ) | |||||||||
|
| |||||||||||||||
Total | $ | (989,704 | ) | |||||||||||||
|
| |||||||||||||||
The accompanying notes are an integral part of these consolidated financial statements.
F-87
Table of Contents
Silver Point Specialty Lending Fund
Notes to Consolidated Financial Statements
(in U.S. Dollars)
| 1. | Organization and Business |
Silver Point Specialty Lending Fund, a statutory trust organized under the laws of the state of Maryland (the “Fund”), was formed on November 15, 2021 (the “Conversion Date”). The Fund’s predecessor entity was originally formed as a Delaware limited liability company under the name SPCP Group VII, LLC on July 31, 2014. On April 1, 2015, the Fund was converted to a Delaware limited partnership under the name Silver Point Specialty Credit Fund, L.P. and entered into the initial limited partnership agreement. On July 1, 2015, additional limited partners were admitted to the Fund (the “Initial Closing” or the “Initial Closing Date”) and subsequent closings occurred on various dates until the final closing on December 29, 2016. On the Conversion Date, Silver Point Specialty Credit Fund, L.P. transferred all of its assets and liabilities to the Fund and converted to a Maryland statutory trust (the “Conversion”) in connection with the Fund’s intention to be treated as a Business Development Company (“BDC”) under the Investment Company of 1940 (the “1940 Act”), as amended. On December 30, 2021, the Fund elected to be treated as a BDC.
Prior to the Conversion Date, Silver Point Specialty Credit Fund GP, LLC, a Delaware limited liability company, served as the general partner (the “General Partner”) of the Fund and owners of beneficial interest in the Fund are collectively referred to herein as the “Limited Partners” and together with the general partner as the “Partners”. Following the Conversion, the owners of beneficial interest in the Fund are collectively referred to herein as the “Shareholders”, and together the Partners and the Shareholders are referred to herein as the “Investors”. Following the Conversion Date, the business and affairs of the Fund are managed exclusively by or under the direction of the board of trustees (the “Board”). Silver Point Specialty Credit Fund Management, LLC, a Delaware limited liability company, serves as the Fund’s adviser (the “Adviser”) and is registered with the U.S. Securities and Exchange Commission (the “SEC”) as an investment adviser. The Adviser provides certain management and administrative services to the Fund and is an affiliate of the General Partner. All references to the General Partner herein shall, where applicable, be inclusive of the General Partner or its designee, which includes but is not limited to the Adviser.
The Fund’s investment objective is to achieve stable income generation with attractive risk-adjusted returns primarily in U.S. middle market lending opportunities and specialty asset based financings. It is anticipated that the majority of the loans will be secured, floating rate investments. In seeking to achieve its investment objective, the Fund may invest across a broad range of asset classes, instruments and industries as the Board deems appropriate and may make investments in companies and issuers domiciled outside of the United States.
Prior to amendments in 2023, in the event that the Fund had not conducted an IPO by April 1, 2023 (the “IPO Outside Date”), then commencing on such date, unless otherwise agreed, the Fund would use its best efforts to wind down, liquidate and dissolve. In the event of an IPO, the Fund’s existence would continue, unless and until the Board determined to wind down the Fund.
During the first quarter of 2023, the Fund obtained approval from its Board and Shareholders to (i) remove the IPO Outside Date and extend the Fund’s investment period to June 30, 2025, and (ii) maintain the existing advisory fee structure through the extended investment period. Instead of conducting an IPO, the Fund agreed to provide Shareholders liquidity following the end of the Fund’s investment period by arranging the sale of common shares of beneficial interest of the Fund, at a price not less than net asset value per share, or the Fund will commence an orderly wind down.
F-88
Table of Contents
Silver Point Specialty Lending Fund
Notes to Consolidated Financial Statements (continued)
(in U.S. Dollars)
| 2. | Summary of Significant Accounting Policies |
Basis of Presentation
The accompanying consolidated financial statements have been prepared in accordance with generally accepted accounting principles in the United States of America (“U.S. GAAP”), are presented in U.S. dollars and include the accounts of the Fund and its wholly owned subsidiaries. All material intercompany balances and transactions have been eliminated. All references to the Fund include the accounts of its consolidated subsidiaries. Additionally, the accompanying audited consolidated financial statements of the Fund and related financial information have been prepared pursuant to the requirements of Article 6 of Regulation S-X of the Securities Act of 1933.
The Fund is an investment company and, therefore, applies the specialized accounting and reporting guidance in Accounting Standards Codification 946, Financial Services — Investment Companies.
Basis of Consolidation
The Fund generally consolidates any wholly, or substantially, owned subsidiary when the design and purpose of the subsidiary is to act as an extension of the Fund’s investment operations and to facilitate the execution of the Fund’s investment strategy. Accordingly, the Fund has consolidated the results of its subsidiaries in its consolidated financial statements, including Silver Point SCF CLO I, Ltd., Silver Point SCF CLO I, LLC, Specialty Credit Facility, LLC, Specialty Credit Holdings, LLC, Specialty Credit Fund Cayman, Ltd., Silver Point Specialty Credit Depositor, LLC, SCF West, LLC, SCF APEG Holdings, LLC, SCF CAL, L.P., SCF CAL GP, LLC, SCF I SPRE Holdings, LLC, SCF Union Crossing Holdings, LLC, and SLMD Holdings, Inc. All intercompany transactions and balances have been eliminated in consolidation. Since the Fund is an investment company, portfolio investments held by the Fund are not consolidated into the consolidated financial statements. The portfolio investments held by the Fund (including its investments held by consolidated subsidiaries) are included on the consolidated statements of assets and liabilities as investments at fair value.
Use of Estimates
The preparation of consolidated financial statements in accordance with U.S. GAAP requires management to make estimates and assumptions that affect the fair value of investments, the reported amounts of assets and liabilities, the disclosure of contingent assets and liabilities at the date of the consolidated financial statements, and the reported amounts of income and expenses during the reporting period. Actual results could differ from those estimates and such differences could be material.
Reclassifications
Certain prior period amounts may be reclassified to conform to the current presentation with no effect on our financial condition, results of operations or cash flows.
Investment Classification
The Fund operates as a non-diversified company within the meaning of the 1940 Act. However, the Fund’s investment portfolio may, from time to time, meet the diversification standards of a diversified company within the meaning of the 1940 Act. As required by the 1940 Act, the Fund classifies its investments by level of control. As defined in the 1940 Act, “Control Investments” are those where there is the ability or power to exercise a controlling influence over the management or policies of a company. Control is generally deemed to exist when a
F-89
Table of Contents
Silver Point Specialty Lending Fund
Notes to Consolidated Financial Statements (continued)
(in U.S. Dollars)
company or individual possesses or has the right to acquire within 60 days or less, a beneficial ownership of more than 25% of the voting securities of an investee company. Under the 1940 Act, “Affiliate Investments” are defined by a lesser degree of influence and are deemed to exist through the possession outright or via the right to acquire within 60 days or less, beneficial ownership of 5% or more of the outstanding voting securities of another person. “Non-Control/Non-Affiliate Investments” are those that are neither Control Investments nor Affiliate Investments.
The following table presents the composition of the investment portfolio by industry classifications at amortized cost and fair value as of December 31, 2022 and December 31, 2021 with corresponding percentages of total fair value:
| December 31, 2022 | December 31, 2021 | |||||||||||||||||||||||
Industry Classification | Cost / Amortized Cost | Fair Value | % of Fair Value | Cost / Amortized Cost | Fair Value | % of Fair Value | ||||||||||||||||||
Aerospace & Defense | $ | 59,119,567 | $ | 58,666,227 | 7.19 | % | $ | 51,405,168 | $ | 50,267,298 | 5.28 | % | ||||||||||||
Airline & Airport Services | 48,356,591 | 43,290,299 | 5.31 | 46,426,969 | 46,279,074 | 4.87 | ||||||||||||||||||
Automobiles & Components | 30,513,727 | 28,427,328 | 3.48 | 33,749,773 | 34,063,642 | 3.58 | ||||||||||||||||||
Business Services | 53,850,200 | 58,852,649 | 7.21 | 78,848,641 | 88,096,223 | 9.26 | ||||||||||||||||||
Consumer Apparel | 11,384,974 | 10,109,100 | 1.24 | 11,643,256 | 11,626,875 | 1.22 | ||||||||||||||||||
Consumer Brands | 2,323,088 | 1,919,075 | 0.24 | 24,187,798 | 24,161,076 | 2.54 | ||||||||||||||||||
Consumer Products | 17,990,518 | 18,236,175 | 2.24 | 25,874,572 | 25,980,311 | 2.73 | ||||||||||||||||||
Consumer Services | — | 5,756,066 | 0.71 | — | 12,657,607 | 1.33 | ||||||||||||||||||
E-Commerce | 32,684,177 | 32,871,916 | 4.03 | 36,144,352 | 32,697,718 | 3.44 | ||||||||||||||||||
Food Products | 16,803,998 | 16,635,252 | 2.04 | 16,781,227 | 17,036,704 | 1.79 | ||||||||||||||||||
Gaming & Leisure | 37,971,825 | 35,461,028 | 4.35 | 38,576,337 | 39,279,686 | 4.13 | ||||||||||||||||||
Healthcare Equipment & Supplies | 16,448,446 | 16,424,959 | 2.01 | 6,483,384 | 6,483,384 | 0.68 | ||||||||||||||||||
Healthcare Providers & Services | 57,229,184 | 57,219,067 | 7.02 | 70,868,648 | 71,023,909 | 7.47 | ||||||||||||||||||
Industrial | 9,537,533 | 9,442,001 | 1.16 | 9,537,532 | 9,628,617 | 1.01 | ||||||||||||||||||
Industrial Products & Services | 41,038,698 | 40,082,281 | 4.92 | 26,186,544 | 27,144,026 | 2.85 | ||||||||||||||||||
Manufacturing | 20,649,133 | 20,585,261 | 2.52 | 12,202,960 | 12,175,867 | 1.28 | ||||||||||||||||||
Media: Advertising | — | — | — | 15,078,498 | 15,691,364 | 1.65 | ||||||||||||||||||
Multi-Family | 46,299,037 | 43,598,393 | 5.35 | 59,122,583 | 60,184,425 | 6.33 | ||||||||||||||||||
Oilfield Services | 26,674,977 | 26,720,145 | 3.28 | — | — | — | ||||||||||||||||||
Other | 3,553,884 | 2,272,724 | 0.28 | 3,507,345 | 2,926,858 | 0.31 | ||||||||||||||||||
Paper & Packaging | 22,144,786 | 22,379,063 | 2.74 | 24,709,806 | 24,872,267 | 2.61 | ||||||||||||||||||
Pharmaceuticals & Life Sciences | 69,740,725 | 66,591,458 | 8.17 | 67,744,506 | 68,173,717 | 7.17 | ||||||||||||||||||
Power Generation | 5,422,670 | 5,458,490 | 0.67 | 25,134,593 | 26,540,445 | 2.79 | ||||||||||||||||||
Professional Services | 31,104,685 | 31,634,536 | 3.88 | 34,734,373 | 34,780,924 | 3.66 | ||||||||||||||||||
Real Estate Development & Management | 34,676,827 | 34,629,832 | 4.25 | 25,680,350 | 25,690,328 | 2.70 | ||||||||||||||||||
Restaurants | 4,856,954 | 4,769,625 | 0.58 | 4,892,330 | 4,852,089 | 0.51 | ||||||||||||||||||
Software & Services | 22,346,299 | 22,292,569 | 2.73 | 20,304,479 | 20,609,241 | 2.17 | ||||||||||||||||||
Specialty Chemicals | 25,355,702 | 24,472,485 | 3.00 | 6,257,368 | 6,368,375 | 0.67 | ||||||||||||||||||
Specialty Retail | 25,232,430 | 19,617,662 | 2.41 | 24,841,261 | 25,195,457 | 2.65 | ||||||||||||||||||
Staples Retail | 10,846,332 | 10,782,113 | 1.32 | 48,187,430 | 47,691,475 | 5.01 | ||||||||||||||||||
Technology | 32,323,307 | 31,129,382 | 3.82 | 22,704,834 | 23,121,031 | 2.43 | ||||||||||||||||||
Technology Hardware & Equipment | — | — | — | 41,428,153 | 40,849,217 | 4.30 | ||||||||||||||||||
Telecommunications | 15,000,000 | 15,097,500 | 1.85 | 15,000,000 | 15,000,000 | 1.58 | ||||||||||||||||||
|
|
|
|
|
|
|
|
|
|
|
| |||||||||||||
Total | $ | 831,480,274 | $ | 815,424,661 | 100.00 | % | $ | 928,245,070 | $ | 951,149,230 | 100.00 | % | ||||||||||||
|
|
|
|
|
|
|
|
|
|
|
| |||||||||||||
F-90
Table of Contents
Silver Point Specialty Lending Fund
Notes to Consolidated Financial Statements (continued)
(in U.S. Dollars)
The following table presents the composition of the investment portfolio by geographic dispersion at amortized cost and fair value as of December 31, 2022 and December 31, 2021 with corresponding percentages of total fair value:
| December 31, 2022 | December 31, 2021 | |||||||||||||||||||||||
Geographic Dispersion(1) | Cost / Amortized Cost | Fair Value | % of Fair Value | Cost / Amortized Cost | Fair Value | % of Fair Value | ||||||||||||||||||
Canada | $ | 19,588,291 | $ | 19,050,675 | 2.33 | % | $ | 21,033,431 | $ | 21,411,410 | 2.25 | % | ||||||||||||
Cayman Islands | 6,231,778 | 6,253,666 | 0.77 | 5,836,919 | 5,835,747 | 0.61 | ||||||||||||||||||
Japan | 22,404,546 | 20,200,955 | 2.48 | 23,997,684 | 24,537,398 | 2.58 | ||||||||||||||||||
Luxembourg | 33,225,945 | 26,076,579 | 3.20 | 76,168,532 | 75,963,991 | 7.99 | ||||||||||||||||||
Netherlands | 23,106,253 | 21,438,244 | 2.63 | 22,013,356 | 22,013,296 | 2.31 | ||||||||||||||||||
Singapore | 4,806,116 | 4,653,224 | 0.57 | 4,826,414 | 5,155,344 | 0.54 | ||||||||||||||||||
United Kingdom | 22,913,270 | 17,237,314 | 2.11 | 25,819,270 | 25,841,669 | 2.72 | ||||||||||||||||||
United States of America | 699,204,075 | 700,514,004 | 85.91 | 748,549,464 | 770,390,375 | 81.00 | ||||||||||||||||||
|
|
|
|
|
|
|
|
|
|
|
| |||||||||||||
Total | $ | 831,480,274 | $ | 815,424,661 | 100.00 | % | $ | 928,245,070 | $ | 951,149,230 | 100.00 | % | ||||||||||||
|
|
|
|
|
|
|
|
|
|
|
| |||||||||||||
| (1) | Geographic dispersion represents the country of the issuer and may not represent the operating domicile. |
Cash and Cash Equivalents
The Fund considers cash on deposit at a major financial institution as cash held at banks in the consolidated statements of assets and liabilities. Cash equivalents consist of highly liquid investments with an original maturity of generally 60 days or less, such as U.S. Treasury bills. At times, cash held at banks and cash equivalents may exceed Federal Deposit Insurance Corporation insured limits. Management believes that the credit risk to these deposits and cash equivalents is minimal. Cash equivalents are classified as Level 1 in the GAAP valuation hierarchy.
Foreign Cash Held at Banks
The Fund considers foreign cash held at banks as cash denominated in currencies other than the U.S. dollar. Management believes that the credit risk to these deposits is minimal.
Restricted Cash
Restricted cash consists of cash on deposit with major U.S. financial institutions in connection with the credit facility with Deutsche Bank AG and the 2021 Debt Securitization (Note 7). Restricted cash is generally restricted to the purchase of investments, as well as payment of expenses and interest. Restricted cash may be available for monthly withdrawal subject to certain restrictions.
Due from and Due to Broker
Due from broker consists of $2,969,179 of cash collateral related to foreign currency forward contracts and interest rate swaps (Note 5) as of December 31, 2022. Due to broker consists of $480,000 of cash collateral received related to foreign currency forward contracts as of December 31, 2021.
The Fund is a party to International Swap and Derivatives Association, Inc. (“ISDA”) Master Agreements (“Master Agreements”) with certain counterparties that govern over-the-counter derivative contracts entered into
F-91
Table of Contents
Silver Point Specialty Lending Fund
Notes to Consolidated Financial Statements (continued)
(in U.S. Dollars)
from time to time. The Master Agreements may contain provisions regarding, among other things, the parties’ general obligations, representations, agreements, collateral requirements, events of default and early termination. With respect to certain counterparties, in accordance with the terms of the Master Agreements, collateral posted to the Fund is held by the Fund’s custodian and with respect to those amounts that can be sold or repledged, are presented in the Fund’s portfolio. Collateral can be in the form of cash and U.S. government securities as agreed to by the Fund and the applicable counterparty. Cash collateral pledged by the Fund is segregated by the Fund’s custodian and the collateral requirements are determined based on the Fund’s net position with each counterparty.
Investment Transactions and Related Income and Expense
Investments, including derivative and foreign currency forward contracts, are carried at fair value, with resulting unrealized appreciation and depreciation reflected in the consolidated statements of operations. Purchases and sales of investments are recorded on a trade date basis. Net gains or losses on investments, derivative and foreign currency forward contracts are included on the consolidated statements of operations. Realized gains and losses on investments and derivative contracts are determined on the specific cost identification basis. Amounts received or paid related to derivative contracts are recognized on a net basis as realized gain (loss), except upfront payments made or received upon entering a derivative contract, which are treated as a part of the cost basis of the derivative contract. Purchases and settlements of foreign currency forward contracts having the same settlement date and counterparty are generally settled net and any realized gains or losses are recognized on the settlement date.
Loans including revolving credit agreements are generally recorded on the consolidated statements of assets and liabilities as a component of investments owned at fair value, net of the unfunded portion of the related revolving credit agreement. Real estate properties represent direct ownership of underlying real property assets. The properties are recorded at fair value and generally do not produce rental income.
Interest income and expense are recognized on an accrual basis. Debt investments are generally placed on non-accrual status when payments are past due and there is reasonable doubt that principal or interest will be collected. Generally, accrued interest is reversed against interest income when a debt investment is placed on non-accrual status. Interest payments received on debt investments on non-accrual status may be recognized as interest income or treated as a reduction of cost basis of the debt investment based on management’s judgment of ultimate recovery and other considerations. Loan origination and commitment fees received in-full at the inception of a loan or bond and fees earned in full upfront and to be paid at the termination of the loan are deferred and accreted into interest income, using the effective yield method as an enhancement to the related loan’s yield over the contractual life of the loan. The amortized cost of investments is adjusted for accretion of fees, if any. For the year ended December 31, 2022 and December 31, 2021, non-cash interest income related to such accretion amounts to $10,271,953 and $12,775,398, respectively. Upon the prepayment of a loan, prepayment premiums and any unamortized fees are recorded as interest income.
The Fund has loans in its portfolio that contain payment-in-kind (“PIK”) provisions. PIK interest, computed at the contractual rate specified in each loan agreement, is generally recorded as interest income on an accrual basis. On the specified capitalization date, PIK interest is added to the principal balance and cost of the loan.
Other Income
From time to time, the Fund may receive fees for services provided to portfolio companies by the Adviser. The services that the Adviser provides vary by investment, but may include syndication, structuring, diligence fees, or
F-92
Table of Contents
Silver Point Specialty Lending Fund
Notes to Consolidated Financial Statements (continued)
(in U.S. Dollars)
other service-based fees and fees for providing managerial assistance to our portfolio companies. These fees are recognized when services are rendered and recorded as other income.
Foreign Currency Transactions
Net realized gain (loss) from foreign currency transactions as reported in the consolidated statements of operations arises from sales of foreign currencies; currency gains or losses realized between the trade and settlement dates on investment transactions; and the difference between the amounts of dividends, interest, and foreign withholding taxes recorded on the Fund’s books and the U.S. dollar equivalent of the amounts actually received or paid. Net change in unrealized appreciation (depreciation) from foreign currency translations as reported in the consolidated statements of operations arises from changes in the fair values of assets and liabilities, other than investments at fiscal period-end, resulting from changes in exchange rates.
Investments and other assets and liabilities denominated in foreign currencies are translated into U.S. dollar amounts at the date of valuation. Purchases and sales of investments and income and expense items denominated in foreign currencies are translated into U.S. dollar amounts on the respective dates of such transactions.
The Fund does not isolate realized and unrealized gains and losses on investments and derivative contracts resulting from changes in foreign currency exchange rates on the consolidated statements of operations. Such fluctuations are reflected on the consolidated statements of operations together with net realized gain (loss) and net change in unrealized gain (loss) on investments and derivative contracts. The Fund generally attempts to hedge its foreign currency exposure through currency contracts.
Derivatives
In the normal course of business, the Fund has commitments and risks resulting from its investment transactions, which may include those involving derivative instruments. Derivative instruments are measured in terms of the notional contract amount and derive their value based upon one or more underlying instruments. While the notional amount gives some indication of the Fund’s derivative activity, it generally is not exchanged, but is only used as the basis on which interest and other payments are exchanged. Derivative instruments are subject to various risks similar to non-derivative instruments including market, credit, liquidity, and operational risks. The Fund manages these risks on an aggregate basis as part of its risk management process.
The Fund seeks to manage the currency risks associated with investments denominated in currencies other than U.S. dollars by using foreign currencies and entering into foreign currency forward contracts. In a foreign currency forward contract, the Fund agrees to recover or deliver a fixed quantity of one currency for another at a pre-determined price at a future date. The foreign currency forward contracts are recorded at fair value. The Fund does not utilize hedge accounting and as such, realized and unrealized gains and losses on foreign currency forward contracts are included on the consolidated statements of operations.
Additionally, the Fund seeks to mitigate interest rate risk associated with investments with fixed rate by entering into interest rate swaps. Interest rate swaps are recorded at fair value and are presented either as a derivative asset or a derivative liability on the Fund’s consolidated statements of assets and liabilities, depending on the nature of the balance at period end. Changes in the fair value of the interest rate swaps are presented as part of change in unrealized appreciation (depreciation) on the consolidated statements of operations for interest rate swaps not designated as hedging instruments. Interest rate swap agreements are derived using daily swap curves and models that incorporate a number of market data factors, such as discounted cash flows, trades and values of the underlying reference instruments. The fair value of the interest rate swaps does not take into account collateral
F-93
Table of Contents
Silver Point Specialty Lending Fund
Notes to Consolidated Financial Statements (continued)
(in U.S. Dollars)
posted which is recorded separately as due to or due from broker on the Fund’s consolidated statements of assets and liabilities, depending on the nature of the balance at period end.
Distributions from Equity Investments
Distributions received from equity investments in limited liability companies (“LLCs”) and limited partnerships (“LPs”) are evaluated to determine if the distribution should be recorded as dividend income, return of capital or realized gain (loss). Generally, the Fund will not record distributions from equity investments in LLCs and LPs as dividend income unless there are sufficient accumulated tax basis earnings and profits in the LLCs or LPs prior to the distribution. Prior to the ex-dividend date, the value of a dividend may be reflected in the fair value of the equity investment. Distributions that are classified as a return of capital are recorded as a reduction in the cost basis of the equity investment.
Deferred Financing Costs and Debt Issuance Costs
Deferred financing costs represent fees and other direct costs incurred in connection with the Fund’s borrowings. For revolving credit facilities, these amounts are capitalized as an asset within the consolidated statements of assets and liabilities and are amortized using the straight-line methodology over the expected term of the borrowing which is generally expected to be at the end of the revolving period. The Fund records costs related to the issuance of term debt obligations as debt issuance costs. These costs are deferred and amortized using the effective interest method. These costs are presented as a reduction to the outstanding principal amount of the term debt obligations on the consolidated statements of assets and liabilities.
Deferred Offering Costs
The Fund may incur legal, accounting, regulatory, investment banking and other costs in relation to equity offerings. IPO offering costs are recorded as deferred offering costs and are charged against paid-in capital in excess of par on completion of the related offering or written off if the offering does not occur.
Expenses
Expenses are recorded on an accrual basis.
Capital Activity
Prior to the Fund’s Conversion, contributions and distributions were recorded as an increase and decrease to partners’ capital based on the effective date of the related capital call or distribution (Note 9). Post Conversion dividends paid to shareholders are recorded on the ex-dividend date. The amount to be paid out as a dividend is determined by the Board and is generally based upon income estimated by the Adviser.
Valuation of Investments and Derivative Contracts
Investments owned at fair value consist primarily of secured loans, bonds, real estate properties and equities. Derivative contracts consist of foreign currency forward contracts and interest rate swaps.
Effective August 10, 2022, the Board designated our Adviser as the Fund’s valuation designee pursuant to Rule 2a-5 under the Investment Company Act, which establishes requirements for determining fair value in good faith for purposes of the Investment Company Act. Accordingly, our Adviser has appointed its BDC Valuation
F-94
Table of Contents
Silver Point Specialty Lending Fund
Notes to Consolidated Financial Statements (continued)
(in U.S. Dollars)
Committee with the responsibility for fair value determinations pursuant to valuation procedures adopted for the Fund. The Board oversees the Adviser in its role as valuation designee in accordance with the requirements of Rule 2a-5 under the Investment Company Act.
Investments and derivative contracts are valued in good faith by the Adviser, as the Fund’s valuation designee, at fair value pursuant to the valuation policy, which considers quotations provided by independent pricing sources, when such quotations are available and deemed reliable.
Investments that are not listed on an exchange but are actively traded over-the-counter are generally valued at the representative “bid” quotation if held long and the representative “ask” quotation if held short or, in the case of equities that trade in over-the-counter marketplaces, at the last deemed reliable sale price provided by independent pricing sources. Derivative contracts not listed on an exchange are generally valued through industry-standard valuation models using inputs obtained from pricing vendors and from the relevant derivative contract.
Investments for which independent pricing sources or recent transaction activity are either not readily available or are not deemed reliable (“Non-quoted Investments”) are fair valued as determined in good faith by the Adviser, as the Fund’s valuation designee. Non-Quoted Investments are valued in a multi-step process:
| 1. | The BDC valuation team within the Fund Accounting team of the Adviser (“Fund Accounting”) provides recent portfolio company financial statements and other reporting materials to independent valuation firm(s) (“IVF”) approved by the BDC Valuation Committee. |
| 2. | The IVF evaluates this information along with relevant observable market data to conduct independent valuations each quarter, and their valuation recommendations are documented and discussed with the BDC Valuation Committee, Fund Accounting and the relevant investment professionals, as appropriate. |
| 3. | The valuation recommendations for certain investments may be determined by the BDC Valuation Committee in good faith in accordance with the valuation policy for the Fund without the employment of an IVF, based on immateriality or other considerations as appropriate. |
| 4. | The BDC Valuation Committee discusses the valuations and approves the fair value of the investments in good faith based on the input and advice provided by the IVF, the BDC valuation team and relevant investment professionals of the Adviser, as necessary. |
The Fund conducts this valuation process on a quarterly basis.
The estimated fair value of financial instruments is based upon available information and may not be the amount that the Fund would realize in a current transaction or might be ultimately realized, since such amounts depend on future circumstances, and the differences could be material.
In accordance with the authoritative guidance on fair value measurements and disclosures under U.S. GAAP, the Fund discloses the fair value of its investments according to a hierarchy that prioritizes the inputs used to measure the fair value. The hierarchy gives the highest priority to valuations based upon unadjusted quoted prices on a securities exchange in active markets for identical assets or liabilities (level 1 measurements) and the lowest priority to valuations based upon unobservable inputs that are significant to the valuation (level 3 measurements). In accordance with GAAP, these inputs are summarized in the three broad levels listed below:
Level 1: Inputs that reflect unadjusted quoted prices on a securities exchange in active markets for identical assets or liabilities;
F-95
Table of Contents
Silver Point Specialty Lending Fund
Notes to Consolidated Financial Statements (continued)
(in U.S. Dollars)
Level 2: Inputs other than quoted prices on a securities exchange that are observable for the asset or liability either directly or indirectly in active markets, or unadjusted prices on a securities exchange in markets that are not considered to be active;
Level 3: Significant inputs that may be unobservable or inputs, including market quotations other than quoted prices on a securities exchange, in markets that are not considered to be active.
Inputs are used in applying the various valuation techniques and broadly refer to the assumptions that market participants use to make valuation decisions including assumptions about risk. Inputs may include price information, volatility statistics, specific and broad credit data, liquidity statistics and other factors. An investment’s level within the fair value hierarchy is based on the lowest level of any input that is significant to the fair value measurement. However, the determination of what constitutes “observable” requires judgment by the Adviser. The Adviser considers observable data to be that market data which is readily available, regularly distributed or updated, reliable and verifiable, not proprietary, and provided by multiple independent sources that are actively involved in the relevant market. The categorization of an investment within the hierarchy is based upon the pricing transparency of the investment and does not necessarily correspond to the Adviser’s perceived risk of that instrument.
In determining an instrument’s placement within the hierarchy, the Adviser separates the Fund’s investment portfolio into two categories: investments and derivative contracts. Each of these categories can further be divided between assets and liabilities and further by investment type.
There were no investments classified within level 1 as of December 31, 2022, or December 31, 2021.
Investments that are valued based on dealer quotations or alternative pricing sources supported by observable inputs are generally classified within level 2. These may include certain bonds or bank loans.
Derivative contracts can be exchange-traded or privately negotiated over-the-counter (“OTC”). OTC derivatives, including foreign currency forward contracts and interest rate swaps are generally valued using observable inputs. In instances where models are used, the value of an OTC derivative depends upon the contractual terms of, and specific risks inherent in the instrument as well as the availability and reliability of observable inputs. OTC derivatives are typically classified within level 2 of the fair value hierarchy depending on their liquidity or the observability of their inputs.
Investments classified within level 3 have significant unobservable inputs. Level 3 instruments may include certain bank loans, trust interests, private equity and real estate properties. When observable prices are not available for these investments, one or more valuation techniques (e.g., market approach or income approach) for which sufficient and reliable data is available may be used. Within level 3, the use of the market approach technique generally consists of using comparable market data, while the use of the income approach technique generally consists of the net present value of estimated future cash flows, adjusted as appropriate for liquidity, credit, market and/or other factors. Quotations provided by independent pricing sources may also be considered, if available and deemed reliable, in determining the value of level 3 investments.
The inputs used in estimating the value of level 3 investments that are not valued using quotations provided by independent pricing sources may include but are not limited to the original transaction price, recent transactions in the same or similar instruments, completed or pending third party transactions in the underlying investment or comparable issuers, subsequent rounds of financing, recapitalizations and other transactions across the capital structure, offerings in the equity or debt capital markets, discount rates, durations and changes in financial ratios
F-96
Table of Contents
Silver Point Specialty Lending Fund
Notes to Consolidated Financial Statements (continued)
(in U.S. Dollars)
or cash flows. Comparable public companies may also be identified based on industry, size, strategy, etc. and a trading multiple or yield is determined for each comparable company. Additionally, level 3 investments may also be adjusted to reflect illiquidity and/or non-transferability, with the amount of such discount estimated in the absence of market information. Assumptions used due to the lack of observable inputs may significantly impact the resulting fair value and therefore the Fund’s consolidated results of operations.
Income Taxes
The Fund is currently treated as a partnership for U.S. federal income tax purposes. The Fund itself is not subject to U.S. federal income taxes; each investor is individually liable for income taxes, if any, on its share of the Fund’s net taxable income. The Fund may be subject to entity level taxes with respect to certain state sourced income, as well as other income allocable to underlying resident investors; such taxes may be treated as entity level expenses or, to the extent such taxes are determined based on the identity or jurisdiction of each investor, specially charged to investors based on their allocable share, if any, of such income. This state and local tax withholding paid by the Fund on behalf of these investors is recorded in other assets until the time at which it is netted against each relevant investor’s current income distribution. Interest, dividends and other income realized by the Fund from non-U.S. sources and capital gains realized on the sale of securities of non-U.S. issuers may be subject to withholding and other taxes levied by the jurisdiction in which the income is sourced. Such withholding taxes are accrued when incurred and are shown on the consolidated statements of operations, where applicable, as withholding taxes. For the year ended December 31, 2022 and December 31, 2021, the Fund incurred a net tax expense, which is included in other expense on the consolidated statement of operations, of zero and $44,731, respectively. The Fund conducts its business to the maximum extent practicable so that the Fund’s activities do not create a taxable presence in any non-U.S. jurisdiction in which the Fund or the Adviser do not have offices.
The Fund is subject to partnership audit rules enacted as part of the Bipartisan Budget Act of 2015 (the “Centralized Partnership Audit Regime”). Under the Centralized Partnership Audit Regime, any IRS audit of the Fund would be conducted at the Fund level rather than in separate proceedings involving each Investor. Adjustments to partnership items will generally be determined at the Fund level, and the Fund may be required to pay taxes (and associated interest and penalties) imposed as a result of such adjustments. In certain cases, the Fund may be able to elect to have the tax assessed or collected at the investor level. In the event of an audit, these new rules, and any elections thereunder, may significantly affect the amount and timing of tax (and associated interest and penalties) that is required to be borne by the Fund and its investors, as well as the manner in which such amounts are allocated among its Investors (including former Investors).
The Fund follows the authoritative guidance on accounting for and disclosure of uncertainty in tax positions, and is required to determine whether a tax position of the Fund is more likely than not to be sustained upon examination, including resolution of any related appeals or litigation processes, based on the technical merits of the position. For tax positions meeting the more likely than not threshold, the tax amount recognized in the consolidated financial statements is reduced by the largest benefit that has a greater than fifty percent likelihood of being realized upon ultimate settlement with the relevant taxing authority. For the year ended December 31, 2022 and December 31, 2021, there were no liabilities related to accounting for uncertainty in tax positions.
The Fund files tax returns as prescribed by the tax laws of the jurisdictions in which it operates and invests, if required. In the normal course of business, the Fund is subject to examination by federal, state, local and foreign jurisdictions, where applicable. The Fund may be subject to examination by such jurisdictions for all open tax years, the earliest of which is 2019. The Fund recognizes interest and penalties, when known, related to realized
F-97
Table of Contents
Silver Point Specialty Lending Fund
Notes to Consolidated Financial Statements (continued)
(in U.S. Dollars)
tax positions on the consolidated statements of operations. For the year ended December 31, 2022 and December 31, 2021, there were no interest and penalties.
Recent Accounting Pronouncements
In January 2021, the Financial Accounting Standards Board issued Accounting Standards Update No. 2021-01 (“ASU 2021-01”), “Reference Rate Reform (Topic 848)”. ASU 2021-01 is an update of ASU 2020-04, which is in response to concerns about structural risks of interbank offered rates, and particularly the risk of cessation of LIBOR; regulators have undertaken reference rate reform initiatives to identify alternative reference rates that are more observable or transaction based and less susceptible to manipulation. ASU 2020-04 provides optional guidance for a limited period of time to ease the potential burden in accounting for (or recognizing the effects of) reference rate reform on financial reporting. ASU 2020-04 is elective and applies to all entities, subject to meeting certain criteria, that have contracts, hedging relationships, and other transactions that reference LIBOR or another reference rate expected to be discontinued because of reference rate reform. The ASU 2021-01 update clarifies that certain optional expedients and exceptions in Topic 848 for contract modifications and hedge accounting apply to derivatives that are affected by the discounting transition. In December 2022, the FASB issued ASU No. 2022-06, Reference Rate Reform (Topic 848): Deferral of the Sunset Date of Topic 848, which deferred the sunset day of this guidance to December 31, 2024. The Fund adopted this guidance and the adoption did not have a material impact on the Fund’s consolidated financial statements.
| 3. | Reverse Repurchase Agreements |
The Fund may enter into reverse repurchase transactions in order to finance certain investments. In reverse repurchase agreements, the Fund sells investments to a counterparty and the Fund agrees to repurchase the same investments at an agreed upon price and date. These agreements are carried at the amounts at which the investments will be subsequently repurchased from the counterparties, plus initial margin. The associated investments collateral is reflected in investments owned, at fair value on the consolidated statements of assets and liabilities. As the valuation of the underlying investments increases, variation margin is posted as collateral by the counterparty to the Fund and as the valuation decreases, variation margin is returned and posted as collateral by the Fund to the counterparty, in each case to secure the repurchase obligations of the parties. Fluctuations arising from the translation of foreign currency on the Reverse Repurchase agreements are included within the net change in unrealized appreciation (depreciation) on translation of assets and liabilities in foreign currencies on the consolidated statements of operations.
The Fund is party to Global Master Repurchase Agreements and/or Master Repurchase Agreements with counterparties which govern the repurchase and reverse repurchase transactions, including settlement in the event of default. In the event of default of the counterparty’s obligation to repurchase the investment in a repurchase agreement, the Fund generally has the right to retain or sell the purchased investment, liquidate any additional collateral and apply the proceeds in satisfaction of the repurchase obligation. The use of repurchase agreements involves the potential risk of loss by the Fund of the investments pledged as collateral. In addition, in the event the buyer of the investments under a reverse repurchase agreement files for bankruptcy or becomes insolvent, the Fund’s use of the proceeds of the agreement may be restricted pending a determination by the party, or its trustee, whether to enforce the Fund’s obligation to repurchase the investments. To manage these risks, the Adviser actively monitors its use of leverage and seeks to maintain sufficient liquid assets to meet the demands of the counterparties to these agreements in the event of adverse changes in market conditions.
As of December 31, 2022 and December 31, 2021, there were no reverse repurchase agreements outstanding.
F-98
Table of Contents
Silver Point Specialty Lending Fund
Notes to Consolidated Financial Statements (continued)
(in U.S. Dollars)
| 4. | Sell / Buy-back Agreements |
The Fund may also finance the purchase of certain investments through sell / buy-back agreements, which are similar to repurchase agreements. In a sell / buy-back agreement, the Fund enters into a trade to sell an investment and contemporaneously enters into a trade to buy the same investment back on a specified date in the future with the same counterparty. The Fund uses sell/buy-back agreements as a short-term financing alternative to its existing revolving credit facilities with terms generally 90 days or less. Under U.S. GAAP, the Fund treats its sell/buy-back agreements as secured borrowings and continues to present the investment as an asset and the obligation to return the cash received as a liability on the consolidated statements of assets and liabilities. The amount borrowed is generally equal to the cost of the assets pledged. Interest income earned on investments pledged as collateral and financing charges associated with the sell / buy-back agreements are included within interest income and interest and financing expenses, respectively, on the consolidated statements of operations. Accrued interest receivable on investments and accrued financing charges on the sell / buy-back agreements are included within interest receivable and interest payable, respectively, on the consolidated statements of assets and liabilities. As of December 31, 2022 and December 31, 2021, there were no outstanding borrowings under the sell / buy-back agreements.
| 5. | Derivative Contracts |
The Fund may enter into derivative financial instruments in the normal course of business to achieve certain risk management objectives, including managing its interest rate, credit risk and foreign currency risk exposures.
The following table presents the details of the Fund’s average U.S. dollar notional exposure for the year ended December 31, 2022 and December 31, 2021:
| For the Year Ended December 31, 2022 | For the Year Ended December 31, 2021 | |||||||||||||||||||||||
| Interest Rate Swaps | Total Return Swaps(2) | Foreign Currency Forward Contracts | Interest Rate Cap(2) | Total Return Swaps(2) | Foreign Currency Forward Contracts | |||||||||||||||||||
Average notional value(1) | $ | 38,607,370 | $ | 30,603,714 | $ | 46,808,283 | $ | 80,000,000 | $ | 5,816,215 | $ | 55,214,222 | ||||||||||||
Risk exposure | Interest Rate | Interest Rate | | Foreign Currency | | Interest Rate | Credit Risk | | Foreign Currency | | ||||||||||||||
| (1) | For each contract type, calculated based on month end amounts during which the contract was held. |
| (2) | Contracts no longer held as of the end of reporting period. |
The Fund’s net exposure to foreign currency forward contracts and interest rate swaps presented on the consolidated statements of assets and liabilities was as follows:
| Gross Amount of Assets | Gross Amount of Liabilities | Net Amount of Assets or (Liabilities) | Collateral (Received) Pledged | Net Amounts | ||||||||||||||||
December 31, 2022 | ||||||||||||||||||||
Foreign currency forward contracts | $ | 242,373 | $ | 125,230 | $ | 117,143 | $ | 2,010,000 | $ | 2,127,143 | ||||||||||
Interest rate swaps | 165,747 | — | 165,747 | 959,179 | 1,124,926 | |||||||||||||||
December 31, 2021 | ||||||||||||||||||||
Foreign currency forward contracts | 10,606 | 1,000,310 | (989,704 | ) | (480,000 | ) | (1,469,704 | ) | ||||||||||||
F-99
Table of Contents
Silver Point Specialty Lending Fund
Notes to Consolidated Financial Statements (continued)
(in U.S. Dollars)
The effect of transactions in derivative instruments on the consolidated statements of operations was presented in Net Gain (Loss). Refer to consolidated statements of operations for details.
| 6. | Fair Value Measurements |
The following table presents the investments carried on the consolidated statements of assets and liabilities by level within the fair value hierarchy as of December 31, 2022.
| December 31, 2022 | ||||||||||||||||
| Level 1 | Level 2 | Level 3 | Total | |||||||||||||
Investments: | ||||||||||||||||
Secured loans | $ | — | $ | 74,605,862 | $ | 625,670,030 | $ | 700,275,892 | ||||||||
Secured bonds | — | 87,518,365 | — | 87,518,365 | ||||||||||||
Equities | — | — | 16,057,433 | 16,057,433 | ||||||||||||
Real estate properties | — | — | 9,300,247 | 9,300,247 | ||||||||||||
Trust interest | — | — | 2,272,724 | 2,272,724 | ||||||||||||
|
|
|
|
|
|
|
| |||||||||
Total investments | $ | — | $ | 162,124,227 | $ | 653,300,434 | $ | 815,424,661 | ||||||||
|
|
|
|
|
|
|
| |||||||||
Derivative contracts: | ||||||||||||||||
Foreign currency forward contracts(1) | $ | — | $ | 117,143 | $ | — | $ | 117,143 | ||||||||
Interest rate swaps | — | 165,747 | — | 165,747 | ||||||||||||
|
|
|
|
|
|
|
| |||||||||
Total derivative contracts | $ | — | $ | 282,890 | $ | — | $ | 282,890 | ||||||||
|
|
|
|
|
|
|
| |||||||||
| (1) | As of December 31, 2022, foreign currency forward contracts included foreign currency forward contracts assets of $242,373 and liabilities of $125,230. |
The following table presents the investments carried on the consolidated statements assets and liabilities by level within the fair value hierarchy as of December 31, 2021.
| December 31, 2021 | ||||||||||||||||
| Level 1 | Level 2 | Level 3 | Total | |||||||||||||
Investments: | ||||||||||||||||
Secured loans | $ | — | $ | 237,275,625 | $ | 559,294,204 | $ | 796,569,829 | ||||||||
Secured bonds | — | 94,227,254 | — | 94,227,254 | ||||||||||||
Equities | — | — | 39,412,426 | 39,412,426 | ||||||||||||
Real estate properties | — | — | 18,012,863 | 18,012,863 | ||||||||||||
Trust interest | — | — | 2,926,858 | 2,926,858 | ||||||||||||
|
|
|
|
|
|
|
| |||||||||
Total investments | $ | — | $ | 331,502,879 | $ | 619,646,351 | $ | 951,149,230 | ||||||||
|
|
|
|
|
|
|
| |||||||||
Derivative contracts: | ||||||||||||||||
Foreign currency forward contracts(1) | $ | — | $ | (989,704 | ) | $ | — | $ | (989,704 | ) | ||||||
|
|
|
|
|
|
|
| |||||||||
Total derivative contracts | $ | — | $ | (989,704 | ) | $ | — | $ | (989,704 | ) | ||||||
|
|
|
|
|
|
|
| |||||||||
| (1) | As of December 31, 2021, foreign currency forward contracts included foreign currency forward contracts assets of $10,606 and liabilities of $1,000,310. |
F-100
Table of Contents
Silver Point Specialty Lending Fund
Notes to Consolidated Financial Statements (continued)
(in U.S. Dollars)
The following table includes a roll forward of the amounts for the year ended December 31, 2022 for investments classified within level 3. The classification of an investment within level 3 is based upon the significance of the unobservable inputs to the overall fair value measurement.
| Fair Value Measurements of Level 3 Investments | ||||||||||||||||||||||||
| Secured Loans | Secured Bonds | Equities | Trust Interest | Real Estate Properties | Total | |||||||||||||||||||
Balance at January 1, 2022 | $ | 559,294,204 | $ | — | $ | 39,412,426 | $ | 2,926,858 | $ | 18,012,863 | $ | 619,646,351 | ||||||||||||
Transfer in(1) | 90,414,420 | — | — | — | — | 90,414,420 | ||||||||||||||||||
Transfer out | — | — | — | — | — | — | ||||||||||||||||||
Accretion/amortization of discounts/premiums | 5,529,930 | — | — | — | — | 5,529,930 | ||||||||||||||||||
Interest paid-in-kind | 1,292,143 | — | — | 46,540 | — | 1,338,683 | ||||||||||||||||||
Purchases(2) | 166,572,274 | — | 690,758 | — | 80,772 | 167,343,804 | ||||||||||||||||||
Sales, paydowns and resolutions(2) | (195,354,491 | ) | — | (10,239,069 | ) | — | (8,348,500 | ) | (213,942,060 | ) | ||||||||||||||
Net realized gain/(loss) | (54,371 | ) | — | 285,961 | — | 202,974 | 434,564 | |||||||||||||||||
Net change in unrealized appreciation/(depreciation) | (2,024,079 | ) | — | (14,092,643 | ) | (700,674 | ) | (647,862 | ) | (17,465,258 | ) | |||||||||||||
|
|
|
|
|
|
|
|
|
|
|
| |||||||||||||
Balance at December 31, 2022 | $ | 625,670,030 | $ | — | $ | 16,057,433 | $ | 2,272,724 | $ | 9,300,247 | $ | 653,300,434 | ||||||||||||
|
|
|
|
|
|
|
|
|
|
|
| |||||||||||||
Change in net unrealized appreciation / (depreciation) on investments held as of December 31, 2022 | $ | (1,644,316 | ) | $ | — | $ | (11,848,951 | ) | $ | (700,674 | ) | $ | (186,616 | ) | $ | (14,380,557 | ) | |||||||
|
|
|
|
|
|
|
|
|
|
|
| |||||||||||||
| (1) | Investments were transferred in from level 2 to level 3 due to a lack of observable market data. |
| (2) | Includes the effects of reorganizations. |
F-101
Table of Contents
Silver Point Specialty Lending Fund
Notes to Consolidated Financial Statements (continued)
(in U.S. Dollars)
The following table includes a roll forward of the amounts for the year ended December 31, 2021 for investments classified within level 3. The classification of an investment within level 3 is based upon the significance of the unobservable inputs to the overall fair value measurement.
| Fair Value Measurements of Level 3 Investments | ||||||||||||||||||||||||
| Secured Loans | Secured Bonds | Equities | Trust Interest | Real Estate Properties | Total | |||||||||||||||||||
Balance at January 1, 2021 | $ | 549,033,503 | $ | — | $ | 16,445,611 | $ | 2,898,644 | $ | — | $ | 568,377,758 | ||||||||||||
Transfer in(1) | 19,100,000 | 606,633 | — | — | — | 19,706,633 | ||||||||||||||||||
Transfer out | — | — | — | — | — | — | ||||||||||||||||||
Accretion/amortization of discounts/premiums | 4,471,604 | 28,690 | — | — | — | 4,500,294 | ||||||||||||||||||
Interest paid-in-kind | 3,523,476 | — | — | 73,871 | — | 3,597,347 | ||||||||||||||||||
Purchases(2) | 327,598,176 | — | 14,950,321 | — | 17,602,287 | 360,150,784 | ||||||||||||||||||
Sales, paydowns and resolutions(2) | (342,509,877 | ) | (609,681 | ) | (10,394,478 | ) | — | (1,084 | ) | (353,515,120 | ) | |||||||||||||
Net realized gain/(loss) | (10,986,984 | ) | — | 8,354,864 | — | 1,084 | (2,631,036 | ) | ||||||||||||||||
Net change in unrealized appreciation/(depreciation) | 9,064,306 | (25,642 | ) | 10,056,108 | (45,657 | ) | 410,576 | 19,459,691 | ||||||||||||||||
|
|
|
|
|
|
|
|
|
|
|
| |||||||||||||
Balance at December 31, 2021 | $ | 559,294,204 | $ | — | $ | 39,412,426 | $ | 2,926,858 | $ | 18,012,863 | $ | 619,646,351 | ||||||||||||
|
|
|
|
|
|
|
|
|
|
|
| |||||||||||||
Change in net unrealized appreciation / (depreciation) on investments held as of December 31, 2021 | $ | 617,675 | $ | — | $ | 10,413,650 | $ | (45,657 | ) | $ | 410,576 | $ | 11,396,244 | |||||||||||
|
|
|
|
|
|
|
|
|
|
|
| |||||||||||||
| (1) | Investment was transferred in from level 2 to level 3 due to a lack of observable market data. |
| (2) | Includes the effects of reorganizations. |
All realized gains (losses) and change in unrealized appreciation (depreciation) in the tables above are reflected in the accompanying consolidated statements of operations. Transfers between levels 1, 2 or 3, if any, are recognized at the beginning value on January 1.
F-102
Table of Contents
Silver Point Specialty Lending Fund
Notes to Consolidated Financial Statements (continued)
(in U.S. Dollars)
The following tables provide quantitative information about the Fund’s level 3 fair value measurements for the Fund’s investments as of December 31, 2022 and December 31, 2021. In addition to the techniques and inputs noted in the tables below, the Fund may also use, in accordance with the valuation policy, other valuation techniques and methodologies when determining the Fund’s fair value measurements. The below tables are not intended to be inclusive of all unobservable inputs, but rather provide information on the significant level 3 inputs as they relate to the Fund’s fair value measurements.
| Quantitative Information about Level 3 Value Investments | ||||||||||||||
Investment Type | Fair Value at December 31, 2022 | Valuation | Unobservable | Range (Weighted | Impact to Valuation from an Increase in Input(1) | |||||||||
Secured Loans | $ | 563,505,022 | Income Approach | Yield | 7.0% - 20.8% (12.9%) | Decrease | ||||||||
| Expected Term(2) | 0.4 yrs. - 3.1 yrs. (1.0 yrs.) | Decrease | ||||||||||||
| 24,062,324 | Market Quotation | Market Quotation | N/A | N/A | ||||||||||
| 38,102,684 | Recent Transaction | Recent Transaction | N/A | N/A | ||||||||||
Equities | 7,240,238 | Income Approach | Discount Rate | 15.0% - 17.0% (15.8%) | Decrease | |||||||||
| Expected Term(2) | 0.9 yrs. | Decrease | ||||||||||||
| 5,756,066 | Discount to Market Quotation | Discount | 25.8% | Decrease | ||||||||||
| 3,061,129 | Market Comparables | Earnings Multiple | 6.8x | Increase | ||||||||||
Real Estate Properties | 9,300,247 | Income Approach | Discount Rate | 10.5% | Decrease | |||||||||
| Expected Term(2) | 0.7 yrs. | Decrease | ||||||||||||
Trust Interest | 2,272,724 | Asset Approach | Recovery Rate | 3.5% | Increase | |||||||||
|
| |||||||||||||
Total Level 3 Investments | $ | 653,300,434 | ||||||||||||
|
| |||||||||||||
| (1) | This column represents the directional change in the fair value of the Level 3 investments that would result from an increase to the corresponding unobservable input. A decrease to the unobservable input would have the opposite effect. Significant changes in these inputs in isolation could result in significantly higher or lower fair value measurements. |
| (2) | Expected term is an unobservable input for investments where the valuation methodology contemplates exits other than contractual maturities, if any. Weighted average expected term for Level 3 investments was approximately 3.0 years as of December 31, 2022. |
F-103
Table of Contents
Silver Point Specialty Lending Fund
Notes to Consolidated Financial Statements (continued)
(in U.S. Dollars)
| Quantitative Information about Level 3 Value Investments | ||||||||||||||
Investment Type | Fair Value at December 31, 2021 | Valuation | Unobservable | Range (Weighted | Impact to Valuation from an Increase in Input(1) | |||||||||
Secured Loans | $ | 424,006,508 | Income Approach | Yield | 5.3% - 19.1% (9.7%) | Decrease | ||||||||
| Expected Term(2) | 1.3 yrs. - 3.3 yrs. (2.0 yrs.) | Decrease | ||||||||||||
| 89,542,125 | Market Quotation | Market Quotation | N/A | N/A | ||||||||||
| 45,745,571 | Recent Transaction | Recent Transaction | N/A | N/A | ||||||||||
Equities | 12,657,607 | Discount to Market Quotation | Discount | 30.5% | Decrease | |||||||||
| 7,134,277 | Income Approach | Discount Rate | 15.0% - 16.0% (15.8%) | Decrease | ||||||||||
| Expected Term(2) | 0.5 yrs - 1.8 yrs. (1.5 yrs.) | Decrease | ||||||||||||
| 9,932,386 | Market Quotation | Market Quotation | N/A | N/A | ||||||||||
Real Estate Properties | 9,486,863 | Income Approach | Discount Rate | 13.8% | Decrease | |||||||||
| Expected Term(2) | 0.8 yrs. | Decrease | ||||||||||||
| 8,526,000 | Market Comparables | Price Per Unit | $200k/ac | Increase | ||||||||||
Preferred Equities | 9,688,156 | Income Approach | Yield | 17.6% | Decrease | |||||||||
Trust Interest | 2,926,858 | Asset Approach | Recovery Rate | 4.7% | Increase | |||||||||
|
| |||||||||||||
Total Level 3 Investments | $ | 619,646,351 | ||||||||||||
|
| |||||||||||||
| (1) | This column represents the directional change in the fair value of the Level 3 investments that would result from an increase to the corresponding unobservable input. A decrease to the unobservable input would have the opposite effect. Significant changes in these inputs in isolation could result in significantly higher or lower fair value measurements. |
| (2) | Expected term is an unobservable input for investments where the valuation methodology contemplates exits other than contractual maturities, if any. Weighted average expected term for Level 3 investments was approximately 3.0 years as of December 31, 2021. |
| 7. | Debt |
At December 31, 2022, pursuant to the Investment Company Act, the Fund is only permitted to borrow amounts such that the asset coverage ratio is at least 200% after such borrowings. As of December 31, 2022 and December 31, 2021, the asset coverage ratio based on the aggregate amount outstanding of the Fund’s senior securities was 215% and 207%, respectively. Asset coverage ratio is equal to (i) total assets at the end of the period, less all liabilities and indebtedness not represented by senior securities, divided by (ii) total debt represented by senior securities at the end of the period.
The Fund is party to a secured revolving credit facility with Deutsche Bank AG (the “Revolving Credit Facility”), which allows the Fund to borrow an amount up to $200 million. The stated maturity for the Revolving Credit Facility is April 17, 2026. Effective October 6, 2022, the interest rate is 3-Month SOFR plus a margin of 245 basis points per annum and an applicable credit spread adjustment on the drawn portion, as well as a commitment fee of 40 basis points per annum on any unused portion. The Fund is also charged a facility agent fee of 30 basis points per annum on the total facility amount. As of December 31, 2022 and December 31, 2021, approximately $30.0 million and $142.2 million, respectively, of the Revolving Credit Facility was outstanding. In connection with the Revolving Credit Facility, the Fund has pledged collateral consisting of investments valued at approximately $201.6 million and $285.1 million as of December 31, 2022 and December 31, 2021, respectively, which is included in investments owned, at fair value, on the consolidated statements of assets and
F-104
Table of Contents
Silver Point Specialty Lending Fund
Notes to Consolidated Financial Statements (continued)
(in U.S. Dollars)
liabilities. Such pledged assets may accordingly be restricted as to resale. Certain specified revaluation events related to pledged assets may result in a decrease in the borrowing base, and could incent or require the Fund to pledge additional collateral.
The Fund was party to a revolving credit facility with Signature Bank (the “Signature Facility”), which was terminated on September 29, 2021. The Signature Facility was secured by the unfunded commitments of investors and allows the Fund to borrow an amount up to $80 million. The interest rate on the drawn portion of the Signature Facility was Daily LIBOR plus 195 basis points per annum with a 50 basis point floor. The commitment fee on any unused portion of the Signature Facility was 20 basis points per annum.
On September 9, 2021, the Fund completed a $400 million term debt securitization (the “2021 Debt Securitization”), also known as a collateralized loan obligation transaction, which is a form of secured financing incurred by the Fund. The debt offered in the 2021 Debt Securitization (the “2021 CLO”) was issued by Silver Point SCF CLO I, Ltd., a wholly owned subsidiary of the Fund, and is backed by a diversified portfolio of senior secured bonds and loans and second lien loans. The Fund owns $112 million of Class D and Subordinated Notes. All transactions and balances associated with these two classes of notes have been eliminated in consolidation. In connection with the 2021 CLO, the Fund has pledged collateral consisting of investments valued at approximately, $356.6 million and $347.1 million as of December 31, 2022 and December 31, 2021, respectively. The stated maturity for the 2021 CLO is October 15, 2032. The 2021 CLO consists of the following:
| December 31, 2022 | ||||||||||||||||||||||
2021 CLO | Total Principal Amount Committed | Principal Amount Outstanding | Carrying Value(1) | Fair Value | Coupon | Interest Rate | ||||||||||||||||
Class A-1 Loans | $ | 100,000,000 | $ | 100,000,000 | $ | 99,377,514 | $ | 99,094,000 | 3ML+1.72% | 5.80 | % | |||||||||||
Class A-1a Notes | 104,500,000 | 104,500,000 | 103,849,502 | 103,553,230 | 3ML+1.72% | 5.80 | % | |||||||||||||||
Class A-1b Notes | 7,500,000 | 7,500,000 | 7,453,314 | 6,791,468 | 2.45% | 2.45 | % | |||||||||||||||
Class A-2a Notes | 6,000,000 | 6,000,000 | 5,962,651 | 5,914,883 | 3ML+1.90% | 5.98 | % | |||||||||||||||
Class A-2b Notes | 10,000,000 | 10,000,000 | 9,937,751 | 8,829,100 | 2.81% | 2.81 | % | |||||||||||||||
Class B-1 Notes | 8,000,000 | 8,000,000 | 7,950,201 | 7,716,140 | 3ML+2.00% | 6.08 | % | |||||||||||||||
Class B-2 Notes | 8,000,000 | 8,000,000 | 7,950,201 | 6,903,864 | 2.94% | 2.94 | % | |||||||||||||||
Class C Notes | 44,000,000 | 44,000,000 | 43,726,107 | 40,812,033 | 3ML+3.00% | 7.08 | % | |||||||||||||||
|
|
|
|
|
|
|
|
|
| |||||||||||||
Total 2021 CLO | $ | 288,000,000 | $ | 288,000,000 | $ | 286,207,241 | $ | 279,614,718 | 5.74 | % | ||||||||||||
|
|
|
|
|
|
|
|
|
| |||||||||||||
| (1) | Carrying value represents aggregate principal amount outstanding less unamortized debt issuance costs. |
On November 4, 2021, the Fund placed $145 million in aggregate principal of unsecured notes that mature on November 4, 2026 (the “2026 Notes”). The 2026 Notes were issued in two tranches, with $100 million of tranche A notes funded on November 4, 2021 and $45 million of tranche B notes funded on January 21, 2022. The 2026 Notes bear interest at a rate of 4.00% per year, payable semi-annually on November 4 and May 4, of each year, commencing on May 4, 2022. The 2026 Notes are subject to various repayment and redemption provisions. Additionally, in connection with the 2026 Notes, the Fund is required to maintain certain asset ratios.
F-105
Table of Contents
Silver Point Specialty Lending Fund
Notes to Consolidated Financial Statements (continued)
(in U.S. Dollars)
The following tables present the details of the Fund’s borrowings as of December 31, 2022 and December 31, 2021:
| December 31, 2022 | ||||||||||||||||||||||||||||
Facility | Total Principal Amount Committed | Principal Amount Outstanding | Carrying Value | Fair Value | Coupon | Interest Rate | Maturity Date | |||||||||||||||||||||
Revolving Credit Facility(1) | $ | 200,000,000 | $ | 29,974,938 | $ | 29,974,938 | $ | 29,974,938 | S+2.45% | 7.11 | % | 4/17/2026 | ||||||||||||||||
2021 CLO(2)(3) | 288,000,000 | 288,000,000 | 286,207,241 | 279,614,718 | Various | 5.74 | % | 10/15/2032 | ||||||||||||||||||||
2026 Notes(3) | 145,000,000 | 145,000,000 | 142,400,323 | 127,020,000 | 4.00% | 4.00 | % | 11/4/2026 | ||||||||||||||||||||
|
|
|
|
|
|
|
| |||||||||||||||||||||
Total | $ | 633,000,000 | $ | 462,974,938 | $ | 458,582,502 | $ | 436,609,656 | ||||||||||||||||||||
|
|
|
|
|
|
|
| |||||||||||||||||||||
| December 31, 2021 | ||||||||||||||||||||||||||||
Facility | Total Principal Amount Committed | Principal Amount Outstanding | Carrying Value | Fair Value | Coupon | Interest Rate | Maturity Date | |||||||||||||||||||||
Revolving Credit Facility(1) | $ | 200,000,000 | $ | 142,174,938 | $ | 142,174,938 | $ | 142,174,938 | L+2.20% | 2.45 | % | 10/17/2025 | ||||||||||||||||
2021 CLO(2)(3) | 288,000,000 | 288,000,000 | 285,240,769 | 288,841,850 | Various | 2.13 | % | 10/15/2032 | ||||||||||||||||||||
2026 Notes(3) | 100,000,000 | 100,000,000 | 97,776,623 | 100,000,000 | 4.00% | 4.00 | % | 11/4/2026 | ||||||||||||||||||||
|
|
|
|
|
|
|
| |||||||||||||||||||||
Total | $ | 588,000,000 | $ | 530,174,938 | $ | 525,192,330 | $ | 531,016,788 | ||||||||||||||||||||
|
|
|
|
|
|
|
| |||||||||||||||||||||
| (1) | Interest rate as of December 31, 2022 was 3-Month SOFR+2.45% and an applicable credit spread adjustment. Interest rate as of December 31, 2021 was 3-Month LIBOR+2.20%. The base interest rate (i.e., 3-Month LIBOR) is subject to quarterly changes. Interest rate does not include the amortization of upfront fees, facility agent fee, unfunded fees and expenses that were incurred in connection with the Revolving Credit Facility. |
| (2) | Interest rates as of December 31, 2022 and December 31, 2021 were calculated using the weighted average interest rate based on the 2021 CLO. Interest rate does not include the amortization of upfront fees. Refer to 2021 CLO table above for coupon rate. |
| (3) | Carrying value represents aggregate principal amount outstanding less unamortized debt issuance costs. |
The fair value of the Fund’s credit facilities are categorized as Level 3 within the fair value hierarchy as of December 31, 2022 and December 31, 2021.
F-106
Table of Contents
Silver Point Specialty Lending Fund
Notes to Consolidated Financial Statements (continued)
(in U.S. Dollars)
The components of the Fund’s interest and financing expenses for the years ended December 31, 2022 and December 31, 2021 were as follows:
| For the Year Ended December 31, 2022 | For the Year Ended December 31, 2021 | |||||||
Stated interest expense | $ | 20,320,483 | $ | 11,403,673 | ||||
Unfunded fees | 969,038 | 786,952 | ||||||
Amortization of deferred financing costs and debt issuance costs | 2,750,773 | 2,606,768 | ||||||
|
|
|
| |||||
Total interest expense(1) | $ | 24,040,294 | $ | 14,797,393 | ||||
|
|
|
| |||||
Weighted average interest rate | 4.85 | % | 3.78 | % | ||||
Average borrowings | $ | 495,444,169 | $ | 391,358,864 | ||||
| (1) | Interest expense includes the portion of the facility agent fee applicable to the drawn portion of the Revolving Credit Facility and the unfunded fee includes the portion of the facility agent fee applicable to the undrawn portion of the Revolving Credit Facility. Rates as of December 31, 2022 was 3-Month SOFR+2.45% and an applicable credit spread adjustment and December 31, 2021 was 3-Month LIBOR+2.20%, and the base interest rate (i.e., 3-Month SOFR) is subject to quarterly changes. Interest rate does not include the amortization of upfront fees, facility agent fee, non-usage fees and expenses that were incurred in connection with the Revolving Credit Facility. |
| 8. | Certain Risk Factors |
The following summary of certain risk factors is not intended to be a comprehensive explanation of all the risks related to investing in the Fund. In the ordinary course of business, the Fund seeks to manage a variety of risks, which may include market risk, credit risk, liquidity risk and off-balance sheet risk. The Fund may seek to identify measure and monitor risk through various control mechanisms. There can be no assurance that the Fund will implement practices to account for all of the risks of investing in the Fund or that the Fund’s risk management practices will be effective.
The Fund’s activities may be affected by general economic and market conditions, such as interest rates, availability of credit, credit defaults, inflation rates, economic uncertainty and changes in laws (including laws relating to taxation of the Fund’s investments), trade barriers, commodity prices, currency exchange rates and controls and national and international political circumstances. These factors may affect the level and volatility of financial instruments’ prices and liquidity of the Fund’s investments. Market conditions, including increased competition, may also cause the Fund’s portfolio to be comprised of assets that differ significantly from the Adviser’s expectations at the time of the initial offering of interests.
The Fund may be subject to the risk of loss arising from direct or indirect exposure to various catastrophic events, including the following: hurricanes, earthquakes and other natural disasters; terrorism; wars; and public health crises, including the occurrence of a contagious disease (such as COVID-19). To the extent that any such event occurs and has a material effect on global financial markets or specific markets in which the Fund participates (or has a material effect on locations in which Silver Point operates) the risks of loss can be substantial and could have a material adverse effect on the Fund and the investors’ investments therein.
The Federal Reserve has been raising interest rates in response to inflation that may adversely affect the value, volatility and liquidity of dividend and interest paying securities. Market volatility, dramatic changes to interest
F-107
Table of Contents
Silver Point Specialty Lending Fund
Notes to Consolidated Financial Statements (continued)
(in U.S. Dollars)
rates and/or unfavorable economic conditions may lower our performance or impair our ability to achieve our investment objective. The occurrence of any of the above events could have a significant adverse impact on the value and risk profile of our portfolio.
The consequences of the Russian military invasion of Ukraine, the impact on inflation and increased disruption to supply chains and energy resources may impact our portfolio companies, result in an economic downturn or recession either globally or locally in the U.S. or other economies, reduce business activity, and have an adverse impact on the Fund’s returns and net asset value. In response to the conflict between Russia and Ukraine, the U.S. and other countries have imposed sanctions or other restrictive actions against Russia, Russian-backed separatist regions in Ukraine, and certain banks, companies, government officials and other individuals in Russia and Belarus. Any of the above factors, including sanctions, export controls, tariffs, trade wars and other governmental actions, could have a material adverse effect on our business, financial condition, cash flows and results of operations and could cause the market value of our common shares and/or debt securities to decline. We have no way to predict the duration or outcome of the situation, as the conflict and government reactions are rapidly developing and beyond our control. Prolonged unrest, military activities, or broad-based sanctions could have a material adverse effect on our portfolio companies. Such consequences also may increase our funding cost or limit our access to the capital markets.
The current political climate has intensified concerns about a potential trade war between China and the U.S., as each country has imposed tariffs on the other country’s products. These actions may trigger a significant reduction in international trade, the oversupply of certain manufactured goods, substantial price reductions of goods and possible failure of individual companies and/or large segments of China’s export industry, which could have a negative impact on our performance. U.S. companies that source material and goods from China and those that make large amounts of sales in China would be particularly vulnerable to an escalation of trade tensions. Events such as these and their consequences are difficult to predict and it is unclear whether further tariffs may be imposed or other escalating actions may be taken in the future. Any of these effects could have a material adverse effect on our business, financial condition and results of operations.
Investment results may vary substantially over time, and investors could lose some or all of their investment. No guarantee or representation is made that the Fund’s investment program will be successful. The Fund’s investment program involves, without limitation, risks associated with limited diversification and concentration, investments in speculative assets and the use of speculative investment strategies and techniques, interest rates, volatility, credit deterioration or default risks, systems risks and other risks inherent in the Fund’s activities. The Fund’s investments may be materially affected by conditions in the financial markets and overall economic conditions occurring globally and in particular markets where the Fund may invest its assets. The Fund’s methods of minimizing such risks may not be successful.
The Fund’s portfolio may be concentrated in a limited number of portfolio companies and industries. As a result, the aggregate returns the Fund realizes may be significantly adversely affected if a small number of investments perform poorly or if the Fund needs to write down the value of any one investment. Additionally, a downturn in any particular industry in which the Fund is invested could significantly affect its aggregate returns.
There is no guarantee that the fair value determined for any investment will ultimately represent the value that will be realized by the Fund on the disposition of the investment. In the event there is no readily available market for any of the Fund’s investments, such investments may be difficult to value.
The Fund intends to invest in loans, bonds and similar debt obligations, including senior secured loans and secondary purchases of debt issued by small and middle market companies. Debt obligations are subject to the
F-108
Table of Contents
Silver Point Specialty Lending Fund
Notes to Consolidated Financial Statements (continued)
(in U.S. Dollars)
risk of the issuer’s inability to meet principal and interest payments on its obligations (i.e., credit risk) and are subject to price volatility due to such factors as interest rate sensitivity, market perception of the creditworthiness of the issuer and general market liquidity (i.e., market risk). These obligations are subject to other risks, including, without limitation: (i) declines in the value of collateral securing the obligations, if any; (ii) declines in the enterprise value of the obligor; (iii) failure of restrictive covenants, if any, to adequately protect the interests of the creditor; (iv) the failure of the bankruptcy process (or other determination of creditors’ rights) to produce the outcome anticipated by the investor; (v) the possible invalidation of an investment transaction as a preference or fraudulent conveyance under relevant creditors’ rights laws; (vi) so-called lender-liability claims by the issuer of the obligations; and (vii) environmental or other liabilities that may arise with respect to collateral securing the obligations. When the Fund makes a “unitranche” or senior secured term loan investment in a portfolio company, it generally takes a security interest in the available assets of the portfolio company, including the equity interests of its subsidiaries, which is expected to help mitigate the risk that the Fund will not be repaid. However, the fact that a loan is secured, does not guarantee that the Fund will receive principal and interest payments according to the loan’s terms, or at all, or that the Fund will be able to collect on the loan, should it be forced to enforce its remedies. To the extent the Fund invests in mezzanine or other junior debt, it may incur additional risks. Other creditors may rank senior to the Fund in the event of an insolvency, which may result in greater risk and loss of principal.
To the extent the Fund’s debt investments are based on floating rates, such as SOFR, LIBOR, EURIBOR, the Federal Funds Rate or the Prime Rate, general interest rate fluctuations may have a substantial negative impact on the Fund’s investments, the value of an investment in the Fund and the rate of return on invested capital. Additionally, to the extent that the floating interest rates applicable to the Fund’s debt investments are subject to a negotiated cap or floor, the Fund may be unable to capitalize upon favorable market fluctuations of interest rates.
Historically, many financial instruments have used a floating rate based on LIBOR, which is the offered rate for short-term Eurodollar deposits between major international banks. The U.K. Financial Conduct Authority has announced a phase out of LIBOR, and after June 30, 2023, U.S. dollar LIBOR settings will cease to be published or will no longer be representative. Currently, the Secured Overnight Financing Rate (“SOFR”) is the presumptive replacement for LIBOR. SOFR is a “repo” rate representing the interest rate that banks impose on each other in making secured loans, specifically, loans secured by U.S. treasuries. SOFR is a daily, overnight rate, released by the U.S. Federal Reserve Bank every morning. Note that while LIBOR was, at least theoretically, meant to represent a bank’s cost of capital, SOFR does not necessarily represent the cost of capital to a bank. Given the inherent differences between LIBOR and SOFR, or any other alternative benchmark rate that may be established, there are many uncertainties regarding a transition from LIBOR, including, but not limited to, the need to amend all contracts with LIBOR as the referenced rate and how this will impact the cost of variable rate debt and certain derivative financial instruments. In addition, SOFR or other replacement rates may fail to gain market acceptance. Any failure of SOFR or alternative reference rates to gain market acceptance could adversely affect the return on, value of and market for securities linked to such rates. The transition process might lead to increased volatility and illiquidity in markets for, and reduce the effectiveness of, new hedges placed against, instruments whose terms currently include LIBOR. On March 15, 2022, President Biden signed into law the Consolidated Appropriations Act of 2022, which among other things, provides for the use of interest rates based on SOFR in certain contracts currently based on LIBOR and a safe harbor from liability for utilizing SOFR-based interest rates as a replacement for LIBOR. The elimination of LIBOR could have an adverse impact on the market value of and/or transferability of any LIBOR-linked securities, loans, and other financial obligations or extensions of credit held by or due to us or on our overall financial condition or results of operations.
F-109
Table of Contents
Silver Point Specialty Lending Fund
Notes to Consolidated Financial Statements (continued)
(in U.S. Dollars)
In connection with an investment in senior secured loans or mezzanine loans, the Fund may also acquire equity securities, including warrants. In addition, the Fund may invest directly in the equity securities of portfolio companies. However, the equity interests the Fund receives may not appreciate in value and, in fact, may decline in value. Accordingly, the Fund may not be able to realize gains from its equity interests, and any gains that it does realize on the disposition of any equity interests may not be sufficient to offset any other losses. Additionally, the Fund’s investment in non-quoted equity involves a high degree of business and financial risk which may adversely affect the performance of such investment and result in substantial losses. The Fund’s portfolio may consist of non-U.S. securities, financial instruments and other assets. Such investments require consideration of certain risks typically not associated with investing in the U.S., including, among other things, trade balances and imbalances and related economic policies, political difficulties, unfavorable currency exchange rate fluctuations, imposition of exchange control regulation by the U.S. or non-U.S. governments, greater market volatility, differing securities market structures and various administrative difficulties.
The Adviser anticipates that a substantial portion of the Fund’s portfolio may consist of investments that have been given a below investment grade rating by a ratings agency or have not been rated by any ratings agency. Securities in the lower-rated categories and comparable non-rated securities may be subject to greater risk of loss of principal and interest than higher-rated and comparable non-rated securities, and are generally considered to be predominantly speculative with respect to the issuer’s capacity to pay interest and repay principal. Because investors generally perceive that there are greater risks associated with lower-rated and comparable non-rated securities, the yields and prices of such securities may be more volatile than those for higher-rated and comparable non-rated securities.
The Fund may find it necessary or desirable to foreclose on certain loans and take possession of collateral. The foreclosure process can be lengthy and expensive. Borrowers may resist foreclosure actions by asserting numerous claims, counterclaims and defenses against the Fund, including, without limitation, numerous lender liability claims and defenses, even when such assertions may have no basis of fact in an effort to prolong the foreclosure action and force the lender into a modification of the loan or a favorable buy-out of the borrower’s position. Further, there can be no assurance that the Adviser or any management team established by the Adviser will be able to successfully operate, hold or maintain the collateral in accordance with the Fund’s expectations, or that the Fund will be able to profit from its investment in such collateral. In addition, there may be significant expenditures associated with holding real property, including real estate taxes and maintenance costs. The liquidation proceeds upon sale of the collateral may be less than the amount invested in the loan, resulting in a loss to the Fund. Any costs or delays involved in the liquidation of the collateral may further reduce proceeds received and thus, may increase any loss.
The Fund may make investments which may not be advantageously disposed of prior to the date scheduled for dissolution of the Fund. Although the Adviser expects that investments (and their underlying collateral, if applicable) will be able to be disposed of prior to dissolution, the Fund may have to sell, distribute or otherwise dispose of investments (or collateral) at a disadvantageous time for a price which is less than the price that could have been obtained if they were held for a longer period of time. Additionally, due to the illiquid nature of the collateral that underlies many of the positions which the Fund is expected to acquire, as well as the uncertainties of the reorganization and active management process, the Adviser is unable to predict with confidence what the exit strategy will ultimately be for any given position.
The Fund may directly or indirectly leverage its investments through borrowings and may utilize leverage embedded in derivative instruments. The Fund may secure such leverage with one or more assets of the Fund, and pre-Conversion, a pledge of the Partners’ undrawn capital commitments or the General Partner’s right to call capital. Fund leverage will result in the Fund controlling more assets than the Fund’s contributed capital. Direct
F-110
Table of Contents
Silver Point Specialty Lending Fund
Notes to Consolidated Financial Statements (continued)
(in U.S. Dollars)
leverage increases the Fund’s returns if the Fund earns a greater return on investments purchased with borrowed funds than the Fund’s cost of borrowing such funds. However, the use of leverage exposes the Fund to additional levels of risk, including (i) net asset value declining more sharply than it otherwise would have had the Fund not borrowed to make the investments, (ii) margin calls or interim margin requirements which may force premature liquidations of investment positions, (iii) losses on investments where the investment fails to earn a return that equals or exceeds the Fund’s cost of borrowing such funds and (iv) general interest rate fluctuations, which may adversely impact the rate of return on invested capital. For the years ended December 31, 2022 and December 31, 2021, the Fund has leveraged its investments through the credit facilities.
The Fund may invest in financial instruments issued by financial institutions, such as investment and commercial banks, insurance companies, savings and loan associations, mortgage originators and other companies engaged in the financial services industry (collectively, “financial institutions”). In addition, financial institutions will act as counterparties in connection with our investment activities. We may also gain exposure to these entities through derivative transactions, including, without limitation, options, credit default swaps and credit linked notes, and through long and short strategies. In the course of conducting their business operations, financial institutions are exposed to a variety of risks that are inherent to the financial services industry. Significant risks that could affect the financial condition and results of operations of financial institutions include, but are not limited to, fluctuations in interest rates, exchange rates, equity and commodity prices and credit spreads caused by global and local market and economic conditions; credit-related losses that can occur as a result of an individual, counterparty or issuer being unable or unwilling to honor its contractual obligations; the potential inability to repay short-term borrowings with new borrowings or assets that can be quickly converted into cash while meeting other obligations; operational failures or unfavorable external events; potential changes to the established rules and policies of various U.S. and non-U.S. legislative bodies and regulatory and exchange authorities, such as federal and state securities, bank regulators and industry participants; risks associated with litigation, investigations and/or proceedings by private claimants and governmental and self-regulatory agencies arising in connection with a financial institution’s activities; and its continuing ability to compete effectively in the market. The impact of these risks on financial institutions to which we are exposed may have an adverse effect on our business.
On March 10, 2023, Silicon Valley Bank (“SVB”), was closed by the California Department of Financial Protection and Innovation, which appointed the Federal Deposit Insurance Corporation, or the FDIC, as receiver. Similarly, on March 12, 2023, Signature Bank and Silvergate Capital Corp. were each swept into receivership. Although a statement by the Department of the Treasury, the Federal Reserve and the FDIC stated that all depositors of SVB would have access to all of their money after only one business day of closure, including funds held in uninsured deposit accounts, borrowers under credit agreements, letters of credit and certain other financial instruments with SVB, Signature Bank or any other financial institution that is placed into receivership by the FDIC may be unable to access undrawn amounts thereunder. If any of our counterparties to any such instruments were to be placed into receivership, we may be unable to access such funds. In addition, if any of our portfolio companies are unable to access funds pursuant to such instruments or lending arrangements with such a financial institution, such portfolio companies’ ability to pay their obligations to us could be adversely affected. In this regard, counterparties to SVB credit agreements and arrangements, and third parties such as beneficiaries of letters of credit (among others), might experience direct impacts from the closure of SVB, and uncertainty remains over liquidity concerns in the broader financial services industry. As of the date of this annual report, we had no direct exposure to SVB or Signature Bank. Our Adviser will continue to assess the impact of these events on the Fund’s portfolio companies and the Fund.
F-111
Table of Contents
Silver Point Specialty Lending Fund
Notes to Consolidated Financial Statements (continued)
(in U.S. Dollars)
There can be no assurance that the principals or other employees or affiliated investors will continue to be employed by, or associated with the Adviser, General Partner or their respective affiliates throughout the life of the Fund. The loss of key personnel could have a material adverse effect on the Fund.
Legal, tax and regulatory changes could occur during the term of the Fund that may adversely affect the Fund. Regulatory changes and scrutiny may increase the Fund’s exposure to potential liabilities and to legal, compliance and other related costs. Increased regulatory oversight may also impose additional administrative burdens on the Adviser, including, without limitation, responding to investigations and implementing new policies and procedures.
From time to time, the Fund and its affiliates are subject to litigation arising in the normal course of business. While it is not possible to predict the results of such litigation, the Adviser does not believe the ultimate outcome of these types of matters will have a material adverse effect on the Fund’s financial position or results of operations or cash flows.
Investors with interests greater than 10% of the Fund’s total interests are considered significant. Two Investors own significant interests which, in the aggregate, comprise 31.7% of the Fund’s total net assets.
| 9. | Net Assets |
Committed Capital
The capital commitment of each Limited Partner was drawn down from time to time over the life of the Fund through September 30, 2021, which was the expiration of the limited partnership’s commitment period (the “Commitment Period”). On September 28, 2021, the Fund called all remaining unfunded capital, releasing all Partners from their unfunded commitments. During the Commitment Period there were no defaulting Partners.
In connection with the Conversion on November 15, 2021, the Fund issued approximately 36.9 million shares to existing Investors at a value of $15 per share.
The aggregate invested capital of Investors affiliated with the Fund was approximately 18% of the Fund at December 31, 2021 and December 31, 2022.
Distributions
Pre-Conversion
The General Partner generally distributed Current Income (as defined below) and realization proceeds with respect to an investment or any portion thereof, other than certain amounts withheld in accordance with the Fund’s distribution provisions, at least quarterly and within 45 days of the calendar quarter end. “Current Income” (i.e. cash received by the Fund from investments other than realization proceeds, reduced by Fund expenses, other than Temporary Investment Income (as defined below), was distributed pro rata in proportion to the capital contributions with respect to such investment. “Temporary Investment Income” (i.e. investments in high grade instruments lasting less than one year, commercial paper with maturities less than six months, bank deposit accounts, money market funds, and certificates of deposit) were distributed pro rata in proportion to their aggregate capital contributions to the Fund. Realization proceeds with respect to an investment or any portion thereof, after consideration of the Capital Gains Incentive Compensation (see below), any priority distributions to which the General Partner is entitled, and other permitted withholdings for investments and expenses, was distributed pro rata in proportion to the capital contributions to such investment.
F-112
Table of Contents
Silver Point Specialty Lending Fund
Notes to Consolidated Financial Statements (continued)
(in U.S. Dollars)
Post-Conversion
The Board may, in its discretion, authorize the Fund to distribute ratably among the Shareholders of any class or series of shares in the Fund in accordance with the number of outstanding full and fractional shares of such class or series as the Board may deem proper or as may otherwise be determined in accordance with the governing documents of the Fund. Any such distribution may be made in cash or property (including without limitation any type of obligations of the Fund or any assets thereof) or shares of any class or series or any combination thereof. It is expected that the Board will authorize quarterly distributions of the majority of the Fund’s net investment income. The Board may always retain such amount as it may deem necessary to pay the debts or expenses or meet other obligations of the Fund, or as it may otherwise deem desirable to use in the conduct of its affairs or to retain for future requirements or extensions of the business. Once the Fund becomes a regulated investment company, inasmuch as the computation of net income and gains for Federal income tax purposes may vary from the computation thereof on the books, the above provisions shall be interpreted to give the Board the power in their discretion to distribute for any fiscal year as ordinary dividends and as capital gains distributions, respectively, additional amounts sufficient to enable the Fund to avoid or reduce liability for taxes.
Management Fee
During the Commitment Period of the limited partnership, the Fund paid the Adviser, in respect of each Limited Partner, a management fee, payable quarterly in arrears, equal to the sum of (x) 0.0625% (0.25% annualized) of such Limited Partner’s unfunded commitment and (y) 0.1875% (0.75% annualized) of such Limited Partner’s aggregate drawn Commitment. After the expiration or termination of the Commitment Period, the Fund paid the Adviser, in respect of each Limited Partner, a management fee, payable quarterly in arrears, equal to 0.1875% (0.75% annualized) of such Limited Partner’ net capital contributions. If the Fund commences winding up in connection with the expiration of the Fund’s term, the management fee will be payable until the final termination of the Fund following the complete realization of the Fund’s investments. Following an IPO, the management fee calculation is proposed to change to 1.25% per annum of the average of the Fund’s total gross assets (excluding cash and temporary investments in cash equivalents) at the end of the two most recently completed calendar quarters. Additionally, following the time at which the Fund is permitted to reduce its asset coverage, the Management Fee charged on assets financed using leverage over a 1.0x debt-to-equity ratio is expected to be 1.00%. Refer to Note 1 Organization and Business for further information.
If the Adviser or its affiliates or their respective officers, directors, partners, members, shareholders or employees (other than the Fund, any alternative investment vehicle, any subsidiary or any parallel investment entity) receive any compensation in the form of directors’ fees, transaction fees, monitoring fees, financial advisory fees, investment management fees, origination fees, arrangement fees, commitment fees, broken deal fees and other fees for similar or related services and any other compensation in connection with lending or other financial transactions or investments (including, without limitation, acquisitions, dispositions, recapitalizations and restructurings), the portion of such compensation ratably attributable to investments made (or, in the case of broken deal fees, proposed) either directly by the Fund or indirectly through an alternative investment vehicle or a subsidiary will be either (a) paid to the Fund (or such alternative investment vehicle, as applicable) or (b) prior to Conversion, applied as an offset to the management fee. During the year ended December 31, 2021, the Fund’s management fees were reduced by $630,007 in connection with such compensation. Prior to Conversion, if the management fee was not sufficient to offset any such fees, any shortfall was be carried forward to reduce future management fees until the earlier of such time as (i) such shortfall is fully offset or (ii) the Adviser is no longer entitled to receive the management fee from the Fund. Upon Conversion or such time that the Adviser is no longer entitled to receive the management fee from the Fund, any remaining shortfall will be paid by the Adviser or its affiliates to the Fund. As of November 15, 2021, there was no shortfall and all such fees were fully offset
F-113
Table of Contents
Silver Point Specialty Lending Fund
Notes to Consolidated Financial Statements (continued)
(in U.S. Dollars)
against the management fee. Any fees received by the Adviser or its affiliates in connection with or arising from providing administrative, collateral management or similar or related services in respect of lending or other financial transactions or investments will be retained by the Adviser and will not be applied as an offset to the management fee.
The Adviser, in its sole discretion, was permitted to waive or reduce the management fee with respect to any Limited Partner prior to Conversion. The capital accounts of the General Partner and affiliated individuals and entities were not charged a management fee prior to Conversion.
Income Incentive Compensation
Prior to the first public offering and sale of equity securities of the Fund resulting in aggregate net proceeds to the Fund and/or any selling stockholders, in combination with any previous public offerings, in excess of the lesser of $65,000,000 and 15% of aggregate commitments to the Fund at the time of such offering (“a Qualified IPO”), Income incentive compensation is calculated and payable to the Adviser (“Income Incentive Compensation”) quarterly in arrears based on the amount by which Pre-Incentive Compensation Net Investment Income (as defined below) in respect of the current calendar quarter and the eleven preceding calendar quarters (beginning with the calendar quarter that commences on July 1, 2015) (the “Trailing Twelve Quarters”) exceeds the Hurdle Rate Amount (as defined below). Income Incentive Compensation is calculated and paid as follows:
No amount in any calendar quarter in which the Fund’s Pre-Incentive Compensation Net Investment Income for the Trailing Twelve Quarters does not exceed the Hurdle Rate Amount.
100% of the Fund’s Pre-Incentive Compensation Net Investment Income, if any, that exceeds the Hurdle Rate Amount but is less than or equal to the Catch-up Amount (as defined below).
For any calendar quarter in which the Fund’s Pre-Incentive Compensation Net Investment Income for the Trailing Twelve Quarters exceeds the Catch-up Amount, 15% of the excess will be paid.
The “Hurdle Rate Amount” is calculated on a quarterly basis by multiplying 1.75% (7.00% annualized) and the Fund’s net asset value (total assets less indebtedness) at the beginning of each applicable calendar quarter comprising the relevant Trailing Twelve Quarters. The “Catch-up Amount” is calculated on a quarterly basis by multiplying 2.0588% (8.2353% annualized) and the Fund’s net asset value at the beginning of each applicable calendar quarter comprising the relevant Trailing Twelve Quarters. The above calculations are appropriately adjusted for capital contributions and distributions during the quarter. “Pre-Incentive Compensation Net Investment Income” means, with respect to any period, (a) interest income, dividend income and any other income accrued or earned by the Fund during such period minus (b) operating expenses for that period (including Management Fee, expenses payable under any Administration Agreement, and any interest expense and dividends paid on any issued and outstanding preferred stock, but excluding incentive compensation); provided that Pre-Incentive Compensation Net Investment Income also includes net interest income, if any, from derivative financial instruments or swaps on a look-through basis as if the Fund owned the reference assets directly (where such net interest income is defined as the difference between (A) the interest income and fees received in respect of the reference assets of the derivative financial instrument or swap and (B) the interest expense or financing charges paid by the Fund to the derivative or swap counterparty); provided further that Pre-Incentive Compensation Net Investment Income does not include any realized capital gains, realized capital losses or unrealized capital appreciation or depreciation; and provided further that if the resulting amount is negative, then Pre-Incentive Compensation Net Investment Income will be expressed as zero (0).
F-114
Table of Contents
Silver Point Specialty Lending Fund
Notes to Consolidated Financial Statements (continued)
(in U.S. Dollars)
Following a Qualified IPO, the Income Incentive Compensation rate is expected to be 17.5%. Refer to Note 1 Organization and Business for further information.
Capital Gains Incentive Compensation
Prior to Conversion, the General Partner was entitled to receive Capital Gains Incentive Compensation which was determined in arrears at the end of each Fiscal Year and equal to 15% of the Fund’s cumulative capital gains (without giving consideration to any unrealized gains) through the end of such Fiscal Year, less the amount of any Capital Gains Incentive Compensation previously distributed to the General Partner for any prior period. Following Conversion, but prior to a Qualified IPO, the Capital Gains Incentive Compensation is paid by the Fund to the Adviser. Following a Qualified IPO, the Capital Gains Compensation rate is expected to be 17.5%. Refer to Note 1 Organization and Business for further information. Capital Gains Incentive Compensation together with Income Incentive Compensation is collectively referred to as “Incentive Compensation”. The General Partner may, in its sole discretion, waive or reduce the Incentive Compensation with respect to any Limited Partner prior to Conversion. The capital accounts of the General Partner and affiliated individuals and entities were not charged Incentive Compensation prior to Conversion.
Upon Conversion, all management fee and Incentive Compensation waivers were eliminated.
Clawback
Immediately prior to Conversion, the General Partner and the Adviser paid to the Fund an aggregate amount equal to the “Clawback Amount” as of such date, subject to certain tax limitations as described in the governing Fund documents. The Clawback Amount was equal to (i) the cumulative Incentive Compensation received by the Adviser since the Initial Closing though the date of determination of the Clawback Amount minus (ii) the product of 15% (adjusted for any waiver or reduction of Incentive Compensation paid by Limited Partners) and the sum of the aggregate amount of cumulative capital gains (without giving consideration to any unrealized gains) and Pre-Incentive Compensation Net Investment Income generated since the Initial Closing and through the date of determination of the Clawback Amount. The Clawback amount of approximately $2.5 million was paid from the Adviser to the Fund and was then distributed from the Fund to investors in December 2021.
Income and Expense Allocation
Pre-conversion
As a limited partnership, items of income and expense (other than the management fee and Incentive Compensation) generally were shared by all of the Partners pro rata in accordance with their Commitments; provided, however, that the Fund may specially allocate expenses incurred on behalf of, or in respect of, a particular Partner by virtue of such partner’s specific regulatory, legal or tax status to such partner.
Post-conversion
As a unitized trust, income and expenses are generally shared by all of the Shareholders pro rata in accordance with their number of shares; provided that if for legal, regulatory or tax reasons that could materially affect the Fund, the Fund may require a Shareholder to withdraw from the Trust and to be admitted as a shareholder of a parallel investment entity and transfer such a proportionate share of the Trust’s assets and liabilities, and the expenses of such transfer shall be borne by such Shareholder.
F-115
Table of Contents
Silver Point Specialty Lending Fund
Notes to Consolidated Financial Statements (continued)
(in U.S. Dollars)
| 10. | Related Party Transactions |
The Adviser, or its affiliates, is authorized to pay expenses in the name of and on behalf of the Fund which they deem necessary or advisable. To the extent that expenses borne by or reimbursements due to the Fund are paid by the Adviser, or an affiliate, the Fund will reimburse or seek reimbursement from such party. As of December 31, 2022 and December 31, 2021, the Fund owed $1,756 and $19,048 to an affiliate, respectively.
Pursuant to the Advisory Agreement entered into on November 15, 2021, the Adviser is responsible for providing various accounting and administrative services to the Fund and the Fund will reimburse the Adviser for its costs, expenses and allocable portion of overhead (including rent, office equipment and utilities) and other expenses incurred by the Adviser in performing its administrative obligations. For the year ended December 31, 2022 and December 31, 2021, the Fund incurred approximately $1.5 million and zero, respectively, in costs related to the administrative services provided by the Advisor, which were recorded as part of “administration fees” in the Fund’s Consolidated Statements of Operations. As of December 31, 2022 and December 31, 2021, $0.8 million and zero, respectively, was payable and included in “accrued expenses and other liabilities” in the Consolidated Statements of Assets and Liabilities.
| 11. | Commitments and Contingencies |
In the normal course of its operations, the Fund enters into contracts that contain a variety of representations and warranties which provide general indemnifications. The Fund’s maximum exposure under these arrangements is unknown as this would involve future claims that may be made against the Fund that have not yet occurred. However, based on experience, the Fund expects the risk of significant loss to be remote.
The Fund has commitments to fund investments in its portfolio. The principal amount of the unfunded commitments are not recorded in the Fund’s consolidated statements of assets and liabilities since these commitments may have contingencies and expire without being drawn upon. The total commitment amount does
F-116
Table of Contents
Silver Point Specialty Lending Fund
Notes to Consolidated Financial Statements (continued)
(in U.S. Dollars)
not necessarily represent future cash requirements. A summary of the composition of the Fund’s unfunded commitments as of December 31, 2022 and December 31, 2021 is shown in the table below:
Portfolio Company | Investment Type(1) | December 31, 2022 | December 31, 2021 | |||||||
8800 Austin, LLC and 8900 Austin, LLC | 1st Lien Term Loan | $ | 2,546,206 | $ | 2,731,604 | |||||
A Stucki TopCo Holdings LLC & Intermediate Holdings LLC | 1st Lien Revolver | 878,780 | — | |||||||
Allentown LLC | 1st Lien Term Loan | 1,737,691 | — | |||||||
Allentown LLC | 1st Lien Revolver | 752,999 | — | |||||||
Amerijet Holdings Inc | 1st Lien Revolver | 2,756,872 | 1,654,123 | |||||||
BayMark Health Services Inc | 2nd Lien Term Loan | 2,914,380 | 5,486,667 | |||||||
BayMark Health Services Inc | 1st Lien Term Loan | 1,863,188 | 3,276,502 | |||||||
Buck Global LLC | 1st Lien Term Loan | 3,679,245 | 3,679,245 | |||||||
Buck Global LLC | 1st Lien Revolver | 809,434 | 1,766,038 | |||||||
Circle Graphics Inc | 1st Lien Term Loan | 1,091,813 | 1,611,723 | |||||||
Dye & Durham Corp | 1st Lien Term Loan | 815,863 | 863,585 | |||||||
Dye & Durham Corp | 1st Lien Revolver | 142,776 | 323,844 | |||||||
HOA Finance Two, LLC / HOA II Finance Two, LLC | 1st Lien Term Loan | 178,189 | — | |||||||
Inotiv Inc | 1st Lien Revolver | 1,244,402 | 1,244,402 | |||||||
Inotiv Inc | 1st Lien Term Loan | — | 2,407,230 | |||||||
iPark Riverdale (aka Rising Ground Yonkers) | 1st Lien Term Loan | 455,330 | — | |||||||
LeVecke Real Estate Holdings, LLC | 1st Lien Term Loan | 265,525 | — | |||||||
Kaplan Woodland Hills Property Company, LLC | 1st Lien Term Loan | — | 665,667 | |||||||
LAC Acquisition LLC d/b/a Lighthouse Autism Center | 1st Lien Revolver | — | 1,500,000 | |||||||
LAC Acquisition LLC d/b/a Lighthouse Autism Center | 1st Lien Term Loan | — | 3,500,000 | |||||||
LMG Holdings | 1st Lien Revolver | 690,670 | 690,670 | |||||||
Masterwork Electronics, Inc. | 1st Lien Revolver | — | 1,844,250 | |||||||
National Dentex Corp | 1st Lien Term Loan | — | 631,931 | |||||||
National Dentex Corp | 1st Lien Revolver | 27,136 | 1,003,655 | |||||||
Paycom Acquisition LLC/Corp (aka Onyx CenterSource, Inc) | 1st Lien Revolver | 389,727 | — | |||||||
Smarsh Inc | 1st Lien Term Loan | 472,634 | — | |||||||
Smarsh Inc | 1st Lien Revolver | 236,317 | — | |||||||
SP-CREH 19 Highline LLC | 1st Lien Revolver | — | 3,305,326 | |||||||
Speedstar Holding LLC | 1st Lien Term Loan | — | 3,017,241 | |||||||
STV Group, Inc | 1st Lien Revolver | 780,000 | 1,300,000 | |||||||
Sutherland Global Services Inc | 1st Lien Revolver | — | 1,332,943 | |||||||
TH Liquidating Trust | Trust Interest | 285,563 | 285,563 | |||||||
Thunder Grandparent Inc. (dba Telestream, Inc) | 1st Lien Revolver | 387,931 | 775,862 | |||||||
UC Tower Hillside Crossing | 1st Lien Term Loan | — | 541,999 | |||||||
|
|
|
| |||||||
Total | $ | 25,402,671 | $ | 45,440,070 | ||||||
|
|
|
| |||||||
| (1) | Unfunded commitment to term loan investments represents exposure obtained through delayed draw term loans. |
F-117
Table of Contents
Silver Point Specialty Lending Fund
Notes to Consolidated Financial Statements (continued)
(in U.S. Dollars)
The Adviser determines the manner and extent in which the Fund invests based on various factors which may change over time. The Fund’s investment objectives and obligations may result in financial support provided to investee companies through funding of debt instruments and equity. During the years ended December 31, 2022 and December 31, 2021, the Fund funded such contractually required obligations of $21,643,642 and $34,588,598, respectively. During the years ended December 31, 2022 and December 31, 2021, the Fund made follow-on investments of $28,960,608 and $7,397,779, respectively, directly with issuers where it had existing positions in such issuer.
From time to time, the Fund and its affiliates are subject to litigation arising in the normal course of business. While it is not possible to predict the results of such litigation, the Adviser does not believe the ultimate outcome of these types of matters will have a material adverse effect on the Fund’s financial position or results of operations or cash flows.
| 12. | Financial Highlights |
The following summarizes the financial highlights for the Fund:
| For the years ended December 31, | ||||||||||||||||||||
| 2022 | 2021 | 2020 | 2019 | 2018 | ||||||||||||||||
Per Share Data(1) | ||||||||||||||||||||
Net asset value, beginning of year | $ | 15.27 | $ | 15.00 | N/A | N/A | N/A | |||||||||||||
Net investment income | 1.45 | 0.20 | N/A | N/A | N/A | |||||||||||||||
Net realized gain (loss) and net change in unrealized appreciation (depreciation) | (1.09 | ) | 0.07 | N/A | N/A | N/A | ||||||||||||||
|
|
|
|
|
|
|
|
|
| |||||||||||
Total from operations | 0.36 | 0.27 | N/A | N/A | N/A | |||||||||||||||
|
|
|
|
|
|
|
|
|
| |||||||||||
Dividends declared from net investment income | (1.24 | ) | — | N/A | N/A | N/A | ||||||||||||||
Dividends declared from realized gains | — | — | N/A | N/A | N/A | |||||||||||||||
|
|
|
|
|
|
|
|
|
| |||||||||||
Total increase (decrease) in net assets | (0.88 | ) | 0.27 | N/A | N/A | N/A | ||||||||||||||
|
|
|
|
|
|
|
|
|
| |||||||||||
Net asset value, end of year | $ | 14.39 | $ | 15.27 | N/A | N/A | N/A | |||||||||||||
|
|
|
|
|
|
|
|
|
| |||||||||||
Shares outstanding, end of year(2) | 36,907,451 | 36,907,451 | N/A | N/A | N/A | |||||||||||||||
Total Return, based on net asset value(3) | 2.34 | % | 15.98 | % | 13.11 | % | 12.26 | % | 15.35 | % | ||||||||||
Ratios / Supplemental Data | ||||||||||||||||||||
Net assets, end of year | $ | 530,976,832 | $ | 563,684,976 | $ | 467,498,084 | $ | 462,306,302 | $ | 459,385,074 | ||||||||||
Weighted-average shares outstanding(2) | 36,907,451 | 36,907,451 | N/A | N/A | N/A | |||||||||||||||
Ratio of net expenses (including incentive fees) to average net assets(4)(5) | 7.87 | % | 6.51 | % | 6.78 | % | 8.98 | % | 9.50 | % | ||||||||||
Ratio of net investment income to average net assets(4)(5) | 9.81 | % | 9.90 | % | 12.23 | % | 13.12 | % | 15.98 | % | ||||||||||
Ratio of incentive fees to average net assets(4)(5) | 1.42 | % | 1.78 | % | 1.73 | % | 1.83 | % | 2.22 | % | ||||||||||
Ratio of net expense before management fee offsets and incentive compensation(4)(5) | 6.45 | % | 4.86 | % | 5.08 | % | 7.17 | % | 7.30 | % | ||||||||||
Ratio of management fee offsets(4) | — | (0.13 | )% | (0.03 | )% | (0.02 | )% | (0.02 | )% | |||||||||||
Ratio of net expenses (excluding incentive fees) to average net assets(4)(5) | 6.45 | % | 4.73 | % | 5.05 | % | 7.15 | % | 7.28 | % | ||||||||||
Ratio of interest and financing related expenses to average net assets(4)(5) | 4.41 | % | 3.04 | % | 3.70 | % | 5.65 | % | 5.66 | % | ||||||||||
Portfolio turnover rate(7) | 26.97 | % | 69.55 | % | 47.01 | % | 51.55 | % | 41.81 | % | ||||||||||
Total capital commitments, end of year(6) | N/A | N/A | 552,165,000 | 552,165,000 | 552,165,000 | |||||||||||||||
Ratio of total contributed capital to total committed capital, end of year(6) | N/A | N/A | 82.58 | % | 81.15 | % | 80.08 | % | ||||||||||||
IRR(8) | N/A | 14.81 | % | 14.57 | % | 15.24 | % | 16.78 | % | |||||||||||
F-118
Table of Contents
Silver Point Specialty Lending Fund
Notes to Consolidated Financial Statements (continued)
(in U.S. Dollars)
The information presented in the financial highlights includes both affiliated and non-affiliated Limited Partners/Shareholders.
| (1) | Per share data is only applicable to the period of November 15, 2021 to December 31, 2022, when the Fund was a unitized trust. Prior to November 15, 2021, the Fund was non-unitized Partnership (See Note 1). |
| (2) | Shares outstanding are only applicable to the period of November 15, 2021 to December 31, 2022, when the Fund was a unitized trust. Prior to November 15, 2021, the Fund was non-unitized Partnership (See Note 1). |
| (3) | For the periods ended December 31, 2018 to November 14, 2021, total return based on net asset value is calculated as Investors total increase (decrease) in net assets and partners’ capital resulting from operations divided by Investors capital during the period, adjusted for capital inflows, outflows and items of income and expense as presented in the consolidated statements of operations. The total return until November 14, 2021 was calculated by geometrically linking weighted fund monthly returns. For the period November 15, 2021 to December 31, 2021 and for the year ended December 31, 2022, total return is calculated as the change in net asset value during the respective periods, assuming dividends and distributions, if any, are reinvested, divided by the beginning NAV per share. |
| (4) | For the periods ended December 31, 2018 to December 31, 2021, the ratios above are calculated and based upon the weighted average Limited Partners’ capital during the year and items of income and expense as presented in the consolidated statements of operations. Individual Limited Partner’s ratios may vary from the ratios listed above. For the period ended December 31, 2022, the ratios above are calculated based upon average net assets. |
| (5) | The net investment income (loss) ratio is presented after the effects of expenses (including interest expense on the Signature Facility, Revolving Credit Facility, 2021 CLO and 2026 Notes, the management fee and Incentive Compensation). Individual Limited Partner’s ratios may vary from the ratios listed above. |
| (6) | Capital commitments and the ratio of total contributed capital to total committed capital is only applicable for years ended December 31, 2020, 2019 and 2018. The Fund converted to a unitized trust effective November 15, 2021. Prior to November 15, 2021, the Fund was non-unitized Partnership (See Note 1). |
| (7) | Portfolio turnover is calculated as the lesser of (i) purchases of portfolio investments or (ii) the aggregate total of sales of portfolio investments plus any prepayments received, divided by the monthly average of the value of portfolio investments owned by the Fund during the period. |
| (8) | For the years ended December 31, 2018 through December 31, 2021, the internal rate of return for the Fund’s Limited Partners from the Initial Closing are net of management fee and Incentive Compensation and have been computed based on the amounts and effective dates of capital called from and distributed to Limited Partners and the ending partners’ capital at the end of the period of the Limited Partners’ capital accounts, adjusted for the effects of the subsequent closes. |
| 13. | Subsequent Events |
Management has performed an evaluation of subsequent events through March 29, 2023 which is the date the consolidated financial statements were available to be issued and has determined that no additional items require adjustments to, or disclosure in the consolidated financial statements other than those items described below.
On February 13, 2023, the Board declared a dividend of $0.33 per share, paid on February 13, 2023, for Shareholders of record on December 31, 2022.
F-119