Exhibit 99.3 IDR Simplification & Acquisition November 2019 www.nblmidstream.comExhibit 99.3 IDR Simplification & Acquisition November 2019 www.nblmidstream.com
Forward Looking Statements This presentation contains certain “forward-looking statements” within the meaning of federal securities law. Words such as “anticipates”, “believes”, “expects”, “intends”, “will”, “should”, “may”, “estimates”, and similar expressions may be used to identify forward-looking statements. Forward-looking statements are not statements of historical fact and reflect Noble Midstream Partners LP’s (Noble Midstream or the Partnership) current views about future events. No assurances can be given that the forward-looking statements contained in this presentation will occur as projected and actual results may differ materially from those projected. Forward-looking statements are based on current expectations, estimates and assumptions that involve a number of risks and uncertainties that could cause actual results to differ materially from those projected. These risks include, without limitation, our customers’ ability to meet their drilling and development plans, changes in general economic conditions, competitive conditions in the Partnership’s industry, actions taken by third-party operators, gatherers, processors and transporters, the demand for crude oil and natural gas gathering and processing services, the Partnership’s ability to successfully implement its business plan, the Partnership’s ability to complete internal growth projects on time and on budget, the ability of third parties to complete construction of pipelines in which the Partnership holds equity interests on time and on budget, the price and availability of debt and equity financing, the availability and price of crude oil and natural gas to the consumer compared to the price of alternative and competing fuels, and other risks inherent in the Partnership’s business, including those described under “Risk Factors” and “Forward-Looking Statements” in the Partnership's most recent Annual Report on Form 10-K and in other reports on we file with the Securities and Exchange Commission (SEC). These reports are also available from the Partnership’s office or website, www.nblmidstream.com. Forward-looking statements are based on the estimates and opinions of management at the time the statements are made. Noble Midstream does not assume any obligation to update forward-looking statements should circumstances, management’s estimates, or opinions change. This presentation also contains certain non-GAAP measures of financial performance that management believes are good tools for internal use and the investment community in evaluating Noble Midstream’s overall financial performance. Please see Slide 24 for definitions and reconciliations of the non-GAAP financial measures used in this presentation to the most directly comparable GAAP financial measures. Confidentiality Notice This presentation is confidential and is subject to confidentiality obligations you have confirmed. This presentation has been prepared by the Partnership solely for use in connection with the proposed placement of the securities described in this presentation. This presentation is personal to each prospective investor and does not constitute an offer to any other person or to the public generally to subscribe for or otherwise acquire securities. You are authorized to use this presentation solely for the purpose of considering the purchase of the Partnership’s securities. Distribution of this presentation to any other person other than the prospective investor and any person retained to advise such prospective investor with respect to its purchase is unauthorized, and any disclosure of any of its contents, without the Partnership’s prior written consent, is prohibited. 2 w ww ww w..n nb bllm miid ds st tr re ea am m..c co om mForward Looking Statements This presentation contains certain “forward-looking statements” within the meaning of federal securities law. Words such as “anticipates”, “believes”, “expects”, “intends”, “will”, “should”, “may”, “estimates”, and similar expressions may be used to identify forward-looking statements. Forward-looking statements are not statements of historical fact and reflect Noble Midstream Partners LP’s (Noble Midstream or the Partnership) current views about future events. No assurances can be given that the forward-looking statements contained in this presentation will occur as projected and actual results may differ materially from those projected. Forward-looking statements are based on current expectations, estimates and assumptions that involve a number of risks and uncertainties that could cause actual results to differ materially from those projected. These risks include, without limitation, our customers’ ability to meet their drilling and development plans, changes in general economic conditions, competitive conditions in the Partnership’s industry, actions taken by third-party operators, gatherers, processors and transporters, the demand for crude oil and natural gas gathering and processing services, the Partnership’s ability to successfully implement its business plan, the Partnership’s ability to complete internal growth projects on time and on budget, the ability of third parties to complete construction of pipelines in which the Partnership holds equity interests on time and on budget, the price and availability of debt and equity financing, the availability and price of crude oil and natural gas to the consumer compared to the price of alternative and competing fuels, and other risks inherent in the Partnership’s business, including those described under “Risk Factors” and “Forward-Looking Statements” in the Partnership's most recent Annual Report on Form 10-K and in other reports on we file with the Securities and Exchange Commission (SEC). These reports are also available from the Partnership’s office or website, www.nblmidstream.com. Forward-looking statements are based on the estimates and opinions of management at the time the statements are made. Noble Midstream does not assume any obligation to update forward-looking statements should circumstances, management’s estimates, or opinions change. This presentation also contains certain non-GAAP measures of financial performance that management believes are good tools for internal use and the investment community in evaluating Noble Midstream’s overall financial performance. Please see Slide 24 for definitions and reconciliations of the non-GAAP financial measures used in this presentation to the most directly comparable GAAP financial measures. Confidentiality Notice This presentation is confidential and is subject to confidentiality obligations you have confirmed. This presentation has been prepared by the Partnership solely for use in connection with the proposed placement of the securities described in this presentation. This presentation is personal to each prospective investor and does not constitute an offer to any other person or to the public generally to subscribe for or otherwise acquire securities. You are authorized to use this presentation solely for the purpose of considering the purchase of the Partnership’s securities. Distribution of this presentation to any other person other than the prospective investor and any person retained to advise such prospective investor with respect to its purchase is unauthorized, and any disclosure of any of its contents, without the Partnership’s prior written consent, is prohibited. 2 w ww ww w..n nb bllm miid ds st tr re ea am m..c co om m
Experienced Management Team in Place Brent Smolik, Chief Executive Officer, Noble Midstream • Appointed Chief Executive Officer of Noble Midstream in August 2019 and serves as President and Chief Operating Officer of Noble Energy, since November 2018 • Before joining Noble Energy in 2018, Mr. Smolik served as President, Chief Executive Officer and Chairman of the Board of EP Energy Corporation and EP Energy LLC from 2012 to 2017 • Previously served as Executive Vice President of El Paso Corporation and President of the El Paso Exploration & Production Company, President of ConocoPhillips Canada and Burlington Resources Canada Tom Christensen, Chief Financial Officer, Noble Midstream • Appointed Chief Financial Officer in September 2019 after serving as interim Chief Financial Officer since July 2019 • Previously held the position of Chief Accounting Officer of Noble Midstream since August 2016 and served as Corporate Finance Manager in Noble Energy’s Treasury group, joining Noble Energy upon its acquisition of Rosetta Resources in 2015 • Tom served in positions of increasing responsibility at Rosetta, including most recently serving as its Assistant Controller overseeing SEC reporting, corporate accounting, income taxes and technical accounting matters Chris Stavinoha, Director of Capital Projects, Noble Midstream • Prior to serving in his current role Mr. Stavinoha served as a Project Development Leader and Project Manager for Noble Energy and has over 25 years of project management and project execution experience • Previously held the position of Executive Vice President for London Offshore from June 2002 until May 2010 and prior to 2002 served in various engineering and project management roles at Sonat Offshore Drilling (Transocean) and McDermott Inc. Barry Guice, Director of Operations, Noble Midstream • Appointed Director of Operations for Noble Midstream in July 2018 and previously worked at Noble Energy since 2009, serving in various capacities as Director of Operations for Gulf of Mexico, Senior Asset Manager for the Leviathan field, Engineering and Development Manager for International Division and Project Manager for a deepwater development in the Gulf of Mexico • Previously held various operations, engineering and project management roles at BP in the onshore U.S. and Gulf of Mexico John Reuwer, Vice President, Business and Corporate Development, Noble Midstream • Appointed as Vice President, Business and Corporate Development, effective October 28, 2019 • Previously served in positions of increasing responsibility within the Partnership’s business development, mergers and acquisitions, and corporate development teams, after joining Noble Midstream in March 2017 • Previously worked in management consulting, advising energy clients on large strategic initiatives including mergers, acquisitions, joint ventures, restructurings and other growth projects 3 w ww ww w..n nb bllm miid ds st tr re ea am m..c co om mExperienced Management Team in Place Brent Smolik, Chief Executive Officer, Noble Midstream • Appointed Chief Executive Officer of Noble Midstream in August 2019 and serves as President and Chief Operating Officer of Noble Energy, since November 2018 • Before joining Noble Energy in 2018, Mr. Smolik served as President, Chief Executive Officer and Chairman of the Board of EP Energy Corporation and EP Energy LLC from 2012 to 2017 • Previously served as Executive Vice President of El Paso Corporation and President of the El Paso Exploration & Production Company, President of ConocoPhillips Canada and Burlington Resources Canada Tom Christensen, Chief Financial Officer, Noble Midstream • Appointed Chief Financial Officer in September 2019 after serving as interim Chief Financial Officer since July 2019 • Previously held the position of Chief Accounting Officer of Noble Midstream since August 2016 and served as Corporate Finance Manager in Noble Energy’s Treasury group, joining Noble Energy upon its acquisition of Rosetta Resources in 2015 • Tom served in positions of increasing responsibility at Rosetta, including most recently serving as its Assistant Controller overseeing SEC reporting, corporate accounting, income taxes and technical accounting matters Chris Stavinoha, Director of Capital Projects, Noble Midstream • Prior to serving in his current role Mr. Stavinoha served as a Project Development Leader and Project Manager for Noble Energy and has over 25 years of project management and project execution experience • Previously held the position of Executive Vice President for London Offshore from June 2002 until May 2010 and prior to 2002 served in various engineering and project management roles at Sonat Offshore Drilling (Transocean) and McDermott Inc. Barry Guice, Director of Operations, Noble Midstream • Appointed Director of Operations for Noble Midstream in July 2018 and previously worked at Noble Energy since 2009, serving in various capacities as Director of Operations for Gulf of Mexico, Senior Asset Manager for the Leviathan field, Engineering and Development Manager for International Division and Project Manager for a deepwater development in the Gulf of Mexico • Previously held various operations, engineering and project management roles at BP in the onshore U.S. and Gulf of Mexico John Reuwer, Vice President, Business and Corporate Development, Noble Midstream • Appointed as Vice President, Business and Corporate Development, effective October 28, 2019 • Previously served in positions of increasing responsibility within the Partnership’s business development, mergers and acquisitions, and corporate development teams, after joining Noble Midstream in March 2017 • Previously worked in management consulting, advising energy clients on large strategic initiatives including mergers, acquisitions, joint ventures, restructurings and other growth projects 3 w ww ww w..n nb bllm miid ds st tr re ea am m..c co om m
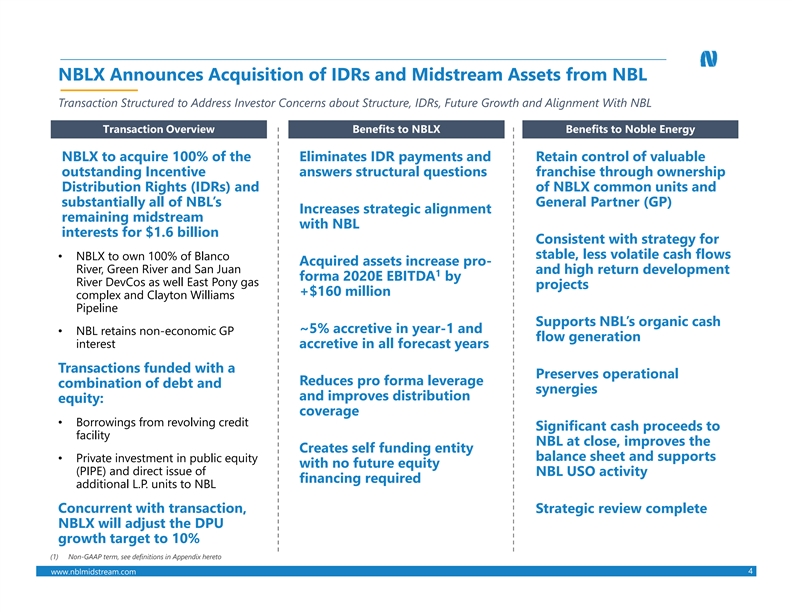
NBLX Announces Acquisition of IDRs and Midstream Assets from NBL Transaction Structured to Address Investor Concerns about Structure, IDRs, Future Growth and Alignment With NBL Transaction Overview Benefits to NBLX Benefits to Noble Energy NBLX to acquire 100% of the Eliminates IDR payments and Retain control of valuable outstanding Incentive answers structural questions franchise through ownership Distribution Rights (IDRs) and of NBLX common units and substantially all of NBL’s General Partner (GP) Increases strategic alignment remaining midstream with NBL interests for $1.6 billion Consistent with strategy for stable, less volatile cash flows • NBLX to own 100% of Blanco Acquired assets increase pro- River, Green River and San Juan and high return development 1 forma 2020E EBITDA by River DevCos as well East Pony gas projects +$160 million complex and Clayton Williams Pipeline Supports NBL’s organic cash ~5% accretive in year-1 and • NBL retains non-economic GP flow generation interest accretive in all forecast years Transactions funded with a Preserves operational Reduces pro forma leverage combination of debt and synergies and improves distribution equity: coverage • Borrowings from revolving credit Significant cash proceeds to facility NBL at close, improves the Creates self funding entity balance sheet and supports • Private investment in public equity with no future equity (PIPE) and direct issue of NBL USO activity financing required additional L.P. units to NBL Concurrent with transaction, Strategic review complete NBLX will adjust the DPU growth target to 10% (1) Non-GAAP term, see definitions in Appendix hereto 4 w ww ww w..n nb bllm miid ds st tr re ea am m..c co om mNBLX Announces Acquisition of IDRs and Midstream Assets from NBL Transaction Structured to Address Investor Concerns about Structure, IDRs, Future Growth and Alignment With NBL Transaction Overview Benefits to NBLX Benefits to Noble Energy NBLX to acquire 100% of the Eliminates IDR payments and Retain control of valuable outstanding Incentive answers structural questions franchise through ownership Distribution Rights (IDRs) and of NBLX common units and substantially all of NBL’s General Partner (GP) Increases strategic alignment remaining midstream with NBL interests for $1.6 billion Consistent with strategy for stable, less volatile cash flows • NBLX to own 100% of Blanco Acquired assets increase pro- River, Green River and San Juan and high return development 1 forma 2020E EBITDA by River DevCos as well East Pony gas projects +$160 million complex and Clayton Williams Pipeline Supports NBL’s organic cash ~5% accretive in year-1 and • NBL retains non-economic GP flow generation interest accretive in all forecast years Transactions funded with a Preserves operational Reduces pro forma leverage combination of debt and synergies and improves distribution equity: coverage • Borrowings from revolving credit Significant cash proceeds to facility NBL at close, improves the Creates self funding entity balance sheet and supports • Private investment in public equity with no future equity (PIPE) and direct issue of NBL USO activity financing required additional L.P. units to NBL Concurrent with transaction, Strategic review complete NBLX will adjust the DPU growth target to 10% (1) Non-GAAP term, see definitions in Appendix hereto 4 w ww ww w..n nb bllm miid ds st tr re ea am m..c co om m
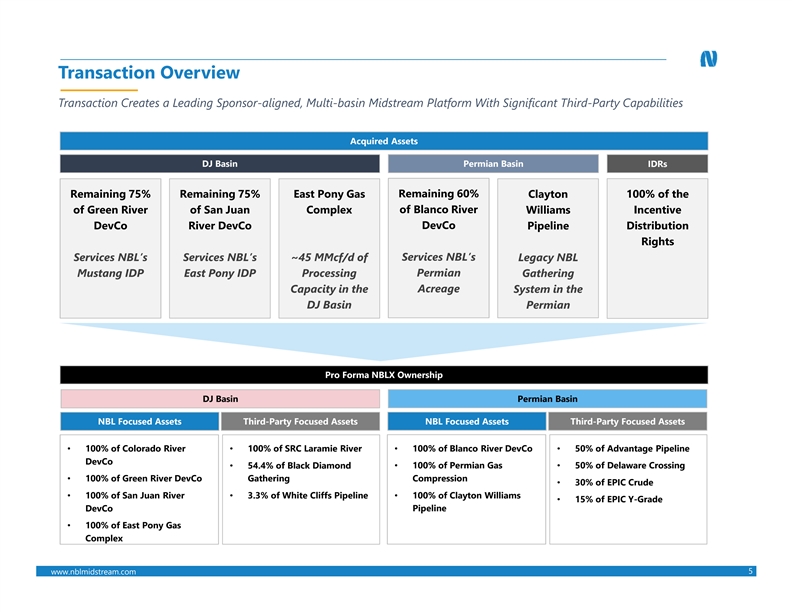
Transaction Overview Transaction Creates a Leading Sponsor-aligned, Multi-basin Midstream Platform With Significant Third-Party Capabilities Acquired Assets DJ Basin Permian Basin IDRs Remaining 60% Remaining 75% Remaining 75% East Pony Gas Clayton 100% of the of Blanco River of Green River of San Juan Complex Williams Incentive DevCo River DevCo DevCo Distribution Pipeline Rights Services NBL’s Services NBL’s ~45 MMcf/d of Services NBL’s Legacy NBL Mustang IDP East Pony IDP Processing Permian Gathering Acreage Capacity in the System in the DJ Basin Permian Pro Forma NBLX Ownership DJ Basin Permian Basin NBL Focused Assets Third-Party Focused Assets NBL Focused Assets Third-Party Focused Assets • 100% of Colorado River • 100% of SRC Laramie River • 100% of Blanco River DevCo • 50% of Advantage Pipeline DevCo • 100% of Permian Gas • 50% of Delaware Crossing • 54.4% of Black Diamond Compression • 100% of Green River DevCo Gathering • 30% of EPIC Crude • 100% of Clayton Williams • 100% of San Juan River • 3.3% of White Cliffs Pipeline • 15% of EPIC Y-Grade Pipeline DevCo • 100% of East Pony Gas Complex 5 w ww ww w..n nb bllm miid ds st tr re ea am m..c co om mTransaction Overview Transaction Creates a Leading Sponsor-aligned, Multi-basin Midstream Platform With Significant Third-Party Capabilities Acquired Assets DJ Basin Permian Basin IDRs Remaining 60% Remaining 75% Remaining 75% East Pony Gas Clayton 100% of the of Blanco River of Green River of San Juan Complex Williams Incentive DevCo River DevCo DevCo Distribution Pipeline Rights Services NBL’s Services NBL’s ~45 MMcf/d of Services NBL’s Legacy NBL Mustang IDP East Pony IDP Processing Permian Gathering Acreage Capacity in the System in the DJ Basin Permian Pro Forma NBLX Ownership DJ Basin Permian Basin NBL Focused Assets Third-Party Focused Assets NBL Focused Assets Third-Party Focused Assets • 100% of Colorado River • 100% of SRC Laramie River • 100% of Blanco River DevCo • 50% of Advantage Pipeline DevCo • 100% of Permian Gas • 50% of Delaware Crossing • 54.4% of Black Diamond Compression • 100% of Green River DevCo Gathering • 30% of EPIC Crude • 100% of Clayton Williams • 100% of San Juan River • 3.3% of White Cliffs Pipeline • 15% of EPIC Y-Grade Pipeline DevCo • 100% of East Pony Gas Complex 5 w ww ww w..n nb bllm miid ds st tr re ea am m..c co om m
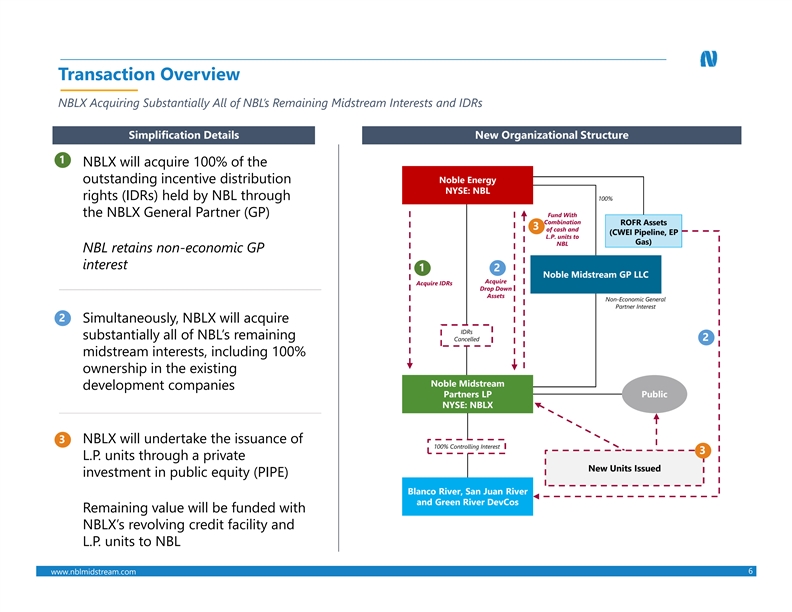
Transaction Overview NBLX Acquiring Substantially All of NBL’s Remaining Midstream Interests and IDRs Simplification Details New Organizational Structure 1 NBLX will acquire 100% of the outstanding incentive distribution Noble Energy NYSE: NBL rights (IDRs) held by NBL through 100% the NBLX General Partner (GP) Fund With Combination ROFR Assets 3 of cash and (CWEI Pipeline, EP L.P. units to Gas) NBL NBL retains non-economic GP interest 1 2 Noble Midstream GP LLC Acquire Acquire IDRs Drop Down Assets Non-Economic General Partner Interest 2 Simultaneously, NBLX will acquire IDRs substantially all of NBL’s remaining Cancelled 2 midstream interests, including 100% ownership in the existing Noble Midstream development companies Partners LP Public NYSE: NBLX 3 NBLX will undertake the issuance of 100% Controlling Interest 3 L.P. units through a private New Units Issued investment in public equity (PIPE) Blanco River, San Juan River and Green River DevCos Remaining value will be funded with NBLX’s revolving credit facility and L.P. units to NBL 6 w ww ww w..n nb bllm miid ds st tr re ea am m..c co om mTransaction Overview NBLX Acquiring Substantially All of NBL’s Remaining Midstream Interests and IDRs Simplification Details New Organizational Structure 1 NBLX will acquire 100% of the outstanding incentive distribution Noble Energy NYSE: NBL rights (IDRs) held by NBL through 100% the NBLX General Partner (GP) Fund With Combination ROFR Assets 3 of cash and (CWEI Pipeline, EP L.P. units to Gas) NBL NBL retains non-economic GP interest 1 2 Noble Midstream GP LLC Acquire Acquire IDRs Drop Down Assets Non-Economic General Partner Interest 2 Simultaneously, NBLX will acquire IDRs substantially all of NBL’s remaining Cancelled 2 midstream interests, including 100% ownership in the existing Noble Midstream development companies Partners LP Public NYSE: NBLX 3 NBLX will undertake the issuance of 100% Controlling Interest 3 L.P. units through a private New Units Issued investment in public equity (PIPE) Blanco River, San Juan River and Green River DevCos Remaining value will be funded with NBLX’s revolving credit facility and L.P. units to NBL 6 w ww ww w..n nb bllm miid ds st tr re ea am m..c co om m
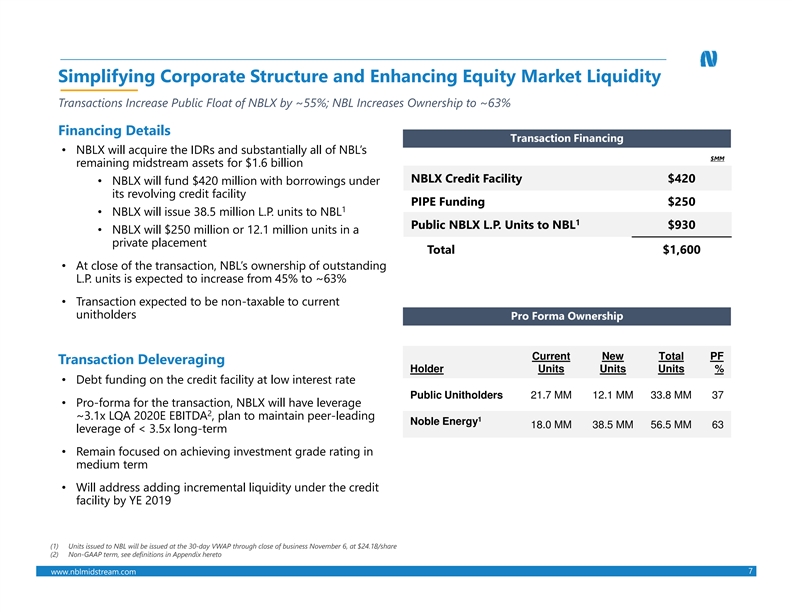
Simplifying Corporate Structure and Enhancing Equity Market Liquidity Transactions Increase Public Float of NBLX by ~55%; NBL Increases Ownership to ~63% Financing Details Transaction Financing • NBLX will acquire the IDRs and substantially all of NBL’s $MM remaining midstream assets for $1.6 billion NBLX Credit Facility $420 • NBLX will fund $420 million with borrowings under its revolving credit facility PIPE Funding $250 1 • NBLX will issue 38.5 million L.P. units to NBL 1 Public NBLX L.P. Units to NBL $930 • NBLX will $250 million or 12.1 million units in a private placement Total $1,600 • At close of the transaction, NBL’s ownership of outstanding L.P. units is expected to increase from 45% to ~63% • Transaction expected to be non-taxable to current unitholders Pro Forma Ownership Current New Total PF Transaction Deleveraging Holder Units Units Units % • Debt funding on the credit facility at low interest rate Public Unitholders 21.7 MM 12.1 MM 33.8 MM 37 • Pro-forma for the transaction, NBLX will have leverage 2 ~3.1x LQA 2020E EBITDA , plan to maintain peer-leading 1 Noble Energy 18.0 MM 38.5 MM 56.5 MM 63 leverage of < 3.5x long-term • Remain focused on achieving investment grade rating in medium term • Will address adding incremental liquidity under the credit facility by YE 2019 (1) Units issued to NBL will be issued at the 30-day VWAP through close of business November 6, at $24.18/share (2) Non-GAAP term, see definitions in Appendix hereto 7 w ww ww w..n nb bllm miid ds st tr re ea am m..c co om mSimplifying Corporate Structure and Enhancing Equity Market Liquidity Transactions Increase Public Float of NBLX by ~55%; NBL Increases Ownership to ~63% Financing Details Transaction Financing • NBLX will acquire the IDRs and substantially all of NBL’s $MM remaining midstream assets for $1.6 billion NBLX Credit Facility $420 • NBLX will fund $420 million with borrowings under its revolving credit facility PIPE Funding $250 1 • NBLX will issue 38.5 million L.P. units to NBL 1 Public NBLX L.P. Units to NBL $930 • NBLX will $250 million or 12.1 million units in a private placement Total $1,600 • At close of the transaction, NBL’s ownership of outstanding L.P. units is expected to increase from 45% to ~63% • Transaction expected to be non-taxable to current unitholders Pro Forma Ownership Current New Total PF Transaction Deleveraging Holder Units Units Units % • Debt funding on the credit facility at low interest rate Public Unitholders 21.7 MM 12.1 MM 33.8 MM 37 • Pro-forma for the transaction, NBLX will have leverage 2 ~3.1x LQA 2020E EBITDA , plan to maintain peer-leading 1 Noble Energy 18.0 MM 38.5 MM 56.5 MM 63 leverage of < 3.5x long-term • Remain focused on achieving investment grade rating in medium term • Will address adding incremental liquidity under the credit facility by YE 2019 (1) Units issued to NBL will be issued at the 30-day VWAP through close of business November 6, at $24.18/share (2) Non-GAAP term, see definitions in Appendix hereto 7 w ww ww w..n nb bllm miid ds st tr re ea am m..c co om m
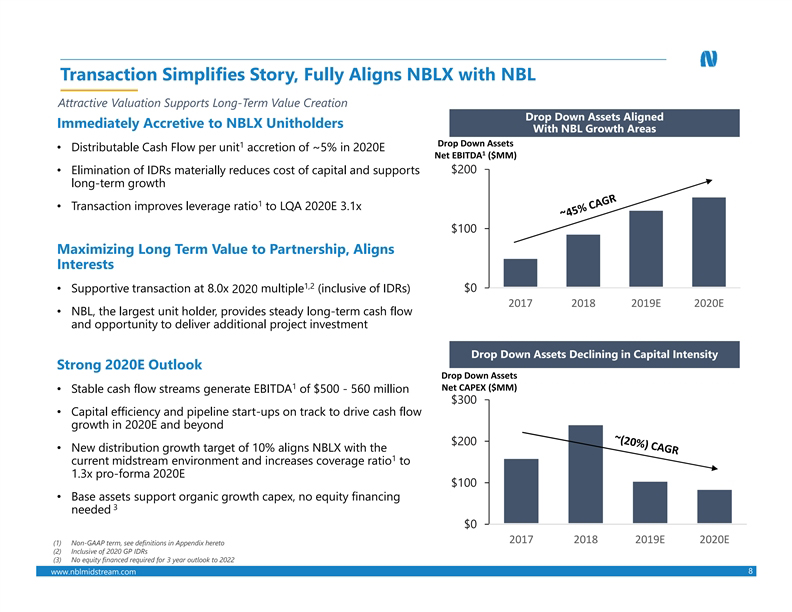
www.nblmidstream.com $0 $100 $200 $300 2017 2018 2019E 2020E Transaction Simplifies Story, Fully Aligns NBLX with NBL Immediately Accretive to NBLX Unitholders • Distributable Cash Flow per unit1 accretion of ~5% in 2020E • Elimination of IDRs materially reduces cost of capital and supports long-term growth • Transaction improves leverage ratio1 to LQA 2020E 3.1x Maximizing Long Term Value to Partnership, Aligns Interests • Supportive transaction at 8.0x 2020 multiple1,2 (inclusive of IDRs) • NBL, the largest unit holder, provides steady long-term cash flow and opportunity to deliver additional project investment Strong 2020E Outlook • Stable cash flow streams generate EBITDA1 of $500 - 560 million • Capital efficiency and pipeline start-ups on track to drive cash flow growth in 2020E and beyond • New distribution growth target of 10% aligns NBLX with the current midstream environment and increases coverage ratio1 to 1.3x pro-forma 2020E • Base assets support organic growth capex, no equity financing needed 3 (1) Non-GAAP term, see definitions in Appendix hereto (2) Inclusive of 2020 GP IDRs (3) No equity financed required for 3 year outlook to 2022 $0 $100 $200 2017 2018 2019E 2020E Drop Down Assets Aligned With NBL Growth Areas Drop Down Assets Declining in Capital Intensity Drop Down Assets Net EBITDA1 ($MM) Drop Down Assets Net CAPEX ($MM) Attractive Valuation Supports Long-Term Value Creation 8
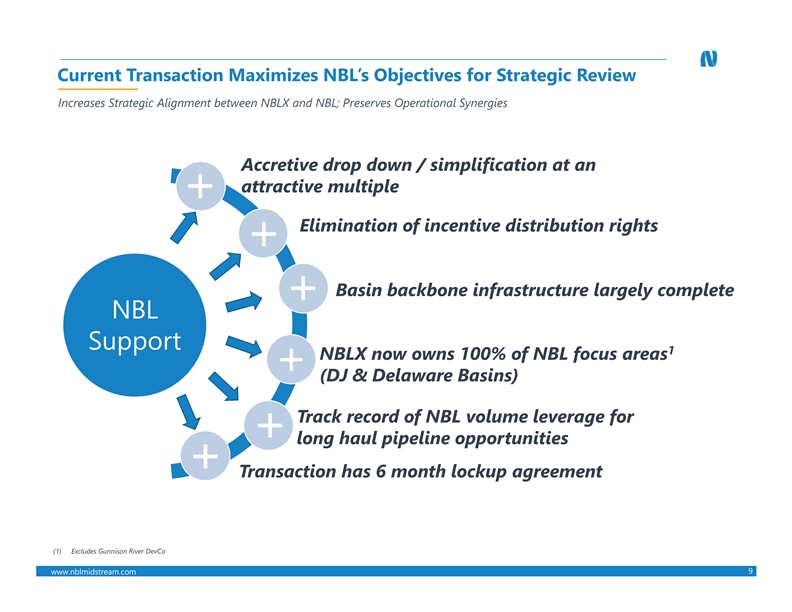
Current Transaction Maximizes NBL’s Objectives for Strategic Review Increases Strategic Alignment between NBLX and NBL; Preserves Operational Synergies Accretive drop down / simplification at an attractive multiple Elimination of incentive distribution rights Basin backbone infrastructure largely complete NBL Support 1 NBLX now owns 100% of NBL focus areas (DJ & Delaware Basins) Track record of NBL volume leverage for long haul pipeline opportunities Transaction has 6 month lockup agreement (1) Excludes Gunnison River DevCo 9 w ww ww w..n nb bllm miid ds st tr re ea am m..c co om mCurrent Transaction Maximizes NBL’s Objectives for Strategic Review Increases Strategic Alignment between NBLX and NBL; Preserves Operational Synergies Accretive drop down / simplification at an attractive multiple Elimination of incentive distribution rights Basin backbone infrastructure largely complete NBL Support 1 NBLX now owns 100% of NBL focus areas (DJ & Delaware Basins) Track record of NBL volume leverage for long haul pipeline opportunities Transaction has 6 month lockup agreement (1) Excludes Gunnison River DevCo 9 w ww ww w..n nb bllm miid ds st tr re ea am m..c co om m
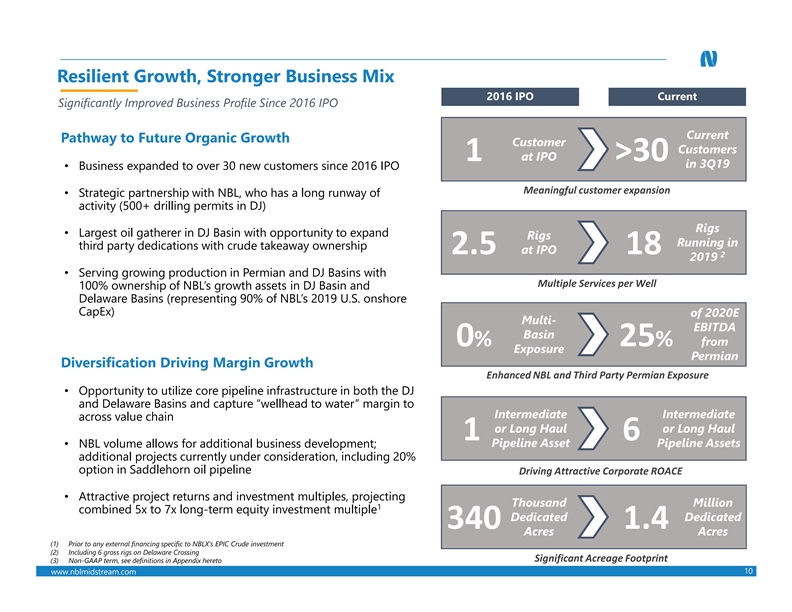
Resilient Growth, Stronger Business Mix 2016 IPO Current Significantly Improved Business Profile Since 2016 IPO Current Pathway to Future Organic Growth Customer Customers 1 at IPO >30 in 3Q19 • Business expanded to over 30 new customers since 2016 IPO Meaningful customer expansion • Strategic partnership with NBL, who has a long runway of activity (500+ drilling permits in DJ) Rigs • Largest oil gatherer in DJ Basin with opportunity to expand Rigs Running in third party dedications with crude takeaway ownership 2.5 at IPO 18 2 2019 • Serving growing production in Permian and DJ Basins with Multiple Services per Well 100% ownership of NBL’s growth assets in DJ Basin and Delaware Basins (representing 90% of NBL’s 2019 U.S. onshore CapEx) of 2020E Multi- EBITDA Basin 0% 25% from Exposure Permian Diversification Driving Margin Growth Enhanced NBL and Third Party Permian Exposure • Opportunity to utilize core pipeline infrastructure in both the DJ and Delaware Basins and capture “wellhead to water” margin to Intermediate Intermediate across value chain or Long Haul or Long Haul 1 6 Pipeline Asset Pipeline Assets • NBL volume allows for additional business development; additional projects currently under consideration, including 20% option in Saddlehorn oil pipeline Driving Attractive Corporate ROACE 10 • Attractive project returns and investment multiples, projecting Thousand Million 1 combined 5x to 7x long-term equity investment multiple Dedicated Dedicated 340 1.4 Acres Acres (1) Prior to any external financing specific to NBLX’s EPIC Crude investment (2) Including 6 gross rigs on Delaware Crossing Significant Acreage Footprint (3) Non-GAAP term, see definitions in Appendix hereto 10 w ww ww w..n nb bllm miid ds st tr re ea am m..c co om mResilient Growth, Stronger Business Mix 2016 IPO Current Significantly Improved Business Profile Since 2016 IPO Current Pathway to Future Organic Growth Customer Customers 1 at IPO >30 in 3Q19 • Business expanded to over 30 new customers since 2016 IPO Meaningful customer expansion • Strategic partnership with NBL, who has a long runway of activity (500+ drilling permits in DJ) Rigs • Largest oil gatherer in DJ Basin with opportunity to expand Rigs Running in third party dedications with crude takeaway ownership 2.5 at IPO 18 2 2019 • Serving growing production in Permian and DJ Basins with Multiple Services per Well 100% ownership of NBL’s growth assets in DJ Basin and Delaware Basins (representing 90% of NBL’s 2019 U.S. onshore CapEx) of 2020E Multi- EBITDA Basin 0% 25% from Exposure Permian Diversification Driving Margin Growth Enhanced NBL and Third Party Permian Exposure • Opportunity to utilize core pipeline infrastructure in both the DJ and Delaware Basins and capture “wellhead to water” margin to Intermediate Intermediate across value chain or Long Haul or Long Haul 1 6 Pipeline Asset Pipeline Assets • NBL volume allows for additional business development; additional projects currently under consideration, including 20% option in Saddlehorn oil pipeline Driving Attractive Corporate ROACE 10 • Attractive project returns and investment multiples, projecting Thousand Million 1 combined 5x to 7x long-term equity investment multiple Dedicated Dedicated 340 1.4 Acres Acres (1) Prior to any external financing specific to NBLX’s EPIC Crude investment (2) Including 6 gross rigs on Delaware Crossing Significant Acreage Footprint (3) Non-GAAP term, see definitions in Appendix hereto 10 w ww ww w..n nb bllm miid ds st tr re ea am m..c co om m

Asset Acquisition Summary, Leading DJ and Permian Basin Positions Pro-Forma NBLX Will Own Substantially All of NBL’s Onshore Midstream Assets DJ Basin Permian Basin Largest Oil Gatherer in DJ Basin with 10+ With backbone infrastructure built, Permian 1 customers and growing EBITDA and FCF reaching inflection point Previous Pro Forma NBLX Interest Services Ownership Ownership Previous Pro Forma NBLX Interest Services Ownership Ownership Oil / Gas / PW Blanco River 40% 100% Oil / Gas / PW Gathering Green River Gathering / FW 25% 100% Clayton Williams Oil / Gas / PW 0% 100% Delivery Pipeline Gathering San Juan River FW Delivery 25% 100% Gas Gathering East Pony Gas G&P / Gas 0% 100% Processing (1) Non-GAAP term, see definitions in Appendix hereto 11 w ww ww w..n nb bllm miid ds st tr re ea am m..c co om mAsset Acquisition Summary, Leading DJ and Permian Basin Positions Pro-Forma NBLX Will Own Substantially All of NBL’s Onshore Midstream Assets DJ Basin Permian Basin Largest Oil Gatherer in DJ Basin with 10+ With backbone infrastructure built, Permian 1 customers and growing EBITDA and FCF reaching inflection point Previous Pro Forma NBLX Interest Services Ownership Ownership Previous Pro Forma NBLX Interest Services Ownership Ownership Oil / Gas / PW Blanco River 40% 100% Oil / Gas / PW Gathering Green River Gathering / FW 25% 100% Clayton Williams Oil / Gas / PW 0% 100% Delivery Pipeline Gathering San Juan River FW Delivery 25% 100% Gas Gathering East Pony Gas G&P / Gas 0% 100% Processing (1) Non-GAAP term, see definitions in Appendix hereto 11 w ww ww w..n nb bllm miid ds st tr re ea am m..c co om m
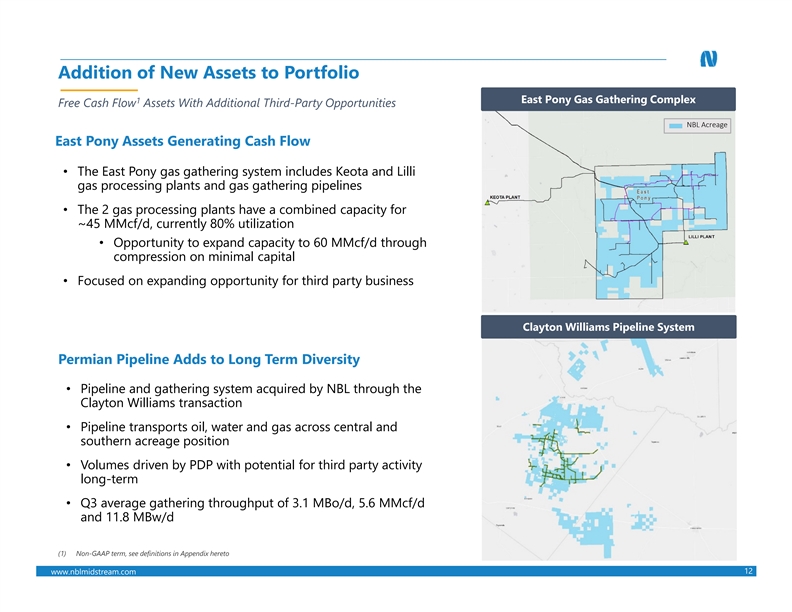
Addition of New Assets to Portfolio 1 East Pony Gas Gathering Complex Free Cash Flow Assets With Additional Third-Party Opportunities NBL Acreage East Pony Assets Generating Cash Flow • The East Pony gas gathering system includes Keota and Lilli gas processing plants and gas gathering pipelines • The 2 gas processing plants have a combined capacity for ~45 MMcf/d, currently 80% utilization • Opportunity to expand capacity to 60 MMcf/d through compression on minimal capital • Focused on expanding opportunity for third party business Clayton Williams Pipeline System Permian Pipeline Adds to Long Term Diversity • Pipeline and gathering system acquired by NBL through the NBL Acreage CWEI Pipelines Clayton Williams transaction • Pipeline transports oil, water and gas across central and southern acreage position • Volumes driven by PDP with potential for third party activity long-term • Q3 average gathering throughput of 3.1 MBo/d, 5.6 MMcf/d and 11.8 MBw/d (1) Non-GAAP term, see definitions in Appendix hereto 12 w ww ww w..n nb bllm miid ds st tr re ea am m..c co om mAddition of New Assets to Portfolio 1 East Pony Gas Gathering Complex Free Cash Flow Assets With Additional Third-Party Opportunities NBL Acreage East Pony Assets Generating Cash Flow • The East Pony gas gathering system includes Keota and Lilli gas processing plants and gas gathering pipelines • The 2 gas processing plants have a combined capacity for ~45 MMcf/d, currently 80% utilization • Opportunity to expand capacity to 60 MMcf/d through compression on minimal capital • Focused on expanding opportunity for third party business Clayton Williams Pipeline System Permian Pipeline Adds to Long Term Diversity • Pipeline and gathering system acquired by NBL through the NBL Acreage CWEI Pipelines Clayton Williams transaction • Pipeline transports oil, water and gas across central and southern acreage position • Volumes driven by PDP with potential for third party activity long-term • Q3 average gathering throughput of 3.1 MBo/d, 5.6 MMcf/d and 11.8 MBw/d (1) Non-GAAP term, see definitions in Appendix hereto 12 w ww ww w..n nb bllm miid ds st tr re ea am m..c co om m
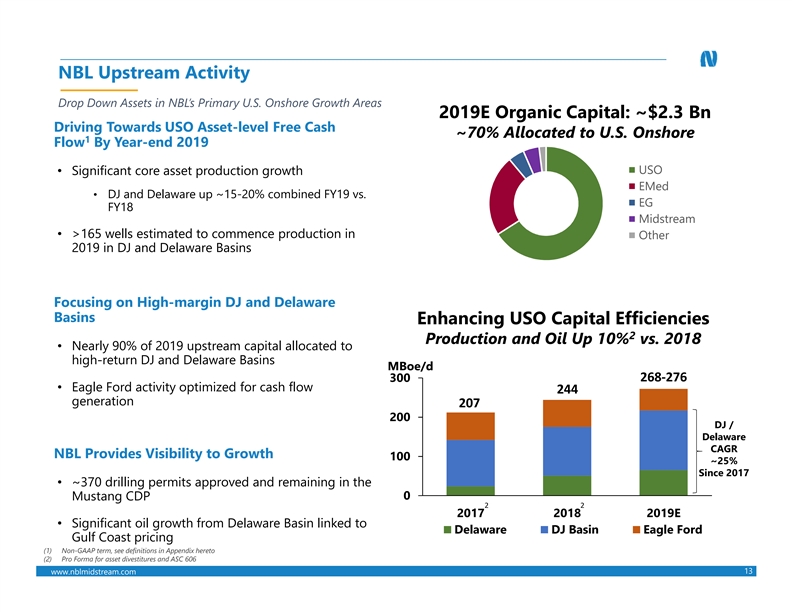
NBL Upstream Activity Drop Down Assets in NBL’s Primary U.S. Onshore Growth Areas 2019E Organic Capital: ~$2.3 Bn Driving Towards USO Asset-level Free Cash ~70% Allocated to U.S. Onshore 1 Flow By Year-end 2019 USO • Significant core asset production growth EMed • DJ and Delaware up ~15-20% combined FY19 vs. EG FY18 Midstream • >165 wells estimated to commence production in Other 2019 in DJ and Delaware Basins . . . . . . . . . . . . . . . . . . . . . . . . . . . . . . . . . . . . . . . . Focusing on High-margin DJ and Delaware Basins Enhancing USO Capital Efficiencies 2 Production and Oil Up 10% vs. 2018 • Nearly 90% of 2019 upstream capital allocated to high-return DJ and Delaware Basins MBoe/d 268-276 300 • Eagle Ford activity optimized for cash flow 244 generation 207 200 DJ / Delaware CAGR NBL Provides Visibility to Growth 100 ~25% Since 2017 • ~370 drilling permits approved and remaining in the 0 Mustang CDP 2 2 2017 2018 2019E • Significant oil growth from Delaware Basin linked to Delaware DJ Basin Eagle Ford Gulf Coast pricing (1) Non-GAAP term, see definitions in Appendix hereto (2) Pro Forma for asset divestitures and ASC 606 13 w ww ww w..n nb bllm miid ds st tr re ea am m..c co om mNBL Upstream Activity Drop Down Assets in NBL’s Primary U.S. Onshore Growth Areas 2019E Organic Capital: ~$2.3 Bn Driving Towards USO Asset-level Free Cash ~70% Allocated to U.S. Onshore 1 Flow By Year-end 2019 USO • Significant core asset production growth EMed • DJ and Delaware up ~15-20% combined FY19 vs. EG FY18 Midstream • >165 wells estimated to commence production in Other 2019 in DJ and Delaware Basins . . . . . . . . . . . . . . . . . . . . . . . . . . . . . . . . . . . . . . . . Focusing on High-margin DJ and Delaware Basins Enhancing USO Capital Efficiencies 2 Production and Oil Up 10% vs. 2018 • Nearly 90% of 2019 upstream capital allocated to high-return DJ and Delaware Basins MBoe/d 268-276 300 • Eagle Ford activity optimized for cash flow 244 generation 207 200 DJ / Delaware CAGR NBL Provides Visibility to Growth 100 ~25% Since 2017 • ~370 drilling permits approved and remaining in the 0 Mustang CDP 2 2 2017 2018 2019E • Significant oil growth from Delaware Basin linked to Delaware DJ Basin Eagle Ford Gulf Coast pricing (1) Non-GAAP term, see definitions in Appendix hereto (2) Pro Forma for asset divestitures and ASC 606 13 w ww ww w..n nb bllm miid ds st tr re ea am m..c co om m
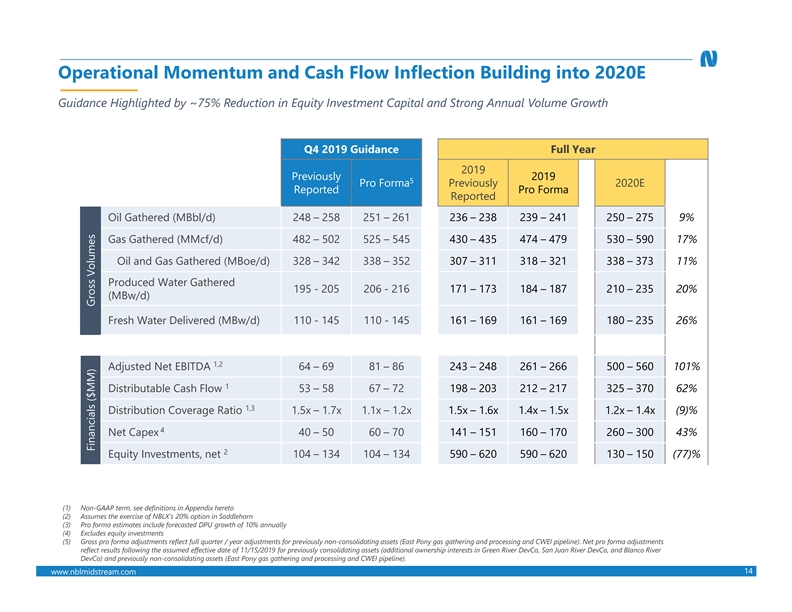
Operational Momentum and Cash Flow Inflection Building into 2020E Guidance Highlighted by ~75% Reduction in Equity Investment Capital and Strong Annual Volume Growth Q4 2019 Guidance Full Year 2019 Previously 2019 5 Pro Forma Previously 2020E Reported Pro Forma Reported Oil Gathered (MBbl/d) 248 – 258 251 – 261 236 – 238 239 – 241 250 – 275 9% Gas Gathered (MMcf/d) 482 – 502 525 – 545 430 – 435 474 – 479 530 – 590 17% Oil and Gas Gathered (MBoe/d) 328 – 342 338 – 352 307 – 311 318 – 321 338 – 373 11% Produced Water Gathered 195 - 205 206 - 216 171 – 173 184 – 187 210 – 235 20% (MBw/d) Fresh Water Delivered (MBw/d) 110 - 145 110 - 145 161 – 169 161 – 169 180 – 235 26% 1,2 Adjusted Net EBITDA 64 – 69 81 – 86 243 – 248 261 – 266 500 – 560 101% 1 Distributable Cash Flow 53 – 58 67 – 72 198 – 203 212 – 217 325 – 370 62% 1,3 Distribution Coverage Ratio 1.5x – 1.7x 1.1x – 1.2x 1.5x – 1.6x 1.4x – 1.5x 1.2x – 1.4x (9)% 4 Net Capex 40 – 50 60 – 70 141 – 151 160 – 170 260 – 300 43% 2 Equity Investments, net 104 – 134 104 – 134 590 – 620 590 – 620 130 – 150 (77)% (1) Non-GAAP term, see definitions in Appendix hereto (2) Assumes the exercise of NBLX’s 20% option in Saddlehorn (3) Pro forma estimates include forecasted DPU growth of 10% annually (4) Excludes equity investments (5) Gross pro forma adjustments reflect full quarter / year adjustments for previously non-consolidating assets (East Pony gas gathering and processing and CWEI pipeline). Net pro forma adjustments reflect results following the assumed effective date of 11/15/2019 for previously consolidating assets (additional ownership interests in Green River DevCo, San Juan River DevCo, and Blanco River DevCo) and previously non-consolidating assets (East Pony gas gathering and processing and CWEI pipeline). 14 w ww ww w..n nb bllm miid ds st tr re ea am m..c co om m Financials ($MM) Gross VolumesOperational Momentum and Cash Flow Inflection Building into 2020E Guidance Highlighted by ~75% Reduction in Equity Investment Capital and Strong Annual Volume Growth Q4 2019 Guidance Full Year 2019 Previously 2019 5 Pro Forma Previously 2020E Reported Pro Forma Reported Oil Gathered (MBbl/d) 248 – 258 251 – 261 236 – 238 239 – 241 250 – 275 9% Gas Gathered (MMcf/d) 482 – 502 525 – 545 430 – 435 474 – 479 530 – 590 17% Oil and Gas Gathered (MBoe/d) 328 – 342 338 – 352 307 – 311 318 – 321 338 – 373 11% Produced Water Gathered 195 - 205 206 - 216 171 – 173 184 – 187 210 – 235 20% (MBw/d) Fresh Water Delivered (MBw/d) 110 - 145 110 - 145 161 – 169 161 – 169 180 – 235 26% 1,2 Adjusted Net EBITDA 64 – 69 81 – 86 243 – 248 261 – 266 500 – 560 101% 1 Distributable Cash Flow 53 – 58 67 – 72 198 – 203 212 – 217 325 – 370 62% 1,3 Distribution Coverage Ratio 1.5x – 1.7x 1.1x – 1.2x 1.5x – 1.6x 1.4x – 1.5x 1.2x – 1.4x (9)% 4 Net Capex 40 – 50 60 – 70 141 – 151 160 – 170 260 – 300 43% 2 Equity Investments, net 104 – 134 104 – 134 590 – 620 590 – 620 130 – 150 (77)% (1) Non-GAAP term, see definitions in Appendix hereto (2) Assumes the exercise of NBLX’s 20% option in Saddlehorn (3) Pro forma estimates include forecasted DPU growth of 10% annually (4) Excludes equity investments (5) Gross pro forma adjustments reflect full quarter / year adjustments for previously non-consolidating assets (East Pony gas gathering and processing and CWEI pipeline). Net pro forma adjustments reflect results following the assumed effective date of 11/15/2019 for previously consolidating assets (additional ownership interests in Green River DevCo, San Juan River DevCo, and Blanco River DevCo) and previously non-consolidating assets (East Pony gas gathering and processing and CWEI pipeline). 14 w ww ww w..n nb bllm miid ds st tr re ea am m..c co om m Financials ($MM) Gross Volumes
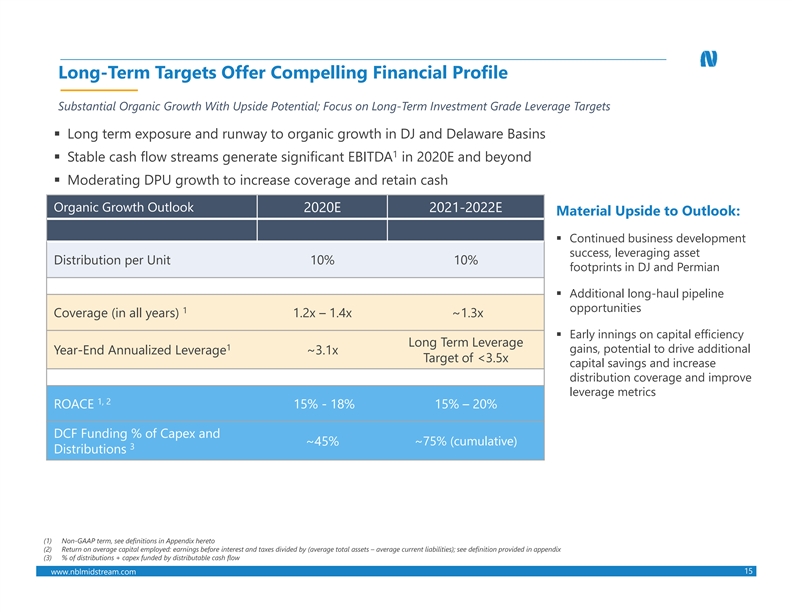
Long-Term Targets Offer Compelling Financial Profile Substantial Organic Growth With Upside Potential; Focus on Long-Term Investment Grade Leverage Targets § Long term exposure and runway to organic growth in DJ and Delaware Basins 1 § Stable cash flow streams generate significant EBITDA in 2020E and beyond § Moderating DPU growth to increase coverage and retain cash Organic Growth Outlook 2020E 2021-2022E Material Upside to Outlook: § Continued business development success, leveraging asset Distribution per Unit 10% 10% footprints in DJ and Permian § Additional long-haul pipeline opportunities 1 Coverage (in all years) 1.2x – 1.4x ~1.3x § Early innings on capital efficiency Long Term Leverage 1 gains, potential to drive additional Year-End Annualized Leverage ~3.1x Target of <3.5x capital savings and increase distribution coverage and improve leverage metrics 1, 2 ROACE 15% - 18% 15% – 20% DCF Funding % of Capex and ~75% (cumulative) ~45% 3 Distributions (1) Non-GAAP term, see definitions in Appendix hereto (2) Return on average capital employed: earnings before interest and taxes divided by (average total assets – average current liabilities); see definition provided in appendix (3) % of distributions + capex funded by distributable cash flow 15 w ww ww w..n nb bllm miid ds st tr re ea am m..c co om mLong-Term Targets Offer Compelling Financial Profile Substantial Organic Growth With Upside Potential; Focus on Long-Term Investment Grade Leverage Targets § Long term exposure and runway to organic growth in DJ and Delaware Basins 1 § Stable cash flow streams generate significant EBITDA in 2020E and beyond § Moderating DPU growth to increase coverage and retain cash Organic Growth Outlook 2020E 2021-2022E Material Upside to Outlook: § Continued business development success, leveraging asset Distribution per Unit 10% 10% footprints in DJ and Permian § Additional long-haul pipeline opportunities 1 Coverage (in all years) 1.2x – 1.4x ~1.3x § Early innings on capital efficiency Long Term Leverage 1 gains, potential to drive additional Year-End Annualized Leverage ~3.1x Target of <3.5x capital savings and increase distribution coverage and improve leverage metrics 1, 2 ROACE 15% - 18% 15% – 20% DCF Funding % of Capex and ~75% (cumulative) ~45% 3 Distributions (1) Non-GAAP term, see definitions in Appendix hereto (2) Return on average capital employed: earnings before interest and taxes divided by (average total assets – average current liabilities); see definition provided in appendix (3) % of distributions + capex funded by distributable cash flow 15 w ww ww w..n nb bllm miid ds st tr re ea am m..c co om m
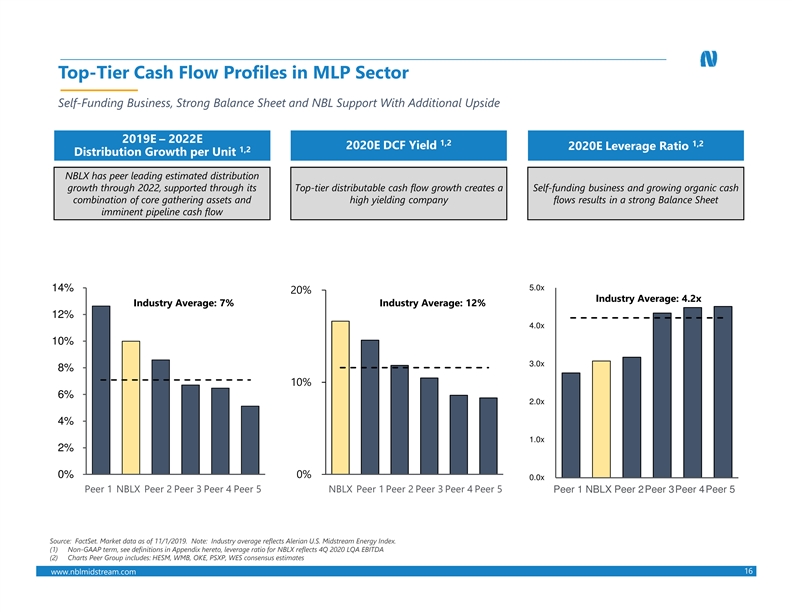
Top-Tier Cash Flow Profiles in MLP Sector Self-Funding Business, Strong Balance Sheet and NBL Support With Additional Upside 2019E – 2022E 1,2 1,2 2020E DCF Yield 2020E Leverage Ratio 1,2 Distribution Growth per Unit NBLX has peer leading estimated distribution growth through 2022, supported through its Top-tier distributable cash flow growth creates a Self-funding business and growing organic cash combination of core gathering assets and high yielding company flows results in a strong Balance Sheet imminent pipeline cash flow 5.0x 14% 20% Industry Average: 4.2x Industry Average: 7% Industry Average: 12% 12% 4.0x 10% 3.0x 8% 10% 6% 2.0x 4% 1.0x 2% 0% 0% 0.0x Peer 1 NBLX Peer 2 Peer 3 Peer 4 Peer 5 NBLX Peer 1 Peer 2 Peer 3 Peer 4 Peer 5 Peer 1 NBLX Peer 2Peer 3Peer 4Peer 5 Source: FactSet. Market data as of 11/1/2019. Note: Industry average reflects Alerian U.S. Midstream Energy Index. (1) Non-GAAP term, see definitions in Appendix hereto, leverage ratio for NBLX reflects 4Q 2020 LQA EBITDA (2) Charts Peer Group includes: HESM, WMB, OKE, PSXP, WES consensus estimates 16 w ww ww w..n nb bllm miid ds st tr re ea am m..c co om mTop-Tier Cash Flow Profiles in MLP Sector Self-Funding Business, Strong Balance Sheet and NBL Support With Additional Upside 2019E – 2022E 1,2 1,2 2020E DCF Yield 2020E Leverage Ratio 1,2 Distribution Growth per Unit NBLX has peer leading estimated distribution growth through 2022, supported through its Top-tier distributable cash flow growth creates a Self-funding business and growing organic cash combination of core gathering assets and high yielding company flows results in a strong Balance Sheet imminent pipeline cash flow 5.0x 14% 20% Industry Average: 4.2x Industry Average: 7% Industry Average: 12% 12% 4.0x 10% 3.0x 8% 10% 6% 2.0x 4% 1.0x 2% 0% 0% 0.0x Peer 1 NBLX Peer 2 Peer 3 Peer 4 Peer 5 NBLX Peer 1 Peer 2 Peer 3 Peer 4 Peer 5 Peer 1 NBLX Peer 2Peer 3Peer 4Peer 5 Source: FactSet. Market data as of 11/1/2019. Note: Industry average reflects Alerian U.S. Midstream Energy Index. (1) Non-GAAP term, see definitions in Appendix hereto, leverage ratio for NBLX reflects 4Q 2020 LQA EBITDA (2) Charts Peer Group includes: HESM, WMB, OKE, PSXP, WES consensus estimates 16 w ww ww w..n nb bllm miid ds st tr re ea am m..c co om m
NBLX Equity Story Reinvigorated With Announced Transactions Significant Stand-Alone Organic Potential for Growth With Enhanced Clarity on Structure Key Transactional Highlights: • NBL reaffirms support and commitment to NBLX • Unique opportunity to invest in a company with sector leading growth paired with simplified corporate structure • Accretive drop down / simplification on a DCF basis at attractive multiple – eliminates structural questions • Transactions aligns NBLX with NBL, providing steady long term cash flow and opportunity to deliver additional project investment at the NBL level Key Financial Highlights: • Accretive on a distribution per unit basis • Eliminates incentive distribution payments 1 • Reduces pro forma leverage and improves distribution coverage • No future equity financing required, self-funding growth (1) Non-GAAP term, see definitions in Appendix hereto 17 w ww ww w..n nb bllm miid ds st tr re ea am m..c co om mNBLX Equity Story Reinvigorated With Announced Transactions Significant Stand-Alone Organic Potential for Growth With Enhanced Clarity on Structure Key Transactional Highlights: • NBL reaffirms support and commitment to NBLX • Unique opportunity to invest in a company with sector leading growth paired with simplified corporate structure • Accretive drop down / simplification on a DCF basis at attractive multiple – eliminates structural questions • Transactions aligns NBLX with NBL, providing steady long term cash flow and opportunity to deliver additional project investment at the NBL level Key Financial Highlights: • Accretive on a distribution per unit basis • Eliminates incentive distribution payments 1 • Reduces pro forma leverage and improves distribution coverage • No future equity financing required, self-funding growth (1) Non-GAAP term, see definitions in Appendix hereto 17 w ww ww w..n nb bllm miid ds st tr re ea am m..c co om m
Appendix 18 w ww ww w..n nb bllm miid ds st tr re ea am m..c co om mAppendix 18 w ww ww w..n nb bllm miid ds st tr re ea am m..c co om m
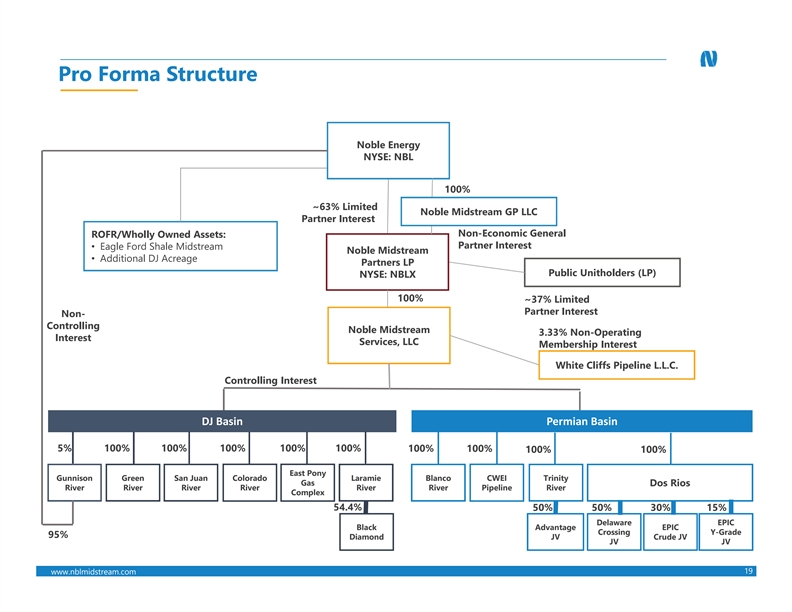
Pro Forma Structure Noble Energy NYSE: NBL 100% ~63% Limited Noble Midstream GP LLC Partner Interest Non-Economic General ROFR/Wholly Owned Assets: Partner Interest • Eagle Ford Shale Midstream Noble Midstream • Additional DJ Acreage Partners LP Public Unitholders (LP) NYSE: NBLX 100% ~37% Limited Partner Interest Non- Controlling Noble Midstream 3.33% Non-Operating Interest Services, LLC Membership Interest White Cliffs Pipeline L.L.C. Controlling Interest DJ Basin Permian Basin 5% 100% 100% 100% 100% 100% 100% 100% 100% 100% East Pony Gunnison Green San Juan Colorado Laramie Blanco CWEI Trinity Gas Dos Rios River River River River River River Pipeline River Complex 54.4% 50% 50% 30% 15% Delaware EPIC Black Advantage EPIC Crossing Y-Grade 95% Diamond JV Crude JV JV JV 19 w ww ww w..n nb bllm miid ds st tr re ea am m..c co om mPro Forma Structure Noble Energy NYSE: NBL 100% ~63% Limited Noble Midstream GP LLC Partner Interest Non-Economic General ROFR/Wholly Owned Assets: Partner Interest • Eagle Ford Shale Midstream Noble Midstream • Additional DJ Acreage Partners LP Public Unitholders (LP) NYSE: NBLX 100% ~37% Limited Partner Interest Non- Controlling Noble Midstream 3.33% Non-Operating Interest Services, LLC Membership Interest White Cliffs Pipeline L.L.C. Controlling Interest DJ Basin Permian Basin 5% 100% 100% 100% 100% 100% 100% 100% 100% 100% East Pony Gunnison Green San Juan Colorado Laramie Blanco CWEI Trinity Gas Dos Rios River River River River River River Pipeline River Complex 54.4% 50% 50% 30% 15% Delaware EPIC Black Advantage EPIC Crossing Y-Grade 95% Diamond JV Crude JV JV JV 19 w ww ww w..n nb bllm miid ds st tr re ea am m..c co om m
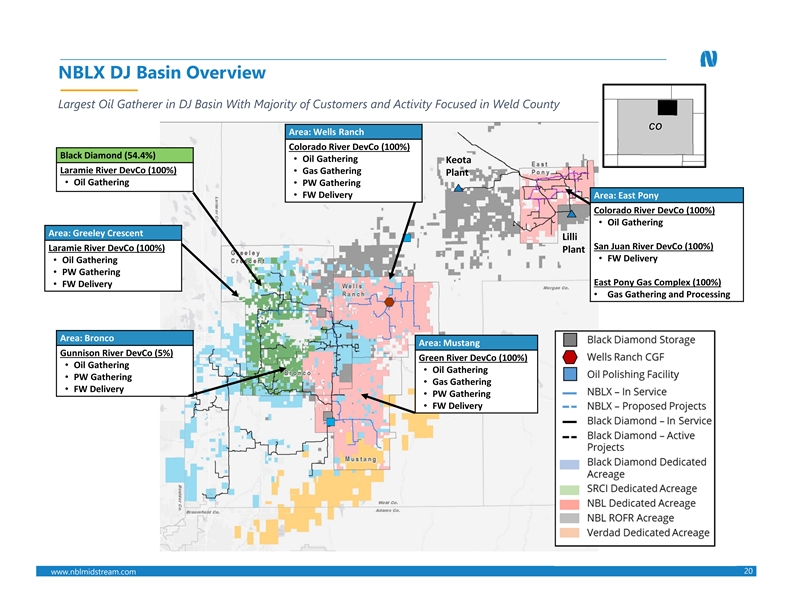
NBLX DJ Basin Overview Largest Oil Gatherer in DJ Basin With Majority of Customers and Activity Focused in Weld County Area: Wells Ranch Colorado River DevCo (100%) Black Diamond (54.4%) • Oil Gathering Keota Laramie River DevCo (100%) • Gas Gathering Plant • Oil Gathering • PW Gathering • FW Delivery Area: East Pony Colorado River DevCo (100%) • Oil Gathering Area: Greeley Crescent Lilli San Juan River DevCo (100%) Laramie River DevCo (100%) Plant • FW Delivery • Oil Gathering • PW Gathering East Pony Gas Complex (100%) • FW Delivery • Gas Gathering and Processing Area: Bronco Area: Mustang Gunnison River DevCo (5%) Green River DevCo (100%) • Oil Gathering • Oil Gathering • PW Gathering • Gas Gathering • FW Delivery • PW Gathering • FW Delivery 20 w ww ww w..n nb bllm miid ds st tr re ea am m..c co om mNBLX DJ Basin Overview Largest Oil Gatherer in DJ Basin With Majority of Customers and Activity Focused in Weld County Area: Wells Ranch Colorado River DevCo (100%) Black Diamond (54.4%) • Oil Gathering Keota Laramie River DevCo (100%) • Gas Gathering Plant • Oil Gathering • PW Gathering • FW Delivery Area: East Pony Colorado River DevCo (100%) • Oil Gathering Area: Greeley Crescent Lilli San Juan River DevCo (100%) Laramie River DevCo (100%) Plant • FW Delivery • Oil Gathering • PW Gathering East Pony Gas Complex (100%) • FW Delivery • Gas Gathering and Processing Area: Bronco Area: Mustang Gunnison River DevCo (5%) Green River DevCo (100%) • Oil Gathering • Oil Gathering • PW Gathering • Gas Gathering • FW Delivery • PW Gathering • FW Delivery 20 w ww ww w..n nb bllm miid ds st tr re ea am m..c co om m
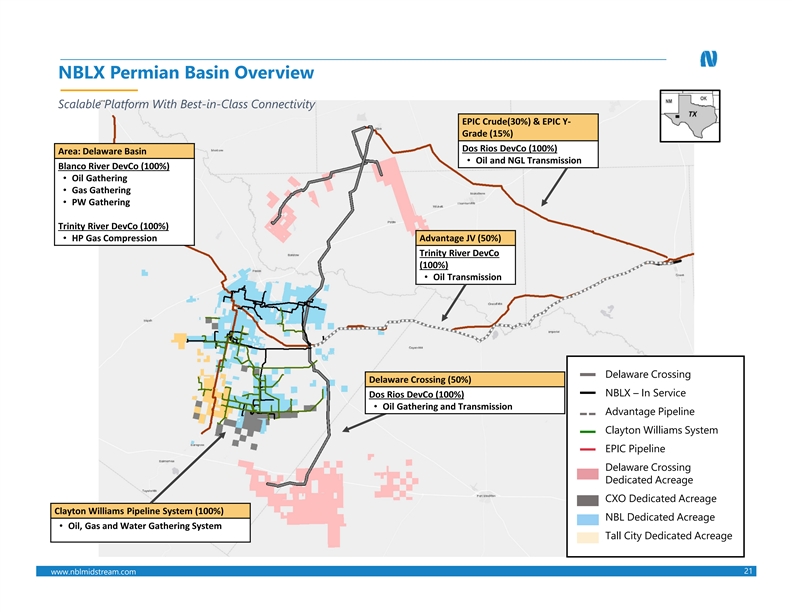
NBLX Permian Basin Overview Scalable Platform With Best-in-Class Connectivity EPIC Crude(30%) & EPIC Y- Grade (15%) Dos Rios DevCo (100%) Area: Delaware Basin • Oil and NGL Transmission Blanco River DevCo (100%) • Oil Gathering • Gas Gathering • PW Gathering Trinity River DevCo (100%) • HP Gas Compression Advantage JV (50%) Trinity River DevCo (100%) • Oil Transmission Delaware Crossing Delaware Crossing (50%) NBLX – In Service Dos Rios DevCo (100%) • Oil Gathering and Transmission Advantage Pipeline Clayton Williams System EPIC Pipeline Delaware Crossing Dedicated Acreage CXO Dedicated Acreage Clayton Williams Pipeline System (100%) NBL Dedicated Acreage • Oil, Gas and Water Gathering System Tall City Dedicated Acreage 21 w ww ww w..n nb bllm miid ds st tr re ea am m..c co om mNBLX Permian Basin Overview Scalable Platform With Best-in-Class Connectivity EPIC Crude(30%) & EPIC Y- Grade (15%) Dos Rios DevCo (100%) Area: Delaware Basin • Oil and NGL Transmission Blanco River DevCo (100%) • Oil Gathering • Gas Gathering • PW Gathering Trinity River DevCo (100%) • HP Gas Compression Advantage JV (50%) Trinity River DevCo (100%) • Oil Transmission Delaware Crossing Delaware Crossing (50%) NBLX – In Service Dos Rios DevCo (100%) • Oil Gathering and Transmission Advantage Pipeline Clayton Williams System EPIC Pipeline Delaware Crossing Dedicated Acreage CXO Dedicated Acreage Clayton Williams Pipeline System (100%) NBL Dedicated Acreage • Oil, Gas and Water Gathering System Tall City Dedicated Acreage 21 w ww ww w..n nb bllm miid ds st tr re ea am m..c co om m
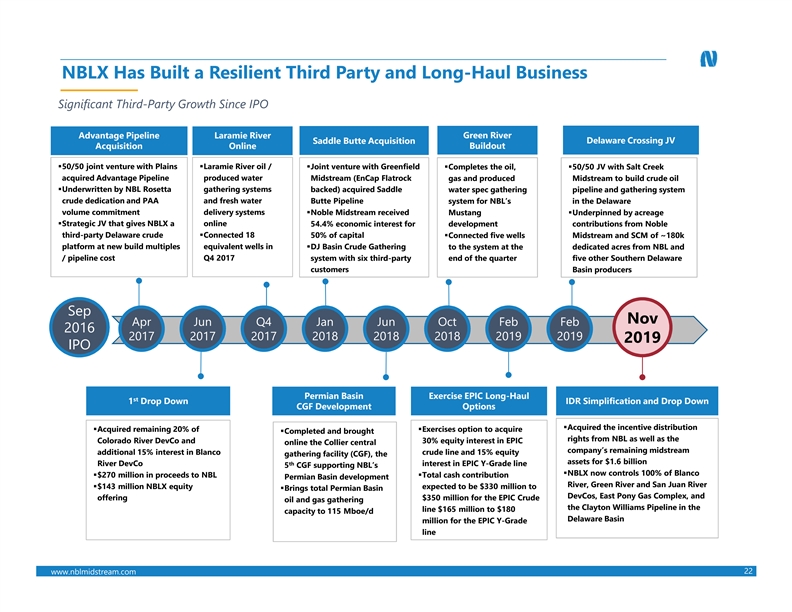
NBLX Has Built a Resilient Third Party and Long-Haul Business Significant Third-Party Growth Since IPO Green River Advantage Pipeline Laramie River Saddle Butte Acquisition Delaware Crossing JV Acquisition Online Buildout §50/50 joint venture with Plains §Laramie River oil / §Joint venture with Greenfield §Completes the oil, §50/50 JV with Salt Creek acquired Advantage Pipeline produced water Midstream (EnCap Flatrock gas and produced Midstream to build crude oil §Underwritten by NBL Rosetta gathering systems backed) acquired Saddle water spec gathering pipeline and gathering system crude dedication and PAA and fresh water Butte Pipeline system for NBL’s in the Delaware volume commitment delivery systems §Noble Midstream received Mustang §Underpinned by acreage §Strategic JV that gives NBLX a online 54.4% economic interest for development contributions from Noble third-party Delaware crude §Connected 18 50% of capital §Connected five wells Midstream and SCM of ~180k platform at new build multiples equivalent wells in §DJ Basin Crude Gathering to the system at the dedicated acres from NBL and / pipeline cost Q4 2017 system with six third-party end of the quarter five other Southern Delaware customers Basin producers Sep Nov Apr Jun Q4 Jan Jun Oct Feb Feb 2016 2017 2017 2017 2018 2018 2018 2019 2019 2019 IPO Permian Basin Exercise EPIC Long-Haul st 1 Drop Down IDR Simplification and Drop Down CGF Development Options §Acquired the incentive distribution §Acquired remaining 20% of §Exercises option to acquire §Completed and brought rights from NBL as well as the Colorado River DevCo and 30% equity interest in EPIC online the Collier central company’s remaining midstream additional 15% interest in Blanco crude line and 15% equity gathering facility (CGF), the assets for $1.6 billion River DevCo th interest in EPIC Y-Grade line 5 CGF supporting NBL’s §NBLX now controls 100% of Blanco §$270 million in proceeds to NBL §Total cash contribution Permian Basin development River, Green River and San Juan River §$143 million NBLX equity expected to be $330 million to §Brings total Permian Basin DevCos, East Pony Gas Complex, and offering $350 million for the EPIC Crude oil and gas gathering the Clayton Williams Pipeline in the line $165 million to $180 capacity to 115 Mboe/d Delaware Basin million for the EPIC Y-Grade line 22 w ww ww w..n nb bllm miid ds st tr re ea am m..c co om mNBLX Has Built a Resilient Third Party and Long-Haul Business Significant Third-Party Growth Since IPO Green River Advantage Pipeline Laramie River Saddle Butte Acquisition Delaware Crossing JV Acquisition Online Buildout §50/50 joint venture with Plains §Laramie River oil / §Joint venture with Greenfield §Completes the oil, §50/50 JV with Salt Creek acquired Advantage Pipeline produced water Midstream (EnCap Flatrock gas and produced Midstream to build crude oil §Underwritten by NBL Rosetta gathering systems backed) acquired Saddle water spec gathering pipeline and gathering system crude dedication and PAA and fresh water Butte Pipeline system for NBL’s in the Delaware volume commitment delivery systems §Noble Midstream received Mustang §Underpinned by acreage §Strategic JV that gives NBLX a online 54.4% economic interest for development contributions from Noble third-party Delaware crude §Connected 18 50% of capital §Connected five wells Midstream and SCM of ~180k platform at new build multiples equivalent wells in §DJ Basin Crude Gathering to the system at the dedicated acres from NBL and / pipeline cost Q4 2017 system with six third-party end of the quarter five other Southern Delaware customers Basin producers Sep Nov Apr Jun Q4 Jan Jun Oct Feb Feb 2016 2017 2017 2017 2018 2018 2018 2019 2019 2019 IPO Permian Basin Exercise EPIC Long-Haul st 1 Drop Down IDR Simplification and Drop Down CGF Development Options §Acquired the incentive distribution §Acquired remaining 20% of §Exercises option to acquire §Completed and brought rights from NBL as well as the Colorado River DevCo and 30% equity interest in EPIC online the Collier central company’s remaining midstream additional 15% interest in Blanco crude line and 15% equity gathering facility (CGF), the assets for $1.6 billion River DevCo th interest in EPIC Y-Grade line 5 CGF supporting NBL’s §NBLX now controls 100% of Blanco §$270 million in proceeds to NBL §Total cash contribution Permian Basin development River, Green River and San Juan River §$143 million NBLX equity expected to be $330 million to §Brings total Permian Basin DevCos, East Pony Gas Complex, and offering $350 million for the EPIC Crude oil and gas gathering the Clayton Williams Pipeline in the line $165 million to $180 capacity to 115 Mboe/d Delaware Basin million for the EPIC Y-Grade line 22 w ww ww w..n nb bllm miid ds st tr re ea am m..c co om m
Non-GAAP Financial Measures This presentation includes EBITDA, Adjusted EBITDA, Distributable Cash Flow, Distribution Coverage Ratio, Annualized Leverage Ratio and ROACE, all of which are non-GAAP measures which may be used periodically by management when discussing our financial results with investors and analysts. We now define Adjusted EBITDA as net income before income taxes, net interest expense, depreciation and amortization, transaction expenses, unit-based compensation and certain other items that we do no view as indicative of our ongoing performance. Additionally, Adjusted EBITDA reflects the adjusted earnings impact of our unconsolidated investments by adjusting our equity earnings or losses from our unconsolidated investments to reflect our proportionate share of their EBITDA. Prior period Adjusted EBITDA has been reclassified to conform to the current period presentation. Adjusted EBITDA is used as a supplemental financial measure by management and by external users of our financial statements, such as investors, industry analysts, lenders and ratings agencies, to assess: • our operating performance as compared to those of other companies in the midstream energy industry, without regard to financing methods, historical cost basis or capital structure; • the ability of our assets to generate sufficient cash flow to make distributions to our partners; • our ability to incur and service debt and fund capital expenditures; • and the viability of acquisitions and other capital expenditure projects and the returns on investment of various investment opportunities. We now define Distributable Cash Flow as Adjusted EBITDA plus distributions received from our unconsolidated investments less our proportionate share of Adjusted EBITDA from unconsolidated investments, estimated maintenance capital expenditures and cash interest paid. Prior period distributable cash flow has been reclassified to conform to the current period presentation. Distributable Cash Flow is used by management to evaluate our overall performance. Our partnership agreement requires us to distribute all available cash on a quarterly basis, and Distributable Cash Flow is one of the factors used by the board of directors of our general partner to help determine the amount of available cash that is available to our unitholders for a given period. We define Distribution Coverage Ratio as Distributable Cash Flow divided by total distributions declared. The Distribution Coverage Ratio is used by management to illustrate our ability to make our distributions each quarter. We define free cash flow at the upstream level as GAAP cash flow from operations less consolidated capital investments. We define ROACE as earnings before interest and taxes divided by (average total assets – average current liabilities). ROACE is used by management to measure the efficiency of the utilization of the capital that we employ. We define Annualized Leverage Ratio as total debt divided by quarterly adjusted EBITDA attributable to the Partnership, annualized for four quarters. Annualized Leverage Ratio is used by management to assess our ability to incur and service debt and fund capital expenditures. We believe that the presentation of Adjusted EBITDA, Distributable Cash Flow, Distribution Coverage Ratio, Annualized Leverage Ratio and ROACE provide information useful to investors in assessing our financial condition and results of operations. The GAAP measure most directly comparable to Adjusted EBITDA, Distributable Cash Flow, Distribution Coverage Ratio, Annualized Leverage Ratio and ROACE is Net Income. Adjusted EBITDA, Distributable Cash Flow, Distribution Coverage Ratio, Annualized Leverage Ratio and ROACE should not be considered alternatives to net income or any other measure of financial performance or liquidity presented in accordance with GAAP. Adjusted EBITDA, Distributable Cash Flow, Distribution Coverage Ratio, Annualized Leverage Ratio and ROACE exclude some, but not all, items that affect net income, and these measures may vary from those of other companies. As a result, Adjusted EBITDA, Distributable Cash Flow, Distribution Coverage Ratio, Annualized Leverage Ratio and ROACE as presented herein may not be comparable to similarly titled measures of other companies. Noble Midstream does not provide guidance on the reconciling items between forecasted Net Income, forecasted Adjusted EBITDA, forecasted Distributable Cash Flow and forecasted Distribution Coverage Ratio due to the uncertainty regarding timing and estimates of these items. Noble Midstream provides a range for the forecasts of Net Income, Adjusted EBITDA, Distributable Cash Flow and Distribution Coverage Ratio to allow for the variability in timing and uncertainty of estimates of reconciling items between forecasted Net Income, forecasted Adjusted EBITDA, forecasted Distributable Cash Flow and forecasted Distribution Coverage Ratio. Therefore, the Partnership cannot reconcile forecasted Net Income to forecasted Adjusted EBITDA, forecasted Distributable Cash Flow or forecasted Distribution Coverage Ratio without unreasonable effort. In addition to Net Income, the GAAP measure most directly comparable to Adjusted EBITDA and Distributable Cash Flow is net cash provided by operating activities. Adjusted EBITDA and Distributable Cash Flow should not be considered alternatives to net income, net cash provided by operating activities or any other measure of financial performance or liquidity presented in accordance with GAAP. Due to the forward- looking nature of net cash provided by operating activities, management cannot reliably predict certain of the necessary components of the most directly comparable forward-looking GAAP measures, such as future impairments and future changes in working capital. Accordingly, Noble Midstream is unable to present a quantitative reconciliation of the aforementioned forward-looking non-GAAP financial measures to net cash provided by operating activities. Amounts excluded from these non-GAAP measures in future periods could be significant. 23 w ww ww w..n nb bllm miid ds st tr re ea am m..c co om mNon-GAAP Financial Measures This presentation includes EBITDA, Adjusted EBITDA, Distributable Cash Flow, Distribution Coverage Ratio, Annualized Leverage Ratio and ROACE, all of which are non-GAAP measures which may be used periodically by management when discussing our financial results with investors and analysts. We now define Adjusted EBITDA as net income before income taxes, net interest expense, depreciation and amortization, transaction expenses, unit-based compensation and certain other items that we do no view as indicative of our ongoing performance. Additionally, Adjusted EBITDA reflects the adjusted earnings impact of our unconsolidated investments by adjusting our equity earnings or losses from our unconsolidated investments to reflect our proportionate share of their EBITDA. Prior period Adjusted EBITDA has been reclassified to conform to the current period presentation. Adjusted EBITDA is used as a supplemental financial measure by management and by external users of our financial statements, such as investors, industry analysts, lenders and ratings agencies, to assess: • our operating performance as compared to those of other companies in the midstream energy industry, without regard to financing methods, historical cost basis or capital structure; • the ability of our assets to generate sufficient cash flow to make distributions to our partners; • our ability to incur and service debt and fund capital expenditures; • and the viability of acquisitions and other capital expenditure projects and the returns on investment of various investment opportunities. We now define Distributable Cash Flow as Adjusted EBITDA plus distributions received from our unconsolidated investments less our proportionate share of Adjusted EBITDA from unconsolidated investments, estimated maintenance capital expenditures and cash interest paid. Prior period distributable cash flow has been reclassified to conform to the current period presentation. Distributable Cash Flow is used by management to evaluate our overall performance. Our partnership agreement requires us to distribute all available cash on a quarterly basis, and Distributable Cash Flow is one of the factors used by the board of directors of our general partner to help determine the amount of available cash that is available to our unitholders for a given period. We define Distribution Coverage Ratio as Distributable Cash Flow divided by total distributions declared. The Distribution Coverage Ratio is used by management to illustrate our ability to make our distributions each quarter. We define free cash flow at the upstream level as GAAP cash flow from operations less consolidated capital investments. We define ROACE as earnings before interest and taxes divided by (average total assets – average current liabilities). ROACE is used by management to measure the efficiency of the utilization of the capital that we employ. We define Annualized Leverage Ratio as total debt divided by quarterly adjusted EBITDA attributable to the Partnership, annualized for four quarters. Annualized Leverage Ratio is used by management to assess our ability to incur and service debt and fund capital expenditures. We believe that the presentation of Adjusted EBITDA, Distributable Cash Flow, Distribution Coverage Ratio, Annualized Leverage Ratio and ROACE provide information useful to investors in assessing our financial condition and results of operations. The GAAP measure most directly comparable to Adjusted EBITDA, Distributable Cash Flow, Distribution Coverage Ratio, Annualized Leverage Ratio and ROACE is Net Income. Adjusted EBITDA, Distributable Cash Flow, Distribution Coverage Ratio, Annualized Leverage Ratio and ROACE should not be considered alternatives to net income or any other measure of financial performance or liquidity presented in accordance with GAAP. Adjusted EBITDA, Distributable Cash Flow, Distribution Coverage Ratio, Annualized Leverage Ratio and ROACE exclude some, but not all, items that affect net income, and these measures may vary from those of other companies. As a result, Adjusted EBITDA, Distributable Cash Flow, Distribution Coverage Ratio, Annualized Leverage Ratio and ROACE as presented herein may not be comparable to similarly titled measures of other companies. Noble Midstream does not provide guidance on the reconciling items between forecasted Net Income, forecasted Adjusted EBITDA, forecasted Distributable Cash Flow and forecasted Distribution Coverage Ratio due to the uncertainty regarding timing and estimates of these items. Noble Midstream provides a range for the forecasts of Net Income, Adjusted EBITDA, Distributable Cash Flow and Distribution Coverage Ratio to allow for the variability in timing and uncertainty of estimates of reconciling items between forecasted Net Income, forecasted Adjusted EBITDA, forecasted Distributable Cash Flow and forecasted Distribution Coverage Ratio. Therefore, the Partnership cannot reconcile forecasted Net Income to forecasted Adjusted EBITDA, forecasted Distributable Cash Flow or forecasted Distribution Coverage Ratio without unreasonable effort. In addition to Net Income, the GAAP measure most directly comparable to Adjusted EBITDA and Distributable Cash Flow is net cash provided by operating activities. Adjusted EBITDA and Distributable Cash Flow should not be considered alternatives to net income, net cash provided by operating activities or any other measure of financial performance or liquidity presented in accordance with GAAP. Due to the forward- looking nature of net cash provided by operating activities, management cannot reliably predict certain of the necessary components of the most directly comparable forward-looking GAAP measures, such as future impairments and future changes in working capital. Accordingly, Noble Midstream is unable to present a quantitative reconciliation of the aforementioned forward-looking non-GAAP financial measures to net cash provided by operating activities. Amounts excluded from these non-GAAP measures in future periods could be significant. 23 w ww ww w..n nb bllm miid ds st tr re ea am m..c co om m
Contact Information Tom Christensen 1001 Noble Energy Way Chief Financial Officer Houston, TX 77070 tom.christensen@nblmidstream.com 832.639.7524 w ww ww w..n nb bllm miid ds st tr re ea am m..c co om mContact Information Tom Christensen 1001 Noble Energy Way Chief Financial Officer Houston, TX 77070 tom.christensen@nblmidstream.com 832.639.7524 w ww ww w..n nb bllm miid ds st tr re ea am m..c co om m