UNITED STATES
SECURITIES AND EXCHANGE COMMISSION
Washington, D.C. 20549
______________________________________________________________
FORM 10-K
______________________________________________________________
(Mark One)
☒ ANNUAL REPORT PURSUANT TO SECTION 13 OR 15(d) OF THE SECURITIES EXCHANGE ACT OF 1934
For the fiscal year ended December 31, 2024
OR
☐ TRANSITION REPORT PURSUANT TO SECTION 13 OR 15(d) OF THE SECURITIES EXCHANGE ACT OF 1934
For the transition period from ________ to ________
Commission File Number 001-37875
_____________________________________________________________
FB FINANCIAL CORPORATION
(Exact name of registrant as specified in its charter)
______________________________________________________________
| | | | | |
| Tennessee | 62-1216058 |
(State or other jurisdiction of
incorporation or organization) | (I.R.S. Employer
Identification No.) |
1221 Broadway, Suite 1300
Nashville, Tennessee | 37203 |
| (Address of principal executive offices) | (Zip Code) |
Registrant’s telephone number, including area code: (615) 564-1212
___________________________________________________________
Securities registered pursuant to Section 12(b) of the Act:
| | | | | | | | | | | | | | | | | |
| Title of each class | | Trading Symbol(s) | | Name of each exchange on which registered | |
| Common Stock, Par Value $1.00 Per Share | | FBK | | New York Stock Exchange | |
Securities registered pursuant to Section 12(g) of the Act: None
Indicate by check mark if the registrant is a well-known seasoned issuer as defined in Rule 405 of the Securities Act. Yes ☐ No ☒
Indicate by check mark if the registrant is not required to file reports pursuant to Section 13 or Section 15(d) of the Act. Yes ☐ No ☒
Indicate by check mark whether the registrant (1) has filed all reports required to be filed by Section 13 or 15(d) of the Securities Exchange Act of 1934 during the preceding 12 months (or for such shorter period that the registrant was required to file such reports), and (2) has been subject to such filing requirements for the past 90 days. Yes ☒ No ☐
Indicate by check mark whether the registrant has submitted electronically every Interactive Data File required to be submitted pursuant to Rule 405 of Regulation S-T (§ 232.405 of this chapter) during the preceding 12 months (or for such shorter period that the Registrant was required to submit such files). Yes ☒ No ☐
Indicate by check mark whether the registrant is a large accelerated filer, an accelerated filer, a non-accelerated filer, a smaller reporting company, or an emerging growth company. See the definitions of “large accelerated filer,” “accelerated filer,” “smaller reporting company,” and “emerging growth company” in Rule 12b-2 of the Exchange Act.
| | | | | | | | | | | | | | | | | | | | | | | |
| Large accelerated filer | | ☒ | | | Accelerated filer | | ☐ |
| Non-accelerated filer | | ☐ | | | Small reporting company | | ☐ |
| Emerging growth company | | ☐ | | | | | |
If an emerging growth company, indicate by check mark if the registrant has elected not to use the extended transition period for complying with any new or revised financial accounting standards provided pursuant to Section 13(a) of the Exchange Act. ☐ Indicate by check mark whether the registrant has filed a report on and attestation to its management’s assessment of the effectiveness of its internal control over financial reporting
under Section 404(b) of the Sarbanes-Oxley Act (15 U.S.C. 7262(b)) by the registered public accounting firm that prepared or issued its audit report. ☒
If securities are registered pursuant to Section 12(b) of the Act, indicate by check mark whether the financial statements of the registrant included in the filing reflect the correction of an error to previously issued financial statements. ☐
Indicate by check mark whether any of those error corrections are restatements that required a recovery analysis of incentive-based compensation received by any of the registrant’s executive officers during the relevant recovery period pursuant to §240.10D-1(b). ☐
Indicate by check mark whether the registrant is a shell company (as defined in Rule 12b-2 of the Exchange Act). Yes ☐ No ☒
As of June 30, 2024, the last business day of the registrant's most recently completed second fiscal quarter, the aggregate market value of the registrant's common stock held by non-affiliates of the registrant was 1,363,325,628, based on the closing sale price of $39.03 per share as reported on the New York Stock Exchange.
The number of shares of registrant’s Common Stock outstanding as of February 11, 2025 was 46,678,175.
Portions of the registrant’s Definitive Proxy Statement relating to the registrant's 2024 Annual Meeting of Shareholders, which will be filed within 120 days after December 31, 2024, are incorporated by reference into Part III of this Annual Report on Form 10-K.
Table of Contents
| | | | | | | | |
| | | Page |
|
| | | |
| Item 1. | | |
| Item 1A. | | |
| Item 1B. | | |
| Item 1C. | | |
| Item 2. | | |
| Item 3. | | |
| Item 4. | | |
| | | |
|
| | | |
| Item 5. | | |
| Item 6. | | |
| Item 7. | | |
| Item 7A. | | |
| Item 8. | | |
| Item 9. | | |
| Item 9A. | | |
| Item 9B. | | |
| Item 9C. | | |
| | |
|
| | |
| Item 10. | | |
| Item 11. | | |
| Item 12. | | |
| Item 13. | | |
| Item 14. | | |
| | |
| |
| | |
| Item 15. | | |
| Item 16. | | |
| |
GLOSSARY OF ABBREVIATIONS AND ACRONYMS
As used in this Annual Report on Form 10-K for the years ended December 31, 2024, 2023, and 2022 (this “Report”), references to “we,” “our,” “us,” “FB Financial,” or “the Company” refer to FB Financial Corporation, a Tennessee corporation, and our wholly-owned banking subsidiary, FirstBank, a Tennessee state-chartered bank, unless otherwise indicated or the context otherwise requires. References to “Bank” or “FirstBank” refer to FirstBank, our wholly-owned banking subsidiary.
The acronyms and abbreviations identified below are used in the Notes to the consolidated financial statements as well as in the Management’s discussion and analysis of financial condition and results of operations. You may find it helpful to refer to this page as you read this Report.
| | | | | | | | | | | | | | |
| ACL | Allowance for credit losses | | FDIA | Federal Deposit Insurance Act |
| AFS | Available-for-sale | | FDIC | Federal Deposit Insurance Corporation |
| AI | Artificial intelligence | | FDM | Financial difficulty modification |
| ALCO | Asset Liability Management Committee | | Federal Reserve | Board of Governors of the Federal Reserve System |
| AOCI | Accumulated other comprehensive income | | FHLB | Federal Home Loan Bank |
| ASC | Accounting Standard Codification | | FRA | Federal Reserve Act |
| ASU | Accounting Standard Update | | GAAP | U.S. generally accepted accounting principles |
| Bank | FirstBank, subsidiary bank | | GDP | Gross domestic product |
| BHCA | Bank Holding Company Act | | GLBA | Gramm-Leach-Bliley Act |
| Board of Directors | FB Financial Corporation's board of directors | | GNMA | Government National Mortgage Association |
| BOLI | Bank-owned life insurance | | HFI | Held for investment |
| BSA | Bank Secrecy Act | | HFS | Held for sale |
| BTFP | Bank Term Funding Program | | MBS | Mortgage‑backed securities |
| CD | Certificate of Deposit | | MSA | Metropolitan statistical areas |
| CECL | Current expected credit losses | | MSR | Mortgage servicing rights |
| CET1 | Common Equity Tier 1 | | NIM | Net interest margin |
| CFPB | Consumer Financial Protection Bureau | | NYSE | New York Stock Exchange |
| CIBCA | Change in Bank Control Act | | OREO | Other real estate owned |
| CISO | Chief Information Security Officer | | PCAOB | Public Company Accounting Oversight Board |
| Company | FB Financial Corporation | | PCD | Purchased credit deteriorated |
| COSO | Committee of Sponsoring Organizations of the Treadway Commission | | PSU | Performance-based restricted stock units |
| CPR | Conditional prepayment rate | | Report | Form 10-K for the year ended December 31, 2024 |
| CRA | Community Reinvestment Act | | ROAA | Return on average assets |
| CRE | Commercial real estate | | ROAE | Return on average common equity |
| DIF | Deposit Insurance Fund | | RSU | Restricted stock units |
| Dodd-Frank Act | Dodd-Frank Wall Street Reform and Consumer Protection Act of 2010 | | SEC | U.S. Securities and Exchange Commission |
| EPS | Earnings per share | | SOFR | Secured overnight financing rate |
| ESPP | Employee Stock Purchase Plan | | TDFI | Tennessee Department of Financial Institutions |
| EVE | Economic value of equity | | U.S. | United States of America |
| FASB | Financial Accounting Standards Board | | | |
| | | | |
| | | | |
| | | | |
| | | | |
| | | | |
| | | | |
| | | | |
| | | | |
| | | | |
| | | | |
Cautionary note regarding forward-looking statements
This Annual Report contains certain forward-looking statements that are not historical in nature and may be considered forward-looking statements within the meaning of the Private Securities Litigation Reform Act of 1995. These forward-looking statements include, without limitation, statements regarding the Company’s future plans, results, strategies, and expectations, including but not limited to expectations around changing economic markets. These statements can generally be identified by the use of the words and phrases “may,” “will,” “should,” “could,” “would,” “goal,” “plan,” “potential,” “estimate,” “project,” “believe,” “intend,” “anticipate,” “expect,” “target,” “aim,” “predict,” “continue,” “seek,” “forecasts” “likely,” “future,” “strategy” and other variations of such words and phrases and similar expressions. These forward-looking statements are not historical facts, and are based upon management's current expectations, estimates, and projections, many of which, by their nature, are inherently uncertain and beyond the Company’s control. The inclusion of these forward-looking statements should not be regarded as a representation by the Company or any other person that such expectations, estimates, and projections will be achieved. Accordingly, the Company cautions shareholders and investors that any such forward-looking statements are not guarantees of future performance and are subject to risks, assumptions, and uncertainties that are difficult to predict. Actual outcomes and results may prove to be materially different from the outcomes and results expressed or implied by the forward-looking statements.
A number of factors could cause actual results to differ materially from those contemplated by the forward-looking statements including, without limitation, (1) current and future economic conditions, including the effects of inflation, interest rate fluctuations, changes in the economy or global supply chain, supply-demand imbalances affecting local real estate prices, and high unemployment rates in the local or regional economies in which the Company operates and/or the US economy generally, (2) changes or the lack of changes in government interest rate policies and the associated impact on the Company’s business, net interest margin, and mortgage operations, (3) increased competition for deposits, (4) changes in the quality or composition of the Company’s loan or investment portfolios, including adverse developments in borrower industries or in the repayment ability of individual borrowers or issuers of investment securities, or the impact of interest rates on the value of our investment securities portfolio, (5) any deterioration in commercial real estate market fundamentals, (6) the Company’s ability to identify potential candidates for, consummate, and achieve synergies from, potential future acquisitions, (7) the Company’s ability to manage any unexpected outflows of uninsured deposits and avoid selling investment securities or other assets at an unfavorable time or at a loss, (8) the Company’s ability to successfully execute its various business strategies, (9) changes in state and federal legislation, regulations or policies applicable to banks and other financial service providers, including legislative developments, (10) the effectiveness of the Company’s controls and procedures to detect, prevent, mitigate and otherwise manage the risk of fraud or misconduct by internal or external parties, including attempted physical-security and cybersecurity attacks, denial-of-service attacks, hacking, phishing, social-engineering attacks, malware intrusion, data-corruption attempts, system breaches, identity theft, ransomware attacks, environmental conditions, and intentional acts of destruction, (11) the Company’s dependence on information technology systems of third party service providers and the risk of systems failures, interruptions, or breaches of security, and (12) the impact, extent and timing of technological changes, (13) concentrations of credit or deposit exposure, (14) the impact of natural disasters, pandemics, acts of war or terrorism, or other catastrophic events, (15) events giving rise to international or regional political instability, including the broader impacts of such events on financial markets and/or global macroeconomic environments, and/or (16) general competitive, economic, political, and market conditions.
The foregoing factors should not be construed as exhaustive and should be read in conjunction with the sections entitled “Risk Factors” and “Management’s Discussion and Analysis of Financial Condition and Results of Operations” included in this Annual Report; and in any of the Company’s subsequent Securities and Exchange Commission Filings. Many of these factors are beyond the Company’s ability to control or predict. If one or more events related to these or other risks or uncertainties materialize, or if the underlying assumptions prove to be incorrect, actual results may differ materially from the forward-looking statements. Accordingly, shareholders and investors should not place undue reliance on any such forward-looking statements. Any forward-looking statement speaks only as of the date of this Annual Report, and the Company undertakes no obligation to publicly update or review any forward-looking statement, whether as a result of new information, future developments or otherwise, except as required by law. New risks and uncertainties may emerge from time to time, and it is not possible for the Company to predict their occurrence or how they will affect the Company. The Company qualifies all forward-looking statements by these cautionary statements.
PART I
ITEM - 1. Business
In this Annual Report, the terms “we,” “our,” “ours,” “us,” “FB Financial,” and “the Company” refer to FB Financial Corporation, a Tennessee corporation, and our wholly-owned subsidiaries, including our state-chartered consolidated banking subsidiary, “FirstBank” or “the Bank,” unless the context indicates that we refer only to the parent company, FB Financial Corporation.
Overview
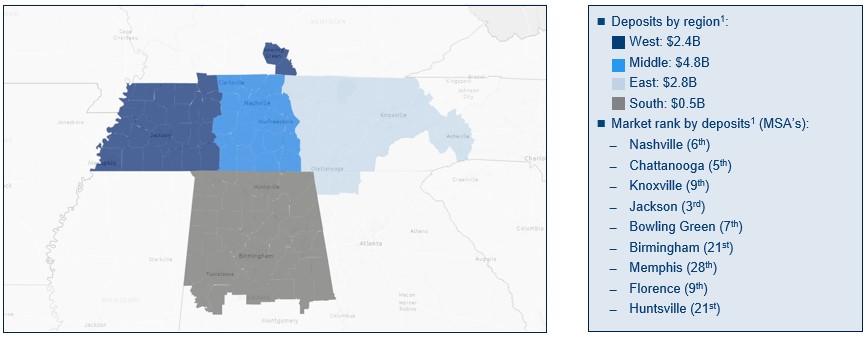
FB Financial Corporation is a bank holding company designated as a financial holding company. We are headquartered in Nashville, Tennessee. Our wholly-owned bank subsidiary is FirstBank which provides a comprehensive suite of commercial and consumer banking services to clients in select markets primarily in Tennessee, Kentucky, Alabama and North Georgia. As of December 31, 2024, our footprint included 77 full-service bank branches and several other limited service banking, ATM and mortgage loan production locations serving the Tennessee metropolitan markets of Nashville, Chattanooga (including North Georgia), Knoxville, Memphis, and Jackson in addition to the metropolitan markets of Birmingham, Florence and Huntsville, Alabama and Bowling Green, Kentucky. The Bank also operates in 17 community markets. During the year ended December 31, 2024, the Company announced expansions into the Tuscaloosa, Alabama and Asheville, North Carolina markets. Further, the Company also provides mortgage banking services utilizing its bank branch network and mortgage banking offices located throughout the southeastern United States. As of December 31, 2024, we had total assets of $13.16 billion, loans held for investment of $9.60 billion, total deposits of $11.21 billion, and total common shareholders’ equity of $1.57 billion.
Throughout our history, we have maintained a community banking approach of personalized relationship-based service, which is delivered locally through experienced bankers in each market. As we have grown, maintaining this relationship-based approach utilizing local, talented and experienced bankers in each market has been an integral component of our success. Our bankers utilize their local knowledge and relationships to deliver timely solutions to our clients. We empower these bankers by giving them local decision making authority supplemented by appropriate risk management. In our experience, business owners and operators prefer to deal with decision makers, and our banking model is built to place the decision maker as close to the client as possible. We have designed our operations, technology, and centralized risk oversight processes to specifically support our operating model. We deploy this operating model universally in each of our markets, regardless of size. We believe we have a competitive advantage in our markets versus both smaller community banks and larger regional and national banks. Our robust offering of products, services and capabilities differentiate us from community banks, and our significant local market knowledge, client service level and the speed with which we are able to make decisions and deliver our services to customers differentiate us from larger regional and national banks.
We seek to leverage our operating model by focusing on profitable growth opportunities across our footprint, both in high-growth metropolitan markets and in stable community markets. As a result, we are able to strategically deploy our capital across our markets to take advantage of those opportunities that we believe provide the greatest certainty of profitable growth and highest returns.
Our history
Originally chartered in 1906, we are one of the longest continually operating banks in Tennessee. While our deep community roots go back over 100 years, our growth trajectory changed in 1984 when an experienced banker and entrepreneur partnered to acquire Farmers State Bank with a focus on growing the Bank. In 1988, Farmers State Bank purchased the assets of First National Bank of Lexington, Tennessee and changed the name to FirstBank, forming the foundation of our current franchise. In 1990, James W. Ayers became FirstBank's sole shareholder and remained the sole shareholder until our initial public offering in September 2016. The Bank grew from a community bank with only $14 million in assets in 1984 to total assets of $13.16 billion at December 31, 2024.
From 1984 to 2001, we operated as a community bank growing organically and through small acquisitions in community markets in West Tennessee. In 2001, our strategy evolved from serving purely community markets to include a modest presence in metropolitan markets, expanding our reach and enhancing our growth. We entered Nashville and Memphis in 2001 by opening a branch in each of those markets. In 2004 and 2008, we opened our first branches in Knoxville and Chattanooga, respectively. Although we experienced some growth in each metropolitan market, those markets did not become a significant strategic focus until we implemented our current strategy in the Nashville metropolitan statistical area in 2012. The successful implementation of this strategy, along with strategic acquisitions, resulted in growing Nashville into our largest market with 41.5% of our total deposits as of June 30, 2024. Additionally, we expanded into the Huntsville, Alabama MSA in 2014 by opening a branch in Huntsville and loan production office in Florence, Alabama, which was converted to a full-service branch in 2019. During 2020, we expanded into the Bowling Green, Kentucky MSA with our
acquisition of FNB Financial Corp. in addition to increasing our Nashville MSA market share through our acquisition of Franklin Financial Network, Inc. During 2021, we expanded our banking division into Central Alabama with hiring of additional experienced senior bankers in Birmingham. During 2024, we continued to augment our growth into Central Alabama by announcing expansion into the Tuscaloosa market, as well as entering into the Asheville, North Carolina market. As a result of this evolution and focus on continuous organic growth, we operate a balanced business model that serves a diverse customer base in both metropolitan and community markets.
Our markets
Our market footprint is the southeastern United States, centered around Tennessee, and includes portions of Alabama, North Georgia and Kentucky. Recently, we announced expansion into the Asheville, North Carolina market.
| | | | | | | | | | | | | | | | | | | | | | | | | | | | | | | | | | | | | | |
Top Metropolitan Markets(2) | | Top Community Markets(2) |
| Market | Market Rank | Branches (#) | Deposits ($mm) | Deposit Market Share | Percent of Total Deposits | | Market | Market Rank | Branches (#) | Deposits ($mm) | Deposit Market Share | Percent of Total Deposits |
| Nashville | 6 | | 23 | | 4,346 | | 4.7 | % | 41.5 | % | | Lexington | 1 | | 5 | | 407 | | 50.4 | % | 3.9 | % |
| Chattanooga | 5 | | 7 | | 971 | | 6.4 | % | 9.3 | % | | Dalton | 5 | | 2 | | 278 | | 8.4 | % | 2.7 | % |
| Knoxville | 9 | | 5 | | 777 | | 3.1 | % | 7.4 | % | | Tullahoma | 2 | | 3 | | 252 | | 15.7 | % | 2.4 | % |
| Jackson | 3 | | 6 | | 540 | | 12.3 | % | 5.2 | % | | Morristown | 5 | | 2 | | 217 | | 9.6 | % | 2.1 | % |
| Birmingham | 21 | | 3 | | 330 | | 0.7 | % | 3.2 | % | | Cookeville | 11 | | 1 | | 215 | | 4.7 | % | 2.1 | % |
| Bowling Green | 7 | | 5 | | 278 | | 6.0 | % | 2.7 | % | | Crossville | 5 | | 1 | | 186 | | 11.0 | % | 1.8 | % |
| Memphis | 28 | | 3 | | 277 | | 0.7 | % | 2.6 | % | | Paris | 3 | | 2 | | 170 | | 13.9 | % | 1.6 | % |
| Florence | 9 | | 1 | | 109 | | 2.8 | % | 1.0 | % | | Huntingdon | 2 | | 5 | | 164 | | 23.0 | % | 1.6 | % |
| Huntsville | 21 | | 2 | | 86 | | 0.8 | % | 0.8 | % | | Decatur | 1 | | 1 | | 150 | | 37.4 | % | 1.4 | % |
| | | | | | | |
(1)Source: SNL Financial. Market data is as of June 30, 2024 and is presented on a pro forma basis for announced acquisitions since June 30, 2024.
(2)Source: Company data and S&P Global Market Intelligence
Market characteristics and mix.
Metropolitan markets. Our metropolitan markets are generally characterized by attractive demographics and strong economies and offer substantial opportunity for future growth. We compete in these markets with national and regional banks that currently have the largest market share positions and with community banks primarily focused only on a particular geographic area or business niche. We believe we are well positioned to grow our market penetration among our target clients of small to medium sized businesses as well as large corporate businesses and the consumer base working and living in these metropolitan markets. In our experience, such clients demand the product sophistication of a larger bank, but prefer the customer service, relationship focus and local connectivity of a community bank. We believe that our size, product suite and operating model offer us a competitive advantage in these markets versus our smaller competitors, many of which are focused only on specific counties or industries. Our operating model driven by local talent with strong community ties and local authority serves as a key competitive advantage over our larger competitors. We believe that, as a result, we are well positioned to leverage our existing franchise to expand our market share in our markets.
Community markets. Our community markets tend to be more stable throughout various economic cycles, with primarily retail and small business customer opportunities and more limited competition. We believe this leads to an attractive profitability profile and more granular loan and deposit portfolios. Our community markets are standalone markets and not suburbs of larger markets. We primarily compete in these markets with community banks that generally have less than $1 billion in total assets. Our strategy is to compete against these smaller community banks by providing a broader and more sophisticated set of products and capabilities while still maintaining our local service model. We believe these markets are being deemphasized by national and regional banks which provides us with opportunities to hire talented bankers and maintain or grow market share in these community markets.
Our core client profile across our footprint includes retail and wealth consumers, small businesses, and corporate clients and owners. We target business clients with substantial operating history. Our typical business client would keep business deposit accounts with us, and we would look to provide banking services to the owners and employees of the business as well. We also have an active consumer lending business that includes deposit products, mortgages, home equity lines and small consumer finance loans. We continuously strive to build deeper relationships by actively advising clients and offering products that meet their banking needs.
The following tables show our deposit market share ranking among banks in Tennessee as of June 30, 2024 (the most recent date that such information is publicly available). Of the 10 largest banks in the state based on total deposits, 6 are national or regional banks, which we believe provides us with significant opportunities to gain market share from these banks.
Top 10 banks in Tennessee: | | | | | | | | | | | | | | | | | | | | | | | | | | | | | | | | |
| Rank | | Company name | | Headquarters | | Branches
(#) | | Total
deposits
($bn) | | Deposit
market
share
(%) |
| 1 | | First Horizon Corporation (TN) | | Memphis, TN | | 136 | | | 30.1 | | | 13.5 | |
| 2 | | Pinnacle Financial Partners (TN) | | Nashville, TN | | 57 | | | 27.7 | | | 12.4 | |
| 3 | | Regions Financial Corporation (AL) | | Birmingham, AL | | 194 | | | 23.3 | | | 10.5 | |
| 4 | | Bank of America Corporation (NC) | | Charlotte, NC | | 58 | | | 16.9 | | | 7.6 | |
| 5 | | Truist Financial Corporation (NC) | | Charlotte, NC | | 98 | | | 16.0 | | | 7.2 | |
| 6 | | FB Financial Corporation (TN) | | Nashville, TN | | 71 | | | 9.0 | | | 4.1 | |
| 7 | | U.S. Bancorp (MN) | | Minneapolis, MN | | 59 | | | 5.4 | | | 2.4 | |
| 8 | | Wilson Bank Holding Company (TN) | | Lebanon, TN | | 32 | | | 4.6 | | | 2.0 | |
| 9 | | Fifth Third Bancorp (OH) | | Cincinnati, OH | | 40 | | | 3.8 | | | 1.7 | |
| 10 | | Simmons First National Corporation (AR) | | Pine Bluff, AR | | 46 | | | 3.6 | | | 1.6 | |
Source: S&P Global Market Intelligence and Company reports as of June 30, 2024 adjusted for pending and completed acquisitions as of June 30, 2024. Our business strategy
Our overall business strategy is comprised of the following core priorities.
Enhance market penetration in our markets. In recent years, we have successfully grown our franchise across our footprint by executing our community bank growth strategy. The strategy is centered on the following: recruiting the best bankers and empowering them with local authority; developing branch presence; building brand awareness and growing our business and consumer banking presence; and expanding our product offering and capabilities. These strategies coupled with our personalized, relationship-based client service have contributed significantly to our success. Additionally, we believe that our scale, resources and range of products provides us with a competitive advantage over the smaller community banks in our markets we operate. As a result of these competitive advantages and growth strategies, the Nashville MSA has become our largest market with approximately 41.5% of our deposits and 4.7% market share, based on pro forma deposits as of June 30, 2024. We intend to continue to efficiently increase our market penetration through organic growth and strategic acquisitions.
Based on market and competitive similarities, we believe our growth strategies are transferable to our other metropolitan markets and we have implemented these strategies in additional markets across our footprint. In Knoxville and Chattanooga, we have achieved top 10 deposit market shares through our acquisitions of Northwest Georgia Bank, the Clayton Banks, and the branches from Atlantic Capital Bank and continued organic growth in those markets. In the Memphis, Huntsville and Birmingham MSAs, our banking model has attracted strong leadership teams and we have experienced significant growth in both deposits and loans. Additionally, we have hired experienced leadership teams and started building production teams in Tuscaloosa and Asheville, where we will also be establishing a physical presence.
Pursue opportunistic and strategic acquisitions. We have completed 13 acquisitions in the past 25 years. We pursue acquisitions that enhance market penetration, possess strong core deposits, are accretive to earnings per share while minimizing tangible book value dilution, and meet our internal return targets. We believe that numerous small to mid-
sized banks or branch networks will be available for acquisition throughout our footprint as well as in attractive contiguous markets in the coming years due to industry trends, such as compliance and operational challenges, regulatory pressure, management succession issues and shareholder liquidity needs. In Tennessee alone, there are approximately 104 commercial banks with total assets of less than $5 billion, and in the selected neighboring states of Alabama, Georgia, Kentucky, North Carolina, South Carolina and Virginia, there are over 435 commercial banks with under $5 billion in assets. We believe that we are positioned as a natural consolidator because of our financial strength, reputation and operating model.
Improve efficiency by leveraging technology and scaling operations. We have invested significantly in our personnel, infrastructure and technology in recent years, which we believe has created a scalable platform that will support future growth across all of our markets. Our bankers and branches, especially in the metropolitan markets, continue to scale in size, and we believe there is capacity to grow our business without adding significantly to our branch network. We plan to continue to invest, as needed, in our technology and business infrastructure to support our future growth and increase operating efficiencies.
Develop niche banking and noninterest income opportunities. While our primary focus is on capturing opportunities in our core banking business, we have successfully seized opportunities to grow our noninterest income. Our mortgage platform is focused through a traditional retail delivery channel. Additionally, we have successfully expanded our fee-based business to include more robust treasury management, trust and investment services and capital markets revenue streams. We intend to continue emphasizing these business lines which we believe serve as customer acquisition channels and provide us with a range of cross-selling opportunities, while making our business stronger and more profitable.
Risk management
General
Our operating model demands a strong risk management culture built to address multiple areas of risk, including credit risk, interest rate risk, liquidity risk, price risk, compliance risk, information security/cyber risk, third-party risk, operational risk, strategic risk and reputational risk. Our risk management culture is supported by investments in the right people and technologies to protect our business. Our Board of Directors, through its Risk Committee, is ultimately responsible for overseeing risk management of the Company. We have a Chief Risk Officer who oversees risk management across our business. Our Board, Chief Executive Officer and Chief Risk Officer are supported by the heads of other functional areas at the Bank, including credit, legal, IT, audit, compliance, capital markets, credit review, information security and physical security. Our comprehensive risk management framework is designed to complement our core strategy of empowering our experienced, local bankers with local-decision making to better serve our clients.
Our credit policies support our goal of maintaining sound credit quality standards while achieving balance sheet growth, earnings growth, appropriate liquidity and other key objectives. We maintain a risk management infrastructure that includes local authority, centralized policymaking and a system of checks and balances. The fundamental principles of our credit policy and procedures are to maintain credit quality standards, which enhance our long-term value to our clients, associates, shareholders and communities. Our loan policies provide our bankers with a sufficient degree of flexibility to permit them to deliver responsive and effective lending solutions to our clients while maintaining appropriate credit quality. Furthermore, our bankers and associates are hired for the long-term and they are incented to focus on long-term credit quality. Since lending represents credit risk exposure, the Board of Directors and its duly appointed committees seek to ensure that the Bank maintains appropriate credit quality standards. The Credit Risk Committee of the Board of Directors provides oversight at the Board level, while management oversight committees, including the ACL Committee and Corporate Credit Risk Committee, administer the loan portfolio and monitor credit risk. These committees meet at least quarterly to review the lending activities.
Credit concentration
Diversification of risk is a key factor in prudent asset management. Our granular loan portfolio reflects a balanced mix of consumer and commercial clients across these markets, which we believe inherently mitigates the impact of industry and market cycles. In addition, risk from concentration is actively managed by management and reviewed by the Board of Directors of the Bank, and exposures relating to borrower, industry and commercial real estate categories are tracked and measured against policy limits. These limits are reviewed as part of our periodic review of the credit policy. Loan concentration levels are monitored by the Corporate Credit Risk Committee and reported to the Credit Risk Committee of the Board of Directors.
Loan approval process
The loan approval process at the Bank is characterized by local authority supported by a control environment that provides for prompt and thorough underwriting of loans. Our localized decision making is reinforced through a centralized review process supported by technology that monitors credits to ensure compliance with our credit policies. Our loan
approval method is based on a hierarchy of individual lending authorities for new credits and renewals granted to our individual bankers, market presidents, regional presidents, senior and regional credit officers, senior management and Credit Risk Committee of the Board of Directors. The Corporate Credit Risk Committee, along with senior management, establishes the maximum lending limits at each level and sets individual authorities within these maximum limits to each individual based on demonstrated experience and expertise, and are periodically reviewed and updated. We believe that the ability to have individual loan authority up to specified levels based on experience and track record coupled with appropriate approval limits allows us to provide prompt and appropriate responses to our clients while still allowing for the appropriate level of oversight.
As a relationship-oriented lender, rather than transaction-oriented lender, a majority of our loans HFI are made to borrowers or relationships located or operating in our market area. This provides us with a better understanding of their business, creditworthiness and the economic conditions in their market and industry. Furthermore, our associates are held accountable for their decisions, which effectively aligns their incentives to reflect appropriate management of risk.
In considering loans, we follow the underwriting principles set forth in our credit policy with a primary focus on the following factors:
•A relationship with our clients that provides us with a thorough understanding of their financial condition and ability to repay the loan;
•verification that the primary and secondary sources of repayment are adequate in relation to the amount of the loan;
•adherence to appropriate loan to value guidelines for real estate secured loans;
•targeted levels of diversification for the loan portfolio, both as to type of borrower and type of collateral; and
•proper documentation of loans, including perfected liens on collateral.
As part of the approval process for any given loan, we seek to minimize risk in a variety of ways, including the following:
•analysis of the borrower's and/or guarantor's financial condition, cash flow, liquidity, and leverage;
•assessment of the project's operating history, operating projections, location and condition;
•review of appraisals, title commitment and environmental reports;
•consideration of the management's experience and financial strength of the principals of the borrower; and
•understanding economic trends and industry conditions.
The Corporate Credit Risk Committee reviews and approves any amendments to the credit policy, monitors loan portfolio trends, credit trends, and results of credit reviews. The Credit Risk Committee of the Board of Directors approves loan transactions that exceed management authorized thresholds as set forth in our credit policy. Loan pricing is established in conjunction with the loan approval process based on pricing guidelines for loans that are set by the Bank’s senior management. We believe that our loan approval process provides for thorough internal controls, underwriting, and decision making.
Lending limits
The Bank is limited in the amount it can loan in the aggregate to a single borrower or related borrowers by the amount of our regulatory capital. Tennessee’s legal lending limit is a safety and soundness measure intended to prevent one person or a relatively small and economically related group of persons from borrowing an unduly large amount of bank funds. It is also intended to safeguard a bank’s depositors by diversifying the risk of potential loan losses among a relatively large number of creditworthy borrowers engaged in various types of businesses. Generally, under Tennessee law, loans and extensions of credit to a borrower may not exceed 15% of our bank’s Tier 1 capital, plus an additional 10% of the bank’s Tier 1 capital, with approval of the bank’s board. Further, the Bank may elect to conform to similar standards applicable to national banks under federal law, in lieu of Tennessee law. Because the federal law and Tennessee state law standards are determined as a percentage of the Bank’s capital, these state and federal limits both increase or decrease as the Bank’s capital increases or decreases. Based upon the capitalization of the Bank at December 31, 2024, the Bank’s legal lending limits were approximately $211.6 million (15%) and $352.6 million (25%). The Bank may seek to sell participations in our larger loans to other financial institutions, which will allow us to manage the risk involved in these loans and to meet the lending needs of our clients requiring extensions of credit in excess of these limits.
In addition to these legally imposed lending limits, we also employ appropriate limits on our overall loan portfolio and requirements with respect to certain types of lending and individual lending relationships. For example, we have lending limits related to maximum borrower, industry and certain types of commercial real estate exposures.
Enterprise risk management
We maintain an enterprise risk management program that helps us to identify, manage, monitor and control potential risks that may affect us, including credit risk, interest rate risk, liquidity risk, price risk, compliance risk, operational risk, information security/cyber risk, third-party risk, strategic risk and reputational risk. Our operating model demands a strong risk culture built to address the multiple areas of risk we face, and our risk management strategy is supported by significant investments in the right people and technologies to protect the organization.
Our comprehensive risk management framework and risk identification is a continuous process and occurs at both the transaction level and the portfolio level. While our local bankers and associates support our day-to-day risk practices, management seeks to identify interdependencies and correlations across portfolios and lines of business that may amplify risk exposure through a thorough centralized review process. Risk measurement helps us to control and monitor risk levels and is based on the sophistication of the risk measurement tools used to reflect the complexity and levels of assumed risk. We monitor risks and ensure compliance with our risk policies by timely reviewing risk positions and exceptions. This monitoring process ensures that management’s decisions are implemented for all geographies, products and legal entities with overview by the appropriate committees.
We control risks through limits that are communicated through policies, standards, procedures and processes that define responsibility and authority. Such limits serve as a means to control exposures to the various risks associated with our activities, and are meaningful management tools that can be adjusted if conditions or risk tolerances change. In addition, we maintain a process to authorize exceptions or changes to risk limits when warranted. These risk management practices help to ensure effective reporting, compliance with all laws, rules and regulations, avoid damage to our reputation and related consequences, and attain our strategic goals while avoiding pitfalls and surprises along the way.
The Risk Committee of the Board of Directors approves policies that set operational standards and risk limits. Management is responsible for the implementation, integrity and maintenance of our risk management systems ensuring the directives are implemented and administered in compliance with the approved policy. Our Chief Risk Officer supervises the overall management of our risk management program, reports to the Chief Executive Officer and yet also retains independent access to the Risk Committee of the Board of Directors.
Credit risk management
Credit risk management is a key component of our risk management program. We employ consistent analysis and underwriting to examine credit information and prepare underwriting documentation. We monitor and approve exceptions to our credit policies as required, and we also track and address technical exceptions.
Each relationship manager has the primary responsibility for appropriately risk rating each loan that is made. In addition, our credit administration department is responsible for the ongoing monitoring of loan portfolio performance through the review of ongoing financial reports, credit quality reports, relationship manager reports, audit reviews and exception reporting and concentration analysis. This monitoring process also includes an ongoing review of loan risk ratings. Management and monitoring of our allowance for credit losses is performed by our ACL Committee. We have a Corporate Credit Risk Committee which monitors the integrity of our portfolio within the parameters of the credit policy. We utilize a risk grading system that enables management to differentiate individual loan quality and forecast future profitability and portfolio loss potential. The Credit Risk Committee of the Board of Directors has the authority to approve credit policies and risk limits.
We assign a credit risk rating at the time a commercial loan is made and adjust it as conditions warrant. Portfolio monitoring systems allow management to proactively assess risk and make decisions that will minimize the impact of negative developments. Successful credit management is achieved by lenders consistently meeting with clients and regularly reviewing their financial conditions. This enables both the recognition of future opportunities and potential weaknesses early.
The Board of Directors supports a strong credit review program and is committed to its effectiveness as part of the independent process of assessing our lending activities. We have communicated to our credit and lending staff that the identification of emerging problem loans begins with the lending personnel knowing their clients and supported by credit personnel, actively monitoring their client relationships. The credit review process is meant to augment this active management of client relationships and to provide an independent and broad-based look into our lending activities. We believe that our strong client relationships support our ability to identify potential deterioration of our credits at an early stage enabling us to address these issues early on to minimize potential losses.
We maintain a robust credit review function by utilizing an internal credit review team as well as third-party credit review firms. The results from internal and external credit reviews are reported to the Risk Committee of the Board of Directors to ensure independence and objectivity. The examinations performed by the credit review department are based on risk assessments of individual loan commitments within our loan portfolio over a period of time. At the conclusion of each review, the credit review department provides management with a report that summarizes the results of the review. At a
minimum, the report addresses risk rating accuracy, compliance with regulations and policies, loan documentation accuracy, the timely receipt of financial statements, and any additional material issues.
We monitor the levels of delinquencies for any negative or adverse trends. From time to time, we may modify loans to extend the term or make other concessions to help a borrower with a deteriorating financial condition stay current on their loan and to avoid foreclosure. We generally do not forgive principal or interest on loans or modify the interest rates on loans to rates that are below market rates. We believe that we are well reserved for losses resulting from our non-performing assets.
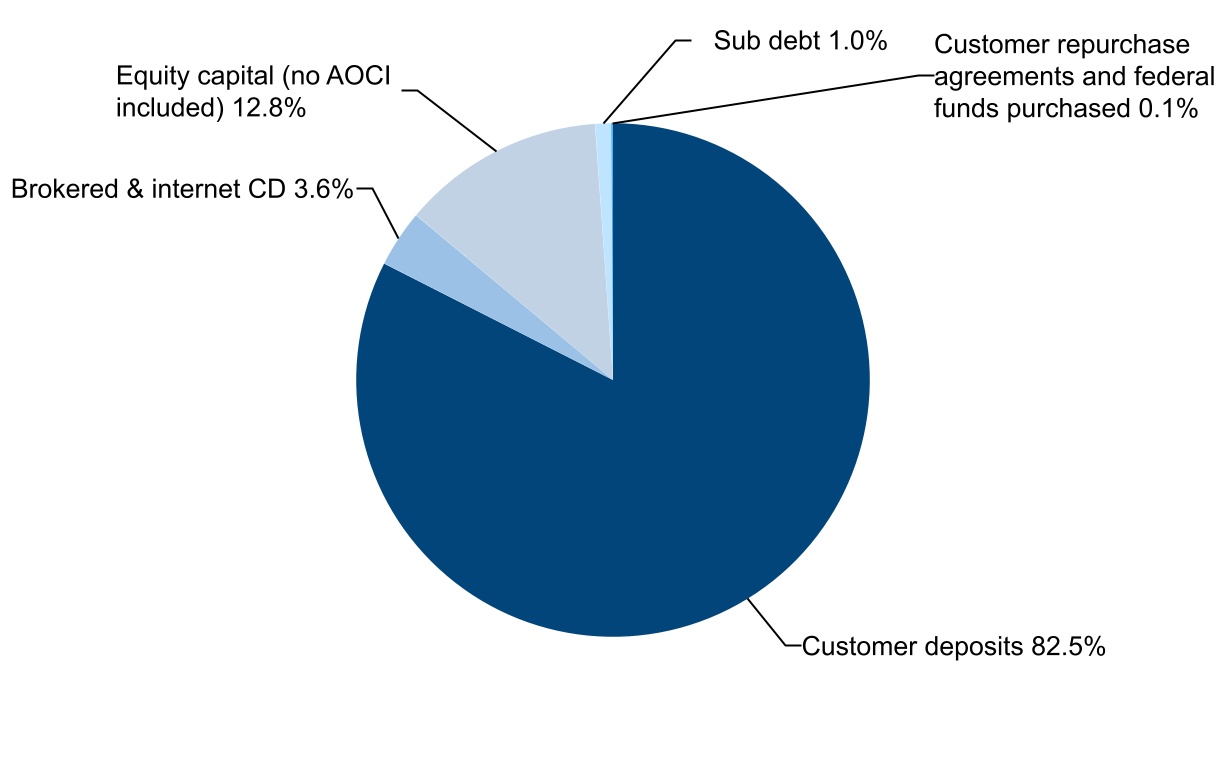
Liquidity and interest rate risk management
Our liquidity planning framework is focused on robust forecasting and risk management to ensure predictable funding needs and availability. We strive to maintain the lowest cost of funding available while maintaining stable sources of liquidity. To achieve these objectives, we utilize a simple funding and capital structure consisting primarily of deposits and common equity. We remain continually focused on growing our noninterest-bearing and other low-cost core deposits while replacing higher cost funding sources, including wholesale time deposits and other borrowed debt, to fund our balance sheet growth. The following chart shows our overall funding structure as of December 31, 2024.
Funding structure as of December 31, 2024
In addition, we monitor our liquidity risk by adopting policies to define potential liquidity problems, reviewing and maintaining an updated contingency funding plan, testing our sources of funds availability at least annually and providing a prudent capital structure consistent with our credit standing and plans for strategic growth.
Our interest rate risk management system is overseen by the Risk Committee of our Board of Directors, who has the authority to approve acceptable rate risk levels. Our Board of Directors has established the Asset Liability Management Committee at the management level to ensure appropriate risk measurement by requiring:
•quarterly testing of interest rate risk exposure;
•proactive liquidity and interest rate risk identification and measurement;
•liquidity forecasting under hypothetical stress scenarios;
•stress testing of key interest rate risk modeling assumptions; and
•quarterly risk presentations by senior management
Cybersecurity
For information on the Company's information security and related risks, refer to “Item 1C. Cybersecurity” and “Item A. Risk factors: Technology and operational risks.”
Competition
We conduct our core banking operations primarily in Tennessee, Alabama, North Georgia, Kentucky, and more recently North Carolina, and compete in the commercial banking industry primarily through our wholly-owned banking subsidiary, FirstBank. The banking industry is highly competitive, and we experience competition in our market areas from many other financial institutions. We compete with commercial banks, credit unions, savings institutions, mortgage banking firms, online mortgage lenders, online deposit banks, digital banking platforms, consumer finance companies, securities brokerage firms, insurance companies, money market funds and other mutual funds, as well as super-regional, national and international financial institutions that operate offices in our market areas and elsewhere. In addition, a number of out-of-state financial intermediaries have opened production offices, or otherwise solicit loans and deposits, in our market areas. Increased competition in our markets may result in the Bank experiencing reduced loans and deposits, as well as reduced net interest margin and profitability. Furthermore, our markets have grown increasingly competitive in recent years with a number of banks entering our markets, with a primary focus on the metropolitan markets. We believe this trend will continue as banks look to gain a foothold in these growing markets. This trend will result in greater competition primarily in our metropolitan markets. However, we firmly believe that our market position and client-focused operating model enhance our ability to attract and retain clients.
See “Our markets” in this section above for a further discussion of the markets we compete in and the competitive landscape in these markets.
Human capital
At the Company, we believe that helping people build a better future starts with investing in our associates, who are the driving force behind our success. Our associates not only deliver trusted solutions to our customers and invest in our communities but also help us achieve superior long-term returns for our shareholders.
As of December 31, 2024, the Company employed 1,490 full-time equivalent associates with an average tenure of 6 years and 5 months. Our associates help us achieve our mission, and we continually invest in their development and well-being.
Our vision
Our vision drives everything we do and informs how we support and empower our associates. It is rooted in providing a great place to work, offering competitive opportunities for growth, and prioritizing the well-being of our people. Our vision is to:
•Deliver trusted solutions to our customers;
•Provide a great place to work for our associates;
•Invest in our communities; and
•Provide superior long-term returns for our shareholders
We also take pride in living by our core values, which guide our actions and decisions every day. These values reflect our commitment to our associates and our shared success:
•One Team, One Bank
•Do the Right Thing
•Commitment to Excellence
•Exist for the Customer
•Treat People with Respect
•Enjoy Life
Culture and associate engagement
In 2024, we were named one of Middle Tennessee’s Top Workplaces by The Tennessean for the tenth consecutive year, a reflection of our commitment to fostering a positive culture as ranked by our own associates.
Additionally, we launched our first all-associate engagement survey, which achieved an impressive 88% overall participation rate. This survey offers valuable insights into the associate experience, serving as a baseline for future
surveys. It will guide our initiatives and support a broader listening strategy to ensure we continue fostering a positive and engaging workplace.
As part of our commitment to giving back, we offer full-time associates 16 hours of paid time off to volunteer in activities that benefit local organizations. In 2024, our associates dedicated over 9,400 hours to making a positive impact in the areas that we operate.
Talent
Our vision of providing a great place to work is reflected in our efforts to recruit, develop, and retain top talent. In 2024, we continued our Management-to-Leadership Development Series, which helps new and emerging leaders transition into leadership roles. Since its inception, 118 associates have successfully graduated from the program, gaining valuable skills and experience. This initiative allows associates to explore career paths, develop leadership abilities, and grow in ways that align with both their personal goals and the Company’s broader objectives.
We also place significant emphasis on succession planning as part of our ongoing effort to build a strong talent pipeline. Our approach focuses on identifying and developing associates throughout the Company who have the potential to grow and take on increased responsibilities in the future. By investing in the development of associates today, we are preparing the organization for tomorrow’s needs, creating a workforce that is well-positioned to drive continued growth and success.
We are committed to fostering an environment where all individuals are respected, valued and supported. We embrace people of all backgrounds and experiences, that supports the unique perspectives and contributions of everyone. We recognize that our strength lies in the richness of these differences, and we actively work to foster a culture that ensures everyone has the opportunity to thrive.
Compensation and benefits
We are committed to attracting and retaining the best talent by offering competitive compensation and benefits. Our goal is to provide associates with the resources they need to succeed both personally and professionally. Along with market-competitive pay, healthcare benefits, equity incentives, and an employee stock purchase plan, we ensure that associates receive comprehensive support for their well-being.
In an environment of rising medical premiums, the Company took proactive steps to mitigate premium increases where possible and contributed on average 70% of the total medical premium cost. We also continue to offer vision insurance at no cost for all associates.
In addition to our healthcare initiatives, we focused on mental health awareness and financial well-being, offering workshops, resources, and guidance to support associates and their families. During Mental Health Awareness Month, we prioritized supporting associates’ mental well-being by providing resources to help manage work-life balance, family responsibilities, and stress. Through these initiatives, we reaffirm our commitment to helping associates bring their best selves to work while supporting them in various aspects of their lives.
Information technology systems
During the year ended December 31, 2024, we advanced our data management and process automation initiatives, aimed at enhancing data utilization and streamlining manual processes. Key efforts included improving customer data management, optimization of account and officer-level profitability, and the development of deeper insights into credit and deposit trends. Additionally, we strengthened our integration with core banking solutions, further enhancing data governance and accessibility through improvements in management reporting, credit risk data and asset liability management.
In 2024, we also undertook a comprehensive assessment and optimization of our technology assets. This included upgrading our network infrastructure to improve network system performance, reliability and connectivity across business operations. We also planned enhancements to our telecommunications infrastructure to further improve communication and collaboration across the organization.
We completed key projects to enhance regulatory compliance, payment processing and digital capabilities. Key technology upgrades included the implementation of AI-based monitoring tools, network infrastructure enhancements and strengthened compliance tracking measures, all of which were designed to support greater operational efficiency and risk management.
Looking forward, we plan to focus on maximizing our existing technology investments while supporting FirstBank Way, our strategic improvement plan. These efforts are intended to enable greater scalability and efficiency while maintaining our strong community banking focus.
Supervision and regulation
The U.S. financial services and banking industries are highly regulated. The bank regulatory framework, involving the supervision, regulation, and examination of the Bank by bank regulatory agencies, is intended primarily for the protection of consumers, bank depositors and the Deposit Insurance Fund of the FDIC, rather than holders of our capital stock.
The following is a general summary of the material aspects of certain statutes and regulations applicable to the Company and the Bank. Federal and state banking laws and regulations affect virtually all of our operations. These summary descriptions are not complete, and you should refer to the full text of the statutes, regulations, and corresponding guidance for more information. The legal and regulatory regime is continually under review by legislatures, regulators and other governmental bodies, and changes regularly occur through the enactment or amendment of laws and regulations or through shifts in policy, implementation or enforcement. Statutes and regulations are subject to change, and additional statutes, regulations, and corresponding guidance may be adopted. We are unable to predict these future changes or the effects, if any, that these changes could have on our business, revenues, and financial results.
Regulation of the Company and the Bank
The Company is subject to regulation and supervision by multiple regulatory bodies. As a bank holding company, we are subject to ongoing regulation, supervision, and examination by the Federal Reserve under the Bank Holding Company Act of 1956, as amended. The Federal Reserve’s jurisdiction also extends to any company that is directly or indirectly controlled by the bank holding company. FB Financial has elected to be treated as a financial holding company, which allows us to engage in a broader range of activities than would otherwise be permissible for a bank holding company, including activities such as securities underwriting, insurance underwriting, and merchant banking. In addition, as discussed in more detail below, the Bank and any of our other subsidiaries that offer consumer financial products and services are subject to regulation and supervision by the CFPB. The Dodd-Frank Act also permits states to adopt consumer protection laws and regulations that may be more strict than those of the CFPB, and state attorneys general are permitted to enforce certain federal consumer financial protection law.
The Bank is a Tennessee state-chartered bank that is not a member of the Federal Reserve System, and is subject to ongoing regulation, supervision, and examination by the FDIC and the Bank's state banking regulator, the Tennessee Department of Financial Institutions. The TDFI and FDIC supervise and regulate all areas of the Bank’s operations including, without limitation, the making of loans, the issuance of securities, the conduct of the Bank’s corporate affairs, the satisfaction of capital adequacy requirements, the payment of dividends, and the establishment or closing of banking offices. The FDIC is the Bank’s primary federal regulatory agency, which regularly examines the Bank’s operations and financial condition and compliance with federal consumer protection laws. In addition, the Bank’s deposit accounts are insured by the FDIC to the maximum extent permitted by law, and the FDIC has certain enforcement powers over the Bank. Various Federal and State consumer laws and regulations apply to the Bank, including state consumer laws and regulations that also affect the operations of the Bank, including state usury laws, consumer credit and equal credit opportunity laws, and fair credit reporting. The Bank and certain of its subsidiaries are also prohibited from engaging in certain tying arrangements in connection with extensions of credit, leases or sales of property, or furnishing products or services.
The Company is also subject to the disclosure and regulatory requirements of the Securities Act and the Exchange Act, both as administered by the SEC. The Company’s common stock is listed on the New York Stock Exchange under the trading symbol “FBK” and, therefore, is subject to the rules of the NYSE for listed companies.
Bank holding company obligations to bank subsidiaries
As a bank holding company, the Company is required to act as a source of financial and managerial strength to its depository institution subsidiaries and to maintain resources adequate to support such subsidiaries. The Federal Reserve may require a bank holding company to make capital injections into a troubled subsidiary bank and may charge the bank holding company with engaging in unsafe and unsound practices for failure to commit resources to such a subsidiary bank. As a result, we could be required to commit resources to support the Bank in situations where additional investments in a bank may not otherwise be warranted. These situations include guaranteeing the compliance of an “undercapitalized” bank with its obligations under a capital restoration plan. As a result of these obligations, a bank holding company may be required to contribute additional capital to its subsidiaries in the form of capital notes or other instruments that qualify as capital under regulatory rules. Any such loan from a holding company to a subsidiary bank is likely to be unsecured and subordinated to the bank's depositors and perhaps to other creditors of the bank. If we were to enter bankruptcy or become subject to the orderly liquidation process established by the Dodd-Frank Act, any commitment by us to a federal bank regulatory agency to maintain the capital of the Bank would be assumed by the bankruptcy trustee or the FDIC, as appropriate, and entitled to a priority of payment.
Acquisitions
The Company is required by the BHCA to obtain the prior approval of the Federal Reserve to acquire substantially all the assets of a bank or to acquire direct or indirect ownership or control of more than 5% of any class of the voting shares of any bank, bank holding company, savings and loan holding company or savings association, or to increase any such non-majority ownership or control of any bank, bank holding company, savings and loan holding company or savings association, or to merge or consolidate with any bank holding company. If the Company is “well capitalized” and “well managed,” as defined under the BHCA and implementing regulations, we may purchase a bank located outside of Tennessee. However, restrictions may be placed on the acquisition of a bank that has only been in existence for a limited amount of time or will result in concentrations of deposits exceeding limits specified by statute. For example, Tennessee law currently prohibits a bank holding company from acquiring control of a Tennessee-based financial institution until the target financial institution has been in operation for at least three years.
Change of control
Federal law restricts the amount of voting stock of a bank holding company or a bank that a person may acquire without the prior approval of banking regulators. Under the Change in Bank Control Act and the regulations thereunder, an individual, company, or group must give advance notice to the Federal Reserve before acquiring control of any bank holding company, such as the Company, or before acquiring control of any FDIC-insured bank, such as the Bank. Acquisition of 25% or more of any class of voting securities constitutes control, and it is generally presumed for purposes of the CIBCA that the acquisition of 10% or more of any class of voting securities would constitute the acquisition of control. Also, under the CIBCA, the shareholdings of individuals and companies that are deemed to be “acting in concert”, whether or not pursuant to an express agreement, would be aggregated for purposes of determining whether such holders “control” a bank or bank holding company. Once notified, the Federal Reserve may approve or disapprove the acquisition. These and other laws make it more difficult to acquire the Company or the Bank than it might be to acquire control of another type of corporation.
Capital requirements
The Company and the Bank are required under federal law to maintain specified minimum levels of capital based on ratios of capital to total assets and to risk-weighted assets. The following minimum capital requirements are applicable to the Company and the Bank:
•a common equity Tier 1 risk-based capital ratio of 4.5%;
•a Tier 1 risk-based capital ratio of 6%;
•a total risk-based capital ratio of 8%;
•a leverage ratio of 4%; and
•a supplementary leverage ratio of 3%, resulting in a leverage ratio requirement of 7%
Banking regulators may determine, based on factors such as size, complexity, or level of risk that a covered banking organization must maintain capital levels above the minimum requirements.
Tier 1 Capital is defined to include two components: common equity Tier 1 Capital and additional Tier 1 Capital. The highest form of capital, Common Equity Tier 1 Capital, consists solely of common stock plus related surplus, retained earnings, accumulated other comprehensive income, and minority interests in the equity accounts of consolidated subsidiaries. In order to avoid restrictions on capital distributions or discretionary bonus payments to executives, a covered banking organization must maintain a capital conservation buffer on top of its minimum risk-based capital requirements. This buffer must consist solely of Tier 1 Common Equity, but the buffer applies to all three risk-based measurements (CET1 Capital, Tier 1 Capital and total capital). The capital conservation buffer consists of an additional amount of common equity equal to 2.5% of risk-weighted assets.
The U.S. Basel III Capital Rules also make important changes to the “prompt corrective action” framework. Federal law and regulations establish a capital-based regulatory scheme designed to promote early intervention for troubled banks and require the FDIC to choose the least expensive resolution of bank failures. The capital-based regulatory framework contains five categories of regulatory capital requirements, including “well capitalized,” “adequately capitalized,” “undercapitalized,” “significantly undercapitalized,” and “critically undercapitalized.” A well-capitalized insured depository institution is one (i) having a total risk-based capital ratio of 10% or greater, (ii) having a Tier 1 risk-based capital ratio of 8% or greater, (iii) having a CET1 capital ratio of 6.5% or greater, (iv) having a leverage capital ratio of 5% or greater and (v) that is not subject to any order or written directive to meet and maintain a specific capital level for any capital measure. An institution that fails to remain well-capitalized becomes subject to a series of restrictions that increase in severity as its capital condition weakens. Such restrictions may include a prohibition on capital distributions, restrictions on asset growth or restrictions on the ability to receive regulatory approval of applications.
As of December 31, 2024, the Bank had sufficient capital to qualify as “well capitalized” under the requirements contained in the applicable regulations, policies and directives pertaining to capital adequacy, and it is unaware of any material violation or alleged material violation of these regulations, policies or directives. Rapid growth, poor loan portfolio performance, or poor earnings performance, or a combination of these factors, could change the Bank’s capital position in a relatively short period of time, making additional capital infusions necessary.
Restrictions on dividends
The ability of the Company or the Bank to pay dividends, repurchase stock and make other capital distributions is limited by regulatory capital rules and other aspects of the regulatory framework. The Federal Reserve's policy regarding dividends is that a bank holding company should not declare or pay a cash dividend that would impose undue pressure on the capital of any bank subsidiary or would be funded only through borrowing or other arrangements that might adversely affect a bank holding company's financial position. As a general matter, the Federal Reserve has indicated that the board of directors of a bank holding company should consult with the Federal Reserve and eliminate, defer or significantly reduce the bank holding company's dividends if:
•its net income available to shareholders for the past four quarters, net of dividends previously paid during that period, is not sufficient to fully fund the dividends;
•its prospective rate of earnings retention is not consistent with its capital needs and overall current and prospective financial condition; or
•it will not meet, or is in danger of not meeting, its minimum regulatory capital adequacy ratios.
Should an insured depository institution controlled by a bank holding company be “significantly undercapitalized” under the applicable federal bank capital ratios, or if the bank subsidiary is “undercapitalized” and has failed to submit an acceptable capital restoration plan or has materially failed to implement such a plan, federal banking regulators (in the case of the Bank, the FDIC) may choose to require prior Federal Reserve approval for any capital distribution by the bank holding company.
Under Tennessee law, we are not permitted to pay cash dividends if, after giving effect to such payment, we would not be able to pay our debts as they become due in the usual course of business or our total assets would be less than the sum of our total liabilities plus any amounts needed to satisfy any preferential rights if we were dissolving. In deciding whether or not to declare a dividend of any particular size, our Board of Directors must consider our current and prospective capital, liquidity, and other needs.
Additionally, Tennessee law places restrictions on the declaration of dividends by state-chartered banks to their shareholders, including, but not limited to, that the board of directors of a Tennessee-chartered bank may only make a dividend from the surplus profits arising from the business of the bank, and may not declare dividends in any calendar year that exceeds the total of its retained net income of that year combined with its retained net income of the preceding two (2) years without the prior approval of the TDFI commissioner. Furthermore, the FDIC and the TDFI also have authority to prohibit the payment of dividends by a Tennessee bank when it determines such payment to be an unsafe and unsound banking practice.
Transactions with affiliates and insiders
The Bank is subject to regulations of the Federal Reserve Act, or FRA, and the Federal Reserve’s Regulation W, as made applicable to state nonmember banks by the FDIA. An affiliate of a bank is any company or entity that controls, is controlled by or is under common control with the Bank, and, in our case, includes, among others, the Company as well as our former Chairman, James W. Ayers and the companies he controls. Accordingly, transactions between the Bank and the Company or Mr. Ayers or any of his affiliates, will be subject to a number of restrictions, including restrictions relating to extensions of credit, contracts, leases and purchases or sale of assets. Such restrictions and limitations prevent the Company or other affiliates from borrowing from the Bank unless the loans are secured by specified collateral of designated amounts. Furthermore, such secured loans by the Bank to the Company or other affiliates are limited, individually, to 10% of the Bank’s capital and surplus, and such secured loans are limited in the aggregate to 20% of the Bank’s capital and surplus.
All such transactions must be on terms that are no less favorable to the Bank than those that would be available from nonaffiliated third-parties. Federal Reserve policies also forbid the payment by bank subsidiaries of management fees which are unreasonable in amount or exceed the fair market value of the services rendered or, if no market exists, actual costs plus a reasonable profit.
Loans to executive officers, directors or to any person who directly or indirectly, or acting through or in concert with one or more persons, owns, controls or has the power to vote more than 10% of any class of voting securities of a bank, which the Bank refers to as “10% Shareholders,” as well as other similar groups as defined by the FRA and corresponding
regulations, which are commonly referred to as Regulation O, are subject to regulatory requirements. Among other things, these loans must be made on terms substantially the same as those prevailing on transactions made to unaffiliated individuals and certain extensions of credit to those persons must first be approved in advance by a disinterested majority of the entire board of directors. Regulation O prohibits loans to any of those individuals where the aggregate amount exceeds an amount equal to 15% of an institution’s unimpaired capital and surplus plus an additional 10% of unimpaired capital and surplus in the case of loans that are fully secured by readily marketable collateral, or when the aggregate amount on all of the extensions of credit outstanding to all of these persons would exceed the Bank’s unimpaired capital and unimpaired surplus. Regulations also identify limited circumstances in which the Bank is permitted to extend credit to executive officers.
FDIC Insurance
The Bank’s deposits are insured by the Deposit Insurance Fund of the FDIC up to applicable legal limits. The FDIC charges deposit insurance assessments to FDIC-insured institutions, including the Bank, to fund and support the DIF. The rate of these deposit insurance assessments is based on, among other things, the risk characteristics of the Bank. The FDIC has the power to terminate the Bank’s deposit insurance if it determines the Bank is engaging in unsafe or unsound practices. Federal banking laws provide for the appointment of the FDIC as receiver in the event the Bank were to fail, such as in connection with undercapitalization, insolvency, unsafe or unsound conditions or other financial distress. In a receivership, the claims of the Bank’s depositors (and those of the FDIC as subrogee of the Bank) would have priority over other general unsecured claims against the Bank.
The FDIC imposes a risk-based deposit premium assessment system, which was amended pursuant to the Federal Deposit Insurance Reform Act of 2005. Under this system, the amount of FDIC assessments paid by an individual insured depository institution, like the Bank, is based on the level of perceived risk incurred in its activities. The Bank's deposit accounts are currently insured by the DIF, generally up to a maximum of $250,000 per separately insured depositor. The Bank pays deposit insurance assessments to the FDIC to be insured by the DIF. Under the current assessment system, the FDIC assigns an institution to a risk category based on the institution's most recent supervisory and capital evaluations, which are designed to measure risk. Under the FDIA, the FDIC may terminate a bank's deposit insurance upon a finding that the institution has engaged in unsafe and unsound practices, is in an unsafe or unsound condition to continue operations, or has violated any applicable law, regulation, rule, order, agreement or condition imposed by the FDIC. Under the Dodd-Frank Act, the FDIC has adopted regulations that base deposit insurance assessments on total assets less capital rather than deposit liabilities and include off-balance sheet liabilities of institutions and their affiliates in risk-based assessments. After an institution's average assets exceed $10 billion over four quarters, the assessment rate increases compared to institutions at lower average asset levels. In addition, for large institutions, the FDIC uses a performance score and a loss-severity score that are used to calculate an initial assessment rate. In calculating these scores, the FDIC uses a bank's capital level and supervisory ratings and certain financial measures to assess an institution's ability to withstand asset-related stress and funding-related stress. The FDIC has the ability to make discretionary adjustments to the total score based upon significant risk factors that are not adequately captured in the calculations.
In October 2022, the FDIC adopted a final rule, applicable to all insured depository institutions, to increase base deposit insurance assessment rate schedules uniformly by 2 basis points beginning in the first quarterly assessment period of 2023. The FDIC has indicated that the new assessment rate schedules will remain in effect until the DIF reserve ratio meets or exceeds 2%.
In November 2023, the FDIC issued a final rule to implement a special assessment to recover losses to the DIF incurred as a result of the March 2023 bank failures and the FDIC's use of the systemic risk exception to cover certain deposits that were otherwise uninsured. The special assessment was based on estimated uninsured deposits as of December 31, 2022, excluding the first $5.0 billion, and will be assessed at a quarterly rate of 3.36 basis points, over eight quarterly assessment periods, beginning in the first quarter of 2024. In June 2024, due to the increased estimate of losses, the FDIC announced that it projects that the special assessment will be collected for an additional two quarters beyond the initial eight-quarter collection period, at a lower rate. This updated assessment was made under the FDIC’s final rule whereby the estimated loss pursuant to the systemic risk determination can be periodically adjusted. The FDIC has also retained the ability to cease collection early, extend the special assessment collection period and impose a final shortfall special assessment. The special assessments are tax deductible. The extent to which any such additional future assessments will impact our future deposit insurance expense is currently uncertain.
Compensation and risk management
Under regulatory guidance applicable to banking organizations, incentive compensation policies must be consistent with safety and soundness principles. Under this guidance, financial institutions must review their compensation programs to ensure that they: (i) provide employees with incentives that appropriately balance risk and reward and that do not
encourage imprudent risk, (ii) are compatible with effective controls and risk management, and (iii) are supported by strong corporate governance, including active and effective oversight by the banking organization’s board of directors. Monitoring methods and processes used by a banking organization should be commensurate with the size and complexity of the organization and its use of incentive compensation.
We are also subject to other rules regarding our compensation practices, including the “say-on-pay” and say-on-golden-parachute” requirements of the Dodd-Frank Act and the requirement to have an independent compensation committee, and the requirement to adopt policies mandating the clawback of excess incentive-based compensation earned by a current or former executive officer during the three fiscal years preceding the date the listed company is required to prepare an accounting restatement. The Company’s current clawback policy is included in “Part IV- Item 15. Exhibits and Financial Statement Schedules- Exhibit 97” of this Report.
Community Reinvestment Act
The CRA and its corresponding regulations are intended to encourage banks to help meet the credit needs of their service areas, including low and moderate-income neighborhoods, consistent with safe and sound operations. These regulations provide for regulatory assessment of a bank’s record in meeting the credit needs of its service area. Federal banking agencies are required to make public a rating of a bank’s performance under the CRA. The federal banking agencies consider a bank’s CRA rating when a bank submits an application to establish banking centers, merge, or acquire the assets and assume the liabilities of another bank. In the case of a bank holding company, the CRA performance record of all banks involved in the merger or acquisition are reviewed in connection with the filing of an application to acquire ownership or control of shares or assets of a bank or to merge with any other financial holding company. An unsatisfactory record can substantially delay, block or impose conditions on the transaction. The Bank received a satisfactory rating on its most recent CRA assessment.
In October 2023, the federal banking regulators issued a joint final rule to substantially revise how an insured depository institution's CRA performance is evaluated. The final rule is intended, among other things, to adapt to changes in the banking industry, including the expanded role of mobile and online banking, and to tailor performance standards to account for differences in bank size and business models. The final rule introduces new tests under which the performance of banks with over $2 billion in assets will be assessed. The new rule also includes data collection and reporting requirements, some of which are applicable only to banks with over $10 billion in assets, such as FirstBank. Most provisions of the final rule will become effective on January 1, 2026, and the data reporting requirements will become effective on January 1, 2027. The final rule is currently enjoined while a federal court considers a challenge to the rule.
Anti-money laundering and economic sanctions
Federal anti-money laundering rules impose various requirements on financial institutions intended to prevent the use of the U.S. financial system to fund terrorist activities. These provisions include a requirement that financial institutions operating in the United States have anti-money laundering compliance programs, due diligence policies and controls to ensure the detection and reporting of money laundering. Such compliance programs supplement existing compliance requirements, also applicable to financial institutions, under the Bank Secrecy Act and the Office of Foreign Assets Control regulations. The Bank has established policies and procedures to ensure compliance with federal anti-money laundering laws and regulations.
Privacy and data security
The Bank is subject to regulations implementing the privacy protection provisions of GLBA. These regulations require the Bank to disclose its privacy policy, including identifying with whom it shares “nonpublic personal information,” to customers at the time of establishing the customer relationship and annually thereafter. The regulations also require the Bank to provide its customers with initial and annual notices that accurately reflect its privacy policies and practices. In addition, to the extent its sharing of such information is not covered by an exception, the Bank is required to provide its customers with the ability to “opt-out” of having the Bank share their nonpublic personal information with unaffiliated third-parties.
The Bank is subject to regulatory guidelines establishing standards for safeguarding customer information. The guidelines describe the federal bank regulatory agencies’ expectations for the creation, implementation and maintenance of an information security program, which would include administrative, technical and physical safeguards appropriate to the size and complexity of the institution and the nature and scope of its activities. The standards are intended to ensure the security and confidentiality of customer records and information, protect against any anticipated threats or hazards to the security or integrity of such records and protect against unauthorized access to or use of such records or information that could result in substantial harm or inconvenience to any customer. These guidelines, along with related regulatory materials, increasingly focus on risk management and processes related to information technology and the use of third- parties in the provision of financial services.
The federal bank regulatory agencies place reporting requirements on banks and banking service providers that experience cybersecurity incidents. Under this rule, banks must report these incidents within 36 hours to their primary federal regulator. In addition, banks are required to inform customers of any computer security incidents lasting more than four hours.
Consumer laws and regulations
We are subject to a broad array of federal and state laws designed to protect consumers in connection with our lending activities, including the Equal Credit Opportunity Act, the Fair Credit Reporting Act, the Truth in Lending Act, the Truth in Savings Act, the Home Mortgage Disclosure Act, the Real Estate Settlement Procedures Act, the Electronic Funds Transfer Act, and, in some cases, their respective state law counterparts. The CFPB has broad regulatory, supervisory and enforcement authority over our offering and provision of consumer financial products and services under these laws.
We have established numerous controls and procedures designed to ensure that we fully comply with lending and other consumer protection laws, both federal and state, as they are currently interpreted (which interpretations are subject to change by the CFPB). In addition, our employees undergo at least annual training to ensure that they remain aware of consumer protection laws and the activities mandated, or prohibited, thereunder.
Mortgage regulation
In addition to the consumer laws and regulations above, the Dodd-Frank Act also imposes specific duties on mortgage lenders, including a duty to determine the borrower's ability to repay the loan, and imposed a requirement on mortgage securitizers to retain a minimum level of economic interest in securitized pools of certain mortgage types.
Interchange fees
The Dodd-Frank Act also included provisions (known as the “Durbin Amendment”), which restrict interchange fees to those which are “reasonable and proportionate” for certain debit card issuers and limits the ability of networks and issuers to restrict debit card transaction routing. In the final rules, interchange fees for debit card transactions were capped at $0.21 plus five basis points (plus $0.01 for fraud loss) in order to be eligible for a safe harbor such that the fee is conclusively determined to be reasonable and proportionate.
Regulatory enforcement authority
Federal and state banking laws grant substantial enforcement powers to federal and state regulators. This enforcement authority includes, among other things, the ability to assess civil money penalties, to issue consent or removal orders and to initiate injunctive actions against banking organizations and “institution-affiliated parties,” such as management, employees and agents. In general, these enforcement actions may be initiated for violations of laws, regulations and orders of regulatory authorities, or unsafe or unsound practices. Other actions or inactions, including filing false, misleading or untimely reports with regulatory authorities, may provide the basis for enforcement action. When issued by a banking regulator, consent and similar orders may, among other things, require affirmative action to correct any harm resulting from a violation or practice, including restitution, reimbursement, indemnifications or guarantees against loss. A bank may also be ordered to restrict its growth, dispose of certain assets, rescind agreements or contracts, or take other actions determined to be appropriate by the ordering regulatory agency.
Future legislative developments
Various legislative acts are from time to time introduced in Congress and the Tennessee legislature. This legislation may change banking statutes and the environment in which we operate in substantial and unpredictable ways. We cannot determine the ultimate effect that potential legislation, if enacted, or implementing regulations and interpretations with respect thereto, would have on our financial condition or results of operations.
The new presidential administration and many members of Congress have advocated for changes in financial services regulation, potentially including amendments to the Dodd-Frank Act and other federal banking laws, and structural changes to the CFPB. It is possible, though uncertain, that Congress and/or the relevant federal agencies may seek to roll back or modify some or much of the rulemaking and regulatory guidance issued under the previous presidential administration. Additionally, the full impact of the leadership changes at banking regulatory agencies on the enforcement and supervisory priorities of each agency is not fully known at this time. It is therefore unclear at the present time what effect the aforementioned changes will have on the banking industry as a whole or the Company specifically.
Available Information
Our website address is www.firstbankonline.com. We file or furnish to the Securities Exchange and Commission Annual Reports on Form 10-K, Quarterly Reports on Form 10-Q, Current Reports on Form 8-K, proxy statements and Annual Reports to shareholders, and from time to time, amendments to these documents and other documents called for by the SEC. The reports and other documents filed with or furnished to the SEC are available to investors on or through our website at https://investors.firstbankonline.com under the heading “Stock & Filings” and then under “SEC Filings.” These reports are available on our website free of charge as soon as reasonably practicable after we electronically file them with the SEC.
In addition to our website, the SEC maintains an internet site that contains our reports, proxy and information statements and other information we file electronically with the SEC at https://www.sec.gov.
ITEM 1A - Risk Factors
Our operations and financial results are subject to various risks and uncertainties, including, but not limited to, the material risks described below. Many of these risks are beyond our control although efforts are made to manage and mitigate those risks while simultaneously optimizing operational and financial results. The occurrence of any of the following risks, as well as risks of which we are currently unaware or currently deem immaterial, could materially and adversely affect our assets, business, cash flows, condition (financial or otherwise), liquidity, prospects, results of operations and the trading price of our common stock. It is impossible to predict or identify all such factors and, as a result, you should not consider the following factors to be a complete discussion of the risks, uncertainties and assumptions that could materially and adversely affect our assets, business, cash flows, condition (financial or otherwise), liquidity, prospects, results of operations and the trading price of our common stock.
In addition, certain statements in the following risk factors constitute forward-looking statements. Please refer to the section entitled “Cautionary note regarding forward-looking statements” included in this Annual Report.
CREDIT AND LOAN RISK
The majority of our assets are loans, which if not repaid would result in losses to the Bank.
Making any loan involves various risks, including risks inherent in dealing with individual borrowers, risks of nonpayment, risks resulting from uncertainties as to the future value of collateral and cash flows available to service debt, and risks resulting from changes in economic and market conditions. Our credit risk approval and monitoring procedures may fail to identify or reduce these credit risks, and they cannot completely eliminate all credit risks related to our loan portfolio. If the overall economic climate, including employment rates, real estate markets, interest rates and general economic growth, in the United States, generally, or our markets, specifically, experiences material disruption, our borrowers may experience difficulties in repaying their loans, the collateral we hold may decrease in value or become illiquid, and the levels of nonperforming loans, charge-offs and delinquencies could rise and require additional provisions for loan losses, which would cause our net income and return on equity to decrease.
We maintain an allowance for credit losses, which is a reserve established through a provision for credit losses charged to expense, which represents the portion of the loan's amortized cost basis that we do not expect to collect due to credit losses over the loan's life, considering past events, current conditions, and reasonable and supportable forecasts of future economic conditions considering macroeconomic forecasts. In addition, we record a reserve for unfunded commitments, considering the same items included in the allowance for credit losses with the addition of expected funding. Management’s determination of the appropriateness of the allowance and reserve for unfunded commitments is based on periodic evaluation of the loan portfolio, lending-related commitments and other relevant factors, including macroeconomic forecasts and historical loss rates. Deterioration in economic conditions affecting borrowers, new information regarding existing loans, identification of additional problem loans and other factors, both within and outside of our control, may require an increase in the allowance for credit losses and/or the reserve for unfunded commitments. The model is sensitive to changes in macroeconomic forecasts and incorporates management judgment. If we are required to materially increase our level of allowance for credit losses for any reason, such increase could adversely affect our business, financial condition and results of operations.
The application of the purchase method of accounting in our acquisitions (and any future acquisitions) also will affect our allowance for credit losses. We are required to determine whether purchased loans held for investment have experienced more-than-insignificant deterioration in credit quality since origination. Loans that have experienced this level of deterioration in credit quality are subject to special accounting at initial recognition. We initially measure the amortized cost of a purchase credit deteriorated loan by adding the acquisition date estimate of expected credit losses to the loan's purchase price (i.e. the “gross up” approach). If we have underestimated credit losses at recognition, we will incur
additional expense in our provision for credit losses to maintain an appropriate level of allowance for credit losses on those loans.
In addition, bank regulators periodically review our allowance for credit losses and may require an increase in the provision for credit losses or the recognition of further loan charge-offs, based on judgments different than those of management. Furthermore, if charge-offs in future periods exceed the allowance for credit losses, we will need additional provisions to increase the allowance for credit losses. Any increases in the allowance for credit losses will result in a decrease in net income and capital and may have a material adverse effect on our business, financial condition and results of operations.
Because a significant portion of our loan portfolio is comprised of real estate loans, negative changes in the economy affecting real estate values and liquidity could impair the value of collateral securing our real estate loans and result in loan and other losses.
As of December 31, 2024, approximately 77% of our loan portfolio was comprised of loans with real estate as a primary or secondary component of collateral. This includes collateral consisting of income producing and residential construction properties, which properties tend to be more sensitive to general economic conditions and downturns in real estate markets. As a result, adverse developments affecting real estate values in our market areas could increase the credit risk associated with our real estate loan portfolio. Adverse changes affecting real estate values and the liquidity of real estate in one or more of our markets could increase the credit risk associated with our loan portfolio and could result in losses that would adversely affect credit quality and our financial condition or results of operations. These adverse changes could significantly impair the value of property pledged as collateral to secure the loans and affect our ability to sell the collateral upon foreclosure without a loss or additional losses. If real estate values decline, it is also more likely that we would be required to increase our allowance for credit losses. Thus, declines in the value of real estate collateral could adversely affect our financial condition, results of operations or cash flows.
Weakness in residential real estate market prices, weakness in demand, or increases in building costs could result in a volatile environment including price reductions in home and land values adversely affecting the value of collateral securing some of the construction and development loans that we hold. Should we experience the return of adverse economic and real estate market conditions similar to those we experienced from 2008 through 2010 we may again experience increases in non-performing loans and other real estate owned, increased losses and expenses from the management and disposition of non-performing assets, increases in provision for credit losses, and increases in operating expenses as a result of the allocation of management time and resources to the collection and work out of loans, all of which would negatively impact our financial condition and results of operations.
We are subject to lending concentration risks.
Our exposure to commercial real estate (both owner-occupied and non-owner occupied), commercial and industrial, and construction loans expose us to greater credit risk than loans secured by other types of collateral because the collateral securing these loans is typically more difficult to liquidate. Additionally, these types of loans also often involve larger loan balances to a single borrower or groups of related borrowers. These higher credit risks are further heightened when the loans are concentrated in a small number of larger borrowers leading to relationship exposure. As of December 31, 2024, the following loan types accounted for the stated percentages of our loan portfolio: commercial real estate (both owner-occupied and non-owner occupied) - 36%; commercial and industrial - 18%; and construction - 11%.
Non-owner occupied commercial real estate loans may be affected to a greater extent than residential loans by adverse conditions in real estate markets or the economy because commercial real estate borrowers’ ability to repay their loans depends on successful development of their properties. These loans also involve greater risk because they generally are not fully amortizing over the loan period, and therefore have a balloon payment due at maturity. A borrower’s ability to make a balloon payment typically will depend on being able to either refinance the loan or sell the underlying property in a timely manner. In addition, banking regulators have been giving commercial real estate lending greater scrutiny, and may require banks with higher levels of commercial real estate loans to implement improved underwriting, internal controls, risk management policies and portfolio stress testing, as well as possibly higher levels of allowances for losses and capital levels as a result of commercial real estate lending growth and exposures.
Commercial and industrial loans and owner-occupied commercial real estate loans are typically based on the borrowers’ ability to repay the loans from the cash flow of their businesses. These loans may involve greater risk because the availability of funds to repay each loan depends substantially on the success of the business itself. In addition, the assets securing the loans depreciate over time, are difficult to appraise and liquidate, and fluctuate in value based on the success of the business.
Risk of loss on a construction loan depends largely upon whether our initial estimate of the property’s value at completion of construction or development equals or exceeds the cost of the property construction or development (including interest), the availability of permanent take-out financing and the builder’s ability to sell the property. During the
construction or development phase, a number of factors can result in delays and cost overruns. If estimates of value are inaccurate or if actual construction costs exceed estimates, the value of the property securing the loan may be insufficient to ensure full repayment when completed through a permanent loan or by foreclosure on collateral.
Commercial real estate loans, commercial and industrial loans, and construction loans are more susceptible to a risk of loss during a downturn in the business cycle due to the vulnerability of these sectors during a downturn. Our underwriting, review and monitoring cannot eliminate all of the risks related to these loans. We also make both secured and unsecured loans to our commercial customers. Unsecured loans generally involve a higher degree of risk of loss than secured loans because, without collateral, repayment is wholly dependent upon the success of the borrowers’ businesses. Because of this lack of collateral, we are limited in our ability to collect on defaulted unsecured loans. Further, the collateral that secures our secured commercial and industrial loans typically includes inventory, accounts receivable and equipment, which usually have a value that is insufficient to satisfy the loan without a loss if the business does not succeed. Our loan concentration in these sectors and their higher credit risk could lead to increased losses on these loans, which could have a material adverse effect on our financial condition, results of operations or cash flows.
Our ability to grow our loan portfolio may be hampered.
Our ability to grow our loan portfolio could be limited by, among other reasons, economic conditions, competition in our markets, our ability to hire and train experienced or successful bankers, our ability to generate the deposits needed to grow loan assets, or the drain on liquidity and available deposits that the banking industry has experienced and may continue to experience.
MARKET AND INTEREST RATE RISK
Difficult or volatile market conditions in the national financial markets, the U.S. economy generally, or our markets in particular may adversely affect our lending activity or other businesses, as well as our financial condition.
Our business and financial performance are vulnerable to weak economic conditions in the financial markets and economic conditions generally and specifically in our markets, the principal market in which we conduct business. A deterioration in economic conditions in our primary market areas could result in increased loan delinquencies, foreclosures, and write-downs of asset values, lower demand for our products and services, reduced low cost or noninterest-bearing deposits, and intangible asset impairment. Additionally, difficult market conditions may lead to a deterioration in the value of the collateral for loans made by us, especially real estate, which could reduce our customers' ability to repay outstanding loans and reduce the value of assets associated with our existing loans. Additional issues surrounding weakening economic conditions and volatile markets that could adversely impact us include increased industry regulation and downward pressures on our stock price.
We conduct our banking operations primarily in Tennessee. As of December 31, 2024, approximately 69% of our loans and approximately 72% of our deposits were made to borrowers or received from depositors who live and/or primarily conduct business in Tennessee. Therefore, our success will depend in large part upon the general economic conditions in this area. This geographic concentration imposes risks from lack of geographic diversification, as adverse economic developments in Tennessee (including the Nashville MSA, our largest market), among other things, could affect the volume of loan originations, increase the level of nonperforming assets, increase the rate of foreclosure losses on loans, reduce the value of our loans and loan servicing portfolio, reduce the value of the collateral securing our loans and reduce the amount of our deposits.
Any regional or local economic downturn that affects Tennessee or existing or prospective borrowers, depositors or property values in this area may affect us and our profitability more significantly and more adversely than our competitors whose operations are less geographically concentrated.
Changes in interest rates could adversely affect our results of operations and financial condition.
Our earnings and financial condition are dependent to a large degree upon net interest income, which is the difference, or spread, between interest earned on loans, securities and other interest-earning assets and interest paid on deposits, borrowings and other interest-bearing liabilities. When market rates of interest change, the interest we receive on our assets and the interest we pay on our liabilities may fluctuate. This may cause decreases in our spread and may adversely affect our earnings and financial condition. Interest rates are highly sensitive to many factors including, without limitation: the rate of inflation; economic conditions; federal monetary policies; and stability of domestic and foreign markets.
Although we have implemented procedures, we believe will reduce the potential effects of changes in interest rates on our net interest income, these procedures may not always be successful. Accordingly, changes in levels of market interest rates could materially and adversely affect our net interest income and our net interest margin, asset quality, loan and
lease origination volume, liquidity or overall profitability. Additionally, changes in interest rates can adversely affect the origination of mortgage loans held for sale and resulting mortgage banking revenues.
The performance of our investment securities portfolio is subject to fluctuation due to changes in interest rates and market conditions, including credit deterioration of the issuers of individual securities.
Changes in interest rates may negatively affect both the returns on and fair value of our investment securities. Interest rate volatility can reduce unrealized gains or increase unrealized losses in our portfolio. Interest rates are highly sensitive to many factors including monetary policies, domestic and international economic and political issues, and other factors beyond our control. Additionally, actual investment income and cash flows from investment securities that carry prepayment risk, such as mortgage-backed securities and callable securities, may materially differ from those anticipated at the time of investment or subsequently as a result of changes in interest rates and market conditions. These occurrences could materially and adversely affect our net interest income or our results of operations.
We may be materially and adversely affected by the creditworthiness and liquidity of other financial institutions.
Financial services institutions are interrelated as a result of trading, clearing, counterparty, or other relationships. We have exposure to many different industries and counterparties, and routinely execute transactions with counterparties in the financial services industry, including commercial banks, brokers and dealers, investment banks and other institutional customers. Many of these transactions expose us to credit risk in the event of a default by, or questions or concerns about the creditworthiness of a counterparty or client, or concerns about the financial services industry generally. In addition, our credit risk may be exacerbated when the collateral held by us cannot be realized upon or is liquidated at prices not sufficient to recover the full amount of the credit or derivative exposure due to us. Any such losses could have a material adverse effect on us.
Changes in U.S. trade policies, including the imposition of tariffs and retaliatory tariffs, may adversely impact our business, financial condition, and results of operations.
The new administration has signaled it will impose certain tariffs against U.S. trading partners. On February 1, 2025, an Executive Order was issued imposing tariffs at various levels on imports from Canada, Mexico, and China. The newly imposed tariffs have resulted in immediate threats of retaliatory tariffs against U.S. goods and resulted in discussions with the countries which have delayed many of the U.S. imposed tariffs while discussions with each trading partner continue.
The above and other potential tariffs and trade restrictions may cause the prices of our customers' products to increase, which could reduce demand for such products, or reduce our customers' margins, and adversely impact their revenues, financial results, and ability to service debt. This in turn could adversely affect our financial condition and results of operations. In addition, to the extent changes in the political environment have a negative impact on us or on the markets in which we operate our business, our results of operations and financial condition could be materially and adversely impacted in the future. At this time, it remains unclear what the U.S. government or trading partners will or will not do with respect to additional tariffs that may be imposed or international trade agreements and policies.
Significant changes to the size, structure, powers and operations of the federal government may cause economic disruptions that could, in turn, adversely impact our business, results of operations and financial condition.
The new administration has begun to implement significant changes to the size and scope of the federal government to achieve stated goals including reducing the federal budget deficit and national debt, improving the efficiency of government operations, and promoting innovation and economic growth. To date, these efforts have been carried out through a mix of executive actions aimed at eliminating or modifying federal agency and federal program funding, reducing the size of the federal workforce, reducing or altering the scope of activities conducted by, and possibly eliminating, various federal agencies and bureaus, and encouraging the use of artificial intelligence and other advanced technologies within the public and private sectors. If implemented, these changes may have varied effects on the economy that are difficult to predict. For instance, the delivery of government services and the distribution of federal program funds and benefits may be disrupted or, in some cases, eliminated as a result of funding cuts or recasting of federal agency mandates. Further, a substantial reduction of the federal workforce could adversely affect regional and local economies, both directly and indirectly, in geographies with significant concentrations of federal employees and contractors. It is possible that the velocity of such comprehensive changes to the federal government may be materially adverse to the regional and local economies where we conduct business and to our customers, which, in turn, could be materially adverse to our business, financial condition and results of operations.
LIQUIDITY RISK
A lack of liquidity could adversely affect our operations and jeopardize our business, financial condition or results of operations.
We rely on our ability to generate deposits and effectively manage the repayment and maturity schedules of our loans and investment securities to ensure that we have adequate liquidity to fund our operations. In addition to our traditional funding
sources, we also may borrow funds from third-party lenders or issue equity or debt securities to investors. Our access to funding sources in amounts adequate to finance or capitalize our activities, or on terms that are acceptable to us, could be impaired by factors that affect us directly or the financial services industry or economy in general, such as disruptions in the financial markets or negative views and expectations about the prospects for the financial services industry. Any decline in available funding could adversely impact our ability to originate loans, invest in securities, meet our expenses, pay dividends to our shareholders, or to fulfill obligations such as repaying our borrowings or meeting deposit withdrawal demands, any of which could have a material adverse impact on our liquidity, business, financial condition or results of operations.
Failure to address the federal debt ceiling in a timely manner, downgrade of the U.S. credit rating, and uncertain credit and financial market conditions may affect the stability of securities issued or guaranteed by the federal government, which may adversely affect the valuation or liquidity of our investment securities portfolio and increase future borrowing costs.
As a result of uncertain political, credit and financial market conditions, including the potential consequences of the federal government defaulting on its obligations for a period of time due to federal debt ceiling limitations or other unresolved political issues, investments in financial instruments issued or guaranteed by the federal government pose liquidity risks. Downgrades to the U.S. credit rating could affect the stability of securities issued or guaranteed by the federal government and the valuation or liquidity of our portfolio of such investment securities, and could result in our counterparties requiring additional collateral for our borrowings. Further, unless and until U.S. political, credit and financial market conditions have been sufficiently resolved or stabilized, it may increase our future borrowing costs.
MORTGAGE BANKING RISK
Our mortgage revenue is cyclical and is sensitive to the level of interest rates, changes in economic conditions, decreased economic activity, and slowdowns in the housing market.
The success of our mortgage segment is dependent upon our ability to originate loans and sell them to investors. Loan production levels are sensitive to changes in the level of interest rates and changes in economic conditions. As the mortgage industry experienced in 2023, mortgage production, especially refinancing activity, declines when interest rates rise. Our mortgage origination volume could be materially and adversely affected by rising interest rates.
Because we sell a substantial portion of the mortgage loans we originate, the profitability of our mortgage banking business also depends in large part on our ability to aggregate a high volume of loans and sell them in the secondary market at a gain. If interest rates rise, we expect increasing industry-wide competitive pressures related to changing market conditions to reduce pricing margins and mortgage revenues generally. If our level of mortgage production declines, our continued profitability will depend upon our ability to further reduce our costs. If we are unable to do so, our continued profitability may be materially and adversely affected.
In 2024, we sold nearly all of the $1.22 billion of mortgage loans held for sale that we closed. When mortgage loans are sold, whether as whole loans or pursuant to a securitization, we are required to make customary representations and warranties to purchasers, guarantors and insurers about the mortgage loans and the manner in which they were originated. We may be required to repurchase or substitute mortgage loans, or indemnify buyers against losses, in the event we breach certain representations or warranties in connection with the sale of such loans. If repurchase and indemnity demands increase, such demands are valid claims and are in excess of our provision for potential losses, our liquidity, results of operations or financial condition may be materially and adversely affected.
The value of our mortgage servicing rights asset is subjective by nature and may be vulnerable to inaccuracies or other events outside our control.
The value of our mortgage servicing rights asset can fluctuate. Particularly, the asset could decrease in value if prepayment speeds, delinquency rates, or the cost to service increases or overall values decrease causing a lack of liquidity of MSRs in the market. Similarly, the value may decrease if interest rates decrease or change in a non-parallel manner or are otherwise volatile, all of which are mostly out of the Bank’s control. We must use estimates, assumptions and judgments when valuing this asset. An inaccurate valuation, or changes to the valuation due to factors outside of our control, could inhibit our ability to realize the full value of this asset. As a result, our balance sheet may not precisely represent the fair market value of this and other financial assets.
Our business model is materially dependent on U.S. government‑sponsored entities and government agencies, and any changes in these entities, their current roles or the leadership at such entities or their regulators could materially and adversely affect our business, financial condition, liquidity and results of operations.
Our ability to generate revenues through mortgage loan sales depends on programs administered by Government-Sponsored Enterprises, such as Fannie Mae and Freddie Mac, government agencies, including Ginnie Mae, and others that facilitate the issuance of mortgage‑backed securities in the secondary market. Presently, a significant portion of the
newly originated loans that we originate directly with borrowers qualify under existing standards for inclusion in MBS issued by Fannie Mae or Freddie Mac or guaranteed by Ginnie Mae. A number of legislative proposals have been introduced in recent years that would wind down or phase out the GSEs. It is not possible to predict the scope and nature of the actions that the U.S. government will ultimately take with respect to the GSEs. Any changes in laws and regulations affecting the relationship between Fannie Mae and Freddie Mac and their regulators or the U.S. federal government, and any changes in leadership at these entities, could adversely affect our business and prospects. Any discontinuation of, or significant reduction in, the operation of Fannie Mae or Freddie Mac or any significant adverse change in their capital structure, financial condition, activity levels in the primary or secondary mortgage markets or in underwriting criteria could materially and adversely affect our business, financial condition, liquidity and results of operations.
Elimination of the traditional roles of Fannie Mae and Freddie Mac, or any changes to the nature or extent of the guarantees provided by Fannie Mae and Freddie Mac or the fees, terms and guidelines that govern our selling and servicing relationships with them, could also materially and adversely affect our ability to sell and securitize loans through our loan production segment, and the performance, liquidity and market value of our investments. Moreover, any changes to the nature of the GSEs or their guarantee obligations could redefine what constitutes an Agency MBS and could have broad adverse implications for the market and our business, financial condition, liquidity and results of operations.
Decreased residential mortgage origination volume and pricing decisions of competitors may adversely affect our profitability.
Our mortgage operation originates, sells and services residential mortgage loans. Changes in interest rates, housing prices, applicable government regulations and pricing decisions by our loan competitors may adversely affect demand for our residential mortgage loan products, the revenue realized on the sale of loans, the revenues received from servicing such loans for others and, ultimately, reduce our net income. New regulations, increased regulatory reviews, and/or changes in the structure of the secondary mortgage markets which we utilize to sell mortgage loans may increase costs and make it more difficult to operate a residential mortgage origination business. Our revenue from the mortgage banking business was $46.6 million in 2024. This revenue could significantly decline in future periods if interest rates were to rise and the other risks highlighted in this paragraph were realized, which may adversely affect our profitability.
We may incur costs, liabilities, fines and other sanctions if we fail to satisfy our mortgage loan servicing obligations.
We act as servicer for approximately $10.24 billion of mortgage loans owned by third-parties as of December 31, 2024. As a servicer for those loans, we have certain contractual obligations to third-parties. If we commit a material breach of our obligations as servicer, we may be subject to termination if the breach is not cured within a specified period of time following notice, causing us to lose servicing income. For certain investors and/or transactions, we may be contractually obligated to repurchase a mortgage loan or reimburse the investor for credit losses incurred on the loan as a remedy for origination errors with respect to the loan. If we have increased repurchase obligations because of claims that we did not satisfy our obligations as a servicer, or if we have increased loss severity on such repurchases, we may have a significant reduction to net servicing income within our mortgage banking noninterest income. In addition, we may be subject to fines and other sanctions imposed by federal or state regulators as a result of actual or perceived deficiencies in our foreclosure practices. Any of these actions may harm our reputation or negatively affect our residential lending or servicing business and, as a result, our profitability.
LEGAL, REGULATORY AND COMPLIANCE RISK
We are subject to significant government regulation and supervision.
The Company and the Bank are subject to extensive federal and state regulation and supervision by the FDIC, Tennessee Department of Financial Institution, the Federal Reserve Board, and the CFPB, among others, the primary focus of which is to protect customers, depositors, the deposit insurance fund and the safety and soundness of the banking system as a whole, and not shareholders. The quantity and scope of applicable federal and state regulations may place banks at a competitive disadvantage compared to less regulated competitors such as financial technology companies, finance companies, credit unions, mortgage banking companies and leasing companies. These laws and regulations apply to almost every aspect of our business, and affect our lending practices and procedures, capital structure, investment activities, deposit gathering activities, our services and products, risk management practices, dividend policy and growth, including through acquisitions.
Legislation and regulation with respect to our industry has increased in recent years. Changes to statutes, regulations or regulatory policies, including changes in interpretation or implementation of statutes, regulations or policies, or the issuance of new supervisory guidance, could affect us in substantial and unpredictable ways, and could subject us to additional costs, restrict our growth, limit the services and products we may offer or limit the pricing of banking services
and products. In addition, establishing systems and processes to achieve compliance with laws and regulation increases our costs and could limit our ability to pursue business opportunities.
If we receive less than satisfactory results on regulatory examinations, we could be subject to damage to our reputation, significant fines and penalties, requirements to increase compliance and risk management activities and related costs and restriction on acquisitions, new locations, new lines of business, or continued growth. Future changes in federal and state banking could adversely affect our operating results and ability to continue to compete effectively. For example, the Dodd-Frank Act and related regulations, including the Home Mortgage Disclosure Act, subject us to additional restrictions, oversight and reporting obligations, which have significantly increased costs. And over the last several years, state and federal regulators have focused on enhanced risk management practices, mortgage law and regulation, compliance with the Bank Secrecy Act and anti-money laundering laws, data integrity and security, use of service providers, and fair lending and other consumer protection issues, which has increased our need to build additional processes and infrastructure. Government agencies charged with adopting and interpreting laws, rules and regulations, may do so in an unforeseen manner, including in ways that potentially expand the reach of the laws, rules or regulations more than initially contemplated or currently anticipated. We cannot predict the substance or impact of pending or future legislation or regulation, or the application thereof. Compliance with such current and potential regulation and scrutiny could significantly increase our costs, impede the efficiency of our internal business processes, require us to increase our regulatory capital and limit our ability to pursue business opportunities in an efficient manner. Our success depends on our ability to maintain compliance with both existing and new laws and regulations.
Applicable laws and regulations restrict both the ability of the Bank to pay dividends to us and our ability to pay dividends to our shareholders.
The Company and the Bank are subject to various regulatory restrictions relating to the payment of dividends. In addition, the Federal Reserve has the authority to prohibit bank holding companies from engaging in unsafe or unsound practices in conducting their business. These federal and state laws, regulations and policies are described in greater detail in “Business: Supervision and regulation: Regulation of the Company and the Bank: Restrictions on dividends” and generally consider previous results and net income, capital needs, asset quality, existence of enforcement or remediation proceedings, and overall financial condition in determining whether a dividend payment is appropriate. For the foreseeable future, the majority, if not all, of our revenue will be from any dividends paid to us by the Bank. Accordingly, our ability to pay dividends also depends on the ability of the Bank to pay dividends to us. Further, the present and future dividend policy of the Bank is subject to the discretion of the Board of Directors. We cannot guarantee that we or the Bank will be permitted by financial condition or applicable regulatory restrictions to pay dividends, that the Board of Directors will elect to pay dividends to us, or the timing or amount of any dividend actually paid. See “Item 5. Market for Registrant's Common Equity, Related Stockholder Matters and Issuer Purchases of Equity Securities - Dividends.” If we do not pay dividends, market perceptions of our common stock may be adversely affected, which could in turn create downward pressure on our stock price.
As the parent company of the Bank, the Federal Reserve may require us to commit capital resources to support the Bank.
The Federal Reserve requires us to act as a source of strength to the Bank and to commit capital and financial resources to support the Bank. This support may be required at times when we might otherwise determine not to provide it. In addition, if we commit to a federal bank regulator that we will maintain the capital of the Bank, whether in response to the Federal Reserve’s invoking its source-of-strength authority or in response to other regulatory measures, that commitment will be assumed by a bankruptcy trustee and, as a result, the Bank will be entitled to priority payment in respect of that commitment, ahead of our other creditors. Thus, any borrowing that must be done by us in order to support the Bank may adversely impact our cash flow, financial condition, results of operations or prospects.
Our financial condition may be affected negatively by the costs of litigation.
We may be involved from time to time in a variety of litigation, investigations or similar matters arising out of our business. From time to time, and particularly during periods of economic stress, customers may make claims or otherwise take legal action pertaining to performance of our responsibilities. These claims are often referred to as “lender liability” claims. Whether customer claims and legal action related to the performance of our responsibilities are founded or unfounded, if such claims and legal actions are not resolved in a favorable manner, they may result in significant financial liability and/or adversely affect our market perception, products and services, as well as potentially affecting customer demand for those products and services. In many cases, we may seek reimbursement from our insurance carriers to cover such costs and expenses. These claims, as well as supervisory and enforcement actions by our regulators could involve large monetary claims, capital directives, regulatory agreements and directives and significant defense costs. The outcome of any such cases or actions is uncertain. Substantial legal liability or significant regulatory action against us could have material adverse financial effects or cause significant reputational harm to us, which in turn could seriously harm our business prospects. Our insurance may not cover all claims that may be asserted against us, and any claims asserted against us,
regardless of merit or eventual outcome, may harm our reputation. Should the ultimate judgments or settlements in any litigation or investigation significantly exceed our insurance coverage, they could have a material adverse effect on our business, financial condition or results of operations.
TECHNOLOGY AND OPERATIONAL RISKS
We rely on third-party vendors to provide services that are integral to the operation of our business.
We depend on a range of third-party service providers that are integral to the operation of our business. These vendors service our mortgage loan business, provide critical core systems' processing services, essential web hosting and other internet systems, and deposit processing services. If these service providers fail to perform servicing duties or perform those duties inadequately, we could experience a temporary interruption in our business, sustain credit losses on our loans and/or incur additional costs to obtain a replacement servicer. There can be no assurance that a replacement servicer could be retained in a timely manner or at a similar cost.
Being able to maintain these relationships on favorable terms is not guaranteed. In addition, some of our data processing services are provided by companies associated with our competitors. The loss of these vendor relationships could disrupt the services we provide to our customers and cause significant expenses to replace these services. Our operations could be significantly disrupted if third-party service providers experienced their own difficulties, or terminate their services. If an interruption were to continue for a significant period, our business' financial condition and operations could be adversely affected, perhaps materially. Assuming we were able to replace third-party service providers, it may be at a higher cost. For example, if we experienced issues with our mortgage servicing provider it could result in a range of critical issues including; servicing rights becoming terminated, repurchasing of mortgage loans, and/or reimbursements to investors.
Additionally, we utilize many vendors that provide services to support our operations, including the storage and processing of sensitive consumer and business customer data. A cyber security breach of a vendor's system may result in theft and/or unavailability of our data or disruption of business processes. We could be liable to our customers for losses arising from a breach of a vendor's data security system. We rely on outsourced service providers to implement and maintain prudent cyber security controls. We have procedures in place to assess a vendor's cyber security controls prior to establishing a contractual relationship and to periodically review assessments of those control systems. However, these procedures are not infallible, and a vendor's system can be breached despite the procedures we employ.
Our risk management framework may not be effective in mitigating risks and/or losses to us.
Our risk management framework is comprised of various processes, systems, and strategies, that are designed to manage the types of risk to which we are subject, including, among others, credit, price, liquidity, interest rate and compliance risks. Our framework also includes financial or other modeling methodologies that involve management assumptions and judgment. Our risk management framework may not be effective under all circumstances and may not adequately mitigate any risk or loss to us. If our framework is not effective, we could suffer unexpected losses and our business, financial condition, results of operations or prospects could be materially and adversely affected.
System failure or breaches of our network security, including cyber-attacks or data security breaches, could subject us to increased operating costs as well as litigation among other liabilities.
The computer systems and network infrastructure we, and our vendors, use may be vulnerable to physical theft, fire, power loss, telecommunications failure or a similar catastrophic event. Additionally, security breaches, denial of service attacks, viruses, ransomware, and other disruptive problems caused by cyber criminals. Any damage or failure that causes breakdowns or disruptions in our client relationship management, general ledger, deposit, loan and other systems could damage our reputation, result in a loss of client business, subject us to additional regulatory scrutiny, or expose us to civil litigation and possible financial liability, any of which could have a material adverse effect on us.
Compromised computers, phishing and other disruptions could also jeopardize the security of information stored in and transmitted through our network infrastructure. A cybersecurity breach of our information systems could lead to fraudulent activity such as identity theft, losses on the part of our banking customers, additional security costs, negative publicity and damage to our reputation and brand. In addition, our customers could be subject to scams that may result in the release of sufficient information concerning themselves or their accounts to allow unauthorized access to their accounts or our systems (e.g., “phishing” and “smishing”). Claims for compensatory or other damages may be brought against us because of a breach of our systems or fraudulent activity. If we are unsuccessful in defending against such resulting claims, we may be forced to pay damages, which could materially and adversely affect our financial condition and results of operations.
Information security risks have generally increased in recent years in part because of the proliferation of new technologies, use of the internet and telecommunications technologies to conduct financial transactions, increase in remote working, and the increased sophistication and activities of organized crime, hackers, nation state supported organizations, terrorists, and other external parties. The methods used to obtain unauthorized access, disable or degrade
service or sabotage systems change frequently and often are not recognized until launched against a target. We may be unable to anticipate these techniques or to implement adequate preventative measures. Further, computer viruses or malware could infiltrate our systems and disrupt our delivery of services making our applications unavailable. Although we utilize several preventative and detective security controls in our network, they may be ineffective in preventing computer viruses or malware that could damage our relationships with our merchant customers, cause a decrease in transactions by individual cardholders, or cause us to be in non-compliance with applicable network rules and regulations. In addition, a significant incident of fraud or an increase in fraud levels generally involving our products could result in reputational damage to us, which could reduce the use of our products and services. Such incidents of fraud could also lead to regulatory intervention, which could increase our compliance costs. Compliance with the various complex laws and regulations is costly and time consuming, and failure to comply could have a material adverse effect on our business. Additionally, increased regulatory requirements on our services may increase our costs, which could materially and adversely affect our business, financial condition and results of operations. Accordingly, account data breaches and related fraudulent activity could have a material adverse effect on our future growth prospects, business, financial condition and results of operations.
Our operations rely on the secure processing, transmission and storage of confidential information in our computer systems and networks. Although we believe we have robust information security procedures and controls, our encryption software, systems, vendors, and our customers’ devices themselves may become the target of cyber-attacks or information security breaches. Such events could result in the unauthorized release, gathering, monitoring, misuse, unavailability, loss, or destruction of our or our customers’ confidential, proprietary and other information, or otherwise disrupt our or our customers’ business operations. As cyber threats continue to evolve, we may be required to expend significant additional resources to continue to modify or enhance our protective measures or to investigate and remediate any information security vulnerabilities.
We are under continuous threat of loss due to organized cyber-attacks involving unauthorized access, computer hackers, computer viruses, malicious code, and other security problems and system disruptions as we continue to expand client capabilities to utilize internet and other remote channels to transact business. We have invested and intend to continue to devote significant resources to the security of our computer systems, but they may still be vulnerable to these threats. A user who circumvents security measures can misappropriate confidential or proprietary information, including information regarding us, our personnel and/or our clients, or cause interruptions or malfunctions in operations. The occurrence of any cyber-attack or information security breach could result in significant potential liabilities to customers and other third- parties, reputational damage, the disruption of our operations and regulatory concerns, all of which could materially and adversely affect our business, financial condition or results of operations. The harm to our business could be even greater if such an event occurs during a period of disproportionately heavy demand for our products or services or traffic on our systems or networks.
The financial services industry is undergoing rapid technological changes and we may not have the resources to implement new technology to stay current with these changes.
In addition to better serving customers, the effective use of technology increases efficiency and enables financial institutions to reduce costs. Our future success will depend, in part, upon our ability to address the technological needs of our customers that will satisfy client demands for convenience in addition to providing secure electronic environments. As we continue to grow and expand our market area, part of our growth strategy is to focus on expanding market share and product offerings through partnerships with financial technology companies that will supplement our existing offerings, such as blockchain-based products and/or financial solutions supported by artificial intelligence. These technological advances are intended to allow us to acquire new customers and generate additional core deposits at a lower cost. Many of our larger competitors have substantially greater resources to invest, and have invested significantly more than us, in technological improvements. As a result, they may be able to offer additional or more convenient products compared to those that we will be able to provide, which would put us at a competitive disadvantage. Accordingly, we may not be able to effectively implement new technology-driven products and services or be successful in marketing such products and services to our customers, which could impair our growth and profitability.
The nature of technology-driven disruption to our industry is changing, in some cases seeking to displace traditional financial service providers rather than merely enhancing traditional services or their delivery.
Technological innovation has expanded the overall market for banking services while siphoning a portion of the revenues from those services away from banks and disrupting prior methods of delivering those services. Certain recent innovations, however, may tend to replace traditional banks as financial service providers rather than merely augment those services. Similarly, innovations based on blockchain technology eventually may be the foundation for enhancing transactional security and facilitating payments throughout the banking industry, but also eventually may reduce the need for banks as secure deposit-keepers and intermediaries.
To thrive as our industry continues to change, we may need to embrace technological evolution and innovations and redefine the customs of a traditional bank, while also maintaining our commitment to our community banking approach. As a result, this type of transition creates implementation risk. In this process, it is and will continue to be critical that we understand and appreciate our clients’ experiences interacting with us and our systems, including those clients who desire traditionally-delivered services provided through our community-banking model, those who seek and embrace the latest innovations, and those who want services to be convenient, personalized, and understandable.
We are subject to certain operational risks, including, but not limited to, client or employee fraud.
Employee errors and employee and client misconduct could subject us to financial losses or regulatory sanctions and seriously harm our reputation. Misconduct by our employees could include hiding unauthorized activities from us, improper or unauthorized activities on behalf of our customers or improper use of confidential information. It is not always possible to prevent employee errors and misconduct, and the precautions we take to prevent and detect this activity may not be effective in all cases. Employee errors could also subject us to financial claims for negligence. Check fraud perpetrated by others who are not employees or clients could also result in financial losses. We maintain a system of internal controls and insurance coverage to mitigate against these operational risks. If our internal controls fail to prevent or detect an occurrence, or if any resulting loss is not insured or exceeds applicable insurance limits, it could have a material adverse effect on our business, financial condition, or results of operations.
We rely heavily upon information supplied by third-parties, including information contained in credit applications, property appraisals, title information, equipment pricing and valuation and employment and income documentation, in deciding which loans we originate, as well as the terms of those loans. If any such data is misrepresented, either fraudulently or inadvertently, and the misrepresentation is not detected prior to asset funding, the value of the asset may be significantly lower than expected, or we may fund a loan that we would not have funded or on terms we would not have extended.
The impact of widespread health emergencies, catastrophic events, or natural disasters adversely affect our business, financial condition, liquidity, and results of operations.
A significant portion of our business is in the Southeast and includes areas which are susceptible to weather-related events such as tornadoes, floods, droughts, and fires. Pandemics may impact global, national, and/or local economies, disrupt global supply chains, or create significant volatility and disruption in financial markets. Such events can disrupt our operations and negatively affect our business and the economies in which we operate. These events may also have a negative impact on the financial condition of our clients, which may decrease revenues from those clients and increase the credit risk associated with loans and other credit exposures to those clients.
In addition, geopolitical matters such as international trade disputes, political unrest, cyber-attacks or campaigns, and slow growth in the global economy, as well as acts of terrorism, war, and other violence could result in disruptions in the financial markets or the markets that we serve. These negative events could have a material adverse effect on our results of operations or financial condition and may affect our ability to access capital.
STRATEGIC AND OTHER BUSINESS RISKS
Our strategy of pursuing acquisitions exposes us to risk.
We intend to pursue a strategy that includes acquisition and consolidation opportunities within our core markets and beyond. The market for any such acquisition targets is highly competitive, which may adversely affect our ability to find acquisition candidates that fit our strategy and our standards. Acquisitions of financial institutions also involve operational risks and uncertainties, such as the time and expense associated with identifying and evaluating potential acquisition targets and negotiating terms or potential transactions, which could result in our attention being diverted from the operation of our existing business. Also, all acquisitions are subject to various regulatory approvals, and if we were unable to obtain such approvals for any reason, it would impair our ability to consummate acquisitions.
We have a shareholder who owns a significant portion of our stock and that shareholder’s interests in our business may be different than our other shareholders.
Mr. Ayers, the Company's former Chairman, currently owns approximately 23% of our common stock. Further, Mr. Ayers has the right under the shareholder's agreement, by and between the Company and Mr. Ayers and entered into in connection with the Company's initial public offering, to designate up to 20% of our directors and at least one member of the nominating and corporate governance and compensation committees of our board of directors for so long as permitted under applicable law. So long as Mr. Ayers continues to own a significant portion of our common stock, he will have the ability to influence the vote in any election of directors and will have the ability to significantly influence a vote regarding a transaction that requires shareholder approval regardless of whether others believe the transaction is in our best interests. In any of these matters, the interests of Mr. Ayers may differ from or conflict with the interests of our other shareholders.
Moreover, this concentration of stock ownership may also adversely affect the trading price of our common stock to the extent investors perceive disadvantages in owning stock of a company with a significant shareholder.
We could be required to write down goodwill and other intangible assets.
At December 31, 2024, our goodwill and other identifiable intangible assets were $248.3 million. Under current accounting standards, if we determine goodwill or intangible assets are impaired because, for example, the acquired business does not meet projected revenue targets or credit losses are dramatically higher than anticipated, we are required to write down the carrying value of these assets. We conduct a review at least annually to determine whether goodwill is impaired. Our goodwill impairment evaluation indicated no impairment of goodwill for our reporting segments. We cannot provide assurance, however, that we will not be required to take an impairment charge in the future. Any impairment charge would have an adverse effect on our shareholders' equity and financial results and could cause a decline in our stock price.
GENERAL RISKS
We face strong competition from financial services companies and other companies that offer banking services.
We conduct our banking operations primarily in Tennessee, with our largest market being the Nashville MSA, which is a highly competitive banking market. Many of our competitors offer the same, or a wider variety of, banking services within our market areas, and we compete with them for the same customers. These competitors include banks with nationwide operations, regional banks and community banks. In many instances these national and regional banks have greater resources than we do, and the smaller community banks may have stronger ties in local markets than we do, which may put us at a competitive disadvantage. We also face competition from many other types of financial institutions, including thrift institutions, finance companies, brokerage firms, insurance companies, credit unions, mortgage banks and other internet-based companies offering financial services which enjoy fewer regulatory constraints and some may have lower cost structures. In addition, a number of out-of-state financial institutions have opened offices and solicit deposits in our market areas. Increased competition in our markets may result in reduced loans and deposits, as well as reduced net interest margin and profitability. If we are unable to attract and retain banking customers, we may be unable to continue to grow our loan and deposit portfolios, and our business, financial condition or results of operations may be adversely affected.
Further, a number of larger banks continue to enter the Nashville MSA, and we believe this trend will continue as banks look to gain a foothold in this growing market. This trend will likely result in greater competition in and may impair our ability to grow our share of our largest market.
Holders of our subordinated debentures have rights that are senior to those of our common shareholders.
We have supported a portion of our growth through the issuance of subordinated notes which are senior in rank to our shares of common stock. As a result, we must make payments on the subordinated notes before any dividends can be paid on our common stock and, in the event of our bankruptcy, dissolution or liquidation, the holders of the subordinated notes must be satisfied before any distributions can be made on our common stock.
New lines of business, products, product enhancements or services may subject us to additional risks.
From time to time, we may implement or acquire new lines of business or offer new products and product enhancements as well as new services within our existing lines of business. There are substantial risks and uncertainties associated with these efforts. In acquiring, developing or marketing new lines of business, products, product enhancements or services, we may invest significant time and resources, although there is no guarantee that these new lines of business, products, product enhancements or services will be successful or that we will realize their expected benefits. Further, initial timetables for the introduction and development of new lines of business, products, product enhancements or services may not be achieved, and price and profitability targets may not prove feasible. External factors, such as compliance with regulations, competitive alternatives and shifting market preferences, may also impact the ultimate implementation and success of new lines of business or offerings of new products, product enhancements or services. Furthermore, any new line of business, product, product enhancement or service could have a significant impact on the effectiveness of our system of internal controls. Failure to successfully manage these risks in the development and implementation of new lines of business or offerings of new products, product enhancements or services could have a material adverse effect on our business, financial condition or results of operation.
Consumers may decide not to use banks to complete their financial transactions.
Technology and other changes are allowing parties to complete, through alternative methods and delivery channels, financial transactions that historically have involved banks. For example, consumers can now maintain funds that would have historically been held as bank deposits in brokerage accounts, mutual funds with an Internet-only bank, or with virtually any bank in the country through online or mobile banking. Consumers can also complete transactions such as purchasing goods and services, paying bills and/or transferring funds directly without the assistance of banks by transacting through non-bank enterprises or through the use of emerging payment technologies such as cryptocurrencies.
The process of eliminating banks as intermediaries could result in the loss of fee income, as well as the loss of customer deposits and the related income generated from those deposits. The loss of these revenue streams and the lower-cost deposits as a source of funds could have an adverse effect on our financial condition, results of operations and liquidity.
We depend on the accuracy and completeness of information about customers.
In deciding whether to extend credit or enter certain transactions, we rely on information furnished by or on behalf of customers, including financial statements, credit reports, tax returns and other financial information. We may also rely on representations of those customers or other third-parties, such as independent auditors, as to the accuracy and completeness of that information. Reliance on inaccurate or misleading personal information, financial statements, credit reports, tax returns or other financial information, including information falsely provided because of identity theft, could have an adverse effect on our business, financial condition and results of operations.
Negative publicity could impact our reputation.
Reputational risk is inherent in our business. Negative public opinion could adversely affect our ability to keep and attract customers and could expose us to adverse legal and regulatory consequences. Negative public opinion could result from our actual, alleged, or perceived conduct related to employees or banking practices. Such negative public opinion could ultimately impact our earnings and stock price.
Negative developments affecting the banking industry may erode client confidence in the banking system.
Any future bank failures like those experienced in 2023 or similar events may negatively impact client confidence in the safety and soundness of community banks and may generate market volatility among publicly traded bank holding companies and, in particular, community and regional banks. As a result, some clients have chosen, and may continue to choose, to maintain deposits with larger financial institutions or invest in higher yielding short-term fixed income securities, all of which could materially adversely impact the Company's liquidity, loan funding capacity, net interest margin, capital, and results of operations. While the Treasury, the Federal Reserve, and the FDIC have historically taken action to ensure that depositors of failed banks had access to their deposits, including uninsured deposit accounts, there is no guarantee that bank failures or bank runs will not occur in the future and, if they were to occur, they may have a material adverse impact on client and investor confidence in community and regional banks, negatively impacting our liquidity, capital, results of operations, and stock price.
ITEM 1B - Unresolved Staff Comments
None.
ITEM 1C- Cybersecurity
Cyber risk management and strategy
The Bank recognizes the critical importance of developing, implementing, assessing, and maintaining appropriate cybersecurity measures to safeguard information systems and protect the confidentiality, integrity, and availability of data. The Risk Committee of the Board of Directors oversees management's processes for identifying and mitigating risks, including cybersecurity risks. The Chief Information Security Officer with experience in information technology and cybersecurity, is primarily responsible for implementing cyber risk mitigation strategies and is supported by a team of skilled professionals holding cybersecurity-related certifications.
To ensure the robustness of cybersecurity strategies, the Bank actively collaborates with external experts, including cybersecurity assessors, consultants, and auditors, who provide specialized knowledge and insights. These partnerships include regular audits, threat assessments, and consultations on security enhancements. The Bank’s CISO regularly briefs the Risk Committee of the Board of Directors on cybersecurity and information security posture.
Cybersecurity risk management is integrated into the Bank’s broader risk management framework to foster a company-wide culture of cybersecurity awareness. Key risk indicators, aligned with the Board-approved Statement of Risk Appetite, are reported quarterly to multiple management level committees and the Risk Committee of the Board of Directors. This process ensures timely communication and escalation of issues along with the required mitigation and remediation efforts related to cybersecurity risks.
Given the risks associated with third-party service providers, thorough assessments are conducted before engagement and ongoing monitoring is maintained to ensure compliance with organizational standards. Elements of the assessment include cyber, financial, reputational, compliance, legal, strategic and operational reviews. The Third-Party Risk Management department, reporting directly to our CISO, oversees this critical process.
To further strengthen the Bank’s preparedness, cybersecurity insurance coverage is maintained with coverage levels periodically reviewed to ensure alignment with the risk appetite.
While robust cybersecurity measures have been implemented, the Bank has not experienced any material impacts from cybersecurity threats to date. This is not a guarantee that potential future events will be immaterial. The evolving nature of cyber threats means that new risks will emerge. These threats could potentially affect the Bank’s business strategy, operations, or financial condition. For potential impacts of future threats, refer to “Item 1A - Risk Factors - Technology and Operational Risks.”
Cybersecurity governance
The Bank has implemented a comprehensive set of information security policies, standards, and related training programs to promote awareness and prevention of cybersecurity risks. All employees are required to:
•Review and acknowledge the information security framework upon hiring.
•Formally review and understand updates to these policies.
•Complete annual training sessions addressing data privacy and security, password protection, internet use, social engineering risks, and other key cybersecurity topics.
These efforts ensure employees remain vigilant and informed about evolving threats and best practices.
The Bank’s information security program undergoes rigorous internal and external auditing. The internal audit team and bank examiners conduct annual reviews to evaluate program’s effectiveness and risk mitigation efforts. Additionally, external auditors assess specific components of the information security program as part of the annual financial statements audit. The program is designed in accordance with the National Institute of Standards and Technology guidelines and the Cyber Risk Institute Profile recommended by the American Bankers Association underscoring our commitment to maintaining a strong cybersecurity governance framework.
ITEM 2 - Properties
Our principal executive offices and FirstBank’s main office are located at 1221 Broadway, Suite 1300 Nashville, Tennessee. We have banking locations in the Tennessee metropolitan markets of Nashville, Chattanooga, Knoxville, Memphis, and Jackson in addition to the metropolitan markets of Birmingham, Huntsville and Florence, Alabama and Bowling Green, Kentucky. As of December 31, 2024, we operated 77 full-service bank branches and 8 limited service branch locations throughout our geographic market areas as well as 12 mortgage offices throughout the southeastern United States. We also operate in 17 community markets throughout our footprint. See “Item 1. Business – Our Markets” for more detail. We own 66 of these locations and lease our other locations, which include nearly all of our mortgage offices and our principal executive office. We believe that our offices and banking locations are suitable and adequate for our current business operations.
ITEM 3 - Legal Proceedings
Various legal proceedings to which FB Financial Corporation or a subsidiary of FB Financial Corporation is party arise from time to time in the normal course of business. As of the date hereof, there are no material pending legal proceedings to which FB Financial Corporation or any of its subsidiaries is a party or of which any of its or its subsidiaries' assets or properties are subject.
ITEM 4 - Mine Safety Disclosures
Not applicable.
PART II
ITEM 5. Market for Registrant’s Common Equity, Related Stockholder Matters and Issuer Purchases of Equity Securities.
Market Information and Holders of Record
FB Financial Corporation's common stock is traded on the New York Stock Exchange under the symbol “FBK” and has traded on that market since September 16, 2016.
The Company had approximately 2,304 stockholders of record as of February 11, 2025. A substantially greater number of holders of FBK common stock are “street name” or beneficial holders, whose shares of record are held by banks, brokers and other financial institutions.
Stock Performance Graph
The performance graph and table below compares the cumulative total stockholder return on the common stock of the Company with the cumulative total return on the equity securities included in the Standard & Poor’s 500 Index (S&P 500), which reflects overall stock market performance and the S&P 500 Bank Industry Group, which is a Global Industry Classification Standard Level 2 industry group consisting of 13 regional and national publicly traded banks. The graph assumes an initial $100 investment on December 31, 2019 through December 31, 2024. Data for the S&P 500 and S&P 500 Bank Industry Group assumes reinvestment of dividends. Returns are shown on a total return basis. The performance graph represents past performance and should not be considered to be an indication of future performance. The information in this paragraph and the following stock performance graph shall not be deemed to be “soliciting material” or to be “filed” with the SEC or subject to Regulation 14A or 14C, other than as provided in Item 201 of Regulation S-K, or to the liabilities of Section 18 of the Exchange Act, except to the extent that we specifically request that such information be treated as soliciting material or specifically incorporate it by reference into a filing under the Securities Act or the Exchange Act.

| | | | | | | | | | | | | | | | | | | | |
| | Index |
| | FB Financial Corporation | | S&P 500 Total Return Index | | S&P 500 Bank Total Return Index |
| 12/31/2019 | | 100.00 | | | 100.00 | | | 100.00 | |
| 12/31/2020 | | 88.86 | | | 118.40 | | | 86.25 | |
| 12/31/2021 | | 113.30 | | | 152.39 | | | 116.82 | |
| 12/31/2022 | | 94.61 | | | 124.79 | | | 94.38 | |
| 12/31/2023 | | 106.30 | | | 157.59 | | | 104.73 | |
| 12/31/2024 | | 139.68 | | | 197.02 | | | 144.74 | |
Source: S&P Global Market Intelligence
Dividends
We declared cash dividends on our common stock of $0.68 per share for the year ended December 31, 2024, compared to $0.60 per share for the year ended December 31, 2023. The timing and amount of future dividends are at the discretion of the Board of Directors and will depend upon a number of factors including general and economic conditions, industry standards, our financial condition and operating results, our available cash and current and anticipated cash needs, capital requirements, banking regulations, contractual, legal, tax and regulatory restrictions and implications on the payment of dividends by us to our shareholders or by the Bank to us, and such other factors as our Board of Directors may deem relevant. Our Board of Directors anticipates that we will continue to pay quarterly dividends in amounts determined based on the factors discussed above. However, there can be no assurance that we will continue to pay dividends on our common stock at the current levels or at all. For a more complete discussion on the restrictions on dividends, see “Business: Supervision and regulation: Regulation of the Company and the Bank: Restrictions on dividends” and Note 13 “Dividend restrictions” in the notes to the consolidated financial statements.
Stock Repurchase Program
The following table provides information about repurchases of common stock by the Company during the quarter ended December 31, 2024:
| | | | | | | | | | | | | | |
| Period | (a)
Total number of shares purchased | (b)
Average price paid per share | (c)
Total number of shares purchased as part of publicly announced plans or programs | (d) Maximum number (or approximate dollar value) of shares that may yet be purchased under the plans or programs (1) |
| October 1 - October 31 | — | | $ | — | | — | | $ | 87,300,693 | |
| November 1 - November 30 | — | | — | | — | | 87,300,693 | |
| December 1 - December 31 | — | | — | | — | | 87,300,693 | |
| Total | — | | $ | — | | — | | $ | 87,300,693 | |
(1) Amounts are inclusive of commissions and fees related to the stock repurchases.On March 21, 2024, the Company announced that its board of directors re-authorized the Company’s stock repurchase program pursuant to which the Company may purchase up to $100 million in shares of the Company’s issued and outstanding common stock. The Company purchased 353,286 shares pursuant to this plan during the year ended December 31, 2024. The purchase authorizations granted under the repurchase plan will terminate either on the date on which the maximum dollar amount is repurchased under the new repurchase plan or on January 31, 2026, whichever date occurs earlier. The repurchase plan will be conducted pursuant to a written plan and is intended to comply with Rule 10b-18 promulgated under the Securities Exchange Act of 1934, as amended.
Sale of Equity Securities
The Company did not sell any unregistered equity securities during 2024.
ITEM 6 — [RESERVED]
ITEM 7 — Management's Discussion and Analysis of Financial Condition and Results of Operations
Overall Objective
The following is a discussion of our financial condition at December 31, 2024 and 2023, and our results of operations for the years ended December 31, 2024 and 2023, and should be read in conjunction with our audited consolidated financial statements included elsewhere herein. The purpose of this discussion is to focus on information about our financial condition and results of operations which is not otherwise apparent from our consolidated financial statements. This discussion and analysis contains forward-looking statements that are subject to certain risks and uncertainties and are based on certain assumptions that we believe are reasonable but may prove to be inaccurate. Certain risks, uncertainties and other factors, including those set forth in the “Cautionary note regarding forward-looking statements” and “Risk Factors” sections of this Annual Report, may cause actual results to differ materially from those projected results discussed in the forward-looking statements appearing in this discussion and analysis. We assume no obligation to update any of these forward-looking statements. Discussion and analysis of our financial condition and results of operations for the years ended December 31, 2023 and 2022 are included in the respective sections within “Item 7 - Management's Discussion and Analysis of Financial Condition and Results of Operations” of our Annual Report filed on Form 10-K with the SEC for the year ended December 31, 2023.
Overview
We are a financial holding company headquartered in Nashville, Tennessee. We operate primarily through our wholly-owned bank subsidiary, FirstBank. FirstBank provides a comprehensive suite of commercial and consumer banking services to clients in select markets in Tennessee, Kentucky, Alabama and North Georgia. As of December 31, 2024, our footprint included 77 full-service branches serving the following Tennessee Metropolitan Statistical Areas: Nashville, Chattanooga (including North Georgia), Knoxville, Memphis, and Jackson in addition to Bowling Green, Kentucky and Birmingham, Florence and Huntsville, Alabama. We also provide banking services to 17 community markets throughout Tennessee, Alabama and North Georgia. During the year ended December 31, 2024, the Company announced expansions into the Tuscaloosa, Alabama and Asheville, North Carolina markets. FirstBank also provides mortgage banking services utilizing its bank branch network and mortgage banking offices strategically located throughout the southeastern United States. As of December 31, 2024, we had total assets of $13.16 billion, loans held for investment of $9.60 billion, total deposits of $11.21 billion, and total shareholders’ equity of $1.57 billion.
We operate through two segments, Banking and Mortgage. We generate most of our revenue in our Banking segment from interest on loans and investments, loan-related fees, trust and investment services and deposit-related fees. Our primary source of funding for our loans is customer deposits, and, to a lesser extent, unsecured credit lines, brokered deposits, and other borrowings. We generate most of our revenue in our Mortgage segment from origination fees and gains on sales in the secondary market of mortgage loans, as well as from mortgage servicing revenues.
Key factors affecting our business
Interest rates
Net interest income is the largest contributor to our net income and is the difference between the interest and fees earned on interest-earning assets (primarily loans, investment securities and interest-bearing deposits with other financial institutions) and the interest expense incurred in connection with interest-bearing liabilities (primarily deposits and borrowings). The level of net interest income is primarily a function of the average balance of interest-earning assets, the average balance of interest-bearing liabilities and the spread between the contractual yield on such assets and the contractual cost of such liabilities. These factors are influenced by both the pricing and mix of interest-earning assets and interest-bearing liabilities which, in turn, are impacted by external factors such as local economic conditions, competition for loans and deposits, the monetary policy of the Federal Reserve Board and market interest rates.
The cost of our deposits and short-term wholesale borrowings is largely based on short-term interest rates, which are primarily driven by the Federal Reserve’s actions. The yields generated by our loans and securities are typically driven by short-term and long-term interest rates, which are market driven and are, at times, heavily influenced by the Federal Reserve’s actions. The level of net interest income is therefore influenced by movements in such interest rates and the pace at which such movements occur.
Interest rates increased throughout the year ended December 31, 2024. Volatile interest rates could have significant adverse effects on the earnings, financial condition and results of operations of the Company.
For additional information regarding our interest rate risks factors and management, see “Business: Risk management:
Liquidity and interest rate risk management” and “Risk factors: Risks related to our business.”
Credit trends
We focus on originating quality loans and have established loan approval policies and procedures to assist us in upholding the overall credit quality of our loan portfolio. However, credit trends in the markets in which we operate and in our loan portfolio can materially impact our financial condition and performance and are primarily driven by the economic conditions in our markets.
During 2024, our percentage of total nonperforming loans to loans HFI increased to 0.87% as of December 31, 2024, from 0.65% as of December 31, 2023. Our classified loans increased to 1.15% of loans HFI as of December 31, 2024, compared to 0.74% as of December 31, 2023. Our nonperforming assets as of December 31, 2024 were $121.9 million, or 0.93% of total assets compared to $86.5 million, or 0.69% of assets as of December 31, 2023.
Our provisions for credit losses resulted in an expense of $12.0 million for the year ended December 31, 2024 compared to $2.5 million for the year ended December 31, 2023. For the year ended December 31, 2024, our provision for credit losses was comprised of $14.7 million of provision for credit losses on loans HFI and $2.7 million related to reversals of credit losses on unfunded commitments. The current period expense is the result of changes to the overall loan portfolio, including both growth and changes in portfolio composition, an increase in net charge-offs and slight deterioration in economic forecasts which impacted our loss estimation process. These evaluations weighed the impact of the current economic outlook, including unemployment and gross domestic product, as well as macroeconomic events which may impact our loan portfolio, such as supply chain concerns and global conflicts. See further discussion under the subheading “Allowance for credit losses.”
For additional information regarding credit quality risk factors for our Company, see “Item 1. Business: Risk management: Credit risk management” and “Item 1A. Risk factors: Credit Risks.”
Competition
Our profitability and growth are affected by the highly competitive nature of the financial services industry. We compete with commercial banks, savings banks, credit unions, non-bank financial services companies, online mortgage providers, internet banks and other financial institutions operating within the areas we serve, particularly with national and regional banks that often have more resources than we do to invest in growth and technology and community banks with strong local ties, all of which target the same clients we do. We have seen increased competitive pressures on deposit rates. Continued deposit pricing pressure may continue to affect our financial results in the future.
For additional information, see “Item 1. Business: Our markets,” “Business: Competition” and “Item 1A. Risk factors: Risks related to our business.”
Regulatory trends and changes in laws
We are subject to extensive regulation and supervision, which continue to evolve as the legal and regulatory framework governing our operations continues to change. The current operating environment also has heightened supervisory expectations in areas such as consumer compliance, BSA and anti-money laundering compliance, risk management and internal audit. We expect to incur increased costs for compliance, risk management and audit personnel or professional fees associated with advisors and consultants due the current economic environment.
As described further under “Business: Supervision and regulation,” we are subject to a variety of laws and regulations, including the Dodd-Frank Act. See also “Item 1A. Risk factors: Legal, regulatory and compliance risk.”
Financial highlights
The following table presents certain selected historical consolidated income statement data and key indicators as of the dates or for the years indicated. Our historical results for any prior period are not necessarily indicative of results to be expected in any future period.
| | | | | | | | | | | | | | | | | | | | | | | | |
| | | | | | |
| | As of or for the years ended December 31, | | | | |
| (Dollars in thousands, except per share data) | | 2024 | | | 2023 | | | 2022 | | | | | |
| Selected Balance Sheet Data | | | | | | | | | | |
| Cash and cash equivalents | | $ | 1,042,488 | | | $ | 810,932 | | | $ | 1,027,052 | | | | | |
| Investment securities, at fair value | | 1,538,008 | | | 1,471,973 | | | 1,474,176 | | | | | |
| Loans held for sale | | 126,760 | | | 67,847 | | | 139,451 | | | | | |
| Loans HFI | | 9,602,384 | | | 9,408,783 | | | 9,298,212 | | | | | |
| Allowance for credit losses on loans HFI | | (151,942) | | | (150,326) | | | (134,192) | | | | | |
| | | | | | | | | | |
| Total assets | | 13,157,482 | | | 12,604,403 | | | 12,847,756 | | | | | |
| Interest-bearing deposits (non-brokered) | | 8,625,113 | | | 8,179,430 | | | 8,178,453 | | | | | |
| Brokered deposits | | 469,089 | | | 150,475 | | | 750 | | | | | |
| Noninterest-bearing deposits | | 2,116,232 | | | 2,218,382 | | | 2,676,631 | | | | | |
| | | | | | | | | | |
| Total deposits | | 11,210,434 | | | 10,548,287 | | | 10,855,834 | | | | | |
| | | | | | | | | | |
| | | | | | | | | | |
| | | | | | | | | | |
| Borrowings | | 176,789 | | | 390,964 | | | 415,677 | | | | | |
| Allowance for credit losses on unfunded commitments | | 6,107 | | | 8,770 | | | 22,969 | | | | | |
| Total common shareholders' equity | | 1,567,538 | | | 1,454,794 | | | 1,325,425 | | | | | |
| Selected Statement of Income Data | | | | | | | | | | |
| Total interest income | | $ | 725,538 | | | $ | 678,410 | | | $ | 481,422 | | | | | |
| Total interest expense | | 309,035 | | | 271,193 | | | 69,187 | | | | | |
| Net interest income | | 416,503 | | | 407,217 | | | 412,235 | | | | | |
| Provisions for credit losses | | 12,004 | | | 2,539 | | | 18,982 | | | | | |
| Total noninterest income | | 39,070 | | | 70,543 | | | 114,667 | | | | | |
| Total noninterest expense | | 296,899 | | | 324,929 | | | 348,346 | | | | | |
| Income before income taxes | | 146,670 | | | 150,292 | | | 159,574 | | | | | |
| Income tax expense | | 30,619 | | | 30,052 | | | 35,003 | | | | | |
| Net income applicable to noncontrolling interest | | 16 | | | 16 | | | 16 | | | | | |
| Net income applicable to FB Financial Corporation | | $ | 116,035 | | | $ | 120,224 | | | $ | 124,555 | | | | | |
| | | | | | | | | | |
| Net interest income (tax-equivalent basis) | | $ | 419,091 | | | $ | 410,562 | | | $ | 415,282 | | | | | |
| Per Common Share | | | | | | | | | | |
| Basic net income | | $ | 2.48 | | | $ | 2.57 | | | $ | 2.64 | | | | | |
| Diluted net income | | 2.48 | | | 2.57 | | | 2.64 | | | | | |
Book value(1) | | 33.59 | | | 31.05 | | | 28.36 | | | | | |
Tangible book value(2) | | 28.27 | | | 25.69 | | | 22.90 | | | | | |
| Cash dividends declared | | 0.68 | | | 0.60 | | | 0.52 | | | | | |
| | | | | | | | | | |
| | | | | | | | | | |
| | | | | | | | | | |
| | | | | | | | | | |
| | | | | | | | | | |
| | | | | | | | | | |
| | |
| Selected Ratios | | | | | | | | | | |
| Return on average: | | | | | | | | | | |
Assets(3) | | 0.91 | % | | 0.95 | % | | 1.01 | % | | | | |
Shareholders' equity(3) | | 7.71 | % | | 8.74 | % | | 9.23 | % | | | | |
Tangible common equity(2) | | 9.24 | % | | 10.7 | % | | 11.4 | % | | | | |
| | | | | | | | | | |
| Efficiency ratio | | 65.2 | % | | 68.0 | % | | 66.1 | % | | | | |
Core efficiency ratio (tax-equivalent basis)(2) | | 57.3 | % | | 62.9 | % | | 62.7 | % | | | | |
| Loans HFI to deposit ratio | | 85.7 | % | | 89.2 | % | | 85.7 | % | | | | |
| Noninterest-bearing deposits to total deposits | | 18.9 | % | | 21.0 | % | | 24.7 | % | | | | |
| Net interest margin (tax-equivalent basis) | | 3.51 | % | | 3.44 | % | | 3.57 | % | | | | |
| Yield on interest-earning assets | | 6.10 | % | | 5.72 | % | | 4.16 | % | | | | |
| Cost of interest-bearing liabilities | | 3.53 | % | | 3.16 | % | | 0.87 | % | | | | |
| Cost of total deposits | | 2.76 | % | | 2.39 | % | | 0.54 | % | | | | |
| | | | | | | | | | |
| | | | | | | | | | |
| | | | | | | | | | |
| | | | | | | | | | | | | | | | | | | | | | | | |
| | As of or for the years ended December 31, | | | | |
| | 2024 | | | 2023 | | | 2022 | | | | | |
| Credit Quality Ratios | | | | | | | | | | |
| Allowance for credit losses on loans HFI as a percentage of loans HFI | | 1.58 | % | | 1.60 | % | | 1.44 | % | | | | |
| Net charge-offs as a percentage of average loans HFI | | (0.14) | % | | (0.01) | % | | (0.02) | % | | | | |
| Nonperforming loans HFI as a percentage of loans HFI | | 0.87 | % | | 0.65 | % | | 0.49 | % | | | | |
Nonperforming assets as a percentage of total assets(4) | | 0.93 | % | | 0.69 | % | | 0.68 | % | | | | |
| | | | | | | | | | |
| | | | | | | | | | |
| | | | | | | | | | |
| | | | | | |
| | | | | | | | | | |
| Capital Ratios (Company) | | | | | | | | | | |
| Total common shareholders' equity to assets | | 11.9 | % | | 11.5 | % | | 10.3 | % | | | | |
Tangible common equity to tangible assets(2) | | 10.2 | % | | 9.74 | % | | 8.50 | % | | | | |
| Tier 1 Leverage | | 11.3 | % | | 11.3 | % | | 10.5 | % | | | | |
| Tier 1 Risk-Based Capital | | 13.1 | % | | 12.5 | % | | 11.3 | % | | | | |
| Total Risk-Based Capital | | 15.2 | % | | 14.5 | % | | 13.1 | % | | | | |
| Common Equity Tier 1 (CET1) | | 12.8 | % | | 12.2 | % | | 11.0 | % | | | | |
| | | | | | | | | | |
| | | | | | | | | | |
| | | | | | | | | | |
| | | | | | | | | | |
| | | | | | | | | | |
| | | | | | | | | | |
(1)Book value per share equals our total common shareholders’ equity divided by the number of shares of our common stock outstanding as of the date presented.
(2)Non-GAAP financial measure; See "GAAP reconciliation and management explanation of non-GAAP financial measures” and non-GAAP reconciliations herein.
(3)ROAA and ROAE is calculated by dividing net income or loss for that period by our average assets or average equity for the same period.
(4)Includes $31.4 million, $21.2 million and $26.2 million of optional rights to repurchase GNMA loans that meet certain defined delinquency criteria as of December 31, 2024, 2023 and 2022, respectively.
GAAP reconciliation and management explanation of non-GAAP financial measures
We identify certain financial measures discussed in this Report as being “non-GAAP financial measures.” The non-GAAP financial measures presented in this Report are adjusted efficiency ratio (tax-equivalent basis), tangible book value per common share, tangible common equity to tangible assets and return on average tangible common equity.
In accordance with the SEC's rules, we classify a financial measure as being a non-GAAP financial measure if that financial measure excludes or includes amounts, or is subject to adjustments that have the effect of excluding or including amounts, that are included or excluded, as the case may be, in the most directly comparable measure calculated and presented in accordance with GAAP as in effect from time to time in the United States in our consolidated statements of income, balance sheets or statements of cash flows.
The non-GAAP financial measures that we discuss in this Report should not be considered in isolation or as a substitute for the most directly comparable or other financial measures calculated in accordance with GAAP. Moreover, the manner in which we calculate the non-GAAP financial measures that we discuss in our selected historical consolidated financial data may differ from that of other companies reporting measures with similar names. You should understand how such other banking organizations calculate their financial measures similar or with names similar to the non-GAAP financial measures we have discussed in our selected historical consolidated financial data when comparing such non-GAAP financial measures. The following reconciliation tables provide a more detailed analysis of these, and reconciliation for, each of non-GAAP financial measures.
Core efficiency ratio (tax-equivalent basis)
The core efficiency ratio (tax-equivalent basis) is a non-GAAP measure that excludes certain gains (losses), merger and offering-related expenses and other selected items. Our management uses this measure in its analysis of our performance. Our management believes this measure provides a greater understanding of ongoing operations and enhances comparability of results with prior periods, as well as demonstrates the effects of significant gains and charges. The most directly comparable financial measure calculated in accordance with GAAP is the efficiency ratio.
The following table presents, as of the dates set forth below, a reconciliation of our core efficiency ratio (tax-equivalent basis) to our efficiency ratio:
| | | | | | | | | | | | | | | | | | | | | | | | |
| | Years Ended December 31, | | | | |
| (dollars in thousands) | | 2024 | | | 2023 | | | 2022 | | | | | |
| Core efficiency ratio (tax-equivalent basis) | | | | | | | | | | |
| Total noninterest expense | | $ | 296,899 | | | $ | 324,929 | | | $ | 348,346 | | | | | |
| Less early retirement, severance and other costs | | 1,478 | | | 8,449 | | | — | | | | | |
| Less loss (gain) on lease terminations | | — | | | 1,770 | | | (18) | | | | | |
| Less FDIC special assessment | | 500 | | | 1,788 | | | — | | | | | |
| Less mortgage restructuring | | — | | | — | | | 12,458 | | | | | |
| | | | | | | | | | |
| | | | | | | | | | |
| Core noninterest expense | | $ | 294,921 | | | $ | 312,922 | | | $ | 335,906 | | | | | |
| Net interest income | | $ | 416,503 | | | $ | 407,217 | | | $ | 412,235 | | | | | |
| Net interest income (tax-equivalent basis) | | 419,091 | | | 410,562 | | | 415,282 | | | | | |
| Total noninterest income | | 39,070 | | | 70,543 | | | 114,667 | | | | | |
| Less loss from securities, net | | (56,378) | | | (13,973) | | | (376) | | | | | |
Less loss on sales or write-downs of premises and equipment, other real estate
owned and other assets | | (2,167) | | | (27) | | | (265) | | | | | |
| Less cash life insurance benefit | | 2,057 | | | — | | | — | | | | | |
| Less loss on change in fair value on commercial loans held for sale | | — | | | (2,114) | | | (5,133) | | | | | |
| | | | | | | | | | |
| Core noninterest income | | $ | 95,558 | | | $ | 86,657 | | | $ | 120,441 | | | | | |
| Total revenue | | $ | 455,573 | | | $ | 477,760 | | | $ | 526,902 | | | | | |
| Core revenue (tax-equivalent basis) | | $ | 514,649 | | | $ | 497,219 | | | $ | 535,723 | | | | | |
| Efficiency ratio | | 65.2 | % | | 68.0 | % | | 66.1 | % | | | | |
| Core efficiency ratio (tax-equivalent basis) | | 57.3 | % | | 62.9 | % | | 62.7 | % | | | | |
Tangible book value per common share and tangible common equity to tangible assets
Tangible book value per common share and tangible common equity to tangible assets are non-GAAP measures that exclude the impact of goodwill and other intangibles used by the Company’s management to evaluate capital adequacy. Because intangible assets such as goodwill and other intangibles vary extensively from company to company, we believe that the presentation of this information allows investors to more easily compare the Company’s capital position to other companies. The most directly comparable financial measure calculated in accordance with GAAP is book value per common share and our total shareholders’ equity to total assets.
The following table presents, as of the dates set forth below, tangible common equity compared with total shareholders’ equity, tangible book value per common share compared with our book value per common share and common equity to tangible assets compared to total shareholders’ equity to total assets:
| | | | | | | | | | | | | | | | | | | | | | | | |
| | As of December 31, | | | | |
| (dollars in thousands, except share and per share data) | | 2024 | | | 2023 | | | 2022 | | | | | |
| Tangible assets | | | | | | | | | | |
| Total assets | | $ | 13,157,482 | | | $ | 12,604,403 | | | $ | 12,847,756 | | | | | |
| Adjustments: | | | | | | | | | | |
| Goodwill | | (242,561) | | | (242,561) | | | (242,561) | | | | | |
| Core deposit and other intangibles | | (5,762) | | | (8,709) | | | (12,368) | | | | | |
| Tangible assets | | $ | 12,909,159 | | | $ | 12,353,133 | | | $ | 12,592,827 | | | | | |
| Tangible common equity | | | | | | | | | | |
| Total common shareholders’ equity | | $ | 1,567,538 | | | $ | 1,454,794 | | | $ | 1,325,425 | | | | | |
| Adjustments: | | | | | | | | | | |
| Goodwill | | (242,561) | | | (242,561) | | | (242,561) | | | | | |
| Core deposit and other intangibles | | (5,762) | | | (8,709) | | | (12,368) | | | | | |
| Tangible common equity | | $ | 1,319,215 | | | $ | 1,203,524 | | | $ | 1,070,496 | | | | | |
| Common shares outstanding | | 46,663,120 | | | 46,848,934 | | | 46,737,912 | | | | | |
| Book value per common share | | $ | 33.59 | | | $ | 31.05 | | | $ | 28.36 | | | | | |
| Tangible book value per common share | | $ | 28.27 | | | $ | 25.69 | | | $ | 22.90 | | | | | |
| Total common shareholders’ equity to total assets | | 11.9 | % | | 11.5 | % | | 10.3 | % | | | | |
| Tangible common equity to tangible assets | | 10.2 | % | | 9.74 | % | | 8.50 | % | | | | |
Return on average tangible common equity
Return on average tangible common equity is a non-GAAP measure that uses average shareholders' equity and excludes the impact of goodwill and other intangibles. This measurement is used by the Company's management to provide a depiction of the Company's profitability without being impacted by its intangible assets, as intangible assets are not directly managed to generate earnings. The following table presents, as of the dates set forth below, reconciliations of total average tangible common equity to average shareholders' equity and return on average tangible common equity to return on average shareholders' equity:
| | | | | | | | | | | | | | | | | | | | | | | | |
| | Years Ended December 31, | | | | |
| (dollars in thousands) | | 2024 | | | 2023 | | | 2022 | | | | | |
| Return on average tangible common equity | | | | | | | | | | |
| Total average common shareholders’ equity | | $ | 1,505,739 | | | $ | 1,374,831 | | | $ | 1,349,583 | | | | | |
| Adjustments: | | | | | | | | | | |
| Average goodwill | | (242,561) | | | (242,561) | | | (242,561) | | | | | |
| Average intangibles, net | | (7,177) | | | (10,472) | | | (14,573) | | | | | |
| Average tangible common equity | | $ | 1,256,001 | | | $ | 1,121,798 | | | $ | 1,092,449 | | | | | |
| Net income applicable to FB Financial Corporation | | $ | 116,035 | | | $ | 120,224 | | | $ | 124,555 | | | | | |
| Return on average common shareholders' equity | | 7.71 | % | | 8.74 | % | | 9.23 | % | | | | |
| Return on average tangible common equity | | 9.24 | % | | 10.7 | % | | 11.4 | % | | | | |
Overview of recent financial performance
Year ended December 31, 2024 compared to the year ended December 31, 2023
Our net income decreased during the year ended December 31, 2024 to $116.1 million from $120.2 million for the year ended December 31, 2023. Diluted earnings per common share was $2.48 and $2.57 for the years ended December 31, 2024 and 2023, respectively. Our net income represented a return on average assets of 0.91% and 0.95% for the years ended December 31, 2024 and 2023, respectively, and a return on average equity of 7.71% and 8.74% for the same periods. Our ratio of return on average tangible common equity for the years ended December 31, 2024 and 2023 was 9.2% and 10.7%, respectively. See “GAAP reconciliation and management explanation of non-GAAP financial measures” in this Report for a discussion of tangible common equity and return on average tangible common equity.
During the year ended December 31, 2024, net interest income increased to $416.5 million compared with $407.2 million in the year ended December 31, 2023. Our net interest margin, on a tax-equivalent basis, increased to 3.51% for the year ended December 31, 2024 as compared to 3.44% for the year ended December 31, 2023. The increase in net interest margin was primarily driven by higher yields on interest-earning assets, particularly loans and taxable investment securities. This increase was partially offset by the cost of interest-bearing liabilities, primarily from money market and customer deposits.
Provision for credit losses on loans HFI and unfunded loan commitments was $12.0 million for the year ended December 31, 2024 compared $2.5 million for the year ended December 31, 2023 primarily due to a reversal of provision for credit losses on unfunded commitments of $2.7 million compared to $14.2 million during the year ended December 31, 2023. Refer to the section “Provision for credit losses” for additional information.
Noninterest income for the year ended December 31, 2024 decreased by $31.5 million to $39.1 million, down from $70.5 million for prior year period. The decrease in noninterest income was driven by a $56.4 million net loss on investment securities related to the sale of $526.4 million of AFS securities compared to a $14.0 million net loss on investment securities primarily related to the sale of $100.5 million of AFS securities for the year ended December 31, 2023. Refer to the section “Other earning assets” for additional information on the sale of the AFS securities. The decrease was partially offset by a $2.9 million increase in investment services and trust income, a $2.1 million increase in BOLI income resulting from proceeds from payment of death benefits, and a $1.9 million increase in equity investments income. Additionally, during the year ended December 31, 2023, a $2.1 million loss was recorded associated with the change in fair value of the commercial loans held for sale portfolio that was exited during the year ended December 31, 2023.
Noninterest expense decreased to $296.9 million for the year ended December 31, 2024, compared with $324.9 million for the year ended December 31, 2023. The decrease in noninterest expense is due to decreases in salaries, commissions and employee benefits of $19.6 million primarily related to the Company’s efficiency and scalability initiatives and updated methodology of deferrals for loan fees and loan origination expenses. Additionally, the decrease is reflective of decreases in occupancy, advertising, legal and professional expenses and franchise tax expense.
Year ended December 31, 2023 compared to year ended December 31, 2022
Our net income decreased during the year ended December 31, 2023 to $120.2 million from $124.6 million for the year ended December 31, 2022. Diluted earnings per common share was $2.57 and $2.64 for the years ended December 31, 2023 and 2022, respectively. Our net income represented a return on average assets of 0.95% and 1.01% for the years ended December 31, 2023 and 2022, respectively, and a return on average equity of 8.74% and 9.23% for the same periods. Our ratio of return on average tangible common equity for the years ended December 31, 2023 and 2022 was 10.7% and 11.4%, respectively. See “GAAP reconciliation and management explanation of non-GAAP financial measures” in this Report for a discussion of tangible common equity and return on average tangible common equity.
During the year ended December 31, 2023, net interest income decreased to $407.2 million compared with $412.2 million in the year ended December 31, 2022. Our net interest margin, on a tax-equivalent basis, decreased to 3.44% for the year ended December 31, 2023 as compared to 3.57% for the year ended December 31, 2022, influenced by rising interest rates increasing our total cost of funds compared to the increase in the interest income on interest-earning assets during the year ended December 31, 2023.
Provision for credit losses on loans HFI and unfunded loan commitments was $2.5 million for the year ended December 31, 2023 compared $19.0 million for the year ended December 31, 2022 primarily due to a reversal of provision for credit losses on unfunded commitments of $14.2 million compared to provision expense of $8.6 million during the year ended December 31, 2022. Refer to the section “Provision for credit losses” for additional information.
Noninterest income for the year ended December 31, 2023 decreased by $44.1 million to $70.5 million, down from $114.7 million for prior year period. The decrease in noninterest income was primarily driven by a decrease in mortgage banking income of $28.9 million to $44.7 million for the year ended December 31, 2023, compared to $73.6 million for the prior year period. These results were impacted by increasing interest rates, compressing margins and a decrease in demand for residential mortgages experienced through the industry during the year ended December 31, 2023 compared with the year ended December 31, 2022. The change was also impacted by the restructuring of our mortgage business, including the exit of our direct-to-consumer internet delivery channel during the year ended December 31, 2022. Additionally contributing to the decrease in noninterest income during the year ended December 31, 2023 was a $14.0 million net loss on investment securities primarily related to the sale of $100.5 million of AFS securities. Refer to the section “Other earning assets” for additional information on the sale of the AFS securities.
Noninterest expense decreased to $324.9 million for the year ended December 31, 2023, compared with $348.3 million for the year ended December 31, 2022. The decrease in noninterest expense is reflective of the $28.3 million decrease in salaries, commissions and employee-related costs namely in the Mortgage segment related to the restructuring of our Mortgage segment, reduced headcount and mortgage production. Additionally, this decrease in salaries, commission and employee-benefit related costs was partially offset by an $8.4 million increase in early retirement, severance and other costs related to our efficiency and scalability initiatives and $4.7 million in regulatory fees and assessments, which includes a $1.8 million FDIC special assessment associated with the bank failures earlier in 2023. Additionally, the decrease in noninterest expense reflects $12.5 million in mortgage restructuring expenses included in expenses in the year ended December 31, 2022.
Business segment highlights
We operate our business in two business segments: Banking and Mortgage. See Note 1, “Basis of presentation” and Note 18 “Segment reporting” in the notes to our consolidated financial statements for a description of these business segments.
Banking
Income before taxes from the Banking segment decreased for the year ended December 31, 2024 to $143.1 million, compared to $154.3 million for the year ended December 31, 2023. Net interest income increased by $9.5 million to $410.8 million during the year ended December 31, 2024 compared to $401.2 million during the year ended December 31, 2023. Provisions for credit losses on loans HFI and unfunded loan commitments resulted in $12.3 million of provision expense during the year ended December 31, 2024 compared to $2.6 million during the year ended December 31, 2023. The Banking segment recorded a noninterest loss of $8.4 million in the year ended December 31, 2024 as compared to income of $25.8 million in the year ended December 31, 2023. This decrease includes a net loss on investment securities of $56.4 million associated with the sale of $526.4 million AFS debt securities during the year ended December 31, 2024 compared with a net loss on investment securities of $14.0 million primarily related to the sale of $100.5 million of AFS debt securities for the year ended December 31, 2023. Noninterest expense decreased to $247.1 million for year ended December 31, 2024 compared to $270.1 million for the year ended December 31, 2023 due to decreases in salaries, occupancy, advertising, legal and professional fees and franchise tax expense.
Mortgage
Activity in our Mortgage segment resulted in a pre-tax net contribution of $3.6 million for the year ended December 31, 2024 compared to a $4.1 million pre-tax net loss for the year ended December 31, 2023. Net interest income was $5.7 million for the year ended December 31, 2024 compared to $6.0 million for the year ended December 31, 2023. Provisions for credit losses on loans HFI and unfunded loan commitments resulted in a reversal of $0.3 million of provision expense during the year ended December 31, 2024 compared to a reversal of $0.1 million of provision expense during the year ended December 31, 2023. Mortgage banking income increased $1.9 million to $46.6 million during the year ended December 31, 2024 compared to $44.7 million for the year ended December 31, 2023.
The components of mortgage banking income for the years ended December 31, 2024 and 2023 were as follows:
| | | | | | | | | | | | | | | | |
| | Years Ended December 31, |
| (dollars in thousands) | | 2024 | | | 2023 | | | |
| Mortgage banking income | | | | | | |
Gains and fees from origination and sale of mortgage
loans held for sale | | $ | 32,459 | | | $ | 32,470 | | | |
| Net change in fair value of loans held for sale and derivatives | | 1,241 | | | (1,815) | | | |
| Change in fair value on MSRs, net of hedging | | (16,278) | | | (16,226) | | | |
| Mortgage servicing income | | 29,212 | | | 30,263 | | | |
| Total mortgage banking income | | $ | 46,634 | | | $ | 44,692 | | | |
| | | | | | |
| | | | | | |
| | | | | | |
| | | | | | |
| | | | | | |
| Interest rate lock commitment volume | | $ | 1,459,494 | | | $ | 1,396,837 | | | |
| Interest rate lock commitment volume by purpose (%): | | | | | | |
| Purchase | | 84.1 | % | | 86.8 | % | | |
| Refinance | | 15.9 | % | | 13.2 | % | | |
| | | | | | |
| Mortgage sales | | $ | 1,173,066 | | | $ | 1,245,125 | | | |
| Mortgage sale margin | | 2.77 | % | | 2.61 | % | | |
| Closing volume | | $ | 1,222,606 | | | $ | 1,199,362 | | | |
| Outstanding principal balance of mortgage loans serviced | | $ | 10,235,048 | | | $ | 10,762,906 | | | |
Noninterest expense for the years ended December 31, 2024 and 2023 was $49.8 million and $54.8 million, respectively. This decrease is reflective of a decrease in salaries and employee benefits associated with our efficiency and scalability initiatives.
Results of operations
Throughout the following discussion of our operating results, we present our net interest income, net interest margin and core efficiency ratio on a fully tax-equivalent basis. The fully tax-equivalent basis adjusts for the tax-favored status of net interest income from certain loans and investments.
Our tax-exempt income is converted to a tax-equivalent basis by adjusting for the combined federal and blended state statutory income tax rate of 26.06% for the years ended December 31, 2024, 2023, and 2022.
Net interest income
Net interest income is the principle component of our earnings and represents the difference, or spread, between interest and fee income generated from earning assets and the interest expense paid on deposits and borrowed funds. Net interest income and margin are shaped by fluctuations in interest rates as well as changes in volume and mix of earning assets and interest-bearing liabilities.
During the year ended December 31, 2024, the U.S. Treasury yield curve continued its path towards normalization with steepening in the intermediate and longer term sectors of the yield curve as the Federal Reserve cut short-term interest rates 100 basis points near the end of the year and longer term yields increased. This is in contrast to the inverted U.S. Treasury yield curve exhibited during the year ended December 31, 2023. The Federal Funds Target Rate range was 4.25% - 4.50% and 5.25% - 5.50% as of December 31, 2024 and December 31, 2023, respectively.
Net interest income increased $8.5 million to $419.1 million for the year ended December 31, 2024 as compared to $410.6 million for the year ended December 31, 2023. Increases in interest income of $46.4 million were largely offset by increases in interest expense of $37.8 million for the year ended December 31, 2024 compared to the prior period. The increase in interest income for the current year period was driven by an increase in yields on average earning assets which reached 6.10% in the current year, as compared to 5.72% in the prior year. The increase in interest expense was due to both an increase in the rate paid on interest-bearing liabilities, which increased to 3.53% from 3.16%, and an increase in the average balance of interest-bearing liabilities of $151.0 million.
Interest income on loans HFI increased $26.8 million to $622.8 million for the year ended December 31, 2024 from $596.0 million for the year ended December 31, 2023 due primarily to increasing yields. The average yield on loans HFI increased by 26 basis points period-over-period to 6.64% for the year ended December 31, 2024 from 6.38% for the year ended December 31, 2023.
The components of our loan yield for the years ended December 31, 2024, 2023, and 2022 were as follows:
| | | | | | | | | | | | | | | | | | | | | | | | | | | | | | | | | | | | | | |
| | Years Ended December 31, |
| | 2024 | | | 2023 | | | 2022 | |
| (dollars in thousands) | | Interest
income | | Average
yield | | Interest
income | | Average
yield | | Interest
income | | Average
yield |
| Loans HFI yield components: | | | | | | | | | | | | |
Contractual interest rate on loans HFI(1) | | $ | 614,051 | | | 6.54 | % | | $ | 579,193 | | | 6.20 | % | | $ | 400,154 | | | 4.69 | % |
| Origination and other loan fee income | | 6,365 | | | 0.07 | % | | 14,675 | | | 0.15 | % | | 22,818 | | | 0.27 | % |
| Accretion (amortization) on purchased loans | | 657 | | | 0.01 | % | | 694 | | | 0.01 | % | | (1,020) | | | (0.01) | % |
| Nonaccrual interest collections | | 1,757 | | | 0.02 | % | | 1,439 | | | 0.02 | % | | 2,712 | | | 0.03 | % |
| Syndicated loan fee income | | — | | | — | % | | — | | | — | % | | 1,150 | | | 0.01 | % |
| Total loans HFI yield | | $ | 622,830 | | | 6.64 | % | | $ | 596,001 | | | 6.38 | % | | $ | 425,814 | | | 4.99 | % |
(1)Includes tax equivalent adjustment using combined marginal tax rate of 26.06%. |
Interest income on taxable investment securities increased $22.8 million to $50.1 million for the year ended December 31, 2024 from $27.3 million for the year ended December 31, 2023 due to the reinvestment of proceeds from the sale of AFS debt securities that were sold during the second half of 2023 and first and third quarters of 2024 to higher yielding U.S. government agency securities and mortgage-backed securities. The yield on taxable investment securities increased 142 basis points to 3.41% for the year ended December 31, 2024 compared to 1.99% for the year ended December 31, 2023.
Interest expense was $309.0 million for the year ended December 31, 2024, an increase of $37.8 million as compared to $271.2 million for the year ended December 31, 2023. The increase was largely attributed to a rise in the rate paid on interest-bearing deposit accounts, most notably, on money market and customer time deposit products. Total cost of interest-bearing deposits was 3.49% for the year ended December 31, 2024 compared to 3.08% for the year ended December 31, 2023.
Interest expense on money market deposits increased $20.9 million to $147.1 million for the year ended December 31, 2024 compared to $126.2 million for the year ended December 31, 2023. The average rate on money market deposits increased 31 basis points to 3.84% for the year ended December 31, 2024 from 3.53% for the year ended December 31, 2023. Interest expense on customer time deposits increased $10.3 million to $55.5 million for the year ended December 31, 2024 from $45.3 million for the year ended December 31, 2023. The average rate on customer time deposits increased 82 basis points to 3.97% for the year ended December 31, 2024 from 3.15% for the year ended December 31, 2023.
The average balance of other borrowings increased $94.0 million to $97.2 million for the year ended December 31, 2024 compared to $3.2 million for the year ended December 31, 2023. As a result, interest expense on other borrowings increased to $4.7 million for the year ended December 31, 2024 compared to $116 thousand for the year ended December 31, 2023. The yield on other borrowings increased 122 basis points to 4.82% for the year ended December 31, 2024 compared to 3.60% for the year ended December 31, 2023. The increase is due primarily to borrowings from the Bank Term Funding Program, which was paid-off during the year ended December 31, 2024. Refer to the section “Borrowings” for additional information on the BTFP.
Average balance and interest yield/rate analysis
The table below shows the average balances, income and expense and yield and rates of each of our interest-earning assets and interest-bearing liabilities on a tax equivalent basis, if applicable, for the periods indicated.
| | | | | | | | | | | | | | | | | | | | | | | | | | | | | | | | | | | | | | | | | | | | | | | | | | | | | | | | |
| | Years Ended December 31, |
| | 2024 | | | 2023 | | | 2022 | |
| (dollars in thousands) | | Average balances | | Interest
income/
expense | | Average
yield/
rate | | Average balances | | Interest
income/
expense | | Average
yield/
rate | | Average
balances | | Interest
income/
expense | | Average
yield/
rate |
| Interest-earning assets: | | | | | | | | | | | | | | | | | | |
Loans HFI (1)(2) | | $ | 9,384,458 | | | $ | 622,830 | | | 6.64 | % | | $ | 9,335,977 | | | $ | 596,001 | | | 6.38 | % | | $ | 8,541,650 | | | $ | 425,814 | | | 4.99 | % |
| Mortgage loans held for sale | | 66,983 | | | 4,486 | | | 6.70 | % | | 56,815 | | | 3,856 | | | 6.79 | % | | 215,952 | | | 8,385 | | | 3.88 | % |
| Commercial loans held for sale | | — | | | — | | | — | % | | 10,602 | | | 162 | | | 1.53 | % | | 51,075 | | | 2,627 | | | 5.14 | % |
| Investment securities: | | | | | | | | | | | | | | | | | | |
| Taxable | | 1,468,646 | | | 50,057 | | | 3.41 | % | | 1,370,514 | | | 27,257 | | | 1.99 | % | | 1,439,745 | | | 25,469 | | | 1.77 | % |
Tax-exempt (2) | | 196,003 | | | 6,423 | | | 3.28 | % | | 290,884 | | | 9,674 | | | 3.33 | % | | 305,212 | | | 9,916 | | | 3.25 | % |
Total investment securities (2) | | 1,664,649 | | | 56,480 | | | 3.39 | % | | 1,661,398 | | | 36,931 | | | 2.22 | % | | 1,744,957 | | | 35,385 | | | 2.03 | % |
Federal funds sold and reverse repurchase
agreements | | 123,601 | | | 6,703 | | | 5.42 | % | | 112,833 | | | 5,798 | | | 5.14 | % | | 197,235 | | | 3,414 | | | 1.73 | % |
Interest-bearing deposits with other financial
institutions | | 666,810 | | | 34,587 | | | 5.19 | % | | 701,629 | | | 35,652 | | | 5.08 | % | | 843,779 | | | 7,275 | | | 0.86 | % |
| FHLB stock | | 33,307 | | | 3,040 | | | 9.13 | % | | 40,058 | | | 3,355 | | | 8.38 | % | | 43,969 | | | 1,569 | | | 3.57 | % |
Total interest-earning assets (2) | | 11,939,808 | | | 728,126 | | | 6.10 | % | | 11,919,312 | | | 681,755 | | | 5.72 | % | | 11,638,617 | | | 484,469 | | | 4.16 | % |
| Noninterest-earning assets: | | | | | | | | | | | | | | | | | | |
| Cash and due from banks | | 135,338 | | | | | | | 132,327 | | | | | | | 107,814 | | | | | |
| Allowance for credit losses on loans HFI | | (153,265) | | | | | | | (140,246) | | | | | | | (127,499) | | | | | |
Other assets (3)(4) | | 803,867 | | | | | | | 757,441 | | | | | | | 758,918 | | | | | |
| Total noninterest-earning assets | | 785,940 | | | | | | | 749,522 | | | | | | | 739,233 | | | | | |
| Total assets | | $ | 12,725,748 | | | | | | | $ | 12,668,834 | | | | | | | $ | 12,377,850 | | | | | |
| Interest-bearing liabilities: | | | | | | | | | | | | | | | | | | |
| Interest-bearing deposits: | | | | | | | | | | | | | | | | | | |
| Interest-bearing checking | | $ | 2,625,713 | | | $ | 80,045 | | | 3.05 | % | | $ | 2,863,053 | | | $ | 81,761 | | | 2.86 | % | | $ | 3,121,638 | | | $ | 21,857 | | | 0.70 | % |
| Money market deposits | | 3,827,898 | | | 147,075 | | | 3.84 | % | | 3,578,707 | | | 126,205 | | | 3.53 | % | | 2,846,101 | | | 22,868 | | | 0.80 | % |
| Savings deposits | | 363,649 | | | 253 | | | 0.07 | % | | 422,339 | | | 259 | | | 0.06 | % | | 500,189 | | | 268 | | | 0.05 | % |
| Customer time deposits | | 1,399,278 | | | 55,529 | | | 3.97 | % | | 1,436,313 | | | 45,251 | | | 3.15 | % | | 1,167,947 | | | 11,555 | | | 0.99 | % |
| Brokered and internet time deposits | | 276,864 | | | 13,443 | | | 4.86 | % | | 101,423 | | | 5,343 | | | 5.27 | % | | 6,935 | | | 94 | | | 1.36 | % |
| Time deposits | | 1,676,142 | | | 68,972 | | | 4.11 | % | | 1,537,736 | | | 50,594 | | | 3.29 | % | | 1,174,882 | | | 11,649 | | | 0.99 | % |
| Total interest-bearing deposits | | 8,493,402 | | | 296,345 | | | 3.49 | % | | 8,401,835 | | | 258,819 | | | 3.08 | % | | 7,642,810 | | | 56,642 | | | 0.74 | % |
| Other interest-bearing liabilities: | | | | | | | | | | | | | | | | | | |
Securities sold under agreements to
repurchase and federal funds purchased | | 21,339 | | | 366 | | | 1.72 | % | | 29,860 | | | 669 | | | 2.24 | % | | 28,497 | | | 66 | | | 0.23 | % |
| Federal Home Loan Bank advances | | — | | | — | | | — | % | | 28,973 | | | 1,487 | | | 5.13 | % | | 171,142 | | | 5,583 | | | 3.26 | % |
| Subordinated debt | | 130,352 | | | 7,638 | | | 5.86 | % | | 127,386 | | | 10,102 | | | 7.93 | % | | 127,799 | | | 6,868 | | | 5.37 | % |
| Other borrowings | | 97,182 | | | 4,686 | | | 4.82 | % | | 3,225 | | | 116 | | | 3.60 | % | | 1,468 | | | 28 | | | 1.91 | % |
| Total other interest-bearing liabilities | | 248,873 | | | 12,690 | | | 5.10 | % | | 189,444 | | | 12,374 | | | 6.53 | % | | 328,906 | | | 12,545 | | | 3.81 | % |
| Total interest-bearing liabilities | | 8,742,275 | | | 309,035 | | | 3.53 | % | | 8,591,279 | | | 271,193 | | | 3.16 | % | | 7,971,716 | | | 69,187 | | | 0.87 | % |
| Noninterest-bearing liabilities: | | | | | | | | | | | | | | | | | | |
| Demand deposits | | 2,233,092 | | | | | | | 2,442,019 | | | | | | | 2,877,266 | | | | | |
Other liabilities(4) | | 244,549 | | | | | | | 260,612 | | | | | | | 179,192 | | | | | |
| Total noninterest-bearing liabilities | | 2,477,641 | | | | | | | 2,702,631 | | | | | | | 3,056,458 | | | | | |
| Total liabilities | | 11,219,916 | | | | | | | 11,293,910 | | | | | | | 11,028,174 | | | | | |
FB Financial Corporation common
shareholders’ equity | | 1,505,739 | | | | | | | 1,374,831 | | | | | | | 1,349,583 | | | | | |
| Noncontrolling interest | | 93 | | | | | | | 93 | | | | | | | 93 | | | | | |
| Shareholders’ equity | | 1,505,832 | | | | | | | 1,374,924 | | | | | | | 1,349,676 | | | | | |
| Total liabilities and shareholders’ equity | | $ | 12,725,748 | | | | | | | $ | 12,668,834 | | | | | | | $ | 12,377,850 | | | | | |
Net interest income (tax-equivalent basis)(2) | | | | $ | 419,091 | | | | | | | $ | 410,562 | | | | | | | $ | 415,282 | | | |
Interest rate spread (tax-equivalent basis)(2) | | | | | | 2.57 | % | | | | | | 2.56 | % | | | | | | 3.29 | % |
Net interest margin (tax-equivalent basis) (2)(5) | | | | | | 3.51 | % | | | | | | 3.44 | % | | | | | | 3.57 | % |
| Cost of total deposits | | | | | | 2.76 | % | | | | | | 2.39 | % | | | | | | 0.54 | % |
Average interest-earning assets to average
interest-bearing liabilities | | | | | | 136.6 | % | | | | | | 138.7 | % | | | | | | 146.0 | % |
(1)Average balances of nonaccrual loans and overdrafts are included in average loan balances.
(2)Interest income includes the effects of taxable-equivalent adjustments using a U.S. federal income tax rate and, where applicable, state income tax to increase tax-exempt interest income to a tax-equivalent basis. The net tax-equivalent adjustment amounts included in income were $2.6 million, $3.3 million, and $3.0 million for years ended December 31, 2024, 2023, and 2022, respectively.
(3)Includes average net unrealized losses on investment securities available for sale of $166.1 million, $231.5 million, and $144.3 million for the years ended December 31, 2024, 2023, and 2022, respectively.
(4)Includes average of optional rights to repurchase government guaranteed GNMA mortgage loans previously sold that meet certain defined delinquency criteria of $24.6 million, $21.7 million, and $13.1 million for the years ended December 31, 2024, 2023, and 2022, respectively.
(5)The NIM is calculated by dividing net interest income, on a tax-equivalent basis, by average total earning assets.
Yield/rate and volume analysis
The tables below present the components of the changes in net interest income for the years ended December 31, 2024 and 2023. For each major category of interest-earning assets and interest-bearing liabilities, information is provided with respect to changes due to average volume and changes due to interest rates, with the changes in both volume and interest rates allocated to these two categories based on the proportionate absolute changes in each category.
| | | | | | | | | | | | | | | | | | | | |
| | Year ended December 31, 2024 compared to year ended December 31, 2023 due to changes in |
| (dollars in thousands) | | Volume | | Yield/rate | | Net increase
(decrease) |
| Interest-earning assets: | | | | | | |
Loans HFI(1)(2) | | $ | 3,218 | | | $ | 23,611 | | | $ | 26,829 | |
| Loans held for sale - mortgage | | 681 | | | (51) | | | 630 | |
| Loans held for sale - commercial | | (162) | | | — | | | (162) | |
| Investment securities: | | | | | | |
| Taxable | | 3,345 | | | 19,455 | | | 22,800 | |
Tax-exempt(2) | | (3,109) | | | (142) | | | (3,251) | |
| Federal funds sold and reverse repurchase agreements | | 584 | | | 321 | | | 905 | |
| Interest-bearing deposits with other financial institutions | | (1,806) | | | 741 | | | (1,065) | |
| FHLB stock | | (616) | | | 301 | | | (315) | |
Total interest income(2) | | 2,135 | | | 44,236 | | | 46,371 | |
| Interest-bearing liabilities: | | | | | | |
| Interest-bearing checking deposits | | (7,235) | | | 5,519 | | | (1,716) | |
| Money market deposits | | 9,574 | | | 11,296 | | | 20,870 | |
| Savings deposits | | (41) | | | 35 | | | (6) | |
| Customer time deposits | | (1,470) | | | 11,748 | | | 10,278 | |
| Brokered and internet time deposits | | 8,518 | | | (418) | | | 8,100 | |
Securities sold under agreements to repurchase and federal funds
purchased | | (146) | | | (157) | | | (303) | |
| Federal Home Loan Bank advances | | (1,487) | | | — | | | (1,487) | |
| Subordinated debt | | 174 | | | (2,638) | | | (2,464) | |
| Other borrowings | | 4,530 | | | 40 | | | 4,570 | |
| Total interest expense | | 12,417 | | | 25,425 | | | 37,842 | |
Change in net interest income(2) | | $ | (10,282) | | | $ | 18,811 | | | $ | 8,529 | |
| | | | | | |
| | | | | | |
(1)Average loans are presented gross, including nonaccrual loans and overdrafts.
(2)Interest income includes the effects of the tax-equivalent adjustments to increase tax-exempt interest income to a tax-equivalent basis. The net taxable-equivalent adjustment amounts included was $2.6 million and $3.3 million for the years ended December 31, 2024 and 2023, respectively.
Year ended December 31, 2023 compared to year ended December 31, 2022
| | | | | | | | | | | | | | | | | | | | |
| | Year ended December 31, 2023 compared to year ended December 31, 2022 due to changes in |
| (dollars in thousands on a tax-equivalent basis) | | Volume | | Yield/rate | | Net increase
(decrease) |
| Interest-earning assets: | | | | | | |
Loans HFI(1)(2) | | $ | 50,709 | | | $ | 119,478 | | | $ | 170,187 | |
| Loans held for sale - mortgage | | (10,801) | | | 6,272 | | | (4,529) | |
| Loans held for sale - commercial | | (618) | | | (1,847) | | | (2,465) | |
| Investment securities: | | | | | | |
| Taxable | | (1,377) | | | 3,165 | | | 1,788 | |
Tax-exempt(2) | | (477) | | | 235 | | | (242) | |
| Federal funds sold and reverse repurchase agreements | | (4,337) | | | 6,721 | | | 2,384 | |
| Interest-bearing deposits with other financial institutions | | (7,223) | | | 35,600 | | | 28,377 | |
| FHLB stock | | (328) | | | 2,114 | | | 1,786 | |
Total interest income(2) | | 25,548 | | | 171,738 | | | 197,286 | |
| Interest-bearing liabilities: | | | | | | |
| Interest-bearing checking deposits | | (7,384) | | | 67,288 | | | 59,904 | |
| Money market deposits | | 25,836 | | | 77,501 | | | 103,337 | |
| Savings deposits | | (48) | | | 39 | | | (9) | |
| Customer time deposits | | 8,455 | | | 25,241 | | | 33,696 | |
| Brokered and internet time deposits | | 4,978 | | | 271 | | | 5,249 | |
Securities sold under agreements to repurchase and federal funds
purchased | | 31 | | | 572 | | | 603 | |
| Federal Home Loan Bank advances | | (7,297) | | | 3,201 | | | (4,096) | |
| Subordinated debt | | (33) | | | 3,267 | | | 3,234 | |
| Other borrowings | | 63 | | | 25 | | | 88 | |
| Total interest expense | | 24,601 | | | 177,405 | | | 202,006 | |
Change in net interest income(2) | | $ | 947 | | | $ | (5,667) | | | $ | (4,720) | |
(1)Average loans are presented gross, including nonaccrual loans and overdrafts.
(2)Interest income includes the effects of the tax-equivalent adjustments to increase tax-exempt interest income to a tax-equivalent basis. The net taxable-equivalent adjustment amounts included was $3.3 million, and $3.0 million for the years ended December 31, 2023 and 2022, respectively.
Provision for credit losses
The provision for credit losses charged to operating expense is an amount which, in the judgment of management, is necessary to maintain the allowance for credit losses at an appropriate level under the current expected credit loss model. The determination of the amount of the allowance is complex and involves a high degree of judgment and subjectivity. Refer to Note 1, “Basis of presentation” in the notes to our consolidated financial statements for a detailed discussion regarding ACL methodology.
Our allowance for credit losses calculation as of December 31, 2024 and 2023 resulted from management’s best estimate of losses over the life of loans and unfunded commitments in our portfolio in accordance with the CECL approach. Our calculation as of December 31, 2024 included economic forecasts for unemployment, gross domestic product, as well as other macroeconomic events which may impact our loan portfolio, such as supply chain concerns and global conflicts. These factors may continue to lead to increased volatility in forecasted macroeconomic variables, a key input to our calculated level of allowance for credit losses.
We recognized a provision for credit losses on loans HFI for the years ended December 31, 2024 and 2023 of $14.7 million and $16.7 million, respectively. The current period provision on loans HFI is due to growth in loan balances for most loan categories, an increase in net charge-offs and slight deterioration in economic forecasts offset by significant decreases in construction lending. For the year ended December 31, 2023, the current period provision on loans HFI was impacted by three commercial and industrial relationships moving to nonaccrual status and the deteriorating economic forecasts.
We recorded a reversal of provision for credit losses on unfunded commitments of $2.7 million and $14.2 million for the years ended December 31, 2024 and 2023, respectively. The reversal of provision for credit losses on unfunded commitments for the years ended December 31, 2024 and 2023 is primarily due to management's concentrated effort to reduce unfunded loan commitments during the periods indicated including a $227.7 million and a $913.2 million decrease in our construction category for the years ended December 31, 2024 and 2023, respectively. Decreases in commitment balances for construction and commercial real estate were partially offset by increases in commercial and industrial and residential segments. Decreases in commitment balances for construction resulted in a $2.6 million and $14.2 million decrease in ACL for the years ended December 31, 2024 and 2023, respectively.
During the years ended December 31, 2024 and 2023, it was determined that all AFS debt securities that experienced a decline in fair value below amortized cost basis were due to noncredit-related factors. Therefore, there was no provision for credit losses recognized on AFS debt securities during the years ended December 31, 2024 and 2023.
Noninterest income
The following table sets forth the components of noninterest income for the periods indicated:
| | | | | | | | | | | | | | | | | | | | | | | | |
| | | | | Years Ended December 31, |
| (dollars in thousands) | | | | | | 2024 | | | 2023 | | | 2022 | |
| Mortgage banking income | | | | | | $ | 46,634 | | | $ | 44,692 | | | $ | 73,580 | |
| Investment services and trust income | | | | | | 14,191 | | | 11,320 | | | 8,866 | |
| Service charges on deposit accounts | | | | | | 13,234 | | | 12,154 | | | 12,049 | |
| ATM and interchange fees | | | | | | 11,465 | | | 10,282 | | | 15,600 | |
| Loss from investment securities, net | | | | | | (56,378) | | | (13,973) | | | (376) | |
| Loss on sales or write-downs of premises and equipment, other real estate owned and other assets | | | | | | (2,167) | | | (27) | | | (265) | |
| | | | | | | | | | |
| Other income | | | | | | 12,091 | | | 6,095 | | | 5,213 | |
| Total noninterest income | | | | | | $ | 39,070 | | | $ | 70,543 | | | $ | 114,667 | |
Noninterest income amounted to $39.1 million for the year ended December 31, 2024, a decrease of $31.5 million, or 45%, as compared to $70.5 million for the year ended December 31, 2023. The decrease in total noninterest income was driven by the net loss from investment securities and net loss on write-downs of premises and equipment, offset by increases in investment services and trust income and other noninterest income.
Mortgage banking income primarily includes origination fees and realized gains and losses on the sale of mortgage loans, unrealized change in fair value of mortgage loans and derivatives, and mortgage loan servicing fees, which includes the net change in fair value of MSRs and related derivatives. Mortgage banking income was $46.6 million, an increase of $1.9 million compared to the prior year.
Investment services and trust income is comprised of wealth management fees and trust and insurance income. Investment services and trust income increased $2.9 million during the year ended December 31, 2024 to $14.2 million as compared to $11.3 million during the year ended December 31, 2023. The increase is primarily attributable to fees earned from higher assets under management stemming from market value improvement and existing account growth, as well as customer acquisition efforts through a mix of financial advisors joining the Company bringing new business and the addition of new accounts by the financial advisors already at the Company.
Service charges on deposit accounts include overdraft fees, account analysis fees and other customer transaction-related service charges. Service charges on deposit accounts increased $1.1 million during the year ended December 31, 2024 to $13.2 million as compared to $12.2 million during the year ended December 31, 2023.
ATM and interchange fees represent income related to customers' utilization of their debit cards and interchange income. ATM and interchange fees were $11.5 million for the year ended December 31, 2024, compared to $10.3 million for the year ended December 31, 2023.
Net loss from investment securities was $56.4 million for the year ended December 31, 2024 compared to a net loss of $14.0 million for the year ended December 31, 2023. The net loss from investment securities during the year ended December 31, 2024 stemmed from the sale of $526.4 million of AFS debt securities while the net loss in the prior year primarily related to the sale of $100.5 million of AFS debt securities during that period. The proceeds from the investment securities sales in both years were reinvested into higher yielding AFS securities. Refer to the section “Other earning assets” for additional information on the sale of the AFS debt securities.
Net loss on sales or write-downs of premises and equipment, other real estate owned and other assets was $2.2 million for the year ended December 31, 2024 compared to $27 thousand for the year ended December 31, 2023. The loss on sales or write-downs of premises and equipment, other real estate owned and other assets during the year ended December 31, 2024 is primarily due to a $2.3 million impairment charge on two facilities which will be decommissioned.
Other income is comprised of income recognized that does not typically fit into one of the other noninterest income categories and includes primarily BOLI income, swap fees, equity investment income, and prior to 2024, change in fair value of commercial loans held for sale. Other income increased $6.0 million to $12.1 million during the year ended December 31, 2024 as compared to $6.1 million during the year ended December 31, 2023. This increase was primarily related to a $2.1 million increase in BOLI income resulting from proceeds from payment of death benefits during the year ended December 31, 2024, an $1.9 million increase in equity investments income and a $2.1 million loss recorded during the year ended December 31, 2023 associated with the change in fair value of the commercial loans held for sale portfolio that was exited during the year ended December 31, 2023.
Noninterest expense
The following table sets forth the components of noninterest expense for the periods indicated:
| | | | | | | | | | | | | | | | | | | | | | | | |
| | | | | Years Ended December 31, |
| (dollars in thousands) | | | | | | 2024 | | | 2023 | | | 2022 | |
| Salaries, commissions and employee benefits | | | | | | $ | 183,813 | | | $ | 203,441 | | | $ | 211,491 | |
| Occupancy and equipment expense | | | | | | 26,250 | | | 28,148 | | | 23,562 | |
| Data processing | | | | | | 9,642 | | | 9,230 | | | 9,315 | |
| Legal and professional fees | | | | | | 7,679 | | | 8,890 | | | 15,028 | |
| Advertising | | | | | | 7,007 | | | 8,267 | | | 11,208 | |
| | | | | | | | | | |
| Amortization of core deposit and other intangibles | | | | | | 2,947 | | | 3,659 | | | 4,585 | |
| | | | | | | | | | |
| | | | | | | | | | |
| | | | | | | | | | |
| | | | | | | | | | |
| | | | | | | | | | |
| Mortgage restructuring expense | | | | | | — | | | — | | | 12,458 | |
| Other expense | | | | | | 59,561 | | | 63,294 | | | 60,699 | |
| Total noninterest expense | | | | | | $ | 296,899 | | | $ | 324,929 | | | $ | 348,346 | |
Noninterest expense decreased by $28.0 million, or 9%, during the year ended December 31, 2024 to $296.9 million as compared to $324.9 million in the year ended December 31, 2023. The decrease in noninterest expense was attributable to decreases in salaries and employee benefits, occupancy expense, legal and professional fees, advertising, and other noninterest expense.
Salaries, commissions and employee benefits expense is comprised of salaries and wages in addition to other employee benefit costs and represents the largest component of noninterest expense. For the year ended December 31, 2024, salaries, commissions and employee benefits expense decreased $19.6 million, or 10%, to $183.8 million as compared to $203.4 million for the year ended December 31, 2023. This change was attributable to the impact of the Company’s efficiency and scalability initiatives, partially offset by increases to incentive expense recognized as a result of the Company's overall performance. Additionally contributing to this decrease was a $10.3 million decrease from the Company applying an updated deferral methodology for loan fees and loan origination expenses.
Occupancy and equipment expense includes occupancy, depreciation and equipment expense. Occupancy and equipment expense decreased $1.9 million during the year ended December 31, 2024 to $26.3 million as compared to $28.1 million during the year ended December 31, 2023. The decrease was primarily driven by a $1.8 million loss on lease terminations primarily associated with branch closures recognized during the year ended December 31, 2023.
Data processing is comprised of all third-party core operating system and processing charges as well as payroll processing. Data processing fees were $9.6 million for the year ended December 31, 2024, compared to $9.2 million for the year ended December 31, 2023.
Legal and professional fees represent fees incurred for the various support functions, which includes legal, consulting, outsourcing and other professional related fees. Legal and professional fees decreased by $1.2 million during the year ended December 31, 2024 to $7.7 million as compared to $8.9 million during the year ended December 31, 2023. The decrease was primarily driven by the completion of internal projects in the prior year.
Advertising includes expenses related to sponsorships, advertising, marketing, customer relations and business development and public relations. During the year ended December 31, 2024, advertising expense decreased $1.3 million to $7.0 million compared to $8.3 million during the year ended December 31, 2023. This decrease was primarily attributable to marketing rebate activity with partners earned through higher transaction volumes during the year ended December 31, 2024 compared to the year ended December 31, 2023.
Amortization of core deposit and other intangibles were $2.9 million for the year ended December 31, 2024, compared to $3.7 million for the year ended December 31, 2023.
Mortgage restructuring expense is related to the exit from our direct-to-consumer internet delivery channel during the year ended December 31, 2022. This expense primarily included salaries, commissions and employee benefits expense, including severance and the acceleration of vesting on restricted stock units. Other components of this expense included software license and maintenance fees, an impairment of our operating lease right-of-use assets and a loss on disposal of fixed assets.
Other noninterest expense primarily includes mortgage servicing expenses, regulatory fees and deposit insurance assessments, software license and maintenance fees and various other miscellaneous expenses. Other noninterest expense decreased $3.7 million during the year ended December 31, 2024 to $59.6 million compared to $63.3 million during the year ended December 31, 2023. The decrease was primarily related to a $4.4 million decrease in franchise tax expense.
Efficiency ratio
The efficiency ratio is one measure of productivity in the banking industry. This ratio is a measure of the cost of generating one dollar of revenue. That is, the ratio is designed to reflect the percentage of one dollar which must be expended to generate that dollar of revenue. This ratio is calculated by dividing noninterest expense by the sum of net interest income and noninterest income. For a core efficiency ratio, we exclude certain gains, losses and expenses we do not consider core to our business.
Our efficiency ratio was 65.2% and 68.0% for the years ended December 31, 2024 and 2023, respectively. Our adjusted efficiency ratio, on a tax-equivalent basis, was 57.3% and 62.9% for the years ended December 31, 2024 and 2023, respectively. See “GAAP reconciliation and management explanation of non-GAAP financial measures” in this Report for a discussion of the adjusted efficiency ratio.
Income taxes
Income tax expense was $30.6 million and $30.1 million for the years ended December 31, 2024 and 2023, respectively. This represents effective tax rates of 20.9% and 20.0% for the years ended December 31, 2024 and 2023, respectively. The primary differences from the enacted Federal rates are applicable state income taxes and certain expenses that are not deductible, reduced for non-taxable income. Refer to Note 12 “Income taxes” in the notes to the consolidated financial statements for additional information regarding the Company’s income tax expense and effective tax rates.
Financial condition
The following discussion of our financial condition compares balances as of December 31, 2024 and 2023.
Loan portfolio
The following table sets forth the balance and associated percentage of each class of financing receivable in our loan portfolio as of the dates indicated:
| | | | | | | | | | | | | | | | | | | | | | | | | | | | | | | | | | | | | | | | | | | | | | | | | | |
| | | | | | | | | | | | | | | | |
| | December 31, | | | | | | | | | | | | |
| | | 2024 | | | | | 2023 | | | | | | | |
| (dollars in thousands) | | Committed | | Amount Outstanding | | % of total outstanding | | Committed | | Amount Outstanding | | % of total outstanding | | | | | | | | | | | | |
| Loan Type: | | | | | | | | | | | | | | | | | | | | | | | | |
Commercial and industrial
| | $ | 3,062,626 | | | $ | 1,691,213 | | | 18 | % | | $ | 2,982,967 | | | $ | 1,720,733 | | | 18 | % | | | | | | | | | | | | |
| Construction | | 1,585,865 | | | 1,087,732 | | | 11 | % | | 2,123,177 | | | 1,397,313 | | | 15 | % | | | | | | | | | | | | |
| Residential real estate: | | | | | | | | | | | | | | | | | | | | | | | | |
| 1-to-4 family mortgage | | 1,624,053 | | | 1,616,754 | | | 17 | % | | 1,569,525 | | | 1,568,552 | | | 17 | % | | | | | | | | | | | | |
| Residential line of credit | | 1,336,506 | | | 602,475 | | | 6 | % | | 1,231,038 | | | 530,912 | | | 6 | % | | | | | | | | | | | | |
| Multi-family mortgage | | 665,813 | | | 653,769 | | | 7 | % | | 627,387 | | | 603,804 | | | 6 | % | | | | | | | | | | | | |
| Commercial real estate: | | | | | | | | | | | | | | | | | | | | | | | | |
| Owner-occupied | | 1,436,424 | | | 1,357,568 | | | 14 | % | | 1,305,503 | | | 1,232,071 | | | 13 | % | | | | | | | | | | | | |
| Non-owner occupied | | 2,154,027 | | | 2,099,129 | | | 22 | % | | 2,026,491 | | | 1,943,525 | | | 21 | % | | | | | | | | | | | | |
| Consumer and other | | 507,175 | | | 493,744 | | | 5 | % | | 437,382 | | | 411,873 | | | 4 | % | | | | | | | | | | | | |
| Total loans | | $ | 12,372,489 | | | $ | 9,602,384 | | | 100 | % | | $ | 12,303,470 | | | $ | 9,408,783 | | | 100 | % | | | | | | | | | | | | |
Our loans HFI portfolio is our most significant earning asset, comprising 73.0% and 74.6% of our total assets at December 31, 2024 and 2023, respectively. Our strategy is to grow our loan portfolio by originating quality commercial and consumer type loans that comply with our credit policies and that produce revenues consistent with our financial objectives. Our overall lending approach is primarily focused on providing credit to our customers directly in the markets we serve. However, we are also party to loan syndications and participations from other banks (collectively, “participated loans”). As of December 31, 2024 and 2023, loans HFI included approximately $177.6 million and $254.6 million, respectively, related to participated loans.
We also sell loan participations to unaffiliated third-parties as part of our credit risk management and balance sheet management strategy. During the years ended December 31, 2024 and 2023, we sold $25.3 million and $55.8 million in loan participations, respectively. All loans, whether or not we act as a participant, are underwritten to the same standards as all other loans we originate. We believe our loan portfolio is well-balanced, which provides us with the opportunity to grow while monitoring our loan concentrations.
Loan concentrations are considered to exist when there are amounts loaned to a number of borrowers engaged in similar activities that would cause them to be similarly impacted by economic or other conditions. Our lending activity is heavily concentrated in the geographic market areas we serve, with the highest concentration in Tennessee. This geographic concentration subjects our loan portfolio to the general economic conditions within the state. The risks created by this concentration have been considered by management in the determination of the appropriateness of the allowance for credit losses on loans HFI. As of December 31, 2024 and 2023, there were no concentrations of loans exceeding 10% of total loans other than our geographic exposure to Tennessee and Alabama, as well as the categories of loans disclosed in the table above. We believe our loan portfolio is diversified relative to industry concentrations across the various loan portfolio categories. For additional details related to the concentrations within our loan portfolio, refer to the industry classification and collateral property type concentration tables detailed later in this section.
Banking regulators have established guidelines of less than 100% of tier 1 capital plus allowance for credit losses in construction lending and less than 300% of tier 1 capital plus allowance for credit losses in commercial real estate lending that management monitors as part of the risk management process. The construction concentration ratio is a percentage of the outstanding construction and land development loans to total tier 1 capital plus allowance for credit losses. The commercial real estate concentration ratio is a percentage of the outstanding balance of non-owner occupied commercial real estate, multifamily, and construction and land development loans to tier 1 capital plus allowance for credit losses. Management strives to operate within the thresholds set forth above. When our ratios are in excess of one or both of
these guidelines, banking regulators generally require an increased level of monitoring in these lending areas by management.
The table below shows concentration ratios for the Bank and Company as of December 31, 2024 and 2023.
| | | | | | | | | | | | | | |
| | As a percentage (%) of tier 1 capital plus allowance for credit losses |
| | FirstBank | | FB Financial Corporation |
| December 31, 2024 | | | | |
| Construction | | 70.1 | % | | 67.1 | % |
| Commercial real estate | | 249.3 | % | | 238.5 | % |
| December 31, 2023 | | | | |
| Construction | | 93.3 | % | | 91.2 | % |
| Commercial real estate | | 265.1 | % | | 259.0 | % |
| | | | | |
Loan categories: The principal categories of our loans held for investment portfolio are discussed below: |
| Commercial and industrial loans. | Commercial and industrial loans are typically made to small and medium-sized manufacturing, wholesale, retail and service businesses, and farmers for working capital and operating needs and business expansions. This category also includes loans secured by manufactured housing receivables made primarily to manufactured housing communities. Commercial and industrial loans generally include lines of credit and loans with maturities of five years or less. Commercial and industrial loans are generally made with operating cash flows as the primary source of repayment, but may also include collateralization by inventory, accounts receivable, equipment and personal guarantees. |
|
|
|
|
|
|
|
|
| Construction loans. | Construction loans include commercial construction, land acquisition and land development loans and single-family interim construction loans to small and medium-sized businesses and individuals. These loans are generally secured by the land or the real property being built and are made based on our assessment of the value of the property on an as-completed basis and repayment depends upon project completion and sale, refinancing, or operation of the real estate. |
|
|
|
|
|
|
|
|
|
| 1-4 family mortgage loans. | Our residential real estate 1-4 family mortgage loans are primarily made with respect to and secured by single family homes, including manufactured homes with real estate, which are both owner-occupied and investor owned. Repayment depends primarily upon the cash flow of the borrower as well as the value of the real estate collateral. |
|
|
|
|
| Residential line of credit loans. | Our residential line of credit loans are primarily revolving, open-end lines of credit secured by 1-4 residential properties. Repayment depends primarily upon the cash flow of the borrower as well as the value of the real estate collateral. |
|
|
| Multi-family residential loans. | Our multi-family residential loans are primarily secured by multi-family properties, such as apartments and condominium buildings. Repayment depends primarily upon the cash flow of the borrower as well as the value of the real estate collateral. |
|
|
|
| Commercial real estate owner-occupied loans. | Our commercial real estate owner-occupied loans include loans to finance commercial real estate owner occupied properties for various purposes including use as offices, warehouses, production facilities, health care facilities, retail centers, restaurants, churches and agricultural based facilities. Commercial real estate owner-occupied loans are typically repaid through the ongoing business operations of the borrower. |
|
|
|
|
|
|
| Commercial real estate non-owner occupied loans. | Our commercial real estate non-owner occupied loans include loans to finance commercial real estate investment properties for various purposes including use as offices, warehouses, health care facilities, hotels, mixed-use residential/commercial, manufactured housing communities, retail centers, multifamily properties, assisted living facilities and agricultural based facilities. Commercial real estate non-owner occupied loans are typically repaid with the funds received from the sale or refinancing of the property or rental income from such property. |
|
|
|
|
|
|
|
|
|
| Consumer and other loans. | Consumer and other loans include loans to individuals for personal, family and household purposes, including car, boat and other recreational vehicle loans, manufactured homes (without real estate) and personal lines of credit. Consumer loans are generally secured by vehicles and other household goods, with repayment depending primarily on the cash flow of the borrower. Other loans also include loans to states and political subdivisions in the U.S. and are repaid through tax revenues or refinancing.
|
|
|
|
|
|
|
|
|
As part of our lending policy and risk management activities, we track lending exposure of commercial and industrial and owner-occupied commercial real estate by industry classification (as defined by the North American Industry Classification System) and type to determine potential risks associated with industry concentrations, and if any risk issues could lead to additional credit loss exposure. The table below provides a summary of our commercial and industrial and owner-occupied commercial real estate portfolios by industry classification.
| | | | | | | | | | | | | | | | | | | | |
| | December 31, 2024 |
| (dollars in thousands) | | Committed | | Amount Outstanding | | Nonperforming |
| Commercial and industrial | | | | | | |
| Real estate rental and leasing | | $ | 473,132 | | | $ | 282,801 | | | $ | 463 | |
| Finance and insurance | | 439,596 | | | 271,731 | | | — | |
| Construction | | 391,811 | | | 105,421 | | | 1,060 | |
| Manufacturing | | 255,070 | | | 171,614 | | | — | |
| Wholesale trade | | 186,446 | | | 98,032 | | | 151 | |
| Professional, scientific and technical services | | 186,189 | | | 108,155 | | | 9 | |
| Information | | 178,395 | | | 88,722 | | | — | |
| Educational services | | 171,669 | | | 53,191 | | | 20 | |
| Other services (except public administration) | | 126,305 | | | 81,179 | | | 17 | |
| Retail trade | | 122,698 | | | 83,567 | | | 5,270 | |
| Health care and social assistance | | 115,704 | | | 76,833 | | | 493 | |
Administrative and support and waste management and
remediation services | | 106,693 | | | 69,560 | | | 2,151 | |
| Transportation and warehousing | | 84,576 | | | 74,785 | | | 104 | |
| Arts, entertainment and recreation | | 57,998 | | | 32,403 | | | — | |
| Management of companies and enterprises | | 45,367 | | | 26,765 | | | — | |
| Accommodation and food services | | 30,570 | | | 26,372 | | | 104 | |
| Other | | 90,407 | | | 40,082 | | | 549 | |
| Total | | $ | 3,062,626 | | | $ | 1,691,213 | | | $ | 10,391 | |
| | | | | | |
| Commercial real estate owner-occupied | | | | | | |
| Real estate rental and leasing | | $ | 240,229 | | | $ | 226,367 | | | $ | — | |
| Other services (except public administration) | | 206,748 | | | 201,688 | | | 4,506 | |
| Retail trade | | 192,902 | | | 188,159 | | | — | |
| Health care and social assistance | | 136,470 | | | 133,106 | | | 219 | |
| Manufacturing | | 121,683 | | | 118,201 | | | 55 | |
| Accommodation and food services | | 102,616 | | | 101,443 | | | — | |
| Wholesale trade | | 82,074 | | | 78,938 | | | — | |
| Transportation and warehousing | | 76,686 | | | 51,111 | | | — | |
| Construction | | 70,921 | | | 62,967 | | | — | |
| Professional, scientific and technical services | | 41,077 | | | 39,082 | | | 94 | |
| Arts, entertainment and recreation | | 40,727 | | | 38,838 | | | — | |
| Agriculture, forestry, fishing and hunting | | 26,945 | | | 25,320 | | | 676 | |
| Educational services | | 19,193 | | | 18,785 | | | — | |
| Management of companies and enterprises | | 18,478 | | | 16,608 | | | — | |
| Finance and insurance | | 17,489 | | | 16,236 | | | 2,668 | |
Administrative and support and waste management and
remediation services | | 14,573 | | | 13,680 | | | 519 | |
| Other | | 27,613 | | | 27,039 | | | 908 | |
| Total | | $ | 1,436,424 | | | $ | 1,357,568 | | | $ | 9,645 | |
Additionally, we track our lending exposure of non-owner occupied commercial real estate and construction by collateral property type to determine potential risks associated with collateral types, and if any risk issues could lead to additional credit loss exposure.
The table below provides a summary of our non-owner occupied commercial real estate and construction loan portfolios by collateral property type.
| | | | | | | | | | | | | | | | | | | | |
| | December 31, 2024 |
| (dollars in thousands) | | Committed | | Amount Outstanding | | Nonperforming |
| Commercial real estate non-owner occupied | | | | | | |
| Retail | | $ | 498,688 | | | $ | 487,334 | | | $ | 3,512 | |
| Office | | 357,260 | | | 348,295 | | | 18 | |
| Warehouse and industrial | | 350,125 | | | 323,422 | | | — | |
| Hotel | | 321,725 | | | 321,493 | | | 2,649 | |
| Assisted living and special care facilities | | 140,881 | | | 140,702 | | | — | |
| Self-storage | | 133,134 | | | 131,072 | | | — | |
| Land-mobile home park | | 91,172 | | | 90,397 | | | — | |
| Healthcare facility | | 82,052 | | | 81,892 | | | — | |
| Restaurants, bars and event venues | | 37,872 | | | 36,007 | | | — | |
| Recreation, sports and entertainment | | 36,639 | | | 35,398 | | | — | |
| Other | | 104,479 | | | 103,117 | | | — | |
| Total | | $ | 2,154,027 | | | $ | 2,099,129 | | | $ | 6,179 | |
| | | | | | |
| Construction | | | | | | |
| Consumer: | | | | | | |
| Construction | | $ | 183,218 | | | $ | 122,321 | | | $ | 2,298 | |
| Land | | 39,890 | | | 34,417 | | | — | |
| Commercial: | | | | | | |
| Land | | 267,993 | | | 229,254 | | | 1,653 | |
| Multi-family | | 208,749 | | | 158,708 | | | — | |
| Office | | 26,704 | | | 17,356 | | | 5,999 | |
| Recreation, sports and entertainment | | 18,252 | | | 8,030 | | | — | |
| Retail | | 15,402 | | | 13,486 | | | — | |
| Convenience store and gas station | | 13,446 | | | 11,220 | | | — | |
| Self-storage | | 11,150 | | | 5,867 | | | — | |
| Car wash | | 3,975 | | | 3,975 | | | — | |
| Other | | 51,391 | | | 14,331 | | | — | |
| | | | | | |
| | | | | | |
| Residential Development: | | | | | | |
| Construction | | 589,318 | | | 354,377 | | | 1,503 | |
| Land | | 120,719 | | | 79,296 | | | — | |
| Lots | | 35,658 | | | 35,094 | | | — | |
| Total | | $ | 1,585,865 | | | $ | 1,087,732 | | | $ | 11,453 | |
Loan maturity and sensitivities
The following table presents the contractual maturities of our loan portfolio as of December 31, 2024. Loans with scheduled maturities are reported in the maturity category in which the payment is due. Demand loans with no stated maturity and overdrafts are reported in the “due in 1 year or less” category. Loans that have adjustable rates are shown as amortizing to final maturity rather than when the interest rates are next subject to change. The tables do not include prepayment assumptions or scheduled repayments.
| | | | | | | | | | | | | | | | | | | | | | | | | | | | | | | | |
| | December 31, 2024 |
| Loan type (dollars in thousands) | | Maturing in one
year or less | | Maturing in one
to five years | | Maturing in
five to fifteen years | | Maturing after
fifteen years | | Total |
| Commercial and industrial | | $ | 759,138 | | | $ | 795,517 | | | $ | 135,811 | | | $ | 747 | | | $ | 1,691,213 | |
| Construction | | 596,847 | | | 428,934 | | | 59,320 | | | 2,631 | | | 1,087,732 | |
| Residential real estate: | | | | | | | | | | |
| 1-to-4 family mortgage | | 88,328 | | | 486,882 | | | 197,875 | | | 843,669 | | | 1,616,754 | |
| Residential line of credit | | 62,954 | | | 101,543 | | | 437,928 | | | 50 | | | 602,475 | |
| Multi-family mortgage | | 92,605 | | | 426,815 | | | 105,823 | | | 28,526 | | | 653,769 | |
| Commercial real estate: | | | | | | | | | | |
| Owner-occupied | | 134,608 | | | 859,263 | | | 346,709 | | | 16,988 | | | 1,357,568 | |
| Non-owner occupied | | 246,487 | | | 1,252,172 | | | 589,871 | | | 10,599 | | | 2,099,129 | |
| Consumer and other | | 18,849 | | | 73,384 | | | 85,900 | | | 315,611 | | | 493,744 | |
| Total ($) | | $ | 1,999,816 | | | $ | 4,424,510 | | | $ | 1,959,237 | | | $ | 1,218,821 | | | $ | 9,602,384 | |
| Total (%) | | 20.8 | % | | 46.1 | % | | 20.4 | % | | 12.7 | % | | 100.0 | % |
For loans due after one year or more, the following table presents the interest rate composition for loans outstanding as of December 31, 2024.
| | | | | | | | | | | | | | | | | | | | |
| | December 31, 2024 |
| Loan type (dollars in thousands) | | Fixed
interest rate | | Floating
interest rate | | Total |
| Commercial and industrial | | $ | 421,471 | | | $ | 510,604 | | | $ | 932,075 | |
| Construction | | 127,691 | | | 363,194 | | | 490,885 | |
| Residential real estate: | | | | | | |
| 1-to-4 family mortgage | | 1,140,136 | | | 388,290 | | | 1,528,426 | |
| Residential line of credit | | 4,251 | | | 535,270 | | | 539,521 | |
| Multi-family mortgage | | 326,305 | | | 234,859 | | | 561,164 | |
| Commercial real estate: | | | | | | |
| Owner-occupied | | 833,665 | | | 389,295 | | | 1,222,960 | |
| Non-owner occupied | | 1,001,638 | | | 851,004 | | | 1,852,642 | |
| Consumer and other | | 444,061 | | | 30,834 | | | 474,895 | |
| Total ($) | | $ | 4,299,218 | | | $ | 3,303,350 | | | $ | 7,602,568 | |
| Total (%) | | 56.5 | % | | 43.5 | % | | 100.0 | % |
The following table presents the contractual maturities of our loan portfolio segregated into fixed and floating interest rate loans as of December 31, 2024.
| | | | | | | | | | | | | | | | | | | | |
| | December 31, 2024 |
| Contractual maturity (dollars in thousands) | | Fixed
interest rate | | Floating
interest rate | | Total |
| One year or less | | $ | 563,688 | | $ | 1,436,128 | | $ | 1,999,816 |
| One to five years | | 2,459,130 | | 1,965,380 | | 4,424,510 |
| Five to fifteen years | | 967,559 | | 991,678 | | 1,959,237 |
| Over fifteen years | | 872,529 | | 346,292 | | 1,218,821 |
| Total ($) | | $ | 4,862,906 | | $ | 4,739,478 | | $ | 9,602,384 |
| Total (%) | | 50.6 | % | | 49.4 | % | | 100.0 | % |
Of the loans shown above with floating interest rates as of December 31, 2024, many have interest rate floors as follows:
| | | | | | | | | | | | | | | | | | | | | | | | | | | | | | | | | | | |
| Loans with interest rate floors (dollars in thousands) | | Maturing in one year or less | Weighted average level of support (bps) | Maturing in one to five years | Weighted average level of support (bps) | Maturing in five years to fifteen years | Weighted average level of support (bps) | Maturing after
fifteen years | Weighted average level of support (bps) | Total | Weighted average level of support (bps) |
Loans with
current rates
above floors: | | | | | | | | | | | |
| | | | | | | | | | | |
| 1-25 bps | | $ | 2,458 | | 25 | | $ | 9,774 | | 18 | | $ | 1,143 | | 6 | | $ | — | | — | | $ | 13,375 | | 18 | |
| 26-50 bps | | 15,401 | | 50 | | 44,076 | | 38 | | 1,287 | | 46 | | 328 | | 45 | | 61,092 | | 41 | |
| 51-75 bps | | 1,178 | | 75 | | 18,409 | | 67 | | 577 | | 75 | | — | | — | | 20,164 | | 68 | |
| 76-100 bps | | 19,483 | | 100 | | 44,542 | | 89 | | 1,627 | | 86 | | 2,803 | | 85 | | 68,455 | | 92 | |
| 101-200 bps | | 136,201 | | 172 | | 201,315 | | 163 | | 26,656 | | 167 | | 15,518 | | 145 | | 379,690 | | 166 | |
| 201-300 bps | | 191,648 | | 271 | | 344,122 | | 260 | | 179,447 | | 274 | | 21,978 | | 276 | | 737,195 | | 266 | |
| 301-400 bps | | 417,283 | | 360 | | 291,024 | | 363 | | 399,587 | | 362 | | 51,135 | | 360 | | 1,159,029 | | 361 | |
| 401-500 bps | | 229,213 | | 431 | | 350,001 | | 432 | | 160,830 | | 437 | | 216,729 | | 454 | | 956,773 | | 437 | |
| 501-600 bps | | 416 | | 585 | | 6,711 | | 588 | | 10,504 | | 560 | | 1,968 | | 520 | | 19,599 | | 566 | |
601 bps and
above | | 251 | | 697 | | 17,548 | | 663 | | 5,208 | | 666 | | 4,329 | | 747 | | 27,336 | | 677 | |
Total loans with
current rates
above floors | | $ | 1,013,532 | | 323 | | $ | 1,327,522 | | 303 | | $ | 786,866 | | 353 | | $ | 314,788 | | 412 | | $ | 3,442,708 | | 330 | |
Loans at interest
rate floors
providing
support: | | | | | | | | | | | |
| 1-25 bps | | $ | 2,134 | | 25 | | $ | 20,170 | | 20 | | $ | 1,554 | | 23 | | $ | — | | — | | $ | 23,858 | | 21 | |
| 26-50 bps | | 3,361 | | 50 | | 7,924 | | 41 | | — | | — | | — | | — | | 11,285 | | 44 | |
| 51-75 bps | | 398 | | 75 | | 281 | | 63 | | 531 | | 64 | | — | | — | | 1,210 | | 68 | |
| 76-100 bps | | 932 | | 99 | | — | | — | | — | | — | | — | | — | | 932 | | 99 | |
| | | | | | | | | | | |
| | | | | | | | | | | |
| | | | | | | | | | | |
| | | | | | | | | | | |
| | | | | | | | | | | |
Total loans at
interest rate
floors
providing
support | | $ | 6,825 | | 50 | | $ | 28,375 | | 26 | | $ | 2,085 | | 34 | | $ | — | | — | | $ | 37,285 | | 31 | |
Asset quality
In order to operate with a sound risk profile, we focus on originating loans that we believe to be of high quality. We have established loan approval policies and procedures to assist us in maintaining the overall quality of our loan portfolio. When delinquencies in our loans exist, we rigorously monitor the levels of such delinquencies for any negative or adverse trends. From time to time, we may modify loans to extend the term or make other concessions, including interest rate reduction, a term extension, principal forgiveness, payment deferral, or a combination thereof, to help a borrower with a deteriorating financial condition stay current on their loan and to avoid foreclosure. Furthermore, we are committed to collecting on all of our loans. This practice leads to higher recoveries in the long-term.
Nonperforming assets
Our nonperforming assets consist of nonperforming loans, other real estate owned and other repossessed non-earning assets. As of December 31, 2024 and 2023, we had $121.9 million and $86.5 million, respectively, in nonperforming assets. Nonperforming loans are those on which the accrual of interest has stopped, as well as loans that are contractually 90 days past due on which interest continues to accrue. Accrued interest receivable written off as an adjustment to interest income amounted to $0.7 million and $1.1 million for the years ended December 31, 2024 and 2023, respectively. Additionally, we had net interest recoveries on nonperforming assets previously charged off of $1.8 million and $1.4 million for the years ended December 31, 2024 and 2023, respectively.
Nonperforming loans HFI increased by $22.8 million to $83.7 million as of December 31, 2024 compared to $60.9 million as of December 31, 2023. The increase in nonperforming loans primarily occurred in our 1-4 family mortgage residential real estate and construction portfolios. The increase in nonperforming loans in our 1-4 family mortgage residential real estate portfolio stemmed from higher unemployment, while the construction portfolio increase was caused by one credit entering non-performing status. The increase in these portfolios was partially offset by a decrease in our commercial and industrial portfolio driven by a full charge-off of a single commercial and industrial relationship during the year ended December 31, 2024.
As of December 31, 2024 and 2023, we had $31.4 million and $21.2 million, respectively, of delinquent GNMA optional repurchase loans previously sold included on our consolidated balance sheets in loans held for sale. These are considered nonperforming assets as we do not earn any interest on the unexercised option to repurchase these loans.
As of both December 31, 2024 and 2023, other real estate owned included $0.1 million of excess land and facilities held for sale resulting from our prior acquisitions. Other repossessed assets also included other repossessed non-real estate amounting to $2.4 million and $1.1 million as of December 31, 2024 and 2023, respectively.
The following table provides details of our nonperforming assets, the ratio of such loans and other nonperforming assets to total assets, and certain other related information as of the dates presented:
| | | | | | | | | | | | | | | | | | | |
| | December 31, | | | | | | | | |
| (dollars in thousands) | | 2024 | | 2023 | | | | | | | | |
| Loan Type: | | | | | | | | | | | |
| Commercial and industrial | | $ | 10,391 | | $ | 21,730 | | | | | | | | | |
| Construction | | 11,453 | | 3,037 | | | | | | | | | |
| Residential real estate: | | | | | | | | | | | |
| 1-to-4 family mortgage | | 27,944 | | 16,073 | | | | | | | | | |
| Residential line of credit | | 1,894 | | 2,473 | | | | | | | | | |
| Multi-family mortgage | | 21 | | 32 | | | | | | | | | |
| Commercial real estate: | | | | | | | | | | | |
| Owner-occupied | | 9,645 | | 3,188 | | | | | | | | | |
| Non-owner occupied | | 6,179 | | 3,351 | | | | | | | | | |
| Consumer and other | | 16,178 | | 11,039 | | | | | | | | | |
| Total nonperforming loans HFI | | $ | 83,705 | | $ | 60,923 | | | | | | | | | |
| | | | | | | | | | | |
Mortgage loans held for sale(1) | | 31,357 | | 21,229 | | | | | | | | | |
| Other real estate owned | | 4,409 | | 3,192 | | | | | | | | | |
| Other repossessed assets | | 2,444 | | 1,139 | | | | | | | | | |
| Total nonperforming assets | | $ | 121,915 | | $ | 86,483 | | | | | | | | | |
| Nonperforming loans HFI as a percentage of total loans HFI | | 0.87 | % | 0.65 | % | | | | | | | | |
| Nonperforming assets as a percentage of total assets | | 0.93 | % | 0.69 | % | | | | | | | | |
| Nonaccrual loans HFI as a percentage of loans HFI | | 0.62 | % | 0.51 | % | | | | | | | | |
| | | | | | | | | | | |
| | | | | | | | | | | |
| (1) Represents optional right to repurchase government guaranteed GNMA mortgage loans previously sold that meet certain defined delinquency criteria. | | | | | | |
We have evaluated our loans HFI classified as nonperforming and believe all nonperforming loans have been adequately reserved for in the allowance for credit losses on loans HFI as of December 31, 2024 and 2023. Management also continually monitors past due loans for potential credit quality deterioration. Loans not considered nonperforming include loans 30-89 days past due that continue to accrue interest amounting to $47.9 million at December 31, 2024 as compared to $47.0 million at December 31, 2023. The slight increase from December 31, 2023 to December 31, 2024 primarily occurred within our consumer and other, 1-4 family mortgage residential real estate and commercial real estate owner occupied portfolios offset with decreases in our commercial real estate non-owner occupied and construction portfolios.
Allowance for credit losses
The allowance for credit losses represents the portion of the loan’s amortized cost basis that we do not expect to collect due to credit losses over the loan’s life, considering past events, current conditions, and reasonable and supportable forecasts of future economic conditions. Loan losses are charged against the allowance when we believe the uncollectibility of a loan balance is confirmed. Subsequent recoveries, if any, are credited to the allowance. The allowance for credit losses is based on the loan’s amortized cost basis, excluding accrued interest receivable, as we promptly charge off uncollectible accrued interest receivable.
We calculate our expected credit loss using a lifetime loss rate methodology. We utilize probability-weighted forecasts, which consider multiple macroeconomic variables that are applicable to each type of loan. See “Critical Accounting Estimates - Allowance for credit losses” and Note 3 “Loans and allowance for credit losses” in the notes to the consolidated financial statements for additional information regarding our methodology.
The following table presents the allocation of the allowance for credit losses on loans HFI by loan category as well as the ratio of loans by loan category compared to the total loan portfolio as of the dates indicated:
| | | | | | | | | | | | | | | | | | | | | | | | | | | | | | |
| | | | |
| | December 31, |
| | 2024 | | 2023 |
| (dollars in thousands) | | Amount | | | | ACL
as a % of loans HFI category | | Amount | | | | ACL
as a % of loans HFI category |
| | | | | | | | | | | | |
| Loan Type: | | | | | | | | | | | | |
| Commercial and industrial | | $ | 16,667 | | | | | 0.99 | % | | $ | 19,599 | | | | | 1.14 | % |
| Construction | | 31,698 | | | | | 2.91 | % | | 35,372 | | | | | 2.53 | % |
| Residential real estate: | | | | | | | | | | | | |
| 1-to-4 family mortgage | | 25,340 | | | | | 1.57 | % | | 26,505 | | | | | 1.69 | % |
| Residential line of credit | | 10,952 | | | | | 1.82 | % | | 9,468 | | | | | 1.78 | % |
| Multi-family mortgage | | 10,512 | | | | | 1.61 | % | | 8,842 | | | | | 1.46 | % |
| Commercial real estate: | | | | | | | | | | | | |
| Owner-occupied | | 11,993 | | | | | 0.88 | % | | 10,653 | | | | | 0.86 | % |
| Non-owner occupied | | 25,531 | | | | | 1.22 | % | | 22,965 | | | | | 1.18 | % |
| Consumer and other | | 19,249 | | | | | 3.90 | % | | 16,922 | | | | | 4.11 | % |
| Total allowance for credit losses on loans HFI | | $ | 151,942 | | | | | 1.58 | % | | $ | 150,326 | | | | | 1.60 | % |
The following table summarizes activity in our allowance for credit losses on loans HFI during the periods indicated:
| | | | | | | | | | | | | | | | | | | | | | | | | |
| | | | | Years Ended December 31, | |
| (dollars in thousands) | | | | | | 2024 | | | 2023 | | | | | 2022 | |
| Allowance for credit losses on loans HFI at beginning of period | | | | | | $ | 150,326 | | | $ | 134,192 | | | | | $ | 125,559 | | |
| Charge-offs: | | | | | | | | | | | | | |
| Commercial and industrial | | | | | | (11,080) | | | (462) | | | | | (2,087) | | |
| Construction | | | | | | (122) | | | — | | | | | — | | |
| Residential real estate: | | | | | | | | | | | | | |
| 1-to-4 family mortgage | | | | | | (439) | | | (46) | | | | | (77) | | |
| Residential line of credit | | | | | | (73) | | | — | | | | | — | | |
| | | | | | | | | | | | | |
| Commercial real estate: | | | | | | | | | | | | | |
| Owner-occupied | | | | | | — | | | (144) | | | | | (15) | | |
| Non-owner occupied | | | | | | — | | | — | | | | | (268) | | |
| Consumer and other | | | | | | (3,051) | | | (2,851) | | | | | (2,254) | | |
| Total charge-offs | | | | | | $ | (14,765) | | | $ | (3,503) | | | | | $ | (4,701) | | |
| Recoveries: | | | | | | | | | | | | | |
| Commercial and industrial | | | | | | $ | 428 | | | $ | 273 | | | | | $ | 2,005 | | |
| Construction | | | | | | — | | | 10 | | | | | 11 | | |
| Residential real estate: | | | | | | | | | | | | | |
| 1-to-4 family mortgage | | | | | | 84 | | | 100 | | | | | 54 | | |
| Residential line of credit | | | | | | 18 | | | 1 | | | | | 17 | | |
| | | | | | | | | | | | | |
| Commercial real estate: | | | | | | | | | | | | | |
| Owner-occupied | | | | | | 245 | | | 109 | | | | | 88 | | |
| Non-owner occupied | | | | | | — | | | 1,833 | | | | | — | | |
| Consumer and other | | | | | | 939 | | | 573 | | | | | 766 | | |
| Total recoveries | | | | | | $ | 1,714 | | | $ | 2,899 | | | | | $ | 2,941 | | |
| Net charge-offs | | | | | | (13,051) | | | (604) | | | | | (1,760) | | |
| Provision for credit losses on loans HFI | | | | | | 14,667 | | | 16,738 | | | | | 10,393 | | |
| | | | | | | | | | | | | |
| | | | | | | | | | | | | |
| Allowance for credit losses on loans HFI at the end of period | | | | | | $ | 151,942 | | | $ | 150,326 | | | | | $ | 134,192 | | |
Ratio of net charge-offs during the period to average loans outstanding during the
period | | | | | | (0.14) | % | | (0.01) | % | | | | (0.02) | % | |
| Allowance for credit losses on loans HFI as a percentage of loans | | | | | | 1.58 | % | | 1.60 | % | | | | 1.44 | % | |
| Allowance for credit losses on loans HFI as a percentage of nonaccrual loans HFI | | | | | | 256.0 | % | | 311.7 | % | | | | 489.2 | % | |
| Allowance for credit losses on loans HFI as a percentage of nonperforming loans | | | | | | 181.5 | % | | 246.7 | % | | | | 292.7 | % | |
| |
| | | | | | | | | | | | | |
| | | | | | | | | | | | | |
The following tables details our provision for (reversal of) credit losses on loans HFI and net (charge-offs) recoveries to average loans HFI outstanding by loan category during the periods indicated:
| | | | | | | | | | | | | | | | | | | | | | | | | | |
| | Provision for (reversal of) credit losses on loans HFI | | Net (charge-offs) recoveries | | Average loans HFI | | Ratio of net (charge-offs) recoveries to average loans HFI |
| (dollars in thousands) | | | |
| | | | | | | | |
| | | | | | | | |
| | | | | | | | |
| | | | | | | | |
| | | | | | | | |
| | | | | | | | |
| | | | | | | | |
| | | | | | | | |
| | | | | | | | |
| | | | | | | | |
| | | | | | | | |
| | | | | | | | |
| | | | | | | | |
| | | | | | | | |
| | | | | | | | |
| | | | | | | | |
| | | | | | | | |
| | | | | | | | |
| | | | | | | | |
| | | | | | | | |
| | | | | | | | |
| | | | | | | | |
| | | | | | | | |
| | | | | | | | |
| Year Ended December 31, 2024 | | | | | | | | |
| Commercial and industrial | | $ | 7,720 | | | $ | (10,652) | | | $ | 1,655,250 | | | (0.64) | % |
| Construction | | (3,552) | | | (122) | | | 1,199,414 | | | (0.01) | % |
| Residential real estate: | | | | | | | | |
| 1-to-4 family mortgage | | (810) | | | (355) | | | 1,587,111 | | | (0.02) | % |
| Residential line of credit | | 1,539 | | | (55) | | | 562,877 | | | (0.01) | % |
| Multi-family mortgage | | 1,670 | | | — | | | 629,920 | | | — | % |
| Commercial real estate: | | | | | | | | |
| Owner-occupied | | 1,095 | | | 245 | | | 1,278,683 | | | 0.02 | % |
| Non-owner occupied | | 2,566 | | | — | | | 2,021,677 | | | — | % |
| Consumer and other | | 4,439 | | | (2,112) | | | 449,526 | | | (0.47) | % |
| Total | | $ | 14,667 | | | $ | (13,051) | | | $ | 9,384,458 | | | (0.14) | % |
| Year Ended December 31, 2023 | | | | | | | | |
| Commercial and industrial | | $ | 8,682 | | | $ | (189) | | | $ | 1,678,832 | | | (0.01) | % |
| Construction | | (4,446) | | | 10 | | | 1,594,317 | | | — | % |
| Residential real estate: | | | | | | | | |
| 1-to-4 family mortgage | | 310 | | | 54 | | | 1,558,477 | | | — | % |
| Residential line of credit | | 1,973 | | | 1 | | | 507,884 | | | — | % |
| Multi-family mortgage | | 2,352 | | | — | | | 519,554 | | | — | % |
| Commercial real estate: | | | | | | | | |
| Owner-occupied | | 2,905 | | | (35) | | | 1,169,680 | | | — | % |
| Non-owner occupied | | (784) | | | 1,833 | | | 1,925,759 | | | 0.10 | % |
| Consumer and other | | 5,746 | | | (2,278) | | | 381,474 | | | (0.60) | % |
| Total | | $ | 16,738 | | | $ | (604) | | | $ | 9,335,977 | | | (0.01) | % |
| Year Ended December 31, 2022 | | | | | | | | |
| Commercial and industrial | | $ | (4,563) | | | $ | (82) | | | $ | 1,466,685 | | | (0.01) | % |
| Construction | | 11,221 | | | 11 | | | 1,549,622 | | | — | % |
| Residential real estate: | | | | | | | | |
| 1-to-4 family mortgage | | 7,060 | | | (23) | | | 1,438,801 | | | — | % |
| Residential line of credit | | 1,574 | | | 17 | | | 431,826 | | | — | % |
| Multi-family mortgage | | (486) | | | — | | | 411,509 | | | — | % |
| Commercial real estate: | | | | | | | | |
| Owner occupied | | (4,883) | | | 73 | | | 1,060,523 | | | 0.01 | % |
| Non-owner occupied | | (3,584) | | | (268) | | | 1,839,577 | | | (0.01) | % |
| Consumer and other | | 4,054 | | | (1,488) | | | 343,107 | | | (0.43) | % |
| Total | | $ | 10,393 | | | $ | (1,760) | | | $ | 8,541,650 | | | (0.02) | % |
The ACL on loans HFI was $151.9 million and $150.3 million and represented 1.58% and 1.60% of loans HFI as of December 31, 2024 and 2023, respectively. For further information related to the change in the ACL refer to “Provision for credit losses” section herein and Note 3, “Loans and allowance for credit losses on loans HFI” in the notes to our consolidated financial statements.For the year ended December 31, 2024, we experienced net charge-offs of $13.1 million, or 0.14% of average loans HFI, compared to net charge-offs of $0.6 million, or 0.01% for the year ended December 31, 2023. The increase was driven by a $10.5 million full charge-off of a single commercial and industrial relationship during the year ended December 31, 2024. Our ratio of total nonperforming loans HFI as a percentage of total loans HFI increased by 22 basis points to 0.87% as of December 31, 2024 compared to December 31, 2023. See above within this section for further information related to this increase.
Management has made a concerted effort to reduce exposure to construction lending during year ended December 31, 2024. The reduction in construction balances and the corresponding allowance reduction offset some of the additional allowance needed related to growth in other loan segments.
We also maintain an allowance for credit losses on unfunded commitments in other liabilities, which decreased to $6.1 million as of December 31, 2024 from $8.8 million as of December 31, 2023 due to a 4.30% or $124.6 million decrease in unfunded loan commitments during the period. The decrease in the allowance for credit losses on unfunded commitment was driven primarily as a result of management’s concentrated effort to reduce unfunded loan commitments, namely in our construction category.
Loans held for sale
Mortgage loans held for sale consisted of $95.4 million of residential real estate mortgage loans in the process of being sold to third-party private investors or government sponsored agencies and $31.4 million of GNMA optional repurchase loans. This compares to $46.6 million of residential real estate mortgage loans in the process of being sold to third-party private investors or government sponsored agencies and $21.2 million of GNMA optional repurchase loans as of December 31, 2023.
Deposits
Deposits represent the Bank’s primary source of funding. We continue to focus on growing core customer deposits through our relationship driven banking philosophy, community-focused marketing programs and our treasury management services.
Total deposits were $11.21 billion and $10.55 billion as of December 31, 2024 and 2023, respectively. Noninterest-bearing deposits at December 31, 2024 and 2023 were $2.12 billion and $2.22 billion, respectively which include mortgage escrow deposits which increased to $69.0 million as of December 31, 2024 from $63.6 million as of December 31, 2023. Our interest-bearing deposits were $9.09 billion and $8.33 billion at December 31, 2024 and 2023, respectively.
The decrease in our noninterest-bearing deposits from December 31, 2024 to December 31, 2023 was due to a migration to interest-yielding products such as interest-bearing checking deposits, which increased by $402.0 million. In addition, customers also migrated to money market and savings deposits accounts which increased by $133.6 million from December 31, 2023.
Our deposits from municipal and governmental entities, also known as public funds, decreased by $43.0 million during the period within the interest-bearing checking category. The decrease in public funds was largely due to management's decision over the period to not renew certain maturing public deposits.
Additionally, customer time deposits decreased by $89.6 million from December 31, 2023 which was largely driven by management's decision not to renew certain maturing deposits given the change in market interest rates.
Brokered and internet time deposits increased by $318.3 million to $469.1 million as of December 31, 2024 compared to December 31, 2023. The increase was driven by an issuance of brokered deposits of $369.1 million at an average coupon of 4.15% as we took advantage of favorable relative terms available during the second half of the year ended December 31, 2024.
We have experienced an increase in our cost of interest-bearing deposits due to a shift in our deposit composition and due to an increase in the interest rate environment. Average deposit balances by type, together with the average rates per period are reflected in the average balance sheet amounts, interest paid, and rate analysis tables included in this management’s discussion and analysis under the subheading “Results of operations” discussion.
Our deposit base may include certain deposits from related parties as disclosed within Note 22, “Related party transactions” in the notes to our consolidated financial statements included in this Report.
The following table sets forth the distribution by type of our deposit accounts as of the dates indicated:
| | | | | | | | | | | | | | | | | | | | | | | | | | | | | | | | | | | | | | | | | | | | | | | | | | | | | | | | |
| | | | | | |
| | December 31, |
| | 2024 | | | 2023 | | | 2022 | |
| (dollars in thousands) | | Amount | | % of total deposits | | Average rate(1) | | Amount | | % of total deposits | | Average rate(1) | | Amount | | % of total
deposits | | Average rate(1) |
| Deposit Type | | | | | | | | | | | | | | | | | | |
Noninterest-bearing
demand | | $ | 2,116,232 | | | 19 | % | | — | % | | $ | 2,218,382 | | | 21 | % | | — | % | | $ | 2,676,631 | | | 25 | % | | — | % |
| Interest-bearing demand | | 2,906,425 | | | 26 | % | | 3.05 | % | | 2,504,421 | | | 24 | % | | 2.86 | % | | 3,059,984 | | | 28 | % | | 0.70 | % |
| Money market | | 3,986,777 | | | 36 | % | | 3.84 | % | | 3,819,814 | | | 36 | % | | 3.53 | % | | 3,226,102 | | | 30 | % | | 0.80 | % |
| Savings deposits | | 351,706 | | | 3 | % | | 0.07 | % | | 385,037 | | | 4 | % | | 0.06 | % | | 471,143 | | | 4 | % | | 0.05 | % |
| Customer time deposits | | 1,380,205 | | | 12 | % | | 3.97 | % | | 1,469,811 | | | 14 | % | | 3.15 | % | | 1,420,131 | | | 13 | % | | 0.99 | % |
Brokered and internet time
deposits | | 469,089 | | | 4 | % | | 4.86 | % | | 150,822 | | | 1 | % | | 5.27 | % | | 1,843 | | | — | % | | 1.36 | % |
| Total deposits | | $ | 11,210,434 | | | 100 | % | | 2.76 | % | | $ | 10,548,287 | | | 100 | % | | 2.39 | % | | $ | 10,855,834 | | | 100 | % | | 0.54 | % |
| | | | | | | | | | | | | | | | | | |
| | | | | | | | | | | | | | | | | | |
| | | | | | | | | | | | | | | | | | |
Customer Time Deposits(2) | | | | | | | | | | | | | | | | | | |
| 0.00-1.00% | | $ | 65,302 | | | 5 | % | | | | $ | 62,464 | | | 4 | % | | | | $ | 387,739 | | | 27 | % | | |
| 1.01-2.00% | | 63,582 | | | 5 | % | | | | 114,521 | | | 8 | % | | | | 341,721 | | | 24 | % | | |
| 2.01-3.00% | | 74,171 | | | 5 | % | | | | 51,346 | | | 4 | % | | | | 89,916 | | | 6 | % | | |
| 3.01-4.00% | | 264,863 | | | 19 | % | | | | 268,550 | | | 18 | % | | | | 342,576 | | | 24 | % | | |
| 4.01-5.00% | | 875,916 | | | 63 | % | | | | 812,781 | | | 55 | % | | | | 224,308 | | | 16 | % | | |
| Above 5.00% | | 36,371 | | | 3 | % | | | | 160,149 | | | 11 | % | | | | 33,871 | | | 3 | % | | |
| Total customer time deposits | | $ | 1,380,205 | | | 100 | % | | | | $ | 1,469,811 | | | 100 | % | | | | $ | 1,420,131 | | | 100 | % | | |
Brokered and Internet Time Deposits(2) | | | | | | | | | | | | | | | | | | |
| 0.00-1.00% | | $ | — | | | — | % | | | | $ | 99 | | | — | % | | | | $ | 99 | | | 5 | % | | |
| 1.01-2.00% | | — | | | — | % | | | | — | | | — | % | | | | 747 | | | 41 | % | | |
| 2.01-3.00% | | — | | | — | % | | | | 248 | | | — | % | | | | 747 | | | 41 | % | | |
| 3.01-4.00% | | 169,088 | | | 36 | % | | | | — | | | — | % | | | | 250 | | | 13 | % | | |
| 4.01-5.00% | | 199,888 | | | 43 | % | | | | — | | | — | % | | | | — | | | — | % | | |
| Above 5.00% | | 100,113 | | | 21 | % | | | | 150,475 | | | 100 | % | | | | — | | | — | % | | |
| Total brokered and internet time deposits | | $ | 469,089 | | | 100 | % | | | | $ | 150,822 | | | 100 | % | | | | $ | 1,843 | | | 100 | % | | |
| Total time deposits | | $ | 1,849,294 | | | | | | | $ | 1,620,633 | | | | | | | $ | 1,421,974 | | | | | |
(1) Average rates are presented for the years ended December 31, 2024, 2023, and 2022, respectively. (2) Rates are presented as of period-end. |
Further details related to our deposit customer base is presented below as of the dates indicated: | | | | | | | | | | | | | | | | | | | | | | | | | | |
| | | | |
| | December 31, |
| | 2024 | | | 2023 | |
| (dollars in thousands) | | Amount | | % of total deposits | | Amount | | % of total deposits |
Deposits by customer segment(1) | | | | | | | | |
| Consumer | | $ | 4,853,609 | | | 43 | % | | $ | 4,880,890 | | | 46 | % |
| Commercial | | 4,802,105 | | | 43 | % | | 4,069,724 | | | 39 | % |
| Public | | 1,554,720 | | | 14 | % | | 1,597,673 | | | 15 | % |
| Total deposits | | $ | 11,210,434 | | | 100 | % | | $ | 10,548,287 | | | 100 | % |
(1) Segments are determined based on the customer account level.
The tables below set forth maturity information on time deposits and amounts in excess of the FDIC insurance limit as of December 31, 2024:
| | | | | | | | | | | | | | |
| | |
| (dollars in thousands) | | Amount | | Weighted average interest rate at period end |
| Time deposits of $250 and less | | | | |
| Months to maturity: | | | | |
| Three or less | | $ | 364,837 | | | 4.25 | % |
| Over Three to Six | | 420,080 | | | 4.15 | % |
| Over Six to Twelve | | 345,798 | | | 3.71 | % |
| Over Twelve | | 268,568 | | | 3.48 | % |
| Total | | $ | 1,399,283 | | | 3.94 | % |
| | | | |
| Time deposits of greater than $250 | | | | |
| Months to maturity: | | | | |
| Three or less | | $ | 135,225 | | | 4.46 | % |
| Over Three to Six | | 174,164 | | | 4.32 | % |
| Over Six to Twelve | | 103,796 | | | 3.66 | % |
| Over Twelve | | 36,826 | | | 3.37 | % |
| Total | | $ | 450,011 | | | 4.13 | % |
Uninsured deposits are defined as the portion of deposit accounts in U.S. offices that exceed the FDIC insurance limit and amounts in any other uninsured investment or deposit account that are classified as deposits and are not subject to any federal or state deposit insurance regimes. Collateralized deposits are included within our total uninsured deposits.
As of December 31, 2024, the estimated portion of time deposits outstanding that are otherwise uninsured by maturity were as follows:
| | | | | | | | |
| | | | |
| (dollars in thousands) | | | | Amount |
| Months to maturity: | | | | |
| Three or less | | | | $ | 118,064 | |
| Over Three to Six | | | | 152,948 | |
| Over Six to Twelve | | | | 96,165 | |
| Over Twelve | | | | 31,790 | |
| Total | | | | $ | 398,967 | |
Further details related to our estimated insured or collateralized deposits and uninsured and uncollateralized deposits is presented below as of the dates indicated:
| | | | | | | | | | | | | | |
| | | | |
| | December 31, |
| | 2024 | | | 2023 | |
Estimated insured or collateralized deposits(1) | | $ | 8,346,796 | | | $ | 7,414,224 | |
Estimated uninsured and uncollateralized deposits(1) | | $ | 2,863,638 | | | $ | 3,134,063 | |
Estimated uninsured and uncollateralized deposits as a % of total deposits(1) | | 25.5 | % | | 29.7 | % |
Estimated uninsured deposits(2) | | $ | 4,478,898 | | | $ | 4,899,349 | |
(1) Amounts are shown on a fully consolidated basis and exclude deposits of affiliates that are eliminated in consolidation.
(2) Amounts are shown on an unconsolidated basis consistent with regulatory reporting requirements.
Other earning assets
Securities purchased under agreements to resell (“reverse repurchase agreements”)
We enter into agreements with certain customers to purchase investment securities under agreements to resell at specific dates in the future. This investment deploys some of our liquidity position into an instrument that improves the return on those funds. Securities purchased under agreements to resell totaled $61.1 million and $47.8 million at December 31, 2024 and 2023, respectively.
Federal Funds Sold
Federal funds may fluctuate from period to period depending upon our liquidity position at the time and our strategy for deploying liquidity. Federal funds sold totaled $64.8 million and $35.5 million at December 31, 2024 and 2023, respectively.
AFS debt securities portfolio
Our investment portfolio objectives include maximizing total return after other primary objectives are achieved such as, but not limited to, providing liquidity, capital preservation, and pledging collateral for certain deposit types, various lines of credit and other borrowings. The investment objectives guide the portfolio allocation among security types, maturities, and other attributes.
The fair value of our AFS debt securities portfolio was $1.54 billion and $1.47 billion as of December 31, 2024 and 2023, respectively. Included in the fair value of AFS debt securities were net unrealized losses of $141.4 million and $186.8 million as of December 31, 2024 and 2023, respectively. Current net unrealized losses are due to increases in longer term interest rates.
During the year ended December 31, 2024, we sold $526.4 million of AFS debt securities, resulting in a loss on securities of $56.4 million. We primarily sold fixed rate, deeply discounted mortgage bonds and low yielding municipal bonds and reinvested the proceeds into U.S. government agency AFS debt securities and a blend of fixed and floating rate securities to achieve the best accretion profile for the Bank. Including the reinvestment of these proceeds, we purchased $905.4 million of AFS debt securities during the year ended December 31, 2024. Maturities, prepayments and calls of AFS debt securities totaled $299.8 million for the year ended December 31, 2024.
During the year ended December 31, 2023, we sold $100.5 million of AFS debt securities. The sales contributed to a pre-tax loss on securities of $14.0 million. We primarily sold collateralized mortgage obligations, U.S. government agency securities and municipal securities. We reinvested the proceeds from the sales primarily into U.S. government agency AFS debt securities in order increase the effective yield of our portfolio. Including the reinvestment of these proceeds, we purchased $202.1 million of AFS debt securities during the year ended December 31, 2023 and had maturities and calls of securities which totaled $128.2 million.
The following table sets forth the fair value, scheduled maturities and weighted average yields for our AFS debt securities portfolio as of the dates indicated below:
| | | | | | | | | | | | | | | | | | | | | | | | | | | | | | | | | | | | | | |
| | | | |
| | December 31, |
| | | 2024 | | | 2023 | |
| (dollars in thousands) | | Fair value | | % of total investment securities | | Weighted average yield (1) | | Fair value | | % of total investment securities | | Weighted average yield (1) |
| U.S. Treasury securities: | | | | | | | | | | | | |
| Maturing within one year | | $ | 299 | | | — | % | | 4.25 | % | | $ | 61,466 | | | 4.2 | % | | 2.50 | % |
| Maturing in one to five years | | — | | | — | % | | — | % | | 47,030 | | | 3.2 | % | | 1.59 | % |
| Maturing in five to ten years | | — | | | — | % | | — | % | | — | | | — | % | | — | % |
| Maturing after ten years | | — | | | — | % | | — | % | | — | | | — | % | | — | % |
| Total U.S. Treasury securities | | 299 | | | — | % | | 4.25 | % | | 108,496 | | | 7.4 | % | | 2.10 | % |
| U.S. government agency securities: | | | | | | | | | | | | |
| Maturing within one year | | — | | | — | % | | — | % | | — | | | — | % | | — | % |
| Maturing in one to five years | | — | | | — | % | | — | % | | 13,094 | | | 0.9 | % | | 1.96 | % |
| Maturing in five to ten years | | 207,220 | | | 13.5 | % | | 5.28 | % | | 6,000 | | | 0.4 | % | | 6.40 | % |
| Maturing after ten years | | 355,787 | | | 23.1 | % | | 5.47 | % | | 184,862 | | | 12.6 | % | | 6.23 | % |
| Total U.S. government agency securities | | 563,007 | | | 36.6 | % | | 5.40 | % | | 203,956 | | | 13.9 | % | | 5.96 | % |
| Municipal securities: | | | | | | | | | | | | |
| Maturing within one year | | 548 | | | — | % | | 4.26 | % | | 2,813 | | | 0.2 | % | | 2.23 | % |
| Maturing in one to five years | | 3,611 | | | 0.2 | % | | 3.56 | % | | 11,677 | | | 0.8 | % | | 5.85 | % |
| Maturing in five to ten years | | 15,723 | | | 1.0 | % | | 3.06 | % | | 40,304 | | | 2.7 | % | | 3.60 | % |
| Maturing after ten years | | 127,975 | | | 8.3 | % | | 2.93 | % | | 187,469 | | | 12.7 | % | | 2.94 | % |
| Total municipal securities | | 147,857 | | | 9.5 | % | | 2.96 | % | | 242,263 | | | 16.4 | % | | 3.00 | % |
| Mortgage-backed securities - residential and commercial: | | | | | | | | | | | | |
| Maturing within one year | | 2,222 | | | 0.1 | % | | 3.35 | % | | 126 | | | — | % | | 1.57 | % |
| Maturing in one to five years | | 343 | | | — | % | | 2.16 | % | | 3,239 | | | 0.2 | % | | 2.91 | % |
| Maturing in five to ten years | | 13,424 | | | 0.9 | % | | 2.73 | % | | 33,121 | | | 2.3 | % | | 2.97 | % |
| Maturing after ten years | | 809,867 | | | 52.8 | % | | 3.10 | % | | 877,446 | | | 59.6 | % | | 1.86 | % |
| Total mortgage-backed securities - residential and commercial | | 825,856 | | | 53.8 | % | | 3.09 | % | | 913,932 | | | 62.1 | % | | 1.90 | % |
| | | | | | | | | | | | |
| | | | | | | | | | | | |
| | | | | | | | | | | | |
| | | | | | | | | | | | |
| | | | | | | | | | | | |
| | | | | | | | | | | | |
| Corporate securities: | | | | | | | | | | | | |
| Maturing within one year | | — | | | — | % | | — | % | | — | | | — | % | | — | % |
| Maturing in one to five years | | 989 | | | 0.1 | % | | 7.98 | % | | — | | | — | % | | — | % |
| Maturing in five to ten years | | — | | | — | % | | — | % | | 3,326 | | | 0.2 | % | | 4.33 | % |
| Maturing after ten years | | — | | | — | % | | — | % | | — | | | — | % | | — | % |
| Total corporate securities | | 989 | | | 0.1 | % | | 7.98 | % | | 3,326 | | | 0.2 | % | | 4.33 | % |
| Total AFS debt securities | | $ | 1,538,008 | | | 100.0 | % | | 3.93 | % | | $ | 1,471,973 | | | 100.0 | % | | 2.66 | % |
(1)Yields on a tax-equivalent basis.
Borrowed funds
Deposits are the primary source of funds for our lending activities and general business purposes. However, we may also obtain advances from the FHLB, borrow from the Federal Reserve’s Discount Window, one-off borrowing programs from the Federal Reserve, purchase federal funds and engage in overnight borrowing with correspondent banks, or enter into client repurchase agreements. We also use these sources of funds as part of our asset liability management process to control our long-term interest rate risk exposure, even if it may increase our short-term cost of funds.
Our level of short-term borrowing can fluctuate on a daily basis depending on funding needs and the sources of funds to satisfy those needs, in addition to the overall interest rate environment and cost of public funds.
Securities sold under agreements to repurchase and federal funds purchased
We enter into agreements with certain customers to sell certain securities under agreements to repurchase the security the following day. These agreements are made to provide customers with comprehensive treasury management products
as a short-term return for their excess funds. Securities sold under agreements to repurchase totaled $13.5 million and $19.3 million at December 31, 2024 and 2023, respectively.
We also maintain lines with certain correspondent banks that provide borrowing capacity in the form of federal funds purchased. Federal funds purchased are short-term borrowings that typically mature within one to ninety days. Borrowings against these lines (i.e., federal funds purchased) totaled $89.4 million as of December 31, 2023. There were no such borrowings as of December 31, 2024.
FHLB short-term advances
As a member of the FHLB system, we may utilize advances from the FHLB in order to provide additional liquidity and funding. Under these short-term agreements, we maintain a line of credit that as of December 31, 2024 and 2023 had total borrowing capacity of $1.40 billion and $1.76 billion, respectively. As of December 31, 2024 and 2023, we had qualifying loans pledged as collateral securing these lines amounting to $2.61 billion and $3.01 billion, respectively. There were no FHLB advances outstanding as of December 31, 2024 or December 31, 2023.
Bank Term Funding Program
In March 2023, the Federal Reserve established the Bank Term Funding Program to make available funding to eligible depository institutions in order to help assure they have the ability to meet the needs of their depositors following the March 2023 high-profile bank failures. The program allows for advances for up to one year secured by eligible high-quality securities at par value extended at the one-year overnight index swap rate, plus 10 basis points, as of the day the advance is made. The interest rate is fixed for the term of the advance and there are no prepayment penalties. The BTFP ceased extending new borrowings on March 11, 2024. As of December 31, 2023, we had outstanding borrowings of $130.0 million under the BTFP at a borrowing rate of 4.85%. During the year ended December 31, 2024, we repaid the $130.0 million borrowings in full.
Subordinated debt
During the year ended December 31, 2003, we formed two separate trusts which issued $9.0 million and $21.0 million of floating rate trust preferred securities as part of a pooled offering of such securities. We issued junior subordinated debentures of $9.3 million, which included proceeds of common securities which we purchased for $0.3 million, and junior subordinated debentures of $21.7 million which included proceeds of common securities of $0.7 million. The trusts were created for the sole purpose of issuing 30-year capital trust preferred securities to fund the purchase of junior subordinated debentures issued by us. Both issuances were to the trusts in exchange for the proceeds of the securities offerings, which represent the sole asset of the trusts.
Additionally, during the year ended December 31, 2020, we placed $100.0 million of ten year fixed-to-floating rate subordinated notes, maturing September 1, 2030. The Company mitigated interest rate exposure associated with these notes through the use of fair value hedging instruments. The fair value hedge matured during the year ended December 31, 2024. See Note 15, "Derivatives" for additional details related to these instruments.
Further information related to our subordinated debt as of December 31, 2024 is detailed below:
| | | | | | | | | | | | | | | | | | | | |
| (dollars in thousands) | Year established | Maturity | Call date | Total debt outstanding | Interest rate | Coupon structure |
| Subordinated debt issued by trust preferred securities: | | |
FBK Trust I (1) | 2003 | 06/09/2033 | 6/09/2008 | $ | 9,280 | | 7.84% | 3-month SOFR plus 3.51% |
FBK Trust II (1) | 2003 | 06/26/2033 | 6/26/2008 | 21,650 | | 7.74% | 3-month SOFR plus 3.41% |
| Additional subordinated debt: | | | | | | |
FBK subordinated debt I(2) | 2020 | 09/01/2030 | 9/1/2025 | 100,000 | | 4.50% | Semi-annual fixed(3) |
| Unamortized debt issuance costs | (226) | | | |
| | | |
| Total subordinated debt, net | $ | 130,704 | | | |
(1)The Company classifies $30.0 million of the Trusts' subordinated debt as Tier 1 capital. (2)The Company classifies the issuance, net of unamortized issuance costs as Tier 2 capital, which will be phased out 20% per year in the final five years before maturity. (3)Beginning on September 1, 2025 the coupon structure migrates to the 3-month SOFR plus a spread of 439 basis points through the end of the term of the debenture. |
Other borrowings
Other borrowings on our consolidated balance sheets includes our finance lease liability totaling $1.2 million and $1.3 million as of December 31, 2024 and 2023, respectively. In addition, other borrowings on our consolidated balance sheets include guaranteed rebooked GNMA loans previously sold that meet certain defined delinquency criteria and are eligible for repurchase totaling $31.4 million and $21.2 million as of December 31, 2024 and 2023, respectively. See Note 7, “Leases” and Note 16, “Fair value of financial instruments” within the notes to our consolidated financial statements herein for additional information regarding our finance lease and guaranteed GNMA loans eligible for repurchase, respectively.
Liquidity and capital resources
We are expected to maintain adequate liquidity at the Bank to meet the cash flow requirements of clients who may be either depositors wishing to withdraw funds or borrowers needing assurance that sufficient funds will be available to meet their credit needs. Our Liquidity Policy is intended to cause the Bank to maintain adequate liquidity and, therefore, enhance our ability to raise funds to support asset growth, meet deposit withdrawals and lending needs and otherwise sustain our operations. We accomplish this through management of the maturities of our interest-earning assets and interest-bearing liabilities. We believe that our present position is adequate to meet our current and future liquidity needs.
We continuously monitor our liquidity position to ensure that assets and liabilities are managed in a manner that will meet all of our short-term and long-term cash requirements. We manage our liquidity position to meet the daily cash flow needs of clients, while maintaining an appropriate balance between assets and liabilities to optimize our net interest margin. We also monitor our liquidity requirements in light of interest rate trends, changes in the economy and the scheduled maturity and interest rate sensitivity of the investment and loan portfolios and deposits.
As part of our liquidity management strategy, we focus on minimizing our costs of liquidity and attempt to decrease these costs by growing our noninterest-bearing and other low-cost deposits, while replacing higher cost funding sources. While we do not control the types of deposit instruments our clients choose, we do influence those choices with the rates and the deposit specials we offer. Increasing interest rates generally attracts customers to higher cost interest-bearing deposit products as they seek to maximize their yield.
Our investment portfolio is another alternative for meeting liquidity needs. These assets generally have readily available markets that offer conversions to cash as needed. AFS debt securities within our investment portfolio are used to secure government, public, trust and other deposits and as collateral for short-term borrowings, letters of credit and derivative instruments. As of December 31, 2024 and 2023, we had pledged securities related to these items with carrying values of $0.94 billion and $0.93 billion, respectively.
Additional sources of liquidity include federal funds purchased, repurchase agreements, FHLB borrowings and lines of credit. Interest is charged at the prevailing market rate on federal funds purchased, reverse repurchase agreements and FHLB advances. Overnight advances obtained from the FHLB are used primarily to meet day to day liquidity needs, particularly when the cost of such borrowing compares favorably to the rates that we would be required to pay to attract deposits. There were no FHLB advances outstanding as of December 31, 2024 or December 31, 2023. As of December 31, 2024, we had the ability to borrow $1.40 billion through FHLB advances with remaining capacity of $1.40 billion. As of December 31, 2023, there was $1.76 billion available to borrow against with a remaining capacity of $1.30 billion.
We also maintained unsecured lines of credit with other commercial banks totaling $370.0 million as of both December 31, 2024 and 2023. These are unsecured, uncommitted lines of credit typically maturing at various times within the next twelve months. Borrowings against these lines (i.e., federal funds purchased) totaled $89.4 million as of December 31, 2023. There were no such borrowings against these lines as of December 31, 2024. As of both December 31, 2024 and 2023, we also had $50.0 million available through the IntraFi network, which allows us to offer banking customers access to FDIC insurance protection on deposits through our Bank which exceed FDIC insurance limits.
Our current on-balance sheet liquidity and available sources of liquidity are summarized in the table below:
| | | | | | | | | | | | | | |
| | | | |
| | December 31, |
| (dollars in thousands) | | 2024 | | | 2023 | |
| Current on-balance sheet liquidity: | | | | |
| Cash and cash equivalents | | $ | 1,042,488 | | | $ | 810,932 | |
| Unpledged AFS debt securities | | 600,965 | | | 542,427 | |
| | | | |
| Total on-balance sheet liquidity | | $ | 1,643,453 | | | $ | 1,353,359 | |
| | | | |
| Available sources of liquidity: | | | | |
Unsecured borrowing capacity(1) | | $ | 3,318,091 | | | $ | 3,350,026 | |
| FHLB remaining borrowing capacity | | 1,397,905 | | | 1,297,702 | |
| Federal Reserve discount window | | 2,053,541 | | | 2,431,084 | |
| Total available sources of liquidity | | $ | 6,769,537 | | | $ | 7,078,812 | |
| | | | |
| On-balance sheet liquidity as a percentage of total assets | | 12.5 | % | | 10.7 | % |
On-balance sheet liquidity and available sources of liquidity as a percentage of estimated uninsured and uncollateralized deposits(2) | | 293.8 | % | | 269.0 | % |
| | | | |
| | | | |
| | | | |
| | | | |
(1)Includes capacity available per internal policy in the form of brokered deposits and unsecured lines of credit.
(2)Amounts are shown on a fully consolidated basis and exclude deposits of affiliates that are eliminated in consolidation.
The Company also maintains the ability to access capital markets to meet its liquidity needs. The Company may utilize various methods to raise capital, including through the sale of common stock, preferred stock, debt securities, warrants, rights, or other securities. Specific terms and prices would be determined at the time of any such offering. In the past, the Company has utilized capital markets to generate liquidity in the form of common stock and subordinated debt primarily for the purpose of funding acquisitions.
The Company is a corporation separate and apart from the Bank and, therefore, it must provide for its own liquidity. The Company’s main source of funding is dividends declared and paid by the Bank to the Company. Statutory and regulatory limitations exist that affect the ability of the Bank to pay dividends to the Company. Management believes that these limitations will not impact the Company’s ability to meet its ongoing short-term cash obligations. For additional information regarding dividend restrictions, see the “Item 1. Business - Supervision and regulation,” “Item 1A. Risk Factors - Risks related to our business” and “Item 5. Market for Registrant’s Common Equity, Related Stockholder Matters and Issuer Purchases of Equity Securities - Dividends,” each of which is set forth in our Annual Report.
Due to state banking laws, the Bank may not declare dividends in any calendar year in an amount exceeding the total of its net income for that year combined with its retained net income of the preceding two years, without the prior approval of the TDFI. Based upon this regulation, as of December 31, 2024 and December 31, 2023, $185.9 million and $218.4 million of the Bank’s retained earnings were available for the payment of dividends without such prior approval. In addition, dividends paid by the Bank to the Company would be prohibited if the effect thereof would cause the Bank’s capital to be reduced below applicable minimum capital requirements. During the year ended December 31, 2024, there were $61.5 million in cash dividends approved by the board for payment from the Bank to the holding company. Additionally, asset dividends of equity securities amounting to $21.7 million were distributed from the Bank to the holding company during the year ended December 31, 2024. During the year ended December 31, 2023, there were $49.0 million in cash dividends approved by the board for payment from the Bank to the holding company. None of these required approval from the TDFI. Subsequent to December 31, 2024, the Board approved a dividend from the Bank to the holding company to be paid in the first quarter for $9.8 million that also did not require approval from the TDFI.
During the year ended December 31, 2024, the Company declared shareholder dividends of $0.68 per share, or $32.2 million. During the year ended December 31, 2023, the Company declared shareholder dividends of $0.60 per share, or $28.3 million. Subsequent to December 31, 2024, the Company declared a quarterly dividend in the amount of $0.19 per share, payable on February 25, 2025, to stockholders of record as of February 11, 2025.
Shareholders’ equity and capital management
Our total shareholders’ equity was $1.57 billion and $1.45 billion as of December 31, 2024 and 2023, respectively. The increase in shareholders’ equity was primarily attributable to net income of $116.0 million and unrealized loss reclassification adjustment for loss on sale of securities included in net income of $41.7 million (net of tax benefit) from December 31, 2023. This increase was partially off-set by dividends declared of $32.2 million and stock repurchases of $12.7 million. Book value per common share was $33.59 as of December 31, 2024 and $31.05 as of December 31, 2023.
Our capital management consists of providing adequate equity to support our current and future operations. We are subject to various regulatory capital requirements administered by state and federal banking agencies, including the TDFI, Federal Reserve and the FDIC. Failure to meet minimum capital requirements may prompt certain actions by regulators that, if undertaken, could have a direct material adverse effect on our financial condition and results of operations. The Federal Reserve and the FDIC have issued guidelines governing the levels of capital that banks must maintain. As of December 31, 2024 and 2023, we met all capital adequacy requirements for which we were subject. See additional discussion regarding our capital adequacy and ratios within Note 19, “Minimum capital requirements” in the notes to our consolidated financial statements contained herein.
| | | | | | | | | | | | | | | | | | | | |
| December 31, 2024 | | FB Financial Corporation | | FirstBank | |
To be Well-Capitalized(1) |
| Total risk-based capital | | 15.2 | % | | 14.7 | % | | 10.0 | % |
| Tier 1 risk-based capital | | 13.1 | % | | 12.6 | % | | 8.0 | % |
| Common Equity Tier 1 ratio | | 12.8 | % | | 12.6 | % | | 6.5 | % |
| Tier 1 leverage | | 11.3 | % | | 10.8 | % | | 5.0 | % |
(1) Applicable to Bank level capital.
Capital ratios are well above regulatory requirements for well-capitalized institutions. Management uses risk-based capital ratios in its analysis of the measures to assess the quality of capital and believes that investors may find it useful in their analysis of the Company.
Critical accounting estimates
Our consolidated financial statements are prepared in accordance with U.S. generally accepted accounting principles and general practices within the banking industry. A summary of our accounting policies is included in “Item 8. Financial Statements and Supplementary Data - Note 1, Basis of presentation and summary of significant accounting policies” of this Report. Certain of these policies require management to apply significant judgement and estimates, which can have a material impact on the carrying value of certain assets and liabilities, and we consider the below policies to be our critical accounting policies.
Allowance for credit losses
The allowance for credit losses represents management’s best estimate of expected credit losses over the life of our loan portfolios as measured at each respective recent balance sheet date. However, significant downturns in circumstances relating to loan quality or economic conditions could necessitate additional provisions or reductions in the ACL. Unanticipated changes and events could have a significant impact on the financial performance of our loan customers and their ability to perform as agreed. The economic indices sourced from economic forecasts and used in developing the ACL include the unemployment rate, changes in the U.S. gross domestic product, changes in commercial real estate prices and BBB spread.
Given the dynamic relationship between macroeconomic variables within our modeling framework it is difficult to estimate the impact of a change in any one individual variable on the ACL. However, to illustrate a hypothetical sensitivity, we calculated a quantitative allowance using an alternative negative economic scenario. Under this alternative negative economic scenario, a significant deterioration in economic conditions was assumed which would negatively impact the underlying economic variables, compared to our baseline forecast. Below is a comparison of key economic assumptions between these scenarios at the end of each period noted below.
| | | | | | | | | | | | | | | | | | | | |
| | December 31, |
| | 2024 | | 2025 | | 2026 |
| Baseline forecast: | | | | | | |
| Unemployment rate | | 4.00% | | 4.10% | | 4.00% |
| GDP | | 2.70% | | 2.20% | | 2.00% |
| CRE price index | | 305.7 | | 304.4 | | 327.1 |
| BBB spread | | 1.60% | | 2.20% | | 2.50% |
| | | | | | |
| Negative economic scenario: | | | | | | |
| Unemployment rate | | 4.00% | | 6.30% | | 5.60% |
| GDP | | 2.70% | | 0.03% | | 1.70% |
| CRE price index | | 305.7 | | 272.9 | | 304.4 |
| BBB spread | | 1.60% | | 2.70% | | 2.60% |
Excluding the impact of qualitative considerations, using only the negative economic scenario would result in a hypothetical increase over our recognized ACL of approximately $53.2 million at December 31, 2024.
The preceding sensitivity analysis results do not represent our view of expected credit losses nor is it intended to estimate future changes in provisioning for credit losses due to:
•highly uncertain and speculative economic environment;
•inter-relatedness and non-linearity of economic variables resulting inability to extrapolate to additional changes in variables; and
•sensitivity analysis does not consider any quantitative or qualitative adjustments and associated risk profile components incorporated by management as part of its overall ACL framework.
Mortgage servicing rights
We account for our mortgage servicing rights at fair value at each reporting date with changes in the fair value reported in earnings in the period in which the changes occur. We retain the right to service certain mortgage loans that we sell to secondary market investors. These mortgage servicing rights are recognized as a separate asset on the date the corresponding mortgage is sold.
The retained mortgage servicing right is initially measured at the fair value of future net cash flows expected to be realized for performing servicing activities. Fair value is determined using an income approach with various assumptions including expected cash flows, prepayment speeds, market discount rates, servicing costs, and other factors. These techniques require management to make estimates regarding future servicing cash flows, taking into consideration historical and forecasted residential mortgage loan prepayment rates, discount rates, escrow balance and servicing costs. Changes in interest rates and prepayments speeds or other factors impact the fair value of the MSR which impacts earnings. The fair value of the MSR was $162.0 million at December 31, 2024.
Based on a hypothetical sensitivity analysis, we estimate that an increase in discount rates of 100 basis points and 200 basis points would reduce the December 31, 2024 fair value of the MSR by approximately 4.64% (or $7.5 million) and 8.88% (or $14.4 million), respectively. Separately, a 10% and 20% increase on the prepayment rates would reduce the December 31, 2024 fair value of the MSR by approximately 2.60% (or $4.2 million) and 5.04% (or $8.2 million), respectively.
The sensitivity calculations above are hypothetical changes and should not be considered to be predictive of future performance. Changes in fair value based on adverse changes in assumptions generally cannot be extrapolated because the relationship of the change in assumption to the change in fair value may not be linear. Also, the effect of an adverse variation in a particular assumption on the fair value of the mortgage servicing rights calculated without changing any other assumption, while in reality changes in one factor may result in changes in another, which may either magnify or counteract the effect of the change. The derivative instruments utilized by the Company, which were not included in the above sensitivities, would serve to offset the estimated impacts to fair value included above.
ITEM 7A — Quantitative and Qualitative Disclosures About Market Risk
Interest rate sensitivity
Our market risk arises primarily from interest rate risk inherent in the normal course of lending and deposit-taking activities. Management believes that our ability to successfully respond to changes in interest rates will have a significant impact on our financial results. To that end, management actively monitors and manages our interest rate risk exposure.
The ALCO, which is authorized by our Board of Directors, monitors our interest rate sensitivity and makes decisions relating to that process. The ALCO’s goal is to structure our asset/liability composition to maximize net interest income while managing interest rate risk so as to minimize the adverse impact of changes in interest rates on net interest income and capital in either a rising or declining interest rate environment. Profitability is affected by fluctuations in interest rates. A sudden and substantial change in interest rates may adversely impact our earnings because the interest rates borne by assets and liabilities do not change at the same speed, to the same extent or on the same basis.
We monitor the impact of changes in interest rates on our net interest income and economic value of equity using rate shock analysis. Net interest income simulations measure the short-term earnings exposure from changes in market rates of interest in a rigorous and explicit fashion. Our current financial position is combined with assumptions regarding future business to calculate net interest income under varying hypothetical rate scenarios. EVE measures our long-term earnings exposure from changes in market rates of interest. EVE is defined as the present value of assets minus the present value of liabilities at a point in time. A decrease in EVE due to a specified rate change indicates a decline in the long-term earnings capacity of the balance sheet assuming that the rate change remains in effect over the life of the current balance sheet. For purposes of calculating EVE, a zero percent floor is assumed on discount factors.
The following analysis depicts the estimated impact on net interest income and EVE of immediate changes in interest rates at the specified levels for the periods presented:
| | | | | | | | | | | | | | | | | | |
| | Percentage change in: | | | | |
| | Net interest income (1) | | | | |
| | | | |
| | | | | | | | |
| Change in interest rates | | December 31, | | | | |
| (in basis points) | | 2024 | | | 2023 | | | | | |
| +400 | | 10.4 | % | | 8.99 | % | | | | |
| +300 | | 8.39 | % | | 6.81 | % | | | | |
| +200 | | 5.78 | % | | 4.65 | % | | | | |
| +100 | | 2.97 | % | | 2.44 | % | | | | |
| -100 | | (2.87) | % | | (2.86) | % | | | | |
| -200 | | (6.06) | % | | (6.54) | % | | | | |
| | | | | | | | | | | | | | |
| | | Percentage change in: |
| | Economic value of equity (2) |
| | | | |
| Change in interest rates | | December 31, |
| (in basis points) | | 2024 | | | 2023 | |
| +400 | | (14.5) | % | | (16.6) | % |
| +300 | | (12.3) | % | | (13.6) | % |
| +200 | | (7.92) | % | | (8.05) | % |
| +100 | | (3.80) | % | | (3.29) | % |
| -100 | | 3.08 | % | | 1.03 | % |
| -200 | | 5.17 | % | | (0.63) | % |
(1)The percentage change represents the projected net interest income for 12 months on a flat balance sheet in a stable interest rate environment versus the projected net interest income in the various rate scenarios.
(2)The percentage change in this column represents our EVE in a stable interest rate environment versus EVE in the various rate scenarios.
The results for the net interest income simulations as of December 31, 2024 and 2023 resulted in an asset sensitive position. The primary influence of our asset sensitivity is the floating rate structure in many of our loans held for investment as well as the composition of our liabilities which is primarily customer deposits. Our floating-rate loan portfolio is indexed to market rates and the timing and magnitude of loan and deposit repricing varies in proportion to market rate fluctuations. We actively monitor and perform stress tests on our deposit betas as part of our overall management of interest rate risk. This requires the use of various assumptions based on historical relationships of these variables in reaching any conclusion. Since these correlations are based on competitive pricing in the market, we anticipate that our future results will likely be different from the scenario results presented above and such differences could be material.
The preceding measures assume no change in the size or asset/liability compositions of the balance sheet. Thus, the measures do not reflect the actions the ALCO may undertake in response to such changes in interest rates. The scenarios assume instantaneous movements in interest rates in increments of 100, 200, 300 and 400 basis points. As interest rates are adjusted over a period of time, it is our strategy to proactively change the volume and mix of our balance sheet in order to mitigate our interest rate risk. The computation of the prospective effects of hypothetical interest rate changes requires numerous assumptions regarding characteristics of new business and the behavior of existing positions. These business assumptions are based upon our experience, business plans and published industry experience. Key assumptions employed in the model include asset prepayment speeds, competitive factors, the relative price sensitivity of certain assets and liabilities and the expected life of non-maturity deposits. Because these assumptions are inherently uncertain, actual results may differ from simulated results.
We may utilize derivative financial instruments as part of an ongoing effort to mitigate interest rate risk exposure to interest rate fluctuations and facilitate the needs of our customers. For more information about our derivative financial instruments, see Note 15, “Derivatives” in the notes to our consolidated financial statements.
ITEM 8 – Financial Statements and Supplementary Data
| | | | | |
| Table of Contents |
| |
| | Page |
| |
| |
| |
| Consolidated Financial Statements: | |
| |
| |
| |
| |
| |
| |
Report on Management’s Assessment of Internal Control over Financial Reporting
The management of FB Financial Corporation (the “Company”) is responsible for establishing and maintaining adequate internal control over financial reporting. The Company's internal control over financial reporting is a process designed by, or under the supervision of, the Company’s principal executive and principal financial officer and effected by the Board of Directors, management and other personnel, to provide reasonable assurance regarding the reliability of financial reporting and the preparation of financial statements for external purposes in accordance with generally accepted accounting principles and includes those policies and procedures that (i) pertain to the maintenance of records that in reasonable detail accurately and fairly reflect the transactions and dispositions of the Company’s assets; (ii) provide reasonable assurance that transactions are recorded as necessary to permit preparation of financial statements in accordance with generally accepted accounting principles, and that receipts and expenditures are being made only in accordance with authorizations of our management and directors; and (iii) provide reasonable assurance regarding prevention or timely detection of unauthorized acquisition, use or disposition of the Company’s assets that could have a material effect on the financial statements.
Because of its inherent limitations, internal control over financial reporting may not prevent or detect misstatements. Also, projections of any evaluation of effectiveness to future periods are subject to the risk that controls may become inadequate because of changes in conditions, or that the degree of compliance with the policies or procedures may deteriorate. Therefore, even those systems determined to be effective can provide only reasonable assurance with respect to financial statement preparation and presentation.
The Company's management assessed the effectiveness of the Company's internal control over financial reporting as of December 31, 2024. In making the assessment, management used the “Internal Control — Integrated Framework” promulgated by the Committee of Sponsoring Organizations of the Treadway Commission.
Based on this assessment management has determined that, as of December 31, 2024, the Company's internal control over financial reporting is effective based on the COSO 2013 framework. Additionally, based upon management's assessment, the Company determined that there were no material weaknesses in its internal control over financial reporting as of December 31, 2024.
The effectiveness of the Company's internal control over financial reporting as of December 31, 2024, has been audited by Crowe LLP, an independent registered public accounting firm, as stated in their report which appears herein.
Report of Independent Registered Public Accounting Firm
Shareholders and the Board of Directors of FB Financial Corporation
Nashville, Tennessee
Opinions on the Financial Statements and Internal Control over Financial Reporting
We have audited the accompanying consolidated balance sheets of FB Financial Corporation (the “Company”) as of December 31, 2024 and 2023, the related consolidated statements of income, comprehensive income (loss), changes in shareholders’ equity, and cash flows for each of the years in the three-year period ended December 31, 2024, and the related notes (collectively referred to as the “financial statements”). We also have audited the Company’s internal control over financial reporting as of December 31, 2024, based on criteria established in Internal Control – Integrated Framework: (2013) issued by the Committee of Sponsoring Organizations of the Treadway Commission (COSO).
In our opinion, the financial statements referred to above present fairly, in all material respects, the financial position of the Company as of December 31, 2024 and 2023, and the results of its operations and its cash flows for each of the years in the three-year period ended December 31, 2024 in conformity with accounting principles generally accepted in the United States of America. Also in our opinion, the Company maintained, in all material respects, effective internal control over financial reporting as of December 31, 2024, based on criteria established in Internal Control – Integrated Framework: (2013) issued by COSO.
Basis for Opinions
The Company’s management is responsible for these financial statements, for maintaining effective internal control over financial reporting, and for its assessment of the effectiveness of internal control over financial reporting, included in the accompanying Report on Management’s Assessment of Internal Control over Financial Reporting. Our responsibility is to express an opinion on the Company’s financial statements and an opinion on the Company’s internal control over financial reporting based on our audits. We are a public accounting firm registered with the Public Company Accounting Oversight Board (United States) ("PCAOB") and are required to be independent with respect to the Company in accordance with the U.S. federal securities laws and the applicable rules and regulations of the Securities and Exchange Commission and the PCAOB.
We conducted our audits in accordance with the standards of the PCAOB. Those standards require that we plan and perform the audits to obtain reasonable assurance about whether the financial statements are free of material misstatement, whether due to error or fraud, and whether effective internal control over financial reporting was maintained in all material respects.
Our audits of the financial statements included performing procedures to assess the risks of material misstatement of the financial statements, whether due to error or fraud, and performing procedures that respond to those risks. Such procedures included examining, on a test basis, evidence regarding the amounts and disclosures in the financial statements. Our audits also included evaluating the accounting principles used and significant estimates made by management, as well as evaluating the overall presentation of the financial statements. Our audit of internal control over financial reporting included obtaining an understanding of internal control over financial reporting, assessing the risk that a material weakness exists, and testing and evaluating the design and operating effectiveness of internal control based on the assessed risk. Our audits also included performing such other procedures as we considered necessary in the circumstances. We believe that our audits provide a reasonable basis for our opinions.
Definition and Limitations of Internal Control Over Financial Reporting
A company’s internal control over financial reporting is a process designed to provide reasonable assurance regarding the reliability of financial reporting and the preparation of financial statements for external purposes in accordance with generally accepted accounting principles. A company’s internal control over financial reporting includes those policies and procedures that (1) pertain to the maintenance of records that, in reasonable detail, accurately and fairly reflect the transactions and dispositions of the assets of the company; (2) provide reasonable assurance that transactions are recorded as necessary to permit preparation of financial statements in accordance with generally accepted accounting principles, and that receipts and expenditures of the company are being made only in accordance with authorizations of management and directors of the company; and (3) provide reasonable assurance regarding prevention or timely detection of unauthorized acquisition, use, or disposition of the company’s assets that could have a material effect on the financial statements.
Because of its inherent limitations, internal control over financial reporting may not prevent or detect misstatements. Also, projections of any evaluation of effectiveness to future periods are subject to the risk that controls may become inadequate because of changes in conditions, or that the degree of compliance with the policies or procedures may deteriorate.
Critical Audit Matter
The critical audit matter communicated below is a matter arising from the current period audit of the financial statements that was communicated or required to be communicated to the audit committee and that: (1) relates to accounts or disclosures that are material to the financial statements and (2) involved our especially challenging, subjective, or complex judgments. The communication of the critical audit matter does not alter in any way our opinion on the financial statements, taken as a whole, and we are not, by communicating the critical audit matter below, providing a separate opinion on the critical audit matter or on the accounts or disclosures to which it relates.
Allowance for Credit Losses on Loans – Reasonable and Supportable Forecasts and Qualitative Adjustments
As described in Note 1 – Basis of presentation and Note 3 – Loans and allowance for credit losses on loans HFI, the Company estimates expected credit losses for its financial assets carried at amortized cost utilizing the current expected credit loss (“CECL”) methodology. The allowance for credit losses (“ACL”) on loans held for investment on December 31, 2024 was $151.9 million. The provision for credit losses on loans held for investment for the year ended December 31, 2024 was $14.7 million.
The Company calculated an expected credit loss using a lifetime loss rate methodology. The Company utilizes probability-weighted forecasts that are developed by a third-party vendor, which consider multiple macroeconomic variables that are applicable to the type of loan. Each of the Company's loss rate models incorporate forward-looking macroeconomic projections throughout the reasonable and supportable forecast period and the subsequent historical reversion at the macroeconomic variable input level. The Company's loss rate models then estimate the lifetime loss rate for pools of loans by combining the calculated loss rate based on each variable within the model (including the macroeconomic variables). The lifetime loss rate for the pool is then multiplied by the loan balances to determine the expected credit losses on the pool. The Company then considers the need to qualitatively adjust its modeled quantitative expected credit loss estimate for information not already captured in the model loss estimation process.
The audit procedures over the determination of forecast scenarios involved a high degree of auditor judgment and required significant audit effort, including the use of more experienced audit personnel and our valuation specialists due to its complexity. Additionally, the audit procedures over the qualitative adjustments utilized in management’s methodology involved challenging and subjective auditor judgment. Therefore, we identified the following as a critical audit matter: a) auditing the forecasted macroeconomic scenario and b) auditing the identification and application of qualitative adjustments to the ACL model.
The primary audit procedures we performed to address this critical audit matter included the following:
•Tested the operating effectiveness of controls specific to:
◦Determining the reasonableness of the forecasted macroeconomic scenario used in the model,
◦The identification and application of qualitative adjustments to the ACL model,
◦The mathematical accuracy of the qualitative adjustments to the ACL model,
◦The relevance and reliability of data used by the Company’s third-party vendor to develop forecast scenarios.
◦The Company’s allowance committee’s oversight and review of the overall ACL.
•Evaluated management’s judgments in the selection and application of the forecasted macroeconomic scenarios.
•Used the work of specialists to assist in evaluating the relevance and reliability of data used by the Company’s third-party vendor to develop forecast scenarios.
•Evaluated management’s judgments in the identification and application of qualitative adjustments to the ACL model.
•Tested the completeness and accuracy of the data used in qualitative adjustments to the ACL model.
/s/ Crowe LLP
We have served as the Company's auditor since 2018.
Franklin, Tennessee
February 25, 2025
FB Financial Corporation and subsidiaries
Consolidated balance sheets
(Amounts are in thousands except share and per share amounts)
| | | | | | | | | | | | | | | | |
| | | | | | |
| | December 31, | | |
| | | 2024 | | | 2023 | | | |
| ASSETS | | | | | | |
| Cash and due from banks | | $ | 120,153 | | | $ | 146,542 | | | |
| Federal funds sold and reverse repurchase agreements | | 125,825 | | | 83,324 | | | |
| Interest-bearing deposits in financial institutions | | 796,510 | | | 581,066 | | | |
| Cash and cash equivalents | | 1,042,488 | | | 810,932 | | | |
| Investments: | | | | | | |
| Available-for-sale debt securities, at fair value | | 1,538,008 | | | 1,471,973 | | | |
| | | | | | |
| Federal Home Loan Bank stock, at cost | | 32,749 | | | 34,190 | | | |
| Loans held for sale (includes $95,403 and $46,618 at fair value, respectively) | | 126,760 | | | 67,847 | | | |
| Loans held for investment | | 9,602,384 | | | 9,408,783 | | | |
| Less: allowance for credit losses on loans HFI | | 151,942 | | | 150,326 | | | |
| Net loans held for investment | | 9,450,442 | | | 9,258,457 | | | |
| Premises and equipment, net | | 148,899 | | | 155,731 | | | |
| Operating lease right-of-use assets | | 47,963 | | | 54,295 | | | |
| Interest receivable | | 49,611 | | | 52,715 | | | |
| Mortgage servicing rights, at fair value | | 162,038 | | | 164,249 | | | |
| Bank-owned life insurance | | 72,504 | | | 76,143 | | | |
| Other real estate owned, net | | 4,409 | | | 3,192 | | | |
| Goodwill | | 242,561 | | | 242,561 | | | |
| Core deposit and other intangibles, net | | 5,762 | | | 8,709 | | | |
| Other assets | | 233,288 | | | 203,409 | | | |
| Total assets | | $ | 13,157,482 | | | $ | 12,604,403 | | | |
| LIABILITIES | | | | | | |
| Deposits | | | | | | |
| Noninterest-bearing | | $ | 2,116,232 | | | $ | 2,218,382 | | | |
| Interest-bearing checking | | 2,906,425 | | | 2,504,421 | | | |
| Money market and savings | | 4,338,483 | | | 4,204,851 | | | |
| Customer time deposits | | 1,380,205 | | | 1,469,811 | | | |
| Brokered and internet time deposits | | 469,089 | | | 150,822 | | | |
| Total deposits | | 11,210,434 | | | 10,548,287 | | | |
| Borrowings | | 176,789 | | | 390,964 | | | |
| Operating lease liabilities | | 60,024 | | | 67,643 | | | |
| Accrued expenses and other liabilities | | 142,604 | | | 142,622 | | | |
| Total liabilities | | 11,589,851 | | | 11,149,516 | | | |
| SHAREHOLDERS’ EQUITY | | | | | | |
Common stock, $1 par value per share; 75,000,000 shares authorized; 46,663,120 and 46,848,934 shares issued and outstanding, respectively | | 46,663 | | | 46,849 | | | |
| Additional paid-in capital | | 860,266 | | | 864,258 | | | |
| Retained earnings | | 762,293 | | | 678,412 | | | |
| Accumulated other comprehensive loss, net | | (101,684) | | | (134,725) | | | |
| Total FB Financial Corporation common shareholders’ equity | | 1,567,538 | | | 1,454,794 | | | |
| Noncontrolling interest | | 93 | | | 93 | | | |
| Total equity | | 1,567,631 | | | 1,454,887 | | | |
| Total liabilities and shareholders’ equity | | $ | 13,157,482 | | | $ | 12,604,403 | | | |
See the accompanying notes to the consolidated financial statements.
FB Financial Corporation and subsidiaries
Consolidated statements of income
(Amounts are in thousands, except per share amounts)
5
| | | | | | | | | | | | | | | | | | | | | | | | |
| | | | | Years Ended December 31, |
| | | | | | | 2024 | | | 2023 | | | 2022 | |
| Interest income: | | | | | | | | | | |
| Interest and fees on loans | | | | | | $ | 626,402 | | | $ | 599,195 | | | $ | 436,363 | |
| Interest on investment securities | | | | | | | | | | |
| Taxable | | | | | | 50,057 | | | 27,257 | | | 25,469 | |
| Tax-exempt | | | | | | 4,749 | | | 7,153 | | | 7,332 | |
| Other | | | | | | 44,330 | | | 44,805 | | | 12,258 | |
| Total interest income | | | | | | 725,538 | | | 678,410 | | | 481,422 | |
| | | | | | | | | | |
| Interest expense: | | | | | | | | | | |
| Deposits | | | | | | 296,345 | | | 258,819 | | | 56,642 | |
| Borrowings | | | | | | 12,690 | | | 12,374 | | | 12,545 | |
| Total interest expense | | | | | | 309,035 | | | 271,193 | | | 69,187 | |
| Net interest income | | | | | | 416,503 | | | 407,217 | | | 412,235 | |
| Provision for credit losses on loans HFI | | | | | | 14,667 | | | 16,738 | | | 10,393 | |
| (Reversal of) provision for credit losses on unfunded commitments | | | | | | (2,663) | | | (14,199) | | | 8,589 | |
| Net interest income after provision for credit losses | | | | | | 404,499 | | | 404,678 | | | 393,253 | |
| | | | | | | | | | |
| Noninterest income: | | | | | | | | | | |
| Mortgage banking income | | | | | | 46,634 | | | 44,692 | | | 73,580 | |
| Investment services and trust income | | | | | | 14,191 | | | 11,320 | | | 8,866 | |
| Service charges on deposit accounts | | | | | | 13,234 | | | 12,154 | | | 12,049 | |
| ATM and interchange fees | | | | | | 11,465 | | | 10,282 | | | 15,600 | |
| Loss from investment securities, net | | | | | | (56,378) | | | (13,973) | | | (376) | |
Loss on sales or write-downs of premises and equipment, other real estate
owned and other assets, net | | | | | | (2,167) | | | (27) | | | (265) | |
| | | | | | | | | | |
| Other income | | | | | | 12,091 | | | 6,095 | | | 5,213 | |
| Total noninterest income | | | | | | 39,070 | | | 70,543 | | | 114,667 | |
| | | | | | | | | | |
| Noninterest expenses: | | | | | | | | | | |
| Salaries, commissions and employee benefits | | | | | | 183,813 | | | 203,441 | | | 211,491 | |
| Occupancy and equipment expense | | | | | | 26,250 | | | 28,148 | | | 23,562 | |
| Data processing | | | | | | 9,642 | | | 9,230 | | | 9,315 | |
| Legal and professional fees | | | | | | 7,679 | | | 8,890 | | | 15,028 | |
| Advertising | | | | | | 7,007 | | | 8,267 | | | 11,208 | |
| | | | | | | | | | |
| Amortization of core deposit and other intangibles | | | | | | 2,947 | | | 3,659 | | | 4,585 | |
| | | | | | | | | | |
| | | | | | | | | | |
| | | | | | | | | | |
| | | | | | | | | | |
| | | | | | | | | | |
| Mortgage restructuring expense | | | | | | — | | | — | | | 12,458 | |
| Other expense | | | | | | 59,561 | | | 63,294 | | | 60,699 | |
| Total noninterest expense | | | | | | 296,899 | | | 324,929 | | | 348,346 | |
| Income before income taxes | | | | | | 146,670 | | | 150,292 | | | 159,574 | |
| Income tax expense | | | | | | 30,619 | | | 30,052 | | | 35,003 | |
Net income applicable to FB Financial Corporation and noncontrolling
interest | | | | | | 116,051 | | | 120,240 | | | 124,571 | |
| Net income applicable to noncontrolling interest | | | | | | 16 | | | 16 | | | 16 | |
| Net income applicable to FB Financial Corporation | | | | | | $ | 116,035 | | | $ | 120,224 | | | $ | 124,555 | |
| | | | | | | | | | |
| Earnings per common share: | | | | | | | | | | |
| Basic | | | | | | $ | 2.48 | | | $ | 2.57 | | | $ | 2.64 | |
| Diluted | | | | | | 2.48 | | | 2.57 | | | 2.64 | |
See the accompanying notes to the consolidated financial statements.
FB Financial Corporation and subsidiaries
Consolidated statements of comprehensive income (loss)
(Amounts are in thousands)
| | | | | | | | | | | | | | | | | | | | | | | | |
| | | | | Years Ended December 31, |
| | | | | | | 2024 | | | 2023 | | | 2022 | |
| Net income | | | | | | $ | 116,051 | | | $ | 120,240 | | | $ | 124,571 | |
| Other comprehensive income (loss), net of tax: | | | | | | | | | | |
Net unrealized (loss) gain in available-for-sale securities, net of tax (benefit) expense of $(2,744), $8,706 and $(62,316) | | | | | | (8,217) | | | 24,802 | | | (176,798) | |
Reclassification adjustment for loss (gain) on sale of securities included in net income, net of tax benefit of $14,692, $3,668 and $— | | | | | | 41,686 | | | 10,406 | | | (1) | |
Net unrealized (loss) gain in hedging activities, net of tax (benefit) expense of $(151), $(176), and $532 | | | | | | (428) | | | (500) | | | 1,508 | |
| | | | | | | | | | |
| Total other comprehensive income (loss), net of tax | | | | | | 33,041 | | | 34,708 | | | (175,291) | |
Comprehensive income (loss) applicable to FB Financial Corporation
and noncontrolling interest | | | | | | 149,092 | | | 154,948 | | | (50,720) | |
| Comprehensive income applicable to noncontrolling interest | | | | | | 16 | | | 16 | | | 16 | |
| Comprehensive income (loss) applicable to FB Financial Corporation | | | | | | $ | 149,076 | | | $ | 154,932 | | | $ | (50,736) | |
See the accompanying notes to the consolidated financial statements.
FB Financial Corporation and subsidiaries
Consolidated statements of changes in shareholders’ equity
(Amounts are in thousands except per share amounts)
| | | | | | | | | | | | | | | | | | | | | | | | | | | | | | | | | | | | | | | | | | | | |
| | Common
stock | | Additional
paid-in
capital | | Retained
earnings | | Accumulated
other
comprehensive income
(loss), net | | Total common
shareholders’ equity | | Noncontrolling interest | | Total shareholders’ equity |
| Balance at December 31, 2021 | | $ | 47,549 | | | $ | 892,529 | | | $ | 486,666 | | | $ | 5,858 | | | $ | 1,432,602 | | | $ | 93 | | | $ | 1,432,695 | |
Net income attributable to FB Financial
Corporation and noncontrolling
interest | | — | | | — | | | 124,555 | | | — | | | 124,555 | | | 16 | | | 124,571 | |
Other comprehensive loss, net of
taxes | | — | | | — | | | — | | | (175,291) | | | (175,291) | | | — | | | (175,291) | |
| Repurchase of common stock | | (997) | | | (38,982) | | | — | | | — | | | (39,979) | | | — | | | (39,979) | |
| Stock based compensation expense | | 3 | | | 9,854 | | | — | | | — | | | 9,857 | | | — | | | 9,857 | |
Restricted stock units vested and
distributed, net of shares withheld | | 156 | | | (2,998) | | | — | | | — | | | (2,842) | | | — | | | (2,842) | |
Shares issued under employee stock
purchase program | | 27 | | | 1,185 | | | — | | | — | | | 1,212 | | | — | | | 1,212 | |
| Dividends declared ($0.52 per share) | | — | | | — | | | (24,689) | | | — | | | (24,689) | | | — | | | (24,689) | |
| Noncontrolling interest distribution | | — | | | — | | | — | | | — | | | — | | | (16) | | | (16) | |
| Balance at December 31, 2022 | | $ | 46,738 | | | $ | 861,588 | | | $ | 586,532 | | | $ | (169,433) | | | $ | 1,325,425 | | | $ | 93 | | | $ | 1,325,518 | |
Net income attributable to FB Financial
Corporation and noncontrolling interest | | — | | | — | | | 120,224 | | | — | | | 120,224 | | | 16 | | | 120,240 | |
Other comprehensive income, net of
taxes | | — | | | — | | | — | | | 34,708 | | | 34,708 | | | — | | | 34,708 | |
| Repurchase of common stock | | (136) | | | (4,808) | | | — | | | — | | | (4,944) | | | — | | | (4,944) | |
| Stock based compensation expense | | 9 | | | 10,372 | | | — | | | — | | | 10,381 | | | — | | | 10,381 | |
Restricted stock units vested, net of
taxes | | 149 | | | (2,213) | | | — | | | — | | | (2,064) | | | — | | | (2,064) | |
Performance-based restricted stock
units vested, net of taxes | | 68 | | | (1,383) | | | — | | | — | | | (1,315) | | | — | | | (1,315) | |
Shares issued under employee stock
purchase program | | 21 | | | 702 | | | — | | | — | | | 723 | | | — | | | 723 | |
| Dividends declared ($0.60 per share) | | — | | | — | | | (28,344) | | | — | | | (28,344) | | | — | | | (28,344) | |
| Noncontrolling interest distribution | | — | | | — | | | — | | | — | | | — | | | (16) | | | (16) | |
| Balance at December 31, 2023 | | $ | 46,849 | | | $ | 864,258 | | | $ | 678,412 | | | $ | (134,725) | | | $ | 1,454,794 | | | $ | 93 | | | $ | 1,454,887 | |
| | | | | | | | | | | | | | |
| | | | | | | | | | | | | | |
Net income attributable to FB Financial
Corporation and noncontrolling interest | | — | | | — | | | 116,035 | | | — | | | 116,035 | | | 16 | | | 116,051 | |
Other comprehensive income, net of
taxes | | — | | | — | | | — | | | 33,041 | | | 33,041 | | | — | | | 33,041 | |
| Repurchase of common stock | | (353) | | | (12,346) | | | — | | | — | | | (12,699) | | | — | | | (12,699) | |
| Stock based compensation expense | | 6 | | | 9,479 | | | — | | | — | | | 9,485 | | | — | | | 9,485 | |
Restricted stock units vested, net of
taxes | | 110 | | | (1,612) | | | — | | | — | | | (1,502) | | | — | | | (1,502) | |
Performance-based restricted stock
units vested, net of taxes | | 30 | | | (374) | | | — | | | — | | | (344) | | | — | | | (344) | |
Shares issued under employee stock
purchase program | | 21 | | | 861 | | | — | | | — | | | 882 | | | — | | | 882 | |
| Dividends declared ($0.68 per share) | | — | | | — | | | (32,154) | | | — | | | (32,154) | | | — | | | (32,154) | |
| Noncontrolling interest distribution | | — | | | — | | | — | | | — | | | — | | | (16) | | | (16) | |
| Balance at December 31, 2024 | | $ | 46,663 | | | $ | 860,266 | | | $ | 762,293 | | | $ | (101,684) | | | $ | 1,567,538 | | | $ | 93 | | | $ | 1,567,631 | |
See the accompanying notes to the consolidated financial statements.
FB Financial Corporation and subsidiaries
Consolidated statements of cash flows
(Amounts are in thousands)
| | | | | | | | | | | | | | | | | | | | |
| | Years Ended December 31, |
| | 2024 | | | 2023 | | | 2022 | |
| Cash flows from operating activities: | | | | | | |
| Net income applicable to FB Financial Corporation and noncontrolling interest | | $ | 116,051 | | | $ | 120,240 | | | $ | 124,571 | |
| Adjustments to reconcile net income to net cash provided by operating activities: | | | | | | |
| Depreciation and amortization of fixed assets and software | | 11,966 | | | 11,180 | | | 8,017 | |
| Amortization of core deposit and other intangibles | | 2,947 | | | 3,659 | | | 4,585 | |
| Amortization of issuance costs on subordinated debt | | 386 | | | 387 | | | 387 | |
| Capitalization of mortgage servicing rights | | (4,984) | | | (7,192) | | | (20,809) | |
| Net change in fair value of mortgage servicing rights | | 7,195 | | | 11,308 | | | (32,044) | |
| Stock-based compensation expense | | 9,485 | | | 10,381 | | | 9,857 | |
| Provision for credit losses on loans HFI | | 14,667 | | | 16,738 | | | 10,393 | |
| (Reversal of) provision for credit losses on unfunded commitments | | (2,663) | | | (14,199) | | | 8,589 | |
| Provision for (reversal of) mortgage loan repurchases | | 235 | | | (650) | | | (2,989) | |
| (Accretion) amortization of discounts and premiums on acquired loans, net | | (657) | | | (694) | | | 1,020 | |
| Amortization of premiums and discounts on securities, net | | 2,180 | | | 6,106 | | | 6,589 | |
| Loss from investment securities, net | | 56,378 | | | 13,973 | | | 376 | |
| Originations of loans held for sale | | (1,222,606) | | | (1,199,362) | | | (2,403,476) | |
| Repurchases of loans held for sale | | — | | | — | | | (194) | |
| Proceeds from sale of loans held for sale | | 1,206,725 | | | 1,276,596 | | | 3,067,204 | |
| Gain on sale and change in fair value of loans held for sale | | (33,700) | | | (28,541) | | | (47,783) | |
| | | | | | |
Net loss on write-downs of premises and equipment, other real estate
owned and other assets | | 2,167 | | | 27 | | | 265 | |
| | | | | | |
| | | | | | |
| (Reversal of) provision for deferred income taxes | | (1,763) | | | (1,415) | | | 12,552 | |
| Earnings on bank-owned life insurance | | (3,753) | | | (1,871) | | | (1,452) | |
| Changes in: | | | | | | |
| Operating lease assets and liabilities, net | | (1,287) | | | 3,637 | | | 5,030 | |
| Other assets and interest receivable | | (27,679) | | | 6,564 | | | (7,222) | |
| Accrued expenses and other liabilities | | 7,510 | | | (15,800) | | | 56,247 | |
| Net cash provided by operating activities | | 138,800 | | | 211,072 | | | 799,713 | |
| Cash flows from investing activities: | | | | | | |
| Activity in available-for-sale securities: | | | | | | |
| Sales | | 526,441 | | | 100,463 | | | 1,218 | |
| Maturities, prepayments and calls | | 299,814 | | | 128,206 | | | 204,748 | |
| Purchases | | (905,431) | | | (202,054) | | | (242,889) | |
| Proceeds from sales of equity securities | | — | | | 3,091 | | | — | |
| Net change in loans | | (211,941) | | | (97,302) | | | (1,675,976) | |
| | | | | | |
| Net sales (purchases) of FHLB stock | | 1,441 | | | 24,451 | | | (26,424) | |
| | | | | | |
| Purchases of premises and equipment | | (6,546) | | | (20,229) | | | (10,629) | |
| Proceeds from the sale of premises and equipment | | 1,009 | | | 123 | | | 875 | |
| Proceeds from the sale of other real estate owned | | 2,323 | | | 6,083 | | | 4,959 | |
| Purchase of equity method securities | | (10,000) | | | — | | | — | |
| Purchase of equity securities without a readily determinable market value | | — | | | — | | | (10,000) | |
| Proceeds from the sale of other assets | | 1,494 | | | 1,717 | | | — | |
| Proceeds from bank-owned life insurance | | 7,392 | | | 236 | | | — | |
| Net cash used in investing activities | | (294,004) | | | (55,215) | | | (1,754,118) | |
| Cash flows from financing activities: | | | | | | |
| Net increase (decrease) in deposits | | 657,650 | | | (312,897) | | | 28,784 | |
Net (decrease) increase in securities sold under agreements to repurchase and
federal funds purchased | | (95,265) | | | 21,819 | | | 46,229 | |
| | | | | | |
| Repayment of Bank Term Funding Program borrowings | | (130,000) | | | — | | | — | |
| Net decrease (increase) in short-term FHLB advances | | — | | | (45,000) | | | 175,000 | |
| | | | | | |
| | | | | | |
| | | | | | |
| | | | | | |
| | | | | | |
| Stock-based compensation withholding payments | | (1,846) | | | (3,379) | | | (2,842) | |
| Net proceeds from sale of common stock under employee stock purchase program | | 882 | | | 723 | | | 1,212 | |
| Repurchase of common stock | | (12,699) | | | (4,944) | | | (39,979) | |
| Dividends paid on common stock | | (31,780) | | | (28,057) | | | (24,503) | |
| Dividend equivalent payments made upon vesting of equity compensation | | (166) | | | (226) | | | (168) | |
| Noncontrolling interest distribution | | (16) | | | (16) | | | (16) | |
| Net cash provided by (used in) financing activities | | 386,760 | | | (371,977) | | | 183,717 | |
| Net change in cash and cash equivalents | | 231,556 | | | (216,120) | | | (770,688) | |
| Cash and cash equivalents at beginning of the period | | 810,932 | | | 1,027,052 | | | 1,797,740 | |
| Cash and cash equivalents at end of the period | | $ | 1,042,488 | | | $ | 810,932 | | | $ | 1,027,052 | |
| | | | | | |
FB Financial Corporation and subsidiaries
Consolidated statements of cash flows (continued)
(Amounts are in thousands)
| | | | | | | | | | | | | | | | | | | | |
| | Years Ended December 31, |
| | 2024 | | | 2023 | | | 2022 | |
| Supplemental cash flow information: | | | | | | |
| Interest paid | | $ | 303,662 | | | $ | 261,032 | | | $ | 63,701 | |
| Taxes paid, net | | 43,195 | | | 37,937 | | | 906 | |
| Supplemental noncash disclosures: | | | | | | |
| Transfers from loans to other real estate owned | | $ | 3,458 | | | $ | 2,736 | | | $ | 1,437 | |
| Transfers from loans to other assets | | 4,362 | | | 2,925 | | | — | |
| Transfers from other real estate owned to other assets | | — | | | 75 | | | — | |
| | | | | | |
| Transfers from other real estate owned to premises and equipment | | — | | | — | | | 351 | |
| | | | | | |
| | | | | | |
| Transfers from loans to loans held for sale | | 1,054 | | | 13,720 | | | 46,364 | |
| Transfers from loans held for sale to loans | | 1,850 | | | 3,273 | | | 24,479 | |
| Loans provided for sales of other assets | | 1,078 | | | 911 | | | — | |
Increase (decrease) in rebooked GNMA loans under optional repurchase
program | | 10,128 | | | (4,982) | | | 26,211 | |
| | | | | | |
| | | | | | |
| | | | | | |
| | | | | | |
| | | | | | |
| | | | | | |
| Dividends declared not paid on restricted stock units and performance stock units | | 374 | | | 287 | | | 222 | |
| | | | | | |
| | | | | | |
| Right-of-use assets obtained in exchange for operating lease liabilities | | 5,973 | | | 7,300 | | | 25,399 | |
| | | | | | |
See the accompanying notes to the consolidated financial statements.
FB Financial Corporation and subsidiaries
Notes to consolidated financial statements
(Dollar amounts are in thousands, except share and per share amounts)
Note (1)—Basis of presentation and summary of significant accounting policies
(A) Organization and Company overview
FB Financial Corporation (the “Company”) is a financial holding company headquartered in Nashville, Tennessee.
FirstBank (the “Bank”), a direct subsidiary of the Company, headquartered in Nashville, provides a comprehensive suite of commercial and consumer banking services to clients in select markets. These services are offered through the Bank’s 77 full-service branches throughout Tennessee, Kentucky, Alabama and North Georgia, as well as other limited servicing banking, ATM and mortgage loan production locations serving metropolitan and community markets across its footprint.
(B) Basis of presentation and use of estimates
The accompanying consolidated financial statements include the Company and its wholly-owned subsidiaries, namely the Bank. All significant intercompany accounts and transactions have been eliminated in consolidation.
The accounting policies followed by the Company and its subsidiaries and the methods of applying these principles conform with accounting principles generally accepted in the United States of America and general banking industry. In preparing the consolidated financial statements, management is required to make estimates and assumptions that affect the reported amounts of assets and liabilities at the date of the consolidated financial statements and the reported amounts of revenue and expenses during the reporting period, the most significant of which relate to the allowance for credit losses and mortgage servicing rights.
Certain policies that significantly affect the determination of financial position, results of operations and cash flows are summarized below. Additionally, certain prior period amounts have been reclassified to conform to the current period presentation. These reclassifications did not materially impact the Company's consolidated financial statements.
(C) Cash and cash equivalents
The Company considers all highly liquid unrestricted investments with a maturity of three months or less when purchased to be cash equivalents. This includes cash, federal funds sold, reverse repurchase agreements and interest-bearing deposits in other financial institutions.
The Bank maintains its cash in bank deposit accounts, which, at times, may exceed federally insured limits. The Bank has not experienced any losses in such correspondent accounts and believes it is not exposed to any significant credit risk from cash and cash equivalents.
(D) Investment securities
Available-for-sale debt securities, at fair value
Debt securities that might be sold before maturity are classified as available-for-sale. Available-for-sale debt securities are carried at fair value, with unrealized holding gains and losses reported in other comprehensive income, net of applicable taxes, unless such unrealized gain or loss results from expected credit losses. Unrealized losses resulting from credit losses for available-for-sale debt securities are recognized in earnings as a provision for credit losses.
Accrued interest receivable for available-for-sale securities is separated from other components of amortized cost and presented separately on the consolidated balance sheets. The amortization and accretion of purchase premiums or discounts is recognized as interest income on the level-yield method anticipating prepayments based upon the prior three month average monthly prepayments when available.
The Company evaluates available-for-sale securities for expected credit losses. For securities in an unrealized loss position, consideration is given to the extent to which the fair value has been less than cost, the financial condition and near-term prospects of the issuer and the intent and ability of the Company to retain its investment in the issuer for a period of time sufficient to allow for any anticipated recovery in fair value. In analyzing an issuer’s financial condition, the Company considers whether the securities are issued by the federal government or its agencies, whether downgrades by bond rating agencies have occurred, and the results of reviews of the issuer’s financial condition.
If the Company does not intend to sell the security and it is not more likely than not to be required to sell the security before recovery of its amortized cost basis, the difference between the amortized cost and the fair value is separated into estimated credit losses and all other factors. Estimated credit losses are recorded as an allowance for credit losses and
FB Financial Corporation and subsidiaries
Notes to consolidated financial statements
(Dollar amounts are in thousands, except share and per share amounts)
recognized in earnings as a provision for credit losses. Amounts related to other, non-credit related factors are recognized in other comprehensive income, net of applicable taxes.
The Company did not record any provision for credit losses for its available-for-sale debt securities during the years ended December 31, 2024 and 2023, as declines in fair value below amortized cost were determined to be non-credit related.
Sales of available-for-sale securities are evaluated based on factors such as changes in interest rates, liquidity needs, asset and liability management strategies and other factors. If the Company intends to sell the security or it is more likely than not that the Company will be required to sell the security before recovery of its amortized cost basis, the expected credit loss recognized in earnings is equal to the difference between its amortized cost basis and its fair value at the date it was determined to be impaired due to credit losses or other factors. The sale and purchase of investment securities are recognized on a trade date basis with gains and losses on sales being determined using the specific identification method.
Held-to-maturity securities
Debt securities are classified as held-to-maturity and carried at amortized cost, excluding accrued interest, when management has the positive intent and ability to hold them to maturity. At December 31, 2024 and 2023, the Company did not own any securities classified as held-to-maturity.
Trading account securities
Trading account securities are held for the purpose of buying and selling securities at a profit. Trading account securities are carried at fair value on the balance sheet, with any periodic changes in fair value recorded through income. At December 31, 2024 and 2023, the Company did not own any securities classified as trading.
Equity securities
Equity securities with a readily determinable market value are carried at fair value on the balance sheet with any unrealized gains or losses recorded through income. Equity securities without a readily determinable fair value are carried at cost less impairment. Equity securities where the company has the ability to exercise significant influence over an investee’s operations and financial policies are accounted for under the equity method of accounting. Equity securities that qualify as equity method investments are initially recorded at cost and adjusted to reflect the Company’s proportionate share of profit or loss of the investee through income. We review equity method investments for impairment if there are events or changes in circumstances which indicate the carrying amount might not be recoverable. Equity securities, including those with and without a readily determinable market value and equity method securities are included in other assets on the consolidated balance sheets.
Federal Home Loan Bank stock, at cost
The Company accounts for its investments in FHLB stock in accordance with ASC 942-325 “Financial Services-Depository and Lending-Investments-Other.” FHLB stock does not have a readily determinable fair value because its ownership is restricted and lacks a market as all transactions are executed at par value with the FHLB as the sole purchaser. FHLB stock is carried at cost and evaluated for impairment based upon management’s assessment of the recoverability of the par value. Ownership of FHLB stock is required to participate in the FHLB system and varies based upon the amount of FHLB advances.
(E) Loans held for sale
Mortgage loans held for sale
Mortgage loans originated and intended for sale in the secondary market are carried at fair value under the fair value option as permitted under the guidance in ASC 825, “Financial Instruments,” until sold. Electing to measure these assets at fair value reduces certain timing differences and more accurately matches the changes in fair value of the loans with changes in the fair value of derivative instruments used to economically hedge them. The change in fair value of both loans held for sale and the related derivative instruments are recorded in mortgage banking income in the consolidated statements of income. Gains and losses on sale are recognized at the time the loan is closed. Pass through origination costs and related loan fees are also included in mortgage banking income.
A portion of loans sold by the Company are sold to GNMA with the Company retaining the servicing rights after the sale. GNMA optional repurchase programs allow financial institutions to repurchase individual delinquent mortgage loans that meet certain criteria from the securitized loan pool from which the institution provides servicing. At the servicer’s option and without GNMA’s prior authorization, the servicer may repurchase such a delinquent loan for an amount equal to 100%
FB Financial Corporation and subsidiaries
Notes to consolidated financial statements
(Dollar amounts are in thousands, except share and per share amounts)
of the remaining principal balance of the loan. Under ASC 860, “Transfers and Servicing,” this buy-back option is considered a conditional option until the delinquency criteria are met, at which time the option becomes unconditional. When the Company is deemed to have effective control over these loans under the unconditional buy-back option, the loan can no longer be reported as sold and must be brought onto the balance sheet as loans held for sale, regardless of whether the Company intends to exercise the buy-back option. These loans are reported at the current unpaid principal balance as loans held for sale with an offsetting liability reported in borrowings on the Company’s consolidated balance sheets and are considered nonperforming assets due to their delinquent status.
Commercial loan held for sale
Historically, the Company held and managed a designated portfolio of commercial loans, including shared national credits and institution healthcare loans, originally acquired through past acquisitions. During the year ended December 31, 2023, the Company exited the final commercial relationship designated as held for sale. Prior to this exit, the Company accounted for these designated relationships as held for sale.
(F) Loans held for investment (excluding purchased credit deteriorated loans)
Loans that management has the intent and ability to hold for the foreseeable future or until maturity or payoff are stated at amortized cost. Amortized cost, or recorded investment, represents the principal amount outstanding, net of any remaining purchase accounting adjustments, including discounts or premiums, as well as any deferred loan fees and direct costs on originated loans. Interest income on loans is recognized using the simple interest method on daily principal balances outstanding, including the accretion or amortization of purchase accounting adjustments, deferred loan fees and other direct costs.
Loans may be designated as nonaccrual if past due 90 days or more or if management determines based on economic conditions and the borrower’s financial condition that collection of principal or interest is doubtful, unless the credit is well secured and in the process of collection. When a loan is placed on nonaccrual status, the accrued but unpaid interest is charged against current period operations. Thereafter, interest on nonaccrual loans is recognized only as received if future collection of principal is probable. If the collectability of outstanding principal is doubtful, interest received is applied as a reduction of principal. A loan may be restored to accrual status when principal and interest are no longer past due or it otherwise becomes both well secured and collectability is reasonably assured.
(G) Allowance for credit losses
The allowance for credit losses represents the portion of the loan’s amortized cost basis that the Company does not expect to collect due to credit losses over the loan’s life, considering past events, current conditions, and reasonable and supportable forecasts of future economic conditions. Loan losses are charged against the allowance when management believes the uncollectibility of a loan balance is confirmed. Subsequent recoveries, if any, are credited to the allowance. The allowance for credit losses is based on the loan's amortized cost basis, excluding accrued interest receivable, as the Company promptly charges off uncollectible accrued interest receivable. Management’s determination of the appropriateness of the allowance is based on periodic evaluation of the loan portfolio, lending-related commitments and other relevant factors, including macroeconomic forecasts and historical loss rates. In the future, the Company may update information and forecasts that may cause significant changes in the estimate in those future quarters.
The Company calculates its expected credit loss using a lifetime loss rate methodology. The Company utilizes probability-weighted forecasts, which consider multiple macroeconomic variables from Moody’s that are applicable to each type of loan. Each of the Company’s loss rate models incorporate forward-looking macroeconomic projections throughout the reasonable and supportable forecast period and the subsequent historical reversion at the macroeconomic variable input level. In order to estimate the life of a loan, the contractual term of the loan is adjusted for estimated prepayments based on market information and the Company’s prepayment history.
For loss estimation purposes, the Company disaggregates the loan portfolio into three loan pools: 1) Commercial and industrial; 2) Retail; 3) Commercial real estate. These loan pools are further disaggregated into loan segments for application of qualitative inputs for loss estimation purposes. These loan segments include:
Commercial and industrial loans. Commercial and industrial loans are typically made to small and medium-sized manufacturing, wholesale, retail and service businesses, and farmers for working capital and operating needs and business expansions. This category also includes loans secured by manufactured housing receivables made primarily to manufactured housing communities. Commercial and industrial loans generally include lines of credit and loans with maturities of five years or less. Commercial and industrial loans are generally made with operating cash flows as the
FB Financial Corporation and subsidiaries
Notes to consolidated financial statements
(Dollar amounts are in thousands, except share and per share amounts)
primary source of repayment, but may also include collateralization by inventory, accounts receivable, equipment and personal guarantees.
Construction loans. Construction loans include commercial construction, land acquisition and land development loans and single-family interim construction loans to small and medium-sized businesses and individuals. These loans are generally secured by the land or the real property being built and are made based on the Company’s assessment of the value of the property on an as-completed basis and repayment depends upon project completion and sale, refinancing, or operation of the real estate.
1-4 family mortgage loans. The Company’s residential real estate 1-4 family mortgage loans are primarily made with respect to and secured by single family homes, including manufactured homes with real estate, which are both owner-occupied and investor owned. Repayment depends primarily upon the cash flow of the borrower as well as the value of the real estate collateral.
Residential line of credit loans. The Company’s residential line of credit loans are primarily revolving, open-end lines of credit secured by 1-4 residential properties. Repayment depends primarily upon the cash flow of the borrower as well as the value of the real estate collateral.
Multi-family residential loans. The Company’s multi-family residential loans are primarily secured by multi-family properties, such as apartments and condominium buildings. Repayment depends primarily upon the cash flow of the borrower as well as the value of the real estate collateral.
Commercial real estate owner-occupied loans. The Company’s commercial real estate owner-occupied loans include loans to finance commercial real estate owner occupied properties for various purposes including use as offices, warehouses, production facilities, health care facilities, retail centers, restaurants, churches and agricultural based facilities. Commercial real estate owner-occupied loans are typically repaid through the ongoing business operations of the borrower.
Commercial real estate non-owner occupied loans. The Company’s commercial real estate non-owner occupied loans include loans to finance commercial real estate investment properties for various purposes including use as offices, warehouses, health care facilities, hotels, mixed-use residential/commercial, manufactured housing communities, retail centers, multifamily properties, assisted living facilities and agricultural based facilities. Commercial real estate non-owner occupied loans are typically repaid with the funds received from the sale or refinancing of the property or rental income from such property.
Consumer and other loans. The Company’s consumer and other loans include loans to individuals for personal, family and household purposes, including car, boat and other recreational vehicle loans, manufactured homes (without real estate) and personal lines of credit. Consumer loans are generally secured by vehicles and other household goods, with repayment depending primarily on the cash flow of the borrower. Other loans also include loans to states and political subdivisions in the U.S. and are repaid through tax revenues or refinancing.
The Company’s loss rate models estimate the lifetime loss rate for the pools of loan segments by combining the calculated loss rate based on each variable within the model, including the macroeconomic variables. The lifetime loss rate for the pool is then multiplied by the loan balances to determine the expected credit losses on the pool.
The quantitative models require loan data and macroeconomic variables based on the inherent credit risks in each portfolio to more accurately measure the credit risks associated with each. The quantitative models pool loans with similar risk characteristics and collectively assesses the lifetime loss rate for each pool to estimate its expected credit loss.
The Company considers the need to qualitatively adjust its modeled quantitative expected credit loss estimate for information not otherwise captured in the model loss estimation process. These qualitative factor adjustments may increase or decrease the Company’s estimate of expected credit losses. The Company considers the qualitative factors that are relevant to the institution as of the reporting date, which may include, but are not limited to: levels of and trends in delinquencies and performance of loans; levels of and trends in write-offs and recoveries collected; trends in volume and terms of loans; effects of any changes in reasonable and supportable economic forecasts; effects of any changes in risk selection and underwriting standards; other changes in lending policies, procedures, and practices; experience, ability, and depth of lending management and expertise; available relevant information sources that contradict the Company’s own forecast; effects of changes in prepayment expectations or other factors affecting assessments of loan contractual terms; industry conditions; and effects of changes in credit concentrations.
FB Financial Corporation and subsidiaries
Notes to consolidated financial statements
(Dollar amounts are in thousands, except share and per share amounts)
A loan may require an individual evaluation when it is placed on nonaccrual status or no longer exhibits similar risk characteristics. These risk characteristics may include payment performance, internal or external credit scores, collateral type, effective interest rate or term among others. A loan is deemed collateral-dependent when the borrower is experiencing financial difficulty and the repayment is expected to be primarily through sale or operation of the collateral. The allowance for credit losses for collateral-dependent loans as well as loans where foreclosure is probable is calculated as the amount for which the loan’s amortized cost basis exceeds fair value of the underlying collateral. Fair value is determined based on appraisals performed by qualified appraisers and reviewed by qualified personnel. In cases where repayment is to be provided substantially through the sale of collateral, the Company reduces the fair value by the estimated costs to sell.
The Company evaluates all loan modifications according to the accounting guidance for loan refinancing and modifications to determine whether the modification should be accounted for as a new loan or a continuation of the existing loan. The Company derecognizes the existing loan and accounts for the modified loan as a new loan if the effective yield on the modified loan is at least equal to the effective yield for comparable loans with similar collection risks and the modifications to the original loan are more than minor. If a loan modification does not meet these conditions, it extends the existing loan’s amortized cost basis and accounts for the modified loan as a continuation of the existing loan. Substantially all of its loan modifications involving borrowers experiencing financial difficulty are accounted for as a continuation of the existing loan.
See Note 3, “Loans and allowance for credit losses” for additional details related to the Company's allowance for credit losses.
(H) Business combinations and accounting for purchase credit deteriorated loans
Business combinations are accounted for by applying the acquisition method in accordance with ASC 805, “Business Combinations.” Under the acquisition method, identifiable assets acquired and liabilities assumed and any non-controlling interest in the acquiree at the acquisition date are measured at their fair values as of that date. Any excess of the purchase price over fair value of net assets acquired is recorded as goodwill. To the extent the fair value of net assets acquired, including any other identifiable intangible assets, exceeds the purchase price, a bargain purchase gain is recognized. Results of operations of acquired entities are included in the consolidated statements of income from the date of acquisition.
Loans acquired in business combinations with evidence of more-than-insignificant credit deterioration since origination are considered to be PCD. The Company developed multiple criteria to assess the presence of more–than–insignificant credit deterioration in acquired loans, mainly focused on changes in credit quality and payment status. While general criteria have been established, each acquisition will vary in its specific facts and circumstances and the Company will apply judgment around PCD identification for each individual acquisition based on their unique portfolio mix and risks identified.
(I) Off-balance sheet financial instruments
Financial instruments include off-balance sheet credit instruments, such as commitments to make loans and commercial letters of credit, issued to meet customer financing needs. The face amount for these items represents the exposure to loss, before considering customer collateral or ability to repay. Such financial instruments are recorded when they are funded, unless considered derivatives.
For loan commitments that are not accounted for as derivatives and when the obligation is not unconditionally cancellable by the Company, the Company applies the CECL methodology to estimate the expected credit loss for off-balance sheet commitments. The estimate of expected credit losses for off-balance sheet credit commitments is recognized as a liability. When the loan is funded, an allowance for expected credit losses is estimated for that loan using the CECL methodology, and the liability for off-balance sheet commitments is reduced. When applying the CECL methodology to estimate the expected credit loss, the Company considers the likelihood that funding will occur, the contractual period of exposure to credit loss, the risk of loss, historical loss experience, and current conditions along with expectations of future economic conditions.
(J) Premises and equipment and other long-lived assets
Land is carried at cost. Premises and equipment are stated at cost less accumulated depreciation. Provisions for depreciation are computed principally on the straight-line method and are charged to occupancy expense over the estimated useful lives of the assets. Maintenance agreements are amortized to expense over the period of time covered
FB Financial Corporation and subsidiaries
Notes to consolidated financial statements
(Dollar amounts are in thousands, except share and per share amounts)
by the agreement. Costs of major additions, replacements or improvements are capitalized while expenditures for maintenance and repairs are charged to expense as incurred.
For financial statement purposes, the estimated useful life for premises is the lesser of the remaining useful life per third- party appraisal or forty years, for furniture, fixtures and equipment the estimated useful life is three to ten years, and for leasehold improvements the estimated useful life is the remaining term of the lease.
Premises and equipment and other long-lived assets are reviewed for impairment when events indicate their carrying amount may not be recoverable from future undiscounted cash flows. If impaired, the assets are recorded at fair value. At December 31, 2024, the Company had an impairment charge of $2,349 on two facilities which will be decommissioned recorded in gain (loss) on sales or write-downs of premises and equipment, other real estate owned and other assets on the consolidated statements of income. There was no such impairment at December 31, 2023 or 2022.
(K) Other real estate owned
Real estate acquired through, or in lieu of, loan foreclosure is initially recorded at fair value less the estimated cost to sell at the date of foreclosure, which may establish a new cost basis. Other real estate owned may also include excess facilities and properties held for sale as described in Note 5, “Other real estate owned.” Physical possession of residential real estate property collateralizing a consumer mortgage loan occurs when legal title is obtained upon completion of foreclosure or when the borrower conveys all interest in the property to satisfy the loan. After initial measurement, valuations are periodically performed by management and the asset is carried at the lower of carrying amount or fair value less costs to sell. Revenue and expenses from operations are included in other noninterest income and noninterest expenses. Losses due to the valuation of the property are included in gain (loss) on sales or write-downs of premises and equipment, other real estate owned and other assets on the consolidated statements of income.
(L) Leases
The Company leases certain banking, mortgage and operations locations. The Company records leases on the balance sheet in the form of a lease liability for the present value of future minimum payments under the lease terms and a right-of-use asset equal to the lease liability adjusted for items such as deferred or prepaid rent, incentive liabilities, leasehold intangibles and any impairment of the right-of-use asset. In determining whether a contract contains a lease, management conducts an analysis at lease inception to ensure an asset was specifically identified and the Company has control of use of the asset. The Company considers a lease to be a finance lease if future minimum lease payments amount to greater than 90% of the asset's fair value or if the lease term is equal to or greater than 75% of the asset's estimated economic useful life. The Company does not record leases on the consolidated balance sheets that are classified as short term (less than one year). Additionally, the Company has not recorded equipment leases on the consolidated balance sheets as these are not material to the Company.
At lease inception, the Company determines the lease term by adding together the minimum lease term and all optional renewal periods that it is reasonably certain to renew. This determination is at management's full discretion and is made through consideration of the asset, market conditions, competition and entity based economic conditions, among other factors. The lease term is used in the economic life test and also to calculate straight-line rent expense. The depreciable life of leasehold improvements is limited by the estimated lease term, including renewals.
Operating leases are expensed on a straight-line basis over the life of the lease beginning when the lease commences. Rent expense and variable lease expense are included in occupancy and equipment expense on the Company's consolidated statements of income. The Company's variable lease expense includes rent escalators that are based on the Consumer Price Index or market conditions and include items such as common area maintenance, utilities, parking, property taxes, insurance and other costs associated with the lease. The Company recognizes a right-of-use asset and a finance lease liability at the lease commencement date on the estimated present value of lease payments over the lease term for finance leases. The amortization of the right-of-use asset is expensed through occupancy and equipment expense and the interest on the lease liability is expensed through interest expense on borrowings on the Company's consolidated statements of income.
There are no residual value guarantees, restrictions or covenants imposed by leases that will impact the Company's ability to pay dividends or cause the Company to incur additional expenses. The discount rate used in determining the lease liability is based upon incremental borrowing rates the Company could obtain for similar loans as of the date of commencement or renewal.
FB Financial Corporation and subsidiaries
Notes to consolidated financial statements
(Dollar amounts are in thousands, except share and per share amounts)
(M) Mortgage servicing rights
The Company accounts for its mortgage servicing rights at fair value at each reporting date with changes in the fair value reported in earnings in the period in which changes occur. The Company retains the right to service certain mortgage loans that it sells to secondary market investors. These mortgage servicing rights are recognized as a separate asset on the date the corresponding mortgage loan is sold.
The retained mortgage servicing right is initially recorded at the fair value of future net cash flows expected to be realized for performing servicing activities. Fair value is determined using an income approach with various assumptions including expected cash flows, prepayment speeds, market discount rates, servicing costs, and other factors.
Subsequent changes in fair value, including the write-downs due to payoffs and paydowns, are recorded in earnings in Mortgage banking income.
(N) Transfers of financial assets
Transfers of financial assets are accounted for as sales when control over the transferred assets is surrendered. Control is generally considered to have been surrendered when 1) the transferred assets are legally isolated from the Company or its consolidated affiliates, even in bankruptcy or other receivership, 2) the transferee has the right to pledge or exchange the assets with no conditions that constrain the transferee and provide more than a trivial benefit to the Company, and 3) the Company does not maintain the obligation or unilateral ability to reclaim or repurchase the assets. If these sale criteria are met, the transferred assets are removed from the Company’s balance sheet and a gain or loss on sale is recognized on the consolidated statements of income. If not met, the transfer is recorded as a secured borrowing, and the assets remain on the Company’s consolidated balance sheets, the proceeds from the transaction are recognized as a liability, and gain or loss on sale is deferred until the sale criterion are achieved.
(O) Goodwill and other intangibles
Goodwill represents the excess of the purchase price over the estimated fair value of identifiable net assets associated with acquisition transactions. Goodwill is assigned to the Company’s reporting units, Banking or Mortgage, and tested for impairment annually, or more frequently if an event occurs or circumstances change that would more likely than not reduce the fair value of the reporting unit below its carrying value. As part of its testing, the Company may elect to first assess qualitative factors to determine whether it is more likely than not that the fair value of a reporting unit is less than its carrying amount. If the results of the qualitative assessment indicate that more likely than not a reporting unit’s fair value is less than its carrying amount, the Company determines the fair value of the respective reporting unit (through the application of various quantitative valuation methodologies) relative to its carrying amount to determine whether quantitative indicators of potential impairment are present. The Company may also elect to bypass the qualitative assessment and begin with the quantitative assessment. If the results of the quantitative assessment indicate that the fair value of the reporting unit is below its carrying amount, the Company will recognize an impairment loss in noninterest expense for the amount that the reporting unit’s carrying amount exceeds its fair value (up to the amount of goodwill recorded). No impairment charges were recognized in either reporting units during the year ended December 31, 2024.
Other intangible assets consist of core deposit intangible assets arising from whole bank and branch acquisitions in addition to a customer trust intangible. All intangible assets are initially measured at fair value and then amortized over their estimated useful lives.
See Note 6, “Goodwill and intangible assets” for additional information on goodwill and other intangibles.
(P) Income taxes
Income tax expense is the total of the current year income tax due and the change in deferred tax assets and liabilities. Deferred tax assets and liabilities are the expected future tax amounts for the temporary differences between carrying amounts and tax bases of assets and liabilities, computed using enacted tax rates. A valuation allowance, if needed, reduces deferred tax assets to the amount expected to be realized. As changes in tax laws or rates are enacted, deferred tax assets and liabilities are adjusted through the provision for income taxes.
A tax position is recognized as a benefit only if it is “more likely than not” that the tax position would be sustained in a tax examination, with a tax examination being presumed to occur. The amount recognized is the amount of tax benefit that is
FB Financial Corporation and subsidiaries
Notes to consolidated financial statements
(Dollar amounts are in thousands, except share and per share amounts)
greater than 50% likely of being realized on examination. For tax positions not meeting the “more likely than not” test, no tax benefit is recorded.
The Company’s policy is to recognize interest and penalties on uncertain tax positions in income tax expense in the consolidated statements of income. There were no amounts related to uncertain tax positions recognized for the years ended December 31, 2024, 2023 or 2022.
(Q) Derivative financial instruments and hedging activities
A derivative is a financial instrument that derives its cash flows, and therefore its value, by reference to an underlying instrument, index or referenced interest rate. These instruments include interest rates swaps, caps, floors, financial forwards and futures contracts. The Company mainly uses derivatives to manage economic risk related to mortgage loans, long-term debt, and other funding sources. The Company also uses derivatives to facilitate transactions on behalf of its customers.
All derivative instruments are recognized on the Company’s consolidated balance sheets at their fair value. The Company does not offset fair value amounts under master netting agreements. Fair values are estimated using pricing models and current market data. On the date the derivative instrument is entered into, the Company designates the derivative as (1) a fair value hedge, (2) a cash flow hedge, or (3) a derivative with no hedge accounting designation. Changes in the fair value of a derivative instrument that is highly effective and that is designated and qualifies as a fair value hedge, along with the gain or loss on the hedged asset or liability that is attributable to the hedged risk (including losses or gains on firm commitments), are recorded in earnings. Changes in the fair value of a derivative instrument that is highly effective and that is designated and qualifies as a cash flow hedge are recorded in accumulated other comprehensive income, until earnings are affected by the variability of cash flows (e.g., when period settlements on a variable-rate asset or liability are recorded in earnings). Changes in the fair value of a derivative with no hedge accounting designation and settlements on the instrument are reported in earnings.
The Company formally documents all relationships between hedging instruments and hedge items, as well as its risk management objective and strategy for undertaking various hedge transactions. This process includes linking all derivative instruments that are designated as fair value or cash flow hedges to specific assets or liabilities on the Company’s consolidated balance sheets, or to specific firm commitments or forecasted transactions. The Company also formally assesses, both at the hedge’s inception and on an ongoing basis, whether the derivative instruments that are used in hedging transactions are highly effective in offsetting changes in fair values or cash flows of hedged items.
The Company discontinues hedge accounting prospectively when: (1) it is determined that the derivative instrument is no longer highly effective in offsetting changes in the fair value or cash flows of a hedged item (including firm commitments or forecasted transactions); (2) the derivative instrument expires or is sold, terminated or exercised; (3) the derivative instrument is de-designated as a hedging instrument because it is unlikely that a forecasted transaction will occur; (4) a hedged firm commitment no longer meets the definition of a firm commitment; or (5) management determines that designation of the derivative instrument as a hedging instrument is no longer appropriate.
When hedge accounting is discontinued because it is determined that the derivative instrument no longer qualifies as an effective fair value or cash flow hedge, the derivative instrument continues to be carried on the Company’s consolidated balance sheets at its fair value, with changes in the fair value included in earnings. Additionally, for fair value hedges, the hedged asset or liability is no longer adjusted for changes in fair value and the existing basis adjustment is amortized or accreted as an adjustment to the hedged item’s yield over the hedged item’s remaining life as established at original designation of the hedging relationship. For cash flow hedges, when hedge accounting is discontinued, but the hedged cash flows or forecasted transactions are still expected to occur, the unrealized gains and losses that were accumulated in other comprehensive income are recognized in earnings in the same period when the earnings are affected by the original hedged cash flows or forecasted transactions. When a cash flow hedge is discontinued because the hedged cash flows or forecasted transactions are not expected to occur, unrealized gains and losses that were accumulated in other comprehensive income are recognized in earnings immediately.
(R) Comprehensive income
Comprehensive income consists of net income and other comprehensive income. Other comprehensive income includes unrealized gains and losses on available-for-sale securities and derivatives designated as cash flow hedges, net of taxes.
FB Financial Corporation and subsidiaries
Notes to consolidated financial statements
(Dollar amounts are in thousands, except share and per share amounts)
(S) Loss contingencies
Loss contingencies, including claims and legal actions arising in the ordinary course of business, are recorded as liabilities when the likelihood of loss is probable and an amount or range of loss can be reasonably estimated. Management does not believe there are such matters that will have a material effect on the consolidated financial statements.
(T) Earnings per common share
Basic EPS excludes dilution and is computed by dividing earnings attributable to common shareholders by the weighted average number of common shares outstanding during the period. Diluted EPS includes the dilutive effect of additional potential common shares issuable under stock-based compensation plans where securities have been granted but are not yet vested and distributable. Diluted EPS is computed by dividing earnings attributable to common shareholders by the weighted average number of common shares outstanding for the year, plus an incremental number of common-equivalent shares computed using the treasury stock method.
The following is a summary of the basic and diluted earnings per common share calculation for each of the periods presented:
| | | | | | | | | | | | | | | | | | | | |
| | Years Ended December 31, |
| | | 2024 | | 2023 | | 2022 |
| Basic earnings per common share: | | | | | | |
| | | | | | |
| | | | | | |
| Earnings available to common shareholders | | $ | 116,035 | | | $ | 120,224 | | | $ | 124,555 | |
| Weighted average basic shares outstanding | | 46,737,217 | | | 46,781,214 | | | 47,113,470 | |
| Basic earnings per common share | | $ | 2.48 | | | $ | 2.57 | | | $ | 2.64 | |
| Diluted earnings per common share: | | | | | | |
| Earnings available to common shareholders | | $ | 116,035 | | | $ | 120,224 | | | $ | 124,555 | |
| Weighted average basic shares outstanding | | 46,737,217 | | | 46,781,214 | | | 47,113,470 | |
Weighted average diluted shares contingently issuable(1) | | 135,408 | | | 41,578 | | | 126,321 | |
| Weighted average diluted shares outstanding | | 46,872,625 | | | 46,822,792 | | | 47,239,791 | |
| Diluted earnings per common share | | $ | 2.48 | | | $ | 2.57 | | | $ | 2.64 | |
(1) Excludes 2,235, 172,677 and 11,888 restricted stock units outstanding considered to be antidilutive as of December 31, 2024, 2023 and 2022 respectively.(U) Segment reporting
ASC 280, “Segment Reporting,” requires information be reported about a company's reporting segments using a “management approach.” Identifiable reporting segments are defined as those revenue-producing components for which discrete financial information is utilized internally and which are subject to evaluation by the chief operating decision maker in making resource allocation decisions. Based on this guidance, the Company has identified two reporting segments - Banking and Mortgage. The Banking segment, the Company's primary segment, provides a full range of deposit and lending services to corporate, commercial and consumer customers. The Company also originates conforming residential mortgage loans through the Mortgage segment which engages in servicing and sale of mortgage loans through the secondary markets. Certain financial information has been presented in Note 18, “Segment reporting.”
FB Financial Corporation and subsidiaries
Notes to consolidated financial statements
(Dollar amounts are in thousands, except share and per share amounts)
(V) Stock-based compensation
The Company grants RSUs under compensation arrangements for the benefit of certain employees, executive officers, and directors. RSU grants are subject to time-based vesting. The total number of RSUs granted represents the maximum number of restricted stock units eligible to vest based upon the service conditions set forth in the grant agreements.
The Company awards annual grants of PSUs to certain employees and executive officers. Under the terms of a PSU award, the number of units that will vest and convert to shares of common stock will be based on the extent to which the Company achieves specified performance criteria relative to a predefined peer group during a fixed three-year performance period.
Stock-based compensation expense is recognized in accordance with ASC 718-20, “Compensation – Stock Compensation Awards Classified as Equity.” Compensation expense for RSUs is equal to the fair market value at the grant date and recognized over the vesting period. Compensation expense for PSUs is estimated each period based on the fair value of the stock at the grant date and the most probable outcome of the performance condition, adjusted for the passage of time within the vesting period of the awards. The Company has elected to record forfeitures as they occur. The summary of RSUs, PSUs, and stock-based compensation expense is presented in Note 21, “Stock-based compensation".
(W) Subsequent events
In accordance with ASC 855, “Subsequent Events,” the Company has evaluated events and transactions that occurred after December 31, 2024 through the date of the issued consolidated financial statements for potential recognition and disclosure.
Recently adopted accounting standards
In June 2022, the FASB issued ASU 2022-03, “Fair Value Measurement (Topic 820): Fair Value Measurement of Equity Securities Subject to Contractual Sale Restrictions.” The FASB issued this update to clarify the guidance in ASC 820, “Fair Value Measurement,” when measuring the fair value of an equity security subject to contractual restrictions that prohibit the sale of an equity security, to amend a related illustrative example, and to introduce new disclosure requirements for equity securities subject to contractual sale restrictions that are measured at fair value in accordance with Topic 820. The Company adopted this update effective January 1, 2024. The adoption did not have an impact on the Company’s consolidated financial statements or related disclosures.
In March 2023, the FASB issued ASU 2023-01, “Leases (Topic 842): Common Control Arrangements” as part of the Post-Implementation Review process of ASC 842, “Leases,” around related party arrangements between entities under common control. Under previous guidance, a lessee is generally required to amortize leasehold improvements that it owns over the shorter of the useful life of those improvements or the lease term. However, due to the nature of leasehold improvements made under leases between entities under common control, ASU 2023-01 requires a lessee in a common-control arrangement to amortize such leasehold improvements that it owns over the improvements’ useful life to the common control group, regardless of the lease term. The Company adopted this standard on January 1, 2024 on a prospective basis. The adoption of this standard did not have a material impact on the Company’s consolidated financial statements or related disclosures.
Additionally, in March 2023, the FASB issued ASU 2023-02, “Investments – Equity Method and Joint Ventures (Topic 323): Accounting for Investments in Tax Credit Structures Using the Proportional Amortization Method.” The amendments in this update permit reporting entities to elect to account for tax equity investments, regardless of the tax credit program from which the income tax credits are received, using the proportional amortization method if certain conditions are met. The Company adopted this standard effective January 1, 2024. The adoption of this accounting pronouncement did not have an impact on the Company’s historical consolidated financial statements but could influence the Company’s decisions with respect to investments in certain tax credits prospectively.
In November 2023, the FASB issued ASU 2023-07, “Segment Reporting (Topic 280): Improvements to Reportable Segment Disclosures.” The amendments in this update are intended to improve reportable segment disclosure requirements, primarily through enhanced disclosures about significant expenses. The ASU requires disclosures to include significant segment expenses that are regularly provided to the chief operating decision maker, a description of other segment items by reportable segment, and any additional measures of a segment's profit or loss used by the chief operating decision maker when deciding how to allocate resources. The ASU also requires all annual disclosures currently required by Topic 280, “Segment Reporting,” to be included in interim periods. The Company adopted this standard effective December 31, 2024, for annual financial statements and subsequent interim periods beginning in 2025, and
FB Financial Corporation and subsidiaries
Notes to consolidated financial statements
(Dollar amounts are in thousands, except share and per share amounts)
retrospectively updated its disclosures. Refer to Note 18 for further information. The adoption of this standard did not have a material impact on the Company's consolidated financial statements.
Newly issued not yet effective accounting standards
In December 2023, the FASB issued ASU 2023-08, “Intangibles – Goodwill and Other-Crypto Assets (Subtopic 350-60): Accounting for and Disclosure of Crypto Assets.” This update requires entities to present crypto assets measured at fair value separately from other intangible assets on the balance sheet and reflect changes from remeasurement in the net income. Additionally, an entity that receives crypto assets as noncash consideration in the ordinary course of business and converts them nearly immediately into cash is required to classify those cash receipts as cash flows from operating activities. Lastly, the update requires entities to provide interim and annual disclosures about the types of crypto assets they hold and any changes in their holdings of crypto assets. While the Company does not currently hold or facilitate transactions with crypto assets, the Company is evaluating the potential future financial statement and disclosure impact from adopting this guidance when it becomes applicable based on the Company’s crypto asset activities.
Additionally, in December 2023, the FASB issued ASU 2023-09, “Income Taxes (Topic 740): Improvements to Income Tax Disclosures.” The amendments in this update enhance the transparency and decision usefulness of income tax disclosures. This ASU requires disclosures of specific categories and disaggregation of information in the rate reconciliation table. The ASU also requires disclosure of disaggregated information related to income taxes paid, income or loss from continuing operations before income tax expense or benefit, and income tax expense or benefit from continuing operations. The requirements of the ASU are effective for annual periods beginning after December 15, 2024. Early adoption is permitted, and the amendments should be applied on a prospective basis. Retrospective application is permitted. The Company is evaluating the impact this will have on the Company’s income tax disclosures.
In November 2024, the FASB issued ASU 2024-03, “Income Statement – Reporting Comprehensive Income – Expense Disaggregation Disclosures (Subtopic 220-40): Disaggregation of Income Statement Expenses.” This update is intended to provide investors more detailed disclosures around specific types of expenses. This ASU requires certain details for expenses presented on the face of the consolidated statements of income as well as selling expenses to be presented in the notes to the financial statements. This update is effective for fiscal years beginning after December 15, 2026, and interim periods within fiscal years beginning after December 15, 2027, with early adoption permitted. The disclosure updates are required to be applied prospectively with the option for retrospective application. The Company is evaluating the impact this will have on the Company's consolidated financial statements and related disclosures.
FB Financial Corporation and subsidiaries
Notes to consolidated financial statements
(Dollar amounts are in thousands, except share and per share amounts)
Note (2)—Investment securities
The following tables summarize the amortized cost, allowance for credit losses and fair value of the AFS debt securities and the corresponding amounts of unrealized gains and losses recognized in accumulated other comprehensive loss, net at December 31, 2024 and 2023:
| | | | | | | | | | | | | | | | | | | | | | | | | | | | | | | | |
| | December 31, 2024 |
| | | Amortized cost | | Gross unrealized gains | | Gross unrealized losses | | Allowance for credit losses on investments | | Fair Value |
| Investment Securities | | | | | | | | | | |
| AFS debt securities | | | | | | | | | | |
| U.S. government agency securities | | $ | 564,752 | | | $ | 172 | | | $ | (1,917) | | | $ | — | | | $ | 563,007 | |
| Mortgage-backed securities - residential | | 927,883 | | | 393 | | | (117,277) | | | — | | | 810,999 | |
| Mortgage-backed securities - commercial | | 15,965 | | | — | | | (1,108) | | | — | | | 14,857 | |
| Municipal securities | | 169,498 | | | 20 | | | (21,661) | | | — | | | 147,857 | |
| U.S. Treasury securities | | 299 | | | — | | | — | | | — | | | 299 | |
| Corporate securities | | 1,000 | | | — | | | (11) | | | — | | | 989 | |
| Total | | $ | 1,679,397 | | | $ | 585 | | | $ | (141,974) | | | $ | — | | | $ | 1,538,008 | |
| | | | | | | | | | | | | | | | | | | | | | | | | | | | | | | | | | |
| | December 31, 2023 | | |
| | | Amortized cost | | Gross unrealized gains | | Gross unrealized losses | | Allowance for credit losses on investments | | Fair Value | | |
| Investment Securities | | | | | | | | | | | | |
| AFS debt securities | | | | | | | | | | | | |
| U.S. government agency securities | | $ | 204,663 | | | $ | 470 | | | $ | (1,177) | | | $ | — | | | $ | 203,956 | | | |
| Mortgage-backed securities - residential | | 1,057,389 | | | — | | | (160,418) | | | — | | | 896,971 | | | |
| Mortgage-backed securities - commercial | | 18,186 | | | — | | | (1,225) | | | — | | | 16,961 | | | |
| Municipal securities | | 263,312 | | | 370 | | | (21,419) | | | — | | | 242,263 | | | |
| U.S. Treasury securities | | 111,729 | | | — | | | (3,233) | | | — | | | 108,496 | | | |
| Corporate securities | | 3,500 | | | — | | | (174) | | | — | | | 3,326 | | | |
| Total | | $ | 1,658,779 | | | $ | 840 | | | $ | (187,646) | | | $ | — | | | $ | 1,471,973 | | | |
| | | | | | | | | | | | |
| | | | | | | | | | | | |
The components of amortized cost for AFS debt securities on the consolidated balance sheets exclude accrued interest receivable since the Company elected to present accrued interest receivable separately on the consolidated balance sheets. As of December 31, 2024 and 2023, total accrued interest receivable on AFS debt securities was $6,401 and $7,212, respectively.
AFS debt securities pledged at December 31, 2024 and 2023 had carrying amounts of $937,043 and $929,546, respectively, and were pledged to secure a Federal Reserve line of credit, public deposits and repurchase agreements. Additionally at December 31, 2023, AFS debt securities were pledged to secure Bank Term Funding Program borrowings.
Within AFS debt securities, there were no aggregate holdings of any single issuer, other than U.S. Government sponsored enterprises, in an amount greater than 10% of shareholders’ equity during any period presented.
AFS debt securities transactions are recorded as of the trade date. At December 31, 2024 and 2023, there were no trade date receivables nor payables that related to sales or purchases settled after period end.
FB Financial Corporation and subsidiaries
Notes to consolidated financial statements
(Dollar amounts are in thousands, except share and per share amounts)
The following tables show gross unrealized losses on AFS debt securities for which an allowance for credit losses has not been recorded at December 31, 2024 and 2023, aggregated by investment category and length of time that individual securities have been in a continuous unrealized loss position:
| | | | | | | | | | | | | | | | | | | | | | | | | | | | | | | | | | | | | | |
| | December 31, 2024 |
| | | Less than 12 months | | 12 months or more | | Total |
| | | Fair Value | | Gross Unrealized Loss | | Fair Value | | Gross Unrealized Loss | | Fair Value | | Gross Unrealized Loss |
| U.S. government agency securities | | $ | 494,885 | | | $ | (1,908) | | | $ | 714 | | | $ | (9) | | | $ | 495,599 | | | $ | (1,917) | |
| Mortgage-backed securities - residential | | 209,078 | | | (8,956) | | | 441,502 | | | (108,321) | | | 650,580 | | | (117,277) | |
| Mortgage-backed securities - commercial | | 2,222 | | | (19) | | | 12,635 | | | (1,089) | | | 14,857 | | | (1,108) | |
| Municipal securities | | 34,059 | | | (2,376) | | | 110,173 | | | (19,285) | | | 144,232 | | | (21,661) | |
| | | | | | | | | | | | |
| Corporate securities | | — | | | — | | | 989 | | | (11) | | | 989 | | | (11) | |
| Total | | $ | 740,244 | | | $ | (13,259) | | | $ | 566,013 | | | $ | (128,715) | | | $ | 1,306,257 | | | $ | (141,974) | |
| | | | | | | | | | | | | | | | | | | | | | | | | | | | | | | | | | | | | | |
| | | December 31, 2023 |
| | | Less than 12 months | | 12 months or more | | Total |
| | | Fair Value | | Gross Unrealized Loss | | Fair Value | | Gross Unrealized Loss | | Fair Value | | Gross Unrealized Loss |
| U.S. government agency securities | | $ | 25,923 | | | $ | (21) | | | $ | 14,040 | | | $ | (1,156) | | | $ | 39,963 | | | $ | (1,177) | |
| Mortgage-backed securities - residential | | — | | | — | | | 896,971 | | | (160,418) | | | 896,971 | | | (160,418) | |
| Mortgage-backed securities - commercial | | — | | | — | | | 16,961 | | | (1,225) | | | 16,961 | | | (1,225) | |
| Municipal securities | | 14,480 | | | (148) | | | 188,669 | | | (21,271) | | | 203,149 | | | (21,419) | |
| U.S. Treasury securities | | — | | | — | | | 108,496 | | | (3,233) | | | 108,496 | | | (3,233) | |
| Corporate securities | | — | | | — | | | 3,326 | | | (174) | | | 3,326 | | | (174) | |
| Total | | $ | 40,403 | | | $ | (169) | | | $ | 1,228,463 | | | $ | (187,477) | | | $ | 1,268,866 | | | $ | (187,646) | |
| | | | | | | | | | | | |
| | | | | | | | | | | | |
As of December 31, 2024 and 2023, the Company’s AFS debt securities portfolio consisted of 271 and 439 individual securities, 248 and 370 of which were in an unrealized loss position, respectively.
The majority of the investment portfolio was either government guaranteed, an issuance of a government sponsored entity or highly rated by major credit rating agencies, and the Company has historically not recorded any credit losses associated with these investments. Municipal debt securities with market values below amortized cost at December 31, 2024 were reviewed for material credit events and/or rating downgrades with individual credit reviews performed. The issuers of these AFS debt securities continue to make timely principal and interest payments under the contractual terms of the securities and the issuers will continue to be observed as a part of the Company’s ongoing credit monitoring. As such, as of December 31, 2024 and 2023, it was determined that all AFS debt securities that experienced a decline in fair value below amortized cost basis were due to noncredit-related factors. Further, it is not likely that the Company will be required to sell these securities before recovery of their amortized cost basis. Therefore, there was no allowance for credit losses recognized on AFS debt securities as of December 31, 2024 or December 31, 2023. Periodically, AFS debt securities may be sold, or the composition of the portfolio realigned to improve yields, quality or marketability, or to implement changes in investment or asset/liability strategy, including maintaining collateral requirements and raising funds for liquidity purposes or preparing for anticipated changes in market interest rates.
FB Financial Corporation and subsidiaries
Notes to consolidated financial statements
(Dollar amounts are in thousands, except share and per share amounts)
The amortized cost and fair value of AFS debt securities by contractual maturity as of December 31, 2024 and 2023 are shown below. Expected maturities may differ from contractual maturities because borrowers may have the right to call or prepay obligations with or without call or prepayment penalties.
| | | | | | | | | | | | | | | | | | | | | | | | | | |
| | | | |
| | December 31, |
| | | 2024 | | | 2023 | |
| | | Available-for-sale | | Available-for-sale |
| | | Amortized cost | | Fair Value | | Amortized cost | | Fair Value |
| Due in one year or less | | $ | 849 | | | $ | 847 | | | $ | 64,776 | | | $ | 64,279 | |
| Due in one to five years | | 4,186 | | | 4,600 | | | 75,996 | | | 71,801 | |
| Due in five to ten years | | 225,954 | | | 222,943 | | | 51,162 | | | 49,630 | |
| Due in over ten years | | 504,560 | | | 483,762 | | | 391,270 | | | 372,331 | |
| | 735,549 | | | 712,152 | | | 583,204 | | | 558,041 | |
| Mortgage-backed securities - residential | | 927,883 | | | 810,999 | | | 1,057,389 | | | 896,971 | |
| Mortgage-backed securities - commercial | | 15,965 | | | 14,857 | | | 18,186 | | | 16,961 | |
| Total AFS debt securities | | $ | 1,679,397 | | | $ | 1,538,008 | | | $ | 1,658,779 | | | $ | 1,471,973 | |
Sales and other dispositions of AFS debt securities were as follows:
| | | | | | | | | | | | | | | | | | | | | | | |
| | | | Years Ended December 31, |
| | | | | | 2024 | | | 2023 | | | 2022 |
| Proceeds from sales | | | | | $ | 526,441 | | | $ | 100,463 | | | $ | 1,218 | |
| Proceeds from maturities, prepayments and calls | | | | | 299,814 | | | 128,206 | | | 204,748 | |
| Gross realized gains | | | | | 90 | | | 45 | | | 4 | |
| Gross realized losses | | | | | 56,468 | | | 14,119 | | | 3 | |
| | | | | | | | | |
Equity Securities
The Company has equity securities without a readily determinable market value included in other assets on the consolidated balance sheets with carrying amounts of $23,459 and $25,191 at December 31, 2024 and 2023, respectively. Additionally, the Company had $32,749 and $34,190 of FHLB stock carried at cost at December 31, 2024 and 2023, respectively, included separately from the other equity securities discussed above.
Equity method investment
The Company holds equity securities of a privately held entity which originates manufactured housing loans through utilization of its proprietary developed technology. During the year ended December 31, 2024, the Company acquired additional equity securities in this privately held entity and, as a result, the Company determined it has the ability to exercise significant influence over the privately held entity. Accordingly, the Company's investment was accounted for under the equity method of accounting as of December 31, 2024. The investment was initially recorded at cost and was adjusted to reflect the Company’s proportionate share of profit or loss of the investee. This investment is included in other assets on the consolidated balance sheets with a carrying amount of $19,970 as of December 31, 2024. As a result of the investment, the Company has a basis difference of $17,103 which is being accounted for as equity method goodwill.
As of December 31, 2023, this investment was accounted for as an equity investment without a readily determinable market value and included in other assets on the consolidated balance sheets with a carrying value of $10,000.
FB Financial Corporation and subsidiaries
Notes to consolidated financial statements
(Dollar amounts are in thousands, except share and per share amounts)
Note (3)—Loans and allowance for credit losses on loans HFI
Loans outstanding as of December 31, 2024 and 2023, by class of financing receivable are as follows:
| | | | | | | | | | | | | | |
| | | | |
| | December 31, |
| | | 2024 | | | 2023 | |
| Commercial and industrial | | $ | 1,691,213 | | | $ | 1,720,733 | |
| Construction | | 1,087,732 | | | 1,397,313 | |
| Residential real estate: | | | | |
| 1-to-4 family mortgage | | 1,616,754 | | | 1,568,552 | |
| Residential line of credit | | 602,475 | | | 530,912 | |
| Multi-family mortgage | | 653,769 | | | 603,804 | |
| Commercial real estate: | | | | |
| Owner-occupied | | 1,357,568 | | | 1,232,071 | |
| Non-owner occupied | | 2,099,129 | | | 1,943,525 | |
| Consumer and other | | 493,744 | | | 411,873 | |
| Gross loans | | 9,602,384 | | | 9,408,783 | |
| Less: Allowance for credit losses on loans HFI | | (151,942) | | | (150,326) | |
| Net loans | | $ | 9,450,442 | | | $ | 9,258,457 | |
As of December 31, 2024 and 2023, $988,177 and $1,030,016, respectively, of qualifying residential mortgage loans (including loans held for sale) and $1,620,510 and $1,984,007, respectively, of qualifying commercial mortgage loans were pledged to the FHLB system securing advances against the Bank’s line of credit. Additionally, as of December 31, 2024 and 2023, qualifying commercial and industrial, construction and consumer loans, of $2,561,352 and $3,107,495, respectively, were pledged to the Federal Reserve under the Borrower-in-Custody program.
The amortized cost of loans HFI on the consolidated balance sheets exclude accrued interest receivable as the Company presents accrued interest receivable separately on the balance sheet. As of December 31, 2024 and 2023, accrued interest receivable on loans HFI amounted to $40,970 and $43,776, respectively.
Credit Quality - Commercial Type Loans
The Company categorizes commercial loan types into risk categories based on relevant information about the ability of borrowers to service their debt such as: current financial information, historical payment experience, credit documentation, public information, and current economic trends, among other factors. The Company analyzes loans that share similar risk characteristics collectively. Loans that do not share similar risk characteristics may be evaluated individually.
The Company uses the following definitions for risk ratings:
| | | | | | | | |
| Pass. | Loans rated Pass include those that are adequately collateralized performing loans which management believes do not have conditions that have occurred or may occur that would result in the loan being downgraded into an inferior category. The Pass category also includes commercial loans rated as Watch, which include those that management believes have conditions that have occurred, or may occur, which could result in the loan being downgraded to an inferior category. |
|
|
| |
| |
| | |
| Special Mention. | Loans rated Special Mention are those that have potential weaknesses that deserve management’s close attention. If left uncorrected, these potential weaknesses may result in deterioration of the repayment prospects for the loan or in the institution’s credit position at some future date. Management does not believe there will be a loss of principal or interest. These loans require intensive servicing and may possess more than normal credit risk. |
|
| |
| |
| | |
| Classified. | Loans included in the Classified category include loans rated as Substandard and Doubtful. Loans rated as Substandard are inadequately protected by the current net worth and paying capacity of the obligor or of the collateral pledged, if any. Substandard loans have a well-defined weakness or weaknesses that jeopardize the liquidation of the debt. They are characterized by the distinct possibility that the institution will sustain some loss if the deficiencies are not corrected. Doubtful loans have all the weaknesses inherent in those classified as Substandard, with the added characteristic that the weakness or weaknesses make collection or liquidation in full, based on currently existing facts, conditions, and values, highly questionable and improbable. |
| |
| |
| |
| |
| |
Risk ratings are updated on an ongoing basis and are subject to change by continuous loan monitoring processes.
FB Financial Corporation and subsidiaries
Notes to consolidated financial statements
(Dollar amounts are in thousands, except share and per share amounts)
The following tables present the credit quality of the Company's commercial type loan portfolio as of December 31, 2024 and 2023 and the gross charge-offs for the years ended December 31, 2024 and 2023 by year of origination. Revolving loans are presented separately. Management considers the guidance in ASC 310-20 when determining whether a modification, extension, or renewal constitutes a current period origination.
| | | | | | | | | | | | | | | | | | | | | | | | | | | | | | | | | | | | | | | | | | | | | | | | | | | | |
| | |
| | | | | | | | |
| | | | | | | | |
As of and for the year ended December 31, 2024 | | 2024 | | | 2023 | | | 2022 | | | 2021 | | | 2020 | | | Prior | | Revolving Loans Amortized Cost Basis | | Total | | |
| Commercial and industrial | | | | | | | | | | | | | | | | | | |
| Pass | | $ | 194,185 | | | $ | 182,677 | | | $ | 130,148 | | | $ | 56,460 | | | $ | 29,735 | | | $ | 104,236 | | | $ | 909,398 | | | $ | 1,606,839 | | | |
| Special Mention | | 2,684 | | | 2,425 | | | 7,609 | | | 277 | | | 285 | | | 2,015 | | | 24,345 | | | 39,640 | | | |
| Classified | | — | | | 175 | | | 19,125 | | | 4,424 | | | 1,659 | | | 6,201 | | | 13,150 | | | 44,734 | | | |
| | | | | | | | | | | | | | | | | | |
| Total | | 196,869 | | | 185,277 | | | 156,882 | | | 61,161 | | | 31,679 | | | 112,452 | | | 946,893 | | | 1,691,213 | | | |
| | | | | | | | | | | | | | | | | | |
Current-period gross
charge-offs | | — | | | 116 | | | 950 | | | 506 | | | 1,234 | | | 7 | | | 8,267 | | | 11,080 | | | |
| Construction | | | | | | | | | | | | | | | | | | |
| Pass | | 190,058 | | | 116,122 | | | 349,716 | | | 99,225 | | | 27,616 | | | 54,099 | | | 199,596 | | | 1,036,432 | | | |
| Special Mention | | 156 | | | 87 | | | 15,432 | | | 389 | | | 10 | | | 576 | | | — | | | 16,650 | | | |
| Classified | | — | | | — | | | 7,314 | | | 290 | | | 8,335 | | | — | | | 18,711 | | | 34,650 | | | |
| | | | | | | | | | | | | | | | | | |
| Total | | 190,214 | | | 116,209 | | | 372,462 | | | 99,904 | | | 35,961 | | | 54,675 | | | 218,307 | | | 1,087,732 | | | |
| | | | | | | | | | | | | | | | | | |
Current-period gross
charge-offs | | — | | | — | | | 122 | | | — | | | — | | | — | | | — | | | 122 | | | |
| Residential real estate: | | | | | | | | | | | | | | | | | | |
| | | | | | | | | | | | | | | | | | |
| Multi-family mortgage | | | | | | | | | | | | | | | | | | |
| Pass | | 40,076 | | | 3,800 | | | 232,415 | | | 223,076 | | | 51,948 | | | 69,652 | | | 21,883 | | | 642,850 | | | |
| Special Mention | | — | | | — | | | — | | | — | | | — | | | — | | | — | | | — | | | |
| Classified | | — | | | — | | | — | | | 9,919 | | | — | | | 1,000 | | | — | | | 10,919 | | | |
| | | | | | | | | | | | | | | | | | |
| Total | | 40,076 | | | 3,800 | | | 232,415 | | | 232,995 | | | 51,948 | | | 70,652 | | | 21,883 | | | 653,769 | | | |
| | | | | | | | | | | | | | | | | | |
| | | | | | | | | | | | | | | | | | |
Current-period gross
charge-offs | | — | | | — | | | — | | | — | | | — | | | — | | | — | | | — | | | |
| Commercial real estate: | | | | | | | | | | | | | | | | | | |
| Owner occupied | | | | | | | | | | | | | | | | | | |
| Pass | | 185,416 | | | 103,060 | | | 247,049 | | | 215,798 | | | 102,580 | | | 396,288 | | | 84,226 | | | 1,334,417 | | | |
| Special Mention | | — | | | — | | | 1,370 | | | 2,582 | | | — | | | 6,133 | | | — | | | 10,085 | | | |
| Classified | | — | | | — | | | 6,324 | | | 235 | | | 61 | | | 5,371 | | | 1,075 | | | 13,066 | | | |
| | | | | | | | | | | | | | | | | | |
| Total | | 185,416 | | | 103,060 | | | 254,743 | | | 218,615 | | | 102,641 | | | 407,792 | | | 85,301 | | | 1,357,568 | | | |
| | | | | | | | | | | | | | | | | | |
Current-period gross
charge-offs | | — | | | — | | | — | | | — | | | — | | | — | | | — | | | — | | | |
| Non-owner occupied | | | | | | | | | | | | | | | | | | |
| Pass | | 198,591 | | | 36,027 | | | 526,417 | | | 445,598 | | | 111,943 | | | 689,158 | | | 58,255 | | | 2,065,989 | | | |
| Special Mention | | — | | | 4,836 | | | — | | | 1,527 | | | — | | | 19,311 | | | — | | | 25,674 | | | |
| Classified | | — | | | — | | | — | | | 136 | | | — | | | 7,330 | | | — | | | 7,466 | | | |
| | | | | | | | | | | | | | | | | | |
| Total | | 198,591 | | | 40,863 | | | 526,417 | | | 447,261 | | | 111,943 | | | 715,799 | | | 58,255 | | | 2,099,129 | | | |
| | | | | | | | | | | | | | | | | | |
| | | | | | | | | | | | | | | | | | |
| | | | | | | | | | | | | | | | | | |
| | | | | | | | | | | | | | | | | | |
Current-period gross
charge-offs | | — | | | — | | | — | | | — | | | — | | | — | | | — | | | — | | | |
| Total commercial loan types | | | | | | | | | | | | | | | | | | |
| Pass | | 808,326 | | | 441,686 | | | 1,485,745 | | | 1,040,157 | | | 323,822 | | | 1,313,433 | | | 1,273,358 | | | 6,686,527 | | | |
| Special Mention | | 2,840 | | | 7,348 | | | 24,411 | | | 4,775 | | | 295 | | | 28,035 | | | 24,345 | | | 92,049 | | | |
| Classified | | — | | | 175 | | | 32,763 | | | 15,004 | | | 10,055 | | | 19,902 | | | 32,936 | | | 110,835 | | | |
| | | | | | | | | | | | | | | | | | |
| Total | | $ | 811,166 | | | $ | 449,209 | | | $ | 1,542,919 | | | $ | 1,059,936 | | | $ | 334,172 | | | $ | 1,361,370 | | | $ | 1,330,639 | | | $ | 6,889,411 | | | |
Current-period gross
charge-offs | | $ | — | | | $ | 116 | | | $ | 1,072 | | | $ | 506 | | | $ | 1,234 | | | $ | 7 | | | $ | 8,267 | | | $ | 11,202 | | | |
FB Financial Corporation and subsidiaries
Notes to consolidated financial statements
(Dollar amounts are in thousands, except share and per share amounts)
| | | | | | | | | | | | | | | | | | | | | | | | | | | | | | | | | | | | | | | | | | | | | | | | | | | | |
| | |
| | | | | | | | |
| | | | | | | | |
As of and for the year ended
December 31, 2023 | | 2023 | | | 2022 | | | 2021 | | | 2020 | | | 2019 | | | Prior | | Revolving Loans Amortized Cost Basis | | Total | | |
| Commercial and industrial | | | | | | | | | | | | | | | | | | |
| Pass | | $ | 225,734 | | | $ | 255,921 | | | $ | 151,492 | | | $ | 39,897 | | | $ | 70,302 | | | $ | 73,415 | | | $ | 839,918 | | | $ | 1,656,679 | | | |
| Special Mention | | — | | | 17,947 | | | 3,083 | | | — | | | 151 | | | 108 | | | 7,549 | | | 28,838 | | | |
| Classified | | 457 | | | 4,253 | | | 3,075 | | | 3,027 | | | 254 | | | 6,129 | | | 18,021 | | | 35,216 | | | |
| | | | | | | | | | | | | | | | | | |
| Total | | 226,191 | | | 278,121 | | | 157,650 | | | 42,924 | | | 70,707 | | | 79,652 | | | 865,488 | | | 1,720,733 | | | |
Current-period gross
charge-offs | | 14 | | | 7 | | | 201 | | | 22 | | | — | | | 87 | | | 131 | | | 462 | | | |
| | | | | | | | | | | | | | | | | | |
| Construction | | | | | | | | | | | | | | | | | | |
| Pass | | 179,929 | | | 677,387 | | | 148,312 | | | 46,697 | | | 39,140 | | | 49,954 | | | 208,491 | | | 1,349,910 | | | |
| Special Mention | | 1 | | | 4,659 | | | 2,943 | | | 1,202 | | | — | | | 690 | | | 12,000 | | | 21,495 | | | |
| Classified | | — | | | 2,349 | | | 1,484 | | | 6,620 | | | — | | | — | | | 15,455 | | | 25,908 | | | |
| | | | | | | | | | | | | | | | | | |
| Total | | 179,930 | | | 684,395 | | | 152,739 | | | 54,519 | | | 39,140 | | | 50,644 | | | 235,946 | | | 1,397,313 | | | |
Current-period gross
charge-offs | | — | | | — | | | — | | | — | | | — | | | — | | | — | | | — | | | |
| | | | | | | | | | | | | | | | | | |
| Residential real estate: | | | | | | | | | | | | | | | | | | |
| | | | | | | | | | | | | | | | | | |
| Multi-family mortgage | | | | | | | | | | | | | | | | | | |
| Pass | | 29,982 | | | 151,495 | | | 223,889 | | | 92,745 | | | 29,933 | | | 43,479 | | | 31,209 | | | 602,732 | | | |
| Special Mention | | — | | | — | | | — | | | — | | | — | | | — | | | — | | | — | | | |
| Classified | | — | | | — | | | — | | | — | | | — | | | 1,072 | | | — | | | 1,072 | | | |
| | | | | | | | | | | | | | | | | | |
| Total | | 29,982 | | | 151,495 | | | 223,889 | | | 92,745 | | | 29,933 | | | 44,551 | | | 31,209 | | | 603,804 | | | |
Current-period gross
charge-offs | | — | | | — | | | — | | | — | | | — | | | — | | | — | | | — | | | |
| | | | | | | | | | | | | | | | | | |
| | | | | | | | | | | | | | | | | | |
| Commercial real estate: | | | | | | | | | | | | | | | | | | |
| Owner occupied | | | | | | | | | | | | | | | | | | |
| Pass | | 118,030 | | | 261,196 | | | 231,241 | | | 115,397 | | | 151,146 | | | 281,253 | | | 53,970 | | | 1,212,233 | | | |
| Special Mention | | — | | | 1,297 | | | 1,827 | | | — | | | 154 | | | 2,617 | | | — | | | 5,895 | | | |
| Classified | | — | | | 6,305 | | | 16 | | | — | | | 760 | | | 5,789 | | | 1,073 | | | 13,943 | | | |
| | | | | | | | | | | | | | | | | | |
| Total | | 118,030 | | | 268,798 | | | 233,084 | | | 115,397 | | | 152,060 | | | 289,659 | | | 55,043 | | | 1,232,071 | | | |
Current-period gross
charge-offs | | — | | | — | | | 144 | | | — | | | — | | | — | | | — | | | 144 | | | |
| | | | | | | | | | | | | | | | | | |
| Non-owner occupied | | | | | | | | | | | | | | | | | | |
| Pass | | 47,026 | | | 474,560 | | | 478,878 | | | 117,429 | | | 178,448 | | | 580,168 | | 43,577 | | | 1,920,086 | | | |
| Special Mention | | — | | | — | | | 3,975 | | | — | | | — | | | 10,435 | | — | | | 14,410 | | | |
| Classified | | — | | | — | | | 1,001 | | | — | | | 381 | | | 7,647 | | — | | | 9,029 | | | |
| | | | | | | | | | | | | | | | | | |
| Total | | 47,026 | | | 474,560 | | | 483,854 | | | 117,429 | | | 178,829 | | | 598,250 | | | 43,577 | | | 1,943,525 | | | |
Current-period gross
charge-offs | | — | | | — | | | — | | | — | | | — | | | — | | | — | | | — | | | |
| | | | | | | | | | | | | | | | | | |
| Total commercial loan types | | | | | | | | | | | | | | | | | | |
| Pass | | 600,701 | | | 1,820,559 | | | 1,233,812 | | | 412,165 | | | 468,969 | | | 1,028,269 | | | 1,177,165 | | | 6,741,640 | | | |
| Special Mention | | 1 | | | 23,903 | | | 11,828 | | | 1,202 | | | 305 | | | 13,850 | | | 19,549 | | | 70,638 | | | |
| Classified | | 457 | | | 12,907 | | | 5,576 | | | 9,647 | | | 1,395 | | | 20,637 | | | 34,549 | | | 85,168 | | | |
| Total | | $ | 601,159 | | | $ | 1,857,369 | | | $ | 1,251,216 | | | $ | 423,014 | | | $ | 470,669 | | | $ | 1,062,756 | | | $ | 1,231,263 | | | $ | 6,897,446 | | | |
Current-period gross
charge-offs | | 14 | | | 7 | | | 345 | | | 22 | | | — | | | 87 | | | 131 | | | 606 | | | |
FB Financial Corporation and subsidiaries
Notes to consolidated financial statements
(Dollar amounts are in thousands, except share and per share amounts)
Credit Quality - Consumer Type Loans
For consumer and residential loan classes, the Company primarily evaluates credit quality based on delinquency and accrual status of the loan, credit documentation and by payment activity. The performing or nonperforming status is updated on an on-going basis dependent upon improvement and deterioration in credit quality. Nonperforming loans include loans that are no longer accruing interest (nonaccrual loans) and loans past due ninety or more days and still accruing interest.
The following tables present the credit quality by classification (performing or nonperforming) of the Company’s consumer type loan portfolio as of December 31, 2024 and 2023 and the gross charge-offs for the years ended December 31, 2024 and 2023 by year of origination. Revolving loans are presented separately. Management considers the guidance in ASC 310-20 when determining whether a modification, extension, or renewal constitutes a current period origination.
| | | | | | | | | | | | | | | | | | | | | | | | | | | | | | | | | | | | | | | | | | | | | | | | | | |
|
| | | | | | |
| | | | | | |
As of and for the year ended December 31, 2024 | | 2024 | | | 2023 | | | 2022 | | | 2021 | | | 2020 | | | Prior | | Revolving Loans Amortized Cost Basis | | Total |
| | | | | | | | | | | | | | | | |
| | | | | | | | | | | | | | | | |
| | | | | | | | | | | | | | | | |
| | | | | | | | | | | | | | | | |
| | | | | | | | | | | | | | | | |
| Residential real estate: | | | | | | | | | | | | | | | | |
| 1-to-4 family mortgage | | | | | | | | | | | | | | | | |
| Performing | | $ | 223,520 | | | $ | 165,395 | | | $ | 443,372 | | | $ | 360,188 | | | $ | 129,674 | | | $ | 266,661 | | | $ | — | | | $ | 1,588,810 | |
| Nonperforming | | 27 | | | 941 | | | 7,254 | | | 6,357 | | | 4,192 | | | 9,173 | | | — | | | 27,944 | |
| Total | | 223,547 | | | 166,336 | | | 450,626 | | | 366,545 | | | 133,866 | | | 275,834 | | | — | | | 1,616,754 | |
Current-period gross
charge-offs | | 10 | | | 54 | | | 150 | | | 130 | | | 67 | | | 28 | | | — | | | 439 | |
| Residential line of credit | | | | | | | | | | | | | | | | |
| Performing | | — | | | — | | | — | | | — | | | — | | | — | | | 600,581 | | | 600,581 | |
| Nonperforming | | — | | | — | | | — | | | — | | | — | | | — | | | 1,894 | | | 1,894 | |
| Total | | — | | | — | | | — | | | — | | | — | | | — | | | 602,475 | | | 602,475 | |
Current-period gross
charge-offs | | — | | | — | | | — | | | — | | | — | | | — | | | 73 | | | 73 | |
| Consumer and other | | | | | | | | | | | | | | | | |
| Performing | | 139,684 | | | 93,817 | | | 76,286 | | | 35,507 | | | 29,387 | | | 102,233 | | | 652 | | | 477,566 | |
| Nonperforming | | 1,300 | | | 1,749 | | | 1,686 | | | 3,139 | | | 2,548 | | | 5,755 | | | 1 | | | 16,178 | |
| Total | | 140,984 | | | 95,566 | | | 77,972 | | | 38,646 | | | 31,935 | | | 107,988 | | | 653 | | | 493,744 | |
Current-period gross
charge-offs | | 1,593 | | | 511 | | | 302 | | | 278 | | | 69 | | | 298 | | | — | | | 3,051 | |
| Total consumer type loans | | | | | | | | | | | | | | | | |
| Performing | | 363,204 | | | 259,212 | | | 519,658 | | | 395,695 | | | 159,061 | | | 368,894 | | | 601,233 | | | 2,666,957 | |
| Nonperforming | | 1,327 | | | 2,690 | | | 8,940 | | | 9,496 | | | 6,740 | | | 14,928 | | | 1,895 | | | 46,016 | |
| Total | | $ | 364,531 | | | $ | 261,902 | | | $ | 528,598 | | | $ | 405,191 | | | $ | 165,801 | | | $ | 383,822 | | | $ | 603,128 | | | $ | 2,712,973 | |
Current-period gross
charge-offs | | $ | 1,603 | | | $ | 565 | | | $ | 452 | | | $ | 408 | | | $ | 136 | | | $ | 326 | | | $ | 73 | | | $ | 3,563 | |
FB Financial Corporation and subsidiaries
Notes to consolidated financial statements
(Dollar amounts are in thousands, except share and per share amounts)
| | | | | | | | | | | | | | | | | | | | | | | | | | | | | | | | | | | | | | | | | | | | | | | | | | |
|
| | | | | | |
| | | | | | |
As of and for the year ended
December 31, 2023 | | 2023 | | | 2022 | | | 2021 | | | 2020 | | | 2019 | | | Prior | | Revolving Loans Amortized Cost Basis | | Total |
| | | | | | | | | | | | | | | | |
| | | | | | | | | | | | | | | | |
| | | | | | | | | | | | | | | | |
| | | | | | | | | | | | | | | | |
| | | | | | | | | | | | | | | | |
| Residential real estate: | | | | | | | | | | | | | | | | |
| 1-to-4 family mortgage | | | | | | | | | | | | | | | | |
| Performing | | $ | 198,537 | | | $ | 500,628 | | | $ | 399,338 | | | $ | 145,484 | | | $ | 81,905 | | | $ | 226,587 | | | $ | — | | | $ | 1,552,479 | |
| Nonperforming | | 76 | | | 2,565 | | | 4,026 | | | 3,846 | | | 690 | | | 4,870 | | | — | | | 16,073 | |
| Total | | 198,613 | | | 503,193 | | | 403,364 | | | 149,330 | | | 82,595 | | | 231,457 | | | — | | | 1,568,552 | |
Prior-period gross
charge-offs | | — | | | 18 | | | — | | | 4 | | | — | | | 24 | | | — | | | 46 | |
| Residential line of credit | | | | | | | | | | | | | | | | |
| Performing | | — | | | — | | | — | | | — | | | — | | | — | | | 528,439 | | | 528,439 | |
| Nonperforming | | — | | | — | | | — | | | — | | | — | | | — | | | 2,473 | | | 2,473 | |
| Total | | — | | | — | | | — | | | — | | | — | | | — | | | 530,912 | | | 530,912 | |
Prior-period gross
charge-offs | | — | | | — | | | — | | | — | | | — | | | — | | | — | | | — | |
| Consumer and other | | | | | | | | | | | | | | | | |
| Performing | | 104,399 | | | 91,557 | | | 45,187 | | | 34,928 | | | 24,040 | | | 93,833 | | | 6,890 | | | 400,834 | |
| Nonperforming | | 528 | | | 1,025 | | | 2,562 | | | 1,819 | | | 1,264 | | | 3,841 | | | — | | | 11,039 | |
| Total | | 104,927 | | | 92,582 | | | 47,749 | | | 36,747 | | | 25,304 | | | 97,674 | | | 6,890 | | | 411,873 | |
Prior-period gross
charge-offs | | 1,463 | | | 564 | | | 139 | | | 201 | | | 110 | | | 372 | | | 2 | | | 2,851 | |
| Total consumer type loans | | | | | | | | | | | | | | | | |
| Performing | | 302,936 | | | 592,185 | | | 444,525 | | | 180,412 | | | 105,945 | | | 320,420 | | | 535,329 | | | 2,481,752 | |
| Nonperforming | | 604 | | | 3,590 | | | 6,588 | | | 5,665 | | | 1,954 | | | 8,711 | | | 2,473 | | | 29,585 | |
| Total | | $ | 303,540 | | | $ | 595,775 | | | $ | 451,113 | | | $ | 186,077 | | | $ | 107,899 | | | $ | 329,131 | | | $ | 537,802 | | | $ | 2,511,337 | |
Prior-period gross
charge-offs | | 1,463 | | | 582 | | | 139 | | | 205 | | | 110 | | | 396 | | | 2 | | | 2,897 | |
Nonaccrual and Past Due Loans
The following tables represent an analysis of the aging by class of financing receivable as of December 31, 2024 and 2023:
| | | | | | | | | | | | | | | | | | | | | | | | | | | | | | | | | | |
| December 31, 2024 | | 30-89 days
past due and accruing
interest | | 90 days or
more and accruing
interest | | Nonaccrual
loans | | | | Loans current
on payments
and accruing
interest | | Total |
| Commercial and industrial | | $ | 1,204 | | | $ | 730 | | | $ | 9,661 | | | | | $ | 1,679,618 | | | $ | 1,691,213 | |
| Construction | | 3,288 | | | 538 | | | 10,915 | | | | | 1,072,991 | | | 1,087,732 | |
| Residential real estate: | | | | | | | | | | | | |
| 1-to-4 family mortgage | | 24,376 | | | 15,319 | | | 12,625 | | | | | 1,564,434 | | | 1,616,754 | |
| Residential line of credit | | 2,302 | | | 357 | | | 1,537 | | | | | 598,279 | | | 602,475 | |
| Multi-family mortgage | | 979 | | | — | | | 21 | | | | | 652,769 | | | 653,769 | |
| Commercial real estate: | | | | | | | | | | | | |
| Owner occupied | | 1,996 | | | 94 | | | 9,551 | | | | | 1,345,927 | | | 1,357,568 | |
| Non-owner occupied | | — | | | 3,512 | | | 2,667 | | | | | 2,092,950 | | | 2,099,129 | |
| Consumer and other | | 13,710 | | | 3,797 | | | 12,381 | | | | | 463,856 | | | 493,744 | |
| Total | | $ | 47,855 | | | $ | 24,347 | | | $ | 59,358 | | | | | $ | 9,470,824 | | | $ | 9,602,384 | |
FB Financial Corporation and subsidiaries
Notes to consolidated financial statements
(Dollar amounts are in thousands, except share and per share amounts)
| | | | | | | | | | | | | | | | | | | | | | | | | | | | | | | | | | |
| December 31, 2023 | | 30-89 days
past due and accruing
interest | | 90 days or
more and accruing
interest | | Nonaccrual
loans | | | | Loans current on payments and accruing interest | | Total |
| Commercial and industrial | | $ | 732 | | | $ | — | | | $ | 21,730 | | | | | $ | 1,698,271 | | | $ | 1,720,733 | |
| Construction | | 6,579 | | | 165 | | | 2,872 | | | | | 1,387,697 | | | 1,397,313 | |
| Residential real estate: | | | | | | | | | | | | |
| 1-to-4 family mortgage | | 21,768 | | | 9,355 | | | 6,718 | | | | | 1,530,711 | | | 1,568,552 | |
| Residential line of credit | | 2,464 | | | 1,337 | | | 1,136 | | | | | 525,975 | | | 530,912 | |
| Multi-family mortgage | | — | | | — | | | 32 | | | | | 603,772 | | | 603,804 | |
| Commercial real estate: | | | | | | | | | | | | |
| Owner occupied | | 480 | | | — | | | 3,188 | | | | | 1,228,403 | | | 1,232,071 | |
| Non-owner occupied | | 4,059 | | | — | | | 3,351 | | | | | 1,936,115 | | | 1,943,525 | |
| Consumer and other | | 10,961 | | | 1,836 | | | 9,203 | | | | | 389,873 | | | 411,873 | |
| Total | | $ | 47,043 | | | $ | 12,693 | | | $ | 48,230 | | | | | $ | 9,300,817 | | | $ | 9,408,783 | |
The following tables provide the amortized cost basis of loans on non-accrual status, as well as any related allowance as of December 31, 2024 and 2023 by class of financing receivable.
| | | | | | | | | | | | | | | | | | | | | | | | | | | | |
| | | | | |
| December 31, 2024 | | Nonaccrual
with no
related
allowance | | Nonaccrual
with
related
allowance | | Related
allowance | | Year to date Interest Income | | |
| Commercial and industrial | | $ | 5,294 | | | $ | 4,367 | | | $ | 2,177 | | | $ | 641 | | | |
| Construction | | 1,653 | | | 9,262 | | | 1,383 | | | 456 | | | |
| Residential real estate: | | | | | | | | | | |
| 1-to-4 family mortgage | | 1,562 | | | 11,063 | | | 211 | | | 57 | | | |
| Residential line of credit | | 148 | | | 1,389 | | | 26 | | | 69 | | | |
| Multi-family mortgage | | — | | | 21 | | | 1 | | | 1 | | | |
| Commercial real estate: | | | | | | | | | | |
| Owner occupied | | 6,415 | | | 3,136 | | | 137 | | | 144 | | | |
| Non-owner occupied | | 2,224 | | | 443 | | | 6 | | | 91 | | | |
| Consumer and other | | — | | | 12,381 | | | 646 | | | — | | | |
| Total | | $ | 17,296 | | | $ | 42,062 | | | $ | 4,587 | | | $ | 1,459 | | | |
| | | | | | | | | | | | | | | | | | | | | | | | | | | | |
| December 31, 2023 | | Nonaccrual
with no
related
allowance | | Nonaccrual
with
related
allowance | | Related
allowance | | Year to date Interest Income | | |
| | | | | | | | | | |
| Commercial and industrial | | $ | 3,678 | | | $ | 18,052 | | | $ | 5,011 | | | $ | 2,451 | | | |
| Construction | | 2,267 | | | 605 | | | 59 | | | 335 | | | |
| Residential real estate: | | | | | | | | | | |
| 1-to-4 family mortgage | | 1,444 | | | 5,274 | | | 103 | | | 410 | | | |
| Residential line of credit | | 685 | | | 451 | | | 8 | | | 141 | | | |
| Multi-family mortgage | | — | | | 32 | | | 1 | | | 3 | | | |
| Commercial real estate: | | | | | | | | | | |
| Owner occupied | | 2,920 | | | 268 | | | 15 | | | 514 | | | |
| Non-owner occupied | | 3,316 | | | 35 | | | 1 | | | 1,221 | | | |
| Consumer and other | | — | | | 9,203 | | | 498 | | | 1,053 | | | |
| Total | | $ | 14,310 | | | $ | 33,920 | | | $ | 5,696 | | | $ | 6,128 | | | |
Accrued interest receivable written off as an adjustment to interest income amounted to $706, $1,094, and $1,089 for the years ended December 31, 2024, 2023, and 2022, respectively.
FB Financial Corporation and subsidiaries
Notes to consolidated financial statements
(Dollar amounts are in thousands, except share and per share amounts)
Loan Modifications to Borrowers Experiencing Financial Difficulty
Occasionally, the Company may make certain modifications of loans to borrowers experiencing financial difficulty. These modifications may be in the form of an interest rate reduction, a term extension, principal forgiveness, payment deferral or a combination thereof. Upon the Company’s determination that a modified loan has subsequently been deemed uncollectible, the portion of the loan deemed uncollectible is charged off against the allowance for credit losses on loans HFI. The Company closely monitors the performance of the loans that are modified to borrowers experiencing financial difficulty to understand the effectiveness of its modification efforts. Tables within this section exclude loans that were paid off or are otherwise no longer in the loan portfolio as of period end.
The following table presents the amortized cost of FDM loans as of December 31, 2024 by class of financing receivable and type of concession granted that were modified during the year ended December 31, 2024.
| | | | | | | | | | | | | | | | | | | | | | | | | | | | | | | | | | | | | | |
Year Ended
December 31, 2024 | | Term extension | | Payment deferral and term extension | | Interest rate reduction and term extension | | Payment deferral, interest rate reduction, and term extension | | Total | | % of total class of financing receivables |
Commercial and
industrial | | $ | — | | | $ | 5,052 | | | $ | — | | | $ | — | | | $ | 5,052 | | | 0.3 | % |
| Construction | | — | | | — | | | — | | | 2,008 | | | 2,008 | | | 0.2 | % |
| Residential real estate: | | | | | | | | | | | | |
| 1-to-4 family mortgage | | — | | | 3,780 | | | — | | | — | | | 3,780 | | | 0.2 | % |
Residential line of
credit | | 28 | | | — | | | — | | | — | | | 28 | | | — | % |
| | | | | | | | | | | | |
| | | | | | | | | | | | |
| | | | | | | | | | | | |
| | | | | | | | | | | | |
| Consumer and other | | 36 | | | — | | | 97 | | | — | | | 133 | | | — | % |
| Total | | $ | 64 | | | $ | 8,832 | | | $ | 97 | | | $ | 2,008 | | | $ | 11,001 | | | 0.1 | % |
During the year ended December 31, 2023, the Company modified three residential mortgage loans with balances totaling $160 and one commercial and industrial loan with a balance of $181 in the form of term extensions for borrowers experiencing financial difficulties.
The following table describes the financial effect of the modifications made to borrowers experiencing financial difficultly:
| | | | | | | | | | | | | | | | | | | | |
Year Ended
December 31, 2024 | | Weighted average term extension
(in months) | | Weighted average payment deferral
(in months) | | Weighted average interest rate reduction |
| Commercial and industrial | | 12 | | 12 | | — |
| Construction | | 360 | | 5 | | 0.10% |
| Residential real estate: | | | | | | |
| 1-to-4 family mortgage | | 147 | | 4 | | — |
| Residential line of credit | | 120 | | — | | — |
| | | | | | |
| | | | | | |
| | | | | | |
| | | | | | |
| Consumer and other | | 25 | | — | | 1.49% |
During the year ended December 31, 2024, consumer and other loans of $30 defaulted that were previously modified in the prior 12 months by receiving a term extension. In addition, during the year ended December 31, 2024, 1-4 family mortgage residential real estate loans of $1,474 defaulted that were previously modified in the prior 12 months by receiving a combination of payment deferral and term extension. No financing receivables modified in the preceding twelve months had a payment default during the year ended December 31, 2023. For FDM loans, a subsequent payment default is defined as the earlier of the FDM loans being placed on non-accrual status or reaching 30 days past due with respect to principal and/or interest payments. At December 31, 2024, the Company had commitments to lend additional funds to borrowers whose loans were classified as an FDM loans of $1. There were no such commitments as of December 31, 2023.
The Company closely monitors the performance of the loans that are modified to borrowers experiencing financial difficulty to understand the effectiveness of its modification efforts. The table below depicts the performance of loans HFI as of December 31, 2024 made to borrowers experiencing financial difficulty that were modified in the prior twelve months.
FB Financial Corporation and subsidiaries
Notes to consolidated financial statements
(Dollar amounts are in thousands, except share and per share amounts)
| | | | | | | | | | | | | | | | | | | | | | | | | | | | | | | | |
| December 31, 2024 | | 30-89 days
past due and accruing
interest | | 90 days or
more and accruing
interest | | Nonaccrual loans(1) | | Loans current
on payments
and accruing
interest | | Total |
| Commercial and industrial | | $ | — | | | $ | — | | | $ | 5,052 | | | $ | — | | | $ | 5,052 | |
| Construction | | — | | | — | | | 2,008 | | | — | | | 2,008 | |
| Residential real estate: | | | | | | | | | | |
| 1-to-4 family mortgage | | — | | | 316 | | | — | | | 3,464 | | | 3,780 | |
| Residential line of credit | | — | | | — | | | — | | | 28 | | | 28 | |
| | | | | | | | | | |
| | | | | | | | | | |
| | | | | | | | | | |
| | | | | | | | | | |
| Consumer and other | | 14 | | | 16 | | | — | | | 103 | | | 133 | |
| Total | | $ | 14 | | | $ | 332 | | | $ | 7,060 | | | $ | 3,595 | | | $ | 11,001 | |
(1) Loans were on non-accrual when modified and subsequently classified as FDM.Collateral-Dependent Loans
For collateral-dependent loans, or those loans for which repayment is expected to be provided substantially through the operation or sale of collateral, where the borrower is also experiencing financial difficulty, the following tables present the loans by class of financing receivable.
| | | | | | | | | | | | | | | | | | | | | | | | | | | | | | | | |
| | December 31, 2024 |
| | Type of Collateral | | |
| | Real Estate | | Farmland | | | | Business Assets | | Total | | | | |
| Commercial and industrial | | $ | — | | | $ | — | | | | | $ | 8,492 | | | $ | 8,492 | | | | | |
| Construction | | 22,047 | | | 1,653 | | | | | — | | | 23,700 | | | | | |
| Residential real estate: | | | | | | | | | | | | | | |
| 1-to-4 family mortgage | | 1,843 | | | — | | | | | — | | | 1,843 | | | | | |
| Residential line of credit | | 148 | | | — | | | | | — | | | 148 | | | | | |
| Multi-family mortgage | | 9,919 | | | — | | | | | — | | | 9,919 | | | | | |
| Commercial real estate: | | | | | | | | | | | | | | |
| Owner occupied | | — | | | 6,415 | | | | | — | | | 6,415 | | | | | |
| Non-owner occupied | | 6,886 | | | — | | | | | — | | | 6,886 | | | | | |
| | | | | | | | | | | | | | |
| Total | | $ | 40,843 | | | $ | 8,068 | | | | | $ | 8,492 | | | $ | 57,403 | | | | | |
| | | | | | | | | | | | | | | | | | | | | | | | | | | | | | | | |
| | December 31, 2023 |
| | Type of Collateral | | |
| | Real Estate | | Farmland | | | | Business Assets | | Total | | | | |
| Commercial and industrial | | $ | — | | | $ | 363 | | | | | $ | 20,599 | | | $ | 20,962 | | | | | |
| Construction | | 8,224 | | | — | | | | | — | | | 8,224 | | | | | |
| Residential real estate: | | | | | | | | | | | | | | |
| 1-to-4 family mortgage | | 5,317 | | | — | | | | | — | | | 5,317 | | | | | |
| Residential line of credit | | 1,245 | | | — | | | | | — | | | 1,245 | | | | | |
| | | | | | | | | | | | | | |
| Commercial real estate: | | | | | | | | | | | | | | |
| Owner occupied | | 1,975 | | | 1,160 | | | | | — | | | 3,135 | | | | | |
| Non-owner occupied | | 3,316 | | | — | | | | | — | | | 3,316 | | | | | |
| Consumer and other | | 112 | | | — | | | | | — | | | 112 | | | | | |
| Total | | $ | 20,189 | | | $ | 1,523 | | | | | $ | 20,599 | | | $ | 42,311 | | | | | |
FB Financial Corporation and subsidiaries
Notes to consolidated financial statements
(Dollar amounts are in thousands, except share and per share amounts)
Allowance for Credit Losses on Loans HFI
The Company performed evaluations within its established qualitative framework, assessing the impact of the current economic outlook, including unemployment and gross domestic product, as well as macroeconomic events which may impact our loan portfolio, such as supply chain concerns and global conflicts. All qualitative adjustments are applied at the pool or segment level based on the perceived risk. Segments may be identified using credit quality ratings, loan-to-value, collateral type and purpose. The increase in the allowance for credit losses on loans HFI as of December 31, 2024 compared with December 31, 2023 is primarily the result of changes to the overall loan portfolio, including both growth and changes in portfolio composition, an increase in net charge-offs and slight deterioration in economic forecasts offset by reductions in construction lending.
The following tables provide the changes in the allowance for credit losses on loans HFI by class of financing receivable for the years ended December 31, 2024, 2023, and 2022:
| | | | | | | | | | | | | | | | | | | | | | | | | | | | | | | | | | | | | | | | | | | | | | | | | | | | | | | | | |
| | | Commercial
and industrial | | Construction | | 1-to-4
family
residential
mortgage | | Residential
line of credit | | Multi-family
residential
mortgage | | Commercial
real estate
owner
occupied | | Commercial
real estate
non-owner
occupied | | Consumer
and other | | Total | |
| |
| | | | | | | | | | | | | | | | | | | |
| | | | | | | | | | | | | | | | | | | |
| | | | | | | | | | | | | | | | | | | |
| | | | | | | | | | | | | | | | | | | |
| | | | | | | | | | | | | | | | | | | |
| | | | | | | | | | | | | | | | | | | |
| Year Ended December 31, 2024 | |
Beginning balance - December 31, 2023 | | $ | 19,599 | | | $ | 35,372 | | | $ | 26,505 | | | $ | 9,468 | | | $ | 8,842 | | | $ | 10,653 | | | $ | 22,965 | | | $ | 16,922 | | | $ | 150,326 | | |
| | | | | | | | | | | | | | | | | | | |
| | | | | | | | | | | | | | | | | | | |
Provision for (reversal of)
credit losses on loans
HFI | | 7,720 | | | (3,552) | | | (810) | | | 1,539 | | | 1,670 | | | 1,095 | | | 2,566 | | | 4,439 | | | 14,667 | | |
Recoveries of loans previously charged-off | | 428 | | | — | | | 84 | | | 18 | | | — | | | 245 | | | — | | | 939 | | | 1,714 | | |
| Loans charged off | | (11,080) | | | (122) | | | (439) | | | (73) | | | — | | | — | | | — | | | (3,051) | | | (14,765) | | |
| | | | | | | | | | | | | | | | | | | |
| | | | | | | | | | | | | | | | | | | |
Ending balance - December 31, 2024 | | $ | 16,667 | | | $ | 31,698 | | | $ | 25,340 | | | $ | 10,952 | | | $ | 10,512 | | | $ | 11,993 | | | $ | 25,531 | | | $ | 19,249 | | | $ | 151,942 | | |
| | | | | | | | | | | | | | | | | | | | | | | | | | | | | | | | | | | | | | | | | | | | | | | | | | | | | | | | | |
| | | Commercial
and industrial | | Construction | | 1-to-4
family
residential
mortgage | | Residential
line of credit | | Multi-family
residential
mortgage | | Commercial
real estate
owner
occupied | | Commercial
real estate
non-owner
occupied | | Consumer
and other | | Total | |
| |
| | | | | | | | | | | | | | | | | | | |
| | | | | | | | | | | | | | | | | | | |
| | | | | | | | | | | | | | | | | | | |
| | | | | | | | | | | | | | | | | | | |
| | | | | | | | | | | | | | | | | | | |
| Year Ended December 31, 2023 | | |
Beginning balance - December 31, 2022 | | $ | 11,106 | | | $ | 39,808 | | | $ | 26,141 | | | $ | 7,494 | | | $ | 6,490 | | | $ | 7,783 | | | $ | 21,916 | | | $ | 13,454 | | | $ | 134,192 | | |
| | | | | | | | | | | | | | | | | | | |
| | | | | | | | | | | | | | | | | | | |
Provision for (reversal of)
credit losses on loans
HFI | | 8,682 | | | (4,446) | | | 310 | | | 1,973 | | | 2,352 | | | 2,905 | | | (784) | | | 5,746 | | | 16,738 | | |
Recoveries of loans previously charged-off | | 273 | | | 10 | | | 100 | | | 1 | | | — | | | 109 | | | 1,833 | | | 573 | | | 2,899 | | |
| Loans charged off | | (462) | | | — | | | (46) | | | — | | | — | | | (144) | | | — | | | (2,851) | | | (3,503) | | |
| | | | | | | | | | | | | | | | | | | |
| | | | | | | | | | | | | | | | | | | |
Ending balance -
December 31, 2023 | | $ | 19,599 | | | $ | 35,372 | | | $ | 26,505 | | | $ | 9,468 | | | $ | 8,842 | | | $ | 10,653 | | | $ | 22,965 | | | $ | 16,922 | | | $ | 150,326 | | |
| | | | | | | | | | | | | | | | | | | | | | | | | | | | | | | | | | | | | | | | | | | | | | | | | | | | | | | | |
| | | Commercial
and industrial | | Construction | | 1-to-4
family
residential
mortgage | | Residential
line of credit | | Multi-family
residential
mortgage | | Commercial
real estate
owner
occupied | | Commercial
real estate
non-owner
occupied | | Consumer
and other | | Total |
| Year Ended December 31, 2022 | |
Beginning balance - December 31, 2021 | | $ | 15,751 | | | $ | 28,576 | | | $ | 19,104 | | | $ | 5,903 | | | $ | 6,976 | | | $ | 12,593 | | | $ | 25,768 | | | $ | 10,888 | | | $ | 125,559 | |
(Reversal of) provision for
credit losses on loans
HFI | | (4,563) | | | 11,221 | | | 7,060 | | | 1,574 | | | (486) | | | (4,883) | | | (3,584) | | | 4,054 | | | 10,393 | |
Recoveries of loans previously charged-off | | 2,005 | | | 11 | | | 54 | | | 17 | | | — | | | 88 | | | — | | | 766 | | | 2,941 | |
| Loans charged off | | (2,087) | | | — | | | (77) | | | — | | | — | | | (15) | | | (268) | | | (2,254) | | | (4,701) | |
Ending balance -
December 31, 2022 | | $ | 11,106 | | | $ | 39,808 | | | $ | 26,141 | | | $ | 7,494 | | | $ | 6,490 | | | $ | 7,783 | | | $ | 21,916 | | | $ | 13,454 | | | $ | 134,192 | |
FB Financial Corporation and subsidiaries
Notes to consolidated financial statements
(Dollar amounts are in thousands, except share and per share amounts)
Note (4)—Premises and equipment
Premises and equipment and related accumulated depreciation as of December 31, 2024 and 2023, are as follows:
| | | | | | | | | | | | | | |
| | | 2024 | | 2023 |
| Land | | $ | 36,790 | | | $ | 35,092 | |
| Premises | | 107,865 | | | 112,092 | |
| Furniture, fixtures and equipment | | 26,978 | | | 25,734 | |
| Leasehold improvements | | 32,029 | | | 28,271 | |
| Construction in process | | 2,628 | | | 4,943 | |
| Finance lease | | 1,145 | | | 1,256 | |
| | 207,435 | | | 207,388 | |
| Less: accumulated depreciation and amortization | | (58,536) | | | (51,657) | |
| Total premises and equipment | | $ | 148,899 | | | $ | 155,731 | |
Depreciation and amortization expense was $10,363, $9,797, and $7,554 for the years ended December 31, 2024, 2023, and 2022, respectively.
Note (5)—Other real estate owned
The amount reported as other real estate owned includes property acquired through foreclosure in addition to excess facilities held for sale and is carried at the lower of the carrying amount of the underlying loan or the fair value of the real estate less costs to sell. The following table summarizes the other real estate owned for the years ended December 31, 2024, 2023, and 2022:
| | | | | | | | | | | | | | | | | | | | | | | | |
| | | | Year Ended December 31, |
| | | | | | | 2024 | | 2023 | | 2022 |
| Balance at beginning of period | | | | | | $ | 3,192 | | | $ | 5,794 | | | $ | 9,777 | |
| Transfers from loans | | | | | | 3,458 | | | 2,736 | | | 1,437 | |
| Transfers to other assets | | | | | | — | | | (75) | | | — | |
| Transfers to premises and equipment | | | | | | — | | | — | | | (351) | |
| | | | | | | | | | |
| Proceeds from sale of other real estate owned | | | | | | (2,323) | | | (6,083) | | | (4,955) | |
| Gain on sale of other real estate owned | | | | | | 82 | | | 835 | | | 328 | |
| | | | | | | | | | |
| Write-downs and partial liquidations | | | | | | — | | | (15) | | | (442) | |
| Balance at end of period | | | | | | $ | 4,409 | | | $ | 3,192 | | | $ | 5,794 | |
Included within the other real estate owned balance above, foreclosed residential real estate properties totaled $2,880 and $2,414 as of December 31, 2024 and 2023, respectively.The recorded investment in residential mortgage loans secured by residential real estate properties for which foreclosure proceedings are in process totaled $7,652 and $3,377 as of December 31, 2024 and 2023, respectively.
Note (6)—Goodwill and intangible assets
Goodwill represents the excess of the cost of a business combination over the fair value of the net assets acquired. The carrying amount of goodwill was $242,561 at both December 31, 2024 and 2023.
The Company’s policy is to assess goodwill for impairment at the reporting unit level on an annual basis or more frequently, if an event occurs or circumstances change which indicate that the fair value of a reporting unit is below its carrying amount. Impairment is the condition that exists when the carrying amount of the reporting unit exceeds the fair value of that reporting unit. During the year ended December 31, 2024, the Company performed a qualitative assessment and determined it was more likely than not the fair value of the reporting units exceeded its carrying value, including goodwill. As such, no impairment of goodwill was recorded as of December 31, 2024.
FB Financial Corporation and subsidiaries
Notes to consolidated financial statements
(Dollar amounts are in thousands, except share and per share amounts)
Core deposit and other intangibles include core deposit intangibles and a customer base trust intangible. The composition of core deposit and other intangibles, which excludes fully amortized intangibles, as of December 31, 2024 and 2023 is as follows:
| | | | | | | | | | | | | | | | | | | | | | |
| | | Core deposit and other intangibles | | |
| | | Gross Carrying Amount | | Accumulated Amortization | | Net Carrying Amount | | |
| December 31, 2024 | | | | | | | | |
| Core deposit intangible | | $ | 59,835 | | | $ | (54,486) | | | $ | 5,349 | | | |
| Customer base trust intangible | | 1,600 | | | (1,187) | | | 413 | | | |
| | | | | | | | |
| Total core deposit and other intangibles | | $ | 61,435 | | | $ | (55,673) | | | $ | 5,762 | | | |
| | | | | | | | |
| December 31, 2023 | | | | | | | | |
| Core deposit intangible | | $ | 59,835 | | | $ | (51,699) | | | $ | 8,136 | | | |
| Customer base trust intangible | | 1,600 | | | (1,027) | | | 573 | | | |
| | | | | | | | |
| Total core deposit and other intangibles | | $ | 61,435 | | | $ | (52,726) | | | $ | 8,709 | | | |
Amortization of core deposit and other intangibles totaled $2,947, $3,659, and $4,585 for the years ended December 31, 2024, 2023, and 2022, respectively.
The estimated aggregate future amortization expense of core deposit and other intangibles is as follows:
| | | | | | | | | |
| 2025 | | $ | 2,306 | | |
| 2026 | | 1,563 | | |
| 2027 | | 1,080 | | |
| 2028 | | 572 | | |
| 2029 | | 211 | | |
| Thereafter | | 30 | | |
| | | $ | 5,762 | | |
FB Financial Corporation and subsidiaries
Notes to consolidated financial statements
(Dollar amounts are in thousands, except share and per share amounts)
Note (7)—Leases
As of December 31, 2024, the Company was the lessee in 47 operating leases and 1 finance lease of certain branch, mortgage and operations locations with original terms greater than one year.
Many leases include options to renew, with terms that can extend the lease up to an additional 20 years or more. Certain lease agreements contain provisions to periodically adjust rental payments for inflation. Renewal options that management is reasonably certain to renew and fixed rent escalations are included in the right-of-use asset and lease liability.
Information related to the Company’s leases is presented below as of December 31, 2024 and 2023:
| | | | | | | | | | | | | | | | | |
| | | | | |
| | | December 31, |
| Classification | | 2024 | | 2023 |
| Right-of-use assets: | | | | | |
| Operating leases | Operating lease right-of-use assets | | $ | 47,963 | | $ | 54,295 |
| Finance leases | Premises and equipment, net | | 1,145 | | 1,256 |
| Total right-of-use assets | | | $ | 49,108 | | $ | 55,551 |
| Lease liabilities: | | | | | |
| Operating leases | Operating lease liabilities | | $ | 60,024 | | $ | 67,643 |
| Finance leases | Borrowings | | 1,229 | | 1,326 |
| Total lease liabilities | | | $ | 61,253 | | $ | 68,969 |
Weighted average remaining lease term (in years) -
operating | | | 11.0 | | 11.6 |
Weighted average remaining lease term (in years) -
finance | | | 10.4 | | 11.4 |
| Weighted average discount rate - operating | | | 3.47 | % | | 3.39 | % |
| Weighted average discount rate - finance | | | 1.76 | % | | 1.76 | % |
The components of total lease expense included in the consolidated statements of income were as follows: | | | | | | | | | | | | | | | | | | | | | | | | | | | | |
| | | | | Years Ended December 31, |
| | | | | |
| Classification | | | | | | 2024 | | | | 2023 | | | 2022 |
| Operating lease costs: | | | | | | | | | | | | |
| Amortization of right-of-use asset | Occupancy and equipment | | | | | | $ | 6,962 | | | | $ | 8,516 | | | $ | 8,441 | |
| Short-term lease cost | Occupancy and equipment | | | | | | 371 | | | | 540 | | | 526 | |
| Variable lease cost | Occupancy and equipment | | | | | | 1,335 | | | | 1,205 | | | 1,078 | |
| | | | | | | | | | | | |
Loss on lease modifications and
terminations
| (1) | | | | | | — | | | | 1,770 | | | 346 | |
| Finance lease costs: | | | | | | | | | | | | |
| Interest on lease liabilities | Interest expense on borrowings | | | | | | 22 | | | | 24 | | | 28 | |
| Amortization of right-of-use asset | Occupancy and equipment | | | | | | 111 | | | | 111 | | | 120 | |
| | | | | | | | | | | | |
| Sublease income | Occupancy and equipment | | | | | | (522) | | | | (957) | | | (993) | |
| Total lease cost | | | | | | | $ | 8,279 | | | | $ | 11,209 | | | $ | 9,546 | |
(1) For the year ended December 31, 2023, amount is included in "Occupancy and equipment" related to the closure of two branch locations. For the year ended December 31, 2022, $364 was related to loss on lease modifications and terminations from vacating two locations included in "Mortgage restructuring expense" and $18 of gains on early lease terminations and modifications from other vacated locations included in "Occupancy and equipment".
The Company does not separate lease and non-lease components and instead elects to account for them as a single lease component. Variable lease cost primarily represents variable payments such as common area maintenance, utilities, and property taxes.
FB Financial Corporation and subsidiaries
Notes to consolidated financial statements
(Dollar amounts are in thousands, except share and per share amounts)
A maturity analysis of operating and finance lease liabilities and a reconciliation of cash flows to lease liabilities as of December 31, 2024 is as follows:
| | | | | | | | | | | |
| Operating | | Finance |
| Leases | | Lease |
| Lease payments due: | | | |
| December 31, 2025 | $ | 8,562 | | | $ | 121 | |
| December 31, 2026 | 8,309 | | | 123 | |
| December 31, 2027 | 7,849 | | | 125 | |
| December 31, 2028 | 6,957 | | | 127 | |
| December 31, 2029 | 5,897 | | | 129 | |
| Thereafter | 35,828 | | | 721 | |
| Total undiscounted future minimum lease payments | 73,402 | | | 1,346 | |
| Less: imputed interest | (13,378) | | | (117) | |
| Lease liabilities | $ | 60,024 | | | $ | 1,229 | |
Note (8)—Mortgage servicing rights
Changes in the Company’s mortgage servicing rights were as follows for the years ended December 31, 2024, 2023, and 2022:
| | | | | | | | | | | | | | | | | | | | |
| | | | Years Ended December 31, |
| | | | | | 2024 | | | 2023 | | 2022 | |
| | | | | | | | |
| | | | | | | | |
| Carrying value at beginning of period | | | | | $ | 164,249 | | | $ | 168,365 | | $ | 115,512 | |
| Capitalization | | | | | 4,984 | | | 7,192 | | 20,809 | |
| | | | | | | | |
| | | | | | | | |
| | | | | | | | |
| | | | | | | | |
| | | | | | | | |
| Change in fair value: | | | | | | | | |
| Due to payoffs/paydowns | | | | | (13,693) | | | (12,327) | | (16,012) | |
| Due to change in valuation inputs or assumptions | | | | | 6,498 | | | 1,019 | | 48,056 | |
| Carrying value at end of period | | | | | $ | 162,038 | | | $ | 164,249 | | $ | 168,365 | |
The following table summarizes servicing income and expense, which are included in mortgage banking income and other noninterest expense, respectively, in the consolidated statements of income for the years ended December 31, 2024, 2023, and 2022:
| | | | | | | | | | | | | | | | | | | | |
| | | | | Years Ended December 31, |
| | | | | | 2024 | | | 2023 | | 2022 | |
| | | | | | | | |
| Servicing income | | | | | $ | 29,212 | | | $ | 30,263 | | $ | 30,763 | |
| Change in fair value of mortgage servicing rights | | | | | (7,195) | | | (11,308) | | 32,044 | |
| Change in fair value of derivative hedging instruments | | | | | (9,083) | | | (4,918) | | (42,143) | |
| Servicing income | | | | | 12,934 | | | 14,037 | | 20,664 | |
| Servicing expenses | | | | | 7,642 | | | 8,093 | | 10,259 | |
| Net servicing income | | | | | $ | 5,292 | | | $ | 5,944 | | $ | 10,405 | |
FB Financial Corporation and subsidiaries
Notes to consolidated financial statements
(Dollar amounts are in thousands, except share and per share amounts)
Data and key economic assumptions, as well as the valuation's sensitivity to interest rate fluctuations, related to the Company’s mortgage servicing rights as of December 31, 2024 and 2023 are as follows:
| | | | | | | | | | | | | | |
| | | | |
| | December 31, |
| | | 2024 | | 2023 |
| Unpaid principal balance of mortgage loans sold and serviced for others | | $ | 10,235,048 | | | $ | 10,762,906 | |
| Weighted-average prepayment speed (CPR) | | 6.04 | % | | 6.19 | % |
| Estimated impact on fair value of a 10% increase | | $ | (4,213) | | | $ | (4,616) | |
| Estimated impact on fair value of a 20% increase | | $ | (8,168) | | | $ | (8,924) | |
| | | | |
| | | | |
| Discount rate | | 10.18 | % | | 9.62 | % |
| Estimated impact on fair value of a 100 bp increase | | $ | (7,515) | | | $ | (7,637) | |
| Estimated impact on fair value of a 200 bp increase | | $ | (14,397) | | | $ | (14,624) | |
| | | | |
| | | | |
| Weighted-average coupon interest rate | | 3.59 | % | | 3.47 | % |
| Weighted-average servicing fee (basis points) | | 27 | | 27 |
| Weighted-average remaining maturity (in months) | | 336 | | 334 |
The sensitivity calculations above are hypothetical changes and should not be considered to be predictive of future performance. Changes in fair value based on adverse changes in assumptions generally cannot be extrapolated because the relationship of the change in assumption to the change in fair value may not be linear. Also, the effect of an adverse variation in a particular assumption on the fair value of the mortgage servicing rights calculated without changing any other assumption, while in reality changes in one factor may result in changes in another, which may either magnify or counteract the effect of the change. The derivative instruments utilized by the Company, which were not included in the above sensitivities, would serve to offset the estimated impacts to fair value included in the table above. See Note 15, “Derivatives” for additional information on these derivative instruments.
As of December 31, 2024 and 2023, the Company held mortgage escrow deposits totaling $68,995 and $63,591, respectively, related to loans sold with servicing retained.
FB Financial Corporation and subsidiaries
Notes to consolidated financial statements
(Dollar amounts are in thousands, except share and per share amounts)
Note (9)—Other assets and other liabilities
Included in other assets are:
| | | | | | | | | | | | | | |
| | | As of December 31, |
| Other assets | | 2024 | | 2023 |
| Derivatives (See Note 15) | | 29,951 | | | 34,738 | |
| Equity securities without a readily determinable market value | | 23,459 | | | 25,191 | |
| Current income tax receivable | | 22,076 | | | 5,930 | |
| Deferred tax asset (See Note 12) | | 21,597 | | | 31,631 | |
| Mortgage lending receivable | | 20,971 | | | 16,344 | |
| Pledged collateral on derivative instruments | | 20,961 | | | 14,042 | |
| Equity method investment (See Note 2) | | 19,970 | | | — | |
| FHLB lender risk account receivable | | 19,926 | | | 20,258 | |
| Prepaid expenses | | 16,018 | | | 13,594 | |
| Software | | 1,388 | | | 525 | |
| Other assets | | 36,971 | | | 41,156 | |
| Total other assets | | $ | 233,288 | | | $ | 203,409 | |
Included in other liabilities are:
| | | | | | | | | | | | | | | |
| | | As of December 31, | |
| Other liabilities | | 2024 | | 2023 | |
| | | | | |
| Derivatives (See Note 15) | | 32,383 | | | 38,215 | | |
| | | | | |
| | | | | |
| Accrued payroll | | 26,901 | | | 18,406 | | |
| Accrued interest payable | | 24,182 | | | 18,809 | | |
| FHLB lender risk account guaranty | | 9,738 | | | 9,746 | | |
| Allowance for credit losses on unfunded commitments (See Note 14) | | 6,107 | | | 8,770 | | |
| Deferred compensation | | 2,328 | | | 2,152 | | |
| Mortgage buyback reserve (See Note 14) | | 697 | | | 899 | | |
| Other liabilities | | 40,268 | | | 45,625 | | |
| Total other liabilities | | $ | 142,604 | | | $ | 142,622 | | |
Note (10)—Deposits
As of December 31, 2024 and 2023, the aggregate amount of time deposits with a minimum denomination greater than $250 was $450,011 and $644,588, respectively.
At December 31, 2024, the scheduled maturities of time deposits are as follows:
| | | | | | | | |
| Scheduled maturities of time deposits | | |
| Due on or before: | | |
| December 31, 2025 | | $ | 1,543,869 | |
| December 31, 2026 | | 253,563 | |
| December 31, 2027 | | 41,021 | |
| December 31, 2028 | | 6,119 | |
| December 31, 2029 | | 4,715 | |
| Thereafter | | 7 | |
| Total | | $ | 1,849,294 | |
As of December 31, 2024 and 2023, the Company had $2,949 and $3,475, respectively, of deposit accounts in overdraft status and thus have been reclassified to loans on the accompanying consolidated balance sheets.
FB Financial Corporation and subsidiaries
Notes to consolidated financial statements
(Dollar amounts are in thousands, except share and per share amounts)
Note (11)—Borrowings
The Company has access to various sources of funds that allow for management of interest rate exposure and liquidity. The following table summarizes the Company's outstanding borrowings and weighted average interest rates as of December 31, 2024 and 2023:
| | | | | | | | | | | | | | | | | | | | | | | | | | |
| | Outstanding Balance | | Weighted Average Interest Rate |
| | December 31, | | December 31, |
| | 2024 | | | 2023 | | | 2024 | | | 2023 | |
Securities sold under agreements to repurchase
and federal funds purchased | | $ | 13,499 | | | $ | 108,764 | | | 0.20 | % | | 5.05 | % |
| | | | | | | | |
| Bank Term Funding Program | | — | | | 130,000 | | | — | % | | 4.85 | % |
| Subordinated debt, net | | 130,704 | | | 129,645 | | | 5.28 | % | | 5.52 | % |
| Other borrowings | | 32,586 | | | 22,555 | | | 0.07 | % | | 0.10 | % |
| Total | | $ | 176,789 | | | $ | 390,964 | | | | | |
| | | | | | | | |
| | | | | | | | |
| | | | | | | | |
Securities sold under agreements to repurchase and federal funds purchased
Securities sold under agreements to repurchase are financing arrangements that mature daily. Securities sold under agreements to repurchase totaled $13,499 and $19,328 as of December 31, 2024 and 2023, respectively. The weighted average interest rate of the Company's securities sold under agreements to repurchase was 0.20% and 1.60% as of December 31, 2024 and 2023, respectively. The fair value of securities pledged to secure repurchase agreements may decline. The Company manages this risk by having a policy to pledge securities valued at 100% of the outstanding balance of repurchase agreements.
The Bank maintains lines with certain correspondent banks that provide borrowing capacity in the form of federal funds purchased. Federal funds purchased are short-term borrowings that typically mature within one to ninety days. As of December 31, 2024 and 2023, the aggregate total borrowing capacity under these lines amounted to $370,000. As of December 31, 2023, borrowings against these lines (i.e., federal funds purchased) totaled $89,436 with a weighted average rate of 5.79%. There were no such borrowings outstanding as of December 31, 2024.
Information concerning securities sold under agreement to repurchase and federal funds purchased is summarized as follows:
| | | | | | | | | | | |
| December 31, 2024 | | December 31, 2023 |
| Balance at year end | $ | 13,499 | | | $ | 108,764 | |
| Average daily balance during the year | 21,339 | | | 29,860 | |
| Average interest rate during the year | 1.72 | % | | 2.24 | % |
| Maximum month-end balance during the year | $ | 78,228 | | | $ | 116,220 | |
| Weighted average interest rate at year-end | 0.20 | % | | 5.05 | % |
Federal Home Loan Bank Advances
As a member of the FHLB, the Company may utilize advances from the FHLB in order to provide additional liquidity and funding. Under these short-term agreements, the Company maintains a line of credit that as of December 31, 2024 and 2023 had total borrowing capacity of $1,397,905 and $1,757,702, respectively. As of December 31, 2024 and 2023, the Company had qualifying loans pledged as collateral securing these lines amounting to $2,608,687 and $3,014,023, respectively. There were no FHLB advances outstanding as of December 31, 2024 or December 31, 2023.
Information concerning FHLB advances as of or for the years ended December 31, 2024 and 2023 is summarized within the table below.
| | | | | | | | | | | |
| December 31, 2024 | | December 31, 2023 |
| Balance at year end | $ | — | | | $ | — | |
| Average daily balance during the year | — | | | 28,973 | |
| Average interest rate during the year | — | % | | 5.13 | % |
| Maximum month-end balance during the year | $ | — | | | $ | 125,000 | |
| Weighted average interest rate at year-end | — | % | | — | % |
FB Financial Corporation and subsidiaries
Notes to consolidated financial statements
(Dollar amounts are in thousands, except share and per share amounts)
Bank Term Funding Program
In March 2023, the Federal Reserve established the Bank Term Funding Program to make available funding to eligible depository institutions in order to help ensure they have the ability to meet the needs of their depositors following the March 2023 high-profile bank failures. The program allows for advances for up to one year secured by eligible high-quality securities at par value extended at the one-year overnight index swap rate, plus 10 basis points, as of the day the advance is made. The interest rate is fixed for the term of the advance and there are no prepayment penalties. The BTFP ceased extending new borrowings on March 11, 2024.
At December 31, 2023, the Company had outstanding borrowings of $130,000 under the BTFP at a borrowing rate of 4.85% and a maturity date of December 26, 2024. During the year ended December 31, 2024, we repaid the $130,000 borrowings in full. There were no such borrowings outstanding as of December 31, 2024.
Information concerning the BTFP as of or for the years ended December 31, 2024 and 2023 is summarized within the table below.
| | | | | | | | | | | |
| December 31, 2024 | | December 31, 2023 |
| Balance at year end | $ | — | | | $ | 130,000 | |
| Average daily balance during the year | 95,902 | | | 1,781 | |
| Average interest rate during the year | 4.86 | % | | 4.85 | % |
| Maximum month-end balance during the year | $ | 130,000 | | | $ | 130,000 | |
| Weighted average interest rate at year-end | — | % | | 4.85 | % |
Subordinated Debt
During the year ended December 31, 2003, two separate trusts were formed by the Company, which issued $9,000 and $21,000 of floating rate trust preferred securities as part of a pooled offering of such securities. The Company issued junior subordinated debentures of $9,280, which included proceeds of common securities purchased by the Company of $280, and junior subordinated debentures of $21,650, which included proceeds of common securities of $650. The trusts were created for the sole purpose of issuing 30-year capital trust preferred securities to fund the purchase of junior subordinated debentures issued by the Company. Both issuances were to the trusts in exchange for the proceeds of the securities offerings, which represent the sole asset of the trusts.
Additionally, during the year ended December 31, 2020, the Company placed $100,000 of ten year fixed-to-floating rate subordinated notes, maturing September 1, 2030. The Company mitigated interest rate exposure associated with these notes through the use of fair value hedging instruments. The fair value hedge matured during the year ended December 31, 2024. See Note 15, "Derivatives" for additional details related to these instruments.
Further information related to the Company's subordinated debt as of December 31, 2024 is detailed below:
| | | | | | | | | | | | | | | | | | | | |
| Name | Year Established | Maturity | Call Date | Total Debt Outstanding | Interest Rate | Coupon Structure |
| Subordinated Debt issued by Trust Preferred Securities: | | |
FBK Trust I (1) | 2003 | 06/09/2033 | 6/09/2008 | $ | 9,280 | | 7.84% | 3-month SOFR plus 3.51% |
FBK Trust II (1) | 2003 | 06/26/2033 | 6/26/2008 | 21,650 | | 7.74% | 3-month SOFR plus 3.41% |
| Additional Subordinated Debt: | | | | | |
FBK Subordinated Debt I(2) | 2020 | 09/01/2030 | 9/1/2025 | 100,000 | | 4.50% | Semi-annual Fixed (3) |
| Unamortized debt issuance costs | | (226) | | | |
| | | |
| Total Subordinated Debt, net | | | | $ | 130,704 | | | |
(1)The Company classifies $30,000 of the trusts' subordinated debt as Tier 1 capital. (2)The Company classifies the issuance, net of unamortized issuance costs as Tier 2 capital, which will be phased out 20% per year in the final five years before maturity. (3)Beginning on September 1, 2025 the coupon structure migrates to the 3-month SOFR plus a spread of 439 basis points through the end of the term of the debenture. |
FB Financial Corporation and subsidiaries
Notes to consolidated financial statements
(Dollar amounts are in thousands, except share and per share amounts)
Other Borrowings
As of December 31, 2024 and 2023, other borrowings included a finance lease liability amounting to $1,229 and $1,326, respectively. Additionally, as of December 31, 2024 and 2023, the Company had $31,357 and $21,229, respectively, of government guaranteed GNMA loans that meet certain defined delinquency rates under their contractual terms that were eligible for optional repurchase and recorded in both loans HFS and other borrowings.
See Note 7, “Leases” and Note 16, “Fair Value of financial instruments” for additional information regarding the Company's finance lease and guaranteed GNMA loans eligible for repurchase, respectively.
Note (12)—Income taxes
An allocation of federal and state income taxes between current and deferred portions is presented below: | | | | | | | | | | | | | | | | | | | | | | |
| | | | Years Ended December 31, |
| | | | | | 2024 | | | 2023 | | | 2022 | |
| Current | | | | | | $ | 32,382 | | | $ | 31,467 | | | $ | 22,451 | |
| Deferred | | | | | | (1,763) | | | (1,415) | | | 12,552 | |
| Total | | | | | | $ | 30,619 | | | $ | 30,052 | | | $ | 35,003 | |
The following table presents a reconciliation of federal income taxes at the statutory federal rate of 21% to the Company's effective tax rates for the years ended December 31, 2024, 2023, and 2022:
| | | | | | | | | | | | | | | | | | | | | | | | | | | | | | | | |
| | | | Years Ended December 31, |
| | | | | | 2024 | | | 2023 | | | 2022 | |
| Federal taxes calculated at statutory rate | | | | | | | $ | 30,801 | | 21.0 | % | | $ | 31,561 | | 21.0 | % | | $ | 33,510 | | 21.0 | % |
| (Decrease) increase resulting from: | | | | | | | | | | | | | | |
| State taxes, net of federal benefit | | | | | | | (404) | | (0.3) | % | | (158) | | (0.1) | % | | 3,845 | | 2.4 | % |
| Expense (benefit) from equity based compensation | | | | | | | 56 | | 0.0 | % | | 219 | | 0.1 | % | | (392) | | (0.2) | % |
| Municipal interest income, net of interest disallowance | | | | | | | (1,325) | | (0.9) | % | | (1,804) | | (1.2) | % | | (1,774) | | (1.1) | % |
| Bank-owned life insurance | | | | | | | (788) | | (0.5) | % | | (393) | | (0.3) | % | | (305) | | (0.2) | % |
| | | | | | | | | | | | | | |
| | | | | | | | | | | | | | |
| Section 162(m) limitation | | | | | | | 284 | | 0.2 | % | | 244 | | 0.2 | % | | 241 | | 0.1 | % |
| Nondeductible expenses | | | | | | | 2,029 | | 1.4 | % | | 384 | | 0.3 | % | | 326 | | 0.2 | % |
| Other | | | | | | | (34) | | — | % | | (1) | | — | % | | (448) | | (0.3) | % |
| Income tax expense, as reported | | | | | | | $ | 30,619 | | 20.9 | % | | $ | 30,052 | | 20.0 | % | | $ | 35,003 | | 21.9 | % |
The Company is subject to Internal Revenue Code Section 162(m), which limits the deductibility of compensation paid to certain individuals. It is the Company’s policy to apply the Section 162(m) limitations to stock-based compensation first followed by cash compensation. As a result of the vesting of this stock-based compensation and cash compensation paid to date, the Company has disallowed a portion of its compensation paid to the applicable individuals.
FB Financial Corporation and subsidiaries
Notes to consolidated financial statements
(Dollar amounts are in thousands, except share and per share amounts)
The components of the deferred tax assets and liabilities at December 31, 2024 and 2023, are as follows:
| | | | | | | | | | | | | | |
| | December 31, |
| | | 2024 | | | 2023 | |
| Deferred tax assets: | | | | |
| Allowance for credit losses | | $ | 39,155 | | | $ | 39,228 | |
| Operating lease liabilities | | 21,864 | | | 24,607 | |
| Net operating loss | | 523 | | | 805 | |
| Amortization of core deposit intangibles | | 1,482 | | | 1,135 | |
| Deferred compensation | | 10,372 | | | 7,433 | |
| Unrealized loss on debt securities | | 36,766 | | | 48,714 | |
| Other assets | | 5,616 | | | 4,863 | |
| Subtotal | | 115,778 | | | 126,785 | |
| Deferred tax liabilities: | | | | |
| FHLB stock dividends | | $ | (252) | | | $ | (263) | |
| Operating leases - right of use assets | | (19,252) | | | (21,312) | |
| Depreciation | | (8,117) | | | (5,996) | |
| | | | |
| Unrealized gain on equity securities | | (948) | | | (2,122) | |
| Unrealized gain on cash flow hedges | | — | | | (151) | |
| | | | |
| Mortgage servicing rights | | (42,221) | | | (42,797) | |
| Goodwill | | (20,121) | | | (17,995) | |
| Other liabilities | | (3,270) | | | (4,518) | |
| Subtotal | | (94,181) | | | (95,154) | |
| Net deferred tax assets | | $ | 21,597 | | | $ | 31,631 | |
The Company had a net operating loss carryforward generated as a result of a previous merger amounting to $2,491 and $3,835 as of December 31, 2024 and 2023, respectively. The net operating loss carryforward can be used to offset taxable income in future periods and reduce income tax liabilities in those future periods. While net operating losses are subject to certain annual utilization limits under Section 382, the Company believes the net operating loss carryforwards will be realized based on the projected annual limitation and the length of the net operating loss carryover period. The Company's determination of the realization of the net deferred tax asset is based on its assessment of all available positive and negative evidence. The net operating loss carryforward will begin to expire in 2029.
The Company and its subsidiaries file income tax returns in the U.S. federal jurisdiction and various state jurisdictions. The Company is generally no longer subject to U.S. federal and state income tax examinations by tax authorities for tax years before 2021.
Note (13)—Dividend restrictions
Due to regulations of the Tennessee Department of Financial Institutions, the Bank may not declare dividends in any calendar year that exceeds the total of its net income of that year combined with its retained net income of the preceding two years without the prior approval of the TDFI Commissioner. Based upon this regulation, $185,927 and $218,415 was available for payment of dividends without such prior approval as of December 31, 2024 and 2023, respectively.
In addition, dividends paid by the Bank to the Company would be prohibited if the effect thereof would cause the Bank’s capital to be reduced below applicable minimum capital requirements.
There were $61,500, $49,000, and $49,000 in cash dividends paid from the Bank to the Company during the years ended December 31, 2024, 2023, and 2022, respectively. Additionally, during the year ended December 31, 2024, the Bank declared noncash dividends to the Company consisting of equity securities amounting to $21,700. No such noncash dividend was declared during the years ended December 31, 2023 and 2022.
FB Financial Corporation and subsidiaries
Notes to consolidated financial statements
(Dollar amounts are in thousands, except share and per share amounts)
Note (14)—Commitments and contingencies
Commitments to extend credit and letters of credit
The Company issues certain financial instruments to meet customer financing needs, including loan commitments, credit lines and letters of credit. The agreements associated with these type of unfunded loan commitments provide credit or support the credit of others, as long as conditions established in the contract are met, and usually have expiration dates.
The same credit and underwriting policies the Company uses to evaluate and underwrite loans are also used to originate unfunded loan commitments, including obtaining collateral at exercise of the commitment. These unfunded loan commitments are only recorded in the consolidated financial statements when drawn upon and many expire without being used. The Company’s maximum off-balance sheet exposure to credit loss from these unfunded loan commitments is represented by the contractual amount of these instruments.
| | | | | | | | | | | | | | |
| | | | |
| | December 31, |
| | | 2024 | | | 2023 | |
| Commitments to extend credit, excluding interest rate lock commitments | | $ | 2,770,105 | | | $ | 2,906,016 | |
| Letters of credit | | 69,855 | | | 77,055 | |
| Balance at end of period | | $ | 2,839,960 | | | $ | 2,983,071 | |
As of December 31, 2024 and 2023, unfunded loan commitments included above with floating interest rates totaled $2,573,218 and $2,459,669, respectively.
As part of the credit loss process, the Company estimates expected credit losses on its unfunded loan commitments under the CECL methodology. When applying this methodology, the Company considers the likelihood that funding will occur, the contractual period of exposure to credit loss, the risk of loss, historical loss experience, and current conditions along with expectations of future economic conditions.
The table below presents activity within the allowance for credit losses on unfunded loan commitments included in accrued expenses and other liabilities on the Company’s consolidated balance sheets:
| | | | | | | | | | | | | | | | | | | | |
| | | | Years Ended December 31, |
| | | | | 2024 | | | 2023 | | 2022 | |
| Balance at beginning of period | | | | | $ | 8,770 | | | $ | 22,969 | | $ | 14,380 | |
| | | | | | | | |
| | | | | | | | |
| (Reversal of) provision for credit losses on unfunded commitments | | | | | (2,663) | | | (14,199) | | 8,589 | |
| Balance at end of period | | | | | $ | 6,107 | | | $ | 8,770 | | $ | 22,969 | |
Loan repurchases or indemnifications
In connection with the sale of mortgage loans to third-party private investors or government sponsored agencies, the Company makes representations and warranties as to the propriety of its origination activities, which are typical and customary to these types of transactions. Occasionally, investors require the Company to repurchase loans sold to them or otherwise indemnify the investor against certain losses under the terms of the warranties. When the Company is required to repurchase the loans, the loans are recorded at fair value in loans HFI. The total principal amount of loans repurchased (or indemnified for) was $6,181, $8,552 and $7,834 for the years ended December 31, 2024, 2023, and 2022, respectively.
The Company maintains a reserve associated with potential losses on loans previously sold included in accrued expenses and other liabilities on the Company's consolidated balance sheets. The following table summarizes this activity:
| | | | | | | | | | | | | | | | | | | | | |
| | | | Years Ended December 31, |
| | | | | | | 2024 | | | 2023 | | 2022 | |
| Balance at beginning of period | | | | | | $ | 899 | | | $ | 1,621 | | $ | 4,802 | |
| Provision for (reversal of) loan repurchases or indemnifications | | | | | | 235 | | | (650) | | (2,989) | |
| | | | | | | | | |
| Losses on loans repurchased or indemnified | | | | | | (437) | | | (72) | | (192) | |
| Balance at end of period | | | | | | $ | 697 | | | $ | 899 | | $ | 1,621 | |
| | | | | | | | | |
Legal Proceedings
Various legal claims arise from time to time in the normal course of business, which, in the opinion of management, will not have a material effect on the Company’s consolidated financial statements.
FB Financial Corporation and subsidiaries
Notes to consolidated financial statements
(Dollar amounts are in thousands, except share and per share amounts)
Note (15)—Derivatives
The Company utilizes derivative financial instruments as part of its ongoing efforts to manage its interest rate risk exposure as well as interest rate exposure for its customers. Derivative financial instruments are included in the consolidated balance sheet line items other assets or other liabilities at fair value in accordance with ASC 815, “Derivatives and Hedging.” See Note 1, “Basis of presentation and summary of significant accounting policies,” for additional information on the Company’s accounting policies related to derivative instruments and hedging activities.
Derivatives designated as fair value hedges
The Company enters into fair value hedging relationships using interest rates swaps to mitigate the Company’s exposure to losses in market value as interest rates change. Derivative instruments that are used as part of the Company’s interest rate risk management strategy include interest rate swaps that relate to pricing of specific balance sheet assets and liabilities. Interest rate swaps generally involve the exchange of fixed and variable rate interest payments between two parties, based on a common notional principal amount and maturity date. The critical terms of the interest rate swaps match the terms of the corresponding hedged items. All components of each derivative instrument’s gain or loss are included in the assessment of hedge effectiveness. Any initial and ongoing assessment of expected hedge effectiveness is based on regression analysis.
At December 31, 2023, the Company had interest rate swaps designated as fair value hedges to convert fixed rate money market deposits to variable with notional values totaling $200,000 and market values totaling $(4,497) recorded in other liabilities on the consolidated balance sheets. Additionally at December 31, 2023, the Company had an interest rate swap designated as a fair value hedge on subordinated debt with a notional value of $100,000 and market value of $(673) recorded in other liabilities on the consolidated balance sheets. At December 31, 2024, the Company did not have any interest rate swaps that were designated as fair value hedges.
During the year ended December 31, 2024, the Company terminated interest rate swaps that were designated as fair value hedges on fixed rate money market deposits with notional values of $200,000. Additionally, during the year ended December 31, 2024 the Company held a swap agreement designated as a fair value hedge covering subordinated debt with notional value of $100,000 that matured.
The following discloses the total amount of expense included in interest expense on deposits and borrowings, related to the Company's fair value hedging instruments:
| | | | | | | | | | | | | | | | | | |
| | | Years Ended December 31, |
| | | | | 2024 | | 2023 | 2022 |
| Designated fair value hedge: | | | | | | | | |
| Interest expense on deposits | | | | | $ | (4,588) | | | $ | (7,176) | | $ | (717) | |
| Interest expense on borrowings | | | | | (645) | | | (3,630) | | (395) | |
| Total | | | | | $ | (5,233) | | | $ | (10,806) | | $ | (1,112) | |
During the year ended December 31, 2024, amortization expense totaling $4,588 related to the terminated fair value hedges was recognized as an increase to interest expense on deposits. As of December 31, 2024, there is no remaining fair value adjustment related to the terminated fair value hedges included in money market and savings deposits on the consolidated balance sheets.
The following amounts were recorded on the balance sheet related to cumulative adjustments of fair value hedges as of December 31, 2023:
| | | | | | | | | | | | | | | | | |
| | | December 31, 2023 |
| Line item on the balance sheet | | | Carrying amount of the hedged item | | Cumulative decrease in fair value hedging adjustment included in the carrying amount of the hedged item |
| Money market and savings deposits | | | $ | 198,143 | | (1) | $ | (4,497) | |
| Borrowings | | | 98,715 | | (2) | (673) | |
| Total | | | $ | 296,858 | | | $ | (5,170) | |
(1) The carrying value also includes an unaccreted purchase accounting fair value premium of $2,640 as of December 31, 2023.
(2) The carrying value also includes unamortized subordinated debt issuance costs of $612 as of December 31, 2023.
FB Financial Corporation and subsidiaries
Notes to consolidated financial statements
(Dollar amounts are in thousands, except share and per share amounts)
Derivatives designated as cash flow hedges
The Company enters into cash flow hedging relationships using interest rate swaps to mitigate the exposure to the variability in future cash flows or other forecast transactions associated with its floating rate assets and liabilities. The Company uses interest rate swap agreements to hedge the repricing characteristics of its floating rate subordinated debt. All components of each derivative instrument’s gain or loss are included in the assessment of hedge effectiveness. Any initial and ongoing assessment of expected hedge effectiveness is based on regression analysis. The ongoing periodic measures of hedge ineffectiveness are based on the expected change in cash flows of the hedged item caused by changes in the benchmark interest rate.
At December 31, 2023, the Company had interest rate swaps designated as cash flow hedges on subordinated debt with notional values totaling $30,000 and market values totaling $579 recorded in other assets on the consolidated balance sheets. At December 31, 2024, the Company did not have any interest rate swaps that were designated as cash flow hedges.
During the year ended December 31, 2024, the interest rate swaps that were designated as cash flow hedges covering subordinated debt with notional amounts of $30,000 matured.
The Company’s consolidated statements of income included income of $517 and $985 for the years ended December 31, 2024 and 2023, respectively, and expense of $93 for the year ended December 31, 2022, in interest expense on borrowings related to these cash flow hedges. The cash flow hedges were highly effective during the periods presented and as a result qualified for hedge accounting treatment. As such, no amounts were reclassified from accumulated other comprehensive loss into earnings as a result of hedge ineffectiveness during any period presented.
The following discloses the amount included in other comprehensive income (loss), net of tax, for derivative instruments designated as cash flow hedges for the periods presented:
| | | | | | | | | | | | | | | | | | | | | |
| | | | Years Ended December 31, |
| | | | | | 2024 | | 2023 | 2022 |
Amount of (loss) gain recognized in other comprehensive income (loss), net of tax (benefit) expense of $(151), $(176) and $532 | | | | | | $ | (428) | | | $ | (500) | | $ | 1,508 | |
Derivatives not designated as hedging instruments
Derivatives not designated under hedge accounting rules include those that are entered into as either economic hedges as part of the Company’s overall risk management strategy or to facilitate client needs. Economic hedges are those that are not designated as a fair value or cash flow hedge for accounting purposes but are necessary to economically manage the risk exposure associated with the assets and liabilities of the Company.
The Company enters into derivative instruments to help its commercial customers manage their exposure to interest rate fluctuations. To mitigate the interest rate risk associated with customer contracts, the Company enters into an offsetting derivative contract. The Company manages its credit risk, or potential risk of default by its commercial customers through credit limit approval and monitoring procedures.
The Company enters into interest rate-lock commitments on residential loan commitments that will be held for resale. These are considered derivative instruments with no hedge accounting designation, and the interest rate exposure on these commitments is economically hedged primarily with forward contracts. Gains and losses arising from changes in the valuation of the interest rate-lock commitments are recognized currently in earnings and are reflected under the line-item mortgage banking income in the consolidated statements of income.
The Company also enters into forwards, futures and option contracts to economically hedge the change in fair value of mortgage servicing rights. Gains and losses associated with these instruments are included in earnings and are reflected under the line-item mortgage banking income in the consolidated statements of income.
FB Financial Corporation and subsidiaries
Notes to consolidated financial statements
(Dollar amounts are in thousands, except share and per share amounts)
The following tables provide details on the Company’s non-designated derivative financial instruments as of the dates presented: | | | | | | | | | | | | | | | | | | | | | |
| | December 31, 2024 | |
| | Notional Amount | | Asset | | Liability | |
| | | | | | | |
| Interest rate contracts | | $ | 565,152 | | | $ | 29,298 | | | $ | 29,377 | | |
| Forward commitments | | 140,000 | | | 6 | | | — | | |
| Interest rate-lock commitments | | 65,687 | | | 647 | | | — | | |
| Futures contracts | | 217,000 | | | — | | | 3,006 | | |
| | | | | | | |
| Total | | $ | 987,839 | | | $ | 29,951 | | | $ | 32,383 | | |
| | | | | | | | | | | | | | | | | | | | |
| | | December 31, 2023 |
| | | Notional Amount | | Asset | | Liability |
| | | | | | |
| Interest rate contracts | | $ | 569,865 | | | $ | 32,179 | | | $ | 32,184 | |
| Forward commitments | | 159,000 | | | — | | | 861 | |
| Interest rate-lock commitments | | 69,217 | | | 1,203 | | | — | |
| Futures contracts | | 254,000 | | | 777 | | | — | |
| | | | | | |
| Total | | $ | 1,052,082 | | | $ | 34,159 | | | $ | 33,045 | |
(Losses) gains included in the consolidated statements of income related to the Company’s non-designated derivative financial instruments were as follows:
| | | | | | | | | | | | | | | | | | |
| | | | Years Ended December 31, |
| | | | | | | 2024 | | 2023 | | 2022 | |
| Included in mortgage banking income: | | | | | | | | |
| Interest rate lock commitments | | | | | | $ | (556) | | $ | (230) | | $ | (5,764) | |
| Forward commitments | | | | | | (546) | | 953 | | 55,804 | |
| Futures contracts | | | | | | (7,670) | | (3,366) | | (36,381) | |
| Option contracts | | | | | | — | | (1,125) | | 36 | |
| Total | | | | | | $ | (8,772) | | $ | (3,768) | | $ | 13,695 | |
Netting of Derivative Instruments
Certain financial instruments, including derivatives, may be eligible for offset on the consolidated balance sheets when the “right of offset” exists or when the instruments are subject to an enforceable master netting agreement, which includes the right of the non-defaulting party or non-affected party to offset recognized amounts, including collateral posted with the counterparty, to determine a net receivable or net payable upon early termination of the agreement. Certain of the Company’s derivative instruments are subject to master netting agreements, however the Company has not elected to offset such financial instruments on the consolidated balance sheets. The following table presents the Company’s gross derivative positions as recognized on the consolidated balance sheets as well as the net derivative positions, including collateral pledged to the extent the application of such collateral did not reduce the net derivative liability position below zero, had the Company elected to offset those instruments subject to an enforceable master netting agreement:
| | | | | | | | | | | | | | | | | | | | | | | | | | | | | | | | | | | | | | |
| | | | | | | | |
| | | | | | | | | | | | |
| | | | | | | | | | | | |
| | | | | | | | | | | | |
| | | | | | | | | | | | |
| | | | | | | | | | | | |
| | | | | | | | | | | | |
| | | | | | | | | | | | |
| | | | | | | | | | | | |
| | | | | | | | | | | | |
| | | | | | | | | | | | |
| | | | | | | | Gross amounts not offset on the consolidated balance sheets | | |
| | Gross amounts recognized | | Gross amounts offset on the consolidated balance sheets | | Net amounts presented on the consolidated balance sheets | | Financial instruments | | Financial collateral pledged | | Net Amount |
| December 31, 2024 | | | | | | | | | | | | |
| Derivative financial assets | | $ | 28,379 | | | $ | — | | | $ | 28,379 | | | $ | 1,030 | | | $ | — | | | $ | 27,349 | |
| Derivative financial liabilities | | $ | 9,144 | | | $ | — | | | $ | 9,144 | | | $ | 1,030 | | | $ | 8,114 | | | $ | — | |
| | | | | | | | | | | | |
| December 31, 2023 | | | | | | | | | | | | |
| Derivative financial assets | | $ | 31,468 | | | $ | — | | | $ | 31,468 | | | $ | 6,502 | | | $ | — | | | $ | 24,966 | |
| Derivative financial liabilities | | $ | 11,330 | | | $ | — | | | $ | 11,330 | | | $ | 6,502 | | | $ | 4,828 | | | $ | — | |
FB Financial Corporation and subsidiaries
Notes to consolidated financial statements
(Dollar amounts are in thousands, except share and per share amounts)
Collateral Requirements
Most derivative contracts with customers are secured by collateral. Additionally, in accordance with the interest rate agreements with derivative counterparties, the Company may be required to post collateral with these derivative counterparties. As of December 31, 2024 and 2023, the Company had collateral posted of $20,961 and $14,042, respectively, against its obligations under these agreements. Cash pledged as collateral on derivative contracts is recorded in other assets on the consolidated balance sheets.
Note (16)—Fair value of financial instruments
FASB ASC 820-10 defines fair value as the exchange price that would be received for an asset or paid to transfer a liability (exit price) in the principal or most advantageous market for the asset or liability in an orderly transaction between market participants on the measurement date. ASC 820-10 also establishes a framework for measuring the fair value of assets and liabilities according to a hierarchy that prioritizes the inputs to valuation techniques used to measure fair value into three broad levels. The fair value hierarchy gives the highest priority to quoted prices in active markets for identical assets and liabilities (Level 1) and the lowest priority to unobservable inputs (Level 3). The hierarchy maximizes the use of observable inputs and minimizes the use of unobservable inputs by requiring that the most observable inputs be used when available. Observable inputs are inputs that market participants would use in pricing the asset or liability based on market data obtained from sources independent of the Company. Unobservable inputs are inputs that are derived from assumptions based on management’s estimate of assumptions that market participants would use in pricing the asset or liability based on the best information available under the circumstances.
The hierarchy is broken down into the following three levels, based on the reliability of inputs:
Level 1: Unadjusted quoted prices in active markets for identical assets or liabilities that are accessible at the measurement date.
Level 2: Significant other observable inputs other than Level 1 prices, such as quoted prices for similar assets or liabilities, quoted prices in markets that are not active or other inputs that are observable or can be corroborated by observable market data.
Level 3: Significant unobservable inputs for assets or liabilities that are derived from assumptions based on management’s estimate of assumptions that market participants would use in pricing the assets or liabilities.
FB Financial Corporation and subsidiaries
Notes to consolidated financial statements
(Dollar amounts are in thousands, except share and per share amounts)
The Company records the fair values of financial assets and liabilities on a recurring and nonrecurring basis using the following methods and assumptions:
| | | | | | |
| Investment securities | | Investment securities are recorded at fair value on a recurring basis. Fair values for securities are based on quoted market prices, where available. If quoted prices are not available, fair values are based on quoted market prices of similar instruments or are determined by matrix pricing, which is a mathematical technique widely used in the industry to value debt securities without relying exclusively on quoted prices for the specific securities but rather by relying on the pricing relationship or correlation among other benchmark quoted securities. Investment securities valued using quoted market prices of similar instruments or that are valued using matrix pricing are classified as Level 2. |
| | |
| Loans held for sale | | Mortgage loans held for sale are carried at fair value determined using current secondary market prices for loans with similar characteristics, that is, using Level 2 inputs. |
| | |
| Derivatives | | The fair value of the Company's interest rate swap agreements to facilitate customer transactions are based upon fair values provided from entities that engage in interest rate swap activity and is based upon projected future cash flows and interest rates. The fair value of interest rate lock commitments associated with the mortgage pipeline is based on fees currently charged to enter into similar agreements, and for fixed-rate commitments, the difference between current levels of interest rates and the committed rates is also considered. The fair values of the Company's designated cash flow and fair value hedges are determined by calculating the difference between the discounted fixed rate cash flows and the discounted variable rate cash flows. The fair values of both the Company's hedges, including designated cash flow hedges and designated fair value hedges are based on pricing models that utilize observable market inputs. These financial instruments are classified as Level 2. |
| | |
| OREO | | OREO is comprised of properties obtained in partial or total satisfaction of loan obligations and excess land and facilities held for sale. OREO acquired in settlement of indebtedness is recorded at the lower of the carrying amount of the loan or the fair value of the real estate less costs to sell. Fair value is determined on a nonrecurring basis based on appraisals by qualified licensed appraisers and is adjusted for management’s estimates of costs to sell and holding period discounts. OREO valuations are classified as Level 3. |
| | |
| Mortgage servicing rights | | MSRs are carried at fair value. Fair value is determined using an income approach with various assumptions including expected cash flows, market discount rates, prepayment speeds, servicing costs, and other factors. As such, MSRs are considered Level 3. |
| | |
| Collateral- dependent loans | | Collateral-dependent loans are loans for which, based on current information and events, the Company has determined foreclosure of the collateral is probable, or where the borrower is experiencing financial difficulty and the Company expects repayment of the loan to be provided substantially through the operation or sale of the collateral and it is probable that the creditor will be unable to collect all amounts due according to the contractual terms of the loan agreement. Collateral-dependent loans are classified as Level 3. |
FB Financial Corporation and subsidiaries
Notes to consolidated financial statements
(Dollar amounts are in thousands, except share and per share amounts)
The balances and levels of the assets and liabilities measured at fair value on a recurring basis as of December 31, 2024 and 2023 are presented in the following tables:
| | | | | | | | | | | | | | | | | | | | | | | | | | |
| At December 31, 2024 | | Quoted prices
in active
markets for
identical assets
(liabilities)
(level 1) | | Significant
other
observable
inputs
(level 2) | | Significant unobservable
inputs
(level 3) | | Total |
| Recurring valuations: | | | | | | | | |
| Financial assets: | | | | | | | | |
| AFS debt securities: | | | | | | | | |
| U.S. government agency securities | | $ | — | | | $ | 563,007 | | | $ | — | | | $ | 563,007 | |
| Mortgage-backed securities - residential | | — | | | 810,999 | | | — | | | 810,999 | |
| Mortgage-backed securities - commercial | | — | | | 14,857 | | | — | | | 14,857 | |
| Municipal securities | | — | | | 147,857 | | | — | | | 147,857 | |
| U.S. Treasury securities | | — | | | 299 | | | — | | | 299 | |
| Corporate securities | | — | | | 989 | | | — | | | 989 | |
| | | | | | | | |
| Total securities | | $ | — | | | $ | 1,538,008 | | | $ | — | | | $ | 1,538,008 | |
| Loans held for sale, at fair value | | $ | — | | | $ | 95,403 | | | $ | — | | | $ | 95,403 | |
| Mortgage servicing rights | | — | | | — | | | 162,038 | | | 162,038 | |
| Derivatives | | — | | | 29,951 | | | — | | | 29,951 | |
| Financial Liabilities: | | | | | | | | |
| Derivatives | | — | | | 32,383 | | | — | | | 32,383 | |
| | | | | | | | | | | | | | | | | | | | | | | | | | |
| At December 31, 2023 | | Quoted prices
in active
markets for
identical assets
(liabilities)
(level 1) | | Significant
other
observable
inputs
(level 2) | | Significant unobservable
inputs
(level 3) | | Total |
| Recurring valuations: | | | | | | | | |
| Financial assets: | | | | | | | | |
| AFS debt securities: | | | | | | | | |
| U.S. government agency securities | | $ | — | | | $ | 203,956 | | | $ | — | | | $ | 203,956 | |
| Mortgage-backed securities - residential | | — | | | 896,971 | | | — | | | 896,971 | |
| Mortgage-backed securities - commercial | | — | | | 16,961 | | | — | | | 16,961 | |
| Municipal securities | | — | | | 242,263 | | | — | | | 242,263 | |
| U.S. Treasury securities | | — | | | 108,496 | | | — | | | 108,496 | |
| Corporate securities | | — | | | 3,326 | | | — | | | 3,326 | |
| | | | | | | | |
| Total securities | | $ | — | | | $ | 1,471,973 | | | $ | — | | | $ | 1,471,973 | |
| Loans held for sale, at fair value | | $ | — | | | $ | 46,618 | | | $ | — | | | $ | 46,618 | |
| Mortgage servicing rights | | — | | | — | | | 164,249 | | | 164,249 | |
| Derivatives | | — | | | 34,738 | | | — | | | 34,738 | |
| Financial Liabilities: | | | | | | | | |
| Derivatives | | — | | | 38,215 | | | — | | | 38,215 | |
FB Financial Corporation and subsidiaries
Notes to consolidated financial statements
(Dollar amounts are in thousands, except share and per share amounts)
The balances and levels of the assets measured at fair value on a nonrecurring basis as of December 31, 2024 and 2023 are presented in the following tables:
| | | | | | | | | | | | | | | | | | | | | | | | | | | | | | |
| At December 31, 2024 | | Quoted prices
in active
markets for
identical assets
(liabilities
(level 1) | | Significant
other
observable
inputs
(level 2) | | Significant unobservable
inputs
(level 3) | | Total | | | | |
| Nonrecurring valuations: | | | | | | | | | | | | |
| Financial assets: | | | | | | | | | | | | |
| Other real estate owned | | $ | — | | | $ | — | | | $ | 2,873 | | | $ | 2,873 | | | | | |
Collateral-dependent net loans held for
investment: | | | | | | | | | | | | |
| Commercial and industrial | | — | | | — | | | 694 | | | 694 | | | | | |
| Construction | | — | | | — | | | 20,818 | | | 20,818 | | | | | |
| | | | | | | | | | | | |
| | | | | | | | | | | | |
| | | | | | | | | | | | |
| Multifamily | | — | | | — | | | 9,000 | | | 9,000 | | | | | |
| | | | | | | | | | | | |
| | | | | | | | | | | | |
| | | | | | | | | | | | |
| | | | | | | | | | | | |
| Total collateral-dependent loans | | $ | — | | | $ | — | | | $ | 30,512 | | | $ | 30,512 | | | | | |
| | | | | | | | | | | | | | | | | | | | | | | | | | |
| At December 31, 2023 | | Quoted prices
in active
markets for
identical assets
(liabilities)
(level 1) | | Significant
other
observable
inputs
(level 2) | | Significant unobservable
inputs
(level 3) | | Total |
| Nonrecurring valuations: | | | | | | | | |
| Financial assets: | | | | | | | | |
| Other real estate owned | | $ | — | | | $ | — | | | $ | 2,400 | | | $ | 2,400 | |
Collateral-dependent net loans held for
investment: | | | | | | | | |
| Commercial and industrial | | $ | — | | | $ | — | | | $ | 12,338 | | | $ | 12,338 | |
| Construction | | — | | | — | | | 203 | | | 203 | |
| Residential real estate: | | | | | | | | |
| 1-4 family mortgage | | — | | | — | | | 429 | | | 429 | |
| | | | | | | | |
| | | | | | | | |
| | | | | | | | |
| | | | | | | | |
| Consumer and other | | — | | | — | | | 71 | | | 71 | |
| Total collateral-dependent loans | | $ | — | | | $ | — | | | $ | 13,041 | | | $ | 13,041 | |
FB Financial Corporation and subsidiaries
Notes to consolidated financial statements
(Dollar amounts are in thousands, except share and per share amounts)
Historically, the Company had a portfolio of acquired commercial loans. There were no such loans outstanding as of December 31, 2024 as the last relationship was exited during the year ended December 31, 2023. These commercial loans were measured at fair value. As such, these loans were excluded from the ACL.
The following table sets forth the changes in fair value associated with this portfolio for the years ended December 31, 2023 and 2022.
| | | | | | | | | | | | | | | | | | | | |
| | |
| | | | | | |
| | | | | | |
| | | | | | |
| | | | | | |
| | | | | | |
| | | | | | |
| | | | | | |
| | | | | | |
| | Year Ended December 31, 2023 |
| | Principal balance | | Fair Value discount | | Fair Value |
| Carrying value at beginning of period | | $ | 34,357 | | | $ | (3,867) | | | $ | 30,490 | |
| | | | | | |
| Change in fair value: | | | | | | |
| Paydowns and payoffs | | (28,376) | | | — | | | (28,376) | |
| Write-offs to discount | | (5,981) | | | 5,981 | | | — | |
| Changes in valuation included in other noninterest income | | — | | | (2,114) | | | (2,114) | |
| Carrying value at end of period | | $ | — | | | $ | — | | | $ | — | |
| | | | | | | | | | | | | | | | | | | | |
| | Year Ended December 31, 2022 |
| | Principal balance | | Fair Value discount | | Fair Value |
| Carrying value at beginning of period | | $ | 86,762 | | | $ | (7,463) | | | $ | 79,299 | |
| | | | | | |
| Change in fair value: | | | | | | |
| Paydowns and payoffs | | (43,676) | | | — | | | (43,676) | |
| Write-offs to discount | | (8,729) | | | 8,729 | | | — | |
| Changes in valuation included in other noninterest income | | — | | | (5,133) | | | (5,133) | |
| Carrying value at end of period | | $ | 34,357 | | | $ | (3,867) | | | $ | 30,490 | |
The significant unobservable inputs (Level 3) used in the valuation and changes in fair value associated with the Company’s mortgage servicing rights for the years ended December 31, 2024, 2023, and 2022 are detailed at Note 8, “Mortgage servicing rights.”
The following tables present information as of December 31, 2024 and 2023 about significant unobservable inputs (Level 3) used in the valuation of assets measured at fair value on a nonrecurring basis:
| | | | | | | | | | | | | | | | | | | | | | | | | | | |
| December 31, 2024 | | | | | | | | | |
| Financial instrument | | Fair Value | | Valuation technique | | Significant
unobservable inputs | | Range of
inputs | |
Collateral-dependent net loans
held for investment | | $ | 30,512 | | | Valuation of collateral | | Discount for comparable sales | | 10%-40% | |
| Other real estate owned | | $ | 2,873 | | | Appraised value of property less costs to sell | | Discount for costs to sell | | 0%-10% | |
| | | | | | | | | | | | | | | | | | | | | | | | | | | |
| December 31, 2023 | | | | | | | | | |
| Financial instrument | | Fair Value | | Valuation technique | | Significant
unobservable inputs | | Range of
inputs | |
Collateral-dependent net loans
held for investment | | $ | 13,041 | | | Valuation of collateral | | Discount for comparable sales | | 10%-61% | |
| Other real estate owned | | $ | 2,400 | | | Appraised value of property less costs to sell | | Discount for costs to sell | | 0%-15% | |
| | | | | | | | | |
Fair value for collateral-dependent loans is determined based on the estimated value of the collateral securing the loans, less estimated selling costs and closing costs related to liquidation of the collateral. For loans secured by real estate, the fair value is determined based on appraisals performed by qualified appraisers and reviewed by qualified personnel. For non-real estate collateral, fair value is determined based on various sources, including third party asset valuation and internally determined values based on cost adjusted or other judgmentally determined factors. Collateral-dependent loans are reviewed and evaluated on at least a quarterly basis for additional impairment and adjusted accordingly, based on changes in market conditions from the time of valuation and management’s knowledge of the borrower and borrower’s business. As of December 31, 2024 and 2023, total amortized cost of collateral-dependent loans measured on a nonrecurring basis amounted to $34,712 and $18,166, respectively. The allowance for credit losses is calculated as the amount for which the loan’s amortized cost basis exceeds fair value.
FB Financial Corporation and subsidiaries
Notes to consolidated financial statements
(Dollar amounts are in thousands, except share and per share amounts)
Other real estate owned acquired in settlement of indebtedness is recorded at fair value of the real estate less estimated costs to sell. Subsequently, it may be necessary to record nonrecurring fair value adjustments for declines in fair value. Any write-downs based on the asset’s fair value at the date of foreclosure are charged to the allowance for credit losses.
Appraisals for both collateral-dependent loans and other real estate owned are performed by certified appraisers whose qualifications and licenses have been reviewed and verified by the Company. Once received, a member of the lending administrative department reviews the assumptions and approaches utilized in the appraisal as well as the overall resulting fair value in comparison with independent data sources such as recent market data or industry wide statistics. Collateral-dependent loans that are dependent on recovery through sale of equipment, such as farm equipment, automobiles and aircrafts are generally valued based on public source pricing or subscription services while more complex assets are valued through leveraging brokers who have expertise in the collateral involved.
Fair value option
The following table summarizes the Company’s loans held for sale as of the dates presented:
| | | | | | | | | | | | | | |
| | | | |
| | December 31, |
| | 2024 | | 2023 |
| Loans held for sale under a fair value option: | | | | |
| | | | |
| | | | |
| Mortgage loans held for sale | | 95,403 | | | 46,618 | |
| | | | |
| Loans held for sale not accounted for under a fair value option: | | | | |
| Mortgage loans held for sale - guaranteed GNMA repurchase option | | 31,357 | | | 21,229 | |
| Total loans held for sale | | $ | 126,760 | | | $ | 67,847 | |
Mortgage loans held for sale
Net gain of $376 and net losses $121 and $13,677 resulting from fair value changes of mortgage loans were recorded in income during the years ended December 31, 2024, 2023, and 2022, respectively. The amount does not reflect changes in fair values of related derivative instruments used to hedge exposure to market-related risks associated with these mortgage loans held for sale. The net change in fair value of these loans held for sale and derivatives resulted in a net gain of $1,241 and net losses of $1,815 and $17,633 for the years ended December 31, 2024, 2023, and 2022, respectively. The change in fair value of both mortgage loans held for sale and the related derivative instruments are recorded in mortgage banking income in the consolidated statements of income. Election of the fair value option allows the Company to reduce the accounting volatility that would otherwise result from the asymmetry created by accounting for the financial instruments at the lower of cost or fair value and the derivatives at fair value.
The Company’s valuation of mortgage loans held for sale incorporates an assumption for credit risk; however, given the short-term period that the Company holds these mortgage loans held for sale, valuation adjustments attributable to instrument-specific credit risk is nominal.
The following table summarizes the differences between the fair value and the principal balance for mortgage loans held for sale measured at fair value as of December 31, 2024 and 2023:
| | | | | | | | | | | | | | |
| | | | |
| | December 31, |
| | 2024 | | 2023 |
| Aggregate fair value | | $ | 95,403 | | | $ | 46,618 | |
| Aggregate unpaid principal balance | | 93,918 | | | 45,509 | |
| Difference | | $ | 1,485 | | | $ | 1,109 | |
FB Financial Corporation and subsidiaries
Notes to consolidated financial statements
(Dollar amounts are in thousands, except share and per share amounts)
The following table contains the estimated fair values and the related carrying values of the Company’s financial instruments. Non-financial instruments are excluded from the table below.
| | | | | | | | | | | | | | | | | | | | | | | | | | | | | | | | |
| | | | | Fair Value |
| December 31, 2024 | | Carrying amount | | Level 1 | | Level 2 | | Level 3 | | Total |
| Financial assets: | | | | | | | | | | |
| Cash and cash equivalents | | $ | 1,042,488 | | | $ | 1,042,488 | | | $ | — | | | $ | — | | | $ | 1,042,488 | |
| Investment securities | | 1,538,008 | | | — | | | 1,538,008 | | | — | | | 1,538,008 | |
| Net loans held for investment | | 9,450,442 | | | — | | | — | | | 9,221,311 | | | 9,221,311 | |
| Loans held for sale, at fair value | | 95,403 | | | — | | | 95,403 | | | — | | | 95,403 | |
| Interest receivable | | 49,611 | | | 629 | | | 8,012 | | | 40,970 | | | 49,611 | |
| Mortgage servicing rights | | 162,038 | | | — | | | — | | | 162,038 | | | 162,038 | |
| Derivatives | | 29,951 | | | — | | | 29,951 | | | — | | | 29,951 | |
| Financial liabilities: | | | | | | | | | | |
| Deposits: | | | | | | | | | | |
| Without stated maturities | | $ | 9,361,140 | | | $ | 9,361,140 | | | $ | — | | | $ | — | | | $ | 9,361,140 | |
| With stated maturities | | 1,849,294 | | | — | | | 1,846,989 | | | — | | | 1,846,989 | |
Securities sold under agreements to repurchase and federal funds purchased | | 13,499 | | | 13,499 | | | — | | | — | | | 13,499 | |
| | | | | | | | | | |
| | | | | | | | | | |
| Subordinated debt, net | | 130,704 | | | — | | | — | | | 126,684 | | | 126,684 | |
| | | | | | | | | | |
| Interest payable | | 24,182 | | | 3,759 | | | 18,923 | | | 1,500 | | | 24,182 | |
| Derivatives | | 32,383 | | | — | | | 32,383 | | | — | | | 32,383 | |
| | | | | | | | | | | | | | | | | | | | | | | | | | | | | | | | |
| | | Fair Value |
| December 31, 2023 | | Carrying amount | | Level 1 | | Level 2 | | Level 3 | | Total |
| Financial assets: | | | | | | | | | | |
| Cash and cash equivalents | | $ | 810,932 | | | $ | 810,932 | | | $ | — | | | $ | — | | | $ | 810,932 | |
| Investment securities | | 1,471,973 | | | — | | | 1,471,973 | | | — | | | 1,471,973 | |
| Net loans held for investment | | 9,258,457 | | | — | | | — | | | 9,068,518 | | | 9,068,518 | |
| Loans held for sale, at fair value | | 46,618 | | | — | | | 46,618 | | | — | | | 46,618 | |
| Interest receivable | | 52,715 | | | 388 | | | 8,551 | | | 43,776 | | | 52,715 | |
| Mortgage servicing rights | | 164,249 | | | — | | | — | | | 164,249 | | | 164,249 | |
| Derivatives | | 34,738 | | | — | | | 34,738 | | | — | | | 34,738 | |
| Financial liabilities: | | | | | | | | | | |
| Deposits: | | | | | | | | | | |
| Without stated maturities | | $ | 8,927,654 | | | $ | 8,927,654 | | | $ | — | | | $ | — | | | $ | 8,927,654 | |
| With stated maturities | | 1,620,633 | | | — | | | 1,614,400 | | | — | | | 1,614,400 | |
Securities sold under agreements to repurchase and federal funds purchased | | 108,764 | | | 108,764 | | | — | | | — | | | 108,764 | |
| Bank Term Funding Program | | 130,000 | | | — | | | 130,000 | | | — | | | 130,000 | |
| Subordinated debt, net | | 129,645 | | | — | | | — | | | 122,671 | | | 122,671 | |
| | | | | | | | | | |
| Interest payable | | 18,809 | | | 4,104 | | | 13,205 | | | 1,500 | | | 18,809 | |
| Derivatives | | 38,215 | | | — | | | 38,215 | | | — | | | 38,215 | |
FB Financial Corporation and subsidiaries
Notes to consolidated financial statements
(Dollar amounts are in thousands, except share and per share amounts)
Note (17)—Parent company financial statements
The following information presents the condensed balance sheets, statements of income and cash flows of FB Financial Corporation as of December 31, 2024 and 2023 and for each of the years in the three-year period ended December 31, 2024.
| | | | | | | | | | | | | | |
| | | As of December 31, |
| Balance sheets | | 2024 | | 2023 |
| Assets | | | | |
Cash and cash equivalents(1) | | $ | 32,857 | | | $ | 21,448 | |
| | | | |
| | | | |
Investment in subsidiaries(1) | | 1,527,292 | | | 1,449,439 | |
| Other assets | | 38,918 | | | 15,291 | |
| Goodwill | | 29 | | | 29 | |
| Total assets | | $ | 1,599,096 | | | $ | 1,486,207 | |
| Liabilities and shareholders' equity | | | | |
| Liabilities | | | | |
| Borrowings | | $ | 30,930 | | | $ | 30,930 | |
| Accrued expenses and other liabilities | | 628 | | | 483 | |
| Total liabilities | | 31,558 | | | 31,413 | |
| Shareholders' equity | | | | |
| Common stock | | 46,663 | | | 46,849 | |
| Additional paid-in capital | | 860,266 | | | 864,258 | |
| Retained earnings | | 762,293 | | | 678,412 | |
| Accumulated other comprehensive loss | | (101,684) | | | (134,725) | |
| Total shareholders' equity | | 1,567,538 | | | 1,454,794 | |
| Total liabilities and shareholders' equity | | $ | 1,599,096 | | | $ | 1,486,207 | |
(1) Eliminates in consolidation
| | | | | | | | | | | | | | | | | | | | |
| | | Years Ended December 31, |
| Statements of income | | 2024 | | 2023 | | 2022 |
| Income | | | | | | |
| | | | | | |
| | | | | | |
Dividend income from bank subsidiary(1) | | $ | 83,200 | | | $ | 49,000 | | | $ | 49,000 | |
| | | | | | |
Dividend income from nonbank subsidiary(1) | | — | | | 530 | | | — | |
| | | | | | |
| | | | | | |
| Other income | | 7 | | | 57 | | | 89 | |
| Total income | | 83,207 | | | 49,587 | | | 49,089 | |
| Expenses | | | | | | |
| Interest expense | | 2,107 | | | 1,590 | | | 1,587 | |
| Salaries, legal and professional fees | | 1,549 | | | 1,461 | | | 1,590 | |
| Other noninterest expense | | 426 | | | 478 | | | 771 | |
| Total expenses | | 4,082 | | | 3,529 | | | 3,948 | |
Income before income tax benefit and equity in undistributed
earnings of subsidiaries | | 79,125 | | | 46,058 | | | 45,141 | |
| Federal and state income tax benefit | | (1,047) | | | (887) | | | (1,002) | |
| Income before equity in undistributed earnings of subsidiaries | | 80,172 | | | 46,945 | | | 46,143 | |
Equity in undistributed earnings from bank subsidiary(1) | | 35,863 | | | 73,832 | | | 76,232 | |
Equity in undistributed earnings from nonbank subsidiary(1) | | — | | | (553) | | | 2,180 | |
| Net income | | $ | 116,035 | | | $ | 120,224 | | | $ | 124,555 | |
| | | | | | |
(1) Eliminates in consolidation
FB Financial Corporation and subsidiaries
Notes to consolidated financial statements
(Dollar amounts are in thousands, except share and per share amounts)
| | | | | | | | | | | | | | | | | | | | |
| | | Years Ended December 31, |
| Statements of cash flows | | 2024 | | 2023 | | 2022 |
| Operating Activities | | | | | | |
| Net income | | $ | 116,035 | | | $ | 120,224 | | | $ | 124,555 | |
| Adjustments to reconcile net income to net cash provided by operating activities: | | | | | | |
| Equity in undistributed income of bank subsidiary | | (35,863) | | | (73,832) | | | (76,232) | |
| Equity in undistributed income of nonbank subsidiary | | — | | | 553 | | | (2,180) | |
| | | | | | |
| | | | | | |
| | | | | | |
| Stock-based compensation expense | | 9,485 | | | 10,381 | | | 9,857 | |
| (Increase) decrease in other assets | | (24,055) | | | 1,017 | | | (802) | |
| Decrease in other liabilities | | (8,584) | | | (4,064) | | | (7,381) | |
| | | | | | |
| Net cash provided by operating activities | | 57,018 | | | 54,279 | | | 47,817 | |
| Investing Activities | | | | | | |
| | | | | | |
| | | | | | |
| | | | | | |
| | | | | | |
| Net cash provided by investing activities | | — | | | — | | | — | |
| Financing Activities | | | | | | |
| | | | | | |
| | | | | | |
| | | | | | |
| | | | | | |
| Stock-based compensation withholding payments | | (1,846) | | | (3,379) | | | (2,842) | |
Net proceeds from sale of common stock under employee stock purchase
program | | 882 | | | 723 | | | 1,212 | |
| Repurchase of common stock | | (12,699) | | | (4,944) | | | (39,979) | |
| Dividends paid on common stock | | (31,780) | | | (28,057) | | | (24,503) | |
| Dividend equivalent payments made upon vesting of equity compensation | | (166) | | | (226) | | | (168) | |
| Net cash used in financing activities | | (45,609) | | | (35,883) | | | (66,280) | |
| Net increase (decrease) in cash and cash equivalents | | 11,409 | | | 18,396 | | | (18,463) | |
| Cash and cash equivalents at beginning of year | | 21,448 | | | 3,052 | | | 21,515 | |
| Cash and cash equivalents at end of year | | $ | 32,857 | | | $ | 21,448 | | | $ | 3,052 | |
| Supplemental noncash disclosures: | | | | | | |
Dividends declared not paid on restricted stock units and performance stock
units | | $ | 374 | | | $ | 287 | | | $ | 222 | |
| Noncash dividends from bank subsidiary | | 21,700 | | | — | | | — | |
| | | | | | |
| | | | | | |
| | | | | | |
Note (18)—Segment reporting
The Company and the Bank are engaged in the business of banking and provide a full range of financial services. The Company determines reportable segments based on the significance of the segment’s operating results to the overall Company, the products and services offered, customer characteristics, processes and service delivery of the segments and the regular financial performance review and allocation of resources by the Chief Executive Officer, the Company’s chief operating decision maker. The Company has identified two distinct reportable segments—Banking and Mortgage. The Company’s primary segment is Banking, which provides a full range of deposit and lending products and services to corporate, commercial and consumer customers. The Company also originates conforming residential mortgage loans through its Mortgage segment, whose activities include the servicing of residential mortgage loans and securitization of loans to third party private investors or government sponsored agencies.
The chief operating decision maker uses income before income taxes as the measure of segment profit or loss to assess the performance of and allocate resources to each segment. Interest income provides the primary revenue in the Banking segment, and mortgage banking income provides the primary revenue in the Mortgage segment. Interest expense, provision for credit losses, and salaries, commissions and employee benefits provide the significant expenses in the Banking segment, and salaries, commissions and employee benefits provide the significant expenses in the Mortgage segment. These figures are regularly provided to the chief operating decision maker and are monitored through budget-to-actual variance review.
Beginning in 2024, the Company began assigning a transfer rate to allocate net interest income to products and business segments. Through this process, the Company formulates a loan funding charge and a deposit funding credit for its entire loan and deposit portfolios. The intent of the transfer rate methodology is to transfer interest rate risk among the segments and allow management to better measure the net interest margin contribution of its products and business segments. Changes in management structure or allocation methodologies and procedures result in changes in reported segment financial data. Prior period results have been adjusted to conform to the current methodology.
FB Financial Corporation and subsidiaries
Notes to consolidated financial statements
(Dollar amounts are in thousands, except share and per share amounts)
The following tables present selected financial information with respect to the Company’s reportable segments for the years ended December 31, 2024, 2023, and 2022.
| | | | | | | | | | | | | | | | | | | | |
| Year Ended December 31, 2024 | | Banking(2) | | Mortgage | | Consolidated |
| Interest income | | $ | 726,033 | | | $ | (495) | | | $ | 725,538 | |
| Interest expense | | 315,250 | | | (6,215) | | | 309,035 | |
| Net interest income | | 410,783 | | | 5,720 | | | 416,503 | |
| Provisions for (reversals of) credit losses | | 12,264 | | | (260) | | | 12,004 | |
| Net interest income after provision for credit losses | | 398,519 | | | 5,980 | | | 404,499 | |
| Mortgage banking income | | — | | | 62,912 | | | 62,912 | |
Change in fair value of mortgage servicing rights, net of hedging(1) | | — | | | (16,278) | | | (16,278) | |
| Other noninterest (loss) income | | (8,376) | | | 812 | | | (7,564) | |
| Total noninterest (loss) income | | (8,376) | | | 47,446 | | | 39,070 | |
| Salaries, commissions and employee benefits | | 154,411 | | | 29,402 | | | 183,813 | |
| Depreciation and amortization | | 11,541 | | | 425 | | | 11,966 | |
| Amortization of intangibles | | 2,947 | | | — | | | 2,947 | |
| | | | | | |
Other noninterest expense(3) | | 78,172 | | | 20,001 | | | 98,173 | |
| Total noninterest expense | | 247,071 | | | 49,828 | | | 296,899 | |
| Income before income taxes | | $ | 143,072 | | | $ | 3,598 | | | $ | 146,670 | |
| Income tax expense | | | | | | 30,619 | |
Net income applicable to FB Financial Corporation and noncontrolling interest | | | | | | 116,051 | |
Net income applicable to noncontrolling interest(2) | | | | | | 16 | |
| Net income applicable to FB Financial Corporation | | | | | | $ | 116,035 | |
| Total assets | | $ | 12,554,435 | | | $ | 603,047 | | | $ | 13,157,482 | |
| Goodwill | | 242,561 | | | — | | | 242,561 | |
(1) Change in fair value of mortgage servicing rights, net of hedging is included in Mortgage banking income in the Company's consolidated statements of income.
(2) Banking segment includes noncontrolling interest.
(3) Other noninterest expense for Banking includes expenses for occupancy and equipment expense, data processing, advertising, legal and professional fees and other expenses. Other noninterest expense for Mortgage includes expenses for occupancy and equipment expense, data processing, advertising, legal and professional fees, servicing expenses and other expenses.
| | | | | | | | | | | | | | | | | | | | |
| Year Ended December 31, 2023 | | Banking(2) | | Mortgage | | Consolidated |
| Interest income | | $ | 678,591 | | | $ | (181) | | | $ | 678,410 | |
| Interest expense | | 277,342 | | | (6,149) | | | 271,193 | |
| Net interest income | | 401,249 | | | 5,968 | | | 407,217 | |
| Provisions for (reversals of) credit losses | | 2,599 | | | (60) | | | 2,539 | |
| Net interest income after provision for credit losses | | 398,650 | | | 6,028 | | | 404,678 | |
| Mortgage banking income | | — | | | 60,918 | | | 60,918 | |
Change in fair value of mortgage servicing rights, net of hedging(1) | | — | | | (16,226) | | | (16,226) | |
| Other noninterest income | | 25,831 | | | 20 | | | 25,851 | |
| Total noninterest income | | 25,831 | | | 44,712 | | | 70,543 | |
| Salaries, commissions and employee benefits | | 170,625 | | | 32,816 | | | 203,441 | |
| Depreciation and amortization | | 10,444 | | | 736 | | | 11,180 | |
| Amortization of intangibles | | 3,659 | | | — | | | 3,659 | |
| | | | | | |
Other noninterest expense(3) | | 85,407 | | | 21,242 | | | 106,649 | |
| Total noninterest expense | | 270,135 | | | 54,794 | | | 324,929 | |
| Income (loss) before income taxes | | $ | 154,346 | | | $ | (4,054) | | | $ | 150,292 | |
| Income tax expense | | | | | | 30,052 | |
| | | | | | |
| | | | | | |
Net income applicable to FB Financial Corporation and noncontrolling interest | | | | | | 120,240 | |
Net income applicable to noncontrolling interest(2) | | | | | | 16 | |
| Net income applicable to FB Financial Corporation | | | | | | $ | 120,224 | |
| Total assets | | $ | 12,050,245 | | | $ | 554,158 | | | $ | 12,604,403 | |
| Goodwill | | 242,561 | | | — | | | 242,561 | |
(1) Change in fair value of mortgage servicing rights, net of hedging is included in Mortgage banking income in the Company's consolidated statements of income.
(2) Banking segment includes noncontrolling interest.
(3) Other noninterest expense for Banking includes expenses for occupancy and equipment expense, data processing, advertising, legal and professional fees and other expenses. Other noninterest expense for Mortgage includes expenses for occupancy and equipment expense, data processing, advertising, legal and professional fees, servicing expenses and other expenses.
FB Financial Corporation and subsidiaries
Notes to consolidated financial statements
(Dollar amounts are in thousands, except share and per share amounts)
| | | | | | | | | | | | | | | | | | | | |
| Year Ended December 31, 2022 | | Banking(2) | | Mortgage | | Consolidated |
| Interest income | | $ | 470,430 | | | $ | 10,992 | | | $ | 481,422 | |
| Interest expense | | 71,405 | | | (2,218) | | | 69,187 | |
| Net interest income | | 399,025 | | | 13,210 | | | 412,235 | |
| Provisions for credit losses | | 18,982 | | | — | | | 18,982 | |
| Net interest income after provision for credit losses | | 380,043 | | | 13,210 | | | 393,253 | |
| Mortgage banking income | | — | | | 83,679 | | | 83,679 | |
Change in fair value of mortgage servicing rights, net of hedging(1) | | — | | | (10,099) | | | (10,099) | |
| Other noninterest income (loss) | | 41,312 | | | (225) | | | 41,087 | |
| Total noninterest income | | 41,312 | | | 73,355 | | | 114,667 | |
| Salaries, commissions and employee benefits | | 150,408 | | | 61,083 | | | 211,491 | |
| Depreciation and amortization | | 7,035 | | | 982 | | | 8,017 | |
| Amortization of intangibles | | 4,585 | | | — | | | 4,585 | |
| | | | | | |
Other noninterest expense(3) | | 63,248 | | | 61,005 | | | 124,253 | |
| Total noninterest expense | | 225,276 | | | 123,070 | | | 348,346 | |
| Income (loss) before income taxes | | $ | 196,079 | | | $ | (36,505) | | | $ | 159,574 | |
| Income tax expense | | | | | | 35,003 | |
Net income applicable to FB Financial Corporation and noncontrolling interest | | | | | | 124,571 | |
Net income applicable to noncontrolling interest(2) | | | | | | 16 | |
| Net income applicable to FB Financial Corporation | | | | | | $ | 124,555 | |
| Total assets | | $ | 12,232,849 | | | $ | 614,907 | | | $ | 12,847,756 | |
| Goodwill | | 242,561 | | | — | | | 242,561 | |
(1) Change in fair value of mortgage servicing rights, net of hedging is included in Mortgage banking income in the Company's consolidated statements of income.
(2) Banking segment includes noncontrolling interest.
(3) Other noninterest expense for Banking includes expenses for occupancy and equipment expense, data processing, advertising, legal and professional fees and other expenses. Other noninterest expense for Mortgage includes expenses for occupancy and equipment expense, data processing, advertising, legal and professional fees, servicing expenses, restructuring expenses and other expenses.
Note (19)—Minimum capital requirements
Banks and bank holding companies are subject to regulatory capital requirements administered by federal banking agencies. Capital adequacy guidelines and, additionally for banks, prompt corrective action regulations involve quantitative measures of assets, liabilities, and certain off-balance sheet items calculated under regulatory accounting practices. Capital amounts and classifications are also subject to qualitative judgments by regulators. Failure to meet capital requirements can initiate regulatory action.
Under regulatory guidance for non-advanced approach institutions, the Bank and Company are required to maintain minimum capital ratios as outlined in the table below. Minimum risk-based capital adequacy ratios below include a capital conservation buffer of 2.50%. As of December 31, 2024 and 2023, the Bank and Company met all capital adequacy requirements to which they are subject. Additionally, under U.S. Basel III Capital Rules, the Bank and Company opted out of including accumulated other comprehensive income in regulatory capital.
The Company elected to phase-in the impact related to adopting ASU 2016-13 over the permissible five-year transition relief period and delayed the initial impact of CECL adoption plus 25% of the quarterly increases in ACL in the first two years after adoption. Beginning in 2022, the cumulative amount of the transition adjustments became fixed and were phased out in annual increments over a three-year period. 2024 represents the final year of this CECL adoption phase out, with 25% of the initial impact of CECL adoption being adjusted out of regulatory capital calculations.
FB Financial Corporation and subsidiaries
Notes to consolidated financial statements
(Dollar amounts are in thousands, except share and per share amounts)
Actual and required capital amounts and ratios are included below as of the dates indicated.
| | | | | | | | | | | | | | | | | | | | | | | | | | | | | | | | | | | | | | | | | | |
| December 31, 2024 | | Actual | | | | Minimum Requirement for Capital Adequacy with
Capital Buffer | | To Qualify as Well-Capitalized Under Prompt Corrective Action Provisions |
| | Amount | | Ratio | | | | | | Amount | | Ratio | | Amount | | Ratio |
| | | | | | | | | | | | | | | | |
| Total Capital (to risk-weighted assets) | | | | | | | | | | | | | | | | |
| FB Financial Corporation | | $ | 1,721,941 | | | 15.2 | % | | | | | | $ | 1,187,163 | | | 10.5 | % | | N/A | | N/A |
| FirstBank | | 1,650,305 | | | 14.7 | % | | | | | | 1,175,095 | | | 10.5 | % | | $ | 1,119,138 | | | 10.0 | % |
| Tier 1 Capital (to risk-weighted assets) | | | | | | | | | | | | | | | | |
| FB Financial Corporation | | $ | 1,480,722 | | | 13.1 | % | | | | | | $ | 961,037 | | | 8.5 | % | | N/A | | N/A |
| FirstBank | | 1,410,505 | | | 12.6 | % | | | | | | 951,267 | | | 8.5 | % | | $ | 895,310 | | | 8.0 | % |
Common Equity Tier 1 Capital
(to risk-weighted assets) | | | | | | | | | | | | | | | | |
| FB Financial Corporation | | $ | 1,450,722 | | | 12.8 | % | | | | | | $ | 791,442 | | | 7.0 | % | | N/A | | N/A |
| FirstBank | | 1,410,505 | | | 12.6 | % | | | | | | 783,397 | | | 7.0 | % | | $ | 727,440 | | | 6.5 | % |
| Tier 1 Capital (to average assets) | | | | | | | | | | | | | | | | |
| FB Financial Corporation | | $ | 1,480,722 | | | 11.3 | % | | | | | | $ | 522,557 | | | 4.0 | % | | N/A | | N/A |
| FirstBank | | 1,410,505 | | | 10.8 | % | | | | | | 521,538 | | | 4.0 | % | | $ | 651,923 | | | 5.0 | % |
| | | | | | | | | | | | | | | | | | | | | | | | | | | | | | | | | | | | | | | | | | |
| December 31, 2023 | | Actual | | | | Minimum Requirement for Capital Adequacy with
Capital Buffer | | To Qualify as Well-Capitalized Under Prompt Corrective Action Provisions |
| | Amount | | Ratio | | | | | | Amount | | Ratio | | Amount | | Ratio |
| | | | | | | | | | | | | | | | |
| Total Capital (to risk-weighted assets) | | | | | | | | | | | | | | | | |
| FB Financial Corporation | | $ | 1,635,848 | | | 14.5 | % | | | | | | $ | 1,182,028 | | | 10.5 | % | | N/A | | N/A |
| FirstBank | | 1,600,950 | | | 14.2 | % | | | | | | 1,179,886 | | | 10.5 | % | | $ | 1,123,701 | | | 10.0 | % |
| Tier 1 Capital (to risk-weighted assets) | | | | | | | | | | | | | | | | |
| FB Financial Corporation | | $ | 1,405,890 | | | 12.5 | % | | | | | | $ | 956,880 | | | 8.5 | % | | N/A | | N/A |
| FirstBank | | 1,370,991 | | | 12.2 | % | | | | | | 955,145 | | | 8.5 | % | | $ | 898,960 | | | 8.0 | % |
Common Equity Tier 1 Capital (to risk-weighted assets) | | | | | | | | | | | | | | | | |
| FB Financial Corporation | | $ | 1,375,890 | | | 12.2 | % | | | | | | $ | 788,018 | | | 7.0 | % | | N/A | | N/A |
| FirstBank | | 1,370,991 | | | 12.2 | % | | | | | | 786,590 | | | 7.0 | % | | $ | 730,405 | | | 6.5 | % |
| Tier 1 Capital (to average assets) | | | | | | | | | | | | | | | | |
| FB Financial Corporation | | $ | 1,405,890 | | | 11.3 | % | | | | | | $ | 496,485 | | | 4.0 | % | | N/A | | N/A |
| FirstBank | | 1,370,991 | | | 11.1 | % | | | | | | 495,761 | | | 4.0 | % | | $ | 619,701 | | | 5.0 | % |
Note (20)—Employee benefit plans
401(k) plan
The Company sponsors a defined contribution plan which covers substantially all employees and allows participating employees to contribute the maximum amount of their eligible salary subject to certain limits based on the federal tax laws. The Company has an employer match of 50% of the first 6% of an employee’s salary with any such contributions vesting ratably over a three-year period. For the years ended December 31, 2024, 2023, and 2022, matching employer contributions totaled $3,225, $3,450 and $3,686 respectively.
Acquired supplemental retirement plans
The Company has nonqualified supplemental retirement plans for certain former employees that were assumed through acquisitions. As of December 31, 2024 and 2023, other liabilities on the consolidated balance sheets included post-retirement benefits payable of $2,328 and $2,152, respectively, related to these plans. For the years ended December 31, 2024, 2023, and 2022, the expense related to these plans and payments to the participants were not meaningful. The Company also acquired single premium life insurance policies on these individuals. At December 31, 2024 and 2023, cash surrender value of bank-owned life insurance was $72,504 and $76,143, respectively. Income related to these policies (net of related insurance premium expense) amounted to $3,753, $1,871 and $1,452 for the years ended December 31, 2024, 2023, and 2022, respectively.
FB Financial Corporation and subsidiaries
Notes to consolidated financial statements
(Dollar amounts are in thousands, except share and per share amounts)
Note (21)—Stock-based compensation
Restricted Stock Units
The Company grants RSUs under compensation arrangements for the benefit of certain employees and directors. RSU grants are subject to time-based vesting with associated compensation recognized on a straight-line basis based on the grant date fair value of the awards. The total number of RSUs granted represents the number of awards eligible to vest based upon the service conditions set forth in the grant agreements.
The following table summarizes changes in RSUs for the year ended December 31, 2024:
| | | | | | | | | | | | | | | | | | |
| | | | | | |
| | | | |
| | | Restricted Stock
Units
Outstanding | | Weighted
Average Grant
Date
Fair Value | | | | |
| Balance at beginning of period (unvested) | | 323,520 | | | $ | 37.52 | | | | | |
| Granted | | 182,447 | | | 36.07 | | | | | |
| Vested | | (150,194) | | | 37.64 | | | | | |
| Forfeited | | (10,337) | | | 37.34 | | | | | |
| Balance at end of period (unvested) | | 345,436 | | | $ | 36.71 | | | | | |
The total fair value of RSUs vested and released was $5,653, $8,089, and $8,018 for the years ended December 31, 2024, 2023, and 2022, respectively.The compensation cost related to the grants and vesting of RSUs was $7,340, $7,438, and $7,372 for the years ended December 31, 2024, 2023, and 2022, respectively. This includes amounts paid related to grants and compensation for directors elected to be settled in stock amounting to $838, $834, and $663 for the years ended December 31, 2024, 2023, and 2022, respectively.
As of December 31, 2024, there was $6,825 of total unrecognized compensation cost related to unvested RSUs which is expected to be recognized over a weighted-average period of 1.68 years. Additionally, as of December 31, 2024, there were 1,351,486 shares available for issuance under the Company’s stock compensation plans. As of December 31, 2024 and 2023, there was $344 and $268, respectively, accrued in other liabilities related to dividend equivalent units declared to be paid upon vesting and distribution of the underlying RSUs.
Performance-Based Restricted Stock Units
The Company awards PSUs to certain employees. Under the terms of the awards, the number of units that will vest and convert to shares of common stock will be based on the Company’s achievement of certain performance metrics over a fixed three-year performance period. The number of shares issued upon vesting can range from 0% to 200% of the PSUs granted.
For PSUs granted prior to December 31, 2023, performance factors will be based on the Company’s achievement of core return on average tangible common equity over the performance period relative to a predefined peer group.
For PSUs granted after December 31, 2023, performance factors will be based on a combination of the same metric discussed above as well as the Company’s adjusted tangible book value over the performance period.
Compensation expense for PSUs is estimated each period based on the fair value of the Company’s stock at the grant date and the most probable outcome of the performance condition, adjusted for the passage of time within the performance period of the awards.
FB Financial Corporation and subsidiaries
Notes to consolidated financial statements
(Dollar amounts are in thousands, except share and per share amounts)
The following table summarizes information about the changes in PSUs as of and for the year ended December 31, 2024:
| | | | | | | | | | | | | | | | | | |
| | | | | | |
| | | | | | |
| | | | | | |
| | | | |
| | Performance Stock Units Outstanding(1) | | Weighted
Average Grant
Date
Fair Value | | | | |
| Balance at beginning of period (unvested) | | 176,163 | | | $ | 40.86 | | | | | |
| Granted | | 100,267 | | | 35.60 | | | | | |
Performance adjustment (2) | | (9,778) | | | 42.71 | | | | | |
| Vested | | (40,071) | | | 42.71 | | | | | |
| Forfeited or expired | | (3,188) | | | 38.07 | | | | | |
| Balance at end of period (unvested) | | 223,393 | | | $ | 38.06 | | | | | |
(1) PSUs are presented as outstanding, granted and forfeited in the table above assuming targets are met and the awards pay out at 100%. (2) The performance adjustment represents the difference in shares ultimately awarded due to performance attainment above or below target. | | | | |
The following table summarizes data related to the Company’s outstanding PSUs as of December 31, 2024: | | | | | | | | | | | | | | | | | | | | |
| Grant Year | | Grant Price | | Performance Period | | PSUs Outstanding |
| 2022 | | $ | 44.44 | | | 2022 to 2024 | | 48,710 |
| 2023 | | $ | 37.17 | | | 2023 to 2025 | | 75,893 |
| 2024 | | $ | 35.60 | | | 2024 to 2026 | | 98,790 |
The Company recorded compensation cost $2,145, $2,943, and $2,485 for the years ended December 31, 2024, 2023, and 2022, respectively. As of December 31, 2024, maximum unrecognized compensation cost at 200% payout related to the unvested PSUs was $12,770, and the weighted average remaining performance period over which the cost could be recognized was 1.79 years. As of December 31, 2024 and 2023, there was $217 and $85, respectively, accrued in other liabilities related to dividend equivalent units declared to be paid upon vesting and distribution of the underlying PSUs.
Employee Stock Purchase Plan
The Company maintains an employee stock purchase plan under which employees, through payroll deductions, are able to purchase shares of Company common stock. The employee purchase price is 95% of the lower of the market price on the first or last day of the offering period. The maximum number of shares issuable during any offering period is 200,000 shares, limited to 725 shares for each participating employee. There were 21,862, 20,520, and 26,950 shares of common stock issued under the ESPP with proceeds from employee payroll withholdings of $861, $686, and $1,087 during the years ended December 31, 2024, 2023, and 2022, respectively. As of December 31, 2024, there were 2,272,364 shares available for issuance under the ESPP.
Note (22)—Related party transactions
Loans
The Bank has made and expects to continue to make loans to management, executive officers, the directors and significant shareholders of the Company and their related interests in the ordinary course of business, in compliance with regulatory requirements.
An analysis of loans to management, executive officers, the directors and significant shareholders of the Bank and their related interests is presented below:
| | | | | | | | |
| Loans outstanding at January 1, 2024 | | $ | 49,073 | |
| New loans and advances | | 5,041 | |
| Change in related party status | | — | |
| Repayments | | (22,708) | |
| Loans outstanding at December 31, 2024 | | $ | 31,406 | |
Unfunded commitments to management, executive officers, the directors, and significant shareholders and their related interests totaled $14,510 and $44,206 at December 31, 2024 and 2023, respectively.
FB Financial Corporation and subsidiaries
Notes to consolidated financial statements
(Dollar amounts are in thousands, except share and per share amounts)
Deposits
The Bank held deposits from related parties totaling $282,963 and $316,141 as of December 31, 2024 and 2023, respectively.
Leases
The Bank leases various office spaces from entities owned by certain directors of the Company under varying terms. Lease expense for these properties totaled $411, $385, and $396 for the years ended December 31, 2024, 2023, and 2022, respectively.
Aviation lease
Through a wholly-owned subsidiary, FBK Aviation, LLC, the Company owns and maintains an aircraft. FBK Aviation, LLC maintains non-exclusive aircraft leases with entities owned by certain directors. The Company recognized income $50, $28, and $52 during the years ended December 31, 2024, 2023, and 2022, respectively, under these agreements.
Equity investment in preferred stock and master loan purchase agreement
The Company holds an equity investment in a privately held entity which originates manufactured housing loans through utilization of its proprietary developed technology. As a result of the investment, the Company holds two board seats on the entity’s board of directors. The Company also has a master loan purchase agreement with the entity to purchase up to $250,000 in manufactured housing loan production over an initial five-year term. Under this agreement, the Company purchased $58,171 and $33,164 of loans for the years ended December 31, 2024 and 2023, respectively. No such loans were purchased during the year ended December 31, 2022. As of December 31, 2024 and 2023, the amortized cost of these loans HFI amounted to $86,890 and $32,154, respectively. See Note 2, “Investment securities”, for additional information on this investment.
ITEM 9. Changes In and Disagreements with Accountants on Accounting and Financial Disclosure
None.
ITEM 9A. Controls and Procedures
Evaluation of Disclosure Controls and Procedures
An evaluation of the Company’s disclosure controls and procedures (as defined in Rule 13a-15(e) under the Exchange Act as of December 31, 2024 was carried out under the supervision and with the participation of the Company’s Chief Executive Officer, Chief Financial Officer and other members of the Company’s senior management. The Company’s Chief Executive Officer and Chief Financial Officer concluded that, as of December 31, 2024, the Company’s disclosure controls and procedures were effective for ensuring that information the Company is required to disclose in reports that it files or submits under the Act, as amended, is recorded, processed, summarized and reported within the time periods specified in the SEC’s rules and forms and that such information is accumulated and communicated to the Company’s senior management, including its Chief Executive Officer and Chief Financial Officer, as appropriate to allow timely decisions regarding required disclosure.
Annual Reports on Internal Control over Financial Reporting
The report of the Company’s management on the Company’s internal control over financial reporting is included under subheading “Report on Management’s Assessment of Internal Control over Financial Reporting” within Item 8, “Financial Statements and Supplementary Data.” The report of the Company’s independent registered public accounting firm on the Company’s internal control over financial reporting is included under subheading “Report of Independent Registered Public Accounting Firm” within Item 8, “Financial Statements and Supplementary Data,” within this Annual Report.
Changes in Internal Controls
There were no changes in our internal control over financial reporting that occurred during the year ended December 31, 2024 that has materially affected, or is reasonably likely to materially affect, our internal control over financial reporting.
Limitations on the Effectiveness of Controls
The Company’s management recognizes that a control system, no matter how well conceived and operated, can provide only reasonable, not absolute, assurance that the objectives of the control system are met. Further, the design of a control system must reflect the fact that there are resource constraints, and the benefits of controls must be considered relative to their costs. Because of the inherent limitations in all control systems, no evaluation of controls can provide absolute assurance that all control issues, errors and instances of fraud, if any, within the Company have been detected.
ITEM 9B. Other Information
Rule 10b5-1 Trading Plans
During the quarter ended December 31, 2024, none of the Company’s directors or executive officers adopted, modified, or terminated any contract, instruction, or written plan for the purchase or sale of Company securities that was intended to satisfy the affirmative defense conditions of Rule 10b5-1(c) or any “non-Rule 10b5-1 trading arrangement.”
Other Events
None.
ITEM 9C. Disclosure Regarding Foreign Jurisdictions that Prevent Inspections
Not Applicable.
PART III
Item 10. Directors, Executive Officers and Corporate Governance
We have adopted an Insider Trading Policy that governs the purchase, sale, and/or disposition of our securities by directors, officers, employees, and other covered persons. This policy is designed to promote compliance with insider trading laws, rules, and regulations and any applicable listing standards. It is the Company’s policy to comply with all applicable securities and state laws when engaging in transactions in the Company’s securities. A copy of our Insider Trading Policy is filed with this Annual Report as Exhibit 19.1.
The other information required by this Item will be presented in, and is incorporated herein by reference to, the Company’s definitive proxy statement for the 2025 annual meeting of shareholders which will be filed with the SEC within 120 days of December 31, 2024.
Item 11. Executive Compensation
The information required by this Item will be presented in, and is incorporated herein by reference to, the Company’s definitive proxy statement for the 2025 annual meeting of shareholders which will be filed with the SEC within 120 days of December 31, 2024.
Item 12. Security Ownership of Certain Beneficial Owners and Management and Related Stockholder Matters
The information required by this Item will be presented in, and is incorporated herein by reference to, the Company’s definitive proxy statement for the 2025 annual meeting of shareholders which will be filed with the SEC within 120 days of December 31, 2024.
Item 13. Certain Relationships, Related Transactions and Director Independence
The information required by this Item will be presented in, and is incorporated herein by reference to, the Company’s definitive proxy statement for the 2025 annual meeting of shareholders which will be filed with the SEC within 120 days of December 31, 2024.
Item 14. Principal Accountant Fees and Services
The information required by this Item will be presented in, and is incorporated herein by reference to, the Company’s definitive proxy statement for the 2025 annual meeting of shareholders which will be filed with the SEC within 120 days of December 31, 2024.
PART IV
Item 15. Exhibits and Financial Statement Schedules
(a) Documents filed as a part of this report.
1. Financial Statements
The following consolidated financial statements of FB Financial Corporation and our subsidiaries and related reports of our independent registered public accounting firm are incorporated in this Item 15. by reference from Part II - Item 8. Financial Statements and Supplementary Data of this Annual Report.
•Consolidated balance sheets as of December 31, 2024 and 2023
•Consolidated statements of income for the years ended December 31, 2024, 2023, and 2022
•Consolidated statements of comprehensive income (loss) for the years ended December 31, 2024, 2023, and 2022
•Consolidated statements of changes in shareholders' equity for the years ended December 31, 2024, 2023, and 2022
•Consolidated statements of cash flows for the years ended December 31, 2024, 2023, and 2022
•Notes to consolidated financial statements
•Report of Independent Registered Public Accounting Firm
2. Financial Statement Schedules
None are applicable because the required information has been incorporated in the consolidated financial statements and notes thereto of FB Financial Corporation and our subsidiaries which are incorporated in this Annual Report by reference.
3. Exhibits
The following exhibits are filed or furnished herewith or are incorporated herein by reference to other documents previously filed with the SEC.
EXHIBIT INDEX
| | | | | |
| Exhibit Number | Description |
| 3.1 | |
| 3.2 | |
| 4.1 | |
| 4.2 | |
| 4.8 | In accordance with Item 601(b)(4)(iii)(A) of Regulation S-K, certain instruments with respect to long-term debt of the Company have been omitted but will be furnished to the Securities and Exchange Commission upon request. |
| 10.1 | |
| 10.2 | |
| 10.3 | |
| 10.4 | |
| 10.5 | |
| 10.6 | |
| 10.7 | |
| 10.8 | |
| 10.9 | |
| 10.10 | |
| 10.11 | |
| 10.12 | |
| 10.13 | |
| 19.1 | |
| 21 | |
| 23.1 | |
| 24.1 | |
| 31.1 | |
| 31.2 | |
| | | | | |
| 32.1 | |
| 97 | |
| 101.INS | Inline XBRL Instance Document* |
| 101.SCH | Inline XBRL Taxonomy Extension Schema Document* |
| 101.CAL | Inline XBRL Taxonomy Extension Calculation Linkbase Document* |
| 101.DEF | Inline XBRL Taxonomy Extension Definition Linkbase Document* |
| 101.LAB | Inline XBRL Taxonomy Extension Label Linkbase Document* |
| 101.PRE | Inline XBRL Taxonomy Extension Presentation Linkbase Document* |
| 104 | Cover Page Interactive Data File (formatted as Inline XBRL and contained in Exhibit 101) |
| | | | | |
| * | Filed herewith. |
| ** | Furnished herewith. |
| *** | As directed by Item 601(a)(5) of Regulation S-K, certain schedules and exhibits to this exhibit are omitted from this filing. The Company agrees to furnish supplementally a copy of any omitted schedule or exhibit to the SEC upon request. |
| † | Represents a management contract or a compensatory plan or arrangement. |
ITEM 16. Form 10-K Summary
None.
Signatures
Pursuant to the requirements of the section 13 or 15(d) of the Securities Exchange Act of 1934, the Registrant has duly caused this Report to be signed on its behalf by the undersigned thereunto duly authorized.
| | | | | | | | |
| | | FB Financial Corporation |
| | |
| | /s/ Christopher T. Holmes |
| February 25, 2025 | | Christopher T. Holmes President and Chief Executive Officer (Principal Executive Officer) |
| | |
| | |
| | |
| | |
| | |
| | |
| | |
POWER OF ATTORNEY
KNOW ALL MEN BY THESE PRESENTS, that each person whose signature appears below constitutes and appoints Christopher T. Holmes and Michael M. Mettee and each of them, his or her true and lawful attorney(s)-in-fact and agent(s), with full power of substitution and resubstitution, for him or her and in his or her name, place and stead, in any and all capacities, to sign any or all amendments to this report and to file the same, with all exhibits and schedules thereto, and other documents in connection therewith, with the Securities and Exchange Commission, granting unto said attorney(s)-in-fact and agent(s) full power and authority to do and perform each and every act and thing requisite and necessary to be done in and about the premises, as fully to all intents and purposes as he or she might or could do in person, hereby ratifying and confirming all that said attorney(s)-in-fact and agent(s), or their substitute(s), may lawfully do or cause to be done by virtue hereof.
Pursuant to the requirements of the Securities Exchange Act of 1934, this report has been signed below by the following persons on behalf of the registrant and in the capacities and on the dates indicated.
| | | | | | | | | | | | | | |
| Signature | | Title | | Date |
| | | | |
| /s/ Christopher T. Holmes | | | | |
| Christopher T. Holmes | | Director, President and Chief Executive Officer | | February 25, 2025 |
| | (Principal Executive Officer) | | |
| | | | |
| /s/ Michael M. Mettee | | | | |
| Michael M. Mettee | | Chief Financial Officer | | February 25, 2025 |
| | (Principal Financial Officer) | | |
| | | | |
| /s/ Jonathan Pennington | | | | |
| Jonathan Pennington | | Chief Accounting Officer | | February 25, 2025 |
| | (Principal Accounting Officer) | | |
| | | | | |
| /s/ J. Jonathan Ayers | | | | |
| J. Jonathan Ayers | | Director | | February 25, 2025 |
| | | | | |
| /s/ William F. Carpenter III | | | | |
| William F. Carpenter III | | Chairman of the Board | | February 25, 2025 |
| | | | | |
| /s/ Agenia W. Clark | | | | |
| Agenia W. Clark | | Director | | February 25, 2025 |
| | | | | |
| /s/ James W. Cross IV | | | | |
| James W. Cross IV | | Director | | February 25, 2025 |
| | | | | |
| /s/ James L. Exum | | | | |
| James L. Exum | | Director | | February 25, 2025 |
| | | | |
| /s/ Orrin H. Ingram | | | | |
| Orrin H. Ingram | | Director | | February 25, 2025 |
| | | | | |
| /s/ R. Milton Johnson | | | | |
| R. Milton Johnson | | Director | | February 25, 2025 |
| | | | |
| /s/ Raja J. Jubran | | | | |
| Raja J. Jubran | | Director | | February 25, 2025 |
| | | | |
| /s/ C. Wright Pinson | | | | |
| C. Wright Pinson | | Director | | February 25, 2025 |
| | | | |
| /s/ Emily J. Reynolds | | | | |
| Emily J. Reynolds | | Director | | February 25, 2025 |
| | | | |
| /s/ Melody J. Sullivan | | | | |
| Melody J. Sullivan | | Director | | February 25, 2025 |