UNITED STATES
SECURITIES AND EXCHANGE COMMISSION
Washington, D.C. 20549
________
FORM N-CSRS
________
CERTIFIED SHAREHOLDER REPORT OF REGISTERED MANAGEMENT
INVESTMENT COMPANIES
Investment Company Act file number 811-23091
Gallery Trust
(Exact name of registrant as specified in charter)
________
SEI Investments
One Freedom Valley Drive
Oaks, PA 19456
(Address of principal executive offices) (Zip code)
Michael Beattie
C/O SEI Investments
One Freedom Valley Drive
Oaks, PA 19456
(Name and address of agent for service)
Registrant’s telephone number, including area code: 1-888-832-4386
Date of fiscal year end: March 31, 2019
Date of reporting period September 30, 2018
Item 1. Reports to Stockholders.
A copy of the report transmitted to stockholders pursuant to Rule 30e-1 under the Act (17 CFR § 270.30e-1) is attached hereto.
Mondrian Emerging Markets Equity Fund
Mondrian International Government Fixed Income Fund
(Each, a Series of Gallery Trust)
Semi-Annual Report
September 30, 2018
Investment Adviser: Mondrian Investment Partners Limited
|
TABLE OF CONTENTS
| | | |
Portfolio Performance Review
| | 1 | |
| Schedules of Investments | | 4 | |
Statements of Assets and Liabilities
| | 13 | |
Statements of Operations
| | 14 | |
| Statements of Changes in Net Assets | | 16 | |
Financial Highlights
| | 18 | |
Notes to Financial Statements
| | 20 | |
Disclosure of Fund Expenses
| | 38 | |
Approval of Investment Advisory Agreement
| | 40 | |
Fund Information
| | 44 | |
The Funds file their complete schedule of investments of fund holdings with the Securities and Exchange Commission (the “Commission”) for the first and third quarters of each fiscal year on Form N-Q within sixty days of the period end. The Funds’ N-Q forms are available on the Commission’s website at http://www.sec.gov, and may be reviewed and copied at the Commission’s Public Reference Room in Washington, DC. Information on the operation of the Public Reference Room may be obtained by calling 1-800-SEC-0330.
A description of the policies and procedures that the Funds use to determine how to vote proxies relating to fund securities, as well as information relating to how a Fund voted proxies relating to fund securities will be available (i) without charge, upon request, by calling 1-888-832-4386; and (ii) on the Commission’s website at http://www.sec.gov.
This report has been prepared for shareholders and may be distributed to others only if preceded or accompanied by an effective prospectus.
Mondrian Emerging Markets
Equity Fund
September 30, 2018 (Unaudited)
Mondrian Emerging Markets Equity Fund
(all returns in U.S. dollars)
Six months ended September 30, 2018
Against a backdrop of increasing interest rates, political volatility and ongoing trade tensions between the U.S. and China, investor sentiment towards emerging markets weakened, causing the MSCI Emerging Markets Index to fall 9.0% during the period. All regions and major markets posted negative returns although Latin America was particularly weak, down 13.8%. Asia relatively outperformed, down 7.6%, where India and Taiwan were notable outperformers.
The Mondrian Emerging Markets Equity Fund (the“Fund”) narrowly underperformed the benchmark index during the six-month period. Overweight positioning in Brazil, particularly exposure to the depreciating Brazilian real, and stock selection in India were the primary detractors from relative investment performance. This was offset by strong stock selection in Korea plus the benefits of the underweight allocation to the weak Chinese market, overweight to the outperforming Indian market, and underweight exposure to South Africa.
In India, the portfolio was correctly overweight in the market, but stock selection detracted despite strong performance from pharmaceutical manufacturer Lupin and the holding in HCL Technologies. Housing finance company Indiabulls posted weak returns towards the end of the period, while Vedanta underperformed on weakening commodity prices. Elsewhere in Asia stock selection was largely positive, particularly in Korea. The portfolio benefited from its holding in Korean battery maker Samsung SDI and the outperformance of SK Telecom. In China, the outperformance of financial services company Ping An, utility China Resources Power and telecom China Mobile, was offset somewhat by the position in pork producer WH Group which was negatively impacted by concerns over the potential impact of U.S.-China trade tariffs. Outside Asia, the portfolio’s overweight allocation to the underperforming Brazilian market and currency negatively impacted the portfolio; domestic Brazilian stocks and the currency suffered a sharp sell-off as uncertainty regarding the outcome of upcoming presidential elections, and a nationwide truckers’ strike that was only alleviated when the government agreed to subsidize diesel prices weighed heavily on sentiment. These factors negatively impacted the stock prices of domestically focused names such as toll road operator CCR, education provider Kroton, and financial Itau Unibanco. However, these impacts were offset by the strong performance of pulp and paper producer Suzano, which continued to benefit from rising pulp prices and the expected synergies from its announced merger with rival Fibria. Elsewhere, our exposure to Turkish banks through the holdings in Garanti and Halk holdings were particularly weak.
At the sector level, the underweight position in the strong energy sector detracted from relative returns, amidst a backdrop of rising oil prices. Small positive contribu-
1
Mondrian Emerging Markets
Equity Fund
September 30, 2018 (Unaudited)
PORTFOLIO PERFORMANCE REVIEW (continued)
tions were realized from the overweight allocation to the materials sector, and underweight positioning in the underperforming information technology sector, enhanced by positive stock selection in both sectors.
This material represents the Adviser’s assessment of the Fund and market environment at a specific point in time and should not be relied upon by the reader as research or investment advice.
The performance data quoted represents past performance and does not guarantee future results. The investment return and principal value of an investment will fluctuate so that an investor’s shares when redeemed may be worth more or less than their original cost and current performance may be lower or high than the performance quoted.
Investing involves risk, including the possible loss of principal. International investments entail risks not ordinarily associated with U.S. investments including fluctuation in currency values, differences in accounting principles, or economic or political instability in other nations. Emerging markets involve heightened risks related to the same factors, as well as increased volatility and lower trading volume. The Fund may invest in derivatives, which are often more volatile than other investments and may magnify the Fund’s gains or losses.
Definition of Comparative Index
The MSCI Emerging Markets Index is a free float-adjusted market capitalization index that is designed to measure equity market performance of emerging markets.
2
Mondrian International Government
Fixed Income Fund
September 30, 2018 (Unaudited)
PORTFOLIO PERFORMANCE REVIEW
Mondrian International Government Fixed Income Fund
(all returns in U.S. dollars)
Six months ended September 30, 2018
The FTSE Non-U.S. Dollar World Government Bond Index was down 7.2% in U.S. dollar unhedged terms over the six months ended September 30, 2018. The strongest performing markets were Canada (down 1.0%) and Mexico (down 1.5%). Both countries were buoyed by the announcement of the replacement of the North American Free Trade Agreement (NAFTA). The new agreement, the United States –Mexico – Canada Agreement (USMCA), secures the trading relationship between the nations that was threatened by the potential withdrawal of the U.S. from NAFTA. The weakest performing markets were the Eurozone (down 7.4%) and Japan (down 7.3%). Within the Eurozone, Italy was particularly weak, as a new government was formed that threatened a looser approach to fiscal policy.
The Mondrian International Government Fixed Income Fund (the “Fund”) outperformed the benchmark index over the six-month period. Overweight positions to Australia and New Zealand, both fully currency hedged, added to relative performance over the period. The overweight to Malaysia throughout the period and the underweight to the Eurozone periphery in the first part of the period also added to relative performance.
This material represents the Adviser’s assessment of the Fund and market environment at a specific point in time and should not be relied upon by the reader as research or investment advice.
The performance data quoted represents past performance and does not guarantee future results. The investment return and principal value of an investment will fluctuate so that an investor’s shares when redeemed may be worth more or less than their original cost and current performance may be lower or high than the performance quoted.
Investing involves risk, including the possible loss of principal. International investments entail risks not ordinarily associated with U.S. investments including fluctuation in currency values, differences in accounting principles, or economic or political instability in other nations. Bond and bond funds are subject to interest rate risk and will decline in value as interest rates rise. The Fund may invest in derivatives, which are often more volatile than other investments and may magnify the Fund’s gains or losses.
Definition of Comparative Index
The FTSE Non-U.S. Dollar World Government Bond Index (WGBI) measures the performance of fixed-rate, local currency, investment-grade sovereign bonds. The WGBI is a widely used benchmark that currently includes sovereign debt from over 20 countries, denominated in a variety of currencies, and has more than 30 years of history available. The WGBI provides a broad benchmark for the global sovereign fixed income market.
3
Mondrian Emerging Markets
Equity Fund
September 30, 2018 (Unaudited)
SCHEDULE OF INVESTMENTS
Sector Weightings†:
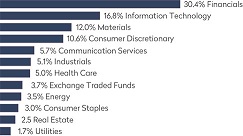
† Percentages based on total investments.| COMMON STOCK — 94.2% | | | | | | |
| | | | | | | |
| BRAZIL — 12.0% | | | | | | |
CCR SA | | | 479,600 | | | $ | 996,359 | |
Embraer SA ADR | | | 144,385 | | | | 2,828,502 | |
Hypera SA | | | 256,800 | | | | 1,811,599 | |
| Itau Unibanco Holding – Sponsored ADR Pref. | | | 216,834 | | | | 2,380,837 | |
Kroton Educacional SA | | | 398,200 | | | | 1,116,149 | |
Suzano Papel E Celulose SA | | | 199,500 | | | | | |
| Total Brazil | | | | | | | | |
| | | | | | | | | |
| CHINA — 18.5% | | | | | | | | |
| Brilliance China Automotive Holdings Ltd. | | | 410,000 | | | | 663,052 | |
| China Construction Bank Corp. Class H | | | 4,547,000 | | | | 3,972,929 | |
| China Medical System Holdings Ltd. | | | 921,000 | | | | 1,280,024 | |
China Mobile Ltd. | | | 349,000 | | | | 3,439,467 | |
| China Resources Power Holdings Co Ltd. | | | 887,291 | | | | 1,568,671 | |
| Dongfeng Motor Group Co Ltd. Class H | | | 1,340,000 | | | | 1,379,652 | |
| Ping An Insurance Group Co of China Ltd. Class H | | | 536,000 | | | | | |
| Total China | | | | | | | | |
The accompanying notes are an integral part of the financial statements.
4
Mondrian Emerging Markets
Equity Fund
September 30, 2018 (Unaudited)
| COMMON STOCK — continued | | | | | | | | |
| | | | | | | |
| HONG KONG — 5.9% | | | | | | | | |
Sands China Ltd. | | | 610,000 | | | $ | 2,762,332 | |
WH Group Ltd. | | | 4,066,000 | | | | | |
| Total Hong Kong | | | | | | | | |
| | | | | | | | | |
| INDIA — 12.7% | | | | | | | | |
Bajaj Auto Ltd. | | | 53,226 | | | | 1,973,268 | |
HCL Technologies Ltd. | | | 126,156 | | | | 1,893,123 | |
| Housing Development Finance Corp Ltd. | | | 56,199 | | | | 1,360,203 | |
Indiabulls Housing Finance Ltd. | | | 179,485 | | | | 2,121,558 | |
Larsen & Toubro Ltd. GDR | | | 52,644 | | | | 923,829 | |
Lupin Ltd. | | | 125,891 | | | | 1,564,650 | |
Vedanta Ltd. | | | 732,688 | | | | | |
| Total India | | | | | | | | |
| | | | | | | | | |
| INDONESIA — 1.4% | | | | | | | | |
| Bank Rakyat Indonesia Persero Tbk PT | | | 6,232,500 | | | | | |
| Total Indonesia | | | | | | | | |
| | | | | | | | | |
| MALAYSIA — 4.4% | | | | | | | | |
Genting Malaysia Bhd | | | 1,751,200 | | | | 2,111,511 | |
Malayan Banking Bhd | | | 887,700 | | | | | |
| Total Malaysia | | | | | | | | |
| | | | | | | | | |
| MEXICO — 2.4% | | | | | | | | |
| Fibra Uno Administracion SA de CV REIT | | | 1,757,815 | | | | | |
| Total Mexico | | | | | | | | |
| | | | | | | | | |
| PERU — 1.0% | | | | | | | | |
Credicorp Ltd. | | | 4,471 | | | | | |
| Total Peru | | | | | | | | |
| | | | | | | | | |
| RUSSIA — 4.6% | | | | | | | | |
Gazprom PJSC ADR | | | 434,348 | | | | 2,158,710 | |
LUKOIL PJSC ADR | | | 14,626 | | | | 1,118,011 | |
MMC Norilsk Nickel PJSC ADR | | | 66,889 | | | | | |
| Total Russia | | | | | | | | |
The accompanying notes are an integral part of the financial statements.
5
Mondrian Emerging Markets
Equity Fund
September 30, 2018 (Unaudited)
| COMMON STOCK — continued | | | | | | | | |
| | | | | | | |
| SOUTH AFRICA — 1.0% | | | | | | | | |
Sasol Ltd. | | | 25,012 | | | | | |
| Total South Africa | | | | | | | | |
| | | | | | | | | |
| SOUTH KOREA — 15.5% | | | | | | | | |
Korea Zinc Ltd. | | | 4,105 | | | | 1,613,505 | |
LG Chemical Ltd. | | | 7,101 | | | | 2,339,793 | |
Samsung Electronics Ltd. GDR | | | 4,826 | | | | 5,052,236 | |
Samsung SDI Co Ltd. | | | 6,921 | | | | 1,612,872 | |
Shinhan Financial Group Ltd. | | | 56,189 | | | | 2,279,472 | |
SK Telecom Co Ltd. | | | 7,598 | | | | | |
| Total South Korea | | | | | | | | |
| | | | | | | | | |
| TAIWAN — 10.1% | | | | | | | | |
| ASE Technology Holding Co Ltd. | | | 664,000 | | | | 1,620,149 | |
Mega Financial Holding Co Ltd. | | | 2,733,000 | | | | 2,461,517 | |
Taiwan SMC ADR | | | 127,760 | | | | | |
| Total Taiwan | | | | | | | | |
| | | | | | | | | |
| THAILAND — 1.4% | | | | | | | | |
Kasikornbank PCL NVDR | | | 199,300 | | | | | |
| Total Thailand | | | | | | | | |
| | | | | | | | | |
| TURKEY — 1.6% | | | | | | | | |
Turkiye Garanti Bankasi AS | | | 537,398 | | | | 686,540 | |
Turkiye Halk Bankasi AS | | | 786,244 | | | | | |
| Total Turkey | | | | | | | | |
| | | | | | | | | |
| UNITED ARAB EMIRATES — 1.2% | | | | | | | | |
First Abu Dhabi Bank PJSC | | | 305,713 | | | | | |
| Total United Arab Emirates | | | | | | | | |
| | | | | | | | | |
| UNITED KINGDOM — 0.5% | | | | | | | | |
Anglo American PLC | | | 21,641 | | | | | |
| Total United Kingdom | | | | | | | | |
| | | | | | | | | |
| Total Common Stock | | | | | | | | |
(Cost $90,931,988) | | | | | | | | |
The accompanying notes are an integral part of the financial statements.
6
Mondrian Emerging Markets
Equity Fund
September 30, 2018 (Unaudited)
| EXCHANGE TRADED FUNDS — 3.6% | | | | | | | | |
| | | | | | |
| | | | | | | | | |
| iShares MSCI Emerging Markets ETF | | | 55,315 | | | $ | 2,374,120 | |
iShares MSCI India ETF | | | 15,190 | | | | 493,219 | |
iShares MSCI Taiwan ETF | | | 15,788 | | | | | |
| Total Exchange Traded Funds | | | | | | | | |
(Cost $3,428,580) | | | | | | | | |
| Total Value of Securities — 97.8% | | | | | | | | |
(Cost $94,360,568) | | | | | | | | |
Percentages are based on Net Assets of $95,998,554.
ADR — American Depositary Receipt
ETF — Exchange Traded Fund
GDR — Global Depositary Receipt
Ltd. — Limited
MSCI — Morgan Stanley Capital International
NVDR — Non-Voting Depositary Receipt
PJSC — Public Joint-Stock Company
PLC — Public Limited Company
REIT — Real Estate Investment Trust
As of September 30, 2018, all of the Fund’s investments were considered Level 1, in accordance with the authoritative guidance on fair value measurements and disclosure under U.S. GAAP.
Transfers between investment levels may occur as markets fluctuate and/or the availability of data used in an investment’s valuation changes. The Fund generally recognizes transfers between the levels as of the end of the reporting period. As of September 30, 2018, there were transfers from Level 2 to Level 1 assets and liabilities. For the period ended September 30, 2018, the Fund held no Level 3 securities.
For more information on valuation inputs, see Note 2 in Notes to Financial Statements.
The accompanying notes are an integral part of the financial statements.
7
Mondrian International Government
Fixed Income Fund
September 30, 2018 (Unaudited)
SCHEDULE OF INVESTMENTS
Sector Weightings†:
† Percentages based on total investments.
| GLOBAL BONDS — 98.9% | | | | | | |
| | | | Face Amount
(Local Currency) | | | |
| AUSTRALIA — 8.0% | | | | | | |
| Australia Government Bond | | | | | | |
5.750%, 05/15/21 | | AUD | 155,000 | | $ | 122,531 | |
4.750%, 04/21/27 | | AUD | 1,200,000 | | | 1,008,635 | |
3.250%, 04/21/25 | | AUD | 2,050,000 | | | 1,551,064 | |
3.000%, 03/21/47 | | AUD | 600,000 | | | | |
| Total Australia | | | | | | | |
| | | | | | | | |
| AUSTRIA — 4.4% | | | | | | | |
| Republic of Austria Government Bond | | | | | | | |
6.250%, 07/15/27 | | EUR | 998,000 | | | | |
| Total Austria | | | | | | | |
| | | | | | | | |
| BELGIUM — 4.0% | | | | | | | |
| Kingdom of Belgium Government Bond | | | | | | | |
1.000%, 06/22/26 (A) | | EUR | 1,300,000 | | | | |
| Total Belgium | | | | | | | |
| | | | | | | | |
| CANADA — 4.0% | | | | | | | |
| Canadian Government Bond | | | | | | | |
5.000%, 06/01/37 | | CAD | 520,000 | | | 555,717 | |
1.500%, 06/01/26 | | CAD | 600,000 | | | 435,090 | |
0.750%, 09/01/21 | | CAD | 740,000 | | | | |
| Total Canada | | | | | | | |
| | | | | | | | |
| FINLAND — 4.6% | | | | | | | |
| Finland Government Bond | | | | | | | |
1.625%, 09/15/22 (A) | | EUR | 500,000 | | | 621,150 | |
0.500%, 09/15/27 (A) | | EUR | 1,000,000 | | | | |
| Total Finland | | | | | | | |
| | | | | | | | |
The accompanying notes are an integral part of the financial statements.
8
Mondrian International Government
Fixed Income Fund
September 30, 2018 (Unaudited)
| GLOBAL BONDS — continued | | | | | | | |
| | | | Face Amount
(Local Currency) | | | |
| FRANCE — 4.3% | | | | | | | |
| French Republic Government Bond OAT | | | | | | | |
0.000%, 05/25/20 (B) | | EUR | 1,410,000 | | | | |
| Total France | | | | | | | |
| | | | | | | | |
| GERMANY — 4.7% | | | | | | | |
| Kreditanstalt fuer Wiederaufbau International Finance | | | | | | | |
2.050%, 02/16/26 | | JPY | 180,000,000 | | | | |
| Total Germany | | | | | | | |
| | | | | | | | |
| ITALY — 11.6% | | | | | | | |
| Italy Buoni Poliennali Del Tesoro | | | | | | | |
4.750%, 09/01/44 (A) | | EUR | 700,000 | | | 955,210 | |
2.950%, 09/01/38 (A) | | EUR | 820,000 | | | 875,549 | |
2.000%, 02/01/28 | | EUR | 850,000 | | | 910,299 | |
1.450%, 05/15/25 | | EUR | 850,000 | | | 910,305 | |
0.050%, 04/15/21 | | EUR | 760,000 | | | | |
| Total Italy | | | | | | | |
| | | | | | | | |
| JAPAN — 13.6% | | | | | | | |
| Japan Government Five Year Bond | | | | | | | |
0.100%, 06/20/21 | | JPY | 19,500,000 | | | 172,529 | |
| Japan Government Ten Year Bond | | | | | | | |
0.100%, 06/20/26 | | JPY | 18,500,000 | | | 163,530 | |
| Japan Government Thirty Year Bond | | | | | | | |
2.400%, 12/20/34 | | JPY | 170,000,000 | | | 1,946,726 | |
| Japan Government Twenty Year Bond | | | | | | | |
1.600%, 06/20/30 | | JPY | 60,000,000 | | | 611,195 | |
0.200%, 06/20/36 | | JPY | 285,000,000 | | | | |
| Total Japan | | | | | | | |
| | | | | | | | |
| MALAYSIA — 2.9% | | | | | | | |
| Malaysia Government Bond | | | | | | | |
4.254%, 05/31/35 | | MYR | 670,000 | | | 153,607 | |
4.181%, 07/15/24 | | MYR | 4,000,000 | | | | |
| Total Malaysia | | | | | | | |
The accompanying notes are an integral part of the financial statements.
9
Mondrian International Government
Fixed Income Fund
September 30, 2018 (Unaudited)
| GLOBAL BONDS — continued | | | | | | | |
| | | | Face Amount
(Local Currency) | | | |
| MEXICO — 4.1% | | | | | | | |
| Mexican Bonos | | | | | | | |
7.750%, 11/23/34 | | MXN | 13,650,000 | | $ | 707,628 | |
7.500%, 06/03/27 | | MXN | 8,100,000 | | | 421,162 | |
6.500%, 06/10/21 | | MXN | 8,580,000 | | | | |
| Total Mexico | | | | | | | |
| | | | | | | | |
| NETHERLANDS — 4.4% | | | | | | | |
| Netherlands Government Bond | | | | | | | |
5.500%, 01/15/28 | | EUR | 738,490 | | | 1,249,295 | |
0.000%, 01/15/22 (A)(B) | | EUR | 388,000 | | | | |
| Total Netherlands | | | | | | | |
| | | | | | | | |
| NEW ZEALAND — 4.5% | | | | | | | |
| New Zealand Government Bond | | | | | | | |
5.500%, 04/15/23 | | NZD | 715,000 | | | 545,736 | |
4.500%, 04/15/27 | | NZD | 1,125,000 | | | 862,797 | |
2.750%, 04/15/37 | | NZD | 530,000 | | | | |
| Total New Zealand | | | | | | | |
| | | | | | | | |
| SINGAPORE — 4.6% | | | | | | | |
| Singapore Government Bond | | | | | | | |
2.875%, 09/01/30 | | SGD | 1,050,000 | | | 785,743 | |
2.375%, 06/01/25 | | SGD | 780,000 | | | 569,887 | |
2.000%, 07/01/20 | | SGD | 570,000 | | | | |
| Total Singapore | | | | | | | |
| | | | | | | | |
| SPAIN — 8.0% | | | | | | | |
| Spain Government Bond | | | | | | | |
4.200%, 01/31/37 (A) | | EUR | 750,000 | | | 1,148,307 | |
1.600%, 04/30/25 (A) | | EUR | 1,100,000 | | | 1,334,521 | |
1.400%, 01/31/20 | | EUR | 515,000 | | | | |
| Total Spain | | | | | | | |
| | | | | | | | |
| SUPRANATIONAL — 11.2% | | | | | | | |
| Asian Development Bank | | | | | | | |
2.350%, 06/21/27 | | JPY | 180,000,000 | | | 1,892,712 | |
| European Financial Stability Facility | | | | | | | |
0.950%, 02/14/28 | | EUR | 500,000 | | | 586,533 | |
The accompanying notes are an integral part of the financial statements.
10
Mondrian International Government
Fixed Income Fund
September 30, 2018 (Unaudited)
| GLOBAL BONDS — continued | | | | | | | |
| | | Face Amount
(Local Currency) | | | |
| SUPRANATIONAL — continued | | | | | | | |
| European Investment Bank | | | | | | | |
2.150%, 01/18/27 | | JPY | 180,000,000 | | | | |
| Total Supranational | | | | | | | |
| | | | | | | | |
| Total Global Bonds | | | | | | | |
(Cost $37,838,852) | | | | | | | |
| | | | | | | | |
| Total Value of Securities — 98.9% | | | | | | | |
(Cost $37,838,852) | | | | | | | |
A list of the open forward foreign currency exchange contracts held by the Fund at September 30, 2018 is as follows:
| Counterparty | Maturity Date | Currency to Deliver | | Currency to Receive | | | Unrealized Appreciation (Depreciation) | |
| Brown Brothers Harriman | 10/31/18 | USD | | | 35,856 | | AUD | | 49,500 | | | $ | (67 | ) |
| Brown Brothers Harriman | 10/31/18 | USD | | | 8,802 | | SGD | | 12,000 | | | | (17 | ) |
| Brown Brothers Harriman | 10/31/18 | USD | | | 5,134,777 | | GBP | | 3,914,000 | | | | (26,018 | ) |
| Brown Brothers Harriman | 10/31/18 | USD | | | 1,209,987 | | SEK | | 10,599,000 | | | | (14,290 | ) |
| Brown Brothers Harriman | 10/31/18 | AUD | | | 4,333,000 | | USD | | 3,158,540 | | | | 25,724 | |
| Brown Brothers Harriman | 10/31/18 | NZD | | | 2,670,000 | | USD | | 1,785,215 | | | | 15,070 | |
| Brown Brothers Harriman | 10/31/18 | SGD | | | 2,425,000 | | USD | | 1,778,511 | | | | 3,336 | |
| Brown Brothers Harriman | 10/31/18 | EUR | | | 357,000 | | USD | | 421,032 | | | | 5,500 | |
| State Street | 10/31/18 | GBP | | | 3,599,500 | | USD | | 4,661,135 | | | | (37,122 | ) |
| State Street | 10/31/18 | AUD | | | 8,447,500 | | USD | | 6,235,716 | | | | 128,061 | |
| State Street | 10/31/18 | USD | | | 6,015,970 | | AUD | | 8,242,500 | | | | (56,532 | ) |
| State Street | 10/31/18 | USD | | | 628,703 | | EUR | | 534,000 | | | | (7,152 | ) |
| State Street | 10/31/18 | USD | | | 3,510,729 | | NZD | | 5,252,500 | | | | (28,450 | ) |
| State Street | 10/31/18 | USD | | | 2,678,305 | | SGD | | 3,651,500 | | | | (5,294 | ) |
| State Street | 10/31/18 | GBP | | | 4,181,500 | | USD | | 5,486,787 | | | | 28,874 | |
| State Street | 10/31/18 | SEK | | | 10,599,000 | | USD | | 1,209,987 | | | | 14,290 | |
| State Street | 10/31/18 | NZD | | | 5,245,500 | | USD | | 3,549,777 | | | | 72,138 | |
| State Street | 10/31/18 | USD | | | 2,361,198 | | SEK | | 20,783,500 | | | | (16,566 | ) |
| State Street | 10/31/18 | USD | | | 10,230,350 | | GBP | | 7,781,000 | | | | (74,180 | ) |
| State Street | 10/31/18 | NZD | | | 77,000 | | USD | | 50,598 | | | | (451 | ) |
| State Street | 10/31/18 | SGD | | | 30,000 | | USD | | 21,815 | | | | (146 | ) |
| State Street | 10/31/18 | SGD | | | 4,930,000 | | USD | | 3,622,935 | | | | 14,023 | |
| State Street | 10/31/18 | USD | | | 147,686 | | AUD | | 205,000 | | | | 532 | |
| State Street | 10/31/18 | USD | | | 46,105 | | NZD | | 70,000 | | | | 303 | |
| State Street | 10/31/18 | USD | | | 955,572 | | SGD | | 1,308,500 | | | | 2,289 | |
| State Street | 10/31/18 | SEK | | | 10,184,500 | | USD | | 1,126,321 | | | | (22,614 | ) |
| State Street | 10/31/18 | USD | | | 156,959 | | EUR | | 135,000 | | | | 175 | |
| State Street | 10/31/18 | EUR | | | 669,000 | | USD | | 783,370 | | | | 4,684 | |
| Net Unrealized Appreciation on Forward Foreign Currency Exchange Contracts | | | $ | 26,100 | |
The accompanying notes are an integral part of the financial statements.
11
Mondrian International Government
Fixed Income Fund
September 30, 2018 (Unaudited)
Percentages are based on Net Assets of $38,715,206.
(A) Securities sold within terms of a private placement memorandum, exempt from regis- tration under Section 144A of the Securities Act of 1933, as amended, and may be sold only to dealers in that program or other “accredited investors.” The total value of such securities at September 30, 2018 was $8,098,883 and represents 20.9% of Net Assets.
(B) Zero Coupon Bond. The effective yield at the time of purchase is negative.
AUD — Australian Dollar
CAD — Canadian Dollar
EUR — Euro
GBP — British Pound Sterling
JPY — Japanese Yen
MXN — Mexican Peso
MYR — Malaysian Ringgit
NZD — New Zealand Dollar
SGD — Singapore Dollar
SEK — Swedish Krona
USD — United States Dollar
The following is a list of the inputs used as of September 30, 2018, in valuing the Fund’s investments carried at market value:
Investments in Securities | | | | | | | | | | | | |
| Global Bonds | | | | | | | | | | | | | | | | |
| Total Investments in Securities | | | | | | | | | | | | | | | | |
Other Financial Instruments | | | | | | | | | | | | |
| Forwards Contracts* | | | | | | | | | | | | |
| Unrealized Appreciation | | $ | — | | | $ | 314,999 | | | $ | — | | | $ | 314,999 | |
| Unrealized Depreciation | | | | | | | | | | | | | | | | |
| Total Other Financial Instruments | | | | | | | | | | | | | | | | |
* Forward foreign currency exchange contracts are valued at the unrealized appreciation (depreciation) on the instrument.
For the period ended September 30, 2018, there were no transfers between Level 1 and Level 2 assets and liabilities. For the period ended September 30, 2018, the Fund held no Level 3 securities. The Fund generally recognizes transfers between the levels as of the end of the reporting period.
Amounts designated as “—” are $0 or have been rounded to $0.
For more information on valuation inputs, see Note 2 in Notes to Financial Statements.
The accompanying notes are an integral part of the financial statements.
12
September 30, 2018 (Unaudited)
| STATEMENTS OF ASSETS AND LIABILITIES | | | | | | |
| | | Mondrian Emerging Markets
Equity Fund | | | Mondrian International Government Fixed
Income Fund | |
Assets: | | | | | | |
| Investments (Cost $94,360,568 and $37,838,852) | | $ | 93,887,085 | | | $ | 38,284,734 | |
| Foreign currency (Cost $12,791,950 and $—) | | | 12,793,405 | | | | — | |
Cash | | | — | | | | 202,451 | |
| Receivable for investment securities sold | | | 14,821,996 | | | | — | |
Dividends receivable | | | 398,817 | | | | 285,292 | |
Reclaims receivable | | | 27,398 | | | | — | |
Receivable for capital shares sold | | | — | | | | 64,014 | |
Unrealized appreciation on forward foreign currency contracts | | | | | | | | |
Total assets | | | | | | | | |
| Liabilities: | | | | | | | | |
| Payable for investment securities purchased | | | 15,127,421 | | | | — | |
Payable to custodian | | | 10,748,326 | | | | — | |
Audit fees payable | | | 26,889 | | | | 30,578 | |
| Payable due to Investment Adviser | | | 9,477 | | | | 3,376 | |
| Unrealized depreciation on spot foreign currency contracts | | | 3,217 | | | | — | |
Payable due to Administrator | | | 1,900 | | | | 773 | |
| Payable for capital shares redeemed | | | 123 | | | | 101,645 | |
| Chief Compliance Officer fees payable | | | 65 | | | | 25 | |
Payable due to Trustees | | | 18 | | | | 7 | |
Unrealized depreciation on forward foreign currency contracts | | | — | | | | 288,899 | |
Other accrued expenses | | | | | | | | |
Total liabilities | | | | | | | | |
Net assets | | | | | | | | |
| Net assets consist of: | | | | | | | | |
Paid-in capital | | $ | 200,930,349 | | | $ | 39,700,944 | |
| Undistributed (distributions in excess of) net investment income | | | 1,047,860 | | | | (1,635,784 | ) |
| Accumulated net realized gain/(loss) on investments and foreign currency transactions | | | (105,484,236 | ) | | | 184,209 | |
| Net unrealized appreciation/(depreciation) on investments | | | (473,483 | ) | | | 445,882 | |
| Net unrealized appreciation/(depreciation) on forward foreign currency contracts and foreign currency transactions and translations | | | | | | | | |
Net assets | | | | | | | | |
| Outstanding Shares of Beneficial Interest (unlimited authorization - no par value) | | | | | | | | |
Net Asset Value, Offering and Redemption Price Per Share | | | | | | | | |
Amounts designated as “—” are $0 or have been rounded to $0.
The accompanying notes are an integral part of the financial statements.
13
For the Six Months Ended September 30, 2018 (Unaudited)
| STATEMENTS OF OPERATIONS | | | |
| | | Mondrian Emerging Markets
Equity Fund(1) | |
| Investment income | | | |
Dividends | | $ | 6,256,280 | |
Less: foreign taxes withheld | | | | |
Total investment income | | | | |
| Expenses | | | | |
Investment advisory fees | | | 1,203,813 | |
Custodian fees | | | 126,348 | |
Accounting and administration fees | | | 36,256 | |
Legal fees | | | 31,704 | |
Other | | | 29,211 | |
Audit and tax | | | 26,889 | |
Registration fees | | | 21,455 | |
Printing fees | | | 15,784 | |
Shareholder services expenses | | | 14,504 | |
Trustees’ fees and expenses | | | 10,234 | |
Interest expense | | | 1,119 | |
Chief Compliance Officer fees | | | | |
Total expenses | | | | |
| Less: | | | | |
Investment advisory fees waived | | | | |
Net expenses | | | | |
Net investment income | | | | |
| Net realized gain/(loss) on: | | | | |
Investments | | | 8,349,242 | |
Foreign currency transactions | | | (560,331 | ) |
Foreign currency exchange contracts | | | | |
Net realized gain | | | | |
| Net change in unrealized appreciation/(depreciation) on: | | | | |
Investments | | | (41,417,620 | ) |
| Change in accrued foreign capital gains tax on appreciated securities | | | 356,649 | |
| Foreign currency transactions and translation of other assets and liabilities denominated in foreign currency | | | | |
| Net change in unrealized appreciation/(depreciation) | | | | |
Net realized and unrealized loss | | | | |
| Net decrease in net assets resulting from operations | | | | |
| (1) | On September 24, 2018, the Laudus Mondrian Emerging Markets Fund (the “Emerging Markets Predecessor Fund”) was reorganized into the Gallery Trust Mondrian Emerging Markets Equity Fund. Information presented prior to September 24, 2018 is that of the Emerging Markets Predecessor Fund. See Note 1 in Notes to Financial Statements. |
The accompanying notes are an integral part of the financial statements.
14
For the Six Months Ended September 30, 2018 (Unaudited)
| STATEMENTS OF OPERATIONS | | | |
| | | Mondrian International Government Fixed
Income Fund(1) | |
| Investment income | | | |
Dividends | | $ | 5,660 | |
Interest | | | | |
Total investment income | | | | |
| Expenses | | | | |
Investment advisory fees | | | 219,060 | |
Audit and tax | | | 25,737 | |
Registration fees | | | 14,645 | |
Printing fees | | | 13,596 | |
Shareholder services expenses | | | 13,249 | |
Accounting and administration fees | | | 11,327 | |
Custodian fees | | | 8,010 | |
Trustees’ fees and expenses | | | 7,739 | |
Legal fees | | | 5,353 | |
Other | | | 2,664 | |
Interest expense | | | 108 | |
Chief Compliance Officer fees | | | | |
Total expenses | | | | |
| Less: | | | | |
Investment advisory fees waived | | | | |
Net expenses | | | | |
Net investment income | | | | |
| Net realized gain/(loss) on: | | | | |
Investments | | | 308,031 | |
Foreign currency transactions | | | 171,165 | |
Foreign currency exchange contracts | | | | |
Net realized gain | | | | |
| Net change in unrealized appreciation/(depreciation) on: | | | | |
Investments | | | (5,073,207 | ) |
| Foreign currency transactions and translation of other assets and liabilities denominated in foreign currency | | | (18,729 | ) |
Foreign currency exchange contracts | | | | |
| Net change in unrealized appreciation/(depreciation) | | | | |
Net realized and unrealized loss | | | | |
| Net decrease in net assets resulting from operations | | | | |
| (1) | On September 24, 2018, the Laudus Mondrian International Government Fixed Income Fund (the “Fixed Income Predecessor Fund”) was reorganized into the Gallery Trust Mondrian International Government Fixed Income Fund. Information presented prior to September 24, 2018 is that of the Fixed Income Predecessor Fund. See Note 1 in Notes to Financial Statements. |
The accompanying notes are an integral part of the financial statements.
15
Mondrian Emerging Markets
Equity Fund
| STATEMENTS OF CHANGES IN NET ASSETS | |
| | | Six-month period ended September 30, 2018(1)
(Unaudited) | | | | |
| Operations: | | | | | | |
Net investment income | | $ | 4,166,623 | | | $ | 7,460,054 | |
| Net realized gain on investments and foreign currency transactions | | | 7,780,761 | | | | 9,866,867 | |
Net change in unrealized appreciation/(depreciation) on investments, foreign currency transactions and translation of other assets and liabilities denominated in foreign currency | | | | | | | | |
Net increase/(decrease) in net assets resulting from operations | | | | | | | | |
| Dividends and distributions from: | | | | | | | | |
Net investment income | | | | | | | | |
Total dividends and distributions | | | | | | | | |
Capital share transactions(2): | | | | | | | | |
Issued | | | 3,512,492 | | | | 39,445,892 | |
Reinvestment of dividends | | | 2,844,738 | | | | 8,123,300 | |
Redeemed | | | | | | | | |
Net decrease in net assets from capital share transactions | | | | | | | | |
Total decrease in net assets | | | | | | | | |
| Net assets: | | | | | | | | |
Beginning of period | | | | | | | | |
End of period | | | | | | | | |
Undistributed/(distributions in excess of) net investment income | | | | | | | | |
| (1) | On September 24, 2018, the Laudus Mondrian Emerging Markets Fund (the “Emerging Markets Predecessor Fund”) was reorganized into the Gallery Trust Mondrian Emerging Markets Equity Fund. Information presented prior to September 24, 2018 is that of the Emerging Markets Predecessor Fund. See Note 1 in Notes to Financial Statements. |
| (2) | See Note 8 – Share transactions in Notes to the Financial Statements. |
The accompanying notes are an integral part of the financial statements.
16
Mondrian International Government
Fixed Income Fund
| STATEMENTS OF CHANGES IN NET ASSETS | | | | | | |
| | | Six-month period ended September 30, 2018(1)
(Unaudited) | | | | |
| Operations: | | | | | | |
Net investment income | | $ | 335,295 | | | $ | 750,412 | |
Net realized gain on investments and foreign currency transactions | | | 379,874 | | | | 842,379 | |
Net change in unrealized appreciation/(depreciation) on investments, foreign currency transactions and translation of other assets and liabilities denominated in foreign currency | | | | | | | | |
Net increase/(decrease) in net assets resulting from operations | | | | | | | | |
| Dividends and distributions from: | | | | | | | | |
Net investment income | | | — | | | | (12,784 | ) |
Net realized gains | | | | | | | | |
Total dividends and distributions | | | | | | | | |
Capital share transactions(2): | | | | | | | | |
Issued | | | 4,280,475 | | | | 6,608,676 | |
Reinvestment of dividends | | | 276,836 | | | | 9,308 | |
Redeemed | | | | | | | | |
Net decrease in net assets from capital share transactions | | | | | | | | |
Total decrease in net assets | | | | | | | | |
| Net assets: | | | | | | | | |
Beginning of period | | | | | | | | |
End of period | | | | | | | | |
| Distributions in excess of net investment income | | | | | | | | |
| (1) | On September 24, 2018, the Laudus Mondrian International Government Fixed Income Fund (the “Fixed Income Predecessor Fund”) was reorganized into the Gallery Trust Mondrian International Government Fixed Income Fund. Information presented prior to September 24, 2018 is that of the Fixed Income Predecessor Fund. See Note 1 in Notes to Financial Statements. |
| (2) | See Note 8 – Share transactions in Notes to the Financial Statements. |
Amounts designated as “—” are $0 or have been rounded to $0.
The accompanying notes are an integral part of the financial statements.
17
Mondrian Emerging Markets
Equity Fund
| FINANCIAL HIGHLIGHTS | |
Selected per share data & ratios
for a share outstanding throughout the period | |
| | | Six-month period
ended 9/30/18
(Unaudited)(2) | | | Year
Ended
3/31/18(3) | | | Year
Ended
3/31/17 | | | Year
Ended
3/31/16 | | | Year
Ended
3/31/15 | | | Year
Ended
3/31/14 | |
Net asset value, beginning of period | | | | | | | | | | | | | | | | | | | | | | | | |
Income/(loss) from operations:(1) | | | | | | | | | | | | | | | | | | | | | | | | |
| Net investment income | | | 0.14 | | | | 0.19 | | | | 0.14 | | | | 0.14 | | | | 0.12 | | | | 0.14 | |
| Net realized and unrealized gain/(loss) on investments | | | | | | | | | | | | | | | | | | | | | | | | |
| Total gain/(loss) from operations | | | | | | | | | | | | | | | | | | | | | | | | |
| Dividends and distributions from: | | | | | | | | | | | | | | | | | | | | | | | | |
| Net investment income | | | (0.22 | ) | | | (0.23 | ) | | | (0.18 | ) | | | (0.09 | ) | | | (0.24 | ) | | | (0.11 | ) |
| Net realized gains | | | | | | | | | | | | | | | | | | | | | | | | |
| Total dividends and distributions | | | | | | | | | | | | | | | | | | | | | | | | |
| Net asset value, end of period | | | | | | | | | | | | | | | | | | | | | | | | |
Total return† | | | | | | | | | | | | | | | | | | | | | | | | |
| Ratios and supplemental data | | | | | | | | | | | | | | | | | | | | | | | | |
Net assets, end of period ($ Thousands) | | $ | 95,999 | | | $ | 314,259 | | | $ | 336,896 | | | $ | 406,462 | | | $ | 559,347 | | | $ | 121,795 | |
| Ratio of expenses to average net assets (including waivers and reimbursements) | | | 1.20 | %* | | | 1.19 | %(4) | | | 1.20 | % | | | 1.20 | % | | | 1.29 | %(5) | | | 1.45 | % |
| Ratio of expenses to average net assets (excluding waivers and reimbursements) | | | 1.26 | %* | | | 1.21 | %(4) | | | 1.22 | % | | | 1.21 | % | | | 1.31 | % | | | 1.52 | % |
| Ratio of net investment income to average net assets | | | 3.46 | %* | | | 2.30 | %(4) | | | 1.92 | % | | | 1.87 | % | | | 1.42 | % | | | 1.55 | % |
| Portfolio turnover rate | | | 38 | %** | | | 39 | % | | | 32 | % | | | 28 | % | | | 30 | %(6) | | | 69 | % |
| ** | Portfolio turnover is for the period indicated and has not been annualized. |
† | Total return is for the period indicated and has not been annualized. Returns shown do not reflect the deductions of taxes that a shareholder would pay on Fund distributions or the redemption of Fund shares. Total return may have been lower had the Adviser not waived its fee and/or reimbursed other expenses. |
| (1) | Per share calculations were performed using average shares for the period. |
| (2) | On September 24, 2018, the Laudus Mondrian Emerging Markets Fund (the “Emerging Markets Predecessor Fund”) was reorganized into the Gallery Trust Mondrian Emerging Markets Equity Fund. Information presented prior to September 24, 2018 is that of the Emerging Markets Predecessor Fund. See Note 1 in Notes to Financial Statements. |
| (3) | Effective July 25, 2017, the Investor Share class, the Select Share class, and the Institutional Share class were consolidated into a single class of shares of the fund. The financial history as shown in the financial highlights is that of the former Institutional Shares. |
| (4) | The ratio of net operating expenses and gross operating expenses would have been 1.20% and 1.22%, respectively, and the ratio of net investment income would have been 2.29%, if the custody out-of-pocket fee reimbursement had not been included. |
| (5) | Effective October 1, 2014, the annual operating expense was reduced. The ratio presented for period ended 3/31/15 is a blended ratio. |
| (6) | Portfolio turnover excludes the impact of investment activity from a merger with another fund. |
| (7) | Value is less than ($0.005) per share. |
Amounts designated as “—” are $0 or have been rounded to $0.
The accompanying notes are an integral part of the financial statements.
18
Mondrian International Government
Fixed Income Fund
| FINANCIAL HIGHLIGHTS | |
Selected per share data & ratios
for a share outstanding throughout the period | |
| | | Six-month period
ended 9/30/18
(Unaudited)(2) | | | Year
Ended
3/31/18 | | | Year
Ended
3/31/17 | | | Year
Ended
3/31/16 | | | Year
Ended
3/31/15 | | | Year
Ended
3/31/14 | |
Net asset value, beginning of period | | | | | | | | | | | | | | | | | | | | | | | | |
Income/(loss) from operations:(1) | | | | | | | | | | | | | | | | | | | | | | | | |
| Net investment income | | | 0.05 | | | | 0.08 | | | | 0.09 | | | | 0.11 | | | | 0.15 | | | | 0.16 | |
| Net realized and unrealized gain/(loss) on investments | | | | | | | | | | | | | | | | | | | | | | | | |
| Total gain/(loss) from operations | | | | | | | | | | | | | | | | | | | | | | | | |
| Dividends and distributions from: | | | | | | | | | | | | | | | | | | | | | | | | |
| Net investment income | | | — | | | | (0.00 | )(3) | | | (0.00 | )(3) | | | — | | | | — | | | | — | |
| Net realized gains | | | | | | | | | | | | | | | | | | | | | | | | |
| Total dividends and distributions | | | | | | | | | | | | | | | | | | | | | | | | |
| Net asset value, end of period | | | | | | | | | | | | | | | | | | | | | | | | |
Total return† | | | | | | | | | | | | | | | | | | | | | | | | |
| Ratios and supplemental data | | | | | | | | | | | | | | | | | | | | | | | | |
Net assets, end of period ($ Thousands) | | $ | 38,715 | | | $ | 84,330 | | | $ | 95,565 | | | $ | 119,938 | | | $ | 187,388 | | | $ | 652,647 | |
| Ratio of expenses to average net assets (including waivers and reimbursements) | | | 0.75 | %* | | | 0.74 | %(4) | | | 0.75 | % | | | 0.75 | % | | | 0.74 | % | | | 0.69 | % |
| Ratio of expenses to average net assets (excluding waivers and reimbursements) | | | 0.88 | %* | | | 0.81 | %(4) | | | 0.79 | % | | | 0.81 | % | | | 0.76 | % | | | 0.69 | % |
| Ratio of net investment income to average net assets | | | 0.92 | %* | | | 0.84 | %(4) | | | 0.87 | % | | | 1.21 | % | | | 1.39 | % | | | 1.48 | % |
| Portfolio turnover rate | | | 21 | %** | | | 52 | % | | | 98 | % | | | 31 | % | | | 50 | % | | | 52 | % |
| ** | Portfolio turnover is for the period indicated and has not been annualized. |
| † | Total return is for the period indicated and has not been annualized. Returns shown do not reflect the deductions of taxes that a shareholder would pay on Fund distributions or the redemption of Fund shares. Total return may have been lower had the Adviser not waived its fee and/or reimbursed other expenses. |
| (1) | Per share calculations were performed using average shares for the period. |
| (2) | On September 24, 2018, the Laudus Mondrian International Government Fixed Income Fund (the “Fixed Income Predecessor Fund”) was reorganized into the Gallery Trust Mondrian International Government Fixed Income Fund. Information presented prior to September 24, 2018 is that of the Fixed Income Predecessor Fund. See Note 1 in Notes to Financial Statements. |
| (3) | Value is less than ($0.005) per share. |
| (4) | The ratio of net operating expenses and gross operating expenses would have been 0.75% and 0.82%, respectively, and the ratio of net investment income would have been 0.83%, if the custody out-of-pocket fee reimbursement had not been included. |
Amounts designated as “—” are $0 or have been rounded to $0.
The accompanying notes are an integral part of the financial statements.
19
September 30, 2018 (Unaudited)
NOTES TO FINANCIAL STATEMENTS1. Organization
Gallery Trust (the “Trust”), is organized as a Delaware statutory trust under an Agreement and Declaration of Trust dated August 25, 2015. The Trust is registered under the Investment Company Act of 1940 (the “1940 Act”), as amended, as an open-end investment management company with three funds. The financial statements herein are those of the Mondrian Emerging Markets Equity Fund (the “Emerging Markets Fund”) and the Mondrian International Government Fixed Income Fund (the “Fixed Income Fund”) (each a “Fund” and collectively the “Funds”). The Emerging Markets Fund is classified as a diversified investment company and the Fixed Income Fund is classified as a “non-diversified” investment company under the 1940 Act. The investment objective of the Emerging Markets Fund is to seek long-term capital appreciation. The investment objective of the Fixed Income Fund is to seek long-term total return consistent with its value-oriented investment approach. Mondrian Investment Partners Limited, a limited company organized under the laws of England and Wales in 1990, serves as the Funds’ investment adviser (“Mondrian” or the “Adviser”). The Adviser makes investment decisions for the Funds and continuously reviews, supervises and administers the investment program of the Funds, subject to the supervision of, and policies established by, the Trustees of the Trust.
The Funds operated as Laudus Mondrian Emerging Markets Fund (the “Emerging Markets Predecessor Fund”) and Laudus Mondrian International Government Fixed Income Fund (the “Fixed Income Predecessor Fund”) (and, together with the Emerging Markets Predecessor Fund, the “Predecessor Funds”), a series of Laudus Trust. Each Predecessor Fund was managed by Charles Schwab Investment Management, Inc. (the “Predecessor Adviser”), and sub-advised by Mondrian. Each Fund has the same objective and substantially similar investment strategies as those of its Predecessor Fund. Each Fund acquired the assets and assumed all of the liabilities of its Predecessor Fund (the “Reorganization”) on September 24, 2018 in a tax-free transaction. The Funds had no operations prior to the Reorganization. The financial statements and financial highlights reflect the financial information of the Predecessor Funds for periods prior to September 24, 2018.
2. Significant accounting policies
The following are significant accounting policies, which are consistently followed in the preparation of the financial statements of the Funds. The Funds are investment companies that apply the accounting and reporting guidance issued in Topic 946 by the U.S. Financial Accounting Standards Board (“FASB”).
20
September 30, 2018 (Unaudited)
NOTES TO FINANCIAL STATEMENTS (continued)Use of estimates — The preparation of financial statements in conformity with U.S. generally accepted accounting principles (“U.S. GAAP”) requires management to make estimates and assumptions that affect the fair value of assets, the reported amounts of assets and liabilities and disclosure of contingent assets and liabilities at the date of the financial statements and the reported amount of increases and decreases in net assets from operations during the reporting period. Actual results could differ from those estimates and such differences could be material.
Valuation of investments — Securities listed on a securities exchange, market or automated quotation system for which quotations are readily available (except for securities traded on NASDAQ), including securities traded over the counter, are valued at the last quoted sale price on an exchange or market (foreign or domestic) on which they are traded on valuation date (or at approximately 4:00 pm ET if a security’s primary exchange is normally open at that time), or, if there is no such reported sale on the valuation date, at the most recent quoted bid price. For securities traded on NASDAQ, the NASDAQ Official Closing Price will be used. If available, debt securities are priced based upon valuations provided by recognized independent, third-party pricing agents. Such values generally reflect the last reported sales price if the security is actively traded. The third-party pricing agents may also value debt securities by employing methodologies that utilize actual market transactions, broker-supplied valuations, or other methodologies designed to identify the market value for such securities. Such methodologies generally consider such factors as security prices, yields, maturities, call features, ratings and developments relating to specific securities in arriving at valuations. Debt securities with remaining maturities of sixty days or less may be valued at their amortized cost, which approximates market value. If such prices are not available or determined to not represent the fair value of the security as of each Fund’s pricing time, the security will be valued at fair value as determined in good faith using methods approved by the Board of Trustees (the “Board”). The prices for foreign securities will be reported in local currency and converted to U.S. dollars using currency exchange rates.
Securities for which market prices are not “readily available” are valued in accordance with fair value procedures established by the Board. The Funds’ fair value procedures are implemented through a fair value pricing committee (the “Committee”) designated by the Board. Some of the more common reasons that may necessitate that a security be valued using fair value procedures include: the security’s trading has been halted or suspended; the security has been de-listed from a national exchange; the
21
September 30, 2018 (Unaudited)
security’s primary trading market is temporarily closed at a time when under normal conditions it would be open; or the security’s primary pricing source is not able or willing to provide a price. When a security is valued in accordance with the fair value procedures, the Committee will determine the value after taking into consideration relevant information reasonably available to the Committee.
For securities that principally trade on a foreign market or exchange, a significant gap in time can exist between the time of a particular security’s last trade and the time at which the Fund calculates its net asset value. The closing prices of such securities may no longer reflect their market value at the time the Fund calculates net asset value if an event that could materially affect the value of those securities (a “Significant Event”) has occurred between the time of the security’s last close and the time that the Fund calculates net asset value. A Significant Event may relate to a single issuer or to an entire market sector. If the Funds’ Adviser becomes aware of a Significant Event that has occurred with respect to a security or group of securities after the closing of the exchange or market on which the security or securities principally trade, but before the time at which the Fund calculates net asset value, it may request that a Committee meeting be called.
The Funds use MarkIt Fair Value (“MarkIt”) as a third party fair valuation vendor. MarkIt provides a fair value for foreign securities held by the Funds based on certain factors and methodologies (involving, generally, tracking valuation correlations between the U.S. market and each non-U.S. security) applied by MarkIt in the event that there is a movement in the U.S. market that exceeds a specific threshold that has been established by the Committee. The Committee has also established a “confidence interval” which is used to determine the level of correlation between the value of a foreign security and movements in the U.S. market before a particular security is fair valued when the threshold is exceeded. In the event that the threshold established by the Committee is exceeded on a specific day, the Funds value the non-U.S. securities in their portfolios that exceed the applicable “confidence interval” based upon the fair values provided by MarkIt. In such event, it is not necessary to hold a Committee meeting. In the event that the Adviser believes that the fair values provided by MarkIt are not reliable, the Adviser contacts the Funds’ Administrator and requests that a meeting of the Committee be held.
If a local market in which the Fund owns securities is closed for one or more days, the Fund shall value all securities held in the corresponding currency
22
September 30, 2018 (Unaudited)
NOTES TO FINANCIAL STATEMENTS (continued)
based on the fair value prices provided by MarkIt using the predetermined confidence interval discussed above.
In accordance with the authoritative guidance on fair value measurements and disclosure under U.S. GAAP, the Funds disclose the fair value of their investments in a hierarchy that prioritizes the inputs to valuation techniques used to measure the fair value. The objective of a fair value measurement is to determine the price that would be received to sell an asset or paid to transfer a liability in an orderly transaction between market participants at the measurement date (an exit price). Accordingly, the fair value hierarchy gives the highest priority to quoted prices (unadjusted) in active markets for identical assets or liabilities (Level 1) and the lowest priority to unobservable inputs (Level 3). The three levels of the fair value hierarchy are described below:
Level 1 — Inputs are unadjusted, quoted prices in active markets for identical assets or liabilities at the measurement date.
Level 2 — Inputs other than quoted prices included in Level 1 that are observable for the asset or liability, either directly or indirectly. Level 2 inputs include quoted prices for similar instruments in active markets, and inputs other than quoted prices that are observable for the asset or liability.
Level 3 — Inputs are unobservable inputs for the asset or liability, and include situations where there is little, if any, market activity for the asset or liability.
Investments are classified within the level of the lowest significant input considered in determining fair value. Investments classified within Level 3 whose fair value measurement considers several inputs may include Level 1 or Level 2 inputs as components of the overall fair value measurement.
Fair value measurement classifications are summarized in the Funds’ Schedule of Investments.
For the six months ended September 30, 2018, there have been no significant changes to the Funds’ fair valuation methodology.
Federal income taxes — It is each Fund’s intention to continue to qualify as a regulated investment company for Federal income tax purposes by complying with the appropriate provisions of Subchapter M of the Internal Revenue Code of 1986. Accordingly, no provision for Federal income taxes has been made in the financial statements.
23
September 30, 2018 (Unaudited)
NOTES TO FINANCIAL STATEMENTS (continued)The Funds evaluate tax positions taken or expected to be taken in the course of preparing the Funds’ tax returns to determine whether it is “more-likely-than-not” (i.e., greater than 50-percent) that each tax position will be sustained upon examination by a taxing authority based on the technical merits of the position. Tax positions not deemed to meet the more-likely-than-not threshold are recorded as a tax benefit or expense in the current year. The Funds did not record any tax provision in the current period. However, management’s conclusions regarding tax positions taken may be subject to review and adjustment at a later date based on factors including, but not limited to, examination by tax authorities (i.e., the last three tax year ends, as applicable), on-going analysis of and changes to tax laws, regulations and interpretations thereof.
As of and during the six months ended September 30, 2018, the Funds did not have a liability for any unrecognized tax benefits. The Funds recognize interest and penalties, if any, related to unrecognized tax benefits as income tax expense in the Statement of Operations. During the six months ended September 30, 2018, the Funds did not incur any interest or penalties.
Security transactions, dividend and investment income — Security transactions are accounted for on trade date basis for financial reporting purposes. Costs used in determining realized gains and losses on the sale of investment securities are based on the specific identification method. Dividend income is recognized on the ex-dividend date. Interest income is recognized on the accrual basis from settlement date. Purchase discounts and premiums on debt securities are accreted and amortized to maturity and included in interest income. Certain dividends from foreign securities will be recorded as soon as the Fund is informed of the dividend, net of withholding taxes, if such information is obtained subsequent to the ex-dividend date.
Foreign currency translation — The books and records of the Funds are maintained in U.S. dollars. Investment securities and other assets and liabilities denominated in a foreign currency are translated into U.S. dollars on the date of valuation. The Funds do not isolate that portion of realized or unrealized gains and losses resulting from changes in the foreign exchange rate from fluctuations arising from changes in the market prices of the securities. These gains and losses are included in net realized and unrealized gains and losses on investments on the Statement of Operations.
Net realized and unrealized gains and losses on foreign currency transactions represent net foreign exchange gains or losses from foreign currency exchange contracts, disposition of foreign currencies, currency gains or
24
September 30, 2018 (Unaudited)
NOTES TO FINANCIAL STATEMENTS (continued)
losses realized between trade and settlement dates on securities transactions and the difference between the amount of the investment income and foreign withholding taxes recorded on the Funds’ books and the U.S. dollar equivalent of the amounts actually received or paid.
Forward Foreign Currency Contracts — The Funds may enter into forward foreign currency contracts as hedges against either specific transactions, fund positions or anticipated fund positions. The Funds may also engage in currency transactions to enhance the Funds’ returns. All commitments are “marked-to-market” daily at the applicable foreign exchange rate, and any resulting unrealized gains or losses are recorded currently. The Funds realize gains and losses at the time forward contracts are closed. Unrealized gains or losses on outstanding positions in forward foreign currency contracts held at the close of the period are recognized as ordinary income or loss for Federal income tax purposes. The Funds could be exposed to risk if the counterparties to the contracts are unable to meet the terms of the contract and from unanticipated movements in the value of a foreign currency relative to the U.S. dollar. Finally, the risk exists that losses could exceed amounts disclosed on the Statement of Assets and Liabilities. Refer to each Fund’s Schedule of Investments for details regarding open forward foreign currency contracts as of September 30, 2018, if applicable.
For the six months ended September 30, 2018, the average balances of forward foreign currency exchange contracts were as follows:
| Average Monthly Notional Contracts Purchased | | $ | 18,157,431 | |
| Average Monthly Notional Contracts Sold | | | (19,212,845 | ) |
To reduce counterparty risk with respect to Over-the-Counter (“OTC”) transactions, the Funds have entered into netting arrangements, established within the Funds’ International Swap and Derivatives Association, Inc. (“ISDA”) master agreements, which allow the Funds to make (or to have an entitlement to receive) a single net payment in the event of default (close-out netting) for outstanding payables and receivables with respect to certain OTC positions in forward foreign currency contracts for each individual counterparty. In addition, the Funds may require that certain counterparties post cash and/or securities in collateral accounts to cover their net payment obligations for those derivative contracts subject to ISDA master agreements. If the counterparty fails to perform under these contracts and agreements, the cash and/or securities will be made available to the Funds.
25
September 30, 2018 (Unaudited)
NOTES TO FINANCIAL STATEMENTS (continued)For financial reporting purposes, the Funds do not offset derivative assets and derivative liabilities that are subject to netting arrangements in the Statement of Assets and Liabilities. Bankruptcy or insolvency laws of a particular jurisdiction may impose restrictions on or prohibitions against the right of offset in bankruptcy, insolvency or other events.
Collateral terms are contract specific for OTC derivatives. For derivatives traded under an ISDA master agreement, the collateral requirements are typically calculated by netting the mark to market amount of each transaction under such agreement and comparing that amount to the value of any collateral currently pledged by the Funds or the counterparty.
For financial reporting purposes, cash collateral that has been pledged to cover obligations of the Fund, if any, is reported separately on the Statement of Assets and Liabilities as cash pledged as collateral. Non-cash collateral pledged by the Fund, if any, is noted in the Schedule of Investments. Generally, the amount of collateral due from or to a party must exceed a minimum transfer amount threshold before a transfer has to be made. To the extent amounts due to the Fund from its counterparties are not fully collateralized, contractually or otherwise, the Fund bears the risk of loss from counterparty nonperformance.
The following is a summary by counterparty of the market value of OTC financial derivative instruments and collateral (received)/pledged for the Fixed Income Fund as of September 30, 2018:
| Counterparty | | Gross Assets Recognized in the Statement of Assets and Liabilities | | | Gross Liabilities Recognized in the Statement of Assets and Liabilities | | | Net Amount Available to be Offset | | | Cash Collateral Pledged or (Received) | | | Net Amount† | |
| Brown Brothers Harriman | | $ | 49,630 | | | $ | (40,392 | ) | | $ | 9,238 | | | $ | — | | | $ | 9,238 | |
| State Street Bank & Trust Co. | | | | | | | | | | | | | | | | | | | | |
| Total | | | | | | | | | | | | | | | | | | | | |
† |
| Represents the net receivable/(payable) that would be due from/to the counterparty in the event of default. Exposure from OTC financial derivative instruments can only be netted across transactions governed under the same master agreement with the same legal entity. |
Dividends and distributions to shareholders — The Emerging Markets Fund distributes its net investment income at least annually. The Fixed Income Fund distributes its net investment income quarterly. For each Fund, net
26
September 30, 2018 (Unaudited)
NOTES TO FINANCIAL STATEMENTS (continued)realized capital gains, if any, are distributed at least annually. All distributions are recorded on ex-dividend date.
Expenses — Expenses that are directly related to the Fund are charged to the Fund. Other operating expenses of the Trust are prorated to the funds based on the number of funds and/or relative daily net assets.
3. Transactions with affiliates
Certain officers of the Trust are also employees of SEI Investments Global Funds Services (the “Administrator”), a wholly owned subsidiary of SEI Investments Company, and/or SEI Investments Distribution Co. (the “Distributor”). Such officers are paid no fees by the Trust, other than the Chief Compliance Officer (“CCO”) as described below, for serving as officers of the Trust.
A portion of the services provided by the CCO and his staff, who are employees of the Administrator, are paid for by the Trust as incurred. The services include regulatory oversight of the Trust’s advisors and service providers, as required by SEC regulations. The CCO’s services and fees have been approved by and are reviewed by the Board.
4. Administration, Custodian, Transfer Agent and Distribution Agreements
Effective September 24, 2018, the Funds and the Administrator are parties to an Administration Agreement under which the Administrator provides administrative services to the Funds. For these services, the Administrator is paid an asset based fee, which will vary depending on the number of share classes and the average daily net assets of the Funds. For the period from September 24, 2018 to September 30, 2018, the Emerging Markets Fund and Fixed Income Fund paid $1,900 and $773, respectively, for these services. Prior to September 24, 2018, the Predecessor Funds entered into an administrative services agreement with State Street Bank and Trust Company (“State Street”) pursuant to which the Predecessor Funds agreed to pay State Street for certain costs incurred in providing administrative and accounting services to the Predecessor Funds. The Emerging Markets Predecessor Fund and Fixed Income Predecessor Fund paid $34,356 and $10,554, respectively, for these services. Expenses incurred under the agreements are shown on the Statement of Operations as “Accounting and administration fees”.
Brown Brothers Harriman & Co., (the “Custodian”) serves as the Funds’ Custodian pursuant to a custody agreement. Atlantic Shareholder Services, LLC (the “Transfer Agent”) serves as the Fund’s Transfer Agent pursuant to a transfer agency agreement.
27
September 30, 2018 (Unaudited)
NOTES TO FINANCIAL STATEMENTS (continued)
5. Investment Advisory Agreement
Effective September 24, 2018, under the terms of an investment advisory agreement, the Adviser provides investment advisory services to the Funds. The Adviser is entitled to a fee, which is calculated daily and paid monthly, at an annual rate of 0.75% of the average daily net assets of the Emerging Markets Fund and 0.50% of the average daily net assets of the Fixed Income Fund. Prior to September 24, 2018, the Predecessor Adviser was paid a fee at an annual rate of 1.00% of the Emerging Markets Predecessor Fund’s average daily net assets and 0.60% of the average daily net assets of the Fixed Income Predecessor Fund’s average daily net assets. The Predecessor Adviser paid Mondrian a sub-advisory fee for its services as sub-adviser to each Predecessor Fund out of the advisory fees that the Predecessor Adviser received from the Predecessor Fund.
Effective September 24, 2018, the Adviser has contractually agreed to reduce its fees and/or reimburse expenses to the extent necessary to keep total annual operating expenses (excluding interest, taxes, brokerage commissions, acquired fund fees and expenses, and non-routine expenses (collectively “excluded expenses”)) from exceeding 0.92% and 0.60% of the average daily net assets of the Emerging Markets Fund and Fixed Income Fund, respectively, until February 28, 2021 (the “Expense Limitation”). This agreement may be terminated: (i) by the Board of Trustees of the Trust, for any reason at any time; or (ii) by the Adviser, upon ninety (90) days’ prior written notice to the Trust, effective as of the close of business on February 28, 2021.
Prior to September 24, 2018, the Predecessor Adviser had contractually agreed through July 30, 2019, to limit the total annual fund operating expenses charged, excluding interest, taxes and certain non-routine expenses to 1.20% and 0.75% of the average daily net assets of the Emerging Markets Predecessor Fund and Fixed Income Predecessor Fund respectively.
6. Investment transactions
The cost of purchases and proceeds from security sales other than long-term U.S. Government and short-term securities for the six months ended September 30, 2018, are as follows:
| | | | | | | |
| Emerging Markets Fund | | $ | 85,556,587 | | | $ | 312,794,935 | |
| Fixed Income Fund | | | 14,115,718 | | | | 54,581,311 | |
There were no purchases or sales of long-term U.S. Government securities.
28
September 30, 2018 (Unaudited)
NOTES TO FINANCIAL STATEMENTS (continued)
7. Federal tax information
The amount and character of income and capital gain distributions to be paid, if any, are determined in accordance with Federal income tax regulations, which may differ from U.S. GAAP. As a result, net investment income/(loss) and net realized gain/(loss) on investment transactions for a reporting period may differ significantly from distributions during such period. These book/tax differences may be temporary or permanent. To the extent these differences are permanent in nature, they are charged or credited to undistributed net investment income/ (loss), accumulated net realized gain/(loss) or paid-in capital, as appropriate, in the period that the differences arise.
The tax character of dividends and distributions declared during the last two fiscal years were as follows:
| | | | | | | | | | | |
| Emerging Markets Fund | 2018 | | $ | 8,413,005 | | | $ | — | | | $ | 8,413,005 | |
| 2017 | | | 9,543,878 | | | | — | | | | 9,543,878 | |
| Fixed Income Fund | 2018 | | | 12,784 | | | | — | | | | 12,784 | |
| 2017 | | | 14,676 | | | | 761,942 | | | | 776,618 | |
As of March 31, 2018, the components of distributable earnings on a tax basis were as follows:
| | | | | | | |
| Undistributed ordinary income | | $ | 2,884,344 | | | $ | — | |
| Undistributed long-term capital gains | | | — | | | | 356,817 | |
| Net unrealized appreciation (depreciation) on investments | | | 27,506,659 | | | | 3,620,050 | |
| Net other unrealized appreciation (depreciation) | | | | | | | | |
| Total distributable earnings | | | | | | | | |
Under the Regulated Investment Company Modernization Act of 2010, the Funds are permitted to carry forward capital losses incurred in taxable years beginning after December 22, 2010 for an unlimited period. Additionally, post-enactment capital losses that are carried forward will retain their character as either short-term or long-term capital losses rather than being considered all short-term as under previous law. The capital loss carryforwards, all of which are not subject to expiration, are noted below:
29
September 30, 2018 (Unaudited)
NOTES TO FINANCIAL STATEMENTS (continued)
| | | | | | | | | | |
| Emerging Markets Fund | | $ | 11,552,916 | | | $ | 91,392,462 | | | $ | 102,945,378 | |
During the year ended March 31, 2018, the Emerging Markets Fund utilized capital loss carryforwards of $2,582,862 to offset capital gains.The Federal tax cost and aggregate gross unrealized appreciation and depreciation for the investments held by the Fund at September 30, 2018, were as follows:
| | | | | | Aggregate Gross Unrealized Appreciation | | | Aggregate Gross Unrealized Depreciation | | | Net Unrealized Appreciation (Depreciation) | |
| Emerging Markets Fund | | $ | 94,360,568 | | | $ | 5,162,032 | | | $ | (5,635,515 | ) | | $ | (473,483 | ) |
| Fixed Income Fund | | | 37,838,852 | | | | 1,111,019 | | | | (665,137 | ) | | | 445,882 | |
8. Share Transactions
The share transactions are shown below:
| | | | |
| | | Six-month period ended September 30, 2018 (Unaudited) | | | Year ended March 31, 2018(2) | |
| Shares transactions: | | | | | | |
Issued | | | 419,352 | | | | 4,763,454 | |
Reinvestment of dividends | | | 382,872 | | | | 990,646 | |
Redeemed | | | | | | | | |
| Net decrease in shares outstanding | | | | | | | | |
| | | | |
| | | Six-month period ended September 30, 2018 (Unaudited) | | | | |
| Shares transactions: | | | | | | |
Issued | | | 419,257 | | | | 665,839 | |
Reinvestment of dividends | | | 28,105 | | | | 938 | |
Redeemed | | | | | | | | |
| Net decrease in shares outstanding | | | | | | | | |
30
September 30, 2018 (Unaudited)
NOTES TO FINANCIAL STATEMENTS (continued)
(1) On September 24, 2018, the Laudus Mondrian Emerging Markets Fund (the “Emerging Markets Predecessor Fund”) was reorganized into the Gallery Trust Mondrian Emerging Markets Equity Fund. Information presented prior to September 24, 2018 is that of the Emerging Markets Predecessor Fund. See Note 1.
(2) Effective July 25, 2017, the Investor Share class, the Select Share class, and the Institutional Share class were consolidated into a single class of shares of the Fund.
(3) On September 24, 2018, the Laudus Mondrian International Government Fixed Income Fund (the “Fixed Income Predecessor Fund”) was reorganized into the Gallery Trust Mondrian International Government Fixed Income Fund. Information presented prior to September 24, 2018 is that of the Fixed Income Predecessor Fund. See Note 1.
9. Risks associated with financial instruments
As with all mutual funds, a shareholder of a fund is subject to the risk that his or her investment could lose money. The Funds are subject to the principal risks noted below, any of which may adversely affect the Fund’s net asset value and ability to meet its investment objective. A more complete description of risks associated with the Funds is included in the prospectus.
Active management risk
The Funds are subject to the risk that the Adviser’s judgments about the attractiveness, value, or potential appreciation of the Funds’ investments may prove to be incorrect. If the investments selected and strategies employed by the Funds fail to produce the intended results, the Funds could underperform in comparison to its benchmark index or other funds with similar objectives and investment strategies.
Equity risk
Since it purchases equity securities, the Emerging Markets Fund is subject to the risk that stock prices may fall over short or extended periods of time. Historically, the equity markets have moved in cycles, and the value of the Fund’s equity securities may fluctuate from day to day. Individual companies may report poor results or be negatively affected by industry and/or economic trends and developments. The prices of securities issued by such companies may suffer a decline in response. These factors contribute to price volatility, which is the principal risk of investing in the Fund.
Convertible securities risk
The value of a convertible security is influenced by changes in interest rates (with investment value declining as interest rates increase and increasing as interest rates decline) and the credit standing of the issuer. The price of a convertible security will also normally vary in some proportion to changes in the price of the underlying common stock because of the conversion or exercise feature.
31
September 30, 2018 (Unaudited)
NOTES TO FINANCIAL STATEMENTS (continued)
Large capitalization company risk
The large capitalization companies in which the Emerging Markets Fund may invest may lag the performance of smaller capitalization companies because large capitalization companies may experience slower rates of growth than smaller capitalization companies and may not respond as quickly to market changes and opportunities.
Foreign company risk
Investing in foreign companies, including direct investments and investments through depositary receipts, poses additional risks since political and economic events unique to a country or region will affect those markets and their issuers. These risks will not necessarily affect the U.S. economy or similar issuers located in the U.S. Securities of foreign companies may not be registered with the SEC and foreign companies are generally not subject to the regulatory controls imposed on U.S. issuers and, as a consequence, there is generally less publically available information about foreign securities than is available about domestic securities. Income from foreign securities owned by the Funds may be reduced by a withholding tax at the source, which tax would reduce income received from the securities comprising the portfolio. Foreign securities may also be more difficult to value than securities of U.S. issuers.While depositary receipts provide an alternative to directly purchasing the underlying foreign securities in their respective national markets and currencies, investments in depositary receipts continue to be subject to many of the risks associated with investing directly in foreign securities.
Emerging markets securities risk
The Funds’ investments in emerging markets securities are considered speculative and subject to heightened risks in addition to the general risks of investing in foreign securities. Unlike more established markets, emerging markets may have governments that are less stable, markets that are less liquid and economies that are less developed. In addition, the securities markets of emerging market countries may consist of companies with smaller market capitalizations and may suffer periods of relative illiquidity; significant price volatility; restrictions on foreign investment; and possible restrictions on repatriation of investment income and capital. Furthermore, foreign investors may be required to register the proceeds of sales, and future economic or political crises could lead to price controls, forced mergers, expropriation or confiscatory taxation, seizure, nationalization or creation of government monopolies.
32
September 30, 2018 (Unaudited)
NOTES TO FINANCIAL STATEMENTS (continued)
Foreign currency risk
As a result of the Funds’ investments in securities denominated in, and/or receiving revenues in, foreign currencies, the Funds will be subject to currency risk. Currency risk is the risk that foreign currencies will decline in value relative to the U.S. dollar or, in the case of hedging positions, that the U.S. dollar will decline in value relative to the currency hedged. In either event, the dollar value of an investment in the Fund would be adversely affected.
Depositary receipts risk
Investments in depositary receipts may be less liquid and more volatile than the underlying securities in their primary trading market. If a depositary receipt is denominated in a different currency than its underlying securities, the Funds will be subject to the currency risk of both the investment in the depositary receipt and the underlying security. Holders of depositary receipts may have limited or no rights to take action with respect to the underlying securities or to compel the issuer of the receipts to take action. The prices of depositary receipts may differ from the prices of securities upon which they are based. Certain of the depositary receipts in which the Fund invests may be unsponsored depositary receipts. Unsponsored depositary receipts may not provide as much information about the underlying issuer and may not carry the same voting privileges as sponsored depositary receipts. Unsponsored depositary receipts are issued by one or more depositaries in response to market demand, but without a formal agreement with the company that issues the underlying securities.
Derivatives risk
The Funds’ use of forward contracts and participatory notes is subject to market risk, correlation risk, credit risk, valuation risk and liquidity risk. Market risk is the risk that the market value of an investment may move up and down, sometimes rapidly and unpredictably. Correlation risk is the risk that changes in the value of the derivative may not correlate perfectly or at all with the underlying asset, rate or index. Credit risk is the risk that the counterparty to a derivative contract will default or otherwise become unable to honor a financial obligation. Valuation risk is the risk that the derivative may be difficult to value. Liquidity risk is described below. The Funds’ use of forwards is also subject to leverage risk and hedging risk. Leverage risk is the risk that the use of leverage may amplify the effects of market volatility on the Fund’s share price and may also cause the Fund to liquidate portfolio positions when it would not be advantageous to do so in order to satisfy its obligations. Hedging risk is the risk that derivatives instruments used for hedging purposes may also limit any potential gain that may result from the increase in value of the hedged asset. To the extent that the
33
September 30, 2018 (Unaudited)
NOTES TO FINANCIAL STATEMENTS (continued)
Funds engage in hedging strategies, there can be no assurance that such strategy will be effective or that there will be a hedge in place at any given time. Each of these risks could cause the Funds to lose more than the principal amount invested in a derivative instrument.
Liquidity risk
Certain securities may be difficult or impossible to sell at the time and the price that the Fund would like. The Fund may have to lower the price, sell other securities instead or forgo an investment opportunity, any of which could have a negative effect on Fund management or performance.
Portfolio turnover risk
Due to their investment strategies, the Funds may buy and sell securities frequently. This may result in higher transaction costs and additional capital gains tax liabilities.
Large purchase and redemption risk
Large purchases or redemptions of the Fund’s shares may force the Fund to purchase or sell securities at times when it would not otherwise do so, and may cause the Fund’s portfolio turnover rate and transaction costs to rise, which may negatively affect the Fund’s performance and have adverse tax consequences for Fund shareholders.
Fixed income risk
Fixed income securities are subject to a number of risks, including credit and interest rate risks. Credit risk is the risk that the issuer or obligor will not make timely payments of principal and interest. Changes in an issuer’s credit rating or the market’s perception of an issuer’s creditworthiness may also affect the value of the Fund’s investment in that issuer. Interest rate risk is the risk that the value of a fixed income security will fall when interest rates rise. In general, the longer the maturity of a fixed income security, the more likely its value will decline when interest rates rise. Risks associated with rising interest rates are heightened given that interest rates in the U.S. are at, or near, historic lows.
Zero-coupon bond risk
The market value of a zero-coupon bond is generally more volatile than the market value of other fixed income securities with similar maturities that pay interest periodically. In addition, federal income tax law requires that the holder of a zero coupon bond accrue a portion of the discount at which the bond was purchased as taxable income each year. The Fund may consequently have to dispose of portfolio securities under disadvantageous circumstances to generate
34
September 30, 2018 (Unaudited)
NOTES TO FINANCIAL STATEMENTS (continued)
cash to satisfy its requirement as a regulated investment company to distribute all of its net income (including non-cash income attributable to zero-coupon securities). These actions may reduce the assets to which the Fund’s expenses could otherwise be allocated and may reduce the Fund’s rate of return.
Foreign sovereign debt securities risk
The Fixed Income Fund’s investments in foreign sovereign debt securities are subject to the risks that: (i) the governmental entity that controls the repayment of sovereign debt may not be willing or able to repay the principal and/or interest when it becomes due, due to factors such as debt service burden, political constraints, cash flow problems and other national economic factors; (ii) governments may default on their debt securities, which may require holders of such securities to participate in debt rescheduling or additional lending to defaulting governments; and (iii) there is no bankruptcy proceeding by which defaulted sovereign debt may be collected in whole or in part.
Foreign government agencies risk
Bonds issued by government agencies, subdivisions or instrumentalities of foreign governments are generally backed only by the general creditworthiness and reputation of the entity issuing the bonds and may not be backed by the full faith and credit of the foreign government. Moreover, a foreign government that explicitly provides its full faith and credit to a particular entity may be, due to changed circumstances, unable or unwilling to provide that support. A foreign government agency’s operations and financial condition are influenced by the foreign government’s economic and other policies.
Supranational entities risk
Government members, or “stockholders,” usually make initial capital contributions to a supranational entity and in many cases are committed to make additional capital contributions if the supranational entity is unable to repay its borrowings. There is no guarantee, however, that one or more stockholders of the supranational entity will continue to make any necessary additional capital contributions. If such contributions are not made, the entity may be unable to pay interest or repay principal on its debt securities, and the Fund may lose money on such investments.
Corporate fixed income securities risk
Corporate fixed income securities respond to economic developments, especially changes in interest rates, as well as perceptions of the creditworthiness and business prospects of individual issuers.
35
September 30, 2018 (Unaudited)
NOTES TO FINANCIAL STATEMENTS (continued)
Non-diversification risk
The Fixed Income Fund is classified as “non-diversified,” which means it may invest a larger percentage of its assets in a smaller number of issuers than a diversified fund. To the extent the Fund invests its assets in a smaller number of issuers, the Fund will be more susceptible to negative events affecting those issuers than a diversified fund.
10. Indemnifications
In the normal course of business, the Funds enter into contracts that provide general indemnifications. The Funds’ maximum exposure under these arrangements is dependent on future claims that may be made against the Funds and, therefore, cannot be established; however, based on experience, the risk of loss from such claims is considered remote.
11. Borrowing from banks
The Funds have access to custodian overdraft facilities. A Fund may have utilized the overdraft facility and incurred an interest expense, which is disclosed on the fund’s Statement of Operations, if any. The interest expense is determined based on a negotiated rate above the current Federal Funds Rate.
12. Other
At September 30, 2018, the percentage of total shares outstanding held by a limited number of shareholders for each Fund, which were comprised of omnibus accounts that were held on behalf of various individual shareholders was as follows:
| | | | | | | |
| Emerging Markets Fund | | | 5 | | | | 81 | % |
| Fixed Income Fund | | | 3 | | | | 82 | % |
13. New accounting pronouncement
In August 2018, the FASB issued Accounting Standards Update 2018-13, Fair Value Measurement (Topic 820). The new guidance includes additions and modifications to disclosures requirements for fair value measurements. For public entities, the amendments are effective for financial statements issued for fiscal years beginning after December 15, 2019, and interim periods within those fiscal years. At this time, management is currently evaluating the impact of this new guidance on the financial statements and disclosures.
36
September 30, 2018 (Unaudited)
NOTES TO FINANCIAL STATEMENTS (concluded)
14. Subsequent events
At a meeting held on June 13, 2018 the Board of Trustees of Gallery Trust approved a change in the Funds’ fiscal year end from September 30th to October 31st. The change in fiscal year end is effective on October 31, 2018.
The Funds have evaluated the need for disclosures and/or adjustments resulting from subsequent events through the date the financials were issued. Based on this evaluation, no disclosures and/or adjustments were required to the financial statements as of September 30, 2018.
37
September 30, 2018 (Unaudited)
DISCLOSURE OF FUND EXPENSES
All mutual funds have operating expenses. As a shareholder of a mutual fund, your investment is affected by these ongoing costs, which include (among others) costs for fund management, administrative services, and shareholder reports like this one. It is important for you to understand the impact of these costs on your investment returns.
Operating expenses such as these are deducted from the mutual fund’s gross income and directly reduce its final investment return. These expenses are expressed as a percentage of the mutual fund’s average net assets; this percentage is known as the mutual fund’s expense ratio.
The following examples use the expense ratio and are intended to help you understand the ongoing costs (in dollars) of investing in your Fund and to compare these costs with those of other mutual funds. The examples are based on an investment of $1,000 made at the beginning of the period shown and held for the entire period from April 1, 2018 to September 30, 2018.
The table on the next page illustrates your Fund’s costs in two ways:
Actual Fund Return. This section helps you to estimate the actual expenses after fee waivers that your Fund incurred over the period. The “Expenses Paid During Period” column shows the actual dollar expense cost incurred by a $1,000 investment in the Fund, and the “Ending Account Value” number is derived from deducting that expense cost from the Fund’s gross investment return.
You can use this information, together with the actual amount you invested in the Fund, to estimate the expenses you paid over that period. Simply divide your ending starting account value by $1,000 to arrive at a ratio (for example, an $8,600 account value divided by $1,000 = 8.6), then multiply that ratio by the number shown for your Fund under “Expenses Paid During Period.”
Hypothetical 5% Return. This section helps you compare your Fund’s costs with those of other mutual funds. It assumes that the Fund had an annual 5% return before expenses during the year, but that the expense ratio (Column 3) for the period is unchanged. This example is useful in making comparisons because the Securities and Exchange Commission requires all mutual funds to make this 5% calculation. You can assess your Fund’s comparative cost by comparing the hypothetical result for your Fund in the “Expenses Paid During Period” column with those that appear in the same charts in the shareholder reports for other mutual funds.
38
September 30, 2018 (Unaudited)
DISCLOSURE OF FUND EXPENSES (concluded)
Note: Because the return is set at 5% for comparison purposes — NOT your Fund’s actual return — the account values shown may not apply to your specific investment.
| | | Beginning
Account
Value
4/1/18 | | | Ending
Account
Value
9/30/18 | | |
Annualized Expense Ratios | | | Expenses
Paid During Period* | |
Mondrian Emerging Markets Equity Fund | |
| Actual Fund Return | | $ | 1,000.00 | | | $ | 901.30 | | | | 1.20 | % | | $ | 5.72 | |
| Hypothetical 5% Return | | $ | 1,000.00 | | | $ | 1,019.05 | | | | 1.20 | % | | $ | 6.07 | |
Mondrian International Government Fixed Income Fund | |
| Actual Fund Return | | $ | 1,000.00 | | | $ | 942.40 | | | | 0.75 | % | | $ | 3.65 | |
| Hypothetical 5% Return | | $ | 1,000.00 | | | $ | 1,021.31 | | | | 0.75 | % | | $ | 3.80 | |
* Expenses are equal to the Fund’s annualized expense ratio multiplied by the average account value over the period, multiplied by 183/365 (to reflect the one-half year period.)
39
September 30, 2018 (Unaudited)
APPROVAL OF INVESTMENT ADVISORY AGREEMENT
Pursuant to Section 15 of the Investment Company Act of 1940 (the “1940 Act”), the advisory agreement (the “Agreement”) of the Mondrian Emerging Markets Equity Fund and the Mondrian International Government Fixed Income Fund (the “Funds”) must be approved: (i) by a vote of a majority of the shareholders of the Funds; and (ii) by the vote of a majority of the members of the Board of Trustees (the “Board” or the “Trustees”) of Gallery Trust (the “Trust”) who are not parties to the Agreement or “interested persons” of any party thereto, as defined in the 1940 Act (the “Independent Trustees”), cast in person at a meeting called for the purpose of voting on such approval.
A Board meeting was held on June 13, 2018 to decide whether to approve the Agreement for an initial two-year term. At the meeting, the Board also considered the proposed reorganization of the Laudus Mondrian Emerging Markets Fund and the Laudus Mondrian International Government Fixed Income Fund (the “Predecessor Funds”), each a series of Laudus Trust, into the Mondrian Emerging Markets Equity Fund and the Mondrian International Government Fixed Income Fund, respectively. The Predecessor Funds commenced operations on November 2, 2007 and were advised by Charles Schwab Investment Management, Inc. and sub-advised by Mondrian Investment Partners Limited (“Mondrian” or the “Adviser”). In considering the approval of the Agreement, the Board considered that Mondrian would serve as the investment adviser of the Funds and that the portfolio management team of each Fund was expected to be the same or substantially the same as the portfolio management team of the corresponding Predecessor Fund. In preparation for the meeting, the Trustees requested that the Adviser furnish information necessary to evaluate the terms of the Agreement. The Trustees used this information, as well as other information that the Adviser and other service providers of the Funds presented or submitted to the Board at the meeting, to help them decide whether to approve the Agreement for an initial two-year term.
Specifically, the Board requested and received written materials from the Adviser and other service providers of the Funds regarding: (i) the nature, extent and quality of the services to be provided by the Adviser; (ii) the Adviser’s investment management personnel; (iii) the Adviser’s operations; (iv) the Adviser’s brokerage practices (including any soft dollar arrangements) and investment strategies; (v) the Funds’ proposed advisory fees to be paid to the Adviser and overall fees and operating expenses compared with peer groups of mutual funds; (vi) the Adviser’s compliance program, including a description of material compliance matters and material compliance violations; (vii) the Adviser’s policies on and compliance procedures for personal securities transactions; (viii) the Adviser’s investment experience; (ix) the Adviser’s rationale for introducing
40
September 30, 2018 (Unaudited)
APPROVAL OF INVESTMENT ADVISORY AGREEMENT (continued)
the Funds as well as the Funds’ proposed objectives and strategies; and (x) the performance of the Predecessor Funds.
Representatives from the Adviser, along with other Fund service providers, presented additional information and participated in question and answer sessions at the meeting to help the Trustees evaluate the Adviser’s services, fees and other aspects of the Agreement. The Independent Trustees received advice from independent counsel and met in executive session outside the presence of Fund management and the Adviser.
At the Board meeting, the Trustees, including all of the Independent Trustees, based on their evaluation of the information provided by the Adviser and other service providers of the Funds, approved the Agreement. In considering the approval of the Agreement, the Board considered various factors that they determined were relevant, including: (i) the nature, extent and quality of the services to be provided by the Adviser; (ii) the investment performance of the Adviser; and (iii) the fees to be paid to the Adviser, as discussed in further detail below.
Nature, Extent and Quality of Services to be Provided by the Adviser
In considering the nature, extent and quality of the services to be provided by the Adviser, the Board reviewed the portfolio management services to be provided by the Adviser to the Funds, including the quality and continuity of the Adviser’s portfolio management personnel, the resources of the Adviser, and the Adviser’s compliance history and compliance program. The Trustees reviewed the terms of the proposed Agreement. The Trustees also reviewed the Adviser’s proposed investment and risk management approaches for the Funds. The most recent investment adviser registration form (“Form ADV”) for the Adviser was provided to the Board, as was the response of the Adviser to a detailed series of questions which included, among other things, information about the investment advisory services to be provided by the Adviser to the Funds.
The Trustees also considered other services to be provided to the Funds by the Adviser such as selecting broker-dealers for executing portfolio transactions, monitoring adherence to the Funds’ investment restrictions, and monitoring compliance with various Fund policies and procedures and with applicable securities laws and regulations. Based on the factors above, as well as those discussed below, the Board concluded, within the context of its full deliberations, that the nature, extent and quality of the services to be provided to the Funds by the Adviser would be satisfactory.
41
September 30, 2018 (Unaudited)
APPROVAL OF INVESTMENT ADVISORY AGREEMENT (continued)
Investment Performance of Adviser
Because Mondrian served as the investment sub-adviser of the Predecessor Funds and each Fund’s portfolio management team was expected to be the same or substantially the same as the portfolio management team of the corresponding Predecessor Fund, the Board considered the investment performance of the Predecessor Funds in considering the approval of the Agreement. Representatives from the Adviser provided information regarding and led discussions of factors impacting the performance of the Predecessor Funds, outlining current market conditions and explaining their expectations and strategies for the future. Following evaluation, the Board concluded, within the context of its full deliberations, that the investment performance of the Adviser and its investment management personnel supported approval of the Agreement.
Costs of Advisory Services
In considering the advisory fees payable by the Funds to the Adviser, the Trustees reviewed, among other things, a report of the proposed advisory fees to be paid to the Adviser. The Trustees also reviewed reports prepared by the Funds’ administrator comparing the Funds’ net and gross expense ratios and advisory fees to those paid by peer groups of mutual funds as classified by Lipper, an independent provider of investment company data. The Trustees reviewed pro forma fee and expense information, as well as the management fees charged by the Adviser to other clients with comparable mandates. The Trustees considered any differences in management fees and took into account the respective demands, resources and complexity associated with the Funds and other client accounts as well as the extensive regulatory, compliance and tax regimes to which the Funds are subject. The Board also considered that the advisory fee of each Fund would be lower than the advisory fee of the corresponding Predecessor Fund. The Board concluded, within the context of its full deliberations, that the advisory fees were reasonable in light of the nature and quality of the services expected to be rendered by the Adviser. The Board also considered the Adviser’s commitment to managing the Funds and its willingness to enter into expense limitation and fee waiver arrangements with the Funds.
Profitability and Economies of Scale
Because Mondrian had not served as the investment adviser of the Predecessor Funds and the Funds had not commenced operations, it was not possible to determine the profitability that the Adviser might achieve with respect to the Funds or the extent to which economies of scale would be realized by the Adviser as the assets of the Funds grow. Accordingly, the Trustees did not make any conclusions regarding the Adviser’s profitability, or the extent to which economies
42
September 30, 2018 (Unaudited)
APPROVAL OF INVESTMENT ADVISORY AGREEMENT (concluded)
of scale would be realized by the Adviser as the assets of the Funds grow, but will do so during future considerations of the Agreement.
Approval of the Agreement
Based on the Board’s deliberations and its evaluation of the information described above and other factors and information it believed relevant in the exercise of its reasonable business judgment, the Board, including all of the Independent Trustees, with the assistance of Fund counsel and Independent Trustees’ counsel, unanimously concluded that the terms of the Agreement, including the fees to be paid thereunder, were fair and reasonable and agreed to approve the Agreement for an initial term of two years. In its deliberations, the Board did not identify any absence of information as material to its decision, or any particular factor (or conclusion with respect thereto) or single piece of information that was all-important, controlling or determinative of its decision, but considered all of the factors together, and each Trustee may have attributed different weights to the various factors (and conclusions with respect thereto) and information.
43
| Fund information | |
| | |
| Registered office | P.O. Box 588 |
| | Portland, ME 04112 |
| | |
| Adviser | Mondrian Investment Partners Limited |
| | 10 Gresham Street, 5th Floor |
| | London, England EC2V 7JD |
| | |
| Distributor | SEI Investments Distribution Co. |
| | One Freedom Valley Drive |
| | Oaks, PA 19456 |
| | |
| Administrator | SEI Investments Global Funds Services |
| | One Freedom Valley Drive |
| | Oaks, PA 19456 |
| | |
| Legal Counsel | Morgan, Lewis & Bockius LLP |
| | 1701 Market Street |
| | Philadelphia, PA 19103 |
| | |
| Custodian | Brown Brothers Harriman & Co |
| | 40 Water Street |
| | Boston, Massachusetts 02109 |
| | |
| Transfer Agent | Atlantic Fund Services, LLC |
| | Three Canal Plaza |
| | Portland, ME 04101 |
| | |
| Independent Registered | PricewaterhouseCoopers LLP |
| Public Accounting Firm | 2001 Market Street |
| | Philadelphia, PA 19103 |
[This Page Intentionally Left Blank]
MON-SA-002-0100
Item 2. Code of Ethics.
Not applicable for semi-annual report.
Item 3. Audit Committee Financial Expert.
Not applicable for semi-annual report.
Item 4. Principal Accountant Fees and Services.
Not applicable for semi-annual report.
Item 5. Audit Committee of Listed Registrants.
Not applicable to open-end management investment companies.
Item 6. Schedule of Investments.
Schedule of Investments is included as part of the Report to Shareholders filed under Item 1 of this form.
Item 7. Disclosure of Proxy Voting Policies and Procedures for Closed-End Management Investment Companies.
Not applicable to open-end management investment companies.
Item 8. Portfolio Managers of Closed-End Management Investment Companies.
Not applicable. Effective for closed-end management investment companies for fiscal years ending on or after December 31, 2005
Item 9. Purchases of Equity Securities by Closed-End Management Company and Affiliated Purchasers.
Not applicable to open-end management investment companies.
Item 10. Submission of Matters to a Vote of Security Holders.
There have been no changes to the procedures by which shareholders may recommend nominees to the Registrant’s Board of Trustees during the period covered by this report.
Item 11. Controls and Procedures.
(a) The Registrant’s principal executive and principal financial officers, or persons performing similar functions, have concluded that the Registrant’s disclosure controls and procedures (as defined in Rule 30a-3(c) under the Act (17 CFR 270.30a-3(c))) as of a date within 90 days of the filing date of the report, are effective based on the evaluation of these controls and procedures required by Rule 30a-3(b) under the Act (17 CFR 270.30a-3(b)) and Rules 13a-15(b) or 15d-15(b) under the Exchange Act (17 CFR 240.13a-15(b) or 240.15d-15(b)).
(b) There has been no change in the Registrant’s internal control over financial reporting (as defined in Rule 30a-3(d) under the Act (17 CFR 270.30a-3(d)) that occurred during the second fiscal quarter of the period covered by this report that has materially affected, or is reasonably likely to materially affect, the Registrant’s internal control over financial reporting.
Items 12. Disclosure of Securities Lending Activities for Closed-End Management Investment Companies.
Not applicable.
Items 13. Exhibits.
(a)(1) Not applicable for semi-annual report.
(a)(2) A separate certification for the principal executive officer and the principal financial officer of the Registrant as required by Rule 30a-2(a) under the Investment Company Act of 1940, as amended (17 CFR 270.30a-2(a)), are filed herewith.
(b) Officer certifications as required by Rule 30a-2(b) under the Investment Company Act of 1940, as amended (17 CFR 270.30a-2(b)) also accompany this filing as an exhibit.
SIGNATURES
Pursuant to the requirements of the Securities Exchange Act of 1934 and the Investment Company Act of 1940, the registrant has duly caused this report to be signed on its behalf by the undersigned, thereunto duly authorized.
| (Registrant) | Gallery Trust |
| | |
| | |
| By (Signature and Title) | /s/ Michael Beattie |
| | Michael Beattie |
| | President |
| | |
| Date: December 7, 2018 | |
Pursuant to the requirements of the Securities Exchange Act of 1934 and the Investment Company Act of 1940, this report has been signed below by the following persons on behalf of the registrant and in the capacities and on the dates indicated.
| By (Signature and Title) | /s/ Michael Beattie |
| | Michael Beattie |
| | President |
| | |
| Date: December 7, 2018 | |
| | |
| | |
| By (Signature and Title) | /s/ Stephen Connors |
| | Stephen Connors |
| | Treasurer, Controller & CFO |
| | |
| Date: December 7, 2018 |