The Funds file their complete schedule of investments of fund holdings with the Securities and Exchange Commission (the “Commission”) for the first and third quarters of each fiscal year on Form N-Q or as an exhibit to its reports on Form N-PORT within sixty days of the period end. The Funds’ N-Q forms and Form N-PORT reports are available on the Commission’s website at http://www.sec.gov, and may be reviewed and copied at the Commission’s Public Reference Room in Washington, DC. Information on the operation of the Public Reference Room may be obtained by calling 1-800-SEC-0330.
A description of the policies and procedures that the Funds use to determine how to vote proxies relating to fund securities, as well as information relating to how a Fund voted proxies relating to fund securities will be available (i) without charge, upon request, by calling 1-888-832-4386; and (ii) on the Commission’s website at http://www.sec.gov.
This report has been prepared for shareholders and may be distributed to others only if preceded or accompanied by an effective prospectus.
| Gallery Trust | | Mondrian International Value |
| | |
| | | April 30, 2020 (Unaudited) |
† Percentages based on total investments. |
| COMMON STOCK — 98.7% | | | | | | |
| | | | | | | |
| AUSTRALIA — 1.0% | | | | | | |
QBE Insurance Group Ltd | | | 843,598 | | | | | |
| Total Australia | | | | | | | | |
| | | | | | | | | |
| CHINA — 2.6% | | | | | | | | |
China Mobile Ltd | | | 1,530,500 | | | | | |
| Total China | | | | | | | | |
| | | | | | | | | |
| DENMARK — 1.3% | | | | | | | | |
ISS A/S* | | | 406,215 | | | | | |
| Total Denmark | | | | | | | | |
| | | | | | | | | |
| FRANCE — 7.5% | | | | | | | | |
Cie de Saint-Gobain SA* | | | 507,963 | | | | 13,474,209 | |
Sanofi SA | | | 165,842 | | | | 16,256,458 | |
Societe Generale SA* | | | 353,867 | | | | | |
| Total France | | | | | | | | |
| | | | | | | | | |
| GERMANY — 9.3% | | | | | | | | |
Allianz SE | | | 70,667 | | | | 13,066,540 | |
Continental AG | | | 151,567 | | | | 12,797,571 | |
Daimler AG | | | 120,109 | | | | 4,150,375 | |
The accompanying notes are an integral part of the financial statements.
| Gallery Trust | | Mondrian International Value |
| | |
| | | April 30, 2020 (Unaudited) |
| COMMON STOCK — continued | | | | | | |
| | | | | | | |
| GERMANY (continued) | | | | | | |
Deutsche Telekom AG | | | 346,306 | | | $ | 5,048,339 | |
Evonik Industries AG | | | 368,140 | | | | | |
| Total Germany | | | | | | | | |
| | | | | | | | | |
| HONG KONG — 6.8% | | | | | | | | |
CK Hutchison Holdings Ltd | | | 2,079,500 | | | | 15,405,911 | |
Jardine Matheson Holdings Ltd | | | 111,115 | | | | 4,870,191 | |
WH Group Ltd | | | 12,349,500 | | | | | |
| Total Hong Kong | | | | | | | | |
| | | | | | | | | |
| ITALY — 4.4% | | | | | | | | |
Enel SpA | | | 1,663,588 | | | | 11,382,456 | |
Eni SpA | | | 994,657 | | | | | |
| Total Italy | | | | | | | | |
| | | | | | | | | |
| JAPAN — 27.6% | | | | | | | | |
| Coca-Cola Bottlers Japan Holdings Inc | | | 473,200 | | | | 8,529,748 | |
FUJIFILM Holdings Corp | | | 305,100 | | | | 14,478,747 | |
Fujitsu Ltd | | | 95,200 | | | | 9,297,646 | |
Honda Motor Co Ltd | | | 606,300 | | | | 14,609,021 | |
Isuzu Motors Ltd | | | 452,200 | | | | 3,456,176 | |
Kyocera Corp | | | 251,400 | | | | 13,411,879 | |
Mitsubishi Electric Corp | | | 743,700 | | | | 9,201,677 | |
| Nippon Telegraph & Telephone Corp | | | 304,900 | | | | 6,914,474 | |
Otsuka Holdings Co Ltd | | | 277,000 | | | | 10,904,969 | |
Sekisui Chemical Co Ltd | | | 604,600 | | | | 7,642,854 | |
| Sumitomo Electric Industries Ltd | | | 34,900 | | | | 358,424 | |
Takeda Pharmaceutical Co Ltd | | | 453,100 | | | | 16,265,713 | |
Tokio Marine Holdings Inc | | | 217,752 | | | | 10,254,770 | |
Toyota Industries | | | 93,500 | | | | | |
| Total Japan | | | | | | | | |
| | | | | | | | | |
| NETHERLANDS — 3.3% | | | | | | | | |
Ahold Delhaize NV | | | 149,437 | | | | 3,639,200 | |
Royal Dutch Shell PLC Class B ^ | | | 729,642 | | | | | |
| Total Netherlands | | | | | | | | |
The accompanying notes are an integral part of the financial statements.
| Gallery Trust | | Mondrian International Value |
| | |
| | | April 30, 2020 (Unaudited) |
| COMMON STOCK — continued | | | | | | |
| | | | | | | |
| SINGAPORE — 4.2% | | | | | | |
| Singapore Telecommunications Ltd | | | 3,100,302 | | | $ | 6,193,135 | |
United Overseas Bank Ltd | | | 958,240 | | | | | |
| Total Singapore | | | | | | | | |
| | | | | | | | | |
| SPAIN — 2.0% | | | | | | | | |
Banco Santander SA | | | 4,246,726 | | | | | |
| Total Spain | | | | | | | | |
| | | | | | | | | |
| SWEDEN — 2.6% | | | | | | | | |
Telia Co AB | | | 3,516,743 | | | | | |
| Total Sweden | | | | | | | | |
| | | | | | | | | |
| SWITZERLAND — 5.2% | | | | | | | | |
ABB Ltd | | | 559,034 | | | | 10,581,975 | |
Novartis AG | | | 122,274 | | | | 10,408,676 | |
Zurich Insurance Group AG | | | 11,242 | | | | | |
| Total Switzerland | | | | | | | | |
| | | | | | | | | |
| TAIWAN — 2.2% | | | | | | | | |
| Taiwan Semiconductor Manufacturing Co Ltd | | | 825,000 | | | | 8,357,736 | |
| Taiwan Semiconductor Manufacturing Co Ltd ADR | | | 37,724 | | | | | |
| Total Taiwan | | | | | | | | |
| | | | | | | | | |
| UNITED KINGDOM — 18.7% | | | | | | | | |
BP PLC | | | 2,690,208 | | | | 10,617,867 | |
G4S PLC | | | 2,813,365 | | | | 3,849,358 | |
GlaxoSmithKline PLC | | | 697,193 | | | | 14,530,143 | |
John Wood Group PLC | | | 624,264 | | | | 1,595,651 | |
Kingfisher PLC | | | 3,948,299 | | | | 7,799,431 | |
Lloyds Banking Group PLC | | | 25,720,398 | | | | 10,371,477 | |
SSE PLC | | | 949,250 | | | | 14,947,980 | |
Tesco PLC | | | 4,571,881 | | | | 13,537,073 | |
Travis Perkins PLC | | | 238,991 | | | | 3,113,373 | |
WPP PLC | | | 1,021,114 | | | | | |
| Total United Kingdom | | | | | | | | |
The accompanying notes are an integral part of the financial statements.
| Gallery Trust | | Mondrian International Value |
| | |
| | | April 30, 2020 (Unaudited) |
| COMMON STOCK — continued | | | | | | |
| | | | | | | |
| Total Common Stock | | | | | | |
(Cost $573,059,768) | | | | | | | |
| | | | | | | | |
| PREFERRED STOCK — 0.2% | | | | | | | |
| | | | | | | | |
| GERMANY — 0.2% | | | | | | | |
| Bayerische Motoren Werke AG, 4.66% | | | 13,304 | | | | | |
| | | | | | | | | |
| Total Preferred Stock | | | | | | | | |
(Cost $963,310) | | | | | | | | |
| Total Value of Securities — 98.9% | | | | | | | | |
(Cost $574,023,078) | | | | | | | | |
Percentages are based on Net Assets of $471,754,837.
| * | Non-income producing security. |
| ^ | Security traded on the London Stock Exchange. |
ADR — American Depositary Receipt
Ltd. — Limited
PLC — Public Limited Company
The following is a list of the inputs used as of April 30, 2020, in valuing the Fund’s investments carried at market value:
| Investments in Securities | | Level 1 | | | Level 2 | | | Level 3 | | | Total | |
| Common Stock | | $ | 2,004,276 | | | $ | 463,696,519 | | | $ | — | | | $ | 465,700,795 | |
| Preferred Stock | | | | | | | | | | | | | | | | |
| Total Investments in Securities | | | | | | | | | | | | | | | | |
For the period ended April 30, 2020, there were no transfers in or out of Level 3.
For more information on valuation inputs, see Note 2 in Notes to Financial Statements.
The accompanying notes are an integral part of the financial statements.
| Gallery Trust | | Mondrian Emerging Markets Value |
| | |
| | | April 30, 2020 (Unaudited) |
SCHEDULE OF INVESTMENTS
† Percentages based on total investments. |
| COMMON STOCK — 95.7% | |
| | | | | | | |
| BRAZIL — 3.1% | |
Hypera SA* | | | 56,600 | | | $ | 302,989 | |
Itau Unibanco Holding SA ADR | | | 56,368 | | | | 237,309 | |
Suzano Papel e Celulose SA* | | | 25,300 | | | | | |
| Total Brazil | | | | | | | | |
| | | | | | | | | |
| CHINA — 39.4% | |
Alibaba Group Holding Ltd * | | | 44,000 | | | | 1,115,022 | |
| Alibaba Group Holding Ltd ADR * | | | 3,212 | | | | 650,976 | |
| Brilliance China Automotive Holdings Ltd | | | 64,000 | | | | 59,416 | |
| China Medical System Holdings Ltd | | | 373,000 | | | | 442,241 | |
China Merchants Bank Class H | | | 206,500 | | | | 983,948 | |
China Mobile Ltd | | | 72,500 | | | | 583,455 | |
CSPC Pharmaceutical Group | | | 272,000 | | | | 542,332 | |
| Hangzhou Hikvision Digital Technology Class A | | | 69,600 | | | | 314,734 | |
| Hengan International Group Co Ltd | | | 59,500 | | | | 528,662 | |
| Jiangsu Yanghe Brewery Joint-Stock Class A | | | 36,612 | | | | 508,380 | |
Midea Group Co Ltd Class A | | | 80,903 | | | | 611,276 | |
NetEase ADR | | | 2,764 | | | | 953,469 | |
| Ping An Insurance Group Co of China Ltd Class H | | | 125,000 | | | | 1,288,130 | |
The accompanying notes are an integral part of the financial statements.
| Gallery Trust | | Mondrian Emerging Markets Value |
| | |
| | | April 30, 2020 (Unaudited) |
| COMMON STOCK — continued | |
| | | | | | | |
| CHINA (continued) | |
| Tingyi Cayman Islands Holding Corp Class H | | | 316,000 | | | | | |
| Total China | | | | | | | | |
| | | | | | | | | |
| HONG KONG — 7.3% | |
Sands China Ltd | | | 58,000 | | | | 238,459 | |
Tencent Holdings | | | 17,400 | | | | 920,898 | |
WH Group Ltd | | | 542,000 | | | | | |
| Total Hong Kong | | | | | | | | |
| | | | | | | | | |
| INDIA — 10.9% | |
Bajaj Auto Ltd | | | 6,177 | | | | 213,581 | |
HCL Technologies Ltd | | | 72,494 | | | | 521,478 | |
| Housing Development Finance Corp Ltd | | | 15,050 | | | | 380,422 | |
Indiabulls Housing Finance Ltd | | | 87,277 | | | | 151,276 | |
Infosys Ltd Sponsored ADR | | | 49,815 | | | | 459,793 | |
Reliance Industries | | | 41,690 | | | | | |
| Total India | | | | | | | | |
| | | | | | | | | |
| INDONESIA — 1.1% | |
| Bank Rakyat Indonesia Persero Tbk PT | | | 1,355,700 | | | | | |
| Total Indonesia | | | | | | | | |
| | | | | | | | | |
| MALAYSIA — 0.5% | |
Malayan Banking Bhd | | | 62,545 | | | | | |
| Total Malaysia | | | | | | | | |
| | | | | | | | | |
| MEXICO — 1.8% | |
| Fibra Uno Administracion SA de CV REIT | | | 363,776 | | | | 302,027 | |
| Grupo Financiero Banorte SAB de CV Class O | | | 45,100 | | | | | |
| Total Mexico | | | | | | | | |
| | | | | | | | | |
| PERU — 0.9% | |
Credicorp Ltd | | | 1,471 | | | | | |
| Total Peru | | | | | | | | |
The accompanying notes are an integral part of the financial statements.
| Gallery Trust | | Mondrian Emerging Markets Value |
| | |
| | | April 30, 2020 (Unaudited) |
| COMMON STOCK — continued | |
| | | | | | | |
| RUSSIA — 4.1% | |
Gazprom PJSC ADR | | | 94,947 | | | $ | 479,483 | |
LUKOIL PJSC ADR | | | 7,232 | | | | | |
| Total Russia | | | | | | | | |
| | | | | | | | | |
| SOUTH AFRICA — 2.1% | |
Mondi | | | 27,470 | | | | | |
| Total South Africa | | | | | | | | |
| | | | | | | | | |
| SOUTH KOREA — 10.9% | |
Korea Zinc Co Ltd | | | 422 | | | | 134,057 | |
LG Chem Ltd | | | 2,362 | | | | 723,206 | |
Samsung Electronics Co Ltd | | | 17,587 | | | | 720,457 | |
| Samsung Electronics Co Ltd GDR | | | 318 | | | | 326,234 | |
| Samsung Fire & Marine Insurance Co Ltd | | | 1,607 | | | | 250,387 | |
Shinhan Financial Group Co Ltd | | | 15,329 | | | | | |
| Total South Korea | | | | | | | | |
| | | | | | | | | |
| TAIWAN — 10.2% | |
| ASE Technology Holding Co Ltd | | | 238,000 | | | | 532,208 | |
CTBC Financial Holding | | | 304,000 | | | | 203,123 | |
Mega Financial Holding Co Ltd | | | 73,000 | | | | 73,624 | |
| Taiwan Semiconductor Manufacturing Co Ltd ADR | | | 29,521 | | | | | |
| Total Taiwan | | | | | | | | |
| | | | | | | | | |
| UNITED ARAB EMIRATES — 1.1% | |
First Abu Dhabi Bank PJSC | | | 78,755 | | | | | |
| Total United Arab Emirates | | | | | | | | |
| | | | | | | | | |
| UNITED KINGDOM — 1.0% | |
Unilever PLC | | | 4,499 | | | | | |
| Total United Kingdom | | | | | | | | |
| | | | | | | | | |
The accompanying notes are an integral part of the financial statements.
| Gallery Trust | | Mondrian Emerging Markets Value |
| | |
| | | April 30, 2020 (Unaudited) |
| COMMON STOCK — continued | |
| | | | | | | |
| UNITED STATES — 1.3% | |
| Consumer Discretionary — 1.3% | |
Yum China Holdings* | | | 6,303 | | | | | |
| | | | | | | | | |
| Total United States | | | | | | | | |
| | | | | | | | | |
| Total Common Stock | | | | | | | | |
(Cost $21,922,397) | | | | | | | | |
| | |
| PREFERRED STOCK — 2.2% | |
| | |
| SOUTH KOREA — 2.2% | |
Samsung Electronics Co Ltd** | | | 14,598 | | | | | |
| | | | | | | | | |
| Total Preferred Stock | | | | | | | | |
(Cost $469,505) | | | | | | | | |
| Total Value of Securities — 97.9% | | | | | | | | |
(Cost $22,391,902) | | | | | | | | |
Percentages are based on Net Assets of $23,211,360.
| * | Non-income producing security. |
| ** | There is currently no rate available. |
ADR — American Depositary Receipt
CV — Convertible Security
GDR — Global Depositary Receipt
Ltd. — Limited
PLC — Public Limited Company
REIT — Real Estate Investment Trust
The accompanying notes are an integral part of the financial statements.
| Gallery Trust | | Mondrian Emerging Markets Value |
| | |
| | | April 30, 2020 (Unaudited) |
The following is a list of the inputs used as of April 30, 2020, in valuing the Fund’s investments carried at market value:
| Investments in Securities | | Level 1 | | | Level 2 | | | Level 3 | | | Total | |
| Common Stock | | $ | 6,578,758 | | | $ | 15,641,668 | | | $ | — | | | $ | 22,220,426 | |
| Preferred Stock | | | | | | | | | | | | | | | | |
| Total Investments in Securities | | | | | | | | | | | | | | | | |
For the period ended April 30, 2020, there were no transfers in or out of Level 3.
For more information on valuation inputs, see Note 2 in Notes to Financial Statements.
The accompanying notes are an integral part of the financial statements.
| Gallery Trust | | Mondrian International Government |
| | |
| | | April 30, 2020 (Unaudited) |
SCHEDULE OF INVESTMENTS

† Percentages based on total investments. |
| GLOBAL BONDS — 95.6% | | | | | | | |
| | Face Amount
(Local Currency) | | | | |
| AUSTRALIA — 3.9% | | | | | | | |
| Australia Government Bond | | | | | | | |
5.750%, 05/15/21 | AUD | | 155,000 | | | $ | 106,748 | |
4.750%, 04/21/27 | AUD | | 450,000 | | | | 375,803 | |
3.250%, 04/21/25 | AUD | | 226,000 | | | | 167,733 | |
3.000%, 03/21/47 | AUD | | 385,000 | | | | | |
| Total Australia | | | | | | | | |
| | | | | | | | | |
| AUSTRIA — 4.6% | | | | | | | | |
| Republic of Austria Government Bond | | | | | | | | |
6.250%, 07/15/27 | EUR | | 710,000 | | | | | |
| Total Austria | | | | | | | | |
| | | | | | | | | |
| BELGIUM — 4.5% | | | | | | | | |
| Kingdom of Belgium Government Bond | | | | | | | | |
1.000%, 06/22/26 (A) | EUR | | 950,000 | | | | | |
| Total Belgium | | | | | | | | |
| | | | | | | | | |
| CANADA — 2.0% | | | | | | | | |
| Canadian Government Bond | | | | | | | | |
5.000%, 06/01/37 | CAD | | 224,000 | | | | 264,759 | |
1.500%, 06/01/26 | CAD | | 200,000 | | | | 153,257 | |
0.750%, 09/01/21 | CAD | | 100,000 | | | | | |
| Total Canada | | | | | | | | |
| | | | | | | | | |
| FINLAND — 3.7% | | | | | | | | |
| Finland Government Bond | | | | | | | | |
0.500%, 09/15/27 (A) | EUR | | 799,000 | | | | | |
| Total Finland | | | | | | | | |
The accompanying notes are an integral part of the financial statements.
| Gallery Trust | | Mondrian International Government |
| | |
| | | April 30, 2020 (Unaudited) |
| GLOBAL BONDS — continued | | | | | | | | |
| | Face Amount
(Local Currency) | | | | |
| FRANCE — 3.3% | | | | | | | | |
| French Republic Government Bond OAT | | | | | | | | |
1.500%, 05/25/31 | EUR | | 300,000 | | | $ | 384,057 | |
0.500%, 05/25/25 | EUR | | 195,000 | | | | 224,226 | |
| Total Capital International | | | | | | | | |
0.750%, 07/12/28 | EUR | | 200,000 | | | | | |
| Total France | | | | | | | | |
| | | | | | | | | |
| GERMANY — 5.5% | | | | | | | | |
| Bundesrepublik Deutschland Bundesanleihe | | | | | | | | |
2.500%, 07/04/44 | EUR | | 100,000 | | | | 185,166 | |
| Kreditanstalt fuer Wiederaufbau | | | | | | | | |
2.050%, 02/16/26 | JPY | | 112,000,000 | | | | | |
| Total Germany | | | | | | | | |
| | | | | | | | | |
| ITALY — 9.9% | | | | | | | | |
| Italy Buoni Poliennali Del Tesoro | | | | | | | | |
4.750%, 09/01/44 (A) | EUR | | 100,000 | | | | 152,932 | |
2.950%, 09/01/38 (A) | EUR | | 500,000 | | | | 601,050 | |
2.000%, 02/01/28 | EUR | | 850,000 | | | | 960,011 | |
1.450%, 05/15/25 | EUR | | 308,000 | | | | 341,094 | |
0.050%, 04/15/21 | EUR | | 385,000 | | | | | |
| Total Italy | | | | | | | | |
| | | | | | | | | |
| JAPAN — 19.0% | | | | | | | | |
| Japan Government Thirty Year Bond | | | | | | | | |
2.400%, 12/20/34 | JPY | | 90,000,000 | | | | 1,107,852 | |
0.300%, 06/20/46 | JPY | | 140,100,000 | | | | 1,271,729 | |
| Japan Government Twenty Year Bond | | | | | | | | |
1.600%, 06/20/30 | JPY | | 107,000,000 | | | | 1,161,202 | |
0.200%, 06/20/36 | JPY | | 131,400,000 | | | | | |
| Total Japan | | | | | | | | |
| | | | | | | | | |
| KUWAIT — 1.1% | | | | | | | | |
| Kuwait International Government Bond | | | | | | | | |
3.500%, 03/20/27 | USD | | 240,000 | | | | | |
| Total Kuwait | | | | | | | | |
The accompanying notes are an integral part of the financial statements.
| Gallery Trust | | Mondrian International Government |
| | |
| | | April 30, 2020 (Unaudited) |
| GLOBAL BONDS — continued | | | | | | | | |
| | Face Amount
(Local Currency) | | | | |
| MALAYSIA — 2.0% | | | | | | | | |
| Malaysia Government Bond | | | | | | | | |
4.254%, 05/31/35 | MYR | | 900,000 | | | $ | 231,823 | |
4.181%, 07/15/24 | MYR | | 1,113,000 | | | | | |
| Total Malaysia | | | | | | | | |
| | | | | | | | | |
| MEXICO — 3.2% | | | | | | | | |
| Mexican Bonos | | | | | | | | |
8.500%, 05/31/29 | MXN | | 5,800,000 | | | | 271,674 | |
8.500%, 11/18/38 | MXN | | 423,000 | | | | 19,152 | |
8.000%, 11/07/47 | MXN | | 12,000,000 | | | | | |
| Total Mexico | | | | | | | | |
| | | | | | | | | |
| NETHERLANDS — 4.2% | | | | | | | | |
| Netherlands Government Bond | | | | | | | | |
5.500%, 01/15/28 | EUR | | 94,056 | | | | 151,012 | |
2.750%, 01/15/47 (A) | EUR | | 250,000 | | | | 481,653 | |
0.500%, 01/15/40 (A) | EUR | | 250,000 | | | | 307,556 | |
0.250%, 07/15/29 (A) | EUR | | 100,000 | | | | | |
| Total Netherlands | | | | | | | | |
| | | | | | | | | |
| NEW ZEALAND — 8.1% | | | | | | | | |
| New Zealand Government Bond | | | | | | | | |
5.500%, 04/15/23 | NZD | | 811,000 | | | | 575,454 | |
4.500%, 04/15/27 | NZD | | 900,000 | | | | 701,744 | |
2.750%, 04/15/37 | NZD | | 986,000 | | | | | |
| Total New Zealand | | | | | | | | |
| | | | | | | | | |
| SUPRANATIONAL — 14.3% | | | | | | | | |
| Asian Development Bank | | | | | | | | |
2.350%, 06/21/27 | JPY | | 110,000,000 | | | | 1,210,157 | |
| European Financial Stability Facility | | | | | | | | |
0.950%, 02/14/28 | EUR | | 990,000 | | | | 1,182,272 | |
| European Investment Bank | | | | | | | | |
2.150%, 01/18/27 | JPY | | 109,000,000 | | | | | |
| Total Supranational | | | | | | | | |
The accompanying notes are an integral part of the financial statements.
| Gallery Trust | | Mondrian International Government |
| | |
| | | April 30, 2020 (Unaudited) |
| GLOBAL BONDS — continued | | | | | | | | |
| | Face Amount
(Local Currency) | | | | |
| UNITED ARAB EMIRATES — 1.0% | | | | | | | | |
| MDGH - GMTN BV | | | | | | | | |
2.875%, 11/07/29 | USD | | 256,000 | | | | | |
| Total United Arab Emirates | | | | | | | | |
| | | | | | | | | |
| UNITED KINGDOM — 5.3% | | | | | | | | |
| HSBC Holdings | | | | | | | | |
4.583%, 06/19/29 (B) | USD | | 230,000 | | | | 260,062 | |
| United Kingdom Gilt | | | | | | | | |
4.500%, 09/07/34 | GBP | | 147,638 | | | | 291,448 | |
4.250%, 09/07/39 | GBP | | 370,000 | | | | | |
| Total United Kingdom | | | | | | | | |
| | | | | | | | | |
| Total Global Bonds | | | | | | | | |
(Cost $22,973,182) | | | | | | | | |
| | | | | | | | | |
| U.S. TREASURY OBLIGATIONS — 1.5% | | | | | | | | |
| | | | | | | | | |
| United States Treasury Bond | | | | | | | | |
2.750%, 08/15/42 | 225,000 | | 225,000 | | | | 292,878 | |
| United States Treasury Notes | | | | | | | | |
1.625%, 02/15/26 | 79,800 | | 79,800 | | | | | |
| Total U.S. Treasury Obligations | | | | | | | | |
(Cost $281,907) | | | | | | | | |
| Total Value of Securities — 97.1% | | | | | | | | |
(Cost $23,255,089) | | | | | | | | |
The accompanying notes are an integral part of the financial statements.
| Gallery Trust | | Mondrian International Government |
| | |
| | | April 30, 2020 (Unaudited) |
A list of the open forward foreign currency exchange contracts held by the Fund at April 30, 2020 is as follows:
| Counterparty | Maturity Date | Currency to Deliver | | Currency to Receive | | | Unrealized
Appreciation
(Depreciation) | |
| Brown Brothers Harriman | 07/30/20 | USD | | 270,913 | | AUD | | 417,500 | | | $ | 1,202 | |
| Brown Brothers Harriman | 07/30/20 | USD | | 2,066,921 | | EUR | | 1,901,000 | | | | 20,349 | |
| Brown Brothers Harriman | 07/30/20 | USD | | 1,429,385 | | GBP | | 1,147,500 | | | | 16,417 | |
| Brown Brothers Harriman | 07/30/20 | USD | | 503,589 | | NOK | | 5,232,500 | | | | 7,411 | |
| Brown Brothers Harriman | 07/30/20 | USD | | 493,732 | | PLN | | 2,071,500 | | | | 5,430 | |
| Brown Brothers Harriman | 07/30/20 | NZD | | 3,261,000 | | USD | | 1,971,819 | | | | (27,384 | ) |
| Brown Brothers Harriman | 07/30/20 | JPY | | 118,442,000 | | USD | | 1,111,020 | | | | | |
| Net Unrealized Appreciation on Forward Foreign Currency Exchange Contracts | | | | | |
Percentages are based on Net Assets of $25,025,097.
| (A) | Securities sold within terms of a private placement memorandum, exempt from registration under Section 144A of the Securities Act of 1933, as amended, and may be sold only to dealers in that program or other “accredited investors.” The total value of securities as of April 30, 2020 was 3,710,379 and represents 14.8% on Net Assets. |
| (B) | Floating rate security - Rate disclosed is the rate in effect on April 30, 2020. |
AUD — Australian Dollar
CAD — Canadian Dollar
EUR — Euro
GBP — Pound Sterling
JPY — Japanese Yen
MXN — Mexican Peso
MYR — Malaysian Ringgit
NOK — Norwegian Krone
NZD — New Zealand Dollar
PLN — Poland Zloty
USD — United States Dollar
The accompanying notes are an integral part of the financial statements.
| Gallery Trust | | Mondrian International Government |
| | |
| | | April 30, 2020 (Unaudited) |
The following is a list of the inputs used as of April 30, 2020, in valuing the Fund’s investments carried at market value
| Investments in Securities | | Level 1 | | | Level 2 | | | Level 3 | | | Total | |
| Global Bonds | | $ | — | | | $ | 23,908,991 | | | $ | — | | | $ | 23,908,991 | |
| U.S. Treasury Obligations | | | | | | | | | | | | | | | | |
| Total Investments in Securities | | | | | | | | | | | | | | | | |
| Other Financial Instruments | | Level 1 | | | Level 2 | | | Level 3 | | | Total | |
| Forwards Contracts* | | | | | | | | | | | | |
| Unrealized Appreciation | | $ | — | | | $ | 56,474 | | | $ | — | | | $ | 56,474 | |
| Unrealized Depreciation | | | | | | | | | | | | | | | | |
| Total Other Financial Instruments | | | | | | | | | | | | | | | | |
| * | Forward foreign currency exchange contracts are valued at the unrealized appreciation (depreciation) on the instrument. |
For the period ended April 30, 2020, there were no transfers in or out of Level 3.
Amounts designated as “—” are $0 or have been rounded to $0.
For more information on valuation inputs, see Note 2 in Notes to Financial Statements.
The accompanying notes are an integral part of the financial statements.
| Gallery Trust | | Mondrian U.S. Small Cap Equity Fund |
| | April 30, 2020 (Unaudited) |
| | |
|
SCHEDULE OF INVESTMENTS
† Percentages based on total investments. |
| COMMON STOCK — 96.9% | | | | | | |
| | | | | | | |
| UNITED STATES — 96.9% | | | | | | |
| Energy — 0.3% | | | | | | |
Green Plains Partners LP | | | 650 | | | | | |
| | | | | | | | | |
| Financials — 6.3% | | | | | | | | |
Houlihan Lokey Inc | | | 688 | | | | 40,853 | |
Moelis & Company | | | 911 | | | | | |
| | | | | | | | | |
| Health Care — 5.8% | | | | | | | | |
AMN Healthcare Services Inc * | | | 687 | | | | 32,275 | |
iRadimed Corp * | | | 1,402 | | | | | |
| | | | | | | | | |
| Industrials — 39.9% | | | | | | | | |
AAR Corp | | | 1,424 | | | | 27,882 | |
Astronics Corp * | | | 3,007 | | | | 27,003 | |
Barnes Group Inc | | | 823 | | | | 31,587 | |
Donaldson Company Inc | | | 771 | | | | 33,793 | |
Douglas Dynamics Inc | | | 902 | | | | 33,338 | |
EnerSys | | | 586 | | | | 34,217 | |
GrafTech International Ltd | | | 5,145 | | | | 41,777 | |
Luxfer Holdings PLC | | | 2,670 | | | | 36,232 | |
McGrath RentCorp | | | 545 | | | | 29,730 | |
Regal Beloit Corp | | | 502 | | | | 35,647 | |
Tetra Tech Inc | | | 427 | | | | 32,145 | |
Timken Company | | | 942 | | | | 35,400 | |
US Ecology | | | 944 | | | | | |
| | | | | | | | | |
The accompanying notes are an integral part of the financial statements.
| Gallery Trust | | Mondrian U.S. Small Cap Equity Fund |
| | April 30, 2020 (Unaudited) |
| | |
|
| COMMON STOCK — continued | | | | | | | | |
| | | | | | | |
| UNITED STATES (continued) | | | | | | | | |
| Information Technology — 21.0% | | | | | | | | |
Avnet | | | 932 | | | $ | 27,979 | |
Cabot Microelectronics Corp | | | 306 | | | | 37,497 | |
| Comtech Telecommunications Corp | | | 1,478 | | | | 27,358 | |
FLIR Systems Inc | | | 885 | | | | 38,409 | |
Maximus Inc | | | 538 | | | | 36,218 | |
NIC Inc | | | 1,054 | | | | 25,539 | |
Vishay Intertechnology Inc | | | 1,994 | | | | | |
| | | | | | | | | |
| Materials — 18.2% | | | | | | | | |
AptarGroup Inc | | | 288 | | | | 30,839 | |
Graphic Packaging Holding Co | | | 1,998 | | | | 26,673 | |
Greif Class A | | | 948 | | | | 32,128 | |
Innospec Inc | | | 487 | | | | 35,317 | |
PH Glatfelter Co | | | 2,113 | | | | 30,850 | |
PolyOne Corp | | | 1,712 | | | | | |
| | | | | | | | | |
| Real Estate — 5.4% | | | | | | | | |
| Landmark Infrastructure Partners LP | | | 2,790 | | | | 31,443 | |
Physicians Realty Trust | | | 1,746 | | | | | |
| | | | | | | | | |
| Total United States | | | | | | | | |
| | | | | | | | | |
| Total Value of Securities — 96.9% | | | | | | | | |
(Cost $1,159,936) | | | | | | | | |
Percentages are based on Net Assets of $1,077,282.
| * | Non-income producing security. |
L.P. — Limited Partnership
PLC — Public Limited Company
As of April 30, 2020, all of the Fund’s investments were considered Level 1, in accordance the authoritative guidance on fair value measurements and disclosure under U.S. GAAP.
For the period ended April 30, 2020, there were no transfers in or out of Level 3.
For more information on valuation inputs, see Note 2 in Notes to Financial Statements.
The accompanying notes are an integral part of the financial statements.
| Gallery Trust | | |
| | |
| | | April 30, 2020 (Unaudited) |
SCHEDULE OF INVESTMENTS
† Percentages based on total investments.
| COMMON STOCK — 98.1% | | | | | | |
| | | | | | | |
| CANADA — 8.5% | | | | | | |
Emera Inc | | | 1,499 | | | $ | 59,671 | |
Enbridge Inc | | | 1,719 | | | | | |
| Total Canada | | | | | | | | |
| | | | | | | | | |
| CHILE — 4.0% | | | | | | | | |
Enel Americas | | | 324,971 | | | | | |
| Total Chile | | | | | | | | |
| | | | | | | | | |
| CHINA — 4.1% | | | | | | | | |
| Jiangsu Expressway Co Ltd Class H | | | 46,000 | | | | | |
| Total China | | | | | | | | |
| | | | | | | | | |
| FRANCE — 3.7% | | | | | | | | |
Veolia Environnement SA | | | 2,277 | | | | | |
| Total France | | | | | | | | |
| | | | | | | | | |
| INDIA — 3.4% | | | | | | | | |
Power Grid Corp of India Ltd | | | 20,841 | | | | | |
| Total India | | | | | | | | |
| | | | | | | | | |
| ITALY — 7.7% | | | | | | | | |
Atlantia SpA* | | | 3,297 | | | | 53,663 | |
Snam SpA | | | 10,735 | | | | | |
| Total Italy | | | | | | | | |
| | | | | | | | | |
| JAPAN — 4.2% | | | | | | | | |
West Japan Railway Co | | | 900 | | | | | |
| Total Japan | | | | | | | | |
The accompanying notes are an integral part of the financial statements.
| Gallery Trust | | |
| | |
| | | April 30, 2020 (Unaudited) |
| COMMON STOCK — continued | | | | | | | | |
| | | | | | | |
| MEXICO — 7.5% | | | | | | | | |
| Aeroportuario Centro Norte SAB de CV B Class B | | | 13,811 | | | $ | 50,549 | |
| Promotora y Operadora de Infraestructura | | | 7,114 | | | | | |
| Total Mexico | | | | | | | | |
| | | | | | | | | |
| PORTUGAL — 4.5% | | | | | | | | |
EDP - Energias de Portugal SA | | | 14,191 | | | | | |
| Total Portugal | | | | | | | | |
| | | | | | | | | |
| SPAIN — 3.5% | | | | | | | | |
Naturgy Energy Group SA | | | 2,643 | | | | | |
| Total Spain | | | | | | | | |
| | | | | | | | | |
| UNITED ARAB EMIRATES — 3.6% | | | | | | | | |
DP World PLC | | | 3,018 | | | | | |
| Total United Arab Emirates | | | | | | | | |
| | | | | | | | | |
| UNITED KINGDOM — 10.6% | | | | | | | | |
National Grid PLC | | | 4,091 | | | | 48,115 | |
Pennon Group PLC | | | 3,323 | | | | 45,826 | |
SSE PLC | | | 3,016 | | | | | |
| Total United Kingdom | | | | | | | | |
| | | | | | | | | |
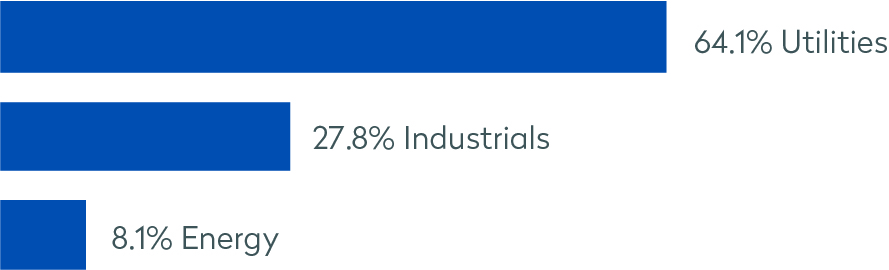
| UNITED STATES — 32.8% | | | | | | | | |
| Energy — 4.0% | | | | | | | | |
Williams Co Inc | | | 2,720 | | | | | |
| | | | | | | | | |
| Industrials — 3.7% | | | | | | | | |
Kansas City Southern | | | 380 | | | | | |
| | | | | | | | | |
| Utilities — 25.1% | | | | | | | | |
Dominion Energy | | | 756 | | | | 58,310 | |
Duke Energy Corp | | | 738 | | | | 62,479 | |
Edison International | | | 975 | | | | 57,242 | |
Evergy Inc | | | 829 | | | | 48,439 | |
PPL Corporation | | | 2,399 | | | | 60,983 | |
Xcel Energy Inc | | | 715 | | | | | |
| | | | | | | | | |
The accompanying notes are an integral part of the financial statements.
| Gallery Trust | | |
| | |
| | | April 30, 2020 (Unaudited) |
| COMMON STOCK — continued | | | | | | | | |
| | | | | | | | |
| UNITED STATES (continued) | | | | | | | | |
| Total United States | | | | | | | | |
| | | | | | | | | |
| Total Common Stock | | | | | | | | |
(Cost $1,337,064) | | | | | |
| Total Value of Securities — 98.1% | | | | | | | | |
(Cost $1,337,064) | | | | | |
Percentages are based on Net Assets of $1,327,351.
Ltd. — Limited
PLC — Public Limited Company
The following is a list of the inputs used as of April 30, 2020, in valuing the Fund’s investments carried at market value
| Investments in Securities | | Level 1 | | | Level 2 | | | Level 3 | | | Total | |
| Common Stock | | | | | | | | | | | | | | | | |
| Total Investments in Securities | | | | | | | | | | | | | | | | |
For the period ended April 30, 2020, there were no transfers in or out of Level 3.
For more information on valuation inputs, see Note 2 in Notes to Financial Statements.
The accompanying notes are an integral part of the financial statements.
| Gallery Trust | | April 30, 2020 (Unaudited) |
| | |
| | | |
STATEMENTS OF ASSETS AND LIABILITIES
| | | Mondrian International Value Equity Fund | | | Mondrian Emerging Markets Value Equity Fund | | | Mondrian International Government Fixed Income Fund | |
| Assets: | | | | | | | | | |
| Investments (Cost $574,023,078, $22,391,902, and $23,255,089) | | $ | 466,333,045 | | | $ | 22,725,045 | | | $ | 24,287,046 | |
| Foreign currency (Cost $–, $87 and $547,250) | | | 549,081 | | | | — | | | | 87 | |
Cash | | | (1,692,888 | ) | | | 324,279 | | | | 577,684 | |
| Receivable for investment securities sold | | | 3,278,030 | | | | 527,986 | | | | — | |
| Dividends and interest receivable | | | 1,646,489 | | | | 30,268 | | | | 166,888 | |
| Receivable for capital shares sold | | | 2,007,083 | | | | 24,985 | | | | — | |
Reclaims receivable | | | 2,822,455 | | | | 748 | | | | — | |
| Unrealized appreciation on forward foreign currency contracts | | | — | | | | 70 | | | | 56,473 | |
| Unrealized appreciation on spot foreign currency contracts | | | 79 | | | | — | | | | — | |
Prepaid expenses | | | | | | | | | | | | |
Total assets | | | | | | | | | | | | |
| Liabilities: | | | | | | | | | | | | |
| Payable for investment securities purchased | | | 1,608,962 | | | | 383,781 | | | | — | |
Audit fees payable | | | 16,859 | | | | 11,694 | | | | 14,179 | |
| Payable due to Administrator | | | 41,323 | | | | 2,012 | | | | 2,199 | |
| Payable due to Investment Adviser | | | 206,169 | | | | 1,904 | | | | 694 | |
| Payable for capital shares redeemed | | | 1,300,300 | | | | 1,651 | | | | 15,157 | |
| Chief Compliance Officer fees payable | | | 5,115 | | | | 216 | | | | 290 | |
Payable due to Trustees | | | 3,665 | | | | 122 | | | | 285 | |
| Unrealized depreciation on spot foreign currency contracts | | | 711 | | | | 88 | | | | — | |
| Unrealized depreciation on forward foreign currency contracts | | | — | | | | — | | | | 27,384 | |
Other accrued expenses | | | | | | | | | | | | |
Total liabilities | | | | | | | | | | | | |
Net assets | | | | | | | | | | | | |
| | | | | | | | | | | | | |
| Net assets consist of: | | | | | | | | | | | | |
Paid-in capital | | $ | 596,132,690 | | | $ | 132,619,349 | | | $ | 25,951,606 | |
Total distributable loss | | | | | | | | | | | | |
Net assets | | | | | | | | | | | | |
| | | | | | | | | | | | | |
| Outstanding Shares of Beneficial Interest (unlimited authorization - no par value) | | | | | | | | | | | | |
Net Asset Value, Offering and Redemption Price Per Share | | | | | | | | | | | | |
The accompanying notes are an integral part of the financial statements.
STATEMENTS OF ASSETS AND LIABILITIES
| | | Mondrian U.S. Small Cap Equity Fund | | | Mondrian Global Listed Infrastructure Fund | |
| Assets: | | | | | | |
| Investments (Cost $1,159,936 and $1,337,064) | | $ | 1,044,132 | | | $ | 1,302,598 | |
| Foreign currency (Cost $876 and $–) | | | — | | | | 901 | |
Cash | | | 7,792 | | | | 17,398 | |
| Receivable from Investment Adviser | | | 5,285 | | | | 5,454 | |
Dividends receivable | | | 1,082 | | | | 1,182 | |
Reclaims receivable | | | — | | | | 738 | |
Deferred offering costs | | | — | | | | — | |
| Receivable for investment securities sold | | | 35,938 | | | | — | |
Prepaid expenses | | | | | | | | |
Total assets | | | | | | | | |
| Liabilities: | | | | | | | | |
Audit fees payable | | | 12,373 | | | | 13,389 | |
Payable due to Administrator | | | 114 | | | | 114 | |
| Chief Compliance Officer fees payable | | | 12 | | | | 14 | |
Payable due to Trustees | | | 8 | | | | 12 | |
| Payable for investment securities purchased | | | 16,568 | | | | — | |
Other accrued expenses | | | | | | | | |
Total liabilities | | | | | | | | |
Net assets | | | | | | | | |
| | | | | | | | | |
| Net assets consist of: | | | | | | | | |
Paid-in capital | | $ | 1,306,653 | | | $ | 1,352,601 | |
Total distributable loss | | | | | | | | |
Net assets | | | | | | | | |
| | | | | | | | | |
Outstanding Shares of Beneficial Interest
(unlimited authorization - no par value) | | | | | | | | |
Net Asset Value, Offering and Redemption Price Per Share | | | | | | | | |
The accompanying notes are an integral part of the financial statements.
| Gallery Trust | | |
| | April 30, 2020 (Unaudited) |
| | | |
| | | Mondrian International Value Equity Fund | |
| Investment income | | | |
Dividends | | $ | 6,411,831 | |
Less: foreign taxes withheld | | | | |
Total investment income | | | | |
| | | | | |
| Expenses | | | | |
Investment advisory fees | | | 1,956,105 | |
Accounting and administration fees | | | 290,168 | |
Custodian fees | | | 56,795 | |
Printing fees | | | 48,235 | |
Legal fees | | | 48,024 | |
Other | | | 43,989 | |
Registration fees | | | 36,026 | |
Trustees’ fees and expenses | | | 22,781 | |
| Dividend disbursing and transfer agent fees and expenses | | | 20,900 | |
Audit and tax | | | 16,859 | |
Chief Compliance Officer fees | | | | |
Total expenses | | | 2,548,331 | |
| Less: | | | | |
Investment advisory fees waived | | | | |
Net expenses | | | | |
| | | | | |
Net investment income | | | | |
| | | | | |
| Net realized loss on: | | | | |
Investments | | | (10,691,655 | ) |
Foreign currency transactions | | | | |
Net realized loss | | | | |
| Net change in unrealized appreciation/(depreciation) on: | | | | |
Investments | | | (111,051,312 | ) |
| Foreign currency transactions and translation of other assets and liabilities denominated in foreign currency | | | | |
| Net change in unrealized appreciation/(depreciation) | | | | |
Net realized and unrealized loss | | | | |
| | | | | |
| Net decrease in net assets resulting from operations | | | | |
The accompanying notes are an integral part of the financial statements.
| Gallery Trust | | |
| | April 30, 2020 (Unaudited) |
| | | |
STATEMENTS OF OPERATIONS
| | | Mondrian Emerging Markets Value Equity Fund | |
| Investment income | | | |
Dividends | | $ | 389,864 | |
Less: foreign taxes withheld | | | | |
Total investment income | | | | |
| | | | | |
| Expenses | | | | |
Investment advisory fees | | | 127,171 | |
Custodian fees | | | 19,280 | |
Accounting and administration fees | | | 17,523 | |
| Dividend disbursing and transfer agent fees and expenses | | | 13,949 | |
Audit and tax | | | 12,794 | |
Other | | | 5,519 | |
Registration fees | | | 4,894 | |
Printing fees | | | 3,069 | |
Legal fees | | | 2,997 | |
Trustees’ fees and expenses | | | 1,381 | |
Chief Compliance Officer fees | | | | |
Total expenses | | | 209,065 | |
| Less: | | | | |
Investment advisory fees waived | | | | |
Net expenses | | | | |
| | | | | |
Net investment income | | | | |
| | | | | |
| Net realized gain (loss) on: | | | | |
Investments | | | (716,867 | ) |
Foreign currency transactions | | | | |
Net realized loss | | | | |
| Net change in unrealized appreciation/(depreciation) on: | | | | |
Investments | | | (1,324,726 | ) |
| Change in accrued foreign capital gains tax on appreciated securities | | | 6,754 | |
| Foreign currency transactions and translation of other assets and liabilities denominated in foreign currency | | | | |
| Net change in unrealized appreciation/(depreciation) | | | | |
Net realized and unrealized loss | | | | |
| | | | | |
| Net decrease in net assets resulting from operations | | | | |
The accompanying notes are an integral part of the financial statements.
STATEMENTS OF OPERATIONS
| | | Mondrian International Government Fixed Income Fund | |
| Investment income | | | |
Interest | | $ | 199,785 | |
Less: foreign taxes withheld | | | | |
Total investment income | | | | |
| | | | | |
| Expenses | | | | |
Investment advisory fees | | | 65,290 | |
| Dividend disbursing and transfer agent fees and expenses | | | 13,863 | |
Accounting and administration fees | | | 13,597 | |
Audit and tax | | | 13,079 | |
Other | | | 6,230 | |
Registration fees | | | 3,353 | |
Printing fees | | | 3,062 | |
Custodian fees | | | 2,906 | |
Legal fees | | | 2,356 | |
Trustees’ fees and expenses | | | 1,137 | |
Chief Compliance Officer fees | | | | |
Total expenses | | | 125,284 | |
| Less: | | | | |
Investment advisory fees waived | | | | |
Net expenses | | | | |
| | | | | |
Net investment income | | | | |
| | | | | |
| Net realized gain on: | | | | |
Investments | | | 349,476 | |
Foreign currency transactions | | | | |
Net realized gain | | | | |
| Net change in unrealized appreciation/(depreciation) on: | | | | |
Investments | | | (787,788 | ) |
| Foreign currency transactions and translation of other assets and liabilities denominated in foreign currency | | | | |
| Net change in unrealized appreciation/(depreciation) | | | | |
Net realized and unrealized loss | | | | |
| | | | | |
| Net decrease in net assets resulting from operations | | | | |
The accompanying notes are an integral part of the financial statements.
| Gallery Trust | | |
| | April 30, 2020 (Unaudited) |
| | | |
STATEMENTS OF OPERATIONS
| | | Mondrian U.S. Small Cap Equity Fund | |
| Investment income | | | |
Dividends | | | | |
Total investment income | | | | |
| | | | | |
| Expenses | | | | |
| Dividend disbursing and transfer agent fees and expenses | | | 13,293 | |
Audit and tax | | | 12,173 | |
Registration fees | | | 6,738 | |
Investment advisory fees | | | 5,444 | |
Deferred offering costs | | | 4,375 | |
Accounting and administration fees | | | 768 | |
Printing fees | | | 585 | |
Other | | | 368 | |
Custodian fees | | | 366 | |
Legal fees | | | 116 | |
Trustees’ fees and expenses | | | 55 | |
Chief Compliance Officer fees | | | | |
Total expenses | | | 44,301 | |
| Less: | | | | |
Investment advisory fees waived | | | (5,444 | ) |
Reimbursement from Investment Adviser | | | | |
Net expenses | | | | |
| | | | | |
Net investment income | | | | |
| | | | | |
| Net realized loss on: | | | | |
Investments | | | | |
Net realized loss | | | | |
| Net change in unrealized appreciation/(depreciation) on: | | | | |
Investments | | | | |
| Net change in unrealized appreciation/(depreciation) | | | | |
Net realized and unrealized loss | | | | |
| | | | | |
| Net decrease in net assets resulting from operations | | | | |
The accompanying notes are an integral part of the financial statements.
STATEMENTS OF OPERATIONS
| | | Mondrian Global Listed Infrastructure Fund | |
| Investment income | | | |
Dividends | | $ | 36,839 | |
Less: foreign taxes withheld | | | | |
Total investment income | | | | |
| | | | | |
| Expenses | | | | |
Audit and tax | | | 13,389 | |
| Dividend disbursing and transfer agent fees and expenses | | | 13,270 | |
Registration fees | | | 6,736 | |
Investment advisory fees | | | 6,278 | |
Deferred offering costs | | | 4,375 | |
Other | | | 1,470 | |
Custodian fees | | | 1,096 | |
Accounting and administration fees | | | 768 | |
Printing fees | | | 706 | |
Legal fees | | | 126 | |
Trustees’ fees and expenses | | | 60 | |
Chief Compliance Officer fees | | | | |
Total expenses | | | 48,296 | |
| Less: | | | | |
Investment advisory fees waived | | | (6,278 | ) |
Reimbursement from Investment Adviser | | | | |
Net expenses | | | | |
| | | | | |
Net investment income | | | | |
| | | | | |
| Net realized gain (loss) on: | | | | |
Investments | | | (2,771 | ) |
Foreign currency transactions | | | | |
Net realized gain (loss) | | | | |
| Net change in unrealized appreciation/(depreciation) on: | | | | |
Investments | | | (219,131 | ) |
| Change in accrued foreign capital gains tax on appreciated securities | | | 701 | |
| Foreign currency transactions and translation of other assets and liabilities denominated in foreign currency | | | | |
| Net change in unrealized appreciation/(depreciation) | | | | |
Net realized and unrealized loss | | | | |
| | | | | |
| Net decrease in net assets resulting from operations | | | | |
The accompanying notes are an integral part of the financial statements.
| Gallery Trust | | Mondrian International Value |
| | |
| | |
|
STATEMENTS OF CHANGES IN NET ASSETS
| | | Six-month period ended April 30, 2020
(Unaudited) | | | Year ended October 31, 2019 | |
| Operations: | | | | | | |
Net investment income | | $ | 3,610,265 | | | $ | 19,461,922 | |
| Net realized gain/(loss) on investments and foreign currency transactions | | | (10,698,730 | ) | | | 15,329,820 | |
| Net change in unrealized appreciation/(depreciation) on investments, foreign currency transactions and translation of other assets and liabilities denominated in foreign currency | | | | | | | | |
| Net increase/(decrease) in net assets resulting from operations | | | | | | | | |
Distribution of Income | | | | | | | | |
Capital share transactions(1): | | | | | | | | |
Issued | | | 63,703,277 | | | | 147,191,874 | |
Reinvestment of dividends | | | 27,306,352 | | | | 22,992,279 | |
Redeemed | | | | | | | | |
| Net increase in net assets from capital share transactions | | | | | | | | |
Total increase/(decrease) in net assets | | | (135,547,026 | ) | | | 69,714,981 | |
| Net assets: | | | | | | | | |
Beginning of period | | | | | | | | |
End of period | | | | | | | | |
| (1) | See Note 8 – Share transactions in Notes to Financial Statements. |
The accompanying notes are an integral part of the financial statements.
| Gallery Trust | | Mondrian Emerging Markets Value |
| | |
| | |
|
STATEMENTS OF CHANGES IN NET ASSETS
| | | Six-month period ended April 30, 2020
(Unaudited) | | | Year ended October 31, 2019 | |
| Operations: | | | | | | |
Net investment income | | $ | 183,762 | | | $ | 1,355,460 | |
| Net realized gain/(loss) on investments and foreign currency transactions | | | (694,413 | ) | | | 207,871 | |
| Net change in unrealized appreciation/(depreciation) on investments, accrued foreign capital gains tax on appreciated securities, foreign currency transactions and translation of other assets and liabilities denominated in foreign currency | | | | | | | | |
| Net increase/(decrease) in net assets resulting from operations | | | | | | | | |
Distribution of Income | | | | | | | | |
Capital share transactions(1): | | | | | | | | |
Issued | | | 3,786,206 | | | | 2,317,599 | |
Reinvestment of dividends | | | 1,318,682 | | | | 4,403,015 | |
Redeemed | | | | | | | | |
| Net decrease in net assets from capital share transactions | | | | | | | | |
Total decrease in net assets | | | (24,285,029 | ) | | | (41,881,959 | ) |
| Net assets: | | | | | | | | |
Beginning of period | | | | | | | | |
End of period | | | | | | | | |
| (1) | See Note 8 – Share transactions in Notes to Financial Statements. |
The accompanying notes are an integral part of the financial statements.
| Gallery Trust | | Mondrian International Government |
| | |
| | |
|
STATEMENTS OF CHANGES IN NET ASSETS
| | | Six-month period ended April 30, 2020
(Unaudited) | | | Year ended October 31, 2019 | |
| Operations: | | | | | | |
Net investment income | | $ | 121,430 | | | $ | 358,660 | |
| Net realized gain on investments, foreign currency exchange contracts, and foreign currency transactions | | | 456,332 | | | | 616,366 | |
| Net change in unrealized appreciation/(depreciation) on investments, foreign currency exchange contracts, foreign currency transactions and translation of other assets and liabilities denominated in foreign currency | | | | | | | | |
| Net increase/(decrease) in net assets resulting from operations | | | | | | | | |
Distribution of Income | | | | | | | | |
Capital share transactions(1): | | | | | | | | |
Issued | | | 1,198,728 | | | | 5,272,964 | |
Reinvestment of dividends | | | 995,760 | | | | 1,097,262 | |
Redeemed | | | | | | | | |
| Net decrease in net assets from capital share transactions | | | | | | | | |
Total decrease in net assets | | | (3,091,989 | ) | | | (9,008,473 | ) |
| Net assets: | | | | | | | | |
Beginning of period | | | | | | | | |
End of period | | | | | | | | |
| (1) | See Note 8 – Share transactions in Notes to Financial Statements. |
The accompanying notes are an integral part of the financial statements.
| Gallery Trust | | Mondrian U.S. Small Cap Equity Fund |
| | |
| | |
|
STATEMENTS OF CHANGES IN NET ASSETS
| | | Six-month period ended April 30,2020
(Unaudited) | | | Period ended October 31, 2019(1) | |
| Operations: | | | | | | |
Net investment income | | $ | 11,763 | | | $ | 19,051 | |
| Net realized gain/(loss) on investments and foreign currency transactions | | | (127,185 | ) | | | 39,457 | |
| Net change in unrealized appreciation/(depreciation) on investments, foreign currency transactions and translation of other assets and liabilities denominated in foreign currency | | | | | | | | |
| Net increase/(decrease) in net assets resulting from operations | | | | | | | | |
Distribution of Income | | | | | | | | |
Capital share transactions(2): | | | | | | | | |
Issued | | | — | | | | 1,250,000 | |
Reinvestment of dividends | | | | | | | | |
| Net increase in net assets from capital share transactions | | | | | | | | |
Total increase/(decrease) in net assets | | | (408,030 | ) | | | 1,485,312 | |
| Net assets: | | | | | | | | |
Beginning of period | | | | | | | | |
End of period | | | | | | | | |
| (1) | The fund commenced operations on December 17, 2018. |
| (2) | See Note 8 – Share transactions in Notes to Financial Statements. |
The accompanying notes are an integral part of the financial statements.
STATEMENTS OF CHANGES IN NET ASSETS
| | | Six-month period ended April 30, 2020 (Unaudited) | | | Period ended October 31, 2019(1) | |
| Operations: | | | | | | |
Net investment income | | $ | 28,722 | | | $ | 37,842 | |
| Net realized gain/(loss) on investments and foreign currency transactions | | | (1,567 | ) | | | 46,807 | |
| Net change in unrealized appreciation/(depreciation) on investments, accrued foreign capital gains tax on appreciated securities, foreign currency transactions and translation of other assets and liabilities denominated in foreign currency | | | | | | | | |
| Net increase/(decrease) in net assets resulting from operations | | | | | | | | |
Distribution of Income | | | | | | | | |
Capital share transactions(2): | | | | | | | | |
Issued | | | — | | | | 1,250,000 | |
Reinvestment of dividends | | | 101,676 | | | | 925 | |
Redeemed | | | | | | | | |
| Net increase in net assets from capital share transactions | | | | | | | | |
Total increase/(decrease) in net assets | | | (191,538 | ) | | | 1,518,889 | |
| Net assets: | | | | | | | | |
Beginning of period | | | | | | | | |
End of period | | | | | | | | |
| (1) | The fund commenced operations on December 17, 2018. |
| (2) | See Note 8 – Share transactions in Notes to Financial Statements. |
The accompanying notes are an integral part of the financial statements.
| Gallery Trust | | Mondrian International Value |
| | |
| | |
|
Selected per share data & ratios
for a share outstanding throughout the year
| | | Six-month period
ended
4/30/20
(Unaudited) | | | Year
Ended
10/31/19 | | | Year
Ended
10/31/18 | | | Year
Ended
10/31/17 | | | Year
Ended
10/31/16 (2) | | | Year
Ended
10/31/15 (2) | |
| Net asset value, beginning of period | | | | | | | | | | | | | | | | | | | | | | | | |
Income/(loss) from operations:(1) | | | | | | | | | | | | | | | | | | | | | | | | |
| Net investment income | | | 0.09 | | | | 0.48 | | | | 0.47 | | | | 0.42 | | | | 0.43 | | | | 0.38 | |
| Net realized and unrealized gain/(loss) on investments | | | | | | | | | | | | | | | | | | | | | | | | |
| Total gain/(loss) from operations | | | | | | | | | | | | | | | | | | | | | | | | |
Redemption Fees | | | | | | | | | | | | | | | | | | | | | | | | |
| Dividends and distributions from: | | | | | | | | | | | | | | | | | | | | | | | | |
| Net investment income | | | (0.51 | ) | | | (0.39 | ) | | | (0.48 | ) | | | (0.31 | ) | | | (0.37 | ) | | | (0.68 | ) |
| Net realized gains | | | | | | | | | | | | | | | | | | | | | | | | |
| Total dividends and distributions | | | | | | | | | | | | | | | | | | | | | | | | |
| Net asset value, end of period | | | | | | | | | | | | | | | | | | | | | | | | |
Total return† | | | | | | | | | | | | | | | | | | | | | | | | |
| Ratios and supplemental data | | | | | | | | | | | | | | | | | | | | | | | | |
Net assets, end of period ($ Thousands) | | $ | 471,755 | | | $ | 607,302 | | | $ | 537,587 | | | $ | 580,798 | | | $ | 420,277 | | | $ | 358,381 | |
| Ratio of expenses to average net assets (including waivers and reimbursements) | | | 0.79 | %* | | | 0.79 | % | | | 0.79 | % | | | 0.79 | % | | | 0.82 | % | | | 0.88 | % |
| Ratio of expenses to average net assets (excluding waivers and reimbursements) | | | 0.91 | %* | | | 0.89 | % | | | 0.88 | % | | | 0.85 | % | | | 0.89 | % | | | 0.88 | % |
| Ratio of net investment income to average net assets | | | 1.29 | %* | | | 3.40 | % | | | 2.96 | % | | | 2.91 | % | | | 3.20 | % | | | 2.54 | % |
| Portfolio turnover rate | | | 11 | %** | | | 23 | % | | | 23 | %(4) | | | 28 | %(4) | | | 20 | % | | | 28 | %(4) |
| ** | Portfolio turnover is for the period indicated and has not been annualized. |
| † | Returns shown do not reflect the deductions of taxes that a shareholder would pay on Fund distributions or the redemption of Fund shares. Total return may have been lower had the Adviser not waived its fee and/or reimbursed other expenses. |
| (1) | Per share calculations were performed using average shares for the period. |
| (2) | On March 14, 2016, The International Equity Portfolio, a series of Delaware Pooled Trust (the “Predecessor Fund”) was reorganized into the Mondrian International Equity Fund. Information presented prior to March 14, 2016 is that of the Predecessor Fund. See Note 1 in Notes to Financial Statements. |
| (3) | Value is less than $0.005 per share. |
| (4) | Excludes the value of Portfolio securities received or delivered as a result of in-kind purchases or redemptions of the Portfolio’s capital shares. |
Amounts designated as “—” are $0 or have been rounded to $0.
The accompanying notes are an integral part of the financial statements.
| Gallery Trust | | Mondrian Emerging Markets Value |
| | |
| | |
|
FINANCIAL HIGHLIGHTS
Selected per share data & ratios
for a share outstanding throughout the year or period
| | | Six-month period
ended
4/30/20
(Unaudited) | | | Year
Ended
10/31/19 | | | Period
ended
10/31/18(2) | | | Year
Ended
3/31/18(3) | | | Year
Ended
3/31/17 | | | Year
Ended
3/31/16 | |
| Net asset value, beginning of period | | | | | | | | | | | | | | | | | | | | | | | | |
Income/(loss) from operations:(1) | | | | | | | | | | | | | | | | | | | | | | | | |
| Net investment income | | | 0.04 | | | | 0.16 | | | | 0.15 | | | | 0.19 | | | | 0.14 | | | | 0.14 | |
| Net realized and unrealized gain/(loss) on investments | | | | | | | | | | | | | | | | | | | | | | | | |
| Total gain/(loss) from operations | | | | | | | | | | | | | | | | | | | | | | | | |
| Dividends and distributions from: | |
| Net investment income | | | | | | | | | | | | | | | | | | | | | | | | |
| Total dividends and distributions | | | | | | | | | | | | | | | | | | | | | | | | |
| Net asset value, end of period | | | | | | | | | | | | | | | | | | | | | | | | |
Total return† | | | | | | | | | | | | | | | | | | | | | | | | |
| Ratios and supplemental data | | | | | | | | | | | | | | | | | | | | | | | | |
Net assets, end of period ($ Thousands) | | $ | 23,211 | | | $ | 47,496 | | | $ | 89,378 | | | $ | 314,259 | | | $ | 336,896 | | | $ | 406,462 | |
| Ratio of expenses to average net assets (including waivers and reimbursements) | | | 0.92 | %* | | | 0.92 | % | | | 1.18 | %* | | | 1.19 | %(4) | | | 1.20 | % | | | 1.20 | % |
| Ratio of expenses to average net assets (excluding waivers and reimbursements) | | | 1.23 | %* | | | 1.13 | % | | | 1.26 | %* | | | 1.21 | %(4) | | | 1.22 | % | | | 1.21 | % |
| Ratio of net investment income to average net assets | | | 1.09 | %* | | | 2.16 | % | | | 3.25 | %* | | | 2.30 | %(4) | | | 1.92 | % | | | 1.87 | % |
| Portfolio turnover rate | | | 23 | %** | | | 37 | % | | | 62 | %** | | | 39 | % | | | 32 | % | | | 28 | % |
| ** | Portfolio turnover is for the period indicated and has not been annualized. |
| † | Total return is for the period indicated and has not been annualized. Returns shown do not reflect the deductions of taxes that a shareholder would pay on Fund distributions or the redemption of Fund shares. Total return may have been lower had the Adviser not waived its fee and/or reimbursed other expenses. |
| (1) | Per share calculations were performed using average shares for the period. |
| (2) | For the period April 1, 2018 to October 31, 2018. On September 24, 2018, the Laudus Mondrian Emerging Markets Fund (the “Emerging Markets Predecessor Fund”) was reorganized into the Gallery Trust Mondrian Emerging Markets Equity Fund (the “Emerging Markets Fund”). Information presented prior to September 24, 2018 is that of the Emerging Markets Predecessor Fund. Effective October 31, 2018, the Emerging Markets Fund changed its fiscal year end to October 31. See Note 1 in Notes to Financial Statements. |
| (3) | Effective July 25, 2017, the Investor Share class, the Select Share class, and the Institutional Share class were consolidated into a single class of shares of the fund. The financial history as shown in the financial highlights is that of the former Institutional Shares. |
| (4) | The ratio of net operating expenses and gross operating expenses would have been 1.20% and 1.22%, respectively, and the ratio of net investment income would have been 2.29%, if the custody out-of-pocket fee reimbursement had not been included. |
Amounts designated as “—” are $0 or have been rounded to $0.
The accompanying notes are an integral part of the financial statements.
| Gallery Trust | | Mondrian International Government |
| | |
| | |
|
FINANCIAL HIGHLIGHTS
Selected per share data & ratios
for a share outstanding throughout the year or period
| | | Six-month period
ended
4/30/20
(Unaudited) | | | Year
Ended
10/31/19 | | | Period
ended
10/31/18(2) | | | Year
Ended
3/31/18 | | | Year
Ended
3/31/17 | | | Year
Ended
3/31/16 | |
| Net asset value, beginning of period | | | | | | | | | | | | | | | | | | | | | | | | |
Income/(loss) from operations:(1) | | | | | | | | | | | | | | | | | | | | | | | | |
| Net investment income | | | 0.04 | | | | 0.12 | | | | 0.06 | | | | 0.08 | | | | 0.09 | | | | 0.11 | |
| Net realized and unrealized gain/(loss) on investments | | | | | | | | | | | | | | | | | | | | | | | | |
| Total gain/(loss) from operations | | | | | | | | | | | | | | | | | | | | | | | | |
| Dividends and distributions from: | |
| Net investment income | | | (0.33 | ) | | | (0.37 | ) | | | — | | | — (3) | | | — (3) | | | | — | |
| Net realized gains | | | | | | | | | | | | | | | | | | | | | | | | |
| Total dividends and distributions | | | | | | | | | | | | | | | | | | | | | | | |
| Net asset value, end of period | | | | | | | | | | | | | | | | | | | | | | | | |
Total return† | | | | | | | | | | | | | | | | | | | | | | | | |
| Ratios and supplemental data | | | | | | | | | | | | | | | | | | | | | | | | |
Net assets, end of period ($ Thousands) | | $ | 25,025 | | | $ | 28,117 | | | $ | 37,126 | | | $ | 84,330 | | | $ | 95,565 | | | $ | 119,938 | |
| Ratio of expenses to average net assets (including waivers and reimbursements) | | | 0.60 | %* | | | 0.60 | % | | | 0.74 | %* | | | 0.74 | %(4) | | | 0.75 | % | | | 0.75 | % |
| Ratio of expenses to average net assets (excluding waivers and reimbursements) | | | 0.96 | %* | | | 1.02 | % | | | 0.86 | %* | | | 0.81 | %(4) | | | 0.79 | % | | | 0.81 | % |
| Ratio of net investment income to average net assets | | | 0.93 | %* | | | 1.19 | % | | | 0.96 | %* | | | 0.84 | %(4) | | | 0.87 | % | | | 1.21 | % |
| Portfolio turnover rate | | | 7 | %** | | | 42 | % | | | 32 | %** | | | 52 | % | | | 98 | % | | | 31 | % |
| ** | Portfolio turnover is for the period indicated and has not been annualized. |
| † | Total return is for the period indicated and has not been annualized. Returns shown do not reflect the deductions of taxes that a shareholder would pay on Fund distributions or the redemption of Fund shares. Total return may have been lower had the Adviser not waived its fee and/or reimbursed other expenses. |
| (1) | Per share calculations were performed using average shares for the period. |
| (2) | For the period April 1, 2018 to October 31, 2018. On September 24, 2018, the Laudus Mondrian International Government Fixed Income Fund (the “Fixed Income Predecessor Fund”) was reorganized into the Gallery Trust Mondrian International Government Fixed Income Fund (the “Fixed Income Fund”). Information presented prior to September 24, 2018 is that of the Fixed Income Predecessor Fund. Effective October 31, 2018, the Fixed Income Fund changed its fiscal year end to October 31. See Note 1 in Notes to Financial Statements. |
| (3) | Value is less than ($0.005) per share. |
| (4) | The ratio of net operating expenses and gross operating expenses would have been 0.75% and 0.82%, respectively, and the ratio of net investment income would have been 0.83%, if the custody out-of-pocket fee reimbursement had not been included. |
Amounts designated as “—” are $0 or have been rounded to $0.
The accompanying notes are an integral part of the financial statements.
| Gallery Trust | | Mondrian U.S. Small Cap Equity Fund |
| | |
| | |
|
FINANCIAL HIGHLIGHTS
Selected per share data & ratios
for a share outstanding throughout the period
| | | Six-month
period ended
4/30/20
(Unaudited) | | | Period
Ended
10/3/19‡ | |
| Net asset value, beginning of period | | | | | | | | |
Income/(loss) from operations:(1) | | | | | | | | |
Net investment income | | | 0.09 | | | | 0.15 | |
| Net realized and unrealized gain/(loss) on investments | | | | | | | | |
Total gain/(loss) from operations | | | | | | | | |
| Dividends and distributions from: | |
Net investment income | | | (0.13 | ) | | | — | |
Net realized gains | | | | | | | | |
Total dividends and distributions | | | | | | | | |
Net asset value, end of period | | | | | | | | |
Total return† | | | | | | | | |
| Ratios and supplemental data | | | | | | | | |
| Net assets, end of period ($ Thousands) | | $ | 1,077 | | | $ | 1,485 | |
| Ratio of expenses to average net assets (including waivers and reimbursements) | | | 0.90 | %* | | | 0.90 | %* |
| Ratio of expenses to average net assets (excluding waivers and reimbursements) | | | 6.52 | %* | | | 7.74 | %* |
| Ratio of net investment income to average net assets | | | 1.73 | %* | | | 1.61 | %* |
Portfolio turnover rate | | | 36 | %** | | | 32 | %** |
| ** | Portfolio turnover is for the period indicated and has not been annualized. |
| ‡ | The Fund commenced operations on December 17, 2018. |
| † | Total return is for the period indicated and has not been annualized. Returns shown do not reflect the deductions of taxes that a shareholder would pay on Fund distributions or the redemption of Fund shares. Total return may have been lower had the Adviser not waived its fee and/or reimbursed other expenses. |
| (1) | Per share calculations were performed using average shares for the period. |
Amounts designated as “—” are $0 or have been rounded to $0.
The accompanying notes are an integral part of the financial statements.
FINANCIAL HIGHLIGHTS
Selected per share data & ratios
for a share outstanding throughout the period
| | | Six-month
period ended
4/30/20
(Unaudited) | | | Period
Ended
10/3/19‡ | |
| Net asset value, beginning of period | | | | | | | | |
Income/(loss) from operations:(1) | | | | | | | | |
Net investment income | | | 0.22 | | | | 0.30 | |
| Net realized and unrealized gain/(loss) on investments | | | | | | | | |
Total gain/(loss) from operations | | | | | | | | |
| Dividends and distributions from: | | | | | | | | |
Net investment income | | | (0.41 | ) | | | (0.01 | ) |
Net realized gains | | | | | | | | |
Total dividends and distributions | | | | | | | | |
Net asset value, end of period | | | | | | | | |
Total return† | | | | | | | | |
| Ratios and supplemental data | | | | | | | | |
| Net assets, end of period ($ Thousands) | | $ | 1,327 | | | $ | 1,519 | |
Ratio of expenses to average net assets (including waivers and reimbursements) | | | 0.95 | %* | | | 0.95 | %* |
Ratio of expenses to average net assets (excluding waivers and reimbursements) | | | 6.55 | %* | | | 8.67 | %* |
| Ratio of net investment income to average net assets | | | 3.89 | %* | | | 3.15 | %* |
Portfolio turnover rate | | | 19 | %** | | | 31 | %** |
| ** | Portfolio turnover is for the period indicated and has not been annualized. |
| ‡ | The Fund commenced operations on December 17, 2018. |
| † | Total return is for the period indicated and has not been annualized. Returns shown do not reflect the deductions of taxes that a shareholder would pay on Fund distributions or the redemption of Fund shares. Total return may have been lower had the Adviser not waived its fee and/or reimbursed other expenses. |
| (1) | Per share calculations were performed using average shares for the period. |
Amounts designated as “—” are $0 or have been rounded to $0.
The accompanying notes are an integral part of the financial statements.
| Gallery Trust | | April 30, 2020 (Unaudited) |
| | |
| | | |
| | |
NOTES TO FINANCIAL STATEMENTS
| | |
Gallery Trust (the “Trust”), is organized as a Delaware statutory trust under an Agreement and Declaration of Trust dated August 25, 2015. The Trust is registered under the Investment Company Act of 1940 (the “1940 Act”), as amended, as an open-end investment management company with six funds. The financial statements herein are those of the Mondrian International Value Equity Fund (formerly, Mondrian International Equity Fund) (the “International Fund”), Mondrian Emerging Markets Value Equity Fund (formerly, the Mondrian Emerging Markets Equity Fund) (the “Emerging Markets Fund”) the Mondrian International Government Fixed Income Fund (the “International Government Fixed Income Fund”), the Mondrian U.S. Small Cap Equity Fund (the “U.S. Small Cap Equity Fund”), and the Mondrian Global Listed Infrastructure Fund (the “Global Listed Infrastructure Fund”) (each a “Fund” and collectively the “Funds”). The International Fund, Emerging Markets Fund, U.S. Small Cap Equity Fund, and Global Listed Infrastructure Fund are classified as diversified, and the Fixed Income Fund is classified as “non-diversified” under the 1940 Act. The investment objective of the International Fund is to seek long-term total return by investing at least 80% of its net assets, plus any borrowings for investment purposes, in equity securities. The investment objective of the Emerging Markets Fund is to seek long-term capital appreciation. The investment objective of the Fixed Income Fund is to seek long-term total return consistent with its value-oriented investment approach. The investment objective of the U.S. Small Cap Equity Fund is to seek long-term total return by investing at least 80% of its net assets, plus any borrowings for investment purposes, in equity securities of U.S. small-capitalization companies. The investment objective of the Global Listed Infrastructure Fund is to seek long-term total return by investing at least 80% of its net assets, plus any borrowings for investment purposes, in equity securities of infrastructure companies listed on a domestic or foreign exchange. Mondrian Investment Partners Limited, a limited company organized under the laws of England and Wales in 1990, serves as the Funds’ investment adviser (“Mondrian” or the “Adviser”). The Adviser makes investment decisions for the Funds and reviews, supervises and administers the investment program of the Funds, subject to the supervision of, and policies established by, the Trustees of the Trust.
The International Fund operated as The International Equity Portfolio, a series of Delaware Pooled Trust (the “International Predecessor Fund”), prior to the International Fund’s acquisition of the assets and assumption of the liabilities of the International Predecessor Fund (the “Reorganization”) on March 14, 2016 in a tax-free transaction. The International Fund had no operations prior
| Gallery Trust | | April 30, 2020 (Unaudited) |
| | |
| | | |
| | |
| NOTES TO FINANCIAL STATEMENTS (continued) | | |
to the Reorganization. The International Predecessor Fund was managed by Delaware Management Company, a series of Delaware Management Business Trust (the “Delaware Predecessor Adviser”), and sub-advised by Mondrian Investment Partners Limited. The International Predecessor Fund had substantially similar investment objectives and strategies as those of the International Fund. The financial statements and financial highlights reflect the financial information of the International Predecessor Fund for periods prior to March 14, 2016.
The Emerging Markets Fund and Fixed Income Fund operated as Laudus Mondrian Emerging Markets Fund (the “Emerging Markets Predecessor Fund”) and Laudus Mondrian International Government Fixed Income Fund (the “Fixed Income Predecessor Fund”) and, together, were a series of Laudus Trust. Each Predecessor Fund was managed by Charles Schwab Investment Management, Inc. (the “Predecessor Adviser”), and sub-advised by Mondrian. Each Fund has the same objective and substantially similar investment strategies as those of its Predecessor Fund. Each Fund acquired the assets and assumed all of the liabilities of its Predecessor Fund (the “Reorganization”) on September 24, 2018 in a tax-free transaction. The Funds had no operations prior to the Reorganization. The financial statements and financial highlights reflect the financial information of the Predecessor Funds for periods prior to September 24, 2018.
Effective October 31, 2018, the Emerging Markets Fund and International Government Fixed Income Fund changed their fiscal year end from March 31 to October 31.
The U.S. Small Cap Equity Fund and Global Listed Infrastructure Fund commenced operations on December 17, 2018.
| 2. | Significant accounting policies |
The following are significant accounting policies, which are consistently followed in the preparation of the financial statements of the Funds. The Funds are investment companies that apply the accounting and reporting guidance issued in Topic 946 by the U.S. Financial Accounting Standards Board (“FASB”).
Use of estimates — The preparation of financial statements, in conformity with U.S. generally accepted accounting principles (“U.S. GAAP”), requires management to make estimates and assumptions that affect the fair value of assets, the reported amounts of assets and liabilities and disclosure of contingent assets and liabilities at the date of the financial statements and
| Gallery Trust | | April 30, 2020 (Unaudited) |
| | |
| | | |
| | |
| NOTES TO FINANCIAL STATEMENTS (continued) | | |
the reported amount of increases and decreases in net assets from operations during the reporting period. Actual results could differ from those estimates and such differences could be material.
Valuation of investments — Securities listed on a securities exchange, market or automated quotation system for which quotations are readily available (except for securities traded on NASDAQ), including securities traded over the counter, are valued at the last quoted sale price on an exchange or market (foreign or domestic) on which they are traded on valuation date (or at approximately 4:00 pm ET if a security’s primary exchange is normally open at that time), or, if there is no such reported sale on the valuation date, at the most recent quoted bid price. For securities traded on NASDAQ, the NASDAQ Official Closing Price will be used. If available, debt securities are priced based upon valuations provided by recognized independent, third-party pricing agents. Such values generally reflect the last reported sales price if the security is actively traded. The third-party pricing agents may also value debt securities by employing methodologies that utilize actual market transactions, broker-supplied valuations, or other methodologies designed to identify the market value for such securities. Such methodologies generally consider such factors as security prices, yields, maturities, call features, ratings and developments relating to specific securities in arriving at valuations. Debt securities with remaining maturities of sixty days or less may be valued at their amortized cost, which approximates market value. If such prices are not available or determined to not represent the fair value of the security as of each Fund’s pricing time, the security will be valued at fair value as determined in good faith using methods approved by the Board of Trustees (the “Board”). The prices for foreign securities will be reported in local currency and converted to U.S. dollars using currency exchange rates.
Securities for which market prices are not “readily available” are valued in accordance with fair value procedures established by the Funds’ Board. The Funds’ fair value procedures are implemented through a fair value pricing committee (the “Committee”) designated by the Board. Some of the more common reasons that may necessitate that a security be valued using fair value procedures include: the security’s trading has been halted or suspended; the security has been de-listed from a national exchange; the security’s primary trading market is temporarily closed at a time when under normal conditions it would be open; or the security’s primary pricing source is not able or willing to provide a price. When a security is
| Gallery Trust | | April 30, 2020 (Unaudited) |
| | |
| | | |
| | |
| NOTES TO FINANCIAL STATEMENTS (continued) | | |
valued in accordance with the fair value procedures, the Committee will determine the value after taking into consideration relevant information reasonably available to the Committee.
For securities that principally trade on a foreign market or exchange, a significant gap in time can exist between the time of a particular security’s last trade and the time at which the Fund calculates its net asset value. The closing prices of such securities may no longer reflect their market value at the time the Fund calculates net asset value if an event that could materially affect the value of those securities (a “Significant Event”) has occurred between the time of the security’s last close and the time that the Fund calculates net asset value. A Significant Event may relate to a single issuer or to an entire market sector. If the Funds’ Adviser becomes aware of a Significant Event that has occurred with respect to a security or group of securities after the closing of the exchange or market on which the security or securities principally trade, but before the time at which the Fund calculates net asset value, it may request that a Committee meeting be called.
The Funds use MarkIt Fair Value (“MarkIt”) as a third party fair valuation vendor. MarkIt provides a fair value for foreign securities held by the Funds based on certain factors and methodologies (involving, generally, tracking valuation correlations between the U.S. market and each non-U.S. security) applied by MarkIt in the event that there is a movement in the U.S. market that exceeds a specific threshold that has been established by the Committee. The Committee has also established a “confidence interval” which is used to determine the level of correlation between the value of a foreign security and movements in the U.S. market before a particular security is fair valued when the threshold is exceeded. In the event that the threshold established by the Committee is exceeded on a specific day, the Funds value the non-U.S. securities in their portfolios that exceed the applicable “confidence interval” based upon the fair values provided by MarkIt. In such event, it is not necessary to hold a Committee meeting. In the event that the Adviser believes that the fair values provided by MarkIt are not reliable, the Adviser contacts the Funds’ Administrator and requests that a meeting of the Committee be held.
If a local market in which the Funds own securities is closed for one or more days, the Funds shall value all securities held in the corresponding currency based on the fair value prices provided by MarkIt using the predetermined confidence interval discussed above.
| Gallery Trust | | April 30, 2020 (Unaudited) |
| | |
| | | |
| | |
| NOTES TO FINANCIAL STATEMENTS (continued) | | |
In accordance with the authoritative guidance on fair value measurements and disclosure under U.S. GAAP, the Funds disclose the fair value of their investments in a hierarchy that prioritizes the inputs to valuation techniques used to measure the fair value. The objective of a fair value measurement is to determine the price that would be received to sell an asset or paid to transfer a liability in an orderly transaction between market participants at the measurement date (an exit price). Accordingly, the fair value hierarchy gives the highest priority to quoted prices (unadjusted) in active markets for identical assets or liabilities (Level 1) and the lowest priority to unobservable inputs (Level 3). The three levels of the fair value hierarchy are described below:
Level 1 — Inputs are unadjusted, quoted prices in active markets for identical assets or liabilities at the measurement date.
Level 2 — Inputs other than quoted prices included in Level 1 that are observable for the asset or liability, either directly or indirectly. Level 2 inputs include quoted prices for similar instruments in active markets, and inputs other than quoted prices that are observable for the asset or liability.
Level 3 — Inputs are unobservable inputs for the asset or liability, and include situations where there is little, if any, market activity for the asset or liability.
Investments are classified within the level of the lowest significant input considered in determining fair value. Investments classified within Level 3 whose fair value measurement considers several inputs may include Level 1 or Level 2 inputs as components of the overall fair value measurement.
Fair value measurement classifications are summarized in the Funds’ Schedule of Investments.
For the period ended April 30, 2020, there have been no significant changes to the Funds’ fair valuation methodology.
Federal income taxes — It is each Fund’s intention to continue to qualify as a regulated investment company for Federal income tax purposes by complying with the appropriate provisions of Subchapter M of the Internal Revenue Code of 1986. Accordingly, no provision for Federal income taxes has been made in the financial statements.
The Funds evaluate tax positions taken or expected to be taken in the course of preparing the Funds’ tax returns to determine whether it is “more-likely-than-not” (i.e., greater than 50-percent) that each tax position
| Gallery Trust | | April 30, 2020 (Unaudited) |
| | |
| | | |
| | |
| NOTES TO FINANCIAL STATEMENTS (continued) | | |
will be sustained upon examination by a taxing authority based on the technical merits of the position. Tax positions not deemed to meet the more-likely-than-not threshold are recorded as a tax benefit or expense in the current year. The Funds did not record any tax provision in the current period. However, management’s conclusions regarding tax positions taken may be subject to review and adjustment at a later date based on factors including, but not limited to, examination by tax authorities (i.e., the last three tax year ends, as applicable), on-going analysis of and changes to tax laws, regulations and interpretations thereof.
As of and during the period ended April 30, 2020, the Funds did not have a liability for any unrecognized tax benefits. The Funds recognize interest and penalties, if any, related to unrecognized tax benefits as income tax expense in the Statement of Operations. During the period ended April 30, 2020, the Funds did not incur any interest or penalties.
Security transactions, dividend and investment income — Security transactions are accounted for on trade date basis for financial reporting purposes. Costs used in determining realized gains and losses on the sale of investment securities are based on the specific identification method. Dividend income is recognized on the ex-dividend date. Interest income is recognized on the accrual basis from settlement date. Purchase discounts and premiums on debt securities are accreted and amortized to maturity and included in interest income. Certain dividends from foreign securities will be recorded as soon as the Funds are informed of the dividend, net of withholding taxes, if such information is obtained subsequent to the ex-dividend date.
Foreign currency translation — The books and records of the Funds are maintained in U.S. dollars. Investment securities and other assets and liabilities denominated in a foreign currency are translated into U.S. dollars on the date of valuation. The Funds do not isolate that portion of realized or unrealized gains and losses resulting from changes in the foreign exchange rate from fluctuations arising from changes in the market prices of the securities. These gains and losses are included in net realized and unrealized gains and losses on investments on the Statement of Operations.
Net realized and unrealized gains and losses on foreign currency transactions represent net foreign exchange gains or losses from foreign currency exchange contracts, disposition of foreign currencies, currency gains or losses realized between trade and settlement dates on securities
| Gallery Trust | | April 30, 2020 (Unaudited) |
| | |
| | | |
| | |
| NOTES TO FINANCIAL STATEMENTS (continued) | | |
transactions and the difference between the amount of the investment income and foreign withholding taxes recorded on the Funds’ books and the U.S. dollar equivalent of the amounts actually received or paid.
Forward Foreign Currency Contracts — The Funds may enter into forward foreign currency contracts as hedges against either specific transactions, fund positions or anticipated fund positions. The Funds may also engage in currency transactions to enhance the Funds’ returns. All commitments are “marked-to-market” daily at the applicable foreign exchange rate, and any resulting unrealized gains or losses are recorded currently. The Funds realize gains and losses at the time forward contracts are closed. Unrealized gains or losses on outstanding positions in forward foreign currency contracts held at the close of the period are recognized as ordinary income or loss for Federal income tax purposes. The Funds could be exposed to risk if the counterparties to the contracts are unable to meet the terms of the contract and from unanticipated movements in the value of a foreign currency relative to the U.S. dollar. Finally, the risk exists that losses could exceed amounts disclosed on the Statement of Assets and Liabilities. Refer to each Fund’s Schedule of Investments for details regarding open forward foreign currency contracts as of April 30, 2020, if applicable.
For the period ended April 30, 2020, the average balances of forward foreign currency exchange contracts for the International Government Fixed Income Fund were as follows:
| Average Monthly Notional Contracts Purchased | | $ | 4,996,729 | |
| Average Monthly Notional Contracts Sold | | | (3,083,424 | ) |
To reduce counterparty risk with respect to Over-the-Counter (“OTC”) transactions, the Funds have entered into netting arrangements, established within the Funds’ International Swap and Derivatives Association, Inc. (“ISDA”) master agreements, which allow the Funds to make (or to have an entitlement to receive) a single net payment in the event of default (close-out netting) for outstanding payables and receivables with respect to certain OTC positions in forward foreign currency contracts for each individual counterparty. In addition, the Funds may require that certain counterparties post cash and/or securities in collateral accounts to cover their net payment obligations for those derivative contracts subject to ISDA master agreements. If the counterparty fails to perform under these contracts and agreements, the cash and/or securities will be made available to the Funds.
| Gallery Trust | | April 30, 2020 (Unaudited) |
| | |
| | | |
| | |
| NOTES TO FINANCIAL STATEMENTS (continued) | | |
For financial reporting purposes, the Funds do not offset derivative assets and derivative liabilities that are subject to netting arrangements in the Statement of Assets and Liabilities. Bankruptcy or insolvency laws of a particular jurisdiction may impose restrictions on or prohibitions against the right of offset in bankruptcy, insolvency or other events.
Collateral terms are contract specific for OTC derivatives. For derivatives traded under an ISDA master agreement, the collateral requirements are typically calculated by netting the mark to market amount of each transaction under such agreement and comparing that amount to the value of any collateral currently pledged by the Funds or the counterparty.
For financial reporting purposes, cash collateral that has been pledged to cover obligations of the Funds, if any, is reported separately on the Statement of Assets and Liabilities as cash pledged as collateral. Non-cash collateral pledged by the Funds, if any, is noted in the Schedule of Investments. Generally, the amount of collateral due from or to a party must exceed a minimum transfer amount threshold before a transfer has to be made. To the extent amounts due to the Funds from their counterparties are not fully collateralized, contractually or otherwise, the Funds bear the risk of loss from counterparty nonperformance.
The following is a summary by counterparty of the market value of OTC financial derivative instruments and collateral (received)/pledged for the Fixed Income Fund as of April 30, 2020:
| Counterparty | | Gross
Assets Recognized
in the Statement of Assets and Liabilities | | | Gross
Liabilities Recognized
in the Statement of Assets and Liabilities | | | Net
Amount Available
to be Offset | | | Cash
Collateral Pledged or (Received) | | | Net
Amount † | |
| Brown Brothers Harriman | | | | | | | | | | | | | | | | | | | | |
| Total | | | | | | | | | | | | | | | | | | | | |
| † | Represents the net receivable/(payable) that would be due from/to the counterparty in the event of default. Exposure from OTC financial derivative instruments can only be netted across transactions governed under the same master agreement with the same legal entity. |
| Gallery Trust | | April 30, 2020 (Unaudited) |
| | |
| | | |
| | |
| NOTES TO FINANCIAL STATEMENTS (continued) | | |
Dividends and distributions to shareholders — The International Fund, Emerging Markets Fund, U.S. Small Cap Equity Fund and Global Listed Infrastructure Fund distribute their net investment income at least annually. The Fixed Income Fund distributes its net investment income quarterly. For each Fund, net realized capital gains, if any, are distributed at least annually. All distributions are recorded on ex-dividend date.
Offering Costs — During the period ended April 30, 2020, the U.S. Small Cap Equity Fund and the Global Listed Infrastructure Fund incurred offering costs each in the amount of $4,375, which are being amortized to expense over a twelve month period. As of April 30, 2020, the offering costs have been fully amortized by the Funds.
Expenses — Expenses that are directly related to the Fund are charged to the Fund. Other operating expenses of the Trust are prorated to the funds based on the number of funds and/or relative daily net assets.
| 3. | Transactions with affiliates |
Certain officers of the Trust are also employees of SEI Investments Global Funds Services (the “Administrator”), a wholly owned subsidiary of SEI Investments Company, and/or SEI Investments Distribution Co. (the “Distributor”). Such officers are paid no fees by the Trust, other than the Chief Compliance Officer (“CCO”) as described below, for serving as officers of the Trust.
A portion of the services provided by the CCO and his staff, who are employees of the Administrator, are paid for by the Trust as incurred. The services include regulatory oversight of the Trust’s advisors and service providers, as required by SEC regulations. The CCO’s services and fees have been approved by and are reviewed by the Board.
| 4. | Administration, Custodian, Transfer Agent and Distribution Agreements |
The Funds and the Administrator are parties to an Administration Agreement under which the Administrator provides administrative services to the Funds. For these services, the Administrator is paid an asset based fee, which will vary depending on the number of share classes and the average daily net assets of the Funds. For the period ended April 30, 2020, the amounts paid for these services are represented in the table below:
| Gallery Trust | | April 30, 2020 (Unaudited) |
| | |
| | | |
| | |
| NOTES TO FINANCIAL STATEMENTS (continued) | | |
| | | Accounting and Administration Fees | |
International Value Equity Fund | | $ | 290,168 | |
| Emerging Markets Value Equity Fund | | | 17,523 | |
| International Government Fixed Income Fund | | | 13,597 | |
U.S. Small Cap Equity Fund | | | 768 | |
Global Listed Infrastructure Fund | | | 768 | |
Expenses incurred under the agreements are shown on the Statement of Operations as “Accounting and administration fees”.
Brown Brothers Harriman & Co., (the “Custodian”) serves as the Funds’ Custodian pursuant to a custody agreement. Apex Fund Services (the “Transfer Agent”) serves as the Funds’ Transfer Agent pursuant to a transfer agency agreement.
| 5. | Investment Advisory Agreement |
Under the terms of an investment advisory agreement, the Adviser provides investment advisory services to the Funds. The Adviser is entitled to a fee, which is calculated daily and paid monthly, at an annual rate for each fund. The table below shows the rate of each Fund’s investment advisory fee.
| | | | |
International Value Equity Fund | | | 0.70% |
|
| Emerging Markets Value Equity Fund | | | 0.75% |
|
| International Government Fixed Income Fund | | | 0.50% |
|
U.S. Small Cap Equity Fund | | | 0.80% |
|
Global Listed Infrastructure Fund | | | 0.85% |
|
Prior to September 24, 2018, the Delaware Predecessor Adviser was paid a fee at an annual rate of 1.00% of the Emerging Markets Predecessor Fund’s average daily net assets and 0.60% of the average daily net assets of the Fixed Income Predecessor Fund’s average daily net assets. The Predecessor Adviser paid Mondrian a sub-advisory fee for its services as sub-adviser to each Predecessor Fund out of the advisory fees that the Predecessor Adviser received from the Predecessor Fund.
The Adviser has contractually agreed to reduce its fees and/or reimburse expenses to the extent necessary to keep total annual Fund operating expenses (excluding interest, taxes, brokerage commissions, acquired fund fees and
| Gallery Trust | | April 30, 2020 (Unaudited) |
| | |
| | | |
| | |
| NOTES TO FINANCIAL STATEMENTS (continued) | | |
expenses, and non-routine (collectively “excluded expenses”)) from exceeding the below percentages of the average daily net assets of the Funds until February 28, 2021 (the “Expense Limitation”).
| | | | |
International Value Equity Fund | | | 0.79% |
|
| Emerging Markets Value Equity Fund | | | 0.92% |
|
| International Government Fixed Income Fund | | | 0.60% |
|
U.S. Small Cap Equity Fund | | | 0.90% |
|
Global Listed Infrastructure Fund | | | 0.95% |
|
This agreement may be terminated: (i) by the Board for any reason at any time, or (ii) by the Adviser, upon ninety (90) days’ prior written notice to the Trust, effective as of the close of business on February 28, 2021.
Prior to September 24, 2018, the Delaware Predecessor Adviser had contractually agreed through July 30, 2019, to limit the total annual fund operating expenses charged, excluding interest, taxes and certain non-routine expenses to 1.20% and 0.75% of the average daily net assets of the Emerging Markets Predecessor Fund and Fixed Income Predecessor Fund respectively.
| 6. | Investment transactions |
The cost of purchases and proceeds from security sales other than long-term U.S. Government and short-term securities for the period ended April 30, 2020, are as follows:
| | | | | | | |
International Value Equity Fund | | $ | 63,039,150 | | | $ | 75,310,683 | |
| Emerging Markets Value Equity Fund | | | 7,747,031 | | | | 30,265,902 | |
| International Government Fixed Income Fund | | | 1,892,133 | | | | 4,785,206 | |
U.S. Small Cap Equity Fund | | | 485,244 | | | | 517,526 | |
Global Listed Infrastructure Fund | | | 282,715 | | | | 300,227 | |
The International Government Fixed Income Fund had purchases and sales of long-term U.S. Government securities of $— and $1,697,778, respectively.
| Gallery Trust | | April 30, 2020 (Unaudited) |
| | |
| | | |
| | |
| NOTES TO FINANCIAL STATEMENTS (continued) | | |
| 7. | Federal tax information |
The amount and character of income and capital gain distributions to be paid, if any, are determined in accordance with Federal income tax regulations, which may differ from U.S. GAAP. As a result, net investment income/(loss) and net realized gain/(loss) on investment transactions for a reporting period may differ significantly from distributions during such period. These book/tax differences may be temporary or permanent. To the extent these differences are permanent in nature, they are charged or credited to distributable earnings or paid-in capital, as appropriate, in the period that the differences arise.
The character of distributions made during the year from net investment income or net realized gains may differ from their ultimate characterization for federal income tax purposes. Also, due to the timing of dividend distributions, the fiscal year in which amounts are distributed may differ from the year that the income or realized gains (losses) were recorded by the Funds. Income dividends and capital gain distributions are determined in accordance with federal income tax regulations, which may differ from U.S. GAAP. These differences are primarily due to differing treatments for forwards, foreign currency transactions, wash sale loss deferrals, investments in REIT’s and investments in PFICs. Distributions during the years ended October 31, 2019 and October 31, 2018, unless otherwise noted, were as follows:
| |
| | | | | | | | | | | | | |
| International Value Equity Fund | | 2019 | | | $ | 14,825,938 | | | $ | 15,990,373 | | | $ | — | | | $ | 30,816,311 | |
| | | 2018 | | | | 17,091,536 | | | | — | | | | — | | | | 17,091,536 | |
| | | | | | | | | | | | | | | | | | | | |
| Emerging Markets Value Equity Fund | | 2019 | | | | 4,415,213 | | | | — | | | | — | | | | 4,415,213 | |
| | | 2018 | * | | | 2,885,248 | | | | — | | | | — | | | | 2,885,248 | |
| | | 2018 | ** | | | 8,413,005 | | | | — | | | | — | | | | 8,413,005 | |
| | | | | | | | | | | | | | | | | | | | |
| International Government Fixed Income Fund | | 2019 | | | | 1,319,302 | | | | 94,932 | | | | — | | | | 1,414,234 | |
| | | 2018 | * | | | — | | | | 357,037 | | | | — | | | | 357,037 | |
| | | 2018 | ** | | | 12,784 | | | | — | | | | — | | | | 12,784 | |
| | | | | | | | | | | | | | | | | | | | |
| U.S. Small Cap Equity Fund | | 2019 | *** | | | — | | | | — | | | | — | | | | — | |
| | | | | | | | | | | | | | | | | | | | |
| Global Listed Infrastructure Fund | | 2019 | *** | | | 925 | | | | — | | | | — | | | | 925 | |
| Gallery Trust | | April 30, 2020 (Unaudited) |
| | |
| | | |
| | |
| NOTES TO FINANCIAL STATEMENTS (continued) | | |
| * | Period ended October 31, 2018. |
| ** | Year ended March 31, 2018. |
| *** | Period ended October 31, 2019. |
As of October 31, 2019, the components of Distributable Earnings on a tax basis were as follows:
| | | International Value Equity Fund | | | Emerging
Markets Value Equity Fund | | | International Government Fixed Income Fund | | | U.S. Small
Cap Equity Fund | | | Global Listed Infrastructure Fund | |
| Undistributed ordinary income | | $ | 20,564,540 | | | $ | 1,319,956 | | | $ | — | | | $ | 51,202 | | | $ | 83,724 | |
| Undistributed long-term capital gains | | | 15,373,629 | | | | — | | | | — | | | | — | | | | — | |
| Capital loss carryforwards | | | — | | | | (107,755,243 | ) | | | — | | | | — | | | | — | |
| Net unrealized appreciation (depreciation) on investments | | | (5,625,866 | ) | | | 176,134 | | | | 1,381,510 | | | | 184,130 | | | | 184,240 | |
| Other temporary differences | | | | | | | | | | | | | | | | | | | | |
| Total distributable earnings | | | | | | | | | | | | | | | | | | | | |
| * | These differences relate to FX Straddle deferrals. |
Under the Regulated Investment Company Modernization Act of 2010, the Funds are permitted to carry forward capital losses incurred in taxable years beginning after December 22, 2010 for an unlimited period. Capital losses that are carried forward will retain their character as either short-term or long-term capital losses. The capital loss carryforwards are noted below:
| | | | | | | | | | |
| Emerging Markets Value Equity Fund | | $ | 26,321,469 | | | $ | 81,433,774 | | | $ | 107,755,243 | |
| * | The utilization of this amount is subject to limitation under IRC section 382-384. |
| Gallery Trust | | April 30, 2020 (Unaudited) |
| | |
| | | |
| | |
| NOTES TO FINANCIAL STATEMENTS (continued) | | |
For Federal income tax purposes the difference between Federal tax cost and book cost primarily relates to passive foreign investment companies, investments in publicly traded partnerships, and wash sales which cannot be used for Federal income tax purposes in the current year and have been deferred for use in future years. The Federal tax cost and aggregate gross unrealized appreciation and depreciation for the investments held by the Funds at April 30, 2020, were as follows:
| | | | | | Aggregate Gross
Unrealized
Appreciation | | | Aggregate Gross
Unrealized
Depreciation | | | Net Unrealized
Appreciation
(Depreciation) | |
| International Value Equity Fund | | $ | 574,023,078 | | | $ | 24,021,854 | | | $ | (131,711,887 | ) | | $ | (107,690,033 | ) |
| Emerging Markets Value Equity Fund | | | 22,391,902 | | | | 2,271,192 | | | | (1,938,049 | ) | | | 333,143 | |
| International Government Fixed Income Fund | | | 23,255,089 | | | | 1,282,471 | | | | (250,514 | ) | | | 1,031,957 | |
| U.S. Small Cap Equity Fund | | | 1,159,936 | | | | 55,610 | | | | (171,414 | ) | | | (115,804 | ) |
| Global Listed Infrastructure Fund | | | 1,337,064 | | | | 70,564 | | | | (105,030 | ) | | | (34,466 | ) |
The share transactions are shown below:
Mondrian International Value Equity Fund | |
| | | Six-month period ended April 30, 2020
(Unaudited) | | | Year ended October 31, 2019 | |
| Shares transactions: | | | | | | |
| Institutional Class shares | | | | | | |
Issued | | | 5,142,287 | | | | 10,607,837 | |
Reinvestment of dividends | | | 1,856,359 | | | | 1,743,360 | |
Redeemed | | | | | | | | |
| Net increase in shares outstanding | | | | | | | | |
| Gallery Trust | | April 30, 2020 (Unaudited) |
| | |
| | | |
| | |
| NOTES TO FINANCIAL STATEMENTS (continued) | | |
Mondrian Emerging Markets Value Equity Fund | |
| | | Six-month period ended April 30, 2020
(Unaudited) | | | Year ended October 31, 2019 | |
| Shares transactions: | | | | | | |
| Institutional Class shares | | | | | | |
Issued | | | 550,288 | | | | 322,000 | |
Reinvestment of dividends | | | 170,152 | | | | 660,122 | |
Redeemed | | | | | | | | |
| Net decrease in shares outstanding | | | | | | | | |
Mondrian International Government Fixed Income Fund | |
| | | Six-month period ended April 30, 2020
(Unaudited) | | | Year ended October 31, 2019 | |
| Shares transactions: | | | | | | |
| Institutional Class shares | | | | | | |
Issued | | | 126,117 | | | | 549,721 | |
Reinvestment of dividends | | | 103,342 | | | | 114,895 | |
Redeemed | | | | | | | | |
| Net decrease in shares outstanding | | | | | | | | |
Mondrian U.S. Small Cap Equity Fund | |
| | | Six-month period ended April 30, 2020
(Unaudited) | | | For the period ended
October 31, 2019(1) | |
| Shares transactions: | | | | | | |
| Institutional Class shares | | | | | | |
Issued | | | — | | | | 125,000 | |
Reinvestment of dividends | | | | | | | | |
| Net increase in shares outstanding | | | | | | | | |
| Gallery Trust | | April 30, 2020 (Unaudited) |
| | |
| | | |
| | |
| NOTES TO FINANCIAL STATEMENTS (continued) | | |
Mondrian Global Listed Infrastructure Fund | |
| | | Six-month period ended April 30, 2020
(Unaudited) | | | For the period ended
October 31, 2019(1) | |
| Shares transactions: | | | | | | |
| Institutional Class shares | | | | | | |
Issued | | | — | | | | 125,000 | |
Reinvestment of dividends | | | | | | | | |
| Net increase in shares outstanding | | | | | | | | |
| (1) | The Fund commenced operations December 17, 2018. |
| 9. | Risks associated with financial instruments |
As with all mutual funds, a shareholder of a Fund is subject to the risk that his or her investment could lose money. The Funds are subject to the principal risks noted below, any of which may adversely affect the Funds’ net asset value and ability to meet its investment objective. A more complete description of risks associated with each Fund is included in the prospectus.
Active management risk
The Funds are subject to the risk that the Adviser’s judgments about the attractiveness, value, or potential appreciation of the Funds’ investments may prove to be incorrect. If the investments selected and strategies employed by the Funds fail to produce the intended results, the Funds could underperform in comparison to its benchmark index or other funds with similar objectives and investment strategies.
Equity risk
Since it purchases equity securities, the Funds are subject to the risk that stock prices may fall over short or extended periods of time. Historically, the equity markets have moved in cycles, and the value of the Funds’ equity securities may fluctuate from day to day. Individual companies may report poor results or be negatively affected by industry and/or economic trends and developments. The prices of securities issued by such companies may suffer a decline in response. These factors contribute to price volatility, which is the principal risk of investing in the Funds.
| Gallery Trust | | April 30, 2020 (Unaudited) |
| | |
| | | |
| | |
| NOTES TO FINANCIAL STATEMENTS (continued) | | |
Convertible securities risk
The value of a convertible security is influenced by changes in interest rates (with investment value declining as interest rates increase and increasing as interest rates decline) and the credit standing of the issuer. The price of a convertible security will also normally vary in some proportion to changes in the price of the underlying common stock because of the conversion or exercise feature.
Large capitalization company risk
The large capitalization companies in which the Funds may invest may lag the performance of smaller capitalization companies because large capitalization companies may experience slower rates of growth than smaller capitalization companies and may not respond as quickly to market changes and opportunities.
Preferred stocks risk
Preferred stocks are sensitive to interest rate changes, and are also subject to equity risk, which is the risk that stock prices will fall over short or extended periods of time. The rights of preferred stocks on the distribution of a company’s assets in the event of a liquidation are generally subordinate to the rights associated with a company’s debt securities.
Foreign company risk
Investing in foreign companies, including direct investments and investments through depositary receipts, poses additional risks since political and economic events unique to a country or region will affect those markets and their issuers. These risks will not necessarily affect the U.S. economy or similar issuers located in the U.S. Securities of foreign companies may not be registered with the SEC and foreign companies are generally not subject to the regulatory controls imposed on U.S. issuers and, as a consequence, there is generally less publically available information about foreign securities than is available about domestic securities. Income from foreign securities owned by the Funds may be reduced by a withholding tax at the source, which tax would reduce income received from the securities comprising the portfolio. Foreign securities may also be more difficult to value than securities of U.S. issuers. While depositary receipts provide an alternative to directly purchasing the underlying foreign securities in their respective national markets and currencies, investments in depositary receipts continue to be subject to many of the risks associated with investing directly in foreign securities.
| Gallery Trust | | April 30, 2020 (Unaudited) |
| | |
| | | |
| | |
| NOTES TO FINANCIAL STATEMENTS (continued) | | |
Emerging markets securities risk
The Funds’ investments in emerging markets securities are considered speculative and subject to heightened risks in addition to the general risks of investing in foreign securities. Unlike more established markets, emerging markets may have governments that are less stable, markets that are less liquid and economies that are less developed. In addition, the securities markets of emerging market countries may consist of companies with smaller market capitalizations and may suffer periods of relative illiquidity; significant price volatility; restrictions on foreign investment; and possible restrictions on repatriation of investment income and capital. Furthermore, foreign investors may be required to register the proceeds of sales, and future economic or political crises could lead to price controls, forced mergers, expropriation or confiscatory taxation, seizure, nationalization or creation of government monopolies.
Foreign currency risk
As a result of the Funds’ investments in securities denominated in, and/or receiving revenues in, foreign currencies, the Funds will be subject to currency risk. Currency risk is the risk that foreign currencies will decline in value relative to the U.S. dollar or, in the case of hedging positions, that the U.S. dollar will decline in value relative to the currency hedged. In either event, the dollar value of an investment in the Funds would be adversely affected.
Depositary receipts risk
Investments in depositary receipts may be less liquid and more volatile than the underlying securities in their primary trading market. If a depositary receipt is denominated in a different currency than its underlying securities, the Funds will be subject to the currency risk of both the investment in the depositary receipt and the underlying security. Holders of depositary receipts may have limited or no rights to take action with respect to the underlying securities or to compel the issuer of the receipts to take action. The prices of depositary receipts may differ from the prices of securities upon which they are based. Certain of the depositary receipts in which the Fund invests may be unsponsored depositary receipts. Unsponsored depositary receipts may not provide as much information about the underlying issuer and may not carry the same voting privileges as sponsored depositary receipts. Unsponsored depositary receipts are issued by one or more depositaries in response to market demand, but without a formal agreement with the company that issues the underlying securities.
| Gallery Trust | | April 30, 2020 (Unaudited) |
| | |
| | | |
| | |
| NOTES TO FINANCIAL STATEMENTS (continued) | | |
Derivatives risk
The Funds’ use of forward contracts and participatory notes is subject to market risk, correlation risk, credit risk, valuation risk and liquidity risk. Market risk is the risk that the market value of an investment may move up and down, sometimes rapidly and unpredictably. Correlation risk is the risk that changes in the value of the derivative may not correlate perfectly or at all with the underlying asset, rate or index. Credit risk is the risk that the counterparty to a derivative contract will default or otherwise become unable to honor a financial obligation. Valuation risk is the risk that the derivative may be difficult to value. Liquidity risk is described below. The Funds’ use of forwards is also subject to leverage risk and hedging risk. Leverage risk is the risk that the use of leverage may amplify the effects of market volatility on the Fund’s share price and may also cause the Fund to liquidate portfolio positions when it would not be advantageous to do so in order to satisfy its obligations. Hedging risk is the risk that derivatives instruments used for hedging purposes may also limit any potential gain that may result from the increase in value of the hedged asset. To the extent that the Funds engage in hedging strategies, there can be no assurance that such strategy will be effective or that there will be a hedge in place at any given time. Each of these risks could cause the Funds to lose more than the principal amount invested in a derivative instrument.
Liquidity risk
Certain securities may be difficult or impossible to sell at the time and the price that the Funds would like. The Funds may have to lower the price, sell other securities instead or forgo an investment opportunity, any of which could have a negative effect on Fund management or performance.
Portfolio turnover risk
Due to their investment strategies, the Funds may buy and sell securities frequently. This may result in higher transaction costs and additional capital gains tax liabilities.
Large purchase and redemption risk
Large purchases or redemptions of the Fund’s shares may force the Fund to purchase or sell securities at times when it would not otherwise do so, and may cause the Fund’s portfolio turnover rate and transaction costs to rise, which may negatively affect the Fund’s performance and have adverse tax consequences for Fund shareholders.
| Gallery Trust | | April 30, 2020 (Unaudited) |
| | |
| | | |
| | |
| NOTES TO FINANCIAL STATEMENTS (continued) | | |
Fixed income risk
Fixed income securities are subject to a number of risks, including credit and interest rate risks. Credit risk is the risk that the issuer or obligor will not make timely payments of principal and interest. Changes in an issuer’s credit rating or the market’s perception of an issuer’s creditworthiness may also affect the value of the Fund’s investment in that issuer. Interest rate risk is the risk that the value of a fixed income security will fall when interest rates rise. In general, the longer the maturity of a fixed income security, the more likely its value will decline when interest rates rise. Risks associated with rising interest rates are heightened given that interest rates in the U.S. are at, or near, historic lows.
Zero-coupon bond risk
The market value of a zero-coupon bond is generally more volatile than the market value of other fixed income securities with similar maturities that pay interest periodically. In addition, federal income tax law requires that the holder of a zero coupon bond accrue a portion of the discount at which the bond was purchased as taxable income each year. The Fund may consequently have to dispose of portfolio securities under disadvantageous circumstances to generate cash to satisfy its requirement as a regulated investment company to distribute all of its net income (including non-cash income attributable to zero-coupon securities). These actions may reduce the assets to which the Fund’s expenses could otherwise be allocated and may reduce the Fund’s rate of return.
Foreign sovereign debt securities risk
The Funds’ investments in foreign sovereign debt securities are subject to the risks that: (i) the governmental entity that controls the repayment of sovereign debt may not be willing or able to repay the principal and/or interest when it becomes due, due to factors such as debt service burden, political constraints, cash flow problems and other national economic factors; (ii) governments may default on their debt securities, which may require holders of such securities to participate in debt rescheduling or additional lending to defaulting governments; and (iii) there is no bankruptcy proceeding by which defaulted sovereign debt may be collected in whole or in part.
Foreign government agencies risk
Bonds issued by government agencies, subdivisions or instrumentalities of foreign governments are generally backed only by the general creditworthiness and reputation of the entity issuing the bonds and may not be backed by the
| Gallery Trust | | April 30, 2020 (Unaudited) |
| | |
| | | |
| | |
| NOTES TO FINANCIAL STATEMENTS (continued) | | |
full faith and credit of the foreign government. Moreover, a foreign government that explicitly provides its full faith and credit to a particular entity may be, due to changed circumstances, unable or unwilling to provide that support. A foreign government agency’s operations and financial condition are influenced by the foreign government’s economic and other policies.
Supranational entities risk
Government members, or “stockholders,” usually make initial capital contributions to a supranational entity and in many cases are committed to make additional capital contributions if the supranational entity is unable to repay its borrowings. There is no guarantee, however, that one or more stockholders of the supranational entity will continue to make any necessary additional capital contributions. If such contributions are not made, the entity may be unable to pay interest or repay principal on its debt securities, and the Funds may lose money on such investments.
Corporate fixed income securities risk
Corporate fixed income securities respond to economic developments, especially changes in interest rates, as well as perceptions of the creditworthiness and business prospects of individual issuers.
Non-diversification risk
The Fixed Income Fund is classified as “non-diversified,” which means it may invest a larger percentage of its assets in a smaller number of issuers than a diversified fund. To the extent the Fund invests its assets in a smaller number of issuers, the Fund will be more susceptible to negative events affecting those issuers than a diversified fund.
New Fund Risk
Because the U.S. Small Cap Equity Fund and the Global Listed Infrastructure Fund are both new, investors in the Funds bear the risk that the Funds may not be successful in implementing their investment strategy, may not employ a successful investment strategy, or may fail to attract sufficient assets under management to realize economies of scale, any of which could result in the Funds being liquidated at any time without shareholder approval and at a time that may not be favorable for all shareholders. Such liquidation could have negative tax consequences for shareholders and will cause shareholders to incur expenses of liquidation.
| Gallery Trust | | April 30, 2020 (Unaudited) |
| | |
| | | |
| | |
| NOTES TO FINANCIAL STATEMENTS (continued) | | |
Investment Style Risk
Value investing focuses on companies with stocks that appear undervalued to the Adviser in light of factors such as the company’s earnings, book value, revenues or cash flow. The Adviser’s methodology for analyzing value may differ from other market approaches. If the Adviser’s assessment of market conditions, or a company’s value or its prospects for exceeding earnings expectations is inaccurate, a Fund could suffer losses or produce poor performance relative to other funds. In addition, “value stocks” can continue to be undervalued by the market for long periods of time.
Rights and Warrants Risk
Investments in rights or warrants involve the risk of loss of the purchase value of a right or warrant if the right to subscribe to additional shares is not exercised prior to the right’s or warrant’s expiration. Also, the purchase of rights and/or warrants involves the risk that the effective price paid for the right and/or warrant added to the subscription price of the underlying security may exceed the market price of the underlying security in instances such as those where there is no movement in the price of the underlying security.
Small- and Mid-Capitalization Company Risk
The small- and mid-capitalization companies that a Fund invests in may be more vulnerable to adverse business or economic events than larger, more established companies. In particular, investments in small- and mid-capitalization companies may pose additional risks, including liquidity risk, because these companies tend to have limited product lines, markets and financial resources, and may depend upon a relatively small management group. Therefore, small- and mid-capitalization stocks may be more volatile than those of larger companies. These securities may be traded over-the-counter or listed on an exchange.
Exchange-Traded Funds Risk
ETFs are pooled investment vehicles, such as registered investment companies and grantor trusts, whose shares are listed and traded on U.S. and non-U.S. stock exchanges or otherwise traded in the over-the-counter market. To the extent that a Fund invests in ETFs, the Fund will be subject to substantially the same risks as those associated with the direct ownership of the securities comprising the index on which an index ETF is based or the other holdings of an active or index ETF, and the value of the Fund’s investment will fluctuate in response to the performance of the underlying index or holdings. ETFs
| Gallery Trust | | April 30, 2020 (Unaudited) |
| | |
| | | |
| | |
| NOTES TO FINANCIAL STATEMENTS (continued) | | |
typically incur fees that are separate from those of the Fund. Accordingly, the Fund’s investments in ETFs will result in the layering of expenses such that shareholders will indirectly bear a proportionate share of the ETFs’ operating expenses, in addition to paying Fund expenses.
Credit Risk
The credit rating or financial condition of an issuer may affect the value of a fixed income security. Generally, the lower the credit quality of a security, the greater the perceived risk that the issuer will fail to pay interest fully and return principal in a timely manner. If an issuer defaults or becomes unable to honor its financial obligations, the security may lose some or all of its value.
Interest Rate Risk
As with most funds that invest in fixed income securities, changes in interest rates could affect the value of your investment. Rising interest rates tend to cause the prices of fixed income securities (especially those with longer maturities and lower credit qualities) and a Fund’s share price to fall.
High Yield Bond Risk
High yield, or “junk,” bonds are debt securities rated below investment grade. High yield bonds are speculative, involve greater risks of default, downgrade, or price declines and are more volatile and tend to be less liquid than investment-grade securities. Companies issuing high yield bonds are less financially strong, are more likely to encounter financial difficulties, and are more vulnerable to adverse market events and negative sentiments than companies with higher credit ratings.
Prepayment and Extension Risk
When interest rates fall, issuers of high interest debt obligations may pay off the debts earlier than expected (prepayment risk), and a Fund may have to reinvest the proceeds at lower yields. When interest rates rise, issuers of lower interest debt obligations may pay off the debts later than expected (extension risk), thus keeping the Fund’s assets tied up in lower interest debt obligations.
U.S. Government Securities Risk
A Fund’s investment in U.S. government obligations may include securities issued or guaranteed as to principal and interest by the U.S. government, or its agencies or instrumentalities. Payment of principal and interest on U.S. government obligations may be backed by the full faith and credit of the United States or may be backed solely by the issuing or guaranteeing agency or
| Gallery Trust | | April 30, 2020 (Unaudited) |
| | |
| | | |
| | |
| NOTES TO FINANCIAL STATEMENTS (continued) | | |
instrumentality itself. There can be no assurance that the U.S. government would provide financial support to its agencies or instrumentalities (including government-sponsored enterprises) where it is not obligated to do so. In addition, U.S. government securities are not guaranteed against price movements due to changing interest rates.
REITs Risk
REITs are pooled investment vehicles that own, and usually operate, income-producing real estate. REITs are susceptible to the risks associated with direct ownership of real estate, such as the following: declines in property values; increases in property taxes, operating expenses, interest rates or competition; overbuilding; zoning changes; and losses from casualty or condemnation. REITs typically incur fees that are separate from those of a Fund. Accordingly, a Fund’s investments in REITs will result in the layering of expenses such that shareholders will indirectly bear a proportionate share of the REITs’ operating expenses, in addition to paying Fund expenses.
MLPs Risk
MLPs are limited partnerships in which the ownership units are publicly traded. MLPs often own several properties or businesses (or own interests) that are related to oil and gas industries or other natural resources, but they also may finance other projects. To the extent that an MLP’s interests are all in a particular industry, the MLP will be negatively impacted by economic events adversely impacting that industry. Additional risks of investing in an MLP also include those involved in investing in a partnership as opposed to a corporation, such as limited control of management, limited voting rights and tax risks. MLPs may be subject to state taxation in certain jurisdictions, which will have the effect of reducing the amount of income paid by the MLP to its investors. A Fund’s investment in MLPs may result in the layering of expenses, such that shareholders will indirectly bear a proportionate share of the MLPs’ operating expenses, in addition to paying Fund expenses.
Private Placements Risk
Investment in privately placed securities may be less liquid than in publicly traded securities. Although these securities may be resold in privately negotiated transactions, the prices realized from these sales could be less than those originally paid by a Fund or less than what may be considered the fair value of such securities. Further, companies whose securities are not publicly traded may not be subject to the disclosure and other investor protection requirements that might be applicable if their securities were publicly traded.
| Gallery Trust | | April 30, 2020 (Unaudited) |
| | |
| | | |
| | |
| NOTES TO FINANCIAL STATEMENTS (continued) | | |
Risks of Investing in Other Investment Companies
To the extent a Fund invests in other investment companies, such as open-end funds, closed-end funds and ETFs, the Fund will be subject to substantially the same risks as those associated with the direct ownership of the securities held by such other investment companies. As a shareholder of another investment company, the Fund relies on that investment company to achieve its investment objective. If the investment company fails to achieve its objective, the value of the Fund’s investment could decline, which could adversely affect the Fund’s performance. By investing in another investment company, Fund shareholders indirectly bear the Fund’s proportionate share of the fees and expenses of the other investment company, in addition to the fees and expenses that Fund shareholders directly bear in connection with the Fund’s own operations.
Because ETFs and certain closed-end funds are listed on national stock exchanges and are traded like stocks listed on an exchange, their shares potentially may trade at a discount or premium. Investments in ETFs and certain closed-end funds are also subject to brokerage and other trading costs, which could result in greater expenses to the Fund. In addition, because the value of ETF and certain closed-end fund shares depends on the demand in the market, the Adviser may not be able to liquidate the Fund’s holdings at the most optimal time, which could adversely affect Fund performance.
Infrastructure Company Risk
Infrastructure companies are subject to a variety of factors that may adversely affect their business or operations, including high interest costs in connection with capital construction programs, costs associated with environmental and other regulations, difficulty in raising capital in adequate amounts on reasonable terms in periods of high inflation or unsettled capital markets, the effects of economic slowdown and surplus capacity, increased competition from other providers of services, uncertainties concerning the availability of fuel at reasonable prices, the effects of energy conservation policies, service interruption due to environmental, operational or other mishaps, and other factors. Additionally, infrastructure entities may be subject to regulation by various governmental authorities and may also be affected by governmental regulation of rates charged to customers; the imposition of special tariffs and changes in tax laws, regulatory policies and accounting standards; nationalization; and general changes in market sentiment towards infrastructure assets.
| Gallery Trust | | April 30, 2020 (Unaudited) |
| | |
| | | |
| | |
| NOTES TO FINANCIAL STATEMENTS (continued) | | |
Industry Concentration Risk
The Mondrian Global Listed Infrastructure Fund concentrates its investments in infrastructure companies. Concentration in particular industries subjects this Fund to the risks associated with those industries. As a result, this Fund may be subject to greater price volatility and risk of loss as a result of adverse economic, business or other developments affecting those industries than funds investing in a broader range of industries.
Geographic Focus Risk
To the extent that it focuses its investments in a particular country or geographic region, a Fund may be more susceptible to economic, political, regulatory or other events or conditions affecting issuers and countries within that country or geographic region. As a result, the Fund may be subject to greater price volatility and risk of loss than a fund holding more geographically diverse investments.
Market Risk
Each Fund is subject to market risk, which is the risk that the market value of a security may move up and down, sometimes rapidly and unpredictably. Market risk may affect a single issuer, an industry, a sector or the market as a whole. In addition, the impact of any epidemic, pandemic or natural disaster, or widespread fear that such events may occur, could negatively affect the global economy, as well as the economies of individual countries, the financial performance of individual companies and sectors, and the markets in general in significant and unforeseen ways. Any such impact could adversely affect the prices and liquidity of the securities and other instruments in which a Fund invests, which in turn could negatively impact the Fund’s performance and cause losses on your investment in the Fund.
In the normal course of business, the Funds enter into contracts that provide general indemnifications. The Funds’ maximum exposure under these arrangements is dependent on future claims that may be made against the Funds and, therefore, cannot be established; however, based on experience, the risk of loss from such claims is considered remote.
| Gallery Trust | | April 30, 2020 (Unaudited) |
| | |
| | | |
| | |
| NOTES TO FINANCIAL STATEMENTS (continued) | | |
The Funds have access to custodian overdraft facilities. A Fund may have utilized the overdraft facility and incurred an interest expense, which is disclosed on the fund’s Statement of Operations, if any. The interest expense is determined based on a negotiated rate above the current Federal Funds Rate. For the period ended April 30, 2020, none of the Funds incurred any interest expense.
At April 30, 2020, the percentage of total shares outstanding held by a limited number of shareholders for each Fund, which were comprised of omnibus accounts that were held on behalf of various individual shareholders was as follows:
| | | | | | | |
International Value Equity Fund | | 5 | | | | 59% |
|
| Emerging Markets Value Equity Fund | | 3 | | | | 97% |
|
| International Government Fixed Income Fund | | 2 | | | | 85% |
|
U.S. Small Cap Equity Fund | | 1 | | | | 100% |
|
Global Listed Infrastructure Fund | | 1 | | | | 100% |
|
On August 17, 2018, the SEC adopted amendments to Regulation S-X. These changes are effective for periods after November 5, 2018. The updates to Registered Investment Companies were mainly focused on simplifying the presentation of distributable earnings by eliminating the need to present the components of distributable earnings on a book basis in the Statement of Assets & Liabilities. The update also impacted the presentation of undistributed net investment income and distribution to shareholders on the Statement of Changes in Net Assets. The amounts presented in the current Statement of Changes in Net Assets represent the aggregated total distributions of net investment income and realized capital gains, except for distributions classified as return of capital which are still presented separately.
| Gallery Trust | | April 30, 2020 (Unaudited) |
| | |
| | | |
| | |
| NOTES TO FINANCIAL STATEMENTS (concluded) | | |
| 14. | New accounting pronouncement |
In August 2018, the FASB issued Accounting Standards Update 2018-13, Fair Value Measurement (Topic 820). The new guidance includes additions and modifications to disclosures requirements for fair value measurements. For public entities, the amendments are effective for financial statements issued for fiscal years beginning after December 15, 2019, and interim periods within those fiscal years.
The Funds have evaluated the need for disclosures and/or adjustments resulting from subsequent events through the date the financials were issued. Based on this evaluation, see the below disclosure to the financial statements as of April 30, 2020.
Effective July 1, 2020, the Mondrian International Value Equity Fund will change its management fee to 0.65% and the Adviser has contractually agreed to waive fees and reimburse expenses to the extent necessary to keep Total Annual Fund Operating Expenses (not including excluded expenses) from exceeding 0.74% of the Fund’s average daily net assets until February 28, 2021.
| Gallery Trust | | April 30, 2020 (Unaudited) |
| | |
| | | |
| | |
DISCLOSURE OF FUND EXPENSES
| | |
All mutual funds have operating expenses. As a shareholder of a mutual fund, your investment is affected by these ongoing costs, which include (among others) costs for fund management, administrative services, and shareholder reports like this one. It is important for you to understand the impact of these costs on your investment returns.
Operating expenses such as these are deducted from the mutual fund’s gross income and directly reduce its final investment return. These expenses are expressed as a percentage of the mutual fund’s average net assets; this percentage is known as the mutual fund’s expense ratio.
The following examples use the expense ratio and are intended to help you understand the ongoing costs (in dollars) of investing in your Fund and to compare these costs with those of other mutual funds. The examples are based on an investment of $1,000 made at the beginning of the period shown and held for the entire period from November 1, 2019 to April 30, 2020.
The table on the next page illustrates your Fund’s costs in two ways:
Actual Fund Return. This section helps you to estimate the actual expenses after fee waivers that your Fund incurred over the period. The “Expenses Paid During Period” column shows the actual dollar expense cost incurred by a $1,000 investment in the Fund, and the “Ending Account Value” number is derived from deducting that expense cost from the Fund’s gross investment return.
You can use this information, together with the actual amount you invested in the Fund, to estimate the expenses you paid over that period. Simply divide your ending starting account value by $1,000 to arrive at a ratio (for example, an $8,600 account value divided by $1,000 = 8.6), then multiply that ratio by the number shown for your Fund under “Expenses Paid During Period.”
Hypothetical 5% Return. This section helps you compare your Fund’s costs with those of other mutual funds. It assumes that the Fund had an annual 5% return before expenses during the year, but that the expense ratio (Column 3) for the period is unchanged. This example is useful in making comparisons because the Securities and Exchange Commission requires all mutual funds to make this 5% calculation. You can assess your Fund’s comparative cost by comparing the hypothetical result for your Fund in the “Expenses Paid During Period” column with those that appear in the same charts in the shareholder reports for other mutual funds.
| Gallery Trust | | April 30, 2020 (Unaudited) |
| | |
| | | |
| | |
| DISCLOSURE OF FUND EXPENSES | | |
Note: Because the return is set at 5% for comparison purposes — NOT your Fund’s actual return — the account values shown may not apply to your specific investment.
| | | Beginning
Account
Value
11/1/19 | | | Ending
Account
Value
4/30/20 | | | Annualized Expense
Ratios | | | Expenses
Paid
During
Period* | |
| Mondrian International Value Equity Fund | |
| Actual Fund Return | | $ | 1,000.00 | | | $ | 801.00 | | | | 0.79 | % | | $ | 3.54 | |
| Hypothetical 5% Return | | $ | 1,000.00 | | | $ | 1,020.94 | | | | 0.79 | % | | $ | 3.97 | |
| Mondrian Emerging Markets Value Equity Fund | |
| Actual Fund Return | | $ | 1,000.00 | | | $ | 872.30 | | | | 0.92 | % | | $ | 4.28 | |
| Hypothetical 5% Return | | $ | 1,000.00 | | | $ | 1,020.29 | | | | 0.92 | % | | $ | 4.62 | |
| Mondrian International Government Fixed Income Fund | |
| Actual Fund Return | | $ | 1,000.00 | | | $ | 994.00 | | | | 0.60 | % | | $ | 2.97 | |
| Hypothetical 5% Return | | $ | 1,000.00 | | | $ | 1,021.88 | | | | 0.60 | % | | $ | 3.02 | |
| Mondrian U.S. Small Cap Equity Fund | |
| Actual Fund Return | | $ | 1,000.00 | | | $ | 725.80 | | | | 0.90 | % | | $ | 3.86 | |
| Hypothetical 5% Return | | $ | 1,000.00 | | | $ | 1,020.39 | | | | 0.90 | % | | $ | 4.52 | |
| Mondrian Global Listed Infrastructure Fund | |
| Actual Fund Return | | $ | 1,000.00 | | | $ | 874.20 | | | | 0.95 | % | | $ | 4.43 | |
| Hypothetical 5% Return | | $ | 1,000.00 | | | $ | 1,020.14 | | | | 0.95 | % | | $ | 4.77 | |
| * | Expenses are equal to the Fund’s annualized expense ratio multiplied by the average account value over the period, multiplied by 182/366 (to reflect the one-half year period). |
| Gallery Trust | | April 30, 2020 (Unaudited) |
| | |
| | | |
| REVIEW OF LIQUIDITY RISK MANAGEMENT PROGRAM | | |
| | |
Pursuant to Rule 22e-4 under the 1940 Act, the Funds’ investment adviser has adopted, and the Board has approved, a liquidity risk management program (the “Program”) to govern the Funds’ approach to managing liquidity risk. The Program is overseen by the Funds’ Liquidity Risk Management Program Administrator (the “Program Administrator”), and the Program’s principal objectives include assessing, managing and periodically reviewing each Fund’s liquidity risk, based on factors specific to the circumstances of the Funds.
At a meeting of the Board held on March 18, 2020, the Trustees received a report from the Program Administrator addressing the operations of the Program and assessing its adequacy and effectiveness of implementation. The Board acknowledged that the report covered the period from June 1, 2019 through December 31, 2019 and thus did not cover the period of then-current market volatility. The Board requested that the Program Administrator provide an update of the operation of the Program during the then-current market volatility at its next meeting. The Program Administrator’s report noted that the Program Administrator had determined that the Program is reasonably designed to assess and manage each Fund’s liquidity risk and has operated adequately and effectively to manage each Fund’s liquidity risk since the Program was implemented on June 1, 2019. The Program Administrator’s report noted that during the period covered by the report, there were no liquidity events that impacted the Funds or their ability to timely meet redemptions without dilution to existing shareholders. The Program Administrator’s report further noted that no material changes have been made to the Program since its implementation.
There can be no assurance that the Program will achieve its objectives in the future. Please refer to the prospectus for more information regarding a Fund’s exposure to liquidity risk and other principal risks to which an investment in the Funds may be subject.
| Gallery Trust | | April 30, 2020 (Unaudited) |
| | |
| | | |
| | |
APPROVAL OF INVESTMENT ADVISORY AGREEMENT | | |
Pursuant to Section 15 of the Investment Company Act of 1940 (the “1940 Act”), the Funds’ advisory agreement (the “Agreement”) must be renewed at least annually after its initial two-year term: (i) by the vote of the Board of Trustees (the “Board” or the “Trustees”) of Gallery Trust (the “Trust”) or by a vote of a majority of the shareholders of the Funds; and (ii) by the vote of a majority of the Trustees who are not parties to the Agreement or “interested persons” of any party thereto, as defined in the 1940 Act (the “Independent Trustees”), cast in person at a meeting called for the purpose of voting on such renewal.
A Board meeting was held on December 12, 2019 to decide whether to renew the Agreement for an additional one-year term. In preparation for the meeting, the Trustees requested that the Adviser furnish information necessary to evaluate the terms of the Agreement. Prior to the meeting, the Independent Trustees of the Funds met to review and discuss the information provided and submitted a request for additional information to the Adviser, and information was provided in response to this request. The Trustees used this information, as well as other information that the Adviser and other service providers of the Funds presented or submitted to the Board at the meeting and other meetings held during the prior year, to help them decide whether to renew the Agreement for an additional year.
Specifically, the Board requested and received written materials from the Adviser and other service providers of the Funds regarding: (i) the nature, extent and quality of the Adviser’s services; (ii) the Adviser’s investment management personnel; (iii) the Adviser’s operations and financial condition; (iv) the Adviser’s brokerage practices (including any soft dollar arrangements) and investment strategies; (v) the advisory fees paid to the Adviser and overall fees and operating expenses compared with peer groups of mutual funds; (vi) the level of the Adviser’s profitability from its relationship with the Funds, including both direct and indirect benefits accruing to the Adviser and its affiliates; (vii) the Adviser’s potential economies of scale; (viii) the Adviser’s compliance program, including a description of material compliance matters and material compliance violations; (ix) the Adviser’s policies on and compliance procedures for personal securities transactions; and (x) the Funds’ performance compared with peer groups of mutual funds and the Funds’ benchmark indices.
Representatives from the Adviser, along with other Fund service providers, presented additional information and participated in question and answer sessions at the Board meeting to help the Trustees evaluate the Adviser’s
| Gallery Trust | | April 30, 2020 (Unaudited) |
| | |
| | | |
| | |
APPROVAL OF INVESTMENT ADVISORY AGREEMENT | | |
services, fees and other aspects of the Agreement. The Independent Trustees received advice from independent counsel and met in executive sessions outside the presence of Fund management and the Adviser.
At the Board meeting, the Trustees, including all of the Independent Trustees, based on their evaluation of the information provided by the Adviser and other service providers of the Funds, renewed the Agreement. In considering the renewal of the Agreement, the Board considered various factors that they determined were relevant, including: (i) the nature, extent and quality of the services provided by the Adviser; (ii) the investment performance of the Funds and the Adviser; (iii) the costs of the services provided and profits realized by the Adviser from its relationship with the Funds, including both direct and indirect benefits accruing to the Adviser and its affiliates; (iv) the extent to which economies of scale are being realized by the Adviser; and (v) whether fee levels reflect such economies of scale for the benefit of Fund investors, as discussed in further detail below.
Nature, Extent and Quality of Services Provided by the Adviser
In considering the nature, extent and quality of the services provided by the Adviser, the Board reviewed the portfolio management services provided by the Adviser to the Funds, including the quality and continuity of the Adviser’s portfolio management personnel, the resources of the Adviser, and the Adviser’s compliance history and compliance program. The Trustees reviewed the terms of the Agreement. The Trustees also reviewed the Adviser’s investment and risk management approaches for the Funds. The most recent investment adviser registration form (“Form ADV”) for the Adviser was available to the Board, as was the response of the Adviser to a detailed series of questions which included, among other things, information about the investment advisory services provided by the Adviser to the Funds.
The Trustees also considered other services provided to the Funds by the Adviser such as selecting broker-dealers for executing portfolio transactions, monitoring adherence to the Funds’ investment restrictions, and monitoring compliance with various Fund policies and procedures and with applicable securities laws and regulations. Based on the factors above, as well as those discussed below, the Board concluded, within the context of its full deliberations, that the nature, extent and quality of the services provided to the Funds by the Adviser were sufficient to support renewal of the Agreement.
| Gallery Trust | | April 30, 2020 (Unaudited) |
| | |
| | | |
| | |
APPROVAL OF INVESTMENT ADVISORY AGREEMENT | | |
Investment Performance of the Funds and the Adviser
The Board was provided with regular reports regarding the Funds’ performance over various time periods. The Trustees also reviewed reports prepared by the Funds’ administrator comparing the Funds’ performance to their benchmark indices and peer groups of mutual funds as classified by Lipper, an independent provider of investment company data, over various periods of time. Representatives from the Adviser provided information regarding and led discussions of factors impacting the performance of the Funds, outlining current market conditions and explaining their expectations and strategies for the future. The Trustees determined that the Funds’ performance was satisfactory, or, where the Funds’ performance was materially below their benchmarks and/or peer groups, the Trustees were satisfied by the reasons for the underperformance and/or the steps taken by the Adviser in an effort to improve the performance of the Funds. Based on this information, the Board concluded, within the context of its full deliberations, that the investment results that the Adviser had been able to achieve for the Funds were sufficient to support renewal of the Agreement.
Costs of Advisory Services, Profitability and Economies of Scale
In considering the advisory fee payable by the Funds to the Adviser, the Trustees reviewed, among other things, a report of the advisory fees paid to the Adviser. The Trustees also reviewed reports prepared by the Funds’ administrator comparing the Funds’ net and gross expense ratios and advisory fees to those paid by peer groups of mutual funds as classified by Lipper. The Trustees reviewed the management fees charged by the Adviser to other clients with comparable mandates. The Trustees considered any differences in management fees and took into account the respective demands, resources and complexity associated with the Funds and other client accounts as well as the extensive regulatory, compliance and tax regimes to which the Funds are subject. The Board concluded, within the context of its full deliberations, that the advisory fees were reasonable in light of the nature and quality of the services rendered by the Adviser.
The Trustees reviewed the costs of services provided by and the profits realized by the Adviser from its relationship with the Funds, including both direct benefits and indirect benefits, such as research and brokerage services received under soft dollar arrangements, accruing to the Adviser and its affiliates. The Trustees considered how the Adviser’s profitability was affected by factors such as its organizational structure and method for allocating expenses. The Trustees concluded that the profit margins of the Adviser with respect to the
| Gallery Trust | | April 30, 2020 (Unaudited) |
| | |
| | | |
| | |
APPROVAL OF INVESTMENT ADVISORY AGREEMENT | | |
management of the Funds were not unreasonable. The Board also considered the Adviser’s commitment to managing the Funds and its willingness to continue its expense limitation and fee waiver arrangements with the Funds.
The Trustees considered the Adviser’s views relating to economies of scale in connection with the Funds as Fund assets grow and the extent to which the benefits of any such economies of scale are shared with the Funds and Fund shareholders. The Board considered the existence of any economies of scale and whether those were passed along to the Funds’ shareholders through a graduated advisory fee schedule or other means, including fee waivers. The Trustees recognized that economies of scale are difficult to identify and quantify and are rarely identifiable on a fund-by-fund basis. Based on this evaluation, the Board concluded that the advisory fees were reasonable in light of the information that was provided to the Trustees by the Adviser with respect to economies of scale.
Renewal of the Agreement
Based on the Board’s deliberations and its evaluation of the information described above and other factors and information it believed relevant in the exercise of its reasonable business judgment, the Board, including all of the Independent Trustees, with the assistance of Fund counsel and Independent Trustees’ counsel, unanimously concluded that the terms of the Agreement, including the fees payable thereunder, were fair and reasonable and agreed to renew the Agreement for another year. In its deliberations, the Board did not identify any absence of information as material to its decision, or any particular factor (or conclusion with respect thereto) or single piece of information that was all-important, controlling or determinative of its decision, but considered all of the factors together, and each Trustee may have attributed different weights to the various factors (and conclusions with respect thereto) and information.
Fund information | |
| | |
| Registered office | P.O. Box 588 Portland, ME 04112 |
| |
| | |
| Adviser | Mondrian Investment Partners Limited 10 Gresham Street, 5th Floor London, England EC2V 7JD |
| |
| |
| | |
| Distributor | SEI Investments Distribution Co. One Freedom Valley Drive Oaks, PA 19456 |
| |
| |
| | |
| Administrator | SEI Investments Global Funds Services One Freedom Valley Drive Oaks, PA 19456 |
| |
| |
| | |
| Legal Counsel | Morgan, Lewis & Bockius LLP 1701 Market Street Philadelphia, PA 19103 |
| |
| |
| | |
| Custodian | Brown Brothers Harriman & Co 40 Water Street Boston, Massachusetts 02109 |
| |
| |
| | |
| Transfer Agent | Apex Fund Services Three Canal Plaza Portland, ME 04101 |
| |
| |
| | |
Independent Registered Public Accounting Firm | PricewaterhouseCoopers LLP 2001 Market Street Philadelphia, PA 19103 |
| |
MON-SA-001-0500