UNITED STATES
SECURITIES AND EXCHANGE COMMISSION
WASHINGTON, D.C. 20549
FORM N-CSR
CERTIFIED SHAREHOLDER REPORT OF REGISTERED
MANAGEMENT INVESTMENT COMPANIES
Investment Company Act file number: 811-23100
BERNSTEIN FUND, INC.
(Exact name of registrant as specified in charter)
1345 Avenue of the Americas, New York, New York 10105
(Address of principal executive offices) (Zip code)
Joseph J. Mantineo
AllianceBernstein L.P.
1345 Avenue of the Americas
New York, New York 10105
(Name and address of agent for service)
Registrant’s telephone number, including area code: (800) 221-5672
Date of fiscal year end: September 30, 2016
Date of reporting period: September 30, 2016
ITEM 1. REPORTS TO STOCKHOLDERS.
BERNSTEIN FUND, INC.
Small Cap Core Portfolio
International Small Cap Portfolio
International Strategic Equities Portfolio
ANNUAL REPORT
SEPTEMBER 30, 2016
Table of Contents
Before investing in any portfolio of the Bernstein Fund, Inc., a prospective investor should consider carefully the portfolio’s investment objectives and policies, charges, expenses and risks. These and other matters of importance to prospective investors are contained in the portfolios’ prospectus, an additional copy of which may be obtained by visiting our website at www.bernstein.com and clicking on “Investments”, then “Mutual Fund Information—Prospectuses, SAIs and Shareholder Reports” or by calling your financial advisor or by calling Bernstein’s mutual fund shareholder help line at 212.756.4097. Please read the prospectus carefully before investing.
For performance information current to the most recent month-end, please call (collect) (212) 486-5800.
You may obtain a description of the Fund’s proxy voting policies and procedures, and information regarding how the Fund voted proxies relating to portfolio securities during the most recent 12-month period ended June 30, 2016, without charge. Simply visit www.abglobal.com, or go to the Securities and Exchange Commission’s website at www.sec.gov, or call AllianceBernstein at 800.227.4618.
This shareholder report must be preceded or accompanied by the Bernstein Fund, Inc. prospectus for individuals who are not shareholders of the Fund.
The Fund will file its complete schedule of portfolio holdings with the Commission for the first and third quarters of each fiscal year on Form N-Q. The Fund’s Form N-Q is available on the Commission’s website at www.sec.gov. The Fund’s Form N-Q may also be reviewed and copied at the Commission’s Public Reference Room in Washington, D.C.; information on the operation of the Public Reference Room may be obtained by calling 800.SEC.0330.
Investment Products Offered: · Are Not FDIC Insured · May Lose Value · Are Not Bank Guaranteed
Portfolio Adviser Commentary (Unaudited)
To Our Shareholders—November 7, 2016
On the following pages, you will find the 2016 Annual Report for the Portfolios of the Bernstein Fund, Inc. (the “Fund”). The Annual Report covers the six-month and since-inception periods ended September 30, 2016 and includes financial statements as well as notes to the financial statements, information about the recent performance of the Portfolios and a listing of each Portfolio’s holdings as of the period end.
Global equity markets have been volatile over the last six months. The second quarter was marked by multiple large swings up and down, driven by concerns over slow global economic growth, and the surprise Brexit vote near quarter-end triggered a dramatic sell-off that swiftly reversed within a week. The third quarter built on that recovery but volatility reappeared with the arrival of September and fears of a potential interest rate increase by the Federal Reserve. For the six-month period as a whole, returns were strongly positive for the emerging markets and positive for the US and international developed markets. US small cap stocks in particular, delivered very strong performance over the period, increasing over 12%.
If you have any questions about your investments in the Portfolios, please contact your Bernstein Advisor by calling 212.756.4097, or visit www.bernstein.com. As always, we are firmly dedicated to your investment success. Thank you for your continued interest in the Portfolios.
Sincerely,
Seth J. Masters
President
Bernstein Fund, Inc.
Bernstein Small Cap Core Portfolio
Investment Objectives and Strategy
The Portfolio seeks to provide long-term growth of capital.
The Portfolio invests, under normal circumstances, at least 80% of its net assets (plus any borrowings for investment purposes) in equity securities of small-capitalization companies or other securities or instruments with similar economic characteristics, including derivatives related to equity securities. Equity securities will primarily be common stocks, although, for purposes of the 80% policy, equity securities may also include preferred stocks, warrants, convertible securities, sponsored or unsponsored American Depositary Receipts (“ADRs”) and Global Depositary Receipts (“GDRs”) and equity real estate investment trusts (“REITs”). You will be notified at least 60 days prior to any change to the Portfolio’s 80% investment policy.
AllianceBernstein L.P. serves as the Portfolio’s investment manager (the “Manager”). The Manager will invest the assets of the Portfolio primarily in a diversified portfolio of equity securities of small-capitalization companies located in the U.S. The Portfolio defines small-capitalization companies as those that, at the time of investment, fall within the capitalization range between the smallest company in the Russell 2000 Index (the “Russell 2000”) and the largest company in the Russell 2000. The market capitalization of the companies included in the Portfolio’s definition of “small-capitalization” companies will change over time as the capitalization of the securities included in the Russell 2000 change.
The Manager utilizes both quantitative analysis and fundamental research to determine which securities will be held by the Portfolio and to manage risk. The Manager applies quantitative analysis to all of the securities in the Portfolio’s research universe, which is composed primarily of securities in the Portfolio’s benchmark (the Russell 2000 Index). Those securities that score highly on this quantitative analysis are then screened to eliminate those securities that the Manager is recommending against purchasing based on its fundamental research, and a portfolio is constructed from the remaining highly ranked securities based on diversification and risk considerations. In its quantitative analysis, the Manager will consider a number of metrics that have historically provided some indication of favorable future returns, including metrics relating to valuation, quality, investor behavior and corporate behavior. In general, stocks are purchased when, in the view of the Manager, they provide the highest expected returns, considering their contribution to the estimated risk of the Portfolio’s existing investments. Typically, growth in the size of a company’s market capitalization relative to other domestically traded companies will not cause the Manager to dispose of the security. The Manager expects to seek to manage the overall portfolio volatility of the Portfolio relative
(Portfolio Advisor Commentary continued on next page)
Portfolio Adviser Commentary (continued)
to the Russell 2000 by favoring securities that offer the best balance between return and targeted risk.
The Portfolio may also invest in exchange-traded funds (“ETFs”) and other investment companies from time to time.
The Portfolio expects to utilize derivatives, such as options, futures contracts, forwards and swaps. For example, the Portfolio may use stock index futures contracts to equitize cash. Derivatives may provide a more efficient and economical exposure to market segments than direct investments, and may also be a more efficient way to alter the Portfolio’s exposure.
Investment Results
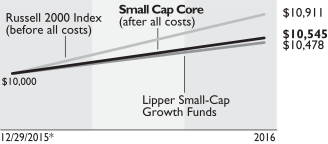
Despite outperforming in the earlier part of the year, all share classes (SCB class, Advisor class, and Z class) of the Portfolio underperformed its benchmark for the period ended September 30, 2016, as shown in the table on page 8. This performance pattern matches the reversal in US market returns and factor premia during this period. US markets started the year with recession fears and concerns about China. The Russell 2000 Index was down 15.9% for calendar 2016 as of February 11, 2016 when momentum, quality factors, and defensive sectors outperformed. Subsequently, stronger than expected economic data led to a risk-on market, where the Russell 2000 Index rallied sharply, and was up 11.5% for the calendar year to date period ended September 30, 2016. During the latter period deep-value factors, low-quality stocks, and cyclical sectors outperformed. This was a volatile and challenging period for factor-based systematic investing. The Portfolio seeks to maintain controlled exposure to high-profitability, momentum, and valuation factors. Outperformance early in the year and the subsequent underperformance was attributable mostly to the swings in the return performance of positive-momentum and high-profitability cohorts. Valuation exposure contributed positively to performance. Healthcare underweight, energy overweight, and real estate underweight contributed to performance; Financials and Consumer Staples underweights detracted.
For the six-month period, the Portfolio’s positive exposure to valuation factors, overweight in Energy and underweight in Utilities and Real Estate sectors contributed to performance, whereas the positive exposure to the momentum factor (which failed), lack of exposure to the low-quality stock cohort, and unfavorable stock selection in Healthcare and Information Technology detracted.
The Portfolios utilized derivatives in the form of Treasury futures for investment purposes which added to performance for both the six-month and since-inception periods.
Bernstein International Small Cap Portfolio
Investment Objective and Strategy
The Portfolio seeks to provide long-term growth of capital.
The Portfolio invests, under normal circumstances, at least 80% of its net assets (plus any borrowings for investment purposes) in equity securities of small-capitalization companies or other securities or instruments with similar economic characteristics, including derivatives related to equity securities. Equity securities will primarily be common stocks, although, for purposes of the 80% policy, equity securities may also include preferred stocks, warrants, convertible securities, sponsored or unsponsored ADRs and GDRs and equity REITs. You will be notified at least 60 days prior to any change to the Portfolio’s 80% investment policy.
AllianceBernstein L.P. serves as the Portfolio’s investment manager. The Manager will invest the assets of the Portfolio primarily in a diversified portfolio of equity securities of small-capitalization companies located outside of the United States. Under normal circumstances, at least 65% of the Portfolio’s net assets will be invested in companies located outside of the United States. The Portfolio defines small-capitalization companies as those that, at the time of investment, have market capitalizations within the market capitalization range of the Portfolio’s benchmark, the Morgan Stanley Capital International (“MSCI”) All Country World Index (“ACWI”) ex-US Small Cap Index. The market capitalization of the companies included in the Portfolio’s definition of “small-capitalization” companies will change over time as the capitalization of the securities included in the MSCI ACWI ex-US Small Cap Index change.
The Portfolio’s exposure to non-U.S. companies may change over time based on the Manager’s assessment of market conditions and the investment merit of non-U.S. issuers. Under normal circumstances, the Manager will invest in companies located in at least three countries other than the United States and, at times, may have exposure to issuers in several different countries. In determining a company’s location for purposes of the Portfolio’s investment policies and restrictions, the Manager may consider: (1) the place of domicile; (2) where the company has an established presence and conducts its business; and (3) where the company conducts a significant part of its economic activities. The Portfolio may invest in both developed and emerging market countries and, at times, may invest significantly in emerging markets.
(Portfolio Advisor Commentary continued on next page)
Portfolio Adviser Commentary (continued)
The Portfolio will consist of securities selected using three separate strategies—international growth, international value, and quantitative. Under the growth strategy, the Manager will seek companies with strong franchises and competitive positioning, as well as companies where the Manager believes that a positive change is underway that will drive growth and returns in the medium term. Under the value strategy, the Manager will seek to exploit controversies and enduring market behaviors of focusing too heavily on recent information and fearing loss more than valuing potential gains. Under the quantitative strategy, the Manager will consider a number of metrics that have historically provided some indication of favorable future returns, including metrics relating to valuation, quality, investor behavior and corporate behavior. Utilizing these resources, the Manager expects to allocate the Portfolio’s assets among industries and geographic locations to attempt to create a diversified portfolio of investments.
The Portfolio may invest in established companies and also in new and less-seasoned issuers. The Portfolio may also invest in ETFs and other investment companies from time to time.
The Portfolio expects to utilize derivatives, such as options, futures contracts, forwards and swaps. For example, the Portfolio may invest in currency derivatives as discussed below and in futures contracts to gain exposure to certain markets. Derivatives may provide a more efficient and economical exposure to market segments than direct investments, and may also be a more efficient way to alter the Portfolio’s exposure.
Fluctuations in currency exchange rates can have a dramatic impact on the returns of foreign equity securities. The Manager may employ currency hedging strategies, including the use of currency-related derivatives, to seek to reduce currency risk in the Portfolio, but it is not required to do so. The Manager may also take long and short positions in currencies or related derivatives for investment purposes, independent of any security positions. The Manager may use stock index futures contracts to gain access to certain markets.
Investment Results
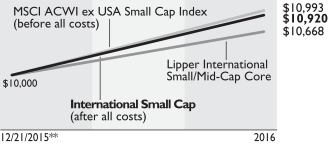
International small cap stocks recovered strongly in the third quarter of 2016 after selling off in the first part of the year due to growth concerns in China and fears about the outcomes of Brexit, leaving both the six-month and since inception periods with strong positive returns for the Portfolio above large cap markets.
As shown in the table on page 8, during the six-month period, all share classes of the Portfolio outperformed its benchmarks, the MSCI ACWI ex-US Small Cap Index and the Lipper International Small/Mid-Cap Core Funds Average. Strong stock selection in consumer discretionary and industrials drove the outperformance and more than offset the drag from being underweight the materials sector and poor stock selection within Japan. Since inception, the Portfolio is trailing the benchmark but is outperforming the Lipper International Small/Mid-Cap Core Funds Average. Poor stock selection in Canada and our underweight to the materials sector have been detractors to performance.
The Portfolio utilized derivatives in the form of currency forwards for hedging purposes, which had an immaterial effect on performance in both the six-month and since-inception periods.
Bernstein International Strategic Equities Portfolio
Investment Objective and Strategy
The Portfolio seeks to provide long-term growth of capital.
The Portfolio invests, under normal circumstances, at least 80% of its net assets (plus any borrowings for investment purposes) in equity securities or other securities or instruments with similar economic characteristics, including derivatives related to equity securities. Equity securities will primarily be common stocks, although, for purposes of the 80% policy, equity securities may also include preferred stocks, warrants, convertible securities, sponsored or unsponsored ADRs and GDRs and equity REITs. You will be notified at least 60 days prior to any change to the Portfolio’s 80% investment policy.
AllianceBernstein L.P. serves as the Portfolio’s investment manager. The Manager will invest the assets of the Portfolio primarily (under normal circumstances, at least 65% of net assets) in equity securities of issuers in countries that make up the MSCI ACWI ex-US Index, which includes both developed and emerging market countries. The Portfolio will focus on securities of large-cap and mid-cap companies. The Manager expects to allocate fund assets among issuers in many foreign countries, but not necessarily in the same proportion that the countries are represented in the MSCI ACWI ex-US Index and may invest in issuers in countries outside of the MSCI ACWI ex-US Index. The Portfolio’s exposure among non-U.S. countries may change over time based on the Manager’s assessment of market conditions and the investment merit of particular non-U.S. issuers. Under normal circumstances, the Manager will invest in companies located in at least three
(Portfolio Advisor Commentary continued on next page)
Portfolio Adviser Commentary (continued)
countries other than the United States and expects to have exposure to issuers in many different countries. In determining a company’s location for purposes of the Portfolio’s investment policies and restrictions, the Manager may consider: (1) the place of domicile; (2) where the company has an established presence and conducts its business; and (3) where the company conducts a significant part of its economic activities. The Portfolio may, at times, invest significantly in emerging markets.
The Manager utilizes both fundamental and quantitative research to both determine which securities will be held by the Portfolio and to manage risk. Specifically, the Portfolio’s management team will use the universe of securities selected by the Manager’s various fundamental investment teams focusing on international equity securities, and apply its quantitative analysis to these securities. In applying its quantitative analysis, the Manager will consider a number of metrics that have historically provided some indication of favorable future returns, including metrics relating to valuation, quality, investor behavior and corporate behavior. Utilizing these resources, the Manager expects to allocate the Portfolio’s assets among industries and geographic locations to attempt to create a diversified portfolio of investments.
The Portfolio may also invest in ETFs and other investment companies from time to time.
The Portfolio expects to utilize derivatives, such as options, futures contracts, forwards and swaps. For example, the Portfolio may invest in currency derivatives as discussed below and in futures contracts to gain exposure to certain markets. Derivatives may provide a more efficient and economical exposure to market segments than direct investments, and may also be a more efficient way to alter the Portfolio’s exposure.
Fluctuations in currency exchange rates can have a dramatic impact on the returns of foreign equity securities. The Manager may employ currency hedging strategies, including the use of currency-related derivatives, to seek to reduce currency risk in the Portfolio, but it is not required to do so. The Manager may also take long and short positions in currencies or related derivatives for investment purposes, independent of any security positions. The Manager may use stock index futures contracts to gain access to certain markets.
Investment Results
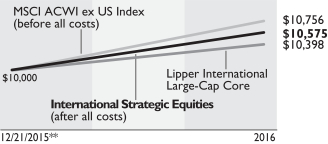
The international equity markets rose during both the six-month and since inception reporting periods, as risk appetite returned following the high volatility experienced in the first quarter of 2016. The Brexit vote at the end of June did not prove to be as disruptive as feared, and this, combined with solid growth in China and stable monetary policy in Japan and the US, led to more of a risk-on environment. As shown in the table on page 8, all share classes of the Portfolio recorded positive absolute performance but lagged the MSCI ACWI ex-US Index in both periods. All share classes of the Portfolio were ahead of the Lipper International Large-Cap Core Average for the since inception period, but lagged over the 6-month period. Positive sector selection was offset by negative country and security selection in both periods.
For the six-month period, the overweight to Technology stocks was the largest sector contributor. Positive stock selection in the Financials and Materials sectors was offset by underperformance of stock selection in Industrials and Utilities. For the since inception period, underweight positions in the Financials and Healthcare sectors contributed positively, in addition to the Technology overweight. Favorable stock selection in Consumer Staples, in addition to Financials and Materials, was offset by underperformance in Industrials, Utilities and Energy stocks. At a country level, for the six-month period, an overweight to Hong Kong and underweight to South Africa contributed positively, but underweights to China and the United Kingdom detracted. For the since inception period, a Hong Kong overweight and Spain underweight were the largest contributors, and an Israel overweight and United Kingdom underweight were the largest detractors.
The Portfolio utilized derivatives in the form of currency forwards for hedging and investment purposes, which detracted from performance for both the six-month and since-inception periods. In addition, the Portfolio utilized Treasury futures for both hedging and investment purposes, which added to performance for both periods.
Disclosures and Risks (Unaudited)
Benchmark Disclosures
None of the following indices or averages reflects fees and expenses associated with the active management of a mutual fund portfolio. The MSCI ACWI ex-US Index measures the performance of the large- and mid-cap market segment across 22 developed markets (excluding the U.S.) and 23 emerging market countries. The MSCI ACWI ex-US Small Cap Index measures the performance of the small-cap market segment across 22 developed markets (excluding the U.S.) and 23 emerging market countries. The Russell 2000 Index measures the performance of the small-cap segment of the U.S. equity universe. Investors cannot invest directly in indices, and their results are not indicative of the performance for any specific investment, including the Portfolios.
A Word About Risk
All Bernstein Portfolios:
The share price of the Portfolios will fluctuate and you may lose money. There is no guarantee that the Portfolios will achieve their investment objectives.
Market Risk: The Portfolio is subject to market risk, which is the risk that stock prices in general may decline over short or extended periods. In the past several years, financial markets in the United States, Europe and elsewhere have experienced increased volatility, decreased liquidity and heightened uncertainty. Recently, some securities markets, particularly in Europe and Asia, have been very volatile and have declined in value significantly. These market conditions may continue, worsen, or spread. The U.S. Government and the Federal Reserve, as well as certain foreign governments and central banks, have taken steps to support financial markets, including by keeping interest rates low. Other governments have tried to support markets by buying stocks and through other market interventions. Government intervention may not work as intended, particularly if the efforts are perceived by investors as being unlikely to achieve the desired results. The Federal Reserve has terminated certain of its market support activities. Further reduction or withdrawal of Federal Reserve or other U.S. or non-U.S. governmental or central bank support could negatively affect financial markets generally, raise interest rates, increase market volatility, and reduce the value and liquidity of securities in which the Portfolio invests.
Current political uncertainty surrounding the European Union (EU) and its membership may increase market volatility. The financial instability of some countries in the EU, including Greece, Italy and Spain, together with the risk of that financial instability impacting other more stable countries, may increase the risk of investing in companies in Europe and worldwide. In addition, policy and legislative changes in the United States and in other countries are affecting many aspects of financial regulation, and may in some instances contribute to decreased liquidity and increased volatility in the financial markets. The impact of these changes, and the practical implications for market participants, may not be fully known for some time.
Economies and financial markets throughout the world are becoming increasingly interconnected. As a result, whether or not the Portfolio invests in securities of issuers located in or with significant exposure to countries experiencing economic and financial difficulties, the value and liquidity of the Portfolio’s investments may be negatively affected.
Liquidity Risk: Liquidity risk exists when particular investments are difficult to purchase or sell, possibly preventing the Portfolio from selling out of these illiquid securities at an advantageous price. Illiquid securities may also be difficult to value. Derivatives and securities involving substantial market and credit risk tend to involve greater liquidity risk.
Redemption Risk: The Portfolio may experience heavy redemptions that could cause the Portfolio to liquidate its assets at inopportune times or at a loss or depressed value, which could cause the value of your investment to decline.
Capitalization Risk: Investments in small- and mid-capitalization companies may be more volatile than investments in large-capitalization companies. Investments in small- and mid-capitalization companies may have additional risks because these companies may have limited product lines, markets or financial resources.
Allocation Risk: The Portfolio may seek to focus on different investment disciplines or factors at different times as means to achieve its investment objective. In the event that the investment disciplines or factors to which the Portfolio has greater exposure perform worse than the investment disciplines or factors with less exposure, the Portfolio’s returns may be negatively affected.
Derivatives Risk: The Portfolio may use derivatives in currency hedging strategies as well as for direct investments to gain access to certain markets, earn income, enhance return and broaden portfolio diversification, which entail greater risk than if used solely for hedging purposes. In addition to other risks such as the credit risk of the counterparty, derivatives involve the risk that changes in the value of the derivative may not
Disclosures and Risks continued on next page
Disclosures and Risks (continued)
correlate with relevant assets, rates or indices. Derivatives may be illiquid and difficult to price or unwind, and small changes may produce disproportionate losses for the Portfolio. Certain derivatives have the potential for unlimited loss, regardless of the size of the initial investment. Assets required to be set aside or posted to cover or secure derivatives positions may themselves go down in value, and these collateral and other requirements may limit investment flexibility. Some derivatives involve leverage, which can make the Portfolio more volatile and can compound other risks. The U.S. Government and foreign governments are in the process of adopting and implementing regulations governing derivatives markets, including mandatory clearing of certain derivatives, margin, reporting and registration requirements. The ultimate impact of the regulations remains unclear. Additional regulation may make derivatives more costly, may limit their availability or utility or otherwise adversely affect their performance, or may disrupt markets.
Management Risk: The Portfolio is subject to management risk because it is an actively managed investment portfolio. The Manager will apply its investment techniques and risk analyses in making investment decisions for the Portfolio, but its decisions may not produce the desired results. In some cases, derivative and other investment techniques may be unavailable or the Manager may determine not to use them, possibly even under market conditions where their use could benefit the Portfolio. In addition, the Manager may change the Portfolio’s investment strategies or policies from time to time. Those changes may not lead to the results intended by the Manager and could have an adverse effect on the Manager and could have an adverse effect on the value or performance of the Portfolio.
REIT Risk: Investing in REITs involves certain unique risks in addition to those risks associated with investing in the real estate industry in general. REITs are dependent upon management skills, are not diversified, and are subject to heavy cash flow dependency, default by borrowers and self-liquidation. Investing in REITs also involves risks similar to those associated with investing in small-capitalization companies. REITs may have limited financial resources, may trade less frequently and in a limited volume and may be subject to more abrupt or erratic price movements than larger company securities.
Investment in Other Investment Companies Risk: As with other investments, investments in other investment companies, including other AB Mutual Funds and ETFs, are subject to market and selection risk. In addition, if the Portfolio acquires shares of investment companies, shareholders bear both their proportionate share of expenses in the Portfolio (including management and advisory fees) and, indirectly, the expenses of the investment companies.
International Strategic Equities and International Small Cap Portfolios
Foreign (Non-U.S.) Securities Risk: Investments in foreign securities entail significant risks in addition to those customarily associated with investing in U.S. securities. These risks include risks related to adverse market, economic, political and regulatory factors and social instability, all of which could disrupt the financial markets in which the Portfolio invests and adversely affect the value of the Portfolio’s assets.
Country Concentration Risk: The Portfolio may not always be diversified among countries or regions and the effect on the share price of the Portfolio of specific risks identified above such as political, regulatory and currency may be magnified due to concentration of the Portfolio’s investments in a particular country or region.
Emerging Markets Securities Risk: The risks of investing in foreign (non-U.S.) securities are heightened with respect to issuers in emerging-market countries because the markets are less developed and less liquid and there may be a greater amount of economic, political and social uncertainty. In addition, the value of the Portfolio’s investments may decline because of factors such as unfavorable or unsuccessful government actions and reduction of government or central bank support.
Foreign Currency Risk: This is the risk that changes in foreign (non-U.S.) currency exchange rates may negatively affect the value of the Portfolio’s investments or reduce the returns of the Portfolio. For example, the value of the Portfolio’s investments in foreign securities and foreign currency positions may decrease if the U.S. Dollar is strong (i.e., gaining value relative to other currencies) and other currencies are weak (i.e., losing value relative to the U.S. Dollar).
Actions by a Few Major Investors: In certain countries, volatility may be heightened by actions of a few major
Disclosures and Risks continued on next page
Disclosures and Risks (continued)
investors. For example, substantial increases or decreases in cash flows of mutual funds investing in these markets could significantly affect local stock prices and, therefore, share prices of the Portfolio.
These risks are fully discussed in the Fund’s prospectus.
An Important Note About Historical Performance
The performance shown on page 8 represents past performance and does not guarantee future results. Performance information is as of the dates shown. Current performance may be lower or higher than the performance information shown. You may obtain performance information current to the most recent month-end by calling 212.756.4097. The investment return and principal value of an investment in the Portfolios will fluctuate, so that shares, when redeemed, may be worth more or less than their original cost.
Investors should consider the investment objectives, risks, charges and expenses of the Fund/Portfolios carefully before investing. For copies of our prospectus or summary prospectus, which contain this and other information, visit www.bernstein.com, click on “Investments”, then “Mutual Fund Information—Prospectuses, SAIs and Shareholder Reports” or by calling Bernstein’s mutual fund shareholder help line at 212.756.4097 or contact your Bernstein Adviser. Please read the prospectus and/or summary prospectus carefully before investing.
Historical Performance (Unaudited)
Bernstein Fund Portfolios vs. Their Benchmarks and Lipper Averages
| | | | | | | | |
| | | TOTAL RETURNS | |
| THROUGH SEPTEMBER 30, 2016 | | PAST 6
MONTHS | | | SINCE
INCEPTION* | |
Small Cap Core Portfolio—SCB Class1 | | | 9.79 | % | | | 5.45 | % |
Small Cap Core Portfolio—Advisor Class | | | 10.00 | % | | | 5.65 | % |
Small Cap Core Portfolio—Class Z | | | 10.00 | % | | | 5.65 | % |
Russell 2000 Index | | | 13.18 | % | | | 9.11 | % |
Lipper Small-Cap Growth Funds | | | 12.27 | % | | | 4.78 | % |
| | | | | | | | | |
International Small Cap Portfolio—SCB Class2 | | | 7.37 | % | | | 9.20 | % |
International Small Cap Portfolio—Advisor Class | | | 7.58 | % | | | 9.30 | % |
International Small Cap Portfolio—Class Z | | | 7.58 | % | | | 9.30 | % |
MSCI ACWI ex USA Small Cap Index | | | 6.97 | % | | | 9.93 | % |
Lipper International Small/Mid-Cap Core | | | 5.52 | % | | | 6.68 | % |
| | | | | | | | | |
International Strategic Equities Portfolio—SCB Class3 | | | 4.65 | % | | | 5.75 | % |
International Strategic Equities Portfolio—Advisor Class | | | 4.76 | % | | | 5.75 | % |
International Strategic Equities Portfolio—Class Z | | | 4.75 | % | | | 5.85 | % |
MSCI ACWI ex-US Index | | | 6.22 | % | | | 7.56 | % |
Lipper International Large-Cap Core | | | 5.12 | % | | | 3.98 | % |
| * | | Inception date: 12/21/2015 for International Small Cap Portfolio and International Strategic Equities Portfolio, 12/29/15 for Small Cap Portfolio. |
| 1 | | The current prospectus table shows the total annual operating expense ratios for the Small Cap Core Portfolio as 1.15%, 0.90% and 0.90% for SCB Class, Advisor Class and Z Class shares, respectively. |
| 2 | | The current prospectus table shows the total annual operating expense ratios for the International Small Cap Portfolio as 1.39%, 1.16% and 1.14% for SCB Class, Advisor Class and Z Class shares, respectively, gross of any fee waiver or expense reimbursements. Contractual fee waivers and/or expense reimbursements limit the Fund’s annual operating expense ratios exclusive of acquired fund fees and expenses other than the advisory fees of any registered funds advised by the Adviser in which the Fund may invest, interest expense, taxes, extraordinary expenses, and brokerage commissions and other transaction costs to 1.35%, 1.10% and 1.10% for SCB Class, Advisor Class and Z Class shares, respectively. These waivers may not be terminated prior to January 4, 2017. Any fees waived and expenses borne by the Adviser may be reimbursed by the Fund until the end of the third fiscal year after the fiscal period in which the fee was waived or the expense was borne, provided that no reimbursement payment will be made that would cause the Portfolio’s total annual fund operating expenses to exceed the expense limitations. Absent reimbursements or waivers, performance would have been lower. The Financial Highlights section of this report sets forth expense ratio data for the current reporting period; the expense ratios shown above may differ from the expense ratios in the Financial Highlights section since they are based on different time periods. |
| 3 | | The current prospectus table shows the total annual operating expense ratios for the International Strategic Equities Portfolio as 1.29%, 1.05% and 1.05% for SCB Class, Advisor Class and Z Class shares, respectively, gross of any fee waiver or expense reimbursements. Contractual fee waivers and/or expense reimbursements limit the Fund’s annual operating expense ratios exclusive of acquired fund fees and expenses other than the advisory fees of any registered funds advised by the Adviser in which the Fund may invest, interest expense, taxes, extraordinary expenses, and brokerage commissions and other transaction costs), on an annualized basis, from exceeding 1.20%, 0.95% and 0.95% of average daily net assets for SCB Class, Advisor Class and Z Class shares (“expense limitations”), respectively. These waivers may not be terminated prior to January 4, 2017. Any fees waived and expenses borne by the Manager may be reimbursed by the Portfolio until the end of the third fiscal year after the fiscal period in which the fee was waived or the expense was borne, provided that no reimbursement payment will be made that would cause the Portfolio’s total annual portfolio operating expenses to exceed the expense limitations. This contractual agreement may be terminated by the Board of Directors of Bernstein Fund, Inc. at its discretion prior to the expiration date. The Adviser has contractually agreed to waive 0.05% of the management fee through December 21, 2016. |
See Disclosures, Risks and Note about Historical Performance on pages 5–7.
(Historical Performance continued on next page)
Historical Performance (continued from previous page)
| | | | |
| Small Cap Core | | | | |
Growth of a $10,000 Investment in the Portfolio
12/29/15* to 9/30/16 | | | | |
| | | | |
| | | | |
| International Small Cap | | | | |
Growth of a $10,000 Investment in the Portfolio
12/21/15** to 9/30/16 | | | | |
| | | | |
| | | | |
| International Strategic Equities | | | | |
Growth of a $10,000 Investment in the Portfolio
12/21/15** to 9/30/16 | | | | |
| | | | |
| * | | Inception date: 12/29/2015 |
| ** | | Inception date: 12/21/2015 |
| | | Past performance is no guarantee of future results and an investment in the portfolios described could lose value. Each chart illustrates the total value of an assumed $10,000 investment as compared to the performance of the Portfolio’s benchmark. |
See Disclosures, Risks and Note about Historical Performance on pages 5–7.
Expense Example—September 30, 2016 (Unaudited)
As a shareholder of the Portfolio, you incur various ongoing costs, including management fees and other Portfolio expenses. This example is intended to help you understand your ongoing costs (in dollars) of investing in the Portfolio and to compare these costs with the ongoing costs of investing in other mutual funds. The example is based on an investment of $1,000 invested at the beginning of the period and held for the entire period as indicated below.
Actual Expenses—The first line of the table below provides information about actual account values and actual expenses. You may use the information in this line, together with the amount you invested, to estimate the expenses that you paid over the period. Simply divide your account value by $1,000 (for example, an $8,600 account value divided by $1,000 = 8.6), then multiply the result by the number in the first line under the heading entitled “Expenses Paid During Period” to estimate the expenses you paid on your account during this period.
Hypothetical Example for Comparison Purposes—The second line of the table below provides information about hypothetical account values and hypothetical expenses based on the Portfolio’s actual expense ratio and an assumed annual rate of return of 5% before expenses, which is not the Portfolio’s actual return. The hypothetical account values and expenses may not be used to estimate the actual ending account balance or expenses you paid for the period. You may use this information to compare the ongoing costs of investing in the Portfolio and other funds by comparing this 5% hypothetical example with the 5% hypothetical examples that appear in the shareholder reports of other funds. Please note that the expenses shown in the table are meant to highlight your ongoing costs only and do not reflect any transactional costs, such as sales charges (loads), or contingent deferred sales charges on redemptions. Therefore, the second line of the table is useful in comparing ongoing costs only, and will not help you determine the relative total costs of owning different funds. In addition, if these transactional costs were included, your costs would have been higher.
| | | | | | | | | | | | | | | | |
| | | BEGINNING
ACCOUNT VALUE
APRIL 1, 2016 | | | ENDING
ACCOUNT VALUE
SEPTEMBER 30, 2016 | | | EXPENSES
PAID DURING
PERIOD* | | | ANNUALIZED
EXPENSE
RATIO* | |
Small Cap Core Portfolio | | | | | | | | | | | | | | | | |
SCB Class | | | | | | | | | | | | | | | | |
Actual | | $ | 1,000 | | | $ | 1,097.90 | | | $ | 6.82 | | | | 1.30 | % |
Hypothetical** | | $ | 1,000 | | | $ | 1,018.50 | | | $ | 6.56 | | | | 1.30 | % |
Advisor Class | | | | | | | | | | | | | | | | |
Actual | | $ | 1,000 | | | $ | 1,100.00 | | | $ | 5.51 | | | | 1.05 | % |
Hypothetical** | | $ | 1,000 | | | $ | 1,019.75 | | | $ | 5.30 | | | | 1.05 | % |
Class Z | | | | | | | | | | | | | | | | |
Actual | | $ | 1,000 | | | $ | 1,100.00 | | | $ | 5.51 | | | | 1.05 | % |
Hypothetical** | | $ | 1,000 | | | $ | 1,019.75 | | | $ | 5.30 | | | | 1.05 | % |
| |
International Small Cap Portfolio | | | | | | | | | | | | | | | | |
SCB Class | | | | | | | | | | | | | | | | |
Actual | | $ | 1,000 | | | $ | 1,073.70 | | | $ | 7.00 | | | | 1.35 | % |
Hypothetical** | | $ | 1,000 | | | $ | 1,018.25 | | | $ | 6.81 | | | | 1.35 | % |
Advisor Class | | | | | | | | | | | | | | | | |
Actual | | $ | 1,000 | | | $ | 1,075.80 | | | $ | 5.71 | | | | 1.10 | % |
Hypothetical** | | $ | 1,000 | | | $ | 1,019.50 | | | $ | 5.55 | | | | 1.10 | % |
Class Z | | | | | | | | | | | | | | | | |
Actual | | $ | 1,000 | | | $ | 1,075.80 | | | $ | 5.71 | | | | 1.10 | % |
Hypothetical** | | $ | 1,000 | | | $ | 1,019.50 | | | $ | 5.55 | | | | 1.10 | % |
| |
International Strategic Equities Portfolio | | | | | | | | | | | | | | | | |
SCB Class | | | | | | | | | | | | | | | | |
Actual | | $ | 1,000 | | | $ | 1,046.50 | | | $ | 6.14 | | | | 1.20 | % |
Hypothetical** | | $ | 1,000 | | | $ | 1,019.00 | | | $ | 6.06 | | | | 1.20 | % |
Advisor Class | | | | | | | | | | | | | | | | |
Actual | | $ | 1,000 | | | $ | 1,047.60 | | | $ | 4.86 | | | | 0.95 | % |
Hypothetical** | | $ | 1,000 | | | $ | 1,020.25 | | | $ | 4.80 | | | | 0.95 | % |
Class Z | | | | | | | | | | | | | | | | |
Actual | | $ | 1,000 | | | $ | 1,047.50 | | | $ | 4.86 | | | | 0.95 | % |
Hypothetical** | | $ | 1,000 | | | $ | 1,020.25 | | | $ | 4.80 | | | | 0.95 | % |
| |
| * | | Expenses are equal to each classes’ annualized expense ratios, multiplied by the average account value over the period, multiplied by 183/366 (to reflect the since inception period). |
| ** | | Assumes 5% annual return before expenses. |
Portfolio Summary—September 30, 2016 (Unaudited)
| | | | | | | | | | |
| Small Cap Core Portfolio | |
| Sector Breakdown* | | | | |
Information Technology | | | 19.6 | % | | | | | | |
Industrials | | | 16.0 | | | | | | | |
Financials | | | 15.4 | | | | | | | |
Health Care | | | 14.9 | | | | | | | |
Consumer Discretionary | | | 11.2 | | | | | | | |
Real Estate | | | 6.9 | | | | | | | |
Energy | | | 5.1 | | | | | | | |
Materials | | | 4.9 | | | | | | | |
Consumer Staples | | | 2.9 | | | | | | | |
Utilities | | | 1.8 | | | | | | | |
Telecommunication Services | | | 1.3 | | | | | | | |
| | | | | | | | | | |
| | | | | | |
| | | | | | |
| International Small Cap Portfolio | |
| Country Breakdown* | | Sector Breakdown* | |
 | | Consumer Discretionary | | | 23.5 | % |
| | Industrials | | | 16.0 | |
| | Information Technology | | | 13.0 | |
| | Consumer Staples | | | 12.2 | |
| | Materials | | | 7.7 | |
| | Health Care | | | 7.4 | |
| | Financials | | | 6.3 | |
| | Real Estate | | | 6.3 | |
| | Utilities | | | 2.6 | |
| | Energy | | | 2.4 | |
| | Telecommunication Services | | | 1.8 | |
| | Funds and Investment Trusts | | | 0.8 | |
| | | | | | |
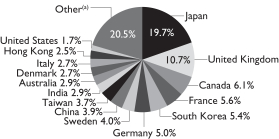
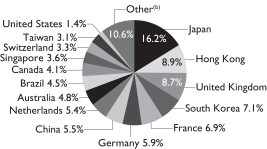
| International Strategic Equities Portfolio | |
| Country Breakdown* | | Sector Breakdown* | |
 | | Financials | | | 17.4 | % |
| | Information Technology | | | 13.8 | |
| | Materials | | | 10.4 | |
| | Consumer Discretionary | | | 10.3 | |
| | Industrials | | | 10.1 | |
| | Consumer Staples | | | 9.8 | |
| | Energy | | | 7.5 | |
| | Health Care | | | 7.0 | |
| | Real Estate | | | 6.0 | |
| | Utilities | | | 4.0 | |
| | Telecommunication Services | | | 3.7 | |
| | | | | | |
| * | | All data are as of September 30, 2016. The Portfolio’s country and sector breakdowns are expressed as a percentage of each Portfolio’s long-term investments and may vary over time. Each Portfolio may also invest in other financial instruments, including derivative instruments, which provide investment exposure to a variety of asset classes (see “Schedule of Investments” section of the report for the Small Cap Core, International Small Cap and International Strategic Equities Portfolios). |
| (a) | | “Other” represents 11.3% in MSCI EM Index countries and 8.1% in MSCI EAFE Index countries and 1.1% in other emerging market countries. |
| (b) | | “Other” represents 2.5% in MSCI EM Index countries and 8.1% in MSCI EAFE Index countries. |
| | | Please note: The sector classifications presented herein are based on the Global Industry Classification Standard (GICS) which was developed by Morgan Stanley Capital International and Standard & Poor’s. The components are divided into sector, industry group, and industry sub-indices as classified by the GICS for each of the market capitalization indices in the broad market. These sector classifications are broadly defined. The “Schedule of Investments” section of the report reflects more specific industry information and is consistent with the investment restrictions discussed in the Portfolio’s prospectus. |
Schedule of Investments
Bernstein Fund, Inc.
Schedule of Investments
Small Cap Core Portfolio
September 30, 2016
| | | | | | | | |
| Company | | Shares | | | U.S. $ Value | |
| COMMON STOCKS–97.9% | |
| Information Technology–19.2% | |
| Communications Equipment–2.1% | |
F5 Networks, Inc.(a) | | | 37,980 | | | $ | 4,733,827 | |
InterDigital, Inc./PA | | | 43,060 | | | | 3,410,352 | |
NETGEAR, Inc.(a) | | | 83,500 | | | | 5,050,915 | |
Sonus Networks, Inc.(a) | | | 287,880 | | | | 2,239,706 | |
| | | | | | | | |
| | | | | | | 15,434,800 | |
| | | | | | | | |
| Electronic Equipment, Instruments & Components–3.6% | |
Anixter International, Inc.(a) | | | 50,490 | | | | 3,256,605 | |
Benchmark Electronics, Inc.(a) | | | 164,530 | | | | 4,105,024 | |
Celestica, Inc. (Toronto)(a) | | | 155,410 | | | | 1,683,090 | |
Insight Enterprises, Inc.(a) | | | 66,680 | | | | 2,170,434 | |
Sanmina Corp.(a) | | | 161,320 | | | | 4,592,780 | |
SYNNEX Corp. | | | 60,190 | | | | 6,868,281 | |
Tech Data Corp.(a) | | | 44,200 | | | | 3,744,182 | |
| | | | | | | | |
| | | | | | | 26,420,396 | |
| | | | | | | | |
| Internet Software & Services–1.5% | |
Cimpress NV(a) | | | 39,050 | | | | 3,951,079 | |
Shutterstock, Inc.(a) | | | 66,170 | | | | 4,215,029 | |
Web.com Group, Inc.(a) | | | 159,010 | | | | 2,746,103 | |
| | | | | | | | |
| | | | | | | 10,912,211 | |
| | | | | | | | |
| IT Services–4.6% | |
Booz Allen Hamilton Holding Corp. | | | 89,990 | | | | 2,844,584 | |
Cardtronics PLC–Class A(a) | | | 49,890 | | | | 2,225,094 | |
Convergys Corp. | | | 176,900 | | | | 5,381,298 | |
CSG Systems International, Inc. | | | 71,550 | | | | 2,957,161 | |
EVERTEC, Inc. | | | 169,840 | | | | 2,849,915 | |
Hackett Group, Inc. (The) | | | 218,680 | | | | 3,612,594 | |
Lionbridge Technologies, Inc.(a) | | | 547,050 | | | | 2,735,250 | |
ManTech International Corp./VA–Class A | | | 108,420 | | | | 4,086,350 | |
Perficient, Inc.(a) | | | 94,930 | | | | 1,912,840 | |
Science Applications International Corp. | | | 78,160 | | | | 5,421,959 | |
| | | | | | | | |
| | | | | | | 34,027,045 | |
| | | | | | | | |
| Semiconductors & Semiconductor Equipment–4.7% | |
Advanced Energy Industries, Inc.(a) | | | 122,100 | | | | 5,777,772 | |
Cavium, Inc.(a) | | | 20,997 | | | | 1,222,025 | |
Cirrus Logic, Inc.(a) | | | 83,230 | | | | 4,423,674 | |
Integrated Device Technology, Inc.(a) | | | 226,261 | | | | 5,226,629 | |
IXYS Corp. | | | 182,740 | | | | 2,202,017 | |
Mellanox Technologies Ltd.(a) | | | 41,780 | | | | 1,806,985 | |
ON Semiconductor Corp.(a) | | | 333,030 | | | | 4,102,930 | |
Silicon Laboratories, Inc.(a) | | | 57,760 | | | | 3,396,288 | |
Synaptics, Inc.(a) | | | 61,450 | | | | 3,599,741 | |
Tessera Technologies, Inc. | | | 69,440 | | | | 2,669,274 | |
| | | | | | | | |
| | | | | | | 34,427,335 | |
| | | | | | | | |
| Company | | Shares | | | U.S. $ Value | |
| Software–2.3% | |
Aspen Technology, Inc.(a) | | | 117,420 | | | $ | 5,494,082 | |
Atlassian Corp. PLC–Class A(a) | | | 95,010 | | | | 2,847,450 | |
Barracuda Networks, Inc.(a) | | | 145,850 | | | | 3,716,258 | |
Manhattan Associates, Inc.(a) | | | 32,580 | | | | 1,877,259 | |
Mentor Graphics Corp. | | | 110,530 | | | | 2,922,413 | |
| | | | | | | | |
| | | | | | | 16,857,462 | |
| | | | | | | | |
| Technology Hardware, Storage & Peripherals–0.4% | |
NCR Corp.(a) | | | 89,930 | | | | 2,894,847 | |
| | | | | | | | |
| | | | | | | 140,974,096 | |
| | | | | | | | |
| | | | | | | | |
| |
| Industrials–15.7% | |
| Aerospace & Defense–0.4% | |
Engility Holdings, Inc.(a) | | | 95,300 | | | | 3,001,950 | |
| | | | | | | | |
| Air Freight & Logistics–0.3% | |
Hub Group, Inc.–Class A(a) | | | 51,140 | | | | 2,084,467 | |
| | | | | | | | |
| Building Products–2.4% | |
Gibraltar Industries, Inc.(a) | | | 54,320 | | | | 2,017,988 | |
Insteel Industries, Inc. | | | 66,400 | | | | 2,406,336 | |
NCI Building Systems, Inc.(a) | | | 167,310 | | | | 2,441,053 | |
Patrick Industries, Inc.(a) | | | 32,650 | | | | 2,021,688 | |
Ply Gem Holdings, Inc.(a) | | | 199,910 | | | | 2,670,798 | |
Trex Co., Inc.(a) | | | 53,650 | | | | 3,150,328 | |
Universal Forest Products, Inc. | | | 26,060 | | | | 2,566,649 | |
| | | | | | | | |
| | | | | | | 17,274,840 | |
| | | | | | | | |
| Commercial Services & Supplies–1.8% | |
ABM Industries, Inc. | | | 56,120 | | | | 2,227,964 | |
ACCO Brands Corp.(a) | | | 127,300 | | | | 1,227,172 | |
Deluxe Corp. | | | 43,480 | | | | 2,905,334 | |
Herman Miller, Inc. | | | 38,770 | | | | 1,108,822 | |
Quad/Graphics, Inc. | | | 121,430 | | | | 3,244,609 | |
Tetra Tech, Inc. | | | 70,900 | | | | 2,514,823 | |
| | | | | | | | |
| | | | | | | 13,228,724 | |
| | | | | | | | |
| Construction & Engineering–3.0% | |
AECOM(a) | | | 89,450 | | | | 2,659,348 | |
Comfort Systems USA, Inc. | | | 68,250 | | | | 2,000,408 | |
EMCOR Group, Inc. | | | 68,150 | | | | 4,063,103 | |
Jacobs Engineering Group, Inc.(a) | | | 53,040 | | | | 2,743,229 | |
MYR Group, Inc.(a) | | | 101,240 | | | | 3,047,324 | |
Quanta Services, Inc.(a) | | | 204,250 | | | | 5,716,957 | |
Valmont Industries, Inc. | | | 14,010 | | | | 1,885,326 | |
| | | | | | | | |
| | | | | | | 22,115,695 | |
| | | | | | | | |
| Electrical Equipment–0.7% | |
Babcock & Wilcox Enterprises, Inc.(a) | | | 151,350 | | | | 2,497,275 | |
EnerSys | | | 41,930 | | | | 2,901,137 | |
| | | | | | | | |
| | | | | | | 5,398,412 | |
| | | | | | | | |
| Machinery–1.7% | | | | | | | | |
Briggs & Stratton Corp. | | | 116,810 | | | | 2,178,507 | |
Chart Industries, Inc.(a) | | | 69,592 | | | | 2,284,705 | |
Global Brass & Copper Holdings, Inc. | | | 116,280 | | | | 3,359,329 | |
Kadant, Inc. | | | 44,730 | | | | 2,330,880 | |
Lincoln Electric Holdings, Inc. | | | 32,900 | | | | 2,060,198 | |
| | | | | | | | |
| | | | | | | 12,213,619 | |
| | | | | | | | |
| | | | | | | | |
| | | |
| Company | | Shares | | | U.S. $ Value | |
| Professional Services–2.4% | | | | | | | | |
Huron Consulting Group, Inc.(a) | | | 72,350 | | | $ | 4,323,636 | |
Insperity, Inc. | | | 52,620 | | | | 3,822,317 | |
Kforce, Inc. | | | 202,980 | | | | 4,159,060 | |
TrueBlue, Inc.(a) | | | 223,670 | | | | 5,068,362 | |
| | | | | | | | |
| | | | | | | 17,373,375 | |
| | | | | | | | |
| Road & Rail–0.6% | | | | | | | | |
Saia, Inc.(a) | | | 69,490 | | | | 2,081,920 | |
Werner Enterprises, Inc. | | | 109,110 | | | | 2,538,990 | |
| | | | | | | | |
| | | | | | | 4,620,910 | |
| | | | | | | | |
| Trading Companies & Distributors–2.4% | | | | | | | | |
Applied Industrial Technologies, Inc. | | | 103,000 | | | | 4,814,220 | |
MRC Global, Inc.(a) | | | 381,090 | | | | 6,261,309 | |
MSC Industrial Direct Co., Inc.–Class A | | | 46,580 | | | | 3,419,438 | |
WESCO International, Inc.(a) | | | 56,590 | | | | 3,479,719 | |
| | | | | | | | |
| | | | | | | 17,974,686 | |
| | | | | | | | |
| | | | | | | 115,286,678 | |
| | | | | | | | |
| | | | | | | | |
| | | |
| Financials–15.1% | | | | | | | | |
| Banks–8.3% | | | | | | | | |
1st Source Corp. | | | 78,060 | | | | 2,786,352 | |
Bank of the Ozarks, Inc. | | | 26,910 | | | | 1,033,344 | |
Cathay General Bancorp | | | 159,470 | | | | 4,908,487 | |
City Holding Co. | | | 49,090 | | | | 2,468,736 | |
Community Trust Bancorp, Inc. | | | 64,170 | | | | 2,381,349 | |
Fidelity Southern Corp. | | | 109,810 | | | | 2,019,406 | |
First Citizens BancShares, Inc./NC–Class A | | | 8,670 | | | | 2,548,026 | |
First Community Bancshares, Inc./VA | | | 73,880 | | | | 1,832,224 | |
First Financial Corp./IN | | | 108,310 | | | | 4,406,051 | |
Flushing Financial Corp. | | | 102,530 | | | | 2,432,012 | |
Great Southern Bancorp, Inc. | | | 58,710 | | | | 2,389,497 | |
Great Western Bancorp, Inc. | | | 43,370 | | | | 1,445,088 | |
Hanmi Financial Corp. | | | 148,520 | | | | 3,912,017 | |
Hilltop Holdings, Inc.(a) | | | 147,720 | | | | 3,317,791 | |
Hope Bancorp, Inc. | | | 117,411 | | | | 2,039,429 | |
International Bancshares Corp. | | | 177,510 | | | | 5,286,248 | |
Prosperity Bancshares, Inc. | | | 28,150 | | | | 1,545,153 | |
Republic Bancorp, Inc./KY–Class A | | | 75,930 | | | | 2,359,904 | |
Sierra Bancorp | | | 116,900 | | | | 2,193,044 | |
Texas Capital Bancshares, Inc.(a) | | | 47,040 | | | | 2,583,437 | |
Triumph Bancorp, Inc.(a) | | | 235,422 | | | | 4,670,772 | |
Western Alliance Bancorp(a) | | | 62,870 | | | | 2,360,140 | |
| | | | | | | | |
| | | | | | | 60,918,507 | |
| | | | | | | | |
| Capital Markets–0.6% | |
Cohen & Steers, Inc. | | | 49,050 | | | | 2,096,888 | |
MarketAxess Holdings, Inc. | | | 12,500 | | | | 2,069,875 | |
| | | | | | | | |
| | | | | | | 4,166,763 | |
| | | | | | | | |
| Consumer Finance–0.3% | |
Nelnet, Inc.–Class A | | | 57,260 | | | | 2,311,586 | |
| | | | | | | | |
| Insurance–2.2% | |
Ambac Financial Group, Inc.(a) | | | 286,770 | | | | 5,273,700 | |
Heritage Insurance Holdings, Inc. | | | 105,450 | | | | 1,519,535 | |
| Company | | Shares | | | U.S. $ Value | |
MBIA, Inc.(a) | | | 307,960 | | | $ | 2,399,008 | |
State Auto Financial Corp. | | | 130,840 | | | | 3,115,301 | |
Universal Insurance Holdings, Inc. | | | 166,070 | | | | 4,184,964 | |
| | | | | | | | |
| | | | | | | 16,492,508 | |
| | | | | | | | |
| Mortgage Real Estate Investment Trusts (REITs)–1.8% | |
American Capital Mortgage Investment Corp. | | | 122,180 | | | | 2,100,274 | |
Ares Commercial Real Estate Corp. | | | 179,730 | | | | 2,264,598 | |
Invesco Mortgage Capital, Inc. | | | 128,640 | | | | 1,959,187 | |
New Residential Investment Corp. | | | 176,420 | | | | 2,436,360 | |
PennyMac Mortgage Investment Trust | | | 139,040 | | | | 2,166,243 | |
Redwood Trust, Inc. | | | 147,010 | | | | 2,081,662 | |
| | | | | | | | |
| | | | | | | 13,008,324 | |
| | | | | | | | |
| Thrifts & Mortgage Finance–1.9% | |
Flagstar Bancorp, Inc.(a) | | | 132,750 | | | | 3,683,812 | |
MGIC Investment Corp.(a) | | | 746,370 | | | | 5,970,960 | |
Radian Group, Inc. | | | 333,960 | | | | 4,525,158 | |
| | | | | | | | |
| | | | | | | 14,179,930 | |
| | | | | | | | |
| | | | | | | 111,077,618 | |
| | | | | | | | |
| | | | | | | | |
| | | |
| Health Care–14.5% | | | | | | | | |
| Biotechnology–4.7% | |
AMAG Pharmaceuticals, Inc.(a) | | | 117,840 | | | | 2,888,258 | |
ARIAD Pharmaceuticals, Inc.(a) | | | 269,380 | | | | 3,687,812 | |
Cepheid(a) | | | 87,000 | | | | 4,584,030 | |
Enanta Pharmaceuticals, Inc.(a) | | | 115,190 | | | | 3,065,206 | |
FibroGen, Inc.(a) | | | 70,170 | | | | 1,452,519 | |
Five Prime Therapeutics, Inc.(a) | | | 56,550 | | | | 2,968,310 | |
Genomic Health, Inc.(a) | | | 54,040 | | | | 1,562,837 | |
Insys Therapeutics, Inc.(a) | | | 105,330 | | | | 1,241,841 | |
Lexicon Pharmaceuticals, Inc.(a) | | | 123,760 | | | | 2,236,343 | |
Myriad Genetics, Inc.(a) | | | 24,740 | | | | 509,149 | |
Neurocrine Biosciences, Inc.(a) | | | 31,520 | | | | 1,596,173 | |
Repligen Corp.(a) | | | 78,930 | | | | 2,382,897 | |
Vanda Pharmaceuticals, Inc.(a) | | | 217,350 | | | | 3,616,704 | |
Xencor, Inc.(a) | | | 108,690 | | | | 2,661,818 | |
| | | | | | | | |
| | | | | | | 34,453,897 | |
| | | | | | | | |
| Health Care Equipment & Supplies–3.1% | |
Align Technology, Inc.(a) | | | 34,410 | | | | 3,225,938 | |
AngioDynamics, Inc.(a) | | | 134,800 | | | | 2,364,392 | |
Atrion Corp. | | | 3,730 | | | | 1,591,218 | |
Exactech, Inc.(a) | | | 70,630 | | | | 1,909,129 | |
Halyard Health, Inc.(a) | | | 80,500 | | | | 2,790,130 | |
Masimo Corp.(a) | | | 27,080 | | | | 1,610,989 | |
OraSure Technologies, Inc.(a) | | | 385,920 | | | | 3,075,782 | |
Orthofix International NV(a) | | | 106,810 | | | | 4,568,264 | |
West Pharmaceutical Services, Inc. | | | 27,110 | | | | 2,019,695 | |
| | | | | | | | |
| | | | | | | 23,155,537 | |
| | | | | | | | |
| Health Care Providers & Services–2.1% | |
Chemed Corp. | | | 21,550 | | | | 3,040,058 | |
HealthSouth Corp. | | | 56,110 | | | | 2,276,383 | |
Molina Healthcare, Inc.(a) | | | 98,530 | | | | 5,746,270 | |
WellCare Health Plans, Inc.(a) | | | 38,550 | | | | 4,513,819 | |
| | | | | | | | |
| | | | | | | 15,576,530 | |
| | | | | | | | |
Schedule of Investments (continued)
| | | | | | | | |
| | | |
| Company | | Shares | | | U.S. $ Value | |
| Life Sciences Tools & Services–1.1% | |
ICON PLC(a) | | | 55,010 | | | $ | 4,256,124 | |
INC Research Holdings, Inc.–Class A(a) | | | 49,140 | | | | 2,190,661 | |
PAREXEL International Corp.(a) | | | 20,910 | | | | 1,452,199 | |
| | | | | | | | |
| | | | | | | 7,898,984 | |
| | | | | | | | |
| Pharmaceuticals–3.5% | | | | | | | | |
Akorn, Inc.(a) | | | 68,980 | | | | 1,880,395 | |
Amphastar Pharmaceuticals, Inc.(a) | | | 158,820 | | | | 3,012,815 | |
ANI Pharmaceuticals, Inc.(a) | | | 41,100 | | | | 2,726,985 | |
Aratana Therapeutics, Inc.(a) | | | 157,100 | | | | 1,470,456 | |
Corcept Therapeutics, Inc.(a) | | | 315,640 | | | | 2,051,660 | |
Depomed, Inc.(a) | | | 162,570 | | | | 4,062,624 | |
Impax Laboratories, Inc.(a) | | | 91,780 | | | | 2,175,186 | |
Prestige Brands Holdings, Inc.(a) | | | 54,730 | | | | 2,641,817 | |
SciClone Pharmaceuticals, Inc.(a) | | | 237,480 | | | | 2,434,170 | |
Supernus Pharmaceuticals, Inc.(a) | | | 140,790 | | | | 3,481,737 | |
| | | | | | | | |
| | | | | | | 25,937,845 | |
| | | | | | | | |
| | | | | | | 107,022,793 | |
| | | | | | | | |
| | | | | | | | |
| |
| Consumer Discretionary–10.9% | |
| Auto Components–1.8% | | | | | | | | |
Dana, Inc. | | | 349,670 | | | | 5,451,355 | |
Stoneridge, Inc.(a) | | | 99,290 | | | | 1,826,936 | |
Tenneco, Inc.(a) | | | 96,170 | | | | 5,603,826 | |
| | | | | | | | |
| | | | | | | 12,882,117 | |
| | | | | | | | |
| Automobiles–0.5% | | | | | | | | |
Winnebago Industries, Inc. | | | 145,310 | | | | 3,424,957 | |
| | | | | | | | |
| Diversified Consumer Services–0.8% | |
Capella Education Co. | | | 50,260 | | | | 2,917,090 | |
Strayer Education, Inc.(a) | | | 63,300 | | | | 2,954,844 | |
| | | | | | | | |
| | | | | | | 5,871,934 | |
| | | | | | | | |
| Hotels, Restaurants & Leisure–3.1% | |
Bloomin’ Brands, Inc. | | | 239,460 | | | | 4,128,291 | |
Brinker International, Inc. | | | 72,810 | | | | 3,671,808 | |
Denny’s Corp.(a) | | | 400,660 | | | | 4,283,056 | |
Jack in the Box, Inc. | | | 20,910 | | | | 2,006,105 | |
Papa John’s International, Inc. | | | 49,030 | | | | 3,866,016 | |
Potbelly Corp.(a) | | | 174,710 | | | | 2,171,645 | |
Ruth’s Hospitality Group, Inc. | | | 183,360 | | | | 2,589,043 | |
| | | | | | | | |
| | | | | | | 22,715,964 | |
| | | | | | | | |
| Household Durables–0.2% | |
NACCO Industries, Inc.–Class A | | | 21,530 | | | | 1,463,179 | |
| | | | | | | | |
| Leisure Products–0.3% | |
JAKKS Pacific, Inc.(a) | | | 182,400 | | | | 1,575,936 | |
Smith & Wesson Holding Corp.(a) | | | 28,610 | | | | 760,740 | |
| | | | | | | | |
| | | | | | | 2,336,676 | |
| | | | | | | | |
| Media–0.7% | | | | | | | | |
New Media Investment Group, Inc. | | | 178,660 | | | | 2,769,230 | |
New York Times Co. (The)–Class A | | | 224,820 | | | | 2,686,599 | |
| | | | | | | | |
| | | | | | | 5,455,829 | |
| | | | | | | | |
| Multiline Retail–0.2% | | | | | | | | |
Big Lots, Inc. | | | 38,600 | | | | 1,843,150 | |
| | | | | | | | |
| Company | | Shares | | | U.S. $ Value | |
| Specialty Retail–2.8% | | | | | | | | |
Caleres, Inc. | | | 169,720 | | | $ | 4,292,219 | |
Children’s Place, Inc. (The) | | | 56,260 | | | | 4,493,486 | |
Citi Trends, Inc. | | | 168,380 | | | | 3,355,813 | |
Francesca’s Holdings Corp.(a) | | | 201,970 | | | | 3,116,397 | |
Michaels Cos., Inc. (The)(a) | | | 56,140 | | | | 1,356,904 | |
Urban Outfitters, Inc.(a) | | | 108,080 | | | | 3,730,922 | |
| | | | | | | | |
| | | | | | | 20,345,741 | |
| | | | | | | | |
| Textiles, Apparel & Luxury Goods–0.5% | |
Perry Ellis International, Inc.(a) | | | 86,560 | | | | 1,668,877 | |
Wolverine World Wide, Inc. | | | 101,220 | | | | 2,331,096 | |
| | | | | | | | |
| | | | | | | 3,999,973 | |
| | | | | | | | |
| | | | | | | 80,339,520 | |
| | | | | | | | |
| | | | | | | | |
| | | |
| Real Estate–6.8% | | | | | | | | |
| Equity Real Estate Investment Trusts (REITs)–6.8% | |
Chesapeake Lodging Trust | | | 101,650 | | | | 2,327,785 | |
CorEnergy Infrastructure Trust, Inc. | | | 102,840 | | | | 3,016,297 | |
DCT Industrial Trust, Inc. | | | 42,530 | | | | 2,064,832 | |
Education Realty Trust, Inc. | | | 88,100 | | | | 3,800,634 | |
EPR Properties | | | 31,750 | | | | 2,499,995 | |
First Industrial Realty Trust, Inc. | | | 38,970 | | | | 1,099,733 | |
Franklin Street Properties Corp. | | | 160,880 | | | | 2,027,088 | |
Getty Realty Corp. | | | 143,000 | | | | 3,421,990 | |
Gramercy Property Trust | | | 467,570 | | | | 4,507,375 | |
Highwoods Properties, Inc. | | | 36,140 | | | | 1,883,617 | |
Independence Realty Trust, Inc. | | | 339,010 | | | | 3,051,090 | |
iStar, Inc.(a) | | | 266,690 | | | | 2,861,584 | |
Medical Properties Trust, Inc. | | | 173,350 | | | | 2,560,379 | |
National Health Investors, Inc. | | | 28,180 | | | | 2,211,566 | |
One Liberty Properties, Inc. | | | 56,280 | | | | 1,359,725 | |
Select Income REIT | | | 111,180 | | | | 2,990,742 | |
Summit Hotel Properties, Inc. | | | 227,280 | | | | 2,991,005 | |
Sun Communities, Inc. | | | 21,020 | | | | 1,649,650 | |
Sunstone Hotel Investors, Inc. | | | 153,790 | | | | 1,966,974 | |
Xenia Hotels & Resorts, Inc. | | | 93,090 | | | | 1,413,106 | |
| | | | | | | | |
| | | | | | | 49,705,167 | |
| | | | | | | | |
| | | | | | | | |
| |
| Energy–5.0% | |
| Energy Equipment & Services–2.8% | |
Archrock, Inc. | | | 156,360 | | | | 2,045,189 | |
Dril-Quip, Inc.(a) | | | 45,820 | | | | 2,554,007 | |
Matrix Service Co.(a) | | | 148,490 | | | | 2,785,672 | |
McDermott International, Inc.(a) | | | 918,090 | | | | 4,599,631 | |
Oil States International, Inc.(a) | | | 149,140 | | | | 4,708,350 | |
RPC, Inc.(a) | | | 244,370 | | | | 4,105,416 | |
| | | | | | | | |
| | | | | | | 20,798,265 | |
| | | | | | | | |
| Oil, Gas & Consumable Fuels–2.2% | |
Gulfport Energy Corp.(a) | | | 77,050 | | | | 2,176,662 | |
Matador Resources Co.(a) | | | 138,330 | | | | 3,366,952 | |
QEP Resources, Inc. | | | 114,390 | | | | 2,234,037 | |
REX American Resources Corp.(a) | | | 48,470 | | | | 4,108,317 | |
SM Energy Co. | | | 112,070 | | | | 4,323,661 | |
| | | | | | | | |
| | | | | | | 16,209,629 | |
| | | | | | | | |
| | | | | | | 37,007,894 | |
| | | | | | | | |
| | | | | | | | |
| | | |
| Company | | Shares | | | U.S. $ Value | |
| Materials–4.7% | |
| Chemicals–1.9% | |
Huntsman Corp. | | | 191,890 | | | $ | 3,122,050 | |
Koppers Holdings, Inc.(a) | | | 88,730 | | | | 2,855,332 | |
PolyOne Corp. | | | 78,390 | | | | 2,650,366 | |
Trinseo SA | | | 89,620 | | | | 5,068,907 | |
| | | | | | | | |
| | | | | | | 13,696,655 | |
| | | | | | | | |
| Containers & Packaging–0.8% | |
Bemis Co., Inc. | | | 63,560 | | | | 3,242,196 | |
Graphic Packaging Holding Co. | | | 210,260 | | | | 2,941,537 | |
| | | | | | | | |
| | | | | | | 6,183,733 | |
| | | | | | | | |
| Metals & Mining–2.0% | |
Commercial Metals Co. | | | 189,810 | | | | 3,073,024 | |
Reliance Steel & Aluminum Co. | | | 21,850 | | | | 1,573,855 | |
Schnitzer Steel Industries, Inc.–Class A | | | 180,350 | | | | 3,769,315 | |
Steel Dynamics, Inc. | | | 118,500 | | | | 2,961,315 | |
Worthington Industries, Inc. | | | 77,430 | | | | 3,718,963 | |
| | | | | | | | |
| | | | | | | 15,096,472 | |
| | | | | | | | |
| | | | | | | 34,976,860 | |
| | | | | | | | |
| | | | | | | | |
| |
| Consumer Staples–2.9% | |
| Food & Staples Retailing–0.5% | |
SpartanNash Co. | | | 135,730 | | | | 3,925,312 | |
| | | | | | | | |
| Food Products–1.5% | |
Fresh Del Monte Produce, Inc. | | | 80,610 | | | | 4,828,539 | |
Sanderson Farms, Inc. | | | 33,910 | | | | 3,266,550 | |
Seaboard Corp.(a) | | | 810 | | | | 2,786,400 | |
| | | | | | | | |
| | | | | | | 10,881,489 | |
| | | | | | | | |
| Personal Products–0.4% | |
Natural Health Trends Corp. | | | 100,870 | | | | 2,850,586 | |
| | | | | | | | |
| Tobacco–0.5% | | | | | | | | |
Universal Corp./VA | | | 58,530 | | | | 3,407,617 | |
| | | | | | | | |
| | | | | | | 21,065,004 | |
| | | | | | | | |
| Company | | Shares | | | U.S. $ Value | |
| Utilities–1.8% | |
| Gas Utilities–0.9% | |
ONE Gas, Inc. | | | 43,910 | | | $ | 2,715,394 | |
Southwest Gas Corp. | | | 53,750 | | | | 3,754,975 | |
| | | | | | | | |
| | | | | | | 6,470,369 | |
| | | | | | | | |
| Independent Power and Renewable Electricity Producers–0.9% | |
Atlantic Power Corp. | | | 883,260 | | | | 2,181,652 | |
Talen Energy Corp.(a) | | | 318,790 | | | | 4,415,242 | |
| | | | | | | | |
| | | | | | | 6,596,894 | |
| | | | | | | | |
| | | | | | | 13,067,263 | |
| | | | | | | | |
| | | | | | | | |
| |
| Telecommunication Services–1.3% | |
| Diversified Telecommunication Services–1.1% | |
IDT Corp.–Class B | | | 202,060 | | | | 3,483,514 | |
Vonage Holdings Corp.(a) | | | 729,460 | | | | 4,821,731 | |
| | | | | | | | |
| | | | | | | 8,305,245 | |
| | | | | | | | |
| Wireless Telecommunication Services–0.2% | |
Spok Holdings, Inc. | | | 59,370 | | | | 1,057,973 | |
| | | | | | | | |
| | | | | | | 9,363,218 | |
| | | | | | | | |
Total Common Stocks
(cost $678,869,061) | | | | | | | 719,886,111 | |
| | | | | | | | |
| | | | | | | | |
| |
| SHORT-TERM INVESTMENTS–1.6% | |
| Investment Companies–1.6% | |
AB Fixed Income Shares, Inc.–
Government Money Market Portfolio–
Class AB, 0.28%(b)(c)
(cost $12,157,406) | | | 12,157,406 | | | | 12,157,406 | |
| | | | | | | | |
Total Investments—99.5%
(cost $691,026,467) | | | | | | | 732,043,517 | |
| | |
Other assets less liabilities—0.5% | | | | | | | 3,468,532 | |
| | | | | | | | |
| Net Assets—100.0% | | | | | | $ | 735,512,049 | |
| | | | | | | | |
| | | | | | | | | | | | | | | | | | |
| |
| FUTURES (see Note 3) | |
| Type | | Number of Contracts | | | Expiration Month | | Original Value | | | Value at September 30, 2016 | | | Unrealized Appreciation/
(Depreciation) | |
| Purchased Contracts | | | | | | | | | | | | | | | |
Russell 2000 Mini Futures | | | 343 | | | December 2016 | | $ | 42,307,947 | | | $ | 42,816,690 | | | $ | 508,743 | |
| (a) | | Non-income producing security. |
| (b) | | Investment in affiliated money market mutual fund. The rate shown represents the 7-day yield as of period end. |
| (c) | | To obtain a copy of the fund’s financial statements, please go to the Securities and Exchange Commission’s website at www.sec.gov, or call AB at (800) 227-4618. |
Glossary:
REIT—Real Estate Investment Trust
See notes to financial statements.
Schedule of Investments
Bernstein Fund, Inc.
Schedule of Investments
International Small Cap Portfolio
September 30, 2016
| | | | | | | | |
| Company | | Shares | | | U.S. $ Value | |
| | | | | | | | |
| COMMON STOCKS–93.3% | |
| Consumer Discretionary–22.2% | |
| Auto Components–4.4% | | | | | | | | |
Aisan Industry Co., Ltd. | | | 102,100 | | | $ | 810,257 | |
Brembo SpA | | | 13,757 | | | | 820,904 | |
Faurecia | | | 64,828 | | | | 2,544,022 | |
Hankook Tire Co., Ltd. | | | 97,269 | | | | 5,258,983 | |
Hanon Systems | | | 217,900 | | | | 2,465,401 | |
Linamar Corp. | | | 84,038 | | | | 3,508,977 | |
Nexen Tire Corp. | | | 209,869 | | | | 2,828,390 | |
Nexteer Automotive Group Ltd. | | | 4,968,288 | | | | 6,495,996 | |
Plastic Omnium SA | | | 92,105 | | | | 3,056,457 | |
Showa Corp. | | | 104,500 | | | | 550,639 | |
Tianneng Power International Ltd. | | | 874,000 | | | | 748,170 | |
| | | | | | | | |
| | | | | | | 29,088,196 | |
| | | | | | | | |
| Distributors–0.1% | |
John Menzies PLC | | | 44,625 | | | | 337,211 | |
| | | | | | | | |
| Diversified Consumer Services–1.1% | |
Navitas Ltd. | | | 171,541 | | | | 688,165 | |
TAL Education Group (ADR)(a) | | | 79,146 | | | | 5,606,703 | |
Tarena International, Inc. (ADR) | | | 90,908 | | | | 1,316,348 | |
| | | | | | | | |
| | | | | | | 7,611,216 | |
| | | | | | | | |
| Hotels, Restaurants & Leisure–3.0% | |
Alsea SAB de CV | | | 188,310 | | | | 637,193 | |
CVC Brasil Operadora e Agencia de Viagens SA | | | 146,319 | | | | 1,082,045 | |
Domino’s Pizza Group PLC | | | 501,492 | | | | 2,427,840 | |
Elior Group(b) | | | 82,014 | | | | 1,877,880 | |
IMAX China Holding, Inc.(a)(b) | | | 824,800 | | | | 4,058,672 | |
Jollibee Foods Corp. | | | 1,147,430 | | | | 5,850,159 | |
Lion Travel Service Co., Ltd. | | | 197,000 | | | | 497,866 | |
Plenus Co., Ltd. | | | 18,700 | | | | 341,933 | |
Round One Corp. | | | 99,700 | | | | 676,197 | |
Tabcorp Holdings Ltd. | | | 527,884 | | | | 2,021,448 | |
| | | | | | | | |
| | | | | | | 19,471,233 | |
| | | | | | | | |
| Household Durables–1.1% | |
Auto Trader Group PLC(b) | | | 448,388 | | | | 2,357,161 | |
Bovis Homes Group PLC | | | 161,648 | | | | 1,832,785 | |
De’ Longhi SpA | | | 5,309 | | | | 128,584 | |
Dorel Industries, Inc.–Class B | | | 27,460 | | | | 739,272 | |
Fujitsu General Ltd. | | | 18,000 | | | | 389,991 | |
SEB SA | | | 5,961 | | | | 841,890 | |
Token Corp. | | | 9,000 | | | | 670,586 | |
| | | | | | | | |
| | | | | | | 6,960,269 | |
| | | | | | | | |
| | | | | | | | |
| Internet & Direct Marketing Retail–0.6% | |
ASKUL Corp. | | | 90,800 | | | $ | 3,444,177 | |
GS Home Shopping, Inc. | | | 4,701 | | | | 703,483 | |
| | | | | | | | |
| | | | | | | 4,147,660 | |
| | | | | | | | |
| Leisure Products–1.6% | |
Amer Sports Oyj | | | 93,020 | | | | 2,845,048 | |
Bandai Namco Holdings, Inc. | | | 73,800 | | | | 2,258,877 | |
Playmates Toys Ltd. | | | 4,528,000 | | | | 698,795 | |
Thule Group AB(b) | | | 277,360 | | | | 4,730,579 | |
| | | | | | | | |
| | | | | | | 10,533,299 | |
| | | | | | | | |
| Media–3.1% | | | | | | | | |
Asatsu-DK, Inc. | | | 31,200 | | | | 831,044 | |
IPSOS | | | 24,661 | | | | 805,553 | |
Loen Entertainment, Inc.(a) | | | 77,536 | | | | 5,506,737 | |
Mediaset Espana Comunicacion SA | | | 41,860 | | | | 496,214 | |
Megacable Holdings SAB de CV | | | 503,409 | | | | 1,933,437 | |
Metropole Television SA | | | 185,802 | | | | 3,352,350 | |
NOS SGPS SA | | | 352,306 | | | | 2,397,331 | |
TV Asahi Holdings Corp. | | | 293,800 | | | | 5,418,613 | |
| | | | | | | | |
| | | | | | | 20,741,279 | |
| | | | | | | | |
| Multiline Retail–1.5% | | | | | | | | |
Dollarama, Inc. | | | 40,650 | | | | 3,173,733 | |
Harvey Norman Holdings Ltd. | | | 686,329 | | | | 2,747,324 | |
Myer Holdings Ltd. | | | 628,730 | | | | 564,168 | |
Poya International Co., Ltd. | | | 25,200 | | | | 375,415 | |
Seria Co., Ltd. | | | 39,900 | | | | 3,207,841 | |
| | | | | | | | |
| | | | | | | 10,068,481 | |
| | | | | | | | |
| Specialty Retail–3.6% | | | | | | | | |
Ace Hardware Indonesia Tbk PT | | | 36,585,100 | | | | 2,456,998 | |
Clas Ohlson AB–Class B | | | 39,767 | | | | 619,069 | |
Delek Automotive Systems Ltd. | | | 79,040 | | | | 691,303 | |
EDION Corp. | | | 82,200 | | | | 688,572 | |
Geo Holdings Corp. | | | 52,400 | | | | 678,055 | |
Giordano International Ltd. | | | 1,426,000 | | | | 736,883 | |
Groupe Fnac SA(a) | | | 11,930 | | | | 876,387 | |
Halfords Group PLC | | | 117,221 | | | | 531,342 | |
JB Hi-Fi Ltd. | | | 40,222 | | | | 895,231 | |
JD Sports Fashion PLC | | | 7,020 | | | | 134,218 | |
KappAhl AB | | | 158,090 | | | | 805,828 | |
Mobilezone Holding AG | | | 51,769 | | | | 759,350 | |
Motorpoint Group PLC(a)(b) | | | 676,257 | | | | 1,730,800 | |
Mr Price Group Ltd. | | | 143,285 | | | | 1,585,075 | |
Nishimatsuya Chain Co., Ltd. | | | 50,700 | | | | 770,635 | |
PAL GROUP Holdings Co., Ltd. | | | 13,000 | | | | 301,888 | |
Senao International Co., Ltd. | | | 125,000 | | | | 209,579 | |
Shimamura Co., Ltd. | | | 19,400 | | | | 2,361,782 | |
T-Gaia Corp. | | | 54,100 | | | | 774,252 | |
Valora Holding AG | | | 2,572 | | | | 732,941 | |
WH Smith PLC | | | 87,021 | | | | 1,736,011 | |
Yamada Denki Co., Ltd. | | | 748,600 | | | | 3,713,113 | |
| | | | | | | | |
| | | | | | | 23,789,312 | |
| | | | | | | | |
| | | | | | | | |
| | | |
| Company | | Shares | | | U.S. $ Value | |
| | | | | | | | |
| Textiles, Apparel & Luxury Goods–2.1% | |
China Lilang Ltd. | | | 714,000 | | | $ | 407,974 | |
Eclat Textile Co., Ltd. | | | 402,000 | | | | 4,816,489 | |
HUGO BOSS AG | | | 40,902 | | | | 2,264,146 | |
Nan Liu Enterprise Co., Ltd. | | | 551,000 | | | | 2,598,428 | |
Sanyo Shokai Ltd. | | | 399,000 | | | | 660,907 | |
Taiwan Paiho Ltd. | | | 862,000 | | | | 3,089,790 | |
| | | | | | | | |
| | | | | | | 13,837,734 | |
| | | | | | | | |
| | | | | | | 146,585,890 | |
| | | | | | | | |
| | | | | | | | |
| | | |
| Industrials–15.5% | | | | | | | | |
| Aerospace & Defense–1.2% | | | | | | | | |
LISI | | | 71,355 | | | | 1,974,257 | |
Saab AB–Class B | | | 105,558 | | | | 3,758,224 | |
Senior PLC | | | 812,276 | | | | 2,411,136 | |
| | | | | | | | |
| | | | | | | 8,143,617 | |
| | | | | | | | |
| Air Freight & Logistics–0.4% | |
bpost SA | | | 27,152 | | | | 736,289 | |
Mitsui-Soko Holdings Co., Ltd. | | | 176,000 | | | | 559,869 | |
Oesterreichische Post AG(a) | | | 16,917 | | | | 599,216 | |
Panalpina Welttransport Holding AG | | | 6,050 | | | | 842,975 | |
| | | | | | | | |
| | | | | | | 2,738,349 | |
| | | | | | | | |
| Airlines–0.7% | | | | | | | | |
Aeroflot PJSC (GDR)(a)(b) | | | 42,750 | | | | 396,592 | |
Air Canada(a) | | | 229,345 | | | | 1,853,010 | |
Dart Group PLC | | | 108,986 | | | | 591,888 | |
Qantas Airways Ltd. | | | 736,061 | | | | 1,767,881 | |
| | | | | | | | |
| | | | | | | 4,609,371 | |
| | | | | | | | |
| Building Products–2.3% | |
DIRTT Environmental Solutions(a) | | | 391,583 | | | | 1,486,401 | |
dorma&kaba Holding AG(a) | | | 8,724 | | | | 6,467,887 | |
Kingspan Group PLC | | | 219,196 | | | | 5,904,684 | |
Sankyo Tateyama, Inc. | | | 25,500 | | | | 414,538 | |
Schweiter Technologies AG | | | 740 | | | | 856,922 | |
| | | | | | | | |
| | | | | | | 15,130,432 | |
| | | | | | | | |
| Commercial Services & Supplies–1.1% | |
Downer EDI Ltd. | | | 215,900 | | | | 898,238 | |
Loomis AB–Class B | | | 76,157 | | | | 2,350,213 | |
Rentokil Initial PLC | | | 1,393,728 | | | | 4,005,829 | |
Transcontinental, Inc.–Class A | | | 17,210 | | | | 231,137 | |
| | | | | | | | |
| | | | | | | 7,485,417 | |
| | | | | | | | |
| Construction & Engineering–2.3% | | | | | | | | |
Balfour Beatty PLC(a) | | | 1,258,770 | | | | 4,554,928 | |
Bird Construction, Inc. | | | 62,019 | | | | 536,542 | |
Burkhalter Holding AG | | | 5,250 | | | | 710,412 | |
Carillion PLC | | | 178,334 | | | | 572,998 | |
John Laing Group PLC(b) | | | 1,557,286 | | | | 5,500,345 | |
Mirait Holdings Corp. | | | 69,200 | | | | 589,652 | |
UGL Ltd.(a) | | | 898,743 | | | | 1,481,833 | |
Wilson Bayly Holmes-Ovcon Ltd. | | | 76,993 | | | | 864,611 | |
| | | | | | | | |
| | | | | | | 14,811,321 | |
| | | | | | | | |
| | | | | | | | |
| Electrical Equipment–1.0% | |
Chiyoda Integre Co., Ltd. | | | 34,400 | | | $ | 700,259 | |
Kung Long Batteries Industrial Co., Ltd. | | | 143,900 | | | | 690,942 | |
Nitto Kogyo Corp. | | | 34,900 | | | | 458,137 | |
TKH Group NV | | | 122,416 | | | | 4,779,134 | |
| | | | | | | | |
| | | | | | | 6,628,472 | |
| | | | | | | | |
| Industrial Conglomerates–0.7% | |
Rheinmetall AG | | | 56,924 | | | | 3,967,763 | |
TOKAI Holdings Corp. | | | 112,400 | | | | 720,320 | |
| | | | | | | | |
| | | | | | | 4,688,083 | |
| | | | | | | | |
| Machinery–3.3% | | | | | | | | |
Biesse SpA | | | 44,164 | | | | 699,703 | |
Bobst Group SA | | | 10,080 | | | | 562,882 | |
Bodycote PLC | | | 263,063 | | | | 2,004,284 | |
Duerr AG | | | 33,145 | | | | 2,786,910 | |
Fenner PLC | | | 319,483 | | | | 828,195 | |
IHI Corp. | | | 572,000 | | | | 1,662,350 | |
Industria Macchine Automatiche SpA | | | 12,423 | | | | 825,181 | |
Juki Corp. | | | 28,700 | | | | 209,894 | |
Komax Holding AG | | | 3,113 | | | | 762,811 | |
Krones AG | | | 31,493 | | | | 3,065,086 | |
KUKA AG(a) | | | 13,344 | | | | 1,613,671 | |
Melrose Industries PLC | | | 1,374,168 | | | | 3,105,874 | |
Nabtesco Corp. | | | 98,200 | | | | 2,782,067 | |
Rational AG | | | 1,431 | | | | 717,980 | |
| | | | | | | | |
| | | | | | | 21,626,888 | |
| | | | | | | | |
| Professional Services–0.8% | |
Applus Services SA | | | 84,370 | | | | 857,361 | |
Brunel International NV | | | 44,558 | | | | 779,028 | |
Teleperformance | | | 27,939 | | | | 2,980,282 | |
WS Atkins PLC | | | 36,588 | | | | 752,366 | |
| | | | | | | | |
| | | | | | | 5,369,037 | |
| | | | | | | | |
| Road & Rail–0.4% | | | | | | | | |
Go-Ahead Group PLC | | | 18,475 | | | | 486,725 | |
National Express Group PLC | | | 523,640 | | | | 2,337,921 | |
| | | | | | | | |
| | | | | | | 2,824,646 | |
| | | | | | | | |
| Trading Companies & Distributors–1.3% | |
Daiichi Jitsugyo Co., Ltd. | | | 154,000 | | | | 841,638 | |
Diploma PLC | | | 258,422 | | | | 2,944,242 | |
Howden Joinery Group PLC | | | 42,570 | | | | 238,499 | |
Kloeckner & Co. SE(a) | | | 64,360 | | | | 784,319 | |
Russel Metals, Inc. | | | 138,033 | | | | 2,204,193 | |
Yamazen Corp. | | | 83,200 | | | | 636,617 | |
Yuasa Trading Co., Ltd. | | | 26,900 | | | | 618,020 | |
| | | | | | | | |
| | | | | | | 8,267,528 | |
| | | | | | | | |
| | | | | | | 102,323,161 | |
| | | | | | | | |
| | | | | | | | |
| |
| Information Technology–12.5% | |
| Communications Equipment–0.2% | |
Senao Networks, Inc. | | | 86,000 | | | | 399,784 | |
VTech Holdings Ltd. | | | 67,800 | | | | 775,304 | |
| | | | | | | | |
| | | | | | | 1,175,088 | |
| | | | | | | | |
Schedule of Investments (continued)
| | | | | | | | |
| | | |
| Company | | Shares | | | U.S. $ Value | |
| | | | | | | | |
| Electronic Equipment, Instruments & Components–2.7% | |
Daiwabo Holdings Co., Ltd. | | | 320,000 | | | $ | 756,342 | |
Electrocomponents PLC | | | 184,320 | | | | 811,087 | |
Inficon Holding AG(a) | | | 940 | | | | 360,096 | |
Kaga Electronics Co., Ltd. | | | 60,100 | | | | 743,324 | |
Mycronic AB | | | 67,044 | | | | 837,468 | |
Premier Farnell PLC | | | 296,763 | | | | 712,011 | |
Ryosan Co., Ltd. | | | 26,000 | | | | 790,537 | |
Samsung Electro-Mechanics Co., Ltd. | | | 61,897 | | | | 2,763,167 | |
Test Research, Inc. | | | 360,000 | | | | 471,632 | |
Tongda Group Holdings Ltd. | | | 21,320,000 | | | | 5,229,288 | |
Yaskawa Electric Corp. | | | 277,400 | | | | 4,149,047 | |
| | | | | | | | |
| | | | | | | 17,623,999 | |
| | | | | | | | |
| Internet Software & Services–1.2% | |
Dip Corp. | | | 228,900 | | | | 7,123,390 | |
Moneysupermarket.com Group PLC | | | 180,118 | | | | 700,475 | |
PChome Online, Inc. | | | 12,594 | | | | 149,075 | |
| | | | | | | | |
| | | | | | | 7,972,940 | |
| | | | | | | | |
| IT Services–2.8% | |
Alten SA | | | 109,953 | | | | 7,691,518 | |
Bechtle AG | | | 6,917 | | | | 800,827 | |
Computacenter PLC | | | 273,784 | | | | 2,519,541 | |
GFT Technologies SE | | | 31,752 | | | | 654,375 | |
Nihon Unisys Ltd. | | | 291,700 | | | | 3,749,943 | |
Softcat PLC | | | 735,047 | | | | 3,048,738 | |
| | | | | | | | |
| | | | | | | 18,464,942 | |
| | | | | | | | |
| Semiconductors & Semiconductor Equipment–4.4% | |
ASM International NV | | | 93,421 | | | | 3,818,803 | |
BE Semiconductor Industries NV | | | 24,302 | | | | 829,074 | |
Chipbond Technology Corp. | | | 1,404,000 | | | | 2,065,542 | |
Disco Corp. | | | 37,200 | | | | 4,405,807 | |
Elite Advanced Laser Corp. | | | 99,600 | | | | 359,593 | |
Hua Hong Semiconductor Ltd.(b) | | | 2,468,000 | | | | 2,878,823 | |
SCREEN Holdings Co., Ltd. | | | 64,000 | | | | 4,125,920 | |
Silergy Corp. | | | 137,000 | | | | 2,032,059 | |
Siltronic AG(a) | | | 159,407 | | | | 4,218,388 | |
Sumco Corp. | | | 544,200 | | | | 4,477,791 | |
| | | | | | | | |
| | | | | | | 29,211,800 | |
| | | | | | | | |
| Software–0.5% | |
Cheetah Mobile, Inc. (ADR)(a) | | | 46,250 | | | | 576,275 | |
Oracle Corp. Japan | | | 20,900 | | | | 1,180,803 | |
Soft-World International Corp. | | | 379,000 | | | | 808,226 | |
Ubisoft Entertainment SA(a) | | | 21,110 | | | | 797,619 | |
| | | | | | | | |
| | | | | | | 3,362,923 | |
| | | | | | | | |
| Technology Hardware, Storage & Peripherals–0.7% | |
Aten International Co., Ltd. | | | 295,000 | | | | 754,288 | |
Elecom Co., Ltd. | | | 7,400 | | | | 161,052 | |
Gigabyte Technology Co., Ltd. | | | 582,000 | | | | 774,751 | |
Logitech International SA | | | 40,450 | | | | 907,946 | |
Micro-Star International Co., Ltd. | | | 273,000 | | | | 711,740 | |
| | | | | | | | |
Riso Kagaku Corp. | | | 34,100 | | | $ | 558,858 | |
Roland DG Corp. | | | 26,300 | | | | 590,460 | |
| | | | | | | | |
| | | | | | | 4,459,095 | |
| | | | | | | | |
| | | | | | | 82,270,787 | |
| | | | | | | | |
| | | | | | | | |
| |
| Consumer Staples–11.8% | |
| Beverages–2.2% | |
Britvic PLC | | | 67,950 | | | | 531,255 | |
Coca-Cola West Co., Ltd. | | | 28,800 | | | | 806,056 | |
Cott Corp. | | | 169,033 | | | | 2,405,462 | |
Refresco Group NV(b) | | | 50,500 | | | | 839,069 | |
Royal Unibrew A/S | | | 145,085 | | | | 7,178,236 | |
Sapporo Holdings Ltd. | | | 93,700 | | | | 2,597,521 | |
| | | | | | | | |
| | | | | | | 14,357,599 | |
| | | | | | | | |
| Food & Staples Retailing–3.3% | |
Ain Holdings, Inc. | | | 63,400 | | | | 4,316,421 | |
Booker Group PLC | | | 664,691 | | | | 1,533,258 | |
Clicks Group Ltd. | | | 242,756 | | | | 2,248,976 | |
cocokara fine, Inc. | | | 13,700 | | | | 527,837 | |
MARR SpA | | | 251,594 | | | | 5,041,891 | |
Metro, Inc. | | | 78,377 | | | | 2,573,038 | |
Tsuruha Holdings, Inc. | | | 49,500 | | | | 5,722,225 | |
| | | | | | | | |
| | | | | | | 21,963,646 | |
| | | | | | | | |
| Food Products–4.2% | |
Bakkafrost P/F | | | 19,282 | | | | 806,652 | |
Calbee, Inc. | | | 85,300 | | | | 3,231,866 | |
Century Pacific Food, Inc. | | | 8,677,400 | | | | 2,898,729 | |
Cloetta AB | | | 542,605 | | | | 1,967,060 | |
Dongwon F&B Co., Ltd. | | | 952 | | | | 195,823 | |
Glanbia PLC | | | 210,632 | | | | 4,052,003 | |
High Liner Foods, Inc. | | | 41,220 | | | | 817,834 | |
Industrias Bachoco SAB de CV | | | 583,341 | | | | 2,437,789 | |
Maeil Dairy Industry Co., Ltd. | | | 15,594 | | | | 489,066 | |
Megmilk Snow Brand Co., Ltd. | | | 76,700 | | | | 2,804,479 | |
Nichirei Corp. | | | 127,500 | | | | 2,863,580 | |
Salmar ASA | | | 25,080 | | | | 766,751 | |
Sao Martinho SA | | | 160,300 | | | | 2,890,886 | |
Scandi Standard AB | | | 105,284 | | | | 781,789 | |
Select Harvests Ltd. | | | 50,270 | | | | 219,447 | |
Thai Vegetable Oil PCL | | | 900,400 | | | | 792,560 | |
| | | | | | | | |
| | | | | | | 28,016,314 | |
| | | | | | | | |
| Household Products–0.8% | |
Pigeon Corp. | | | 175,400 | | | | 5,312,710 | |
| | | | | | | | |
| Personal Products–1.0% | |
Able C&C Co., Ltd. | | | 25,986 | | | | 568,023 | |
Cosmax, Inc. | | | 35,175 | | | | 4,863,702 | |
Oriflame Holding AG(a) | | | 25,930 | | | | 949,718 | |
| | | | | | | | |
| | | | | | | 6,381,443 | |
| | | | | | | | |
| Tobacco–0.3% | |
Gudang Garam Tbk PT | | | 358,000 | | | | 1,703,514 | |
| | | | | | | | |
| | | | | | | 77,735,226 | |
| | | | | | | | |
| | | | | | | | |
| | | |
| Company | | Shares | | | U.S. $ Value | |
| | | | | | | | |
| Materials–7.3% | |
| Chemicals–3.0% | |
Air Water, Inc. | | | 140,000 | | | $ | 2,643,707 | |
Arkema SA | | | 39,976 | | | | 3,701,067 | |
Chr. Hansen Holding A/S | | | 33,340 | | | | 1,985,887 | |
Dynasty Ceramic PCL | | | 5,008,400 | | | | 630,206 | |
FUCHS PETROLUB SE (Preference Shares) | | | 40,205 | | | | 1,835,614 | |
Fujimi, Inc. | | | 10,100 | | | | 152,631 | |
JSR Corp. | | | 214,800 | | | | 3,376,116 | |
LANXESS AG | | | 72,906 | | | | 4,538,194 | |
Ube Industries Ltd. | | | 420,000 | | | | 803,244 | |
| | | | | | | | |
| | | | | | | 19,666,666 | |
| | | | | | | | |
| Construction Materials–0.7% | |
Buzzi Unicem SpA | | | 177,956 | | | | 3,648,948 | |
CSR Ltd. | | | 287,130 | | | | 800,548 | |
| | | | | | | | |
| | | | | | | 4,449,496 | |
| | | | | | | | |
| Containers & Packaging–0.6% | |
Mpact Ltd. | | | 170,467 | | | | 412,550 | |
Pact Group Holdings Ltd. | | | 167,780 | | | | 815,762 | |
Smurfit Kappa Group PLC | | | 107,331 | | | | 2,399,347 | |
Winpak Ltd. | | | 20,532 | | | | 685,939 | |
| | | | | | | | |
| | | | | | | 4,313,598 | |
| | | | | | | | |
| Metals & Mining–2.4% | |
Asahi Holdings, Inc. | | | 43,700 | | | | 746,701 | |
Boliden AB | | | 84,491 | | | | 1,985,932 | |
Detour Gold Corp.(a) | | | 85,286 | | | | 1,855,301 | |
Godo Steel Ltd. | | | 32,900 | | | | 588,492 | |
Granges AB | | | 346,209 | | | | 3,531,777 | |
Lucara Diamond Corp. | | | 275,950 | | | | 822,413 | |
Nippon Denko Co., Ltd. | | | 449,600 | | | | 759,825 | |
Nippon Light Metal Holdings Co., Ltd. | | | 363,300 | | | | 783,889 | |
Northern Star Resources Ltd. | | | 245,160 | | | | 868,762 | |
Sims Metal Management Ltd. | | | 120,282 | | | | 864,997 | |
Syrah Resources Ltd.(a) | | | 487,487 | | | | 1,644,952 | |
Western Areas Ltd.(a) | | | 646,596 | | | | 1,442,630 | |
| | | | | | | | |
| | | | | | | 15,895,671 | |
| | | | | | | | |
| Paper & Forest Products–0.6% | |
Nine Dragons Paper Holdings Ltd. | | | 2,373,000 | | | | 2,237,592 | |
Nippon Paper Industries Co., Ltd. | | | 37,200 | | | | 680,591 | |
Western Forest Products, Inc. | | | 448,490 | | | | 738,396 | |
| | | | | | | | |
| | | | | | | 3,656,579 | |
| | | | | | | | |
| | | | | | | 47,982,010 | |
| | | | | | | | |
| | | | | | | | |
| |
| Health Care–6.3% | |
| Biotechnology–1.0% | |
China Biologic Products, Inc.(a) | | | 16,879 | | | | 2,101,098 | |
Medy-Tox, Inc. | | | 11,334 | | | | 4,658,273 | |
| | | | | | | | |
| | | | | | | 6,759,371 | |
| | | | | | | | |
| Health Care Equipment & Supplies–1.3% | |
Ginko International Co., Ltd. | | | 267,000 | | | | 2,658,967 | |
LivaNova PLC(a) | | | 45,035 | | | | 2,707,054 | |
| | | | | | | | |
Microlife Corp. | | | 249,000 | | | $ | 591,791 | |
St Shine Optical Co., Ltd. | | | 76,000 | | | | 1,775,277 | |
Straumann Holding AG | | | 2,472 | | | | 967,052 | |
| | | | | | | | |
| | | | | | | 8,700,141 | |
| | | | | | | | |
| Health Care Providers & Services–1.6% | | | | | | | | |
Apollo Hospitals Enterprise Ltd. (GDR)(b) | | | 35,170 | | | | 698,125 | |
BML, Inc. | | | 29,400 | | | | 773,732 | |
Medical Facilities Corp. | | | 48,842 | | | | 816,050 | |
Raffles Medical Group Ltd. | | | 3,142,500 | | | | 3,530,341 | |
Shanghai Pharmaceuticals Holding Co., Ltd.–Class H | | | 1,698,700 | | | | 4,613,386 | |
| | | | | | | | |
| | | | | | | 10,431,634 | |
| | | | | | | | |
| Health Care Technology–0.7% | | | | | | | | |
EMIS Group PLC | | | 19,930 | | | | 242,694 | |
NNIT A/S(b) | | | 147,528 | | | | 4,580,658 | |
| | | | | | | | |
| | | | | | | 4,823,352 | |
| | | | | | | | |
| Life Sciences Tools & Services–0.2% | | | | | | | | |
Horizon Discovery Group PLC(a) | | | 559,159 | | | | 1,072,635 | |
| | | | | | | | |
| Pharmaceuticals–1.5% | | | | | | | | |
Dawnrays Pharmaceutical Holdings Ltd. | | | 708,000 | | | | 468,272 | |
DongKook Pharmaceutical Co., Ltd. | | | 12,885 | | | | 701,945 | |
Faes Farma SA | | | 209,504 | | | | 808,318 | |
IlDong Holdings Co., Ltd. | | | 29,340 | | | | 839,057 | |
Indivior PLC | | | 211,376 | | | | 840,608 | |
Nippon Shinyaku Co., Ltd. | | | 32,200 | | | | 1,745,214 | |
Ouro Fino Saude Animal Participacoes SA | | | 107,600 | | | | 1,316,153 | |
Recordati SpA | | | 29,455 | | | | 946,675 | |
Samjin Pharmaceutical Co., Ltd. | | | 24,989 | | | | 734,584 | |
Shandong Luoxin Pharmaceutical Group Stock Co., Ltd.–Class H | | | 526,000 | | | | 749,380 | |
STADA Arzneimittel AG | | | 15,643 | | | | 870,360 | |
| | | | | | | | |
| | | | | | | 10,020,566 | |
| | | | | | | | |
| | | | | | | 41,807,699 | |
| | | | | | | | |
| | | | | | | | |
| | | |
| Real Estate–6.1% | | | | | | | | |
| Equity Real Estate Investment Trusts (REITs)–2.2% | | | | | |
AIMS AMP Capital Industrial REIT | | | 433,900 | | | | 447,041 | |
Allied Properties Real Estate Investment Trust | | | 64,782 | | | | 1,860,578 | |
alstria office REIT-AG(a) | | | 126,845 | | | | 1,742,107 | |
Ascendas Hospitality Trust | | | 876,700 | | | | 472,519 | |
Cominar Real Estate Investment Trust | | | 44,680 | | | | 519,697 | |
Emlak Konut Gayrimenkul Yatirim Ortakligi AS | | | 1,822,806 | | | | 1,847,680 | |
GDI Property Group | | | 650,600 | | | | 475,629 | |
Granite Real Estate Investment Trust (Toronto) | | | 61,418 | | | | 1,876,316 | |
Hamborner REIT AG | | | 40,901 | | | | 432,675 | |
Immobiliare Grande Distribuzione SIIQ SpA | | | 666,721 | | | | 502,414 | |
Intervest Offices & Warehouses NV | | | 17,681 | | | | 487,179 | |
Killam Apartment Real Estate Investment Trust | | | 121,425 | | | | 1,118,967 | |
Lippo Malls Indonesia Retail Trust | | | 1,765,600 | | | | 485,517 | |
Merlin Properties Socimi SA | | | 143,849 | | | | 1,703,332 | |
Prologis Property Mexico SA de CV | | | 291,020 | | | | 477,435 | |
| | | | | | | | |
| | | | | | | 14,449,086 | |
| | | | | | | | |
Schedule of Investments (continued)
| | | | | | | | |
| | | |
| Company | | Shares | | | U.S. $ Value | |
| | | | | | | | |
| Real Estate Management & Development–3.9% | | | | | |
Aeon Mall Co., Ltd. | | | 139,900 | | | $ | 2,209,703 | |
AP Thailand PCL (NVDR) | | | 3,767,500 | | | | 790,576 | |
CA Immobilien Anlagen AG(a) | | | 130,904 | | | | 2,495,616 | |
China Overseas Property Holdings Ltd. | | | 3,755,000 | | | | 783,279 | |
Colliers International Group, Inc. | | | 20,700 | | | | 868,897 | |
Corp. Inmobiliaria Vesta SAB de CV | | | 2,499,280 | | | | 3,444,127 | |
Daikyo, Inc. | | | 298,000 | | | | 540,409 | |
DIC Asset AG | | | 51,200 | | | | 517,050 | |
Dios Fastigheter AB | | | 50,782 | | | | 383,371 | |
Dongwon Development Co., Ltd. | | | 166,456 | | | | 732,915 | |
FirstService Corp. | | | 17,790 | | | | 827,429 | |
Inmobiliaria Colonial SA | | | 238,633 | | | | 1,735,692 | |
Korea Real Estate Investment & Trust Co., Ltd. | | | 94,320 | | | | 270,576 | |
Leopalace21 Corp. | | | 281,400 | | | | 1,859,703 | |
Nexity SA(a) | | | 99,957 | | | | 5,278,940 | |
Sansiri PCL (NVDR) | | | 14,756,000 | | | | 742,642 | |
Supalai PCL | | | 1,051,100 | | | | 737,135 | |
TLG Immobilien AG | | | 54,679 | | | | 1,234,198 | |
| | | | | | | | |
| | | | | | | 25,452,258 | |
| | | | | | | | |
| | | | | | | 39,901,344 | |
| | | | | | | | |
| | | | | | | | |
| | | |
| Financials–4.9% | | | | | | | | |
| Banks–1.8% | | | | | | | | |
Banco Macro SA (ADR) | | | 26,202 | �� | | | 2,050,306 | |
Bank Hapoalim BM | | | 470,279 | | | | 2,670,318 | |
Bank Pembangunan Daerah Jawa Barat Dan Banten Tbk PT | | | 6,622,500 | | | | 818,571 | |
BGEO Group PLC | | | 96,800 | | | | 3,643,569 | |
FinecoBank Banca Fineco SpA | | | 303,870 | | | | 1,761,627 | |
Tochigi Bank Ltd. (The) | | | 87,000 | | | | 353,297 | |
Toho Bank Ltd. (The) | | | 62,000 | | | | 218,224 | |
Towa Bank Ltd. (The) | | | 780,000 | | | | 688,820 | |
| | | | | | | | |
| | | | | | | 12,204,732 | |
| | | | | | | | |
| Capital Markets–0.9% | | | | | | | | |
Azimut Holding SpA | | | 76,406 | | | | 1,124,234 | |
Euronext NV(b) | | | 20,112 | | | | 858,156 | |
Flow Traders(b) | | | 81,575 | | | | 2,478,290 | |
Gluskin Sheff & Associates, Inc. | | | 64,986 | | | | 789,571 | |
IwaiCosmo Holdings, Inc. | | | 53,000 | | | | 462,778 | |
| | | | | | | | |
| | | | | | | 5,713,029 | |
| | | | | | | | |
| Consumer Finance–1.2% | | | | | | | | |
AEON Thana Sinsap Thailand PCL | | | 211,800 | | | | 609,727 | |
AEON Thana Sinsap Thailand PCL (NVDR) | | | 279,300 | | | | 804,046 | |
Credito Real SAB de CV SOFOM ER | | | 1,276,044 | | | | 2,191,481 | |
Gentera SAB de CV | | | 836,421 | | | | 1,511,099 | |
Hitachi Capital Corp. | | | 130,200 | | | | 2,768,302 | |
Jaccs Co., Ltd. | | | 44,000 | | | | 169,000 | |
| | | | | | | | |
| | | | | | | 8,053,655 | |
| | | | | | | | |
| Insurance–0.9% | | | | | | | | |
Anadolu Hayat Emeklilik AS | | | 1,088,809 | | | | 1,817,341 | |
esure Group PLC | | | 806,207 | | | | 3,172,513 | |
| | | | | | | | |
UNIQA Insurance Group AG | | | 105,255 | | | $ | 684,089 | |
| | | | | | | | |
| | | | | | | 5,673,943 | |
| | | | | | | | |
| Thrifts & Mortgage Finance–0.1% | |
Genworth MI Canada, Inc. | | | 29,721 | | | | 764,801 | |
| | | | | | | | |
| | | | | | | 32,410,160 | |
| | | | | | | | |
| | | | | | | | |
| | | |
| Utilities–2.5% | | | | | | | | |
| Gas Utilities–0.2% | | | | | | | | |
Ascopiave SpA | | | 235,340 | | | | 711,153 | |
Superior Plus Corp. | | | 81,977 | | | | 737,321 | |
| | | | | | | | |
| | | | | | | 1,448,474 | |
| | | | | | | | |
| Independent Power and Renewable Electricity Producers–0.4% | |
Electric Power Development Co., Ltd. | | | 106,100 | | | | 2,550,040 | |
| | | | | | | | |
| Multi-Utilities–0.1% | | | | | | | | |
Telecom Plus PLC | | | 46,510 | | | | 666,740 | |
| | | | | | | | |
| Water Utilities–1.8% | | | | | | | | |
Cia de Saneamento Basico do Estado de Sao Paulo | | | 411,500 | | | | 3,819,991 | |
CT Environmental Group Ltd. | | | 13,214,000 | | | | 3,854,311 | |
Pennon Group PLC | | | 338,582 | | | | 3,914,677 | |
| | | | | | | | |
| | | | | | | 11,588,979 | |
| | | | | | | | |
| | | | | | | 16,254,233 | |
| | | | | | | | |
| | | | | | | | |
| | | |
| Energy–2.4% | | | | | | | | |
| Energy Equipment & Services–0.8% | |
Pason Systems, Inc. | | | 45,087 | | | | 577,012 | |
Petrofac Ltd. | | | 307,873 | | | | 3,563,495 | |
ShawCor Ltd. | | | 36,460 | | | | 899,584 | |
| | | | | | | | |
| | | | | | | 5,040,091 | |
| | | | | | | | |
| Oil, Gas & Consumable Fuels–1.6% | |
Det Norske Oljeselskap ASA(a) | | | 285,079 | | | | 4,547,729 | |
Gran Tierra Energy, Inc.(a) | | | 843,990 | | | | 2,528,207 | |
Hankook Shell Oil Co., Ltd. | | | 1,579 | | | | 645,191 | |
Indo Tambangraya Megah Tbk PT | | | 436,500 | | | | 365,749 | |
Itochu Enex Co., Ltd. | | | 100,500 | | | | 773,679 | |
Parkland Fuel Corp. | | | 40,037 | | | | 943,896 | |
Saras SpA | | | 450,840 | | | | 717,359 | |
| | | | | | | | |
| | | | | | | 10,521,810 | |
| | | | | | | | |
| | | | | | | 15,561,901 | |
| | | | | | | | |
| | | | | | | | |
| |
| Telecommunication Services–1.8% | |
| Diversified Telecommunication Services–1.4% | |
B Communications Ltd. | | | 29,360 | | | | 689,053 | |
Com Hem Holding AB | | | 440,826 | | | | 4,068,115 | |
Hutchison Telecommunications Hong Kong Holdings Ltd. | | | 912,000 | | | | 310,391 | |
TalkTalk Telecom Group PLC | | | 202,970 | | | | 531,420 | |
TDC A/S(a) | | | 613,679 | | | | 3,614,185 | |
| | | | | | | | |
| | | | | | | 9,213,164 | |
| | | | | | | | |
| | | | | | | | |
| | | |
| Company | | Shares | | | U.S. $ Value | |
| | | | | | | | |
| Wireless Telecommunication Services–0.4% | |
SmarTone Telecommunications Holdings Ltd. | | | 386,000 | | | $ | 639,431 | |
XL Axiata Tbk PT(a) | | | 8,417,625 | | | | 1,745,199 | |
| | | | | | | | |
| | | | | | | 2,384,630 | |
| | | | | | | | |
| | | | | | | 11,597,794 | |
| | | | | | | | |
Total Common Stocks
(cost $553,463,220) | | | | | | | 614,430,205 | |
| | | | | | | | |
| | | | | | | | |
| | | |
| WARRANTS–2.7% | | | | | | | | |
| Financials–1.1% | |
| Consumer Finance–0.6% | |
Bharat Financial Inclusion Ltd.,
Merrill Lynch Intl & Co.,
expiring 11/05/18(a) | | | 274,938 | | | | 3,638,377 | |
Manappuram Finance Ltd.,
Merrill Lynch Intl & Co.,
expiring 1/10/19(a) | | | 113,620 | | | | 156,223 | |
| | | | | | | | |
| | | | | | | 3,794,600 | |
| | | | | | | | |
| Thrifts & Mortgage Finance–0.5% | |
LIC Housing Finance Ltd.,
Merrill Lynch Intl & Co.,
expiring 3/28/19(a) | | | 425,596 | | | | 3,701,652 | |
| | | | | | | | |
| | | | | | | 7,496,252 | |
| | | | | | | | |
| | | | | | | | |
| | | |
| Health Care–0.8% | | | | | | | | |
| Health Care Providers & Services–0.3% | |
Apollo Hospitals Enterprise Ltd.,
Merrill Lynch Intl & Co.,
expiring 6/28/18(a) | | | 120,260 | | | | 2,373,492 | |
| | | | | | | | |
| Pharmaceuticals–0.5% | | | | | | | | |
Aurobindo Pharma Ltd.,
Merrill Lynch Intl & Co.,
expiring 10/03/18(a) | | | 242,570 | | | | 3,118,181 | |
| | | | | | | | |
| | | | | | | 5,491,673 | |
| | | | | | | | |
| | | | | | | | |
| |
| Consumer Discretionary–0.5% | |
| Auto Components–0.5% | |
Apollo Tyres Ltd.,
Merrill Lynch Intl & Co.,
expiring 3/04/19(a) | | | 1,031,730 | | | | 3,410,041 | |
| | | | | | | | |
| | | | | | | | |
| |
| Materials–0.2% | |
| Chemicals–0.2% | | | | | | | | |
Berger Paints India Ltd.,
Merrill Lynch Intl & Co.,
expiring 8/23/21(a) | | | 219,040 | | | | 859,245 | |
Supreme Industries Ltd.,
Merrill Lynch Intl & Co.,
expiring 1/21/19(a) | | | 18,290 | | | | 248,003 | |
| | | | | | | | |
| | | | | | | 1,107,248 | |
| | | | | | | | |
| | | | | | | | |
| Information Technology–0.1% | |
| IT Services–0.1% | | | | | | | | |
Polaris Consulting & Services Ltd./India,
Merrill Lynch Intl & Co.,
expiring 8/23/21(a) | | | 33,944 | | | $ | 81,459 | |
Polaris Consulting & Services Ltd./India,
Merrill Lynch Intl & Co.,
expiring 5/23/18(a) | | | 195,323 | | | | 468,735 | |
| | | | | | | | |
| | | | | | | 550,194 | |
| | | | | | | | |
Total Warrants
(cost $15,115,246) | | | | | | | 18,055,408 | |
| | | | | | | | |
| | | | | | | | |
| |
| INVESTMENT COMPANIES–0.8% | |
| Funds and Investment Trusts–0.8% | |
iShares Core MSCI EAFE ETF | | | 79,970 | | | | 4,409,546 | |
iShares MSCI India ETF | | | 24,789 | | | | 729,044 | |
| | | | | | | | |
Total Investment Companies
(cost $5,012,050) | | | | | | | 5,138,590 | |
| | | | | | | | |
| | | | | | | | |
| |
| SHORT-TERM INVESTMENTS–2.0% | |
| Investment Companies–2.0% | |
AB Fixed Income Shares, Inc.–
Government Money Market Portfolio–
Class AB, 0.28%(c)(d)
(cost $13,548,561) | | | 13,548,561 | | | | 13,548,561 | |
| | | | | | | | |
Total Investments—98.8%
(cost $587,139,077) | | | | | | | 651,172,764 | |
| | |
Other assets less liabilities—1.2% | | | | | | | 7,589,352 | |
| | | | | | | | |
| Net Assets—100.0% | | | | | | $ | 658,762,116 | |
| | | | | | | | |
Schedule of Investments (continued)
| | | | | | | | | | | | | | | | | | | | | | | | |
| |
| FORWARD CURRENCY EXCHANGE CONTRACTS (see Note 3) | |
| Counterparty | | Contracts to
Deliver (000) | | | In Exchange For (000) | | | Settlement
Date | | | Unrealized Appreciation/ (Depreciation) | |
| | | | | | | | | | | | | | | | | | | | | | | | |
Bank of America, NA | | | CHF | | | | 4,073 | | | | USD | | | | 4,177 | | | | 12/15/16 | | | $ | (33,637 | ) |
Barclays Bank PLC | | | MXN | | | | 84,318 | | | | USD | | | | 4,550 | | | | 12/15/16 | | | | 235,603 | |
Barclays Bank PLC | | | USD | | | | 572 | | | | HKD | | | | 4,429 | | | | 12/15/16 | | | | (80 | ) |
Barclays Bank PLC | | | USD | | | | 2,192 | | | | ZAR | | | | 29,988 | | | | 12/15/16 | | | | (36,530 | ) |
Citibank, NA | | | EUR | | | | 21,410 | | | | USD | | | | 24,215 | | | | 12/15/16 | | | | 85,239 | |
Citibank, NA | | | SEK | | | | 21,000 | | | | USD | | | | 2,509 | | | | 12/15/16 | | | | 52,144 | |
Citibank, NA | | | USD | | | | 6,654 | | | | AUD | | | | 8,660 | | | | 12/15/16 | | | | (36,928 | ) |
Citibank, NA | | | USD | | | | 3,426 | | | | GBP | | | | 2,573 | | | | 12/15/16 | | | | (86,003 | ) |
Citibank, NA | | | USD | | | | 18,872 | | | | JPY | | | | 1,924,386 | | | | 12/15/16 | | | | 163,855 | |
Royal Bank of Scotland PLC | | | USD | | | | 502 | | | | AUD | | | | 654 | | | | 12/15/16 | | | | (1,862 | ) |
Royal Bank of Scotland PLC | | | USD | | | | 2,435 | | | | NZD | | | | 3,330 | | | | 12/15/16 | | | | (16,944 | ) |
Royal Bank of Scotland PLC | | | USD | | | | 3,531 | | | | SGD | | | | 4,746 | | | | 12/15/16 | | | | (49,311 | ) |
State Street Bank & Trust Co. | | | HKD | | | | 26,365 | | | | USD | | | | 3,401 | | | | 12/15/16 | | | | (257 | ) |
State Street Bank & Trust Co. | | | KRW | | | | 1,946,048 | | | | USD | | | | 1,777 | | | | 12/15/16 | | | | 11,012 | |
State Street Bank & Trust Co. | | | USD | | | | 4,835 | | | | CAD | | | | 6,244 | | | | 12/15/16 | | | | (72,871 | ) |
State Street Bank & Trust Co. | | | USD | | | | 4,229 | | | | CHF | | | | 4,073 | | | | 12/15/16 | | | | (17,966 | ) |
State Street Bank & Trust Co. | | | USD | | | | 3,042 | | | | NZD | | | | 4,105 | | | | 12/15/16 | | | | (61,663 | ) |
UBS AG | | | JPY | | | | 719,403 | | | | USD | | | | 7,171 | | | | 12/15/16 | | | | 54,761 | |
UBS AG | | | USD | | | | 4,166 | | | | EUR | | | | 3,714 | | | | 12/15/16 | | | | 19,791 | |
| | | | | | | | | | | | | | | | | | | | | | | | |
| | | | | | | | | | | | | | | | | | | | | | $ | 208,353 | |
| | | | | | | | | | | | | | | | | | | | | | | | |
| (a) | | Non-income producing security. |
| (b) | | Security is exempt from registration under Rule 144A of the Securities Act of 1933. These securities are considered restricted, but liquid and may be resold in transactions exempt from registration, normally to qualified institutional buyers. At September 30, 2016, the aggregate market value of these securities amounted to $32,985,150 or 5.0% of net assets. |
| (c) | | Investment in affiliated money market mutual fund. The rate shown represents the 7-day yield as of period end. |
| (d) | | To obtain a copy of the fund’s financial statements, please go to the Securities and Exchange Commission’s website at www.sec.gov, or call AB at (800) 227-4618. |
Currency Abbreviations:
AUD—Australian Dollar
CAD—Canadian Dollar
CHF—Swiss Franc
EUR—Euro
GBP—Great British Pound
HKD—Hong Kong Dollar
JPY—Japanese Yen
KRW—South Korean Won
MXN—Mexican Peso
NZD—New Zealand Dollar
SEK—Swedish Krona
SGD—Singapore Dollar
USD—United States Dollar
ZAR—South African Rand
Glossary:
ADR—American Depositary Receipt
EAFE—Europe, Australia, and Far East
ETF—Exchange Traded Fund
GDR—Global Depositary Receipt
MSCI—Morgan Stanley Capital International
NVDR—Non Voting Depositary Receipt
PJSC—Public Joint Stock Company
REIT—Real Estate Investment Trust
See notes to financial statements.
Schedule of Investments
Bernstein Fund, Inc.
Schedule of Investments
International Strategic Equities Portfolio
September 30, 2016
| | | | | | | | |
| Company | | Shares | | | U.S. $ Value | |
| | | | | | | | |
| COMMON STOCKS–97.5% | |
| Financials–17.0% | |
| Banks–8.8% | |
ABN AMRO Group NV (GDR)(a) | | | 772,520 | | | $ | 15,972,733 | |
DBS Group Holdings Ltd. | | | 1,227,900 | | | | 13,932,789 | |
Erste Group Bank AG(b) | | | 459,220 | | | | 13,598,279 | |
Itausa–Investimentos Itau SA (Preference Shares) | | | 7,649,680 | | | | 19,617,278 | |
KB Financial Group, Inc. | | | 431,660 | | | | 14,846,927 | |
Lloyds Banking Group PLC | | | 8,272,910 | | | | 5,844,928 | |
Mitsubishi UFJ Financial Group, Inc. | | | 2,944,100 | | | | 14,915,053 | |
Sumitomo Mitsui Trust Holdings, Inc. | | | 274,200 | | | | 8,958,550 | |
| | | | | | | | |
| | | | | | | 107,686,537 | |
| | | | | | | | |
| Capital Markets–4.7% | |
3i Group PLC | | | 1,688,170 | | | | 14,233,652 | |
IG Group Holdings PLC | | | 1,053,870 | | | | 11,891,449 | |
Partners Group Holding AG | | | 24,190 | | | | 12,221,650 | |
Singapore Exchange Ltd. | | | 2,035,400 | | | | 11,102,029 | |
Thomson Reuters Corp. | | | 198,830 | | | | 8,221,752 | |
| | | | | | | | |
| | | | | | | 57,670,532 | |
| | | | | | | | |
| Consumer Finance–0.2% | |
Samsung Card Co., Ltd. | | | 47,750 | | | | 2,181,305 | |
| | | | | | | | |
| Insurance–3.3% | |
Muenchener Rueckversicherungs-Gesellschaft AG in Muenchen (REG) | | | 96,100 | | | | 17,948,191 | |
NN Group NV | | | 742,000 | | | | 22,779,703 | |
| | | | | | | | |
| | | | | | | 40,727,894 | |
| | | | | | | | |
| | | | | | | 208,266,268 | |
| | | | | | | | |
| | | | | | | | |
| |
| Information Technology–13.4% | |
| Electronic Equipment, Instruments & Components–1.8% | |
Hon Hai Precision Industry Co., Ltd. | | | 3,481,500 | | | | 8,810,498 | |
Largan Precision Co., Ltd. | | | 104,300 | | | | 12,711,718 | |
| | | | | | | | |
| | | | | | | 21,522,216 | |
| | | | | | | | |
| Internet Software & Services–2.8% | |
Alibaba Group Holding Ltd. (Sponsored ADR)(b) | | | 114,460 | | | | 12,108,723 | |
NAVER Corp. | | | 11,810 | | | | 9,507,789 | |
Tencent Holdings Ltd. | | | 444,900 | | | | 12,369,116 | |
| | | | | | | | |
| | | | | | | 33,985,628 | |
| | | | | | | | |
| IT Services–1.1% | |
Fujitsu Ltd. | | | 2,538,000 | | | | 13,658,559 | |
| | | | | | | | |
| Semiconductors & Semiconductor Equipment–3.5% | |
ASML Holding NV | | | 125,910 | | | | 13,798,585 | |
Infineon Technologies AG | | | 790,660 | | | | 14,098,661 | |
| | | | | | | | |
Taiwan Semiconductor Manufacturing Co., Ltd. | | | 2,660,000 | | | $ | 15,635,856 | |
| | | | | | | | |
| | | | | | | 43,533,102 | |
| | | | | | | | |
| Software–1.9% | |
Constellation Software, Inc./Canada | | | 21,110 | | | | 9,516,275 | |
Mobileye NV(b) | | | 200,760 | | | | 8,546,353 | |
Oracle Corp. Japan | | | 102,900 | | | | 5,813,617 | |
| | | | | | | | |
| | | | | | | 23,876,245 | |
| | | | | | | | |
| Technology Hardware, Storage & Peripherals–2.3% | |
Samsung Electronics Co., Ltd. | | | 19,520 | | | | 28,435,993 | |
| | | | | | | | |
| | | | | | | 165,011,743 | |
| | | | | | | | |
| | | | | | | | |
| |
| Materials–10.1% | |
| Chemicals–5.2% | |
Arkema SA | | | 170,780 | | | | 15,811,192 | |
Asahi Kasei Corp. | | | 953,000 | | | | 7,594,612 | |
Covestro AG(a) | | | 438,580 | | | | 25,954,306 | |
Johnson Matthey PLC | | | 346,200 | | | | 14,766,904 | |
| | | | | | | | |
| | | | | | | 64,127,014 | |
| | | | | | | | |
| Construction Materials–1.0% | |
Fletcher Building Ltd. | | | 1,532,530 | | | | 12,005,578 | |
| | | | | | | | |
| Metals & Mining–3.3% | |
Fortescue Metals Group Ltd. | | | 4,089,890 | | | | 15,654,361 | |
Goldcorp, Inc. | | | 687,690 | | | | 11,348,366 | |
Novolipetsk Steel PJSC (GDR)(a) | | | 398,100 | | | | 5,174,622 | |
South32 Ltd. | | | 4,524,870 | | | | 8,430,820 | |
| | | | | | | | |
| | | | | | | 40,608,169 | |
| | | | | | | | |
| Paper & Forest Products–0.6% | |
Nine Dragons Paper Holdings Ltd. | | | 7,944,000 | | | | 7,490,702 | |
| | | | | | | | |
| | | | | | | 124,231,463 | |
| | | | | | | | |
| | | | | | | | |
| |
| Consumer Discretionary–10.1% | |
| Automobiles–3.0% | |
Dongfeng Motor Group Co., Ltd.–Class H | | | 574,000 | | | | 578,849 | |
Mazda Motor Corp. | | | 951,300 | | | | 14,594,619 | |
Peugeot SA(b) | | | 1,418,320 | | | | 21,658,843 | |
| | | | | | | | |
| | | | | | | 36,832,311 | |
| | | | | | | | |
| Diversified Consumer Services–2.3% | |
New Oriental Education & Technology Group, Inc. (Sponsored ADR)(b) | | | 206,930 | | | | 9,593,275 | |
TAL Education Group (ADR)(b) | | | 264,670 | | | | 18,749,222 | |
| | | | | | | | |
| | | | | | | 28,342,497 | |
| | | | | | | | |
| Household Durables–0.7% | |
Auto Trader Group PLC(a) | | | 1,682,480 | | | | 8,844,744 | |
| | | | | | | | |
| Leisure Products–0.6% | |
Bandai Namco Holdings, Inc. | | | 243,900 | | | | 7,465,312 | |
| | | | | | | | |
| Multiline Retail–0.5% | |
Lojas Renner SA | | | 763,400 | | | | 5,744,015 | |
| | | | | | | | |
Schedule of Investments (continued)
| | | | | | | | |
| | | |
| Company | | Shares | | | U.S. $ Value | |
| | | | | | | | |
| Specialty Retail–2.2% | |
Kingfisher PLC | | | 1,667,050 | | | $ | 8,133,637 | |
Shimamura Co., Ltd. | | | 76,100 | | | | 9,264,517 | |
Yamada Denki Co., Ltd. | | | 2,008,100 | | | | 9,960,329 | |
| | | | | | | | |
| | | | | | | 27,358,483 | |
| | | | | | | | |
| Textiles, Apparel & Luxury Goods–0.8% | |
Yue Yuen Industrial Holdings Ltd. | | | 2,181,000 | | | | 9,013,735 | |
| | | | | | | | |
| | | | | | | 123,601,097 | |
| | | | | | | | |
| | | | | | | | |
| |
| Industrials–9.8% | |
| Aerospace & Defense–2.9% | |
Saab AB–Class B | | | 254,020 | | | | 9,043,978 | |
Safran SA | | | 366,130 | | | | 26,332,816 | |
| | | | | | | | |
| | | | | | | 35,376,794 | |
| | | | | | | | |
| Airlines–0.7% | |
Qantas Airways Ltd. | | | 3,640,678 | | | | 8,744,226 | |
| | | | | | | | |
| Construction & Engineering–0.5% | |
Hyundai Engineering & Construction Co., Ltd. | | | 175,510 | | | | 6,316,137 | |
| | | | | | | | |
| Electrical Equipment–1.0% | |
Nidec Corp. | | | 132,100 | | | | 12,210,416 | |
| | | | | | | | |
| Industrial Conglomerates–2.5% | |
Jardine Strategic Holdings Ltd. | | | 555,200 | | | | 18,199,120 | |
Siemens AG (REG) | | | 104,220 | | | | 12,220,857 | |
| | | | | | | | |
| | | | | | | 30,419,977 | |
| | | | | | | | |
| Professional Services–0.9% | |
RELX NV | | | 650,940 | | | | 11,643,217 | |
| | | | | | | | |
| Road & Rail–1.3% | |
Central Japan Railway Co. | | | 94,260 | | | | 16,137,776 | |
| | | | | | | | |
| | | | | | | 120,848,543 | |
| | | | | | | | |
| | | | | | | | |
| |
| Consumer Staples–9.5% | |
| Food & Staples Retailing–4.5% | |
Axfood AB | | | 342,660 | | | | 6,049,319 | |
Loblaw Cos., Ltd. | | | 325,240 | | | | 16,733,641 | |
Metro, Inc. | | | 332,920 | | | | 10,929,429 | |
Tsuruha Holdings, Inc. | | | 188,300 | | | | 21,767,575 | |
| | | | | | | | |
| | | | | | | 55,479,964 | |
| | | | | | | | |
| Food Products–2.6% | |
JBS SA | | | 2,565,800 | | | | 9,325,448 | |
WH Group Ltd.(a) | | | 28,384,000 | | | | 22,941,158 | |
| | | | | | | | |
| | | | | | | 32,266,606 | |
| | | | | | | | |
| Household Products–1.8% | |
Reckitt Benckiser Group PLC | | | 227,640 | | | | 21,431,127 | |
| | | | | | | | |
| Tobacco–0.6% | |
Imperial Brands PLC | | | 149,660 | | | | 7,703,092 | |
| | | | | | | | |
| | | | | | | 116,880,789 | |
| | | | | | | | |
| | | | | | | | |
| Energy–7.3% | |
| Oil, Gas & Consumable Fuels–7.3% | |
China Petroleum & Chemical Corp.–Class H | | | 17,474,000 | | | $ | 12,900,358 | |
JX Holdings, Inc. | | | 5,542,300 | | | | 22,432,785 | |
LUKOIL PJSC (Sponsored ADR) | | | 509,180 | | | | 24,813,725 | |
Royal Dutch Shell PLC–Class B | | | 465,830 | | | | 12,076,956 | |
TOTAL SA | | | 179,395 | | | | 8,532,127 | |
Woodside Petroleum Ltd. | | | 412,360 | | | | 9,143,155 | |
| | | | | | | | |
| | | | | | | 89,899,106 | |
| | | | | | | | |
| | | | | | | | |
| | | |
| Health Care–6.9% | | | | | | | | |
| Biotechnology–1.3% | | | | | | | | |
Actelion Ltd. (REG)(b) | | | 88,650 | | | | 15,383,782 | |
| | | | | | | | |
| Health Care Equipment & Supplies–0.9% | | | | | |
Coloplast A/S–Class B | | | 133,360 | | | | 10,371,578 | |
| | | | | | | | |
| Health Care Providers & Services–0.4% | | | | | | | | |
Odontoprev SA | | | 1,350,300 | | | | 5,368,565 | |
| | | | | | | | |
| | | | | | | | |
| Pharmaceuticals–4.3% | | | | | | | | |
Novo Nordisk A/S–Class B | | | 353,100 | | | | 14,716,745 | |
Recordati SpA | | | 491,310 | | | | 15,790,556 | |
Roche Holding AG | | | 48,520 | | | | 12,057,143 | |
Sanofi | | | 139,490 | | | | 10,622,288 | |
| | | | | | | | |
| | | | | | | 53,186,732 | |
| | | | | | | | |
| | | | | | | 84,310,657 | |
| | | | | | | | |
| | | | | | | | |
| | | |
| Real Estate–5.9% | | | | | | | | |
| Equity Real Estate Investment Trusts (REITs)–1.2% | | | | | |
CapitaLand Commercial Trust | | | 7,783,600 | | | | 9,103,267 | |
Goodman Group | | | 1,021,620 | | | | 5,725,855 | |
| | | | | | | | |
| | | | | | | 14,829,122 | |
| | | | | | | | |
| Real Estate Management & Development–4.7% | | | | | |
Cheung Kong Property Holdings Ltd. | | | 2,095,500 | | | | 15,414,193 | |
New World Development Co., Ltd. | | | 9,357,000 | | | | 12,269,766 | |
Sino Land Co., Ltd. | | | 6,790,000 | | | | 12,102,008 | |
UOL Group Ltd. | | | 2,041,400 | | | | 8,437,936 | |
Wharf Holdings Ltd. (The) | | | 1,261,000 | | | | 9,251,417 | |
| | | | | | | | |
| | | | | | | 57,475,320 | |
| | | | | | | | |
| | | | | | | 72,304,442 | |
| | | | | | | | |
| | | | | | | | |
| | | |
| Utilities–3.9% | | | | | | | | |
| Electric Utilities–3.1% | | | | | | | | |
Centrais Eletricas Brasileiras SA(b) | | | 989,900 | | | | 5,862,421 | |
Cia de Transmissao de Energia Eletrica Paulista (Preference Shares) | | | 138,200 | | | | 2,804,668 | |
EDP–Energias de Portugal SA | | | 4,658,740 | | | | 15,634,755 | |
Equatorial Energia SA | | | 336,700 | | | | 5,209,706 | |
Korea Electric Power Corp. | | | 174,240 | | | | 8,535,358 | |
| | | | | | | | |
| | | | | | | 38,046,908 | |
| | | | | | | | |
| | | | | | | | |
| | | |
| Company | | Shares | | | U.S. $ Value | |
| | | | | | | | |
| Multi-Utilities–0.8% | | | | | | | | |
AGL Energy Ltd. | | | 691,630 | | | $ | 10,125,674 | |
| | | | | | | | |
| | | | | | | 48,172,582 | |
| | | | | | | | |
| | | | | | | | |
| | | |
| Telecommunication Services–3.6% | | | | | | | | |
| Diversified Telecommunication Services–3.6% | | | | | |
KT Corp. | | | 48,140 | | | | 1,396,822 | |
KT Corp. (Sponsored ADR) | | | 866,627 | | | | 13,909,364 | |
Nippon Telegraph & Telephone Corp. | | | 634,400 | | | | 29,014,889 | |
| | | | | | | | |
| | | | | | | 44,321,075 | |
| | | | | | | | |
Total Common Stocks (cost $1,115,626,291) | | | | | | | 1,197,847,765 | |
| | | | | | | | |
| | | | | | | | |
| SHORT-TERM INVESTMENTS–2.6% | |
| Investment Companies–2.6% | | | | | | | | |
AB Fixed Income Shares, Inc.–
Government Money Market Portfolio–Class AB, 0.28%(c)(d)
(cost $31,905,295) | | | 31,905,295 | | | $ | 31,905,295 | |
| | | | | | | | |
Total Investments—100.1%
(cost $1,147,531,586) | | | | | | | 1,229,753,060 | |
| | |
Other assets less liabilities—(0.1)% | | | | | | | (1,290,472 | ) |
| | | | | | | | |
| Net Assets—100.0% | | | | | | $ | 1,228,462,588 | |
| | | | | | | | |
| | | | | | | | | | | | | | | | | | |
| |
| FUTURES (see Note 3) | |
| Type | | Number of Contracts | | | Expiration Month | | Original Value | | | Value at September 30, 2016 | | | Unrealized Appreciation/ (Depreciation) | |
| Purchased Contracts | | | | | | | | | | | | |
Mini MSCI EAFE Futures | | | 160 | | | December 2016 | | $ | 13,871,554 | | | $ | 13,653,600 | | | $ | (217,954) | |
Mini MSCI Emerging Market Futures | | | 82 | | | December 2016 | | | 3,819,534 | | | | 3,741,250 | | | | (78,284 | ) |
| | | | | | | | | | | | | | | | | | |
| | | | | | | | | | | | | | | | $ | (296,238 | ) |
| | | | | | | | | | | | | | | | | | |
| | | | | | | | | | | | | | | | | | | | | | | | |
| |
| FORWARD CURRENCY EXCHANGE CONTRACTS (see Note 3) | |
| Counterparty | | Contracts to
Deliver
(000) | | | In Exchange
For
(000) | | | Settlement
Date | | | Unrealized Appreciation/
(Depreciation) | |
| | | | | | | | | | | | | | | | | | | | | | | | |
Bank of America, NA | | | USD | | | | 40,092 | | | | GBP | | | | 30,135 | | | | 10/19/16 | | | $ | (1,019,487 | ) |
Bank of America, NA | | | USD | | | | 2,380 | | | | SEK | | | | 19,948 | | | | 10/19/16 | | | | (52,639 | ) |
Barclays Bank PLC | | | HKD | | | | 498,173 | | | | USD | | | | 64,247 | | | | 10/19/16 | | | | 10,383 | |
Barclays Bank PLC | | | KRW | | | | 35,860,255 | | | | USD | | | | 32,773 | | | | 10/19/16 | | | | 226,176 | |
Barclays Bank PLC | | | SGD | | | | 46,497 | | | | USD | | | | 34,576 | | | | 10/19/16 | | | | 475,295 | |
Barclays Bank PLC | | | USD | | | | 26,635 | | | | CHF | | | | 25,748 | | | | 10/19/16 | | | | (108,177 | ) |
Citibank, NA | | | BRL | | | | 66,322 | | | | USD | | | | 20,431 | | | | 10/04/16 | | | | 37,379 | |
Citibank, NA | | | USD | | | | 20,467 | | | | BRL | | | | 66,322 | | | | 10/04/16 | | | | (73,316 | ) |
Citibank, NA | | | EUR | | | | 5,116 | | | | USD | | | | 5,751 | | | | 10/19/16 | | | | 368 | |
Citibank, NA | | | GBP | | | | 3,723 | | | | USD | | | | 4,880 | | | | 10/19/16 | | | | 52,903 | |
Citibank, NA | | | KRW | | | | 5,156,672 | | | | USD | | | | 4,618 | | | | 10/19/16 | | | | (62,431 | ) |
Citibank, NA | | | USD | | | | 3,065 | | | | GBP | | | | 2,312 | | | | 10/19/16 | | | | (67,056 | ) |
Citibank, NA | | | USD | | | | 2,502 | | | | ILS | | | | 9,443 | | | | 10/19/16 | | | | 19,457 | |
Citibank, NA | | | USD | | | | 4,120 | | | | MXN | | | | 78,900 | | | | 10/19/16 | | | | (57,503 | ) |
Citibank, NA | | | USD | | | | 3,031 | | | | SGD | | | | 4,103 | | | | 10/19/16 | | | | (21,739 | ) |
Citibank, NA | | | USD | | | | 18,195 | | | | ZAR | | | | 256,913 | | | | 10/19/16 | | | | 474,181 | |
Citibank, NA | | | BRL | | | | 66,322 | | | | USD | | | | 20,299 | | | | 11/03/16 | | | | 78,827 | |
Citibank, NA | | | HKD | | | | 31,150 | | | | USD | | | | 4,018 | | | | 11/16/16 | | | | 34 | |
Morgan Stanley & Co., Inc. | | | BRL | | | | 51,469 | | | | USD | | | | 15,704 | | | | 10/04/16 | | | | (122,408 | ) |
Morgan Stanley & Co., Inc. | | | USD | | | | 15,855 | | | | BRL | | | | 51,469 | | | | 10/04/16 | | | | (29,008 | ) |
Morgan Stanley & Co., Inc. | | | EUR | | | | 7,802 | | | | USD | | | | 8,753 | | | | 10/19/16 | | | | (17,647 | ) |
Morgan Stanley & Co., Inc. | | | USD | | | | 9,746 | | | | AUD | | | | 12,752 | | | | 10/19/16 | | | | 11,111 | |
Morgan Stanley & Co., Inc. | | | USD | | | | 3,539 | | | | EUR | | | | 3,153 | | | | 10/19/16 | | | | 5,290 | |
Morgan Stanley & Co., Inc. | | | USD | | | | 3,032 | | | | ILS | | | | 11,386 | | | | 10/19/16 | | | | 7,567 | |
Morgan Stanley & Co., Inc. | | | USD | | | | 15,479 | | | | JPY | | | | 1,582,578 | | | | 10/19/16 | | | | 136,611 | |
Schedule of Investments (continued)
| | | | | | | | | | | | | | | | | | | | | | | | |
| Counterparty | | Contracts to
Deliver
(000) | | | In Exchange
For
(000) | | | Settlement
Date | | | Unrealized Appreciation/
(Depreciation) | |
| | | | | | | | | | | | | | | | | | | | | | | | |
Morgan Stanley & Co., Inc. | | | USD | | | | 5,145 | | | | NOK | | | | 41,410 | | | | 11/16/16 | | | $ | 35,281 | |
Morgan Stanley & Co., Inc. | | | USD | | | | 2,120 | | | | SEK | | | | 18,151 | | | | 11/16/16 | | | | (68 | ) |
Royal Bank of Scotland PLC | | | BRL | | | | 14,853 | | | | USD | | | | 4,551 | | | | 10/04/16 | | | | (15,884 | ) |
Royal Bank of Scotland PLC | | | USD | | | | 4,576 | | | | BRL | | | | 14,853 | | | | 10/04/16 | | | | (8,371 | ) |
Royal Bank of Scotland PLC | | | AUD | | | | 8,278 | | | | USD | | | | 6,349 | | | | 10/19/16 | | | | 15,494 | |
Royal Bank of Scotland PLC | | | KRW | | | | 12,843,923 | | | | USD | | | | 11,676 | | | | 10/19/16 | | | | 19,116 | |
Royal Bank of Scotland PLC | | | TWD | | | | 534,361 | | | | USD | | | | 17,127 | | | | 10/19/16 | | | | 35,425 | |
Royal Bank of Scotland PLC | | | TWD | | | | 107,478 | | | | USD | | | | 3,425 | | | | 10/19/16 | | | | (12,635 | ) |
Royal Bank of Scotland PLC | | | USD | | | | 7,526 | | | | AUD | | | | 9,776 | | | | 10/19/16 | | | | (45,846 | ) |
Royal Bank of Scotland PLC | | | USD | | | | 14,330 | | | | CAD | | | | 18,499 | | | | 10/19/16 | | | | (228,271 | ) |
Royal Bank of Scotland PLC | | | USD | | | | 7,156 | | | | IDR | | | | 93,701,609 | | | | 10/19/16 | | | | 30,505 | |
Royal Bank of Scotland PLC | | | USD | | | | 2,613 | | | | INR | | | | 175,599 | | | | 10/19/16 | | | | 18,339 | |
Royal Bank of Scotland PLC | | | USD | | | | 5,934 | | | | MXN | | | | 109,311 | | | | 10/19/16 | | | | (306,745 | ) |
Royal Bank of Scotland PLC | | | USD | | | | 8,936 | | | | TWD | | | | 282,881 | | | | 10/19/16 | | | | 111,569 | |
Royal Bank of Scotland PLC | | | USD | | | | 11,505 | | | | TWD | | | | 358,958 | | | | 10/19/16 | | | | (23,797 | ) |
Royal Bank of Scotland PLC | | | USD | | | | 7,579 | | | | CHF | | | | 7,344 | | | | 11/16/16 | | | | (973 | ) |
Royal Bank of Scotland PLC | | | USD | | | | 1,964 | | | | GBP | | | | 1,507 | | | | 11/16/16 | | | | (8,790 | ) |
Royal Bank of Scotland PLC | | | USD | | | | 2,165 | | | | SEK | | | | 18,519 | | | | 11/16/16 | | | | (1,336 | ) |
State Street Bank & Trust Co. | | | AUD | | | | 9,776 | | | | USD | | | | 7,349 | | | | 10/19/16 | | | | (130,731 | ) |
State Street Bank & Trust Co. | | | HKD | | | | 23,759 | | | | USD | | | | 3,066 | | | | 10/19/16 | | | | 2,068 | |
State Street Bank & Trust Co. | | | JPY | | | | 890,791 | | | | USD | | | | 8,810 | | | | 10/19/16 | | | | 19,863 | |
State Street Bank & Trust Co. | | | USD | | | | 2,658 | | | | EUR | | | | 2,350 | | | | 10/19/16 | | | | (15,916 | ) |
State Street Bank & Trust Co. | | | USD | | | | 1,711 | | | | HKD | | | | 13,267 | | | | 10/19/16 | | | | (267 | ) |
State Street Bank & Trust Co. | | | USD | | | | 20,964 | | | | INR | | | | 1,398,911 | | | | 10/19/16 | | | | (524 | ) |
State Street Bank & Trust Co. | | | USD | | | | 6,680 | | | | KRW | | | | 7,344,924 | | | | 10/19/16 | | | | (13,361 | ) |
State Street Bank & Trust Co. | | | USD | | | | 4,736 | | | | MYR | | | | 19,252 | | | | 10/19/16 | | | | (72,129 | ) |
State Street Bank & Trust Co. | | | NZD | | | | 14,285 | | | | USD | | | | 10,376 | | | | 11/16/16 | | | | (7,210 | ) |
State Street Bank & Trust Co. | | | USD | | | | 2,557 | | | | GBP | | | | 1,968 | | | | 11/16/16 | | | | (3,767 | ) |
| | | | | | | | | | | | | | | | | | | | | | | | |
| | | $ | (704,790 | ) |
| | | | | | | | | | | | | | | | | | | | | | | | |
| (a) | | Security is exempt from registration under Rule 144A of the Securities Act of 1933. These securities are considered restricted, but liquid and may be resold in transactions exempt from registration, normally to qualified institutional buyers. At September 30, 2016, the aggregate market value of these securities amounted to $78,887,563 or 6.4% of net assets. |
| (b) | | Non-income producing security. |
| (c) | | Investment in affiliated money market mutual fund. The rate shown represents the 7-day yield as of period end. |
| (d) | | To obtain a copy of the fund’s financial statements, please go to the Securities and Exchange Commission’s website at www.sec.gov, or call AB at (800) 227-4618. |
Currency Abbreviations:
AUD—Australian Dollar
BRL—Brazilian Real
CAD—Canadian Dollar
CHF—Swiss Franc
EUR—Euro
GBP—Great British Pound
HKD—Hong Kong Dollar
IDR—Indonesian Rupiah
ILS—Israeli Shekel
INR—Indian Rupee
JPY—Japanese Yen
KRW—South Korean Won
MXN—Mexican Peso
MYR—Malaysian Ringgit
NOK—Norwegian Krone
NZD—New Zealand Dollar
SEK—Swedish Krona
SGD—Singapore Dollar
TWD—New Taiwan Dollar
USD—United States Dollar
ZAR—South African Rand
Glossary:
ADR—American Depositary Receipt
EAFE—Europe, Australia, and Far East
GDR—Global Depositary Receipt
MSCI—Morgan Stanley Capital International
PJSC—Public Joint Stock Company
REG—Registered Shares
See notes to financial statements.
Statement of Assets and Liabilities—September 30, 2016
| | | | | | | | | | | | |
| | | SMALL CAP CORE
PORTFOLIO | | | INTERNATIONAL
SMALL CAP
PORTFOLIO | | | INTERNATIONAL
STRATEGIC EQUITIES
PORTFOLIO | |
| ASSETS | | | | | | | | | | | | |
Investments in securities at value | | | | | | | | | | | | |
Unaffiliated issuers | | $ | 719,886,111 | | | $ | 637,624,203 | | | $ | 1,197,847,765 | |
Affiliated issuers | | | 12,157,406 | | | | 13,548,561 | | | | 31,905,295 | |
Foreign currencies, at value (a) | | | 0 | | | | 2,975,700 | | | | 3,618,631 | |
Cash | | | 0 | | | | 1,213,530 | | | | 0 | �� |
Cash collateral due from broker | | | 2,226,070 | | | | 0 | | | | 919,600 | |
Receivables: | | | | | | | | | | | | |
Unaffiliated dividends and interest | | | 831,676 | | | | 1,039,331 | | | | 3,809,115 | |
Affiliated dividends | | | 4,099 | | | | 3,239 | | | | 6,175 | |
Foreign withholding tax reclaims | | | 0 | | | | 378,680 | | | | 926,226 | |
Investment securities sold and foreign currency transactions | | | 0 | | | | 11,631,912 | | | | 3,121,605 | |
Capital shares sold | | | 1,281,997 | | | | 1,877,905 | | | | 3,331,834 | |
Margin due from broker on exchange-traded derivatives | | | 415,030 | | | | 0 | | | | 143,760 | |
Unrealized appreciation of forward currency exchange contracts | | | 0 | | | | 622,405 | | | | 1,823,242 | |
Prepaid expenses | | | 25,457 | | | | 23,219 | | | | 23,194 | |
| | | | | | | | | | | | |
Total assets | | | 736,827,846 | | | | 670,938,685 | | | | 1,247,476,442 | |
| | | | | | | | | | | | |
| LIABILITIES | | | | | | | | | | | | |
Payables: | | | | | | | | | | | | |
Investment securities purchased and foreign currency transactions | | | 463,790 | | | | 10,688,285 | | | | 14,951,558 | |
Management fee | | | 517,697 | | | | 387,847 | | | | 668,352 | |
Capital shares redeemed | | | 188,245 | | | | 443,666 | | | | 600,532 | |
Transfer Agent fee | | | 16,767 | | | | 7,666 | | | | 7,664 | |
Shareholder servicing fee | | | 941 | | | | 7,222 | | | | 13,456 | |
Accrued expenses | | | 128,357 | | | | 227,831 | | | | 244,260 | |
Unrealized depreciation of forward currency exchange contracts | | | 0 | | | | 414,052 | | | | 2,528,032 | |
| | | | | | | | | | | | |
Total liabilities | | | 1,315,797 | | | | 12,176,569 | | | | 19,013,854 | |
| | | | | | | | | | | | |
NET ASSETS | | $ | 735,512,049 | | | $ | 658,762,116 | | | $ | 1,228,462,588 | |
| | | | | | | | | | | | |
Cost of investments | | | | | | | | | | | | |
Unaffiliated issuers | | $ | 678,869,061 | | | $ | 573,590,516 | | | $ | 1,115,626,291 | |
Affiliated issuers | | $ | 12,157,406 | | | $ | 13,548,561 | | | $ | 31,905,295 | |
| NET ASSETS CONSIST OF: | | | | | | | | | | | | |
Capital stock, at par | | $ | 6,965 | | | $ | 6,029 | | | $ | 11,616 | |
Additional paid-in capital | | | 697,685,212 | | | | 581,977,796 | | | | 1,130,622,601 | |
Undistributed net investment income | | | 833,238 | | | | 7,741,576 | | | | 13,115,127 | |
Accumulated net realized gain (loss) on investment transactions and foreign currency transactions | | | (4,539,159 | ) | | | 4,853,745 | | | | 3,456,333 | |
Net unrealized appreciation/depreciation of: | | | | | | | | | | | | |
Investments and futures transactions (b) | | | 41,525,793 | | | | 63,974,162 | | | | 81,925,236 | |
Foreign currency denominated assets and liabilities | | | 0 | | | | 208,808 | | | | (668,325 | ) |
| | | | | | | | | | | | |
| | $ | 735,512,049 | | | $ | 658,762,116 | | | $ | 1,228,462,588 | |
| | | | | | | | | | | | |
(a) Cost: $0, $2,969,886 and $3,618,118, respectively. (Note 1)
(b) Net of accrued foreign capital gains taxes of $0, $59,525 and $0, respectively.
See Notes to Financial Statements.
Statement of Assets and Liabilities—September 30, 2016 (continued)
| | | | | | | | | | | | |
| | | SMALL CAP CORE
PORTFOLIO | | | INTERNATIONAL
SMALL CAP
PORTFOLIO | | | INTERNATIONAL
STRATEGIC EQUITIES
PORTFOLIO | |
| | |
| CALCULATION OF MAXIMUM OFFERING PRICE | | | | | | | | | |
SCB Class Shares | | | | | | | | | | | | |
Net Assets | | $ | 4,870,086 | | | $ | 37,226,389 | | | $ | 68,976,969 | |
Shares of capital stock outstanding | | | 461,908 | | | | 3,409,938 | | | | 6,528,258 | |
| | | | | | | | | | | | |
Net asset value and offering price per share | | $ | 10.54 | | | $ | 10.92 | | | $ | 10.57 | |
| | | | | | | | | | | | |
Advisor Class Shares | | | | | | | | | | | | |
Net Assets | | $ | 603,861,725 | | | $ | 367,467,644 | | | $ | 737,764,438 | |
Shares of capital stock outstanding | | | 57,185,947 | | | | 33,629,449 | | | | 69,785,133 | |
| | | | | | | | | | | | |
Net asset value and offering price per share | | $ | 10.56 | | | $ | 10.93 | | | $ | 10.57 | |
| | | | | | | | | | | | |
Class Z Shares | | | | | | | | | | | | |
Net Assets | | $ | 126,780,238 | | | $ | 254,068,083 | | | $ | 421,721,181 | |
Shares of capital stock outstanding | | | 12,006,217 | | | | 23,252,748 | | | | 39,844,955 | |
| | | | | | | | | | | | |
Net asset value and offering price per share | | $ | 10.56 | | | $ | 10.93 | | | $ | 10.58 | |
| | | | | | | | | | | | |
See Notes to Financial Statements.
Statement of Operations
| | | | | | | | | | | | |
| | | SMALL CAP CORE
PORTFOLIO(a) | | | INTERNATIONAL
SMALL CAP
PORTFOLIO(b) | | | INTERNATIONAL
STRATEGIC EQUITIES
PORTFOLIO(b) | |
| | | |
| INVESTMENT INCOME | | | | | | | | | | | | |
Income: | | | | | | | | | | | | |
Dividends | | | | | | | | | | | | |
Unaffiliated issuers (c) | | $ | 2,479,982 | | | $ | 9,964,320 | | | $ | 23,700,046 | |
Affiliated issuers | | | 10,962 | | | | 30,472 | | | | 60,801 | |
| | | | | | | | | | | | |
Total income | | | 2,490,944 | | | | 9,994,792 | | | | 23,760,847 | |
| | | | | | | | | | | | |
Expenses: | | | | | | | | | | | | |
Management fee (see Note 2A) | | | 1,296,161 | | | | 3,350,221 | | | | 5,609,393 | |
Shareholder servicing fee (see Note 2B) | | | 4,363 | | | | 27,386 | | | | 52,704 | |
Custodian fee | | | 91,470 | | | | 217,330 | | | | 233,090 | |
Transfer Agent fee—Non-Retail Class | | | 1,868 | | | | 5,322 | | | | 4,530 | |
Transfer Agent fee—Advisor Class | | | 159,177 | | | | 62,971 | | | | 58,128 | |
Transfer Agent fee—Class Z | | | 5,511 | | | | 29,069 | | | | 45,810 | |
Organizational and offering expense | | | 124,029 | | | | 126,377 | | | | 126,292 | |
Registration fees | | | 93,119 | | | | 187,921 | | | | 273,138 | |
Administrative | | | 49,140 | | | | 49,140 | | | | 49,140 | |
Printing fees | | | 35,421 | | | | 43,039 | | | | 25,839 | |
Auditing and tax fees | | | 31,236 | | | | 34,943 | | | | 34,943 | |
Legal fees | | | 8,234 | | | | 13,077 | | | | 26,887 | |
Directors’ fees and expenses | | | 3,580 | | | | 9,201 | | | | 17,380 | |
Miscellaneous | | | 13,723 | | | | 29,181 | | | | 37,530 | |
| | | | | | | | | | | | |
Total expenses | | | 1,917,032 | | | | 4,185,178 | | | | 6,594,804 | |
Less: expenses waived and reimbursed by the Manager (see Note 2A) | | | (217,429 | ) | | | (479,741 | ) | | | (797,984 | ) |
| | | | | | | | | | | | |
Net expenses | | | 1,699,603 | | | | 3,705,437 | | | | 5,796,820 | |
| | | | | | | | | | | | |
Net investment income | | | 791,341 | | | | 6,289,355 | | | | 17,964,027 | |
| | | | | | | | | | | | |
| | | |
| REALIZED AND UNREALIZED GAIN (LOSS) ON INVESTMENT AND FOREIGN CURRENCY TRANSACTIONS | | | | | | | | | | | | |
Net realized gain (loss) on: | | | | | | | | | | | | |
Investment transactions (d) | | | (4,922,285 | ) | | | 5,349,457 | | | | (232,459 | ) |
Futures | | | 383,126 | | | | 0 | | | | 4,419,875 | |
Foreign currency transactions | | | 0 | | | | 914,633 | | | | (5,618,915 | ) |
| | | | | | | | | | | | |
Net realized gain (loss) on investment transactions and foreign currency transactions | | | (4,539,159 | ) | | | 6,264,090 | | | | (1,431,499 | ) |
| | | | | | | | | | | | |
Net change in unrealized appreciation/depreciation of: | | | | | | | | | | | | |
Investments (e) | | | 41,017,050 | | | | 63,974,162 | | | | 82,221,474 | |
Futures | | | 508,743 | | | | 0 | | | | (296,238 | ) |
Foreign currency denominated assets and liabilities | | | 0 | | | | 208,808 | | | | (668,325 | ) |
| | | | | | | | | | | | |
Net change in unrealized appreciation of investments and foreign currency denominated assets and liabilities | | | 41,525,793 | | | | 64,182,970 | | | | 81,256,911 | |
| | | | | | | | | | | | |
Net realized and unrealized gain on investment transactions and foreign currency transactions | | | 36,986,634 | | | | 70,447,060 | | | | 79,825,412 | |
| | | | | | | | | | | | |
Net increase in net assets resulting from operations | | $ | 37,777,975 | | | $ | 76,736,415 | | | $ | 97,789,439 | |
| | | | | | | | | | | | |
(a) For the period December 29, 2015 (commencement of operations) to September 30, 2016.
(b) For the period December 21, 2015 (commencement of operations) to September 30, 2016.
(c) Net of foreign withholding taxes of $1,962, $1,041,082 and $2,661,747, respectively.
(d) Net of foreign capital gains taxes of $0, $10,529 and $0, respectively.
(e) Net of increase in accrued foreign capital gains taxes of $0, $59,525 and $0, respectively.
See Notes to Financial Statements.
Statement of Changes in Net Assets
| | | | | | | | | | | | | | | | | | | | |
| | | | | |
| | | SMALL CAP CORE
PORTFOLIO | | | | | | INTERNATIONAL SMALL
CAP PORTFOLIO | | | | | | INTERNATIONAL STRATEGIC
EQUITIES PORTFOLIO | |
| | | | | | | | | | | | | | | | | | | | |
| | | FORTHE PERIOD
DECEMBER 29,
2015(a)TO
SEPTEMBER 30, 2016 | | | | | | FORTHE PERIOD
DECEMBER 21, 2015(a)TO SEPTEMBER 30, 2016 | | | | | | FORTHE PERIOD DECEMBER 21, 2015(a)TO SEPTEMBER 30, 2016 | |
| |
| INCREASE (DECREASE) IN NET ASSETS FROM | | | | | |
Operations: | | | | | | | | | | | | | | | | | | | | |
Net investment income | | $ | 791,341 | | | | | | | $ | 6,289,355 | | | | | | | $ | 17,964,027 | |
Net realized gain (loss) on investment transactions and foreign currency transactions | | | (4,539,159 | ) | | | | | | | 6,264,090 | | | | | | | | (1,431,499 | ) |
Net change in unrealized appreciation of investments | | | 41,525,793 | | | | | | | | 64,182,970 | | | | | | | | 81,256,911 | |
| | | | | | | | | | | | | | | | | | | | |
Net increase in net assets resulting from operations | | | 37,777,975 | | | | | | | | 76,736,415 | | | | | | | | 97,789,439 | |
| | | | | | | | | | | | | | | | | | | | |
Dividends to shareholders: | | | | | | | | | | | | | | | | | | | | |
Dividends from net investment income (b) | | | (1,000 | ) | | | | | | | 0 | | | | | | | | (2,549 | ) |
| | | | | | | | | | | | | | | | | | | | |
Total dividends to shareholders | | | (1,000 | ) | | | | | | | 0 | | | | | | | | (2,549 | ) |
| | | | | | | | | | | | | | | | | | | | |
Capital-share transactions: | | | | | | | | | | | | | | | | | | | | |
Net proceeds from sales of shares | | | 711,120,219 | | | | | | | | 605,823,703 | | | | | | | | 1,161,220,484 | |
Net proceeds from sales of shares issued to shareholders on reinvestment of dividends | | | 1,000 | | | | | | | | 0 | | | | | | | | 2,549 | |
| | | | | | | | | | | | | | | | | | | | |
Total proceeds from shares sold | | | 711,121,219 | | | | | | | | 605,823,703 | | | | | | | | 1,161,223,033 | |
Cost of shares redeemed | | | (13,486,145 | ) | | | | | | | (23,898,002 | ) | | | | | | | (30,647,335 | ) |
| | | | | | | | | | | | | | | | | | | | |
Net increase in net assets from capital-share transactions | | | 697,635,074 | | | | | | | | 581,925,701 | | | | | | | | 1,130,575,698 | |
| | | | | | | | | | | | | | | | | | | | |
Net increase in net assets | | | 735,412,049 | | | | | | | | 658,662,116 | | | | | | | | 1,228,362,588 | |
| | | | | |
| NET ASSETS: | | | | | | | | | | | | | | | | | | | | |
Beginning of period | | | 100,000 | | | | | | | | 100,000 | | | | | | | | 100,000 | |
| | | | | | | | | | | | | | | | | | | | |
End of period (c) | | $ | 735,512,049 | | | | | | | $ | 658,762,116 | | | | | | | $ | 1,228,462,588 | |
| | | | | | | | | | | | | | | | | | | | |
(c) Includes undistributed net investment income of: | | $ | 833,238 | | | | | | | $ | 7,741,576 | | | | | | | $ | 13,115,127 | |
| | | | | | | | | | | | | | | | | | | | |
(a) Commencement of operations.
(b) See page 31 for share class information on dividend distributions for the Portfolios.
See Notes to Financial Statements.
| | | | |
| |
| | | SMALL CAP CORE
PORTFOLIO | |
| | | | |
| | | FORTHE PERIOD
DECEMBER 29, 2015(a)TO SEPTEMBER 30, 2016 | |
Dividends to shareholders: | | | | |
Dividends from net investment income | | | | |
SCB Class | | $ | (5 | ) |
Advisor Class | | | (5 | ) |
Class Z | | | (990 | ) |
| | | | |
| | $ | (1,000 | ) |
| | | | |
| | | | |
| |
| | | INTERNATIONAL
STRATEGIC EQUITIES
PORTFOLIO | |
| | | | |
| | | FORTHE PERIOD
DECEMBER 21, 2015(a)TO SEPTEMBER 30, 2016 | |
Dividends to shareholders: | | | | |
Dividends from net investment income | | | | |
SCB Class | | $ | (4 | ) |
Advisor Class | | | (5 | ) |
Class Z | | | (2,540 | ) |
| | | | |
| | $ | (2,549 | ) |
| | | | |
(a) Commencement of operations.
See Notes to Financial Statements.
Financial Highlights
Selected per share data and ratios for a share of capital stock outstanding for each respective Portfolio for each of the periods presented:
| | | | |
| |
| | | SMALL CAP CORE
PORTFOLIO | |
| | | | |
| | | SCB CLASS | |
| | | 12/29/2015(a) TO
9/30/16 | |
Net asset value, beginning of period | | $ | 10.00 | |
| | | | |
Income from investment operations: | | | | |
Investment income, net†‡ | | | 0.01 | |
Net realized and unrealized gain on investment transactions and foreign currency transactions (b) | | | 0.53 | |
| | | | |
Total from investment operations | | | 0.54 | |
| | | | |
Less dividends: | | | | |
Dividends from net investment income (c) | | | (0.00 | ) |
| | | | |
Net asset value, end of period | | $ | 10.54 | |
| | | | |
Total return (d) | | | 5.45% | |
| |
| RATIOS/SUPPLEMENTAL DATA | | | | |
Net assets, end of period (000 omitted) | | | $4,870 | |
Average net assets (000 omitted) | | | $2,314 | |
Ratio to average net assets of: | | | | |
Expenses, net of waivers/reimbursements* | | | 1.30% | |
Expenses, before waivers/reimbursements* | | | 1.40% | |
Net investment income*‡ | | | 0.16% | |
Portfolio turnover rate | | | 88% | |
See Footnote Summary on page 40.
See Notes to Financial Statements.
| | | | |
| |
| | | SMALL CAP CORE
PORTFOLIO | |
| | | | |
| | | ADVISOR CLASS | |
| | | 12/29/2015(a) TO
9/30/16 | |
Net asset value, beginning of period | | $ | 10.00 | |
| | | | |
Income from investment operations | | | | |
Investment income, net†‡ | | | 0.04 | |
Net realized and unrealized gain on investment transactions and foreign currency transactions (b) | | | 0.53 | |
| | | | |
Total from investment operations | | | 0.57 | |
| | | | |
Less dividends: | | | | |
Dividends from net investment income | | | (0.01 | ) |
| | | | |
Net asset value, end of period | | $ | 10.56 | |
| | | | |
Total return (d) | | | 5.65% | |
| |
| RATIOS/SUPPLEMENTAL DATA | | | | |
Net assets, end of period (000 omitted) | | | $603,862 | |
Average net assets (000 omitted) | | | $175,999 | |
Ratio to average net assets of: | | | | |
Expenses, net of waivers/reimbursements* | | | 1.05% | |
Expenses, before waivers/reimbursements* | | | 1.15% | |
Net investment income*‡ | | | 0.49% | |
Portfolio turnover rate | | | 88% | |
See Footnote Summary on page 40.
See Notes to Financial Statements.
Financial Highlights (continued)
Selected per share data and ratios for a share of capital stock outstanding for each respective Portfolio for each of the periods presented:
| | | | |
| |
| | | SMALL CAP CORE
PORTFOLIO | |
| | | | |
| | | CLASS Z | |
| | | 12/29/2015(a) TO
9/30/16 | |
Net asset value, beginning of period | | $ | 10.00 | |
| | | | |
Income from investment operations | | | | |
Investment income, net†‡ | | | 0.04 | |
Net realized and unrealized gain on investment transactions and foreign currency transactions (b) | | | 0.53 | |
| | | | |
Total from investment operations | | | .57 | |
| | | | |
Less dividends: | | | | |
Dividends from net investment income | | | (0.01 | ) |
| | | | |
Net asset value, end of period | | $ | 10.56 | |
| | | | |
Total return (c) | | | 5.65% | |
| |
| RATIOS/SUPPLEMENTAL DATA | | | | |
Net assets, end of period (000 omitted) | | | $126,780 | |
Average net assets (000 omitted) | | | $36,539 | |
Ratio to average net assets of: | | | | |
Expenses, net of waivers/reimbursements* | | | 1.05% | |
Expenses, before waivers/reimbursements* | | | 1.35% | |
Net investment income*‡ | | | 0.49% | |
Portfolio turnover rate | | | 88% | |
See Footnote Summary on page 40.
See Notes to Financial Statements.
| | | | |
| |
| | | INTERNATIONAL SMALL CAP
PORTFOLIO | |
| | | | |
| | | SCB CLASS | |
| | | 12/21/2015(a) TO
9/30/16 | |
Net asset value, beginning of period | | $ | 10.00 | |
| | | | |
Income from investment operations: | | | | |
Investment income, net†‡ | | | 0.11 | |
Net realized and unrealized gain on investment transactions and foreign currency transactions | | | 0.81 | |
| | | | |
Total from investment operations | | | 0.92 | |
| | | | |
Net asset value, end of period | | $ | 10.92 | |
| | | | |
Total return (d) | | | 9.20% | |
| |
| RATIOS/SUPPLEMENTAL DATA | | | | |
Net assets, end of period (000 omitted) | | | $37,226 | |
Average net assets (000 omitted) | | | $14,117 | |
Ratio to average net assets of: | | | | |
Expenses, net of waivers/reimbursements* | | | 1.35% | |
Expenses, before waivers/reimbursements* | | | 1.53% | |
Net investment income*‡ | | | 1.38% | |
Portfolio turnover rate | | | 51% | |
See Footnote Summary on page 40.
See Notes to Financial Statements.
Financial Highlights (continued)
Selected per share data and ratios for a share of capital stock outstanding for each respective Portfolio for each of the periods presented:
| | | | |
| |
| | | INTERNATIONAL SMALL CAP
PORTFOLIO | |
| | | | |
| | | ADVISOR CLASS | |
| | | 12/21/2015(a) TO
9/30/16 | |
Net asset value, beginning of period | | $ | 10.00 | |
| | | | |
Income from investment operations | | | | |
Investment income, net†‡ | | | 0.15 | |
Net realized and unrealized gain on investment transactions and foreign currency transactions | | | 0.78 | |
| | | | |
Total from investment operations | | | 0.93 | |
| | | | |
Net asset value, end of period | | $ | 10.93 | |
| | | | |
Total return (d) | | | 9.30% | |
| |
| RATIOS/SUPPLEMENTAL DATA | | | | |
Net assets, end of period (000 omitted) | | | $367,468 | |
Average net assets (000 omitted) | | | $230,324 | |
Ratio to average net assets of: | | | | |
Expenses, net of waivers/reimbursements* | | | 1.10% | |
Expenses, before waivers/reimbursements* | | | 1.22% | |
Net investment income*‡ | | | 1.87% | |
Portfolio turnover rate | | | 51% | |
See Footnote Summary on page 40.
See Notes to Financial Statements.
| | | | |
| |
| | | INTERNATIONAL SMALL CAP
PORTFOLIO | |
| | | | |
| | | CLASS Z | |
| | | 12/21/2015(a) TO
9/30/16 | |
Net asset value, beginning of period | | $ | 10.00 | |
| | | | |
Income from investment operations | | | | |
Investment income, net†‡ | | | 0.15 | |
Net realized and unrealized gain on investment transactions and foreign currency transactions | | | 0.78 | |
| | | | |
Total from investment operations | | | .93 | |
| | | | |
Net asset value, end of period | | $ | 10.93 | |
| | | | |
Total return (d) | | | 9.30% | |
| |
| RATIOS/SUPPLEMENTAL DATA | | | | |
Net assets, end of period (000 omitted) | | | $254,068 | |
Average net assets (000 omitted) | | | $187,312 | |
Ratio to average net assets of: | | | | |
Expenses, net of waivers/reimbursements* | | | 1.10% | |
Expenses, before waivers/reimbursements* | | | 1.26% | |
Net investment income*‡ | | | 1.92% | |
Portfolio turnover rate | | | 51% | |
See Footnote Summary on page 40.
See Notes to Financial Statements.
Financial Highlights (continued)
Selected per share data and ratios for a share of capital stock outstanding for each respective Portfolio for each of the periods presented:
| | | | |
| |
| | | INTERNATIONAL STRATEGIC EQUITIES
PORTFOLIO | |
| | | | |
| | | SCB CLASS | |
| | | 12/21/2015(a) TO
9/30/16 | |
Net asset value, beginning of period | | $ | 10.00 | |
| | | | |
Income from investment operations: | | | | |
Investment income, net†‡ | | | 0.21 | |
Net realized and unrealized gain on investment transactions and foreign currency transactions (b) | | | 0.36 | |
| | | | |
Total from investment operations | | | 0.57 | |
| | | | |
Less dividends: | | | | |
Dividends from net investment income (c) | | | (0.00 | ) |
| | | | |
Net asset value, end of period | | $ | 10.57 | |
| | | | |
Total return (d) | | | 5.75% | |
| |
| RATIOS/SUPPLEMENTAL DATA | | | | |
Net assets, end of period (000 omitted) | | | $68,977 | |
Average net assets (000 omitted) | | | $27,169 | |
Ratio to average net assets of: | | | | |
Expenses, net of waivers/reimbursements* | | | 1.20% | |
Expenses, before waivers/reimbursements* | | | 1.34% | |
Net investment income*‡ | | | 2.70% | |
Portfolio turnover rate | | | 79% | |
See Footnote Summary on page 40.
See Notes to Financial Statements.
| | | | |
| |
| | | INTERNATIONAL STRATEGIC EQUITIES
PORTFOLIO | |
| | | | |
| | | ADVISOR CLASS | |
| | | 12/21/2015(a) TO
9/30/16 | |
Net asset value, beginning of period | | $ | 10.00 | |
| | | | |
Income from investment operations | | | | |
Investment income, net†‡ | | | 0.23 | |
Net realized and unrealized gain on investment transactions and foreign currency transactions (b) | | | 0.35 | |
| | | | |
Total from investment operations | | | 0.58 | |
| | | | |
Less dividends: | | | | |
Dividends from net investment income | | | (0.01 | ) |
| | | | |
Net asset value, end of period | | $ | 10.57 | |
| | | | |
Total return (d) | | | 5.75% | |
| |
| RATIOS/SUPPLEMENTAL DATA | | | | |
Net assets, end of period (000 omitted) | | | $737,765 | |
Average net assets (000 omitted) | | | $459,166 | |
Ratio to average net assets of: | | | | |
Expenses, net of waivers/reimbursements* | | | 0.95% | |
Expenses, before waivers/reimbursements* | | | 1.06% | |
Net investment income*‡ | | | 2.93% | |
Portfolio turnover rate | | | 79% | |
See Footnote Summary on page 40.
See Notes to Financial Statements.
Financial Highlights (continued)
Selected per share data and ratios for a share of capital stock outstanding for each respective Portfolio for each of the periods presented:
| | | | |
| |
| | | INTERNATIONAL STRATEGIC EQUITIES
PORTFOLIO | |
| | | | |
| | | CLASS Z | |
| | | 12/21/2015(a) TO
9/30/16 | |
Net asset value, beginning of period | | $ | 10.00 | |
| | | | |
Income from investment operations | | | | |
Investment income, net†‡ | | | 0.24 | |
Net realized and unrealized gain on investment transactions and foreign currency transactions (b) | | | 0.35 | |
| | | | |
Total from investment operations | | | .59 | |
| | | | |
Less dividends: | | | | |
Dividends from net investment income | | | (0.01 | ) |
| | | | |
Net asset value, end of period | | $ | 10.58 | |
| | | | |
Total return (d) | | | 5.85% | |
| |
| RATIOS/SUPPLEMENTAL DATA | | | | |
Net assets, end of period (000 omitted) | | | $421,721 | |
Average net assets (000 omitted) | | | $295,180 | |
Ratio to average net assets of: | | | | |
Expenses, net of waivers/reimbursements* | | | 0.95% | |
Expenses, before waivers/reimbursements* | | | 1.10% | |
Net investment income*‡ | | | 3.04% | |
Portfolio turnover rate | | | 79% | |
| * | | Annualized, except for certain non-recurring fees. |
| † | | Based on average shares outstanding. |
| ‡ | | Net of fees and expenses waived by the Adviser. |
| (a) | | Commencement of operations. |
| (b) | | Due to timing of sales and repurchase of capital shares, the net realized and unrealized gain (loss) per share is not in accord with the Portfolio’s change in net realized and unrealized gain (loss) on investment transactions for the period. |
| (c) | | Amount is less than $.005. |
| (d) | | Total investment return is calculated assuming an initial investment made at the net asset value at the beginning of the period, reinvestment of all dividends and distributions at net asset value during the period, and redemption on the last day of the period. Total return does not reflect the deduction of taxes that a shareholder would pay on fund distributions or the redemption of fund shares. Total investment return calculated for a period of less than one year is not annualized |
See Notes to Financial Statements.
Notes to Financial Statements
| NOTE 1. | Organization and Significant Accounting Policies |
Bernstein Fund, Inc. (the “Fund”) is a managed open-end registered investment company, incorporated in Maryland on September 11, 2015. The Fund operates as a series company currently comprised of three portfolios: Small Cap Core Portfolio, International Small Cap Portfolio and International Strategic Equities Portfolio (hereafter collectively referred to as the “Portfolios” and individually the “Portfolio”) with the following share classes offered: SCB Class, Advisor Class and Class Z. Small Cap Core Portfolio commenced operations on December 29, 2015. International Small Cap Portfolio and International Strategic Equities Portfolio commenced operations on December 21, 2015.
Each Portfolio has its own investment objectives. Each class of shares has identical voting, dividend, liquidation and other rights, except that the classes bear different distribution and transfer agency expenses. Each class has exclusive voting rights with respect to its distribution plan, as applicable. The financial statements have been prepared in conformity with U.S. generally accepted accounting principles (“U.S. GAAP”) which require management to make certain estimates and assumptions that affect the reported amounts of assets and liabilities in the financial statements and amounts of income and expenses during the reporting period. Actual results could differ from those estimates. The Fund is an investment company under U.S. GAAP and follows the accounting and reporting guidance applicable to investment companies. The following is a summary of significant accounting policies followed by the Fund.
Portfolio securities are valued at their current market value determined on the basis of market quotations or, if market quotations are not readily available or are deemed unreliable, at “fair value” as determined in accordance with procedures established by and under the general supervision of the Fund’s Board of Directors (the “Board”).
In general, the market values of securities which are readily available and deemed reliable are determined as follows: securities listed on a national securities exchange (other than securities listed on the NASDAQ Stock Market, Inc. (“NASDAQ”)) or on a foreign securities exchange are valued at the last sale price at the close of the exchange or foreign securities exchange. If there has been no sale on such day, the securities are valued at the last traded price from the previous day. Securities listed on more than one exchange are valued by reference to the principal exchange on which the securities are traded; securities listed only on NASDAQ are valued in accordance with the NASDAQ Official Closing Price; listed or over the counter (“OTC”) market put or call options are valued at the mid level between the current bid and ask prices. If either a current bid or current ask price is unavailable, AllianceBernstein L.P. (the “Adviser”) will have discretion to determine the best valuation (e.g. last trade price in the case of listed options); open futures are valued using the closing settlement price or, in the absence of such a price, the most recent quoted bid price. If there are no quotations available for the day of valuation, the last available closing settlement price is used; U.S. Government securities and any other debt instruments having 60 days or less remaining until maturity are generally valued at market by an independent pricing vendor, if a market price is available. If a market price is not available, the securities are valued at amortized cost. This methodology is commonly used for short term securities that have an original maturity of 60 days or less, as well as short term securities that had an original term to maturity that exceeded 60 days. In instances when amortized cost is utilized, the Valuation Committee (the “Committee”) must reasonably conclude that the utilization of amortized cost is approximately the same as the fair value of the security. Such factors the Committee will consider include, but are not limited to, an impairment of the creditworthiness of the issuer or material changes in interest rates. Fixed-income securities, including mortgage-backed and asset-backed securities, may be valued on the basis of prices provided by a pricing service or at a price obtained from one or more of the major broker-dealers. In cases where broker-dealer quotes are obtained, the Adviser may establish procedures whereby changes in market yields or spreads are used to adjust, on a daily basis, a recently obtained quoted price on a security. Swaps and other derivatives are valued daily, primarily using independent pricing services, independent pricing models using market inputs, as well as third party broker-dealers or counterparties. Open end mutual funds are valued at the closing net asset value per share, while exchange traded funds are valued at the closing market price per share.
Securities for which market quotations are not readily available (including restricted securities) or are deemed unreliable are valued at fair value as deemed appropriate by the Adviser. Factors considered in making this determination may include, but are not limited to, information obtained by contacting the issuer, analysts, analysis of the issuer’s financial statements or other available documents. In addition, the Fund may use fair value pricing for securities primarily traded in non-U.S. markets because most foreign markets close well before the Fund values its securities at 4:00 p.m., Eastern
Notes to Financial Statements (continued)
Time. The earlier close of these foreign markets gives rise to the possibility that significant events, including broad market moves, may have occurred in the interim and may materially affect the value of those securities. To account for this, the Fund generally values many of its foreign equity securities using fair value prices based on third party vendor modeling tools to the extent available.
| B. | | Fair Value Measurements |
In accordance with U.S. GAAP regarding fair value measurements, fair value is defined as the price that the Portfolios would receive to sell an asset or pay to transfer a liability in an orderly transaction between market participants at the measurement date. U.S. GAAP establishes a framework for measuring fair value, and a three-level hierarchy for fair value measurements based upon the transparency of inputs to the valuation of an asset or liability (including those valued based on their market values as described in Note A above). Inputs may be observable or unobservable and refer broadly to the assumptions that market participants would use in pricing the asset or liability. Observable inputs reflect the assumptions market participants would use in pricing the asset or liability based on market data obtained from sources independent of the Portfolios. Unobservable inputs reflect the Portfolios’ own assumptions about the assumptions that market participants would use in pricing the asset or liability based on the best information available in the circumstances. Each investment is assigned a level based upon the observability of the inputs which are significant to the overall valuation. The three-tier hierarchy of inputs is summarized below.
| | • | | Level 1—quoted prices in active markets for identical investments |
| | • | | Level 2—other significant observable inputs (including quoted prices for similar investments, interest rates, prepayment speeds, credit risk, etc.) |
| | • | | Level 3—significant unobservable inputs (including the Portfolios’ own assumptions in determining the fair value of investments) |
The fair value of debt instruments, such as bonds, and over-the-counter derivatives is generally based on market price quotations, recently executed market transactions (where observable) or industry recognized modeling techniques and are generally classified as Level 2. Pricing vendor inputs to Level 2 valuations may include quoted prices for similar investments in active markets, interest rate curves, coupon rates, currency rates, yield curves, option adjusted spreads, default rates, credit spreads and other unique security features in order to estimate the relevant cash flows which are then discounted to calculate fair values. If these inputs are unobservable and significant to the fair value, these investments will be classified as Level 3. In addition, non-agency rated investments are classified as Level 3.
Where readily available market prices or relevant bid prices are not available for certain equity investments, such investments may be valued based on similar publicly traded investments, movements in relevant indices since last available prices or based upon underlying company fundamentals and comparable company data (such as multiples to earnings or other multiples to equity). Where an investment is valued using an observable input, such as another publicly traded security, the investment will be classified as Level 2. If management determines that an adjustment is appropriate based on restrictions on resale, illiquidity or uncertainty, and such adjustment is a significant component of the valuation, the investment will be classified as Level 3. An investment will also be classified as Level 3 where management uses company fundamentals and other significant inputs to determine the valuation.
The following tables summarize the valuation of the Portfolios’ investments by the above fair value hierarchy levels as of September 30, 2016:
| | | | | | | | | | | | | | | | |
SMALL CAP CORE PORTFOLIO
INVESTMENTSIN SECURITIES: | | LEVEL 1 | | | LEVEL 2 | | | LEVEL 3 | | | TOTAL | |
Assets: | | | | | | | | | | | | | | | | |
Common Stocks (a) | | $ | 719,886,111 | | | $ | 0 | | | $ | 0 | | | $ | 719,886,111 | |
Short-Term Investments | | | 12,157,406 | | | | 0 | | | | 0 | | | | 12,157,406 | |
Total Investments in Securities | | | 732,043,517 | | | | 0 | | | | 0 | | | | 732,043,517 | |
| | | | | | | | | | | | | | | | |
SMALL CAP CORE PORTFOLIO
INVESTMENTSIN SECURITIES: | | LEVEL 1 | | | LEVEL 2 | | | LEVEL 3 | | | TOTAL | |
Other Financial Instruments (b): | | | | | | | | | | | | | | | | |
Assets: | | | | | | | | | | | | | | | | |
Futures | | $ | 508,743 | | | $ | 0 | | | $ | 0 | | | $ | 508,743 | (c) |
Liabilities | | | 0 | | | | 0 | | | | 0 | | | | 0 | |
Total (d) | | $ | 732,552,260 | | | $ | 0 | | | $ | 0 | | | $ | 732,552,260 | |
| | | | |
INTERNATIONAL SMALL CAP PORTFOLIO
INVESTMENTSIN SECURITIES: | | LEVEL 1 | | | LEVEL 2 | | | LEVEL 3 | | | TOTAL | |
Assets: | | | | | | | | | | | | | | | | |
Common Stocks: | | | | | | | | | | | | | | | | |
Consumer Discretionary | | $ | 19,094,269 | | | $ | 127,491,621 | | | $ | 0 | | | $ | 146,585,890 | |
Industrials | | | 27,952,980 | | | | 74,370,181 | | | | 0 | | | | 102,323,161 | |
Information Technology | | | 6,955,641 | | | | 75,315,146 | | | | 0 | | | | 82,270,787 | |
Consumer Staples | | | 22,291,777 | | | | 55,443,449 | | | | 0 | | | | 77,735,226 | |
Materials | | | 6,913,946 | | | | 41,068,064 | | | | 0 | | | | 47,982,010 | |
Health Care | | | 8,953,809 | | | | 32,853,890 | | | | 0 | | | | 41,807,699 | |
Real Estate | | | 12,831,198 | | | | 27,070,146 | | | | 0 | | | | 39,901,344 | |
Financials | | | 14,927,386 | | | | 17,482,774 | | | | 0 | | | | 32,410,160 | |
Utilities | | | 5,935,205 | | | | 10,319,028 | | | | 0 | | | | 16,254,233 | |
Energy | | | 4,948,699 | | | | 10,613,202 | | | | 0 | | | | 15,561,901 | |
Telecommunication Services | | | 531,420 | | | | 11,066,374 | | | | 0 | | | | 11,597,794 | |
Warrants | | | 0 | | | | 18,055,408 | | | | 0 | | | | 18,055,408 | |
Investment Companies | | | 5,138,590 | | | | 0 | | | | 0 | | | | 5,138,590 | |
Short-Term Investments | | | 13,548,561 | | | | 0 | | | | 0 | | | | 13,548,561 | |
Total Investments in Securities | | | 150,023,481 | | | | 501,149,283 | (e) | | | 0 | | | | 651,172,764 | |
Other Financial Instruments (b): | | | | | | | | | | | | | | | | |
Assets: | | | | | | | | | | | | | | | | |
Forward Currency Exchange Contracts | | | 0 | | | | 622,405 | | | | 0 | | | | 622,405 | |
Liabilities: | | | | | | | | | | | | | | | | |
Forward Currency Exchange Contracts | | | 0 | | | | (414,052 | ) | | | 0 | | | | (414,052 | ) |
Total (d) | | $ | 150,023,481 | | | $ | 501,357,636 | | | $ | 0 | | | $ | 651,381,117 | |
| | | | |
INTERNATIONAL STRATEGIC EQUITIES PORTFOLIO
INVESTMENTSIN SECURITIES: | | LEVEL 1 | | | LEVEL 2 | | | LEVEL 3 | | | TOTAL | |
Assets: | | | | | | | | | | | | | | | | |
Common Stocks: | | | | | | | | | | | | | | | | |
Financials | | $ | 27,839,030 | | | $ | 180,427,238 | | | $ | 0 | | | $ | 208,266,268 | |
Information Technology | | | 30,171,351 | | | | 134,840,392 | | | | 0 | | | | 165,011,743 | |
Materials | | | 11,348,366 | | | | 112,883,097 | | | | 0 | | | | 124,231,463 | |
Consumer Discretionary | | | 34,086,512 | | | | 89,514,585 | | | | 0 | | | | 123,601,097 | |
Industrials | | | 0 | | | | 120,848,543 | | | | 0 | | | | 120,848,543 | |
Consumer Staples | | | 36,988,518 | | | | 79,892,271 | | | | 0 | | | | 116,880,789 | |
Energy | | | 22,761,295 | | | | 67,137,811 | | | | 0 | | | | 89,899,106 | |
Health Care | | | 5,368,565 | | | | 78,942,092 | | | | 0 | | | | 84,310,657 | |
Real Estate | | | 0 | | | | 72,304,442 | | | | 0 | | | | 72,304,442 | |
Notes to Financial Statements (continued)
| | | | | | | | | | | | | | | | |
INTERNATIONAL STRATEGIC EQUITIES PORTFOLIO
INVESTMENTSIN SECURITIES: | | LEVEL 1 | | | LEVEL 2 | | | LEVEL 3 | | | TOTAL | |
Utilities | | $ | 13,876,795 | | | $ | 34,295,787 | | | $ | 0 | | | $ | 48,172,582 | |
Telecommunication Services | | | 13,909,364 | | | | 30,411,711 | | | | 0 | | | | 44,321,075 | |
Short-Term Investments | | | 31,905,295 | | | | 0 | | | | 0 | | | | 31,905,295 | |
Total Investments in Securities | | | 228,255,091 | | | | 1,001,497,969 | (e) | | | 0 | | | | 1,229,753,060 | |
Other Financial Instruments (b): | | | | | | | | | | | | | | | | |
Assets: | | | | | | | | | | | | | | | | |
Forward Currency Exchange Contracts | | | 0 | | | | 1,823,242 | | | | 0 | | | | 1,823,242 | |
Liabilities: | | | | | | | | | | | | | | | | |
Futures | | | (296,238 | ) | | | 0 | | | | 0 | | | | (296,238 | )(c) |
Forward Currency Exchange Contracts | | | 0 | | | | (2,528,032 | ) | | | 0 | | | | (2,528,032 | ) |
Total (d) | | $ | 227,958,853 | | | $ | 1,000,793,179 | | | $ | 0 | | | $ | 1,228,752,032 | |
| | (a) | See schedule of investments for sector classifications. |
| | (b) | Other financial instruments are derivative instruments, such as futures, forwards and swaps, which are valued at the unrealized appreciation/depreciation on the instrument. |
| | (c) | Only variation margin receivable/payable at period end is reported within the statement of assets and liabilities. This amount reflects cumulative unrealized appreciation/(depreciation) of exchange-traded derivatives as reported in the schedule of investments. |
| | (d) | There were no transfers between any levels during the reporting period. |
| | (e) | A significant portion of the Portfolio’s foreign equity investments are categorized as Level 2 investments since they are valued using fair value prices based on third party vendor modeling tools to the extent available, see Note 1.A. |
The Portfolio recognizes all transfers between levels of the fair value hierarchy assuming the financial instruments were transferred at the beginning of the reporting period.
The Adviser established the Committee to oversee the pricing and valuation of all securities held in the Portfolios. The Committee operates under pricing and valuation policies and procedures established by the Adviser and approved by the Board, including pricing policies which set forth the mechanisms and processes to be employed on a daily basis to implement these policies and procedures. In particular, the pricing policies describe how to determine market quotations for securities and other instruments. The Committee’s responsibilities include: 1) fair value and liquidity determinations (and oversight of any third parties to whom any responsibility for fair value and liquidity determinations is delegated), and 2) regular monitoring of the Adviser’s pricing and valuation policies and procedures and modification or enhancement of these policies and procedures (or recommendation of the modification of these policies and procedures) as the Committee believes appropriate.
The Committee is also responsible for monitoring the implementation of the pricing policies by the Adviser’s Pricing Group (the “Pricing Group”) and any third party which performs certain pricing functions in accordance with the pricing policies. The Pricing Group is responsible for the oversight of the third party on a day-to-day basis. The Committee and the Pricing Group perform a series of activities to provide reasonable assurance of the accuracy of prices including: 1) periodic vendor due diligence meetings, review of methodologies, new developments and processes at vendors, 2) daily comparison of security valuation versus prior day for all securities that exceeded established thresholds, and 3) daily review of unpriced, stale, and variance reports with exceptions reviewed by senior management and the Committee.
In addition, several processes outside of the pricing process are used to monitor valuation issues including: 1) performance and performance attribution reports are monitored for anomalous impacts based upon benchmark performance, and 2) portfolio managers review all portfolios for performance and analytics (which are generated using the Adviser’s prices).
| C. | | Foreign Currency Translation |
The accounting records of the Fund are maintained in U.S. dollars. Prices of securities and other assets and liabilities denominated in non-U.S. currencies are translated into U.S. dollars using the exchange rate at 4:00 p.m., Eastern Time. Amounts related to the purchases and sales of securities, investment income and expenses are translated at the rates of exchange prevailing on the respective dates of such transactions.
Net realized gain or loss on foreign currency transactions represents net foreign exchange gains or losses from the closure of forward currency exchange contracts, disposition of foreign currencies, currency gains or losses realized between the trade and settlement dates on security transactions and the difference between the amount of dividends, interest and foreign withholding taxes recorded on the Fund’s books and the U.S. dollar equivalent amount actually received or paid. Net unrealized currency gains and losses arising from valuing foreign currency denominated assets and liabilities, other than security investments, at the current exchange rate are reflected as part of unrealized appreciation/depreciation on foreign currencies.
The Fund does not isolate that portion of the results of operations arising as a result of changes in the foreign exchange rates from the changes in the market prices of securities held at period end. The Fund does not isolate the effect of changes in foreign exchange rates from changes in market prices of equity securities sold during the year. The Fund does isolate the effect of changes in foreign exchange rates from changes in market prices of debt securities sold during the year, as required by the Internal Revenue Code.
The International Small Cap Portfolio and International Strategic Equities Portfolio may invest in foreign securities and foreign currency transactions that may involve risks not associated with domestic investments as a result of the level of governmental supervision and regulation of foreign securities markets and the possibility of political or economic instability, among others.
Each Portfolio is treated as a separate entity for federal income tax purposes. Each Portfolio intends to continue to comply with the requirements of Subchapter M of the Internal Revenue Code of 1986 as they apply to regulated investment companies. By so complying, each Portfolio will not be subject to federal and state income taxes to the extent that all of its income is distributed. The Portfolios may be subject to taxes imposed by countries in which they invest. Such taxes are generally based on income and/or capital gains earned or repatriated. Taxes are accrued and applied to net investment income, net realized gains and net unrealized appreciation/depreciation as such income and/or gains are earned based on, management’s understanding of applicable local tax law.
In accordance with U.S. GAAP requirements regarding accounting for uncertainties in income taxes, management has analyzed the Portfolios’ tax positions taken or expected to be taken on federal and state income tax returns for the current tax year and has concluded that no provision for income tax is required in the Portfolios’ financial statements.
| E. | | Security Transactions and Related Investment Income |
Security transactions are accounted for on the trade date (the date the buy or sell order is executed). Securities gains and losses are calculated on the identified cost basis. Interest income is recorded on the accrual basis and dividend income is recorded on the ex-dividend date or as soon as the Portfolio is informed of the dividend. The Portfolios amortize premiums and accrete discounts as adjustments to interest income.
| F. | | Securities Transactions on a When-Issued or Delayed-Delivery Basis |
Each Portfolio may purchase securities on a when-issued basis or purchase or sell securities on a delayed-delivery basis. At the time a Portfolio commits to purchase a security on a when-issued or delayed-delivery basis, the Portfolio will record the transaction and use the security’s value in determining the Portfolio’s net asset value. At the time a Portfolio commits to sell a security on a delayed-delivery basis, the Portfolio will record the transaction and exclude the security’s value in determining the Portfolio’s net asset value.
Notes to Financial Statements (continued)
All income earned and expenses incurred by the Portfolios are borne on a pro-rata basis by each outstanding class of shares, based on the proportionate interest in the Portfolio represented by the shares of such class, except for class specific expenses which are allocated to the respective class. Expenses of the Fund are charged proportionately to each Portfolio or based on other appropriate methods. Realized and unrealized gains and losses are allocated among the various share classes based on respective net assets.
| H. | | Distribution of Income and Gains |
Dividends from net investment income, if any, will be paid to shareholders at least once a year.
Distributions of net realized gains, less any available loss carryforwards, if any, for all the Portfolios will be paid to shareholders at least once a year, and recorded on the ex-dividend date.
Elements of realized gains and net investment income may be recorded in different accounting periods for financial reporting (book) and federal income tax (tax) purposes (temporary differences). To the extent that such distributions required for tax purposes exceed income and gains recorded for book purposes as a result of such temporary differences, “excess distributions” are reflected in the accompanying statement of assets and liabilities. To the extent distributions exceed income and gains for tax purposes, such distributions would be shown as “return of capital” on the statement of changes in net assets. Certain other differences—permanent differences—arise because treatment of elements of income and gains is different between book and tax accounting. Permanent differences are reclassified in the year they arise.
Permanent differences have no effect on net assets. The effects of such permanent differences on each Portfolio, due to foreign currency gain (loss) reclassifications, the tax treatment of passive foreign investment companies “(PFICs)”, capital gain withholding tax, the payment of a nondeductible excise tax, the tax treatment of partnerships, and the tax treatment of offering costs are reflected as adjustments to the components of capital as of September 30, 2016, as shown below:
| | | | | | | | | | | | |
| PORTFOLIO | | INCREASE (DECREASE) TO ADDITIONAL PAID-IN CAPITAL | | | INCREASE (DECREASE) TO UNDISTRIBUTED NET INVESTMENT INCOME (LOSS) | | | INCREASE (DECREASE) TO ACCUMULATED
NET REALIZED GAIN (LOSS)
ON INVESTMENT AND FOREIGN
CURRENCY TRANSACTIONS | |
Small Cap Core Portfolio | | $ | (42,897 | ) | | $ | 42,897 | | | $ | 0 | |
International Small Cap Portfolio | | | (41,876 | ) | | | 1,452,221 | | | | (1,410,345 | ) |
International Strategic Equities Portfolio | | | (41,481 | ) | | | (4,846,351 | ) | | | 4,887,832 | |
| I. | | Organization and Offering Expenses |
The organizational expense of $45,957 (for the fiscal period) was expensed and reimbursed by the Adviser pursuant to the expense limitation agreement for each Portfolio. Offering costs of $103,529, $103,639 and $103,529 have been deferred and are being amortized on a straight line basis over a one year period starting from December 29, 2015 (commencement of operations) for Small Cap Core Portfolio and from December 21, 2015 (commencement of operations) for International Small Cap Portfolio and International Strategic Equities Portfolio, respectively.
| NOTE 2. | Investment Management and Transactions with Affiliated Persons |
Under the Investment Management Agreement between the Fund and the Adviser, the Adviser manages the investment of each Portfolio’s assets, places purchase and sale orders, and bears various expenses, including the salaries and expenses of all personnel except those of outside directors. In addition, the Adviser agrees to permit its directors, officers and employees who may be elected directors or officers of the Fund to serve in the capacities to which they are elected. The Adviser renders these services subject to the general oversight of the Board.
The Portfolios pay the Adviser an investment management fee at an annualized rate as follows:
Small Cap Core Portfolio: 0.80% of the Portfolio’s average daily net assets.
International Small Cap Portfolio: 1.00% of the Portfolio’s average daily net assets.
| | | | | | | | | | | | | | | | | | | | | | | | |
| | | ANNUAL PERCENTAGEOF AVERAGE DAILY NET ASSETSOF EACH PORTFOLIO | |
| PORTFOLIO | | FIRST $1 BILLION | | | NEXT $3 BILLION | | | NEXT $2 BILLION | | | NEXT $2 BILLION | | | NEXT $2 BILLION | | | THEREAFTER | |
| International Strategic Equities | | | 0.925 | % | | | 0.850 | % | | | 0.800 | % | | | 0.750 | % | | | 0.650 | % | | | 0.600 | % |
The Adviser has contractually agreed to waive the annual investment management fees of the International Strategic Equities Portfolio by an amount equal to 0.05% per annum of the average net assets of the Portfolio through December 21, 2016. For the period ending September 30, 2016, such waiver amounted to $303,210.
The Adviser has agreed to waive its fees and bear certain expenses to the extent necessary to limit the total portfolio operating expenses (excluding acquired fund fees and expenses other than the advisory fees of any AB Mutual Funds in which the Portfolios may invest, interest expense, taxes, extraordinary expenses, and brokerage commissions and other transaction costs) as a percentage of daily average net assets on an annual basis (the “Expense Caps”) as follows:
| | | | | | | | | | | | |
| PORTFOLIO | | SCB CLASS | | | ADVISOR CLASS | | | CLASS Z | |
| Small Cap Core | | | 1.30 | % | | | 1.05 | % | | | 1.05 | % |
| International Small Cap | | | 1.35 | % | | | 1.10 | % | | | 1.10 | % |
| International Strategic Equities | | | 1.20 | % | | | 0.95 | % | | | 0.95 | % |
Any fees waived and expenses borne by the Adviser for the Portfolios through September 30, 2016 are subject to repayment by the Portfolios until September 30, 2019, provided that no repayment will be made that would cause the Portfolios’ total annual fund operating expenses to exceed the net fee percentage set forth per the Expense Caps. The Expense Caps may not be terminated by the Adviser before January 4, 2017. During the period ended September 30, 2016, such reimbursement/waivers amounted to:
| | | | | | | | |
| PORTFOLIO | | AMOUNT | | | | |
| Small Cap Core | | $ | 161,882 | | | | | |
| International Small Cap | | | 420,136 | | | | | |
| International Strategic Equities | | | 425,084 | | | | | |
Pursuant to the investment management agreement, the Portfolio may reimburse the Adviser for certain legal and accounting services provided to the Portfolio by the Adviser. During the period ended September 30, 2016, the Adviser voluntarily agreed to waive such fees amounting to:
| | | | | | | | |
| PORTFOLIO | | AMOUNT | | | | |
| Small Cap Core | | $ | 49,140 | | | | | |
| International Small Cap | | | 49,140 | | | | | |
| International Strategic Equities | | | 49,140 | | | | | |
| B. | | Shareholder Servicing Fee; Transfer Agency Fee |
Under the Shareholder Servicing Agreement between the Bernstein Fund, Inc. and the Adviser, the Adviser pays expenses it incurs in providing shareholder servicing to the Fund, the Portfolios and individual shareholders. Such services include, but are not limited to, providing information to shareholders concerning their Bernstein Fund investments, systematic withdrawal plans, fund dividend payments and reinvestments, shareholder account or transactions status, net asset value of shares, fund performance, fund services, plans and options, fund investment policies, portfolio holdings and tax consequences of fund investments; dealing with shareholder complaints and other
Notes to Financial Statements (continued)
correspondence relating to fund matters; and communications with shareholders when proxies are being solicited from them with respect to voting their fund shares. Under the agreement, the fee paid by each Portfolio to the Adviser for services is 0.25% of the average daily net assets of SCB Class Shares.
Under a Transfer Agency Agreement between the Bernstein Fund, Inc., on behalf of the AllianceBernstein Investor Services, Inc. (“ABIS”), a wholly owned subsidiary of the Adviser, for providing personnel and facilities to perform transfer agency services. ABIS may make payments to intermediaries that provide omnibus account services, sub accounting services and/or networking services. For the period ended September 30, 2016, the compensation retained by ABIS amounted to: Small Cap Core Portfolio, $128,808; International Small Cap Portfolio, $87,894; and International Strategic Equities Portfolio, $102,158.
| C. | | Distribution Arrangements |
Under the Distribution Agreement between the Fund, on behalf of each Portfolio, and Sanford C. Bernstein & Co., LLC (the “Distributor”), the Distributor agrees to act as agent to sell shares of the Portfolios. The Distributor receives no fee for this service, and furthermore agrees to pay all expenses arising from the performance of its obligations under this agreement. The Distributor is a wholly owned subsidiary of the Adviser.
| D. | | Investments in Affiliated Issuers |
The AB Fixed-Income Shares, Inc. – Government STIF Portfolio (the “Government STIF Portfolio”), prior to June 1, 2016, was offered as a cash management option to mutual funds and other institutional accounts of the Adviser, and was not available for direct purchase by members of the public. Prior to June 1, 2016, the Government STIF Portfolio paid no advisory fees but did bear its own expenses. As of June 1, 2016, the Government STIF Portfolio, which was renamed “AB Government Money Market Portfolio” (the “Government Money Market Portfolio”), has a contractual advisory fee rate of .20% and continues to bear its own expenses. In connection with the investment by the Portfolios in the Government Money Market Portfolio, the Adviser will waive its advisory fee from the Portfolios in an amount equal to Government Money Market Portfolio’s effective advisory fee. For the period ended September 30, 2016, such waiver amounted to:
| | | | | | | | |
| PORTFOLIO | | AMOUNT | | | | |
| Small Cap Core | | $ | 6,407 | | | | | |
| International Small Cap | | | 10,465 | | | | | |
| International Strategic Equities | | | 20,550 | | | | | |
A summary of the Portfolios’ transactions in shares of the Government Money Market Portfolio for the period ended September 30, 2016 is as follows:
| | | | | | | | | | | | | | | | | | | | |
| PORTFOLIO | | MARKET VALUE AT BEGINNING
OF PERIOD(a) (000) | | | PURCHASES AT COST (000) | | | SALES PROCEEDS (000) | | | MARKET VALUE 9/30/16 (000) | | | DIVIDEND INCOME (000) | |
| Small Cap Core | | $ | 0 | | | $ | 182,008 | | | $ | 169,851 | | | $ | 12,157 | | | $ | 11 | |
| International Small Cap | | | 0 | | | | 285,593 | | | | 272,044 | | | | 13,549 | | | | 30 | |
| International Strategic Equities | | | 0 | | | | 682,579 | | | | 650,674 | | | | 31,905 | | | | 61 | |
| | (a) | The Small Cap Core commenced operation on December 29, 2016. The International Small Cap Portfolio and International Strategic Equities Portfolio commenced operation on December 21, 2016. |
The Portfolio may purchase securities from, or sell securities to, an affiliated fund provided the affiliation is due solely to having a common investment adviser, common officers, or common directors. For the period ended September 30, 2016, the purchase and sale transactions with an affiliated fund in compliance with Rule 17a-7 under the 1940 Act were as follows:
| | | | | | | | |
| PORTFOLIO | | PURCHASES | | | SALES | |
| Small Cap Core | | $ | 0 | | | $ | 0 | |
| International Small Cap | | | 231,158,810 | | | | 0 | |
| International Strategic Equities | | | 454,093,861 | | | | 0 | |
Brokerage commissions paid on investment transactions and brokerage commissions paid to Sanford C. Bernstein & Co., LLC and Sanford C. Bernstein & Co., Ltd., affiliates of the Adviser, for the period ended September 30, 2016 were as follows:
| | | | | | | | | | | | |
| PORTFOLIO | | TOTAL COMMISSIONS | | | SANFORD C. BERNSTEIN & CO., LLC | | | SANFORD C. BERNSTEIN & CO., LTD. | |
| Small Cap Core | | $ | 708,386 | | | $ | 0 | | | $ | 0 | |
| International Small Cap | | | 649,986 | | | | 0 | | | | 0 | |
| International Strategic Equities | | | 1,605,189 | | | | 0 | | | | 0 | |
| NOTE 3. | Investment Security Transactions |
For the period ended September 30, 2016, the Portfolios had purchases and sales transactions, excluding transactions in short-term instruments, as follows:
| | | | | | | | | | | | | | | | |
| PORTFOLIO | | PURCHASES EXCLUDING U.S. GOVERNMENT SECURITIES | | | PURCHASES OF U.S. GOVERNMENT SECURITIES | | | SALES EXCLUDING U.S. GOVERNMENT SECURITIES | | | SALESOF U.S. GOVERNMENT SECURITIES | |
Small Cap Core | | $ | 887,331,709 | | | $ | 0 | | | $ | 203,237,754 | | | $ | 0 | |
International Small Cap | | | 791,524,109 | | | | 0 | | | | 221,725,077 | | | | 0 | |
International Strategic Equities | | | 1,716,864,377 | | | | 0 | | | | 601,005,626 | | | | 0 | |
The cost of investments for federal income tax purposes, gross unrealized appreciation and unrealized depreciation (excluding futures, foreign currency and swap transactions) are as follows:
| | | | | | | | | | | | | | | | |
| | | | | | GROSS UNREALIZED | | | NET UNREALIZED APPRECIATION | |
| PORTFOLIO | | COST | | | APPRECIATION | | | (DEPRECIATION) | | |
Small Cap Core | | $ | 692,385,116 | | | $ | 48,643,103 | | | $ | (8,984,702 | ) | | $ | 39,658,401 | |
International Small Cap | | | 589,496,412 | | | | 77,213,759 | | | | (15,537,407 | ) | | | 61,676,352 | |
International Strategic Equities | | | 1,153,445,618 | | | | 99,916,010 | | | | (23,608,568 | ) | | | 76,307,442 | |
| B. | | Derivative Financial Instruments |
Each Portfolio may use derivatives in an effort to earn income and enhance returns, to replace more traditional direct investments, to obtain exposure to otherwise inaccessible markets (collectively, “investment purposes”), or to hedge or adjust the risk profile of its portfolio.
Notes to Financial Statements (continued)
The principal types of derivatives utilized by the Portfolios, as well as the methods in which they may be used are:
Each Portfolio may buy or sell futures for investment purposes or for the purpose of hedging its portfolio against adverse effects of potential movements in the market. The Portfolio bears the market risk that arises from changes in the value of these instruments and the imperfect correlation between movements in the price of the futures and movements in the price of the assets, reference rates or indices which they are designed to track. Among other things, the Portfolios may purchase or sell futures for foreign currencies or options thereon for non-hedging purposes as a means of making direct investment in foreign currencies, as described below under “Currency Transactions”.
At the time a Portfolio enters into futures, a Portfolio deposits and maintains as collateral an initial margin with the broker, as required by the exchange on which the transaction is effected. Such amount is shown as cash collateral due from broker on the statement of assets and liabilities. Pursuant to the contract, the Portfolio agrees to receive from or pay to the broker an amount of cash equal to the daily fluctuation in the value of the contract. Such receipts or payments are known as variation margin and are recorded by the Portfolio as unrealized gains or losses. Risks may arise from the potential inability of a counterparty to meet the terms of the contract. The credit/counterparty risk for exchange-traded futures is generally less than privately negotiated futures, since the clearinghouse, which is the issuer or counterparty to each exchange-traded future, has robust risk mitigation standards, including the requirement to provide initial and variation margin. When the contract is closed, the Portfolio records a realized gain or loss equal to the difference between the value of the contract at the time it was opened and the time it was closed.
Use of long futures subjects the Portfolio to risk of loss in excess of the amounts shown on the statement of assets and liabilities, up to the notional value of the futures. Use of short futures subjects the Portfolio to unlimited risk of loss. Each Portfolio may enter into futures only on exchanges or boards of trade. The exchange or board of trade acts as the counterparty to each futures transactions; therefore, the Portfolio’s credit risk is subject to failure of the exchange or board of trade. Under some circumstances, futures exchanges may establish daily limits on the amount that the price of futures can vary from the previous day’s settlement price, which could effectively prevent liquidation of unfavorable positions.
During the period ended September 30, 2016, the Small Cap Core Portfolio held futures for non-hedging purposes and International Strategic Equities Portfolio held futures for hedging and non-hedging purposes.
| | • | | Forward Currency Exchange Contracts |
Each Portfolio may enter into forward currency exchange contracts on either a spot (i.e., cash) or forward basis. Spot contracts are entered into at the rate then prevailing in the currency-exchange market. Currency exchange contracts obligate the contracting parties to purchase or sell a specific currency at a specified future date at a specified price. The Portfolios will generally not enter into a currency exchange contract with a term greater than one year. The gain or loss arising from the difference between the original contract and the closing of such contract would be included in net realized gain or loss on foreign currency transactions. Fluctuations in the value of open forward currency exchange contracts are recorded for financial reporting purposes as unrealized appreciation and/or depreciation by the Portfolio. Risks may arise from the potential inability of a counterparty to meet the terms of a contract and from unanticipated movements in the value of a foreign currency relative to the U.S. dollar.
Forward currency exchange contracts used to protect the Portfolios from adverse currency movements involve the risk that the Adviser may not accurately predict currency movements. As a result, total return could be adversely affected. The Adviser may seek investment opportunities by taking long or short positions in currencies through the use of currency related derivatives, including forward currency exchange contracts, futures and options on futures, swaps and other options. The Adviser may enter into foreign currency transactions for investment opportunities when it anticipates that a foreign currency will appreciate or depreciate in value.
Under certain circumstances, the Portfolios may commit a substantial portion or the entire value of their Portfolios to the consummation of these contracts. The Adviser will consider the effect that a substantial commitment of assets to currency exchange contracts would have on the investment program of these Portfolios and the flexibility of the Portfolios to purchase additional securities.
During the period ended September 30, 2016, the International Small Cap Portfolio held forward currency exchange contracts for hedging purchases and International Strategic Equities Portfolio held forward currency exchange contracts for hedging and non-hedging purposes.
The Portfolio typically enters into International Swaps and Derivatives Association, Inc. Master Agreements (“ISDA Master Agreement”) or similar master agreements (collectively, “Master Agreements”) with its OTC derivative contract counterparties in order to, among other things, reduce its credit risk to counterparties. ISDA Master Agreements include provisions for general obligations, representations, collateral and events of default or termination. Under an ISDA Master Agreement, the Portfolio typically may offset with the counterparty certain derivative financial instruments’ payables and/or receivables with collateral held and/or posted and create one single net payment (close-out netting) in the event of default or termination.
Various Master Agreements govern the terms of certain transactions with counterparties, including transactions such as derivative transactions, repurchase and reverse repurchase agreements. These Master Agreements typically attempt to reduce the counterparty risk associated with such transactions by specifying credit protection mechanisms and providing standardization that improves legal certainty. Cross-termination provisions under Master Agreements typically provide that a default in connection with one transaction between the Portfolio and a counterparty gives the non-defaulting party the right to terminate any other transactions in place with the defaulting party to create one single net payment due to/due from the defaulting party. In the event of a default by a Master Agreements counterparty, the return of collateral with market value in excess of the Portfolio’s net liability, held by the defaulting party, may be delayed or denied.
The Portfolio’s Master Agreements may contain provisions for early termination of OTC derivative transactions in the event the net assets of the Portfolio decline below specific levels (“net asset contingent features”). If these levels are triggered, the Portfolio’s counterparty has the right to terminate such transaction and require the Portfolio to pay or receive a settlement amount in connection with the terminated transaction. For additional details, please refer to netting arrangements by counterparty tables below.
During the period ended September 30, 2016, the Portfolio had entered into the following derivatives:
| | | | | | | | | | | | |
SMALL CAP
CORE PORTFOLIO | | ASSET DERIVATIVES | | | LIABILITY DERIVATIVES | |
| DERIVATIVE TYPE | | STATEMENT OF ASSETS
AND LIABILITIES
LOCATION | | FAIR VALUE | | | STATEMENTOF ASSETS
AND LIABILITIES LOCATION | | FAIR VALUE | |
Equity contracts | | Receivable/Payable for variation margin on exchange-traded derivatives | | $ | 508,743 | * | | | | | | |
Total | | | | $ | 508,743 | | | | | | | |
| | * | Only variation margin receivable/payable at period end is reported within the statement of assets and liabilities. This amount reflects cumulative appreciation/(depreciation) of exchange-traded derivatives as reported in the schedule of investments. |
| | | | | | | | | | |
| DERIVATIVE TYPE | | LOCATION OF GAIN OR (LOSS) ON
DERIVATIVES WITHIN STATEMENT OF
OPERATIONS | | REALIZED GAIN
OR (LOSS)ON
DERIVATIVES | | | CHANGE IN UNREALIZED
APPRECIATIONOR
(DEPRECIATION) | |
Equity contracts | | Net realized gain (loss) on futures; Net change in unrealized appreciation/depreciation of futures | | $ | 383,126 | | | $ | 508,743 | |
Total | | | | $ | 383,126 | | | $ | 508,743 | |
Notes to Financial Statements (continued)
During the period ended September 30, 2016, the Portfolio had entered into the following derivatives:
| | | | | | | | | | | | |
INTERNATIONAL SMALL CAP
PORTFOLIO | | ASSET DERIVATIVES | | | LIABILITY DERIVATIVES | |
| DERIVATIVE TYPE | | STATEMENT OF ASSETS
AND LIABILITIES
LOCATION | | FAIR VALUE | | | STATEMENT OF ASSETS
AND LIABILITIES LOCATION | | FAIR VALUE | |
Foreign exchange contracts | | Unrealized appreciation on forward currency exchange contracts | | $ | 622,405 | | | Unrealized depreciation on forward currency exchange contracts | | $ | 414,052 | |
Total | | | | $ | 622,405 | | | | | $ | 414,052 | |
| | | | | | | | | | |
| DERIVATIVE TYPE | | LOCATION OF GAIN OR (LOSS) ON
DERIVATIVES WITHIN STATEMENT OF
OPERATIONS | | REALIZED GAIN
OR (LOSS)ON
DERIVATIVES | | | CHANGE IN UNREALIZED
APPRECIATIONOR
(DEPRECIATION) | |
Foreign exchange contracts | | Net realized gain (loss) on foreign currency transactions; Net change in unrealized appreciation/depreciation of foreign currency denominated assets and liabilities | | $ | 1,163,228 | | | $ | 208,353 | |
Total | | | | $ | 1,163,228 | | | $ | 208,353 | |
During the period ended September 30, 2016, the Portfolio had entered into the following derivatives:
| | | | | | | | | | | | |
INTERNATIONAL STRATEGIC
EQUITIES PORTFOLIO | | ASSET DERIVATIVES | | | LIABILITY DERIVATIVES | |
| DERIVATIVE TYPE | | STATEMENTOF ASSETS
AND LIABILITIES
LOCATION | | FAIR VALUE | | | STATEMENTOF ASSETS
AND LIABILITIES LOCATION | | FAIR VALUE | |
Equity contracts | | | | | | | | Receivable/Payable for variation margin on exchange-traded derivatives | | $ | 296,238 | * |
Foreign exchange contracts | | Unrealized appreciation on forward currency exchange contracts | | $ | 1,823,242 | | | Unrealized depreciation on forward currency exchange contracts | | | 2,528,032 | |
Total | | | | $ | 1,823,242 | | | | | $ | 2,824,270 | |
| | * | Only variation margin receivable/payable at period end is reported within the statement of assets and liabilities. This amount reflects cumulative appreciation/(depreciation) of exchange-traded derivatives as reported in the schedule of investments. |
| | | | | | | | | | |
| DERIVATIVE TYPE | | LOCATION OF GAIN OR (LOSS) ON
DERIVATIVES WITHIN STATEMENT OF
OPERATIONS | | REALIZED GAIN
OR (LOSS)ON
DERIVATIVES | | | CHANGE IN UNREALIZED
APPRECIATION OR
(DEPRECIATION) | |
Equity contracts | | Net realized gain (loss) on futures; Net change in unrealized appreciation/depreciation of futures | | $ | 4,419,875 | | | $ | (296,238 | ) |
Foreign exchange contracts | | Net realized gain (loss) on foreign currency transactions; Net change in unrealized appreciation/depreciation of foreign currency denominated assets and liabilities | | | (4,670,495 | ) | | | (704,790 | ) |
Total | | | | $ | (250,620 | ) | | $ | (1,001,028 | ) |
The following tables represent the average monthly volume of the Portfolios’ derivative transactions during the period ended September 30, 2016
| | | | |
| SMALL CAP CORE PORTFOLIO | | | |
Futures: | | | | |
Average original value of buy contracts | | $ | 23,275,617 | (a) |
| | (a) | Positions were open for four months during the period. |
| | | | |
| INTERNATIONAL SMALL CAP PORTFOLIO | | | |
Forward Currency Exchange Contracts: | | | | |
Average principal amount of buy contracts | | $ | 48,715,695 | (a) |
Average principal amount of sale contracts | | $ | 42,792,507 | (a) |
| | (a) | Positions were open for eight months during the period. |
| | | | |
| INTERNATIONAL STRATEGIC EQUITIES PORTFOLIO | | | |
Futures: | | | | |
Average original value of buy contracts | | $ | 15,807,527 | |
| |
Forward Currency Exchange Contracts: | | | | |
Average principal amount of buy contracts | | $ | 138,795,310 | |
Average principal amount of sale contracts | | $ | 140,756,941 | |
For financial reporting purposes, the Portfolio does not offset derivative assets and derivative liabilities that are subject to netting arrangements in the statement of assets and liabilities.
All derivatives held during the reporting period were subject to netting arrangements. The following table presents the Portfolio’s derivative assets and liabilities by counterparty net of amounts available for offset under Master Agreements (“MA”) and net of the related collateral received/ pledged by the Portfolio as of September 30, 2016:
| | | | | | | | | | | | | | | | | | | | |
SMALL CAP CORE PORTFOLIO | | | | | | | | | | | | | | | | | | | | |
| COUNTERPARTY | | DERIVATIVE ASSETS
SUBJECT TOA MA | | | DERIVATIVE
AVAILABLE
FOR OFFSET | | | CASH
COLLATERAL
RECEIVED | | | SECURITY
COLLATERAL
RECEIVED | | | NET AMOUNT OF
DERIVATIVES
ASSETS | |
Exchange-Traded Derivatives: | | | | | | | | | | | | | | | | | | | | |
Morgan Stanley & Co., Inc.* | | $ | 415,030 | | | $ | 0 | | | $ | 0 | | | $ | 0 | | | $ | 415,030 | |
| | | | | | | | | | | | | | | | | | | | |
Total | | $ | 415,030 | | | $ | 0 | | | $ | 0 | | | $ | 0 | | | $ | 415,030 | |
| | | | | | | | | | | | | | | | | | | | |
| | * | Cash has been posted for initial margin requirements for exchange-traded derivatives outstanding at September 30, 2016. |
Notes to Financial Statements (continued)
| | | | | | | | | | | | | | | | | | | | |
INTERNATIONAL SMALL CAP PORTFOLIO | |
| | | | | |
| COUNTERPARTY | | DERIVATIVE ASSETS SUBJECTTO A MA | | | DERIVATIVE
AVAILABLE
FOR OFFSET | | | CASH
COLLATERAL
RECEIVED | | | SECURITY
COLLATERAL
RECEIVED | | | NET AMOUNT OF
DERIVATIVES
ASSETS | |
OTC Derivatives: | | | | | | | | | | | | | | | | | | | | |
Barclays Bank PLC | | $ | 235,603 | | | $ | (36,610 | ) | | $ | 0 | | | $ | 0 | | | $ | 198,993 | |
Citibank, NA | | | 301,238 | | | | (122,931 | ) | | | 0 | | | | 0 | | | | 178,307 | |
State Street Bank & Trust Co. | | | 11,012 | | | | (11,012 | ) | | | 0 | | | | 0 | | | | 0 | |
UBS AG | | | 74,552 | | | | 0 | | | | 0 | | | | 0 | | | | 74,552 | |
| | | | | | | | | | | | | | | | | | | | |
Total | | $ | 622,405 | | | $ | (170,553 | ) | | $ | 0 | | | $ | 0 | | | $ | 451,852 | ^ |
| | | | | | | | | | | | | | | | | | | | |
| | | | | |
| COUNTERPARTY | | DERIVATIVE LIABILITIES
SUBJECT TOA MA | | | DERIVATIVE
AVAILABLE
FOR OFFSET | | | CASH
COLLATERAL
PLEDGED | | | SECURITY
COLLATERAL
PLEDGED | | | NET AMOUNTOF
DERIVATIVES
LIABILITIES | |
OTC Derivatives: | | | | | | | | | | | | | | | | | | | | |
Bank of America, NA | | $ | 33,637 | | | $ | 0 | | | $ | 0 | | | $ | 0 | | | $ | 33,637 | |
Barclays Bank PLC | | | 36,610 | | | | (36,610 | ) | | | 0 | | | | 0 | | | | 0 | |
Citibank, NA | | | 122,931 | | | | (122,931 | ) | | | 0 | | | | 0 | | | | 0 | |
Royal Bank of Scotland PLC | | | 68,117 | | | | 0 | | | | 0 | | | | 0 | | | | 68,117 | |
State Street Bank & Trust Co. | | | 152,757 | | | | (11,012 | ) | | | 0 | | | | 0 | | | | 141,745 | |
| | | | | | | | | | | | | | | | | | | | |
Total | | $ | 414,052 | | | $ | (170,553 | ) | | $ | 0 | | | $ | 0 | | | $ | 243,499 | ^ |
| | | | | | | | | | | | | | | | | | | | |
| | ^ | Net amount represents the net receivable/payable that would be due from/to the counterparty in the event of default or termination. The net amount from OTC financial derivative instruments can only be netted across transactions governed under the same master agreement with the same counterparty. |
| | | | | | | | | | | | | | | | | | | | |
INTERNATIONAL STRATEGIC EQUITIES PORTFOLIO | |
| | | | | |
| COUNTERPARTY | | DERIVATIVE ASSETS
SUBJECTTO A MA | | | DERIVATIVE
AVAILABLE
FOR OFFSET | | | CASH
COLLATERAL
RECEIVED | | | SECURITY
COLLATERAL
RECEIVED | | | NET AMOUNT OF
DERIVATIVES
ASSETS | |
Exchange-Traded Derivatives: | |
Morgan Stanley & Co., Inc.* | | $ | 143,760 | | | $ | 0 | | | $ | 0 | | | $ | 0 | | | $ | 143,760 | |
| | | | | | | | | | | | | | | | | | | | |
Total | | $ | 143,760 | | | $ | 0 | | | $ | 0 | | | $ | 0 | | | $ | 143,760 | |
| | | | | | | | | | | | | | | | | | | | |
OTC Derivatives: | |
Barclays Bank PLC | | $ | 711,854 | | | $ | (108,177 | ) | | $ | 0 | | | $ | 0 | | | $ | 603,677 | |
Citibank, NA | | | 663,149 | | | | (282,045 | ) | | | 0 | | | | 0 | | | | 381,104 | |
Morgan Stanley & Co., Inc. | | | 195,860 | | | | (169,131 | ) | | | 0 | | | | 0 | | | | 26,729 | |
Royal Bank of Scotland PLC | | | 230,448 | | | | (230,448 | ) | | | 0 | | | | 0 | | | | 0 | |
State Street Bank & Trust Co. | | | 21,931 | | | | (21,931 | ) | | | 0 | | | | 0 | | | | 0 | |
| | | | | | | | | | | | | | | | | | | | |
Total | | $ | 1,823,242 | | | $ | (811,732 | ) | | $ | 0 | | | $ | 0 | | | $ | 1,011,510 | ^ |
| | | | | | | | | | | | | | | | | | | | |
| | | | | | | | | | | | | | | | | | | | |
| COUNTERPARTY | | DERIVATIVE LIABILITIES
SUBJECT TOA MA | | | DERIVATIVE
AVAILABLE
FOR OFFSET | | | CASH
COLLATERAL
PLEDGED | | | SECURITY
COLLATERAL
PLEDGED | | | NET AMOUNT OF
DERIVATIVES
LIABILITIES | |
OTC Derivatives: | |
Bank of America, NA | | $ | 1,072,126 | | | $ | 0 | | | $ | 0 | | | $ | 0 | | | $ | 1,072,126 | |
Barclays Bank PLC | | | 108,177 | | | | (108,177 | ) | | | 0 | | | | 0 | | | | 0 | |
Citibank, NA | | | 282,045 | | | | (282,045 | ) | | | 0 | | | | 0 | | | | 0 | |
Morgan Stanley & Co., Inc. | | | 169,131 | | | | (169,131 | ) | | | 0 | | | | 0 | | | | 0 | |
Royal Bank of Scotland PLC | | | 652,648 | | | | (230,448 | ) | | | 0 | | | | 0 | | | | 422,200 | |
State Street Bank & Trust Co. | | | 243,905 | | | | (21,931 | ) | | | 0 | | | | 0 | | | | 221,974 | |
| | | | | | | | | | | | | | | | | | | | |
Total | | $ | 2,528,032 | | | $ | (811,732 | ) | | $ | 0 | | | $ | 0 | | | $ | 1,716,300 | ^ |
| | | | | | | | | | | | | | | | | | | | |
| | * | Cash has been posted for initial margin requirements for exchange-traded derivatives outstanding at September 30, 2016. |
| | ^ | Net amount represents the net receivable/payable that would be due from/to the counterparty in the event of default or termination. The net amount from OTC financial derivative instruments can only be netted across transactions governed under the same master agreement with the same counterparty. |
The Portfolios may invest in non-U.S. Dollar-denominated securities on a currency hedged or unhedged basis. The Portfolios may seek investment opportunities by taking long or short positions in currencies through the use of currency-related derivatives, including forward currency exchange contracts, futures and options on futures, swaps, and other options. The Portfolios may enter into transactions for investment opportunities when it anticipates that a foreign currency will appreciate or depreciate in value but securities denominated in that currency are not held by the Portfolio and do not present attractive investment opportunities. Such transactions may also be used when the Adviser believes that it may be more efficient than a direct investment in a foreign currency-denominated security. The Portfolios may also conduct currency exchange contracts on a spot basis (i.e., for cash at the spot rate prevailing in the currency exchange market for buying or selling currencies).
| NOTE 4. | Distributions to Shareholders |
The tax character of distributions paid during the fiscal years ended September 30, 2016 was as follows:
| | | | |
| PORTFOLIO | | 2016 | |
Small Cap Core | | | | |
Distributions paid from: | | | | |
Ordinary income | | $ | 1,000 | |
| | | | |
Total distributions paid | | $ | 1,000 | |
| | | | |
| | | | |
International Small Cap | | | | |
Distributions paid from: | | | | |
Ordinary income | | $ | 0 | |
| | | | |
Total distributions paid | | $ | 0 | |
| | | | |
| | | | |
International Strategic Equities | | | | |
Distributions paid from: | | | | |
Ordinary income | | $ | 2,549 | |
| | | | |
Total distributions paid | | $ | 2,549 | |
| | | | |
| | | | | |
Notes to Financial Statements (continued)
As of September 30, 2016, the components of accumulated earnings/(deficit) on a tax basis were as follows:
| | | | | | | | | | | | | | | | | | | | |
| PORTFOLIO | | UNDISTRIBUTED
ORDINARY
INCOME | | | UNDISTRIBUTED
LONG-TERM
GAINS | | | ACCUMULATED
CAPITALAND
OTHER
LOSSES(a) | | | UNREALIZED
APPRECIATION/
(DEPRECIATION)(b) | | | TOTAL
ACCUMULATED
EARNINGS/
(DEFICIT) | |
Small Cap Core | | $ | 833,238 | | | $ | 0 | | | $ | (2,671,767 | ) | | $ | 39,658,401 | | | $ | 37,819,872 | |
International Small Cap | | | 15,211,458 | | | | 0 | | | | 0 | | | | 61,566,832 | | | | 76,778,290 | |
International Strategic Equities | | | 18,476,174 | | | | 2,474,182 | | | | 0 | | | | 76,878,015 | | | | 97,828,371 | |
| | (a) | As of September 30, 2016, Small Cap Core Portfolio had a net capital loss carryforward of $2,671,767. |
| | (b) | The differences between book-basis and tax-basis unrealized appreciation/(depreciation) are attributable primarily to the tax treatment of the tax deferral of losses on wash sales, the tax treatment of passive foreign investment companies (PFICs), and the realization for tax purposes of gains/losses on certain derivative instruments. |
For tax purposes, net realized capital losses may be carried over to offset future capital gains, if any. Funds are permitted to carry forward capital losses incurred in taxable years beginning after December 22, 2010 for an indefinite period, and such losses will retain their character as either short-term or long-term capital losses. As of September 30, 2016, Small Cap Core Portfolio had a net short-term capital loss carryforward of $2,671,767 which may be carried forward for an indefinite period.
| NOTE 5. | Risks Involved in Investing in the Portfolios |
Market Risk—Each Portfolio is subject to market risk, which is the risk that stock prices in general may decline over short or extended periods. In the past several years, financial markets in the United States, Europe and elsewhere have experienced increased volatility, decreased liquidity and heightened uncertainty. Recently, some securities markets, particularly in Europe and Asia, have been very volatile and have declined in value significantly. These market conditions may continue, worsen, or spread. The U.S. Government and the Federal Reserve, as well as certain foreign governments and central banks, have taken steps to support financial markets, including by keeping interest rates low. Other governments have tried to support markets by buying stocks and through other market interventions. Government intervention may not work as intended, particularly if the efforts are perceived by investors as being unlikely to achieve the desired results. The Federal Reserve has terminated certain of its market support activities. Further reduction or withdrawal of Federal Reserve or other U.S. or non-U.S. governmental or central bank support could negatively affect financial markets generally, raise interest rates, increase market volatility, and reduce the value and liquidity of securities in which the Portfolio invests.
Current political uncertainty surrounding the European Union (EU) and its membership may increase market volatility. For example, in June 2016, citizens of the United Kingdom voted in a referendum to leave the EU (known as “Brexit”), creating economic and political uncertainty in its wake. It is unclear how withdrawal negotiations will be conducted and what the potential consequences may be. The financial instability of some countries in the EU, including Greece, Italy and Spain, together with the risk of that financial instability impacting other more stable countries, may increase the risk of investing in companies in Europe and worldwide. In addition, policy and legislative changes in the United States and in other countries are affecting many aspects of financial regulation, and may in some instances contribute to decreased liquidity and increased volatility in the financial markets. The impact of these changes, and the practical implications for market participants, may not be fully known for some time.
Economies and financial markets throughout the world are becoming increasingly interconnected. As a result, whether or not the Portfolio invests in securities of issuers located in or with significant exposure to countries experiencing economic and financial difficulties, the value and liquidity of the Portfolio’s investments may be negatively affected.
Foreign (Non-U.S.) Securities Risk—Investments in foreign securities entail significant risks in addition to those customarily associated with investing in U.S. securities. These risks include risks related to economic, political and social instability, which could disrupt the financial markets in which the Portfolios invest and adversely affect the value of the Portfolios’ assets.
Country Concentration Risk—The Portfolios may not always be diversified among countries or regions and the effect on the share price of the Portfolios of specific risks identified above such as political, regulatory and currency may be magnified due to concentration of the Portfolios’ investments in a particular country or region.
Emerging Markets Securities Risk—The risks of investing in foreign (non-U.S.) securities are heightened with respect to issuers in emerging-market countries because the markets are less developed and less liquid and there may be a greater amount of economic, political and social uncertainty. In addition, the value of the Portfolios’ investments may decline because of factors such as unfavorable or unsuccessful government actions and reduction of government or central bank support.
Foreign Currency Risk—This is the risk that changes in foreign (non-U.S.) currency exchange rates may negatively affect the value of the Portfolio’s investments or reduce the returns of the Portfolios. For example, the value of the Portfolios’ investments in foreign stocks and foreign currency positions may decrease if the U.S. Dollar is strong (i.e., gaining value relative to other currencies) and other currencies are weak (i.e., losing value relative to the U.S. Dollar).
Actions by a Few Major Investors—In certain countries, volatility may be heightened by actions of a few major investors. For example, substantial increases or decreases in cash flows of mutual funds investing in these markets could significantly affect local stock prices and, therefore, share prices of the Portfolios.
Liquidity Risk—Liquidity risk exists when particular investments are difficult to purchase or sell, possibly preventing the Portfolios from selling out of these illiquid securities at an advantageous price. Illiquid securities may also be difficult to value. Derivatives and securities involving substantial market and credit risk tend to involve greater liquidity risk.
Redemption Risk—The Portfolios may experience heavy redemptions that could cause the Portfolios to liquidate its assets at inopportune times or at a loss or depressed value, which could cause the value of your investment to decline.
Capitalization Risk—Investments in small- and mid-capitalization companies may be more volatile than investments in large-cap companies. Investments in small-cap companies may have additional risks because these companies have limited product lines, markets or financial resources.
Allocation Risk—The Portfolios may seek to focus on different investment disciplines or factors at different times as means to achieve its investment objective. In the event that the investment disciplines or factors to which the Portfolios have greater exposure perform worse than the investment disciplines or factors with less exposure, the Portfolios’ returns may be negatively affected.
Derivatives Risk—The Portfolios may use derivatives in currency hedging strategies as well as for direct investments to gain access to certain markets, earn income, enhance return and broaden portfolio diversification, which entail greater risk than if used solely for hedging purposes. In addition to other risks such as the credit risk of the counterparty, derivatives involve the risk that changes in the value of the derivative may not correlate with relevant assets, rates or indices. Derivatives may be illiquid and difficult to price or unwind, and small changes may produce disproportionate losses for the Portfolios. Certain derivatives have the potential for unlimited loss, regardless of the size of the initial investment. Assets required to be set aside or posted to cover or secure derivatives positions may themselves go down in value, and these collateral and other requirements may limit investment flexibility. Some derivatives involve leverage, which can make the Portfolios more volatile and can compound other risks. The U.S. Government and foreign governments are in the process of adopting and implementing regulations governing derivatives markets, including mandatory clearing of certain derivatives, margin, reporting and registration requirements. The ultimate impact of the regulations remains unclear. Additional regulation may make derivatives more costly, may limit their availability or utility or otherwise adversely affect their performance, or may disrupt markets.
Management Risk—The Portfolios are subject to management risk because it is an actively managed investment portfolio. The Adviser will apply its investment techniques and risk analyses in making investment decisions for the Portfolios, but its decisions may not produce the desired results. In some cases, derivative and other investment techniques may be unavailable or the Adviser may determine not to use them, possibly even under market conditions where their use could benefit the Portfolios. In addition, the Adviser may change the Portfolios’ investment strategies or policies from time to time. Those changes may not lead to the results intended by the Adviser and could have an adverse effect on the value or performance of the Portfolios.
Notes to Financial Statements (continued)
REIT Risk—Investing in REITs involves certain unique risks in addition to those risks associated with investing in the real estate industry in general. Equity REITs may be affected by the quality of any credit extended. REITs are dependent upon management skills, are not diversified, and are subject to heavy cash flow dependency, default by borrowers and self-liquidation. Investing in REITs also involves risks similar to those associated with investing in small-capitalization companies. REITs may have limited financial resources, may trade less frequently and in a limited volume and may be subject to more abrupt or erratic price movements than larger company securities.
Investment in Other Investment Companies Risk—As with other investments, investments in other investment companies, including other AB Mutual Funds and ETFs, are subject to market and selection risk. In addition, if a Portfolio acquires shares of investment companies, shareholders bear both their proportionate share of expenses in the Portfolio (including management and advisory fees) and, indirectly, the expenses of the investment companies.
Cybersecurity Risk—Cybersecurity incidents may allow an unauthorized party to gain access to Portfolio assets, customer data (including private shareholder information), or proprietary information, or cause a Portfolio, the Adviser, and/or its service providers (including, but not limited to, fund accountants, custodians, sub-custodians, transfer agents and financial intermediaries) to suffer data breaches, data corruption or lose operational functionality.
Indemnification Risk—In the ordinary course of business, the Portfolios enter into contracts that contain a variety of indemnifications. The Portfolios’ maximum exposure under these arrangements is unknown. However, the Portfolios have not had prior claims or losses pursuant to these indemnification provisions and expect the risk of loss thereunder to be remote. Therefore, the Portfolios have not accrued any liability in connection with these indemnification provisions.
| NOTE 6. | Capital-Share Transactions |
The Fund has authorized 27 billion shares of common stock, par value $0.0001 per share. Each SCB Class, Advisor Class and Class Z of the Portfolios is allocated 1 billion shares. The balance of the authorized shares have been allocated to share classes that are currently not offered.
Share transactions for each Portfolio for the period ended September 30, 2016, were as follows:
| | | | | | | | | | |
| |
| | | SMALL CAP CORE PORTFOLIO | |
| | | | | | | | | | |
| | | |
| | | SHARES | | | | | AMOUNT | |
| | | | | | | | | | |
| | | 12/29/15(a) TO
9/30/16 | | | | | 12/29/15(a) TO
9/30/16 | |
SCB Class Shares | | | | | | | | | | |
Shares sold | | | 503,212 | | | | | $ | 4,871,414 | |
Shares issued to shareholders on reinvestment of dividends | | | 1 | | | | | | 5 | |
Shares redeemed | | | (41,305 | ) | | | | | (407,153 | ) |
| | | | | | | | | | |
Net increase | | | 461,908 | | | | | | 4,464,266 | |
Beginning of period | | | 0 | | | | | | 0 | |
| | | | | | | | | | |
End of period | | | 461,908 | | | | | $ | 4,464,266 | |
| | | | | | | | | | |
| | | | | | | | | | |
Advisor Class Shares | | | | | | | | | | |
Shares sold | | | 58,276,726 | | | | | $ | 583,858,853 | |
Shares issued to shareholders on reinvestment of dividends | | | 0 | (b) | | | | | 5 | |
Shares redeemed | | | (1,090,779 | ) | | | | | (11,110,469 | ) |
| | | | | | | | | | |
Net increase | | | 57,185,947 | | | | | | 572,748,389 | |
Beginning of period | | | 0 | | | | | | 0 | |
| | | | | | | | | | |
End of period | | | 57,185,947 | | | | | $ | 572,748,389 | |
| | | | | | | | | | |
| | | | | | | | | | |
| | | | | | | | | | |
| |
| | | SMALL CAP CORE PORTFOLIO | |
| | | | | | | | | | |
| | | |
| | | SHARES | | | | | AMOUNT | |
| | | | | | | | | | |
| | | 12/29/15(a) TO
9/30/16 | | | | | 12/29/15(a) TO
9/30/16 | |
Class Z Shares | | | | | | | | | | |
Shares sold | | | 12,203,217 | | | | | $ | 122,389,952 | |
Shares issued to shareholders on reinvestment of dividends | | | 102 | | | | | | 990 | |
Shares redeemed | | | (207,102 | ) | | | | | (1,968,523 | ) |
| | | | | | | | | | |
Net increase | | | 11,996,217 | | | | | | 120,422,419 | |
Beginning of period | | | 10,000 | | | | | | 100,000 | |
| | | | | | | | | | |
End of period | | | 12,006,217 | | | | | $ | 120,522,419 | |
| | | | | | | | | | |
| | (a) | Commencement of operations. |
| | (b) | Share amount is less than one full share. |
As of September 30, 2016, certain AllianceBernstein mutual funds owned 12% of the Small Cap Core Portfolio’s outstanding shares. Significant transactions by such shareholders, if any, may impact the Portfolio’s performance.
| | | | | | | | | | |
| |
| | | INTERNATIONAL SMALL CAP PORTFOLIO | |
| | | | | | | | | | |
| | | |
| | | SHARES | | | | | AMOUNT | |
| | | | | | | | | | |
| | | 12/21/15(a) TO
9/30/16 | | | | | 12/21/15(a) TO
9/30/16 | |
SCB Class Shares | | | | | | | | | | |
Shares sold | | | 3,523,508 | | | | | $ | 36,153,789 | |
Shares redeemed | | | (113,570 | ) | | | | | (1,184,560 | ) |
| | | | | | | | | | |
Net increase | | | 3,409,938 | | | | | | 34,969,229 | |
Beginning of period | | | 0 | | | | | | 0 | |
| | | | | | | | | | |
End of period | | | 3,409,938 | | | | | $ | 34,969,229 | |
| | | | | | | | | | |
| | | | | | | | | | |
Advisor Class Shares | | | | | | | | | | |
Shares sold | | | 34,896,865 | | | | | $ | 339,718,913 | |
Shares redeemed | | | (1,267,416 | ) | | | | | (13,172,262 | ) |
| | | | | | | | | | |
Net increase | | | 33,629,449 | | | | | | 326,546,651 | |
Beginning of period | | | 0 | | | | | | 0 | |
| | | | | | | | | | |
End of period | | | 33,629,449 | | | | | $ | 326,546,651 | |
| | | | | | | | | | |
| | | | | | | | | | |
Class Z Shares | | | | | | | | | | |
Shares sold | | | 24,250,748 | | | | | $ | 229,951,001 | |
Shares redeemed | | | (1,008,000 | ) | | | | | (9,541,180 | ) |
| | | | | | | | | | |
Net increase | | | 23,242,748 | | | | | | 220,409,821 | |
Beginning of period | | | 10,000 | | | | | | 100,000 | |
| | | | | | | | | | |
End of period | | | 23,252,748 | | | | | $ | 220,509,821 | |
| | | | | | | | | | |
| | (a) | Commencement of operations. |
Notes to Financial Statements (continued)
As of September 30, 2016, certain AllianceBernstein mutual funds owned 12% and 26% of the International Small Cap Portfolio’s outstanding shares, respectively. Significant transactions by such shareholders, if any, may impact the Portfolio’s performance.
| | | | | | | | | | |
| |
| | | INTERNATIONAL STRATEGIC EQUITIES PORTFOLIO | |
| | | | | | | | | | |
| | | |
| | | SHARES | | | | | AMOUNT | |
| | | | | | | | | | |
| | | 12/21/15(a) TO
9/30/16 | | | | | 12/21/15(a) TO
9/30/16 | |
SCB Class Shares | |
Shares sold | | | 6,707,227 | | | | | $ | 67,376,960 | |
Shares issued to shareholders on reinvestment of dividends | | | 1 | | | | | | 4 | |
Shares redeemed | | | (178,970 | ) | | | | | (1,832,999 | ) |
| | | | | | | | | | |
Net increase | | | 6,528,258 | | | | | | 65,543,965 | |
Beginning of period | | | 0 | | | | | | 0 | |
| | | | | | | | | | |
End of period | | | 6,528,258 | | | | | $ | 65,543,965 | |
| | | | | | | | | | |
| | | | | | | | | | |
Advisor Class Shares | |
Shares sold | | | 72,141,616 | | | | | $ | 699,986,523 | |
Shares issued to shareholders on reinvestment of dividends | | | 1 | | | | | | 5 | |
Shares redeemed | | | (2,356,484 | ) | | | | | (23,990,138 | ) |
| | | | | | | | | | |
Net increase | | | 69,785,133 | | | | | | 675,996,390 | |
Beginning of period | | | 0 | | | | | | 0 | |
| | | | | | | | | | |
End of period | | | 69,785,133 | | | | | $ | 675,996,390 | |
| | | | | | | | | | |
| | | | | | | | | | |
Class Z Shares | |
Shares sold | | | 40,341,955 | | | | | $ | 393,857,001 | |
Shares issued to shareholders on reinvestment of dividends | | | 252 | | | | | | 2,540 | |
Shares redeemed | | | (507,252 | ) | | | | | (4,824,198 | ) |
| | | | | | | | | | |
Net increase | | | 39,834,955 | | | | | | 389,035,343 | |
Beginning of period | | | 10,000 | | | | | | 100,000 | |
| | | | | | | | | | |
End of period | | | 39,844,955 | | | | | $ | 389,135,343 | |
| | | | | | | | | | |
| | (a) | Commencement of operations. |
As of September 30, 2016, certain AllianceBernstein mutual funds owned 11% and 23% of the International Strategic Equities Portfolio’s outstanding shares, respectively. Significant transactions by such shareholders, if any, may impact the Portfolio’s performance.
Prior to commencement of operations, the Portfolios had no operations other than the sale of Class Z Shares to the Adviser of 10,000 shares at $10 per share for each Portfolio.
| NOTE 7. | New Accounting Pronouncement |
In May 2015, the Financial Accounting Standards Board issued an Accounting Standards Update, ASU 2015-07 (the “ASU”) which removes the requirement to categorize within the fair value hierarchy all investments for which fair value is measured using the net asset value per share practical expedient. The ASU also removes the requirement to make certain disclosures for investments that are eligible to be measured at fair value using the net asset value per share
practical expedient but do not utilize that practical expedient. The ASU is effective for annual periods beginning after December 15, 2015 and interim periods within those annual periods. At this time, management is evaluating the implications of these changes on the financial statements.
In October 2016, the U.S. Securities and Exchange Commission adopted new rules and amended existing rules (together, “final rules”) intended to modernize the reporting and disclosure of information by registered investment companies. In part, the final rules amend Regulation S-X and require standardized, enhanced disclosure about derivatives in investment company financial statements, as well as other amendments. The compliance date for the amendments to Regulation S-X is August 1, 2017. Management is currently evaluating the impact that the adoption of the amendments to Regulation S-X will have on the financial statements and related disclosures.
Management has evaluated subsequent events for possible recognition or disclosure in the financial statements through the date the financial statements are issued. Management has determined that there are no other material events that would require disclosure in the Portfolios’ financial statements through this date.
Report of Independent Registered Public Accounting Firm
To the Board of Directors and Shareholders of Bernstein Fund, Inc.:
In our opinion, the accompanying statement of assets and liabilities, including the schedule of investments, and the related statements of operations and of changes in net assets and the financial highlights present fairly, in all material respects, the financial position of Small Cap Core Portfolio, International Small Cap Portfolio, and International Strategic Equities Portfolio (three portfolios constituting Bernstein Fund, Inc., hereafter referred to as the “Fund”) at September 30, 2016, the results of each of their operations, the changes in each of their net assets and the financial highlights for each of the periods presented, in conformity with accounting principles generally accepted in the United States of America. These financial statements and financial highlights (hereafter referred to as “financial statements”) are the responsibility of the Fund’s management. Our responsibility is to express an opinion on these financial statements based on our audits. We conducted our audits of these financial statements in accordance with the standards of the Public Company Accounting Oversight Board (United States). Those standards require that we plan and perform the audit to obtain reasonable assurance about whether the financial statements are free of material misstatement. An audit includes examining, on a test basis, evidence supporting the amounts and disclosures in the financial statements, assessing the accounting principles used and significant estimates made by management, and evaluating the overall financial statement presentation. We believe that our audits, which included confirmation of securities at September 30, 2016 by correspondence with the custodian and brokers, provide a reasonable basis for our opinion.
PricewaterhouseCoopers LLP
New York, New York
November 28, 2016
2016 Federal Tax Information (Unaudited)
For Federal income tax purposes, the following information is furnished with respect to the distributions paid by each applicable Portfolio during the taxable year ended September 30, 2016. For corporate shareholders, the following percentages of dividends paid by each Portfolio qualify for the dividends received deduction.
| | | | | | | | |
| PORTFOLIO | | DIVIDENDS RECEIVED DEDUCTION %
(CORPORATE SHAREHOLDERS) | | | | |
Small Cap Core | | | 100.00 | % | | | | |
For the taxable year ended September 30, 2016, each Portfolio designates the following amounts as the maximum amount that may be considered qualified dividend income for individual shareholders.
| | | | | | | | |
| PORTFOLIO | | QUALIFIED DIVIDEND INCOME | | | | |
Small Cap Core | | $ | 1,000 | | | | | |
International Strategic Equities | | | 2,245 | | | | | |
Shareholders should not use the above information to prepare their income tax returns. The information necessary to complete your income tax returns will be inculded with your Form 1099-DIV which will be sent to you seperately in January 2017.
Bernstein Fund, Inc.
BOARDOF DIRECTORS
Bart Freidman(1)
Chairman
Seth Masters
President
Suzanne Brenner(1)
Director
R. Jay Gerken(1)
Director
William Kristol(1)
Director
Debra Perry(1)
Director
Donald Peterson(1)
Director
OFFICERS
Philip L. Kirstein,
Senior Vice President and Independent Compliance Officer
Andrew Birse(2),
Vice President
Peter Chocian(2),
Vice President
Liliana Dearth(2),
Vice President
Serdar Kalaycioglu(2),
Vice President
Samantha Lau(2),
Vice President
Stuart Rae(2),
Vice President
Shri Singhvi(2),
Vice President
Sammy Suzuki(2),
Vice President
Nelson Yu(2),
Vice President
Joseph J. Mantineo,
Treasurer and Chief Financial Officer
Emilie D. Wrapp,
Secretary
Phyllis J. Clarke,
Controller
Vincent S. Noto,
Chief Compliance Officer
CUSTODIANAND ACCOUNTING AGENT
State Street Bank and Trust Company
State Street Corporation CCB/5
1 Iron Street
Boston, MA 02210
PRINCIPAL UNDERWRITER
AllianceBernstein Investments, Inc.
1345 Avenue of the Americas
New York, NY 10105
TRANSFER AGENT
AllianceBernstein Investor Services, Inc.
P.O. Box 786003
San Antonio, TX 78278-6003
Toll-Free (800) 221-5672
INDEPENDENT REGISTEREDPUBLIC ACCOUNTING FIRM
PricewaterhouseCoopers LLP
300 Madison Avenue
New York, NY 10017
LEGAL COUNSEL
Willkie Farr & Gallagher LLP
787 Seventh Avenue
New York, NY 10019-6099
(1) Member of the Audit Committee, the Governance and Nominating Committee and the Independent Directors Committee.
(2) The day-to-day management of, and investment decisions for, the Portfolios are made by the senior management teams. Messrs. Rae and Suzuki are the investment professionals with the most significant responsibility for the day-to-day management of the International Strategic Equities Portfolio. Ms. Dearth and Messrs. Birse, Chocian and Yu are the investment professionals with the most significant responsibility for the day-to-day management of the International Small Cap Portfolio. Ms. Lau and Messrs. Kalaycioglu and Singhvi are the investment professionals with the most significant responsibility for the day-to-day management of the Small Cap Core Portfolio.
| | | | | | | | |
DIRECTORS’ INFORMATION | | | |
Name, Address+, Age,
(year of Election*) | | Principal Occupation(s)
During Past 5 Years and Other Information | | Portfolios in
Fund Complex
Overseen
By Director | | | Other Public Company
Directorships Currently
Held by Director |
INTERESTED DIRECTOR | | | | | | |
Seth Masters,† c/o AllianceBernstein L.P. 1345 Avenue of the Americas New York, NY 10105 57 (2015) | | Senior Vice President of the Adviser with which he has been associated since prior to 2011. He is Chief Investment Officer (“CIO”) of Bernstein. From 2010 to 2013, he was CIO for Asset Allocation, overseeing the firm’s Dynamic Asset Allocation, Target Date, Target Risk and Indexed services. From 2008 to 2010, he was head of AB’s Defined Contribution business unit. From 2002 to 2008, he was Chief Investment Officer of Blend Strategies. From 1994 to 2002, he was CIO of Emerging Market Value Equities. He joined Bernstein in 1991 as a research analyst covering global financial firms. Prior to joining AB, Mr. Masters worked as a senior associate at Booz, Allen & Hamilton from 1986 to 1990 and taught economics in China from 1983 to 1985. | | | 20 | | | Chair of the Wenner-Gren Foundation Board; and Chair of the Finance Committee of Bennington College until 2011 |
DISINTERESTED DIRECTORS | | | | | | |
Bart Friedman,‡^ Chairman of the Board 71 (2015) | | Senior Partner at Cahill Gordon & Reindel LLP (law firm) since prior to 2011. | | | 20 | | | Chair of the Audit Committee of The Brookings Institution; Chair of the Audit and Compensation Committees of Lincoln Center for the Performing Arts; Allied World Assurance Holdings; and Ovid Therapeutics, Inc. |
| | | |
Suzanne Brenner,‡ 58 (2015) | | Senior Vice President and Chief Investment Officer (CIO) of the Metropolitan Museum of Art, which she joined in 1999. Ms. Brenner is a Certified Public Accountant in the state of New York. Previously, she held many investment management and finance positions with various public and private entities, including the Rockefeller Foundation (1994-1999), through a private equity firm, QCS, Inc. (1992-1994), and Ernst & Young LLP (1981-1992). She is a member of the Emerita Council of 100 Women in Hedge Funds, a global association of more than 10,000 professional women since 2008, and previously served on the Board of Directors of The Investment Fund for Foundations (“TIFF”) from 2003 until 2010. | | | 20 | | | 100 Women in Hedge Funds (through December 31, 2014) |
Bernstein Fund, Inc. (continued)
| | | | | | | | |
DIRECTORS’ INFORMATION (continued) | | | |
Name, Address+, Age,
(year of Election*) | | Principal Occupation(s)
During Past 5 Years and Other Information | | Portfolios in
Fund Complex
Overseen
By Director | | | Other Public Company
Directorships Currently
Held by Director |
R. Jay Gerken,‡ 65 (2015) | | Formerly, President and Chief Executive Officer of Legg Mason Partners Fund Advisor, LLC, and President & Board Member of The Legg Mason and Western Asset mutual funds from 2005 until June 2013. Previously, he was the President and Chair of the funds boards of the Citigroup Asset Management mutual funds (2002-2005); Portfolio Manager and Managing Director, Smith Barney Asset Management (1993-2001) and President & CEO, Directions Management of Shearson Lehman, Inc. (1988-1993). | | | 20 | | | Cedar Lawn Corporation; Trustee of the New Jersey Chapter of the Nature Conservancy; Trustee of the United Methodist Foundation of New Jersey; and Associated Banc-Corp |
| | | |
William Kristol,‡ 63 (2015) | | Editor, The Weekly Standard since prior to 2011. He is a regular contributor on ABC’s This Week and on ABC’s special events and elections coverage, and appears frequently on other leading political commentary shows. | | | 20 | | | Manhattan Institute, John M. Ashbrook Center for Public Affairs at Ashland University; The Salvatori Center at Claremont McKenna College; The Shalem Foundation; and The Institute for the Study of War |
| | | |
Debra Perry,‡ 65 (2015) | | Formerly, Senior Managing Director of Global Ratings and Research, Moody’s Investors Service, Inc. from 2001 to 2004; Chief Administrative Officer, Moody’s, from 1999 to 2001; Chief Credit Officer, Moody’s, from 2000 to 2001; Group Managing Director for the Finance, Securities and Insurance Ratings Groups, Moody’s Corp., from 1996 to 1999; Earlier she held executive positions with First Boston Corporation and Chemical Bank. | | | 20 | | | PartnerRe, from 2013-2016; Korn/Ferry International; Bank of America Funds Series Trust, from 2014-2016; and CNO Financial Group since prior to 2011 |
| | | | | | | | |
DIRECTORS’ INFORMATION (continued) | | | |
Name, Address+, Age,
(year of Election*) | | Principal Occupation(s)
During Past 5 Years and Other Information | | Portfolios in
Fund Complex
Overseen
By Director | | | Other Public Company
Directorships Currently
Held by Director |
Donald K. Peterson,‡ 67 (2015) | | Formerly, Chairman and Chief Executive Officer, Avaya Inc. from 2002 to 2006; President and Chief Executive Officer, Avaya Inc. from 2000 to 2001; President, Enterprise Systems Group in 2000; Chief Financial Officer, Lucent Technologies from 1996 to 2000; Chief Financial Officer, AT&T, Communications Services Group from 1995 to 1996; President, Nortel Communications Systems, Inc. from 1994 to 1995. Prior thereto, he was at Nortel from 1976 to 1995. | | | 20 | | | Worcester Polytechnic Institute, (Emeritus); Member of the Board of TIAA-CREF; and Member of the Board of TIAA-CREF Trust Company, FSB |
* There is no stated term of office for the Directors.
+ The address for each of the Fund’s Disinterested Directors is c/o AllianceBernstein L.P., Attention: Philip L. Kirstein, 1345 Avenue of the Americas, New York, NY 10105.
† Mr. Masters is an “interested person” as defined by the Investment Company Act of 1940, because of his affiliation with AllianceBernstein.
‡ Member of the Audit Committee, the Nominating, Governance and Compensation Committee and the Independent Directors Committee.
^ Member of the Fair Value Pricing Committee.
Bernstein Fund, Inc. (continued)
| | | | |
MANAGEMENTOFTHE FUND |
| Name, Address,* and Age | | Principal Position(s)
Held with Fund | | Principal Occupation
During Past 5 Years |
Seth Masters, 57 | | President | | See biography above. |
| | |
Philip L. Kirstein, 71 | | Senior Vice President and Independent Compliance Officer | | Senior Vice President and Independent Compliance Officer of the AB Funds, with which he has been associated since October 2004. Prior thereto, he was Of Counsel to Kirkpatrick & Lockhart, LLP from October 2003 to October 2004, and General Counsel of Merrill Lynch Investment Managers, L.P., since prior to March 2003. |
| | |
Andrew Birse, 38 | | Vice President | | Senior Vice President of the Manager**, with which he has been associated since prior to 2011. |
| | |
Peter Chocian, 44 | | Vice President | | Vice President of the Manager**, with which he has been associated since prior to 2011. |
| | |
Liliana Dearth, 48 | | Vice President | | Senior Vice President of the Manager**, with which she has been associated since prior to 2011. |
| | |
Serdar Kalaycioglu, 39 | | Vice President | | Senior Vice President of the Manager**, with which he has been associated since prior to 2011. |
| | |
Samantha Lau, 44 | | Vice President | | Senior Vice President of the Manager**, with which she has been associated since prior to 2011. |
| | |
Stuart Rae, 51 | | Vice President | | Senior Vice President of the Manager**, with which he has been associated since prior to 2011. |
| | |
Shri Singhvi, 42 | | Vice President | | Senior Vice President of the Manager**, with which he has been associated since prior to 2011. |
| | |
Sammy Suzuki, 45 | | Vice President | | Senior Vice President of the Manager**, with which he has been associated since prior to 2011. |
| | |
Nelson Yu, 45 | | Vice President | | Senior Vice President of the Manager**, with which he has been associated since prior to 2011. |
| | | | |
MANAGEMENTOFTHE FUND (continued) |
| Name, Address,* and Age | | Principal Position(s)
Held with Fund | | Principal Occupation
During Past 5 Years |
Emilie D. Wrapp, 61 | | Secretary | | Senior Vice President, Assistant General Counsel and Assistant Secretary of ABI**, with which she has been associated since prior to 2011. |
| | |
Joseph J. Mantineo, 57 | | Treasurer and Chief Financial Officer | | Senior Vice President of AllianceBernstein Investor Services (“ABIS”)**, with which he has been associated since prior to 2011. |
| | |
Phyllis J. Clarke, 55 | | Controller | | Vice President of ABIS**, with which she has been associated since prior to 2011. |
| | |
Vincent S. Noto, 51 | | Chief Compliance Officer | | Senior Vice President since 2015 and Mutual Fund Chief Compliance Officer of the Manager** since 2014. Prior thereto, he was Vice President and Director of Mutual Fund Compliance of the Manager** since prior to 2011. |
* The address for each of the Fund’s Officers is 1345 Avenue of the Americas, New York, NY 10105.
** The Manager, ABI and ABIS are affiliates of the Fund.
The Fund’s Statement of Additional Information (“SAI”) has additional information about the Fund’s Directors and Officers and is available without charge upon request. Contact your financial representative or AB at 212-486-5800, or visit www.bernstein.com, for a free prospectus or SAI.
The Following Is Not Part of the Shareholder Report or the Financial Statements
SUMMARY OF SENIOR OFFICER’S EVALUATION OF INVESTMENT ADVISORY AGREEMENT1
The following is a summary of the evaluation of the Investment Advisory Agreement between AllianceBernstein L.P. (the “Adviser”) and the Bernstein Fund, Inc. (the “Fund”) with respect to the following new Portfolios.
International Strategic Equities Portfolio
International Small Cap Portfolio
Small Cap Core Portfolio
The evaluation of the Investment Advisory Agreement was prepared by Philip L. Kirstein, the Senior Officer of the Fund, for the Directors of the Fund, as required by the September 1, 2004 Assurance of Discontinuance (“AoD”) between the Adviser and the New York State Attorney General (the “NYAG”). The Senior Officer’s evaluation of the Investment Advisory Agreement is not meant to diminish the responsibility or authority of the Board of Directors of the Fund to perform its duties pursuant to Section 15 of the Investment Company Act of 1940 (the “40 Act”) and applicable state law. The purpose of the summary is to provide shareholders with a synopsis of the independent evaluation of the fairness of the advisory fees proposed to be paid by the Portfolios which was provided to the Directors in connection with their review of the proposed initial approval of the Investment Advisory Agreement.2
International Strategic Equities Portfolio
International Strategic Equity Portfolio’s investment objective will be long-term growth of capital. The Portfolio will seek to achieve this investment objective by investing primarily in equity securities of non-U.S. companies and in companies located in at least three countries other than the United States. Under normal circumstances, the Portfolio will invest at least 80% of its net assets in equity securities, which will primarily be common stocks but may also include preferred stocks, warrants, convertible securities, and sponsored and unsponsored American Depository Receipts (“ADRs”) and Global Depository Receipts (“GDRs”). The Portfolio’s holdings focus on securities of large-cap and mid-cap companies, and will generally include some securities of emerging market companies.
The Adviser will utilize quantitative and fundamental (bottom-up) analyses in managing International Strategic Equities Portfolio. In its quantitative analysis, the Adviser will consider a number of metrics relating to valuation, quality, and investor and corporate behavior.
The Adviser may utilize derivatives, such as currency derivatives and stock index futures, in the management of International Strategic Equities Portfolio for a variety of reasons, including hedging purposes, reducing currency risk and gaining access to certain markets.
The Adviser proposed that International Strategic Equities Portfolio’s benchmark be the MSCI ACWI ex-US Index (net unhedged). The Adviser expects Lipper and Morningstar to place the Portfolio in their respective International Multi-Cap Core and Foreign Large Blend categories.
International Small Cap Portfolio
International Small Cap Portfolio’s investment objective will be long-term growth of capital. The Portfolio will seek to achieve the investment objective by investing primarily in equity securities of non-U.S. companies and in companies located in at least three countries other than the United States. Under normal circumstances, at least 80% of the Portfolio’s net assets will be invested in equity securities of small capitalization companies and related derivatives. The Portfolio may at times make significant investments in emerging market companies. The Portfolio will consist of three separate portions or “sleeves” with each using a different investment strategy: international growth, international value, and quantitative.
1 It should be noted that the Senior Officer’s evaluation was completed on August 27, 2015 and discussed with the Board on September 10 and 17, 2015.
2 The Adviser also proposed changes to the investment policies of the Overlay Portfolios (Tax-Aware A Portfolio and Overlay A Portfolio) of the Sanford C. Bernstein Fund, Inc. (“SCB”) that would permit the SCB Overlay Portfolios to invest a portion of their assets in the new Portfolios and other existing Portfolios (“Legacy Portfolios”) of SCB. In addition, under an Acquired Fund Fee and Expense Waiver Agreement for the SCB Overlay Portfolios, the Adviser will waive its fees and/or reimburse portfolio expenses in an amount equal to the SCB Overlay Portfolios’ share of all fees and expenses of the new Portfolios and the SCB Legacy Portfolios in which the SCB Overlay Portfolios may invest.
The Adviser may utilize derivatives, such as currency derivatives and stock index futures, in the management of International Small Cap Portfolio for a variety of reasons, including hedging purposes, reducing currency risk and gaining access to certain markets.
The Adviser proposed that International Small Cap Portfolio’s benchmark be the MSCI ACWI ex-US Small Cap Index (net unhedged). The Adviser expects Lipper and Morningstar to place the Portfolio in their respective International Small/Mid-Cap Core and International Small/Mid Core categories.
Small Cap Core Portfolio
Small Cap Core Portfolio’s investment objective will be long-term growth of capital. Under normal circumstances, at least 80% of the Portfolio’s net assets will be invested in equity securities of small capitalization companies and related derivatives.
The Adviser may utilize derivatives in the management of the Portfolio. For example, the Adviser may use stock index future to gain access to certain markets.
The Adviser utilizes both quantitative analysis and fundamental research to determine which securities will be held by the Portfolio and to manage risk. In its quantitative analysis, the Adviser will consider a number of metrics relating to valuation, quality, and investor and corporate behavior.
The Adviser proposed that Small Cap Core Portfolio’s benchmark be the Russell 2000 Index and expects Lipper and Morningstar to place the Portfolio in their respective Small-Cap Core and US Small Blend categories.
The Senior Officer’s evaluation considered the following factors:
| | 1. | | Management fees charged to institutional and other clients of the Adviser for like services; |
| | 2. | | Management fees charged by other mutual fund companies for like services; |
| | 3. | | Costs to the Adviser and its affiliates of supplying services pursuant to the advisory agreements, excluding any intra-corporate profit; |
| | 4. | | Profit margins of the Adviser and its affiliates from supplying such services; |
| | 5. | | Possible economies of scale as the Portfolios grow larger; and |
| | 6. | | Nature and quality of the Adviser’s services including the performance of the Portfolios. |
These factors, with the exception of the first factor, are generally referred to as the “Gartenberg factors,” which were articulated by the United States Court of Appeals for the Second Circuit in 1982. Gartenberg v. Merrill Lynch Asset Management, Inc., 694 F. 2d 923 (2d Cir. 1982). The first factor is an additional factor required to be considered by the AoD between the NYAG and the Adviser. On March 30, 2010, the Supreme Court held the Gartenberg decision was correct in its basic formulation of what Section 36(b) requires: to face liability under Section 36(b), “an investment adviser must charge a fee that is so disproportionately large that it bears no reasonable relationship to the services rendered and could not have been the product of arm’s length bargaining.” Jones v. Harris Associates L.P., 130 S. Ct. 1418 (2010). In the Jones decision, the Court stated the Gartenberg approach fully incorporates the correct understanding of fiduciary duty within the context of Section 36(b) and noted with approval that “Gartenberg insists that all relevant circumstances be taken into account” and “uses the range of fees that might result from arm’s-length bargaining as the benchmark for reviewing challenged fees.”3
3 Jones v. Harris at 1427.
The Following Is Not Part of the Shareholder Report or the Financial Statements (continued)
PORTFOLIOS’ ADVISORY FEES, EXPENSE REIMBURSEMENTS & RATIOS
The Adviser proposed that the Portfolios pay the advisory fees in the table below for receiving the services to be provided pursuant to the Investment Advisory Agreement:
| | |
| PORTFOLIO | | ADVISORY FEE SCHEDULE BASED ON
AVERAGE DAILY NET ASSETS |
International Strategic Equities Portfolio | | 0.925% on the first $1 billion 0.85% on the next $3 billion 0.80% on the next $2 billion 0.75% on the next $2 billion 0.65% on the next $2 billion 0.60% on the balance |
International Small Cap Portfolio | | 1.00% of average net assets (flat fee) |
| Small Cap Core Portfolio | | 0.80% of average net assets (flat fee) |
The proposed advisory fee schedule for International Strategic Equities Portfolio is identical to that of SCB Tax-Managed International Portfolio and SCB International Portfolio, with the exception of the 5 basis points advisory fee waiver, effective for both Portfolios through October 31, 2015.
The proposed Expense Limitation Agreement for the Portfolios provides for the Adviser to establish expense caps, set forth below, for a one year period after commencement of the public offering of the Portfolios. The Portfolios’ Expense Limitation Agreement provides a mechanism for reimbursing the Adviser for its expense cap subsidies. Under the agreement, the Adviser may be able to recoup all or a portion of the amounts waived or reimbursed until the end of three fiscal years after the fiscal period in which the amounts were waived or reimbursed to the extent that the reimbursements do not cause the expense ratios of the Portfolios’ share classes to exceed their expense caps. The Adviser’s ability to recoup expenses will terminate with the agreement. With respect to Small Cap Core Portfolio, the Adviser expects the Portfolio’s operating expenses to be below the expense cap for shares of the SCB Class, the Advisor Class, Class A, Class C, Class I and Class Z. Accordingly, for those share classes of Small Cap Core Portfolio, the expense undertaking limitation will be of no effect.
| | | | | | | | | | | | |
| PORTFOLIO | | EXPENSE CAP PURSUANT TO
EXPENSE LIMITATION
UNDERTAKING | | | ESTIMATED GROSS EXPENSE RATIO4 | | | FISCAL YEAR END |
International Strategic Equities Portfolio | | SCB Class
Advisor Class A Class C Class R Class K Class I Class Z | |
| 1.20
0.95 1.20 1.95 1.45 1.20 0.95 0.95 | %
% % % % % % % | |
| 1.30
1.08 1.44 2.19 1.80 1.49 1.16 1.06 | %
% % % % % % % | | September |
| | | | | | | | | | | | |
International Small Cap Portfolio | | SCB Class
Advisor Class A Class C Class R Class K Class I Class Z | |
| 1.35
1.10 1.35 2.10 1.60 1.35 1.10 1.10 | %
% % % % % % % | |
| 1.40
1.22 1.54 2.29 1.90 1.59 1.26 1.16 | %
% % % % % % % | | September |
| | | | | | | | | | | | |
4 The Portfolios’ estimated gross expense ratios are based on an initial estimate of the Portfolios’ net assets at $750 million, $350 million, and $850 million, respectively for International Strategic Equities Portfolio, International Small Cap Portfolio, and Small Cap Core Portfolio.
| | | | | | | | | | | | | | |
| PORTFOLIO | | EXPENSE CAP PURSUANT TO
EXPENSE LIMITATION
UNDERTAKING | | | ESTIMATED GROSS EXPENSE RATIO4 | | | FISCAL YEAR END | |
Small Cap Core Portfolio | | SCB Class
Advisor Class A Class C Class R Class K Class I Class Z | |
| 1.30
1.05 1.30 2.05 1.55 1.30 1.05 1.05 | %
% % % % % % % | |
| 1.13
0.93 1.27 2.03 1.63 1.32 0.99 0.89 | %
% % % % % % % | | | September | |
| I. | | MANAGEMENT FEES CHARGED TO INSTITUTIONAL AND OTHER CLIENTS |
The management fees charged to investment companies that the Adviser manages and sponsors are usually higher than those charged to similar-sized institutional accounts, including pension plans and sub-advised investment companies. The fee differential reflects, among other things, different services provided to such clients and different liabilities assumed. Services to be provided by the Adviser to the Portfolios that are not provided to non-investment company clients and sub-advised investment companies will include providing office space and personnel to serve as Fund Officers, who among other responsibilities make the certifications required under the Sarbanes–Oxley Act of 2002, and coordinating with and monitoring the Portfolios’ third party service providers such as Fund counsel, auditors, custodians, transfer agents and pricing services. The accounting, administrative, legal and compliance requirements for investment companies are generally costlier than those for institutional accounts due to the greater complexities and time needed for investment companies though the Adviser will be reimbursed by the Portfolios for providing such services. Managing the cash flow of an investment company may be more difficult than managing a stable pool of assets, such as an institutional account with little cash movement in either direction, particularly if a fund has net outflows, and the Adviser is frequently forced to sell securities to raise cash for redemptions. However, managing a fund with positive cash flow may be easier at times than managing a stable pool. Finally, in recent years, investment advisers have been sued by institutional clients and have suffered reputational damage both by the attendant publicity and outcomes other than complete victories. Accordingly, the legal and reputational risks linked with institutional accounts are greater than previously thought, although still not equal to those related to the mutual fund industry.
Notwithstanding the Adviser’s view that managing an investment company is not comparable to managing other institutional accounts as the services provided are different, the Supreme Court has indicated consideration should be given to the advisory fee charged to institutional accounts with a similar investment style as the Portfolios.5 With respect to the Portfolios, there are no institutional mandates in the Adviser’s Form-ADV that have a substantially similar investment style as the Portfolios. However, the Adviser does manage certain institutional mandates that have somewhat similar investment styles as the Portfolios and their fee schedules are set forth in the table below. In addition to the institutional fee schedules, set forth below are what would have been effective advisory fees of the Portfolios had the institutional fee schedules been applicable to the Portfolios and the proposed advisory fees for the Portfolios based on the Portfolios’ projected net asset levels.6
5 The Supreme Court stated that “courts may give such comparisons the weight that they merit in light of the similarities and differences between the services that the clients in question require, but the Courts must be wary of inapt comparisons.” Among the significant differences the Supreme Court noted that may exist between services provided to mutual funds and institutional accounts are “higher marketing costs.” Jones v. Harris at 1428.
6 The Adviser has indicated that with respect to institutional accounts with assets greater than $300 million, it will negotiate a fee schedule. Discounts that are negotiated vary based upon each client relationship.
The Following Is Not Part of the Shareholder Report or the Financial Statements (continued)
| | | | | | | | |
| PORTFOLIO | | PROJECTED
NET ASSETS
($MM) | | AB INSTITUTIONAL FEE SCHEDULE | | EFFECTIVE
AB INST.
ADV. FEE
(%) | | FUND ADVISORY FEE (%) |
| International Strategic Equities Portfolio | | $750.0 | | International Style Blend 0.80% on the first $25 million 0.65% on the next $25 million 0.55% on the next $50 million 0.45% on the next $100 million 0.40% on the balance Minimum account size: $50 million | | 0.438% | | 0.925% |
| | | | | | | | |
| International Small Cap Portfolio | | $350.0 | | N/A | | N/A | | N/A |
| | | | | | | | |
| Small Cap Core Portfolio | | $850.0 | | U.S. Small Cap Growth 1.00% on the first $50 million 0.85% on the next $50 million 0.75% on the balance Minimum account size $25 million | | 0.771% | | 0.800% |
| | | | | | | | |
| Small Cap Core Portfolio | | $850.0 | | U.S. Small Cap Value 1.00% on the first $25 million 0.90% on the next $25 million 0.75% on the balance Minimum account size $25 million | | 0.762% | | 0.800% |
The Adviser also manages the AB Mutual Funds (“ABMF”), which are registered investment companies. The advisory fee schedules of most of the AB Mutual Funds in existence at the time of the settlement were affected by the AoD, which contemplates eight categories with almost all of the AB Mutual Funds in each category having the same fee schedule. Certain of the eight categories are applicable to the Portfolios and the advisory fee schedules of those categories are set forth below. Also below are the effective fees of the Portfolios and what would have been the effective advisory fees of the Portfolios had the NYAG category fee schedules been applicable to the Portfolios based on the Portfolios’ projected net assets:
| | | | | | | | |
| PORTFOLIO | | NYAG CATEGORY | | ABMF FEE SCHEDULE | | ABMF EFFECTIVE
FEE | | PORTFOLIO ADVISORY FEE |
| International Strategic Equities Portfolio7 | | International | | 75 bp on 1st $2.5 billion 65 bp on next $2.5 billion 60 bp on the balance | | 0.750% | | 0.925% |
| | | | | | | | |
| International Small Cap Portfolio7 | | International | | 75 bp on 1st $2.5 billion 65 bp on next $2.5 billion 60 bp on the balance | | 0.750% | | 1.000% |
| | | | | | | | |
| Small Cap Core Portfolio8 | | Specialty | | 75 bp on 1st $2.5 billion 65 bp on next $2.5 billion 60 bp on the balance | | 0.750% | | 0.800% |
7 The two international AB Mutual Funds that follow the International category are AB International Growth Fund, Inc. and AB International Value Fund.
8 The AB Mutual Fund whose investment strategy is somewhat similar to that of Small Cap Core Portfolio and falls within the Specialty category is AB Small Cap Growth Portfolio.
The Adviser also manages certain AB Mutual Funds that have somewhat similar investment styles as the Portfolios and whose advisory fee schedules, set forth in the table below, do not follow the NYAG category fee schedules.
| | | | | | | | |
| PORTFOLIO | | ABMF FUND | | ABMF FEE SCHEDULE | | ABMF EFFECTIVE
FEE | | PORTFOLIO ADVISORY FEE |
| International Strategic Equities Portfolio | | AB Concentrated International Portfolio | | 85 bp (flat fee) | | 0.850% | | 0.925% |
| | | | | | | | |
| Small Cap Core Portfolio | | AB US Small Cap Value Portfolio | | 80 bp (flat fee) | | 0.800% | | 0.800% |
The AllianceBernstein Variable Products Series Fund, Inc. (“AVPS”), which is managed by the Adviser and available through variable annuity and variable life contracts offered by other financial institutions, offers policy holders the option to utilize the AVPS portfolios as the investment option underlying their insurance contracts. Certain AVPS portfolios have a somewhat similar investment style as the Portfolios and their advisory fee schedule are set forth in the table below. Also shown are the Portfolios’ effective advisory fees and what would have been the effective advisory fees of the Portfolios had the AVPS fee schedules been applicable to the Portfolios based on the Portfolios’ projected net assets:
| | | | | | | | |
| PORTFOLIO | | AVPS PORTFOLIO | | AVPS FEE SCHEDULE | | AVPS EFFECTIVE FEE | | PORTFOLIO ADVISORY FEE |
| International Strategic Equities Portfolio | | International Value Portfolio / International Growth Portfolio | | 75 bp on 1st $2.5 billion 65 bp on next $2.5 billion 60 bp on the balance | | 0.750% | | 0.925% |
| | | | | | | | |
| Small Cap Core Portfolio | | Small Cap Growth Portfolio / Small/Mid Cap Value Portfolio | | 75 bp on 1st $2.5 billion 65 bp on next $2.5 billion 60 bp on the balance | | 0.750% | | 0.800% |
The Adviser also manages and sponsors retail mutual funds, organized in jurisdictions outside the United States, generally Luxembourg, Japan and Taiwan, and sold to non-United States resident investors. The Adviser charges the following fees for AB US Small and Mid-Cap Portfolio (UCITS), a Luxembourg fund with a similar investment style as Small Cap Core Portfolio:
| | | | |
| PORTFOLIO | | LUXEMBOURG FUND | | FEE9 |
| Small Cap Core Portfolio | | US Small and Mid-Cap Portfolio (UCITS) | | |
| | Class A | | 1.60% |
| | | Class I (Institutional) | | 0.80% |
The Adviser provides sub-advisory investment services to certain other investment companies managed by other fund families. The Adviser charges the fees set forth below for the following sub-advisory relationships that have somewhat similar investment styles as the Portfolios. Also shown are the Portfolios’ advisory fees and the effective advisory fees of the sub-advisory relationships based on the Portfolios’ projected net assets:
| | | | | | | | |
| PORTFOLIO | | SUB-ADVISED FUND | | SUB-ADVISED FUND FEE SCHEDULE | | SUB-ADVISED
FUND EFFECTIVE
FEE (%) | | PORTFOLIO
ADVISORY FEE (%) |
| International Strategic Equities Portfolio | | Client #110,11 | | AB Sub-Advisory Fee Schedule: 0.60% on the first $1 billion 0.55% on the next $500 million 0.50% on the next $500 million 0.45% on the next $500 million 0.40% on the balance | | 0.600% | | 0.925% |
9 Class A shares of the Luxembourg funds are charged an “all-in” fee, which covers investment advisory and distribution related services.
10 The sub-advised relationship is with an affiliate of the Adviser.
11 Assets are aggregated with other client account portfolios for purposes of calculating the investment advisory fee.
The Following Is Not Part of the Shareholder Report or the Financial Statements (continued)
| | | | | | | | |
| PORTFOLIO | | SUB-ADVISED FUND | | SUB-ADVISED FUND FEE SCHEDULE | | SUB-ADVISED
FUND EFFECTIVE
FEE (%) | | PORTFOLIO
ADVISORY FEE (%) |
| Small Cap Core Portfolio | | Client #110,11 | | AB Sub-Advisory Fee Schedule: 0.60% on the first $1 billion 0.55% on next $500 million 0.50% on next $500 million 0.45% on next $500 million 0.40% on the balance | | 0.600% | | 0.800% |
| | | | | | | | |
| | Client #110,11 | | AB Sub-Advisory Fee Schedule: 0.55% of average daily net assets | | 0.550% | | 0.800% |
| | | | | | | | |
| | Client #2 | | AB Sub-Advisory Fee Schedule: 0.65% on the first $25 million 0.60% on next $75 million 0.55% on the balance | | 0.554% | | 0.800% |
| | | | | | | | |
| | Client #3 | | AB Sub-Advisory Fee Schedule: 0.45% of average daily net assets | | 0.450% | | 0.800% |
| | | | | | | | |
| | | Client #4 | | AB Sub-Advisory Fee Schedule: 0.85% on the first $50 million 0.75% on the balance | | 0.770% | | 0.800% |
It is fair to note that the services the Adviser provides pursuant to sub-advisory agreements are generally confined to the services related to the investment process; in other words, they are not as comprehensive as the services to be provided to the Portfolios by the Adviser. In addition, to the extent that certain of these sub-advisory relationships are with affiliates of the Adviser, the fee schedules may not reflect arm’s-length bargaining or negotiations.
While it appears that certain sub-advisory relationships are paying a lower fee than the proposed advisory fees to the Portfolios, it is difficult to evaluate the relevance of such lower fees due to differences in terms of the services provided, risks involved and other competitive factors between the Portfolios and the sub-advisory relationships. There could be various business reasons why an investment adviser would be willing to provide a sub-advisory relationship investment related services at a different fee level than the fee level applicable to a registered investment company it is sponsoring where the investment adviser is providing all the services, not just investment management, generally required by a registered investment company.
| II. | | MANAGEMENT FEES CHARGED BY OTHER MUTUAL FUND COMPANIES FOR LIKE SERVICES. |
Lipper, Inc., an analytical service not affiliated with the Adviser, compared the fees charged to the Portfolios with fees charged to other investment companies for similar services by other investment advisers.12 Lipper’s analysis included the comparison of the Portfolios’ contractual management fees, estimated at the Portfolios’ projected asset levels, to the medians of the Portfolios’ Lipper Expense Groups (“EG”), and the Portfolios’ contractual management fee rankings.13,14
Lipper describes an EG as a representative sample of comparable funds. Lipper’s standard methodology for screening funds to be included in an EG entails the consideration of several fund criteria, including fund type, investment classification/objective, load type and similar 12b-1/non 12b-1 service fees, asset (size) comparability, expense components, operating structure, and expense attributes. An EG will typically consist of seven to twenty funds.
The original EG for International Small Cap Portfolio had an insufficient number of peers in Lipper’s view. Consequently, Lipper expanded the Portfolio’s EG to include peers that have similar but not the same Lipper investment classification/objective.
12 As stated previously, the Supreme Court cautioned against accepting mutual fund fee comparisons without careful scrutiny since the fees may not be the product of negotiations conducted at arm’s length. See Jones V. Harris at 1429.
13 The contractual management fee is calculated by Lipper using the Portfolio’s contractual management fee rate at a hypothetical asset level. The hypothetical asset level is based on the combined net assets of all classes of the Portfolio, rounded up to the next $25 million. Lipper’s total expense ratio information is based on the most recent annual report except as otherwise noted. A ranking of “1” would mean that the Portfolio had the lowest effective fee rate in the Lipper peer group.
14 It should be noted that Lipper does not consider average account size when constructing EGs. Funds with relatively small average account sizes tend to have a higher transfer agent expense ratio than comparable sized funds that have relatively large average account sizes.
| | | | | | | | | | | | |
| PORTFOLIO | | CONTRACTUAL
MANAGEMENT
FEE (%)15 | | | LIPPER
EG MEDIAN (%) | | | LIPPER
EG RANK | |
International Strategic Equities Portfolio | | | 0.925 | | | | 0.878 | | | | 13/16 | |
International Small Cap Portfolio16 | | | 1.000 | | | | 1.019 | | | | 6/14 | |
Small Cap Core Portfolio | | | 0.800 | | | | 0.849 | | | | 8/17 | |
However, because Lipper had expanded the EG of International Small Cap Portfolio, under Lipper’s standard guidelines, the Portfolio’s Lipper Expense Universe (“EU”) was also expanded to include the universe of those peers that had a similar but not the same Lipper investment classification/objective. A “normal” EU will include peers with the same investment classification/objective as the subject Portfolio.
| | | | | | | | | | | | | | | | | | | | |
| PORTFOLIO | | TOTAL EXPENSE RATIO (%)17 | | | LIPPER EG MEDIAN (%) | | | LIPPER EG RANK | | | LIPPER EU MEDIAN (%) | | | LIPPER
EU RANK | |
International Strategic Equities Portfolio | | | 1.200 | | | | 1.265 | | | | 5/16 | | | | 1.200 | | | | 81/160 | |
International Small Cap Portfolio18 | | | 1.350 | | | | 1.530 | | | | 3/14 | | | | 1.306 | | | | 78/137 | |
Small Cap Core Portfolio | | | 1.126 | | | | 1.241 | | | | 5/17 | | | | 1.186 | | | | 196/462 | |
Based on this analysis, the Portfolios have a more favorable ranking on a total expense ratio basis than on a contractual management fee basis.
| III. | | COSTS TO THE ADVISER AND ITS AFFILIATES OF SUPPLYING SERVICES PURSUANT TO THE MANAGEMENT FEE ARRANGEMENT, EXCLUDING ANY INTRA-CORPORATE PROFIT. |
The Adviser utilizes two profitability reporting systems, which operate independently but are aligned with each other, to estimate the Adviser’s profitability in connection with investment advisory services provided to the Fund. The Senior Officer has retained a consultant to provide independent advice regarding the alignment of the two profitability systems as well as the methodologies and allocations utilized by both profitability systems. See Section IV for additional discussion.
| IV. | | PROFIT MARGINS OF THE ADVISER AND ITS AFFILIATES FOR SUPPLYING SUCH SERVICES. |
The Portfolios have not yet commenced operations. Therefore, there is no historic profitability data with respect to the Adviser’s investment services to the Portfolios.
In addition to the Adviser’s direct profits from managing the Portfolios, certain of the Adviser’s affiliates will have business relationships with the Portfolios and may earn a profit from providing other services to the Portfolios. The courts have referred to this type of business opportunity as “fall-out benefits” to the Adviser and indicated that such benefits should be factored into the evaluation of the total relationship between the Portfolios and the Adviser. Neither case law nor common business practice precludes the Adviser’s affiliates from earning a reasonable profit on this type of relationship provided the affiliates’ charges and services are competitive and the relationship otherwise complies with the 40 Act restrictions. These affiliates will provide transfer agent and distribution related services to the Portfolios and receive transfer agent fees, Rule 12b-1 payments, front-end sales loads and contingent deferred sales charges (“CDSC”).
Sanford C. Bernstein & Co. (“SCB & Co.”) will be distributor of the SCB Class shares of the Portfolios; AllianceBernstein Investments, Inc. (“ABI”) will serve as the distributor of the other classes of shares of the Portfolios, including the Advisor Class. ABI and the Adviser have disclosed in the Portfolios’ prospectus that they may make
15 The contractual management fee does not reflect any expense reimbursements made by the Portfolio to the Adviser for certain clerical, legal, accounting, administrative, and other services. In addition, the contractual management fee does not reflect any advisory fee waivers and/or expense reimbursements.
16 The Portfolio’s EG includes three other International Small/Mid Cap Core (“ISMC”) funds and ten International Small/Mid Cap Growth (“ISMG”) funds.
17 Projected total expense ratio information pertains to the Portfolios’ SCB Class shares. With respect to International Strategic Equities Portfolio and International Small Cap Portfolio, since the Portfolios are projected to operate above their expense caps, their total expense ratios reflect their expense cap levels at 1.20% and 1.35%, respectively. With respect to Small Cap Core Portfolio, the Portfolio is projected to operate below its expense cap of 1.30% with respect to SCB Class shares; accordingly, the Portfolio’s projected total expense ratio shown is lower than the expense cap level.
18 The Portfolio’s EU includes the Portfolio, the EG, and all other ISMC and ISMG funds, excluding outliers.
The Following Is Not Part of the Shareholder Report or the Financial Statements (continued)
revenue sharing payments from their own resources, in addition to resources derived from sales loads and Rule 12b-1 fees, to firms that sell shares of the Portfolios. The total amount to be paid to a financial intermediary associated with the sale of shares will generally not exceed the sum of (a) 0.25% of the current year’s fund sales by that firm and (b) 0.10% of the average daily net assets attributable to that firm over the year. In 2014, ABI paid approximately 0.05% of the average monthly assets of the AB Mutual Funds or approximately $20.4 million for distribution services and educational support (revenue sharing payments).
Fees and reimbursements for out of pocket expenses to be charged by AB Investor Services, Inc. (“ABIS”), the affiliated transfer agent for the Portfolios, are based on the level of the network account and the class of shares held by the account. ABIS also receives a fee per shareholder sub-account for each account maintained by an intermediary on an omnibus basis.
| V. | | POSSIBLE ECONOMIES OF SCALE |
The Adviser has indicated that economies of scale are being shared with shareholders through pricing to scale, breakpoints, fee reductions/waivers, and enhancement to services.
In May 2012, an independent consultant, retained by the Senior Officer, provided the Board of Directors information on the Adviser’s firm-wide average costs from 2005 through 2011 and the potential economies of scale. The independent consultant noted that from 2005 through 2007 the Adviser experienced significant growth in assets under management (“AUM”). During this period, operating expenses increased, in part to keep up with growth, and in part reflecting market returns. However, from 2008 through the first quarter of 2009, AUM rapidly and significantly decreased due to declines in market value and client withdrawals. When AUM rapidly decreased, some operating expenses categories, including base compensation and office space, adjusted more slowly during this period, resulting in an increase in average costs in relation to AUM. Since 2009, AUM has experienced less significant changes. The independent consultant noted that changes in operating expenses reflect changes in business composition and business practices in response to changes in financial markets. Finally, the independent consultant concluded that the increase in average cost and the decline in net operating margin across the Adviser since late 2008 are inconsistent with the view that there are currently reductions in average costs due to economies of scale that can be shared with clients through lower fees.
The Adviser has indicated that economies of scale are being shared with shareholders through fee structures, subsidies, and enhancement to services.19 Based on some of the professional literature that has considered economies of scale in the mutual fund industry, it is thought that to the extent economies of scale exist, they may more often exist across a fund family as opposed to a specific fund. This is because the costs incurred by the Adviser, such as investment research or technology for trading or compliance systems, can be spread across a greater asset base as the fund family increases in size. It is also possible that as the level of services required to operate a successful investment company has increased over time, and advisory firms make such investments in their business to provide services, there may be a sharing of economies of scale without a reduction in advisory fees.
Previously in September 2007, the independent consultant provided the Board of Directors an update of the Deli study on advisory fees and various fund characteristics.20 The independent consultant first reiterated the results of his previous two dimensional comparison analysis (fund size and family size) with the Board of Directors.21 The independent consultant then discussed the results of the regression model that was utilized to study the effects of various factors on advisory fees. The regression model output indicated that the bulk of the variation in fees predicted were explained by various factors, but substantially by fund AUM, family AUM, index fund indicator and investment style.22
19 Fee structures include fee reductions, pricing at scale, and breakpoints in advisory fee schedules.
20 As mentioned previously, the Supreme Court cautioned against accepting mutual fund fee comparisons without careful scrutiny since the fees may not be the product of negotiations conducted at arm’s length. See Jones V. Harris at 1429.
21 The two dimensional analysis showed patterns of lower advisory fees for funds with larger asset sizes and funds from larger family sizes compared to funds with smaller asset sizes and funds from smaller family sizes, which according to the independent consultant is indicative of a sharing of economies of scale and scope. However, in less liquid and active markets, such is not the case, as the empirical analysis showed potential for diseconomies of scale in those markets. The empirical analysis also showed diminishing economies of scale and scope as funds surpassed a certain high level of assets.
22 There have been substantial changes to the investment management industry since 2008. Accordingly, some of the 2008 comparative results may no longer be reflective of current conditions in the industry.
| VI. | | NATURE AND QUALITY OF THE ADVISER’S SERVICES INCLUDING THE PERFORMANCE OF THE PORTFOLIOS. |
With assets under management of approximately $481 billion as of July 31, 2015, the Adviser has the investment experience to manage the Portfolios’ investments and provide related non-investment services to the Portfolios.
Since the Portfolios have not yet commenced operations, the Portfolios have no performance history. However, the Adviser manages certain registered investment companies that have somewhat similar investment styles as the Portfolios, and performance information as of July 31, 2015 for those registered investment companies was provided to the Directors.
CONCLUSION:
Based on the factors discussed above, the Senior Officer’s conclusion is that the Investment Advisory Agreement for Small Cap Core Portfolio is reasonable and within the range of what would have been negotiated at arm’s length in light of all the surrounding circumstances.
With respect to International Strategic Equities Portfolio and International Small Cap Portfolio, the Senior Officer recommended that the Directors consider asking the Adviser to reduce the proposed advisory fees for the Portfolios to bring their advisory fees in line with existing SCB Portfolios, potentially by applying the 5 basis points waiver currently applicable to SCB Tax Managed International Portfolio and SCB International Portfolio.23
The Senior Officer also recommended that the Directors consider discussing with the Adviser the addition of breakpoints to the proposed advisory fee schedules for International Small Cap Portfolio and Small Cap Core Portfolio, although the Directors should consider the capacity constraints for those Portfolios that may limit the potential for the Adviser to achieve economies of scale. In this regard, the Directors should monitor the net asset levels of those Portfolios after they commence operations as well as the Adviser’s profitability in assessing whether economies of scale can be shared with the Portfolios’ shareholders.
In addition, the Senior Officer recommended that the Directors consider asking the Adviser to make the SCB Overlay Portfolios’ Acquired Fund Fee and Expense Waiver Agreement permanent, at least with respect to the advisory fees, so that the Overlay Portfolios’ shareholders will not have to pay two advisory fees for managing their investments.
Dated: October 9, 2015
23 At the September 17, 2015 meeting, in response to the Directors’ request, the Adviser agreed to waive 5 basis points of advisory fees for International Strategic Equities Portfolio.

Distributor
BERNSTEIN FUND, INC.
1345 AVENUEOFTHE AMERICAS, NEW YORK, NY 10105
(212) 756-4097
ISCEC-0151-0916
ITEM 2. CODE OF ETHICS.
(a) The registrant has adopted a code of ethics that applies to its principal executive officer, principal financial officer and principal accounting officer. A copy of the registrant’s code of ethics is filed herewith as Exhibit 12(a)(1).
(b) During the period covered by this report, no material amendments were made to the provisions of the code of ethics adopted in 2(a) above.
(c) During the period covered by this report, no implicit or explicit waivers to the provisions of the code of ethics adopted in 2(a) above were granted.
ITEM 3. AUDIT COMMITTEE FINANCIAL EXPERT.
The registrant’s Board of Directors has determined that independent directors Donald K. Peterson, Debra Perry and Suzanne Brenner qualify as audit committee financial experts.
ITEM 4. PRINCIPAL ACCOUNTANT FEES AND SERVICES.
(a) - (c) The following table sets forth the aggregate fees billed by the independent registered public accounting firm Pricewaterhouse Coopers LLP , for the Fund’s last two fiscal years for professional services rendered for: (i) the audit of the Fund’s annual financial statements included in the Fund’s annual report to stockholders; (ii) assurance and related services that are reasonably related to the performance of the audit of the Fund’s financial statements and are not reported under (i), which include advice and education related to accounting and auditing issues, quarterly press release review (for those Funds that issue quarterly press releases), and preferred stock maintenance testing (for those Funds that issue preferred stock); and (iii) tax compliance, tax advice and tax return preparation.
| | | | | | | | | | | | | | | | |
| | | | | | Audit Fees | | | Audit - Related
Fees | | | Tax Fees | |
Bernstein Fund Inc. | | | 2015 | | | $ | — | | | $ | — | | | $ | — | |
| | | 2016 | | | $ | 8,000.00 | | | $ | — | | | $ | 2,041 | |
(d) Not applicable.
(e) (1) Beginning with audit and non-audit service contracts entered into on or after May 6, 2003, the Fund’s Audit Committee policies and procedures require the pre-approval of all audit and non-audit services provided to the Fund by the Fund’s independent registered public accounting firm. The Fund’s Audit Committee policies and procedures also require pre-approval of all audit and non-audit services provided to the Adviser and Service Affiliates to the extent that these services are directly related to the operations or financial reporting of the Fund.
(e) (2) All of the amounts for Audit Fees, Audit-Related Fees and Tax Fees in the table under Item 4 (a)–(c) are for services pre-approved by the Fund’s Audit Committee.
(f) Not applicable.
(g) The following table sets forth the aggregate non-audit services provided to the Fund, the Fund’s Adviser and entities that control, are controlled by or under common control with the Adviser that provide ongoing services to the Fund:
| | | | | | | | | | | | |
| | | | | | All Fees for
Non-Audit Services
Provided to the
Portfolio, the Adviser
and Service Affiliates | | | Pre-approved by the
Audit Committee
(Portion Comprised of
Audit Related Fees)
(Portion Comprised of
Tax Fees) | |
Bernstein Fund Inc. | | | 2015 | | | $ | — | | | $ | — | |
| | | | | | | | | | $ | — | |
| | | | | | | | | | $ | — | |
| | | 2016 | | | $ | 9,255,652 | | | $ | 2,041 | |
| | | | | | | | | | $ | — | |
| | | | | | | | | | $ | (2,041 | ) |
(h) The Audit Committee of the Fund has considered whether the provision of any non-audit services not pre-approved by the Audit Committee provided by the Fund’s independent registered public accounting firm to the Adviser and Service Affiliates is compatible with maintaining the auditor’s independence.
ITEM 5. AUDIT COMMITTEE OF LISTED REGISTRANTS.
Not applicable to the registrant.
ITEM 6. SCHEDULE OF INVESTMENTS.
Please see Schedule of Investments contained in the Report to Shareholders included under Item 1 of this Form N-CSR.
ITEM 7. DISCLOSURE OF PROXY VOTING POLICIES AND PROCEDURES FOR CLOSED-END MANAGEMENT INVESTMENT COMPANIES.
Not applicable to the registrant.
ITEM 8. PORTFOLIO MANAGERS OF CLOSED-END MANAGEMENT INVESTMENT COMPANIES.
Not applicable to the registrant.
ITEM 9. PURCHASES OF EQUITY SECURITIES BY CLOSED-END MANAGEMENT INVESTMENT COMPANY AND AFFILIATED PURCHASERS.
Not applicable to the registrant.
ITEM 10. SUBMISSION OF MATTERS TO A VOTE OF SECURITY HOLDERS.
There have been no material changes to the procedures by which shareholders may recommend nominees to the Fund’s Board of Directors since the Fund last provided disclosure in response to this item.
ITEM 11. CONTROLS AND PROCEDURES.
(a) The registrant’s principal executive officer and principal financial officer have concluded that the registrant’s disclosure controls and procedures (as defined in Rule 30a-2(c) under the Investment Company Act of 1940, as amended) are effective at the reasonable assurance level based on their evaluation of these controls and procedures as of a date within 90 days of the filing date of this document.
(b) There were no significant changes in the registrant’s internal controls over financial reporting during the second fiscal quarter of the period that could significantly affect these controls subsequent to the date of their evaluation, including any corrective actions with regard to significant deficiencies and material weaknesses.
ITEM 12. EXHIBITS.
The following exhibits are attached to this Form N-CSR:
| | |
EXHIBIT NO. | | DESCRIPTION OF EXHIBIT |
| |
| 12 (a) (1) | | Code of Ethics that is subject to the disclosure of Item 2 hereof |
| |
| 12 (b) (1) | | Certification of Principal Executive Officer Pursuant to Section 302 of the Sarbanes-Oxley Act of 2002 |
| |
| 12 (b) (2) | | Certification of Principal Financial Officer Pursuant to Section 302 of the Sarbanes-Oxley Act of 2002 |
| |
| 12 (c) | | Certification of Principal Executive Officer and Principal Financial Officer Pursuant to Section 906 of the Sarbanes-Oxley Act of 2002 |
SIGNATURES
Pursuant to the requirements of the Securities Exchange Act of 1934 and the Investment Company Act of 1940, the registrant has duly caused this report to be signed on its behalf by the undersigned, thereunto duly authorized.
(Registrant): Bernstein Fund, Inc.
| | |
| By: | | /s/ Seth J. Masters |
| | Seth J. Masters |
| | President |
| |
| Date: | | November 29, 2016 |
Pursuant to the requirements of the Securities Exchange Act of 1934 and the Investment Company Act of 1940, this report has been signed below by the following persons on behalf of the registrant and in the capacities and on the dates indicated.
| | |
| By: | | /s/ Seth J. Masters |
| | Seth J. Masters |
| | President |
| |
| Date: | | November 29, 2016 |
| |
| By: | | /s/ Joseph J. Mantineo |
| | Joseph J. Mantineo |
| | Treasurer and Chief Financial Officer |
| |
| Date: | | November 29, 2016 |