UNITED STATES
SECURITIES AND EXCHANGE COMMISSION
WASHINGTON, D.C. 20549
FORM N-CSR
CERTIFIED SHAREHOLDER REPORT OF REGISTERED MANAGEMENT
INVESTMENT COMPANIES
Investment Company Act file number: 811-23100
BERNSTEIN FUND, INC.
(Exact name of registrant as specified in charter)
66 Hudson Boulevard East, New York, New York 10005
(Address of principal executive offices) (Zip code)
Stephen M. Woetzel
AllianceBernstein L.P.
66 Hudson Boulevard East
New York, New York 10005
(Name and address of agent for service)
Registrant’s telephone number, including area code: (800) 221-5672
Date of fiscal year end: September 30, 2024
Date of reporting period: September 30, 2024
ITEM 1. REPORTS TO STOCKHOLDERS.
Please scan QR code for
Fund Information
International Small Cap Portfolio
Annual Shareholder Report
This annual shareholder report contains important information about the International Small Cap Portfolio (the “Portfolio”) for the period of October 1, 2023 to September 30, 2024. You can find additional information about the Fund at https://www.abfunds.com/link/AB/IRCYX-A. You can also request this information by contacting us at (800) 227 4618.
What were the Fund costs for the last year?
(Based on a hypothetical $10,000 investment)
| Class Name | Cost of a $10,000 investment | Costs paid as a percentage of a $10,000 investment |
|---|
| Advisor Class | $121 | 1.07% |
How did the Fund perform last year? What affected the Fund’s performance?
For the 12-month period, all share classes of the Portfolio outperformed the Morgan Stanley Capital International ("MSCI") All Country World Index ("ACWI") ex USA Small Cap Index (net) (the "benchmark") and the Lipper International/Mid-Cap Core Funds Average. Stock selection and currency exposures contributed to performance, relative to the benchmark, while sector selection, as well as country allocation detracted from overall returns. Security selection within communication services, technology, and industrials contributed significantly due to strong earnings growth, while selection within consumer staples was the main detractor during the period.
Top contributors to performance:
Top detractors from performance:
The following graph shows the performance of hypothetical $10,000 investments in the Fund, a broad-based securities market index and an additional index that corresponds to the Fund's investment strategies, over the most recently completed 10 fiscal years of the Fund, or since inception, if shorter. The Fund's performance reflects applicable sales charges and assumes the reinvestment of dividends.
| Advisor Class | MSCI ACWI ex USA Index (net) | MSCI ACWI ex USA Small Cap Index (net) |
|---|
| 12/15 | $10,000 | $10,000 | $10,000 |
| 09/16 | $10,930 | $10,756 | $10,993 |
| 09/17 | $13,062 | $12,865 | $13,103 |
| 09/18 | $13,262 | $13,091 | $13,347 |
| 09/19 | $12,241 | $12,931 | $12,595 |
| 09/20 | $12,474 | $13,319 | $13,473 |
| 09/21 | $16,243 | $16,504 | $17,927 |
| 09/22 | $11,238 | $12,351 | $12,740 |
| 09/23 | $13,547 | $14,869 | $15,162 |
| 09/24 | $16,989 | $18,638 | $18,687 |
Average Annual Total Returns
| 1 Year | 5 Years | Since Inception 12/21/15 |
|---|
| Advisor Class | 25.41% | 6.77% | 6.22% |
| MSCI ACWI ex USA Index (net) | 25.35% | 7.59% | 7.35% |
| MSCI ACWI ex USA Small Cap Index (net) | 23.25% | 8.21% | 7.38% |
The graph and table do not reflect the deduction of taxes that a shareholder would pay on Fund distributions or the redemption or sale of Fund shares.
Visit https://www.abfunds.com/link/AB/IRCYX-A for the most recent performance information.
| Net Assets | $1,150,383,961 |
| # of Portfolio Holdings | 279 |
| Portfolio Turnover Rate | 50% |
| Total Advisory Fees Paid | $10,709,170 |
Graphical Representation of Holdings
| Value | Value |
|---|
| Industrials | 22.0% |
| Consumer Discretionary | 13.7% |
| Financials | 11.9% |
| Information Technology | 11.1% |
| Materials | 9.4% |
| Communication Services | 7.5% |
| Health Care | 5.9% |
| Energy | 5.8% |
| Real Estate | 4.3% |
| Consumer Staples | 3.5% |
| Utilities | 2.2% |
| Short-Term Investments | 2.2% |
| Other assets less liabilities | 0.5% |
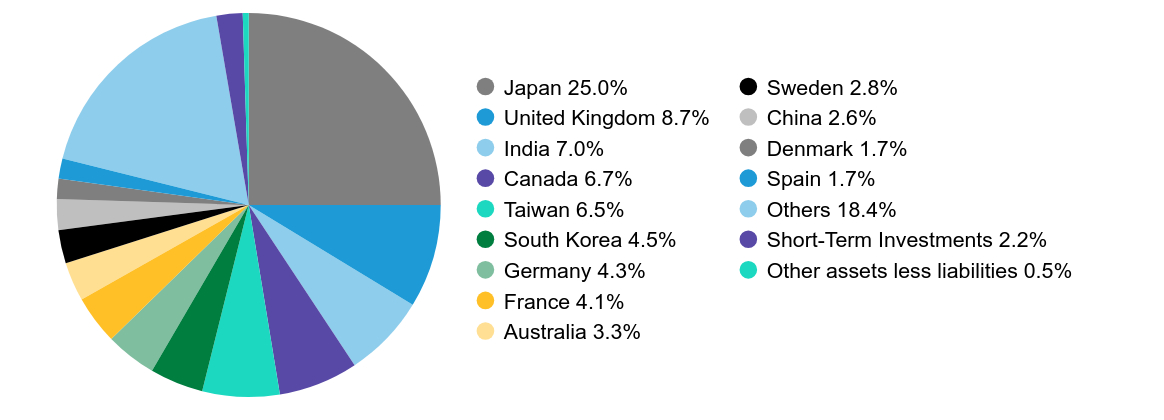
| Value | Value |
|---|
| Japan | 25.0% |
| United Kingdom | 8.7% |
| India | 7.0% |
| Canada | 6.7% |
| Taiwan | 6.5% |
| South Korea | 4.5% |
| Germany | 4.3% |
| France | 4.1% |
| Australia | 3.3% |
| Sweden | 2.8% |
| China | 2.6% |
| Denmark | 1.7% |
| Spain | 1.7% |
| Others | 18.4% |
| Short-Term Investments | 2.2% |
| Other assets less liabilities | 0.5% |
Availability of Additional Information
You can find additional information on the Fund’s website at https://www.abfunds.com/link/AB/IRCYX-A, including the Fund's:
• Prospectus
• Financial information
• Fund holdings
• Proxy voting information
You can also request this information by contacting us at (800) 227 4618.
Shareholders who have consented to receive a single annual or semi-annual shareholder report at a shared address may revoke this consent by contacting us at (800) 227 4618.
Information Regarding the Review and Approval of the Fund’s Advisory Agreement
Information regarding the Fund’s Board of Directors’/Trustees’ review of the advisory agreement is available on the Fund’s website https://www.abfunds.com/link/AB/IRCYX-A. You can request this information, free of charge, by contacting us at (800) 227 4618 or by scanning the QR code below.
The [A/B] logo is a registered service mark of AllianceBernstein and AllianceBernstein® is a registered service mark used by permission of the owner, AllianceBernstein L.P.
Please scan QR code for
Fund Information
Please scan QR code for
Fund Information
International Small Cap Portfolio
Annual Shareholder Report
This annual shareholder report contains important information about the International Small Cap Portfolio (the “Portfolio”) for the period of October 1, 2023 to September 30, 2024. You can find additional information about the Fund at https://www.abfunds.com/link/AB/IRCZX-A. You can also request this information by contacting us at (800) 227 4618.
What were the Fund costs for the last year?
(Based on a hypothetical $10,000 investment)
| Class Name | Cost of a $10,000 investment | Costs paid as a percentage of a $10,000 investment |
|---|
| Class Z | $122 | 1.08% |
How did the Fund perform last year? What affected the Fund’s performance?
For the 12-month period, all share classes of the Portfolio outperformed the Morgan Stanley Capital International ("MSCI") All Country World Index ("ACWI") ex USA Small Cap Index (net) (the "benchmark") and the Lipper International/Mid-Cap Core Funds Average. Stock selection and currency exposures contributed to performance, relative to the benchmark, while sector selection, as well as country allocation detracted from overall returns. Security selection within communication services, technology, and industrials contributed significantly due to strong earnings growth, while selection within consumer staples was the main detractor during the period.
Top contributors to performance:
Top detractors from performance:
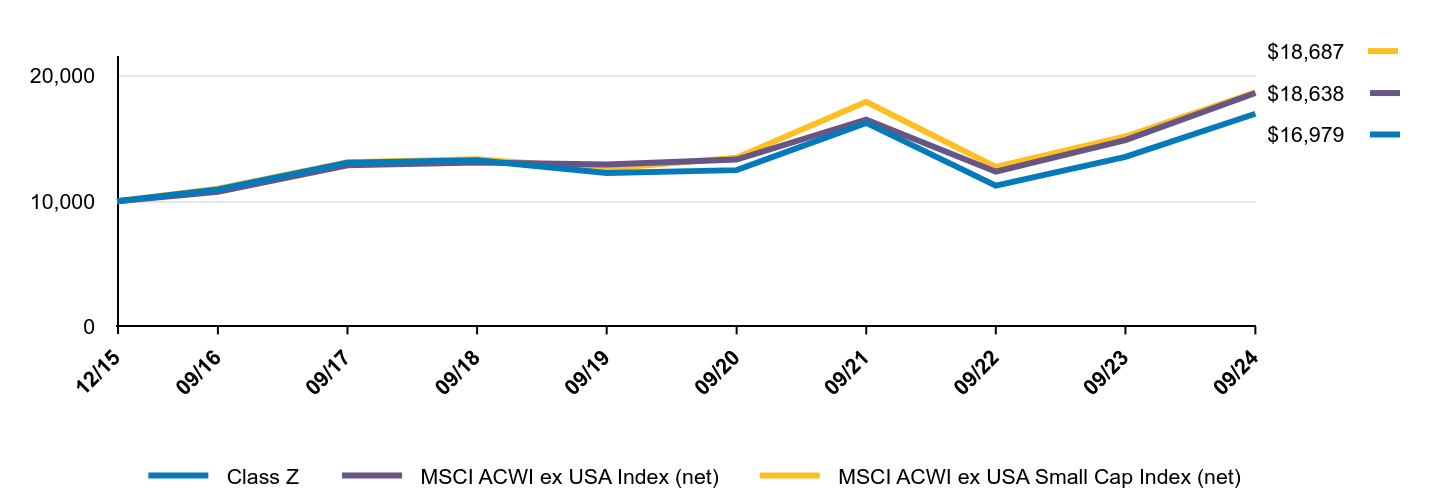
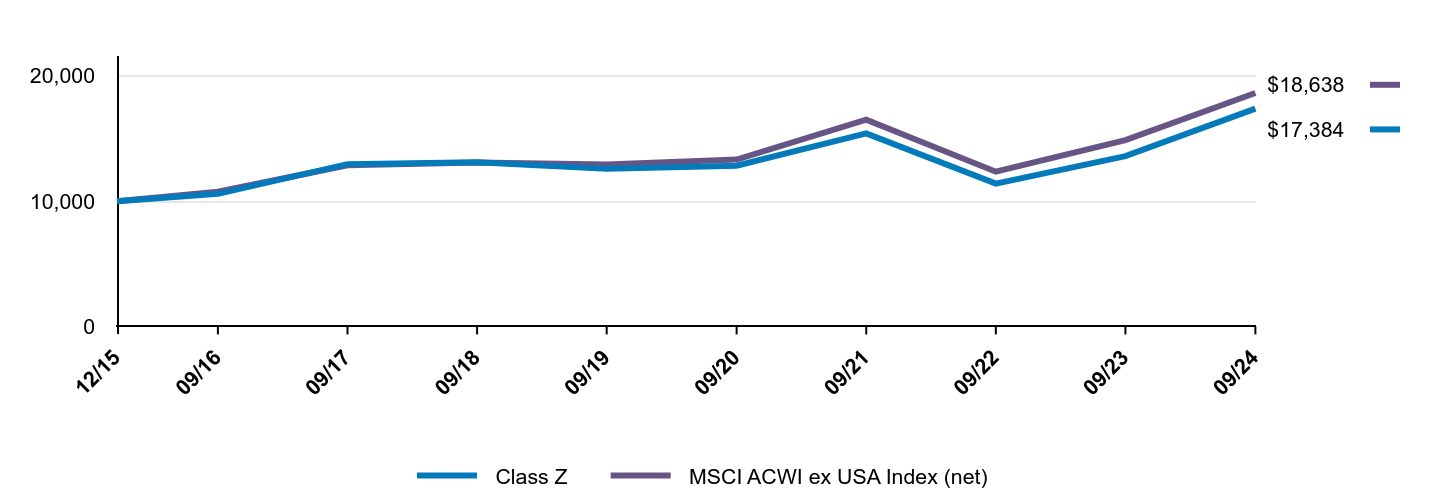
The following graph shows the performance of hypothetical $10,000 investments in the Fund, a broad-based securities market index and an additional index that corresponds to the Fund's investment strategies, over the most recently completed 10 fiscal years of the Fund, or since inception, if shorter. The Fund's performance reflects applicable sales charges and assumes the reinvestment of dividends.
| Class Z | MSCI ACWI ex USA Index (net) | MSCI ACWI ex USA Small Cap Index (net) |
|---|
| 12/15 | $10,000 | $10,000 | $10,000 |
| 09/16 | $10,930 | $10,756 | $10,993 |
| 09/17 | $13,063 | $12,865 | $13,103 |
| 09/18 | $13,264 | $13,091 | $13,347 |
| 09/19 | $12,243 | $12,931 | $12,595 |
| 09/20 | $12,477 | $13,319 | $13,473 |
| 09/21 | $16,248 | $16,504 | $17,927 |
| 09/22 | $11,242 | $12,351 | $12,740 |
| 09/23 | $13,538 | $14,869 | $15,162 |
| 09/24 | $16,979 | $18,638 | $18,687 |
Average Annual Total Returns
| 1 Year | 5 Years | Since Inception 12/21/15 |
|---|
| Class Z | 25.42% | 6.76% | 6.22% |
| MSCI ACWI ex USA Index (net) | 25.35% | 7.59% | 7.35% |
| MSCI ACWI ex USA Small Cap Index (net) | 23.25% | 8.21% | 7.38% |
The graph and table do not reflect the deduction of taxes that a shareholder would pay on Fund distributions or the redemption or sale of Fund shares.
Visit https://www.abfunds.com/link/AB/IRCZX-A for the most recent performance information.
| Net Assets | $1,150,383,961 |
| # of Portfolio Holdings | 279 |
| Portfolio Turnover Rate | 50% |
| Total Advisory Fees Paid | $10,709,170 |
Graphical Representation of Holdings
| Value | Value |
|---|
| Industrials | 22.0% |
| Consumer Discretionary | 13.7% |
| Financials | 11.9% |
| Information Technology | 11.1% |
| Materials | 9.4% |
| Communication Services | 7.5% |
| Health Care | 5.9% |
| Energy | 5.8% |
| Real Estate | 4.3% |
| Consumer Staples | 3.5% |
| Utilities | 2.2% |
| Short-Term Investments | 2.2% |
| Other assets less liabilities | 0.5% |
| Value | Value |
|---|
| Japan | 25.0% |
| United Kingdom | 8.7% |
| India | 7.0% |
| Canada | 6.7% |
| Taiwan | 6.5% |
| South Korea | 4.5% |
| Germany | 4.3% |
| France | 4.1% |
| Australia | 3.3% |
| Sweden | 2.8% |
| China | 2.6% |
| Denmark | 1.7% |
| Spain | 1.7% |
| Others | 18.4% |
| Short-Term Investments | 2.2% |
| Other assets less liabilities | 0.5% |
Availability of Additional Information
You can find additional information on the Fund’s website at https://www.abfunds.com/link/AB/IRCZX-A, including the Fund's:
• Prospectus
• Financial information
• Fund holdings
• Proxy voting information
You can also request this information by contacting us at (800) 227 4618.
Shareholders who have consented to receive a single annual or semi-annual shareholder report at a shared address may revoke this consent by contacting us at (800) 227 4618.
Information Regarding the Review and Approval of the Fund’s Advisory Agreement
Information regarding the Fund’s Board of Directors’/Trustees’ review of the advisory agreement is available on the Fund’s website https://www.abfunds.com/link/AB/IRCZX-A. You can request this information, free of charge, by contacting us at (800) 227 4618 or by scanning the QR code below.
The [A/B] logo is a registered service mark of AllianceBernstein and AllianceBernstein® is a registered service mark used by permission of the owner, AllianceBernstein L.P.
Please scan QR code for
Fund Information
Please scan QR code for
Fund Information
International Small Cap Portfolio
Annual Shareholder Report
This annual shareholder report contains important information about the International Small Cap Portfolio (the “Portfolio”) for the period of October 1, 2023 to September 30, 2024. You can find additional information about the Fund at https://www.abfunds.com/link/AB/IRCSX-A. You can also request this information by contacting us at (800) 227 4618.
What were the Fund costs for the last year?
(Based on a hypothetical $10,000 investment)
| Class Name | Cost of a $10,000 investment | Costs paid as a percentage of a $10,000 investment |
|---|
| SCB Class | $149 | 1.32% |
How did the Fund perform last year? What affected the Fund’s performance?
For the 12-month period, all share classes of the Portfolio outperformed the Morgan Stanley Capital International ("MSCI") All Country World Index ("ACWI") ex USA Small Cap Index (net) (the "benchmark") and the Lipper International/Mid-Cap Core Funds Average. Stock selection and currency exposures contributed to performance, relative to the benchmark, while sector selection, as well as country allocation detracted from overall returns. Security selection within communication services, technology, and industrials contributed significantly due to strong earnings growth, while selection within consumer staples was the main detractor during the period.
Top contributors to performance:
Top detractors from performance:
The following graph shows the performance of hypothetical $10,000 investments in the Fund, a broad-based securities market index and an additional index that corresponds to the Fund's investment strategies, over the most recently completed 10 fiscal years of the Fund, or since inception, if shorter. The Fund's performance reflects applicable sales charges and assumes the reinvestment of dividends.
| SCB Class | MSCI ACWI ex USA Index (net) | MSCI ACWI ex USA Small Cap Index (net) |
|---|
| 12/15 | $10,000 | $10,000 | $10,000 |
| 09/16 | $10,920 | $10,756 | $10,993 |
| 09/17 | $13,026 | $12,865 | $13,103 |
| 09/18 | $13,194 | $13,091 | $13,347 |
| 09/19 | $12,135 | $12,931 | $12,595 |
| 09/20 | $12,349 | $13,319 | $13,473 |
| 09/21 | $16,027 | $16,504 | $17,927 |
| 09/22 | $11,057 | $12,351 | $12,740 |
| 09/23 | $13,289 | $14,869 | $15,162 |
| 09/24 | $16,632 | $18,638 | $18,687 |
Average Annual Total Returns
| 1 Year | 5 Years | Since Inception 12/21/15 |
|---|
| SCB Class | 25.15% | 6.51% | 5.97% |
| MSCI ACWI ex USA Index (net) | 25.35% | 7.59% | 7.35% |
| MSCI ACWI ex USA Small Cap Index (net) | 23.25% | 8.21% | 7.38% |
The graph and table do not reflect the deduction of taxes that a shareholder would pay on Fund distributions or the redemption or sale of Fund shares.
Visit https://www.abfunds.com/link/AB/IRCSX-A for the most recent performance information.
| Net Assets | $1,150,383,961 |
| # of Portfolio Holdings | 279 |
| Portfolio Turnover Rate | 50% |
| Total Advisory Fees Paid | $10,709,170 |
Graphical Representation of Holdings
| Value | Value |
|---|
| Industrials | 22.0% |
| Consumer Discretionary | 13.7% |
| Financials | 11.9% |
| Information Technology | 11.1% |
| Materials | 9.4% |
| Communication Services | 7.5% |
| Health Care | 5.9% |
| Energy | 5.8% |
| Real Estate | 4.3% |
| Consumer Staples | 3.5% |
| Utilities | 2.2% |
| Short-Term Investments | 2.2% |
| Other assets less liabilities | 0.5% |
| Value | Value |
|---|
| Japan | 25.0% |
| United Kingdom | 8.7% |
| India | 7.0% |
| Canada | 6.7% |
| Taiwan | 6.5% |
| South Korea | 4.5% |
| Germany | 4.3% |
| France | 4.1% |
| Australia | 3.3% |
| Sweden | 2.8% |
| China | 2.6% |
| Denmark | 1.7% |
| Spain | 1.7% |
| Others | 18.4% |
| Short-Term Investments | 2.2% |
| Other assets less liabilities | 0.5% |
Availability of Additional Information
You can find additional information on the Fund’s website at https://www.abfunds.com/link/AB/IRCSX-A, including the Fund's:
• Prospectus
• Financial information
• Fund holdings
• Proxy voting information
You can also request this information by contacting us at (800) 227 4618.
Shareholders who have consented to receive a single annual or semi-annual shareholder report at a shared address may revoke this consent by contacting us at (800) 227 4618.
Information Regarding the Review and Approval of the Fund’s Advisory Agreement
Information regarding the Fund’s Board of Directors’/Trustees’ review of the advisory agreement is available on the Fund’s website https://www.abfunds.com/link/AB/IRCSX-A. You can request this information, free of charge, by contacting us at (800) 227 4618 or by scanning the QR code below.
The [A/B] logo is a registered service mark of AllianceBernstein and AllianceBernstein® is a registered service mark used by permission of the owner, AllianceBernstein L.P.
Please scan QR code for
Fund Information
Please scan QR code for
Fund Information
International Strategic Equities Portfolio
Annual Shareholder Report
This annual shareholder report contains important information about the International Strategic Equities Portfolio (the “Portfolio”) for the period of October 1, 2023 to September 30, 2024. You can find additional information about the Fund at https://www.abfunds.com/link/AB/STEYX-A. You can also request this information by contacting us at (800) 227 4618.
What were the Fund costs for the last year?
(Based on a hypothetical $10,000 investment)
| Class Name | Cost of a $10,000 investment | Costs paid as a percentage of a $10,000 investment |
|---|
| Advisor Class | $76 | 0.67% |
How did the Fund perform last year? What affected the Fund’s performance?
During the 12-month period, all share classes of the Portfolio outperformed Morgan Stanley Capital International ("MSCI") All Country World Index ("ACWI") ex USA Index (net) (the "benchmark"). Sector selection was positive, relative to the benchmark, mainly from an overweight to the technology sector, which was boosted by AI-related sentiment, and an underweight to the materials sector, which was impacted by concerns about weaker demand especially from China. Country selection was positive, as overweights to the Netherlands and Taiwan, and an underweight to China, all contributed. Stock selection was also positive during the period.
Top contributors to performance:
Significant individual stock contributors during the period included Japanese semiconductor equipment company Screen Holdings, boosted by global investment into chip foundry capacity, Irish building materials company CRH, benefiting from US infrastructure-related demand and Italian cable manufacturer Prysmian, exposed to the growth in renewable energy.
Top detractors from performance:
Stock detractors during the period included Spanish refiner Repsol, impacted by a weaker oil price, Canadian copper producer First Quantum Minerals, which saw the forced closure of major mine in Panama following government intervention, and French luxury conglomerate Kering, affected by weaker global demand for luxury goods.
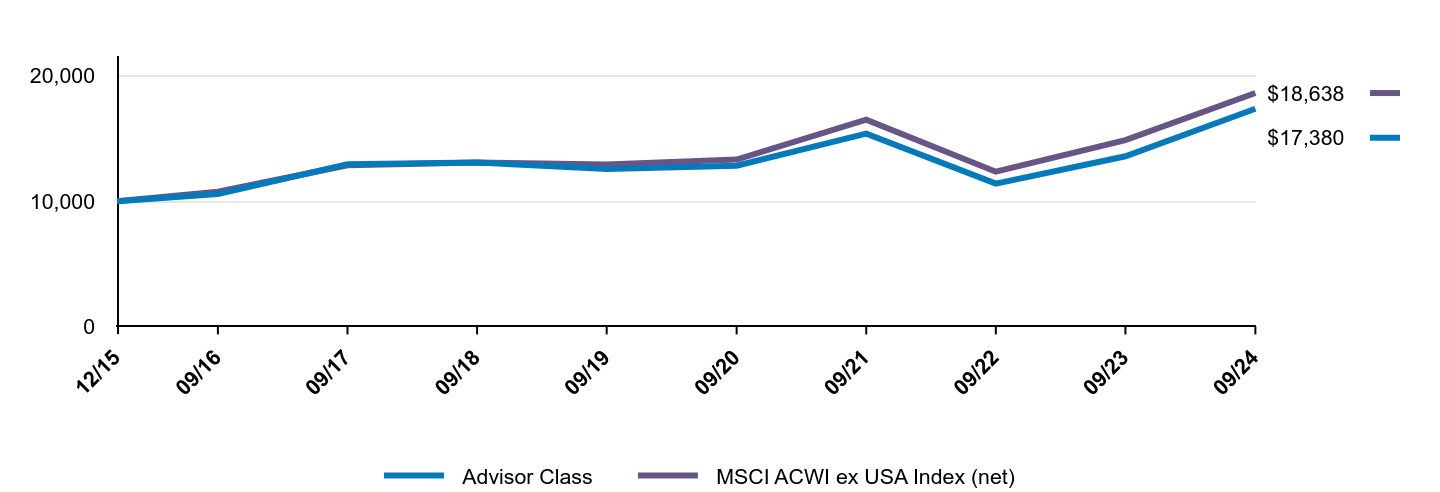
The following graph shows the performance of hypothetical $10,000 investments in the Fund and a broad-based securities market index over the most recently completed 10 fiscal years of the Fund, or since inception, if shorter. The Fund's performance reflects applicable sales charges and assumes the reinvestment of dividends.
| Advisor Class | MSCI ACWI ex USA Index (net) |
|---|
| 12/15 | $10,000 | $10,000 |
| 09/16 | $10,575 | $10,756 |
| 09/17 | $12,942 | $12,865 |
| 09/18 | $13,095 | $13,091 |
| 09/19 | $12,570 | $12,931 |
| 09/20 | $12,825 | $13,319 |
| 09/21 | $15,393 | $16,504 |
| 09/22 | $11,396 | $12,351 |
| 09/23 | $13,584 | $14,869 |
| 09/24 | $17,380 | $18,638 |
Average Annual Total Returns
| 1 Year | 5 Years | Since Inception 12/21/15 |
|---|
| Advisor Class | 27.95% | 6.70% | 6.50% |
| MSCI ACWI ex USA Index (net) | 25.35% | 7.59% | 7.35% |
The graph and table do not reflect the deduction of taxes that a shareholder would pay on Fund distributions or the redemption or sale of Fund shares.
Visit https://www.abfunds.com/link/AB/STEYX-A for the most recent performance information.
| Net Assets | $8,260,302,557 |
| # of Portfolio Holdings | 84 |
| Portfolio Turnover Rate | 69% |
| Total Advisory Fees Paid | $49,085,937 |
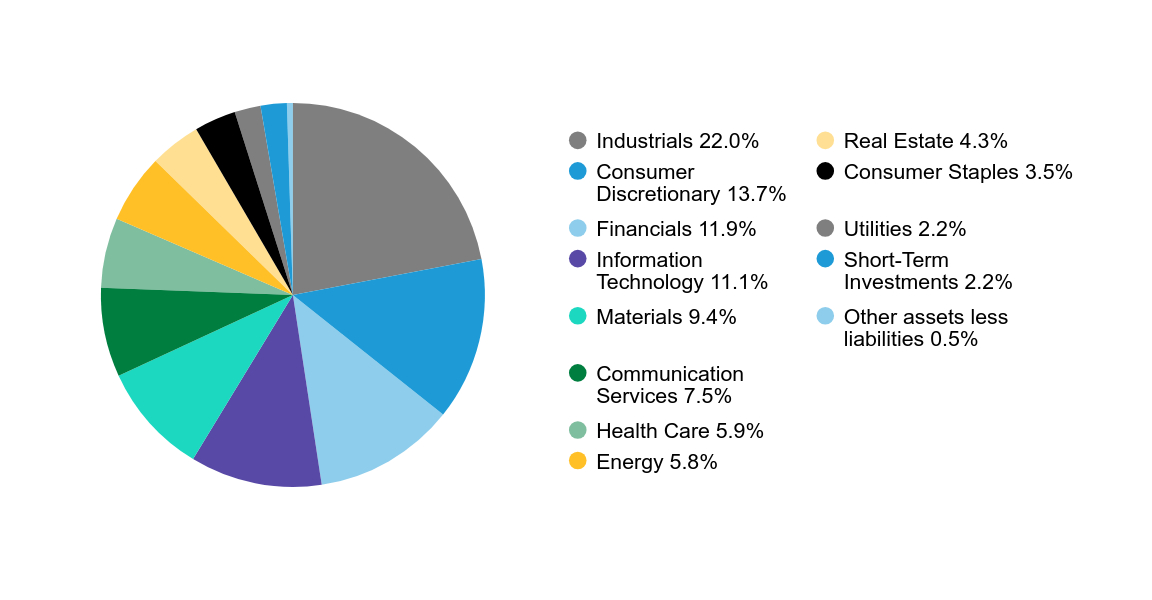
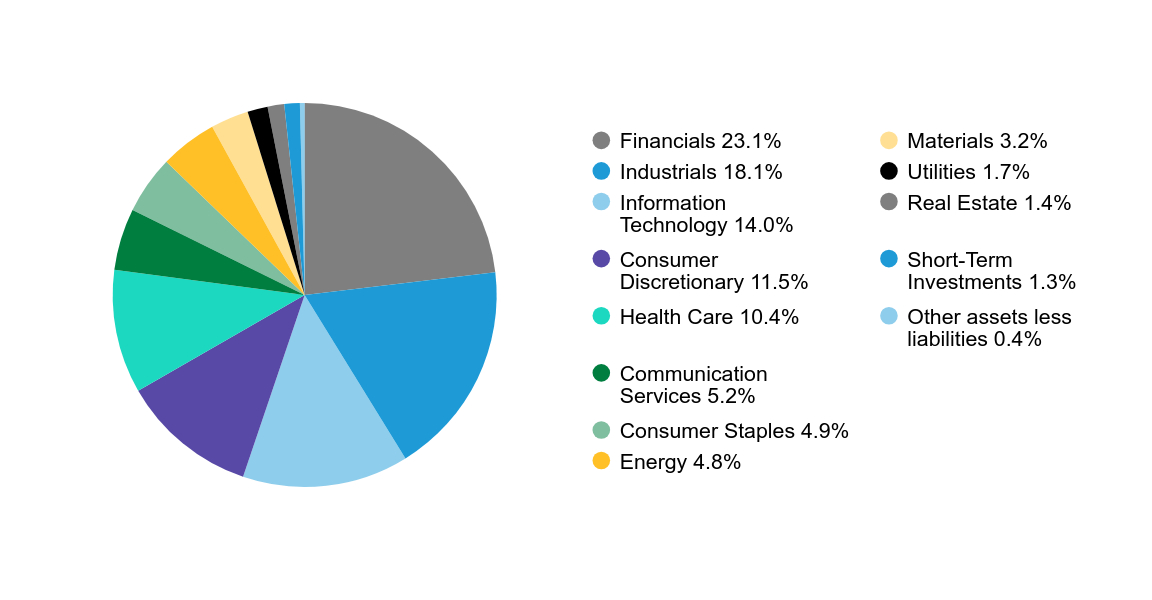
Graphical Representation of Holdings
| Value | Value |
|---|
| Financials | 23.1% |
| Industrials | 18.1% |
| Information Technology | 14.0% |
| Consumer Discretionary | 11.5% |
| Health Care | 10.4% |
| Communication Services | 5.2% |
| Consumer Staples | 4.9% |
| Energy | 4.8% |
| Materials | 3.2% |
| Utilities | 1.7% |
| Real Estate | 1.4% |
| Short-Term Investments | 1.3% |
| Other assets less liabilities | 0.4% |
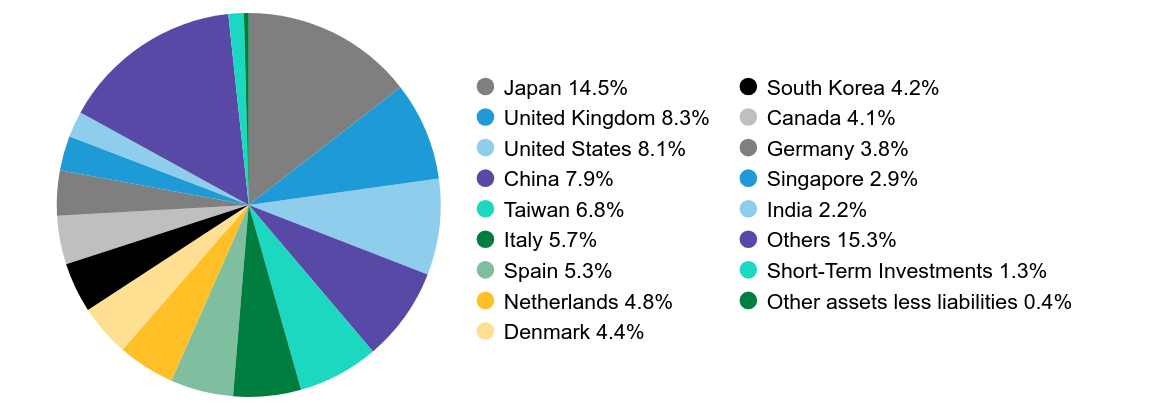
| Value | Value |
|---|
| Japan | 14.5% |
| United Kingdom | 8.3% |
| United States | 8.1% |
| China | 7.9% |
| Taiwan | 6.8% |
| Italy | 5.7% |
| Spain | 5.3% |
| Netherlands | 4.8% |
| Denmark | 4.4% |
| South Korea | 4.2% |
| Canada | 4.1% |
| Germany | 3.8% |
| Singapore | 2.9% |
| India | 2.2% |
| Others | 15.3% |
| Short-Term Investments | 1.3% |
| Other assets less liabilities | 0.4% |
Availability of Additional Information
You can find additional information on the Fund’s website at https://www.abfunds.com/link/AB/STEYX-A, including the Fund's:
• Prospectus
• Financial information
• Fund holdings
• Proxy voting information
You can also request this information by contacting us at (800) 227 4618.
Shareholders who have consented to receive a single annual or semi-annual shareholder report at a shared address may revoke this consent by contacting us at (800) 227 4618.
Information Regarding the Review and Approval of the Fund’s Advisory Agreement
Information regarding the Fund’s Board of Directors’/Trustees’ review of the advisory agreement is available on the Fund’s website https://www.abfunds.com/link/AB/STEYX-A. You can request this information, free of charge, by contacting us at (800) 227 4618 or by scanning the QR code below.
The [A/B] logo is a registered service mark of AllianceBernstein and AllianceBernstein® is a registered service mark used by permission of the owner, AllianceBernstein L.P.
Please scan QR code for
Fund Information
Please scan QR code for
Fund Information
International Strategic Equities Portfolio
Annual Shareholder Report
This annual shareholder report contains important information about the International Strategic Equities Portfolio (the “Portfolio”) for the period of October 1, 2023 to September 30, 2024. You can find additional information about the Fund at https://www.abfunds.com/link/AB/STEZX-A. You can also request this information by contacting us at (800) 227 4618.
What were the Fund costs for the last year?
(Based on a hypothetical $10,000 investment)
| Class Name | Cost of a $10,000 investment | Costs paid as a percentage of a $10,000 investment |
|---|
| Class Z | $79 | 0.69% |
How did the Fund perform last year? What affected the Fund’s performance?
During the 12-month period, all share classes of the Portfolio outperformed Morgan Stanley Capital International ("MSCI") All Country World Index ("ACWI") ex USA Index (net) (the "benchmark"). Sector selection was positive, relative to the benchmark, mainly from an overweight to the technology sector, which was boosted by AI-related sentiment, and an underweight to the materials sector, which was impacted by concerns about weaker demand especially from China. Country selection was positive, as overweights to the Netherlands and Taiwan, and an underweight to China, all contributed. Stock selection was also positive during the period.
Top contributors to performance:
Significant individual stock contributors during the period included Japanese semiconductor equipment company Screen Holdings, boosted by global investment into chip foundry capacity, Irish building materials company CRH, benefiting from US infrastructure-related demand and Italian cable manufacturer Prysmian, exposed to the growth in renewable energy.
Top detractors from performance:
Stock detractors during the period included Spanish refiner Repsol, impacted by a weaker oil price, Canadian copper producer First Quantum Minerals, which saw the forced closure of major mine in Panama following government intervention, and French luxury conglomerate Kering, affected by weaker global demand for luxury goods.
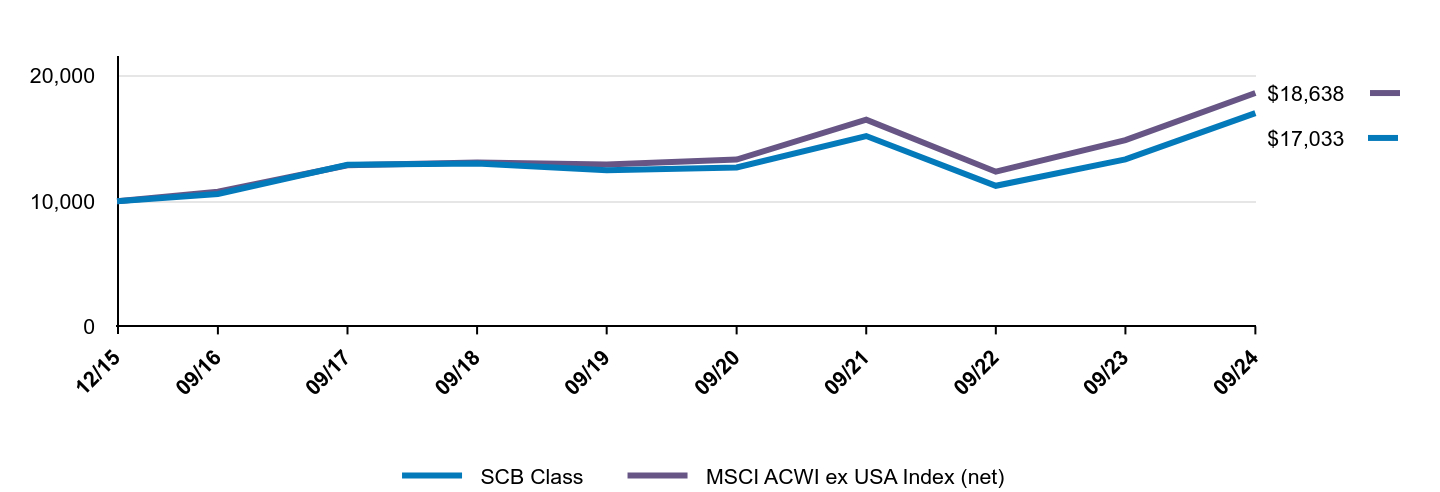
The following graph shows the performance of hypothetical $10,000 investments in the Fund and a broad-based securities market index over the most recently completed 10 fiscal years of the Fund, or since inception, if shorter. The Fund's performance reflects applicable sales charges and assumes the reinvestment of dividends.
| Class Z | MSCI ACWI ex USA Index (net) |
|---|
| 12/15 | $10,000 | $10,000 |
| 09/16 | $10,585 | $10,756 |
| 09/17 | $12,951 | $12,865 |
| 09/18 | $13,104 | $13,091 |
| 09/19 | $12,577 | $12,931 |
| 09/20 | $12,831 | $13,319 |
| 09/21 | $15,407 | $16,504 |
| 09/22 | $11,400 | $12,351 |
| 09/23 | $13,594 | $14,869 |
| 09/24 | $17,384 | $18,638 |
Average Annual Total Returns
| 1 Year | 5 Years | Since Inception 12/21/15 |
|---|
| Class Z | 27.88% | 6.69% | 6.50% |
| MSCI ACWI ex USA Index (net) | 25.35% | 7.59% | 7.35% |
The graph and table do not reflect the deduction of taxes that a shareholder would pay on Fund distributions or the redemption or sale of Fund shares.
Visit https://www.abfunds.com/link/AB/STEZX-A for the most recent performance information.
| Net Assets | $8,260,302,557 |
| # of Portfolio Holdings | 84 |
| Portfolio Turnover Rate | 69% |
| Total Advisory Fees Paid | $49,085,937 |
Graphical Representation of Holdings
| Value | Value |
|---|
| Financials | 23.1% |
| Industrials | 18.1% |
| Information Technology | 14.0% |
| Consumer Discretionary | 11.5% |
| Health Care | 10.4% |
| Communication Services | 5.2% |
| Consumer Staples | 4.9% |
| Energy | 4.8% |
| Materials | 3.2% |
| Utilities | 1.7% |
| Real Estate | 1.4% |
| Short-Term Investments | 1.3% |
| Other assets less liabilities | 0.4% |
| Value | Value |
|---|
| Japan | 14.5% |
| United Kingdom | 8.3% |
| United States | 8.1% |
| China | 7.9% |
| Taiwan | 6.8% |
| Italy | 5.7% |
| Spain | 5.3% |
| Netherlands | 4.8% |
| Denmark | 4.4% |
| South Korea | 4.2% |
| Canada | 4.1% |
| Germany | 3.8% |
| Singapore | 2.9% |
| India | 2.2% |
| Others | 15.3% |
| Short-Term Investments | 1.3% |
| Other assets less liabilities | 0.4% |
Availability of Additional Information
You can find additional information on the Fund’s website at https://www.abfunds.com/link/AB/STEZX-A, including the Fund's:
• Prospectus
• Financial information
• Fund holdings
• Proxy voting information
You can also request this information by contacting us at (800) 227 4618.
Shareholders who have consented to receive a single annual or semi-annual shareholder report at a shared address may revoke this consent by contacting us at (800) 227 4618.
Information Regarding the Review and Approval of the Fund’s Advisory Agreement
Information regarding the Fund’s Board of Directors’/Trustees’ review of the advisory agreement is available on the Fund’s website https://www.abfunds.com/link/AB/STEZX-A. You can request this information, free of charge, by contacting us at (800) 227 4618 or by scanning the QR code below.
The [A/B] logo is a registered service mark of AllianceBernstein and AllianceBernstein® is a registered service mark used by permission of the owner, AllianceBernstein L.P.
Please scan QR code for
Fund Information
Please scan QR code for
Fund Information
International Strategic Equities Portfolio
Annual Shareholder Report
This annual shareholder report contains important information about the International Strategic Equities Portfolio (the “Portfolio”) for the period of October 1, 2023 to September 30, 2024. You can find additional information about the Fund at https://www.abfunds.com/link/AB/STESX-A. You can also request this information by contacting us at (800) 227 4618.
What were the Fund costs for the last year?
(Based on a hypothetical $10,000 investment)
| Class Name | Cost of a $10,000 investment | Costs paid as a percentage of a $10,000 investment |
|---|
| SCB Class | $105 | 0.92% |
How did the Fund perform last year? What affected the Fund’s performance?
During the 12-month period, all share classes of the Portfolio outperformed Morgan Stanley Capital International ("MSCI") All Country World Index ("ACWI") ex USA Index (net) (the "benchmark"). Sector selection was positive, relative to the benchmark, mainly from an overweight to the technology sector, which was boosted by AI-related sentiment, and an underweight to the materials sector, which was impacted by concerns about weaker demand especially from China. Country selection was positive, as overweights to the Netherlands and Taiwan, and an underweight to China, all contributed. Stock selection was also positive during the period.
Top contributors to performance:
Significant individual stock contributors during the period included Japanese semiconductor equipment company Screen Holdings, boosted by global investment into chip foundry capacity, Irish building materials company CRH, benefiting from US infrastructure-related demand and Italian cable manufacturer Prysmian, exposed to the growth in renewable energy.
Top detractors from performance:
Stock detractors during the period included Spanish refiner Repsol, impacted by a weaker oil price, Canadian copper producer First Quantum Minerals, which saw the forced closure of major mine in Panama following government intervention, and French luxury conglomerate Kering, affected by weaker global demand for luxury goods.
The following graph shows the performance of hypothetical $10,000 investments in the Fund and a broad-based securities market index over the most recently completed 10 fiscal years of the Fund, or since inception, if shorter. The Fund's performance reflects applicable sales charges and assumes the reinvestment of dividends.
| SCB Class | MSCI ACWI ex USA Index (net) |
|---|
| 12/15 | $10,000 | $10,000 |
| 09/16 | $10,575 | $10,756 |
| 09/17 | $12,902 | $12,865 |
| 09/18 | $13,013 | $13,091 |
| 09/19 | $12,463 | $12,931 |
| 09/20 | $12,688 | $13,319 |
| 09/21 | $15,196 | $16,504 |
| 09/22 | $11,226 | $12,351 |
| 09/23 | $13,338 | $14,869 |
| 09/24 | $17,033 | $18,638 |
Average Annual Total Returns
| 1 Year | 5 Years | Since Inception 12/21/15 |
|---|
| SCB Class | 27.71% | 6.45% | 6.25% |
| MSCI ACWI ex USA Index (net) | 25.35% | 7.59% | 7.35% |
The graph and table do not reflect the deduction of taxes that a shareholder would pay on Fund distributions or the redemption or sale of Fund shares.
Visit https://www.abfunds.com/link/AB/STESX-A for the most recent performance information.
| Net Assets | $8,260,302,557 |
| # of Portfolio Holdings | 84 |
| Portfolio Turnover Rate | 69% |
| Total Advisory Fees Paid | $49,085,937 |
Graphical Representation of Holdings
| Value | Value |
|---|
| Financials | 23.1% |
| Industrials | 18.1% |
| Information Technology | 14.0% |
| Consumer Discretionary | 11.5% |
| Health Care | 10.4% |
| Communication Services | 5.2% |
| Consumer Staples | 4.9% |
| Energy | 4.8% |
| Materials | 3.2% |
| Utilities | 1.7% |
| Real Estate | 1.4% |
| Short-Term Investments | 1.3% |
| Other assets less liabilities | 0.4% |
| Value | Value |
|---|
| Japan | 14.5% |
| United Kingdom | 8.3% |
| United States | 8.1% |
| China | 7.9% |
| Taiwan | 6.8% |
| Italy | 5.7% |
| Spain | 5.3% |
| Netherlands | 4.8% |
| Denmark | 4.4% |
| South Korea | 4.2% |
| Canada | 4.1% |
| Germany | 3.8% |
| Singapore | 2.9% |
| India | 2.2% |
| Others | 15.3% |
| Short-Term Investments | 1.3% |
| Other assets less liabilities | 0.4% |
Availability of Additional Information
You can find additional information on the Fund’s website at https://www.abfunds.com/link/AB/STESX-A, including the Fund's:
• Prospectus
• Financial information
• Fund holdings
• Proxy voting information
You can also request this information by contacting us at (800) 227 4618.
Shareholders who have consented to receive a single annual or semi-annual shareholder report at a shared address may revoke this consent by contacting us at (800) 227 4618.
Information Regarding the Review and Approval of the Fund’s Advisory Agreement
Information regarding the Fund’s Board of Directors’/Trustees’ review of the advisory agreement is available on the Fund’s website https://www.abfunds.com/link/AB/STESX-A. You can request this information, free of charge, by contacting us at (800) 227 4618 or by scanning the QR code below.
The [A/B] logo is a registered service mark of AllianceBernstein and AllianceBernstein® is a registered service mark used by permission of the owner, AllianceBernstein L.P.
Please scan QR code for
Fund Information
Please scan QR code for
Fund Information
Annual Shareholder Report
This annual shareholder report contains important information about the Small Cap Core Portfolio (the “Portfolio”) for the period of October 1, 2023 to September 30, 2024. You can find additional information about the Fund at https://www.abfunds.com/link/AB/SCRYX-A. You can also request this information by contacting us at (800) 227 4618.
What were the Fund costs for the last year?
(Based on a hypothetical $10,000 investment)
| Class Name | Cost of a $10,000 investment | Costs paid as a percentage of a $10,000 investment |
|---|
| Advisor Class | $101 | 0.89% |
How did the Fund perform last year? What affected the Fund’s performance?
During the 12-month period ended September 30, 2024, Advisor Class and Class Z shares of the Portfolio outperformed, while SCB Class shares underperformed the Russell 2000 Index (the "benchmark"). From a quantitative perspective, momentum and value factor exposures contributed to performance, relative to the benchmark. Conversely, the Portfolio’s exposure to companies with high profitability detracted from performance as low profitability companies outperformed during the period. Additionally, the Portfolio’s exposure to holdings with strong investor sentiment negatively impacted performance as companies with weaker historical investor sentiment outperformed.
Top contributors to performance:
During the 12-month period, from an industry perspective, an underweight exposure to oil and gas drilling and an overweight to homebuilders contributed. Additionally stock selection within the industrials and financials sectors was positive.
Top detractors from performance:
During the 12-month period, from an industry perspective, an overweight to oil, gas, and consumable fuels and an overweight to electric utilities detracted. Additionally, stock selection within the consumer staples and information technology sectors was negative.
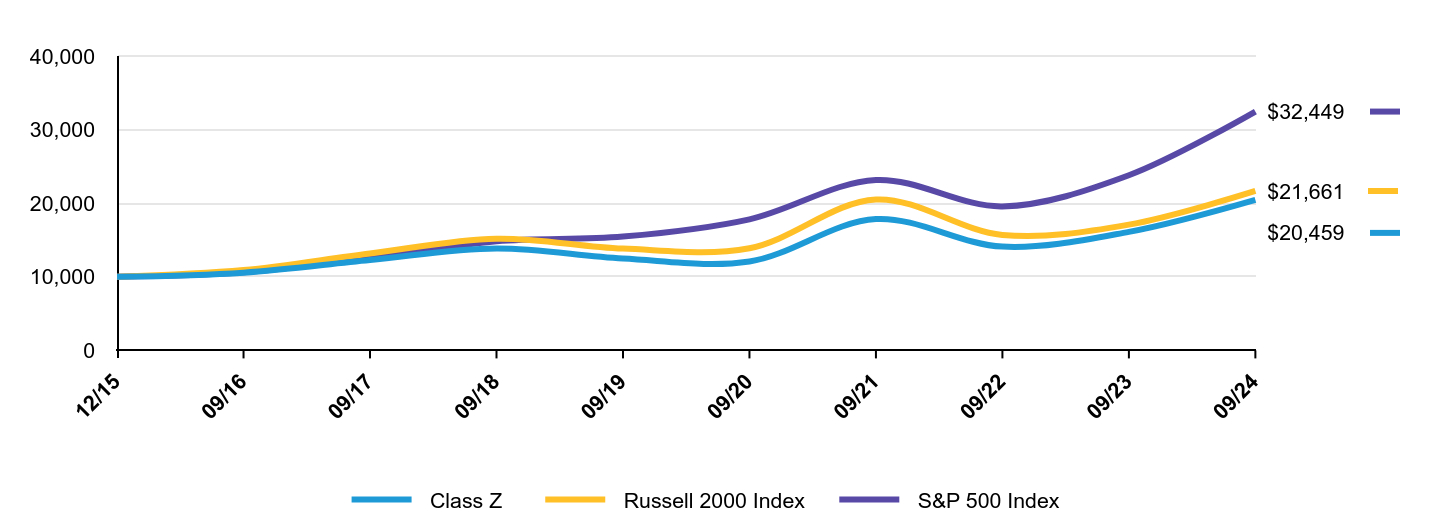
The following graph shows the performance of hypothetical $10,000 investments in the Fund, a broad-based securities market index and an additional index that corresponds to the Fund's investment strategies, over the most recently completed 10 fiscal years of the Fund, or since inception, if shorter. The Fund's performance reflects applicable sales charges and assumes the reinvestment of dividends.
| Advisor Class | Russell 2000 Index | S&P 500 Index |
|---|
| 12/15 | $10,000 | $10,000 | $10,000 |
| 09/16 | $10,565 | $10,911 | $10,606 |
| 09/17 | $12,287 | $13,174 | $12,580 |
| 09/18 | $13,840 | $15,181 | $14,833 |
| 09/19 | $12,470 | $13,832 | $15,464 |
| 09/20 | $12,075 | $13,885 | $17,807 |
| 09/21 | $17,826 | $20,506 | $23,149 |
| 09/22 | $14,079 | $15,687 | $19,568 |
| 09/23 | $16,094 | $17,088 | $23,798 |
| 09/24 | $20,433 | $21,661 | $32,449 |
Average Annual Total Returns
| 1 Year | 5 Years | Since Inception 12/29/15 |
|---|
| Advisor Class | 26.96% | 10.38% | 8.50% |
| Russell 2000 Index | 26.76% | 9.39% | 9.22% |
| S&P 500 Index | 36.35% | 15.98% | 14.38% |
The graph and table do not reflect the deduction of taxes that a shareholder would pay on Fund distributions or the redemption or sale of Fund shares.
Visit https://www.abfunds.com/link/AB/SCRYX-A for the most recent performance information.
| Net Assets | $742,166,244 |
| # of Portfolio Holdings | 229 |
| Portfolio Turnover Rate | 63% |
| Total Advisory Fees Paid | $5,416,981 |
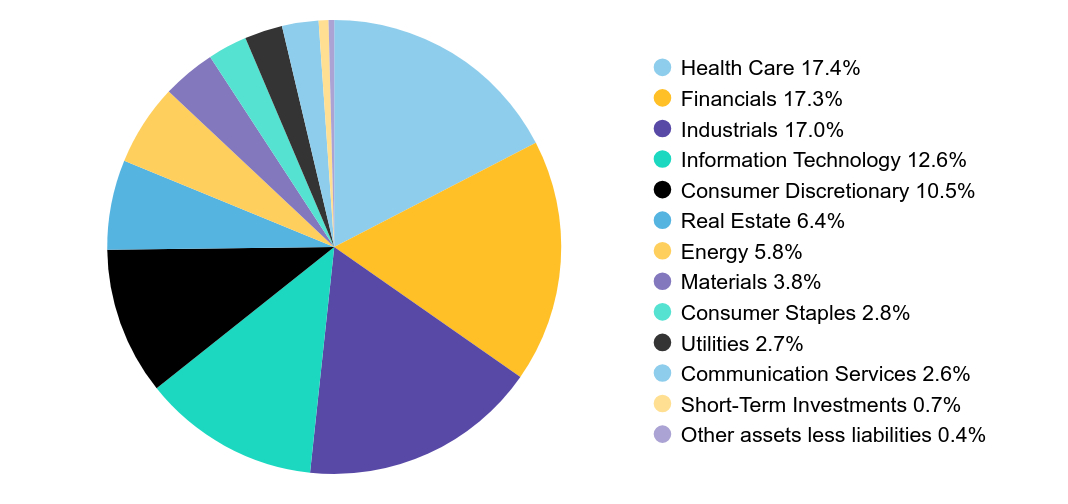
Graphical Representation of Holdings
| Company | U.S. $ Value | % of Net Assets |
|---|
| Vaxcyte, Inc. | $6,872,198 | 0.9% |
| Insmed, Inc. | $6,053,963 | 0.8% |
| Jackson Financial, Inc. - Class A | $5,885,612 | 0.8% |
| Fabrinet | $5,733,670 | 0.8% |
| Boot Barn Holdings, Inc. | $5,731,013 | 0.8% |
| Taylor Morrison Home Corp. | $5,626,491 | 0.8% |
| Powell Industries, Inc. | $5,607,245 | 0.8% |
| SPX Technologies, Inc. | $5,516,359 | 0.7% |
| ACI Worldwide, Inc. | $5,431,030 | 0.7% |
| SPS Commerce, Inc. | $5,378,509 | 0.7% |
| Total | $57,836,090 | 7.8% |
| Value | Value |
|---|
| Health Care | 17.4% |
| Financials | 17.3% |
| Industrials | 17.0% |
| Information Technology | 12.6% |
| Consumer Discretionary | 10.5% |
| Real Estate | 6.4% |
| Energy | 5.8% |
| Materials | 3.8% |
| Consumer Staples | 2.8% |
| Utilities | 2.7% |
| Communication Services | 2.6% |
| Short-Term Investments | 0.7% |
| Other assets less liabilities | 0.4% |
Availability of Additional Information
You can find additional information on the Fund’s website at https://www.abfunds.com/link/AB/SCRYX-A, including the Fund's:
• Prospectus
• Financial information
• Fund holdings
• Proxy voting information
You can also request this information by contacting us at (800) 227 4618.
Shareholders who have consented to receive a single annual or semi-annual shareholder report at a shared address may revoke this consent by contacting us at (800) 227 4618.
Information Regarding the Review and Approval of the Fund’s Advisory Agreement
Information regarding the Fund’s Board of Directors’/Trustees’ review of the advisory agreement is available on the Fund’s website https://www.abfunds.com/link/AB/SCRYX-A. You can request this information, free of charge, by contacting us at (800) 227 4618 or by scanning the QR code below.
The [A/B] logo is a registered service mark of AllianceBernstein and AllianceBernstein® is a registered service mark used by permission of the owner, AllianceBernstein L.P.
Please scan QR code for
Fund Information
Please scan QR code for
Fund Information
Annual Shareholder Report
This annual shareholder report contains important information about the Small Cap Core Portfolio (the “Portfolio”) for the period of October 1, 2023 to September 30, 2024. You can find additional information about the Fund at https://www.abfunds.com/link/AB/SCRZX-A. You can also request this information by contacting us at (800) 227 4618.
What were the Fund costs for the last year?
(Based on a hypothetical $10,000 investment)
| Class Name | Cost of a $10,000 investment | Costs paid as a percentage of a $10,000 investment |
|---|
| Class Z | $100 | 0.88% |
How did the Fund perform last year? What affected the Fund’s performance?
During the 12-month period ended September 30, 2024, Advisor Class and Class Z shares of the Portfolio outperformed, while SCB Class shares underperformed the Russell 2000 Index (the "benchmark"). From a quantitative perspective, momentum and value factor exposures contributed to performance, relative to the benchmark. Conversely, the Portfolio’s exposure to companies with high profitability detracted from performance as low profitability companies outperformed during the period. Additionally, the Portfolio’s exposure to holdings with strong investor sentiment negatively impacted performance as companies with weaker historical investor sentiment outperformed.
Top contributors to performance:
During the 12-month period, from an industry perspective, an underweight exposure to oil and gas drilling and an overweight to homebuilders contributed. Additionally stock selection within the industrials and financials sectors was positive.
Top detractors from performance:
During the 12-month period, from an industry perspective, an overweight to oil, gas, and consumable fuels and an overweight to electric utilities detracted. Additionally, stock selection within the consumer staples and information technology sectors was negative.
The following graph shows the performance of hypothetical $10,000 investments in the Fund, a broad-based securities market index and an additional index that corresponds to the Fund's investment strategies, over the most recently completed 10 fiscal years of the Fund, or since inception, if shorter. The Fund's performance reflects applicable sales charges and assumes the reinvestment of dividends.
| Class Z | Russell 2000 Index | S&P 500 Index |
|---|
| 12/15 | $10,000 | $10,000 | $10,000 |
| 09/16 | $10,565 | $10,911 | $10,606 |
| 09/17 | $12,280 | $13,174 | $12,580 |
| 09/18 | $13,838 | $15,181 | $14,833 |
| 09/19 | $12,481 | $13,832 | $15,464 |
| 09/20 | $12,077 | $13,885 | $17,807 |
| 09/21 | $17,839 | $20,506 | $23,149 |
| 09/22 | $14,101 | $15,687 | $19,568 |
| 09/23 | $16,110 | $17,088 | $23,798 |
| 09/24 | $20,459 | $21,661 | $32,449 |
Average Annual Total Returns
| 1 Year | 5 Years | Since Inception 12/29/15 |
|---|
| Class Z | 26.99% | 10.39% | 8.52% |
| Russell 2000 Index | 26.76% | 9.39% | 9.22% |
| S&P 500 Index | 36.35% | 15.98% | 14.38% |
The graph and table do not reflect the deduction of taxes that a shareholder would pay on Fund distributions or the redemption or sale of Fund shares.
Visit https://www.abfunds.com/link/AB/SCRZX-A for the most recent performance information.
| Net Assets | $742,166,244 |
| # of Portfolio Holdings | 229 |
| Portfolio Turnover Rate | 63% |
| Total Advisory Fees Paid | $5,416,981 |
Graphical Representation of Holdings
| Company | U.S. $ Value | % of Net Assets |
|---|
| Vaxcyte, Inc. | $6,872,198 | 0.9% |
| Insmed, Inc. | $6,053,963 | 0.8% |
| Jackson Financial, Inc. - Class A | $5,885,612 | 0.8% |
| Fabrinet | $5,733,670 | 0.8% |
| Boot Barn Holdings, Inc. | $5,731,013 | 0.8% |
| Taylor Morrison Home Corp. | $5,626,491 | 0.8% |
| Powell Industries, Inc. | $5,607,245 | 0.8% |
| SPX Technologies, Inc. | $5,516,359 | 0.7% |
| ACI Worldwide, Inc. | $5,431,030 | 0.7% |
| SPS Commerce, Inc. | $5,378,509 | 0.7% |
| Total | $57,836,090 | 7.8% |
| Value | Value |
|---|
| Health Care | 17.4% |
| Financials | 17.3% |
| Industrials | 17.0% |
| Information Technology | 12.6% |
| Consumer Discretionary | 10.5% |
| Real Estate | 6.4% |
| Energy | 5.8% |
| Materials | 3.8% |
| Consumer Staples | 2.8% |
| Utilities | 2.7% |
| Communication Services | 2.6% |
| Short-Term Investments | 0.7% |
| Other assets less liabilities | 0.4% |
Availability of Additional Information
You can find additional information on the Fund’s website at https://www.abfunds.com/link/AB/SCRZX-A, including the Fund's:
• Prospectus
• Financial information
• Fund holdings
• Proxy voting information
You can also request this information by contacting us at (800) 227 4618.
Shareholders who have consented to receive a single annual or semi-annual shareholder report at a shared address may revoke this consent by contacting us at (800) 227 4618.
Information Regarding the Review and Approval of the Fund’s Advisory Agreement
Information regarding the Fund’s Board of Directors’/Trustees’ review of the advisory agreement is available on the Fund’s website https://www.abfunds.com/link/AB/SCRZX-A. You can request this information, free of charge, by contacting us at (800) 227 4618 or by scanning the QR code below.
The [A/B] logo is a registered service mark of AllianceBernstein and AllianceBernstein® is a registered service mark used by permission of the owner, AllianceBernstein L.P.
Please scan QR code for
Fund Information
Please scan QR code for
Fund Information
Annual Shareholder Report
This annual shareholder report contains important information about the Small Cap Core Portfolio (the “Portfolio”) for the period of October 1, 2023 to September 30, 2024. You can find additional information about the Fund at https://www.abfunds.com/link/AB/SCRSX-A. You can also request this information by contacting us at (800) 227 4618.
What were the Fund costs for the last year?
(Based on a hypothetical $10,000 investment)
| Class Name | Cost of a $10,000 investment | Costs paid as a percentage of a $10,000 investment |
|---|
| SCB Class | $129 | 1.14% |
How did the Fund perform last year? What affected the Fund’s performance?
During the 12-month period ended September 30, 2024, Advisor Class and Class Z shares of the Portfolio outperformed, while SCB Class shares underperformed the Russell 2000 Index (the "benchmark"). From a quantitative perspective, momentum and value factor exposures contributed to performance, relative to the benchmark. Conversely, the Portfolio’s exposure to companies with high profitability detracted from performance as low profitability companies outperformed during the period. Additionally, the Portfolio’s exposure to holdings with strong investor sentiment negatively impacted performance as companies with weaker historical investor sentiment outperformed.
Top contributors to performance:
During the 12-month period, from an industry perspective, an underweight exposure to oil and gas drilling and an overweight to homebuilders contributed. Additionally stock selection within the industrials and financials sectors was positive.
Top detractors from performance:
During the 12-month period, from an industry perspective, an overweight to oil, gas, and consumable fuels and an overweight to electric utilities detracted. Additionally, stock selection within the consumer staples and information technology sectors was negative.
The following graph shows the performance of hypothetical $10,000 investments in the Fund, a broad-based securities market index and an additional index that corresponds to the Fund's investment strategies, over the most recently completed 10 fiscal years of the Fund, or since inception, if shorter. The Fund's performance reflects applicable sales charges and assumes the reinvestment of dividends.
| SCB Class | Russell 2000 Index | S&P 500 Index |
|---|
| 12/15 | $10,000 | $10,000 | $10,000 |
| 09/16 | $10,545 | $10,911 | $10,606 |
| 09/17 | $12,230 | $13,174 | $12,580 |
| 09/18 | $13,751 | $15,181 | $14,833 |
| 09/19 | $12,356 | $13,832 | $15,464 |
| 09/20 | $11,933 | $13,885 | $17,807 |
| 09/21 | $17,579 | $20,506 | $23,149 |
| 09/22 | $13,856 | $15,687 | $19,568 |
| 09/23 | $15,792 | $17,088 | $23,798 |
| 09/24 | $20,004 | $21,661 | $32,449 |
Average Annual Total Returns
| 1 Year | 5 Years | Since Inception 12/29/15 |
|---|
| SCB Class | 26.67% | 10.12% | 8.24% |
| Russell 2000 Index | 26.76% | 9.39% | 9.22% |
| S&P 500 Index | 36.35% | 15.98% | 14.38% |
The graph and table do not reflect the deduction of taxes that a shareholder would pay on Fund distributions or the redemption or sale of Fund shares.
Visit https://www.abfunds.com/link/AB/SCRSX-A for the most recent performance information.
| Net Assets | $742,166,244 |
| # of Portfolio Holdings | 229 |
| Portfolio Turnover Rate | 63% |
| Total Advisory Fees Paid | $5,416,981 |
Graphical Representation of Holdings
| Company | U.S. $ Value | % of Net Assets |
|---|
| Vaxcyte, Inc. | $6,872,198 | 0.9% |
| Insmed, Inc. | $6,053,963 | 0.8% |
| Jackson Financial, Inc. - Class A | $5,885,612 | 0.8% |
| Fabrinet | $5,733,670 | 0.8% |
| Boot Barn Holdings, Inc. | $5,731,013 | 0.8% |
| Taylor Morrison Home Corp. | $5,626,491 | 0.8% |
| Powell Industries, Inc. | $5,607,245 | 0.8% |
| SPX Technologies, Inc. | $5,516,359 | 0.7% |
| ACI Worldwide, Inc. | $5,431,030 | 0.7% |
| SPS Commerce, Inc. | $5,378,509 | 0.7% |
| Total | $57,836,090 | 7.8% |
| Value | Value |
|---|
| Health Care | 17.4% |
| Financials | 17.3% |
| Industrials | 17.0% |
| Information Technology | 12.6% |
| Consumer Discretionary | 10.5% |
| Real Estate | 6.4% |
| Energy | 5.8% |
| Materials | 3.8% |
| Consumer Staples | 2.8% |
| Utilities | 2.7% |
| Communication Services | 2.6% |
| Short-Term Investments | 0.7% |
| Other assets less liabilities | 0.4% |
Availability of Additional Information
You can find additional information on the Fund’s website at https://www.abfunds.com/link/AB/SCRSX-A, including the Fund's:
• Prospectus
• Financial information
• Fund holdings
• Proxy voting information
You can also request this information by contacting us at (800) 227 4618.
Shareholders who have consented to receive a single annual or semi-annual shareholder report at a shared address may revoke this consent by contacting us at (800) 227 4618.
Information Regarding the Review and Approval of the Fund’s Advisory Agreement
Information regarding the Fund’s Board of Directors’/Trustees’ review of the advisory agreement is available on the Fund’s website https://www.abfunds.com/link/AB/SCRSX-A. You can request this information, free of charge, by contacting us at (800) 227 4618 or by scanning the QR code below.
The [A/B] logo is a registered service mark of AllianceBernstein and AllianceBernstein® is a registered service mark used by permission of the owner, AllianceBernstein L.P.
Please scan QR code for
Fund Information
ITEM 2. CODE OF ETHICS.
(a) The registrant has adopted a code of ethics that applies to its principal executive officer, principal financial officer and principal accounting officer. A copy of the registrant’s code of ethics is filed herewith as Exhibit 19(a)(1).
(b) During the period covered by this report, no material amendments were made to the provisions of the code of ethics adopted in 2(a) above.
(c) During the period covered by this report, no implicit or explicit waivers to the provisions of the code of ethics adopted in 2(a) above were granted.
ITEM 3. AUDIT COMMITTEE FINANCIAL EXPERT.
The registrant’s Board of Directors has determined that independent directors Donald K. Peterson, Debra Perry, R. Jay Gerken and Jeffrey R. Holland qualify as audit committee financial experts.
ITEM 4. PRINCIPAL ACCOUNTANT FEES AND SERVICES.
(a) - (c) The following table sets forth the aggregate fees billed* by the independent registered public accounting firm Ernst & Young LLP, for the Fund’s last two fiscal years, for professional services rendered for: (i) the audit of the Fund’s annual financial statements included in the Fund’s annual report to stockholders; (ii) assurance and related services that are reasonably related to the performance of the audit of the Fund’s financial statements and are not reported under (i), which include advice and education related to accounting and auditing issues, quarterly press release review (for those Funds that issue quarterly press releases), and preferred stock maintenance testing (for those Funds that issue preferred stock); and (iii) tax compliance, tax advice and tax return preparation.
| | | | | | | | | | | | | | | | |
| | | | | | Audit Fees | | | Audit-Related
Fees | | | Tax Fees* | |
Bernstein Fund Inc. Small Cap Core Portfolio | | | 2023 | | | $ | 22,785 | | | $ | 1,933 | | | $ | 24,794 | |
| | | | |
| | | 2024 | | | $ | 22,785 | | | $ | 1,176 | | | $ | 26,792 | |
| | | | |
Bernstein Fund Inc. International Small Cap Portfolio | | | 2023 | | | $ | 26,250 | | | $ | 1,933 | | | $ | 111,843 | |
| | | | |
| | | 2024 | | | $ | 26,250 | | | $ | 1,176 | | | $ | 60,056 | |
| | | | |
Bernstein Fund Inc. International Strategic Equities Portfolio | | | 2023 | | | $ | 26,250 | | | $ | 1,933 | | | $ | 127,459 | |
| | | | |
| | | 2024 | | | $ | 26,250 | | | $ | 1,176 | | | $ | 130,492 | |
| * | Paid to Ernst & Young LLP. |
(d) Not applicable.
(e) (1) Beginning with audit and non-audit service contracts entered into on or after May 6, 2003, the Fund’s Audit Committee policies and procedures require the pre-approval of all audit and non-audit services provided to the Fund by the Fund’s independent registered public accounting firm. The Fund’s Audit Committee policies and procedures also require pre-approval of all audit and non-audit services provided to the Adviser and Service Affiliates to the extent that these services are directly related to the operations or financial reporting of the Fund.
(e) (2) No percentage of services addressed by (b) and (c) of this Item 4 were approved pursuant to the waiver provision of paragraph (c)(7)(i)(C) of Rule 2-01 of Regulation S-X. No amounts are reported for Item 4 (d).
(f) Not applicable.
(g) The following table sets forth the aggregate non-audit services provided to the Fund, the Fund’s Adviser and entities that control, are controlled by or under common control with the Adviser that provide ongoing services to the Fund: (“Service Affiliates”):
| | | | | | | | | | | | |
| | | | All Fees for
Non-Audit Services
Provided to the
Portfolio, the Adviser
and Service
Affiliates | | | Total Amount of
Foregoing Column Pre-
approved by the Audit
Committee
(Portion Comprised of
Audit Related Fees)
(Portion Comprised of
Tax Fees) | |
Bernstein Fund Inc. Small Cap Core Portfolio | | | 2023 | | | $ | 5,896,623 | | | $ | 26,727 | |
| | | | | | | | | | $ | (1,933 | ) |
| | | | | | | | | | $ | (24,794 | ) |
| | | |
| | | 2024 | | | $ | 4,438,852 | | | $ | 27,968 | |
| | | | | | | | | | $ | (1,176 | ) |
| | | | | | | | | | $ | (26,792 | ) |
| | | |
Bernstein Fund Inc. International Small Cap Portfolio | | | 2023 | | | $ | 5,983,672 | | | $ | 113,776 | |
| | | | | | | | | | $ | (1,933 | ) |
| | | | | | | | | | $ | (111,843 | ) |
| | | |
| | | 2024 | | | $ | 4,472,116 | | | $ | 61,232 | |
| | | | | | | | | | $ | (1,176 | ) |
| | | | | | | | | | $ | (60,056 | ) |
| | | |
Bernstein Fund Inc. International Strategic Equities Portfolio | | | 2023 | | | $ | 5,999,288 | | | $ | 129,392 | |
| | | | | | | | | | $ | (1,933 | ) |
| | | | | | | | | | $ | (127,459 | ) |
| | | |
| | | 2024 | | | $ | 4,542,552 | | | $ | 131,668 | |
| | | | | | | | | | $ | (1,176 | ) |
| | | | | | | | | | $ | (130,492 | ) |
(h) The Audit Committee of the Fund has considered whether the provision of any non-audit services not pre-approved by the Audit Committee provided by the Fund’s independent registered public accounting firm to the Adviser and Service Affiliates is compatible with maintaining the auditor’s independence.
(i) Not applicable.
(j) Not applicable.
ITEM 5. AUDIT COMMITTEE OF LISTED REGISTRANTS.
Not applicable to the registrant.
ITEM 6. INVESTMENTS.
Please see Schedule of Investments contained in the Report to Shareholders included under Item 1 of this Form N-CSR.
ITEM 7. FINANCIAL STATEMENTS AND FINANCIAL HIGHLIGHTS FOR OPEN-END MANAGEMENT INVESTMENT COMPANIES.
BERNSTEIN FUND, INC.
Small Cap Core Portfolio
International Small Cap Portfolio
International Strategic Equities Portfolio
ANNUAL FINANCIAL STATEMENTS AND ADDITIONAL INFORMATION
SEPTEMBER 30, 2024
Table of Contents
Before investing in any portfolio of the Bernstein Fund, Inc., a prospective investor should consider carefully the portfolio’s investment objectives and policies, charges, expenses and risks. These and other matters of importance to prospective investors are contained in the portfolios’ prospectus, an additional copy of which may be obtained by visiting our website at www.Bernstein.com and clicking on “Investments”, found in the footer, then “Mutual Fund Information—Prospectuses, SAIs and Shareholder Reports” or by calling your financial advisor or by calling Bernstein’s mutual fund shareholder help line at 212.756.4097. Please read the prospectus carefully before investing.
For performance information current to the most recent month-end, please call (collect) 212.486.5800.
This shareholder report must be preceded or accompanied by the Bernstein Fund, Inc. prospectus for individuals who are not shareholders of the Fund.
You may obtain a description of the Fund’s proxy voting policies and procedures, and information regarding how the Fund voted proxies relating to portfolio securities during the most recent 12-month period ended June 30, without charge. Simply visit www.AllianceBernstein.com, or go to the Securities and Exchange Commission’s website at www.sec.gov, or call AllianceBernstein at 800.227.4618.
The Fund will file its complete schedule of portfolio holdings with the Commission for the first and third quarters of each fiscal year as an exhibit to its reports on Form N-PORT. The Fund’s Form N-PORT reports are available on the Commission’s website at www.sec.gov.
Investment Products Offered: · Are Not FDIC Insured · May Lose Value · Are Not Bank Guaranteed
Schedule of Investments
Bernstein Fund, Inc.
Schedule of Investments
Small Cap Core Portfolio
September 30, 2024
| | | | | | | | |
| | |
| Company | | Shares | | | U.S. $ Value | |
|
| COMMON STOCKS–98.9% | |
|
| Health Care–17.4% | |
| Biotechnology–8.8% | |
Apogee Therapeutics, Inc.(a) | | | 60,450 | | | $ | 3,550,833 | |
Ascendis Pharma A/S (ADR)(a) | | | 20,537 | | | | 3,066,379 | |
Blueprint Medicines Corp.(a) | | | 44,975 | | | | 4,160,187 | |
Bridgebio Pharma, Inc.(a) | | | 128,680 | | | | 3,276,193 | |
CG oncology, Inc.(a) | | | 74,670 | | | | 2,817,299 | |
Cullinan Therapeutics, Inc.(a) | | | 140,480 | | | | 2,351,635 | |
Cytokinetics, Inc.(a) | | | 80,160 | | | | 4,232,448 | |
Denali Therapeutics, Inc.(a) | | | 109,190 | | | | 3,180,705 | |
Halozyme Therapeutics, Inc.(a) | | | 91,472 | | | | 5,235,857 | |
Insmed, Inc.(a) | | | 82,931 | | | | 6,053,963 | |
Intellia Therapeutics, Inc.(a) | | | 112,710 | | | | 2,316,191 | |
Legend Biotech Corp. (ADR)(a) | | | 55,870 | | | | 2,722,545 | |
Merus NV(a) | | | 48,320 | | | | 2,414,067 | |
MoonLake Immunotherapeutics(a) | | | 53,850 | | | | 2,715,117 | |
Ultragenyx Pharmaceutical, Inc.(a) | | | 71,594 | | | | 3,977,047 | |
Vaxcyte, Inc.(a) | | | 60,140 | | | | 6,872,198 | |
Viking Therapeutics, Inc.(a) | | | 58,770 | | | | 3,720,729 | |
Viridian Therapeutics, Inc.(a) | | | 123,410 | | | | 2,807,578 | |
| | | | | | | | |
| | | | | | | 65,470,971 | |
| | | | | | | | |
| Health Care Equipment & Supplies–1.9% | | | | | |
AtriCure, Inc.(a) | | | 169,000 | | | | 4,738,760 | |
CONMED Corp. | | | 43,359 | | | | 3,118,379 | |
Integra LifeSciences Holdings Corp.(a) | | | 63,920 | | | | 1,161,426 | |
iRhythm Technologies, Inc.(a) | | | 18,360 | | | | 1,363,047 | |
OraSure Technologies, Inc.(a) | | | 825,088 | | | | 3,523,126 | |
| | | | | | | | |
| | | | | | | 13,904,738 | |
| | | | | | | | |
| Health Care Providers & Services–4.2% | |
AMN Healthcare Services, Inc.(a) | | | 53,055 | | | | 2,249,002 | |
Cross Country Healthcare, Inc.(a) | | | 196,920 | | | | 2,646,605 | |
Hims & Hers Health, Inc.(a) | | | 172,500 | | | | 3,177,450 | |
Inari Medical, Inc.(a) | | | 87,506 | | | | 3,608,747 | |
Option Care Health, Inc.(a) | | | 144,390 | | | | 4,519,407 | |
Owens & Minor, Inc.(a) | | | 218,090 | | | | 3,421,832 | |
Pediatrix Medical Group, Inc.(a) | | | 198,270 | | | | 2,297,949 | |
PetIQ, Inc.(a) | | | 153,940 | | | | 4,736,734 | |
PROCEPT BioRobotics Corp.(a) | | | 59,250 | | | | 4,747,110 | |
| | | | | | | | |
| | | | | | | 31,404,836 | |
| | | | | | | | |
| Health Care Technology–0.5% | |
Teladoc Health, Inc.(a) | | | 436,669 | | | | 4,008,621 | |
| | | | | | | | |
| Life Sciences Tools & Services–0.2% | |
Quanterix Corp.(a) | | | 84,490 | | | | 1,094,990 | |
| | | | | | | | |
| Pharmaceuticals–1.8% | |
Collegium Pharmaceutical, Inc.(a) | | | 66,120 | | | | 2,554,877 | |
Corcept Therapeutics, Inc.(a) | | | 68,724 | | | | 3,180,547 | |
Harmony Biosciences Holdings, Inc.(a) | | | 75,190 | | | | 3,007,600 | |
Intra-Cellular Therapies, Inc.(a) | | | 45,930 | | | $ | 3,360,698 | |
Rapport Therapeutics, Inc.(a) | | | 63,020 | | | | 1,290,649 | |
| | | | | | | | |
| | | | | | | 13,394,371 | |
| | | | | | | | |
| | | | | | | 129,278,527 | |
| | | | | | | | |
| | | | | | | | |
| | |
| Financials–17.3% | | | | | |
| Banks–9.7% | | | | | |
1st Source Corp. | | | 56,257 | | | | 3,368,669 | |
Associated Banc-Corp. | | | 198,190 | | | | 4,269,013 | |
Bank of Marin Bancorp | | | 88,110 | | | | 1,770,130 | |
BankUnited, Inc. | | | 116,599 | | | | 4,248,867 | |
Berkshire Hills Bancorp, Inc. | | | 141,410 | | | | 3,808,171 | |
Customers Bancorp, Inc.(a) | | | 66,020 | | | | 3,066,629 | |
First BanCorp./Puerto Rico | | | 210,760 | | | | 4,461,789 | |
First Bancorp/Southern Pines NC | | | 69,340 | | | | 2,883,851 | |
First Busey Corp. | | | 134,890 | | | | 3,509,838 | |
First Hawaiian, Inc. | | | 128,830 | | | | 2,982,414 | |
Heritage Financial Corp./WA | | | 162,710 | | | | 3,542,197 | |
International Bancshares Corp. | | | 67,830 | | | | 4,055,556 | |
Nicolet Bankshares, Inc. | | | 37,809 | | | | 3,615,675 | |
Northeast Bank | | | 49,111 | | | | 3,787,931 | |
Pacific Premier Bancorp, Inc. | | | 56,380 | | | | 1,418,521 | |
Peoples Bancorp, Inc./OH | | | 106,875 | | | | 3,215,869 | |
Premier Financial Corp. | | | 133,830 | | | | 3,142,328 | |
Republic Bancorp, Inc./KY–Class A | | | 38,350 | | | | 2,504,255 | |
Texas Capital Bancshares, Inc.(a) | | | 65,530 | | | | 4,682,774 | |
TriCo Bancshares | | | 80,633 | | | | 3,438,997 | |
WSFS Financial Corp. | | | 81,730 | | | | 4,167,413 | |
| | | | | | | | |
| | | | | | | 71,940,887 | |
| | | | | | | | |
| Capital Markets–1.5% | |
Federated Hermes, Inc. | | | 101,160 | | | | 3,719,653 | |
Hamilton Lane, Inc.–Class A | | | 19,410 | | | | 3,268,450 | |
Houlihan Lokey, Inc. | | | 24,516 | | | | 3,874,018 | |
| | | | | | | | |
| | | | | | | 10,862,121 | |
| | | | | | | | |
| Consumer Finance–0.8% | |
Nelnet, Inc.–Class A | | | 33,433 | | | | 3,787,291 | |
PROG Holdings, Inc. | | | 51,480 | | | | 2,496,265 | |
| | | | | | | | |
| | | | | | | 6,283,556 | |
| | | | | | | | |
| Financial Services–2.9% | |
Jackson Financial, Inc.–Class A | | | 64,514 | | | | 5,885,612 | |
Mr. Cooper Group, Inc.(a) | | | 56,351 | | | | 5,194,435 | |
NCR Atleos Corp.(a) | | | 139,018 | | | | 3,966,184 | |
Pagseguro Digital Ltd.–Class A(a) | | | 207,890 | | | | 1,789,933 | |
Payoneer Global, Inc.(a) | | | 322,632 | | | | 2,429,419 | |
Shift4 Payments, Inc.–Class A(a) | | | 21,890 | | | | 1,939,454 | |
| | | | | | | | |
| | | | | | | 21,205,037 | |
| | | | | | | | |
| Insurance–1.6% | |
Assured Guaranty Ltd. | | | 42,630 | | | | 3,389,938 | |
Genworth Financial, Inc.(a) | | | 659,090 | | | | 4,514,766 | |
Hanover Insurance Group, Inc. (The) | | | 27,108 | | | | 4,014,966 | |
| | | | | | | | |
| | | | | | | 11,919,670 | |
| | | | | | | | |
Schedule of Investments (continued)
| | | | | | | | |
| | | |
| Company | | Shares | | | U.S. $ Value | |
| Mortgage Real Estate Investment Trusts (REITs)–0.8% | |
Chimera Investment Corp. | | | 217,276 | | | $ | 3,439,479 | |
MFA Financial, Inc. | | | 176,790 | | | | 2,248,769 | |
| | | | | | | | |
| | | | | | | 5,688,248 | |
| | | | | | | | |
| | | | | | | 127,899,519 | |
| | | | | | | | |
| | | | | | | | |
| |
| Industrials–17.0% | |
| Aerospace & Defense–1.1% | |
AeroVironment, Inc.(a) | | | 10,810 | | | | 2,167,405 | |
Curtiss-Wright Corp. | | | 11,860 | | | | 3,898,264 | |
Leonardo DRS, Inc.(a) | | | 86,510 | | | | 2,441,312 | |
| | | | | | | | |
| | | | | | | 8,506,981 | |
| | | | | | | | |
| Air Freight & Logistics–0.3% | |
Radiant Logistics, Inc.(a) | | | 294,353 | | | | 1,892,690 | |
| | | | | | | | |
| Building Products–1.4% | |
American Woodmark Corp.(a) | | | 40,150 | | | | 3,752,018 | |
Gibraltar Industries, Inc.(a) | | | 60,371 | | | | 4,221,744 | |
UFP Industries, Inc. | | | 21,077 | | | | 2,765,513 | |
| | | | | | | | |
| | | | | | | 10,739,275 | |
| | | | | | | | |
| Commercial Services & Supplies–1.1% | |
Quad/Graphics, Inc. | | | 199,605 | | | | 906,207 | |
Steelcase, Inc.–Class A | | | 277,550 | | | | 3,744,149 | |
Tetra Tech, Inc. | | | 73,260 | | | | 3,454,942 | |
| | | | | | | | |
| | | | | | | 8,105,298 | |
| | | | | | | | |
| Construction & Engineering–3.2% | |
Comfort Systems USA, Inc. | | | 10,279 | | | | 4,012,408 | |
Construction Partners, Inc.–Class A(a) | | | 60,652 | | | | 4,233,510 | |
Fluor Corp.(a) | | | 106,920 | | | | 5,101,153 | |
Granite Construction, Inc. | | | 19,810 | | | | 1,570,537 | |
IES Holdings, Inc.(a) | | | 25,370 | | | | 5,064,359 | |
MasTec, Inc.(a) | | | 30,694 | | | | 3,778,431 | |
| | | | | | | | |
| | | | | | | 23,760,398 | |
| | | | | | | | |
| Electrical Equipment–0.8% | |
Powell Industries, Inc. | | | 25,259 | | | | 5,607,245 | |
| | | | | | | | |
| Ground Transportation–0.4% | |
ArcBest Corp. | | | 28,523 | | | | 3,093,319 | |
| | | | | | | | |
| Machinery–3.3% | |
Blue Bird Corp.(a) | | | 68,520 | | | | 3,286,219 | |
Gates Industrial Corp. PLC(a) | | | 205,351 | | | | 3,603,910 | |
Hillman Solutions Corp.(a) | | | 351,925 | | | | 3,716,328 | |
Mueller Industries, Inc. | | | 57,000 | | | | 4,223,700 | |
Shyft Group, Inc. (The) | | | 227,770 | | | | 2,858,514 | |
SPX Technologies, Inc.(a) | | | 34,594 | | | | 5,516,359 | |
Wabash National Corp. | | | 78,801 | | | | 1,512,191 | |
| | | | | | | | |
| | | | | | | 24,717,221 | |
| | | | | | | | |
| Marine Transportation–1.2% | |
Kirby Corp.(a) | | | 31,460 | | | | 3,851,648 | |
Matson, Inc. | | | 34,670 | | | | 4,944,635 | |
| | | | | | | | |
| | | | | | | 8,796,283 | |
| | | | | | | | |
| Professional Services–2.1% | |
FTI Consulting, Inc.(a) | | | 15,420 | | | $ | 3,508,975 | |
ICF International, Inc. | | | 21,270 | | | | 3,547,623 | |
Korn Ferry | | | 62,140 | | | | 4,675,414 | |
Legalzoomcom, Inc.(a) | | | 249,370 | | | | 1,583,500 | |
WNS Holdings Ltd.(a) | | | 38,652 | | | | 2,037,347 | |
| | | | | | | | |
| | | | | | | 15,352,859 | |
| | | | | | | | |
| Trading Companies & Distributors–2.1% | |
BlueLinx Holdings, Inc.(a) | | | 31,540 | | | | 3,324,947 | |
Boise Cascade Co. | | | 34,322 | | | | 4,838,716 | |
GMS, Inc.(a) | | | 44,411 | | | | 4,022,304 | |
MRC Global, Inc.(a) | | | 284,522 | | | | 3,624,810 | |
| | | | | | | | |
| | | | | | | 15,810,777 | |
| | | | | | | | |
| | | | | | | 126,382,346 | |
| | | | | | | | |
| | | | | | | | |
| | |
| Information Technology–12.6% | | | | | |
| Communications Equipment–0.6% | | | | | |
Calix, Inc.(a) | | | 108,450 | | | | 4,206,775 | |
| | | | | | | | |
| Electronic Equipment, Instruments & Components–2.8% | |
Avnet, Inc. | | | 60,930 | | | | 3,309,108 | |
Daktronics, Inc.(a) | | | 153,920 | | | | 1,987,107 | |
Fabrinet(a) | | | 24,250 | | | | 5,733,670 | |
Novanta, Inc.(a) | | | 16,970 | | | | 3,036,273 | |
Sanmina Corp.(a) | | | 64,736 | | | | 4,431,179 | |
TTM Technologies, Inc.(a) | | | 140,950 | | | | 2,572,338 | |
| | | | | | | | |
| | | | | | | 21,069,675 | |
| | | | | | | | |
| IT Services–0.7% | |
DigitalOcean Holdings, Inc.(a) | | | 58,470 | | | | 2,361,604 | |
Perficient, Inc.(a) | | | 35,286 | | | | 2,663,387 | |
| | | | | | | | |
| | | | | | | 5,024,991 | |
| | | | | | | | |
| Semiconductors & Semiconductor Equipment–2.4% | |
Axcelis Technologies, Inc.(a) | | | 19,140 | | | | 2,006,829 | |
Impinj, Inc.(a) | | | 10,340 | | | | 2,238,817 | |
MACOM Technology Solutions Holdings, Inc.(a) | | | 32,030 | | | | 3,563,658 | |
Onto Innovation, Inc.(a) | | | 11,850 | | | | 2,459,586 | |
Photronics, Inc.(a) | | | 81,690 | | | | 2,022,644 | |
Semtech Corp.(a) | | | 43,810 | | | | 2,000,365 | |
SMART Global Holdings, Inc.(a) | | | 154,890 | | | | 3,244,945 | |
| | | | | | | | |
| | | | | | | 17,536,844 | |
| | | | | | | | |
| Software–6.0% | |
A10 Networks, Inc. | | | 263,980 | | | | 3,811,871 | |
ACI Worldwide, Inc.(a) | | | 106,700 | | | | 5,431,030 | |
Altair Engineering, Inc.–Class A(a) | | | 56,110 | | | | 5,359,066 | |
Braze, Inc.–Class A(a) | | | 102,764 | | | | 3,323,388 | |
CommVault Systems, Inc.(a) | | | 30,918 | | | | 4,756,734 | |
Dave, Inc.(a) | | | 20,847 | | | | 833,046 | |
LiveRamp Holdings, Inc.(a) | | | 36,212 | | | | 897,333 | |
NCR Voyix Corp.(a) | | | 276,639 | | | | 3,753,991 | |
Progress Software Corp. | | | 73,701 | | | | 4,965,236 | |
Qualys, Inc.(a) | | | 32,700 | | | | 4,200,642 | |
SPS Commerce, Inc.(a) | | | 27,700 | | | | 5,378,509 | |
Xperi, Inc.(a) | | | 92,698 | | | | 856,530 | |
| | | | | | | | |
| | | |
| Company | | Shares | | | U.S. $ Value | |
Yext, Inc.(a) | | | 130,020 | | | $ | 899,739 | |
| | | | | | | | |
| | | | | | | 44,467,115 | |
| | | | | | | | |
| Technology Hardware, Storage & Peripherals–0.1% | |
Immersion Corp. | | | 124,651 | | | | 1,111,887 | |
| | | | | | | | |
| | | | | | | 93,417,287 | |
| | | | | | | | |
| | | | | | | | |
| |
| Consumer Discretionary–10.5% | |
| Automobile Components–0.7% | |
American Axle & Manufacturing Holdings, Inc.(a) | | | 479,150 | | | | 2,961,147 | |
Modine Manufacturing Co.(a) | | | 18,120 | | | | 2,406,155 | |
| | | | | | | | |
| | | | | | | 5,367,302 | |
| | | | | | | | |
| Automobiles–0.4% | |
Winnebago Industries, Inc. | | | 46,866 | | | | 2,723,383 | |
| | | | | | | | |
| Broadline Retail–0.4% | |
Dillard’s, Inc.–Class A | | | 7,690 | | | | 2,950,576 | |
| | | | | | | | |
| Diversified Consumer Services–1.0% | |
Perdoceo Education Corp. | | | 159,962 | | | | 3,557,555 | |
Stride, Inc.(a) | | | 41,310 | | | | 3,524,156 | |
| | | | | | | | |
| | | | | | | 7,081,711 | |
| | | | | | | | |
| Hotels, Restaurants & Leisure–1.9% | |
Accel Entertainment, Inc.(a) | | | 308,680 | | | | 3,586,862 | |
International Game Technology PLC | | | 81,330 | | | | 1,732,329 | |
PlayAGS, Inc.(a) | | | 133,404 | | | | 1,519,472 | |
Rush Street Interactive, Inc.(a) | | | 365,578 | | | | 3,966,521 | |
Travel + Leisure Co. | | | 72,641 | | | | 3,347,297 | |
| | | | | | | | |
| | | | | | | 14,152,481 | |
| | | | | | | | |
| Household Durables–2.5% | |
Hovnanian Enterprises, Inc.–Class A(a) | | | 14,310 | | | | 2,924,535 | |
KB Home | | | 61,430 | | | | 5,263,936 | |
Taylor Morrison Home Corp.(a) | | | 80,081 | | | | 5,626,491 | |
Tri Pointe Homes, Inc.(a) | | | 103,700 | | | | 4,698,647 | |
| | | | | | | | |
| | | | | | | 18,513,609 | |
| | | | | | | | |
| Specialty Retail–2.9% | |
Boot Barn Holdings, Inc.(a) | | | 34,260 | | | | 5,731,013 | |
Genesco, Inc.(a) | | | 62,760 | | | | 1,705,189 | |
Group 1 Automotive, Inc. | | | 13,700 | | | | 5,247,648 | |
Lands’ End, Inc.(a) | | | 149,410 | | | | 2,580,311 | |
Upbound Group, Inc. | | | 106,490 | | | | 3,406,615 | |
Wayfair, Inc.–Class A(a) | | | 55,580 | | | | 3,122,484 | |
| | | | | | | | |
| | | | | | | 21,793,260 | |
| | | | | | | | |
| Textiles, Apparel & Luxury Goods–0.7% | |
G-III Apparel Group Ltd.(a) | | | 83,370 | | | | 2,544,453 | |
Kontoor Brands, Inc. | | | 35,840 | | | | 2,930,995 | |
| | | | | | | | |
| | | | | | | 5,475,448 | |
| | | | | | | | |
| | | | | | | 78,057,770 | |
| | | | | | | | |
| | | | | | | | |
| | |
| Real Estate–6.4% | | | | | |
| Diversified REITs–0.8% | |
Broadstone Net Lease, Inc.–Class A | | | 105,660 | | | | 2,002,257 | |
Empire State Realty Trust, Inc.–Class A | | | 362,640 | | | $ | 4,018,051 | |
| | | | | | | | |
| | | | | | | 6,020,308 | |
| | | | | | | | |
| Health Care REITs–1.1% | |
Diversified Healthcare Trust | | | 820,520 | | | | 3,437,979 | |
Sabra Health Care REIT, Inc. | | | 264,660 | | | | 4,925,323 | |
| | | | | | | | |
| | | | | | | 8,363,302 | |
| | | | | | | | |
| Hotel & Resort REITs–0.6% | |
RLJ Lodging Trust | | | 391,439 | | | | 3,593,410 | |
Summit Hotel Properties, Inc. | | | 115,680 | | | | 793,565 | |
| | | | | | | | |
| | | | | | | 4,386,975 | |
| | | | | | | | |
| Industrial REITs–1.2% | |
First Industrial Realty Trust, Inc. | | | 41,766 | | | | 2,338,061 | |
Innovative Industrial Properties, Inc. | | | 25,210 | | | | 3,393,266 | |
STAG Industrial, Inc. | | | 74,304 | | | | 2,904,543 | |
| | | | | | | | |
| | | | | | | 8,635,870 | |
| | | | | | | | |
| Real Estate Management & Development–0.5% | |
Forestar Group, Inc.(a) | | | 111,060 | | | | 3,595,012 | |
| | | | | | | | |
| Retail REITs–1.9% | |
Acadia Realty Trust | | | 168,440 | | | | 3,954,971 | |
Macerich Co. (The) | | | 266,850 | | | | 4,867,344 | |
NETSTREIT Corp. | | | 97,680 | | | | 1,614,650 | |
Tanger, Inc. | | | 115,220 | | | | 3,823,000 | |
| | | | | | | | |
| | | | | | | 14,259,965 | |
| | | | | | | | |
| Specialized REITs–0.3% | |
National Storage Affiliates Trust | | | 46,930 | | | | 2,262,026 | |
| | | | | | | | |
| | | | | | | 47,523,458 | |
| | | | | | | | |
| | | | | | | | |
| | |
| Energy–5.8% | | | | | |
| Energy Equipment & Services–1.1% | |
Cactus, Inc.–Class A | | | 73,570 | | | | 4,389,922 | |
ChampionX Corp. | | | 128,890 | | | | 3,886,033 | |
| | | | | | | | |
| | | | | | | 8,275,955 | |
| | | | | | | | |
| Oil, Gas & Consumable Fuels–4.7% | |
Arch Resources, Inc. | | | 22,980 | | | | 3,174,917 | |
Ardmore Shipping Corp. | | | 95,400 | | | | 1,726,740 | |
CONSOL Energy, Inc. | | | 24,440 | | | | 2,557,646 | |
Gulfport Energy Corp.(a) | | | 16,630 | | | | 2,516,950 | |
HF Sinclair Corp. | | | 27,022 | | | | 1,204,371 | |
International Seaways, Inc. | | | 36,470 | | | | 1,880,393 | |
Magnolia Oil & Gas Corp.–Class A | | | 173,200 | | | | 4,229,544 | |
Matador Resources Co. | | | 52,730 | | | | 2,605,917 | |
Northern Oil and Gas, Inc. | | | 95,620 | | | | 3,385,904 | |
Par Pacific Holdings, Inc.(a) | | | 70,510 | | | | 1,240,976 | |
PBF Energy, Inc.–Class A | | | 72,420 | | | | 2,241,399 | |
Peabody Energy Corp. | | | 117,750 | | | | 3,125,085 | |
Scorpio Tankers, Inc. | | | 35,530 | | | | 2,533,289 | |
Teekay Tankers Ltd.–Class A | | | 34,555 | | | | 2,012,829 | |
| | | | | | | | |
| | | | | | | 34,435,960 | |
| | | | | | | | |
| | | | | | | 42,711,915 | |
| | | | | | | | |
Schedule of Investments (continued)
| | | | | | | | |
| | | |
| Company | | Shares | | | U.S. $ Value | |
| | |
| Materials–3.8% | | | | | |
| Chemicals–1.8% | |
AdvanSix, Inc. | | | 126,500 | | | $ | 3,843,070 | |
Ecovyst, Inc.(a) | | | 336,550 | | | | 2,305,368 | |
Element Solutions, Inc. | | | 113,550 | | | | 3,084,018 | |
Methanex Corp. | | | 47,260 | | | | 1,953,728 | |
Rayonier Advanced Materials, Inc.(a) | | | 290,190 | | | | 2,484,026 | |
| | | | | | | | |
| | | | | | | 13,670,210 | |
| | | | | | | | |
| Construction Materials–0.2% | |
Summit Materials, Inc.–Class A(a) | | | 34,900 | | | | 1,362,147 | |
| | | | | | | | |
| Metals & Mining–1.4% | |
Alpha Metallurgical Resources, Inc. | | | 7,493 | | | | 1,769,697 | |
Olympic Steel, Inc. | | | 42,130 | | | | 1,643,070 | |
Warrior Met Coal, Inc. | | | 59,180 | | | | 3,781,602 | |
Worthington Steel, Inc. | | | 87,790 | | | | 2,985,738 | |
| | | | | | | | |
| | | | | | | 10,180,107 | |
| | | | | | | | |
| Paper & Forest Products–0.4% | |
Sylvamo Corp. | | | 34,230 | | | | 2,938,645 | |
| | | | | | | | |
| | | | | | | 28,151,109 | |
| | | | | | | | |
| | | | | | | | |
| | |
| Consumer Staples–2.8% | | | | | |
| Consumer Staples Distribution & Retail–0.7% | |
Andersons, Inc. (The) | | | 68,990 | | | | 3,459,159 | |
Village Super Market, Inc.–Class A | | | 63,338 | | | | 2,013,515 | |
| | | | | | | | |
| | | | | | | 5,472,674 | |
| | | | | | | | |
| Food Products–1.3% | |
Cal-Maine Foods, Inc. | | | 46,320 | | | | 3,466,589 | |
John B Sanfilippo & Son, Inc. | | | 33,295 | | | | 3,140,051 | |
Nomad Foods Ltd. | | | 163,420 | | | | 3,114,785 | |
| | | | | | | | |
| | | | | | | 9,721,425 | |
| | | | | | | | |
| Household Products–0.3% | |
WD-40 Co. | | | 8,430 | | | | 2,173,928 | |
| | | | | | | | |
| Personal Care Products–0.5% | |
BellRing Brands, Inc.(a) | | | 57,800 | | | | 3,509,616 | |
| | | | | | | | |
| | | | | | | 20,877,643 | |
| | | | | | | | |
| | | | | | | | |
| | |
| Utilities–2.7% | | | | | |
| Electric Utilities–1.5% | |
Genie Energy Ltd.–Class B | | | 184,568 | | | | 2,999,230 | |
IDACORP, Inc. | | | 36,010 | | | | 3,712,271 | |
Portland General Electric Co. | | | 86,680 | | | | 4,151,972 | |
| | | | | | | | |
| | | | | | | 10,863,473 | |
| | | | | | | | |
| Gas Utilities–1.2% | |
Chesapeake Utilities Corp. | | | 35,440 | | | | 4,400,585 | |
Southwest Gas Holdings, Inc. | | | 27,897 | | | | 2,057,683 | |
UGI Corp. | | | 109,214 | | | | 2,732,534 | |
| | | | | | | | |
| | | | | | | 9,190,802 | |
| | | | | | | | |
| | | | | | | 20,054,275 | |
| | | | | | | | |
| | |
| Communication Services–2.6% | | | | | |
| Interactive Media & Services–1.7% | |
Cargurus, Inc.(a) | | | 98,480 | | | $ | 2,957,354 | |
Vimeo, Inc.(a) | | | 731,009 | | | | 3,691,595 | |
Yelp, Inc.(a) | | | 121,785 | | | | 4,272,218 | |
Ziff Davis, Inc.(a) | | | 37,169 | | | | 1,808,644 | |
| | | | | | | | |
| | | | | | | 12,729,811 | |
| | | | | | | | |
| Media–0.9% | |
Nexstar Media Group, Inc. | | | 19,588 | | | | 3,238,876 | |
Scholastic Corp. | | | 38,300 | | | | 1,225,983 | |
Thryv Holdings, Inc.(a) | | | 128,450 | | | | 2,213,193 | |
| | | | | | | | |
| | | | | | | 6,678,052 | |
| | | | | | | | |
| | | | | | | 19,407,863 | |
| | | | | | | | |
Total Common Stocks
(cost $577,613,660) | | | | | | | 733,761,712 | |
| | | | | | | | |
| | | | | | | | |
| | | |
| SHORT-TERM INVESTMENTS–0.7% | | | | | | | | |
| Investment Companies–0.7% | |
AB Fixed Income Shares, Inc.–Government Money Market Portfolio–Class AB, 4.73%(b)(c)(d)
(cost $5,312,199) | | | 5,312,199 | | | | 5,312,199 | |
| | | | | | | | |
Total Investments—99.6%
(cost $582,925,859) | | | | 739,073,911 | |
| | |
Other assets less liabilities—0.4% | | | | | | | 3,092,333 | |
| | | | | | | | |
| Net Assets—100.0% | | | | | | $ | 742,166,244 | |
| | | | | | | | |
| | | | | | | | | | | | | | |
| |
| FUTURES (see Note 3) | |
| Description | | Number of
Contracts | | | Expiration
Month | | Current
Notional | | | Value and
Unrealized
Appreciation
(Depreciation) | |
| Purchased Contracts | | | | | | | | | | | | | | |
| | | | |
E-Mini Russell 2000 Index Futures | | | 358 | | | December 2024 | | $ | 40,260,680 | | | $ | 768,136 | |
| (a) | | Non-income producing security. |
| (b) | | Affiliated investments. |
| (c) | | The rate shown represents the 7-day yield as of period end. |
| (d) | | To obtain a copy of the fund’s shareholder report, please go to the Securities and Exchange Commission’s website at www.sec.gov, or call AB at (800) 227-4618. |
Glossary:
ADR—American Depositary Receipt
REIT—Real Estate Investment Trust
See notes to financial statements.
Schedule of Investments
Bernstein Fund, Inc.
Schedule of Investments
International Small Cap Portfolio
September 30, 2024
| | | | | | | | |
| | |
| Company | | Shares | | | U.S. $ Value | |
|
| COMMON STOCKS–97.3% | |
|
| Industrials–22.0% | |
| Aerospace & Defense–2.3% | |
Bombardier, Inc.–Class B(a) | | | 40,690 | | | $ | 3,096,165 | |
Chemring Group PLC | | | 505,680 | | | | 2,475,087 | |
Hanwha Aerospace Co., Ltd. | | | 39,417 | | | | 8,981,595 | |
Saab AB–Class B | | | 559,793 | | | | 11,929,475 | |
| | | | | | | | |
| | | | | | | 26,482,322 | |
| | | | | | | | |
| Air Freight & Logistics–0.4% | |
Hamakyorex Co., Ltd. | | | 281,200 | | | | 2,448,554 | |
Senko Group Holdings Co., Ltd. | | | 280,800 | | | | 2,447,295 | |
| | | | | | | | |
| | | | | | | 4,895,849 | |
| | | | | | | | |
| Building Products–0.7% | |
Fletcher Building Ltd.(a) | | | 1,355,993 | | | | 2,559,233 | |
Inwido AB | | | 135,001 | | | | 2,497,964 | |
Lindab International AB | | | 94,250 | | | | 2,634,925 | |
| | | | | | | | |
| | | | | | | 7,692,122 | |
| | | | | | | | |
| Commercial Services & Supplies–1.6% | |
Coor Service Management Holding AB(b) | | | 315,337 | | | | 1,399,368 | |
Downer EDI Ltd. | | | 1,929,131 | | | | 7,281,237 | |
Elis SA | | | 301,269 | | | | 6,287,218 | |
Mitie Group PLC | | | 1,596,541 | | | | 2,532,759 | |
Societe BIC SA | | | 12,205 | | | | 820,616 | |
| | | | | | | | |
| | | | | | | 18,321,198 | |
| | | | | | | | |
| Construction & Engineering–2.0% | |
Balfour Beatty PLC | | | 2,080,044 | | | | 11,980,183 | |
ITD Cementation India Ltd. | | | 50,750 | | | | 320,640 | |
Kalpataru Projects International Ltd. | | | 221,717 | | | | 3,604,978 | |
Norconsult Norge AS | | | 643,400 | | | | 2,176,584 | |
Renew Holdings PLC | | | 173,540 | | | | 2,440,791 | |
Ventia Services Group Pty Ltd. | | | 851,239 | | | | 2,671,867 | |
| | | | | | | | |
| | | | | | | 23,195,043 | |
| | | | | | | | |
| Electrical Equipment–1.8% | |
Hanwha Industrial Solutions Co. Ltd/ New(a) | | | 43,660 | | | | 1,111,782 | |
Nexans SA | | | 88,738 | | | | 13,025,334 | |
TKH Group NV | | | 141,206 | | | | 5,946,768 | |
| | | | | | | | |
| | | | | | | 20,083,884 | |
| | | | | | | | |
| Ground Transportation–0.9% | |
Maruzen Showa Unyu Co., Ltd. | | | 77,100 | | | | 2,944,404 | |
Nikkon Holdings Co., Ltd. | | | 191,600 | | | | 2,532,005 | |
Sakai Moving Service Co., Ltd. | | | 123,600 | | | | 2,170,798 | |
Seino Holdings Co., Ltd. | | | 150,600 | | | | 2,533,452 | |
| | | | | | | | |
| | | | | | | 10,180,659 | |
| | | | | | | | |
| | | |
| Company | | Shares | | | U.S. $ Value | |
| Industrial Conglomerates–1.1% | |
Bidvest Group Ltd. (The) | | | 684,392 | | | $ | 11,603,120 | |
Reunert Ltd. | | | 176,246 | | | | 826,272 | |
| | | | | | | | |
| | | | | | | 12,429,392 | |
| | | | | | | | |
| Machinery–7.5% | |
ATS Corp.(a) | | | 264,273 | | | | 7,667,620 | |
Ebara Corp. | | | 182,500 | | | | 2,991,333 | |
ESAB India Ltd. | | | 3,660 | | | | 271,270 | |
Fuji Corp./Aichi | | | 485,700 | | | | 7,802,655 | |
HD Hyundai Construction Equipment Co., Ltd. | | | 121,214 | | | | 4,852,683 | |
Hyundai Rotem Co., Ltd. | | | 268,969 | | | | 11,006,376 | |
IHI Corp. | | | 179,800 | | | | 9,429,474 | |
IMI PLC | | | 64,851 | | | | 1,577,834 | |
Kawasaki Heavy Industries Ltd. | | | 307,500 | | | | 12,604,160 | |
KION Group AG | | | 187,574 | | | | 7,406,324 | |
Makino Milling Machine Co., Ltd. | | | 194,300 | | | | 8,002,221 | |
Morgan Advanced Materials PLC | | | 537,950 | | | | 1,988,622 | |
Shibaura Machine Co., Ltd. | | | 86,400 | | | | 2,399,907 | |
Tocalo Co., Ltd. | | | 211,900 | | | | 2,844,138 | |
Tsugami Corp. | | | 267,600 | | | | 2,792,597 | |
Yangzijiang Shipbuilding Holdings Ltd. | | | 1,367,400 | | | | 2,609,814 | |
| | | | | | | | |
| | | | | | | 86,247,028 | |
| | | | | | | | |
| Marine Transportation–0.4% | |
Hoegh Autoliners ASA | | | 185,822 | | | | 2,385,213 | |
Wallenius Wilhelmsen ASA | | | 189,840 | | | | 2,225,175 | |
| | | | | | | | |
| | | | | | | 4,610,388 | |
| | | | | | | | |
| Passenger Airlines–0.2% | |
JET2 PLC | | | 148,324 | | | | 2,784,457 | |
| | | | | | | | |
| Professional Services–1.7% | |
Danel Adir Yeoshua Ltd. | | | 23,155 | | | | 2,118,044 | |
dip Corp. | | | 257,800 | | | | 5,110,520 | |
Firstsource Solutions Ltd. | | | 1,551,690 | | | | 5,767,462 | |
NICE Information Service Co., Ltd. | | | 259,202 | | | | 2,108,034 | |
Persol Holdings Co., Ltd. | | | 1,398,300 | | | | 2,519,917 | |
Transcosmos, Inc. | | | 73,100 | | | | 1,805,847 | |
| | | | | | | | |
| | | | | | | 19,429,824 | |
| | | | | | | | |
| Trading Companies & Distributors–0.4% | |
Howden Joinery Group PLC | | | 235,449 | | | | 2,861,245 | |
Russel Metals, Inc. | | | 71,926 | | | | 2,182,590 | |
| | | | | | | | |
| | | | | | | 5,043,835 | |
| | | | | | | | |
| Transportation Infrastructure–1.0% | |
Grupo Aeroportuario del Centro Norte SAB de CV | | | 1,083,338 | | | | 9,137,673 | |
Gujarat Pipavav Port Ltd. | | | 916,045 | | | | 2,403,733 | |
| | | | | | | | |
| | | | | | | 11,541,406 | |
| | | | | | | | |
| | | | | | | 252,937,407 | |
| | | | | | | | |
| | | | | | | | |
| |
| Consumer Discretionary–13.7% | |
| Automobile Components–2.1% | |
Amotiv Ltd. | | | 295,120 | | | | 2,119,534 | |
| | | | | | | | |
| | | |
| Company | | Shares | | | U.S. $ Value | |
Banco Products India Ltd. | | | 20,513 | | | $ | 166,594 | |
Forvia SE (Paris) | | | 419,766 | | | | 4,318,506 | |
Mahle Metal Leve SA | | | 420,000 | | | | 2,330,635 | |
Niterra Co., Ltd. | | | 88,100 | | | | 2,482,244 | |
PWR Holdings Ltd. | | | 314,740 | | | | 1,967,009 | |
SAF-Holland SE | | | 79,582 | | | | 1,482,757 | |
Schaeffler AG (Preference Shares) | | | 368,024 | | | | 1,903,775 | |
Toyota Boshoku Corp. | | | 187,900 | | | | 2,470,139 | |
TS Tech Co., Ltd. | | | 416,900 | | | | 5,124,246 | |
| | | | | | | | |
| | | | | | | 24,365,439 | |
| | | | | | | | |
| Automobiles–0.5% | |
Piaggio & C SpA | | | 1,740,366 | | | | 5,105,853 | |
| | | | | | | | |
| Broadline Retail–0.2% | |
Puuilo Oyj | | | 226,902 | | | | 2,438,620 | |
| | | | | | | | |
| Diversified Consumer Services–0.1% | |
Me Group International PLC | | | 426,898 | | | | 1,109,521 | |
| | | | | | | | |
| Hotels, Restaurants & Leisure–2.1% | |
Domino’s Pizza Group PLC | | | 489,565 | | | | 1,964,412 | |
Greggs PLC | | | 65,878 | | | | 2,751,482 | |
Jollibee Foods Corp. | | | 2,050,540 | | | | 9,835,970 | |
Jumbo Interactive Ltd. | | | 230,543 | | | | 2,184,923 | |
Kindred Group PLC | | | 582,474 | | | | 7,404,342 | |
| | | | | | | | |
| | | | | | | 24,141,129 | |
| | | | | | | | |
| Household Durables–2.1% | |
Bellway PLC | | | 179,725 | | | | 7,482,424 | |
Casio Computer Co., Ltd. | | | 809,400 | | | | 6,727,398 | |
Cury Construtora e Incorporadora SA | | | 583,900 | | | | 2,396,609 | |
GN Store Nord AS(a) | | | 274,979 | | | | 6,127,642 | |
Vestel Beyaz Esya Sanayi ve Ticaret AS | | | 3,401,161 | | | | 1,715,545 | |
| | | | | | | | |
| | | | | | | 24,449,618 | |
| | | | | | | | |
| Leisure Products–1.7% | |
BRP, Inc. (Sub-Voting) | | | 79,284 | | | | 4,718,525 | |
Sankyo Co., Ltd. | | | 182,700 | | | | 2,692,814 | |
Sega Sammy Holdings, Inc. | | | 622,500 | | | | 12,471,592 | |
| | | | | | | | |
| | | | | | | 19,882,931 | |
| | | | | | | | |
| Specialty Retail–1.1% | |
ABC-Mart, Inc. | | | 364,100 | | | | 7,738,116 | |
Bermaz Auto Bhd | | | 4,176,100 | | | | 2,275,129 | |
Pet Valu Holdings Ltd. | | | 119,024 | | | | 2,274,961 | |
| | | | | | | | |
| | | | | | | 12,288,206 | |
| | | | | | | | |
| Textiles, Apparel & Luxury Goods–3.8% | |
Arvind Ltd. | | | 1,118,113 | | | | 4,953,189 | |
Asics Corp. | | | 659,400 | | | | 13,852,759 | |
HUGO BOSS AG | | | 93,036 | | | | 4,260,632 | |
Indo Count Industries Ltd. | | | 524,211 | | | | 2,404,348 | |
JNBY Design Ltd.(b) | | | 1,214,000 | | | | 2,507,607 | |
Li Ning Co., Ltd. | | | 1,960,000 | | | | 4,818,745 | |
Makalot Industrial Co., Ltd. | | | 211,140 | | | | 2,335,896 | |
Marimekko Oyj | | | 139,819 | | | | 2,032,651 | |
Mavi Giyim Sanayi Ve Ticaret AS–Class B(b) | | | 912,468 | | | | 2,405,495 | |
Xtep International Holdings Ltd. | | | 5,909,500 | | | $ | 4,514,331 | |
| | | | | | | | |
| | | | | | | 44,085,653 | |
| | | | | | | | |
| | | | | | | 157,866,970 | |
| | | | | | | | |
| | | | | | | | |
| |
| Financials–11.9% | |
| Banks–6.3% | |
Alpha Services and Holdings SA | | | 3,402,972 | | | | 5,909,192 | |
Banco de Sabadell SA | | | 5,554,404 | | | | 11,796,060 | |
Bank of Ireland Group PLC | | | 789,300 | | | | 8,814,517 | |
BAWAG Group AG(b) | | | 147,724 | | | | 11,445,199 | |
BNK Financial Group, Inc. | | | 365,311 | | | | 2,519,202 | |
Canadian Western Bank | | | 68,650 | | | | 2,732,396 | |
City Union Bank Ltd. | | | 4,492,285 | | | | 8,785,701 | |
Dah Sing Financial Holdings Ltd. | | | 807,200 | | | | 2,567,181 | |
Juroku Financial Group, Inc. | | | 79,400 | | | | 2,202,341 | |
Mebuki Financial Group, Inc. | | | 2,906,700 | | | | 11,766,524 | |
Seven Bank Ltd. | | | 550,500 | | | | 1,104,672 | |
Sydbank AS | | | 51,751 | | | | 2,547,280 | |
| | | | | | | | |
| | | | | | | 72,190,265 | |
| | | | | | | | |
| Capital Markets–1.6% | |
Alpha Group International PLC(b) | | | 82,418 | | | | 2,435,172 | |
Azimut Holding SpA | | | 89,609 | | | | 2,317,571 | |
Banca Generali SpA | | | 62,366 | | | | 2,797,577 | |
JAFCO Group Co., Ltd. | | | 187,500 | | | | 2,653,200 | |
Monex Group, Inc. | | | 85,000 | | | | 359,737 | |
Polar Capital Holdings PLC | | | 327,499 | | | | 2,346,875 | |
Sdiptech AB–Class B(a) | | | 70,990 | | | | 2,084,425 | |
Tel Aviv Stock Exchange Ltd. | | | 319,573 | | | | 3,018,613 | |
| | | | | | | | |
| | | | | | | 18,013,170 | |
| | | | | | | | |
| Consumer Finance–1.1% | |
Credit Saison Co., Ltd. | | | 338,800 | | | | 8,501,816 | |
FinVolution Group (ADR) | | | 446,560 | | | | 2,759,741 | |
Jaccs Co., Ltd. | | | 67,100 | | | | 1,816,110 | |
| | | | | | | | |
| | | | | | | 13,077,667 | |
| | | | | | | | |
| Financial Services–1.7% | |
BFF Bank SpA(b) | | | 221,250 | | | | 2,427,860 | |
Genertec Universal Medical Group Co., Ltd.(b) | | | 3,418,000 | | | | 2,213,793 | |
L&T Finance Ltd. | | | 4,063,008 | | | | 8,981,272 | |
OSB Group PLC | | | 1,095,655 | | | | 5,733,621 | |
| | | | | | | | |
| | | | | | | 19,356,546 | |
| | | | | | | | |
| Insurance–1.2% | |
Coface SA | | | 149,153 | | | | 2,443,591 | |
Hiscox Ltd. | | | 517,720 | | | | 7,932,221 | |
Protector Forsikring ASA | | | 114,650 | | | | 2,626,811 | |
UNIQA Insurance Group AG | | | 133,062 | | | | 1,097,912 | |
| | | | | | | | |
| | | | | | | 14,100,535 | |
| | | | | | | | |
| | | | | | | 136,738,183 | |
| | | | | | | | |
Schedule of Investments (continued)
| | | | | | | | |
| | | |
| Company | | Shares | | | U.S. $ Value | |
|
| Information Technology–11.1% | |
| Electronic Equipment, Instruments & Components–3.4% | |
E Ink Holdings, Inc. | | | 1,705,000 | | | $ | 15,805,049 | |
Kaga Electronics Co., Ltd. | | | 102,400 | | | | 2,001,803 | |
Lotes Co., Ltd. | | | 172,000 | | | | 7,503,729 | |
Mycronic AB | | | 63,440 | | | | 2,468,343 | |
Nippon Ceramic Co., Ltd. | | | 138,400 | | | | 2,446,744 | |
Test Research, Inc. | | | 423,000 | | | | 1,885,291 | |
Tripod Technology Corp. | | | 1,093,000 | | | | 6,764,251 | |
| | | | | | | | |
| | | | | | | 38,875,210 | |
| | | | | | | | |
| IT Services–1.6% | |
BIPROGY, Inc. | | | 281,100 | | | | 9,552,785 | |
Future Corp. | | | 194,800 | | | | 2,469,776 | |
Indra Sistemas SA | | | 138,422 | | | | 2,544,451 | |
NSD Co., Ltd. | | | 48,900 | | | | 1,082,794 | |
One Software Technologies Ltd. | | | 86,460 | | | | 1,168,700 | |
Sonata Software Ltd. | | | 233,206 | | | | 1,759,086 | |
| | | | | | | | |
| | | | | | | 18,577,592 | |
| | | | | | | | |
| Semiconductors & Semiconductor Equipment–3.7% | |
Elan Microelectronics Corp. | | | 391,000 | | | | 1,759,417 | |
Faraday Technology Corp. | | | 228,497 | | | | 1,912,712 | |
King Yuan Electronics Co., Ltd. | | | 2,408,000 | | | | 8,540,697 | |
Melexis NV | | | 26,158 | | | | 2,164,318 | |
Phison Electronics Corp. | | | 80,000 | | | | 1,248,756 | |
Sanken Electric Co., Ltd.(a) | | | 165,800 | | | | 7,802,850 | |
Siltronic AG | | | 70,636 | | | | 5,384,200 | |
Sino-American Silicon Products, Inc. | | | 376,000 | | | | 2,099,915 | |
Sitronix Technology Corp. | | | 88,000 | | | | 634,538 | |
Tokyo Seimitsu Co., Ltd. | | | 129,100 | | | | 6,872,360 | |
Ulvac, Inc. | | | 84,600 | | | | 4,537,647 | |
| | | | | | | | |
| | | | | | | 42,957,410 | |
| | | | | | | | |
| Software–1.9% | |
Atoss Software SE | | | 19,512 | | | | 2,824,388 | |
Birlasoft Ltd. | | | 125,172 | | | | 900,019 | |
Sinch AB(a) | | | 1,729,010 | | | | 5,202,869 | |
Tanla Platforms Ltd. | | | 594,462 | | | | 6,357,442 | |
Technology One Ltd. | | | 169,281 | | | | 2,785,947 | |
Text SA | | | 44,050 | | | | 841,173 | |
Truecaller AB–Class B | | | 289,790 | | | | 1,099,973 | |
WingArc1st, Inc. | | | 73,200 | | | | 1,643,894 | |
| | | | | | | | |
| | | | | | | 21,655,705 | |
| | | | | | | | |
| Technology Hardware, Storage & Peripherals–0.5% | |
Chicony Electronics Co., Ltd. | | | 389,000 | | | | 2,005,700 | |
Toshiba TEC Corp. | | | 61,500 | | | | 1,497,942 | |
Wacom Co., Ltd. | | | 503,000 | | | | 2,404,025 | |
| | | | | | | | |
| | | | | | | 5,907,667 | |
| | | | | | | | |
| | | | | | | 127,973,584 | |
| | | | | | | | |
| | | | | | | | |
| |
| Materials–9.4% | |
| Chemicals–3.3% | |
Castrol India Ltd. | | | 931,707 | | | | 2,738,690 | |
Dongjin Semichem Co., Ltd. | | | 86,425 | | | | 1,913,982 | |
FUCHS SE (Preference Shares) | | | 56,220 | | | $ | 2,731,876 | |
Fufeng Group Ltd. | | | 3,512,000 | | | | 2,163,151 | |
Gujarat Narmada Valley Fertilizers & Chemicals Ltd. | | | 1,197,861 | | | | 9,681,650 | |
Kuraray Co., Ltd. | | | 555,900 | | | | 8,260,218 | |
TKG Huchems Co., Ltd. | | | 157,030 | | | | 2,297,780 | |
Tosoh Corp. | | | 463,300 | | | | 6,203,440 | |
Zeon Corp. | | | 274,300 | | | | 2,620,363 | |
| | | | | | | | |
| | | | | | | 38,611,150 | |
| | | | | | | | |
| Construction Materials–0.2% | |
Shinagawa Refractories Co., Ltd. | | | 175,700 | | | | 2,100,251 | |
| | | | | | | | |
| Containers & Packaging–0.7% | |
EPL Ltd. | | | 319,438 | | | | 983,272 | |
Rengo Co., Ltd. | | | 989,900 | | | | 6,915,383 | |
| | | | | | | | |
| | | | | | | 7,898,655 | |
| | | | | | | | |
| Metals & Mining–4.7% | |
APERAM SA | | | 186,685 | | | | 5,852,135 | |
Capstone Mining Corp.(a) | | | 1,593,309 | | | | 12,452,420 | |
Centerra Gold, Inc. | | | 350,221 | | | | 2,514,434 | |
Champion Iron Ltd. | | | 323,620 | | | | 1,628,075 | |
Daiki Aluminium Industry Co., Ltd. | | | 54,600 | | | | 412,357 | |
Endeavour Mining PLC | | | 323,356 | | | | 7,684,322 | |
Labrador Iron Ore Royalty Corp. | | | 104,310 | | | | 2,480,395 | |
Lundin Mining Corp. | | | 885,835 | | | | 9,281,143 | |
OSAKA Titanium Technologies Co., Ltd. | | | 232,900 | | | | 4,076,481 | |
Pan African Resources PLC | | | 5,589,228 | | | | 2,368,789 | |
Shougang Fushan Resources Group Ltd. | | | 5,484,000 | | | | 2,069,300 | |
SSAB AB–Class B | | | 562,484 | | | | 2,880,017 | |
| | | | | | | | |
| | | | | | | 53,699,868 | |
| | | | | | | | |
| Paper & Forest Products–0.5% | |
Interfor Corp.(a) | | | 416,376 | | | | 6,249,719 | |
| | | | | | | | |
| | | | | | | 108,559,643 | |
| | | | | | | | |
| | | | | | | | |
| |
| Communication Services–7.5% | |
| Diversified Telecommunication Services–0.6% | |
Gamma Communications PLC | | | 128,147 | | | | 2,857,720 | |
NOS SGPS SA | | | 605,465 | | | | 2,463,371 | |
Telecom Egypt Co. | | | 1,680,783 | | | | 1,175,643 | |
| | | | | | | | |
| | | | | | | 6,496,734 | |
| | | | | | | | |
| Entertainment–3.0% | |
GungHo Online Entertainment, Inc. | | | 384,400 | | | | 8,269,944 | |
International Games System Co., Ltd. | | | 663,400 | | | | 20,662,585 | |
NetDragon Websoft Holdings Ltd. | | | 1,918,500 | | | | 2,856,362 | |
Soft-World International Corp. | | | 309,000 | | | | 1,284,668 | |
Zengame Technology Holding Ltd.(b) | | | 3,298,000 | | | | 1,208,268 | |
| | | | | | | | |
| | | | | | | 34,281,827 | |
| | | | | | | | |
| Interactive Media & Services–1.1% | |
Kakaku.com, Inc. | | | 460,800 | | | | 8,021,245 | |
Rightmove PLC | | | 327,802 | | | | 2,709,766 | |
SOOP Co., Ltd. | | | 24,466 | | | | 1,871,206 | |
| | | | | | | | |
| | | | | | | 12,602,217 | |
| | | | | | | | |
| | | | | | | | |
| | | |
| Company | | Shares | | | U.S. $ Value | |
| Media–2.8% | |
4imprint Group PLC | | | 31,100 | | | $ | 2,086,745 | |
Criteo SA (Sponsored ADR)(a) | | | 232,483 | | | | 9,355,116 | |
ITV PLC | | | 2,546,250 | | | | 2,734,768 | |
Kadokawa Corp. | | | 460,300 | | | | 10,281,475 | |
Stroeer SE & Co. KGaA | | | 130,402 | | | | 8,347,579 | |
| | | | | | | | |
| | | | | | | 32,805,683 | |
| | | | | | | | |
| | | | | | | 86,186,461 | |
| | | | | | | | |
| | | | | | | | |
| |
| Health Care–5.9% | |
| Biotechnology–2.0% | |
BioGaia AB–Class B | | | 223,719 | | | | 2,473,810 | |
Clinuvel Pharmaceuticals Ltd. | | | 240,925 | | | | 2,333,782 | |
GNI Group Ltd.(a) | | | 297,300 | | | | 5,972,233 | |
Hugel, Inc.(a) | | | 55,991 | | | | 10,228,316 | |
Takara Bio, Inc. | | | 329,100 | | | | 2,303,029 | |
| | | | | | | | |
| | | | | | | 23,311,170 | |
| | | | | | | | |
| Health Care Equipment & Supplies–1.3% | |
Chularat Hospital PCL–Class F | | | 25,532,400 | | | | 2,158,282 | |
ConvaTec Group PLC(b) | | | 2,624,411 | | | | 7,970,873 | |
Eiken Chemical Co., Ltd. | | | 145,700 | | | | 2,379,999 | |
Japan Lifeline Co., Ltd. | | | 292,900 | | | | 2,500,983 | |
| | | | | | | | |
| | | | | | | 15,010,137 | |
| | | | | | | | |
| Health Care Providers & Services–0.2% | |
Odontoprev SA | | | 1,151,580 | | | | 2,378,118 | |
| | | | | | | | |
| Life Sciences Tools & Services–0.1% | |
Chemometec A/S | | | 9,260 | | | | 562,791 | |
| | | | | | | | |
| Pharmaceuticals–2.3% | |
Ajanta Pharma Ltd. | | | 66,613 | | | | 2,539,205 | |
Chong Kun Dang Pharmaceutical Corp. | | | 26,848 | | | | 2,300,656 | |
Consun Pharmaceutical Group Ltd. | | | 3,087,000 | | | | 2,803,144 | |
Dermapharm Holding SE | | | 47,120 | | | | 1,833,554 | |
Faes Farma SA | | | 579,848 | | | | 2,397,874 | |
Hypera SA | | | 1,009,500 | | | | 4,860,617 | |
Mega Lifesciences PCL | | | 2,148,500 | | | | 2,620,733 | |
Procter & Gamble Health Ltd. | | | 36,565 | | | | 2,367,562 | |
Sanofi India Ltd. | | | 22,722 | | | | 1,925,105 | |
United Laboratories International Holdings Ltd. (The) | | | 1,976,000 | | | | 2,544,071 | |
| | | | | | | | |
| | | | | | | 26,192,521 | |
| | | | | | | | |
| | | | | | | 67,454,737 | |
| | | | | | | | |
| | | | | | | | |
| |
| Energy–5.8% | |
| Energy Equipment & Services–1.2% | |
CES Energy Solutions Corp. | | | 431,003 | | | | 2,383,750 | |
Dayang Enterprise Holdings Bhd | | | 2,123,300 | | | | 1,179,898 | |
Trican Well Service Ltd. | | | 712,170 | | | | 2,511,775 | |
Vallourec SACA(a) | | | 502,062 | | | | 7,611,586 | |
| | | | | | | | |
| | | | | | | 13,687,009 | |
| | | | | | | | |
| Oil, Gas & Consumable Fuels–4.6% | |
Baytex Energy Corp. | | | 1,821,947 | | | $ | 5,442,468 | |
Beach Energy Ltd. | | | 8,095,211 | | | | 6,807,522 | |
BW LPG Ltd.(b) | | | 171,540 | | | | 2,444,957 | |
Etablissements Maurel et Prom SA | | | 130,635 | | | | 688,356 | |
Hafnia Ltd. | | | 351,059 | | | | 2,492,795 | |
Headwater Exploration, Inc. | | | 480,106 | | | | 2,247,086 | |
Itochu Enex Co., Ltd. | | | 201,000 | | | | 2,196,734 | |
Oil India Ltd. | | | 1,140,237 | | | | 7,889,386 | |
Oil Refineries Ltd. | | | 9,475,531 | | | | 2,445,734 | |
Parex Resources, Inc. | | | 139,042 | | | | 1,233,690 | |
Petronet LNG Ltd. | | | 1,229,248 | | | | 5,018,640 | |
Petroreconcavo SA | | | 126,600 | | | | 411,798 | |
San-Ai Obbli Co., Ltd. | | | 88,400 | | | | 1,206,515 | |
Secure Energy Services, Inc. | | | 302,480 | | | | 2,735,281 | |
Serica Energy PLC | | | 930,110 | | | | 1,665,113 | |
Thai Oil PCL | | | 3,206,700 | | | | 5,107,400 | |
Thungela Resources Ltd. | | | 161,729 | | | | 1,027,334 | |
Viva Energy Group Ltd.(b) | | | 1,041,663 | | | | 2,101,305 | |
| | | | | | | | |
| | | | | | | 53,162,114 | |
| | | | | | | | |
| | | | | | | 66,849,123 | |
| | | | | | | | |
| | | | | | | | |
| |
| Real Estate–4.3% | |
| Diversified REITs–0.4% | |
H&R Real Estate Investment Trust | | | 298,565 | | | | 2,525,479 | |
Sekisui House Reit, Inc. | | | 3,808 | | | | 2,017,163 | |
| | | | | | | | |
| | | | | | | 4,542,642 | |
| | | | | | | | |
| Health Care REITs–0.7% | |
Assura PLC | | | 13,325,124 | | | | 7,561,553 | |
| | | | | | | | |
| Office REITs–0.4% | |
AREIT, Inc. | | | 3,772,800 | | | | 2,464,144 | |
CLS Holdings PLC | | | 1,690,718 | | | | 2,102,178 | |
| | | | | | | | |
| | | | | | | 4,566,322 | |
| | | | | | | | |
| Real Estate Management & Development–1.4% | |
Deyaar Development PJSC | | | 3,907,377 | | | | 726,811 | |
Kerry Properties Ltd. | | | 1,157,500 | | | | 2,444,614 | |
Starts Corp., Inc. | | | 102,800 | | | | 2,504,880 | |
TAG Immobilien AG(a) | | | 579,724 | | | | 10,745,370 | |
| | | | | | | | |
| | | | | | | 16,421,675 | |
| | | | | | | | |
| Residential REITs–0.2% | |
Morguard North American Residential Real Estate Investment Trust | | | 197,900 | | | | 2,819,722 | |
| | | | | | | | |
| Retail REITs–1.2% | |
Charter Hall Retail REIT | | | 2,563,345 | | | | 6,377,269 | |
Hamborner REIT AG | | | 283,912 | | | | 2,095,680 | |
Lar Espana Real Estate Socimi SA | | | 299,190 | | | | 2,680,997 | |
Mercialys SA | | | 198,527 | | | | 2,678,573 | |
| | | | | | | | |
| | | | | | | 13,832,519 | |
| | | | | | | | |
| | | | | | | 49,744,433 | |
| | | | | | | | |
Schedule of Investments (continued)
| | | | | | | | |
| | | |
| Company | | Shares | | | U.S. $ Value | |
| |
| Consumer Staples–3.5% | |
| Beverages–1.4% | |
Hite Jinro Co., Ltd. | | | 187,120 | | | $ | 2,908,202 | |
Royal Unibrew A/S(a) | | | 125,049 | | | | 10,491,258 | |
Takara Holdings, Inc. | | | 288,700 | | | | 2,451,317 | |
| | | | | | | | |
| | | | | | | 15,850,777 | |
| | | | | | | | |
| Consumer Staples Distribution & Retail–0.6% | |
Axfood AB | | | 89,251 | | | | 2,515,479 | |
Migros Ticaret AS | | | 156,790 | | | | 2,060,369 | |
Sendas Distribuidora SA(a) | | | 1,768,453 | | | | 2,424,940 | |
| | | | | | | | |
| | | | | | | 7,000,788 | |
| | | | | | | | |
| Food Products–1.3% | |
Agthia Group PJSC | | | 109,540 | | | | 232,616 | |
AVI Ltd. | | | 420,700 | | | | 2,672,605 | |
Hilton Food Group PLC | | | 209,730 | | | | 2,517,979 | |
Nichirei Corp. | | | 288,100 | | | | 8,926,946 | |
| | | | | | | | |
| | | | | | | 14,350,146 | |
| | | | | | | | |
| Personal Care Products–0.2% | |
Industri Jamu Dan Farmasi Sido Muncul Tbk PT | | | 56,453,500 | | | | 2,479,628 | |
| | | | | | | | |
| | | | | | | 39,681,339 | |
| | | | | | | | |
| | | | | | | | |
| |
| Utilities–2.2% | |
| Electric Utilities–0.0% | |
Enerjisa Enerji AS(b) | | | 313,040 | | | | 542,556 | |
| | | | | | | | |
| Gas Utilities–0.1% | |
Gujarat State Petronet Ltd. | | | 123,804 | | | | 625,014 | |
| | | | | | | | |
| Independent Power and Renewable Electricity Producers–1.2% | |
Capital Power Corp. | | | 368,110 | | | $ | 13,383,096 | |
| | | | | | | | |
| Multi-Utilities–0.7% | |
Sembcorp Industries Ltd. | | | 1,921,300 | | | | 8,259,156 | |
| | | | | | | | |
| Water Utilities–0.2% | |
Cia de Saneamento de Minas Gerais Copasa MG | | | 524,800 | | | | 2,219,541 | |
| | | | | | | | |
| | | | | | | 25,029,363 | |
| | | | | | | | |
Total Common Stocks
(cost $914,357,426) | | | | | | | 1,119,021,243 | |
| | | | | | | | |
| | | | | | | | |
| |
| RIGHTS–0.0% | |
|
| Industrials–0.0% | |
| Building Products–0.0% | |
Fletcher Building Ltd.(a)(c)
(cost $0) | | | 302,002 | | | | 105,524 | |
| | | | | | | | |
| | | | | | | | |
| |
| SHORT-TERM INVESTMENTS–2.2% | |
| Investment Companies–2.2% | |
AB Fixed Income Shares, Inc.–Government Money Market Portfolio–Class AB, 4.73%(d)(e)(f)
(cost $25,994,586) | | | 25,994,586 | | | | 25,994,586 | |
| | | | | | | | |
Total Investments—99.5%
(cost $940,352,012) | | | | 1,145,121,353 | |
| | |
Other assets less liabilities—0.5% | | | | | | | 5,262,608 | |
| | | | | | | | |
| Net Assets—100.0% | | | | | | $ | 1,150,383,961 | |
| | | | | | | | |
| | | | | | | | | | | | | | | | | | | | |
| |
| FORWARD CURRENCY EXCHANGE CONTRACTS (see Note 3) | |
| Counterparty | | Contracts to
Deliver
(000) | | | In Exchange
For
(000) | | | Settlement
Date | | | Unrealized
Appreciation
(Depreciation) | |
| | | | | | |
Australia and New Zealand Banking Group Ltd. | | USD | | | 2,883 | | | NZD | | | 4,566 | | | | 12/06/2024 | | | $ | 17,680 | |
| | | | | | |
Bank of America, NA | | JPY | | | 1,038,657 | | | USD | | | 7,339 | | | | 10/17/2024 | | | | 97,104 | |
| | | | | | |
Bank of America, NA | | JPY | | | 910,643 | | | USD | | | 6,203 | | | | 10/17/2024 | | | | (145,798 | ) |
| | | | | | |
Bank of America, NA | | EUR | | | 59,311 | | | USD | | | 65,037 | | | | 10/25/2024 | | | | (1,048,013 | ) |
| | | | | | |
Bank of America, NA | | USD | | | 6,151 | | | EUR | | | 5,498 | | | | 10/25/2024 | | | | (24,659 | ) |
| | | | | | |
Bank of America, NA | | CAD | | | 6,345 | | | USD | | | 4,681 | | | | 11/07/2024 | | | | (14,282 | ) |
| | | | | | |
Bank of America, NA | | USD | | | 12,670 | | | GBP | | | 9,568 | | | | 11/08/2024 | | | | 121,886 | |
| | | | | | |
Bank of America, NA | | USD | | | 27,662 | | | AUD | | | 40,904 | | | | 11/22/2024 | | | | 635,331 | |
| | | | | | |
Bank of America, NA | | USD | | | 2,965 | | | TWD | | | 93,177 | | | | 11/22/2024 | | | | (5,305 | ) |
| | | | | | |
Barclays Bank PLC | | BRL | | | 39,773 | | | USD | | | 7,157 | | | | 10/02/2024 | | | | (143,729 | ) |
| | | | | | |
Barclays Bank PLC | | USD | | | 7,300 | | | BRL | | | 39,773 | | | | 10/02/2024 | | | | 536 | |
| | | | | | |
Barclays Bank PLC | | JPY | | | 2,128,942 | | | USD | | | 14,632 | | | | 10/17/2024 | | | | (211,351 | ) |
| | | | | | |
Barclays Bank PLC | | USD | | | 19,047 | | | JPY | | | 2,757,061 | | | | 10/17/2024 | | | | 174,651 | |
| | | | | | |
Barclays Bank PLC | | USD | | | 9,480 | | | JPY | | | 1,337,240 | | | | 10/17/2024 | | | | (156,778 | ) |
| | | | | | |
Barclays Bank PLC | | KRW | | | 4,094,954 | | | USD | | | 2,971 | | | | 10/18/2024 | | | | (135,477 | ) |
| | | | | | | | | | | | | | | | | | | | |
| Counterparty | | Contracts to
Deliver
(000) | | | In Exchange
For
(000) | | | Settlement
Date | | | Unrealized
Appreciation
(Depreciation) | |
| | | | | | |
Barclays Bank PLC | | PHP | | | 520,529 | | | USD | | | 8,898 | | | | 10/25/2024 | | | $ | (371,103 | ) |
| | | | | | |
Barclays Bank PLC | | USD | | | 6,638 | | | EUR | | | 6,057 | | | | 10/25/2024 | | | | 111,011 | |
| | | | | | |
Barclays Bank PLC | | GBP | | | 2,986 | | | USD | | | 3,911 | | | | 11/08/2024 | | | | (81,374 | ) |
| | | | | | |
Barclays Bank PLC | | USD | | | 18,539 | | | INR | | | 1,561,559 | | | | 12/06/2024 | | | | 40,069 | |
| | | | | | |
BNP Paribas SA | | ZAR | | | 52,411 | | | USD | | | 2,928 | | | | 10/17/2024 | | | | (102,014 | ) |
| | | | | | |
BNP Paribas SA | | USD | | | 4,560 | | | CNH | | | 31,812 | | | | 11/21/2024 | | | | (4,280 | ) |
| | | | | | |
BNP Paribas SA | | MXN | | | 104,732 | | | USD | | | 5,351 | | | | 12/11/2024 | | | | 88,045 | |
| | | | | | |
Citibank, NA | | KRW | | | 4,320,100 | | | USD | | | 3,125 | | | | 10/18/2024 | | | | (152,315 | ) |
| | | | | | |
Citibank, NA | | SGD | | | 8,702 | | | USD | | | 6,781 | | | | 10/18/2024 | | | | 5,120 | |
| | | | | | |
Citibank, NA | | USD | | | 5,403 | | | KRW | | | 7,359,247 | | | | 10/18/2024 | | | | 180,623 | |
| | | | | | |
Citibank, NA | | CAD | | | 6,618 | | | USD | | | 4,890 | | | | 11/07/2024 | | | | (7,734 | ) |
| | | | | | |
Citibank, NA | | TWD | | | 383,869 | | | USD | | | 12,060 | | | | 11/22/2024 | | | | (135,446 | ) |
| | | | | | |
Citibank, NA | | USD | | | 3,560 | | | TWD | | | 113,405 | | | | 11/22/2024 | | | | 42,661 | |
| | | | | | |
Goldman Sachs Bank USA | | JPY | | | 775,442 | | | USD | | | 5,365 | | | | 10/17/2024 | | | | (41,011 | ) |
| | | | | | |
Goldman Sachs Bank USA | | EUR | | | 4,377 | | | USD | | | 4,799 | | | | 10/25/2024 | | | | (77,542 | ) |
| | | | | | |
Goldman Sachs Bank USA | | USD | | | 28,435 | | | CHF | | | 24,027 | | | | 10/25/2024 | | | | 29,013 | |
| | | | | | |
Goldman Sachs Bank USA | | USD | | | 3,720 | | | EUR | | | 3,374 | | | | 10/25/2024 | | | | 38,912 | |
| | | | | | |
Goldman Sachs Bank USA | | USD | | | 3,592 | | | EUR | | | 3,211 | | | | 10/25/2024 | | | | (14,463 | ) |
| | | | | | |
Goldman Sachs Bank USA | | USD | | | 4,694 | | | CAD | | | 6,345 | | | | 11/07/2024 | | | | 1,607 | |
| | | | | | |
HSBC Bank USA | | USD | | | 3,316 | | | KRW | | | 4,332,334 | | | | 10/18/2024 | | | | (29,148 | ) |
| | | | | | |
HSBC Bank USA | | EUR | | | 2,683 | | | USD | | | 3,000 | | | | 10/25/2024 | | | | 10,461 | |
| | | | | | |
HSBC Bank USA | | EUR | | | 3,588 | | | USD | | | 3,952 | | | | 10/25/2024 | | | | (46,168 | ) |
| | | | | | |
HSBC Bank USA | | USD | | | 2,886 | | | EUR | | | 2,578 | | | | 10/25/2024 | | | | (13,383 | ) |
| | | | | | |
HSBC Bank USA | | TWD | | | 122,861 | | | USD | | | 3,881 | | | | 11/22/2024 | | | | (21,898 | ) |
| | | | | | |
HSBC Bank USA | | USD | | | 9,217 | | | ILS | | | 34,591 | | | | 12/11/2024 | | | | 80,697 | |
| | | | | | |
JPMorgan Chase Bank, NA | | JPY | | | 3,991,933 | | | USD | | | 27,343 | | | | 10/17/2024 | | | | (488,307 | ) |
| | | | | | |
JPMorgan Chase Bank, NA | | USD | | | 3,993 | | | JPY | | | 567,370 | | | | 10/17/2024 | | | | (37,269 | ) |
| | | | | | |
JPMorgan Chase Bank, NA | | EUR | | | 5,202 | | | USD | | | 5,711 | | | | 10/25/2024 | | | | (84,638 | ) |
| | | | | | |
JPMorgan Chase Bank, NA | | USD | | | 4,277 | | | EUR | | | 3,855 | | | | 10/25/2024 | | | | 18,744 | |
| | | | | | |
JPMorgan Chase Bank, NA | | USD | | | 4,899 | | | CAD | | | 6,618 | | | | 11/07/2024 | | | | (1,793 | ) |
| | | | | | |
JPMorgan Chase Bank, NA | | USD | | | 3,324 | | | AUD | | | 4,840 | | | | 11/22/2024 | | | | 24,673 | |
| | | | | | |
Morgan Stanley Capital Services, Inc. | | BRL | | | 39,773 | | | USD | | | 7,300 | | | | 10/02/2024 | | | | (536 | ) |
| | | | | | |
Morgan Stanley Capital Services, Inc. | | USD | | | 7,303 | | | BRL | | | 39,773 | | | | 10/02/2024 | | | | (2,279 | ) |
| | | | | | |
Morgan Stanley Capital Services, Inc. | | JPY | | | 1,349,714 | | | USD | | | 9,548 | | | | 10/17/2024 | | | | 137,667 | |
| | | | | | |
Morgan Stanley Capital Services, Inc. | | USD | | | 4,267 | | | JPY | | | 617,120 | | | | 10/17/2024 | | | | 35,583 | |
| | | | | | |
Morgan Stanley Capital Services, Inc. | | KRW | | | 12,098,151 | | | USD | | | 8,834 | | | | 10/18/2024 | | | | (345,046 | ) |
| | | | | | |
Morgan Stanley Capital Services, Inc. | | USD | | | 6,491 | | | SGD | | | 8,702 | | | | 10/18/2024 | | | | 284,760 | |
| | | | | | |
Morgan Stanley Capital Services, Inc. | | EUR | | | 2,652 | | | USD | | | 2,944 | | | | 10/25/2024 | | | | (10,861 | ) |
| | | | | | |
Morgan Stanley Capital Services, Inc. | | USD | | | 3,017 | | | EUR | | | 2,708 | | | | 10/25/2024 | | | | 411 | |
| | | | | | |
Morgan Stanley Capital Services, Inc. | | BRL | | | 39,773 | | | USD | | | 7,277 | | | | 11/04/2024 | | | | 2,795 | |
| | | | | | |
Morgan Stanley Capital Services, Inc. | | USD | | | 6,825 | | | MYR | | | 30,189 | | | | 11/21/2024 | | | | 495,465 | |
| | | | | | |
Morgan Stanley Capital Services, Inc. | | USD | | | 9,395 | | | NOK | | | 99,353 | | | | 11/22/2024 | | | | 23,724 | |
| | | | | | |
Standard Chartered Bank | | KRW | | | 8,404,990 | | | USD | | | 6,139 | | | | 10/18/2024 | | | | (238,294 | ) |
| | | | | | |
Standard Chartered Bank | | USD | | | 3,915 | | | TWD | | | 122,861 | | | | 11/22/2024 | | | | (12,030 | ) |
| | | | | | |
State Street Bank & Trust Co. | | JPY | | | 451,449 | | | USD | | | 3,188 | | | | 10/17/2024 | | | | 40,198 | |
| | | | | | |
State Street Bank & Trust Co. | | USD | | | 2,899 | | | JPY | | | 415,076 | | | | 10/17/2024 | | | | (4,730 | ) |
| | | | | | |
State Street Bank & Trust Co. | | CAD | | | 9,516 | | | USD | | | 7,054 | | | | 11/07/2024 | | | | 11,909 | |
Schedule of Investments (continued)
| | | | | | | | | | | | | | | | | | | | |
| Counterparty | | Contracts to
Deliver
(000) | | | In Exchange
For
(000) | | | Settlement
Date | | | Unrealized
Appreciation
(Depreciation) | |
| | | | | | |
State Street Bank & Trust Co. | | USD | | | 4,140 | | | INR | | | 347,441 | | | | 12/06/2024 | | | $ | (6,027 | ) |
| | | | | | |
UBS AG | | USD | | | 7,618 | | | JPY | | | 1,088,020 | | | | 10/17/2024 | | | | (32,461 | ) |
| | | | | | |
UBS AG | | GBP | | | 2,332 | | | USD | | | 3,058 | | | | 11/08/2024 | | | | (60,061 | ) |
| | | | | | |
UBS AG | | NOK | | | 29,930 | | | USD | | | 2,873 | | | | 11/22/2024 | | | | 36,199 | |
| | | | | | |
UBS AG | | USD | | | 5,628 | | | TWD | | | 177,287 | | | | 11/22/2024 | | | | 4,581 | |
| | | | | | | | | | | | | | | | | | | | |
| | | $ | (1,515,487 | ) |
| | | | | | | | | | | | | | | | | | | | |
| (a) | | Non-income producing security. |
| (b) | | Security is exempt from registration under Rule 144A or Regulation S of the Securities Act of 1933. These securities are considered restricted, but liquid and may be resold in transactions exempt from registration. At September 30, 2024, the aggregate market value of these securities amounted to $39,102,453 or 3.4% of net assets. |
| (c) | | Fair valued by the Adviser. |
| (d) | | Affiliated investments. |
| (e) | | The rate shown represents the 7-day yield as of period end. |
| (f) | | To obtain a copy of the fund’s shareholder report, please go to the Securities and Exchange Commission’s website at www.sec.gov, or call AB at (800) 227-4618. |
Currency Abbreviations:
AUD—Australian Dollar
BRL—Brazilian Real
CAD—Canadian Dollar
CHF—Swiss Franc
CNH—Chinese Yuan Renminbi (Offshore)
EUR—Euro
GBP—Great British Pound
ILS—Israeli Shekel
INR—Indian Rupee
JPY—Japanese Yen
KRW—South Korean Won
MXN—Mexican Peso
MYR—Malaysian Ringgit
NOK—Norwegian Krone
NZD—New Zealand Dollar
PHP—Philippine Peso
SGD—Singapore Dollar
TWD—New Taiwan Dollar
USD—United States Dollar
ZAR—South African Rand
Glossary:
ADR—American Depositary Receipt
PJSC—Public Joint Stock Company
REIT—Real Estate Investment Trust
See notes to financial statements.
Schedule of Investments
Bernstein Fund, Inc.
Schedule of Investments
International Strategic Equities Portfolio
September 30, 2024
| | | | | | | | |
| | |
| Company | | Shares | | | U.S. $ Value | |
|
| COMMON STOCKS–98.3% | |
|
| Financials–23.1% | |
| Banks–18.9% | |
Banco Bilbao Vizcaya Argentaria SA | | | 12,569,230 | | | $ | 135,776,106 | |
Bank of Ireland Group PLC | | | 7,559,420 | | | | 84,419,916 | |
Barclays PLC | | | 54,908,360 | | | | 164,976,582 | |
BNP Paribas SA | | | 1,093,980 | | | | 75,070,701 | |
China Merchants Bank Co., Ltd.–Class H | | | 28,875,000 | | | | 139,924,327 | |
Erste Group Bank AG | | | 2,902,129 | | | | 159,032,116 | |
Eurobank Ergasias Services and Holdings SA | | | 21,562,760 | | | | 49,387,743 | |
HDFC Bank Ltd. | | | 4,203,848 | | | | 86,572,914 | |
Industrial & Commercial Bank of China Ltd.–Class H | | | 136,929,000 | | | | 80,687,807 | |
KB Financial Group, Inc. | | | 2,458,610 | | | | 151,701,787 | |
Oversea-Chinese Banking Corp., Ltd. | | | 10,434,100 | | | | 122,141,246 | |
Piraeus Financial Holdings SA | | | 9,472,270 | | | | 40,326,285 | |
Resona Holdings, Inc. | | | 11,073,200 | | | | 77,590,920 | |
Sumitomo Mitsui Financial Group, Inc. | | | 2,055,900 | | | | 43,927,613 | |
UniCredit SpA | | | 3,517,190 | | | | 154,410,244 | |
| | | | | | | | |
| | | | | | | 1,565,946,307 | |
| | | | | | | | |
| Capital Markets–2.6% | |
3i Group PLC | | | 913,980 | | | | 40,487,927 | |
Japan Exchange Group, Inc. | | | 6,426,200 | | | | 83,516,891 | |
Singapore Exchange Ltd. | | | 10,189,900 | | | | 90,290,030 | |
| | | | | | | | |
| | | | | | | 214,294,848 | |
| | | | | | | | |
| Insurance–1.6% | |
NN Group NV | | | 2,643,500 | | | | 131,900,284 | |
| | | | | | | | |
| | | | | | | 1,912,141,439 | |
| | | | | | | | |
| | | | | | | | |
| |
| Industrials–18.1% | |
| Aerospace & Defense–3.9% | |
BAE Systems PLC | | | 9,608,900 | | | | 159,527,632 | |
MTU Aero Engines AG | | | 252,930 | | | | 79,047,641 | |
Saab AB–Class B | | | 3,893,710 | | | | 82,976,954 | |
| | | | | | | | |
| | | | | | | 321,552,227 | |
| | | | | | | | |
| Electrical Equipment–5.3% | |
Fuji Electric Co., Ltd. | | | 1,321,800 | | | | 80,092,115 | |
Prysmian SpA | | | 3,078,530 | | | | 223,989,208 | |
Schneider Electric SE | | | 496,690 | | | | 130,931,287 | |
| | | | | | | | |
| | | | | | | 435,012,610 | |
| | | | | | | | |
| Ground Transportation–1.0% | |
Canadian National Railway Co. | | | 705,110 | | | | 82,567,393 | |
| | | | | | | | |
| Machinery–3.3% | |
Kawasaki Heavy Industries Ltd. | | | 3,305,200 | | | | 135,477,293 | |
Mitsubishi Heavy Industries Ltd. | | | 6,056,200 | | | | 90,503,782 | |
Toyota Industries Corp. | | | 663,000 | | | $ | 51,410,686 | |
| | | | | | | | |
| | | | | | | 277,391,761 | |
| | | | | | | | |
| Professional Services–4.6% | |
RELX PLC (London) | | | 3,472,480 | | | | 163,957,713 | |
Wolters Kluwer NV | | | 1,263,000 | | | | 213,032,268 | |
| | | | | | | | |
| | | | | | | 376,989,981 | |
| | | | | | | | |
| | | | | | | 1,493,513,972 | |
| | | | | | | | |
| | | | | | | | |
| |
| Information Technology–14.0% | |
| Electronic Equipment, Instruments & Components–1.8% | |
Delta Electronics, Inc. | | | 8,113,000 | | | | 96,796,676 | |
Hon Hai Precision Industry Co., Ltd. | | | 9,364,000 | | | | 55,133,929 | |
| | | | | | | | |
| | | | | | | 151,930,605 | |
| | | | | | | | |
| IT Services–1.2% | |
Elm Co. | | | 151,990 | | | | 47,185,226 | |
Tata Consultancy Services Ltd. | | | 1,040,638 | | | | 53,018,731 | |
| | | | | | | | |
| | | | | | | 100,203,957 | |
| | | | | | | | |
| Semiconductors & Semiconductor Equipment–8.8% | |
ASML Holding NV | | | 62,940 | | | | 52,357,258 | |
MediaTek, Inc. | | | 1,088,000 | | | | 40,098,815 | |
Novatek Microelectronics Corp. | | | 4,398,000 | | | | 71,605,322 | |
SCREEN Holdings Co., Ltd. | | | 1,127,100 | | | | 79,259,283 | |
SK Hynix, Inc. | | | 823,230 | | | | 110,178,443 | |
Taiwan Semiconductor Manufacturing Co., Ltd. | | | 9,867,000 | | | | 297,530,762 | |
Tokyo Electron Ltd. | | | 407,100 | | | | 72,600,435 | |
| | | | | | | | |
| | | | | | | 723,630,318 | |
| | | | | | | | |
| Software–1.7% | |
SAP SE | | | 618,000 | | | | 141,356,684 | |
| | | | | | | | |
| Technology Hardware, Storage & Peripherals–0.5% | |
Samsung Electronics Co., Ltd. | | | 826,770 | | | | 38,642,219 | |
| | | | | | | | |
| | | | | | | 1,155,763,783 | |
| | | | | | | | |
| | | | | | | | |
| |
| Consumer Discretionary–11.5% | |
| Automobiles–2.8% | |
Honda Motor Co., Ltd. | | | 9,380,500 | | | | 100,149,417 | |
Kia Corp. | | | 656,630 | | | | 49,999,598 | |
Subaru Corp. | | | 4,475,200 | | | | 79,171,343 | |
| | | | | | | | |
| | | | | | | 229,320,358 | |
| | | | | | | | |
| Broadline Retail–0.9% | |
PDD Holdings, Inc. (ADR)(a) | | | 552,980 | | | | 74,547,234 | |
| | | | | | | | |
| Hotels, Restaurants & Leisure–2.3% | |
Aristocrat Leisure Ltd. | | | 3,296,775 | | | | 133,105,723 | |
Booking Holdings, Inc. | | | 14,560 | | | | 61,328,467 | |
| | | | | | | | |
| | | | | | | 194,434,190 | |
| | | | | | | | |
| Household Durables–1.1% | |
Barratt Developments PLC | | | 6,892,310 | | | | 44,218,362 | |
Schedule of Investments (continued)
| | | | | | | | |
| | | |
| Company | | Shares | | | U.S. $ Value | |
Midea Group Co., Ltd.–Class A | | | 4,000,839 | | | $ | 43,110,596 | |
| | | | | | | | |
| | | | | | | 87,328,958 | |
| | | | | | | | |
| Specialty Retail–2.2% | |
Industria de Diseno Textil SA | | | 3,044,920 | | | | 180,339,664 | |
| | | | | | | | |
| Textiles, Apparel & Luxury Goods–2.2% | |
adidas AG | | | 190,030 | | | | 50,355,366 | |
ANTA Sports Products Ltd. | | | 6,618,000 | | | | 78,342,799 | |
Hermes International SCA | | | 21,840 | | | | 53,777,793 | |
| | | | | | | | |
| | | | | | | 182,475,958 | |
| | | | | | | | |
| | | | | | | 948,446,362 | |
| | | | | | | | |
| | | | | | | | |
| |
| Health Care–10.4% | |
| Health Care Equipment & Supplies–1.5% | |
ResMed, Inc. (CDI) | | | 4,993,600 | | | | 121,341,627 | |
| | | | | | | | |
| Health Care Providers & Services–0.5% | |
Fresenius SE & Co. KGaA(a) | | | 1,108,689 | | | | 42,297,256 | |
| | | | | | | | |
| Pharmaceuticals–8.4% | |
GSK PLC | | | 8,039,860 | | | | 163,699,734 | |
Novartis AG (REG) | | | 766,890 | | | | 88,301,472 | |
Novo Nordisk A/S–Class B | | | 3,052,040 | | | | 362,007,104 | |
Roche Holding AG (Genusschein) | | | 127,810 | | | | 40,901,392 | |
Sanofi SA | | | 351,210 | | | | 40,438,023 | |
| | | | | | | | |
| | | | | | | 695,347,725 | |
| | | | | | | | |
| | | | | | | 858,986,608 | |
| | | | | | | | |
| | | | | | | | |
| |
| Communication Services–5.2% | |
| Diversified Telecommunication Services–0.5% | |
Nippon Telegraph & Telephone Corp. | | | 42,058,400 | | | | 43,117,616 | |
| | | | | | | | |
| Entertainment–2.3% | |
Capcom Co., Ltd. | | | 3,030,200 | | | | 70,676,790 | |
Konami Group Corp. | | | 1,167,200 | | | | 119,029,233 | |
| | | | | | | | |
| | | | | | | 189,706,023 | |
| | | | | | | | |
| Interactive Media & Services–2.2% | |
Tencent Holdings Ltd. | | | 3,307,200 | | | | 183,896,326 | |
| | | | | | | | |
| Wireless Telecommunication Services–0.2% | |
Etihad Etisalat Co. | | | 790,546 | | | | 10,848,506 | |
| | | | | | | | |
| | | | | | | 427,568,471 | |
| | | | | | | | |
| | | | | | | | |
| |
| Consumer Staples–4.9% | |
| Beverages–0.6% | |
Luzhou Laojiao Co., Ltd. | | | 2,409,445 | | | | 50,491,699 | |
| | | | | | | | |
| Consumer Staples Distribution & Retail–3.0% | |
BIM Birlesik Magazalar AS | | | 2,324,360 | | | | 33,729,473 | |
Loblaw Cos., Ltd. | | | 1,584,600 | | | | 210,990,992 | |
| | | | | | | | |
| | | | | | | 244,720,465 | |
| | | | | | | | |
| Personal Care Products–1.3% | |
Colgate-Palmolive India Ltd. | | | 955,510 | | | | 43,475,989 | |
Unilever PLC (London) | | | 1,000,790 | | | $ | 64,884,493 | |
| | | | | | | | |
| | | | | | | 108,360,482 | |
| | | | | | | | |
| | | | | | | 403,572,646 | |
| | | | | | | | |
| | | | | | | | |
| |
| Energy–4.8% | |
| Oil, Gas & Consumable Fuels–4.8% | |
Enbridge, Inc. | | | 1,010,870 | | | | 41,064,141 | |
Petroleo Brasileiro SA (Preference Shares) | | | 12,142,100 | | | | 80,260,848 | |
Repsol SA | | | 9,344,020 | | | | 123,240,854 | |
Shell PLC | | | 4,707,600 | | | | 152,722,674 | |
| | | | | | | | |
| | | | | | | 397,288,517 | |
| | | | | | | | |
| | | | | | | | |
| |
| Materials–3.2% | |
| Construction Materials–2.3% | |
CRH PLC | | | 2,104,410 | | | | 195,162,983 | |
| | | | | | | | |
| Metals & Mining–0.9% | |
Sumitomo Metal Mining Co., Ltd. | | | 2,378,000 | | | | 71,364,657 | |
| | | | | | | | |
| | | | | | | 266,527,640 | |
| | | | | | | | |
| | | | | | | | |
| |
| Utilities–1.7% | |
| Electric Utilities–1.1% | |
Enel SpA | | | 11,670,560 | | | | 93,222,059 | |
| | | | | | | | |
| Water Utilities–0.6% | |
Cia de Saneamento Basico do Estado de Sao Paulo SABESP | | | 2,739,300 | | | | 45,456,380 | |
| | | | | | | | |
| | | | | | | 138,678,439 | |
| | | | | | | | |
| | | | | | | | |
| |
| Real Estate–1.4% | |
| Real Estate Management & Development–1.1% | |
Emaar Properties PJSC | | | 38,670,670 | | | | 91,749,680 | |
| | | | | | | | |
| Retail REITs–0.3% | |
CapitaLand Integrated Commercial Trust | | | 14,655,100 | | | | 24,088,309 | |
| | | | | | | | |
| | | | | | | 115,837,989 | |
| | | | | | | | |
Total Common Stocks
(cost $6,281,497,982) | | | | | | | 8,118,325,866 | |
| | | | | | | | |
| | | | | | | | |
| |
| SHORT-TERM INVESTMENTS–1.3% | |
| Investment Companies–1.3% | |
AB Fixed Income Shares, Inc.–Government Money Market Portfolio–Class AB, 4.73%(b)(c)(d)
(cost $108,507,267) | | | 108,507,267 | | | | 108,507,267 | |
| | | | | | | | |
Total Investments—99.6%
(cost $6,390,005,249) | | | | 8,226,833,133 | |
| | |
Other assets less liabilities—0.4% | | | | | | | 33,469,424 | |
| | | | | | | | |
| Net Assets—100.0% | | | | | | $ | 8,260,302,557 | |
| | | | | | | | |
| | | | | | | | | | | | | | | | | | | | |
| |
| FORWARD CURRENCY EXCHANGE CONTRACTS (see Note 3) | |
| Counterparty | | Contracts to
Deliver
(000) | | | In Exchange
For
(000) | | | Settlement
Date | | | Unrealized
Appreciation
(Depreciation) | |
| | | | | | |
Bank of America, NA | | BRL | | | 115,287 | | | USD | | | 21,161 | | | | 10/02/2024 | | | $ | (1,554 | ) |
| | | | | | |
Bank of America, NA | | USD | | | 20,545 | | | BRL | | | 115,287 | | | | 10/02/2024 | | | | 617,735 | |
| | | | | | |
Bank of America, NA | | KRW | | | 30,739,615 | | | USD | | | 22,848 | | | | 10/18/2024 | | | | (474,361 | ) |
| | | | | | |
Bank of America, NA | | SGD | | | 79,501 | | | USD | | | 61,062 | | | | 10/18/2024 | | | | (843,534 | ) |
| | | | | | |
Bank of America, NA | | USD | | | 25,258 | | | KRW | | | 33,623,247 | | | | 10/18/2024 | | | | 252,276 | |
| | | | | | |
Bank of America, NA | | EUR | | | 29,141 | | | USD | | | 32,250 | | | | 10/25/2024 | | | | (219,113 | ) |
| | | | | | |
Bank of America, NA | | USD | | | 25,381 | | | BRL | | | 138,235 | | | | 11/04/2024 | | | | (98,871 | ) |
| | | | | | |
Bank of America, NA | | CAD | | | 38,397 | | | USD | | | 28,620 | | | | 11/07/2024 | | | | 203,613 | |
| | | | | | |
Bank of America, NA | | USD | | | 28,316 | | | GBP | | | 21,352 | | | | 11/08/2024 | | | | 229,480 | |
| | | | | | |
Bank of America, NA | | USD | | | 55,025 | | | TWD | | | 1,736,050 | | | | 11/22/2024 | | | | 128,113 | |
| | | | | | |
Barclays Bank PLC | | BRL | | | 480,385 | | | USD | | | 86,445 | | | | 10/02/2024 | | | | (1,735,983 | ) |
| | | | | | |
Barclays Bank PLC | | USD | | | 88,175 | | | BRL | | | 480,385 | | | | 10/02/2024 | | | | 6,474 | |
| | | | | | |
Barclays Bank PLC | | JPY | | | 3,246,929 | | | USD | | | 22,279 | | | | 10/17/2024 | | | | (358,489 | ) |
| | | | | | |
Barclays Bank PLC | | USD | | | 25,507 | | | JPY | | | 3,715,429 | | | | 10/17/2024 | | | | 397,161 | |
| | | | | | |
Barclays Bank PLC | | USD | | | 77,850 | | | JPY | | | 11,076,524 | | | | 10/17/2024 | | | | (624,423 | ) |
| | | | | | |
Barclays Bank PLC | | USD | | | 59,116 | | | KRW | | | 78,952,792 | | | | 10/18/2024 | | | | 785,583 | |
| | | | | | |
Barclays Bank PLC | | EUR | | | 19,300 | | | USD | | | 21,515 | | | | 10/25/2024 | | | | 11,177 | |
| | | | | | |
Barclays Bank PLC | | USD | | | 20,431 | | | CHF | | | 17,506 | | | | 10/25/2024 | | | | 307,506 | |
| | | | | | |
Barclays Bank PLC | | USD | | | 23,678 | | | EUR | | | 21,301 | | | | 10/25/2024 | | | | 55,536 | |
| | | | | | |
Barclays Bank PLC | | USD | | | 22,165 | | | EUR | | | 19,810 | | | | 10/25/2024 | | | | (92,248 | ) |
| | | | | | |
Barclays Bank PLC | | USD | | | 14,440 | | | PHP | | | 844,712 | | | | 10/25/2024 | | | | 602,224 | |
| | | | | | |
Barclays Bank PLC | | CNH | | | 206,503 | | | USD | | | 29,577 | | | | 11/21/2024 | | | | 2,986 | |
| | | | | | |
Barclays Bank PLC | | USD | | | 25,115 | | | CNH | | | 175,720 | | | | 11/21/2024 | | | | 50,876 | |
| | | | | | |
Barclays Bank PLC | | USD | | | 91,296 | | | SEK | | | 925,735 | | | | 11/22/2024 | | | | 78,263 | |
| | | | | | |
Barclays Bank PLC | | USD | | | 291,073 | | | INR | | | 24,517,483 | | | | 12/06/2024 | | | | 629,110 | |
| | | | | | |
BNP Paribas SA | | USD | | | 60,221 | | | ZAR | | | 1,074,986 | | | | 10/17/2024 | | | | 1,920,698 | |
| | | | | | |
BNP Paribas SA | | USD | | | 20,579 | | | KRW | | | 27,550,086 | | | | 10/18/2024 | | | | 323,271 | |
| | | | | | |
BNP Paribas SA | | USD | | | 40,981 | | | SGD | | | 54,906 | | | | 10/18/2024 | | | | 1,772,985 | |
| | | | | | |
BNP Paribas SA | | EUR | | | 14,751 | | | USD | | | 16,507 | | | | 10/25/2024 | | | | 71,346 | |
| | | | | | |
BNP Paribas SA | | USD | | | 75,552 | | | EUR | | | 68,749 | | | | 10/25/2024 | | | | 1,048,714 | |
| | | | | | |
Citibank, NA | | JPY | | | 5,044,264 | | | USD | | | 34,178 | | | | 10/17/2024 | | | | (990,800 | ) |
| | | | | | |
Citibank, NA | | SGD | | | 29,530 | | | USD | | | 23,032 | | | | 10/18/2024 | | | | 37,890 | |
| | | | | | |
Citibank, NA | | SGD | | | 26,652 | | | USD | | | 20,728 | | | | 10/18/2024 | | | | (25,168 | ) |
| | | | | | |
Citibank, NA | | TRY | | | 704,161 | | | USD | | | 19,976 | | | | 10/23/2024 | | | | (179,841 | ) |
| | | | | | |
Citibank, NA | | USD | | | 36,310 | | | IDR | | | 592,290,276 | | | | 10/25/2024 | | | | 2,635,675 | |
| | | | | | |
Citibank, NA | | TWD | | | 7,956,902 | | | USD | | | 249,979 | | | | 11/22/2024 | | | | (2,807,541 | ) |
| | | | | | |
Deutsche Bank AG | | SGD | | | 30,594 | | | USD | | | 23,637 | | | | 10/18/2024 | | | | (185,705 | ) |
| | | | | | |
Deutsche Bank AG | | EUR | | | 19,486 | | | USD | | | 21,635 | | | | 10/25/2024 | | | | (76,646 | ) |
| | | | | | |
Goldman Sachs Bank USA | | USD | | | 48,144 | | | JPY | | | 6,959,883 | | | | 10/17/2024 | | | | 379,730 | |
| | | | | | |
Goldman Sachs Bank USA | | CHF | | | 19,614 | | | USD | | | 23,371 | | | | 10/25/2024 | | | | 135,463 | |
| | | | | | |
Goldman Sachs Bank USA | | EUR | | | 27,704 | | | USD | | | 30,654 | | | | 10/25/2024 | | | | (213,869 | ) |
| | | | | | |
Goldman Sachs Bank USA | | USD | | | 28,404 | | | EUR | | | 25,390 | | | | 10/25/2024 | | | | (114,362 | ) |
| | | | | | |
HSBC Bank USA | | BRL | | | 140,924 | | | USD | | | 25,867 | | | | 10/02/2024 | | | | (1,899 | ) |
| | | | | | |
HSBC Bank USA | | USD | | | 25,093 | | | BRL | | | 140,924 | | | | 10/02/2024 | | | | 775,227 | |
| | | | | | |
HSBC Bank USA | | JPY | | | 34,028,111 | | | USD | | | 234,485 | | | | 10/17/2024 | | | | (2,758,082 | ) |
| | | | | | |
HSBC Bank USA | | USD | | | 76,338 | | | JPY | | | 11,048,230 | | | | 10/17/2024 | | | | 689,719 | |
Schedule of Investments (continued)
| | | | | | | | | | | | | | | | | | | | |
| Counterparty | | Contracts to
Deliver
(000) | | | In Exchange
For
(000) | | | Settlement
Date | | | Unrealized
Appreciation
(Depreciation) | |
| | | | | | |
HSBC Bank USA | | KRW | | | 25,674,199 | | | USD | | | 18,710 | | | | 10/18/2024 | | | $ | (768,896 | ) |
| | | | | | |
HSBC Bank USA | | SGD | | | 43,798 | | | USD | | | 33,813 | | | | 10/18/2024 | | | | (291,355 | ) |
| | | | | | |
HSBC Bank USA | | USD | | | 22,282 | | | KRW | | | 29,699,109 | | | | 10/18/2024 | | | | 250,619 | |
| | | | | | |
HSBC Bank USA | | EUR | | | 21,940 | | | USD | | | 24,570 | | | | 10/25/2024 | | | | 124,402 | |
| | | | | | |
HSBC Bank USA | | EUR | | | 82,068 | | | USD | | | 90,407 | | | | 10/25/2024 | | | | (1,033,786 | ) |
| | | | | | |
HSBC Bank USA | | USD | | | 56,445 | | | EUR | | | 50,976 | | | | 10/25/2024 | | | | 352,534 | |
| | | | | | |
HSBC Bank USA | | USD | | | 20,765 | | | CAD | | | 27,927 | | | | 11/07/2024 | | | | (97,878 | ) |
| | | | | | |
HSBC Bank USA | | TWD | | | 877,499 | | | USD | | | 27,590 | | | | 11/22/2024 | | | | (287,749 | ) |
| | | | | | |
HSBC Bank USA | | USD | | | 90,630 | | | TWD | | | 2,875,446 | | | | 11/22/2024 | | | | 721,477 | |
| | | | | | |
HSBC Bank USA | | USD | | | 27,754 | | | ILS | | | 104,429 | | | | 12/11/2024 | | | | 316,481 | |
| | | | | | |
JPMorgan Chase Bank, NA | | JPY | | | 6,363,064 | | | USD | | | 44,732 | | | | 10/17/2024 | | | | 368,710 | |
| | | | | | |
JPMorgan Chase Bank, NA | | USD | | | 27,115 | | | JPY | | | 3,872,411 | | | | 10/17/2024 | | | | (116,618 | ) |
| | | | | | |
JPMorgan Chase Bank, NA | | SGD | | | 42,666 | | | USD | | | 32,907 | | | | 10/18/2024 | | | | (315,893 | ) |
| | | | | | |
JPMorgan Chase Bank, NA | | EUR | | | 5,346 | | | USD | | | 5,982 | | | | 10/25/2024 | | | | 25,752 | |
| | | | | | |
JPMorgan Chase Bank, NA | | EUR | | | 696,364 | | | USD | | | 764,365 | | | | 10/25/2024 | | | | (11,529,058 | ) |
| | | | | | |
JPMorgan Chase Bank, NA | | USD | | | 387,223 | | | CHF | | | 328,150 | | | | 10/25/2024 | | | | 1,520,816 | |
| | | | | | |
JPMorgan Chase Bank, NA | | USD | | | 21,359 | | | EUR | | | 19,151 | | | | 10/25/2024 | | | | (20,986 | ) |
| | | | | | |
JPMorgan Chase Bank, NA | | GBP | | | 202,741 | | | USD | | | 267,792 | | | | 11/08/2024 | | | | (3,255,644 | ) |
| | | | | | |
JPMorgan Chase Bank, NA | | USD | | | 7,356 | | | GBP | | | 5,547 | | | | 11/08/2024 | | | | 60,686 | |
| | | | | | |
JPMorgan Chase Bank, NA | | USD | | | 16,387 | | | PLN | | | 63,682 | | | | 11/21/2024 | | | | 137,875 | |
| | | | | | |
JPMorgan Chase Bank, NA | | USD | | | 20,519 | | | NOK | | | 217,507 | | | | 11/22/2024 | | | | 99,609 | |
| | | | | | |
Morgan Stanley Capital Services, Inc. | | BRL | | | 224,174 | | | USD | | | 41,147 | | | | 10/02/2024 | | | | (3,021 | ) |
| | | | | | |
Morgan Stanley Capital Services, Inc. | | USD | | | 41,163 | | | BRL | | | 224,174 | | | | 10/02/2024 | | | | (12,845 | ) |
| | | | | | |
Morgan Stanley Capital Services, Inc. | | JPY | | | 3,715,429 | | | USD | | | 25,438 | | | | 10/17/2024 | | | | (466,104 | ) |
| | | | | | |
Morgan Stanley Capital Services, Inc. | | USD | | | 36,810 | | | JPY | | | 5,147,947 | | | | 10/17/2024 | | | | (918,954 | ) |
| | | | | | |
Morgan Stanley Capital Services, Inc. | | KRW | | | 462,933,697 | | | USD | | | 338,027 | | | | 10/18/2024 | | | | (13,203,108 | ) |
| | | | | | |
Morgan Stanley Capital Services, Inc. | | BRL | | | 224,174 | | | USD | | | 41,015 | | | | 11/04/2024 | | | | 15,752 | |
| | | | | | |
Morgan Stanley Capital Services, Inc. | | USD | | | 310,668 | | | CAD | | | 422,193 | | | | 11/07/2024 | | | | 1,778,741 | |
| | | | | | |
Morgan Stanley Capital Services, Inc. | | USD | | | 11,918 | | | CLP | | | 11,233,560 | | | | 11/08/2024 | | | | 570,375 | |
| | | | | | |
Morgan Stanley Capital Services, Inc. | | USD | | | 28,968 | | | MYR | | | 128,127 | | | | 11/21/2024 | | | | 2,102,832 | |
| | | | | | |
Morgan Stanley Capital Services, Inc. | | USD | | | 51,178 | | | MXN | | | 1,001,381 | | | | 12/11/2024 | | | | (861,756 | ) |
| | | | | | |
NatWest Markets PLC | | CHF | | | 32,626 | | | USD | | | 38,750 | | | | 10/25/2024 | | | | 99,463 | |
| | | | | | |
NatWest Markets PLC | | EUR | | | 77,442 | | | USD | | | 86,278 | | | | 10/25/2024 | | | | (8,966 | ) |
| | | | | | |
Societe Generale | | USD | | | 31,800 | | | JPY | | | 4,594,818 | | | | 10/17/2024 | | | | 235,030 | |
| | | | | | |
Standard Chartered Bank | | USD | | | 2,862 | | | JPY | | | 413,723 | | | | 10/17/2024 | | | | 22,333 | |
| | | | | | |
Standard Chartered Bank | | USD | | | 281,684 | | | AUD | | | 416,767 | | | | 11/22/2024 | | | | 6,634,071 | |
| | | | | | |
State Street Bank & Trust Co. | | USD | | | 23,574 | | | JPY | | | 3,351,131 | | | | 10/17/2024 | | | | (209,958 | ) |
| | | | | | |
State Street Bank & Trust Co. | | SGD | | | 29,994 | | | USD | | | 23,074 | | | | 10/18/2024 | | | | (281,437 | ) |
| | | | | | |
State Street Bank & Trust Co. | | USD | | | 116,782 | | | KRW | | | 158,950,157 | | | | 10/18/2024 | | | | 3,813,887 | |
| | | | | | |
State Street Bank & Trust Co. | | CNH | | | 3 | | | USD | | | 0 | ** | | | 11/21/2024 | | | | — | |
| | | | | | |
State Street Bank & Trust Co. | | CNH | | | 175,720 | | | USD | | | 25,158 | | | | 11/21/2024 | | | | (7,652 | ) |
| | | | | | |
State Street Bank & Trust Co. | | USD | | | 42,052 | | | THB | | | 1,418,777 | | | | 11/21/2024 | | | | 2,185,705 | |
| | | | | | |
State Street Bank & Trust Co. | | TWD | | | 777,242 | | | USD | | | 24,651 | | | | 11/22/2024 | | | | (41,730 | ) |
| | | | | | |
UBS AG | | JPY | | | 2,928,390 | | | USD | | | 20,609 | | | | 10/17/2024 | | | | 192,846 | |
| | | | | | |
UBS AG | | USD | | | 36,195 | | | JPY | | | 5,146,090 | | | | 10/17/2024 | | | | (316,729 | ) |
| | | | | | |
UBS AG | | USD | | | 27,032 | | | KRW | | | 35,890,192 | | | | 10/18/2024 | | | | 198,490 | |
| | | | | | |
UBS AG | | EUR | | | 28,154 | | | USD | | | 31,389 | | | | 10/25/2024 | | | | 19,441 | |
| | | | | | | | | | | | | | | | | | | | |
| Counterparty | | Contracts to
Deliver
(000) | | | In Exchange
For
(000) | | | Settlement
Date | | | Unrealized
Appreciation
(Depreciation) | |
| | | | | | |
UBS AG | | EUR | | | 22,079 | | | USD | | | 24,355 | | | | 10/25/2024 | | | $ | (245,933 | ) |
| | | | | | |
UBS AG | | USD | | | 20,662 | | | CHF | | | 17,830 | | | | 10/25/2024 | | | | 460,736 | |
| | | | | | |
UBS AG | | USD | | | 41,313 | | | EUR | | | 37,562 | | | | 10/25/2024 | | | | 539,026 | |
| | | | | | |
UBS AG | | USD | | | 27,367 | | | GBP | | | 20,477 | | | | 11/08/2024 | | | | 8,640 | |
| | | | | | |
UBS AG | | USD | | | 22,071 | | | TWD | | | 697,828 | | | | 11/22/2024 | | | | 98,227 | |
| | | | | | |
UBS AG | | USD | | | 17,318 | | | NZD | | | 27,640 | | | | 12/06/2024 | | | | 243,566 | |
| | | | | | | | | | | | | | | | | | | | |
| | | $ | (8,751,592 | ) |
| | | | | | | | | | | | | | | | | | | | |
| ** | | Notional amount less than 500. |
| (a) | | Non-income producing security. |
| (b) | | Affiliated investments. |
| (c) | | The rate shown represents the 7-day yield as of period end. |
| (d) | | To obtain a copy of the fund’s shareholder report, please go to the Securities and Exchange Commission’s website at www.sec.gov, or call AB at (800) 227-4618. |
Currency Abbreviations:
AUD—Australian Dollar
BRL—Brazilian Real
CAD—Canadian Dollar
CHF—Swiss Franc
CLP—Chilean Peso
CNH—Chinese Yuan Renminbi (Offshore)
EUR—Euro
GBP—Great British Pound
IDR—Indonesian Rupiah
ILS—Israeli Shekel
INR—Indian Rupee
JPY—Japanese Yen
KRW—South Korean Won
MXN—Mexican Peso
MYR—Malaysian Ringgit
NOK—Norwegian Krone
NZD—New Zealand Dollar
PHP—Philippine Peso
PLN—Polish Zloty
SEK—Swedish Krona
SGD—Singapore Dollar
THB—Thailand Baht
TRY—Turkish Lira
TWD—New Taiwan Dollar
USD—United States Dollar
ZAR—South African Rand
Glossary:
ADR—American Depositary Receipt
CDI—CHESS Depositary Interest
PJSC—Public Joint Stock Company
REG—Registered Shares
REIT—Real Estate Investment Trust
See notes to financial statements.
Statement of Assets and Liabilities—September 30, 2024
| | | | | | | | | | | | |
| | | SMALL CAP CORE
PORTFOLIO | | | INTERNATIONAL
SMALL CAP
PORTFOLIO | | | INTERNATIONAL
STRATEGIC
EQUITIES
PORTFOLIO | |
|
| ASSETS | |
|
Investments in securities at value | |
| | | |
Unaffiliated issuers | | $ | 733,761,712 | | | $ | 1,119,126,767 | | | $ | 8,118,325,866 | |
| | | |
Affiliated issuers | | | 5,312,199 | | | | 25,994,586 | | | | 108,507,267 | |
| | | |
Foreign currencies, at value (a) | | | 0 | | | | 9,577,095 | | | | 15,123,536 | |
| | | |
Cash | | | 1,016 | | | | 50,563 | | | | 0 | |
| | | |
Cash collateral due from broker | | | 2,992,880 | | | | 667,000 | | | | 13,406,000 | |
| | | |
Receivables: | | | | | | | | | | | | |
| | | |
Unaffiliated interest and dividends | | | 631,161 | | | | 5,245,996 | | | | 20,377,678 | |
| | | |
Affiliated dividends | | | 13,259 | | | | 96,809 | | | | 703,170 | |
| | | |
Investment securities sold and foreign currency transactions | | | 0 | | | | 6,862,653 | | | | 6,469,187 | |
| | | |
Capital shares sold | | | 64,833 | | | | 95,185 | | | | 1,004,318 | |
| | | |
Variation margin on futures | | | 87,677 | | | | 0 | | | | 0 | |
| | | |
Receivable due from Adviser | | | 27,404 | | | | 42,810 | | | | 464,918 | |
| | | |
Unrealized appreciation of forward currency exchange contracts | | | 0 | | | | 2,792,116 | | | | 37,346,953 | |
| | | |
Other assets | | | 44,249 | | | | 2,087,624 | | | | 16,729,663 | |
| | | | | | | | | | | | |
| | | |
Total assets | | | 742,936,390 | | | | 1,172,639,204 | | | | 8,338,458,556 | |
| | | | | | | | | | | | |
|
| LIABILITIES | |
| | | |
Due to custodian | | | 0 | | | | 0 | | | | 1,110,508 | |
| | | |
Cash collateral due to broker | | | 0 | | | | 0 | | | | 2,761,000 | |
| | | |
Payables: | | | | | | | | | | | | |
| | | |
Investment securities purchased and foreign currency transactions | | | 0 | | | | 12,420,488 | | | | 18,013,583 | |
| | | |
Foreign capital gains taxes | | | 0 | | | | 3,940,674 | | | | 2,066,453 | |
| | | |
Management fee | | | 441,232 | | | | 863,641 | | | | 4,107,799 | |
| | | |
Capital shares redeemed | | | 108,787 | | | | 380,128 | | | | 2,568,944 | |
| | | |
Custody and accounting fees payable | | | 54,244 | | | | 141,873 | | | | 595,090 | |
| | | |
Directors’ fees payable | | | 26,667 | | | | 41,344 | | | | 296,856 | |
| | | |
Shareholder servicing fee | | | 1,661 | | | | 12,400 | | | | 82,210 | |
| | | |
Transfer Agent fee | | | 17,150 | | | | 14,371 | | | | 32,627 | |
| | | |
Accrued expenses | | | 120,405 | | | | 132,721 | | | | 422,384 | |
| | | |
Unrealized depreciation of forward currency exchange contracts | | | 0 | | | | 4,307,603 | | | | 46,098,545 | |
| | | | | | | | | | | | |
| | | |
Total liabilities | | | 770,146 | | | | 22,255,243 | | | | 78,155,999 | |
| | | | | | | | | | | | |
| | | |
NET ASSETS | | $ | 742,166,244 | | | $ | 1,150,383,961 | | | $ | 8,260,302,557 | |
| | | | | | | | | | | | |
|
Cost of investments | |
| | | |
Unaffiliated issuers | | $ | 577,613,660 | | | $ | 914,357,426 | | | $ | 6,281,497,982 | |
| | | |
Affiliated issuers | | | 5,312,199 | | | | 25,994,586 | | | | 108,507,267 | |
| | | |
| NET ASSETS CONSIST OF: | | | | | | | | | | | | |
| | | |
Capital stock, at par | | $ | 5,297 | | | $ | 8,887 | | | $ | 60,589 | |
| | | |
Additional paid-in capital | | | 506,731,617 | | | | 944,481,964 | | | | 6,849,061,515 | |
| | | |
Distributable earnings | | | 235,429,330 | | | | 205,893,110 | | | | 1,411,180,453 | |
| | | | | | | | | | | | |
| | | |
| | $ | 742,166,244 | | | $ | 1,150,383,961 | | | $ | 8,260,302,557 | |
| | | | | | | | | | | | |
(a) Cost: $0, $9,608,601 and $15,091,161, respectively. (Note 1)
See Notes to Financial Statements.
| | | | | | | | | | | | |
| | | SMALL CAP CORE
PORTFOLIO | | | INTERNATIONAL
SMALL CAP
PORTFOLIO | | | INTERNATIONAL
STRATEGIC
EQUITIES
PORTFOLIO | |
| | | |
| CALCULATION OF MAXIMUM OFFERING PRICE | | | | | | | | | | | | |
|
SCB Class Shares | |
| | | |
Net Assets | | $ | 8,977,672 | | | $ | 66,264,984 | | | $ | 436,717,413 | |
| | | |
Shares of capital stock outstanding | | | 643,958 | | | | 5,128,562 | | | | 32,113,737 | |
| | | | | | | | | | | | |
| | | |
Net asset value, offering and redemption price per share | | $ | 13.94 | | | $ | 12.92 | | | $ | 13.60 | |
| | | | | | | | | | | | |
|
Advisor Class Shares | |
| | | |
Net Assets | | $ | 650,908,883 | | | $ | 917,374,159 | | | $ | 6,925,657,189 | |
| | | |
Shares of capital stock outstanding | | | 46,446,317 | | | | 70,859,484 | | | | 508,008,628 | |
| | | | | | | | | | | | |
| | | |
Net asset value and offering price per share | | $ | 14.01 | | | $ | 12.95 | | | $ | 13.63 | |
| | | | | | | | | | | | |
|
Class Z Shares | |
| | | |
Net Assets | | $ | 82,279,689 | | | $ | 166,744,818 | | | $ | 897,927,955 | |
| | | |
Shares of capital stock outstanding | | | 5,875,058 | | | | 12,882,661 | | | | 65,765,226 | |
| | | | | | | | | | | | |
| | | |
Net asset value and offering price per share | | $ | 14.00 | | | $ | 12.94 | | | $ | 13.65 | |
| | | | | | | | | | | | |
See Notes to Financial Statements.
Statement of Operations—for the year ended September 30, 2024
| | | | | | | | | | | | |
| | | SMALL CAP CORE
PORTFOLIO | | | INTERNATIONAL
SMALL CAP
PORTFOLIO | | | INTERNATIONAL STRATEGIC EQUITIES PORTFOLIO | |
| | | |
| INVESTMENT INCOME | | | | | | | | | | | | |
| | | |
Income: | | | | | | | | | | | | |
| | | |
Interest | | $ | 118,821 | | | $ | 2,372,388 | | | $ | 161,509 | |
| | | |
Dividends | | | | | | | | | | | | |
| | | |
Unaffiliated issuers (a) | | | 10,076,664 | | | | 32,036,690 | | | | 225,086,437 | |
| | | |
Affiliated issuers | | | 269,092 | | | | 907,379 | | | | 5,026,540 | |
| | | |
Foreign withholding tax reclaim (see Note 1D) | | | 0 | | | | 884,910 | | | | 5,849,308 | |
| | | |
Other income | | | 0 | | | | 5,288 | | | | 34,453 | |
| | | |
| | | | | | | | | | | | |
| | | |
Total income | | | 10,464,577 | | | | 36,206,655 | | | | 236,158,247 | |
| | | |
| | | | | | | | | | | | |
| | | |
Expenses: | | | | | | | | | | | | |
| | | |
Management fee (see Note 2A) | | | 5,451,503 | | | | 10,774,863 | | | | 51,304,247 | |
| | | |
Shareholder servicing fee (see Note 2B) | | | 19,812 | | | | 147,918 | | | | 997,643 | |
| | | |
Custody and accounting fees | | | 77,119 | | | | 218,739 | | | | 779,270 | |
| | | |
Transfer Agent fee—Non-Retail Class | | | 3,407 | | | | 12,764 | | | | 18,954 | |
| | | |
Transfer Agent fee—Advisor Class | | | 255,013 | | | | 180,984 | | | | 302,412 | |
| | | |
Transfer Agent fee—Class Z | | | 27,893 | | | | 48,054 | | | | 204,854 | |
| | | |
Directors’ fees and expenses | | | 60,235 | | | | 95,219 | | | | 681,671 | |
| | | |
Legal fees | | | 34,590 | | | | 46,537 | | | | 266,340 | |
| | | |
Auditing and tax fees | | | 50,577 | | | | 86,306 | | | | 156,742 | |
| | | |
Registration fees | | | 57,128 | | | | 59,394 | | | | 84,500 | |
| | | |
Printing fees | | | 44,871 | | | | 39,626 | | | | 57,226 | |
| | | |
Miscellaneous | | | 42,315 | | | | 67,703 | | | | 311,609 | |
| | | |
| | | | | | | | | | | | |
| | | |
Total expenses before interest expense | | | 6,124,463 | | | | 11,778,107 | | | | 55,165,468 | |
| | | |
Interest expense | | | 0 | | | | 0 | | | | 272,602 | |
| | | |
Total expenses | | | 6,124,463 | | | | 11,778,107 | | | | 55,438,070 | |
| | | |
Less: expenses waived and reimbursed by the Adviser (see Note 2A, 2E and 2F) | | | (34,522 | ) | | | (65,693 | ) | | | (2,218,310 | ) |
| | | |
| | | | | | | | | | | | |
| | | |
Net expenses | | | 6,089,941 | | | | 11,712,414 | | | | 53,219,760 | |
| | | |
| | | | | | | | | | | | |
| | | |
Net investment income | | | 4,374,636 | | | | 24,494,241 | | | | 182,938,487 | |
| | | | | | | | | | | | |
| | | |
| REALIZED AND UNREALIZED GAIN (LOSS) ON INVESTMENT AND FOREIGN CURRENCY TRANSACTIONS | | | | | | | | | | | | |
| | | |
Net realized gain (loss) on: | | | | | | | | | | | | |
| | | |
Investment transactions (b) | | | 78,630,034 | | | | 60,240,027 | | | | 400,666,376 | |
| | | |
Forward currency exchange contracts | | | 0 | | | | 6,226,677 | | | | 122,041,898 | |
| | | |
Futures | | | 4,875,984 | | | | 0 | | | | 0 | |
| | | |
Foreign currency transactions | | | 0 | | | | (3,516,693 | ) | | | (9,766,380 | ) |
| | | | | | | | | | | | |
| | | |
Net realized gain on investment transactions and foreign currency transactions | | | 83,506,018 | | | | 62,950,011 | | | | 512,941,894 | |
| | | | | | | | | | | | |
| | | |
Net change in unrealized appreciation (depreciation) of: | | | | | | | | | | | | |
| | | |
Investments (c) | | | 74,629,448 | | | | 160,272,207 | | | | 1,282,712,418 | |
| | | |
Forward currency exchange contracts | | | 0 | | | | (3,014,182 | ) | | | (95,601,326 | ) |
| | | |
Futures | | | 1,508,344 | | | | 0 | | | | 0 | |
| | | |
Foreign currency denominated assets and liabilities | | | 0 | | | | 74,069 | | | | 1,456,708 | |
| | | | | | | | | | | | |
| | | |
Net change in unrealized appreciation (depreciation) of investments and foreign currency denominated assets and liabilities | | | 76,137,792 | | | | 157,332,094 | | | | 1,188,567,800 | |
| | | | | | | | | | | | |
| | | |
Net gain on investment transactions and foreign currency transactions | | | 159,643,810 | | | | 220,282,105 | | | | 1,701,509,694 | |
| | | | | | | | | | | | |
| | | |
Contributions from affiliates (see Note 2A) | | | 0 | | | | 0 | | | | 79,258 | |
| | | | | | | | | | | | |
| | | |
Net increase in net assets resulting from operations | | $ | 164,018,446 | | | $ | 244,776,346 | | | $ | 1,884,527,439 | |
| | | | | | | | | | | | |
(a) Net of foreign withholding taxes of $22,712, $4,276,483 and $28,739,289, respectively.
(b) Net of foreign realized capital gains taxes of $0, $2,480,967 and $0, respectively.
(c) Net of increase in accrued foreign capital gains taxes on unrealized gains of $0, $2,186,224 and $2,066,453, respectively.
See Notes to Financial Statements.
Statement of Changes in Net Assets
| | | | | | | | | | | | | | | | | | | | |
| | | |
| | | SMALL CAP CORE PORTFOLIO | | | | | | INTERNATIONAL SMALL CAP PORTFOLIO | |
| | | | | | | | | | | | | | | | | | | | |
| | | YEAR
ENDED
9/30/24 | | | YEAR
ENDED
9/30/23 | | | | | | YEAR
ENDED
9/30/24 | | | YEAR
ENDED
9/30/23 | |
|
| INCREASE (DECREASE) IN NET ASSETS FROM | |
|
Operations: | |
| | | | | |
Net investment income | | $ | 4,374,636 | | | $ | 4,435,835 | | | | | | | $ | 24,494,241 | | | $ | 27,324,600 | |
| | | | | |
Net realized gain (loss) on investment transactions and foreign currency transactions | | | 83,506,018 | | | | 53,209,938 | | | | | | | | 62,950,011 | | | | (46,995,068 | ) |
| | | | | |
Net change in unrealized appreciation (depreciation) of investments | | | 76,137,792 | | | | 29,802,792 | | | | | | | | 157,332,094 | | | | 226,661,461 | |
| | | | | | | | | | | | | | | | | | | | |
| | | | | |
Net increase in net assets resulting from operations | | | 164,018,446 | | | | 87,448,565 | | | | | | | | 244,776,346 | | | | 206,990,993 | |
| | | | | | | | | | | | | | | | | | | | |
| | | | | |
Distributions to shareholders (a) | | | (56,325,884 | ) | | | (51,799,141 | ) | | | | | | | (32,069,958 | ) | | | (11,869,244 | ) |
| | | | | | | | | | | | | | | | | | | | |
|
Capital-share transactions: | |
| | | | | |
Net proceeds from sales of shares | | | 63,887,140 | | | | 54,832,435 | | | | | | | | 95,755,091 | | | | 119,128,009 | |
| | | | | |
Net proceeds from sales of shares issued to shareholders on reinvestment of dividends | | | 53,609,960 | | | | 46,414,000 | | | | | | | | 25,763,647 | | | | 9,953,508 | |
| | | | | | | | | | | | | | | | | | | | |
| | | | | |
Total proceeds from shares sold | | | 117,497,100 | | | | 101,246,435 | | | | | | | | 121,518,738 | | | | 129,081,517 | |
| | | | | |
Cost of shares redeemed | | | (127,535,964 | ) | | | (112,191,257 | ) | | | | | | | (230,419,513 | ) | | | (282,249,548 | ) |
| | | | | | | | | | | | | | | | | | | | |
| | | | | |
Net decrease in net assets from capital-share transactions | | | (10,038,864 | ) | | | (10,944,822 | ) | | | | | | | (108,900,775 | ) | | | (153,168,031 | ) |
| | | | | | | | | | | | | | | | | | | | |
| | | | | |
Net increase in net assets | | | 97,653,698 | | | | 24,704,602 | | | | | | | | 103,805,613 | | | | 41,953,718 | |
|
| NET ASSETS: | |
| | | | | |
Beginning of period | | | 644,512,546 | | | | 619,807,944 | | | | | | | | 1,046,578,348 | | | | 1,004,624,630 | |
| | | | | | | | | | | | | | | | | | | | |
| | | | | |
End of period | | $ | 742,166,244 | | | $ | 644,512,546 | | | | | | | $ | 1,150,383,961 | | | $ | 1,046,578,348 | |
| | | | | | | | | | | | | | | | | | | | |
(a) See page 23 for share class information on dividend distributions for the Small Cap Core and International Small Cap Portfolios.
See Notes to Financial Statements.
Statement of Changes in Net Assets (continued)
| | | | | | | | |
| |
| | | INTERNATIONAL STRATEGIC EQUITIES PORTFOLIO | |
| | | | | | | | |
| | | YEAR
ENDED 9/30/24 | | | YEAR
ENDED 9/30/23 | |
|
| INCREASE (DECREASE) IN NET ASSETS FROM | |
|
Operations: | |
| | |
Net investment income | | $ | 182,938,487 | | | $ | 166,287,629 | |
| | |
Net realized gain (loss) on investment transactions and foreign currency transactions | | | 512,941,894 | | | | (617,552,466 | ) |
| | |
Net change in unrealized appreciation (depreciation) of investments | | | 1,188,567,800 | | | | 1,685,241,772 | |
| | |
Contributions from affiliates (see Note 2A) | | | 79,258 | | | | 0 | |
| | | | | | | | |
| | |
Net increase in net assets resulting from operations | | | 1,884,527,439 | | | | 1,233,976,935 | |
| | | | | | | | |
| | |
Distributions to shareholders (a) | | | (228,105,256 | ) | | | (284,518,492 | ) |
| | | | | | | | |
|
Capital-share transactions: | |
| | |
Net proceeds from sales of shares | | | 569,441,094 | | | | 934,048,321 | |
| | |
Net proceeds from sales of shares issued to shareholders on reinvestment of dividends | | | 178,310,061 | | | | 228,796,446 | |
| | | | | | | | |
| | |
Total proceeds from shares sold | | | 747,751,155 | | | | 1,162,844,767 | |
| | |
Cost of shares redeemed | | | (1,244,414,978 | ) | | | (1,584,936,534 | ) |
| | | | | | | | |
| | |
Net decrease in net assets from capital-share transactions | | | (496,663,823 | ) | | | (422,091,767 | ) |
| | | | | | | | |
| | |
Net increase in net assets | | | 1,159,758,360 | | | | 527,366,676 | |
|
| NET ASSETS: | |
| | |
Beginning of period | | | 7,100,544,197 | | | | 6,573,177,521 | |
| | | | | | | | |
| | |
End of period | | $ | 8,260,302,557 | | | $ | 7,100,544,197 | |
| | | | | | | | |
(a) See page 23 for share class information on dividend distributions for the International Strategic Equities Portfolio.
See Notes to Financial Statements.
| | | | | | | | |
| |
| | | SMALL CAP CORE PORTFOLIO | |
| | | | | | | | |
| | | YEAR
ENDED
9/30/24 | | | YEAR
ENDED
9/30/23 | |
|
Distributions to shareholders: | |
| | |
SCB Class | | $ | (617,245 | ) | | $ | (581,765 | ) |
| | |
Advisor Class | | | (47,911,059 | ) | | | (41,711,530 | ) |
| | |
Class Z | | | (7,797,580 | ) | | | (9,505,846 | ) |
| | | | | | | | |
| | |
| | $ | (56,325,884 | ) | | $ | (51,799,141 | ) |
| | | | | | | | |
| | | | | | | | |
| |
| | | INTERNATIONAL
SMALL CAP
PORTFOLIO | |
| | | | | | | | |
| | | YEAR
ENDED
9/30/24 | | | YEAR
ENDED
9/30/23 | |
|
Distributions to shareholders: | |
| | |
SCB Class | | $ | (1,572,194 | ) | | $ | (393,839 | ) |
| | |
Advisor Class | | | (24,109,922 | ) | | | (7,822,705 | ) |
| | |
Class Z | | | (6,387,842 | ) | | | (3,652,700 | ) |
| | | | | | | | |
| | |
| | $ | (32,069,958 | ) | | $ | (11,869,244 | ) |
| | | | | | | | |
| | | | | | | | |
| |
| | | INTERNATIONAL
STRATEGIC EQUITIES
PORTFOLIO | |
| | | | | | | | |
| | | YEAR
ENDED
9/30/24 | | | YEAR
ENDED
9/30/23 | |
|
Distributions to shareholders: | |
| | |
SCB Class | | $ | (10,730,065 | ) | | $ | (12,438,246 | ) |
| | |
Advisor Class | | | (183,727,269 | ) | | | (212,132,679 | ) |
| | |
Class Z | | | (33,647,922 | ) | | | (59,947,567 | ) |
| | | | | | | | |
| | |
| | $ | (228,105,256 | ) | | $ | (284,518,492 | ) |
| | | | | | | | |
See Notes to Financial Statements.
Financial Highlights
Selected per share data and ratios for a share of capital stock outstanding for each respective Portfolio for each of the periods presented:
| | | | | | | | | | | | | | | | | | | | |
| |
| | | SMALL CAP CORE PORTFOLIO
SCB CLASS | |
| | | | | | | | | | | | | | | | | | | | |
| | | YEAR
ENDED
9/30/24 | | | YEAR
ENDED
9/30/23 | | | YEAR
ENDED
9/30/22 | | | YEAR
ENDED
9/30/21 | | | YEAR
ENDED
9/30/20 | |
| | | | | |
Net asset value, beginning of period | | $ | 12.00 | | | $ | 11.36 | | | $ | 15.26 | | | $ | 10.39 | | | $ | 10.78 | |
| | | | | | | | | | | | | | | | | | | | |
| | | | | |
Income from investment operations: | | | | | | | | | | | | | | | | | | | | |
| | | | | |
Investment income (loss), net (a)(b) | | | .05 | | | | .05 | | | | .02 | | | | (.02 | ) | | | .02 | |
| | | | | |
Net realized and unrealized gain (loss) on investment transactions and foreign currency transactions | | | 2.94 | | | | 1.51 | | | | (3.03 | ) | | | 4.93 | | | | (.39 | ) |
| | | | | |
Contributions from affiliates | | | 0 | | | | 0 | | | | .00 | (c) | | | 0 | | | | 0 | |
| | | | | | | | | | | | | | | | | | | | |
| | | | | |
Total from investment operations | | | 2.99 | | | | 1.56 | | | | (3.01 | ) | | | 4.91 | | | | (.37 | ) |
| | | | | | | | | | | | | | | | | | | | |
| | | | | |
Less dividends and distributions: | | | | | | | | | | | | | | | | | | | | |
| | | | | |
Dividends from net investment income | | | (.06 | ) | | | (.01 | ) | | | 0 | | | | (.04 | ) | | | (.02 | ) |
| | | | | |
Distributions from net realized gain on investment transactions | | | (.99 | ) | | | (.91 | ) | | | (.89 | ) | | | 0 | | | | 0 | |
| | | | | | | | | | | | | | | | | | | | |
| | | | | |
Total dividends and distributions | | | (1.05 | ) | | | (.92 | ) | | | (.89 | ) | | | (.04 | ) | | | (.02 | ) |
| | | | | | | | | | | | | | | | | | | | |
| | | | | |
Net asset value, end of period | | $ | 13.94 | | | $ | 12.00 | | | $ | 11.36 | | | $ | 15.26 | | | $ | 10.39 | |
| | | | | | | | | | | | | | | | | | | | |
| | | | | |
Total return (d)(e) | | | 26.67% | * | | | 14.07% | | | | (21.18)% | | | | 47.30% | | | | (3.42)% | |
| | | | | |
| RATIOS/SUPPLEMENTAL DATA | | | | | | | | | | | | | | | | | | | | |
| | | | | |
Net assets, end of period (000 omitted) | | $ | 8,977 | | | $ | 7,156 | | | $ | 7,231 | | | $ | 10,119 | | | $ | 7,895 | |
| | | | | |
Average net assets (000 omitted) | | $ | 7,925 | | | $ | 7,774 | | | $ | 9,101 | | | $ | 9,893 | | | $ | 8,175 | |
| | | | | |
Ratio to average net assets of: | | | | | | | | | | | | | | | | | | | | |
| | | | | |
Expenses, net of waivers/reimbursements | | | 1.14% | | | | 1.14% | | | | 1.13% | | | | 1.14% | | | | 1.14% | |
| | | | | |
Expenses, before waivers/reimbursements | | | 1.15% | | | | 1.14% | | | | 1.13% | | | | 1.14% | | | | 1.14% | |
| | | | | |
Net investment income (loss) (b) | | | .40% | | | | .41% | | | | .13% | | | | (.17)% | | | | .19% | |
| | | | | |
Portfolio turnover rate | | | 63% | | | | 43% | | | | 34% | | | | 40% | | | | 88% | |
See Footnote Summary on page 32.
See Notes to Financial Statements.
| | | | | | | | | | | | | | | | | | | | |
| |
| | | SMALL CAP CORE PORTFOLIO
ADVISOR CLASS | |
| | | | | | | | | | | | | | | | | | | | |
| | | YEAR
ENDED
9/30/24 | | | YEAR
ENDED
9/30/23 | | | YEAR
ENDED
9/30/22 | | | YEAR
ENDED
9/30/21 | | | YEAR
ENDED
9/30/20 | |
| | | | | |
Net asset value, beginning of period | | | $12.06 | | | | $11.42 | | | | $15.32 | | | | $10.43 | | | | $10.82 | |
| | | | | | | | | | | | | | | | | | | | |
| | | | | |
Income from investment operations | | | | | | | | | | | | | | | | | | | | |
| | | | | |
Investment income, net (a)(b) | | | .08 | | | | .08 | | | | .05 | | | | .01 | | | | .04 | |
| | | | | |
Net realized and unrealized gain (loss) on investment transactions and foreign currency transactions | | | 2.95 | | | | 1.53 | | | | (3.05 | ) | | | 4.94 | | | | (.38 | ) |
| | | | | |
Contributions from affiliates | | | 0 | | | | 0 | | | | .00 | (c) | | | 0 | | | | 0 | |
| | | | | | | | | | | | | | | | | | | | |
| | | | | |
Total from investment operations | | | 3.03 | | | | 1.61 | | | | (3.00 | ) | | | 4.95 | | | | (.34 | ) |
| | | | | | | | | | | | | | | | | | | | |
| | | | | |
Less dividends and distributions: | | | | | | | | | | | | | | | | | | | | |
| | | | | |
Dividends from net investment income | | | (.09 | ) | | | (.06 | ) | | | (.01 | ) | | | (.06 | ) | | | (.05 | ) |
| | | | | |
Distributions from net realized gain on investment transactions | | | (.99 | ) | | | (.91 | ) | | | (.89 | ) | | | 0 | | | | 0 | |
| | | | | | | | | | | | | | | | | | | | |
| | | | | |
Total dividends and distributions | | | (1.08 | ) | | | (.97 | ) | | | (.90 | ) | | | (.06 | ) | | | (.05 | ) |
| | | | | | | | | | | | | | | | | | | | |
| | | | | |
Net asset value, end of period | | | $14.01 | | | | $12.06 | | | | $11.42 | | | | $15.32 | | | | $10.43 | |
| | | | | | | | | | | | | | | | | | | | |
| | | | | |
Total return (d)(e) | | | 26.96% | * | | | 14.41% | | | | (21.02)% | | | | 47.62% | | | | (3.17)% | |
| | | | | |
| RATIOS/SUPPLEMENTAL DATA | | | | | | | | | | | | | | | | | | | | |
| | | | | |
Net assets, end of period (000 omitted) | | $ | 650,909 | | | $ | 550,219 | | | $ | 500,636 | | | $ | 702,514 | | | $ | 531,943 | |
| | | | | |
Average net assets (000 omitted) | | $ | 592,814 | | | $ | 558,487 | | | $ | 632,321 | | | $ | 687,421 | | | $ | 688,776 | |
| | | | | |
Ratio to average net assets of: | | | | | | | | | | | | | | | | | | | | |
| | | | | |
Expenses, net of waivers/reimbursements | | | .89% | | | | .89% | | | | .88% | | | | .89% | | | | .89% | |
| | | | | |
Expenses, before waivers/reimbursements | | | .90% | | | | .89% | | | | .88% | | | | .89% | | | | .89% | |
| | | | | |
Net investment income (b) | | | .64% | | | | .66% | | | | .38% | | | | .07% | | | | .43% | |
| | | | | |
Portfolio turnover rate | | | 63% | | | | 43% | | | | 34% | | | | 40% | | | | 88% | |
See Footnote Summary on page 32.
See Notes to Financial Statements.
Financial Highlights (continued)
Selected per share data and ratios for a share of capital stock outstanding for each respective Portfolio for each of the periods presented:
| | | | | | | | | | | | | | | | | | | | |
| |
| | | SMALL CAP CORE PORTFOLIO
CLASS Z | |
| | | | | | | | | | | | | | | | | | | | |
| | | YEAR
ENDED
9/30/24 | | | YEAR
ENDED
9/30/23 | | | YEAR
ENDED
9/30/22 | | | YEAR
ENDED
9/30/21 | | | YEAR
ENDED
9/30/20 | |
| | | | | |
Net asset value, beginning of period | | | $12.05 | | | | $11.42 | | | | $15.31 | | | | $10.42 | | | | $10.82 | |
| | | | | | | | | | | | | | | | | | | | |
| | | | | |
Income from investment operations | | | | | | | | | | | | | | | | | | | | |
| | | | | |
Investment income, net (a)(b) | | | .08 | | | | .08 | | | | .05 | | | | .01 | | | | .05 | |
| | | | | |
Net realized and unrealized gain (loss) on investment transactions and foreign currency transactions | | | 2.95 | | | | 1.52 | | | | (3.03 | ) | | | 4.95 | | | | (.39 | ) |
| | | | | |
Contributions from affiliates | | | 0 | | | | 0 | | | | .00 | (c) | | | 0 | | | | 0 | |
| | | | | | | | | | | | | | | | | | | | |
| | | | | |
Total from investment operations | | | 3.03 | | | | 1.60 | | | | (2.98 | ) | | | 4.96 | | | | (.34 | ) |
| | | | | | | | | | | | | | | | | | | | |
| | | | | |
Less dividends and distributions: | | | | | | | | | | | | | | | | | | | | |
| | | | | |
Dividends from net investment income | | | (.09 | ) | | | (.06 | ) | | | (.02 | ) | | | (.07 | ) | | | (.06 | ) |
| | | | | |
Distributions from net realized gain on investment transactions | | | (.99 | ) | | | (.91 | ) | | | (.89 | ) | | | 0 | | | | 0 | |
| | | | | | | | | | | | | | | | | | | | |
| | | | | |
Total dividends and distributions | | | (1.08 | ) | | | (.97 | ) | | | (.91 | ) | | | (.07 | ) | | | (.06 | ) |
| | | | | | | | | | | | | | | | | | | | |
| | | | | |
Net asset value, end of period | | | $14.00 | | | | $12.05 | | | | $11.42 | | | | $15.31 | | | | $10.42 | |
| | | | | | | | | | | | | | | | | | | | |
| | | | | |
Total return (d)(e) | | | 26.99% | * | | | 14.34% | | | | (20.95)% | | | | 47.70% | | | | (3.23)% | |
| | | | | |
| RATIOS/SUPPLEMENTAL DATA | | | | | | | | | | | | | | | | | | | | |
| | | | | |
Net assets, end of period (000 omitted) | | $ | 82,280 | | | $ | 87,138 | | | $ | 111,941 | | | $ | 164,837 | | | $ | 116,488 | |
| | | | | |
Average net assets (000 omitted) | | $ | 80,699 | | | $ | 109,237 | | | $ | 144,065 | | | $ | 155,037 | | | $ | 182,516 | |
| | | | | |
Ratio to average net assets of: | | | | | | | | | | | | | | | | | | | | |
| | | | | |
Expenses, net of waivers/reimbursements | | | .88% | | | | .88% | | | | .87% | | | | .87% | | | | .87% | |
| | | | | |
Expenses, before waivers/reimbursements | | | .89% | | | | .88% | | | | .87% | | | | .87% | | | | .87% | |
| | | | | |
Net investment income (b) | | | .66% | | | | .68% | | | | .39% | | | | .10% | | | | .46% | |
| | | | | |
Portfolio turnover rate | | | 63% | | | | 43% | | | | 34% | | | | 40% | | | | 88% | |
See Footnote Summary on page 32.
See Notes to Financial Statements.
| | | | | | | | | | | | | | | | | | | | |
| |
| | | INTERNATIONAL SMALL CAP PORTFOLIO
SCB CLASS | |
| | | | | | | | | | | | | | | | | | | | |
| | | YEAR
ENDED
9/30/24 | | | YEAR
ENDED
9/30/23 | | | YEAR
ENDED
9/30/22 | | | YEAR
ENDED
9/30/21 | | | YEAR
ENDED
9/30/20 | |
| | | | | |
Net asset value, beginning of period | | | $10.62 | | | | $8.90 | | | | $13.37 | | | | $10.40 | | | | $10.40 | |
| | | | | | | | | | | | | | | | | | | | |
| | | | | |
Income from investment operations: | | | | | | | | | | | | | | | | | | | | |
| | | | | |
Investment income, net (a)(b) | | | .24 | | | | .24 | | | | .22 | | | | .12 | | | | .10 | |
| | | | | |
Net realized and unrealized gain (loss) on investment transactions and foreign currency transactions | | | 2.36 | | | | 1.55 | | | | (4.23 | ) | | | 2.96 | | | | .09 | |
| | | | | | | | | | | | | | | | | | | | |
| | | | | |
Total from investment operations | | | 2.60 | | | | 1.79 | | | | (4.01 | ) | | | 3.08 | | | | .19 | |
| | | | | | | | | | | | | | | | | | | | |
| | | | | |
Less dividends and distributions: | | | | | | | | | | | | | | | | | | | | |
| | | | | |
Dividends from net investment income | | | (.30 | ) | | | (.07 | ) | | | (.23 | ) | | | (.11 | ) | | | (.19 | ) |
| | | | | |
Distributions from net realized gain on investment transactions | | | 0 | | | | 0 | | | | (.23 | ) | | | 0 | | | | 0 | |
| | | | | | | | | | | | | | | | | | | | |
| | | | | |
Total dividends and distributions | | | (.30 | ) | | | (.07 | ) | | | (.46 | ) | | | (.11 | ) | | | (.19 | ) |
| | | | | | | | | | | | | | | | | | | | |
| | | | | |
Net asset value, end of period | | | $12.92 | | | | $10.62 | | | | $8.90 | | | | $13.37 | | | | $10.40 | |
| | | | | | | | | | | | | | | | | | | | |
| | | | | |
Total return (d) | | | 25.15% | * | | | 20.19% | * | | | (31.01)% | | | | 29.79% | | | | 1.77% | |
| | | | | |
| RATIOS/SUPPLEMENTAL DATA | | | | | | | | | | | | | | | | | | | | |
| | | | | |
Net assets, end of period (000 omitted) | | | $66,265 | | | | $55,201 | | | | $48,349 | | | | $72,116 | | | | $63,328 | |
| | | | | |
Average net assets (000 omitted) | | | $59,167 | | | | $56,324 | | | | $63,185 | | | | $72,063 | | | | $62,709 | |
| | | | | |
Ratio to average net assets of: | | | | | | | | | | | | | | | | | | | | |
| | | | | |
Expenses, net of waivers/reimbursements | | | 1.32% | | | | 1.34% | | | | 1.32% | | | | 1.32% | | | | 1.33% | |
| | | | | |
Expenses, before waivers/reimbursements | | | 1.33% | | | | 1.34% | | | | 1.32% | | | | 1.32% | | | | 1.34% | |
| | | | | |
Net investment income (b) | | | 2.05% | | | | 2.25% | | | | 1.87% | | | | .94% | | | | 1.02% | |
| | | | | |
Portfolio turnover rate | | | 50% | | | | 50% | | | | 50% | | | | 48% | | | | 58% | |
See Footnote Summary on page 32.
See Notes to Financial Statements.
Financial Highlights (continued)
Selected per share data and ratios for a share of capital stock outstanding for each respective Portfolio for each of the periods presented:
| | | | | | | | | | | | | | | | | | | | |
| |
| | | INTERNATIONAL SMALL CAP PORTFOLIO
ADVISOR CLASS | |
| | | | | | | | | | | | | | | | | | | | |
| | | YEAR
ENDED
9/30/24 | | | YEAR
ENDED
9/30/23 | | | YEAR
ENDED
9/30/22 | | | YEAR
ENDED
9/30/21 | | | YEAR
ENDED
9/30/20 | |
| | | | | |
Net asset value, beginning of period | | | $10.65 | | | | $8.93 | | | | $13.41 | | | | $10.42 | | | | $10.43 | |
| | | | | | | | | | | | | | | | | | | | |
| | | | | |
Income from investment operations | | | | | | | | | | | | | | | | | | | | |
| | | | | |
Investment income, net (a)(b) | | | .26 | | | | .27 | | | | .25 | | | | .15 | | | | .13 | |
| | | | | |
Net realized and unrealized gain (loss) on investment transactions and foreign currency transactions | | | 2.37 | | | | 1.56 | | | | (4.23 | ) | | | 2.98 | | | | .08 | |
| | | | | | | | | | | | | | | | | | | | |
| | | | | |
Total from investment operations | | | 2.63 | | | | 1.83 | | | | (3.98 | ) | | | 3.13 | | | | .21 | |
| | | | | | | | | | | | | | | | | | | | |
| | | | | |
Less dividends and distributions: | | | | | | | | | | | | | | | | | | | | |
| | | | | |
Dividends from net investment income | | | (.33 | ) | | | (.11 | ) | | | (.27 | ) | | | (.14 | ) | | | (.22 | ) |
| | | | | |
Distributions from net realized gain on investment transactions | | | 0 | | | | 0 | | | | (.23 | ) | | | 0 | | | | 0 | |
| | | | | | | | | | | | | | | | | | | | |
| | | | | |
Total dividends and distributions | | | (.33 | ) | | | (.11 | ) | | | (.50 | ) | | | (.14 | ) | | | (.22 | ) |
| | | | | | | | | | | | | | | | | | | | |
| | | | | |
Net asset value, end of period | | | $12.95 | | | | $10.65 | | | | $8.93 | | | | $13.41 | | | | $10.42 | |
| | | | | | | | | | | | | | | | | | | | |
| | | | | |
Total return (d) | | | 25.41% | | | | 20.54% | | | | (30.81)% | | | | 30.22% | | | | 1.90% | |
| | | | | |
| RATIOS/SUPPLEMENTAL DATA | | | | | | | | | | | | | | | | | | | | |
| | | | | |
Net assets, end of period (000 omitted) | | $ | 917,374 | | | $ | 784,940 | | | $ | 655,455 | | | $ | 948,393 | | | $ | 748,799 | |
| | | | | |
Average net assets (000 omitted) | | $ | 838,987 | | | $ | 774,138 | | | $ | 856,686 | | | $ | 896,897 | | | $ | 750,872 | |
| | | | | |
Ratio to average net assets of: | | | | | | | | | | | | | | | | | | | | |
| | | | | |
Expenses, net of waivers/reimbursements | | | 1.07% | | | | 1.09% | | | | 1.07% | | | | 1.07% | | | | 1.09% | |
| | | | | |
Expenses, before waivers/reimbursements | | | 1.08% | | | | 1.09% | | | | 1.07% | | | | 1.07% | | | | 1.09% | |
| | | | | |
Net investment income (b) | | | 2.30% | | | | 2.51% | | | | 2.14% | | | | 1.22% | | | | 1.27% | |
| | | | | |
Portfolio turnover rate | | | 50% | | | | 50% | | | | 50% | | | | 48% | | | | 58% | |
See Footnote Summary on page 32.
See Notes to Financial Statements.
| | | | | | | | | | | | | | | | | | | | |
| |
| | | INTERNATIONAL SMALL CAP PORTFOLIO CLASS Z | |
| | | | | | | | | | | | | | | | | | | | |
| | | YEAR
ENDED
9/30/24 | | | YEAR
ENDED
9/30/23 | | | YEAR
ENDED
9/30/22 | | | YEAR
ENDED
9/30/21 | | | YEAR
ENDED
9/30/20 | |
| | | | | |
Net asset value, beginning of period | | | $10.64 | | | | $8.93 | | | | $13.41 | | | | $10.42 | | | | $10.43 | |
| | | | | | | | | | | | | | | | | | | | |
|
Income from investment operations | |
| | | | | |
Investment income, net (a)(b) | | | .25 | | | | .24 | | | | .24 | | | | .15 | | | | .13 | |
| | | | | |
Net realized and unrealized gain (loss) on investment transactions and foreign currency transactions | | | 2.38 | | | | 1.58 | | | | (4.22 | ) | | | 2.98 | | | | .08 | |
| | | | | | | | | | | | | | | | | | | | |
| | | | | |
Total from investment operations | | | 2.63 | | | | 1.82 | | | | (3.98 | ) | | | 3.13 | | | | .21 | |
| | | | | | | | | | | | | | | | | | | | |
|
Less dividends and distributions: | |
| | | | | |
Dividends from net investment income | | | (.33 | ) | | | (.11 | ) | | | (.27 | ) | | | (.14 | ) | | | (.22 | ) |
| | | | | |
Distributions from net realized gain on investment transactions | | | 0 | | | | 0 | | | | (.23 | ) | | | 0 | | | | 0 | |
| | | | | | | | | | | | | | | | | | | | |
| | | | | |
Total dividends and distributions | | | (.33 | ) | | | (.11 | ) | | | (.50 | ) | | | (.14 | ) | | | (.22 | ) |
| | | | | | | | | | | | | | | | | | | | |
| | | | | |
Net asset value, end of period | | | $12.94 | | | | $10.64 | | | | $8.93 | | | | $13.41 | | | | $10.42 | |
| | | | | | | | | | | | | | | | | | | | |
| | | | | |
Total return (d) | | | 25.42% | | | | 20.42% | | | | (30.81)% | | | | 30.22% | | | | 1.91% | |
|
| RATIOS/SUPPLEMENTAL DATA | |
| | | | | |
Net assets, end of period (000 omitted) | | $ | 166,745 | | | $ | 206,437 | | | $ | 300,821 | | | $ | 502,324 | | | $ | 398,208 | |
| | | | | |
Average net assets (000 omitted) | | $ | 179,332 | | | $ | 288,501 | | | $ | 418,569 | | | $ | 478,856 | | | $ | 388,053 | |
|
Ratio to average net assets of: | |
| | | | | |
Expenses, net of waivers/reimbursements | | | 1.08% | | | | 1.09% | | | | 1.07% | | | | 1.07% | | | | 1.08% | |
| | | | | |
Expenses, before waivers/reimbursements | | | 1.08% | | | | 1.09% | | | | 1.07% | | | | 1.07% | | | | 1.08% | |
| | | | | |
Net investment income (b) | | | 2.21% | | | | 2.29% | | | | 2.03% | | | | 1.22% | | | | 1.29% | |
| | | | | |
Portfolio turnover rate | | | 50% | | | | 50% | | | | 50% | | | | 48% | | | | 58% | |
See Footnote Summary on page 32.
See Notes to Financial Statements.
Financial Highlights (continued)
Selected per share data and ratios for a share of capital stock outstanding for each respective Portfolio for each of the periods presented:
| | | | | | | | | | | | | | | | | | | | |
| |
| | | INTERNATIONAL STRATEGIC EQUITIES PORTFOLIO SCB CLASS | |
| | | | | | | | | | | | | | | | | | | | |
| | | YEAR
ENDED
9/30/24 | | | YEAR
ENDED
9/30/23 | | | YEAR
ENDED
9/30/22
| | | YEAR
ENDED
9/30/21 | | | YEAR
ENDED
9/30/20 | |
| | | | | |
Net asset value, beginning of period | | | $10.97 | | | | $9.58 | | | | $13.72 | | | | $11.58 | | | | $11.59 | |
| | | | | | | | | | | | | | | | | | | | |
| | | | | |
Income from investment operations: | | | | | | | | | | | | | | | | | | | | |
| | | | | |
Investment income, net (a)(b) | | | .26 | | | | .23 | | | | .36 | | | | .29 | | | | .16 | |
| | | | | |
Net realized and unrealized gain (loss) on investment transactions and foreign currency transactions | | | 2.70 | | | | 1.56 | | | | (3.74 | ) | | | 1.98 | | | | .06 | |
| | | | | |
Contributions from affiliates | | | .00 | (c) | | | 0 | | | | 0 | | | | 0 | | | | 0 | |
| | | | | | | | | | | | | | | | | | | | |
| | | | | |
Total from investment operations | | | 2.96 | | | | 1.79 | | | | (3.38 | ) | | | 2.27 | | | | .22 | |
| | | | | | | | | | | | | | | | | | | | |
| | | | | |
Less dividends and distributions: | | | | | | | | | | | | | | | | | | | | |
| | | | | |
Dividends from net investment income | | | (.33 | ) | | | (.40 | ) | | | (.30 | ) | | | (.13 | ) | | | (.23 | ) |
| | | | | |
Distributions from net realized gain on investment transactions | | | 0 | | | | 0 | | | | (.46 | ) | | | 0 | | | | 0 | |
| | | | | | | | | | | | | | | | | | | | |
| | | | | |
Total dividends and distributions | | | (.33 | ) | | | (.40 | ) | | | (.76 | ) | | | (.13 | ) | | | (.23 | ) |
| | | | | | | | | | | | | | | | | | | | |
| | | | | |
Net asset value, end of period | | | $13.60 | | | | $10.97 | | | | $9.58 | | | | $13.72 | | | | $11.58 | |
| | | | | | | | | | | | | | | | | | | | |
| | | | | |
Total return (d) | | | 27.71% | | | | 18.82% | | | | (26.13)% | | | | 19.76% | | | | 1.81% | |
| | | | | |
| RATIOS/SUPPLEMENTAL DATA | | | | | | | | | | | | | | | | | | | | |
| | | | | |
Net assets, end of period (000 omitted) | | $ | 436,717 | | | $ | 357,763 | | | $ | 312,692 | | | $ | 445,342 | | | $ | 172,253 | |
| | | | | |
Average net assets (000 omitted) | | $ | 399,057 | | | $ | 358,389 | | | $ | 402,301 | | | $ | 404,275 | | | $ | 171,155 | |
| | | | | |
Ratio to average net assets of: | | | | | | | | | | | | | | | | | | | | |
| | | | | |
Expenses, net of waivers/reimbursements (f) | | | .92% | | | | .96% | | | | .94% | | | | .95% | | | | 1.00% | |
| | | | | |
Expenses, before waivers/reimbursements (f) | | | .95% | | | | .96% | | | | .94% | | | | .95% | | | | 1.00% | |
| | | | | |
Net investment income (b) | | | 2.14% | | | | 2.05% | | | | 2.91% | | | | 2.13% | | | | 1.41% | |
| | | | | |
Portfolio turnover rate | | | 69% | | | | 92% | | | | 73% | | | | 86% | | | | 63% | |
See Footnote Summary on page 32.
See Notes to Financial Statements.
| | | | | | | | | | | | | | | | | | | | |
| |
| | | INTERNATIONAL STRATEGIC EQUITIES PORTFOLIO ADVISOR CLASS | |
| | | | | | | | | | | | | | | | | | | | |
| | | YEAR
ENDED
9/30/24 | | | YEAR
ENDED
9/30/23 | | | YEAR
ENDED
9/30/22 | | | YEAR
ENDED
9/30/21 | | | YEAR
ENDED
9/30/20 | |
| | | | | |
Net asset value, beginning of period | | | $11.00 | | | | $9.61 | | | | $13.76 | | | | $11.62 | | | | $11.63 | |
| | | | | | | | | | | | | | | | | | | | |
|
Income from investment operations | |
| | | | | |
Investment income, net (a)(b) | | | .30 | | | | .25 | | | | .39 | | | | .32 | | | | .19 | |
| | | | | |
Net realized and unrealized gain (loss) on investment transactions and foreign currency transactions | | | 2.69 | | | | 1.58 | | | | (3.75 | ) | | | 1.99 | | | | .06 | |
| | | | | |
Contributions from affiliates | | | .00 | (c) | | | 0 | | | | 0 | | | | 0 | | | | 0 | |
| | | | | | | | | | | | | | | | | | | | |
| | | | | |
Total from investment operations | | | 2.99 | | | | 1.83 | | | | (3.36 | ) | | | 2.31 | | | | .25 | |
| | | | | | | | | | | | | | | | | | | | |
|
Less dividends and distributions: | |
| | | | | |
Dividends from net investment income | | | (.36 | ) | | | (.44 | ) | | | (.33 | ) | | | (.17 | ) | | | (.26 | ) |
| | | | | |
Distributions from net realized gain on investment transactions | | | 0 | | | | 0 | | | | (.46 | ) | | | 0 | | | | 0 | |
| | | | | | | | | | | | | | | | | | | | |
| | | | | |
Total dividends and distributions | | | (.36 | ) | | | (.44 | ) | | | (.79 | ) | | | (.17 | ) | | | (.26 | ) |
| | | | | | | | | | | | | | | | | | | | |
| | | | | |
Net asset value, end of period | | | $13.63 | | | | $11.00 | | | | $9.61 | | | | $13.76 | | | | $11.62 | |
| | | | | | | | | | | | | | | | | | | | |
| | | | | |
Total return (d) | | | 27.95% | | | | 19.19% | | | | (25.96)% | | | | 20.02% | | | | 2.04% | |
|
| RATIOS/SUPPLEMENTAL DATA | |
| | | | | |
Net assets, end of period (000 omitted) | | $ | 6,925,658 | | | $ | 5,698,575 | | | $ | 4,928,516 | | | $ | 6,617,933 | | | $ | 2,510,243 | |
| | | | | |
Average net assets (000 omitted) | | $ | 6,370,009 | | | $ | 5,656,249 | | | $ | 6,230,863 | | | $ | 5,755,397 | | | $ | 2,529,235 | |
|
Ratio to average net assets of: | |
| | | | | |
Expenses, net of waivers/reimbursements (f) | | | .67% | | | | .71% | | | | .69% | | | | .70% | | | | .75% | |
| | | | | |
Expenses, before waivers/reimbursements (f) | | | .70% | | | | .71% | | | | .70% | | | | .70% | | | | .75% | |
| | | | | |
Net investment income (b) | | | 2.41% | | | | 2.30% | | | | 3.19% | | | | 2.39% | | | | 1.65% | |
| | | | | |
Portfolio turnover rate | | | 69% | | | | 92% | | | | 73% | | | | 86% | | | | 63% | |
See Footnote Summary on page 32.
See Notes to Financial Statements.
Financial Highlights (continued)
Selected per share data and ratios for a share of capital stock outstanding for each respective Portfolio for each of the periods presented:
| | | | | | | | | | | | | | | | | | | | |
| |
| | | INTERNATIONAL STRATEGIC EQUITIES PORTFOLIO CLASS Z | |
| | | | | | | | | | | | | | | | | | | | |
| | | YEAR
ENDED
9/30/24 | | | YEAR
ENDED
9/30/23 | | | YEAR
ENDED
9/30/22 | | | YEAR
ENDED
9/30/21 | | | YEAR
ENDED
9/30/20 | |
| | | | | |
Net asset value, beginning of period | | | $11.02 | | | | $9.62 | | | | $13.78 | | | | $11.63 | | | | $11.64 | |
| | | | | | | | | | | | | | | | | | | | |
| | | | | |
Income from investment operations | | | | | | | | | | | | | | | | | | | | |
| | | | | |
Investment income, net (a)(b) | | | .27 | | | | .24 | | | | .37 | | | | .30 | | | | .19 | |
| | | | | |
Net realized and unrealized gain (loss) on investment transactions and foreign currency transactions | | | 2.72 | | | | 1.59 | | | | (3.74 | ) | | | 2.02 | | | | .05 | |
| | | | | |
Contributions from affiliates | | | .00 | (c) | | | 0 | | | | 0 | | | | 0 | | | | 0 | |
| | | | | | | | | | | | | | | | | | | | |
| | | | | |
Total from investment operations | | | 2.99 | | | | 1.83 | | | | (3.37 | ) | | | 2.32 | | | | .24 | |
| | | | | | | | | | | | | | | | | | | | |
| | | | | |
Less dividends and distributions: | | | | | | | | | | | | | | | | | | | | |
| | | | | |
Dividends from net investment income | | | (.36 | ) | | | (.43 | ) | | | (.33 | ) | | | (.17 | ) | | | (.25 | ) |
| | | | | |
Distributions from net realized gain on investment transactions | | | 0 | | | | 0 | | | | (.46 | ) | | | 0 | | | | 0 | |
| | | | | | | | | | | | | | | | | | | | |
| | | | | |
Total dividends and distributions | | | (.36 | ) | | | (.43 | ) | | | (.79 | ) | | | (.17 | ) | | | (.25 | ) |
| | | | | | | | | | | | | | | | | | | | |
| | | | | |
Net asset value, end of period | | | $13.65 | | | | $11.02 | | | | $9.62 | | | | $13.78 | | | | $11.63 | |
| | | | | | | | | | | | | | | | | | | | |
| | | | | |
Total return (d) | | | 27.88% | | | | 19.25% | | | | (26.01)% | | | | 20.07% | | | | 2.02% | |
| | | | | |
| RATIOS/SUPPLEMENTAL DATA | | | | | | | | | | | | | | | | | | | | |
| | | | | |
Net assets, end of period (000 omitted) | | $ | 897,928 | | | $ | 1,044,206 | | | $ | 1,331,970 | | | $ | 2,100,301 | | | $ | 1,349,824 | |
| | | | | |
Average net assets (000 omitted) | | $ | 948,309 | | | $ | 1,325,072 | | | $ | 1,811,737 | | | $ | 2,067,177 | | | $ | 1,331,995 | |
| | | | | |
Ratio to average net assets of: | | | | | | | | | | | | | | | | | | | | |
| | | | | |
Expenses, net of waivers/reimbursements (f) | | | .69% | | | | .73% | | | | .71% | | | | .71% | | | | .76% | |
| | | | | |
Expenses, before waivers/reimbursements (f) | | | .72% | | | | .73% | | | | .71% | | | | .71% | | | | .76% | |
| | | | | |
Net investment income (b) | | | 2.23% | | | | 2.16% | | | | 3.03% | | | | 2.26% | | | | 1.65% | |
| | | | | |
Portfolio turnover rate | | | 69% | | | | 92% | | | | 73% | | | | 86% | | | | 63% | |
| (a) | | Based on average shares outstanding. |
| (b) | | Net of expenses waived by the Adviser. |
| (c) | | Amount is less than $.005. |
| (d) | | Total investment return is calculated assuming an initial investment made at the net asset value at the beginning of the period, reinvestment of all dividends and distributions at net asset value during the period, and redemption on the last day of the period. Total return does not reflect the deduction of taxes that a shareholder would pay on fund distributions or the redemption of fund shares. Total investment return calculated for a period of less than one year is not annualized. |
| (e) | | Includes the impact of proceeds received and credited to the Portfolio resulting from the class action settlements, which enhanced the performance for the Small Cap Core Portfolio for the year ended September 30, 2021 by 0.01%. |
| (f) | | The expense ratios, excluding interest expense are: |
| | | | | | | | | | | | | | | | | | | | |
| | | YEAR
ENDED
9/30/24 | | | YEAR
ENDED
9/30/23 | | | YEAR
ENDED
9/30/22 | | | YEAR
ENDED
9/30/21 | | | YEAR
ENDED
9/30/20 | |
International Strategic | | | | | | | | | | | | | | | | | | | | |
Equities Portfolio | | | | | | | | | | | | | | | | | | | | |
SCB Class | | | | | | | | | | | | | | | | | | | | |
Net of waivers/reimbursements | | | .92% | | | | .96% | | | | .94% | | | | .95% | | | | 1.00% | |
Before waivers/reimbursements | | | .95% | | | | .96% | | | | .94% | | | | .95% | | | | 1.00% | |
Advisor Class | | | | | | | | | | | | | | | | | | | | |
Net of waivers/reimbursements | | | .67% | | | | .71% | | | | .69% | | | | .70% | | | | .75% | |
Before waivers/reimbursements | | | .70% | | | | .71% | | | | .70% | | | | .70% | | | | .75% | |
Class Z | | | | | | | | | | | | | | | | | | | | |
Net of waivers/reimbursements | | | .69% | | | | .72% | | | | .71% | | | | .71% | | | | .76% | |
Before waivers/reimbursements | | | .72% | | | | .72% | | | | .71% | | | | .71% | | | | .76% | |
| * | | The net asset value and total return include adjustments in accordance with accounting principles generally accepted in the United States of America for financial reporting purposes. As such, the net asset value and total return for shareholder transactions may differ from financial statements. |
See Notes to Financial Statements.
Notes to Financial Statements
| NOTE 1. | Organization and Significant Accounting Policies |
Bernstein Fund, Inc. (the “Fund”) is registered under the Investment Company Act of 1940 (the “1940 Act”) as an open-end registered investment company. The Fund, which is a Maryland corporation, operates as a series company currently comprised of three portfolios: Small Cap Core Portfolio, International Small Cap Portfolio and International Strategic Equities Portfolio (hereafter collectively referred to as the “Portfolios” and each individually a “Portfolio”).
The Fund’s Portfolios offer the following share classes: SCB Class, Advisor Class and Class Z. Class Z shares are currently offered exclusively to registered investment companies (or their series) managed by AllianceBernstein L.P. (the “Adviser”). Each Portfolio has its own investment objectives. Each class of shares has identical voting, dividend, liquidation and other rights, except that the classes bear different distribution and transfer agency expenses. Each class has exclusive voting rights with respect to its distribution plan, as applicable. The financial statements have been prepared in conformity with U.S. generally accepted accounting principles (“U.S. GAAP”), which require management to make certain estimates and assumptions that affect the reported amounts of assets and liabilities in the financial statements and amounts of income and expenses during the reporting period. Actual results could differ from those estimates. Each Portfolio is an investment company under U.S. GAAP and follows the accounting and reporting guidance applicable to investment companies. The following is a summary of significant accounting policies followed by the Portfolios.
Portfolio securities are valued at market value determined on the basis of market quotations or, if market quotations are not readily available or are unreliable, at “fair value” as determined in accordance with procedures approved by and under the oversight of the Portfolios’ Board of Directors (the “Board”). Pursuant to these procedures, the Adviser serves as the Portfolios’ valuation designee pursuant to Rule 2a-5 of the 1940 Act. In this capacity, the Adviser is responsible, among other things, for making all fair value determinations relating to the Portfolios’ portfolio investments, subject to the Board’s oversight.
In general, the market values of securities which are readily available and deemed reliable are determined as follows: securities listed on a national securities exchange (other than securities listed on the NASDAQ Stock Market, Inc. (“NASDAQ”)) or on a foreign securities exchange are valued at the last sale price at the close of the exchange or foreign securities exchange. If there has been no sale on such day, the securities are valued at the last traded price from the previous day. Securities listed on more than one exchange are valued by reference to the principal exchange on which the securities are traded; securities listed only on NASDAQ are valued in accordance with the NASDAQ Official Closing Price; listed or over the counter (“OTC”) market put or call options are valued at the mid level between the current bid and ask prices. If either a current bid or current ask price is unavailable, the Adviser will have discretion to determine the best valuation (e.g., last trade price in the case of listed options); open futures are valued using the closing settlement price or, in the absence of such a price, the most recent quoted bid price. If there are no quotations available for the day of valuation, the last available closing settlement price is used; U.S. Government securities and any other debt instruments having 60 days or less remaining until maturity are generally valued at market by an independent pricing vendor, if a market price is available. If a market price is not available, the securities are valued at amortized cost. This methodology is commonly used for short term securities that have an original maturity of 60 days or less, as well as short term securities that had an original term to maturity that exceeded 60 days. In instances when amortized cost is utilized, the Valuation Committee (the “Committee”) must reasonably conclude that the utilization of amortized cost is approximately the same as the fair value of the security. Factors the Committee will consider include, but are not limited to, an impairment of the creditworthiness of the issuer or material changes in interest rates. Fixed-income securities, including mortgage-backed and asset-backed securities, may be valued on the basis of prices provided by a pricing service or at a price obtained from one or more of the major broker-dealers. In cases where broker-dealer quotes are obtained, the Adviser may establish procedures whereby changes in market yields or spreads are used to adjust, on a daily basis, a recently obtained quoted price on a security. Swaps and other derivatives are valued daily, primarily using independent pricing services, independent pricing models using market inputs, as well as third party broker-dealers or counterparties. Open-end mutual funds are valued at the closing net asset value per share, while exchange traded funds are valued at the closing market price per share.
Securities for which market quotations are not readily available (including restricted securities) or are deemed unreliable are valued at fair value as deemed appropriate by the Adviser. Factors considered in making this determination may include, but are not limited to, information obtained by contacting the issuer, analysts, analysis of the issuer’s financial
Notes to Financial Statements (continued)
statements or other available documents. In addition, the Portfolios may use fair value pricing for securities primarily traded in non-U.S. markets because most foreign markets close well before the Portfolios value their securities at 4:00 p.m., Eastern Time. The earlier close of these foreign markets gives rise to the possibility that significant events, including broad market moves, may have occurred in the interim and may materially affect the value of those securities. To account for this, the Portfolios generally value many of their foreign equity securities using fair value prices based on third party vendor modeling tools to the extent available.
| B. | | Fair Value Measurements |
In accordance with U.S. GAAP regarding fair value measurements, fair value is defined as the price that the Portfolios would receive to sell an asset or pay to transfer a liability in an orderly transaction between market participants at the measurement date. U.S. GAAP establishes a framework for measuring fair value, and a three-level hierarchy for fair value measurements based upon the transparency of inputs to the valuation of an asset or liability (including those valued based on their market values as described in Note A above). Inputs may be observable or unobservable and refer broadly to the assumptions that market participants would use in pricing the asset or liability. Observable inputs reflect the assumptions market participants would use in pricing the asset or liability based on market data obtained from sources independent of the Portfolios. Unobservable inputs reflect the Portfolios’ own assumptions about the assumptions that market participants would use in pricing the asset or liability based on the best information available in the circumstances. Each investment is assigned a level based upon the observability of the inputs which are significant to the overall valuation. The three-tier hierarchy of inputs is summarized below.
| | • | | Level 1—quoted prices in active markets for identical investments |
| | • | | Level 2—other significant observable inputs (including quoted prices for similar investments, interest rates, prepayment speeds, credit risk, etc.) |
| | • | | Level 3—significant unobservable inputs (including the Portfolios’ own assumptions in determining the fair value of investments) |
The fair value of debt instruments, such as bonds, and over-the-counter derivatives is generally based on market price quotations, recently executed market transactions (where observable) or industry recognized modeling techniques and are generally classified as Level 2. Pricing vendor inputs to Level 2 valuations may include quoted prices for similar investments in active markets, interest rate curves, coupon rates, currency rates, yield curves, option adjusted spreads, default rates, credit spreads and other unique security features in order to estimate the relevant cash flows which are then discounted to calculate fair values. If these inputs are unobservable and significant to the fair value, these investments will be classified as Level 3.
Where readily available market prices or relevant bid prices are not available for certain equity investments, such investments may be valued based on similar publicly traded investments, movements in relevant indices since last available prices or based upon underlying company fundamentals and comparable company data (such as multiples to earnings or other multiples to equity). Where an investment is valued using an observable input, such as another publicly traded security, the investment will be classified as Level 2. If management determines that an adjustment is appropriate based on restrictions on resale, illiquidity or uncertainty, and such adjustment is a significant component of the valuation, the investment will be classified as Level 3. An investment will also be classified as Level 3 where management uses company fundamentals and other significant inputs to determine the valuation.
The following tables summarize the valuation of the Portfolios’ investments by the above fair value hierarchy levels as of September 30, 2024:
| | | | | | | | | | | | | | | | |
SMALL CAP CORE PORTFOLIO INVESTMENTS IN SECURITIES: | | LEVEL 1 | | | LEVEL 2 | | | LEVEL 3 | | | TOTAL | |
|
Assets: | |
| | | | |
Common Stocks (a) | | $ | 733,761,712 | | | $ | 0 | | | $ | 0 | | | $ | 733,761,712 | |
| | | | |
Short-Term Investments | | | 5,312,199 | | | | 0 | | | | 0 | | | | 5,312,199 | |
| | | | |
Total Investments in Securities | | | 739,073,911 | | | | 0 | | | | 0 | | | | 739,073,911 | |
| | | | |
Other Financial Instruments (b): | | | | | | | | | | | | | | | | |
Assets: | |
| | | | |
Futures | | | 768,136 | | | | 0 | | | | 0 | | | | 768,136 | (c) |
| | | | |
Liabilities | | | 0 | | | | 0 | | | | 0 | | | | 0 | |
| | | | |
Total | | $ | 739,842,047 | | | $ | 0 | | | $ | 0 | | | $ | 739,842,047 | |
| | | | |
INTERNATIONAL SMALL CAP PORTFOLIO INVESTMENTS IN SECURITIES: | | LEVEL 1 | | | LEVEL 2 | | | LEVEL 3 | | | TOTAL | |
| | | | |
Assets: | | | | | | | | | | | | | | | | |
Common Stocks: | | | | | | | | | | | | | | | | |
| | | | |
Industrials | | $ | 44,726,326 | | | $ | 208,211,081 | | | $ | 0 | | | $ | 252,937,407 | |
| | | | |
Consumer Discretionary | | | 34,939,770 | | | | 122,927,200 | | | | 0 | | | | 157,866,970 | |
| | | | |
Financials | | | 18,206,405 | | | | 118,531,778 | | | | 0 | | | | 136,738,183 | |
| | | | |
Information Technology | | | 841,173 | | | | 127,132,411 | | | | 0 | | | | 127,973,584 | |
| | | | |
Materials | | | 43,031,222 | | | | 65,528,421 | | | | 0 | | | | 108,559,643 | |
| | | | |
Communication Services | | | 15,851,850 | | | | 70,334,611 | | | | 0 | | | | 86,186,461 | |
| | | | |
Health Care | | | 18,814,539 | | | | 48,640,198 | | | | 0 | | | | 67,454,737 | |
| | | | |
Energy | | | 23,100,582 | | | | 43,748,541 | | | | 0 | | | | 66,849,123 | |
| | | | |
Real Estate | | | 12,592,520 | | | | 37,151,913 | | | | 0 | | | | 49,744,433 | |
| | | | |
Consumer Staples | | | 7,655,163 | | | | 32,026,176 | | | | 0 | | | | 39,681,339 | |
| | | | |
Utilities | | | 15,602,637 | | | | 9,426,726 | | | | 0 | | | | 25,029,363 | |
| | | | |
Rights | | | 0 | | | | 105,524 | | | | 0 | | | | 105,524 | |
| | | | |
Short-Term Investments | | | 25,994,586 | | | | 0 | | | | 0 | | | | 25,994,586 | |
| | | | |
Total Investments in Securities | | | 261,356,773 | | | | 883,764,580 | (d) | | | 0 | | | | 1,145,121,353 | |
| | | | |
Other Financial Instruments (b): | | | | | | | | | | | | | | | | |
| | | | |
Assets: | | | | | | | | | | | | | | | | |
| | | | |
Forward Currency Exchange Contracts | | | 0 | | | | 2,792,116 | | | | 0 | | | | 2,792,116 | |
| | | | |
Liabilities: | | | | | | | | | | | | | | | | |
| | | | |
Forward Currency Exchange Contracts | | | 0 | | | | (4,307,603 | ) | | | 0 | | | | (4,307,603 | ) |
| | | | |
Total | | $ | 261,356,773 | | | $ | 882,249,093 | | | $ | 0 | | | $ | 1,143,605,866 | |
Notes to Financial Statements (continued)
| | | | | | | | | | | | | | | | |
INTERNATIONAL STRATEGIC EQUITIES PORTFOLIO INVESTMENTS IN SECURITIES: | | LEVEL 1 | | | LEVEL 2 | | | LEVEL 3 | | | TOTAL | |
| | | | |
Assets: | | | | | | | | | | | | | | | | |
Common Stocks: | | | | | | | | | | | | | | | | |
| | | | |
Financials | | $ | 0 | | | $ | 1,912,141,439 | | | $ | 0 | | | $ | 1,912,141,439 | |
| | | | |
Industrials | | | 82,567,393 | | | | 1,410,946,579 | | | | 0 | | | | 1,493,513,972 | |
| | | | |
Information Technology | | | 0 | | | | 1,155,763,783 | | | | 0 | | | | 1,155,763,783 | |
| | | | |
Consumer Discretionary | | | 135,875,701 | | | | 812,570,661 | | | | 0 | | | | 948,446,362 | |
| | | | |
Health Care | | | 0 | | | | 858,986,608 | | | | 0 | | | | 858,986,608 | |
| | | | |
Communication Services | | | 0 | | | | 427,568,471 | | | | 0 | | | | 427,568,471 | |
| | | | |
Consumer Staples | | | 244,720,465 | | | | 158,852,181 | | | | 0 | | | | 403,572,646 | |
| | | | |
Energy | | | 121,324,989 | | | | 275,963,528 | | | | 0 | | | | 397,288,517 | |
| | | | |
Materials | | | 195,162,983 | | | | 71,364,657 | | | | 0 | | | | 266,527,640 | |
| | | | |
Utilities | | | 45,456,380 | | | | 93,222,059 | | | | 0 | | | | 138,678,439 | |
| | | | |
Real Estate | | | 0 | | | | 115,837,989 | | | | 0 | | | | 115,837,989 | |
| | | | |
Short-Term Investments | | | 108,507,267 | | | | 0 | | | | 0 | | | | 108,507,267 | |
| | | | |
Total Investments in Securities | | | 933,615,178 | | | | 7,293,217,955 | (d) | | | 0 | | | | 8,226,833,133 | |
| | | | |
Other Financial Instruments (b): | | | | | | | | | | | | | | | | |
| | | | |
Assets: | | | | | | | | | | | | | | | | |
| | | | |
Forward Currency Exchange Contracts | | | 0 | | | | 37,346,953 | | | | 0 | | | | 37,346,953 | |
| | | | |
Liabilities: | | | | | | | | | | | | | | | | |
| | | | |
Forward Currency Exchange Contracts | | | 0 | | | | (46,098,545 | ) | | | 0 | | | | (46,098,545 | ) |
| | | | |
Total | | $ | 933,615,178 | | | $ | 7,284,466,363 | | | $ | 0 | | | $ | 8,218,081,541 | |
| | (a) | See Schedule of Investments for sector classifications. |
| | (b) | Other financial instruments are derivative instruments, such as futures, forwards and swaps, which are valued at the unrealized appreciation (depreciation) on the instrument. Other financial instruments may also include swaps with upfront premiums, written options and written swaptions which are valued at market value. |
| | (c) | Only variation margin receivable (payable) at period end is reported within the statement of assets and liabilities. This amount reflects cumulative unrealized appreciation (depreciation) on futures and centrally cleared swaps as reported in the schedule of investments. Where applicable, centrally cleared swaps with upfront premiums are presented here at market value. |
| | (d) | A significant portion of the Portfolio’s foreign equity investments are categorized as Level 2 investments since they are valued using fair value prices based on third party vendor modeling tools to the extent available, see Note 1.A. |
| C. | | Foreign Currency Translation |
The accounting records of the Portfolios are maintained in U.S. dollars. Prices of securities and other assets and liabilities denominated in non-U.S. currencies are translated into U.S. dollars using the exchange rate at 4:00 p.m., Eastern Time. Amounts related to the purchases and sales of securities, investment income and expenses are translated at the rates of exchange prevailing on the respective dates of such transactions.
Net realized gain or loss on foreign currency transactions represents net foreign exchange gains or losses from the disposition of foreign currencies, currency gains or losses realized between the trade and settlement dates on security transactions and the difference between the amount of dividends, interest and foreign withholding taxes recorded on the Portfolios’ books and the U.S. dollar equivalent amount actually received or paid. Net unrealized currency gains and losses arising from valuing foreign currency denominated assets and liabilities, other than security investments, at the current exchange rate are reflected as part of unrealized appreciation/depreciation on foreign currencies.
The Portfolios do not isolate that portion of the results of operations arising as a result of changes in the foreign exchange rates from the changes in the market prices of securities held at period end. The Portfolios do isolate the effect of changes in foreign exchange rates from changes in market prices of securities sold during the year, as required by the Internal Revenue Code. The International Small Cap Portfolio and International Strategic Equities Portfolio may invest in foreign securities and foreign currency transactions that may involve risks not associated with domestic investments as a result of the level of governmental supervision and regulation of foreign securities markets and the possibility of political or economic instability, among others.
Each Portfolio is treated as a separate entity for federal income tax purposes. Each Portfolio intends to continue to comply with the requirements of Subchapter M of the Internal Revenue Code of 1986 as they apply to regulated investment companies. By so complying, each Portfolio will not be subject to federal and state income taxes to the extent that all of its income is distributed. The Portfolios may be subject to taxes imposed by countries in which they invest. Such taxes are generally based on income and/or capital gains earned or repatriated. Taxes are accrued and applied to net investment income, net realized gains and net unrealized appreciation/depreciation as such income and/or gains are earned based on, management’s understanding of applicable local tax law.
In consideration of recent decisions rendered by the European courts, certain Portfolios filed reclaims to recover taxes withheld on dividends earned from certain European Union countries during calendar years 2017 through 2022. These filings are subject to various administrative and judicial proceedings within these countries. For the year ended September 30, 2024, the International Small Cap and International Strategic Equities Portfolios successfully recovered taxes withheld by France, Poland and Sweden which are reflected in the statement of operations. No other amounts for additional tax reclaims are disclosed in the financial statements due to the uncertainty as to the ultimate resolution of proceedings, the likelihood of receipt of these reclaims, and the potential timing of payment.
In accordance with U.S. GAAP requirements regarding accounting for uncertainties in income taxes, management has analyzed the Portfolios’ tax positions taken or expected to be taken on federal and state income tax returns for all open tax years (the current and the prior three tax years) and has concluded that no provision for income tax is required in the Portfolios’ financial statements. As of September 30, 2024, the Portfolios did not have any unrecognized tax benefits.
| E. | | Security Transactions and Related Investment Income |
Security transactions are accounted for on the trade date (the date the buy or sell order is executed). Securities gains and losses are calculated on the identified cost basis. Interest income is recorded on the accrual basis and dividend income is recorded on the ex-dividend date or as soon as the Portfolios are informed of the dividend. Non-cash dividends, if any, are recorded on the ex-dividend date at the fair value of the securities received. The Portfolios amortize premiums and accrete discounts as adjustments to interest income. The Portfolio accounts for distributions received from REIT investments or from regulated investment companies as dividend income, realized gain, or return of capital based on information provided by the REIT or the investment company.
All income earned and expenses incurred by the Portfolios are borne on a pro-rata basis by each outstanding class of shares, based on the proportionate interest in the Portfolio represented by the shares of such class, except for class specific expenses which are allocated to the respective class. Expenses of the Fund are charged proportionately to each Portfolio or based on other appropriate methods. Realized and unrealized gains and losses are allocated among the various share classes based on respective net assets.
| G. | | Distribution of Income and Gains |
Dividends from net investment income, if any, will be paid to shareholders at least once a year.
Distributions of net realized gains, less any available loss carryforwards, if any, for all the Portfolios will be paid to shareholders at least once a year, and recorded on the ex-dividend date.
Notes to Financial Statements (continued)
Elements of realized gains and net investment income may be recorded in different accounting periods for financial reporting (book) and federal income tax (tax) purposes (temporary differences). To the extent that such distributions required for tax purposes exceed income and gains recorded for book purposes as a result of such temporary differences, “excess distributions” are reflected in the accompanying statement of assets and liabilities. To the extent distributions exceed income and gains for tax purposes, such distributions would be shown as “return of capital” on the statement of changes in net assets. Certain other differences—permanent differences—arise because treatment of elements of income and gains is different between book and tax accounting. Permanent differences are reclassified in the year they arise.
Permanent differences have no effect on net assets. The effects of such permanent differences on each Portfolio, due to the utilization of earnings and profits distributed to shareholders on redemption of shares and contributions from affiliates which are reflected as adjustments to the components of net assets as of September 30, 2024, as shown below:
| | | | | | | | |
| PORTFOLIO | | INCREASE (DECREASE)
TO ADDITIONAL
PAID-IN CAPITAL | | | INCREASE (DECREASE)
TO DISTRIBUTABLE
EARNINGS/
ACCUMULATED LOSS | |
Small Cap Core | | $ | 4,742,530 | | | $ | (4,742,530 | ) |
| | |
International Small Cap | | | 85,028 | | | | (85,028 | ) |
| | |
International Strategic Equities | | | (79,258 | ) | | | 79,258 | |
| H. | | Cash and Short-Term Investments |
Cash and short-term investments include cash on hand and short-term investments with maturities of less than one year when purchased.
| NOTE 2. | Investment Management and Transactions with Affiliated Persons |
Under the Investment Management Agreement between the Fund and the Adviser, the Adviser manages the investment of each Portfolio’s assets, places purchase and sale orders, and bears various expenses, including the salaries and expenses of all personnel except those of outside directors. In addition, the Adviser agrees to permit its directors, officers and employees who may be elected directors or officers of the Fund to serve in the capacities to which they are elected. The Adviser renders these services subject to the general oversight of the Board.
The Portfolios pay the Adviser an investment management fee at an annualized rate as follows:
Small Cap Core Portfolio: 0.80% of the Portfolio’s average daily net assets.
International Small Cap Portfolio: 1.00% of the Portfolio’s average daily net assets.
| | | | | | | | | | | | |
| ANNUAL PERCENTAGE OF AVERAGE DAILY NET ASSETS OF EACH PORTFOLIO | |
| | | FIRST $2.5 BILLION | | | NEXT $2.5 BILLION | | | THEREAFTER | |
| International Strategic Equities | | | 0.75 | % | | | 0.65 | % | | | 0.60 | % |
The Adviser has agreed to waive its fees and bear certain expenses to the extent necessary to limit the total portfolio operating expenses (excluding acquired fund fees and expenses other than the advisory fees of any AB mutual funds in which the Portfolios may invest, interest expense, taxes, extraordinary expenses, and brokerage commissions and other transaction costs) as a percentage of daily average net assets on an annual basis (the “Expense Caps”) as follows:
| | | | | | | | | | | | |
| PORTFOLIO | | SCB CLASS | | | ADVISOR CLASS | | | CLASS Z | |
| Small Cap Core | | | 1.30 | % | | | 1.05 | % | | | 1.05 | % |
| | | |
| International Small Cap | | | 1.35 | % | | | 1.10 | % | | | 1.10 | % |
The Expense Caps described above for Small Cap Core and International Small Cap may not be terminated by the Adviser before January 28, 2025. During the year ended September 30, 2024, there were no such reimbursement/waivers.
At a meeting held on October 25-26, 2023, the Board approved a voluntary advisory fee waiver for the International Strategic Equities Portfolio of 0.025% of the Portfolio’s average daily net assets. The fee waiver was effective as of November 1, 2023; at a meeting held on October 23-24, 2024, the Board voted to extend the voluntary advisory fee waiver until May 8, 2025, when the Advisory Agreement will next be reviewed by the Board. For the year ended September 30, 2024, such waivers amounted to $1,786,304.
During the year ended September 30, 2024, the Adviser reimbursed the International Strategic Equities Portfolio $26,108 for trading losses incurred due to trade entry errors and $53,150 for trading losses incurred due to NAV errors.
| B. | | Shareholder Servicing Fee; Transfer Agency Fee |
Under the Shareholder Servicing Agreement between the Fund and the Adviser, the Adviser pays expenses it incurs in providing shareholder servicing to the Fund, the Portfolios and individual shareholders. Such services include, but are not limited to, providing information to shareholders concerning their fund investments, systematic withdrawal plans, fund dividend payments and reinvestments, shareholder account or transactions status, net asset value of shares, fund performance, fund services, plans and options, fund investment policies, portfolio holdings and tax consequences of fund investments; dealing with shareholder complaints and other correspondence relating to fund matters; and communications with shareholders when proxies are being solicited from them with respect to voting their fund shares. Under the agreement, the fee paid by each Portfolio to the Adviser for services is 0.25% of the average daily net assets of SCB Class Shares.
The Fund compensates AllianceBernstein Investor Services, Inc. (“ABIS”), a wholly-owned subsidiary of the Adviser, under a Transfer Agency Agreement for providing personnel and facilities to perform transfer agency services for the Fund. ABIS may make payments to intermediaries that provide omnibus account services, sub accounting services and/or networking services. For the year ended September 30, 2024, the compensation retained by ABIS amounted to: Small Cap Core Portfolio, $187,534; International Small Cap Portfolio, $168,719; and International Strategic Equities Portfolio, $402,480.
| C. | | Distribution Arrangements—the Portfolios Except the Retail Classes |
Under the Distribution Agreement between the Fund, on behalf of each Portfolio, and Sanford C. Bernstein & Co., LLC (the “Distributor”), the Distributor agrees to act as agent to sell shares of the Portfolios. The Distributor receives no fee for this service, and furthermore agrees to pay all expenses arising from the performance of its obligations under this agreement. The Distributor is a wholly owned subsidiary of the Adviser.
| D. | | Distribution Arrangements—the Retail Classes Only |
The Fund has entered into a Distribution Services Agreement (the “Agreement”) with AllianceBernstein Investments, Inc., (the “Retail Distributor”), to permit the Retail Distributor to distribute the Portfolios’ Advisor Class and Class Z shares, as applicable, and to permit the Fund to pay distribution services fees to defray expenses associated with the distribution of the Portfolios’ Class A and Class C shares in accordance with a plan of distribution which is included in the Agreement and which has been duly adopted and approved in accordance with Rule 12b-1 under the under the Investment Company Act of 1940 (the “Rule 12b-1 Plan”). Advisor Class shares and Class Z shares are not subject to Rule 12b-1 asset-based sales charges.
| E. | | Investments in Affiliated Issuers |
The Portfolios may invest in AB Government Money Market Portfolio (the “Government Money Market Portfolio”), advised by the Adviser, which has a contractual annual advisory fee rate of .20% of the portfolio’s average daily net assets and bears its own expenses. The Adviser had contractually agreed to waive .10% of the advisory fee of Government Money Market Portfolio (resulting in a net advisory fee of .10%) until August 31, 2023. Effective September 1, 2023, the Adviser has contractually agreed to waive .05% of the advisory fee of Government Money Market Portfolio (resulting in a net advisory fee of .15%) until August 31, 2024. In connection with the investment by the Portfolios in Government Money Market Portfolio, the Adviser has contractually agreed to waive its advisory fee from the Portfolios in an amount equal to each Portfolio’s pro rata share of the effective advisory fee of Government Money Market Portfolio, as borne indirectly by the Portfolios as an acquired fund fee and expense.
Notes to Financial Statements (continued)
For the year ended September 30, 2024, such waivers amounted to:
| | | | |
| PORTFOLIO | | AMOUNT | |
Small Cap Core | | $ | 7,855 | |
| |
International Small Cap | | | 24,349 | |
| |
International Strategic Equities | | | 135,150 | |
A summary of the Portfolios’ transactions in shares of the Government Money Market Portfolio for the year ended September 30, 2024 is as follows:
| | | | | | | | | | | | | | | | | | | | |
| PORTFOLIO | | MARKET VALUE 9/30/23 (000) | | | PURCHASES AT COST (000) | | | SALES PROCEEDS (000) | | | MARKET VALUE 9/30/24 (000) | | | DIVIDEND INCOME (000) | |
Small Cap Core | | $ | 0 | | | $ | 158,202 | | | $ | 152,890 | | | $ | 5,312 | | | $ | 269 | |
| | | | | |
International Small Cap | | | 7,580 | | | | 206,863 | | | | 188,448 | | | | 25,995 | | | | 907 | |
| | | | | |
International Strategic Equities | | | 80,789 | | | | 1,875,623 | | | | 1,847,905 | | | | 108,507 | | | | 5,027 | |
In connection with the election of a new Board of Directors by shareholders effective January 1, 2025, the Portfolios have adopted a retirement plan for certain independent Directors who will retire prior to their initial anticipated retirement date. These Directors will receive a one-time retirement benefit payable from the Portfolios and certain other funds overseen by the Directors. The Adviser has agreed to waive its fees from the Portfolios and certain other funds overseen by the Directors for the cost of such benefit, which is included in Receivable due from Adviser and Directors’ fees payable on the statement of assets and liabilities, and is expected to be paid prior to December 31, 2024.
| NOTE 3. | Investment Security Transactions |
For the year ended September 30, 2024, the Portfolios had purchases and sales transactions, excluding transactions in short-term instruments, as follows:
| | | | | | | | | | | | | | | | |
| PORTFOLIO | | PURCHASES EXCLUDING U.S. GOVERNMENT SECURITIES | | | PURCHASES OF U.S. GOVERNMENT SECURITIES | | | SALES EXCLUDING U.S. GOVERNMENT SECURITIES | | | SALES OF U.S. GOVERNMENT SECURITIES | |
Small Cap Core | | $ | 429,115,576 | | | $ | 0 | | | $ | 473,124,725 | | | $ | 0 | |
| | | | |
International Small Cap | | | 527,622,873 | | | | 0 | | | | 652,793,581 | | | | 0 | |
| | | | |
International Strategic Equities | | | 5,246,107,392 | | | | 0 | | | | 5,724,325,291 | | | | 0 | |
The cost of investments for federal income tax purposes, gross unrealized appreciation and unrealized depreciation are as follows:
| | | | | | | | | | | | | | | | |
| PORTFOLIO | | COST | | | GROSS UNREALIZED | | | NET UNREALIZED
APPRECIATION
(DEPRECIATION) | |
| | APPRECIATION | | | (DEPRECIATION) | |
Small Cap Core | | $ | 585,095,009 | | | $ | 183,498,365 | | | $ | (29,519,462 | ) | | $ | 153,978,903 | |
| | | | |
International Small Cap | | | 954,019,139 | | | | 242,040,958 | | | | (50,649,450 | ) | | | 191,391,508 | |
| | | | |
International Strategic Equities | | | 6,449,518,508 | | | | 1,835,608,603 | | | | (53,088,964 | ) | | | 1,782,519,639 | |
| B. | | Derivative Financial Instruments |
Each Portfolio may use derivatives in an effort to earn income and enhance returns, to replace more traditional direct investments, to obtain exposure to otherwise inaccessible markets (collectively, “investment purposes”), or to hedge or adjust the risk profile of its portfolio.
The principal types of derivatives utilized by the Portfolios, as well as the methods in which they may be used are:
Each Portfolio may buy or sell futures for investment purposes or for the purpose of hedging its portfolio against adverse effects of potential movements in the market. The Portfolios bear the market risk that arises from changes in the value of these instruments and the imperfect correlation between movements in the price of the futures and movements in the price of the assets, reference rates or indices which they are designed to track. Among other things, the Portfolios may purchase or sell futures for foreign currencies or options thereon for non-hedging purposes as a means of making direct investment in foreign currencies, as described below under “Currency Transactions”.
At the time a Portfolio enters into futures, a Portfolio deposits with the broker or segregates at its custodian cash or securities as collateral to satisfy initial margin requirements set by the exchange on which the transaction is effected. Pursuant to the contract, with respect to cash collateral, the Portfolios agree to receive from or pay to the broker an amount of cash equal to the daily fluctuation in the value of the contract; in the case of securities collateral, the Portfolio agrees to adjust the securities position held in the segregated account accordingly. Such receipts, payments or adjustments are known as variation margin and are recorded by the Portfolios as unrealized gains or losses. Risks may arise from the potential inability of a counterparty to meet the terms of the contract. The credit/counterparty risk for exchange-traded futures is generally less than privately negotiated futures, since the clearinghouse, which is the issuer or counterparty to each exchange-traded future, has robust risk mitigation standards, including the requirement to provide initial and variation margin. When the contract is closed, the Portfolios record a realized gain or loss equal to the difference between the value of the contract at the time it was opened and the time it was closed.
Use of long futures subjects the Portfolios to risk of loss in excess of the amounts shown on the statement of assets and liabilities, up to the notional value of the futures. Use of short futures subjects the Portfolios to unlimited risk of loss. Each Portfolio may enter into futures only on exchanges or boards of trade. The exchange or board of trade acts as the counterparty to each futures transactions; therefore, the Portfolios’ credit risk is subject to failure of the exchange or board of trade. Under some circumstances, futures exchanges may establish daily limits on the amount that the price of futures can vary from the previous day’s settlement price, which could effectively prevent liquidation of unfavorable positions.
During the year ended September 30, 2024, the Small Cap Core Portfolio held futures for hedging purposes.
| | • | | Forward Currency Exchange Contracts |
Each Portfolio may enter into forward currency exchange contracts on either a spot (i.e., cash) or forward basis. Spot contracts are entered into at the rate then prevailing in the currency-exchange market. Forward currency exchange contracts obligate the contracting parties to purchase or sell a specific currency at a specified future date at a specified price. The Portfolios will generally not enter into a forward currency exchange contract with a term greater than one year. The gain or loss arising from the difference between the original contract and the closing of such contract would be included in net realized gain or loss on foreign currency exchange contracts. Fluctuations in the value of open forward currency exchange contracts are recorded for financial reporting purposes as unrealized appreciation and/or depreciation by the Portfolio. Risks may arise from the potential inability of a counterparty to meet the terms of a contract and from unanticipated movements in the value of a foreign currency relative to the U.S. dollar.
Forward currency exchange contracts used to protect the Portfolios from adverse currency movements involve the risk that the Adviser may not accurately predict currency movements. As a result, total return could be adversely affected. The Adviser may seek investment opportunities by taking long or short positions in currencies through the use of currency-related derivatives, including forward currency exchange contracts, futures and options on futures, swaps and other options. The Adviser may enter into foreign currency transactions for investment opportunities when it anticipates that a foreign currency will appreciate or depreciate in value.
Under certain circumstances, the Portfolios may commit a substantial portion or the entire value of the Portfolios to the consummation of these contracts. The Adviser will consider the effect that a substantial commitment of assets to forward currency exchange contracts would have on the investment program of the Portfolios and the flexibility of the Portfolios to purchase additional securities.
During the year ended September 30, 2024, the International Small Cap Portfolio and International Strategic Equities Portfolio held forward currency exchange contracts for hedging purposes.
Notes to Financial Statements (continued)
A Portfolio typically enters into International Swaps and Derivatives Association, Inc. Master Agreements (“ISDA Master Agreement”) with its OTC derivative contract counterparties in order to, among other things, reduce its credit risk to OTC counterparties. ISDA Master Agreements include provisions for general obligations, representations, collateral and events of default or termination. Under an ISDA Master Agreement, a Portfolio typically may offset with the OTC counterparty certain derivative financial instruments’ payables and/or receivables with collateral held and/or posted and create one single net payment (close-out netting) in the event of default or termination. In the event of a default by an OTC counterparty, the return of collateral with market value in excess of a Portfolio’s net liability, held by the defaulting party, may be delayed or denied.
A Portfolio’s ISDA Master Agreements may contain provisions for early termination of OTC derivative transactions in the event the net assets of a Portfolio decline below specific levels (“net asset contingent features”). If these levels are triggered, a Portfolio’s OTC counterparty has the right to terminate such transaction and require the Portfolio to pay or receive a settlement amount in connection with the terminated transaction. If OTC derivatives were held at period end, please refer to netting arrangements by the OTC counterparty tables below for additional details.
During the year ended September 30, 2024, the Portfolios had entered into the following derivatives:
| | | | | | | | | | | | |
| SMALL CAP CORE PORTFOLIO | | ASSET DERIVATIVES | | | LIABILITY DERIVATIVES | | | |
| DERIVATIVE TYPE | | STATEMENT OF ASSETS
AND LIABILITIES
LOCATION | | FAIR VALUE | | | STATEMENT OF ASSETS
AND LIABILITIES LOCATION | | FAIR VALUE | |
| | | | |
Equity contracts | | Receivable for variation margin on futures | | $ | 768,136 | * | | | | | | |
| | | | |
Total | | | | $ | 768,136 | | | | | | | |
| | * | Only variation margin receivable/payable at period end is reported within the statement of assets and liabilities. This amount reflects cumulative unrealized appreciation (depreciation) on futures and centrally cleared swaps as reported in the schedule of investments. |
| | | | | | | | | | |
| DERIVATIVE TYPE | | LOCATION OF GAIN OR (LOSS) ON
DERIVATIVES WITHIN STATEMENT
OF OPERATIONS | | REALIZED GAIN
OR (LOSS) ON
DERIVATIVES | | | CHANGE IN UNREALIZED
APPRECIATION OR
(DEPRECIATION) | |
| | | |
Equity contracts | | Net realized gain (loss) on futures; Net change in unrealized appreciation (depreciation) of futures | | $ | 4,875,984 | | | $ | 1,508,344 | |
| | | |
Total | | | | $ | 4,875,984 | | | $ | 1,508,344 | |
| | | | | | | | | | | | |
INTERNATIONAL SMALL
CAP PORTFOLIO | | ASSET DERIVATIVES | | | LIABILITY DERIVATIVES | |
| DERIVATIVE TYPE | | STATEMENT OF ASSETS
AND LIABILITIES
LOCATION | | FAIR VALUE | | | STATEMENT OF ASSETS
AND LIABILITIES LOCATION | | FAIR VALUE | |
| | | | |
Foreign currency contracts | | Unrealized appreciation on forward currency exchange contracts | | $ | 2,792,116 | | | Unrealized depreciation on forward currency exchange contracts | | $ | 4,307,603 | |
| | | | |
Total | | | | $ | 2,792,116 | | | | | $ | 4,307,603 | |
| | | | | | | | | | |
| DERIVATIVE TYPE | | LOCATION OF GAIN OR (LOSS) ON
DERIVATIVES WITHIN STATEMENT
OF OPERATIONS | | REALIZED GAIN
OR (LOSS) ON
DERIVATIVES | | | CHANGE IN UNREALIZED
APPRECIATION OR
(DEPRECIATION) | |
| | | |
Foreign currency contracts | | Net realized gain (loss) on forward currency exchange contracts; Net change in unrealized appreciation (depreciation) of forward currency exchange contracts | | $ | 6,226,677 | | | $ | (3,014,182 | ) |
| | | |
Total | | | | $ | 6,226,677 | | | $ | (3,014,182 | ) |
| | | | | | | | | | | | |
INTERNATIONAL STRATEGIC
EQUITIES PORTFOLIO | | ASSET DERIVATIVES | | | LIABILITY DERIVATIVES | |
| DERIVATIVE TYPE | | STATEMENT OF ASSETS
AND LIABILITIES
LOCATION | | FAIR VALUE | | | STATEMENT OF ASSETS
AND LIABILITIES LOCATION | | FAIR VALUE | |
| | | | |
Foreign currency contracts | | Unrealized appreciation on forward currency exchange contracts | | $ | 37,346,953 | | | Unrealized depreciation on forward currency exchange contracts | | $ | 46,098,545 | |
| | | | |
Total | | | | $ | 37,346,953 | | | | | $ | 46,098,545 | |
| | | | | | | | | | | | |
| DERIVATIVE TYPE | | LOCATION OF GAIN OR (LOSS) ON
DERIVATIVES WITHIN STATEMENT
OF OPERATIONS | | REALIZED GAIN
OR (LOSS) ON
DERIVATIVES | | | CHANGE IN UNREALIZED
APPRECIATION OR
(DEPRECIATION) | |
| | | |
Foreign currency contracts | | Net realized gain (loss) on forward currency exchange contracts; Net change in unrealized appreciation (depreciation) of forward currency exchange contracts | | $ | 122,041,898 | | | $ | (95,601,326 | ) |
| | | |
Total | | | | $ | 122,041,898 | | | $ | (95,601,326 | ) |
The following tables represent the average monthly volume of the Portfolios’ derivative transactions during the year ended September 30, 2024:
| | | | |
| SMALL CAP CORE PORTFOLIO | | | |
Futures: | | | | |
| |
Average notional amount of buy contracts | | $ | 33,382,160 | |
| | | | |
| INTERNATIONAL SMALL CAP PORTFOLIO | | | |
Forward Currency Exchange Contracts: | | | | |
| |
Average principal amount of buy contracts | | $ | 186,114,344 | |
| |
Average principal amount of sale contracts | | $ | 202,917,495 | |
| | | | |
| INTERNATIONAL STRATEGIC EQUITIES PORTFOLIO | | | |
Forward Currency Exchange Contracts: | | | | |
| |
Average principal amount of buy contracts | | $ | 3,010,532,537 | |
| |
Average principal amount of sale contracts | | $ | 3,016,578,057 | |
For financial reporting purposes, the Portfolios do not offset derivative assets and derivative liabilities that are subject to netting arrangements in the statement of assets and liabilities.
All OTC derivatives held at period end were subject to netting arrangements. The following tables present the Portfolios’ derivative assets and liabilities by OTC counterparty net of amounts available for offset under ISDA Master Agreements (“MA”) and net of the related collateral received/pledged by the Portfolios as of September 30, 2024. Exchange-traded derivatives and centrally cleared swaps are not subject to netting arrangements and as such are excluded from the tables.
Notes to Financial Statements (continued)
| | | | | | | | | | | | | | | | | | | | |
| BERNSTEIN INTERNATIONAL SMALL CAP PORTFOLIO | |
| COUNTERPARTY | | DERIVATIVE
ASSETS SUBJECT
TO A MA | | | DERIVATIVES
AVAILABLE FOR
OFFSET | | | CASH
COLLATERAL
RECEIVED* | | | SECURITY
COLLATERAL
RECEIVED* | | | NET AMOUNT OF
DERIVATIVE
ASSETS | |
| | | | | |
Australia and New Zealand Banking Group Ltd. | | $ | 17,680 | | | $ | 0 | | | $ | 0 | | | $ | 0 | | | $ | 17,680 | |
| | | | | |
Bank of America, NA | | | 854,321 | | | | (854,321 | ) | | | 0 | | | | 0 | | | | 0 | |
| | | | | |
Barclays Bank PLC | | | 326,267 | | | | (326,267 | ) | | | 0 | | | | 0 | | | | 0 | |
| | | | | |
BNP Paribas SA | | | 88,045 | | | | (88,045 | ) | | | 0 | | | | 0 | | | | 0 | |
| | | | | |
Citibank, NA | | | 228,404 | | | | (228,404 | ) | | | 0 | | | | 0 | | | | 0 | |
| | | | | |
Goldman Sachs Bank USA | | | 69,532 | | | | (69,532 | ) | | | 0 | | | | 0 | | | | 0 | |
| | | | | |
HSBC Bank USA | | | 91,158 | | | | (91,158 | ) | | | 0 | | | | 0 | | | | 0 | |
| | | | | |
JPMorgan Chase Bank, NA | | | 43,417 | | | | (43,417 | ) | | | 0 | | | | 0 | | | | 0 | |
| | | | | |
Morgan Stanley Capital Services, Inc. | | | 980,405 | | | | (358,722 | ) | | | 0 | | | | 0 | | | | 621,683 | |
| | | | | |
State Street Bank & Trust Co. | | | 52,107 | | | | (10,757 | ) | | | 0 | | | | 0 | | | | 41,350 | |
| | | | | |
UBS AG | | | 40,780 | | | | (40,780 | ) | | | 0 | | | | 0 | | | | 0 | |
| | | | | |
Total | | $ | 2,792,116 | | | $ | (2,111,403 | ) | | $ | 0 | | | $ | 0 | | | $ | 680,713 | ^ |
| | | | | |
| COUNTERPARTY | | DERIVATIVE
LIABILITIES SUBJECT
TO A MA | | | DERIVATIVES
AVAILABLE FOR
OFFSET | | | CASH
COLLATERAL
PLEDGED* | | | SECURITY
COLLATERAL
PLEDGED* | | | NET AMOUNT OF
DERIVATIVE
LIABILITIES | |
| | | | | |
Bank of America, NA | | $ | 1,238,057 | | | $ | (854,321 | ) | | $ | 0 | | | $ | 0 | | | $ | 383,736 | |
| | | | | |
Barclays Bank PLC | | | 1,099,812 | | | | (326,267 | ) | | | (667,000 | ) | | | 0 | | | | 106,545 | |
| | | | | |
BNP Paribas SA | | | 106,294 | | | | (88,045 | ) | | | 0 | | | | 0 | | | | 18,249 | |
| | | | | |
Citibank, NA | | | 295,495 | | | | (228,404 | ) | | | 0 | | | | 0 | | | | 67,091 | |
| | | | | |
Goldman Sachs Bank USA | | | 133,016 | | | | (69,532 | ) | | | 0 | | | | 0 | | | | 63,484 | |
| | | | | |
HSBC Bank USA | | | 110,597 | | | | (91,158 | ) | | | 0 | | | | 0 | | | | 19,439 | |
| | | | | |
JPMorgan Chase Bank, NA | | | 612,007 | | | | (43,417 | ) | | | 0 | | | | 0 | | | | 568,590 | |
| | | | | |
Morgan Stanley Capital Services, Inc. | | | 358,722 | | | | (358,722 | ) | | | 0 | | | | 0 | | | | 0 | |
| | | | | |
Standard Chartered Bank | | | 250,324 | | | | 0 | | | | 0 | | | | 0 | | | | 250,324 | |
| | | | | |
State Street Bank & Trust Co. | | | 10,757 | | | | (10,757 | ) | | | 0 | | | | 0 | | | | 0 | |
| | | | | |
UBS AG | | | 92,522 | | | | (40,780 | ) | | | 0 | | | | 0 | | | | 51,742 | |
| | | | | |
Total | | $ | 4,307,603 | | | $ | (2,111,403 | ) | | $ | (667,000 | ) | | $ | 0 | | | $ | 1,529,200 | ^ |
| | * | The actual collateral received/pledged may be more than the amount reported due to over-collateralization. |
| | ^ | Net amount represents the net receivable/payable that would be due from/to the counterparty in the event of default or termination. The net amount from OTC financial derivative instruments can only be netted across transactions governed under the same master agreement with the same counterparty. |
| | | | | | | | | | | | | | | | | | | | |
| INTERNATIONAL STRATEGIC EQUITIES PORTFOLIO | |
| COUNTERPARTY | | DERIVATIVE
ASSETS SUBJECT
TO A MA | | | DERIVATIVES
AVAILABLE FOR
OFFSET | | | CASH
COLLATERAL
RECEIVED* | | | SECURITY
COLLATERAL
RECEIVED* | | | NET AMOUNT OF
DERIVATIVE
ASSETS | |
| | | | | |
Bank of America, NA | | $ | 1,431,217 | | | $ | (1,431,217 | ) | | $ | 0 | | | $ | 0 | | | $ | 0 | |
| | | | | |
Barclays Bank PLC | | | 2,926,896 | | | | (2,811,143 | ) | | | (115,753 | ) | | | 0 | | | | 0 | |
| | | | | |
BNP Paribas SA | | | 5,137,014 | | | | 0 | | | | (390,000 | ) | | | 0 | | | | 4,747,014 | |
| | | | | |
Citibank, NA | | | 2,673,565 | | | | (2,673,565 | ) | | | 0 | | | | 0 | | | | 0 | |
| | | | | |
Goldman Sachs Bank USA | | | 515,193 | | | | (328,231 | ) | | | 0 | | | | 0 | | | | 186,962 | |
| | | | | |
HSBC Bank USA | | | 3,230,459 | | | | (3,230,459 | ) | | | 0 | | | | 0 | | | | 0 | |
| | | | | |
JPMorgan Chase Bank, NA | | | 2,213,448 | | | | (2,213,448 | ) | | | 0 | | | | 0 | | | | 0 | |
| | | | | |
Morgan Stanley Capital Services, Inc. | | | 4,467,700 | | | | (4,467,700 | ) | | | 0 | | | | 0 | | | | 0 | |
| | | | | |
NatWest Markets PLC | | | 99,463 | | | | (8,966 | ) | | | 0 | | | | 0 | | | | 90,497 | |
| | | | | |
Societe Generale | | | 235,030 | | | | 0 | | | | 0 | | | | 0 | | | | 235,030 | |
| | | | | |
Standard Chartered Bank | | | 6,656,404 | | | | 0 | | | | 0 | | | | 0 | | | | 6,656,404 | |
| | | | | |
State Street Bank & Trust Co. | | | 5,999,592 | | | | (540,777 | ) | | | 0 | | | | (4,406,770 | ) | | | 1,052,045 | |
| | | | | |
UBS AG | | | 1,760,972 | | | | (562,662 | ) | | | (600,000 | ) | | | 0 | | | | 598,310 | |
| | | | | |
Total | | $ | 37,346,953 | | | $ | (18,268,168 | ) | | $ | (1,105,753 | ) | | $ | (4,406,770 | ) | | $ | 13,566,262 | ^ |
| | | | | |
| COUNTERPARTY | | DERIVATIVE
LIABILITIES SUBJECT
TO A MA | | | DERIVATIVES
AVAILABLE FOR
OFFSET | | | CASH
COLLATERAL
PLEDGED* | | | SECURITY
COLLATERAL
PLEDGED* | | | NET AMOUNT OF
DERIVATIVE
LIABILITIES | |
| | | | | |
Bank of America, NA | | $ | 1,637,433 | | | $ | (1,431,217 | ) | | $ | 0 | | | $ | 0 | | | $ | 206,216 | |
| | | | | |
Barclays Bank PLC | | | 2,811,143 | | | | (2,811,143 | ) | | | 0 | | | | 0 | | | | 0 | |
| | | | | |
Citibank, NA | | | 4,003,350 | | | | (2,673,565 | ) | | | (755,000 | ) | | | 0 | | | | 574,785 | |
| | | | | |
Deutsche Bank AG | | | 262,351 | | | | 0 | | | | 0 | | | | 0 | | | | 262,351 | |
| | | | | |
Goldman Sachs Bank USA | | | 328,231 | | | | (328,231 | ) | | | 0 | | | | 0 | | | | 0 | |
| | | | | |
HSBC Bank USA | | | 5,239,645 | | | | (3,230,459 | ) | | | 0 | | | | 0 | | | | 2,009,186 | |
| | | | | |
JPMorgan Chase Bank, NA | | | 15,238,199 | | | | (2,213,448 | ) | | | 0 | | | | 0 | | | | 13,024,751 | |
| | | | | |
Morgan Stanley Capital Services, Inc. | | | 15,465,788 | | | | (4,467,700 | ) | | | (10,998,088 | ) | | | 0 | | | | 0 | |
| | | | | |
NatWest Markets PLC | | | 8,966 | | | | (8,966 | ) | | | 0 | | | | 0 | | | | 0 | |
| | | | | |
State Street Bank & Trust Co. | | | 540,777 | | | | (540,777 | ) | | | 0 | | | | 0 | | | | 0 | |
| | | | | |
UBS AG | | | 562,662 | | | | (562,662 | ) | | | 0 | | | | 0 | | | | 0 | |
| | | | | |
Total | | $ | 46,098,545 | | | $ | (18,268,168 | ) | | $ | (11,753,088 | ) | | $ | 0 | | | $ | 16,077,289 | ^ |
| | * | The actual collateral received/pledged may be more than the amount reported due to over-collateralization. |
| | ^ | Net amount represents the net receivable/payable that would be due from/to the counterparty in the event of default or termination. The net amount from OTC financial derivative instruments can only be netted across transactions governed under the same master agreement with the same counterparty. |
The Portfolios may invest in non-U.S. Dollar-denominated securities on a currency hedged or unhedged basis. The Portfolios may seek investment opportunities by taking long or short positions in currencies through the use of currency-related derivatives, including forward currency exchange contracts, futures and options on futures, swaps, and other options. The Portfolios may enter into transactions for investment opportunities when it anticipates that a foreign currency will appreciate or depreciate in value but securities denominated in that currency are not held by the Portfolios and do not present attractive investment opportunities. Such transactions may also be used when the Adviser believes that it may be
Notes to Financial Statements (continued)
more efficient than a direct investment in a foreign currency-denominated security. The Portfolios may also conduct currency exchange contracts on a spot basis (i.e., for cash at the spot rate prevailing in the currency exchange market for buying or selling currencies).
| NOTE 4. | Distributions to Shareholders |
The tax character of distributions paid during the fiscal years ended September 30, 2024 and September 30, 2023 were as follows:
| | | | | | | | |
| PORTFOLIO | | 2024 | | | 2023 | |
Small Cap Core | | | | | | | | |
| | |
Distributions paid from: | | | | | | | | |
| | |
Ordinary income | | $ | 4,818,683 | | | $ | 3,283,811 | |
| | |
Long-term capital gains | | | 51,507,201 | | | | 48,515,330 | |
| | | | | | | | |
| | |
Total distributions paid | | $ | 56,325,884 | | | $ | 51,799,141 | |
| | | | | | | | |
| | | | | | | | |
International Small Cap | | | | | | | | |
| | |
Distributions paid from: | | | | | | | | |
| | |
Ordinary income | | $ | 32,069,958 | | | $ | 11,869,244 | |
| | |
Long-term capital gains | | | 0 | | | | 0 | |
| | | | | | | | |
| | |
Total distributions paid | | $ | 32,069,958 | | | $ | 11,869,244 | |
| | | | | | | | |
| | | | | | | | |
International Strategic Equities | | | | | | | | |
| | |
Distributions paid from: | | | | | | | | |
| | |
Ordinary income | | $ | 228,105,256 | | | $ | 284,518,492 | |
| | |
Long-term capital gains | | | 0 | | | | 0 | |
| | | | | | | | |
| | |
Total distributions paid | | $ | 228,105,256 | | | $ | 284,518,492 | |
| | | | | | | | |
| | | | | | | | | |
As of September 30, 2024, the components of accumulated earnings/(deficit) on a tax basis were as follows:
| | | | | | | | | | | | | | | | | | | | |
| PORTFOLIO | | UNDISTRIBUTED
ORDINARY
INCOME | | | UNDISTRIBUTED
LONG-TERM
GAINS | | | ACCUMULATED
CAPITAL AND
OTHER
LOSSES(a) | | | UNREALIZED
APPRECIATION/
(DEPRECIATION)(b) | | | TOTAL
ACCUMULATED
EARNINGS/
(DEFICIT) | |
Small Cap Core | | $ | 13,401,264 | | | $ | 68,049,163 | | | $ | 0 | | | $ | 153,978,903 | | | $ | 235,429,330 | |
| | | | | |
International Small Cap | | | 27,823,860 | | | | 0 | | | | (9,292,429 | ) | | | 187,361,674 | | | | 205,893,105 | |
| | | | | |
International Strategic Equities | | | 184,529,203 | | | | 0 | | | | (554,211,894 | ) | | | 1,780,863,144 | | | | 1,411,180,453 | |
| | (a) | As of September 30, 2024 certain Portfolios had capital loss carryforwards for federal income tax purposes. As of September 30, 2024 International Small Cap Portfolio, and International Strategic Equities Portfolio utilized capital loss carryforwards of $55,787,472, and $342,754,850, respectively. |
| | (b) | The differences between book-basis and tax-basis unrealized appreciation/(depreciation) are attributable primarily to the tax deferral of losses on wash sales, the tax treatment of passive foreign investment companies (PFICs), and the realization for tax purposes of gains/losses on certain derivative instruments. |
Under current tax rules, regulated investment companies can elect to treat certain late-year ordinary losses incurred and post-October capital losses (capital losses realized after October 31) as arising on the first day of the following taxable year.
For tax purposes, net capital losses may be carried over to offset future capital gains, if any. Portfolios are permitted to carry forward capital losses for an indefinite period, and such losses will retain their character as either short-term or long-term capital losses.
As of September 30, 2024, the following Portfolios had net capital loss carryforwards as follows:
| | | | | | | | |
| PORTFOLIO | | SHORT-TERM
AMOUNT | | | LONG-TERM
AMOUNT | |
Small Cap Core | | $ | 0 | | | $ | 0 | |
| | |
International Small Cap | | | 9,292,429 | | | | 0 | |
| | |
International Strategic Equities | | | 554,211,894 | | | | 0 | |
| NOTE 5. | Risks Involved in Investing in the Portfolios |
Foreign (Non-U.S.) Securities Risk—Investments in foreign securities entail significant risks in addition to those customarily associated with investing in U.S. securities, such as less liquid, less transparent, less regulated and more volatile markets. These risks include risks related to unfavorable or unsuccessful government actions, reduction of government or central bank support, economic sanctions and potential responses to those sanctions, inadequate accounting standards and auditing and financial recordkeeping requirements, lack of information, social instability, armed conflict, and other adverse market, economic, political and regulatory factors, all of which could disrupt the financial markets in which the Portfolios invest and adversely affect the value of the Portfolios’ assets.
Country Concentration Risk—The Portfolios may not always be diversified among countries or regions and the effect on the share price of the Portfolios of specific risks such as political, regulatory and currency may be magnified due to concentration of the Portfolios’ investments in a particular country or region.
Sector Risk—The Portfolios may have more risk because of concentrated investments in a particular market sector, such as the financials, consumer discretionary, information technology or industrials sector. Market or economic factors affecting that sector could have a major effect on the value of the Portfolios’ investments.
Emerging-Markets Securities Risk—The risks of investing in foreign (non-U.S.) securities are heightened with respect to issuers in emerging-market countries because the markets are less developed and less liquid and there may be a greater amount of economic, political and social uncertainty, and these risks are even more pronounced in “frontier” markets, which are investable markets with lower total market capitalization and liquidity than the more developed emerging markets. Emerging markets typically have fewer medical and economic resources than more developed countries, and thus they may be less able to control or mitigate the effects of a pandemic, climate change, or a natural disaster. In addition, the value of the Portfolios’ investments may decline because of factors such as unfavorable or unsuccessful government actions and reduction of government or central bank support.
Foreign Currency Risk—This is the risk that changes in foreign (non-U.S.) currency exchange rates may negatively affect the value of the Portfolios’ investments or reduce the returns of the Portfolios. For example, the value of the Portfolios’ investments in foreign securities and foreign currency positions may decrease if the U.S. Dollar is strong (i.e., gaining value relative to other currencies) and other currencies are weak (i.e., losing value relative to the U.S. Dollar).
Actions by a Few Major Investors—In certain countries, volatility may be heightened by actions of a few major investors. For example, substantial increases or decreases in cash flows of mutual funds investing in these markets could significantly affect local stock prices and, therefore, share prices of the Portfolios.
Illiquid Investments Risk—Illiquid investments risk exists when particular investments are difficult or impossible to purchase or sell, possibly preventing the Portfolios from purchasing or selling these securities at an advantageous price. In certain cases, governmental actions could prevent sales of securities or repatriation of proceeds. Illiquid securities may also be difficult to value. If the Portfolios are forced to sell an illiquid asset to meet redemption requests or other cash needs, or to try to limit losses, the Portfolios may be forced to sell at a substantial loss or may not be able to sell at all.
Redemption Risk—The Portfolios may experience heavy redemptions that could cause the Portfolios to liquidate their assets at inopportune times or unfavorable prices or increase or accelerate taxable gains or transaction costs and may negatively affect the Portfolios’ net asset value, or performance, which could cause the value of your investment to decline. Redemption risk is heightened during periods of overall market turmoil.
Notes to Financial Statements (continued)
Market Risk—The Portfolios are subject to market risk, which is the risk that stock prices in general or in particular countries or sectors may decline over short or extended periods. Stock prices may decline in response to adverse changes in the economy or the economic outlook; deterioration in investor sentiment; interest rate, currency and commodity price fluctuations; adverse geopolitical, social or environmental developments; issuer- and sector-specific considerations; public health crises (including the occurrence of a contagious disease or illness) and regional and global conflicts, cybersecurity events; market disruptions caused by tariffs; trade disputes; measures to address budget deficits; downgrading of sovereign debt; sanctions or other government actions; and other factors. In the past decade, financial markets in the United States, Europe and elsewhere have experienced increased volatility, decreased liquidity and heightened uncertainty. These market conditions may recur from time to time and have an adverse impact on various securities markets. Governmental and quasi-governmental authorities and regulators throughout the world have provided significant support to financial markets in response to serious economic disruptions, including, but not limited to, buying stocks, providing direct capital infusions into companies, implementing new monetary programs, dramatically changing interest rates and through other market interventions. Government actions to support the economy and financial markets have resulted in a large expansion of government deficits and debt, the long-term consequences of which are not known. Rates of inflation have recently risen. The Federal Reserve, as well as certain foreign central banks have recently raised interest rates as part of their efforts to address rising inflation, and there is a risk that interest rates will continue to rise. Central bank, government or regulatory actions, including increases or decreases in interest rates, or actions that are inconsistent with such actions by different central banks, governments or regulators, could negatively affect financial markets generally, increase market volatility and reduce the value and liquidity of securities in which the Portfolios invest. From time to time, uncertainty regarding the status of negotiations in the U.S. government to increase the statutory debt ceiling could: increase the risk that the U.S. government may default on payments on certain U.S. government securities; cause the credit rating of the U.S. government to be downgraded or increase volatility in both stock and bond markets; result in higher interest rates; reduce prices of U.S. Treasury securities; and/or increase the costs of certain kinds of debt.
The United States and other countries are periodically involved in disputes over trade and other matters, which may result in tariffs on various categories of goods imported from the other country, restrictions on investment and adverse impacts on affected companies and securities. For example, the current political climate between the United States and China has intensified concerns about protectionist trade policies and a potential trade war between China and the United States. The United States has imposed tariffs and other trade barriers on Chinese exports and placed other restrictions on or barriers to investments in China. Trade disputes, particularly prolonged disputes, may adversely affect the economies of the United States and its trading partners, as well as the companies directly or indirectly affected by the dispute and financial markets generally, and thus may adversely affect the value of the Portfolios’ assets. The United States government has in the recent past acted to prohibit U.S. persons, such as the Portfolios, from owning, and required them to divest, certain Chinese companies designated as related to the Chinese military. There is no assurance that more such companies will not be so designated in the future, which could limit the Portfolios’ opportunities for investment and require the sale of securities at a loss or make them illiquid. Additionally, the Chinese government is involved in a territorial dispute with Taiwan; the risk of a forced unification with Taiwan by the Chinese government may adversely affect securities of Chinese, Taiwan-based and other issuers both in and outside the region. If the political climate between the United States, China and other countries in Asia continues to deteriorate, economies and markets may be adversely affected. Policy and legislative changes in the U.S. and in other countries are affecting many aspects of financial regulation, and these and other events affecting global markets, such as the United Kingdom’s exit from the European Union; potential trade imbalances with China or other countries; or sanctions or other government actions against Russia, other nations, or individuals or companies (or countermeasures taken in response to such sanctions), may contribute to decreased liquidity and increased volatility in the financial markets. The impact of these changes on the markets, and the implications for market participants, may not be fully known for some time.
Economies and financial markets throughout the world are highly interconnected. Economic, financial or political events, trading and tariff arrangements, armed conflict, including Russia’s military invasion of Ukraine and the conflict in Israel, Gaza and surrounding areas, terrorism, natural disasters (including the spread of infectious illness) and other circumstances in one country or region could have profound impacts on global economies or markets. Following Russia’s invasion of Ukraine commencing in February of 2022, the United States, the European Union and other countries instituted numerous sanctions against Russia and Belarus and certain companies and individuals. Russia in turn has taken
a large number of retaliatory actions, some of which effectively froze Russian securities held by U.S. investors (including U.S. funds such as the Portfolios) and investors in other countries viewed as “unfriendly” by Russia, including securities represented by depositary receipts, effectively precluding the Portfolios from buying, selling, receiving or delivering those securities or accessing income received on such securities. Since then, Russian securities held by investors in the U.S. and other jurisdictions viewed as “unfriendly” by Russia have lost all, or nearly all, of their market value, and many other issuers, securities and markets have been adversely affected. The continued disruption of the Russian economy has had severe adverse effects on the region and beyond, including significant negative impacts on the markets for certain securities and commodities, such as oil and natural gas, as well as other sectors. As a result, whether or not the Portfolios invest in securities of issuers located in or with significant exposure to countries experiencing economic and financial difficulties, the value and liquidity of the Portfolios’ investments may be negatively affected.
Capitalization Risk—Investments in small- and mid-capitalization companies may be more volatile than investments in large-capitalization companies. Investments in small- and mid-capitalization companies may have additional risks because these companies may have limited product lines, markets or financial resources. The prices of securities of small-mid-capitalization companies generally are more volatile than those of large- capitalization companies and are more likely to be adversely affected than large- capitalization companies by changes in earnings results and investor expectations or poor economic or market conditions, including those experienced during a recession. Securities of small and mid-capitalization companies may underperform large capitalization companies, may be harder to sell at times or at prices the portfolio managers believe appropriate and may have greater potential for losses.
Allocation Risk—The Portfolios may seek to focus on different investment disciplines or factors at different times as a means to achieve their investment objectives. In the event that the investment disciplines or factors to which the Portfolios have greater exposure perform worse than the investment disciplines or factors with less exposure, the Portfolios’ returns may be negatively affected.
Derivatives Risk—The Portfolios may use derivatives in currency hedging as well as for direct investments to gain access to certain markets, earn income, enhance return and broaden portfolio diversification, which entail greater risk than if used solely for hedging purposes. While hedging can guard against potential risks, there is also a risk that a derivative intended as a hedge may not perform as expected. In addition to other risks such as the credit risk of the counterparty (the party on the other side of the transaction), derivatives involve the risk that changes in the value of the derivative may not correlate with relevant assets, rates or indices. Derivatives may be difficult to price or unwind, and small changes may produce disproportionate losses for the Portfolios. A short position in a derivative instrument involves the risk of a theoretically unlimited increase in the value of the underlying asset, reference rate or index, which could cause the Portfolios to suffer a potentially unlimited loss. Certain derivatives have the potential for unlimited loss, regardless of the size of the initial investment. Assets required to be set aside or posted as margin or collateral for derivatives positions may themselves go down in value, and these collateral and other requirements may limit investment flexibility. Some derivatives involve leverage, which can make the Portfolios more volatile and can compound other risks. Derivatives, especially over-the-counter derivatives, are also subject to counterparty risk, which is the risk that the counterparty on a derivative transaction will be unable or unwilling to honor its contractual obligations to the Portfolios. The U.S. government and certain foreign governments have adopted regulations governing derivatives markets, including mandatory clearing of certain derivatives as well as additional regulations governing margin, reporting and registration requirements. The ultimate impact of the regulations remains unclear. Additional regulation may make derivatives more costly, limit their availability or utility, otherwise adversely affect their performance, or disrupt markets.
Management Risk—The Portfolios are subject to management risk because they are actively- managed investment portfolios. The Adviser will apply its investment techniques and risk analyses in making investment decisions for the Portfolios, but these techniques, analyses and decisions may not work as intended or may not produce the desired results, and may, during certain periods, result in increased volatility for the Portfolios or cause the value of the Portfolios’ shares to go down. In some cases, derivatives and other investment techniques may be unavailable, or the Adviser may determine not to use them, possibly even under market conditions where their use could benefit the Portfolios. Some of these techniques may incorporate, or rely upon, quantitative models, but there is no guarantee that these models will generate accurate forecasts, reduce risk or otherwise perform as expected. In addition, the Adviser may change the Portfolios’ investment strategies or policies from time to time. Those changes may not lead to the results intended by the Adviser and could have an adverse effect on the Adviser and could also have an adverse effect on the value or performance of the Portfolios.
Notes to Financial Statements (continued)
Real Estate Related Securities Risk—Investing in real estate related securities includes, among others, the following risks: possible declines in the value of real estate; risks related to general and local economic conditions, including increases in the rate of inflation; possible lack of availability of mortgage funds; overbuilding; extended vacancies of properties; increases in competition, property taxes and operating expenses; changes in zoning laws; costs resulting from the clean-up of, and liability to third parties for damages resulting from, environmental problems; casualty or condemnation losses; uninsured damages from floods, earthquakes or other natural disasters; limitations on and variations in rents; and changes in interest rates. In addition, global climate change may have an adverse effect on property and security values and may exacerbate the risks of natural disasters. The COVID-19 pandemic has also impacted certain real estate sectors by accelerating the trend towards online shopping and remote-working environments. Investing in REITs involves certain unique risks in addition to those risks associated with investing in the real estate industry in general. Equity REITs may be affected by changes in the value of the underlying property owned by the REITs, while mortgage REITs may be affected by the quality of any credit extended. REITs are dependent upon management skills, are not diversified, and are subject to heavy cash flow dependency, default by borrowers and self-liquidation. Investing in Real Estate Investment Trusts (“REITs”) also involves risks similar to those associated with investing in small-capitalization companies. REITs may have limited financial resources, may trade less frequently and in a limited volume and may be subject to more abrupt or erratic price movements than larger company securities. REIT issuers may also fail to maintain their exemptions from investment company registration or fail to qualify for the “dividends paid deduction” under the Internal Revenue Code of 1986, as amended.
Investment in Other Investment Companies Risk—As with other investments, investments in other investment companies, including other registered funds advised by the Adviser and ETFs, are subject to market and management risk. The market value of the shares of other investment companies and ETFs may differ from their net asset value. In addition, if the Portfolios acquire shares of investment companies, shareholders bear both their proportionate share of expenses in the Portfolios (including management and advisory fees) and, indirectly, the expenses of the investment companies.
Cybersecurity Risk—As the use of the internet and other technologies has become more prevalent in the course of business, the Portfolios have become more susceptible to operational and financial risks associated with cybersecurity. Cybersecurity incidents can result from deliberate attacks such as gaining unauthorized access to digital systems (e.g., through “hacking” or malicious software coding) for purposes of misappropriating assets or sensitive information, corrupting data, or causing operational disruption, or from unintentional events, such as the inadvertent release of confidential information. Cybersecurity failures or breaches of the Portfolios or their service providers or the issuers of securities in which the Portfolios invest have the ability to cause disruptions and impact business operations, potentially resulting in financial losses, the inability of Portfolio shareholders to transact business, violations of applicable privacy and other laws, regulatory fines, penalties, reputational damage, reimbursement or other compensation costs, and/or additional compliance costs. While measures have been developed which are designed to reduce the risks associated with cybersecurity, there is no guarantee that those measures will be effective, particularly since the Portfolios do not control the cybersecurity defenses or plans of their service providers, financial intermediaries and companies in which they invest or with which they do business.
Cybersecurity incidents, both intentional and unintentional, may allow an unauthorized party to gain access to Portfolio or shareholder assets, Portfolio or customer data (including private shareholder information), or proprietary information, or cause a Portfolio, the Adviser, and/or the Portfolios’ service providers (including, but not limited to, fund accountants, custodians, sub-custodians, transfer agents and financial intermediaries) to suffer data breaches, data corruption or lose operational functionality, or prevent Portfolio investors from purchasing, redeeming or exchanging shares or receiving distributions. A Portfolio and the Adviser have limited ability to prevent or mitigate cybersecurity incidents affecting third-party service providers. Cybersecurity incidents may result in financial losses to such Portfolio and its shareholders, and substantial costs may be incurred in order to prevent any future cybersecurity incidents.
Indemnification Risk—In the ordinary course of business, the Portfolios enter into contracts that contain a variety of indemnifications. The Portfolios’ maximum exposure under these arrangements is unknown. However, the Portfolios have not had prior claims or losses pursuant to these indemnification provisions and expect the risk of loss thereunder to be remote. Therefore, the Portfolios have not accrued any liability in connection with these indemnification provisions.
| NOTE 6. | Capital-Share Transactions |
The Fund has authorized 27 billion shares of common stock, par value $0.0001 per share. Each SCB Class, Advisor Class and Class Z of the Portfolios is allocated 1 billion shares. The balance of the authorized shares has been allocated to share classes that are currently not offered.
Share transactions for each Portfolio for the years ended September 30, 2024 and September 30, 2023, were as follows:
| | | | | | | | | | | | | | | | | | | | |
| |
| | | SMALL CAP CORE PORTFOLIO | |
| | | | | | | | | | | | | | | | | | | | |
| | | |
| | | SHARES | | | | | | AMOUNT | |
| | | | | | | | | | | | | | | | | | | | |
| | | YEAR
ENDED
9/30/24 | | | YEAR
ENDED
9/30/23 | | | | | | YEAR
ENDED
9/30/24 | | | YEAR
ENDED
9/30/23 | |
SCB Class Shares | |
| | | | | |
Shares sold | | | 90,346 | | | | 12,604 | | | | | | | $ | 1,144,572 | | | $ | 150,293 | |
| | | | | |
Shares issued to shareholders on reinvestment of dividends and distributions | | | 49,516 | | | | 37,241 | | | | | | | | 572,404 | | | | 435,727 | |
| | | | | |
Shares redeemed | | | (92,244 | ) | | | (90,094 | ) | | | | | | | (1,161,983 | ) | | | (1,107,477 | ) |
| | | | | | | | | | | | | | | | | | | | |
| | | | | |
Net increase (decrease) | | | 47,618 | | | | (40,249 | ) | | | | | | $ | 554,993 | | | $ | (521,457 | ) |
| | | | | | | | | | | | | | | | | | | | |
| | | | | | | | | | | | | | | | | | | | |
Advisor Class Shares | |
| | | | | |
Shares sold | | | 4,806,006 | | | | 4,413,420 | | | | | | | $ | 61,400,568 | | | $ | 53,305,142 | |
| | | | | |
Shares issued to shareholders on reinvestment of dividends and distributions | | | 3,899,998 | | | | 3,109,329 | | | | | | | | 45,239,977 | | | | 36,472,428 | |
| | | | | |
Shares redeemed | | | (7,886,253 | ) | | | (5,716,608 | ) | | | | | | | (99,722,846 | ) | | | (69,627,489 | ) |
| | | | | | | | | | | | | | | | | | | | |
| | | | | |
Net increase | | | 819,751 | | | | 1,806,141 | | | | | | | $ | 6,917,699 | | | $ | 20,150,081 | |
| | | | | | | | | | | | | | | | | | | | |
| | | | | | | | | | | | | | | | | | | | |
Class Z Shares | |
| | | | | |
Shares sold | | | 108,226 | | | | 116,497 | | | | | | | $ | 1,342,000 | | | $ | 1,377,000 | |
| | | | | |
Shares issued to shareholders on reinvestment of dividends and distributions | | | 672,785 | | | | 811,079 | | | | | | | | 7,797,579 | | | | 9,505,845 | |
| | | | | |
Shares redeemed | | | (2,136,647 | ) | | | (3,501,777 | ) | | | | | | | (26,651,135 | ) | | | (41,456,291 | ) |
| | | | | | | | | | | | | | | | | | | | |
| | | | | |
Net decrease | | | (1,355,636 | ) | | | (2,574,201 | ) | | | | | | $ | (17,511,556 | ) | | $ | (30,573,446 | ) |
| | | | | | | | | | | | | | | | | | | | |
Notes to Financial Statements (continued)
| | | | | | | | | | | | | | | | | | | | |
| |
| | | INTERNATIONAL SMALL CAP PORTFOLIO | |
| | | | | | | | | | | | | | | | | | | | |
| | | |
| | | SHARES | | | | | | AMOUNT | |
| | | | | | | | | | | | | | | | | | | | |
| | | YEAR
ENDED
9/30/24 | | | YEAR
ENDED
9/30/23 | | | | | | YEAR
ENDED
9/30/24 | | | YEAR
ENDED
9/30/23 | |
SCB Class Shares | |
| | | | | |
Shares sold | | | 487,931 | | | | 274,814 | | | | | | | $ | 5,627,204 | | | $ | 2,873,948 | |
| | | | | |
Shares issued to shareholders on reinvestment of dividends and distributions | | | 110,631 | | | | 29,013 | | | | | | | | 1,166,056 | | | | 294,487 | |
| | | | | |
Shares redeemed | | | (665,685 | ) | | | (538,205 | ) | | | | | | | (7,611,879 | ) | | | (5,682,229 | ) |
| | | | | | | | | | | | | | | | | | | | |
| | | | | |
Net decrease | | | (67,123 | ) | | | (234,378 | ) | | | | | | $ | (818,619 | ) | | $ | (2,513,794 | ) |
| | | | | | | | | | | | | | | | | | | | |
| | | | | | | | | | | | | | | | | | | | |
Advisor Class Shares | |
| | | | | |
Shares sold | | | 6,494,694 | | | | 10,853,794 | | | | | | | $ | 73,505,317 | | | $ | 115,354,061 | |
| | | | | |
Shares issued to shareholders on reinvestment of dividends and distributions | | | 1,727,680 | | | | 591,756 | | | | | | | | 18,209,750 | | | | 6,006,321 | |
| | | | | |
Shares redeemed | | | (11,096,374 | ) | | | (11,106,167 | ) | | | | | | | (127,046,047 | ) | | | (116,447,213 | ) |
| | | | | | | | | | | | | | | | | | | | |
| | | | | |
Net increase (decrease) | | | (2,874,000 | ) | | | 339,383 | | | | | | | $ | (35,330,980 | ) | | $ | 4,913,169 | |
| | | | | | | | | | | | | | | | | | | | |
| | | | | | | | | | | | | | | | | | | | |
Class Z Shares | |
| | | | | |
Shares sold | | | 1,489,477 | | | | 82,797 | | | | | | | $ | 16,622,570 | | | $ | 900,000 | |
| | | | | |
Shares issued to shareholders on reinvestment of dividends and distributions | | | 606,633 | | | | 359,872 | | | | | | | | 6,387,841 | | | | 3,652,700 | |
| | | | | |
Shares redeemed | | | (8,611,693 | ) | | | (14,740,924 | ) | | | | | | | (95,761,587 | ) | | | (160,120,106 | ) |
| | | | | | | | | | | | | | | | | | | | |
| | | | | |
Net decrease | | | (6,515,583 | ) | | | (14,298,255 | ) | | | | | | $ | (72,751,176 | ) | | $ | (155,567,406 | ) |
| | | | | | | | | | | | | | | | | | | | |
| | | | | | | | | | | | | | | | | | | | |
| |
| | | INTERNATIONAL STRATEGIC EQUITIES PORTFOLIO | |
| | | | | | | | | | | | | | | | | | | | |
| | | |
| | | SHARES | | | | | | AMOUNT | |
| | | | | | | | | | | | | | | | | | | | |
| | | YEAR
ENDED
9/30/24 | | | YEAR
ENDED
9/30/23 | | | | | | YEAR
ENDED
9/30/24 | | | YEAR
ENDED
9/30/23 | |
SCB Class Shares | |
| | | | | |
Shares sold | | | 3,105,392 | | | | 4,021,047 | | | | | | | $ | 39,008,517 | | | $ | 44,546,301 | |
| | | | | |
Shares issued to shareholders on reinvestment of dividends and distributions | | | 718,092 | | | | 849,321 | | | | | | | | 7,884,642 | | | | 8,960,335 | |
| | | | | |
Shares redeemed | | | (4,315,395 | ) | | | (4,915,105 | ) | | | | | | | (53,580,206 | ) | | | (52,889,990 | ) |
| | | | | | | | | | | | | | | | | | | | |
| | | | | |
Net decrease | | | (491,911 | ) | | | (44,737 | ) | | | | | | $ | (6,687,047 | ) | | $ | 616,646 | |
| | | | | | | | | | | | | | | | | | | | |
| | | | | | | | | | | | | | | | | | | | |
Advisor Class Shares | |
| | | | | |
Shares sold | | | 43,486,640 | | | | 78,940,722 | | | | | | | $ | 530,432,577 | | | $ | 872,954,387 | |
| | | | | |
Shares issued to shareholders on reinvestment of dividends and distributions | | | 12,445,632 | | | | 15,155,312 | | | | | | | | 136,777,499 | | | | 159,888,547 | |
| | | | | |
Shares redeemed | | | (66,009,850 | ) | | | (88,834,612 | ) | | | | | | | (808,724,938 | ) | | | (955,059,994 | ) |
| | | | | | | | | | | | | | | | | | | | |
| | | | | |
Net increase (decrease) | | | (10,077,578 | ) | | | 5,261,422 | | | | | | | $ | (141,514,862 | ) | | $ | 77,782,940 | |
| | | | | | | | | | | | | | | | | | | | |
| | | | | | | | | | | | | | | | | | | | |
Class Z Shares | |
| | | | | |
Shares sold | | | 0 | | | | 1,462,052 | | | | | | | $ | 0 | | | $ | 16,547,633 | |
| | | | | |
Shares issued to shareholders on reinvestment of dividends and distributions | | | 3,058,902 | | | | 5,671,482 | | | | | | | | 33,647,920 | | | | 59,947,564 | |
| | | | | |
Shares redeemed | | | (32,089,074 | ) | | | (50,753,206 | ) | | | | | | | (382,109,834 | ) | | | (576,986,550 | ) |
| | | | | | | | | | | | | | | | | | | | |
| | | | | |
Net decrease | | | (29,030,172 | ) | | | (43,619,672 | ) | | | | | | $ | (348,461,914 | ) | | $ | (500,491,353 | ) |
| | | | | | | | | | | | | | | | | | | | |
At September 30, 2024, certain AllianceBerstein mutual funds owned 11%, 14% and 11% of Small Cap Core Portfolio, International Small Cap Portfolio and International Strategic Equities Portfolio, respectively, in aggregate of the Portfolios’ outstanding shares. Significant transactions by such shareholders, if any, may impact the Portfolios’ performance.
| NOTE 7. | Recent Accounting Pronouncements |
In December 2022, the Financial Accounting Standards Board issued an Accounting Standards Update, ASU 2022-06, “Reference Rate Reform (Topic 848)—Deferral of the Sunset Date of Topic 848”. ASU 2022-06 is an amendment to ASU 2020-04, which provided optional guidance to ease the potential accounting burden due to the discontinuation of the LIBOR and other interbank-offered based reference rates and which was effective as of March 12, 2020 through December 31, 2022. ASU 2022-06 extends the effective period through December 31, 2024. Management is currently evaluating the impact, if any, of applying ASU 2022-06.
Management has evaluated subsequent events for possible recognition or disclosure in the financial statements through the date the financial statements are issued. Management has determined that there are no material events that would require disclosure in the Portfolios’ financial statements through this date.
Report of Independent Registered Public Accounting Firm
To the Board of Directors of Bernstein Fund, Inc. and Shareholders of Small Cap Core Portfolio, International Small Cap Portfolio and International Strategic Equities Portfolio
Opinions on the Financial Statements
We have audited the accompanying statements of assets and liabilities, including the schedules of investments, of Small Cap Core Portfolio, International Small Cap Portfolio and International Strategic Equities Portfolio (constituting Bernstein Fund, Inc., hereafter collectively referred to as the “Portfolios”) as of September 30, 2024, the related statements of operations for the year ended September 30, 2024, the statements of changes in net assets for each of the two years in the period ended September 30, 2024, including the related notes, and the financial highlights for each of the five years in the period ended September 30, 2024 (collectively referred to as the “financial statements”). In our opinion, the financial statements present fairly, in all material respects, the financial position of each of the Portfolios as of September 30, 2024, the results of each of their operations for the year then ended, the changes in each of their net assets for each of the two years in the period ended September 30, 2024 and each of the financial highlights for each of the five years in the period ended September 30, 2024 in conformity with accounting principles generally accepted in the United States of America.
Basis for Opinions
These financial statements are the responsibility of the Portfolios’ management. Our responsibility is to express an opinion on the Portfolios’ financial statements based on our audits. We are a public accounting firm registered with the Public Company Accounting Oversight Board (United States) (PCAOB) and are required to be independent with respect to the Portfolios in accordance with the U.S. federal securities laws and the applicable rules and regulations of the Securities and Exchange Commission and the PCAOB.
We conducted our audits of these financial statements in accordance with the standards of the PCAOB. Those standards require that we plan and perform the audit to obtain reasonable assurance about whether the financial statements are free of material misstatement, whether due to error or fraud.
Our audits included performing procedures to assess the risks of material misstatement of the financial statements, whether due to error or fraud, and performing procedures that respond to those risks. Such procedures included examining, on a test basis, evidence regarding the amounts and disclosures in the financial statements. Our audits also included evaluating the accounting principles used and significant estimates made by management, as well as evaluating the overall presentation of the financial statements. Our procedures included confirmation of securities owned as of September 30, 2024 by correspondence with the custodian, transfer agent and brokers; when replies were not received from brokers, we performed other auditing procedures. We believe that our audits provide a reasonable basis for our opinions.
/s/ PricewaterhouseCoopers LLP
New York, New York
November 25, 2024
We have served as the auditor of one or more investment companies in the AB Group of Mutual Funds since at least 1985. We have not been able to determine the specific year we began serving as auditor.
2024 Federal Tax Information (Unaudited)
For Federal income tax purposes, the following information is furnished with respect to the distributions paid by each applicable Portfolio during the taxable year ended September 30, 2024. For corporate shareholders, the following percentages of dividends paid by each Portfolio qualify for the dividends received deduction.
| | | | | | | | |
| PORTFOLIO | | DIVIDENDS RECEIVED
DEDUCTION %
(CORPORATE SHAREHOLDERS) | | | | |
| | |
Small Cap Core | | | 86.63 | % | | | | |
For the taxable year ended September 30, 2024, each Portfolio designates the following amounts as the maximum amount that may be considered qualified dividend income for individual shareholders.
| | | | | | | | |
| PORTFOLIO | | QUALIFIED
DIVIDEND INCOME | | | | |
Small Cap Core | | $ | 4,187,829 | | | | | |
| | |
International Small Cap | | | 30,766,568 | | | | | |
| | |
International Strategic Equities | | | 56,175,007 | | | | | |
Certain Portfolios intend to make an election to pass through foreign taxes paid by the Portfolios to their shareholders. For the taxable year ended September 30, 2024, the maximum amounts of foreign taxes that may be passed through and the foreign source income for information reporting purposes is as follows:
| | | | | | | | |
| PORTFOLIO | | FOREIGN TAXES
TO PASS THROUGH
(CORPORATE SHAREHOLDERS) | | | FOREIGN SOURCE
INCOME
(FOREIGN SHAREHOLDERS) | |
International Small Cap | | $ | 5,945,662 | | | $ | 31,557,107 | |
| | |
International Strategic Equities | | | 25,083,005 | | | | 59,245,545 | |
For the taxable year ended September 30, 2024, the long-term capital gain distribution is as follows:
| | | | | | | | |
| PORTFOLIO | | LONG-TERM CAPITAL
GAIN DISTRIBUTIONS | | | | |
| | |
Small Cap Core | | $ | 51,507,201 | | | | | |
Shareholders should not use the above information to prepare their income tax returns. The information necessary to complete your income tax returns will be included with your Form 1099-DIV which will be sent to you separately in January 2025.
Board Consideration of Investment Management Arrangement
Bernstein Fund, Inc. (the “Fund”) is subject to Section 15 of the Investment Company Act of 1940, as amended. Section 15 provides that any investment advisory agreement with a registered investment company such as the Fund may continue in effect for a period of more than two years from the date of its execution, only so long as such continuance is specifically approved at least annually by the board of directors (or by vote of a majority of the outstanding voting securities of the investment company). Pursuant to this requirement, the Fund’s Board of Directors, all of whom were not interested persons of the Fund (the “Independent Directors”), unanimously approved the continuation of the Investment Management Agreement between the Fund, on behalf of the International Strategic Equities Portfolio, International Small Cap Portfolio, and Small Cap Core Portfolio (each, a “Portfolio” and collectively, the “Portfolios”) of the Fund, and AllianceBernstein L.P. (the “Adviser”) (the “Investment Management Agreement” or the “Agreement”) at a meeting held on October 23-24, 2024.
The following discussion describes the considerations in connection with the Board’s review of the Investment Management Agreement.
In connection with the annual review of the continuation of the Investment Management Agreement, on July 25, 2024, at an in-person meeting, the Board of Directors received a presentation with respect to the 2023 profitability of the Adviser regarding the Fund and the Portfolios. Also, in connection with such annual review, counsel to the Independent Directors sent a letter to the Adviser dated August 12, 2024, that contained a list of additional information requested by the Independent Directors to conduct their annual review. The Independent Directors received and evaluated extensive materials relating to the continuation of the Investment Management Agreement from the Adviser. In addition, the Board received materials from the Senior Vice President of the Fund and an independent fee consultant as described below. On September 19, 2024, the Board of Directors held a video conference meeting to discuss its review of the Investment Management Agreement and the materials the Directors had been provided. At that meeting, the Independent Directors met separately with their independent counsel and the Senior Vice President and their independent fee consultant in executive sessions. Following the September 19, 2024 meeting, the Independent Directors, through counsel, requested certain additional information by means of an email from their counsel dated September 24, 2024, and the Adviser provided certain additional information by means of a memorandum dated October 11, 2024. On October 16, 2024, the Board of Directors held an executive session via video conference with independent counsel and the Senior Vice President to further discuss the additional materials the Directors had been provided. Following the October 16, 2024 conference call, the Independent Directors requested certain additional information by means of an email from their counsel dated October 18, 2024. On October 23-24, 2024, the Board of Directors held an in-person meeting to continue their review of the Investment Management Agreement. During this meeting, the Adviser provided further information requested by the Independent Directors relating to contract renewal, and the Independent Directors also met separately with counsel to the Independent Directors as well as the Senior Vice President to review the contract renewal materials provided by the Adviser and additional materials prepared by the Senior Vice President. At the conclusion of this meeting, the Board approved the continuation of the Investment Management Agreement for an additional annual term as described below.
In approving the Investment Management Agreement, the Board, including the Independent Directors, considered all information it deemed reasonably necessary to evaluate the terms of the Investment Management Agreement and considered whether the Agreement would be in the best interests of the Fund. In particular, the Board considered the information that was provided to them by the Adviser in response to their requests, as well as information prepared by the Senior Vice President and the independent fee consultant at the request of the Board. The Fund’s Senior Vice President assists the Board (as well as the boards of other funds sponsored by the Adviser) in evaluating investment management agreements and certain other plans and agreements pursuant to which the Adviser or its affiliates provide services to the Funds. The Board also considered other information provided to the Board in connection with the July 25, 2024, September 19, 2024 and October 23-24, 2024 meetings and throughout the past year.
The information considered by the Board included information with respect to the nature, extent and quality of services provided, investment performance, fees and expenses, profitability, economies of scale, and fall-out benefits and other revenue.
In the Board’s consideration of the factors discussed below, no single factor was considered in isolation or to be determinative to the decision of the Board to approve the Investment Management Agreement. Rather, the Board concluded, in light of a weighing and balancing of all factors considered and in the exercise of the Directors’ business
judgment, that it was in the best interests of the Fund to approve the Investment Management Agreement including the fees to be charged for services thereunder, as summarized below.
Fees and Expenses
The Board, including the Independent Directors, compared the fees and expense ratios of each Portfolio (before and after any fee waivers and expense reimbursements) against fees and expense ratios of a peer group of funds with similar investment objectives (“peer group”). Both the peer group and the funds within the peer group, with respect to the fee and expense data, were available from ISS Market Intelligence (“ISS”), an independent provider of investment company data. The Board noted that the contractual advisory fees of the International Strategic Equities Portfolio and the Small Cap Core Portfolio were below the median for each Portfolio’s respective peer group, and that the total expense ratio of each of these Portfolios was below the peer group median in the ISS report. The Board also noted that the contractual advisory fee of the International Small Cap Portfolio was above the median and within the fourth quintile of that Portfolio’s peer group and that Portfolio’s total expense ratio was only slightly above the peer group median in the ISS report. The Board considered the Adviser’s explanation that the contractual advisory fee of the International Small Cap Portfolio was reasonable based on the research-intensive nature of the Portfolio and the fact that third party research providers generally do not provide coverage for many international small cap names. The Senior Vice President also performed analyses of the advisory fees, and compared such analyses to the Portfolios’ peer groups. In addition, the Board received and considered information from an independent fee consultant regarding the fees and expenses of the Portfolios as well as their investment performance.
The Board also received and considered information about the services rendered, and the fee rates charged, to other clients advised by the Adviser, including information about any recent advisory fee changes with respect to other investment companies advised by the Adviser. The Board noted the differences between the services provided to the Portfolios in comparison to those provided to other types of clients, including institutional clients and other investment companies for which the Adviser acted as investment adviser or subadviser, and the differences in the entrepreneurial and other risks borne by the Adviser in serving the Portfolios compared to other types of clients.
The Board also considered the fee waivers and/or expense caps applicable to the International Small Cap Portfolio and the Small Cap Core Portfolio, and that, at the request of the Board, the Adviser had agreed to continue a fee waiver applicable to the International Strategic Equities Portfolio for an additional year but noted that, if performance of the Portfolio continues to improve, the Adviser would expect to propose the elimination of the waiver as of May 2025 (in connection with the Board’s review of the advisory agreement).
On the basis of its review and consideration of the fees as described above and the Board’s consideration of the other factors described below, and in light of the Adviser’s agreement to fee waivers and/or expense caps applicable to the Portfolios, the Board concluded that the contractual advisory fees as proposed were reasonable.
Nature, Extent and Quality of Services Provided
The Board, including the Independent Directors, considered the nature, quality and extent of services performed by the Adviser and its affiliates gained from their experience as Directors of the Fund, and their overall confidence in the Adviser’s integrity and competence they have gained from that experience. The Board also considered the Adviser’s responsiveness and attention to concerns raised by the Directors from time to time, including the Adviser’s willingness to consider and implement changes to improve investment results. The Board also considered the scope and quality of the Adviser’s investment management capabilities, other resources dedicated to performing its services, the quality of its compliance, administrative and other services provided to the Portfolios and the background and experience of the Adviser’s senior management. The Board reviewed the qualifications, backgrounds and responsibilities of the investment staff primarily responsible for day-to-day portfolio management services for each Portfolio and noted the Adviser’s research and investment management capabilities. The Board reviewed the compliance and administrative services of the Adviser that support the investment advisory services provided to the Portfolios.
In considering the nature and quality of the services provided by the Adviser, the Board, including the Independent Directors, received and considered information about each Portfolio’s investment performance, as well as the performance of its peer group and the performance of an appropriate benchmark index. The Board was provided with performance data versus each Portfolio’s peer group, for the 1-year, 3-year and 5-year periods ended July 31, 2024 and
Board Consideration of Investment Management Arrangement (continued)
versus each Portfolio’s benchmark index for the 1-year, 3-year, 5-year and since inception for the relevant periods, as well as the most recently available Morningstar rating for the Portfolios. The Board also received certain updated performance information as of September 30, 2024. In addition, the Directors considered information showing performance compared to peer groups and benchmarks for rolling calendar year periods and the year to date. The Directors also receive detailed comparative performance information for the Portfolios at each regular Board meeting during the year. The Board recognized that the benchmark indices do not account for fees and expenses incurred by a fund, including the Portfolios. The Directors also considered how peer groups have changed over time and how comparisons may differ depending upon the selection of the peer groups or benchmark indices.
The Directors noted that each Portfolio had outperformed its benchmark for the one-year period ended July 31, 2024. Where the Portfolios had underperformed their benchmark indices or peer groups for certain periods, the Directors considered the Adviser’s explanations for performance and, as applicable, measures the Adviser had taken or proposed to take to improve performance. In particular, for International Strategic Equities Portfolio, the Board noted that the Adviser had recently appointed an additional portfolio manager, and that performance for the Portfolio for the one-year period ended July 31, 2024, had been in the first quintile in comparison to the Portfolio’s peer group. For the International Small Cap Portfolio, the Board noted that the Portfolio’s recent performance had also improved and was above median of its peer group for the one year period ended July 31, 2024.
The Board concluded that the Adviser had the experience and resources necessary to provide services of appropriate nature, quality and scope with respect to the Portfolios.
Profitability
The Board, including the Independent Directors, considered the level of the Adviser’s profits in respect of its management of the respective Portfolios. The materials provided to the Independent Directors included information indicating the profitability of the Portfolios to the Adviser for calendar years 2022 and 2023. The Directors considered the assessment of an independent consultant that had reviewed the profitability statements for consistency with cost accounting theory and industry standards. The Directors reviewed the assumptions and methods of allocation used by the Adviser in preparing fund-specific profitability data, noting that the methodology was consistent with the Adviser’s internal financial reporting. The Directors acknowledged that there are many potentially acceptable allocation methodologies for cost allocation, and that in certain cases the selected allocation methodology may not capture all costs borne by the Adviser with respect to a Portfolio. The Directors noted that they received information regarding revenues and expenses of the Adviser’s relationship with the Fund, including those relating to the Adviser’s subsidiaries that provide transfer agency and distribution services to the Fund, and that they had focused on profitability before taxes and distribution expenses. The Directors reviewed comparative information regarding profitability for other publicly-traded advisers, recognizing that it is difficult to make comparisons of profitability among different investment advisers because only limited comparative information is publicly available and the comparisons are affected by numerous factors including different business mixes.
After reviewing all relevant factors, the Directors, including the Independent Directors, concluded that the levels of the Adviser’s profits in respect of its management of the Portfolios were not excessive.
Economies of Scale
The Board, including the Independent Directors, considered whether there have been economies of scale in respect of the management of the Portfolios, whether the Portfolios have appropriately benefited from any economies of scale, and whether there is potential for realization of any further economies of scale. The Directors discussed possible ways in which any such economies of scale may be shared with the Portfolios, including by investment in enhanced services.
The Directors also considered the Senior Vice President materials which they received in connection with the review of the Investment Management Agreement, which included information reflecting changes in asset levels of the Portfolios and in the profitability of the Adviser over various periods.
After reviewing the profitability and economies of scale information provided by the Adviser, the Board concluded that the benefits of any economies of scale were appropriately being shared with Portfolio investors by way of, among other things and as applicable, establishing advisory fees at levels that contemplated future achievement of scale, breakpoint
arrangements as currently in effect for the International Strategic Equities Portfolio, the fact that the International Small Cap and Small Cap Core Portfolios are research-intensive and may be capacity-constrained, and expense caps and waivers applying to the Portfolios.
Fall-Out Benefits and Other Revenue
The Board, including the Independent Directors, also took into account so-called “fall-out benefits” to the Adviser, such as soft dollar arrangements (whereby the Adviser receives the benefit of research services from many of the brokers and dealers that execute purchases and sales of securities on behalf of its clients on an agency basis). The Directors recognized that the Adviser’s profitability would be lower without these benefits. They also considered other benefits potentially derived from an increase in the Adviser’s business as a result of its relationship with the Fund. The Directors concluded that these fall-out benefits to the Adviser were acceptable.
Advisory Fee Rate Schedule
On the basis of the information considered, the Board determined to approve the continuation of the Investment Management Agreement for an additional annual term, without change to the Portfolios’ contractual fee schedules, as set forth below.
| | |
| PORTFOLIO | | ANNUAL PERCENTAGE OF AVERAGE
DAILY NEW ASSETS OF EACH PORTFOLIO |
| International Strategic Equities | | 0.75% on the first $2.5 billion; 0.65% in excess of $2.5 billion up to, but not exceeding $5 billion; 0.60% of assets in excess of $5 billion |
| | |
| International Small Cap | | 1.00% of assets. |
| | |
| Small Cap Core | | 0.80% of assets. |

Distributor
BERNSTEIN FUND, INC.
66 HUDSON BOULEVARD EAST NEW YORK, NY 10001
(212) 756-4097
ISCEC-0151-0924
ITEM 8. CHANGES IN AND DISAGREEMENTS WITH ACCOUNTANTS FOR OPEN-END MANAGEMENT INVESTMENT COMPANIES.
There were no disagreements with accountants during the reporting period.
ITEM 9. PROXY DISCLOSURES FOR OPEN-END MANAGEMENT INVESTMENT COMPANIES
International Strategic Equities
At a Special Meeting held on July 18, 2024, shareholders of the International Strategic Equities Portfolio (the “Fund”), a series of Bernstein Fund, Inc., elected Directors in connection with the establishment of a single, unitary board (“Unitary Board”) responsible for overseeing mutual funds, exchange-traded funds and certain closed-end investment companies sponsored and advised by the Adviser. In connection with the establishment of the Unitary Board, Ms. Perry and Messrs. Kristol and Peterson will retire as Directors effective December 31, 2024. Shareholders of the Fund elected six individuals to serve as Directors effective January 1, 2025 (the “Directors-Elect”), who will serve on the Unitary Board with current Directors Messrs. Gerken and Holland. The number of votes cast for, against and withheld, as well as the number of abstentions and broker non-votes with respect to the election of each nominee for office is included below.
| | | | | | | | | | | | | | |
Director: | | Voted For | | | Withheld
Authority | | | Abstained | | | Broker Non-Votes |
Jorge A. Bermudez | | | 299,185,456.118 | | | | 1,657,466.930 | | | | 0 | | | N/A |
Alexander Chaloff | | | 299,149,742.345 | | | | 1,693,180.703 | | | | 0 | | | N/A |
R. Jay Gerken | | | 298,937,057.591 | | | | 1,905,865.457 | | | | 0 | | | N/A |
Jeffrey R. Holland | | | 299,018,706.033 | | | | 1,824,217.015 | | | | 0 | | | N/A |
Jeanette W. Loeb | | | 298,867,291.841 | | | | 1,975,631.207 | | | | 0 | | | N/A |
Carol C. McMullen | | | 299,007,032.784 | | | | 1,835,890.264 | | | | 0 | | | N/A |
Garry L. Moody | | | 299,085,552.451 | | | | 1,757,370.597 | | | | 0 | | | N/A |
Emilie D. Wrapp | | | 299,194,241.610 | | | | 1,648,681.438 | | | | 0 | | | N/A |
International Small Cap
At a Special Meeting held on July 18, 2024, shareholders of the International Small Cap Portfolio (the “Fund”), a series of Bernstein Fund, Inc., elected Directors in connection with the establishment of a single, unitary board (“Unitary Board”) responsible for overseeing mutual funds, exchange-traded funds and certain closed-end investment companies sponsored and advised by the Adviser. In connection with the establishment of the Unitary Board, Ms. Perry and Messrs. Kristol and Peterson will retire as Directors effective December 31, 2024. Shareholders of the Fund elected six individuals to serve as Directors effective January 1, 2025 (the “Directors-Elect”), who will serve on the Unitary Board with current Directors Messrs. Gerken and Holland. The number of votes cast for, against and withheld, as well as the number of abstentions and broker non-votes with respect to the election of each nominee for office is included below.
| | | | | | | | | | | | | | |
Director: | | Voted For | | | Withheld
Authority | | | Abstained | | | Broker Non-Votes |
Jorge A. Bermudez | | | 299,185,456.118 | | | | 1,657,466.930 | | | | 0 | | | N/A |
Alexander Chaloff | | | 299,149,742.345 | | | | 1,693,180.703 | | | | 0 | | | N/A |
R. Jay Gerken | | | 298,937,057.591 | | | | 1,905,865.457 | | | | 0 | | | N/A |
Jeffrey R. Holland | | | 299,018,706.033 | | | | 1,824,217.015 | | | | 0 | | | N/A |
Jeanette W. Loeb | | | 298,867,291.841 | | | | 1,975,631.207 | | | | 0 | | | N/A |
Carol C. McMullen | | | 299,007,032.784 | | | | 1,835,890.264 | | | | 0 | | | N/A |
Garry L. Moody | | | 299,085,552.451 | | | | 1,757,370.597 | | | | 0 | | | N/A |
Emilie D. Wrapp | | | 299,194,241.610 | | | | 1,648,681.438 | | | | 0 | | | N/A |
Small Cap Core
At a Special Meeting held on July 18, 2024, shareholders of the Small Cap Core Portfolio (the “Fund”), a series of Bernstein Fund, Inc., elected Directors in connection with the establishment of a single, unitary board (“Unitary Board”) responsible for overseeing mutual funds, exchange-traded funds and certain closed-end investment companies sponsored and advised by the Adviser. In connection with the establishment of the Unitary Board, Ms. Perry and Messrs. Kristol and Peterson will retire as Directors effective December 31, 2024. Shareholders of the Fund elected six individuals to serve as Directors effective January 1, 2025 (the “Directors-Elect”), who will serve on the Unitary Board with current Directors Messrs. Gerken and Holland. The number of votes cast for, against and withheld, as well as the number of abstentions and broker non-votes with respect to the election of each nominee for office is included below.
| | | | | | | | | | | | | | |
Director: | | Voted For | | | Withheld
Authority | | | Abstained | | | Broker Non-Votes |
Jorge A. Bermudez | | | 299,185,456.118 | | | | 1,657,466.930 | | | | 0 | | | N/A |
Alexander Chaloff | | | 299,149,742.345 | | | | 1,693,180.703 | | | | 0 | | | N/A |
R. Jay Gerken | | | 298,937,057.591 | | | | 1,905,865.457 | | | | 0 | | | N/A |
Jeffrey R. Holland | | | 299,018,706.033 | | | | 1,824,217.015 | | | | 0 | | | N/A |
Jeanette W. Loeb | | | 298,867,291.841 | | | | 1,975,631.207 | | | | 0 | | | N/A |
Carol C. McMullen | | | 299,007,032.784 | | | | 1,835,890.264 | | | | 0 | | | N/A |
Garry L. Moody | | | 299,085,552.451 | | | | 1,757,370.597 | | | | 0 | | | N/A |
Emilie D. Wrapp | | | 299,194,241.610 | | | | 1,648,681.438 | | | | 0 | | | N/A |
ITEM 10. REMUNERATION PAID TO DIRECTORS, OFFICERS, AND OTHERS OF OPEN-END MANAGEMENT INVESTMENT COMPANIES.
Aggregate remuneration paid to all Directors and advisory board members are included within the Financial Statements under Item 7 of this Form N-CSR.
ITEM 11. STATEMENT REGARDING BASIS FOR APPROVAL OF INVESTMENT ADVISORY CONTRACT.
Statement regarding basis for Approval of Investment Advisory Contract included within the Financial Statements under Item 7 of this Form N-CSR.
ITEM 12. DISCLOSURE OF PROXY VOTING POLICIES AND PROCEDURES FOR CLOSED-END MANAGEMENT INVESTMENT COMPANIES.
Not applicable to the registrant.
ITEM 13. PORTFOLIO MANAGERS OF CLOSED END MANAGEMENT INVESTMENT COMPANIES.
Not applicable to the registrant.
ITEM 14. PURCHASES OF EQUITY SECURITIES BY CLOSED-END MANAGEMENT INVESTMENT COMPANY OF AND AFFILIDATED PURCHASERS.
Not applicable to the registrant.
ITEM 15. SUBMISSION OF MATTERS TO A VOTE OF SECURITY HOLDERS.
There have been no material changes to the procedures by which shareholders may recommend nominees to the Fund’s Board of Directors since the Fund last provided disclosure in response to this item.
ITEM 16. CONTROLS AND PROCEDURES.
(a) The registrant’s principal executive officer and principal financial officer have concluded that the registrant’s disclosure controls and procedures (as defined in Rule 30a-2(c) under the Investment Company Act of 1940, as amended) are effective at the reasonable assurance level based on their evaluation of these controls and procedures as of a date within 90 days of the filing date of this document.
(b) There were no changes in the registrant’s internal controls over financial reporting that occurred during the period covered by this report that has materially affected, or is reasonably likely to materially affect, the registrant’s internal control over financial reporting.
ITEM 17. DISCLOSURE OF SECURITIES LENDING ACTIVITIES FOR CLOSED-END MANAGEMENT INVESTMENT COMPANIES.
Not applicable to the registrant.
ITEM 18. RECOVERY OF ERRONEOUSLY AWARDED COMPENSATION.
Not applicable to the registrant
ITEM 19. EXHIBITS.
The following exhibits are attached to this Form N-CSR:
SIGNATURES
Pursuant to the requirements of the Securities Exchange Act of 1934 and the Investment Company Act of 1940, the registrant has duly caused this report to be signed on its behalf by the undersigned, thereunto duly authorized.
| | |
| (Registrant): Bernstein Fund, Inc. |
| |
| By: | | /s/ Alex Chaloff |
| | Alex Chaloff |
| | President |
Date: November 29, 2024
Pursuant to the requirements of the Securities Exchange Act of 1934 and the Investment Company Act of 1940, this report has been signed below by the following persons on behalf of the registrant and in the capacities and on the dates indicated.
| | |
| By: | | /s/ Alex Chaloff |
| | Alex Chaloff |
| | President |
Date: November 29, 2024
| | |
| By: | | /s/ Stephen M. Woetzel |
| | Stephen M. Woetzel |
| | Treasurer and Chief Financial Officer |
Date: November 29, 2024