UNITED STATES
SECURITIES AND EXCHANGE COMMISSION
WASHINGTON, D.C. 20549
FORM N-CSR
CERTIFIED SHAREHOLDER REPORT OF REGISTERED
MANAGEMENT INVESTMENT COMPANIES
Investment Company Act file number: 811-23100
BERNSTEIN FUND, INC.
(Exact name of registrant as specified in charter)
1345 Avenue of the Americas,
New York, New York 10105
(Address of principal executive offices) (Zip code)
Joseph J. Mantineo
AllianceBernstein L.P.
1345 Avenue of the Americas
New York, New York 10105
(Name and address of agent for service)
Registrant’s telephone number, including area code: (800) 221-5672
Date of fiscal year end: September 30, 2022
Date of reporting period: September 30, 2022
Enclosed for filing you will find an amended Form N-CSR of the registrant’s original 2022 Form N-CSR filing of the referenced period. The purpose of this amended filing is to update Item 11 (b) and Item 13 (which is addressed in exhibits labeled Exhibit 12 (b)(1) and Exhibit 12 (b)(2) in the original filings). Except as set forth above, no other changes have been made to the Form N-CSR, and this amended filing does not amend, update or change any other items or disclosure found in the Form N-CSR.
ITEM 1. REPORTS TO STOCKHOLDERS.
BERNSTEIN FUND, INC.
Small Cap Core Portfolio
International Small Cap Portfolio
International Strategic Equities Portfolio
ANNUAL REPORT
SEPTEMBER 30, 2022
Table of Contents
Before investing in any portfolio of the Bernstein Fund, Inc., a prospective investor should consider carefully the portfolio’s investment objectives and policies, charges, expenses and risks. These and other matters of importance to prospective investors are contained in the portfolios’ prospectus, an additional copy of which may be obtained by visiting our website at www.Bernstein.com and clicking on “Investments”, found in the footer, then “Mutual Fund Information—Prospectuses, SAIs and Shareholder Reports” or by calling your financial advisor or by calling Bernstein’s mutual fund shareholder help line at 212.756.4097. Please read the prospectus carefully before investing.
For performance information current to the most recent month-end, please call (collect) 212.486.5800.
This shareholder report must be preceded or accompanied by the Bernstein Fund, Inc. prospectus for individuals who are not shareholders of the Fund.
You may obtain a description of the Fund’s proxy voting policies and procedures, and information regarding how the Fund voted proxies relating to portfolio securities during the most recent 12-month period ended June 30, without charge. Simply visit www.AllianceBernstein.com, or go to the Securities and Exchange Commission’s website at www.sec.gov, or call AllianceBernstein at 800.227.4618.
The Fund will file its complete schedule of portfolio holdings with the Commission for the first and third quarters of each fiscal year as an exhibit to its reports on Form N-PORT. The Fund’s Form N-PORT reports are available on the Commission’s website at www.sec.gov.
Investment Products Offered: · Are Not FDIC Insured · May Lose Value · Are Not Bank Guaranteed
Portfolio Manager Commentary (Unaudited)
To Our Shareholders—November 15, 2022
On the following pages, you will find the 2022 annual report for the Portfolios (collectively, the “Portfolios”, and individually, a “Portfolio”) of the Bernstein Fund, Inc. (the “Bernstein Fund”). The annual report covers the six- and 12-month periods ended September 30, 2022, and includes financial statements as well as notes to the financial statements, information about the recent performance of the Portfolios and a listing of each Portfolio’s holdings as of the period end.
Global equity markets have been challenged over the 12-month period ended September 30, 2022, with most stock indices down more than 20%, the conventional threshold defining a bear market. In addition, volatility has been elevated throughout most of 2022, marking a turbulent period for investors. Significant economic and geopolitical stress created a tough macroeconomic backdrop, with both inflation and central banks’ interest-rate policies coming in higher than the markets anticipated.
One of the greatest surprises for markets has been the outperformance of the US dollar, which has negatively impacted US companies’ earnings coming from overseas, while geopolitical forces continue to put pressure on international earnings and economic growth. In contrast to most of the past decade, value stocks have outperformed growth stocks, but stock selection overall has been challenging. Our equity funds seek to find balanced exposure across factors and the portfolio teams have been pivoting to companies with strong balance sheets, pricing power and defensive characteristics, while also seeking to capture opportunities due to valuation dislocations.
The pressure on inflation and interest rates has also made the past year one of the worst on record for fixed-income markets. While this has been very painful for investors, the portfolio teams are leaning into higher yielding issues, with yields notably higher than they were even at the beginning of this calendar year.
Looking ahead, we are carefully minding the odds of recessions in the US and around the world. In this environment, we are confident in our portfolio teams’ ability to find the right balance to position for the eventual rebound and the opportunities that are being created today. Thank you for your continued confidence in our approach.
If you have any questions about your investments in the Portfolios, please contact your Bernstein Advisor by calling 212.756.4097, or visit www.Bernstein.com. As always, we are firmly dedicated to your investment success.
Sincerely,
Beata D. Kirr
President
Bernstein Fund, Inc.
Small Cap Core Portfolio
Investment Objectives and Strategy
The Portfolio seeks to provide long-term growth of capital. The Portfolio invests, under normal circumstances, at least 80% of its net assets (plus any borrowings for investment purposes) in equity securities of small-capitalization companies or other securities or instruments with similar economic characteristics, including derivatives related to equity securities. Equity securities are primarily common stocks, although, for purposes of the 80% policy, equity securities may also include preferred stocks, warrants, convertible securities, sponsored or unsponsored American Depositary Receipts (“ADRs”) and Global Depositary Receipts (“GDRs”) and equity real estate investment trusts (“REITs”). You will be notified at least 60 days prior to any change to the Portfolio’s 80% investment policy.
AllianceBernstein L.P. serves as the Portfolio’s investment manager (the “Adviser”). The Adviser invests the assets of the Portfolio primarily in a diversified portfolio of equity securities of small-capitalization companies located in the US. The Portfolio defines small-capitalization companies as those that, at the time of investment, fall within the capitalization range between the smallest company in the Russell 2000 Index (“Russell 2000”) and the largest company in the Russell 2000. The market capitalization of the companies included in the Portfolio’s definition of “small-capitalization” companies changes over time as the capitalization of the securities included in the Russell 2000 changes.
The Adviser utilizes both quantitative analysis and fundamental research to determine which securities will be held by the Portfolio and to manage risk. The Adviser applies
(Portfolio Manager Commentary continued on next page)
Portfolio Manager Commentary (continued)
quantitative analysis to all of the securities in the Portfolio’s research universe, which is composed primarily of securities in the Portfolio’s benchmark. Those securities that score highly on this quantitative analysis are then screened to eliminate those securities that the Adviser is recommending against purchasing based on its fundamental research, and a portfolio is constructed from the remaining highly ranked securities based on diversification and risk considerations. In its quantitative analysis, the Adviser considers a number of metrics that have historically provided some indication of favorable future returns, including metrics relating to valuation, quality, investor behavior and earnings growth. In general, stocks are purchased when, in the view of the Adviser, they provide the highest expected returns, considering their contribution to the estimated risk of the Portfolio’s existing investments. Typically, growth in the size of a company’s market capitalization relative to other domestically traded companies does not cause the Adviser to dispose of the security. The Adviser expects to seek to manage the overall portfolio volatility of the Portfolio relative to the Russell 2000 by favoring securities that offer the best balance between return and targeted risk.
The Portfolio may also invest in exchange-traded funds (“ETFs”) and other investment companies from time to time.
The Portfolio expects to utilize derivatives, such as options, futures contracts, forwards and swaps. For example, the Portfolio may use stock index futures contracts to equitize cash. Derivatives may provide a more efficient and economical exposure to market segments than direct investments, and may also be a more efficient way to alter the Portfolio’s exposure.
Investment Results
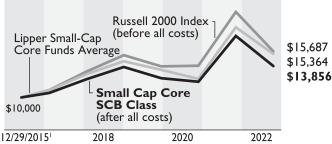
The table on page 10 shows the Portfolio’s performance compared to its benchmark, the Russell 2000 Index, for the six- and 12-month periods ended September 30, 2022. The table also includes the Portfolio’s peer group, as represented by the Lipper Small-Cap Core Funds Average (the “Lipper Average”). Funds in the Lipper Average have generally similar investment objectives to the Portfolio, although some of the funds may have different investment policies and sales and management fees and fund expenses.
Following historically high performance during the previous reporting period, the US small-cap market was down significantly during the current reporting period. All share classes of the Portfolio outperformed the benchmark during this sell-off, with SCB Class shares ending the 12-month period with a decline of -21.18% versus -23.50% for the Russell 2000 Index, while all share classes underperformed the Lipper Average. During the six-month period, all share classes of the Portfolio also outperformed against the benchmark, with SCB Class shares returning -18.33% versus the Russell 2000 Index -19.01%; Advisor Class and SCB Class shares underperformed the Lipper Average, while Class Z shares outperformed.
The US small-cap market was able to close the fourth quarter of 2021 with small gains despite deep supply-chain issues and increasing inflation. A significant sell-off in the market started in the first quarter of 2022 when the US Federal Reserve (the “Fed”) adopted a strong hawkish stance in response to the inflation readings that reached a 40-year-high. Russia’s invasion of Ukraine in February brought geopolitical risks to the fore. Worries about rising inflation and slowing economic growth drove the markets and led to the inversion of the US Treasury yield curve. The Fed continued with a series of 75 basis points interest-rate hikes throughout the year as the inflation proved persistent. Resulting risk-off sentiment led to continued decline in the markets.
The Portfolio continues to maintain strategic exposures to attractive valuation, high-profitability and positive-sentiment stocks, which tend to outperform over the long-term. During the 12-month reporting period, the Portfolio’s defensive exposure to low-beta (a measure of volatility relative to the benchmark), low-residual volatility stocks contributed to performance, relative to the benchmark. Stock selection in industrials and technology sectors also meaningfully contributed to the Portfolio’s outperformance, whereas underweight positioning in the oil and gas exploration space detracted.
The Portfolio utilized derivatives in the form of futures for hedging purposes, which detracted from absolute returns for both periods.
International Small Cap Portfolio
Investment Objective and Strategy
The Portfolio seeks to provide long-term growth of capital. The Portfolio invests, under normal circumstances, at least 80% of its net assets (plus any borrowings for investment purposes) in equity securities of small-capitalization companies or other securities or instruments with similar economic characteristics, including derivatives related to equity securities. Equity securities are primarily common stocks, although, for purposes of the 80% policy, equity
(Portfolio Manager Commentary continued on next page)
Portfolio Manager Commentary (continued)
securities may also include preferred stocks, warrants, convertible securities, sponsored or unsponsored ADRs and GDRs and equity REITs. You will be notified at least 60 days prior to any change to the Portfolio’s 80% investment policy.
AllianceBernstein L.P. serves as the Portfolio’s Adviser. The Adviser invests the assets of the Portfolio primarily in a diversified portfolio of equity securities of small-capitalization companies located outside of the United States. Under normal circumstances, at least 65% of the Portfolio’s net assets are invested in companies located outside of the United States. The Portfolio defines small-capitalization companies as those that, at the time of investment, have market capitalizations within the market capitalization range of the Portfolio’s benchmark, the Morgan Stanley Capital International (“MSCI”) All Country World Index (“ACWI”) ex USA Small Cap. The market capitalization of the companies included in the Portfolio’s definition of “small-capitalization” companies changes over time as the capitalization of the securities included in the MSCI ACWI ex USA Small Cap changes.
The Portfolio’s exposure to non-US companies may change over time based on the Adviser’s assessment of market conditions and the investment merit of non-US issuers. Under normal circumstances, the Adviser invests in companies located in at least three countries other than the United States and expects to have exposure to issuers in several different countries. In determining a company’s location for purposes of the Portfolio’s investment policies and restrictions, the Adviser may consider: (1) the place of domicile, (2) where the company has an established presence and conducts its business and (3) where the company conducts a significant part of its economic activities. The Portfolio may invest in both developed and emerging-market countries and, at times, may invest significantly in emerging markets.
The Adviser seeks to identify attractive investment opportunities primarily through its fundamental investment research or quantitative analysis. In applying its fundamental research, the Adviser generally seeks to identify companies that possess both attractive valuation and compelling company- and/or industry-level investment catalysts. In applying its quantitative analysis, the Adviser typically considers a number of metrics that historically have provided some indication of favorable future returns, including metrics related to valuation, quality, investor behavior and corporate behavior. Utilizing these resources, the Adviser expects to allocate the Portfolio’s assets among issuers, industries and geographic locations to attempt to create a diversified portfolio of investments.
The Portfolio may invest in established companies and also in new and less-seasoned issuers. The Portfolio may also invest in ETFs and other investment companies from time to time.
The Portfolio expects to utilize derivatives, such as options, futures contracts, forwards and swaps. For example, the Portfolio may invest in currency derivatives as discussed below and in futures contracts to gain exposure to certain markets. Derivatives may provide a more efficient and economical exposure to market segments than direct investments, and may also be a more efficient way to alter the Portfolio’s exposure.
Fluctuations in currency exchange rates can have a dramatic impact on the returns of foreign equity securities. The Adviser may employ currency hedging strategies, including the use of currency-related derivatives, to seek to reduce currency risk in the Portfolio, but it is not required to do so. The Adviser may also take long and short positions in currencies or related derivatives for investment purposes, independent of any security positions. The Adviser may use stock index futures contracts to gain access to certain markets.
Investment Results
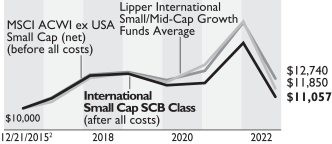
The table on page 10 shows the Portfolio’s performance compared to its benchmark, the MSCI ACWI ex USA Small Cap (net), for the six- and 12-month periods ended September 30, 2022. The table also includes the Portfolio’s peer group, as represented by the Lipper International Small/Mid-Cap Growth Funds Average. Funds in the Lipper Average have generally similar investment objectives to the Portfolio, although some of the funds may have different investment policies and sales and management fees and fund expenses.
Over both periods, all share classes of the Portfolio underperformed the benchmark, and outperformed the Lipper Average. Over both periods, the deteriorating macro-economic outlook and increase in geopolitical concerns increased investor risk-aversion and served as a headwind against the Portfolio’s approach of identifying stocks that are mispriced relative to their long-term, normalized earnings power and their financial and operational risks.
For the 12-month period, weak sector selection and security selection drove the underperformance, relative to the benchmark, as the onset of the Russian invasion of Ukraine caused a spike in energy prices. As a result, the Portfolio’s underweight to the energy sector, which outperformed the broader index by close to 50%, detracted from returns. The increase in risk aversion also caused stock selection in more
(Portfolio Manager Commentary continued on next page)
Portfolio Manager Commentary (continued)
defensive sectors such as real estate, utilities and consumer staples to detract. This was partially offset by gains from stock selection within technology.
In the six-month period, negative stock selection was the primary driver of underperformance. Security selection was weakest within health care, consumer staples, materials and industrials, while stronger selection within technology and communication services helped to moderate the underperformance. Stock selection in Japan detracted, but was partially offset by stronger stock selection in the United Kingdom.
The Portfolio utilized derivatives in the form of currency forwards for hedging purposes, which had no material impact on absolute performance for the six-month period, and added for the 12-month period.
International Strategic Equities Portfolio
Investment Objective and Strategy
The Portfolio seeks to provide long-term growth of capital. The Portfolio invests, under normal circumstances, at least 80% of its net assets (plus any borrowings for investment purposes) in equity securities or other securities or instruments with similar economic characteristics, including derivatives related to equity securities. Equity securities are primarily common stocks, although, for purposes of the 80% policy, equity securities may also include preferred stocks, warrants, convertible securities, sponsored or unsponsored ADRs and GDRs and equity REITs. You will be notified at least 60 days prior to any change to the Portfolio’s 80% investment policy.
AllianceBernstein L.P. serves as the Portfolio’s Adviser. The Adviser invests the assets of the Portfolio primarily (under normal circumstances, at least 65% of net assets) in equity securities of issuers in countries that make up the MSCI ACWI ex USA, which includes both developed- and emerging-market countries. The Portfolio focuses on securities of large-cap and mid-cap companies. The Adviser expects to allocate fund assets among issuers in many foreign countries, but not necessarily in the same proportion that the countries are represented in the MSCI ACWI ex USA and may invest in issuers in countries outside of the MSCI ACWI ex USA. The Portfolio’s exposure among non-US countries may change over time based on the Adviser’s assessment of market conditions and the investment merit of particular non-US issuers. Under normal circumstances, the Adviser invests in companies located in at least three countries other than the United States and expects to have exposure to issuers in several different countries. In determining a company’s location for purposes of the Portfolio’s investment policies and restrictions, the Adviser may consider: (1) the place of domicile, (2) where the company has an established presence and conducts its business and (3) where the company conducts a significant part of its economic activities. The Portfolio may, at times, invest significantly in emerging markets.
The Adviser utilizes both fundamental and quantitative research to both determine which securities will be held by the Portfolio and to manage risk. In applying its quantitative analysis, the Adviser considers a number of metrics that have historically provided some indication of favorable future returns, including metrics relating to valuation, quality, investor behavior and corporate behavior. Utilizing these resources, the Adviser expects to allocate the Portfolio’s assets among issuers, industries and geographic locations to attempt to create a diversified portfolio of investments.
The Portfolio may also invest in ETFs and other investment companies from time to time.
The Portfolio expects to utilize derivatives, such as options, futures contracts, forwards and swaps. For example, the Portfolio may invest in currency derivatives as discussed below and in futures contracts to gain exposure to certain markets. Derivatives may provide a more efficient and economical exposure to market segments than direct investments, and may also be a more efficient way to alter the Portfolio’s exposure.
Fluctuations in currency exchange rates can have a dramatic impact on the returns of foreign equity securities. The Adviser may employ currency hedging strategies, including the use of currency-related derivatives, to seek to reduce currency risk in the Portfolio, but it is not required to do so. The Adviser may also take long and short positions in currencies or related derivatives for investment purposes, independent of any security positions. The Adviser may use stock index futures contracts to gain access to certain markets.
Investment Results
The table on page 10 shows the Portfolio’s performance compared to its benchmark, the MSCI ACWI ex USA (net), for the six- and 12-month periods ended September 30, 2022. The table also includes the Portfolio’s peer group, as represented by the Lipper International Multi-Cap Growth Funds Average. Funds in the Lipper Average have generally similar investment objectives to the Portfolio, although some of the funds may have different investment policies and sales and management fees and fund expenses.
(Portfolio Manager Commentary continued on next page)
Portfolio Manager Commentary (continued)
During the 12-month period, all share classes of the Portfolio underperformed the benchmark but outperformed the Lipper Average. Sector selection was negative, relative to the benchmark, mainly from an overweight to the technology sector, which lagged the market. Country selection was also negative, as overweights to the Netherlands and South Korea detracted. Stock selection was positive, helped by oil and gas producers, which benefited from disruptions to energy markets related to the Russia/Ukraine conflict; health-care, consumer-staples and telecommunications holdings, which proved their defensive nature in volatile times; and companies with post-COVID re-opening exposure.
During the six-month period, all share classes of Portfolio underperformed the benchmark but outperformed the Lipper Average. Country selection detracted, mostly due to an overweight to Zambia through a holding in a metals producer. Security selection was negative, with detractors from mining companies and Asian technology companies, impacted by a global demand slowdown; salmon farmers in Norway, which fell following a jump in Norwegian corporate tax rates; and banks in South Korea and eastern Europe, seen as negatively exposed to macroeconomic trends. Sector selection was positive, with overweights to the consumer-discretionary and energy sectors and an underweight to the materials sector contributing.
The Portfolio utilized derivatives in the form of currency forwards for hedging purposes, which added to absolute returns for both periods.
Disclosures and Risks (Unaudited)
Benchmark Disclosures
None of the following indices or averages reflects fees and expenses associated with the active management of a mutual fund portfolio. The Russell 2000® Index measures the performance of the small-cap segment of the US equity universe. The MSCI ACWI ex USA Small Cap (net) measures the performance of the small-cap market segment across 22 of 23 developed markets (excluding the US) and 24 emerging-market countries. The MSCI ACWI ex USA (net, free float-adjusted, market capitalization weighted) represents the equity market performance of developed and emerging markets, excluding the United States. MSCI makes no express or implied warranties or representations, and shall have no liability whatsoever with respect to any MSCI data contained herein. The MSCI data may not be further redistributed or used as a basis for other indices, any securities or financial products. This report is not approved, reviewed or produced by MSCI. Net returns include the reinvestment of dividends after deduction of non-US withholding tax. Investors cannot invest directly in an index, and their results are not indicative of the performance for any specific investment, including the Portfolios.
A Word About Risk
All Portfolios:
The share price of the Portfolios will fluctuate and you may lose money. There is no guarantee that the Portfolios will achieve their investment objectives.
Cybersecurity Risk: As the use of the internet and other technologies has become more prevalent in the course of business, the Portfolios have become more susceptible to operational and financial risks associated with cybersecurity. Cybersecurity incidents can result from deliberate attacks such as gaining unauthorized access to digital systems (e.g., through “hacking” or malicious software coding) for purposes of misappropriating assets or sensitive information, corrupting data, or causing operational disruption, or from unintentional events, such as the inadvertent release of confidential information. Cybersecurity failures or breaches of the Portfolios or their service providers or the issuers of securities in which the Portfolios invest have the ability to cause disruptions and impact business operations, potentially resulting in financial losses, the inability of Portfolio shareholders to transact business, violations of applicable privacy and other laws, regulatory fines, penalties, reputational damage, reimbursement or other compensation costs, and/or additional compliance costs. While measures have been developed which are designed to reduce the risks associated with cybersecurity, there is no guarantee that those measures will be effective, particularly since the Portfolios do not control the cybersecurity defenses or plans of their service providers, financial intermediaries and companies in which they invest or with which they do business.
Cybersecurity incidents, both intentional and unintentional, may allow an unauthorized party to gain access to Portfolio or shareholder assets, Portfolio or customer data (including private shareholder information), or proprietary information, or cause a Portfolio, the Adviser, and/or the Portfolios’ service providers (including, but not limited to, fund accountants, custodians, sub-custodians, transfer agents and financial intermediaries) to suffer data breaches, data corruption or lose operational functionality, or prevent Portfolio investors from purchasing, redeeming or exchanging shares or receiving distributions. A Portfolio and the Adviser have limited ability to prevent or mitigate cybersecurity incidents affecting third-party service providers. Cybersecurity incidents may result in financial losses to such Portfolio and its shareholders, and substantial costs may be incurred in order to prevent any future cybersecurity incidents.
Illiquid Investments Risk: Illiquid investments risk exists when particular investments are difficult or impossible to purchase or sell, possibly preventing the Portfolios from purchasing or selling these securities at an advantageous price. Illiquid securities may also be difficult to value. If the Portfolios are forced to sell an illiquid asset to meet redemption requests or other cash needs, or to try to limit losses, the Portfolios may be forced to sell at a substantial loss or may not be able to sell at all.
Redemption Risk: The Portfolios may experience heavy redemptions that could cause the Portfolios to liquidate their assets at inopportune times or unfavorable prices or increase or accelerate taxable gains or transaction costs and may negatively affect the Portfolios’ net asset value, or performance, which could cause the value of your investment to decline. Redemption risk is heightened during periods of overall market turmoil.
Market Risk: The Portfolios are subject to market risk, which is the risk that stock or bond prices in general or in particular countries or sectors may decline over short or extended periods. Stock or bond prices may decline in response to adverse changes in the economy or the economic outlook;
(Disclosures and Risks continued on next page)
Disclosures and Risks (continued)
deterioration in investor sentiment; interest-rate, currency and commodity price fluctuations; adverse geopolitical, social or environmental developments; issuer- and sector-specific considerations; public health crises (including the occurrence of a contagious disease or illness); policy and legislative changes; cybersecurity events; and other factors.
Economies and financial markets throughout the world are becoming increasingly interconnected. Economic, financial or political events, trading and tariff arrangements, sanctions, regional and global conflicts, terrorism, natural disasters (including the spread of infectious illness) and other circumstances in one country or region could have profound impacts on global economies or markets. As a result, whether or not the Portfolios invest in securities of issuers located in or with significant exposure to countries experiencing economic and financial difficulties, the value and liquidity of the Portfolios’ investments may be negatively affected.
Sector Risk: The Portfolios may have more risk because of concentrated investments in a particular market sector, such as the financials, consumer discretionary, information technology or industrials sector. Market or economic factors affecting that sector could have a major effect on the value of the Portfolios’ investments.
Capitalization Risk: Investments in small- and mid-capitalization companies may be more volatile than investments in large-capitalization companies. Investments in small- and mid-capitalization companies may have additional risks because these companies may have limited product lines, markets or financial resources. The prices of securities of small- and mid-capitalization companies generally are more volatile than those of large-capitalization companies and are more likely to be adversely affected than large-capitalization companies by changes in earnings results and investor expectations or poor economic or market conditions, including those experienced during a recession. Securities of small- and mid-capitalization capitalization companies may underperform large-capitalization companies, may be harder to sell at times or at prices the portfolio managers believe appropriate and may have greater potential for losses.
Allocation Risk: The Portfolios may seek to focus on different investment disciplines or factors at different times as a means to achieve their investment objectives. In the event that the investment disciplines or factors to which the Portfolios have greater exposure perform worse than the investment disciplines or factors with less exposure, the Portfolios’ returns may be negatively affected.
Derivatives Risk: The Portfolios may use derivatives in currency hedging as well as for direct investments to gain access to certain markets, earn income, enhance return and broaden portfolio diversification, which entail greater risk than if used solely for hedging purposes. In addition to other risks such as the credit risk of the counterparty, derivatives involve the risk that changes in the value of the derivative may not correlate with relevant assets, rates or indices. Derivatives may be difficult to price or unwind, and small changes may produce disproportionate losses for the Portfolios. Certain derivatives have the potential for unlimited loss, regardless of the size of the initial investment. Assets required to be set aside or posted to cover or secure derivatives positions may themselves go down in value, and these collateral and other requirements may limit investment flexibility. Some derivatives involve leverage, which can make the Portfolios more volatile and can compound other risks. Derivatives, especially over-the-counter derivatives, are also subject to counterparty risk, which is the risk that the counterparty (the party on the other side of the transaction) on a derivative transaction will be unable or unwilling to honor its contractual obligations to the Portfolios. The US government and certain foreign governments have adopted regulations governing derivatives markets, including mandatory clearing of certain derivatives as well as additional regulations governing margin, reporting and registration requirements. The ultimate impact of the regulations remains unclear. Additional regulation may make derivatives more costly, limit their availability or utility, otherwise adversely affect their performance, or disrupt markets.
Management Risk: The Portfolios are subject to management risk because they are actively managed investment portfolios. The Adviser will apply its investment techniques and risk analyses in making investment decisions for the Portfolios, but these techniques, analyses and decisions may not work as intended or may not produce the desired results, and may, during certain periods, result in increased volatility for the Portfolios or cause the value of the Portfolios’ shares to go down. In some cases, derivatives and other investment techniques may be unavailable or the Adviser may determine not to use them, possibly even under market conditions where their use could benefit the Portfolios. Some of these techniques may incorporate, or rely upon, quantitative models, but there is no guarantee that these models will generate accurate forecasts, reduce risk or otherwise perform as expected. In addition, the Adviser may change the Portfolios’ investment strategies or policies from time to time. Those changes may not lead to the results intended by the Adviser and could also have an adverse
(Disclosures and Risks continued on next page)
Disclosures and Risks (continued)
effect on the Adviser and could have an adverse effect on the value or performance of the Portfolios.
REIT Risk: Investing in REITs involves certain unique risks in addition to those risks associated with investing in the real estate industry in general. Equity REITs may be affected by changes in the value of the underlying property owned by the REITs, while mortgage REITs may be affected by the quality of any credit extended. REITs are dependent upon management skills, are not diversified, and are subject to heavy cash flow dependency, default by borrowers and self-liquidation. Investing in REITs also involves risks similar to those associated with investing in small-capitalization companies. REITs may have limited financial resources, may trade less frequently and in a limited volume and may be subject to more abrupt or erratic price movements than larger company securities. REIT issuers may also fail to maintain their exemptions from investment company registration or fail to qualify for the “dividends paid deduction” under the Internal Revenue Code of 1986, as amended.
Investment in Other Investment Companies Risk: As with other investments, investments in other investment companies, including other registered funds advised by the Adviser and ETFs, are subject to market and management risk. In addition, if the Portfolios acquire shares of investment companies, shareholders bear both their proportionate share of expenses in the Portfolios (including management and advisory fees) and, indirectly, the expenses of the investment companies in which the Portfolios invest.
International Small Cap and International Strategic Equities Portfolios
Foreign (Non-US) Securities Risk: Investments in foreign securities entail significant risks in addition to those customarily associated with investing in US securities, such as less liquid, less transparent, less regulated and more volatile markets. These risks include risks related to unfavorable or unsuccessful government actions, reduction of government or central bank support, inadequate accounting standards and auditing and financial recordkeeping requirements, lack of information, and adverse market, economic, political and regulatory factors and social instability, all of which could disrupt the financial markets in which the Portfolios invest and adversely affect the value of the Portfolios’ assets.
Country Concentration Risk: The Portfolios may not always be diversified among countries or regions and the effect on the share price of the Portfolios of specific risks such as political, regulatory and currency may be magnified due to concentration of the Portfolios’ investments in a particular country or region.
Emerging-Markets Securities Risk: The risks of investing in foreign (non-US) securities are heightened with respect to issuers in emerging-market countries because the markets are less developed and less liquid and there may be a greater amount of economic, political and social uncertainty, and these risks are even more pronounced in “frontier” markets, which are investable markets with lower total market capitalization and liquidity than the more developed emerging markets. Emerging markets typically have fewer medical and economic resources than more developed countries, and thus they may be less able to control or mitigate the effects of a pandemic. In addition, the value of the Portfolios’ investments may decline because of factors such as unfavorable or unsuccessful government actions and reduction of government or central bank support.
Foreign Currency Risk: This is the risk that changes in foreign (non-US) currency exchange rates may negatively affect the value of the Portfolios’ investments or reduce the returns of the Portfolios. For example, the value of the Portfolios’ investments in foreign securities and foreign currency positions may decrease if the US dollar is strong (i.e., gaining value relative to other currencies) and other currencies are weak (i.e., losing value relative to the US dollar).
Actions by a Few Major Investors: In certain countries, volatility may be heightened by actions of a few major investors. For example, substantial increases or decreases in cash flows of mutual funds investing in these markets could significantly affect local stock prices and, therefore, share prices of the Portfolios.
These risks are discussed in further detail in the Portfolios’ prospectus.
An Important Note About Historical Performance
The performance shown on the following pages represents past performance and does not guarantee future results. Performance information is as of the dates shown. Current performance may be lower or higher than the performance information shown. You may obtain performance information current to the most recent month-end by calling 212.756.4097. The investment return and principal value of an investment in the Portfolios will fluctuate, so that shares, when redeemed, may be worth more or less than their original cost.
(Disclosures and Risks continued on next page)
Disclosures and Risks (continued)
Investors should consider the investment objectives, risks, charges and expenses of the Portfolios carefully before investing. For copies of our prospectus or summary prospectus, which contain this and other information, visit www.Bernstein.com, click on “Investments”, found in the footer, then “Mutual Fund Information—Prospectuses, SAIs and Shareholder Reports”, or call Bernstein’s mutual fund shareholder help line at 212.756.4097 or contact your Bernstein Advisor. Please read the prospectus and/or summary prospectus carefully before investing.
Historical Performance (Unaudited)
Bernstein Fund Portfolios vs. Their Benchmarks and Lipper Averages
| | | | | | | | | | | | | | | | | | | | |
| | | TOTAL RETURNS | | | AVERAGE ANNUAL TOTAL RETURNS | | | | |
| THROUGH SEPTEMBER 30, 2022 | | PAST SIX
MONTHS | | | PAST 12
MONTHS | | | PAST FIVE
YEARS | | | SINCE
INCEPTION | | | INCEPTION DATE | |
Small Cap Core Portfolio1 | | | | | | | | | | | | | | | | | | | 12/29/2015 | |
SCB Class Shares | | | -18.33 | % | | | -21.18 | % | | | 2.53 | % | | | 4.95 | % | | | | |
Advisor Class Shares | | | -18.25 | % | | | -21.02 | % | | | 2.76 | % | | | 5.19 | % | | | | |
Class Z Shares | | | -18.20 | % | | | -20.95 | % | | | 2.81 | % | | | 5.22 | % | | | | |
Russell 2000 Index | | | -19.01 | % | | | -23.50 | % | | | 3.55 | % | | | 6.89 | % | | | | |
Lipper Small-Cap Core Funds Average | | | -18.22 | % | | | -17.55 | % | | | 3.47 | % | | | 6.55 | % | | | | |
| | | | | | | | | | | | | | | | | | | | | |
International Small Cap Portfolio2 | | | | | | | | | | | | | | | | | | | 12/21/2015 | |
SCB Class Shares | | | -25.59 | % | | | -31.01 | % | | | -3.22 | % | | | 1.49 | % | | | | |
Advisor Class Shares | | | -25.46 | % | | | -30.81 | % | | | -2.96 | % | | | 1.74 | % | | | | |
Class Z Shares | | | -25.46 | % | | | -30.81 | % | | | -2.96 | % | | | 1.74 | % | | | | |
MSCI ACWI ex USA Small Cap (net) | | | -24.45 | % | | | -28.93 | % | | | -0.56 | % | | | 3.64 | % | | | | |
Lipper International Small/Mid-Cap Growth Funds Average | | | -25.61 | % | | | -34.24 | % | | | -1.32 | % | | | 2.92 | % | | | | |
| | | | | | | | | | | | | | | | | | | | | |
International Strategic Equities Portfolio3 | | | | | | | | | | | | | | | | | | | 12/21/2015 | |
SCB Class Shares | | | -22.93 | % | | | -26.13 | % | | | -2.75 | % | | | 1.72 | % | | | | |
Advisor Class Shares | | | -22.87 | % | | | -25.96 | % | | | -2.51 | % | | | 1.95 | % | | | | |
Class Z Shares | | | -22.92 | % | | | -26.01 | % | | | -2.52 | % | | | 1.95 | % | | | | |
MSCI ACWI ex USA (net) | | | -22.27 | % | | | -25.17 | % | | | -0.81 | % | | | 3.16 | % | | | | |
Lipper International Multi-Cap Growth Funds Average | | | -24.24 | % | | | -32.36 | % | | | -1.01 | % | | | 2.69 | % | | | | |
| 1 | | The current prospectus table shows the total annual operating expense ratios for the Portfolio as 1.14%, 0.89% and 0.87% for SCB Class, Advisor Class and Class Z shares, respectively. The Financial Highlights section of this report sets forth expense ratio data for the current reporting period; the expense ratios shown above may differ from the expense ratios in the Financial Highlights section since they are based on different time periods. |
| 2 | | The current prospectus table shows the total annual operating expense ratios for the Portfolio as 1.32%, 1.07% and 1.07% for SCB Class, Advisor Class and Class Z shares, respectively. The Financial Highlights section of this report sets forth expense ratio data for the current reporting period; the expense ratios shown above may differ from the expense ratios in the Financial Highlights section since they are based on different time periods. |
| 3 | | The current prospectus table shows the total annual operating expense ratios for the Portfolio as 0.95%, 0.70% and 0.71% for SCB Class, Advisor Class and Class Z shares, respectively. The Financial Highlights section of this report sets forth expense ratio data for the current reporting period; the expense ratios shown above may differ from the expense ratios in the Financial Highlights section since they are based on different time periods. |
See Disclosures, Risks and Note About Historical Performance on pages 6-9.
(Historical Performance continued on next page)
Historical Performance (continued from previous page)
| | | | | | |
| Small Cap Core—SCB Class Shares | | | | | |
Growth of a $10,000 Investment in the Portfolio | | | | | | |
 | | | | | | |
| International Small Cap—SCB Class Shares | | | | | |
Growth of a $10,000 Investment in the Portfolio | | | | | | |
| | | | | | |
| | | | | | |
| International Strategic Equities—SCB Class Shares | | | | | |
Growth of a $10,000 Investment in the Portfolio | | | | | | |
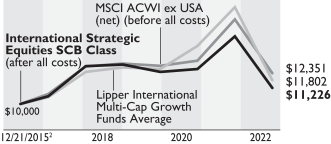 | | | | | | |
| | | Past performance is no guarantee of future results and an investment in the Portfolios could lose value. Each chart illustrates the total value of an assumed $10,000 investment as compared to the performance of each Portfolio’s respective benchmark and Lipper Average for the period since inception through September 30, 2022. |
| 1 | | Inception date: 12/29/2015. |
| 2 | | Inception date: 12/21/2015. |
See Disclosures, Risks and Note About Historical Performance on pages 6-9.
Expense Example—September 30, 2022 (Unaudited)
As a shareholder of a Portfolio, you incur various ongoing costs, including management fees and other Portfolio expenses. This example is intended to help you understand your ongoing costs (in dollars) of investing in the Portfolio and to compare these costs with the ongoing costs of investing in other mutual funds. The example is based on an investment of $1,000 invested at the beginning of the period and held for the entire period as indicated below.
Actual Expenses—The first line of the table below provides information about actual account values and actual expenses. You may use the information in this line, together with the amount you invested, to estimate the expenses that you paid over the period. Simply divide your account value by $1,000 (for example, an $8,600 account value divided by $1,000 = 8.6), then multiply the result by the number in the first line under the heading entitled “Expenses Paid During Period” to estimate the expenses you paid on your account during this period.
Hypothetical Example for Comparison Purposes—The second line of the table below provides information about hypothetical account values and hypothetical expenses based on a Portfolio’s actual expense ratio and an assumed annual rate of return of 5% before expenses, which is not the Portfolio’s actual return. The hypothetical account values and expenses may not be used to estimate the actual ending account balance or expenses you paid for the period. You may use this information to compare the ongoing costs of investing in the Portfolio and other funds by comparing this 5% hypothetical example with the 5% hypothetical examples that appear in the shareholder reports of other funds. Please note that the expenses shown in the table are meant to highlight your ongoing costs only and do not reflect any transactional costs, such as sales charges (loads), or contingent deferred sales charges on redemptions. Therefore, the second line of the table is useful in comparing ongoing costs only, and will not help you determine the relative total costs of owning different funds. In addition, if these transactional costs were included, your costs would have been higher.
| | | | | | | | | | | | | | | | |
| | | BEGINNING
ACCOUNT VALUE
APRIL 1, 2022 | | | ENDING
ACCOUNT VALUE
SEPTEMBER 30, 2022 | | | EXPENSES
PAID DURING
PERIOD* | | | ANNUALIZED
EXPENSE
RATIO* | |
Small Cap Core Portfolio | | | | | | | | | | | | |
SCB Class | | | | | | | | | | | | |
Actual | | $ | 1,000 | | | $ | 816.70 | | | $ | 5.10 | | | | 1.12 | % |
Hypothetical** | | $ | 1,000 | | | $ | 1,019.45 | | | $ | 5.67 | | | | 1.12 | % |
Advisor Class | | | | | | | | | | | | |
Actual | | $ | 1,000 | | | $ | 817.50 | | | $ | 3.96 | | | | 0.87 | % |
Hypothetical** | | $ | 1,000 | | | $ | 1,020.71 | | | $ | 4.41 | | | | 0.87 | % |
Class Z | | | | | | | | | | | | |
Actual | | $ | 1,000 | | | $ | 818.00 | | | $ | 3.92 | | | | 0.86 | % |
Hypothetical** | | $ | 1,000 | | | $ | 1,020.76 | | | $ | 4.36 | | | | 0.86 | % |
| |
International Small Cap Portfolio | | | | | | | | | | | | |
SCB Class | | | | | | | | | | | | |
Actual | | $ | 1,000 | | | $ | 744.10 | | | $ | 5.82 | | | | 1.33 | % |
Hypothetical** | | $ | 1,000 | | | $ | 1,018.40 | | | $ | 6.73 | | | | 1.33 | % |
Advisor Class | | | | | | | | | | | | |
Actual | | $ | 1,000 | | | $ | 745.40 | | | $ | 4.73 | | | | 1.08 | % |
Hypothetical** | | $ | 1,000 | | | $ | 1,019.65 | | | $ | 5.47 | | | | 1.08 | % |
Class Z | | | | | | | | | | | | |
Actual | | $ | 1,000 | | | $ | 745.40 | | | $ | 4.73 | | | | 1.08 | % |
Hypothetical** | | $ | 1,000 | | | $ | 1,019.65 | | | $ | 5.47 | | | | 1.08 | % |
| |
International Strategic Equities Portfolio | | | | | | | | | | | | |
SCB Class | | | | | | | | | | | | |
Actual | | $ | 1,000 | | | $ | 770.70 | | | $ | 4.26 | | | | 0.96 | % |
Hypothetical** | | $ | 1,000 | | | $ | 1,020.26 | | | $ | 4.86 | | | | 0.96 | % |
Advisor Class | | | | | | | | | | | | |
Actual | | $ | 1,000 | | | $ | 771.30 | | | $ | 3.15 | | | | 0.71 | % |
Hypothetical** | | $ | 1,000 | | | $ | 1,021.51 | | | $ | 3.60 | | | | 0.71 | % |
Class Z | | | | | | | | | | | | |
Actual | | $ | 1,000 | | | $ | 770.80 | | | $ | 3.20 | | | | 0.72 | % |
Hypothetical** | | $ | 1,000 | | | $ | 1,021.46 | | | $ | 3.65 | | | | 0.72 | % |
| |
| * | | Expenses are equal to the classes’ annualized expense ratios, multiplied by the average account value over the period, multiplied by 183/365 (to reflect the one-half year period). |
| ** | | Assumes 5% annual return before expenses. |
Portfolio Summary—September 30, 2022 (Unaudited)
| | | | | | |
| Small Cap Core Portfolio | | | |
| |
| Sector Breakdown1 | | | |
| Health Care | | | 19.3 | % | | |
| Financials | | | 16.4 | | | |
| Industrials | | | 16.2 | | | |
| Information Technology | | | 15.6 | | | |
| Consumer Discretionary | | | 10.9 | | | |
| Energy | | | 6.8 | | | |
| Real Estate | | | 5.7 | | | |
| Materials | | | 3.2 | | | |
| Utilities | | | 2.5 | | | |
| Consumer Staples | | | 2.2 | | | |
| Communication Services | | | 1.2 | | | |
| | | | | | |
| International Small Cap Portfolio |
| |
| Sector Breakdown1 | | | Country Breakdown1 |
Industrials | | | 21.5 | % | | 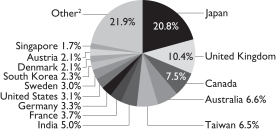 |
Consumer Discretionary | | | 13.5 | |
Information Technology | | | 11.2 | |
Financials | | | 10.9 | |
Materials | | | 10.8 | |
Communication Services | | | 8.7 | |
Health Care | | | 6.3 | |
Real Estate | | | 6.0 | |
Energy | | | 4.1 | |
Consumer Staples | | | 3.4 | |
Utilities | | | 2.1 | |
Funds and Investment Trusts | | | 1.5 | |
| | | | | | |
| International Strategic Equities Portfolio |
| |
| Sector Breakdown1 | | | Country Breakdown1 |
Financials | | | 17.9 | % | | 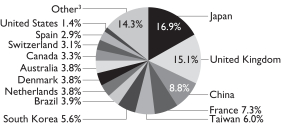 |
Consumer Discretionary | | | 16.0 | |
Information Technology | | | 10.5 | |
Industrials | | | 10.4 | |
Health Care | | | 9.2 | |
Consumer Staples | | | 7.5 | |
Energy | | | 7.4 | |
Communication Services | | | 7.4 | |
Materials | | | 6.2 | |
Utilities | | | 4.2 | |
Real Estate | | | 3.3 | |
| 1 | | All data are as of September 30, 2022. The Portfolio’s country and sector breakdowns are expressed as a percentage of each Portfolio’s long-term investments and may vary over time. Each Portfolio may also invest in other financial instruments, including derivative instruments, which provide investment exposure to a variety of asset classes (see “Schedule of Investments” section of the report for additional details). |
| 2 | | “Other” represents 9.2% in MSCI EM Index countries, 11.0% in MSCI EAFE Index countries and 1.7% in other emerging-market countries. |
| 3 | | “Other” represents 4.6% in MSCI EM Index countries, 8.3% in MSCI EAFE Index countries and 1.4% in other emerging-market countries. |
| | | Please note: The sector classifications presented herein are based on the Global Industry Classification Standard (GICS) which was developed by Morgan Stanley Capital International and Standard & Poor’s. The components are divided into sector, industry group, and industry sub-indices as classified by the GICS for each of the market capitalization indices in the broad market. These sector classifications are broadly defined. The “Schedule of Investments” section of the report reflects more specific industry information and is consistent with the investment restrictions discussed in the Portfolio’s prospectus. |
Schedule of Investments
Bernstein Fund, Inc.
Schedule of Investments
Small Cap Core Portfolio
September 30, 2022
| | | | | | | | |
| | |
| Company | | Shares | | | U.S. $ Value | |
|
| COMMON STOCKS–99.6% | |
|
| Health Care–19.2% | |
| Biotechnology–7.8% | |
Arcus Biosciences, Inc.(a) | | | 52,120 | | | $ | 1,363,459 | |
Arrowhead Pharmaceuticals, Inc.(a) | | | 64,492 | | | | 2,131,461 | |
Ascendis Pharma A/S (ADR)(a) | | | 10,027 | | | | 1,035,388 | |
AVEO Pharmaceuticals, Inc.(a) | | | 124,650 | | | | 1,025,870 | |
Blueprint Medicines Corp.(a) | | | 33,705 | | | | 2,220,822 | |
Coherus Biosciences, Inc.(a) | | | 122,049 | | | | 1,172,891 | |
Cytokinetics, Inc.(a) | | | 41,160 | | | | 1,994,202 | |
Denali Therapeutics, Inc.(a) | | | 41,960 | | | | 1,287,752 | |
Eagle Pharmaceuticals, Inc./DE(a) | | | 22,532 | | | | 595,295 | |
Emergent BioSolutions, Inc.(a) | | | 27,391 | | | | 574,937 | |
Erasca, Inc.(a) | | | 128,090 | | | | 999,102 | |
Gossamer Bio, Inc.(a) | | | 148,270 | | | | 1,776,275 | |
Halozyme Therapeutics, Inc.(a) | | | 72,522 | | | | 2,867,520 | |
Insmed, Inc.(a) | | | 111,981 | | | | 2,412,071 | |
Instil Bio, Inc.(a) | | | 141,380 | | | | 684,279 | |
Intellia Therapeutics, Inc.(a) | | | 42,360 | | | | 2,370,466 | |
IVERIC bio, Inc.(a) | | | 88,160 | | | | 1,581,590 | |
Karuna Therapeutics, Inc.(a) | | | 15,534 | | | | 3,494,063 | |
Legend Biotech Corp. (ADR)(a) | | | 23,550 | | | | 960,840 | |
Mirati Therapeutics, Inc.(a) | | | 13,271 | | | | 926,847 | |
Natera, Inc.(a) | | | 16,087 | | | | 704,932 | |
PTC Therapeutics, Inc.(a) | | | 38,020 | | | | 1,908,604 | |
Recursion Pharmaceuticals, Inc.–Class A(a) | | | 196,510 | | | | 2,090,866 | |
Relay Therapeutics, Inc.(a) | | | 59,930 | | | | 1,340,634 | |
Sarepta Therapeutics, Inc.(a) | | | 9,210 | | | | 1,018,073 | |
Syndax Pharmaceuticals, Inc.(a) | | | 57,120 | | | | 1,372,594 | |
Twist Bioscience Corp.(a) | | | 25,405 | | | | 895,272 | |
Ultragenyx Pharmaceutical, Inc.(a) | | | 29,394 | | | | 1,217,206 | |
Vericel Corp.(a) | | | 54,460 | | | | 1,263,472 | |
Verve Therapeutics, Inc.(a) | | | 36,270 | | | | 1,245,874 | |
Vir Biotechnology, Inc.(a) | | | 75,917 | | | | 1,463,680 | |
Y-mAbs Therapeutics, Inc.(a) | | | 109,239 | | | | 1,575,226 | |
Zentalis Pharmaceuticals, Inc.(a) | | | 34,370 | | | | 744,454 | |
| | | | | | | | |
| | | | | | | 48,316,017 | |
| | | | | | | | |
| Health Care Equipment & Supplies–3.3% | |
CONMED Corp. | | | 23,779 | | | | 1,906,363 | |
Integer Holdings Corp.(a) | | | 49,130 | | | | 3,057,360 | |
iRhythm Technologies, Inc.(a) | | | 32,415 | | | | 4,060,951 | |
Lantheus Holdings, Inc.(a) | | | 63,440 | | | | 4,461,735 | |
Meridian Bioscience, Inc.(a) | | | 98,264 | | | | 3,098,264 | |
Mesa Laboratories, Inc. | | | 7,340 | | | | 1,033,692 | |
Orthofix Medical, Inc.(a) | | | 80,440 | | | | 1,537,208 | |
STAAR Surgical Co.(a) | | | 25,550 | | | | 1,802,553 | |
| | | | | | | | |
| | | | | | | 20,958,126 | |
| | | | | | | | |
| Health Care Providers & Services–4.0% | |
AMN Healthcare Services, Inc.(a) | | | 45,775 | | | | 4,850,319 | |
Chemed Corp. | | | 7,535 | | | | 3,289,480 | |
ModivCare, Inc.(a) | | | 23,990 | | | | 2,391,323 | |
Option Care Health, Inc.(a) | | | 109,720 | | | | 3,452,888 | |
Owens & Minor, Inc. | | | 60,670 | | | | 1,462,147 | |
Pediatrix Medical Group, Inc.(a) | | | 158,170 | | | | 2,611,387 | |
R1 RCM, Inc.(a) | | | 160,850 | | | | 2,980,551 | |
Tenet Healthcare Corp.(a) | | | 71,137 | | | | 3,669,246 | |
| | | | | | | | |
| | | | | | | 24,707,341 | |
| | | | | | | | |
| Health Care Technology–1.6% | |
Change Healthcare, Inc.(a) | | | 125,230 | | | | 3,442,573 | |
Computer Programs & Systems, Inc.(a) | | | 114,540 | | | | 3,193,375 | |
Health Catalyst, Inc.(a) | | | 86,254 | | | | 836,664 | |
NextGen Healthcare, Inc.(a) | | | 136,880 | | | | 2,422,776 | |
| | | | | | | | |
| | | | | | | 9,895,388 | |
| | | | | | | | |
| Life Sciences Tools & Services–1.7% | |
ICON PLC(a) | | | 9,955 | | | | 1,829,530 | |
Medpace Holdings, Inc.(a) | | | 26,932 | | | | 4,232,902 | |
NeoGenomics, Inc.(a) | | | 55,720 | | | | 479,749 | |
Repligen Corp.(a) | | | 10,136 | | | | 1,896,547 | |
Syneos Health, Inc.(a) | | | 43,206 | | | | 2,037,163 | |
| | | | | | | | |
| | | | | | | 10,475,891 | |
| | | | | | | | |
| Pharmaceuticals–0.8% | |
Corcept Therapeutics, Inc.(a) | | | 69,464 | | | | 1,781,057 | |
Intra-Cellular Therapies, Inc.(a) | | | 48,530 | | | | 2,258,101 | |
Revance Therapeutics, Inc.(a) | | | 32,047 | | | | 865,269 | |
| | | | | | | | |
| | | | | | | 4,904,427 | |
| | | | | | | | |
| | | | | | | 119,257,190 | |
| | | | | | | | |
| | | | | | | | |
| |
| Financials–16.3% | |
| Banks–8.9% | |
1st Source Corp. | | | 50,437 | | | | 2,335,233 | |
Associated Banc-Corp. | | | 193,710 | | | | 3,889,697 | |
Bancorp, Inc. (The)(a) | | | 136,568 | | | | 3,001,765 | |
Bank of NT Butterfield & Son Ltd. (The) | | | 46,720 | | | | 1,516,531 | |
Cathay General Bancorp | | | 68,550 | | | | 2,636,433 | |
Civista Bancshares, Inc. | | | 141,839 | | | | 2,944,578 | |
Community Trust Bancorp, Inc. | | | 72,960 | | | | 2,958,528 | |
First BanCorp./Puerto Rico | | | 290,210 | | | | 3,970,073 | |
First Citizens BancShares, Inc./NC–Class A | | | 3,353 | | | | 2,673,783 | |
Great Southern Bancorp, Inc. | | | 44,229 | | | | 2,524,149 | |
Hilltop Holdings, Inc. | | | 131,056 | | | | 3,256,742 | |
Home BancShares, Inc./AR | | | 152,270 | | | | 3,427,598 | |
International Bancshares Corp. | | | 79,390 | | | | 3,374,075 | |
Northeast Bank | | | 91,941 | | | | 3,371,476 | |
Republic Bancorp, Inc./KY–Class A | | | 52,740 | | | | 2,019,942 | |
Synovus Financial Corp. | | | 82,832 | | | | 3,107,028 | |
Texas Capital Bancshares, Inc.(a) | | | 42,170 | | | | 2,489,295 | |
Western Alliance Bancorp | | | 38,980 | | | | 2,562,545 | |
Wintrust Financial Corp. | | | 41,050 | | | | 3,347,627 | |
| | | | | | | | |
| | | | | | | 55,407,098 | |
| | | | | | | | |
| Capital Markets–1.1% | |
Evercore, Inc.–Class A | | | 27,032 | | | | 2,223,382 | |
| | | | | | | | |
| | | |
| Company | | Shares | | | U.S. $ Value | |
Houlihan Lokey, Inc. | | | 57,596 | | | $ | 4,341,586 | |
| | | | | | | | |
| | | | | | | 6,564,968 | |
| | | | | | | | |
| Consumer Finance–0.7% | |
Nelnet, Inc.–Class A | | | 39,533 | | | | 3,130,618 | |
OneMain Holdings, Inc. | | | 49,464 | | | | 1,460,178 | |
| | | | | | | | |
| | | | | | | 4,590,796 | |
| | | | | | | | |
| Insurance–2.4% | |
Assured Guaranty Ltd. | | | 52,060 | | | | 2,522,307 | |
Hanover Insurance Group, Inc. (The) | | | 24,840 | | | | 3,182,998 | |
Kinsale Capital Group, Inc. | | | 19,100 | | | | 4,878,522 | |
Palomar Holdings, Inc.(a) | | | 30,090 | | | | 2,519,135 | |
Primerica, Inc. | | | 11,890 | | | | 1,467,820 | |
| | | | | | | | |
| | | | | | | 14,570,782 | |
| | | | | | | | |
| Mortgage Real Estate Investment Trusts (REITs)–0.4% | |
Ellington Financial, Inc. | | | 117,851 | | | | 1,339,966 | |
PennyMac Mortgage Investment Trust | | | 99,930 | | | | 1,177,175 | |
| | | | | | | | |
| | | | | | | 2,517,141 | |
| | | | | | | | |
| Thrifts & Mortgage Finance–2.8% | |
BankUnited, Inc. | | | 121,229 | | | | 4,142,395 | |
Essent Group Ltd. | | | 83,977 | | | | 2,928,278 | |
Flagstar Bancorp, Inc. | | | 70,516 | | | | 2,355,234 | |
MGIC Investment Corp. | | | 266,780 | | | | 3,420,120 | |
Mr Cooper Group, Inc.(a) | | | 81,490 | | | | 3,300,345 | |
PennyMac Financial Services, Inc. | | | 32,538 | | | | 1,395,880 | |
| | | | | | | | |
| | | | | | | 17,542,252 | |
| | | | | | | | |
| | | | | | | 101,193,037 | |
| | | | | | | | |
| | | | | | | | |
| |
| Industrials–16.1% | |
| Aerospace & Defense–0.3% | |
Curtiss-Wright Corp. | | | 13,760 | | | | 1,914,842 | |
| | | | | | | | |
| Air Freight & Logistics–0.3% | |
Radiant Logistics, Inc.(a) | | | 343,333 | | | | 1,953,565 | |
| | | | | | | | |
| Building Products–1.7% | |
Builders FirstSource, Inc.(a) | | | 44,607 | | | | 2,628,245 | |
Masonite International Corp.(a) | | | 25,120 | | | | 1,790,805 | |
Simpson Manufacturing Co., Inc. | | | 30,835 | | | | 2,417,464 | |
UFP Industries, Inc. | | | 48,777 | | | | 3,519,748 | |
| | | | | | | | |
| | | | | | | 10,356,262 | |
| | | | | | | | |
| Commercial Services & Supplies–0.6% | |
Tetra Tech, Inc. | | | 28,892 | | | | 3,713,489 | |
| | | | | | | | |
| Construction & Engineering–3.6% | |
AECOM | | | 46,757 | | | | 3,196,776 | |
Arcosa, Inc. | | | 48,710 | | | | 2,785,238 | |
Comfort Systems USA, Inc. | | | 47,434 | | | | 4,616,751 | |
EMCOR Group, Inc. | | | 41,730 | | | | 4,818,980 | |
MasTec, Inc.(a) | | | 38,374 | | | | 2,436,749 | |
WillScot Mobile Mini Holdings Corp.(a) | | | 119,700 | | | | 4,827,501 | |
| | | | | | | | |
| | | | | | | 22,681,995 | |
| | | | | | | | |
| Electrical Equipment–0.4% | |
Regal Rexnord Corp. | | | 18,670 | | | | 2,620,521 | |
| | | | | | | | |
| Machinery–2.0% | |
Kadant, Inc. | | | 15,600 | | | | 2,602,236 | |
Oshkosh Corp. | | | 37,740 | | | | 2,652,745 | |
Shyft Group, Inc. (The) | | | 83,770 | | | | 1,711,421 | |
Terex Corp. | | | 67,380 | | | | 2,003,881 | |
Wabash National Corp. | | | 206,941 | | | | 3,220,002 | |
| | | | | | | | |
| | | | | | | 12,190,285 | |
| | | | | | | | |
| Marine–0.5% | |
Kirby Corp.(a) | | | 21,890 | | | | 1,330,255 | |
Star Bulk Carriers Corp. | | | 115,790 | | | | 2,024,009 | |
| | | | | | | | |
| | | | | | | 3,354,264 | |
| | | | | | | | |
| Professional Services–3.5% | |
CACI International, Inc.–Class A(a) | | | 6,426 | | | | 1,677,571 | |
Insperity, Inc. | | | 45,671 | | | | 4,662,552 | |
KBR, Inc. | | | 65,224 | | | | 2,818,981 | |
Kforce, Inc. | | | 54,640 | | | | 3,204,636 | |
Korn Ferry | | | 73,700 | | | | 3,460,215 | |
Science Applications International Corp. | | | 24,790 | | | | 2,192,180 | |
TriNet Group, Inc.(a) | | | 50,230 | | | | 3,577,381 | |
| | | | | | | | |
| | | | | | | 21,593,516 | |
| | | | | | | | |
| Road & Rail–0.6% | |
ArcBest Corp. | | | 48,672 | | | | 3,539,915 | |
| | | | | | | | |
| Trading Companies & Distributors–2.6% | |
Applied Industrial Technologies, Inc. | | | 38,577 | | | | 3,964,944 | |
Boise Cascade Co. | | | 49,552 | | | | 2,946,362 | |
GMS, Inc.(a) | | | 76,551 | | | | 3,062,806 | |
MRC Global, Inc.(a) | | | 343,490 | | | | 2,469,693 | |
Rush Enterprises, Inc.–Class A | | | 81,270 | | | | 3,564,502 | |
| | | | | | | | |
| | | | | | | 16,008,307 | |
| | | | | | | | |
| | | | | | | 99,926,961 | |
| | | | | | | | |
| | | | | | | | |
| |
| Information Technology–15.6% | |
| Communications Equipment–0.4% | |
Lumentum Holdings, Inc.(a) | | | 33,110 | | | | 2,270,353 | |
| | | | | | | | |
| Electronic Equipment, Instruments & Components–4.3% | |
Allegro MicroSystems, Inc.(a) | | | 115,920 | | | | 2,532,852 | |
Avnet, Inc. | | | 80,980 | | | | 2,924,998 | |
Fabrinet(a) | | | 24,738 | | | | 2,361,242 | |
Insight Enterprises, Inc.(a) | | | 40,480 | | | | 3,335,957 | |
Jabil, Inc. | | | 63,159 | | | | 3,644,906 | |
OSI Systems, Inc.(a) | | | 30,452 | | | | 2,194,371 | |
Sanmina Corp.(a) | | | 84,596 | | | | 3,898,184 | |
TD SYNNEX Corp. | | | 28,633 | | | | 2,324,713 | |
TTM Technologies, Inc.(a) | | | 254,330 | | | | 3,352,069 | |
| | | | | | | | |
| | | | | | | 26,569,292 | |
| | | | | | | | |
| IT Services–2.6% | |
Concentrix Corp. | | | 15,933 | | | | 1,778,601 | |
EVERTEC, Inc. | | | 81,834 | | | | 2,565,496 | |
Maximus, Inc. | | | 59,051 | | | | 3,417,281 | |
Perficient, Inc.(a) | | | 42,026 | | | | 2,732,530 | |
TTEC Holdings, Inc. | | | 29,680 | | | | 1,315,121 | |
Schedule of Investments (continued)
| | | | | | | | |
| | | |
| Company | | Shares | | | U.S. $ Value | |
WNS Holdings Ltd. (ADR)(a) | | | 53,182 | | | $ | 4,352,415 | |
| | | | | | | | |
| | | | | | | 16,161,444 | |
| | | | | | | | |
| Semiconductors & Semiconductor Equipment–2.8% | |
Kulicke & Soffa Industries, Inc. | | | 80,913 | | | | 3,117,578 | |
Lattice Semiconductor Corp.(a) | | | 39,768 | | | | 1,956,983 | |
MACOM Technology Solutions Holdings, Inc.(a) | | | 69,550 | | | | 3,601,995 | |
Onto Innovation, Inc.(a) | | | 51,040 | | | | 3,269,112 | |
SMART Global Holdings, Inc.(a) | | | 171,560 | | | | 2,722,657 | |
Synaptics, Inc.(a) | | | 26,579 | | | | 2,631,587 | |
| | | | | | | | |
| | | | | | | 17,299,912 | |
| | | | | | | | |
| Software–5.5% | |
A10 Networks, Inc. | | | 286,950 | | | | 3,807,826 | |
ACI Worldwide, Inc.(a) | | | 134,100 | | | | 2,802,690 | |
Box, Inc.–Class A(a) | | | 131,400 | | | | 3,204,846 | |
CommVault Systems, Inc.(a) | | | 74,518 | | | | 3,952,435 | |
Consensus Cloud Solutions, Inc.(a) | | | 26,223 | | | | 1,240,348 | |
Manhattan Associates, Inc.(a) | | | 28,135 | | | | 3,742,799 | |
MicroStrategy, Inc.–Class A(a) | | | 3,290 | | | | 698,335 | |
NCR Corp.(a) | | | 82,459 | | | | 1,567,546 | |
Progress Software Corp. | | | 71,561 | | | | 3,044,920 | |
Qualys, Inc.(a) | | | 31,100 | | | | 4,335,029 | |
SPS Commerce, Inc.(a) | | | 33,200 | | | | 4,124,436 | |
Varonis Systems, Inc.(a) | | | 64,340 | | | | 1,706,297 | |
| | | | | | | | |
| | | | | | | 34,227,507 | |
| | | | | | | | |
| | | | | | | 96,528,508 | |
| | | | | | | | |
| | | | | | | | |
| |
| Consumer Discretionary–10.8% | |
| Auto Components–1.3% | |
Dana, Inc. | | | 144,590 | | | | 1,652,664 | |
Fox Factory Holding Corp.(a) | | | 30,260 | | | | 2,392,961 | |
Goodyear Tire & Rubber Co. (The)(a) | | | 265,580 | | | | 2,679,702 | |
Patrick Industries, Inc. | | | 28,562 | | | | 1,252,158 | |
| | | | | | | | |
| | | | | | | 7,977,485 | |
| | | | | | | | |
| Automobiles–0.5% | |
Thor Industries, Inc. | | | 21,957 | | | | 1,536,551 | |
Winnebago Industries, Inc. | | | 28,686 | | | | 1,526,382 | |
| | | | | | | | |
| | | | | | | 3,062,933 | |
| | | | | | | | |
| Diversified Consumer Services–1.9% | |
Adtalem Global Education, Inc.(a) | | | 108,280 | | | | 3,946,806 | |
Hillenbrand, Inc. | | | 98,212 | | | | 3,606,345 | |
Mister Car Wash, Inc.(a) | | | 124,780 | | | | 1,070,612 | |
Perdoceo Education Corp.(a) | | | 299,602 | | | | 3,085,901 | |
| | | | | | | | |
| | | | | | | 11,709,664 | |
| | | | | | | | |
| Hotels, Restaurants & Leisure–3.0% | |
Churchill Downs, Inc. | | | 16,630 | | | | 3,062,414 | |
Dine Brands Global, Inc. | | | 49,470 | | | | 3,144,313 | |
Hilton Grand Vacations, Inc.(a) | | | 88,050 | | | | 2,895,965 | |
Marriott Vacations Worldwide Corp. | | | 22,896 | | | | 2,790,107 | |
Papa John’s International, Inc. | | | 42,000 | | | | 2,940,420 | |
Planet Fitness, Inc.–Class A(a) | | | 31,473 | | | | 1,814,733 | |
Travel & Leisure Co. | | | 57,381 | | | | 1,957,840 | |
| | | | | | | | |
| | | | | | | 18,605,792 | |
| | | | | | | | |
| Household Durables–1.6% | |
KB Home | | | 121,570 | | | | 3,151,095 | |
Lovesac Co. (The)(a) | | | 30,903 | | | | 629,803 | |
Taylor Morrison Home Corp.(a) | | | 169,641 | | | | 3,956,028 | |
TopBuild Corp.(a) | | | 14,676 | | | | 2,418,311 | |
| | | | | | | | |
| | | | | | | 10,155,237 | |
| | | | | | | | |
| Leisure Products–0.1% | |
MasterCraft Boat Holdings, Inc.(a) | | | 48,685 | | | | 917,712 | |
| | | | | | | | |
| Specialty Retail–0.8% | |
Citi Trends, Inc.(a) | | | 69,370 | | | | 1,075,928 | |
Lithia Motors, Inc. | | | 9,498 | | | | 2,037,796 | |
Sally Beauty Holdings, Inc.(a) | | | 138,400 | | | | 1,743,840 | |
| | | | | | | | |
| | | | | | | 4,857,564 | |
| | | | | | | | |
| Textiles, Apparel & Luxury Goods–1.6% | |
Carter’s, Inc. | | | 30,000 | | | | 1,965,900 | |
Crocs, Inc.(a) | | | 42,522 | | | | 2,919,560 | |
Deckers Outdoor Corp.(a) | | | 6,260 | | | | 1,956,939 | |
Oxford Industries, Inc. | | | 31,845 | | | | 2,859,044 | |
| | | | | | | | |
| | | | | | | 9,701,443 | |
| | | | | | | | |
| | | | | | | 66,987,830 | |
| | | | | | | | |
| | | | | | | | |
| |
| Energy–6.8% | |
| Energy Equipment & Services–1.6% | |
Cactus, Inc.–Class A | | | 48,160 | | | | 1,850,789 | |
ChampionX Corp. | | | 160,010 | | | | 3,131,396 | |
Helmerich & Payne, Inc. | | | 45,030 | | | | 1,664,759 | |
Oceaneering International, Inc.(a) | | | 129,500 | | | | 1,030,820 | |
Patterson-UTI Energy, Inc. | | | 195,790 | | | | 2,286,827 | |
| | | | | | | | |
| | | | | | | 9,964,591 | |
| | | | | | | | |
| Oil, Gas & Consumable Fuels–5.2% | |
Antero Resources Corp.(a) | | | 75,490 | | | | 2,304,710 | |
Chord Energy Corp. | | | 30,780 | | | | 4,209,781 | |
HF Sinclair Corp. | | | 71,532 | | | | 3,851,283 | |
Magnolia Oil & Gas Corp.–Class A | | | 186,550 | | | | 3,695,555 | |
Matador Resources Co. | | | 97,200 | | | | 4,755,024 | |
Ovintiv, Inc. | | | 69,830 | | | | 3,212,180 | |
PBF Energy, Inc.–Class A(a) | | | 117,970 | | | | 4,147,825 | |
PDC Energy, Inc. | | | 63,590 | | | | 3,674,866 | |
Teekay Tankers Ltd.–Class A(a) | | | 74,415 | | | | 2,049,389 | |
| | | | | | | | |
| | | | | | | 31,900,613 | |
| | | | | | | | |
| | | | | | | 41,865,204 | |
| | | | | | | | |
| | | | | | | | |
| |
| Real Estate–5.7% | |
| Equity Real Estate Investment Trusts (REITs)–5.1% | |
Alexander & Baldwin, Inc.(a) | | | 171,509 | | | | 2,843,619 | |
Apple Hospitality REIT, Inc. | | | 241,860 | | | | 3,400,552 | |
Armada Hoffler Properties, Inc. | | | 173,950 | | | | 1,805,601 | |
CareTrust REIT, Inc. | | | 75,347 | | | | 1,364,534 | |
Cousins Properties, Inc. | | | 48,306 | | | | 1,127,945 | |
First Industrial Realty Trust, Inc. | | | 49,856 | | | | 2,234,047 | |
Healthcare Realty Trust, Inc. | | | 106,430 | | | | 2,219,066 | |
| | | | | | | | |
| | | |
| Company | | Shares | | | U.S. $ Value | |
Industrial Logistics Properties Trust | | | 96,380 | | | $ | 530,090 | |
NexPoint Residential Trust, Inc. | | | 49,210 | | | | 2,273,994 | |
Physicians Realty Trust | | | 151,582 | | | | 2,279,793 | |
RLJ Lodging Trust | | | 293,659 | | | | 2,971,829 | |
Sabra Health Care REIT, Inc. | | | 207,190 | | | | 2,718,333 | |
STAG Industrial, Inc. | | | 91,124 | | | | 2,590,655 | |
Terreno Realty Corp. | | | 35,224 | | | | 1,866,520 | |
VICI Properties, Inc. | | | 51,757 | | | | 1,544,947 | |
| | | | | | | | |
| | | | | | | 31,771,525 | |
| | | | | | | | |
| Real Estate Management & Development–0.6% | |
Anywhere Real Estate, Inc.(a) | | | 205,091 | | | | 1,663,288 | |
RE/MAX Holdings, Inc.–Class A | | | 95,093 | | | | 1,798,208 | |
| | | | | | | | |
| | | | | | | 3,461,496 | |
| | | | | | | | |
| | | | | | | 35,233,021 | |
| | | | | | | | |
| | | | | | | | |
| |
| Materials–3.2% | |
| Chemicals–1.5% | |
AdvanSix, Inc. | | | 86,330 | | | | 2,771,193 | |
Huntsman Corp. | | | 107,875 | | | | 2,647,252 | |
Innospec, Inc. | | | 29,290 | | | | 2,509,274 | |
Orion Engineered Carbons SA | | | 73,990 | | | | 987,767 | |
| | | | | | | | |
| | | | | | | 8,915,486 | |
| | | | | | | | |
| Metals & Mining–1.3% | |
B2Gold Corp. | | | 436,440 | | | | 1,405,337 | |
Commercial Metals Co. | | | 73,232 | | | | 2,598,272 | |
Reliance Steel & Aluminum Co. | | | 17,822 | | | | 3,108,335 | |
Schnitzer Steel Industries, Inc.–Class A | | | 38,420 | | | | 1,093,433 | |
| | | | | | | | |
| | | | | | | 8,205,377 | |
| | | | | | | | |
| Paper & Forest Products–0.4% | |
Louisiana-Pacific Corp. | | | 47,815 | | | | 2,447,650 | |
| | | | | | | | |
| | | | | | | 19,568,513 | |
| | | | | | | | |
| | | | | | | | |
| |
| Utilities–2.5% | |
| Electric Utilities–1.6% | |
ALLETE, Inc. | | | 72,710 | | | | 3,639,135 | |
IDACORP, Inc. | | | 28,340 | | | | 2,805,943 | |
Portland General Electric Co. | | | 76,410 | | | | 3,320,779 | |
| | | | | | | | |
| | | | | | | 9,765,857 | |
| | | | | | | | |
| Gas Utilities–0.4% | |
Chesapeake Utilities Corp. | | | 21,720 | | | | 2,506,271 | |
| | | | | | | | |
| Multi-Utilities–0.5% | |
NorthWestern Corp. | | | 60,435 | | | | 2,978,237 | |
| | | | | | | | |
| | | | | | | 15,250,365 | |
| | | | | | | | |
| | | | | | | | |
| |
| Consumer Staples–2.2% | |
| Food & Staples Retailing–0.3% | |
Village Super Market, Inc.–Class A | | | 104,068 | | | | 2,011,634 | |
| | | | | | | | |
| Food Products–1.6% | |
Cal-Maine Foods, Inc. | | | 45,210 | | | | 2,513,224 | |
Hain Celestial Group, Inc. (The)(a) | | | 110,535 | | | | 1,865,831 | |
John B Sanfilippo & Son, Inc. | | | 39,555 | | | | 2,995,500 | |
Nomad Foods Ltd.(a) | | | 194,110 | | | | 2,756,362 | |
| | | | | | | | |
| | | | | | | 10,130,917 | |
| | | | | | | | |
| Personal Products–0.3% | |
USANA Health Sciences, Inc.(a) | | | 27,150 | | | | 1,521,758 | |
| | | | | | | | |
| | | | | | | 13,664,309 | |
| | | | | | | | |
| | | | | | | | |
| |
| Communication Services–1.2% | |
| Entertainment–0.1% | |
IMAX Corp.(a) | | | 61,810 | | | | 872,757 | |
| | | | | | | | |
| Interactive Media & Services–0.5% | |
Ziff Davis, Inc.(a) | | | 43,809 | | | | 3,000,041 | |
| | | | | | | | |
| Media–0.6% | |
Nexstar Media Group, Inc.–Class A | | | 22,398 | | | | 3,737,106 | |
| | | | | | | | |
| | | | | | | 7,609,904 | |
| | | | | | | | |
Total Common Stocks
(cost $564,161,755) | | | | | | | 617,084,842 | |
| | | | | | | | |
| | | | | | | | |
| |
| SHORT-TERM INVESTMENTS–0.2% | |
| Investment Companies–0.2% | |
AB Fixed Income Shares, Inc.–Government Money Market Portfolio–Class AB, 2.58%(b)(c)(d)
(cost $1,374,218) | | | 1,374,218 | | | | 1,374,218 | |
| | | | | | | | |
Total Investments—99.8%
(cost $565,535,973) | | | | | | | 618,459,060 | |
| | |
Other assets less liabilities—0.2% | | | | | | | 1,348,884 | |
| | | | | | | | |
| Net Assets—100.0% | | | | | | $ | 619,807,944 | |
| | | | | | | | |
| | | | | | | | | | | | | | |
| |
| FUTURES (see Note 3) | |
| Description | | Number of
Contracts | | | Expiration
Month | | Current
Notional | | | Value and
Unrealized
Appreciation/
(Depreciation) | |
| Purchased Contracts | |
| | | | |
E-Mini Russell 2000 Futures | | | 160 | | | December 2022 | | $ | 13,358,400 | | | $ | (1,947,483) | |
Schedule of Investments (continued)
| (a) | | Non-income producing security. |
| (b) | | Affiliated investments. |
| (c) | | The rate shown represents the 7-day yield as of period end. |
| (d) | | To obtain a copy of the fund’s shareholder report, please go to the Securities and Exchange Commission’s website at www.sec.gov, or call AB at (800) 227-4618. |
Glossary:
ADR—American Depositary Receipt
REIT—Real Estate Investment Trust
See notes to financial statements.
Schedule of Investments
Bernstein Fund, Inc.
Schedule of Investments
International Small Cap Portfolio
September 30, 2022
| | | | | | | | |
| | |
| Company | | Shares | | | U.S. $ Value | |
|
| COMMON STOCKS–95.2% | |
|
| Industrials–20.7% | |
| Aerospace & Defense–2.1% | |
Babcock International Group PLC(a) | | | 1,431,128 | | | $ | 4,419,216 | |
QinetiQ Group PLC | | | 596,565 | | | | 2,176,992 | |
Saab AB–Class B | | | 458,606 | | | | 14,288,718 | |
| | | | | | | | |
| | | | | | | 20,884,926 | |
| | | | | | | | |
| Air Freight & Logistics–0.4% | |
Cia de Distribucion Integral Logista Holdings SA | | | 126,952 | | | | 2,313,561 | |
Mitsui-Soko Holdings Co., Ltd. | | | 53,700 | | | | 1,139,334 | |
| | | | | | | | |
| | | | | | | 3,452,895 | |
| | | | | | | | |
| Airlines–0.4% | |
Wizz Air Holdings PLC(a)(b) | | | 237,496 | | | | 4,131,198 | |
| | | | | | | | |
| Building Products–0.8% | |
Bunka Shutter Co., Ltd. | | | 316,800 | | | | 2,244,210 | |
Fletcher Building Ltd. | | | 1,526,150 | | | | 4,134,094 | |
Inwido AB | | | 216,876 | | | | 1,705,517 | |
| | | | | | | | |
| | | | | | | 8,083,821 | |
| | | | | | | | |
| Commercial Services & Supplies–1.8% | |
Biffa PLC(b) | | | 1,976,282 | | | | 9,091,265 | |
Downer EDI Ltd. | | | 2,133,090 | | | | 6,239,296 | |
Intrum AB | | | 75,520 | | | | 949,189 | |
Serco Group PLC | | | 1,220,668 | | | | 2,117,273 | |
| | | | | | | | |
| | | | | | | 18,397,023 | |
| | | | | | | | |
| Construction & Engineering–1.8% | |
Balfour Beatty PLC | | | 2,289,174 | | | | 7,831,514 | |
Hazama Ando Corp. | | | 1,470,700 | | | | 8,490,748 | |
Veidekke ASA | | | 256,810 | | | | 1,921,085 | |
| | | | | | | | |
| | | | | | | 18,243,347 | |
| | | | | | | | |
| Electrical Equipment–2.3% | |
Fuji Electric Co., Ltd. | | | 255,100 | | | | 9,349,634 | |
Luceco PLC(b) | | | 330,205 | | | | 303,997 | |
Nexans SA | | | 97,920 | | | | 8,716,647 | |
TKH Group NV | | | 155,399 | | | | 5,034,279 | |
| | | | | | | | |
| | | | | | | 23,404,557 | |
| | | | | | | | |
| Industrial Conglomerates–1.1% | |
Bidvest Group Ltd. (The) | | | 753,200 | | | | 8,178,670 | |
Chargeurs SA | | | 87,060 | | | | 1,003,422 | |
Sembcorp Industries Ltd. | | | 938,000 | | | | 2,003,466 | |
| | | | | | | | |
| | | | | | | 11,185,558 | |
| | | | | | | | |
| Machinery–4.7% | |
Amada Co., Ltd. | | | 1,308,100 | | | | 8,888,401 | |
ANDRITZ AG | | | 62,810 | | | | 2,658,106 | |
ATS Automation Tooling Systems, Inc.(a) | | | 345,637 | | | | 9,122,905 | |
Duerr AG | | | 209,095 | | | | 4,347,882 | |
Ebara Corp. | | | 68,000 | | | | 2,215,793 | |
IMI PLC | | | 162,810 | | | | 2,013,323 | |
Kawasaki Heavy Industries Ltd. | | | 284,600 | | | | 4,316,839 | |
Morgan Advanced Materials PLC | | | 677,890 | | | | 1,718,159 | |
Nabtesco Corp. | | | 290,800 | | | | 5,948,759 | |
Turk Traktor ve Ziraat Makineleri AS | | | 117,500 | | | | 1,771,166 | |
Valmet Oyj | | | 94,760 | | | | 1,915,689 | |
YAMABIKO Corp. | | | 276,800 | | | | 2,119,175 | |
| | | | | | | | |
| | | | | | | 47,036,197 | |
| | | | | | | | |
| Marine–0.2% | |
Golden Ocean Group Ltd. | | | 237,951 | | | | 1,779,491 | |
| | | | | | | | |
| Professional Services–2.2% | |
BayCurrent Consulting, Inc. | | | 10,000 | | | | 2,594,333 | |
Danel Adir Yeoshua Ltd. | | | 19,500 | | | | 2,039,235 | |
Dip Corp. | | | 283,900 | | | | 7,211,934 | |
NICE Information Service Co., Ltd. | | | 108,024 | | | | 1,002,987 | |
Teleperformance | | | 20,780 | | | | 5,271,549 | |
UT Group Co., Ltd. | | | 261,900 | | | | 4,300,411 | |
| | | | | | | | |
| | | | | | | 22,420,449 | |
| | | | | | | | |
| Road & Rail–0.7% | |
Hamakyorex Co., Ltd. | | | 51,800 | | | | 1,122,473 | |
Maruzen Showa Unyu Co., Ltd. | | | 50,300 | | | | 1,065,670 | |
Redde Northgate PLC | | | 461,870 | | | | 1,492,954 | |
Senko Group Holdings Co., Ltd. | | | 372,800 | | | | 2,463,409 | |
Trancom Co., Ltd. | | | 22,300 | | | | 1,172,412 | |
| | | | | | | | |
| | | | | | | 7,316,918 | |
| | | | | | | | |
| Trading Companies & Distributors–1.0% | |
Howden Joinery Group PLC | | | 305,640 | | | | 1,707,470 | |
Inaba Denki Sangyo Co., Ltd. | | | 124,900 | | | | 2,354,387 | |
Russel Metals, Inc. | | | 105,225 | | | | 1,957,710 | |
Solar A/S–Class B | | | 27,288 | | | | 1,786,125 | |
Yuasa Trading Co., Ltd. | | | 95,500 | | | | 2,311,100 | |
| | | | | | | | |
| | | | | | | 10,116,792 | |
| | | | | | | | |
| Transportation Infrastructure–1.2% | |
Anhui Expressway Co., Ltd.–Class H | | | 2,956,000 | | | | 1,879,795 | |
Grupo Aeroportuario del Centro Norte SAB de CV | | | 1,216,552 | | | | 7,652,870 | |
Sumitomo Warehouse Co., Ltd. (The) | | | 168,800 | | | | 2,293,577 | |
| | | | | | | | |
| | | | | | | 11,826,242 | |
| | | | | | | | |
| | | | | | | 208,279,414 | |
| | | | | | | | |
| | | | | | | | |
| |
| Consumer Discretionary–13.0% | |
| Auto Components–2.5% | |
Faurecia SE(a) | | | 395,578 | | | | 4,282,059 | |
Mahle-Metal Leve SA | | | 427,600 | | | | 1,843,776 | |
Nexteer Automotive Group Ltd. | | | 2,060,000 | | | | 1,113,499 | |
NGK Spark Plug Co., Ltd. | | | 143,300 | | | | 2,541,503 | |
PWR Holdings Ltd. | | | 434,740 | | | | 2,353,602 | |
Schaeffler AG (Preference Shares) | | | 411,700 | | | | 1,846,549 | |
Toyo Tire Corp. | | | 672,794 | | | | 7,323,074 | |
Tube Investments of India Ltd. | | | 104,647 | | | | 3,466,904 | |
| | | | | | | | |
| | | | | | | 24,770,966 | |
| | | | | | | | |
Schedule of Investments (continued)
| | | | | | | | |
| | | |
| Company | | Shares | | | U.S. $ Value | |
| Automobiles–0.4% | |
Piaggio & C SpA | | | 1,984,869 | | | $ | 3,996,585 | |
| | | | | | | | |
| Diversified Consumer Services–0.7% | |
Benesse Holdings, Inc. | | | 464,800 | | | | 6,920,493 | |
| | | | | | | | |
| Hotels, Restaurants & Leisure–3.6% | |
Domino’s Pizza Group PLC | | | 775,261 | | | | 1,926,865 | |
Entain PLC | | | 459,752 | | | | 5,497,005 | |
Greggs PLC | | | 116,263 | | | | 2,196,217 | |
Jollibee Foods Corp. | | | 2,325,880 | | | | 9,074,339 | |
Jumbo Interactive Ltd. | | | 251,460 | | | | 1,917,703 | |
KFC Holdings Japan Ltd. | | | 114,300 | | | | 2,138,642 | |
Kindred Group PLC (SDR) | | | 792,369 | | | | 5,937,608 | |
Tongcheng Travel Holdings Ltd.(a) | | | 4,162,000 | | | | 8,122,161 | |
| | | | | | | | |
| | | | | | | 36,810,540 | |
| | | | | | | | |
| Household Durables–1.0% | |
Ki-Star Real Estate Co., Ltd. | | | 181,500 | | | | 5,448,355 | |
Redrow PLC | | | 847,956 | | | | 3,733,671 | |
Vistry Group PLC | | | 114,260 | | | | 751,429 | |
| | | | | | | | |
| | | | | | | 9,933,455 | |
| | | | | | | | |
| Leisure Products–1.0% | |
BRP, Inc. | | | 108,845 | | | | 6,704,761 | |
MIPS AB(b) | | | 30,464 | | | | 904,329 | |
Sega Sammy Holdings, Inc. | | | 168,400 | | | | 2,293,530 | |
| | | | | | | | |
| | | | | | | 9,902,620 | |
| | | | | | | | |
| Multiline Retail–0.4% | |
Europris ASA(b) | | | 429,414 | | | | 2,147,634 | |
Warehouse Group Ltd. (The) | | | 1,165,510 | | | | 2,015,538 | |
| | | | | | | | |
| | | | | | | 4,163,172 | |
| | | | | | | | |
| Specialty Retail–1.2% | |
Delek Automotive Systems Ltd. | | | 205,270 | | | | 2,771,295 | |
EDION Corp. | | | 259,400 | | | | 2,109,817 | |
Kohnan Shoji Co., Ltd. | | | 88,900 | | | | 2,077,860 | |
Mobilezone Holding AG (REG) | | | 81,487 | | | | 1,219,148 | |
Pet Valu Holdings Ltd. | | | 101,491 | | | | 2,553,163 | |
Sleep Country Canada Holdings, Inc.(b) | | | 108,970 | | | | 1,930,355 | |
| | | | | | | | |
| | | | | | | 12,661,638 | |
| | | | | | | | |
| Textiles, Apparel & Luxury Goods–2.2% | |
Asics Corp. | | | 561,500 | | | | 8,942,468 | |
Handsome Co., Ltd. | | | 76,556 | | | | 1,362,544 | |
HUGO BOSS AG | | | 102,391 | | | | 4,767,409 | |
JNBY Design Ltd.(b) | | | 1,194,500 | | | | 1,165,374 | |
Marimekko Oyj | | | 177,880 | | | | 1,508,718 | |
Pandora A/S | | | 87,744 | | | | 4,103,459 | |
| | | | | | | | |
| | | | | | | 21,849,972 | |
| | | | | | | | |
| | | | | | | 131,009,441 | |
| | | | | | | | |
| | | | | | | | |
| |
| Information Technology–10.8% | |
| Communications Equipment–0.7% | |
Sterlite Technologies Ltd. | | | 2,860,052 | | | | 5,765,307 | |
VTech Holdings Ltd. | | | 282,700 | | | | 1,620,858 | |
| | | | | | | | |
| | | | | | | 7,386,165 | |
| | | | | | | | |
| Electronic Equipment, Instruments & Components–3.0% | |
Anritsu Corp. | | | 201,200 | | | | 2,187,272 | |
E Ink Holdings, Inc. | | | 2,382,000 | | | | 15,725,808 | |
Horiba Ltd. | | | 2,900 | | | | 112,479 | |
Kaga Electronics Co., Ltd. | | | 95,600 | | | | 2,670,237 | |
SOLUM Co., Ltd.(a) | | | 235,823 | | | | 3,084,654 | |
Test Research, Inc. | | | 1,013,000 | | | | 1,975,065 | |
Tong Hsing Electronic Industries Ltd. | | | 853,000 | | | | 4,434,325 | |
| | | | | | | | |
| | | | | | | 30,189,840 | |
| | | | | | | | |
| IT Services–0.8% | |
Computacenter PLC | | | 88,353 | | | | 1,906,915 | |
Data#3 Ltd. | | | 671,466 | | | | 2,669,355 | |
NSD Co., Ltd. | | | 58,700 | | | | 999,214 | |
Sonata Software Ltd. | | | 329,790 | | | | 2,084,826 | |
| | | | | | | | |
| | | | | | | 7,660,310 | |
| | | | | | | | |
| Semiconductors & Semiconductor Equipment–4.2% | |
ASM International NV | | | 24,111 | | | | 5,398,623 | |
ASPEED Technology, Inc. | | | 33,000 | | | | 1,816,241 | |
BE Semiconductor Industries NV | | | 22,413 | | | | 959,508 | |
Elan Microelectronics Corp. | | | 469,000 | | | | 1,222,179 | |
Elite Semiconductor Microelectronics Technology, Inc. | | | 337,000 | | | | 669,964 | |
Himax Technologies, Inc. (ADR) | | | 607,023 | | | | 2,937,991 | |
LX Semicon Co., Ltd. | | | 35,463 | | | | 1,856,903 | |
Melexis NV | | | 31,230 | | | | 2,112,784 | |
Optorun Co., Ltd. | | | 341,300 | | | | 4,927,791 | |
Phison Electronics Corp. | | | 137,000 | | | | 1,133,547 | |
Pixart Imaging, Inc. | | | 310,000 | | | | 829,698 | |
Rorze Corp. | | | 91,900 | | | | 4,436,773 | |
Sanken Electric Co., Ltd. | | | 150,600 | | | | 4,600,547 | |
SCREEN Holdings Co., Ltd. | | | 39,700 | | | | 2,154,079 | |
Sino-American Silicon Products, Inc. | | | 451,000 | | | | 1,842,317 | |
Sitronix Technology Corp. | | | 163,000 | | | | 837,444 | |
Tokyo Seimitsu Co., Ltd. | | | 75,800 | | | | 2,229,828 | |
u-blox Holding AG | | | 21,283 | | | | 2,577,400 | |
| | | | | | | | |
| | | | | | | 42,543,617 | |
| | | | | | | | |
| Software–1.0% | |
Hilan Ltd. | | | 43,303 | | | | 2,312,915 | |
Iress Ltd. | | | 319,783 | | | | 1,823,729 | |
Magic Software Enterprises Ltd. | | | 52,859 | | | | 818,460 | |
Tanla Platforms Ltd. | | | 536,326 | | | | 5,117,763 | |
Truecaller AB–Class B(a) | | | 93,890 | | | | 317,381 | |
| | | | | | | | |
| | | | | | | 10,390,248 | |
| | | | | | | | |
| Technology Hardware, Storage & Peripherals–1.1% | |
Asia Vital Components Co., Ltd. | | | 2,316,000 | | | | 8,068,322 | |
Gigabyte Technology Co., Ltd. | | | 91,000 | | | | 251,627 | |
Konica Minolta, Inc. | | | 764,100 | | | | 2,355,345 | |
| | | | | | | | |
| | | | | | | 10,675,294 | |
| | | | | | | | |
| | | | | | | 108,845,474 | |
| | | | | | | | |
| | | | | | | | |
| |
| Financials–10.6% | |
| Banks–4.4% | |
Aozora Bank Ltd. | | | 68,800 | | | | 1,230,035 | |
| | | | | | | | |
| | | |
| Company | | Shares | | | U.S. $ Value | |
Bank of Ireland Group PLC | | | 1,672,646 | | | $ | 10,728,325 | |
Bank Pembangunan Daerah Jawa Barat Dan Banten Tbk PT | | | 29,172,000 | | | | 2,591,893 | |
Bank Pembangunan Daerah Jawa Timur Tbk PT | | | 47,991,500 | | | | 2,237,660 | |
Bankinter SA | | | 536,158 | | | | 3,010,461 | |
BAWAG Group AG(b) | | | 162,574 | | | | 6,988,776 | |
BNK Financial Group, Inc. | | | 438,540 | | | | 1,831,028 | |
Close Brothers Group PLC | | | 154,680 | | | | 1,592,091 | |
Kiatnakin Phatra Bank PCL | | | 1,190,500 | | | | 2,169,854 | |
Seven Bank Ltd. | | | 660,900 | | | | 1,184,076 | |
Spar Nord Bank A/S | | | 203,170 | | | | 2,267,325 | |
SpareBank 1 SMN | | | 199,682 | | | | 2,037,626 | |
Sydbank AS | | | 82,108 | | | | 2,248,752 | |
Virgin Money UK PLC | | | 2,691,059 | | | | 3,691,907 | |
| | | | | | | | |
| | | | | | | 43,809,809 | |
| | | | | | | | |
| Capital Markets–2.6% | |
Azimut Holding SpA | | | 465,644 | | | | 6,641,612 | |
Banca Generali SpA | | | 74,870 | | | | 2,076,415 | |
IG Group Holdings PLC | | | 1,080,212 | | | | 9,154,544 | |
Intermediate Capital Group PLC | | | 523,670 | | | | 5,649,094 | |
Man Group PLC/Jersey | | | 926,456 | | | | 2,293,974 | |
Polar Capital Holdings PLC | | | 170,419 | | | | 789,668 | |
| | | | | | | | |
| | | | | | | 26,605,307 | |
| | | | | | | | |
| Consumer Finance–0.9% | |
Jaccs Co., Ltd. | | | 93,300 | | | | 2,317,992 | |
Shriram Transport Finance Co., Ltd. | | | 342,671 | | | | 4,987,656 | |
Sun Hung Kai & Co., Ltd. | | | 4,246,000 | | | | 1,529,377 | |
| | | | | | | | |
| | | | | | | 8,835,025 | |
| | | | | | | | |
| Diversified Financial Services–0.3% | |
REC Ltd. | | | 2,179,913 | | | | 2,507,787 | |
| | | | | | | | |
| Insurance–1.7% | |
Beazley PLC | | | 1,669,811 | | | | 10,408,943 | |
Coface SA(a) | | | 249,195 | | | | 2,381,299 | |
Protector Forsikring ASA | | | 212,800 | | | | 2,196,696 | |
Santam Ltd. | | | 169,337 | | | | 2,324,719 | |
| | | | | | | | |
| | | | | | | 17,311,657 | |
| | | | | | | | |
| Thrifts & Mortgage Finance–0.7% | |
Home Capital Group, Inc. | | | 355,457 | | | | 7,076,460 | |
| | | | | | | | |
| | | | | | | 106,146,045 | |
| | | | | | | | |
| | | | | | | | |
| |
| Materials–10.5% | |
| Chemicals–3.7% | |
China General Plastics Corp. | | | 202,224 | | | | 130,220 | |
Dongjin Semichem Co., Ltd. | | | 79,540 | | | | 1,449,243 | |
Elkem ASA(b) | | | 689,240 | | | | 2,214,982 | |
Gujarat Narmada Valley Fertilizers & Chemicals Ltd. | | | 1,263,889 | | | | 9,882,623 | |
Hansol Chemical Co., Ltd. | | | 29,811 | | | | 3,484,695 | |
Incitec Pivot Ltd. | | | 3,222,174 | | | | 7,326,809 | |
Polyplex Corp. Ltd. | | | 76,751 | | | | 1,851,363 | |
Tosoh Corp. | | | 509,900 | | | | 5,683,021 | |
Zeon Corp. | | | 539,700 | | | | 4,769,791 | |
| | | | | | | | |
| | | | | | | 36,792,747 | |
| | | | | | | | |
| Construction Materials–0.2% | |
CSR Ltd. | | | 566,856 | | | | 1,615,382 | |
| | | | | | | | |
| Containers & Packaging–1.1% | |
Orora Ltd. | | | 3,233,115 | | | | 6,232,942 | |
Rengo Co., Ltd. | | | 839,900 | | | | 4,890,669 | |
| | | | | | | | |
| | | | | | | 11,123,611 | |
| | | | | | | | |
| Metals & Mining–4.5% | |
APERAM SA | | | 184,344 | | | | 4,350,181 | |
Central Asia Metals PLC | | | 681,782 | | | | 1,651,899 | |
Champion Iron Ltd. | | | 723,886 | | | | 2,249,650 | |
Endeavour Mining PLC | | | 354,245 | | | | 6,534,305 | |
Fushan International Energy Group Ltd. | | | 1,900,000 | | | | 550,637 | |
Grange Resources Ltd. | | | 3,177,370 | | | | 1,423,878 | |
Kardemir Karabuk Demir Celik Sanayi ve Ticaret AS–Class D | | | 4,033,589 | | | | 2,587,164 | |
Labrador Iron Ore Royalty Corp. | | | 109,494 | | | | 2,291,578 | |
Lundin Mining Corp. | | | 970,459 | | | | 4,903,756 | |
Mitsui Mining & Smelting Co., Ltd. | | | 108,200 | | | | 2,270,147 | |
OZ Minerals Ltd. | | | 511,093 | | | | 8,455,160 | |
Pan African Resources PLC | | | 10,272,266 | | | | 2,009,261 | |
Perenti Global Ltd. | | | 3,341,230 | | | | 1,965,749 | |
SSAB AB–Class B | | | 592,671 | | | | 2,525,654 | |
Wesdome Gold Mines Ltd.(a) | | | 245,150 | | | | 1,657,582 | |
| | | | | | | | |
| | | | | | | 45,426,601 | |
| | | | | | | | |
| Paper & Forest Products–1.0% | |
Daiken Corp. | | | 146,600 | | | | 1,849,701 | |
Interfor Corp.(a) | | | 365,426 | | | | 6,396,641 | |
Ta Ann Holdings Bhd | | | 2,535,000 | | | | 1,765,808 | |
| | | | | | | | |
| | | | | | | 10,012,150 | |
| | | | | | | | |
| | | | | | | 104,970,491 | |
| | | | | | | | |
| | | | | | | | |
| |
| Communication Services–8.4% | |
| Diversified Telecommunication Services–0.2% | |
Telecom Egypt Co. | | | 3,021,580 | | | | 2,647,455 | |
| | | | | | | | |
| Entertainment–3.8% | |
Capcom Co., Ltd. | | | 449,500 | | | | 11,317,249 | |
CTS Eventim AG & Co. KGaA(a) | | | 51,440 | | | | 2,116,338 | |
GungHo Online Entertainment, Inc. | | | 438,400 | | | | 6,734,519 | |
International Games System Co., Ltd. | | | 886,000 | | | | 9,988,635 | |
Rovio Entertainment Oyj(b) | | | 369,830 | | | | 2,056,187 | |
Soft-World International Corp. | | | 482,000 | | | | 1,067,655 | |
Ubisoft Entertainment SA(a) | | | 165,404 | | | | 4,545,719 | |
| | | | | | | | |
| | | | | | | 37,826,302 | |
| | | | | | | | |
| Interactive Media & Services–0.1% | |
AfreecaTV Co., Ltd. | | | 24,970 | | | | 1,091,364 | |
| | | | | | | | |
| Media–4.3% | |
Affle India Ltd.(a) | | | 184,258 | | | | 2,816,771 | |
Cogeco Communications, Inc. | | | 118,378 | | | | 6,179,634 | |
Criteo SA (Sponsored ADR)(a) | | | 278,893 | | | | 7,538,478 | |
IPSOS | | | 23,270 | | | | 1,039,917 | |
Schedule of Investments (continued)
| | | | | | | | |
| | | |
| Company | | Shares | | | U.S. $ Value | |
Kadokawa Corp. | | | 451,100 | | | $ | 8,270,879 | |
Rightmove PLC | | | 412,010 | | | | 2,198,033 | |
Stroeer SE & Co. KGaA | | | 143,511 | | | | 5,405,399 | |
Sun TV Network Ltd. | | | 1,339,249 | | | | 8,347,925 | |
Television Francaise 1 | | | 183,883 | | | | 1,050,487 | |
| | | | | | | | |
| | | | | | | 42,847,523 | |
| | | | | | | | |
| | | | | | | 84,412,644 | |
| | | | | | | | |
| | | | | | | | |
| |
| Health Care–6.1% | |
| Biotechnology–1.0% | |
BioGaia AB–Class B | | | 114,043 | | | | 790,494 | |
Clinuvel Pharmaceuticals Ltd. | | | 132,351 | | | | 1,569,892 | |
Hugel, Inc.(a) | | | 76,845 | | | | 5,434,084 | |
Pharma Mar SA | | | 42,516 | | | | 2,251,628 | |
| | | | | | | | |
| | | | | | | 10,046,098 | |
| | | | | | | | |
| Health Care Equipment & Supplies–2.1% | |
ConvaTec Group PLC(b) | | | 2,993,112 | | | | 6,802,060 | |
Getinge AB–Class B | | | 351,161 | | | | 6,005,246 | |
LivaNova PLC(a) | | | 135,404 | | | | 6,874,461 | |
Riverstone Holdings Ltd. | | | 4,454,800 | | | | 1,783,471 | |
| | | | | | | | |
| | | | | | | 21,465,238 | |
| | | | | | | | |
| Health Care Providers & Services–0.6% | |
Australian Clinical Labs Ltd.(b) | | | 674,640 | | | | 1,524,993 | |
Chularat Hospital PCL–Class F | | | 24,378,800 | | | | 2,378,420 | |
Odontoprev SA | | | 1,411,080 | | | | 2,301,946 | |
| | | | | | | | |
| | | | | | | 6,205,359 | |
| | | | | | | | |
| Life Sciences Tools & Services–0.8% | |
Chemometec A/S | | | 23,263 | | | | 1,759,613 | |
Gerresheimer AG | | | 117,223 | | | | 5,723,511 | |
| | | | | | | | |
| | | | | | | 7,483,124 | |
| | | | | | | | |
| Pharmaceuticals–1.6% | |
Chong Kun Dang Pharmaceutical Corp. | | | 16,828 | | | | 917,665 | |
Faes Farma SA | | | 496,093 | | | | 1,797,134 | |
Huons Co., Ltd. | | | 37,076 | | | | 819,292 | |
Hypera SA | | | 943,700 | | | | 7,741,197 | |
Mega Lifesciences PCL | | | 1,867,400 | | | | 2,289,694 | |
Sanofi India Ltd. | | | 29,225 | | | | 2,074,163 | |
| | | | | | | | |
| | | | | | | 15,639,145 | |
| | | | | | | | |
| | | | | | | 60,838,964 | |
| | | | | | | | |
| | | | | | | | |
| |
| Real Estate–5.8% | |
| Equity Real Estate Investment Trusts (REITs)–3.0% | |
AIMS APAC REIT | | | 2,543,900 | | | | 2,261,548 | |
Charter Hall Retail REIT | | | 2,876,456 | | | | 6,822,464 | |
H&R Real Estate Investment Trust | | | 243,360 | | | | 1,832,225 | |
Immobiliare Grande Distribuzione SIIQ SpA | | | 669,751 | | | | 1,828,136 | |
Keppel Pacific Oak US REIT(b) | | | 3,323,900 | | | | 1,824,113 | |
Killam Apartment Real Estate Investment Trust | | | 570,280 | | | | 6,295,848 | |
Manulife US Real Estate Investment Trust(b) | | | 4,141,400 | | | | 1,752,922 | |
Merlin Properties Socimi SA | | | 236,820 | | | | 1,827,343 | |
Morguard North American Residential Real Estate Investment Trust | | | 185,002 | | | | 2,055,801 | |
Regional REIT Ltd.(b) | | | 2,548,170 | | | | 1,818,057 | |
Sasseur Real Estate Investment Trust(b) | | | 4,009,200 | | | | 1,967,407 | |
| | | | | | | | |
| | | | | | | 30,285,864 | |
| | | | | | | | |
| Real Estate Management & Development–2.8% | |
CA Immobilien Anlagen AG | | | 345,323 | | | | 10,266,618 | |
Farglory Land Development Co., Ltd. | | | 3,413,000 | | | | 6,161,661 | |
Grand City Properties SA | | | 397,500 | | | | 3,938,873 | |
IWG PLC(a) | | | 1,904,737 | | | | 2,668,590 | |
Kerry Properties Ltd. | | | 902,500 | | | | 1,710,750 | |
Midea Real Estate Holding Ltd.(b) | | | 1,917,200 | | | | 1,796,811 | |
Sirius Real Estate Ltd. | | | 1,977,545 | | | | 1,561,076 | |
| | | | | | | | |
| | | | | | | 28,104,379 | |
| | | | | | | | |
| | | | | | | 58,390,243 | |
| | | | | | | | |
| | | | | | | | |
| |
| Energy–3.9% | |
| Energy Equipment & Services–0.2% | |
Pason Systems, Inc. | | | 227,239 | | | | 2,174,756 | |
| | | | | | | | |
| Oil, Gas & Consumable Fuels–3.7% | |
Baytex Energy Corp.(a) | | | 556,804 | | | | 2,358,058 | |
Beach Energy Ltd. | | | 8,909,121 | | | | 8,555,675 | |
BW LPG Ltd.(b) | | | 299,870 | | | | 2,182,235 | |
Cosmo Energy Holdings Co., Ltd. | | | 265,500 | | | | 6,849,919 | |
Harbour Energy PLC | | | 334,352 | | | | 1,659,959 | |
Itochu Enex Co., Ltd. | | | 315,200 | | | | 2,223,375 | |
New Hope Corp., Ltd. | | | 404,897 | | | | 1,635,580 | |
Semirara Mining & Power Corp. | | | 3,333,100 | | | | 2,204,644 | |
Serica Energy PLC | | | 552,648 | | | | 2,295,967 | |
VERBIO Vereinigte BioEnergie AG | | | 39,438 | | | | 2,327,125 | |
Vermilion Energy, Inc. | | | 129,999 | | | | 2,782,836 | |
Whitecap Resources, Inc. | | | 376,248 | | | | 2,380,575 | |
| | | | | | | | |
| | | | | | | 37,455,948 | |
| | | | | | | | |
| | | | | | | 39,630,704 | |
| | | | | | | | |
| | | | | | | | |
| |
| Consumer Staples–3.3% | |
| Beverages–0.8% | |
Royal Unibrew A/S | | | 125,134 | | | | 8,108,173 | |
| | | | | | | | |
| Food & Staples Retailing–1.1% | |
Arcs Co., Ltd. | | | 143,500 | | | | 2,047,756 | |
Axfood AB | | | 92,242 | | | | 2,113,394 | |
Grupo Comercial Chedraui SA de CV | | | 837,590 | | | | 2,481,224 | |
Sheng Siong Group Ltd. | | | 2,307,600 | | | | 2,539,527 | |
Sonae SGPS SA | | | 1,936,770 | | | | 1,562,121 | |
| | | | | | | | |
| | | | | | | 10,744,022 | |
| | | | | | | | |
| Food Products–1.0% | |
Astral Foods Ltd. | | | 207,123 | | | | 2,210,609 | |
Austevoll Seafood ASA | | | 638,154 | | | | 4,326,309 | |
Hokuto Corp. | | | 174,800 | | | | 2,290,329 | |
Marfrig Global Foods SA | | | 994,800 | | | | 1,820,178 | |
| | | | | | | | |
| | | | | | | 10,647,425 | |
| | | | | | | | |
| | | | | | | | |
| | | |
| Company | | Shares | | | U.S. $ Value | |
| Personal Products–0.4% | |
TCI Co., Ltd. | | | 950,000 | | | $ | 3,718,247 | |
| | | | | | | | |
| | | | | | | 33,217,867 | |
| | | | | | | | |
| | | | | | | | |
| |
| Utilities–2.1% | |
| Electric Utilities–0.7% | |
Elmera Group ASA(b) | | | 587,628 | | | | 833,781 | |
Enea SA(a) | | | 1,223,470 | | | | 1,520,125 | |
Genesis Energy Ltd. | | | 2,991,078 | | | | 4,578,352 | |
| | | | | | | | |
| | | | | | | 6,932,258 | |
| | | | | | | | |
| Independent Power and Renewable Electricity Producers–1.4% | |
Capital Power Corp. | | | 403,273 | | | | 13,692,043 | |
| | | | | | | | |
| | | | | | | 20,624,301 | |
| | | | | | | | |
Total Common Stocks
(cost $1,137,078,041) | | | | | | | 956,365,588 | |
| | | | | | | | |
| | | | | | | | |
|
| INVESTMENT COMPANIES–1.5% | |
| Funds and Investment Trusts–1.5% | |
iShares MSCI EAFE Small-Cap ETF(e)
(cost $16,570,772) | | | 297,360 | | | | 14,505,221 | |
| | | | | | | | |
| | | | | | | | |
| |
| SHORT-TERM INVESTMENTS–1.8% | |
| Investment Companies–1.8% | |
AB Fixed Income Shares, Inc.–Government Money Market Portfolio–Class AB, 2.58%(c)(d)(e)
(cost $18,404,113) | | | 18,404,113 | | | | 18,404,113 | |
| | | | | | | | |
Total Investments—98.5%
(cost $1,172,052,926) | | | | 989,274,922 | |
| | |
Other assets less liabilities—1.5% | | | | | | | 15,349,708 | |
| | | | | | | | |
| Net Assets—100.0% | | | | | | $ | 1,004,624,630 | |
| | | | | | | | |
| | | | | | | | | | | | | | | | | | | | | | |
| | | | | | |
| FORWARD CURRENCY EXCHANGE CONTRACTS (see Note 3) | | | | | | | | | | | | | | | | | | | | |
| Counterparty | | Contracts to
Deliver
(000) | | | In Exchange
For
(000) | | | Settlement
Date | | | Unrealized
Appreciation/
(Depreciation) | |
| | | | | | |
Bank of America, NA | | AUD | | | 4,920 | | | | USD | | | | 3,432 | | | | 10/20/2022 | | | $ | 284,781 | |
| | | | | | |
Bank of America, NA | | GBP | | | 3,068 | | | | USD | | | | 3,549 | | | | 11/17/2022 | | | | 120,480 | |
| | | | | | |
Bank of America, NA | | USD | | | 5,335 | | | | SEK | | | | 57,811 | | | | 12/01/2022 | | | | (110,339 | ) |
| | | | | | |
Bank of America, NA | | EUR | | | 33,515 | | | | USD | | | | 32,376 | | | | 12/08/2022 | | | | (623,064 | ) |
| | | | | | |
Barclays Bank PLC | | AUD | | | 5,754 | | | | USD | | | | 4,035 | | | | 10/20/2022 | | | | 354,065 | |
| | | | | | |
Barclays Bank PLC | | PHP | | | 196,727 | | | | USD | | | | 3,478 | | | | 10/27/2022 | | | | 134,503 | |
| | | | | | |
Barclays Bank PLC | | USD | | | 12,165 | | | | KRW | | | | 16,056,488 | | | | 10/27/2022 | | | | (1,010,700 | ) |
| | | | | | |
Barclays Bank PLC | | USD | | | 7,957 | | | | MYR | | | | 35,142 | | | | 12/15/2022 | | | | (433,844 | ) |
| | | | | | |
BNP Paribas SA | | USD | | | 4,051 | | | | AUD | | | | 5,754 | | | | 10/20/2022 | | | | (370,069 | ) |
| | | | | | |
BNP Paribas SA | | USD | | | 3,599 | | | | CAD | | | | 4,732 | | | | 10/27/2022 | | | | (173,304 | ) |
| | | | | | |
BNP Paribas SA | | NZD | | | 6,812 | | | | USD | | | | 4,202 | | | | 11/18/2022 | | | | 388,672 | |
| | | | | | |
Citibank, NA | | USD | | | 12,994 | | | | ILS | | | | 44,507 | | | | 10/19/2022 | | | | (498,732 | ) |
| | | | | | |
Citibank, NA | | CAD | | | 4,732 | | | | USD | | | | 3,669 | | | | 10/27/2022 | | | | 243,916 | |
| | | | | | |
Citibank, NA | | PHP | | | 301,351 | | | | USD | | | | 5,294 | | | | 10/27/2022 | | | | 173,372 | |
| | | | | | |
Goldman Sachs Bank USA | | BRL | | | 17,668 | | | | USD | | | | 3,283 | | | | 10/04/2022 | | | | 7,516 | |
| | | | | | |
Goldman Sachs Bank USA | | USD | | | 3,268 | | | | BRL | | | | 17,668 | | | | 10/04/2022 | | | | 7,421 | |
| | | | | | |
Goldman Sachs Bank USA | | USD | | | 3,260 | | | | BRL | | | | 17,668 | | | | 11/03/2022 | | | | (8,242 | ) |
| | | | | | |
Goldman Sachs Bank USA | | USD | | | 19,834 | | | | INR | | | | 1,613,886 | | | | 12/21/2022 | | | | (196,140 | ) |
| | | | | | |
HSBC Bank USA | | TWD | | | 102,747 | | | | USD | | | | 3,432 | | | | 10/21/2022 | | | | 203,813 | |
| | | | | | |
HSBC Bank USA | | USD | | | 7,420 | | | | TWD | | | | 223,356 | | | | 10/21/2022 | | | | (403,403 | ) |
| | | | | | |
Morgan Stanley Capital Services, Inc. | | BRL | | | 17,668 | | | | USD | | | | 3,268 | | | | 10/04/2022 | | | | (7,421 | ) |
| | | | | | |
Morgan Stanley Capital Services, Inc. | | USD | | | 3,487 | | | | BRL | | | | 17,668 | | | | 10/04/2022 | | | | (211,459 | ) |
| | | | | | |
Morgan Stanley Capital Services, Inc. | | USD | | | 3,314 | | | | AUD | | | | 4,920 | | | | 10/20/2022 | | | | (166,891 | ) |
| | | | | | |
Morgan Stanley Capital Services, Inc. | | USD | | | 5,788 | | | | CNH | | | | 40,306 | | | | 10/20/2022 | | | | (141,576 | ) |
| | | | | | |
Natwest Markets PLC | | GBP | | | 7,476 | | | | USD | | | | 8,884 | | | | 11/17/2022 | | | | 531,145 | |
| | | | | | |
Standard Chartered Bank | | TWD | | | 557,767 | | | | USD | | | | 18,787 | | | | 10/21/2022 | | | | 1,263,910 | |
| | | | | | |
Standard Chartered Bank | | USD | | | 3,066 | | | | KRW | | | | 3,988,968 | | | | 10/27/2022 | | | | (294,469 | ) |
Schedule of Investments (continued)
| | | | | | | | | | | | | | | | | | | | | | |
| Counterparty | | Contracts to
Deliver
(000) | | | In Exchange
For
(000) | | | Settlement
Date | | | Unrealized
Appreciation/
(Depreciation) | |
| | | | | | |
State Street Bank & Trust Co. | | GBP | | | 5,621 | | | | USD | | | | 6,463 | | | | 11/17/2022 | | | $ | 182,076 | |
| | | | | | |
UBS AG | | USD | | | 5,296 | | | | JPY | | | | 749,684 | | | | 12/02/2022 | | | | (84,918 | ) |
| | | | | | |
UBS AG | | CHF | | | 8,446 | | | | USD | | | | 8,751 | | | | 12/07/2022 | | | | 138,596 | |
| | | | | | |
UBS AG | | USD | | | 22,479 | | | | CHF | | | | 21,977 | | | | 12/07/2022 | | | | (68,680 | ) |
| | | | | | | | | | | | | | | | | | | | | | |
| | | $ | (768,985 | ) |
| | | | | | | | | | | | | | | | | | | | | | |
| (a) | | Non-income producing security. |
| (b) | | Security is exempt from registration under Rule 144A or Regulation S of the Securities Act of 1933. These securities are considered restricted, but liquid and may be resold in transactions exempt from registration. At September 30, 2022, the aggregate market value of these securities amounted to $51,436,476 or 5.1% of net assets. |
| (c) | | Affiliated investments. |
| (d) | | The rate shown represents the 7-day yield as of period end. |
| (e) | | To obtain a copy of the fund’s shareholder report, please go to the Securities and Exchange Commission’s website at www.sec.gov, or call AB at (800) 227-4618. |
Currency Abbreviations:
AUD—Australian Dollar
BRL—Brazilian Real
CAD—Canadian Dollar
CHF—Swiss Franc
CNH—Chinese Yuan Renminbi (Offshore)
EUR—Euro
GBP—Great British Pound
ILS—Israeli Shekel
INR—Indian Rupee
JPY—Japanese Yen
KRW—South Korean Won
MYR—Malaysian Ringgit
NZD—New Zealand Dollar
PHP—Philippine Peso
SEK—Swedish Krona
TWD—New Taiwan Dollar
USD—United States Dollar
Glossary:
ADR—American Depositary Receipt
EAFE—Europe, Australia, and Far East
ETF—Exchange Traded Fund
MSCI—Morgan Stanley Capital International
REG—Registered Shares
REIT—Real Estate Investment Trust
SDR—Swedish Depositary Receipt
See notes to financial statements.
Schedule of Investments
Bernstein Fund, Inc.
Schedule of Investments
International Strategic Equities Portfolio
September 30, 2022
| | | | | | | | |
| | |
| Company | | Shares | | | U.S. $ Value | |
|
| COMMON STOCKS–97.5% | |
|
| Financials–17.5% | |
| Banks–13.8% | |
ABN AMRO Bank NV(a) | | | 4,096,850 | | | $ | 36,709,262 | |
Banco Bilbao Vizcaya Argentaria SA | | | 20,438,070 | | | | 91,682,017 | |
CTBC Financial Holding Co., Ltd. | | | 67,894,000 | | | | 42,237,016 | |
Erste Group Bank AG | | | 2,348,909 | | | | 51,493,165 | |
Hana Financial Group, Inc. | | | 3,828,830 | | | | 94,016,839 | |
KB Financial Group, Inc. | | | 2,599,850 | | | | 78,511,600 | |
KB Financial Group, Inc. (ADR) | | | 628,400 | | | | 18,939,976 | |
Mitsubishi UFJ Financial Group, Inc. | | | 24,247,600 | | | | 109,844,634 | |
Natwest Group PLC | | | 59,650,360 | | | | 148,572,299 | |
Oversea-Chinese Banking Corp., Ltd. | | | 14,847,800 | | | | 121,661,090 | |
Sumitomo Mitsui Financial Group, Inc. | | | 4,083,300 | | | | 113,195,102 | |
| | | | | | | | |
| | | | | | | 906,863,000 | |
| | | | | | | | |
| Consumer Finance–0.0% | |
Isracard Ltd. | | | 1 | | | | 3 | |
| | | | | | | | |
| Insurance–3.7% | |
BB Seguridade Participacoes SA | | | 19,514,800 | | | | 96,120,614 | |
NN Group NV | | | 1,103,830 | | | | 42,932,285 | |
Ping An Insurance Group Co. of China Ltd.–Class H | | | 20,643,000 | | | | 102,983,683 | |
| | | | | | | | |
| | | | | | | 242,036,582 | |
| | | | | | | | |
| | | | | | | 1,148,899,585 | |
| | | | | | | | |
| | | | | | | | |
| |
| Consumer Discretionary–15.6% | |
| Automobiles–5.5% | |
Honda Motor Co., Ltd. | | | 2,435,100 | | | | 52,855,728 | |
Kia Corp. | | | 2,067,180 | | | | 102,887,615 | |
Stellantis NV | | | 7,611,717 | | | | 90,022,580 | |
Suzuki Motor Corp. | | | 3,782,900 | | | | 117,762,118 | |
| | | | | | | | |
| | | | | | | 363,528,041 | |
| | | | | | | | |
| Hotels, Restaurants & Leisure–1.6% | |
Compass Group PLC | | | 5,320,920 | | | | 105,952,317 | |
| | | | | | | | |
| Household Durables–0.5% | |
Persimmon PLC | | | 2,073,870 | | | | 28,362,810 | |
| | | | | | | | |
| Internet & Direct Marketing Retail–1.9% | |
Alibaba Group Holding Ltd.(b) | | | 8,495,620 | | | | 84,780,645 | |
JD.com, Inc.–Class A | | | 1,564,247 | | | | 39,463,108 | |
| | | | | | | | |
| | | | | | | 124,243,753 | |
| | | | | | | | |
| Leisure Products–1.4% | |
Bandai Namco Holdings, Inc. | | | 1,407,400 | | | | 91,717,807 | |
| | | | | | | | |
| Textiles, Apparel & Luxury Goods–4.7% | |
Burberry Group PLC | | | 3,931,130 | | | | 78,526,202 | |
Li Ning Co., Ltd. | | | 6,186,000 | | | | 46,938,643 | |
LVMH Moet Hennessy Louis Vuitton SE | | | 312,900 | | | | 184,477,916 | |
| | | | | | | | |
| | | | | | | 309,942,761 | |
| | | | | | | | |
| | | | | | | 1,023,747,489 | |
| | | | | | | | |
| | | | | | | | |
| |
| Information Technology–10.2% | |
| IT Services–1.0% | |
GDS Holdings Ltd.–Class A(b) | | | 9,819,800 | | | | 21,605,130 | |
Tata Consultancy Services Ltd. | | | 1,314,915 | | | | 48,236,688 | |
| | | | | | | | |
| | | | | | | 69,841,818 | |
| | | | | | | | |
| Semiconductors & Semiconductor Equipment–5.6% | |
Novatek Microelectronics Corp. | | | 6,091,000 | | | | 41,687,540 | |
Realtek Semiconductor Corp. | | | 2,761,000 | | | | 23,308,587 | |
SCREEN Holdings Co., Ltd. | | | 445,000 | | | | 24,145,217 | |
Taiwan Semiconductor Manufacturing Co., Ltd. | | | 12,159,000 | | | | 161,172,299 | |
Taiwan Semiconductor Manufacturing Co., Ltd. (Sponsored ADR) | | | 491,980 | | | | 33,730,149 | |
United Microelectronics Corp.(b) | | | 74,504,000 | | | | 83,377,199 | |
| | | | | | | | |
| | | | | | | 367,420,991 | |
| | | | | | | | |
| Software–3.6% | |
Constellation Software, Inc./Canada | | | 48,952 | | | | 68,114,634 | |
Dassault Systemes SE | | | 4,828,530 | | | | 166,705,269 | |
| | | | | | | | |
| | | | | | | 234,819,903 | |
| | | | | | | | |
| | | | | | | 672,082,712 | |
| | | | | | | | |
| | | | | | | | |
| |
| Industrials–10.1% | |
| Aerospace & Defense–1.9% | |
BAE Systems PLC | | | 14,016,390 | | | | 123,153,900 | |
| | | | | | | | |
| Electrical Equipment–4.0% | |
Contemporary Amperex Technology Co., Ltd.–Class A | | | 616,524 | | | | 34,713,243 | |
Fuji Electric Co., Ltd. | | | 1,675,500 | | | | 61,408,513 | |
NARI Technology Co., Ltd.–Class A | | | 16,507,042 | | | | 57,566,151 | |
Nexans SA | | | 510,570 | | | | 45,449,945 | |
Prysmian SpA | | | 2,321,790 | | | | 66,505,045 | |
| | | | | | | | |
| | | | | | | 265,642,897 | |
| | | | | | | | |
| Industrial Conglomerates–0.8% | |
Smiths Group PLC | | | 3,124,350 | | | | 52,042,229 | |
| | | | | | | | |
| Machinery–0.9% | |
Toyota Industries Corp. | | | 1,272,400 | | | | 60,783,466 | |
| | | | | | | | |
| Professional Services–2.5% | |
Wolters Kluwer NV | | | 1,678,110 | | | | 163,403,635 | |
| | | | | | | | |
| | | | | | | 665,026,127 | |
| | | | | | | | |
| | | | | | | | |
| |
| Health Care–8.9% | |
| Health Care Providers & Services–1.1% | |
Sonic Healthcare Ltd. | | | 3,901,662 | | | | 76,102,693 | |
| | | | | | | | |
Schedule of Investments (continued)
| | | | | | | | |
| | | |
| Company | | Shares | | | U.S. $ Value | |
| Pharmaceuticals–7.8% | |
Nippon Shinyaku Co., Ltd. | | | 549,500 | | | $ | 28,036,426 | |
Novo Nordisk A/S–Class B | | | 2,419,100 | | | | 240,985,411 | |
Roche Holding AG (Genusschein) | | | 523,122 | | | | 170,293,252 | |
Sanofi | | | 953,780 | | | | 72,626,988 | |
| | | | | | | | |
| | | | | | | 511,942,077 | |
| | | | | | | | |
| | | | | | | 588,044,770 | |
| | | | | | | | |
| | | | | | | | |
| |
| Consumer Staples–7.4% | |
| Food & Staples Retailing–2.3% | |
Jeronimo Martins SGPS SA | | | 8,077,360 | | | | 150,427,986 | |
| | | | | | | | |
| Food Products–2.0% | |
Minerva SA/Brazil | | | 12,953,300 | | | | 30,111,947 | |
Mowi ASA | | | 4,388,920 | | | | 55,825,029 | |
Nestle SA (REG) | | | 287,795 | | | | 31,127,134 | |
Salmar ASA | | | 482,180 | | | | 16,252,497 | |
| | | | | | | | |
| | | | | | | 133,316,607 | |
| | | | | | | | |
| Tobacco–3.1% | |
British American Tobacco PLC | | | 3,528,110 | | | | 126,509,320 | |
ITC Ltd. | | | 8,156,992 | | | | 33,151,908 | |
Swedish Match AB | | | 4,058,890 | | | | 40,149,437 | |
| | | | | | | | |
| | | | | | | 199,810,665 | |
| | | | | | | | |
| | | | | | | 483,555,258 | |
| | | | | | | | |
| | | | | | | | |
| |
| Energy–7.2% | |
| Oil, Gas & Consumable Fuels–7.2% | |
ENEOS Holdings, Inc. | | | 23,652,100 | | | | 76,281,613 | |
Parex Resources, Inc. | | | 2,318,330 | | | | 33,851,461 | |
Repsol SA(b) | | | 8,465,940 | | | | 97,275,779 | |
Shell PLC | | | 9,445,350 | | | | 234,319,581 | |
Woodside Energy Group Ltd. | | | 1,567,210 | | | | 32,020,474 | |
| | | | | | | | |
| | | | | | | 473,748,908 | |
| | | | | | | | |
| | | | | | | | |
| |
| Communication Services–7.2% | |
| Diversified Telecommunication Services–2.6% | |
KT Corp. | | | 2,471,270 | | | | 62,121,564 | |
Nippon Telegraph & Telephone Corp. | | | 4,010,400 | | | | 108,169,775 | |
| | | | | | | | |
| | | | | | | 170,291,339 | |
| | | | | | | | |
| Entertainment–1.0% | |
Konami Group Corp. | | | 1,407,100 | | | | 65,151,681 | |
| | | | | | | | |
| Interactive Media & Services–3.6% | |
Auto Trader Group PLC(a) | | | 12,045,680 | | | | 68,311,867 | |
Kakaku.com, Inc. | | | 3,318,600 | | | | 56,237,573 | |
Tencent Holdings Ltd. | | | 3,352,600 | | | | 113,238,453 | |
| | | | | | | | |
| | | | | | | 237,787,893 | |
| | | | | | | | |
| | | | | | | 473,230,913 | |
| | | | | | | | |
| | | | | | | | |
| |
| Materials–6.1% | |
| Chemicals–3.1% | |
Incitec Pivot Ltd. | | | 25,881,116 | | | | 58,850,326 | |
Sociedad Quimica y Minera de Chile SA (Sponsored ADR) | | | 1,116,850 | | | | 101,354,138 | |
Tosoh Corp. | | | 4,006,300 | | | | 44,651,675 | |
| | | | | | | | |
| | | | | | | 204,856,139 | |
| | | | | | | | |
| Metals & Mining–3.0% | |
Anglo American PLC | | | 970,120 | | | | 29,128,650 | |
ArcelorMittal SA | | | 1,730,890 | | | | 34,441,789 | |
First Quantum Minerals Ltd. | | | 3,350,660 | | | | 56,881,295 | |
South32 Ltd. | | | 30,906,480 | | | | 73,369,141 | |
| | | | | | | | |
| | | | | | | 193,820,875 | |
| | | | | | | | |
| | | | | | | 398,677,014 | |
| | | | | | | | |
| | | | | | | | |
| |
| Utilities–4.1% | |
| Electric Utilities–2.4% | |
Centrais Eletricas Brasileiras SA | | | 8,141,400 | | | | 64,852,292 | |
Enel SpA | | | 7,189,040 | | | | 29,483,860 | |
Transmissora Alianca de Energia Eletrica SA | | | 8,542,800 | | | | 61,683,439 | |
| | | | | | | | |
| | | | | | | 156,019,591 | |
| | | | | | | | |
| Independent Power and Renewable Electricity Producers–1.7% | |
Capital Power Corp. | | | 3,249,940 | | | | 110,342,915 | |
| | | | | | | | |
| | | | | | | 266,362,506 | |
| | | | | | | | |
| | | | | | | | |
| |
| Real Estate–3.2% | |
| Real Estate Management & Development–3.2% | |
China Resources Land Ltd. | | | 16,430,000 | | | | 64,354,426 | |
Daito Trust Construction Co., Ltd. | | | 748,500 | | | | 70,016,366 | |
Emaar Properties PJSC | | | 49,653,910 | | | | 77,913,313 | |
| | | | | | | | |
| | | | | | | 212,284,105 | |
| | | | | | | | |
Total Common Stocks
(cost $7,477,827,879) | | | | | | | 6,405,659,387 | |
| | | | | | | | |
| | | | | | | | |
| |
| SHORT-TERM INVESTMENTS–1.1% | |
| Investment Companies–1.1% | |
AB Fixed Income Shares, Inc.–Government Money Market Portfolio–Class AB, 2.58%(c)(d)(e)
(cost $74,285,607) | | | 74,285,607 | | | | 74,285,607 | |
| | | | | | | | |
Total Investments—98.6%
(cost $7,552,113,486) | | | | 6,479,944,994 | |
| | |
Other assets less liabilities—1.4% | | | | | | | 93,232,527 | |
| | | | | | | | |
| Net Assets—100.0% | | | | | | $ | 6,573,177,521 | |
| | | | | | | | |
| | | | | | | | | | | | | | | | | | | | |
| |
| FORWARD CURRENCY EXCHANGE CONTRACTS (see Note 3) | |
| Counterparty | | Contracts to
Deliver
(000) | | | In Exchange
For
(000) | | | Settlement
Date | | | Unrealized
Appreciation/
(Depreciation) | |
| | | | | | |
Australia and New Zealand Banking Group Ltd. | | USD | | | 18,652 | | | CNH | | | 125,655 | | | | 10/20/2022 | | | $ | (1,050,127) | |
| | | | | | |
Australia and New Zealand Banking Group Ltd. | | USD | | | 17,114 | | | NZD | | | 27,640 | | | | 11/18/2022 | | | | (1,642,007 | ) |
| | | | | | |
Australia and New Zealand Banking Group Ltd. | | JPY | | | 2,385,348 | | | USD | | | 16,816 | | | | 12/02/2022 | | | | 235,884 | |
| | | | | | |
Bank of America, NA | | JPY | | | 1,981,308 | | | USD | | | 14,022 | | | | 12/02/2022 | | | | 249,793 | |
| | | | | | |
Bank of America, NA | | BRL | | | 81,737 | | | USD | | | 15,400 | | | | 10/04/2022 | | | | 247,947 | |
| | | | | | |
Bank of America, NA | | BRL | | | 853,984 | | | USD | | | 157,952 | | | | 10/04/2022 | | | | (358,693 | ) |
| | | | | | |
Bank of America, NA | | USD | | | 15,118 | | | BRL | | | 81,737 | | | | 10/04/2022 | | | | 34,331 | |
| | | | | | |
Bank of America, NA | | USD | | | 159,623 | | | BRL | | | 853,984 | | | | 10/04/2022 | | | | (1,312,352 | ) |
| | | | | | |
Bank of America, NA | | USD | | | 77,267 | | | ZAR | | | 1,277,342 | | | | 10/13/2022 | | | | (6,753,337 | ) |
| | | | | | |
Bank of America, NA | | USD | | | 34,570 | | | CNH | | | 239,035 | | | | 10/20/2022 | | | | (1,084,667 | ) |
| | | | | | |
Bank of America, NA | | CAD | | | 27,498 | | | USD | | | 21,499 | | | | 10/27/2022 | | | | 1,593,375 | |
| | | | | | |
Bank of America, NA | | KRW | | | 20,471,732 | | | USD | | | 15,718 | | | | 10/27/2022 | | | | 1,496,502 | |
| | | | | | |
Bank of America, NA | | BRL | | | 853,984 | | | USD | | | 158,505 | | | | 11/03/2022 | | | | 1,337,816 | |
| | | | | | |
Bank of America, NA | | USD | | | 13,108 | | | BRL | | | 71,323 | | | | 11/03/2022 | | | | 18,364 | |
| | | | | | |
Barclays Bank PLC | | USD | | | 18,585 | | | AUD | | | 27,253 | | | | 10/20/2022 | | | | (1,149,682 | ) |
| | | | | | |
Barclays Bank PLC | | USD | | | 35,955 | | | CNH | | | 242,546 | | | | 10/20/2022 | | | | (1,978,038 | ) |
| | | | | | |
Barclays Bank PLC | | TWD | | | 469,698 | | | USD | | | 15,809 | | | | 10/21/2022 | | | | 1,053,161 | |
| | | | | | |
Barclays Bank PLC | | USD | | | 39,010 | | | IDR | | | 592,290,000 | | | | 10/27/2022 | | | | (359,362 | ) |
| | | | | | |
Barclays Bank PLC | | GBP | | | 31,208 | | | USD | | | 36,058 | | | | 11/17/2022 | | | | 1,187,502 | |
| | | | | | |
Barclays Bank PLC | | USD | | | 29,091 | | | MYR | | | 128,127 | | | | 12/15/2022 | | | | (1,660,832 | ) |
| | | | | | |
BNP Paribas SA | | BRL | | | 685,802 | | | USD | | | 133,665 | | | | 10/04/2022 | | | | 6,531,409 | |
| | | | | | |
BNP Paribas SA | | USD | | | 126,845 | | | BRL | | | 685,802 | | | | 10/04/2022 | | | | 288,052 | |
| | | | | | |
BNP Paribas SA | | TWD | | | 506,640 | | | USD | | | 16,949 | | | | 10/21/2022 | | | | 1,031,799 | |
| | | | | | |
BNP Paribas SA | | CAD | | | 15,871 | | | USD | | | 12,432 | | | | 10/27/2022 | | | | 943,901 | |
| | | | | | |
BNP Paribas SA | | KRW | | | 29,989,851 | | | USD | | | 23,032 | | | | 10/27/2022 | | | | 2,198,121 | |
| | | | | | |
BNP Paribas SA | | USD | | | 29,651 | | | CAD | | | 38,896 | | | | 10/27/2022 | | | | (1,495,289 | ) |
| | | | | | |
Citibank, NA | | USD | | | 30,488 | | | ILS | | | 104,429 | | | | 10/19/2022 | | | | (1,170,201 | ) |
| | | | | | |
Citibank, NA | | AUD | | | 41,749 | | | USD | | | 26,930 | | | | 10/20/2022 | | | | 220,963 | |
| | | | | | |
Citibank, NA | | CNH | | | 1,535,179 | | | USD | | | 227,663 | | | | 10/20/2022 | | | | 12,607,205 | |
| | | | | | |
Citibank, NA | | USD | | | 19,706 | | | AUD | | | 28,481 | | | | 10/20/2022 | | | | (1,485,271 | ) |
| | | | | | |
Citibank, NA | | USD | | | 14,076 | | | TWD | | | 419,520 | | | | 10/21/2022 | | | | (895,928 | ) |
| | | | | | |
Citibank, NA | | CAD | | | 9,487 | | | USD | | | 7,370 | | | | 10/27/2022 | | | | 502,866 | |
| | | | | | |
Citibank, NA | | KRW | | | 143,165,000 | | | USD | | | 109,124 | | | | 10/27/2022 | | | | 9,669,581 | |
| | | | | | |
Citibank, NA | | USD | | | 32,658 | | | CAD | | | 43,328 | | | | 10/27/2022 | | | | (1,293,945 | ) |
| | | | | | |
Citibank, NA | | USD | | | 39,966 | | | THB | | | 1,418,777 | | | | 11/10/2022 | | | | (2,279,258 | ) |
| | | | | | |
Citibank, NA | | CLP | | | 13,342,182 | | | USD | | | 14,260 | | | | 11/22/2022 | | | | 591,224 | |
| | | | | | |
Citibank, NA | | NOK | | | 528,011 | | | USD | | | 51,779 | | | | 12/01/2022 | | | | 3,232,103 | |
| | | | | | |
Citibank, NA | | USD | | | 23,407 | | | NOK | | | 253,893 | | | | 12/01/2022 | | | | (63,797 | ) |
| | | | | | |
Citibank, NA | | CHF | | | 10,482 | | | USD | | | 10,646 | | | | 12/07/2022 | | | | (43,008 | ) |
| | | | | | |
Citibank, NA | | INR | | | 925,123 | | | USD | | | 11,190 | | | | 12/21/2022 | | | | (67,083 | ) |
| | | | | | |
Goldman Sachs Bank USA | | AUD | | | 5,077 | | | USD | | | 3,274 | | | | 10/20/2022 | | | | 26,495 | |
| | | | | | |
Goldman Sachs Bank USA | | USD | | | 89,634 | | | CNH | | | 649,970 | | | | 10/20/2022 | | | | 1,416,912 | |
| | | | | | |
Goldman Sachs Bank USA | | USD | | | 13,357 | | | CNH | | | 90,216 | | | | 10/20/2022 | | | | (719,362 | ) |
| | | | | | |
Goldman Sachs Bank USA | | CAD | | | 28,309 | | | USD | | | 22,088 | | | | 10/27/2022 | | | | 1,595,508 | |
| | | | | | |
Goldman Sachs Bank USA | | USD | | | 45,074 | | | MXN | | | 924,524 | | | | 11/18/2022 | | | | 454,144 | |
| | | | | | |
Goldman Sachs Bank USA | | USD | | | 216,488 | | | INR | | | 17,615,605 | | | | 12/21/2022 | | | | (2,140,869 | ) |
Schedule of Investments (continued)
| | | | | | | | | | | | | | | | | | | | |
| Counterparty | | Contracts to
Deliver
(000) | | | In Exchange
For
(000) | | | Settlement
Date | | | Unrealized
Appreciation/
(Depreciation) | |
| | | | | | |
HSBC Bank USA | | BRL | | | 86,445 | | | USD | | | 16,519 | | | | 10/04/2022 | | | $ | 494,105 | |
| | | | | | |
HSBC Bank USA | | USD | | | 15,989 | | | BRL | | | 86,445 | | | | 10/04/2022 | | | | 36,309 | |
| | | | | | |
HSBC Bank USA | | USD | | | 77,523 | | | AUD | | | 112,617 | | | | 10/20/2022 | | | | (5,475,430 | ) |
| | | | | | |
HSBC Bank USA | | USD | | | 36,936 | | | CNH | | | 248,740 | | | | 10/20/2022 | | | | (2,090,864 | ) |
| | | | | | |
HSBC Bank USA | | CAD | | | 19,246 | | | USD | | | 14,126 | | | | 10/27/2022 | | | | 193,726 | |
| | | | | | |
HSBC Bank USA | | KRW | | | 42,370,919 | | | USD | | | 32,098 | | | | 10/27/2022 | | | | 2,663,474 | |
| | | | | | |
HSBC Bank USA | | USD | | | 10,511 | | | CAD | | | 14,438 | | | | 10/27/2022 | | | | (59,264 | ) |
| | | | | | |
HSBC Bank USA | | GBP | | | 234,996 | | | USD | | | 276,988 | | | | 11/17/2022 | | | | 14,414,991 | |
| | | | | | |
HSBC Bank USA | | USD | | | 32,563 | | | GBP | | | 30,768 | | | | 11/17/2022 | | | | 1,816,016 | |
| | | | | | |
HSBC Bank USA | | CLP | | | 90,105,772 | | | USD | | | 100,789 | | | | 11/22/2022 | | | | 8,479,591 | |
| | | | | | |
HSBC Bank USA | | USD | | | 13,296 | | | CLP | | | 13,143,237 | | | | 11/22/2022 | | | | 168,593 | |
| | | | | | |
HSBC Bank USA | | SGD | | | 103,472 | | | USD | | | 74,146 | | | | 12/07/2022 | | | | 2,049,140 | |
| | | | | | |
HSBC Bank USA | | USD | | | 17,791 | | | INR | | | 1,427,789 | | | | 12/21/2022 | | | | (417,860 | ) |
| | | | | | |
JPMorgan Chase Bank, NA | | USD | | | 20,446 | | | CNH | | | 140,473 | | | | 10/20/2022 | | | | (767,685 | ) |
| | | | | | |
JPMorgan Chase Bank, NA | | USD | | | 35,540 | | | CAD | | | 46,537 | | | | 10/27/2022 | | | | (1,852,723 | ) |
| | | | | | |
JPMorgan Chase Bank, NA | | GBP | | | 32,075 | | | USD | | | 37,605 | | | | 11/17/2022 | | | | 1,766,130 | |
| | | | | | |
JPMorgan Chase Bank, NA | | USD | | | 233,913 | | | CHF | | | 227,411 | | | | 12/07/2022 | | | | (2,018,045 | ) |
| | | | | | |
Morgan Stanley Capital Services, Inc. | | USD | | | 14,377 | | | CNH | | | 96,941 | | | | 10/20/2022 | | | | (796,678 | ) |
| | | | | | |
Morgan Stanley Capital Services, Inc. | | GBP | | | 2,753 | | | USD | | | 3,194 | | | | 11/17/2022 | | | | 118,560 | |
| | | | | | |
Morgan Stanley Capital Services, Inc. | | JPY | | | 539,076 | | | USD | | | 3,801 | | | | 12/02/2022 | | | | 53,489 | |
| | | | | | |
Standard Chartered Bank | | TWD | | | 4,629,761 | | | USD | | | 155,942 | | | | 10/21/2022 | | | | 10,491,120 | |
| | | | | | |
Standard Chartered Bank | | USD | | | 13,950 | | | TWD | | | 444,073 | | | | 10/21/2022 | | | | 1,264 | |
| | | | | | |
Standard Chartered Bank | | USD | | | 26,737 | | | TWD | | | 826,778 | | | | 10/21/2022 | | | | (762,512 | ) |
| | | | | | |
Standard Chartered Bank | | GBP | | | 25,234 | | | USD | | | 27,235 | | | | 11/17/2022 | | | | (960,501 | ) |
| | | | | | |
Standard Chartered Bank | | EUR | | | 9,864 | | | USD | | | 9,557 | | | | 12/08/2022 | | | | (154,679 | ) |
| | | | | | |
State Street Bank & Trust Co. | | USD | | | 2,936 | | | CNH | | | 19,807 | | | | 10/20/2022 | | | | (161,069 | ) |
| | | | | | |
UBS AG | | USD | | | 4,506 | | | AUD | | | 6,443 | | | | 10/20/2022 | | | | (384,332 | ) |
| | | | | | |
UBS AG | | USD | | | 11,142 | | | CNH | | | 75,056 | | | | 10/20/2022 | | | | (628,132 | ) |
| | | | | | |
UBS AG | | USD | | | 259,303 | | | CAD | | | 336,554 | | | | 10/27/2022 | | | | (15,677,418 | ) |
| | | | | | |
UBS AG | | EUR | | | 171,725 | | | USD | | | 165,826 | | | | 11/09/2022 | | | | (2,891,372 | ) |
| | | | | | |
UBS AG | | GBP | | | 10,903 | | | USD | | | 12,649 | | | | 11/17/2022 | | | | 466,331 | |
| | | | | | |
UBS AG | | USD | | | 106,835 | | | SEK | | | 1,144,828 | | | | 12/01/2022 | | | | (3,372,348 | ) |
| | | | | | |
UBS AG | | JPY | | | 18,940,644 | | | USD | | | 135,987 | | | | 12/02/2022 | | | | 4,332,702 | |
| | | | | | |
UBS AG | | EUR | | | 35,464 | | | USD | | | 34,373 | | | | 12/08/2022 | | | | (544,682 | ) |
| | | | | | | | | | | | | | | | | | | | |
| | | $ | 28,291,797 | |
| | | | | | | | | | | | | | | | | | | | |
| (a) | | Security is exempt from registration under Rule 144A or Regulation S of the Securities Act of 1933. These securities are considered restricted, but liquid and may be resold in transactions exempt from registration. At September 30, 2022, the aggregate market value of these securities amounted to $105,021,129 or 1.6% of net assets. |
| (b) | | Non-income producing security. |
| (c) | | Affiliated investments. |
| (d) | | The rate shown represents the 7-day yield as of period end. |
| (e) | | To obtain a copy of the fund’s shareholder report, please go to the Securities and Exchange Commission’s website at www.sec.gov, or call AB at (800) 227-4618. |
Currency Abbreviations:
AUD—Australian Dollar
BRL—Brazilian Real
CAD—Canadian Dollar
CHF—Swiss Franc
CLP—Chilean Peso
CNH—Chinese Yuan Renminbi (Offshore)
EUR—Euro
GBP—Great British Pound
IDR—Indonesian Rupiah
ILS—Israeli Shekel
INR—Indian Rupee
JPY—Japanese Yen
KRW—South Korean Won
MXN—Mexican Peso
MYR—Malaysian Ringgit
NOK—Norwegian Krone
NZD—New Zealand Dollar
SEK—Swedish Krona
SGD—Singapore Dollar
THB—Thailand Baht
TWD—New Taiwan Dollar
USD—United States Dollar
ZAR—South African Rand
Glossary:
ADR—American Depositary Receipt
PJSC—Public Joint Stock Company
REG—Registered Shares
See notes to financial statements.
Statement of Assets and Liabilities—September 30, 2022
| | | | | | | | | | | | |
| | | SMALL CAP CORE
PORTFOLIO | | | INTERNATIONAL
SMALL CAP
PORTFOLIO | | | INTERNATIONAL
STRATEGIC
EQUITIES
PORTFOLIO | |
|
| ASSETS | |
|
Investments in securities at value | |
| | | |
Unaffiliated issuers | | $ | 617,084,842 | | | $ | 970,870,809 | | | $ | 6,405,659,387 | |
| | | |
Affiliated issuers | | | 1,374,218 | | | | 18,404,113 | | | | 74,285,607 | |
| | | |
Foreign currencies, at value (a) | | | 0 | | | | 8,248,652 | | | | 88,128,065 | |
| | | |
Cash | | | 4,036 | | | | 0 | | | | 1,552,000 | |
| | | |
Cash collateral due from broker | | | 968,000 | | | | 1,492,000 | | | | 2,855,000 | |
| | | |
Receivables: | | | | | | | | | | | | |
| | | |
Unaffiliated interest and dividends | | | 353,533 | | | | 4,757,162 | | | | 34,768,128 | |
| | | |
Affiliated dividends | | | 11,341 | | | | 43,424 | | | | 234,790 | |
| | | |
Foreign withholding tax reclaims | | | 0 | | | | 2,205,545 | | | | 13,668,902 | |
| | | |
Investment securities sold and foreign currency transactions | | | 548,428 | | | | 3,510,947 | | | | 34,573,007 | |
| | | |
Capital shares sold | | | 391,760 | | | | 790,400 | | | | 5,504,391 | |
| | | |
Unrealized appreciation of forward currency exchange contracts | | | 0 | | | | 4,034,266 | | | | 96,310,499 | |
| | | | | | | | | | | | |
| | | |
Total assets | | | 620,736,158 | | | | 1,014,357,318 | | | | 6,757,539,776 | |
| | | | | | | | | | | | |
|
| LIABILITIES | |
| | | |
Due to custodian | | | 0 | | | | 60,595 | | | | 0 | |
| | | |
Cash collateral due to broker | | | 0 | | | | 962,000 | | | | 40,944,000 | |
| | | |
Payables: | | | | | | | | | | | | |
| | | |
Investment securities purchased and foreign currency transactions | | | 0 | | | | 1,327,936 | | | | 65,317,451 | |
| | | |
Capital shares redeemed | | | 219,352 | | | | 853,430 | | | | 5,201,844 | |
| | | |
Management fee | | | 436,473 | | | | 900,775 | | | | 3,914,788 | |
| | | |
Custody and accounting fees payable | | | 64,423 | | | | 171,091 | | | | 696,073 | |
| | | |
Foreign capital gains taxes | | | 0 | | | | 546,058 | | | | 0 | |
| | | |
Variation margin on futures | | | 98,430 | | | | 0 | | | | 0 | |
| | | |
Shareholder servicing fee | | | 1,601 | | | | 10,802 | | | | 69,596 | |
| | | |
Transfer Agent fee | | | 18,195 | | | | 18,136 | | | | 43,283 | |
| | | |
Directors’ fees payable | | | 0 | | | | 341 | | | | 1,128 | |
| | | |
Accrued expenses | | | 89,740 | | | | 78,273 | | | | 155,390 | |
| | | |
Unrealized depreciation of forward currency exchange contracts | | | 0 | | | | 4,803,251 | | | | 68,018,702 | |
| | | | | | | | | | | | |
| | | |
Total liabilities | | | 928,214 | | | | 9,732,688 | | | | 184,362,255 | |
| | | | | | | | | | | | |
| | | |
NET ASSETS | | $ | 619,807,944 | | | $ | 1,004,624,630 | | | $ | 6,573,177,521 | |
| | | | | | | | | | | | |
|
Cost of investments | |
| | | |
Unaffiliated issuers | | $ | 564,161,755 | | | $ | 1,153,648,813 | | | $ | 7,477,827,879 | |
| | | |
Affiliated issuers | | | 1,374,218 | | | | 18,404,113 | | | | 74,285,607 | |
|
| NET ASSETS CONSIST OF: | |
| | | |
Capital stock, at par | | $ | 5,426 | | | $ | 11,252 | | | $ | 68,389 | |
| | | |
Additional paid-in capital | | | 518,088,739 | | | | 1,205,217,279 | | | | 7,767,809,305 | |
| | | |
Distributable earnings (accumulated loss) | | | 101,713,779 | | | | (200,603,901 | ) | | | (1,194,700,173 | ) |
| | | | | | | | | | | | |
| | | |
| | $ | 619,807,944 | | | $ | 1,004,624,630 | | | $ | 6,573,177,521 | |
| | | | | | | | | | | | |
(a) Cost: $0, $8,489,292 and $89,157,516, respectively. (Note 1)
See Notes to Financial Statements.
| | | | | | | | | | | | |
| | | SMALL CAP CORE
PORTFOLIO | | | INTERNATIONAL
SMALL CAP
PORTFOLIO | | | INTERNATIONAL
STRATEGIC
EQUITIES
PORTFOLIO | |
|
| CALCULATION OF MAXIMUM OFFERING PRICE | |
|
SCB Class Shares | |
| | | |
Net Assets | | $ | 7,231,209 | | | $ | 48,348,872 | | | $ | 312,691,751 | |
| | | |
Shares of capital stock outstanding | | | 636,589 | | | | 5,430,063 | | | | 32,650,385 | |
| | | | | | | | | | | | |
| | | |
Net asset value, offering and redemption price per share | | $ | 11.36 | | | $ | 8.90 | | | $ | 9.58 | |
| | | | | | | | | | | | |
|
Advisor Class Shares | |
| | | |
Net Assets | | $ | 500,636,136 | | | $ | 655,454,660 | | | $ | 4,928,516,144 | |
| | | |
Shares of capital stock outstanding | | | 43,820,425 | | | | 73,394,101 | | | | 512,824,784 | |
| | | | | | | | | | | | |
| | | |
Net asset value and offering price per share | | $ | 11.42 | | | $ | 8.93 | | | $ | 9.61 | |
| | | | | | | | | | | | |
|
Class Z Shares | |
| | | |
Net Assets | | $ | 111,940,599 | | | $ | 300,821,098 | | | $ | 1,331,969,626 | |
| | | |
Shares of capital stock outstanding | | | 9,804,895 | | | | 33,696,499 | | | | 138,415,070 | |
| | | | | | | | | | | | |
| | | |
Net asset value and offering price per share | | $ | 11.42 | | | $ | 8.93 | | | $ | 9.62 | |
| | | | | | | | | | | | |
See Notes to Financial Statements.
Statement of Operations—for the year ended September 30, 2022
| | | | | | | | | | | | |
| | | SMALL CAP CORE
PORTFOLIO | | | INTERNATIONAL
SMALL CAP
PORTFOLIO | | | INTERNATIONAL
STRATEGIC
EQUITIES
PORTFOLIO | |
| | | |
| INVESTMENT INCOME | | | | | | | | | | | | |
| | | |
Income: | | | | | | | | | | | | |
| | | |
Dividends | | | | | | | | | | | | |
| | | |
Unaffiliated issuers (a)(b) | | $ | 9,792,358 | | | $ | 42,363,746 | | | $ | 323,781,373 | |
| | | |
Affiliated issuers | | | 55,067 | | | | 144,305 | | | | 1,147,745 | |
| | | |
Interest | | | 4,569 | | | | 0 | | | | 0 | |
| | | |
| | | | | | | | | | | | |
| | | |
Total income | | | 9,851,994 | | | | 42,508,051 | | | | 324,929,118 | |
| | | |
| | | | | | | | | | | | |
| | | |
Expenses: | | | | | | | | | | | | |
| | | |
Management fee (see Note 2A) | | | 6,283,890 | | | | 13,384,393 | | | | 55,669,408 | |
| | | |
Shareholder servicing fee (see Note 2B) | | | 22,751 | | | | 157,963 | | | | 1,005,754 | |
| | | |
Custody and accounting fees | | | 66,301 | | | | 294,843 | | | | 1,256,445 | |
| | | |
Transfer Agent fee—SCB Class | | | 3,701 | | | | 13,576 | | | | 20,774 | |
| | | |
Transfer Agent fee—Advisor Class | | | 257,102 | | | | 184,212 | | | | 322,170 | |
| | | |
Transfer Agent fee—Class Z | | | 44,255 | | | | 105,353 | | | | 388,083 | |
| | | |
Directors’ fees and expenses | | | 33,816 | | | | 58,665 | | | | 368,482 | |
| | | |
Auditing and tax fees | | | 3,065 | | | | 103,054 | | | | 195,105 | |
| | | |
Legal fees | | | 21,890 | | | | 34,982 | | | | 212,590 | |
| | | |
Registration fees | | | 59,836 | | | | 60,198 | | | | 62,877 | |
| | | |
Printing fees | | | 40,998 | | | | 31,861 | | | | 57,328 | |
| | | |
Miscellaneous | | | 51,108 | | | | 73,776 | | | | 422,165 | |
| | | |
| | | | | | | | | | | | |
| | | |
Total expenses | | | 6,888,713 | | | | 14,502,876 | | | | 59,981,181 | |
| | | |
Less: expenses waived and reimbursed by the Adviser (see Note 2A and 2E) | | | (4,605 | ) | | | (17,147 | ) | | | (158,787 | ) |
| | | |
| | | | | | | | | | | | |
| | | |
Net expenses | | | 6,884,108 | | | | 14,485,729 | | | | 59,822,394 | |
| | | |
| | | | | | | | | | | | |
| | | |
Net investment income | | | 2,967,886 | | | | 28,022,322 | | | | 265,106,724 | |
| | | |
| | | | | | | | | | | | |
| | | |
| REALIZED AND UNREALIZED GAIN (LOSS) ON INVESTMENT AND FOREIGN CURRENCY TRANSACTIONS | | | | | | | | | | | | |
| | | |
Net realized gain (loss) on: | | | | | | | | | | | | |
| | | |
Investment transactions (c) | | | 59,625,427 | | | | (11,601,608 | ) | | | (375,805,666 | ) |
| | | |
Forward currency exchange contracts | | | 0 | | | | 8,560,288 | | | | 110,463,607 | |
| | | |
Futures | | | (2,694,604 | ) | | | 0 | | | | 0 | |
| | | |
Foreign currency transactions | | | 0 | | | | (2,667,868 | ) | | | 8,278,637 | |
| | | |
| | | | | | | | | | | | |
| | | |
Net realized gain (loss) on investment transactions and foreign currency transactions | | | 56,930,823 | | | | (5,709,188 | ) | | | (257,063,422 | ) |
| | | |
| | | | | | | | | | | | |
| | | |
Net change in unrealized appreciation/depreciation of: | | | | | | | | | | | | |
| | | |
Investments (d) | | | (228,002,426 | ) | | | (476,901,722 | ) | | | (2,343,412,390 | ) |
| | | |
Forward currency exchange contracts | | | 0 | | | | (583,885 | ) | | | 8,721,951 | |
| | | |
Futures | | | (1,687,059 | ) | | | 0 | | | | 0 | |
| | | |
Foreign currency denominated assets and liabilities | | | 0 | | | | (607,363 | ) | | | (3,240,218 | ) |
| | | |
| | | | | | | | | | | | |
| | | |
Net change in unrealized appreciation/depreciation of investments and foreign currency denominated assets and liabilities | | | (229,689,485 | ) | | | (478,092,970 | ) | | | (2,337,930,657 | ) |
| | | |
| | | | | | | | | | | | |
| | | |
Net realized and unrealized loss on investment transactions and foreign currency transactions | | | (172,758,662 | ) | | | (483,802,158 | ) | | | (2,594,994,079 | ) |
| | | |
| | | | | | | | | | | | |
| | | |
Contributions from affiliates (see Note 2A) | | | 3,193 | | | | 0 | | | | 0 | |
| | | |
| | | | | | | | | | | | |
| | | |
Net decrease in net assets resulting from operations | | $ | (169,787,583 | ) | | $ | (455,779,836 | ) | | $ | (2,329,887,355 | ) |
| | | | | | | | | | | | |
(a) Net of foreign withholding taxes of $18,836, $5,917,061 and $35,902,988, respectively.
(b) Includes $0, $260,037 and $33,820,510, respectively, in refunds received as a result of European Union dividend withholding tax reclaim filings (See Note 1D).
(c) Net of foreign realized capital gains taxes of $0, $1,027,842 and $2,694,524, respectively.
(d) Net of decrease in accrued foreign capital gains taxes on unrealized gains of $0, $1,113,882 and $4,310,871, respectively.
See Notes to Financial Statements.
Statement of Changes in Net Assets
| | | | | | | | | | | | | | | | | | | | |
| | | |
| | | SMALL CAP CORE
PORTFOLIO | | | | | | INTERNATIONAL SMALL CAP
PORTFOLIO | |
| | | | | | | | | | | | | | | | | | | | |
| | | YEAR ENDED
9/30/22 | | | YEAR
ENDED
9/30/21 | | | | | | YEAR
ENDED
9/30/22 | | | YEAR
ENDED
9/30/21 | |
|
| INCREASE (DECREASE) IN NET ASSETS FROM | |
|
Operations: | |
| | | | | |
Net investment income | | $ | 2,967,886 | | | $ | 633,501 | | | | | | | $ | 28,022,322 | | | $ | 17,472,146 | |
| | | | | |
Net realized gain (loss) on investment transactions and foreign currency transactions | | | 56,930,823 | | | | 88,108,725 | | | | | | | | (5,709,188 | ) | | | 146,482,580 | |
| | | | | |
Net change in unrealized appreciation/depreciation of investments | | | (229,689,485 | ) | | | 216,296,551 | | | | | | | | (478,092,970 | ) | | | 195,592,048 | |
| | | | | |
Contributions from affiliates (see Note 2A) | | | 3,193 | | | | 0 | | | | | | | | 0 | | | | 0 | |
| | | | | | | | | | | | | | | | | | | | |
| | | | | |
Net increase (decrease) in net assets resulting from operations | | | (169,787,583 | ) | | | 305,038,777 | | | | | | | | (455,779,836 | ) | | | 359,546,774 | |
| | | | | | | | | | | | | | | | | | | | |
| | | | | |
Distributions to shareholders (a) | | | (51,390,345 | ) | | | (3,943,698 | ) | | | | | | | (57,115,368 | ) | | | (15,502,777 | ) |
| | | | | | | | | | | | | | | | | | | | |
|
Capital-share transactions: | |
| | | | | |
Net proceeds from sales of shares | | | 33,932,843 | | | | 36,265,207 | | | | | | | | 99,489,099 | | | | 101,635,054 | |
| | | | | |
Net proceeds from sales of shares issued to shareholders on reinvestment of dividends | | | 38,420,784 | | | | 3,175,486 | | | | | | | | 52,302,647 | | | | 13,373,914 | |
| | | | | | | | | | | | | | | | | | | | |
| | | | | |
Total proceeds from shares sold | | | 72,353,627 | | | | 39,440,693 | | | | | | | | 151,791,746 | | | | 115,008,968 | |
| | | | | |
Cost of shares redeemed | | | (108,838,149 | ) | | | (119,391,742 | ) | | | | | | | (157,104,974 | ) | | | (146,554,822 | ) |
| | | | | | | | | | | | | | | | | | | | |
| | | | | |
Net decrease in net assets from capital-share transactions | | | (36,484,522 | ) | | | (79,951,049 | ) | | | | | | | (5,313,228 | ) | | | (31,545,854 | ) |
| | | | | | | | | | | | | | | | | | | | |
| | | | | |
Net increase (decrease) in net assets | | | (257,662,450 | ) | | | 221,144,030 | | | | | | | | (518,208,432 | ) | | | 312,498,143 | |
|
| NET ASSETS: | |
| | | | | |
Beginning of period | | | 877,470,394 | | | | 656,326,364 | | | | | | | | 1,522,833,062 | | | | 1,210,334,919 | |
| | | | | | | | | | | | | | | | | | | | |
| | | | | |
End of period | | $ | 619,807,944 | | | $ | 877,470,394 | | | | | | | $ | 1,004,624,630 | | | $ | 1,522,833,062 | |
| | | | | | | | | | | | | | | | | | | | |
(a) See page 35 for share class information on dividend distributions for the Portfolios.
See Notes to Financial Statements.
Statement of Changes in Net Assets (continued)
| | | | | | | | |
| |
| | | INTERNATIONAL STRATEGIC
EQUITIES PORTFOLIO | |
| | | | | | | | |
| | | YEAR
ENDED
9/30/22 | | | YEAR
ENDED
9/30/21 | |
|
| INCREASE (DECREASE) IN NET ASSETS FROM | |
|
Operations: | |
| | |
Net investment income | | $ | 265,106,724 | | | $ | 193,059,998 | |
| | |
Net realized gain (loss) on investment transactions and foreign currency transactions | | | (257,063,422 | ) | | | 838,292,076 | |
| | |
Net change in unrealized appreciation/depreciation of investments | | | (2,337,930,657 | ) | | | 191,018,104 | |
| | | | | | | | |
| | |
Net increase (decrease) in net assets resulting from operations | | | (2,329,887,355 | ) | | | 1,222,370,178 | |
| | | | | | | | |
| | |
Distributions to shareholders (a) | | | (530,917,993 | ) | | | (57,001,223 | ) |
| | | | | | | | |
|
Capital-share transactions: | |
| | |
Net proceeds from sales of shares | | | 712,367,952 | | | | 826,300,948 | |
| | |
Shares issued in connection with the Reorganization | | | 0 | | | | 4,144,702,295 | |
| | |
Net proceeds from sales of shares issued to shareholders on reinvestment of dividends | | | 485,839,887 | | | | 48,987,991 | |
| | | | | | | | |
| | |
Total proceeds from shares sold | | | 1,198,207,839 | | | | 5,019,991,234 | |
| | |
Cost of shares redeemed | | | (927,800,716 | ) | | | (1,054,104,015 | ) |
| | | | | | | | |
| | |
Net increase in net assets from capital-share transactions | | | 270,407,123 | | | | 3,965,887,219 | |
| | | | | | | | |
| | |
Net increase (decrease) in net assets | | | (2,590,398,225 | ) | | | 5,131,256,174 | |
|
| NET ASSETS: | |
| | |
Beginning of period | | | 9,163,575,746 | | | | 4,032,319,572 | |
| | | | | | | | |
| | |
End of period | | $ | 6,573,177,521 | | | $ | 9,163,575,746 | |
| | | | | | | | |
(a) See page 35 for share class information on dividend distributions for the Portfolios.
See Notes to Financial Statements.
| | | | | | | | |
| |
| | | SMALL CAP CORE
PORTFOLIO | |
| | | | | | | | |
| | | YEAR
ENDED
9/30/22 | | | YEAR
ENDED
9/30/21 | |
|
Distributions to shareholders: | |
| | |
SCB Class | | $ | (585,819 | ) | | $ | (27,689 | ) |
| | |
Advisor Class | | | (41,055,925 | ) | | | (3,183,087 | ) |
| | |
Class Z | | | (9,748,601 | ) | | | (732,922 | ) |
| | | | | | | | |
| | |
| | $ | (51,390,345 | ) | | $ | (3,943,698 | ) |
| | | | | | | | |
| | | | | | | | |
| |
| | | INTERNATIONAL
SMALL CAP
PORTFOLIO | |
| | | | | | | | |
| | | YEAR
ENDED
9/30/22 | | | YEAR
ENDED
9/30/21 | |
|
Distributions to shareholders: | |
| | |
SCB Class | | $ | (2,505,829 | ) | | $ | (659,648 | ) |
| | |
Advisor Class | | | (35,750,006 | ) | | | (9,641,123 | ) |
| | |
Class Z | | | (18,859,533 | ) | | | (5,202,006 | ) |
| | | | | | | | |
| | |
| | $ | (57,115,368 | ) | | $ | (15,502,777 | ) |
| | | | | | | | |
| | | | | | | | |
| |
| | | INTERNATIONAL
STRATEGIC EQUITIES
PORTFOLIO | |
| | | | | | | | |
| | | YEAR
ENDED
9/30/22 | | | YEAR
ENDED
9/30/21 | |
|
Distributions to shareholders: | |
| | |
SCB Class | | $ | (24,555,864 | ) | | $ | (2,004,999 | ) |
| | |
Advisor Class | | | (385,741,919 | ) | | | (35,823,954 | ) |
| | |
Class Z | | | (120,620,210 | ) | | | (19,172,270 | ) |
| | | | | | | | |
| | |
| | $ | (530,917,993 | ) | | $ | (57,001,223 | ) |
| | | | | | | | |
See Notes to Financial Statements.
Financial Highlights
Selected per share data and ratios for a share of capital stock outstanding for each respective Portfolio for each of the periods presented:
| | | | | | | | | | | | | | | | | | | | |
| |
| | | SMALL CAP CORE PORTFOLIO
SCB CLASS | |
| | | | | | | | | | | | | | | | | | | | |
| | | YEAR
ENDED
9/30/22 | | | YEAR
ENDED
9/30/21 | | | YEAR
ENDED
9/30/20 | | | YEAR
ENDED
9/30/19 | | | YEAR
ENDED
9/30/18 | |
| | | | | |
Net asset value, beginning of period | | $ | 15.26 | | | $ | 10.39 | | | $ | 10.78 | | | $ | 12.93 | | | $ | 12.21 | |
| | | | | | | | | | | | | | | | | | | | |
|
Income from investment operations: | |
| | | | | |
Investment income (loss), net (a)(b) | | | 0.02 | | | | (0.02 | ) | | | 0.02 | | | | 0.02 | | | | (0.00 | )(c) |
| | | | | |
Net realized and unrealized gain (loss) on investment transactions and foreign currency transactions | | | (3.03 | ) | | | 4.93 | | | | (0.39 | ) | | | (1.38 | ) | | | 1.44 | |
| | | | | |
Contributions from affiliates | | | 0.00 | (c) | | | 0 | | | | 0 | | | | 0 | | | | 0 | |
| | | | | | | | | | | | | | | | | | | | |
| | | | | |
Total from investment operations | | | (3.01 | ) | | | 4.91 | | | | (0.37 | ) | | | (1.36 | ) | | | 1.44 | |
| | | | | | | | | | | | | | | | | | | | |
|
Less dividends and distributions: | |
| | | | | |
Dividends from net investment income | | | 0 | | | | (0.04 | ) | | | (0.02 | ) | | | (0.00 | )(c) | | | (0.01 | ) |
| | | | | |
Distributions from net realized gain on investment transactions | | | (0.89 | ) | | | 0 | | | | 0 | | | | (0.79 | ) | | | (0.71 | ) |
| | | | | | | | | | | | | | | | | | | | |
| | | | | |
Total dividends and distributions | | | (0.89 | ) | | | (0.04 | ) | | | (0.02 | ) | | | (0.79 | ) | | | (0.72 | ) |
| | | | | | | | | | | | | | | | | | | | |
| | | | | |
Net asset value, end of period | | $ | 11.36 | | | $ | 15.26 | | | $ | 10.39 | | | $ | 10.78 | | | $ | 12.93 | |
| | | | | | | | | | | | | | | | | | | | |
| | | | | |
Total return (d)(e) | | | (21.18)% | | | | 47.30% | | | | (3.42)% | | | | (10.15)% | | | | 12.44% | |
|
| RATIOS/SUPPLEMENTAL DATA | |
| | | | | |
Net assets, end of period (000 omitted) | | | $7,231 | | | | $10,119 | | | | $7,895 | | | | $8,692 | | | | $10,865 | |
| | | | | |
Average net assets (000 omitted) | | | $9,101 | | | | $9,893 | | | | $8,175 | | | | $9,118 | | | | $10,771 | |
|
Ratio to average net assets of: | |
| | | | | |
Expenses, net of waivers/reimbursements | | | 1.13% | | | | 1.14% | | | | 1.14% | | | | 1.14% | | | | 1.14% | |
| | | | | |
Expenses, before waivers/reimbursements | | | 1.13% | | | | 1.14% | | | | 1.14% | | | | 1.14% | | | | 1.14% | |
| | | | | |
Net investment income (loss) (b) | | | 0.13% | | | | (0.17)% | | | | 0.19% | | | | 0.19% | | | | (0.02)% | |
| | | | | |
Portfolio turnover rate | | | 34% | | | | 40% | | | | 88% | | | | 61% | | | | 102% | |
See Footnote Summary on page 44.
See Notes to Financial Statements.
| | | | | | | | | | | | | | | | | | | | |
| |
| | | SMALL CAP CORE PORTFOLIO
ADVISOR CLASS | |
| | | | | | | | | | | | | | | | | | | | |
| | | YEAR
ENDED
9/30/22 | | | YEAR
ENDED
9/30/21 | | | YEAR
ENDED
9/30/20 | | | YEAR
ENDED
9/30/19 | | | YEAR
ENDED
9/30/18 | |
| | | | | |
Net asset value, beginning of period | | $ | 15.32 | | | $ | 10.43 | | | $ | 10.82 | | | $ | 12.97 | | | $ | 12.25 | |
| | | | | | | | | | | | | | | | | | | | |
|
Income from investment operations | |
| | | | | |
Investment income, net (a)(b) | | | 0.05 | | | | 0.01 | | | | 0.04 | | | | 0.05 | | | | 0.03 | |
| | | | | |
Net realized and unrealized gain (loss) on investment transactions and foreign currency transactions | | | (3.05 | ) | | | 4.94 | | | | (0.38 | ) | | | (1.38 | ) | | | 1.44 | |
| | | | | |
Contributions from affiliates | | | 0.00 | (c) | | | 0 | | | | 0 | | | | 0 | | | | 0 | |
| | | | | | | | | | | | | | | | | | | | |
| | | | | |
Total from investment operations | | | (3.00 | ) | | | 4.95 | | | | (0.34 | ) | | | (1.33 | ) | | | 1.47 | |
| | | | | | | | | | | | | | | | | | | | |
|
Less dividends and distributions: | |
| | | | | |
Dividends from net investment income | | | (0.01 | ) | | | (0.06 | ) | | | (0.05 | ) | | | (0.03 | ) | | | (0.04 | ) |
| | | | | |
Distributions from net realized gain on investment transactions | | | (0.89 | ) | | | 0 | | | | 0 | | | | (0.79 | ) | | | (0.71 | ) |
| | | | | | | | | | | | | | | | | | | | |
| | | | | |
Total dividends and distributions | | | (0.90 | ) | | | (0.06 | ) | | | (0.05 | ) | | | (0.82 | ) | | | (0.75 | ) |
| | | | | | | | | | | | | | | | | | | | |
| | | | | |
Net asset value, end of period | | $ | 11.42 | | | $ | 15.32 | | | $ | 10.43 | | | $ | 10.82 | | | $ | 12.97 | |
| | | | | | | | | | | | | | | | | | | | |
| | | | | |
Total return (d)(e) | | | (21.02)% | | | | 47.62% | | | | (3.17)% | | | | (9.90)% | | | | 12.64% | |
|
| RATIOS/SUPPLEMENTAL DATA | |
| | | | | |
Net assets, end of period (000 omitted) | | | $500,636 | | | | $702,514 | | | | $531,943 | | | | $734,733 | | | | $752,305 | |
| | | | | |
Average net assets (000 omitted) | | | $632,321 | | | | $687,421 | | | | $688,776 | | | | $724,908 | | | | $718,801 | |
|
Ratio to average net assets of: | |
| | | | | |
Expenses, net of waivers/reimbursements | | | 0.88% | | | | 0.89% | | | | 0.89% | | | | 0.89% | | | | 0.89% | |
| | | | | |
Expenses, before waivers/reimbursements | | | 0.88% | | | | 0.89% | | | | 0.89% | | | | 0.89% | | | | 0.89% | |
| | | | | |
Net investment income (b) | | | 0.38% | | | | 0.07% | | | | 0.43% | | | | 0.44% | | | | 0.23% | |
| | | | | |
Portfolio turnover rate | | | 34% | | | | 40% | | | | 88% | | | | 61% | | | | 102% | |
See Footnote Summary on page 44.
See Notes to Financial Statements.
Financial Highlights (continued)
Selected per share data and ratios for a share of capital stock outstanding for each respective Portfolio for each of the periods presented:
| | | | | | | | | | | | | | | | | | | | |
| |
| | | SMALL CAP CORE PORTFOLIO
CLASS Z | |
| | | | | | | | | | | | | | | | | | | | |
| | | YEAR
ENDED
9/30/22 | | | YEAR
ENDED
9/30/21 | | | YEAR
ENDED
9/30/20 | | | YEAR
ENDED
9/30/19 | | | YEAR
ENDED
9/30/18 | |
| | | | | |
Net asset value, beginning of period | | $ | 15.31 | | | $ | 10.42 | | | $ | 10.82 | | | $ | 12.96 | | | $ | 12.24 | |
| | | | | | | | | | | | | | | | | | | | |
|
Income from investment operations | |
| | | | | |
Investment income, net (a)(b) | | | 0.05 | | | | 0.01 | | | | 0.05 | | | | 0.05 | | | | 0.03 | |
| | | | | |
Net realized and unrealized gain (loss) on investment transactions and foreign currency transactions | | | (3.03 | ) | | | 4.95 | | | | (0.39 | ) | | | (1.37 | ) | | | 1.44 | |
| | | | | |
Contributions from affiliates | | | 0.00 | (c) | | | 0 | | | | 0 | | | | 0 | | | | 0 | |
| | | | | | | | | | | | | | | | | | | | |
| | | | | |
Total from investment operations | | | (2.98 | ) | | | 4.96 | | | | (0.34 | ) | | | (1.32 | ) | | | 1.47 | |
| | | | | | | | | | | | | | | | | | | | |
|
Less dividends and distributions: | |
| | | | | |
Dividends from net investment income | | | (0.02 | ) | | | (0.07 | ) | | | (0.06 | ) | | | (0.03 | ) | | | (0.04 | ) |
| | | | | |
Distributions from net realized gain on investment transactions | | | (0.89 | ) | | | 0 | | | | 0 | | | | (0.79 | ) | | | (0.71 | ) |
| | | | | | | | | | | | | | | | | | | | |
| | | | | |
Total dividends and distributions | | | (0.91 | ) | | | (0.07 | ) | | | (0.06 | ) | | | (0.82 | ) | | | (0.75 | ) |
| | | | | | | | | | | | | | | | | | | | |
| | | | | |
Net asset value, end of period | | $ | 11.42 | | | $ | 15.31 | | | $ | 10.42 | | | $ | 10.82 | | | $ | 12.96 | |
| | | | | | | | | | | | | | | | | | | | |
| | | | | |
Total return (d)(e) | | | (20.95)% | | | | 47.70% | | | | (3.23)% | | | | (9.80)% | | | | 12.69% | |
|
| RATIOS/SUPPLEMENTAL DATA | |
| | | | | |
Net assets, end of period (000 omitted) | | | $111,941 | | | | $164,837 | | | | $116,488 | | | | $192,161 | | | | $211,869 | |
| | | | | |
Average net assets (000 omitted) | | | $144,065 | | | | $155,037 | | | | $182,516 | | | | $190,252 | | | | $193,253 | |
|
Ratio to average net assets of: | |
| | | | | |
Expenses, net of waivers/reimbursements | | | 0.87% | | | | 0.87% | | | | 0.87% | | | | 0.87% | | | | 0.86% | |
| | | | | |
Expenses, before waivers/reimbursements | | | 0.87% | | | | 0.87% | | | | 0.87% | | | | 0.87% | | | | 0.86% | |
| | | | | |
Net investment income (b) | | | 0.39% | | | | 0.10% | | | | 0.46% | | | | 0.46% | | | | 0.25% | |
| | | | | |
Portfolio turnover rate | | | 34% | | | | 40% | | | | 88% | | | | 61% | | | | 102% | |
See Footnote Summary on page 44.
See Notes to Financial Statements.
| | | | | | | | | | | | | | | | | | | | |
| |
| | | INTERNATIONAL SMALL CAP PORTFOLIO
SCB CLASS | |
| | | | | | | | | | | | | | | | | | | | |
| | | YEAR
ENDED
9/30/22 | | | YEAR
ENDED
9/30/21 | | | YEAR
ENDED
9/30/20 | | | YEAR
ENDED
9/30/19 | | | YEAR
ENDED
9/30/18 | |
| | | | | |
Net asset value, beginning of period | | $ | 13.37 | | | $ | 10.40 | | | $ | 10.40 | | | $ | 12.40 | | | $ | 12.70 | |
| | | | | | | | | | | | | | | | | | | | |
| | | | | |
Income from investment operations: | | | | | | | | | | | | | | | | | | | | |
| | | | | |
Investment income, net (a)(b) | | | 0.22 | | | | 0.12 | | | | 0.10 | | | | 0.16 | | | | 0.14 | |
| | | | | |
Net realized and unrealized gain (loss) on investment transactions and foreign currency transactions | | | (4.23 | ) | | | 2.96 | | | | 0.09 | | | | (1.21 | ) | | | 0.02 | |
| | | | | | | | | | | | | | | | | | | | |
| | | | | |
Total from investment operations | | | (4.01 | ) | | | 3.08 | | | | 0.19 | | | | (1.05 | ) | | | 0.16 | |
| | | | | | | | | | | | | | | | | | | | |
| | | | | |
Less dividends and distributions: | | | | | | | | | | | | | | | | | | | | |
| | | | | |
Dividends from net investment income | | | (0.23 | ) | | | (0.11 | ) | | | (0.19 | ) | | | (0.19 | ) | | | (0.14 | ) |
| | | | | |
Distributions from net realized gain on investment transactions | | | (0.23 | ) | | | 0 | | | | 0 | | | | (0.76 | ) | | | (0.32 | ) |
| | | | | | | | | | | | | | | | | | | | |
| | | | | |
Total dividends and distributions | | | (0.46 | ) | | | (0.11 | ) | | | (0.19 | ) | | | (0.95 | ) | | | (0.46 | ) |
| | | | | | | | | | | | | | | | | | | | |
| | | | | |
Net asset value, end of period | | $ | 8.90 | | | $ | 13.37 | | | $ | 10.40 | | | $ | 10.40 | | | $ | 12.40 | |
| | | | | | | | | | | | | | | | | | | | |
| | | | | |
Total return (d) | | | (31.01)% | | | | 29.79% | | | | 1.77% | | | | (8.03)% | | | | 1.29% | |
| | | | | |
| RATIOS/SUPPLEMENTAL DATA | | | | | | | | | | | | | | | | | | | | |
| | | | | |
Net assets, end of period (000 omitted) | | | $48,349 | | | | $72,116 | | | | $63,328 | | | | $64,993 | | | | $71,729 | |
| | | | | |
Average net assets (000 omitted) | | | $63,185 | | | | $72,063 | | | | $62,709 | | | | $64,757 | | | | $76,322 | |
| | | | | |
Ratio to average net assets of: | | | | | | | | | | | | | | | | | | | | |
| | | | | |
Expenses, net of waivers/reimbursements | | | 1.32% | | | | 1.32% | | | | 1.33% | | | | 1.35% | | | | 1.35% | |
| | | | | |
Expenses, before waivers/reimbursements | | | 1.32% | | | | 1.32% | | | | 1.34% | | | | 1.35% | | | | 1.35% | |
| | | | | |
Net investment income (b) | | | 1.87% | | | | 0.94% | | | | 1.02% | | | | 1.50% | | | | 1.07% | |
| | | | | |
Portfolio turnover rate | | | 50% | | | | 48% | | | | 58% | | | | 46% | | | | 81% | |
See Footnote Summary on page 44.
See Notes to Financial Statements.
Financial Highlights (continued)
Selected per share data and ratios for a share of capital stock outstanding for each respective Portfolio for each of the periods presented:
| | | | | | | | | | | | | | | | | | | | |
| |
| | | INTERNATIONAL SMALL CAP PORTFOLIO
ADVISOR CLASS | |
| | | | | | | | | | | | | | | | | | | | |
| | | YEAR
ENDED
9/30/22 | | | YEAR
ENDED
9/30/21 | | | YEAR
ENDED
9/30/20 | | | YEAR
ENDED
9/30/19 | | | YEAR
ENDED
9/30/18 | |
| | | | | |
Net asset value, beginning of period | | $ | 13.41 | | | $ | 10.42 | | | $ | 10.43 | | | $ | 12.43 | | | $ | 12.72 | |
| | | | | | | | | | | | | | | | | | | | |
| | | | | |
Income from investment operations | | | | | | | | | | | | | | | | | | | | |
| | | | | |
Investment income, net (a)(b) | | | 0.25 | | | | 0.15 | | | | 0.13 | | | | 0.19 | | | | 0.18 | |
| | | | | |
Net realized and unrealized gain (loss) on investment transactions and foreign currency transactions | | | (4.23 | ) | | | 2.98 | | | | 0.08 | | | | (1.21 | ) | | | 0.01 | |
| | | | | | | | | | | | | | | | | | | | |
| | | | | |
Total from investment operations | | | (3.98 | ) | | | 3.13 | | | | 0.21 | | | | (1.02 | ) | | | 0.19 | |
| | | | | | | | | | | | | | | | | | | | |
| | | | | |
Less dividends and distributions: | | | | | | | | | | | | | | | | | | | | |
| | | | | |
Dividends from net investment income | | | (0.27 | ) | | | (0.14 | ) | | | (0.22 | ) | | | (0.22 | ) | | | (0.16 | ) |
| | | | | |
Distributions from net realized gain on investment transactions | | | (0.23 | ) | | | 0 | | | | 0 | | | | (0.76 | ) | | | (0.32 | ) |
| | | | | | | | | | | | | | | | | | | | |
| | | | | |
Total dividends and distributions | | | (0.50 | ) | | | (0.14 | ) | | | (0.22 | ) | | | (0.98 | ) | | | (0.48 | ) |
| | | | | | | | | | | | | | | | | | | | |
| | | | | |
Net asset value, end of period | | $ | 8.93 | | | $ | 13.41 | | | $ | 10.42 | | | $ | 10.43 | | | $ | 12.43 | |
| | | | | | | | | | | | | | | | | | | | |
| | | | | |
Total return (d) | | | (30.81)% | | | | 30.22% | | | | 1.90% | | | | (7.70)% | | | | 1.53% | |
| | | | | |
| RATIOS/SUPPLEMENTAL DATA | | | | | | | | | | | | | | | | | | | | |
| | | | | |
Net assets, end of period (000 omitted) | | | $655,455 | | | | $948,393 | | | | $748,799 | | | | $791,765 | | | | $810,447 | |
| | | | | |
Average net assets (000 omitted) | | | $856,686 | | | | $896,897 | | | | $750,872 | | | | $765,916 | | | | $745,535 | |
| | | | | |
Ratio to average net assets of: | | | | | | | | | | | | | | | | | | | | |
| | | | | |
Expenses, net of waivers/reimbursements | | | 1.07% | | | | 1.07% | | | | 1.09% | | | | 1.10% | | | | 1.10% | |
| | | | | |
Expenses, before waivers/reimbursements | | | 1.07% | | | | 1.07% | | | | 1.09% | | | | 1.10% | | | | 1.10% | |
| | | | | |
Net investment income (b) | | | 2.14% | | | | 1.22% | | | | 1.27% | | | | 1.77% | | | | 1.43% | |
| | | | | |
Portfolio turnover rate | | | 50% | | | | 48% | | | | 58% | | | | 46% | | | | 81% | |
See Footnote Summary on page 44.
See Notes to Financial Statements.
| | | | | | | | | | | | | | | | | | | | |
| |
| | | INTERNATIONAL SMALL CAP PORTFOLIO CLASS Z | |
| | | | | | | | | | | | | | | | | | | | |
| | | YEAR
ENDED
9/30/22 | | | YEAR
ENDED
9/30/21 | | | YEAR
ENDED
9/30/20 | | | YEAR
ENDED
9/30/19 | | | YEAR
ENDED
9/30/18 | |
| | | | | |
Net asset value, beginning of period | | $ | 13.41 | | | $ | 10.42 | | | $ | 10.43 | | | $ | 12.43 | | | $ | 12.72 | |
| | | | | | | | | | | | | | | | | | | | |
| | | | | |
Income from investment operations | | | | | | | | | | | | | | | | | | | | |
| | | | | |
Investment income, net (a)(b) | | | 0.24 | | | | 0.15 | | | | 0.13 | | | | 0.18 | | | | 0.18 | |
| | | | | |
Net realized and unrealized gain (loss) on investment transactions and foreign currency transactions | | | (4.22 | ) | | | 2.98 | | | | 0.08 | | | | (1.20 | ) | | | 0.02 | |
| | | | | | | | | | | | | | | | | | | | |
| | | | | |
Total from investment operations | | | (3.98 | ) | | | 3.13 | | | | 0.21 | | | | (1.02 | ) | | | 0.20 | |
| | | | | | | | | | | | | | | | | | | | |
| | | | | |
Less dividends and distributions: | | | | | | | | | | | | | | | | | | | | |
| | | | | |
Dividends from net investment income | | | (0.27 | ) | | | (0.14 | ) | | | (0.22 | ) | | | (0.22 | ) | | | (0.17 | ) |
| | | | | |
Distributions from net realized gain on investment transactions | | | (0.23 | ) | | | 0 | | | | 0 | | | | (0.76 | ) | | | (0.32 | ) |
| | | | | | | | | | | | | | | | | | | | |
| | | | | |
Total dividends and distributions | | | (0.50 | ) | | | (0.14 | ) | | | (0.22 | ) | | | (0.98 | ) | | | (0.49 | ) |
| | | | | | | | | | | | | | | | | | | | |
| | | | | |
Net asset value, end of period | | $ | 8.93 | | | $ | 13.41 | | | $ | 10.42 | | | $ | 10.43 | | | $ | 12.43 | |
| | | | | | | | | | | | | | | | | | | | |
| | | | | |
Total return (d) | | | (30.81)% | | | | 30.22% | | | | 1.91% | | | | (7.70)% | | | | 1.54% | |
| | | | | |
| RATIOS/SUPPLEMENTAL DATA | | | | | | | | | | | | | | | | | | | | |
| | | | | |
Net assets, end of period (000 omitted) | | | $300,821 | | | | $502,324 | | | | $398,208 | | | | $400,566 | | | | $427,851 | |
| | | | | |
Average net assets (000 omitted) | | | $418,569 | | | | $478,856 | | | | $388,053 | | | | $396,772 | | | | $424,411 | |
| | | | | |
Ratio to average net assets of: | | | | | | | | | | | | | | | | | | | | |
| | | | | |
Expenses, net of waivers/reimbursements | | | 1.07% | | | | 1.07% | | | | 1.08% | | | | 1.10% | | | | 1.10% | |
| | | | | |
Expenses, before waivers/reimbursements | | | 1.07% | | | | 1.07% | | | | 1.08% | | | | 1.10% | | | | 1.10% | |
| | | | | |
Net investment income (b) | | | 2.03% | | | | 1.22% | | | | 1.29% | | | | 1.75% | | | | 1.36% | |
| | | | | |
Portfolio turnover rate | | | 50% | | | | 48% | | | | 58% | | | | 46% | | | | 81% | |
See Footnote Summary on page 44.
See Notes to Financial Statements.
Financial Highlights (continued)
Selected per share data and ratios for a share of capital stock outstanding for each respective Portfolio for each of the periods presented:
| | | | | | | | | | | | | | | | | | | | |
| |
| | | INTERNATIONAL STRATEGIC EQUITIES PORTFOLIO SCB CLASS | |
| | | | | | | | | | | | | | | | | | | | |
| | | YEAR
ENDED
9/30/22 | | | YEAR
ENDED
9/30/21 | | | YEAR
ENDED
9/30/20 | | | YEAR
ENDED
9/30/19 | | | YEAR
ENDED
9/30/18 | |
| | | | | |
Net asset value, beginning of period | | $ | 13.72 | | | $ | 11.58 | | | $ | 11.59 | | | $ | 12.45 | | | $ | 12.69 | |
| | | | | | | | | | | | | | | | | | | | |
| | | | | |
Income from investment operations: | | | | | | | | | | | | | | | | | | | | |
| | | | | |
Investment income, net (a)(b) | | | 0.36 | | | | 0.29 | | | | 0.16 | | | | 0.24 | | | | 0.22 | |
| | | | | |
Net realized and unrealized gain (loss) on investment transactions and foreign currency transactions | | | (3.74 | ) | | | 1.98 | | | | 0.06 | | | | (0.79 | ) | | | (0.11 | ) |
| | | | | | | | | | | | | | | | | | | | |
| | | | | |
Total from investment operations | | | (3.38 | ) | | | 2.27 | | | | 0.22 | | | | (0.55 | ) | | | 0.11 | |
| | | | | | | | | | | | | | | | | | | | |
| | | | | |
Less dividends and distributions: | | | | | | | | | | | | | | | | | | | | |
| | | | | |
Dividends from net investment income | | | (0.30 | ) | | | (0.13 | ) | | | (0.23 | ) | | | (0.18 | ) | | | (0.09 | ) |
| | | | | |
Distributions from net realized gain on investment transactions | | | (0.46 | ) | | | 0 | | | | 0 | | | | (0.13 | ) | | | (0.26 | ) |
| | | | | | | | | | | | | | | | | | | | |
| | | | | |
Total dividends and distributions | | | (0.76 | ) | | | (0.13 | ) | | | (0.23 | ) | | | (0.31 | ) | | | (0.35 | ) |
| | | | | | | | | | | | | | | | | | | | |
| | | | | |
Net asset value, end of period | | $ | 9.58 | | | $ | 13.72 | | | $ | 11.58 | | | $ | 11.59 | | | $ | 12.45 | |
| | | | | | | | | | | | | | | | | | | | |
| | | | | |
Total return (d) | | | (26.13)% | | | | 19.76% | | | | 1.81% | | | | (4.22)% | | | | 0.86% | |
| | | | | |
| RATIOS/SUPPLEMENTAL DATA | | | | | | | | | | | | | | | | | | | | |
| | | | | |
Net assets, end of period (000 omitted) | | | $312,692 | | | | $445,342 | | | | $172,253 | | | | $175,497 | | | | $181,606 | |
| | | | | |
Average net assets (000 omitted) | | | $402,301 | | | | $404,275 | | | | $171,155 | | | | $168,856 | | | | $179,015 | |
| | | | | |
Ratio to average net assets of: | | | | | | | | | | | | | | | | | | | | |
| | | | | |
Expenses, net of waivers/reimbursements | | | 0.94% | | | | 0.95% | | | | 1.00% | | | | 1.00% | | | | 1.03% | |
| | | | | |
Expenses, before waivers/reimbursements | | | 0.94% | | | | 0.95% | | | | 1.00% | | | | 1.00% | | | | 1.04% | |
| | | | | |
Net investment income (b) | | | 2.91% | | | | 2.13% | | | | 1.41% | | | | 2.07% | | | | 1.69% | |
| | | | | |
Portfolio turnover rate | | | 73% | | | | 86% | | | | 63% | | | | 63% | | | | 69% | |
See Footnote Summary on page 44.
See Notes to Financial Statements.
| | | | | | | | | | | | | | | | | | | | |
| |
| | | INTERNATIONAL STRATEGIC EQUITIES PORTFOLIO ADVISOR CLASS | |
| | | | | | | | | | | | | | | | | | | | |
| | | YEAR
ENDED
9/30/22 | | | YEAR
ENDED
9/30/21 | | | YEAR
ENDED
9/30/20 | | | YEAR
ENDED
9/30/19 | | | YEAR
ENDED
9/30/18 | |
| | | | | |
Net asset value, beginning of period | | $ | 13.76 | | | $ | 11.62 | | | $ | 11.63 | | | $ | 12.50 | | | $ | 12.72 | |
| | | | | | | | | | | | | | | | | | | | |
| | | | | |
Income from investment operations | | | | | | | | | | | | | | | | | | | | |
| | | | | |
Investment income, net (a)(b) | | | 0.39 | | | | 0.32 | | | | 0.19 | | | | 0.27 | | | | 0.26 | |
| | | | | |
Net realized and unrealized gain (loss) on investment transactions and foreign currency transactions | | | (3.75 | ) | | | 1.99 | | | | 0.06 | | | | (0.80 | ) | | | (0.11 | ) |
| | | | | | | | | | | | | | | | | | | | |
| | | | | |
Total from investment operations | | | (3.36 | ) | | | 2.31 | | | | 0.25 | | | | (0.53 | ) | | | 0.15 | |
| | | | | | | | | | | | | | | | | | | | |
| | | | | |
Less dividends and distributions: | | | | | | | | | | | | | | | | | | | | |
| | | | | |
Dividends from net investment income | | | (0.33 | ) | | | (0.17 | ) | | | (0.26 | ) | | | (0.21 | ) | | | (0.11 | ) |
| | | | | |
Distributions from net realized gain on investment transactions | | | (0.46 | ) | | | 0 | | | | 0 | | | | (0.13 | ) | | | (0.26 | ) |
| | | | | | | | | | | | | | | | | | | | |
| | | | | |
Total dividends and distributions | | | (0.79 | ) | | | (0.17 | ) | | | (0.26 | ) | | | (0.34 | ) | | | (0.37 | ) |
| | | | | | | | | | | | | | | | | | | | |
| | | | | |
Net asset value, end of period | | $ | 9.61 | | | $ | 13.76 | | | $ | 11.62 | | | $ | 11.63 | | | $ | 12.50 | |
| | | | | | | | | | | | | | | | | | | | |
| | | | | |
Total return (d) | | | (25.96)% | | | | 20.02% | | | | 2.04% | | | | (4.01)% | | | | 1.18% | |
| | | | | |
| RATIOS/SUPPLEMENTAL DATA | | | | | | | | | | | | | | | | | | | | |
| | | | | |
Net assets, end of period (000 omitted) | | | $4,928,516 | | | | $6,617,933 | | | | $2,510,243 | | | | $2,621,316 | | | | $2,568,426 | |
| | | | | |
Average net assets (000 omitted) | | | $6,230,863 | | | | $5,755,397 | | | | $2,529,235 | | | | $2,501,981 | | | | $2,275,780 | |
| | | | | |
Ratio to average net assets of: | | | | | | | | | | | | | | | | | | | | |
| | | | | |
Expenses, net of waivers/reimbursements | | | 0.69% | | | | 0.70% | | | | 0.75% | | | | 0.75% | | | | 0.77% | |
| | | | | |
Expenses, before waivers/reimbursements | | | 0.70% | | | | 0.70% | | | | 0.75% | | | | 0.75% | | | | 0.79% | |
| | | | | |
Net investment income (b) | | | 3.19% | | | | 2.39% | | | | 1.65% | | | | 2.35% | | | | 2.05% | |
| | | | | |
Portfolio turnover rate | | | 73% | | | | 86% | | | | 63% | | | | 63% | | | | 69% | |
See Footnote Summary on page 44.
See Notes to Financial Statements.
Financial Highlights (continued)
Selected per share data and ratios for a share of capital stock outstanding for each respective Portfolio for each of the periods presented:
| | | | | | | | | | | | | | | | | | | | |
| |
| | | INTERNATIONAL STRATEGIC EQUITIES PORTFOLIO
CLASS Z | |
| | | | | | | | | | | | | | | | | | | | |
| | | YEAR
ENDED
9/30/22 | | | YEAR
ENDED
9/30/21 | | | YEAR
ENDED
9/30/20 | | | YEAR
ENDED
9/30/19 | | | YEAR
ENDED
9/30/18 | |
| | | | | |
Net asset value, beginning of period | | $ | 13.78 | | | $ | 11.63 | | | $ | 11.64 | | | $ | 12.51 | | | $ | 12.73 | |
| | | | | | | | | | | | | | | | | | | | |
| | | | | |
Income from investment operations | | | | | | | | | | | | | | | | | | | | |
| | | | | |
Investment income, net (a)(b) | | | 0.37 | | | | 0.30 | | | | 0.19 | | | | 0.26 | | | | 0.25 | |
| | | | | |
Net realized and unrealized gain (loss) on investment transactions and foreign currency transactions | | | (3.74 | ) | | | 2.02 | | | | 0.05 | | | | (0.79 | ) | | | (0.10 | ) |
| | | | | | | | | | | | | | | | | | | | |
| | | | | |
Total from investment operations | | | (3.37 | ) | | | 2.32 | | | | 0.24 | | | | (0.53 | ) | | | 0.15 | |
| | | | | | | | | | | | | | | | | | | | |
| | | | | |
Less dividends and distributions: | | | | | | | | | | | | | | | | | | | | |
| | | | | |
Dividends from net investment income | | | (0.33 | ) | | | (0.17 | ) | | | (0.25 | ) | | | (0.21 | ) | | | (0.11 | ) |
| | | | | |
Distributions from net realized gain on investment transactions | | | (0.46 | ) | | | 0 | | | | 0 | | | | (0.13 | ) | | | (0.26 | ) |
| | | | | | | | | | | | | | | | | | | | |
| | | | | |
Total dividends and distributions | | | (0.79 | ) | | | (0.17 | ) | | | (0.25 | ) | | | (0.34 | ) | | | (0.37 | ) |
| | | | | | | | | | | | | | | | | | | | |
| | | | | |
Net asset value, end of period | | $ | 9.62 | | | $ | 13.78 | | | $ | 11.63 | | | $ | 11.64 | | | $ | 12.51 | |
| | | | | | | | | | | | | | | | | | | | |
| | | | | |
Total return (d) | | | (26.01)% | | | | 20.07% | | | | 2.02% | | | | (4.02)% | | | | 1.18% | |
| | | | | |
| RATIOS/SUPPLEMENTAL DATA | | | | | | | | | | | | | | | | | | | | |
| | | | | |
Net assets, end of period (000 omitted) | | | $1,331,970 | | | | $2,100,301 | | | | $1,349,824 | | | | $1,359,213 | | | | $1,420,930 | |
| | | | | |
Average net assets (000 omitted) | | | $1,811,737 | | | | $2,067,177 | | | | $1,331,995 | | | | $1,331,620 | | | | $1,390,312 | |
| | | | | |
Ratio to average net assets of: | | | | | | | | | | | | | | | | | | | | |
| | | | | |
Expenses, net of waivers/reimbursements | | | 0.71% | | | | 0.71% | | | | 0.76% | | | | 0.76% | | | | 0.79% | |
| | | | | |
Expenses, before waivers/reimbursements | | | 0.71% | | | | 0.71% | | | | 0.76% | | | | 0.76% | | | | 0.80% | |
| | | | | |
Net investment income (b) | | | 3.03% | | | | 2.26% | | | | 1.65% | | | | 2.31% | | | | 1.91% | |
| | | | | |
Portfolio turnover rate | | | 73% | | | | 86% | | | | 63% | | | | 63% | | | | 69% | |
| (a) | | Based on average shares outstanding. |
| (b) | | Net of expenses waived by the Adviser. |
| (c) | | Amount is less than $.005. |
| (d) | | Total investment return is calculated assuming an initial investment made at the net asset value at the beginning of the period, reinvestment of all dividends and distributions at net asset value during the period, and redemption on the last day of the period. Total return does not reflect the deduction of taxes that a shareholder would pay on fund distributions or the redemption of fund shares. Total investment return calculated for a period of less than one year is not annualized. |
| (e) | | Includes the impact of proceeds received and credited to the Portfolio resulting from the class action settlements, which enhanced the performance for the Small Cap Core Portfolio for the year ended September 30, 2021 by 0.01%. |
See Notes to Financial Statements.
Notes to Financial Statements
| NOTE 1. | Organization and Significant Accounting Policies |
Bernstein Fund, Inc. (the “Fund”) is registered under the Investment Company Act of 1940 as an open-end registered investment company. The Fund, which is a Maryland corporation, operates as a series company currently comprised of three portfolios: Small Cap Core Portfolio, International Small Cap Portfolio and International Strategic Equities Portfolio (hereafter collectively referred to as the “Portfolios” and each individually a “Portfolio”).
The International Strategic Equities Portfolio (the “Acquiring Portfolio”) acquired the assets and liabilities of the International Portfolio and Tax-Managed International Portfolio (each, an “Acquired Portfolio,” and together, the “Acquired Portfolios”), each a series of Sanford C. Bernstein Fund, Inc. (“SCB Fund”), in a reorganization that was effective at the close of business December 4, 2020 (together, the “Reorganizations,” and each a “Reorganization”). The Reorganizations were approved by the Fund’s Board of Directors and the shareholders of the Acquired Portfolios pursuant to an Agreement and Plan of Reorganization (the “Reorganization Agreement”), see Note 7 for additional Information.
The Fund’s Portfolios offer the following share classes: SCB Class, Advisor Class and Class Z. Class Z shares are currently offered exclusively to registered investment companies (or their series) managed by AllianceBernstein L.P. (the “Adviser”). Each Portfolio has its own investment objectives. Each class of shares has identical voting, dividend, liquidation and other rights, except that the classes bear different distribution and transfer agency expenses. Each class has exclusive voting rights with respect to its distribution plan, as applicable. The financial statements have been prepared in conformity with U.S. generally accepted accounting principles (“U.S. GAAP”), which require management to make certain estimates and assumptions that affect the reported amounts of assets and liabilities in the financial statements and amounts of income and expenses during the reporting period. Actual results could differ from those estimates. Each Portfolio is an investment company under U.S. GAAP and follows the accounting and reporting guidance applicable to investment companies. The following is a summary of significant accounting policies followed by the Portfolios.
Portfolio securities are valued at market value determined on the basis of market quotations or, if market quotations are not readily available or are unreliable, at “fair value” as determined in accordance with procedures approved by and under the oversight of the Portfolios’ Board of Directors (the “Board”). Pursuant to these procedures, the Adviser serves as the Portfolios’ valuation designee pursuant to Rule 2a-5 of the 1940 Act. In this capacity, the Adviser is responsible, among other things, for making all fair value determinations relating to the Portfolios’ portfolio investments, subject to the Board’s oversight.
In general, the market values of securities which are readily available and deemed reliable are determined as follows: securities listed on a national securities exchange (other than securities listed on the NASDAQ Stock Market, Inc. (“NASDAQ”)) or on a foreign securities exchange are valued at the last sale price at the close of the exchange or foreign securities exchange. If there has been no sale on such day, the securities are valued at the last traded price from the previous day. Securities listed on more than one exchange are valued by reference to the principal exchange on which the securities are traded; securities listed only on NASDAQ are valued in accordance with the NASDAQ Official Closing Price; listed or over the counter (“OTC”) market put or call options are valued at the mid level between the current bid and ask prices. If either a current bid or current ask price is unavailable, the Adviser will have discretion to determine the best valuation (e.g., last trade price in the case of listed options); open futures are valued using the closing settlement price or, in the absence of such a price, the most recent quoted bid price. If there are no quotations available for the day of valuation, the last available closing settlement price is used; U.S. Government securities and any other debt instruments having 60 days or less remaining until maturity are generally valued at market by an independent pricing vendor, if a market price is available. If a market price is not available, the securities are valued at amortized cost. This methodology is commonly used for short term securities that have an original maturity of 60 days or less, as well as short term securities that had an original term to maturity that exceeded 60 days. In instances when amortized cost is utilized, the Valuation Committee (the “Committee”) must reasonably conclude that the utilization of amortized cost is approximately the same as the fair value of the security. Factors the Committee will consider include, but are not limited to, an impairment of the creditworthiness of the issuer or material changes in interest rates. Fixed-income securities, including mortgage-backed and asset-backed securities, may be valued on the basis of prices provided by a pricing service or at a price obtained from one or more of the major broker-dealers. In cases where broker-dealer quotes are obtained, the
Notes to Financial Statements (continued)
Adviser may establish procedures whereby changes in market yields or spreads are used to adjust, on a daily basis, a recently obtained quoted price on a security. Swaps and other derivatives are valued daily, primarily using independent pricing services, independent pricing models using market inputs, as well as third party broker-dealers or counterparties. Open-end mutual funds are valued at the closing net asset value per share, while exchange traded funds are valued at the closing market price per share.
Securities for which market quotations are not readily available (including restricted securities) or are deemed unreliable are valued at fair value as deemed appropriate by the Adviser. Factors considered in making this determination may include, but are not limited to, information obtained by contacting the issuer, analysts, analysis of the issuer’s financial statements or other available documents. In addition, the Portfolios may use fair value pricing for securities primarily traded in non-U.S. markets because most foreign markets close well before the Portfolios value their securities at 4:00 p.m., Eastern Time. The earlier close of these foreign markets gives rise to the possibility that significant events, including broad market moves, may have occurred in the interim and may materially affect the value of those securities. To account for this, the Portfolios generally value many of their foreign equity securities using fair value prices based on third party vendor modeling tools to the extent available.
| B. | | Fair Value Measurements |
In accordance with U.S. GAAP regarding fair value measurements, fair value is defined as the price that the Portfolios would receive to sell an asset or pay to transfer a liability in an orderly transaction between market participants at the measurement date. U.S. GAAP establishes a framework for measuring fair value, and a three-level hierarchy for fair value measurements based upon the transparency of inputs to the valuation of an asset or liability (including those valued based on their market values as described in Note A above). Inputs may be observable or unobservable and refer broadly to the assumptions that market participants would use in pricing the asset or liability. Observable inputs reflect the assumptions market participants would use in pricing the asset or liability based on market data obtained from sources independent of the Portfolios. Unobservable inputs reflect the Portfolios’ own assumptions about the assumptions that market participants would use in pricing the asset or liability based on the best information available in the circumstances. Each investment is assigned a level based upon the observability of the inputs which are significant to the overall valuation. The three-tier hierarchy of inputs is summarized below.
| | • | | Level 1—quoted prices in active markets for identical investments |
| | • | | Level 2—other significant observable inputs (including quoted prices for similar investments, interest rates, prepayment speeds, credit risk, etc.) |
| | • | | Level 3—significant unobservable inputs (including the Portfolios’ own assumptions in determining the fair value of investments) |
The fair value of debt instruments, such as bonds, and over-the-counter derivatives is generally based on market price quotations, recently executed market transactions (where observable) or industry recognized modeling techniques and are generally classified as Level 2. Pricing vendor inputs to Level 2 valuations may include quoted prices for similar investments in active markets, interest rate curves, coupon rates, currency rates, yield curves, option adjusted spreads, default rates, credit spreads and other unique security features in order to estimate the relevant cash flows which are then discounted to calculate fair values. If these inputs are unobservable and significant to the fair value, these investments will be classified as Level 3.
Where readily available market prices or relevant bid prices are not available for certain equity investments, such investments may be valued based on similar publicly traded investments, movements in relevant indices since last available prices or based upon underlying company fundamentals and comparable company data (such as multiples to earnings or other multiples to equity). Where an investment is valued using an observable input, such as another publicly traded security, the investment will be classified as Level 2. If management determines that an adjustment is appropriate based on restrictions on resale, illiquidity or uncertainty, and such adjustment is a significant component of the valuation, the investment will be classified as Level 3. An investment will also be classified as Level 3 where management uses company fundamentals and other significant inputs to determine the valuation.
The following tables summarize the valuation of the Portfolios’ investments by the above fair value hierarchy levels as of September 30, 2022:
| | | | | | | | | | | | | | | | |
SMALL CAP CORE PORTFOLIO INVESTMENTSIN SECURITIES: | | LEVEL 1 | | | LEVEL 2 | | | LEVEL 3 | | | TOTAL | |
|
Assets: | |
| | | | |
Common Stocks (a) | | $ | 617,084,842 | | | $ | — | | | $ | — | | | $ | 617,084,842 | |
| | | | |
Short-Term Investments | | | 1,374,218 | | | | — | | | | — | | | | 1,374,218 | |
| | | | |
Total Investments in Securities | | | 618,459,060 | | | | — | | | | — | | | | 618,459,060 | |
| | | | |
Other Financial Instruments (b): | | | | | | | | | | | | | | | | |
| | | | |
Assets | | | — | | | | — | | | | — | | | | — | |
| | | | |
Liabilities: | | | | | | | | | | | | | | | | |
| | | | |
Futures | | | (1,947,483 | ) | | | — | | | | — | | | | (1,947,483 | )(c) |
| | | | |
Total | | $ | 616,511,577 | | | $ | — | | | $ | — | | | $ | 616,511,577 | |
| | | | |
INTERNATIONAL SMALL CAP PORTFOLIO INVESTMENTSIN SECURITIES: | | LEVEL 1 | | | LEVEL 2 | | | LEVEL 3 | | | TOTAL | |
|
Assets: | |
Common Stocks: | | | | | | | | | | | | | | | | |
| | | | |
Industrials | | $ | 47,046,047 | | | $ | 161,233,367 | | | $ | — | | | $ | 208,279,414 | |
| | | | |
Consumer Discretionary | | | 17,725,887 | | | | 113,283,554 | | | | — | | | | 131,009,441 | |
| | | | |
Information Technology | | | 4,844,906 | | | | 104,000,568 | | | | — | | | | 108,845,474 | |
| | | | |
Financials | | | 12,300,484 | | | | 93,845,561 | | | | — | | | | 106,146,045 | |
| | | | |
Materials | | | 25,201,569 | | | | 79,768,922 | | | | — | | | | 104,970,491 | |
| | | | |
Communication Services | | | 13,718,112 | | | | 70,694,532 | | | | — | | | | 84,412,644 | |
| | | | |
Health Care | | | 18,701,075 | | | | 42,137,889 | | | | — | | | | 60,838,964 | |
| | | | |
Real Estate | | | 13,563,007 | | | | 44,827,236 | | | | — | | | | 58,390,243 | |
| | | | |
Energy | | | 9,696,225 | | | | 29,934,479 | | | | — | | | | 39,630,704 | |
| | | | |
Consumer Staples | | | 6,512,011 | | | | 26,705,856 | | | | — | | | | 33,217,867 | |
| | | | |
Utilities | | | 13,692,043 | | | | 6,932,258 | | | | — | | | | 20,624,301 | |
| | | | |
Investment Companies | | | 14,505,221 | | | | — | | | | — | | | | 14,505,221 | |
| | | | |
Short-Term Investments | | | 18,404,113 | | | | — | | | | — | | | | 18,404,113 | |
| | | | |
Total Investments in Securities | | | 215,910,700 | | | | 773,364,222 | (d) | | | — | | | | 989,274,922 | |
| | | | |
Other Financial Instruments (b): | | | | | | | | | | | | | | | | |
|
Assets: | |
| | | | |
Forward Currency Exchange Contracts | | | — | | | | 4,034,266 | | | | — | | | | 4,034,266 | |
|
Liabilities: | |
| | | | |
Forward Currency Exchange Contracts | | | — | | | | (4,803,251 | ) | | | — | | | | (4,803,251 | ) |
| | | | |
Total | | $ | 215,910,700 | | | $ | 772,595,237 | | | $ | — | | | $ | 988,505,937 | |
Notes to Financial Statements (continued)
| | | | | | | | | | | | | | | | |
INTERNATIONAL STRATEGIC EQUITIES PORTFOLIO INVESTMENTSIN SECURITIES: | | LEVEL 1 | | | LEVEL 2 | | | LEVEL 3 | | | TOTAL | |
|
Assets: | |
Common Stocks: | | | | | | | | | | | | | | | | |
| | | | |
Financials | | $ | 115,060,590 | | | $ | 1,033,838,995 | | | $ | — | | | $ | 1,148,899,585 | |
| | | | |
Consumer Discretionary | | | — | | | | 1,023,747,489 | | | | — | | | | 1,023,747,489 | |
| | | | |
Information Technology | | | 101,844,783 | | | | 570,237,929 | | | | — | | | | 672,082,712 | |
| | | | |
Industrials | | | — | | | | 665,026,127 | | | | — | | | | 665,026,127 | |
| | | | |
Health Care | | | — | | | | 588,044,770 | | | | — | | | | 588,044,770 | |
| | | | |
Consumer Staples | | | 30,111,947 | | | | 453,443,311 | | | | — | | | | 483,555,258 | |
| | | | |
Energy | | | 33,851,461 | | | | 439,897,447 | | | | — | | | | 473,748,908 | |
| | | | |
Communication Services | | | — | | | | 473,230,913 | | | | — | | | | 473,230,913 | |
| | | | |
Materials | | | 158,235,433 | | | | 240,441,581 | | | | — | | | | 398,677,014 | |
| | | | |
Utilities | | | 236,878,646 | | | | 29,483,860 | | | | — | | | | 266,362,506 | |
| | | | |
Real Estate | | | — | | | | 212,284,105 | | | | — | | | | 212,284,105 | |
| | | | |
Short-Term Investments | | | 74,285,607 | | | | — | | | | — | | | | 74,285,607 | |
| | | | |
Total Investments in Securities | | | 750,268,467 | | | | 5,729,676,527 | (d) | | | — | | | | 6,479,944,994 | |
| | | | |
Other Financial Instruments (b): | | | | | | | | | | | | | | | | |
|
Assets: | |
| | | | |
Forward Currency Exchange Contracts | | | — | | | | 96,310,499 | | | | — | | | | 96,310,499 | |
|
Liabilities: | |
| | | | |
Forward Currency Exchange Contracts | | | — | | | | (68,018,702 | ) | | | — | | | | (68,018,702 | ) |
| | | | |
Total | | $ | 750,268,467 | | | $ | 5,757,968,324 | | | $ | — | | | $ | 6,508,236,791 | |
| | (a) | See Schedule of Investments for sector classifications. |
| | (b) | Other financial instruments are derivative instruments, such as futures, forwards and swaps, which are valued at the unrealized appreciation/(depreciation) on the instrument. Other financial instruments may also include swaps with upfront premiums, options written and swaptions written which are valued at market value. |
| | (c) | Only variation margin receivable/(payable) at period end is reported within the statement of assets and liabilities. This amount reflects cumulative unrealized appreciation/(depreciation) on futures and centrally cleared swaps as reported in the schedule of investments. Where applicable, centrally cleared swaps with upfront premiums are presented here at market value. |
| | (d) | A significant portion of the Portfolio’s foreign equity investments are categorized as Level 2 investments since they are valued using fair value prices based on third party vendor modeling tools to the extent available, see Note 1.A. |
| C. | | Foreign Currency Translation |
The accounting records of the Portfolios are maintained in U.S. dollars. Prices of securities and other assets and liabilities denominated in non-U.S. currencies are translated into U.S. dollars using the exchange rate at 4:00 p.m., Eastern Time. Amounts related to the purchases and sales of securities, investment income and expenses are translated at the rates of exchange prevailing on the respective dates of such transactions.
Net realized gain or loss on foreign currency transactions represents net foreign exchange gains or losses from the disposition of foreign currencies, currency gains or losses realized between the trade and settlement dates on security transactions and the difference between the amount of dividends, interest and foreign withholding taxes recorded on the Portfolios’ books and the U.S. dollar equivalent amount actually received or paid. Net unrealized currency gains and losses arising from valuing foreign currency denominated assets and liabilities, other than security investments, at the current exchange rate are reflected as part of unrealized appreciation/depreciation on foreign currencies.
The Portfolios do not isolate that portion of the results of operations arising as a result of changes in the foreign exchange rates from the changes in the market prices of securities held at period end. The Portfolios do isolate the effect of changes in foreign exchange rates from changes in market prices of securities sold during the year, as required by the Internal Revenue Code. The International Small Cap Portfolio and International Strategic Equities Portfolio may invest in foreign securities and foreign currency transactions that may involve risks not associated with domestic investments as a result of the level of governmental supervision and regulation of foreign securities markets and the possibility of political or economic instability, among others.
Each Portfolio is treated as a separate entity for federal income tax purposes. Each Portfolio intends to continue to comply with the requirements of Subchapter M of the Internal Revenue Code of 1986 as they apply to regulated investment companies. By so complying, each Portfolio will not be subject to federal and state income taxes to the extent that all of its income is distributed. The Portfolios may be subject to taxes imposed by countries in which they invest. Such taxes are generally based on income and/or capital gains earned or repatriated. Taxes are accrued and applied to net investment income, net realized gains and net unrealized appreciation/depreciation as such income and/or gains are earned based on, management’s understanding of applicable local tax law.
In consideration of recent decisions rendered by the European courts, certain Portfolios filed reclaims to recover taxes withheld on dividends earned from certain European Union countries during calendar years 2006 through 2020. These filings are subject to various administrative and judicial proceedings within these countries. For the year ended September 30, 2022, the International Small Cap and International Strategic Equities Portfolios successfully recovered taxes withheld by Finland, France and Sweden for the aforementioned calendar years in the amount of $260,037 and $33,820,510, respectively. Such amounts are reflected in the statement of operations as an offset to foreign taxes withheld and recorded in dividend income. No other amounts for additional tax reclaims are disclosed in the financial statements due to the uncertainty as to the ultimate resolution of proceedings, the likelihood of receipt of these reclaims, and the potential timing of payment.
In accordance with U.S. GAAP requirements regarding accounting for uncertainties in income taxes, management has analyzed the Portfolios’ tax positions taken or expected to be taken on federal and state income tax returns for all open tax years (the current and the prior three tax years) and has concluded that no provision for income tax is required in the Portfolios’ financial statements. As of September 30, 2022, the Portfolios did not have any unrecognized tax benefits.
| E. | | Security Transactions and Related Investment Income |
Security transactions are accounted for on the trade date (the date the buy or sell order is executed). Securities gains and losses are calculated on the identified cost basis. Interest income is recorded on the accrual basis and dividend income is recorded on the ex-dividend date or as soon as the Portfolios are informed of the dividend. Non-cash dividends, if any, are recorded on the ex-dividend date at the fair value of the securities received. The Portfolios amortize premiums and accrete discounts as adjustments to interest income. The Portfolio accounts for distributions received from REIT investments or from regulated investment companies as dividend income, realized gain, or return of capital based on information provided by the REIT or the investment company.
All income earned and expenses incurred by the Portfolios are borne on a pro-rata basis by each outstanding class of shares, based on the proportionate interest in the Portfolio represented by the shares of such class, except for class specific expenses which are allocated to the respective class. Expenses of the Fund are charged proportionately to each Portfolio or based on other appropriate methods. Realized and unrealized gains and losses are allocated among the various share classes based on respective net assets.
| G. | | Distribution of Income and Gains |
Dividends from net investment income, if any, will be paid to shareholders at least once a year.
Distributions of net realized gains, less any available loss carryforwards, if any, for all the Portfolios will be paid to shareholders at least once a year, and recorded on the ex-dividend date.
Notes to Financial Statements (continued)
Elements of realized gains and net investment income may be recorded in different accounting periods for financial reporting (book) and federal income tax (tax) purposes (temporary differences). To the extent that such distributions required for tax purposes exceed income and gains recorded for book purposes as a result of such temporary differences, “excess distributions” are reflected in the accompanying statement of assets and liabilities. To the extent distributions exceed income and gains for tax purposes, such distributions would be shown as “return of capital” on the statement of changes in net assets. Certain other differences—permanent differences—arise because treatment of elements of income and gains is different between book and tax accounting. Permanent differences are reclassified in the year they arise.
Permanent differences have no effect on net assets. The effects of such permanent differences on each Portfolio, due to the utilization of earnings and profits distributed to shareholders on redemption of shares and contribution from affiliates which are reflected as adjustments to the components of net assets as of September 30, 2022, as shown below:
| | | | | | | | |
| PORTFOLIO | | INCREASE (DECREASE)
TO ADDITIONAL
PAID-IN CAPITAL | | | INCREASE (DECREASE)
TO DISTRIBUTABLE
EARNINGS/
ACCUMULATED LOSS | |
Small Cap Core | | $ | 1,967,730 | | | $ | (1,967,730 | ) |
| | |
International Small Cap | | | 0 | | | | 0 | |
| | |
International Strategic Equities | | | 5,329,568 | | | | (5,329,568 | ) |
| NOTE 2. | Investment Management and Transactions with Affiliated Persons |
Under the Investment Management Agreement between the Fund and the Adviser, the Adviser manages the investment of each Portfolio’s assets, places purchase and sale orders, and bears various expenses, including the salaries and expenses of all personnel except those of outside directors. In addition, the Adviser agrees to permit its directors, officers and employees who may be elected directors or officers of the Fund to serve in the capacities to which they are elected. The Adviser renders these services subject to the general oversight of the Board.
The Portfolios pay the Adviser an investment management fee at an annualized rate as follows:
Small Cap Core Portfolio: 0.80% of the Portfolio’s average daily net assets.
International Small Cap Portfolio: 1.00% of the Portfolio’s average daily net assets.
| | | | | | | | | | | | |
| ANNUAL PERCENTAGEOF AVERAGE DAILY NET ASSETSOF EACH PORTFOLIO | |
| | | FIRST $2.5 BILLION | | | NEXT $2.5 BILLION | | | THEREAFTER | |
| International Strategic Equities | | | 0.75 | % | | | 0.65 | % | | | 0.60 | % |
The Adviser has agreed to waive its fees and bear certain expenses to the extent necessary to limit the total portfolio operating expenses (excluding acquired fund fees and expenses other than the advisory fees of any AB mutual funds in which the Portfolios may invest, interest expense, taxes, extraordinary expenses, and brokerage commissions and other transaction costs) as a percentage of daily average net assets on an annual basis (the “Expense Caps”) as follows:
| | | | | | | | | | | | |
| PORTFOLIO | | SCB CLASS | | | ADVISOR CLASS | | | CLASS Z | |
| Small Cap Core | | | 1.30 | % | | | 1.05 | % | | | 1.05 | % |
| | | |
| International Small Cap | | | 1.35 | % | | | 1.10 | % | | | 1.10 | % |
The Expense Caps described above for Small Cap Core and International Small Cap may not be terminated by the Adviser before January 28, 2023. During the year ended September 30, 2022, there were no such reimbursement/waivers.
During the year ended September 30, 2022, the Adviser reimbursed the Small Cap Core Portfolio $3,193 for trading losses incurred due to trade entry errors.
| B. | | Shareholder Servicing Fee; Transfer Agency Fee |
Under the Shareholder Servicing Agreement between the Fund and the Adviser, the Adviser pays expenses it incurs in providing shareholder servicing to the Fund, the Portfolios and individual shareholders. Such services include, but are not limited to, providing information to shareholders concerning their fund investments, systematic withdrawal plans, fund dividend payments and reinvestments, shareholder account or transactions status, net asset value of shares, fund performance, fund services, plans and options, fund investment policies, portfolio holdings and tax consequences of fund investments; dealing with shareholder complaints and other correspondence relating to fund matters; and communications with shareholders when proxies are being solicited from them with respect to voting their fund shares. Under the agreement, the fee paid by each Portfolio to the Adviser for services is 0.25% of the average daily net assets of SCB Class Shares.
The Fund compensates AllianceBernstein Investor Services, Inc. (“ABIS”), a wholly-owned subsidiary of the Adviser, under a Transfer Agency Agreement for providing personnel and facilities to perform transfer agency services for the Fund. ABIS may make payments to intermediaries that provide omnibus account services, sub accounting services and/or networking services. For the year ended September 30, 2022, the compensation retained by ABIS amounted to: Small Cap Core Portfolio, $212,569; International Small Cap Portfolio, $226,522; and International Strategic Equities Portfolio, $596,879.
| C. | | Distribution Arrangements—the Portfolios Except the Retail Classes |
Under the Distribution Agreement between the Fund, on behalf of each Portfolio, and Sanford C. Bernstein & Co., LLC (the “Distributor”), the Distributor agrees to act as agent to sell SCB Class shares of the Portfolios. The Distributor receives no fee for this service, and furthermore agrees to pay all expenses arising from the performance of its obligations under this agreement. The Distributor is a wholly owned subsidiary of the Adviser.
| D. | | Distribution Arrangements—the Retail Classes Only |
The Fund has entered into a Distribution Services Agreement (the “Agreement”) with AllianceBernstein Investments, Inc., (the “Retail Distributor”), to permit the Retail Distributor to distribute the Portfolios’ Advisor Class and Class Z shares, as applicable, and to permit the Fund to pay distribution services fees to defray expenses associated with the distribution of the Portfolios’ Class A and Class C shares in accordance with a plan of distribution which is included in the Agreement and which has been duly adopted and approved in accordance with Rule 12b-1 under the under the Investment Company Act of 1940 (the “Rule 12b-1 Plan”). Advisor Class shares and Class Z shares are not subject to Rule 12b-1 asset-based sales charges.
| E. | | Investments in Affiliated Issuers |
The Portfolios may invest in AB Government Money Market Portfolio (the “Government Money Market Portfolio”), advised by the Adviser, which has a contractual annual advisory fee rate of .20% of the portfolio’s average daily net assets and bears its own expenses. The Adviser has contractually agreed to waive .10% of the advisory fee of Government Money Market Portfolio (resulting in a net advisory fee of .10%) until August 31, 2023. In connection with the investment by the Portfolios in Government Money Market Portfolio, the Adviser has contractually agreed to waive its advisory fee from the Portfolios in an amount equal to each Portfolio’s pro rata share of the effective advisory fee of Government Money Market Portfolio, as borne indirectly by the Portfolios as an acquired fund fee and expense.
For the year ended September 30, 2022, such waivers amounted to:
| | | | |
| PORTFOLIO | | AMOUNT | |
Small Cap Core | | $ | 4,605 | |
| |
International Small Cap | | | 17,147 | |
| |
International Strategic Equities | | | 158,787 | |
Notes to Financial Statements (continued)
A summary of the Portfolios’ transactions in shares of the Government Money Market Portfolio for the year ended September 30, 2022 is as follows:
| | | | | | | | | | | | | | | | | | | | |
| PORTFOLIO | | MARKET VALUE
9/30/21
(000) | | | PURCHASES
AT COST
(000) | | | SALES
PROCEEDS
(000) | | | MARKET VALUE
9/30/22
(000) | | | DIVIDEND
INCOME
(000) | |
Small Cap Core | | $ | 0 | | | $ | 115,206 | | | $ | 113,832 | | | $ | 1,374 | | | $ | 55 | |
| | | | | |
International Small Cap | | | 17,728 | | | | 259,358 | | | | 258,682 | | | | 18,404 | | | | 144 | |
| | | | | |
International Strategic Equities | | | 230,322 | | | | 1,892,188 | | | | 2,048,224 | | | | 74,286 | | | | 1,148 | |
| NOTE 3. | Investment Security Transactions |
For the year ended September 30, 2022, the Portfolios had purchases and sales transactions, excluding transactions in short-term instruments, as follows:
| | | | | | | | | | | | | | | | |
| PORTFOLIO | | PURCHASES EXCLUDING
U.S. GOVERNMENT
SECURITIES | | | PURCHASES OF
U.S. GOVERNMENT
SECURITIES | | | SALES EXCLUDING
U.S. GOVERNMENT
SECURITIES | | | SALESOF U.S.
GOVERNMENT
SECURITIES | |
Small Cap Core | | $ | 259,975,087 | | | $ | 0 | | | $ | 348,001,468 | | | $ | 0 | |
| | | | |
International Small Cap | | | 643,551,567 | | | | 0 | | | | 675,926,292 | | | | 0 | |
| | | | |
International Strategic Equities | | | 6,173,237,501 | | | | 0 | | | | 5,944,838,320 | | | | 0 | |
The cost of investments for federal income tax purposes, gross unrealized appreciation and unrealized depreciation are as follows:
| | | | | | | | | | | | | | | | |
| | | | | | GROSS UNREALIZED | | | NET UNREALIZED
APPRECIATION (DEPRECIATION) | |
| PORTFOLIO | | COST | | | APPRECIATION | | | (DEPRECIATION) | |
Small Cap Core | | $ | 569,719,919 | | | $ | 126,724,864 | | | $ | (77,985,723 | ) | | $ | 48,739,141 | |
| | | | |
International Small Cap | | | 1,179,280,597 | | | | 93,850,648 | | | | (282,917,966 | ) | | | (189,067,318 | ) |
| | | | |
International Strategic Equities | | | 7,575,793,775 | | | | 371,600,862 | | | | (1,458,781,051 | ) | | | (1,087,180,189 | ) |
| B. | | Derivative Financial Instruments |
Each Portfolio may use derivatives in an effort to earn income and enhance returns, to replace more traditional direct investments, to obtain exposure to otherwise inaccessible markets (collectively, “investment purposes”), or to hedge or adjust the risk profile of its portfolio.
The principal types of derivatives utilized by the Portfolios, as well as the methods in which they may be used are:
Each Portfolio may buy or sell futures for investment purposes or for the purpose of hedging its portfolio against adverse effects of potential movements in the market. The Portfolios bear the market risk that arises from changes in the value of these instruments and the imperfect correlation between movements in the price of the futures and movements in the price of the assets, reference rates or indices which they are designed to track. Among other things, the Portfolios may purchase or sell futures for foreign currencies or options thereon for non-hedging purposes as a means of making direct investment in foreign currencies, as described below under “Currency Transactions”.
At the time a Portfolio enters into futures, a Portfolio deposits and maintains as collateral an initial margin with the broker, as required by the exchange on which the transaction is effected. Such amount is shown as cash collateral due from broker on the statement of assets and liabilities. Pursuant to the contract, the Portfolios agree to receive from or pay to the broker an amount of cash equal to the daily fluctuation in the value of the contract. Such receipts or payments are
known as variation margin and are recorded by the Portfolios as unrealized gains or losses. Risks may arise from the potential inability of a counterparty to meet the terms of the contract. The credit/counterparty risk for exchange-traded futures is generally less than privately negotiated futures, since the clearinghouse, which is the issuer or counterparty to each exchange-traded future, has robust risk mitigation standards, including the requirement to provide initial and variation margin. When the contract is closed, the Portfolios record a realized gain or loss equal to the difference between the value of the contract at the time it was opened and the time it was closed.
Use of long futures subjects the Portfolios to risk of loss in excess of the amounts shown on the statement of assets and liabilities, up to the notional value of the futures. Use of short futures subjects the Portfolios to unlimited risk of loss. Each Portfolio may enter into futures only on exchanges or boards of trade. The exchange or board of trade acts as the counterparty to each futures transactions; therefore, the Portfolios’ credit risk is subject to failure of the exchange or board of trade. Under some circumstances, futures exchanges may establish daily limits on the amount that the price of futures can vary from the previous day’s settlement price, which could effectively prevent liquidation of unfavorable positions.
During the year ended September 30, 2022, the Small Cap Core Portfolio held futures for hedging purposes.
| | • | | Forward Currency Exchange Contracts |
Each Portfolio may enter into forward currency exchange contracts on either a spot (i.e., cash) or forward basis. Spot contracts are entered into at the rate then prevailing in the currency-exchange market. Forward currency exchange contracts obligate the contracting parties to purchase or sell a specific currency at a specified future date at a specified price. The Portfolios will generally not enter into a forward currency exchange contract with a term greater than one year. The gain or loss arising from the difference between the original contract and the closing of such contract would be included in net realized gain or loss on foreign currency transactions. Fluctuations in the value of open forward currency exchange contracts are recorded for financial reporting purposes as unrealized appreciation and/or depreciation by the Portfolio. Risks may arise from the potential inability of a counterparty to meet the terms of a contract and from unanticipated movements in the value of a foreign currency relative to the U.S. dollar.
Forward currency exchange contracts used to protect the Portfolios from adverse currency movements involve the risk that the Adviser may not accurately predict currency movements. As a result, total return could be adversely affected. The Adviser may seek investment opportunities by taking long or short positions in currencies through the use of currency-related derivatives, including forward currency exchange contracts, futures and options on futures, swaps and other options. The Adviser may enter into foreign currency transactions for investment opportunities when it anticipates that a foreign currency will appreciate or depreciate in value.
Under certain circumstances, the Portfolios may commit a substantial portion or the entire value of the Portfolios to the consummation of these contracts. The Adviser will consider the effect that a substantial commitment of assets to forward currency exchange contracts would have on the investment program of the Portfolios and the flexibility of the Portfolios to purchase additional securities.
During the year ended September 30, 2022, the International Small Cap Portfolio and International Strategic Equities Portfolio held forward currency exchange contracts for hedging purposes.
A Portfolio typically enters into International Swaps and Derivatives Association, Inc. Master Agreements (“ISDA Master Agreement”) with its OTC derivative contract counterparties in order to, among other things, reduce its credit risk to OTC counterparties. ISDA Master Agreements include provisions for general obligations, representations, collateral and events of default or termination. Under an ISDA Master Agreement, a Portfolio typically may offset with the OTC counterparty certain derivative financial instruments’ payables and/or receivables with collateral held and/or posted and create one single net payment (close-out netting) in the event of default or termination. In the event of a default by an OTC counterparty, the return of collateral with market value in excess of a Portfolio’s net liability, held by the defaulting party, may be delayed or denied.
A Portfolio’s ISDA Master Agreements may contain provisions for early termination of OTC derivative transactions in the event the net assets of a Portfolio decline below specific levels (“net asset contingent features”). If these levels are triggered, a Portfolio’s OTC counterparty has the right to terminate such transaction and require the Portfolio to pay or receive a settlement amount in connection with the terminated transaction. If OTC derivatives were held at period end, please refer to netting arrangements by the OTC counterparty tables below for additional details.
Notes to Financial Statements (continued)
During the year ended September 30, 2022, the Portfolios had entered into the following derivatives:
| | | | | | | | | | | | |
| SMALL CAP CORE PORTFOLIO | | ASSET DERIVATIVES | | | LIABILITY DERIVATIVES | |
| DERIVATIVE TYPE | | STATEMENT OF ASSETS
AND LIABILITIES
LOCATION | | FAIR VALUE | | | STATEMENT OF ASSETS
AND LIABILITIES LOCATION | | FAIR VALUE | |
| | | | |
Equity contracts | | | | | | | | Receivable/Payable for variation margin on futures | | $ | 1,947,483 | * |
| | | | |
Total | | | | | | | | | | $ | 1,947,483 | |
| | * | Only variation margin receivable/payable at period end is reported within the statement of assets and liabilities. This amount reflects cumulative unrealized appreciation/(depreciation) on futures and centrally cleared swaps as reported in the schedule of investments. |
| | | | | | | | | | | | |
| DERIVATIVE TYPE | | LOCATIONOF GAINOR (LOSS)ON
DERIVATIVES WITHIN STATEMENT
OF OPERATIONS | | REALIZED GAIN
OR (LOSS) ON
DERIVATIVES | | | CHANGE IN UNREALIZED
APPRECIATIONOR
(DEPRECIATION) | |
| | | |
Equity contracts | | Net realized gain (loss) on futures; Net change in unrealized appreciation/depreciation of futures | | $ | (2,694,604 | ) | | $ | (1,687,059 | ) |
| | | |
Total | | | | $ | (2,694,604 | ) | | $ | (1,687,059 | ) |
| | | | | | | | | | | | |
INTERNATIONAL SMALL
CAP PORTFOLIO | | ASSET DERIVATIVES | | | LIABILITY DERIVATIVES | |
| DERIVATIVE TYPE | | STATEMENT OF ASSETS
AND LIABILITIES
LOCATION | | FAIR VALUE | | | STATEMENT OF ASSETS
AND LIABILITIES LOCATION | | FAIR VALUE | |
| | | | |
Foreign currency contracts | | Unrealized appreciation on forward currency exchange contracts | | $ | 4,034,266 | | | Unrealized depreciation on forward currency exchange contracts | | $ | 4,803,251 | |
| | | | |
Total | | | | $ | 4,034,266 | | | | | $ | 4,803,251 | |
| | | | | | | | | | |
| DERIVATIVE TYPE | | LOCATION OF GAIN OR (LOSS) ON
DERIVATIVES WITHIN STATEMENT
OF OPERATIONS | | REALIZED GAIN
OR (LOSS)ON
DERIVATIVES | | CHANGE IN UNREALIZED
APPRECIATIONOR
(DEPRECIATION) | |
| | | |
Foreign currency contracts | | Net realized gain (loss) on forward currency exchange contracts; Net change in unrealized appreciation/depreciation of forward currency exchange contracts | | $8,560,288 | | $ | (583,885 | ) |
| | | |
Total | | | | $8,560,288 | | $ | (583,885 | ) |
| | | | | | | | | | | | |
INTERNATIONAL STRATEGIC
EQUITIES PORTFOLIO | | ASSET DERIVATIVES | | | LIABILITY DERIVATIVES | |
| DERIVATIVE TYPE | | STATEMENTOF ASSETS
AND LIABILITIES
LOCATION | | FAIR VALUE | | | STATEMENTOF ASSETS
AND LIABILITIES LOCATION | | FAIR VALUE | |
| | | | |
Foreign currency contracts | | Unrealized appreciation on forward currency exchange contracts | | $ | 96,310,499 | | | Unrealized depreciation on forward currency exchange contracts | | $ | 68,018,702 | |
| | | | |
Total | | | | $ | 96,310,499 | | | | | $ | 68,018,702 | |
| | | | | | | | | | |
| DERIVATIVE TYPE | | LOCATIONOF GAINOR (LOSS)ON
DERIVATIVES WITHIN STATEMENT
OF OPERATIONS | | REALIZED GAIN
OR (LOSS)ON
DERIVATIVES | | | CHANGE IN UNREALIZED
APPRECIATIONOR
(DEPRECIATION) |
| | | |
Foreign currency contracts | | Net realized gain (loss) on forward currency exchange contracts; Net change in unrealized appreciation/depreciation of forward currency exchange contracts | | $ | 110,463,607 | | | $8,721,951 |
| | | |
Total | | | | $ | 110,463,607 | | | $8,721,951 |
The following tables represent the average monthly volume of the Portfolios’ derivative transactions during the year ended September 30, 2022:
| | | | |
| SMALL CAP CORE PORTFOLIO | | AMOUNT | |
Futures: | | | | |
| |
Average notional amount of buy contracts | | $ | 18,138,046 | |
| | | | |
| INTERNATIONAL SMALL CAP PORTFOLIO | | | |
Forward Currency Exchange Contracts: | | | | |
| |
Average principal amount of buy contracts | | $ | 208,349,360 | |
| |
Average principal amount of sale contracts | | $ | 189,290,159 | |
| | | | |
| INTERNATIONAL STRATEGIC EQUITIES PORTFOLIO | | | |
Forward Currency Exchange Contracts: | | | | |
| |
Average principal amount of buy contracts | | $ | 1,938,435,385 | |
| |
Average principal amount of sale contracts | | $ | 2,154,855,271 | |
For financial reporting purposes, the Portfolios do not offset derivative assets and derivative liabilities that are subject to netting arrangements in the statement of assets and liabilities.
All OTC derivatives held at period end were subject to netting arrangements. The following tables present the Portfolios’ derivative assets and liabilities by OTC counterparty net of amounts available for offset under ISDA Master Agreements (“MA”) and net of the related collateral received/pledged by the Portfolios as of September 30, 2022. Exchange-traded derivatives and centrally cleared swaps are not subject to netting arrangements and as such are excluded from the tables.
| | | | | | | | | | | | | | | | | | | | |
| INTERNATIONAL SMALL CAP PORTFOLIO | |
| COUNTERPARTY | | DERIVATIVE
ASSETS SUBJECT
TOA MA | | | DERIVATIVES
AVAILABLE FOR
OFFSET | | | CASH
COLLATERAL
RECEIVED* | | | SECURITY
COLLATERAL
RECEIVED* | | | NET AMOUNT OF
DERIVATIVE
ASSETS | |
| | | | | |
Bank of America, NA | | $ | 405,261 | | | $ | (405,261 | ) | | $ | 0 | | | $ | 0 | | | $ | 0 | |
| | | | | |
Barclays Bank PLC | | | 488,568 | | | | (488,568 | ) | | | 0 | | | | 0 | | | | 0 | |
| | | | | |
BNP Paribas SA | | | 388,672 | | | | (388,672 | ) | | | 0 | | | | 0 | | | | 0 | |
| | | | | |
Citibank, NA | | | 417,288 | | | | (417,288 | ) | | | 0 | | | | 0 | | | | 0 | |
| | | | | |
Goldman Sachs Bank USA | | | 14,937 | | | | (14,937 | ) | | | 0 | | | | 0 | | | | 0 | |
| | | | | |
HSBC Bank USA | | | 203,813 | | | | (203,813 | ) | | | 0 | | | | 0 | | | | 0 | |
| | | | | |
Natwest Markets PLC | | | 531,145 | | | | 0 | | | | 0 | | | | 0 | | | | 531,145 | |
| | | | | |
Standard Chartered Bank | | | 1,263,910 | | | | (294,469 | ) | | | (962,000 | ) | | | 0 | | | | 7,441 | |
| | | | | |
State Street Bank & Trust Co. | | | 182,076 | | | | 0 | | | | 0 | | | | 0 | | | | 182,076 | |
| | | | | |
UBS AG | | | 138,596 | | | | (138,596 | ) | | | 0 | | | | 0 | | | | 0 | |
| | | | | |
Total | | $ | 4,034,266 | | | $ | (2,351,604 | ) | | $ | (962,000 | ) | | $ | 0 | | | $ | 720,662 | ^ |
Notes to Financial Statements (continued)
| | | | | | | | | | | | | | | | | | | | |
| COUNTERPARTY | | DERIVATIVE
LIABILITIES SUBJECT
TOA MA | | | DERIVATIVES
AVAILABLE FOR
OFFSET | | | CASH
COLLATERAL
PLEDGED* | | | SECURITY
COLLATERAL
PLEDGED* | | | NET AMOUNT OF
DERIVATIVE
LIABILITIES | |
| | | | | |
Bank of America, NA | | $ | 733,403 | | | $ | (405,261 | ) | | $ | 0 | | | $ | 0 | | | $ | 328,142 | |
| | | | | |
Barclays Bank PLC | | | 1,444,544 | | | | (488,568 | ) | | | (955,976 | ) | | | 0 | | | | 0 | |
| | | | | |
BNP Paribas SA | | | 543,373 | | | | (388,672 | ) | | | 0 | | | | 0 | | | | 154,701 | |
| | | | | |
Citibank, NA | | | 498,732 | | | | (417,288 | ) | | | 0 | | | | 0 | | | | 81,444 | |
| | | | | |
Goldman Sachs Bank USA | | | 204,382 | | | | (14,937 | ) | | | 0 | | | | 0 | | | | 189,445 | |
| | | | | |
HSBC Bank USA | | | 403,403 | | | | (203,813 | ) | | | 0 | | | | 0 | | | | 199,590 | |
| | | | | |
Morgan Stanley Capital Services, Inc. | | | 527,347 | | | | 0 | | | | 0 | | | | 0 | | | | 527,347 | |
| | | | | |
Standard Chartered Bank | | | 294,469 | | | | (294,469 | ) | | | 0 | | | | 0 | | | | 0 | |
| | | | | |
UBS AG | | | 153,598 | | | | (138,596 | ) | | | 0 | | | | 0 | | | | 15,002 | |
| | | | | |
Total | | $ | 4,803,251 | | | $ | (2,351,604 | ) | | $ | (955,976 | ) | | $ | 0 | | | $ | 1,495,671 | ^ |
| | * | The actual collateral received/pledged may be more than the amount reported due to over-collateralization. |
| | ^ | Net amount represents the net receivable/payable that would be due from/to the counterparty in the event of default or termination. The net amount from OTC financial derivative instruments can only be netted across transactions governed under the same master agreement with the same counterparty. |
| | | | | | | | | | | | | | | | | | | | |
| INTERNATIONAL STRATEGIC EQUITIES PORTFOLIO | |
| COUNTERPARTY | | DERIVATIVE
ASSETS SUBJECT
TOA MA | | | DERIVATIVES
AVAILABLE FOR
OFFSET | | | CASH
COLLATERAL
RECEIVED* | | | SECURITY
COLLATERAL
RECEIVED* | | | NET AMOUNT OF
DERIVATIVE
ASSETS | |
| | | | | |
Australia and New Zealand Banking Group Ltd. | | $ | 235,884 | | | $ | (235,884 | ) | | $ | 0 | | | $ | 0 | | | $ | 0 | |
| | | | | |
Bank of America, NA | | | 4,978,128 | | | | (4,978,128 | ) | | | 0 | | | | 0 | | | | 0 | |
| | | | | |
Barclays Bank PLC | | | 2,240,663 | | | | (2,240,663 | ) | | | 0 | | | | 0 | | | | 0 | |
| | | | | |
BNP Paribas SA | | | 10,993,282 | | | | (1,495,289 | ) | | | (9,497,993 | ) | | | 0 | | | | 0 | |
| | | | | |
Citibank, NA | | | 26,823,942 | | | | (7,298,491 | ) | | | (8,930,000 | ) | | | 0 | | | | 10,595,451 | |
| | | | | |
Goldman Sachs Bank USA | | | 3,493,059 | | | | (2,860,231 | ) | | | 0 | | | | 0 | | | | 632,828 | |
| | | | | |
HSBC Bank USA | | | 30,315,945 | | | | (8,043,418 | ) | | | (11,010,000 | ) | | | 0 | | | | 11,262,527 | |
| | | | | |
JPMorgan Chase Bank, NA | | | 1,766,130 | | | | (1,766,130 | ) | | | 0 | | | | 0 | | | | 0 | |
| | | | | |
Morgan Stanley Capital Services, Inc. | | | 172,049 | | | | (172,049 | ) | | | 0 | | | | 0 | | | | 0 | |
| | | | | |
Standard Chartered Bank | | | 10,492,384 | | | | (1,877,692 | ) | | | (8,614,692 | ) | | | 0 | | | | 0 | |
| | | | | |
UBS AG | | | 4,799,033 | | | | (4,799,033 | ) | | | 0 | | | | 0 | | | | 0 | |
| | | | | |
Total | | $ | 96,310,499 | | | $ | (35,767,008 | ) | | $ | (38,052,685 | ) | | $ | 0 | | | $ | 22,490,806 | ^ |
| | | | | | | | | | | | | | | | | | | | |
| COUNTERPARTY | | DERIVATIVE
LIABILITIES SUBJECT
TOA MA | | | DERIVATIVES
AVAILABLE FOR
OFFSET | | | CASH
COLLATERAL
PLEDGED* | | | SECURITY
COLLATERAL
PLEDGED* | | | NET AMOUNT OF
DERIVATIVE
LIABILITIES | |
| | | | | |
Australia and New Zealand Banking Group Ltd. | | $ | 2,692,134 | | | $ | (235,884 | ) | | $ | 0 | | | $ | 0 | | | $ | 2,456,250 | |
| | | | | |
Bank of America, NA | | | 9,509,049 | | | | (4,978,128 | ) | | | 0 | | | | 0 | | | | 4,530,921 | |
| | | | | |
Barclays Bank PLC | | | 5,147,914 | | | | (2,240,663 | ) | | | (731,000 | ) | | | 0 | | | | 2,176,251 | |
| | | | | |
BNP Paribas SA | | | 1,495,289 | | | | (1,495,289 | ) | | | 0 | | | | 0 | | | | 0 | |
| | | | | |
Citibank, NA | | | 7,298,491 | | | | (7,298,491 | ) | | | 0 | | | | 0 | | | | 0 | |
| | | | | |
Goldman Sachs Bank USA | | | 2,860,231 | | | | (2,860,231 | ) | | | 0 | | | | 0 | | | | 0 | |
| | | | | |
HSBC Bank USA | | | 8,043,418 | | | | (8,043,418 | ) | | | 0 | | | | 0 | | | | 0 | |
| | | | | |
JPMorgan Chase Bank, NA | | | 4,638,453 | | | | (1,766,130 | ) | | | 0 | | | | 0 | | | | 2,872,323 | |
| | | | | |
Morgan Stanley Capital Services, Inc. | | | 796,678 | | | | (172,049 | ) | | | 0 | | | | 0 | | | | 624,629 | |
| | | | | |
Standard Chartered Bank | | | 1,877,692 | | | | (1,877,692 | ) | | | 0 | | | | 0 | | | | 0 | |
| | | | | |
State Street Bank & Trust Co. | | | 161,069 | | | | 0 | | | | 0 | | | | 0 | | | | 161,069 | |
| | | | | |
UBS AG | | | 23,498,284 | | | | (4,799,033 | ) | | | 0 | | | | 0 | | | | 18,699,251 | |
| | | | | |
Total | | $ | 68,018,702 | | | $ | (35,767,008 | ) | | $ | (731,000 | ) | | $ | 0 | | | $ | 31,520,694 | ^ |
| | * | The actual collateral received/pledged may be more than the amount reported due to over-collateralization. |
| | ^ | Net amount represents the net receivable/payable that would be due from/to the counterparty in the event of default or termination. The net amount from OTC financial derivative instruments can only be netted across transactions governed under the same master agreement with the same counterparty. |
The Portfolios may invest in non-U.S. Dollar-denominated securities on a currency hedged or unhedged basis. The Portfolios may seek investment opportunities by taking long or short positions in currencies through the use of currency-related derivatives, including forward currency exchange contracts, futures and options on futures, swaps, and other options. The Portfolios may enter into transactions for investment opportunities when it anticipates that a foreign currency will appreciate or depreciate in value but securities denominated in that currency are not held by the Portfolios and do not present attractive investment opportunities. Such transactions may also be used when the Adviser believes that it may be more efficient than a direct investment in a foreign currency-denominated security. The Portfolios may also conduct currency exchange contracts on a spot basis (i.e., for cash at the spot rate prevailing in the currency exchange market for buying or selling currencies).
| NOTE 4. | Distributions to Shareholders |
The tax character of distributions paid during the fiscal years ended September 30, 2022 and September 30, 2021 were as follows:
| | | | | | | | |
| PORTFOLIO | | 2022 | | | 2021 | |
Small Cap Core | | | | | | | | |
| | |
Distributions paid from: | | | | | | | | |
| | |
Ordinary income | | $ | 1,025,873 | | | $ | 3,943,698 | |
| | |
Long-term capital gains | | $ | 50,364,472 | | | $ | 0 | |
| | | | | | | | |
| | |
Total distributions paid | | $ | 51,390,345 | | | $ | 3,943,698 | |
| | | | | | | | |
| | | | | | | | |
Notes to Financial Statements (continued)
| | | | | | | | |
| PORTFOLIO | | 2022 | | | 2021 | |
International Small Cap | | | | | | | | |
| | |
Distributions paid from: | | | | | | | | |
| | |
Ordinary income | | $ | 30,557,817 | | | $ | 15,502,777 | |
| | |
Long-term capital gains | | $ | 26,557,551 | | | $ | 0 | |
| | | | | | | | |
| | |
Total distributions paid | | $ | 57,115,368 | | | $ | 15,502,777 | |
| | | | | | | | |
| | | | | | | | |
International Strategic Equities | | | | | | | | |
| | |
Distributions paid from: | | | | | | | | |
| | |
Ordinary income | | $ | 243,649,242 | | | $ | 57,001,223 | |
| | |
Long-term capital gains | | $ | 287,268,751 | | | $ | 0 | |
| | | | | | | | |
| | |
Total distributions paid | | $ | 530,917,993 | | | $ | 57,001,223 | |
| | | | | | | | |
As of September 30, 2022, the components of accumulated earnings/(deficit) on a tax basis were as follows:
| | | | | | | | | | | | | | | | | | | | |
| PORTFOLIO | | UNDISTRIBUTED
ORDINARY
INCOME | | | UNDISTRIBUTED
LONG-TERM
GAINS | | | ACCUMULATED
CAPITALAND
OTHER
LOSSES(a) | | | UNREALIZED
APPRECIATION/
(DEPRECIATION)(b) | | | TOTAL
ACCUMULATED
EARNINGS/
(DEFICIT) | |
Small Cap Core | | $ | 2,041,698 | | | $ | 50,932,940 | | | $ | 0 | | | $ | 48,739,141 | | | $ | 101,713,779 | |
| | | | | |
International Small Cap | | | 9,937,061 | | | | 0 | | | | (20,251,098 | ) | | | (190,289,864 | ) | | | (200,603,901 | ) |
| | | | | |
International Strategic Equities | | | 252,896,017 | | | | 0 | | | | (356,902,921 | ) | | | (1,090,693,269 | ) | | | (1,194,700,173 | ) |
| | (a) | During the fiscal year ended September 30, 2022 International Small Cap Portfolio, and International Strategic Equities Portfolio deferred $20,251,098, and $356,902,921, respectively, in post-October losses. These losses will be treated as arising on October 1, 2022. |
| | (b) | The differences between book-basis and tax-basis unrealized appreciation/(depreciation) are attributable primarily to the tax deferral of losses on wash sales, the tax treatment of passive foreign investment companies (PFICs), and the realization for tax purposes of gains/losses on certain derivative instruments. |
Under current tax rules, regulated investment companies can elect to treat certain late-year ordinary losses incurred and post-October capital losses (capital losses realized after October 31) as arising on the first day of the following taxable year.
For tax purposes, net capital losses may be carried over to offset future capital gains, if any. Portfolios are permitted to carry forward capital losses for an indefinite period, and such losses will retain their character as either short-term or long-term capital losses. As of September 30, 2022, the Portfolios did not have any capital loss carryforwards.
| NOTE 5. | Risks Involved in Investing in the Portfolios |
Foreign (Non-U.S.) Securities Risk—Investments in foreign securities entail significant risks in addition to those customarily associated with investing in U.S. securities, such as less liquid, less transparent, less regulated and more volatile markets. These risks include risks related to unfavorable or unsuccessful government actions, reduction of government or central bank support, inadequate accounting standards and auditing and financial recordkeeping requirements, lack of information, and adverse market, economic, political and regulatory factors and social instability, all of which could disrupt the financial markets in which the Portfolios invest and adversely affect the value of the Portfolios’ assets.
Country Concentration Risk—The Portfolios may not always be diversified among countries or regions and the effect on the share price of the Portfolios of specific risks such as political, regulatory and currency may be magnified due to concentration of the Portfolios’ investments in a particular country or region.
Sector Risk—The Portfolios may have more risk because of concentrated investments in a particular market sector, such as the financials, consumer discretionary, information technology or industrials sector. Market or economic factors affecting that sector could have a major effect on the value of the Portfolios’ investments.
Emerging-Markets Securities Risk—The risks of investing in foreign (non-U.S.) securities are heightened with respect to issuers in emerging-market countries because the markets are less developed and less liquid and there may be a greater amount of economic, political and social uncertainty, and these risks are even more pronounced in “frontier” markets, which are investable markets with lower total market capitalization and liquidity than the more developed emerging markets. Emerging markets typically have fewer medical and economic resources than more developed countries, and thus they may be less able to control or mitigate the effects of a pandemic. In addition, the value of the Portfolios’ investments may decline because of factors such as unfavorable or unsuccessful government actions and reduction of government or central bank support.
Foreign Currency Risk—This is the risk that changes in foreign (non-U.S.) currency exchange rates may negatively affect the value of the Portfolios’ investments or reduce the returns of the Portfolios. For example, the value of the Portfolios’ investments in foreign securities and foreign currency positions may decrease if the U.S. Dollar is strong (i.e., gaining value relative to other currencies) and other currencies are weak (i.e., losing value relative to the U.S. Dollar).
Actions by a Few Major Investors—In certain countries, volatility may be heightened by actions of a few major investors. For example, substantial increases or decreases in cash flows of mutual funds investing in these markets could significantly affect local stock prices and, therefore, share prices of the Portfolios.
Illiquid Investment Risk—Illiquid investments risk exists when particular investments are difficult or impossible to purchase or sell, possibly preventing the Portfolios from purchasing or selling these securities at an advantageous price. Illiquid securities may also be difficult to value. If the Portfolios are forced to sell an illiquid asset to meet redemption requests or other cash needs, or to try to limit losses, the Portfolios may be forced to sell at a substantial loss or may not be able to sell at all.
Redemption Risk—The Portfolios may experience heavy redemptions that could cause the Portfolios to liquidate their assets at inopportune times or unfavorable prices or increase or accelerate taxable gains or transaction costs and may negatively affect the Portfolios’ net asset value, or performance, which could cause the value of your investment to decline. Redemption risk is heightened during periods of overall market turmoil.
Market Risk—The Portfolios are subject to market risk, which is the risk that stock or bond prices in general or in particular countries or sectors may decline over short or extended periods. Stock or bond prices may decline in response to adverse changes in the economy or the economic outlook; deterioration in investor sentiment; interest rate, currency and commodity price fluctuations; adverse geopolitical, social or environmental developments; issuer- and sector-specific considerations; public health crises (including the occurrence of a contagious disease or illness); policy and legislative changes; cybersecurity events; and other factors.
Economies and financial markets throughout the world are becoming increasingly interconnected. Economic, financial or political events, trading and tariff arrangements, sanctions, regional and global conflicts, terrorism, natural disasters (including the spread of infectious illness) and other circumstances in one country or region could have profound impacts on global economies or markets. As a result, whether or not the Portfolios invest in securities of issuers located in or with significant exposure to countries experiencing economic and financial difficulties, the value and liquidity of the Portfolios’ investments may be negatively affected.
Capitalization Risk—Investments in small- mid-capitalization companies may be more volatile than investments in large-capitalization companies. Investments in small- mid-capitalization companies may have additional risks because these companies may have limited product lines, markets or financial resources. The prices of securities of mid-capitalization companies generally are more volatile than those of large capitalization companies and are more likely to be adversely affected than large capitalization companies by changes in earnings results and investor expectations or poor economic or market conditions, including those experienced during a recession. Securities of small- mid-capitalization companies may underperform large capitalization companies, may be harder to sell at times or at prices the portfolio managers believe appropriate and may have greater potential for losses.
Allocation Risk—The Portfolios may seek to focus on different investment disciplines or factors at different times as a means to achieve their investment objectives. In the event that the investment disciplines or factors to which the Portfolios have greater exposure perform worse than the investment disciplines or factors with less exposure, the Portfolios’ returns may be negatively affected.
Notes to Financial Statements (continued)
Derivatives Risk—The Portfolios may use derivatives in currency hedging as well as for direct investments to gain access to certain markets, earn income, enhance return and broaden portfolio diversification, which entail greater risk than if used solely for hedging purposes. In addition to other risks such as the credit risk of the counterparty, derivatives involve the risk that changes in the value of the derivative may not correlate with relevant assets, rates or indices. Derivatives may be difficult to price or unwind, and small changes may produce disproportionate losses for the Portfolios. Certain derivatives have the potential for unlimited loss, regardless of the size of the initial investment. Assets required to be set aside or posted to cover or secure derivatives positions may themselves go down in value, and these collateral and other requirements may limit investment flexibility. Some derivatives involve leverage, which can make the Portfolios more volatile and can compound other risks. Derivatives, especially over-the-counter derivatives, are also subject to counterparty risk, which is the risk that the counterparty (the party on the other side of the transaction) on a derivative transaction will be unable or unwilling to honor its contractual obligations to the Fund. The U.S. government and certain foreign governments have adopted regulations governing derivatives markets, including mandatory clearing of certain derivatives as well as additional regulations governing margin, reporting and registration requirements. The ultimate impact of the regulations remains unclear. Additional regulation may make derivatives more costly, limit their availability or utility, otherwise adversely affect their performance, or disrupt markets.
Management Risk—The Portfolios are subject to management risk because they are actively managed investment portfolios. The Adviser will apply its investment techniques and risk analyses in making investment decisions for the Portfolios, but these techniques, analyses and decisions may not work as intended or may not produce the desired results, and may, during certain periods, result in increased volatility for the Portfolios or cause the value of the Portfolios’ shares to go down. In some cases, derivatives and other investment techniques may be unavailable, or the Adviser may determine not to use them, possibly even under market conditions where their use could benefit the Portfolios. Some of these techniques may incorporate, or rely upon, quantitative models, but there is no guarantee that these models will generate accurate forecasts, reduce risk or otherwise perform as expected. In addition, the Adviser may change the Portfolios’ investment strategies or policies from time to time. Those changes may not lead to the results intended by the Adviser and could also have an adverse effect on the value or performance of the Portfolios.
REIT Risk—Investing in REITs involves certain unique risks in addition to those risks associated with investing in the real estate industry in general. Equity REITs may be affected by changes in the value of the underlying property owned by the REITs, while mortgage REITs may be affected by the quality of any credit extended. REITs are dependent upon management skills, are not diversified, and are subject to heavy cash flow dependency, default by borrowers and self-liquidation. Investing in REITs also involves risks similar to those associated with investing in small-capitalization companies. REITs may have limited financial resources, may trade less frequently and in a limited volume and may be subject to more abrupt or erratic price movements than larger company securities. REIT issuers may also fail to maintain their exemptions from investment company registration or fail to qualify for the “dividends paid deduction” under the Internal Revenue Code of 1986, as amended.
Investment in Other Investment Companies Risk—As with other investments, investments in other investment companies, including other registered funds advised by the Adviser and ETFs, are subject to market and management risk. In addition, if the Portfolios acquire shares of investment companies, shareholders bear both their proportionate share of expenses in the Portfolios (including management and advisory fees) and, indirectly, the expenses of the investment companies in which the Portfolios invest.
LIBOR Transition and Associated Risk—The Portfolios may be exposed to debt securities, derivatives or other financial instruments that utilize the London Interbank Offered Rate, or “LIBOR,” as a “benchmark” or “reference rate” for various interest rate calculations. In 2017, the United Kingdom Financial Conduct Authority (“FCA”), which regulates LIBOR, announced a desire to phase out the use of LIBOR by the end of 2021. The FCA and LIBOR’s administrator, ICE Benchmark Administration, have since announced that most LIBOR settings (which reflect LIBOR rates quoted in different currencies over various time periods) will no longer be published after the end of 2021 but that the most widely used U.S. Dollar LIBOR settings will continue to be published until June 30, 2023. However, banks were strongly encouraged to cease entering into agreements with counterparties referencing LIBOR by the end of 2021. It is possible that a subset of LIBOR settings will be published after these dates on a “synthetic” basis, but any such publications would be considered non-representative of the underlying market. Since 2018 the Federal Reserve Bank of New York has published the secured overnight funding rate (referred to as SOFR), which is intended to replace U.S. Dollar LIBOR.
SOFR is a broad measure of the cost of borrowing cash overnight collateralized by U.S. Treasury securities in the repurchase agreement (repo) market and has been used increasingly on a voluntary basis in new instruments and transactions. In addition, on March 15, 2022, the Adjustable Interest Rate Act was signed into law. This law provides a statutory fallback mechanism to replace LIBOR with a benchmark rate that is selected by the Federal Reserve Board and based on SOFR for certain contracts that reference LIBOR without adequate fallback provisions.
The elimination of LIBOR or changes to other reference rates or any other changes or reforms to the determination or supervision of reference rates could have an adverse impact on the market for, or value of, any securities or payments linked to those reference rates, which may adversely affect a Portfolios’ performance and/or net asset value. Uncertainty and risk also remain regarding the willingness and ability of issuers and lenders to include revised provisions in new and existing contracts or instruments. Consequently, the transition from LIBOR to other reference rates may lead to increased volatility and illiquidity in markets that are tied to LIBOR, fluctuations in values of LIBOR-related investments or investments in issuers that utilize LIBOR, increased difficulty in borrowing or refinancing and diminished effectiveness of hedging strategies, potentially adversely affecting a Portfolios’ performance. Furthermore, the risks associated with the expected discontinuation of LIBOR and transition may be exacerbated if the work necessary to effect an orderly transition to an alternative reference rate is not completed in a timely manner. Neither the effect of the LIBOR transition process nor its ultimate success can yet be known.
Cybersecurity Risk—As the use of the internet and other technologies has become more prevalent in the course of business, the Portfolios have become more susceptible to operational and financial risks associated with cybersecurity. Cybersecurity incidents can result from deliberate attacks such as gaining unauthorized access to digital systems (e.g., through “hacking” or malicious software coding) for purposes of misappropriating assets or sensitive information, corrupting data, or causing operational disruption, or from unintentional events, such as the inadvertent release of confidential information. Cybersecurity failures or breaches of the Portfolios or their service providers or the issuers of securities in which the Portfolios invest have the ability to cause disruptions and impact business operations, potentially resulting in financial losses, the inability of Portfolio shareholders to transact business, violations of applicable privacy and other laws, regulatory fines, penalties, reputational damage, reimbursement or other compensation costs, and/or additional compliance costs. While measures have been developed which are designed to reduce the risks associated with cybersecurity, there is no guarantee that those measures will be effective, particularly since the Portfolios do not control the cybersecurity defenses or plans of their service providers, financial intermediaries and companies in which they invest or with which they do business.
Cybersecurity incidents, both intentional and unintentional, may allow an unauthorized party to gain access to Portfolio or shareholder assets, Portfolio or customer data (including private shareholder information), or proprietary information, or cause a Portfolio, the Adviser, and/or the Portfolios’ service providers (including, but not limited to, fund accountants, custodians, sub-custodians, transfer agents and financial intermediaries) to suffer data breaches, data corruption or lose operational functionality, or prevent Portfolio investors from purchasing, redeeming or exchanging shares or receiving distributions. A Portfolio and the Adviser have limited ability to prevent or mitigate cybersecurity incidents affecting third-party service providers. Cybersecurity incidents may result in financial losses to such Portfolio and its shareholders, and substantial costs may be incurred in order to prevent any future cybersecurity incidents.
Indemnification Risk—In the ordinary course of business, the Portfolios enter into contracts that contain a variety of indemnifications. The Portfolios’ maximum exposure under these arrangements is unknown. However, the Portfolios have not had prior claims or losses pursuant to these indemnification provisions and expect the risk of loss thereunder to be remote. Therefore, the Portfolios have not accrued any liability in connection with these indemnification provisions.
| NOTE 6. | Capital-Share Transactions |
The Fund has authorized 27 billion shares of common stock, par value $0.0001 per share. Each SCB Class, Advisor Class and Class Z of the Portfolios is allocated 1 billion shares. The balance of the authorized shares has been allocated to share classes that are currently not offered.
Notes to Financial Statements (continued)
Share transactions for each Portfolio for the years ended September 30, 2022 and September 30, 2021, were as follows:
| | | | | | | | | | | | | | | | | | | | |
| |
| | | SMALL CAP CORE PORTFOLIO | |
| | | | | | | | | | | | | | | | | | | | |
| | | |
| | | SHARES | | | | | | AMOUNT | |
| | | | | | | | | | | | | | | | | | | | |
| | | YEAR
ENDED
9/30/22 | | | YEAR
ENDED
9/30/21 | | | | | | YEAR
ENDED
9/30/22 | | | YEAR
ENDED
9/30/21 | |
SCB Class Shares | |
| | | | | |
Shares sold | | | 13,143 | | | | 25,857 | | | | | | | $ | 193,157 | | | $ | 375,348 | |
| | | | | |
Shares issued to shareholders on reinvestment of dividends and distributions | | | 23,104 | | | | 1,828 | | | | | | | | 350,482 | | | | 23,193 | |
| | | | | |
Shares redeemed | | | (62,871 | ) | | | (124,509 | ) | | | | | | | (858,857 | ) | | | (1,740,086 | ) |
| | | | | | | | | | | | | | | | | | | | |
| | | | | |
Net decrease | | | (26,624 | ) | | | (96,824 | ) | | | | | | $ | (315,218 | ) | | $ | (1,341,545 | ) |
| | | | | | | | | | | | | | | | | | | | |
| | | | | | | | | | | | | | | | | | | | |
Advisor Class Shares | |
| | | | | |
Shares sold | | | 2,450,082 | | | | 2,500,524 | | | | | | | $ | 33,739,686 | | | $ | 35,807,023 | |
| | | | | |
Shares issued to shareholders on reinvestment of dividends and distributions | | | 1,859,599 | | | | 190,207 | | | | | | | | 28,321,701 | | | | 2,419,437 | |
| | | | | |
Shares redeemed | | | (6,348,125 | ) | | | (7,855,959 | ) | | | | | | | (85,599,146 | ) | | | (111,213,408 | ) |
| | | | | | | | | | | | | | | | | | | | |
| | | | | |
Net decrease | | | (2,038,444 | ) | | | (5,165,228 | ) | | | | | | $ | (23,537,759 | ) | | $ | (72,986,948 | ) |
| | | | | | | | | | | | | | | | | | | | |
| | | | | | | | | | | | | | | | | | | | |
Class Z Shares | |
| | | | | |
Shares sold | | | 0 | | | | 5,582 | | | | | | | $ | 0 | | | $ | 82,836 | |
| | | | | |
Shares issued to shareholders on reinvestment of dividends and distributions | | | 640,513 | | | | 57,660 | | | | | | | | 9,748,601 | | | | 732,856 | |
| | | | | |
Shares redeemed | | | (1,601,805 | ) | | | (476,897 | ) | | | | | | | (22,380,146 | ) | | | (6,438,248 | ) |
| | | | | | | | | | | | | | | | | | | | |
| | | | | |
Net decrease | | | (961,292 | ) | | | (413,655 | ) | | | | | | $ | (12,631,545 | ) | | $ | (5,622,556 | ) |
| | | | | | | | | | | | | | | | | | | | |
| | | | | | | | | | | | | | | | | | | | |
| |
| | | INTERNATIONAL SMALL CAP PORTFOLIO | |
| | | | | | | | | | | | | | | | | | | | |
| | | |
| | | SHARES | | | | | | AMOUNT | |
| | | | | | | | | | | | | | | | | | | | |
| | | YEAR
ENDED
9/30/22 | | | YEAR
ENDED
9/30/21 | | | | | | YEAR
ENDED
9/30/22 | | | YEAR
ENDED
9/30/21 | |
SCB Class Shares | |
| | | | | |
Shares sold | | | 248,402 | | | | 335,053 | | | | | | | $ | 2,850,191 | | | $ | 4,054,689 | |
| | | | | |
Shares issued to shareholders on reinvestment of dividends and distributions | | | 169,965 | | | | 46,902 | | | | | | | | 2,190,852 | | | | 537,030 | |
| | | | | |
Shares redeemed | | | (382,350 | ) | | | (1,079,447 | ) | | | | | | | (4,528,837 | ) | | | (13,363,582 | ) |
| | | | | | | | | | | | | | | | | | | | |
| | | | | |
Net increase (decrease) | | | 36,017 | | | | (697,492 | ) | | | | | | $ | 512,206 | | | $ | (8,771,863 | ) |
| | | | | | | | | | | | | | | | | | | | |
| |
| | | | | | | | | | | | | | | | | | | | |
| | | | | | | | | | | | | | | | | | | | |
| |
| | | INTERNATIONAL SMALL CAP PORTFOLIO | |
| | | | | | | | | | | | | | | | | | | | |
| | | |
| | | SHARES | | | | | | AMOUNT | |
| | | | | | | | | | | | | | | | | | | | |
| | | YEAR
ENDED
9/30/22 | | | YEAR
ENDED
9/30/21 | | | | | | YEAR
ENDED
9/30/22 | | | YEAR
ENDED
9/30/21 | |
Advisor Class Shares | |
| | | | | |
Shares sold | | | 8,249,348 | | | | 7,708,373 | | | | | | | $ | 96,638,908 | | | $ | 97,452,713 | |
| | | | | |
Shares issued to shareholders on reinvestment of dividends and distributions | | | 2,422,656 | | | | 666,220 | | | | | | | | 31,252,262 | | | | 7,634,878 | |
| | | | | |
Shares redeemed | | | (8,003,644 | ) | | | (9,480,523 | ) | | | | | | | (90,003,101 | ) | | | (117,842,861 | ) |
| | | | | | | | | | | | | | | | | | | | |
| | | | | |
Net increase (decrease) | | | 2,668,360 | | | | (1,105,930 | ) | | | | | | $ | 37,888,069 | | | $ | (12,755,270 | ) |
| | | | | | | | | | | | | | | | | | | | |
| | | | | | | | | | | | | | | | | | | | |
Class Z Shares | |
| | | | | |
Shares sold | | | 0 | | | | 9,435 | | | | | | | $ | 0 | | | $ | 127,652 | |
| | | | | |
Shares issued to shareholders on reinvestment of dividends and distributions | | | 1,461,979 | | | | 453,927 | | | | | | | | 18,859,533 | | | | 5,202,006 | |
| | | | | |
Shares redeemed | | | (5,237,233 | ) | | | (1,201,471 | ) | | | | | | | (62,573,036 | ) | | | (15,348,379 | ) |
| | | | | | | | | | | | | | | | | | | | |
| | | | | |
Net decrease | | | (3,775,254 | ) | | | (738,109 | ) | | | | | | $ | (43,713,503 | ) | | $ | (10,018,721 | ) |
| | | | | | | | | | | | | | | | | | | | |
| | | | | | | | | | | | | | | | | | | | |
| |
| | | INTERNATIONAL STRATEGIC EQUITIES PORTFOLIO | |
| | | | | | | | | | | | | | | | | | | | |
| | | |
| | | SHARES | | | | | | AMOUNT | |
| | | | | | | | | | | | | | | | | | | | |
| | | YEAR
ENDED
9/30/22 | | | YEAR
ENDED
9/30/21 | | | | | | YEAR
ENDED
9/30/22 | | | YEAR
ENDED
9/30/21 | |
SCB Class Shares | |
| | | | | |
Shares sold | | | 1,720,671 | | | | 3,148,892 | | | | | | | $ | 20,925,628 | | | $ | 40,718,452 | |
| | | | | |
Shares issued to shareholders on reinvestment of dividends and distributions | | | 1,624,656 | | | | 130,279 | | | | | | | | 21,412,972 | | | | 1,606,333 | |
| | | | | |
Shares redeemed | | | (3,153,455 | ) | | | (5,422,778 | ) | | | | | | | (38,941,876 | ) | | | (71,875,899 | ) |
| | | | | |
Shares issued in connection with the Reorganization | | | 0 | | | | 19,723,789 | | | | | | | | 0 | | | | 245,758,272 | |
| | | | | | | | | | | | | | | | | | | | |
| | | | | |
Net increase | | | 191,872 | | | | 17,580,182 | | | | | | | $ | 3,396,724 | | | $ | 216,207,158 | |
| | | | | | | | | | | | | | | | | | | | |
| | | | | | | | | | | | | | | | | | | | |
Advisor Class Shares | |
| | | | | |
Shares sold | | | 54,297,935 | | | | 58,225,325 | | | | | | | $ | 671,081,324 | | | $ | 776,134,774 | |
| | | | | |
Shares issued to shareholders on reinvestment of dividends and distributions | | | 26,045,963 | | | | 2,286,025 | | | | | | | | 343,806,709 | | | | 28,209,553 | |
| | | | | |
Shares redeemed | | | (48,417,009 | ) | | | (42,597,449 | ) | | | | | | | (581,680,341 | ) | | | (565,315,718 | ) |
| | | | | |
Shares issued in connection with the Reorganization | | | 0 | | | | 246,887,065 | | | | | | | | 0 | | | | 3,078,679,452 | |
| | | | | | | | | | | | | | | | | | | | |
| | | | | |
Net increase | | | 31,926,889 | | | | 264,800,966 | | | | | | | $ | 433,207,692 | | | $ | 3,317,708,061 | |
| | | | | | | | | | | | | | | | | | | | |
| | | | | | | | | | | | | | | | | | | | |
Notes to Financial Statements (continued)
| | | | | | | | | | | | | | | | | | | | |
| |
| | | INTERNATIONAL STRATEGIC EQUITIES PORTFOLIO | |
| | | | | | | | | | | | | | | | | | | | |
| | | |
| | | SHARES | | | | | | AMOUNT | |
| | | | | | | | | | | | | | | | | | | | |
| | | YEAR
ENDED
9/30/22 | | | YEAR
ENDED
9/30/21 | | | | | | YEAR
ENDED
9/30/22 | | | YEAR
ENDED
9/30/21 | |
Class Z Shares | |
| | | | | |
Shares sold | | | 1,807,260 | | | | 702,267 | | | | | | | $ | 20,361,000 | | | $ | 9,447,722 | |
| | | | | |
Shares issued to shareholders on reinvestment of dividends and distributions | | | 9,124,070 | | | | 1,551,141 | | | | | | | | 120,620,206 | | | | 19,172,105 | |
| | | | | |
Shares redeemed | | | (24,945,635 | ) | | | (31,573,155 | ) | | | | | | | (307,178,499 | ) | | | (416,912,398 | ) |
| | | | | |
Shares issued in connection with the Reorganization | | | 0 | | | | 65,673,579 | | | | | | | | 0 | | | | 820,264,571 | |
| | | | | | | | | | | | | | | | | | | | |
| | | | | |
Net increase (decrease) | | | (14,014,305 | ) | | | 36,353,832 | | | | | | | $ | (166,197,293 | ) | | $ | 431,972,000 | |
| | | | | | | | | | | | | | | | | | | | |
At September 30, 2022, certain AllianceBernstein mutual funds owned 12%, 22% and 14% of Small Cap Core Portfolio, International Small Cap Portfolio and International Strategic Equities Portfolio, respectively, in aggregate of the Portfolios’ outstanding shares. Significant transactions by such shareholders, if any, may impact the Portfolios’ performance.
| NOTE 7. | Merger and Reorganization |
At the Board meeting held on July 23, 2020, the Board of the Fund approved the acquisition of the assets and assumption of the liabilities of the Acquired Portfolios by the Acquiring Portfolio. The Portfolios have the same investment objective and similar investment strategies. The Reorganization was completed at the close of business December 4, 2020. Pursuant to the Reorganization, the assets and liabilities of the Acquired Portfolios shares were transferred in exchange for the shares of the Acquiring Portfolio, in a tax-free exchange as follows:
| | | | | | | | | | | | | | | | |
| PORTFOLIO | | SHARES
OUTSTANDING
BEFORETHE
REORGANIZATION | | | SHARES
OUTSTANDING
IMMEDIATELY
AFTERTHE
REORGANIZATION | | | AGGREGATENET
ASSETSBEFORE
THE
REORGANIZATION | | | AGGREGATENET
ASSETS
IMMEDIATELY
AFTERTHE
REORGANIZATION | |
Tax-Managed International | | | 160,996,330 | | | | -0- | | | $ | 2,926,434,366 | + | | $ | -0- | |
International | | | 69,612,429 | | | | -0- | | | | 1,218,267,929 | ++ | | | -0- | |
| | | | |
International Strategic Equities | | | 350,542,748 | | | | 682,827,181 | | | | 4,373,059,514 | | | | 8,517,761,809 | |
| | + | Includes unrealized appreciation of $445,212,768. |
| | ++ | Includes unrealized appreciation of $189,027,013. |
Assuming the acquisition of the Acquired Portfolios had been completed on October 1, 2020, the Acquiring Portfolio’s pro forma results of operations for the year ended September 30, 2021, are as follows:
| | | | |
Net investment income | | $ | 193,213,455 | |
| |
Net realized and unrealized gain on investments | | | 1,303,247,177 | |
| | | | |
| |
Net increase in net assets resulting from operations | | $ | 1,496,460,632 | |
| | | | |
Because the combined investment portfolios have been managed as a single integrated portfolio since the acquisition was completed, it is not practicable to separate the amounts of revenue and earnings of the Acquired Portfolios that have been included in the Acquiring Portfolio’s statement of operations since December 4, 2020.
For financial reporting purposes, assets received and shares issued by the Acquiring Portfolio were recorded at fair value; however, the cost basis of the investments received from the Acquired Portfolios were carried forward to align ongoing reporting of the Acquiring Portfolio’s realized and unrealized gains and losses with amounts distributable to shareholders for tax purposes.
| NOTE 8. | Recent Accounting Pronouncements |
In March 2020, the Financial Accounting Standards Board issued an Accounting Standards Update, ASU 2020-04, “Reference Rate Reform (Topic 848) – Facilitation of the Effects of Reference Rate Reform on Financial Reporting.” ASU 2020-04 provides optional guidance to ease the potential accounting burden due to the discontinuation of the LIBOR and other interbank-offered based reference rates. ASU 2020-04 is effective as of March 12, 2020 through December 31, 2022. Management is currently evaluating the impact, if any, of applying ASU 2020-04.
Management has evaluated subsequent events for possible recognition or disclosure in the financial statements through the date the financial statements are issued. Management has determined that there are no material events that would require disclosure in the Portfolios’ financial statements through this date.
Report of Independent Registered Public Accounting Firm
To the Board of Directors of Bernstein Fund, Inc. and Shareholders of Small Cap Core Portfolio, International Small Cap Portfolio and International Strategic Equities Portfolio
Opinions on the Financial Statements
We have audited the accompanying statements of assets and liabilities, including the schedules of investments, of Small Cap Core Portfolio, International Small Cap Portfolio and International Strategic Equities Portfolio (constituting Bernstein Fund, Inc., hereafter collectively referred to as the “Portfolios”) as of September 30, 2022, the related statements of operations for the year ended September 30, 2022, the statements of changes in net assets for each of the two years in the period ended September 30, 2022, including the related notes, and the financial highlights for each of the five years in the period ended September 30, 2022 (collectively referred to as the “financial statements”). In our opinion, the financial statements present fairly, in all material respects, the financial position of each of the Portfolios as of September 30, 2022, the results of each of their operations for the year then ended, the changes in each of their net assets for each of the two years in the period ended September 30, 2022 and each of the financial highlights for each of the five years in the period ended September 30, 2022 in conformity with accounting principles generally accepted in the United States of America.
Basis for Opinions
These financial statements are the responsibility of the Portfolios’ management. Our responsibility is to express an opinion on the Portfolios’ financial statements based on our audits. We are a public accounting firm registered with the Public Company Accounting Oversight Board (United States) (PCAOB) and are required to be independent with respect to the Portfolios in accordance with the U.S. federal securities laws and the applicable rules and regulations of the Securities and Exchange Commission and the PCAOB.
We conducted our audits of these financial statements in accordance with the standards of the PCAOB. Those standards require that we plan and perform the audit to obtain reasonable assurance about whether the financial statements are free of material misstatement, whether due to error or fraud.
Our audits included performing procedures to assess the risks of material misstatement of the financial statements, whether due to error or fraud, and performing procedures that respond to those risks. Such procedures included examining, on a test basis, evidence regarding the amounts and disclosures in the financial statements. Our audits also included evaluating the accounting principles used and significant estimates made by management, as well as evaluating the overall presentation of the financial statements. Our procedures included confirmation of securities owned as of September 30, 2022 by correspondence with the custodian, transfer agent and brokers; when replies were not received from brokers, we performed other auditing procedures. We believe that our audits provide a reasonable basis for our opinions.
/s/ PricewaterhouseCoopers LLP
New York, New York
November 23, 2022
We have served as the auditor of one or more of the investment companies in the AB Group of Mutual Funds since at least 1985. We have not been able to determine the specific year we began serving as auditor.
2022 Federal Tax Information (Unaudited)
For Federal income tax purposes, the following information is furnished with respect to the distributions paid by each applicable Portfolio during the taxable year ended September 30, 2022. For corporate shareholders, the following percentages of dividends paid by each Portfolio qualify for the dividends received deduction.
| | | | | | | | |
| PORTFOLIO | | DIVIDENDS RECEIVED DEDUCTION %
(CORPORATE SHAREHOLDERS) | | | | |
| | |
Small Cap Core | | | 100 | % | | | | |
For the taxable year ended September 30, 2022, each Portfolio designates the following amounts as the maximum amount that may be considered qualified dividend income for individual shareholders.
| | | | | | | | |
| PORTFOLIO | | QUALIFIED DIVIDEND INCOME | | | | |
Small Cap Core | | $ | 1,958,698 | | | | | |
| | |
International Small Cap | | | 31,949,852 | | | | | |
| | |
International Strategic Equities | | | 246,405,298 | | | | | |
Certain Portfolios intend to make an election to pass through foreign taxes paid by the Portfolios to their shareholders. For the taxable year ended September 30, 2022, the maximum amounts of foreign taxes that may be passed through and the foreign source income for information reporting purposes is as follows:
| | | | | | | | |
| PORTFOLIO | | FOREIGN TAXES TO PASS THROUGH | | | FOREIGN SOURCE
INCOME | |
International Small Cap | | $ | 6,592,559 | | | $ | 47,897,166 | |
| | |
International Strategic Equities | | | 10,726,552 | | | | 302,296,922 | |
For the taxable year ended September 30, 2022, the long-term capital gain distribution is as follows:
| | | | | | | | |
| PORTFOLIO | | LONG-TERM CAPITAL
GAIN DISTRIBUTIONS | | | | |
Small Cap Core | | $ | 50,364,472 | | | | | |
| | |
International Small Cap | | | 26,557,551 | | | | | |
| | |
International Strategic Equities | | | 287,268,751 | | | | | |
Shareholders should not use the above information to prepare their income tax returns. The information necessary to complete your income tax returns will be included with your Form 1099-DIV which will be sent to you separately in January 2023.
Bernstein Fund, Inc.
BOARDOF DIRECTORS
Debra Perry(1)(3)
Chair
Beata D. Kirr
President
R. Jay Gerken(1)(3)
Director
Jeffrey R. Holland(1)
Director
William Kristol(1)
Director
Michelle McCloskey(1)
Director
Donald K. Peterson(1)
Director
OFFICERS
Andrew Birse(2),
Vice President
Peter Chocian(2),
Vice President
Serdar Kalaycioglu(2),
Vice President
Samantha S. Lau(2),
Vice President
Stuart Rae(2),
Vice President
Erik A. Turenchalk(2),
Vice President
Nelson Yu(2),
Vice President
Emilie D. Wrapp,
Secretary
Michael B. Reyes,
Senior Vice President
Joseph J. Mantineo,
Treasurer and Chief Financial Officer
Phyllis J. Clarke,
Controller
Vincent S. Noto,
Chief Compliance Officer
CUSTODIANAND ACCOUNTING AGENT
State Street Bank and Trust Company
State Street Corporation CCB/5
1 Iron Street
Boston, MA 02210
DISTRIBUTORS(4)
Sanford C. Bernstein & Co., LLC
1345 Avenue of the Americas
New York, NY 10105
AllianceBernstein Investments, Inc.
501 Commerce Street
Nashville, TN 37203
TRANSFER AGENT
AllianceBernstein Investor Services, Inc.
P.O. Box 786003
San Antonio, TX 78278
Toll-Free (800) 221-5672
INDEPENDENT REGISTEREDPUBLIC ACCOUNTING FIRM
PricewaterhouseCoopers LLP
300 Madison Avenue
New York, NY 10017
LEGAL COUNSEL
Willkie Farr & Gallagher LLP
787 Seventh Avenue
New York, NY 10019
| (1) | | Member of the Audit Committee, the Governance, Nominating and Compensation Committee, and the Independent Directors Committee. |
| (2) | | The day-to-day management of, and investment decisions for, the Portfolios are made by the senior management teams. Mr. Rae is the investment professional with the most significant responsibility for the day-to-day management of the International Strategic Equities Portfolio. Messrs. Birse, Chocian and Yu are the investment professionals with the most significant responsibility for the day-to-day management of the International Small Cap Portfolio. Ms. Lau and Messrs. Kalaycioglu and Turenchalk are the investment professionals with the most significant responsibility for the day-to-day management of the Small Cap Core Portfolio. |
| (3) | | Member of the Pricing Committee. |
| (4) | | Sanford C. Bernstein & Co., LLC acts as distributor of SCB Class shares of each Portfolio. AllianceBernstein Investments, Inc. acts as the principal underwriter and distributor of the Portfolios’ Advisor Class and Class Z shares. Advisor Class shares and Class Z shares are not subject to the Rule 12b-1 asset-based sales charges. |
| | | | | | | | |
| | |
DIRECTORS’ INFORMATION | | | |
Name, Address+, Age,
(Year of Election*) | | Principal Occupation(s)
During Past Five (5) Years and Other
Information | | Portfolios in
Fund Complex
Overseen
By Director | | | Other Directorships
Currently Held by Director |
INTERESTED DIRECTOR | | | | | | |
Beata D. Kirr,** c/o AllianceBernstein L.P. 1345 Avenue of the Americas New York, NY 10105 48 (2019) | | Senior Vice President of the Investment Manager with which she has been associated since prior to 2017. She is the Co-Head of Investment Strategies since April 2020 and a National Managing Director since 2017. She was previously the Head of Private Client Core Asset Strategies. She joined the firm in 2007 as a Senior Portfolio Manager. Prior to joining AB, she was a director at Harris Alternatives, a global fund of hedge funds, and was with Goldman Sachs, where she advised clients in the Equities, M&A and Equity Capital Markets divisions, from their New York, London and Chicago offices. | | | 17 | | | Women Employed |
DISINTERESTED DIRECTORS | | | | | | |
Debra Perry,#^ Chair of the Board 71 (2011) | | Formerly, Senior Managing Director of Global Ratings and Research, Moody’s Investors Service, Inc. from 2001 to 2004; Chief Administrative Officer, Moody’s, from 1999 to 2001; Chief Credit Officer, Moody’s, from 2000 to 2001; Group Managing Director for the Finance, Securities and Insurance Ratings Groups, Moody’s Corp., from 1996 to 1999; earlier she held executive positions with First Boston Corporation and Chemical Bank. | | | 17 | | | Assurant, Inc., since 2017; Korn/Ferry International, since 2008; Genworth Financial, Inc., from 2016-2022; PartnerRe, from 2013-2016; Bank of America Funds Series Trust, from 2011-2016 |
| | | |
R. Jay Gerken,#^ 71 (2013) | | Formerly, President and Chief Executive Officer of Legg Mason Partners Fund Advisor, LLC, and President & Board Member of The Legg Mason and Western Asset mutual funds from 2005 until June 2013. Previously, he was the President and Chair of the boards of the Citigroup Asset Management mutual funds from 2002 to 2005; Portfolio Manager and Managing Director, Smith Barney Asset Management from 1993 to 2001 and President & CEO, Directions Management of Shearson Lehman, Inc. from 1988 to 1993. | | | 17 | | | Cedar Lawn Corporation; New Jersey Chapter of The Nature Conservancy; and Associated Banc-Corp |
Bernstein Fund, Inc. (continued)
| | | | | | | | |
| | |
DIRECTORS’ INFORMATION (continued) | | | |
Name, Address+, Age,
(Year of Election*) | | Principal Occupation(s)
During Past Five (5) Years and Other
Information | | Portfolios in
Fund Complex
Overseen
By Director | | | Other Directorships
Currently Held by Director |
Jeffrey R. Holland,# 56 (2019) | | Formerly, Limited Partner of Brown Brothers Harriman from 2014 to 2018. Prior thereto, General Partner of Brown Brothers Harriman from 2006 to 2013. | | | 17 | | | Director of various non-profit organizations |
| | | |
William Kristol,# 69 (1994) | | Founder and Editor, The Weekly Standard from 1995 to 2018. He is a regular contributor on leading political commentary shows. He has served as the inaugural Vann Professor of Ethics and Society at Davidson College since 2019. | | | 17 | | | Manhattan Institute; John M. Ashbrook Center for Public Affairs at Ashland University; The Salvatori Center at Claremont McKenna College; The Institute for the Study of War; Foundation for Constitutional Government; and Defending Democracy Together, a non-profit educational corporation |
| | | |
Michelle McCloskey,# 60 (2019) | | Formerly, President of Americas, Man Group from 2017 to August 2019 and President of Man FRM from 2015 to August 2019. Prior thereto, she was a Senior Managing Director of Man FRM from 2012 to 2015. While at the Man Group, she served on the Executive Committee of Man Group plc from 2012 to 2019, as Chief Executive Officer, Board of Managers of Man Alternative Multi Strategy Fund from 2016 to 2019 and as President and Chair of the Board of the Pine Grove Institutional Funds from 2016 to 2019. She currently serves on the Investment Advisory Committee of Texas Tech University Endowment. | | | 17 | | | Assured Guaranty Ltd. since May 2021 |
| | | | | | | | |
| | |
DIRECTORS’ INFORMATION (continued) | | | |
Name, Address+, Age,
(Year of Election*) | | Principal Occupation(s)
During Past Five (5) Years and Other
Information | | Portfolios in
Fund Complex
Overseen
By Director | | | Other Directorships
Currently Held by Director |
Donald K. Peterson,# 73 (2007) | | Formerly, Chairman and Chief Executive Officer, Avaya Inc. (telecommunications equipment and services) from 2002 to 2006; President and Chief Executive Officer, Avaya Inc. from 2000 to 2001; President, Enterprise Systems Group in 2000; Chief Financial Officer, Lucent Technologies (telecommunications equipment and services) from 1996 to 2000; Chief Financial Officer, AT&T, Communications Services Group from 1995 to 1996; President, Nortel Communications Systems, Inc. (telecommunications and networking equipment) from 1994 to 1995. Prior thereto, he was at Nortel from 1976 to 1995. | | | 17 | | | Worcester Polytechnic Institute, (Emeritus); Member of the Board of TIAA-Bank, FSB |
+ The address for each of the Fund’s Disinterested Directors is c/o AllianceBernstein L.P., Attention: Legal and Compliance Department—Mutual Fund Legal, 1345 Avenue of the Americas, New York, NY 10105.
* There is no stated term of office for the Directors.
** Ms. Kirr is an “interested person” as defined by the Investment Company Act of 1940, because of her affiliation with AllianceBernstein.
# Member of the Audit Committee, the Governance, Nominating, and Compensation Committee, and the Independent Directors Committee.
^ Member of the Pricing Committee.
Bernstein Fund, Inc. (continued)
| | | | |
| |
MANAGEMENTOFTHE FUND |
| Name, Address,* and Age | | Principal Position(s)
Held with Fund | | Principal Occupation
During Past Five (5) Years |
Beata D. Kirr, 48 | | President | | See biography above. |
| | |
Andrew Birse, 44 | | Vice President | | Senior Vice President of the Adviser**, with which he has been associated since prior to 2017. He is also Chief Investment Officer - International Small Cap Equities since 2021. |
| | |
Peter Chocian, 50 | | Vice President | | Senior Vice President of the Adviser**, with which he has been associated since prior to 2017. |
| | |
Serdar Kalaycioglu, 45 | | Vice President | | Senior Vice President and Director of Quantitative Research of the Adviser**, with which he has been associated since prior to 2017. |
| | |
Samantha S. Lau, 50 | | Vice President | | Senior Vice President of the Adviser**, with which she has been associated since prior to 2017. She is also Co-Chief Investment Officer of Small and SMID Cap Growth Equities. |
| | |
Stuart Rae, 57 | | Vice President | | Senior Vice President of the Adviser**, with which he has been associated since prior to 2017. He is also Chief Investment Officer of the Asia-Pacific Value Equities. |
| | |
Erik A. Turenchalk, 49 | | Vice President | | Senior Vice President of the Adviser**, with which he has been associated since prior to 2017. |
| | |
Nelson Yu, 51 | | Vice President | | Senior Vice President of the Adviser**, with which he has been associated since prior to 2017. Chief Investment Officer - Investment Sciences and Insights since 2021. |
| | |
Emilie D. Wrapp, 66 | | Secretary | | Senior Vice President, Assistant General Counsel and Assistant Secretary of AllianceBernstein Investments, Inc. (“ABI”)**, with which she has been associated since prior to 2017. |
| | |
Michael B. Reyes, 46 | | Senior Vice President | | Vice President of the Adviser**, with which he has been associated since prior to 2017. |
| | | | |
| |
MANAGEMENTOFTHE FUND (continued) |
| Name, Address,* and Age | | Principal Position(s)
Held with Fund | | Principal Occupation
During Past Five (5) Years |
Joseph J. Mantineo, 63 | | Treasurer and Chief Financial Officer | | Senior Vice President of AllianceBernstein Investor Services (“ABIS”)**, with which he has been associated since prior to 2017. |
| | |
Phyllis J. Clarke, 61 | | Controller | | Vice President of ABIS**, with which she has been associated since prior to 2017. |
| | |
Vincent S. Noto, 57 | | Chief Compliance Officer | | Senior Vice President and Mutual Fund Chief Compliance Officer of the Adviser**, since prior to 2017. |
* The address for each of the Fund’s Officers is 1345 Avenue of the Americas, New York, NY 10105.
** The Manager, ABI and ABIS are affiliates of the Fund.
The Fund’s Statement of Additional Information (“SAI”) has additional information about the Fund’s Directors and Officers and is available without charge upon request. Contact your financial representative or AB at (212) 486-5800, or visit www.bernstein.com, for a free prospectus or SAI.
Operation and Effectiveness of the Portfolios’ Liquidity Risk Management Program:
In October 2016, the Securities and Exchange Commission (“SEC”) adopted the open-end fund liquidity rule (the “Liquidity Rule”). In June 2018 the SEC adopted a requirement that funds disclose information about the operation and effectiveness of their Liquidity Risk Management Program (“LRMP”) in their reports to shareholders.
One of the requirements of the Liquidity Rule is for the Portfolios to designate an Administrator of the Portfolios’ Liquidity Risk Management Program. The Administrator of the Portfolios’ LRMP is AllianceBernstein L.P., the Portfolios’ investment adviser (the “Adviser”). The Adviser has delegated the responsibility to its Liquidity Risk Management Committee (the “Committee”).
Another requirement of the Liquidity Rule is for the Portfolios’ Board of Directors (the “Fund Board”) to receive an annual written report from the Administrator of the LRMP, which addresses the operation of the Portfolios’ LRMP and assesses its adequacy and effectiveness. The Adviser provided the Fund Board with such annual report during the first quarter of 2022, which covered the period January 1, 2021 through December 31, 2021 (the “Program Reporting Period”).
The LRMP’s principal objectives include supporting the Portfolios’ compliance with limits on investments in illiquid assets and mitigating the risk that the Portfolios will be unable to meet their redemption obligations in a timely manner.
Pursuant to the LRMP, the Portfolios classify the liquidity of their portfolio investments into one of the four categories defined by the SEC: Highly Liquid, Moderately Liquid, Less Liquid, and Illiquid. These classifications are reported to the SEC on Form N-PORT.
During the Program Reporting Period, the Committee reviewed whether the Portfolios’ strategy is appropriate for an open-end structure, incorporating any holdings of less liquid and illiquid assets. If the Portfolios participated in derivative transactions, the exposure from such transactions were considered in the LRMP.
The Committee also performed an analysis to determine whether the Portfolios are required to maintain a Highly Liquid Investment Minimum (“HLIM”). The Committee also incorporated the following information when determining the Portfolios’ reasonably anticipated trading size for purposes of liquidity monitoring: historical net redemption activity, a Portfolio’s concentration in an issuer, shareholder concentration, investment performance, total net assets, and distribution channels.
The Adviser informed the Fund Board that the Committee believes the Portfolios’ LRMP is adequately designed, has been implemented as intended, and has operated effectively since its inception. No material exceptions have been noted since the implementation of the LRMP. During the Program Reporting Period, liquidity in all markets was significantly recovered and improved compared to the prior reporting period which included extreme levels of price volatility and relative illiquidity beginning in March 2020 with COVID-19 impacts. As such, the program operated in a relatively robust and benign liquidity environment experienced in markets during the Program Reporting Period. There were no liquidity events that impacted the Portfolios or their ability to timely meet redemptions during the Program Reporting Period.
Board Consideration of Investment Management Arrangement
Bernstein Fund, Inc. (the “Fund”) is subject to Section 15 of the Investment Company Act of 1940, as amended. Section 15 provides that any investment advisory agreement with a registered investment company such as the Fund may continue in effect for a period of more than two years from the date of its execution, only so long as such continuance is specifically approved at least annually by the board of directors (or by vote of a majority of the outstanding voting securities of the investment company). Pursuant to this requirement, the Fund’s Board of Directors, including the Directors who are not interested persons of the Fund (the “Independent Directors”), unanimously approved the continuation of the Investment Management Agreement between the Fund, on behalf of the International Strategic Equities Portfolio, International Small Cap Portfolio, and Small Cap Core Portfolio (each, a “Portfolio” and collectively, the “Portfolios”) of the Fund, and AllianceBernstein L.P. (the “Adviser”)(the “Investment Management Agreement”) at a meeting held on October 26-27, 2022.
The following discussion describes the considerations in connection with the Board’s review of the Investment Management Agreement.
In connection with the annual review of the continuation of the Investment Management Agreement between the Fund and the Adviser, counsel to the Independent Directors sent a letter to the Adviser dated August 10, 2022, that contained a list of information requested by the Independent Directors to conduct their annual review. The Board of Directors, including the Independent Directors, met by video conference and received and evaluated extensive materials relating to the continuation of the Investment Management Agreement from the Adviser. In addition, the Board received materials from the Senior Vice President of the Fund and an independent fee consultant as described below. On September 29, 2022, the Board of Directors held a video conference meeting to discuss its review of the Investment Management Agreement and the materials the Directors had been provided. At that meeting, the Independent Directors met separately with their independent counsel and the Senior Vice President and the independent fee consultant in executive sessions. Following the September 29, 2022 meeting, the Independent Directors, through counsel, requested certain additional information by means of an email from their independent counsel dated October 6, 2022, and the Adviser provided certain additional information by means of a memorandum dated October 19, 2022. On October 26-27, 2022, the Board of Directors held a meeting to continue their review of the Investment Management Agreement. During this meeting, the Adviser provided further information requested by the Independent Directors relating to contract renewal, and the Independent Directors also met separately with counsel to the Independent Directors as well as the Senior Vice President to review the contract renewal materials provided by the Adviser and the materials prepared by the Senior Vice President. At the conclusion of this meeting, the Board approved the continuation of the Investment Management Agreement for an additional annual term as described below.
In approving the Investment Management Agreement, the Board, including the Independent Directors, considered all information it deemed reasonably necessary to evaluate the terms of the Investment Management Agreement and considered whether the Agreement would be in the best interests of the Fund. In particular, the Board considered the information that was provided to them by the Adviser in response to their requests, as well as information prepared by the Senior Vice President and the independent fee consultant at the request of the Board. The Fund’s Senior Vice President assists the Board (as well as the boards of other funds sponsored by the Adviser) in evaluating investment management agreements and certain other plans and agreements pursuant to which the Adviser or its affiliates provide services to the Funds. The Board also considered other information provided to the Board in connection with the September 29, 2022 and October 26-27, 2022 meetings and throughout the past year.
The information considered by the Board included information with respect to the nature, extent and quality of services provided, investment performance, fees and expenses, profitability, economies of scale, and fall-out benefits and other revenue.
In the Board’s consideration of the factors discussed below, no single factor was considered in isolation or to be determinative to the decision of the Board to approve the Investment Management Agreement. Rather, the Board concluded, in light of a weighing and balancing of all factors considered and in the exercise of the Directors’ business judgment, that it was in the best interests of the Fund to approve the Investment Management Agreement including the fees to be charged for services thereunder, as summarized below.
Board Consideration of Investment Management Arrangement (continued)
Fees and Expenses
The Board, including the Independent Directors, compared the fees and expense ratios of each Portfolio (before and after any fee waivers and expense reimbursements) against fees and expense ratios of a peer group of funds with similar investment objectives (“peer group”). Both the peer group and the funds within the peer group, with respect to the fee and expense data, were available from Strategic Insight, an independent provider of investment company data. The Senior Vice President also performed analyses of the advisory fees, and compared such analyses to the Portfolios’ peer groups. In addition, the Board received and considered information from an independent fee consultant regarding the fees and expenses of the Portfolios as well as their investment performance.
The Board also received and considered information about the services rendered, and the fee rates charged, to other clients advised by the Adviser, including information about any recent advisory fee changes with respect to other investment companies advised by the Adviser. The Board noted the differences between the services provided to the Portfolios in comparison to those provided to other types of clients, including institutional clients and other investment companies for which the Adviser acted as investment adviser or subadviser, and the differences in the entrepreneurial and other risks borne by the Adviser in serving the Portfolios compared to other types of clients. In particular, with respect to the International Strategic Equities Portfolio, the Board noted that the Portfolio’s strategy included a greater allocation to emerging markets securities, versus certain other international portfolios managed by the Adviser that did not have a similar allocation to emerging markets securities.
On the basis of its review and consideration of the fees as described above and the Board’s consideration of the other factors described below, and in light of the Adviser’s agreement to continue fee waivers and/or expense caps applicable to the International Small Cap and Small Cap Core Portfolios, the Board concluded that the contractual advisory fees as proposed were reasonable.
Nature, Extent and Quality of Services Provided
The Board, including the Independent Directors, considered the nature, quality and extent of services performed by the Adviser and its affiliates gained from their experience as Directors of the Fund, their overall confidence in the Adviser’s integrity and competence they have gained from that experience, and the Adviser’s initiative in identifying and raising potential issues with the Directors. The Board also considered the Adviser’s responsiveness, frankness and attention to concerns raised by the Directors from time to time, including the Adviser’s willingness to consider and implement organizational and other changes designed to improve investment results and the services provided to the Portfolios. The Board also considered the scope and quality of the Adviser’s investment management capabilities, other resources dedicated to performing its services, the quality of its compliance, administrative and other services provided to the Portfolios and the background and experience of the Adviser’s senior management. The Board reviewed the qualifications, backgrounds and responsibilities of the investment staff primarily responsible for day-to-day portfolio management services for each Portfolio and noted the Adviser’s commitment to strong research and investment management capabilities throughout changing market environments. The Board reviewed the compliance and administrative services of the Adviser that support the investment advisory services provided to the Portfolios.
In considering the nature and quality of the services provided by the Adviser, the Board, including the Independent Directors, received and considered information about each Portfolio’s investment performance, as well as the performance of its peer group and the performance of an appropriate benchmark index. The Board was provided with performance data versus each Portfolio’s peer group, for the 1-year, 3-year and 5-year periods ended July 31, 2022 and versus each Portfolio’s benchmark index for the 1-year, 3-year, 5-year and since inception for the relevant periods, as well as the most recently available Morningstar rating for the Portfolios. The Board also received certain updated performance information as of September 30, 2022. In addition, the Directors considered information showing performance compared to peer groups and benchmarks for rolling calendar year periods and the year to date. The Directors also receive detailed comparative performance information for the Portfolios at each regular Board meeting during the year. The Board recognized that the benchmark indices do not account for fees and expenses incurred by a fund, including the Portfolios. The Directors also considered how peer groups have changed over time and how comparisons may differ depending upon the selection of the peer groups or benchmark indices.
Where the Portfolios had underperformed their peer groups or benchmark indices, the Directors considered the Adviser’s explanations for performance and, as applicable, measures the Adviser had taken or proposed to take to improve
Board Consideration of Investment Management Arrangement (continued)
performance. The Directors noted generally the Adviser’s continued efforts to enhance the services provided to the Portfolios, including enhancements to portfolio management models. The Directors also noted that they would continue to monitor investment performance closely.
The Board concluded that the Adviser had the experience and resources necessary to provide services of appropriate nature, quality and scope with respect to the Portfolios.
Profitability
The Board, including the Independent Directors, considered the level of the Adviser’s profits in respect of its management of the respective Portfolios. The materials provided to the Independent Directors included information indicating the profitability of the Portfolios to the Adviser for calendar years 2020 and 2021, which had been reviewed by an independent consultant. The Directors reviewed the assumptions and methods of allocation used by the Adviser in preparing fund-specific profitability data, noting that the methodology was consistent with the Adviser’s internal financial reporting. The Directors acknowledged that there are many potentially acceptable allocation methodologies for cost allocation, and that in certain cases the selected allocation methodology may not capture all costs borne by the Adviser with respect to a Portfolio. The Directors noted that they received information regarding all revenues and expenses of the Adviser’s relationship with the Fund, including those relating to the Adviser’s subsidiaries that provide transfer agency and distribution services to the Fund, and that they had focused on profitability before taxes and distribution expenses. The Directors reviewed comparative information regarding profitability for other publicly-traded advisers, recognizing that it is difficult to make comparisons of profitability among different investment advisers because only limited comparative information is publicly available and the comparisons are affected by numerous factors including different business mixes.
After reviewing all relevant factors, the Directors, including the Independent Directors, concluded that the levels of the Adviser’s profits in respect of its management of the Portfolios were not excessive.
Economies of Scale
The Board, including the Independent Directors, considered whether there have been economies of scale in respect of the management of the Portfolios, whether the Portfolios have appropriately benefited from any economies of scale, and whether there is potential for realization of any further economies of scale. In this regard, the Board considered that two other portfolios previously managed by the Adviser had been merged into the International Strategic Equities Portfolio in 2021, thereby increasing the Portfolio’s assets under management. As a result, there was a decrease in the effective fee rate of the International Strategic Equities Portfolio as a result of the increased assets. The Directors discussed other possible ways in which any such economies of scale may be shared with the Portfolios, including by investment in enhanced services.
The Directors also considered the Senior Vice President materials which they received in connection with the review of the Investment Management Agreement, which included information reflecting changes in asset levels of the Portfolios and in the profitability of the Adviser over various periods.
After reviewing the profitability and economies of scale information provided by the Adviser, the Board concluded that the benefits of any economies of scale were appropriately being shared with Portfolio investors by way of, among other things and as applicable, establishing advisory fees at levels that contemplated future achievement of scale, recent effective fee rate reductions for the International Strategic Equities Portfolio, breakpoint arrangements as currently in effect for the International Strategic Equities Portfolio, the fact that the International Small Cap and Small Cap Core Portfolios are research-intensive and may be capacity-constrained, expense caps and waivers applying to the International Small Cap and Small Cap Core Portfolios, and the Adviser’s continued reinvestment in the business, including by researching and implementing new product enhancements. The Directors also noted that they would continue to monitor the growth of the Portfolios.
Fall-Out Benefits and Other Revenue
The Board, including the Independent Directors, also took into account so-called “fall-out benefits” to the Adviser, such as soft dollar arrangements (whereby the Adviser receives the benefit of research services from many of the brokers and
Board Consideration of Investment Management Arrangement (continued)
dealers that execute purchases and sales of securities on behalf of its clients on an agency basis). The Directors recognized that the Adviser’s profitability would be lower without these benefits. They also considered other benefits potentially derived from an increase in the Adviser’s business as a result of its relationship with the Fund. The Directors concluded that these fall-out benefits to the Adviser were acceptable.
Advisory Fee Rate Schedule
On the basis of the information considered, the Board determined to approve the continuation of the Investment Management Agreement for an additional annual term, without change to the Portfolios’ contractual fee schedules, as set forth below.
| | |
| PORTFOLIO | | ANNUAL PERCENTAGE OF AVERAGE
DAILY NET ASSETS OF EACH PORTFOLIO |
| International Strategic Equities Portfolio | | 0.75% on the first $2.5 billion; 0.65% in excess of $2.5 billion up to, but not exceeding $5 billion; 0.60% of assets in excess of $5 billion. |
| | |
| International Small Cap Portfolio | | 1.00% of assets. |
| | |
| Small Cap Core Portfolio | | 0.80% of assets. |

Distributor
BERNSTEIN FUND, INC.
1345 AVENUEOFTHE AMERICAS, NEW YORK, NY 10105
(212) 756-4097
ISCEC-0151-0922
ITEM 2. CODE OF ETHICS.
(a) The registrant has adopted a code of ethics that applies to its principal executive officer, principal financial officer and principal accounting officer. A copy of the registrant’s code of ethics is filed herewith as Exhibit 12(a)(1).
(b) During the period covered by this report, no material amendments were made to the provisions of the code of ethics adopted in 2(a) above.
(c) During the period covered by this report, no implicit or explicit waivers to the provisions of the code of ethics adopted in 2(a) above were granted.
ITEM 3. AUDIT COMMITTEE FINANCIAL EXPERT.
The registrant’s Board of Directors has determined that independent directors Donald K. Peterson, Debra Perry, R. Jay Gerken, Jeffrey R. Holland and Michelle McCloskey qualify as audit committee financial experts.
ITEM 4. PRINCIPAL ACCOUNTANT FEES AND SERVICES.
(a) - (c) The following table sets forth the aggregate fees billed by the independent registered public accounting firm Pricewaterhouse Coopers LLP , for the Fund’s last two fiscal years for professional services rendered for: (i) the audit of the Fund’s annual financial statements included in the Fund’s annual report to stockholders; (ii) assurance and related services that are reasonably related to the performance of the audit of the Fund’s financial statements and are not reported under (i), which include advice and education related to accounting and auditing issues, quarterly press release review (for those Funds that issue quarterly press releases), and preferred stock maintenance testing (for those Funds that issue preferred stock); and (iii) tax compliance, tax advice and tax return preparation.
| | | | | | | | | | | | | | | | |
| | | Audit Fees | | | Audit-Related
Fees | | | Tax Fees | |
Bernstein Fund Inc. Small Cap Core Portfolio | | | 2021+ | | | $ | 21,700 | | | $ | 1,099 | | | $ | 26,899 | |
| | | 2022 | | | $ | 21,700 | | | $ | 1,926 | | | $ | 22,794 | |
Bernstein Fund Inc. International Small Cap Portfolio | | | 2021+ | | | $ | 25,000 | | | $ | 1,099 | | | $ | 73,317 | |
| | | 2022 | | | $ | 25,000 | | | $ | 1,926 | | | $ | 67,793 | |
Bernstein Fund Inc. International Strategic Equities Portfolio | | | 2021 | | | $ | 25,000 | | | $ | 7,766 | | | $ | 345,765 | |
| | | 2022 | | | $ | 30,000 | | | $ | 1,926 | | | $ | 149,558 | |
| + | Revised to include certain fees that are applicable to 2021 |
(d) Not applicable.
(e) (1) Beginning with audit and non-audit service contracts entered into on or after May 6, 2003, the Fund’s Audit Committee policies and procedures require the pre-approval of all audit and non-audit services provided to the Fund by the Fund’s independent registered public accounting firm. The Fund’s Audit Committee policies and procedures also require pre-approval of all audit and non-audit services provided to the Adviser and Service Affiliates to the extent that these services are directly related to the operations or financial reporting of the Fund.
(e) (2) All of the amounts for Audit Fees, Audit-Related Fees and Tax Fees in the table under Item 4 (a)–(c) are for services pre-approved by the Fund’s Audit Committee.
(f) Not applicable.
(g) The following table sets forth the aggregate non-audit services provided to the Fund, the Fund’s Adviser and entities that control, are controlled by or under common control with the Adviser that provide ongoing services to the Fund:
| | | | | | | | | | | | |
| | | | | | All Fees for
Non-Audit Services
Provided to the
Portfolio, the Adviser
and Service Affiliates | | | Total Amount of
Foregoing Column
Pre-approved by the Audit
Committee
(Portion Comprised
of Audit Related Fees)
(Portion Comprised of
Tax Fees) | |
Bernstein Fund Inc. Small Cap Core Portfolio | | | 2021+ | | | $ | 3,049,048 | | | $ | 27,998 | |
| | | | | | | | | | $ | (1,099 | ) |
| | | | | | | | | | $ | (26,899 | ) |
| | | 2022 | | | $ | 5,874,283 | | | $ | 24,720 | |
| | | | | | | | | | $ | (1,926 | ) |
| | | | | | | | | | $ | (22,794 | ) |
Bernstein Fund Inc. International Small Cap Portfolio | | | 2021+ | | | $ | 3,095,466 | | | $ | 74,416 | |
| | | | | | | | | | $ | (1,099 | ) |
| | | | | | | | | | $ | (73,317 | ) |
| | | 2022 | | | $ | 5,919,282 | | | $ | 69,719 | |
| | | | | | | | | | $ | (1,926 | ) |
| | | | | | | | | | $ | (67,793 | ) |
Bernstein Fund Inc. International Strategic Equities Portfolio | | | 2021 | | | $ | 3,374,581 | | | $ | 353,531 | |
| | | | | | | | | | $ | (7,766 | ) |
| | | | | | | | | | $ | (345,765 | ) |
| | | 2022 | | | $ | 6,001,047 | | | $ | 151,484 | |
| | | | | | | | | | $ | (1,926 | ) |
| | | | | | | | | | $ | (149,558 | ) |
+ Revised to include certain fees that are applicable to 2021
(h) The Audit Committee of the Fund has considered whether the provision of any non-audit services not pre-approved by the Audit Committee provided by the Fund’s independent registered public accounting firm to the Adviser and Service Affiliates is compatible with maintaining the auditor’s independence.
ITEM 5. AUDIT COMMITTEE OF LISTED REGISTRANTS.
Not applicable to the registrant.
ITEM 6. INVESTMENTS.
Please see Schedule of Investments contained in the Report to Shareholders included under Item 1 of this Form N-CSR.
ITEM 7. DISCLOSURE OF PROXY VOTING POLICIES AND PROCEDURES FOR CLOSED-END MANAGEMENT INVESTMENT COMPANIES.
Not applicable to the registrant.
ITEM 8. PORTFOLIO MANAGERS OF CLOSED-END MANAGEMENT INVESTMENT COMPANIES.
Not applicable to the registrant.
ITEM 9. PURCHASES OF EQUITY SECURITIES BY CLOSED-END MANAGEMENT INVESTMENT COMPANY AND AFFILIATED PURCHASERS.
Not applicable to the registrant.
ITEM 10. SUBMISSION OF MATTERS TO A VOTE OF SECURITY HOLDERS.
There have been no material changes to the procedures by which shareholders may recommend nominees to the Fund’s Board of Directors since the Fund last provided disclosure in response to this item.
| ITEM | 11. CONTROLS AND PROCEDURES. |
(a) The registrant’s principal executive officer and principal financial officer have concluded that the registrant’s disclosure controls and procedures (as defined in Rule 30a-2(c) under the Investment Company Act of 1940, as amended) are effective at the reasonable assurance level based on their evaluation of these controls and procedures as of a date within 90 days of the filing date of this document.
(b) There were no changes in the registrant’s internal controls over financial reporting that occurred during the period covered by this report that has materially affected, or is reasonably likely to materially affect, the registrant’s internal control over financial reporting.
ITEM 12. DISCLOSURE OF SECURITIES LENDING ACTIVITIES FOR CLOSED-END MANAGEMENT INVESTMENT COMPANIES.
Not applicable to the registrant.
ITEM 13. EXHIBITS.
The following exhibits are attached to this Form N-CSR:
SIGNATURES
Pursuant to the requirements of the Securities Exchange Act of 1934 and the Investment Company Act of 1940, the registrant has duly caused this report to be signed on its behalf by the undersigned, thereunto duly authorized.
| | |
| (Registrant): Bernstein Fund, Inc. |
| |
| By: | | /s/ Beata Kirr |
| | Beata Kirr |
| | President |
| |
| Date: | | March 3, 2023 |
Pursuant to the requirements of the Securities Exchange Act of 1934 and the Investment Company Act of 1940, this report has been signed below by the following persons on behalf of the registrant and in the capacities and on the dates indicated.
| | |
| By: | | /s/ Beata Kirr |
| | Beata Kirr |
| | President |
| |
| Date: | | March 3, 2023 |
| |
| By: | | /s/ Joseph J. Mantineo |
| | Joseph J. Mantineo |
| | Treasurer and Chief Financial Officer |
| |
| Date: | | March 3, 2023 |