UNITED STATES
SECURITIES AND EXCHANGE COMMISSION
WASHINGTON, D.C. 20549
FORM N-CSR
CERTIFIED SHAREHOLDER REPORT OF REGISTERED
MANAGEMENT INVESTMENT COMPANIES
Investment Company Act file number: 811-23100
BERNSTEIN FUND, INC.
(Exact name of registrant as specified in charter)
1345 Avenue of the Americas, New York, New York 10105
(Address of principal executive offices) (Zip code)
Joseph J. Mantineo
AllianceBernstein L.P.
1345 Avenue of the Americas
New York, New York 10105
(Name and address of agent for service)
Registrant’s telephone number, including area code: (800) 221-5672
Date of fiscal year end: September 30, 2020
Date of reporting period: September 30, 2020
ITEM 1. REPORTS TO STOCKHOLDERS.
BERNSTEIN FUND, INC.
Small Cap Core Portfolio
International Small Cap Portfolio
International Strategic Equities Portfolio
ANNUAL REPORT
SEPTEMBER 30, 2020
Beginning January 1, 2021, as permitted by new regulations adopted by the Securities and Exchange Commission, each Fund’s annual and semi-annual shareholder reports will no longer be sent by mail, unless you specifically request paper copies of the reports. Instead, the reports will be made available on a website, and you will be notified by mail each time a report is posted and provided with a website address to access the report.
If you already elected to receive shareholder reports electronically, you will not be affected by this change and you need not take any action. You may elect to receive shareholder reports and other communications from a Fund electronically at any time by contacting your financial intermediary (such as a broker-dealer or bank) or, if you are a direct investor, by calling the Fund at 800.221.5672.
You may elect to receive all future reports in paper form free of charge. If you invest through a financial intermediary, you can contact your financial intermediary to request that you continue to receive paper copies of your shareholder reports; if you invest directly with a Fund, you can call the Fund at 800.221.5672. Your election to receive reports in paper form will apply to all funds held in your account with your financial intermediary or, if you invest directly, to all AB Mutual Funds you hold.
Table of Contents
Before investing in any portfolio of the Bernstein Fund, Inc., a prospective investor should consider carefully the portfolio’s investment objectives and policies, charges, expenses and risks. These and other matters of importance to prospective investors are contained in the portfolios’ prospectus, an additional copy of which may be obtained by visiting our website at www.Bernstein.com and clicking on “Investments”, then “Mutual Fund and Money Market Information—Prospectuses, SAIs and Shareholder Reports” or by calling your financial advisor or by calling Bernstein’s mutual fund shareholder help line at 212.756.4097. Please read the prospectus carefully before investing.
For performance information current to the most recent month-end, please call (collect) 212.486.5800.
This shareholder report must be preceded or accompanied by the Bernstein Fund, Inc. prospectus for individuals who are not shareholders of the Fund.
You may obtain a description of the Fund’s proxy voting policies and procedures, and information regarding how the Fund voted proxies relating to portfolio securities during the most recent 12-month period ended June 30, without charge. Simply visit www.AllianceBernstein.com, or go to the Securities and Exchange Commission’s website at www.sec.gov, or call AllianceBernstein at 800.227.4618.
The Fund will file its complete schedule of portfolio holdings with the Commission for the first and third quarters of each fiscal year as an exhibit to its reports on Form N-PORT. The Fund’s Form N-PORT reports are available on the Commission’s website at www.sec.gov. The Fund’s Forms N-PORT may also be reviewed and copied at the Commission’s Public Reference Room in Washington, D.C.; information on the operation of the Public Reference Room may be obtained by calling 800.SEC.0330.
Investment Products Offered: · Are Not FDIC Insured · May Lose Value · Are Not Bank Guaranteed
Portfolio Manager Commentary (Unaudited)
To Our Shareholders—November 16, 2020
On the following pages, you will find the 2020 annual report for the Portfolios (collectively, the “Portfolios”, and individually, a “Portfolio”) of the Bernstein Fund, Inc. (the “Bernstein Fund”). The annual report covers the six- and 12-month periods ended September 30, 2020, and includes financial statements as well as notes to the financial statements, information about the recent performance of the Portfolios and a listing of each Portfolio’s holdings as of the period end.
Global equities recorded positive returns over the six-and 12-month periods ended September 30, 2020. Led by a strong US rally, global equity markets erased losses from March when the COVID-19 pandemic triggered a sharp decline from all-time highs. Investor optimism was supported by expanded monetary and fiscal stimulus, signs of encouraging economic data, and news that several potential vaccines had reached advanced trials.
Equity markets have been notable in their narrowness in this period, with technology stocks globally meaningfully outperforming all other sectors, and resulting in historic concentration across market indices.
Global fixed-income market returns were likewise strong, but volatile over the periods. Helped by unprecedented monetary and fiscal stimulus that combated market illiquidity, risk assets rebounded. Developed- and emerging-market investment-grade corporate bonds led, followed by high-yield bonds, as investors searched for higher yields in a period of falling interest rates.
Despite the recovery over the last six months, numerous concerns continue to plague global markets. Rising COVID-19 cases across much of the developed world are triggering a new round of containment measures and reinforcing fears about the pace of the recovery. Add in the transition to a new presidential administration and the ongoing US-China trade tensions, and uncertainty is expected to weigh on global markets for the foreseeable future.
As always, our portfolio teams are focused on balancing the opportunity for long term growth with managing risk in the short term. We believe that balance today is more important than ever. Thank you for your continued confidence in our approach.
If you have any questions about your investments in the Portfolios, please contact your Bernstein Advisor by calling 212.756.4097, or visit www.Bernstein.com. As always, we are firmly dedicated to your investment success. Thank you for your continued interest in the Portfolios.
Sincerely,
Beata D. Kirr
President
Bernstein Fund, Inc.
Small Cap Core Portfolio
Investment Objectives and Strategy
The Portfolio seeks to provide long-term growth of capital. The Portfolio invests, under normal circumstances, at least 80% of its net assets (plus any borrowings for investment purposes) in equity securities of small-capitalization companies or other securities or instruments with similar economic characteristics, including derivatives related to equity securities. Equity securities are primarily common stocks, although, for purposes of the 80% policy, equity securities may also include preferred stocks, warrants, convertible securities, sponsored or unsponsored American Depositary Receipts (“ADRs”) and Global Depositary Receipts (“GDRs”) and equity real estate investment trusts (“REITs”). You will be notified at least 60 days prior to any change to the Portfolio’s 80% investment policy.
AllianceBernstein L.P. serves as the Portfolio’s investment manager (the “Adviser”). The Adviser invests the assets of the Portfolio primarily in a diversified portfolio of equity securities of small-capitalization companies located in the US. The Portfolio defines small-capitalization companies as those that, at the time of investment, fall within the capitalization range between the smallest company in the Russell 2000 Index (“Russell 2000”) and the largest company in the Russell 2000. The market capitalization of the companies included in the Portfolio’s definition of “small-capitalization” companies changes over time as the capitalization of the securities included in the Russell 2000 changes.
The Adviser utilizes both quantitative analysis and fundamental research to determine which securities will be held by the Portfolio and to manage risk. The Adviser applies quantitative analysis to all of the securities in the Portfolio’s
(Portfolio Manager Commentary continued on next page)
Portfolio Manager Commentary (continued)
research universe, which is composed primarily of securities in the Portfolio’s benchmark. Those securities that score highly on this quantitative analysis are then screened to eliminate those securities that the Adviser is recommending against purchasing based on its fundamental research, and a portfolio is constructed from the remaining highly ranked securities based on diversification and risk considerations. In its quantitative analysis, the Adviser considers a number of metrics that have historically provided some indication of favorable future returns, including metrics relating to valuation, quality, investor behavior and earnings growth. In general, stocks are purchased when, in the view of the Adviser, they provide the highest expected returns, considering their contribution to the estimated risk of the Portfolio’s existing investments. Typically, growth in the size of a company’s market capitalization relative to other domestically traded companies does not cause the Adviser to dispose of the security. The Adviser expects to seek to manage the overall portfolio volatility of the Portfolio relative to the Russell 2000 by favoring securities that offer the best balance between return and targeted risk.
The Portfolio may also invest in exchange-traded funds (“ETFs”) and other investment companies from time to time.
The Portfolio expects to utilize derivatives, such as options, futures contracts, forwards and swaps. For example, the Portfolio may use stock index futures contracts to equitize cash. Derivatives may provide a more efficient and economical exposure to market segments than direct investments, and may also be a more efficient way to alter the Portfolio’s exposure.
Investment Results
The table on page 10 shows the Portfolio’s performance compared to its benchmark, the Russell 2000 Index, for the six- and 12-month periods ended September 30, 2020. The table also includes the Portfolio’s peer group, as represented by the Lipper Small-Cap Core Funds Average (the “Lipper Average”). Funds in the Lipper Average have generally similar investment objectives to the Portfolio, although some of the funds may have different investment policies and sales and management fees and fund expenses.
The global pandemic and related lockdowns depressed economic activity and triggered a deep sell-off in the first quarter of 2020. Governments and central banks around the world staged a powerful response, combining monetary and fiscal stimulus, which helped the markets rebound. Despite having sold off for more than 34% along the way, the Russell 2000 Index ended the 12-month period up 0.39%. The Portfolio underperformed the benchmark in the 12-month period. Underperformance mostly occurred during the volatile first quarter of 2020. The Portfolio performed better over the six-month period, but still trailed the benchmark, as the markets continued their recovery from the pandemic. This performance pattern compared favorably to the peer group. The Portfolio meaningfully outperformed the Lipper Average in both periods.
The Portfolio maintained long-term exposure to attractive valuation, high profitability and positive-sentiment stocks, which tend to outperform over the long term. As the 12-month period progressed, the Portfolio’s exposure to value stocks was a significant detractor, relative to the benchmark, as this style remained challenged for another year. An underweight to the biotechnology sector, and stock selection within industrials and consumer discretionary also detracted from performance. Exposure to low-leverage, high growth, and favorable sentiment, as well as an underweight to real estate and communication services contributed to performance.
The Portfolio utilized derivatives in the form of futures for investment purposes, which added to absolute returns for the six-month period, but detracted for the 12-month period.
International Small Cap Portfolio
Investment Objective and Strategy
The Portfolio seeks to provide long-term growth of capital. The Portfolio invests, under normal circumstances, at least 80% of its net assets (plus any borrowings for investment purposes) in equity securities of small-capitalization companies or other securities or instruments with similar economic characteristics, including derivatives related to equity securities. Equity securities are primarily common stocks, although, for purposes of the 80% policy, equity securities may also include preferred stocks, warrants, convertible securities, sponsored or unsponsored ADRs and GDRs and equity REITs. You will be notified at least 60 days prior to any change to the Portfolio’s 80% investment policy.
AllianceBernstein L.P. serves as the Portfolio’s Adviser. The Adviser invests the assets of the Portfolio primarily in a diversified portfolio of equity securities of small-capitalization companies located outside of the United States. Under normal circumstances, at least 65% of the Portfolio’s net assets are invested in companies located outside of the United States. The Portfolio defines small-capitalization companies as those that, at the time of investment, have market capitalizations within
(Portfolio Manager Commentary continued on next page)
Portfolio Manager Commentary (continued)
the market capitalization range of the Portfolio’s benchmark, the Morgan Stanley Capital International (“MSCI”) All Country World Index (“ACWI”) ex USA Small Cap. The market capitalization of the companies included in the Portfolio’s definition of “small-capitalization” companies changes over time as the capitalization of the securities included in the MSCI ACWI ex USA Small Cap changes.
The Portfolio’s exposure to non-US companies may change over time based on the Adviser’s assessment of market conditions and the investment merit of non-US issuers. Under normal circumstances, the Adviser invests in companies located in at least three countries other than the United States and expects to have exposure to issuers in several different countries. In determining a company’s location for purposes of the Portfolio’s investment policies and restrictions, the Adviser may consider: (1) the place of domicile, (2) where the company has an established presence and conducts its business and (3) where the company conducts a significant part of its economic activities. The Portfolio may invest in both developed and emerging-market countries and, at times, may invest significantly in emerging markets.
The Adviser seeks to identify attractive investment opportunities primarily through its fundamental investment research or quantitative analysis. In applying its fundamental research, the Adviser generally seeks to identify companies that possess both attractive valuation and compelling company- and/or industry-level investment catalysts. In applying its quantitative analysis, the Adviser typically considers a number of metrics that historically have provided some indication of favorable future returns, including metrics related to valuation, quality, investor behavior and corporate behavior. Utilizing these resources, the Adviser expects to allocate the Portfolio’s assets among issuers, industries and geographic locations to attempt to create a diversified portfolio of investments.
The Portfolio may invest in established companies and also in new and less-seasoned issuers. The Portfolio may also invest in ETFs and other investment companies from time to time.
The Portfolio expects to utilize derivatives, such as options, futures contracts, forwards and swaps. For example, the Portfolio may invest in currency derivatives as discussed below and in futures contracts to gain exposure to certain markets. Derivatives may provide a more efficient and economical exposure to market segments than direct investments, and may also be a more efficient way to alter the Portfolio’s exposure.
Fluctuations in currency exchange rates can have a dramatic impact on the returns of foreign equity securities. The Adviser may employ currency hedging strategies, including the use of currency-related derivatives, to seek to reduce currency risk in the Portfolio, but it is not required to do so. The Adviser may also take long and short positions in currencies or related derivatives for investment purposes, independent of any security positions. The Adviser may use stock index futures contracts to gain access to certain markets.
Investment Results
The table on page 10 shows the Portfolio’s performance compared to its benchmark, the MSCI ACWI ex USA Small Cap (net), for the six- and 12-month periods ended September 30, 2020. The table also includes the Portfolio’s peer group, as represented by the Lipper International Small/Mid-Cap Growth Funds Average. Funds in the Lipper Average have generally similar investment objectives to the Portfolio, although some of the funds may have different investment policies and sales and management fees and fund expenses.
All share classes of the Portfolio underperformed the benchmark and Lipper Average for both periods. During the reporting period, the growth investment style, with its focus on secular growers that were less impacted by the economic slowdown resulting from the pandemic-induced lockdowns, dominated performance. In every region of the world, the more cyclically oriented value style underperformed the growth style by historical levels. As a result, the Portfolio significantly underperformed its assigned Lipper peer group of International Small/Mid-Cap Growth Funds as its more balanced approach of finding mispriced companies relative to their long-term, normalized earnings power and their financial and operational risks, lagged. In the 12-month period, stock selection in European industrials was a detractor, relative to the benchmark, as the pandemic-induced lock-down disrupted air travel and the Portfolio’s holdings in aerospace companies fell significantly. Positive sector and country selection modestly offset some losses. In the six- month period, negative stock selection in information technology, real estate and consumer staples detracted, more than offsetting positive stock selection from a recovery in industrials and consumer-discretionary stocks. Sector selection was a modest positive and country selection detracted in this period.
The Portfolio utilized currency forwards for hedging purposes, which had no material impact on absolute performance for either period.
(Portfolio Manager Commentary continued on next page)
Portfolio Manager Commentary (continued)
International Strategic Equities Portfolio
Investment Objective and Strategy
On July 23, 2020, the Boards of Directors of Bernstein Fund and Sanford C. Bernstein Fund, Inc. (“SCB Fund”) reviewed and unanimously approved the reorganization of the International Portfolio and Tax-Managed International Portfolio, each a series of SCB Fund, into the International Strategic Equities Portfolio, a series of Bernstein Fund (together, the “Reorganizations,” and each, a “Reorganization”).
Pursuant to each proposed Reorganization, the International Portfolio and Tax-Managed International Portfolio (each, an “Acquired Portfolio,” and together, the “Acquired Portfolios”) will transfer all of their assets and stated liabilities to the International Strategic Equities Portfolio (the “Acquiring Portfolio”). Each of the Acquired Portfolios and the Acquiring Portfolio have substantially identical investment objectives and substantially similar investment strategies and risks. Shareholders of each Acquired Portfolio approved the Reorganizations on October 22, 2020. It is expected that the Reorganizations will be completed on or about December 4, 2020.
The Portfolio seeks to provide long-term growth of capital. The Portfolio invests, under normal circumstances, at least 80% of its net assets (plus any borrowings for investment purposes) in equity securities or other securities or instruments with similar economic characteristics, including derivatives related to equity securities. Equity securities are primarily common stocks, although, for purposes of the 80% policy, equity securities may also include preferred stocks, warrants, convertible securities, sponsored or unsponsored ADRs and GDRs and equity REITs. You will be notified at least 60 days prior to any change to the Portfolio’s 80% investment policy.
AllianceBernstein L.P. serves as the Portfolio’s Adviser. The Adviser invests the assets of the Portfolio primarily (under normal circumstances, at least 65% of net assets) in equity securities of issuers in countries that make up the MSCI ACWI ex USA, which includes both developed and emerging-market countries. The Portfolio focuses on securities of large-cap and mid-cap companies. The Adviser expects to allocate fund assets among issuers in many foreign countries, but not necessarily in the same proportion that the countries are represented in the MSCI ACWI ex USA and may invest in issuers in countries outside of the MSCI ACWI ex USA. The Portfolio’s exposure among non-US countries may change over time based on the Adviser’s assessment of market conditions and the investment merit of particular non-US issuers. Under normal circumstances, the Adviser invests in companies located in at least three countries other than the United States and expects to have exposure to issuers in several different countries. In determining a company’s location for purposes of the Portfolio’s investment policies and restrictions, the Adviser may consider: (1) the place of domicile, (2) where the company has an established presence and conducts its business and (3) where the company conducts a significant part of its economic activities. The Portfolio may, at times, invest significantly in emerging markets.
The Adviser utilizes both fundamental and quantitative research to both determine which securities will be held by the Portfolio and to manage risk. Specifically, the Portfolio’s management team uses the universe of securities selected by the Adviser’s various fundamental investment teams focusing on international equity securities, and applies its quantitative analysis to these securities. In applying its quantitative analysis, the Adviser considers a number of metrics that have historically provided some indication of favorable future returns, including metrics relating to valuation, quality, investor behavior and corporate behavior. Utilizing these resources, the Adviser expects to allocate the Portfolio’s assets among issuers, industries and geographic locations to attempt to create a diversified portfolio of investments.
The Portfolio may also invest in ETFs and other investment companies from time to time.
The Portfolio expects to utilize derivatives, such as options, futures contracts, forwards and swaps. For example, the Portfolio may invest in currency derivatives as discussed below and in futures contracts to gain exposure to certain markets. Derivatives may provide a more efficient and economical exposure to market segments than direct investments, and may also be a more efficient way to alter the Portfolio’s exposure.
Fluctuations in currency exchange rates can have a dramatic impact on the returns of foreign equity securities. The Adviser may employ currency hedging strategies, including the use of currency-related derivatives, to seek to reduce currency risk in the Portfolio, but it is not required to do so. The Adviser may also take long and short positions in currencies or related derivatives for investment purposes, independent of any security positions. The Adviser may use stock index futures contracts to gain access to certain markets.
(Portfolio Manager Commentary continued on next page)
Portfolio Manager Commentary (continued)
Investment Results
The table on page 10 shows the Portfolio’s performance compared to its benchmark, the MSCI ACWI ex USA (net), for the six- and 12-month periods ended September 30, 2020. The table also includes the Portfolio’s peer group, as represented by the Lipper International Multi-Cap Growth Funds Average. Funds in the Lipper Average have generally similar investment objectives to the Portfolio, although some of the funds may have different investment policies and sales and management fees and fund expenses.
During the 12-month period, all share classes of the Portfolio underperformed the benchmark and Lipper Average. Stock selection detracted, relative to the benchmark, impacted particularly by the underperformance of a number of cyclical stocks exposed to the economic and social impacts of the COVID-19 pandemic. An underweight position to the highest growth parts of the market also detracted. Sector selection was positive, helped by an overweight to the technology sector and an underweight to the financials sector. Country selection also contributed, helped by overweights to some of the smaller European countries such as Denmark and the Netherlands, and underweights to larger economies such as the United Kingdom and France.
During the six-month period, all share classes of the Portfolio underperformed the benchmark and Lipper Average. Country selection was negative, mainly due to underweights to Germany and India, and overweights to Switzerland and Portugal. Stock selection also detracted from performance as a number of more core-like or defensive holdings underperformed the strongly rising market. As in the 12-month period, sector selection was positive, helped by an overweight to the technology sector and an underweight to the financials sector. From a factor perspective, growth outperformed value in the period, and the Portfolio’s performance was also negatively impacted by an underweight to a group of high growth, but relatively expensive, stocks that rose significantly.
The Portfolio utilized derivatives in the form of currency forwards for hedging purposes, which had an immaterial impact on absolute returns for both periods.
Disclosures and Risks (Unaudited)
Benchmark Disclosures
None of the following indices or averages reflects fees and expenses associated with the active management of a mutual fund portfolio. The Russell 2000® Index measures the performance of the small-cap segment of the US equity universe. The MSCI ACWI ex USA Small Cap (net) measures the performance of the small-cap market segment across 22 of 23 developed markets (excluding the US) and 24 emerging-market countries. The MSCI ACWI ex USA (net, free float-adjusted, market capitalization weighted) represents the equity market performance of developed and emerging markets, excluding the United States. MSCI makes no express or implied warranties or representations, and shall have no liability whatsoever with respect to any MSCI data contained herein. The MSCI data may not be further redistributed or used as a basis for other indices, any securities or financial products. This report is not approved, reviewed or produced by MSCI. Net returns include the reinvestment of dividends after deduction of non-US withholding tax. Investors cannot invest directly in an index, and their results are not indicative of the performance for any specific investment, including the Portfolios.
A Word About Risk
All Portfolios:
The share price of the Portfolios will fluctuate and you may lose money. There is no guarantee that the Portfolios will achieve their investment objectives.
Cybersecurity Risk: Cybersecurity incidents, both intentional and unintentional, may allow an unauthorized party to gain access to Portfolio assets, customer data (including private shareholder information), or proprietary information, or cause the Portfolios, the Adviser, and/or its service providers (including, but not limited to, fund accountants, custodians, sub-custodians, transfer agents and financial intermediaries) to suffer data breaches, data corruption or lose operational functionality, or prevent Portfolio investors from purchasing, redeeming or exchanging shares or receiving distributions. A Portfolio and the Adviser have limited ability to prevent or mitigate cybersecurity incidents affecting third-party service providers. Cybersecurity incidents may result in financial losses to such Portfolio and its shareholders, and substantial costs may be incurred in order to prevent any future cybersecurity incidents.
Illiquid Investments Risk: Illiquid investments risk exists when particular investments are difficult to purchase or sell, possibly preventing the Portfolios from purchasing or selling these securities at an advantageous price. Illiquid securities may also be difficult to value.
Redemption Risk: The Portfolios may experience heavy redemptions that could cause the Portfolios to liquidate their assets at inopportune times or unfavorable prices or increase or accelerate taxable gains or transaction costs and may negatively affect the Portfolios’ net asset value, or performance, which could cause the value of your investment to decline. Redemption risk is heightened during periods of overall market turmoil.
Market Risk: The Portfolios are subject to market risk, which is the risk that stock prices in general or in particular countries or sectors may decline over short or extended periods. Stock prices may decline in response to adverse changes in the economy or the economic outlook; deterioration in investor sentiment; interest-rate, currency and commodity price fluctuations; adverse geopolitical, social or environmental developments; issuer- and sector-specific considerations; and other factors. In the past decade, financial markets in the United States, Europe and elsewhere have experienced increased volatility, decreased liquidity and heightened uncertainty. These market conditions may recur from time to time and have an adverse impact on various securities markets. Certain governments and central banks have provided significant support to financial markets, including by buying stocks and through other market interventions. Further governmental or central bank actions, including interest-rate increases or decreases, could negatively affect financial markets generally, increase market volatility and reduce the value and liquidity of securities in which the Portfolios invest.
The United Kingdom (the “UK”) voted to withdraw from the European Union (the “EU”) in 2016. A draft withdrawal agreement containing transitional arrangements and a Political Declaration setting out the agreed negotiating parameters for a future trading relationship were published in October 2019. The outcome of negotiations in respect of the future trading relationship remains uncertain. The UK left the EU on January 31, 2020 subject to a transition period ending December 31, 2020. The European Union (Withdrawal Agreement) Act 2020, which sets out the arrangements for the UK’s withdrawal from the EU, became law in the UK on January 23, 2020. The uncertainty surrounding the effect of the UK ceasing to be a member of the EU, including the uncertainty in relation to the legal and regulatory framework that will apply to the UK and its relationship with the
(Disclosures and Risks continued on next page)
Disclosures and Risks (continued)
remaining members of the EU (including, in relation to trade) after the end of the transitional period has caused and is likely to continue to cause increased economic volatility and market uncertainty globally.
The United States and its trading partners are periodically involved in disputes over trade, which may result in tariffs on various categories of goods imported from the other country. Trade disputes, particularly prolonged disputes, may adversely affect the economies of the United States and its trading partners, as well as the companies directly or indirectly affected by the dispute and financial markets generally, and thus may adversely affect the value of the Portfolios’ assets. In addition, policy and legislative changes in the United States and in other countries are affecting many aspects of financial regulation, and may in some instances contribute to decreased liquidity and increased volatility in the financial markets. The impact of these changes, and the practical implications for market participants, may not be fully known for some time.
Conditions affecting the general economy, including political, social, or economic instability at the local, regional, or global level may also affect the market value of a security. Health crises, such as pandemic and epidemic diseases, as well as other incidents that interrupt the expected course of events, such as natural disasters, war or civil disturbance, acts of terrorism, power outages and other unforeseeable and external events, and the public response to or fear of such diseases or events, have and may in the future have an adverse effect on the Portfolios’ investments and net asset value and can lead to increased market volatility. For example, any preventative or protective actions that governments may take in respect of such diseases or events may result in periods of business disruption, inability to obtain raw materials, supplies and component parts, and reduced or disrupted operations for the Portfolios’ portfolio companies. The occurrence and pendency of such diseases or events could adversely affect the economies and financial markets either in specific countries or worldwide.
Sector Risk: The Portfolios may have more risk because of concentrated investments in a particular market sector, such as the financials, consumer discretionary, information technology or industrials sector. Market or economic factors affecting that sector could have a major effect on the value of the Portfolios’ investments.
Capitalization Risk: Investments in small- and mid-capitalization companies may be more volatile than investments in large-capitalization companies. Investments in small- and mid-capitalization companies may have additional risks because these companies may have limited product lines, markets or financial resources.
Allocation Risk: The Portfolios may seek to focus on different investment disciplines or factors at different times as a means to achieve their investment objectives. In the event that the investment disciplines or factors to which the Portfolios have greater exposure perform worse than the investment disciplines or factors with less exposure, the Portfolios’ returns may be negatively affected.
Derivatives Risk: The Portfolios may use derivatives in currency hedging as well as for direct investments to gain access to certain markets, earn income, enhance return and broaden portfolio diversification, which entail greater risk than if used solely for hedging purposes. In addition to other risks such as the credit risk of the counterparty, derivatives involve the risk that changes in the value of the derivative may not correlate with relevant assets, rates or indices. Derivatives may be difficult to price or unwind, and small changes may produce disproportionate losses for the Portfolios. Certain derivatives have the potential for unlimited loss, regardless of the size of the initial investment. Assets required to be set aside or posted to cover or secure derivatives positions may themselves go down in value, and these collateral and other requirements may limit investment flexibility. Some derivatives involve leverage, which can make the Portfolios more volatile and can compound other risks. Derivatives, especially over-the-counter derivatives, are also subject to counterparty risk. The US government and certain foreign governments have adopted regulations governing derivatives markets, including mandatory clearing of certain derivatives and may impose additional regulations governing margin, reporting and registration requirements. The ultimate impact of the regulations remains unclear. Additional regulation may make derivatives more costly, limit their availability or utility, otherwise adversely affect their performance, or disrupt markets.
Management Risk: The Portfolios are subject to management risk because they are actively managed investment portfolios. The Adviser will apply its investment techniques and risk analyses in making investment decisions for the Portfolios, but these techniques, analyses and decisions may not work as intended or may not produce the desired results, and may, during certain periods, result in increased volatility for the Portfolios or cause the value of the Portfolios’ shares to go down. In some cases, derivatives and other investment techniques may be unavailable or the Adviser may determine
(Disclosures and Risks continued on next page)
Disclosures and Risks (continued)
not to use them, possibly even under market conditions where their use could benefit the Portfolios. Some of these techniques may incorporate, or rely upon, quantitative models, but there is no guarantee that these models will generate accurate forecasts, reduce risk or otherwise perform as expected. In addition, the Adviser may change the Portfolios’ investment strategies or policies from time to time. Those changes may not lead to the results intended by the Adviser and could also have an adverse effect on the Adviser and could have an adverse effect on the value or performance of the Portfolios.
REIT Risk: Investing in REITs involves certain unique risks in addition to those risks associated with investing in the real estate industry in general. Equity REITs may be affected by changes in the value of the underlying property owned by the REITs, while mortgage REITs may be affected by the quality of any credit extended. REITs are dependent upon management skills, are not diversified, and are subject to heavy cash flow dependency, default by borrowers and self-liquidation. Investing in REITs also involves risks similar to those associated with investing in small-capitalization companies. REITs may have limited financial resources, may trade less frequently and in a limited volume and may be subject to more abrupt or erratic price movements than larger company securities. REIT issuers may also fail to maintain their exemptions from investment company registration or fail to qualify for the “dividends paid deduction” under the Internal Revenue Code of 1986, as amended.
Investment in Other Investment Companies Risk: As with other investments, investments in other investment companies, including other registered funds advised by the Adviser and ETFs, are subject to market and management risk. In addition, if the Portfolios acquire shares of investment companies, shareholders bear both their proportionate share of expenses in the Portfolios (including management and advisory fees) and, indirectly, the expenses of the investment companies in which the Portfolios invest.
International Small Cap and International Strategic Equities Portfolios
Foreign (Non-US) Securities Risk: Investments in foreign securities entail significant risks in addition to those customarily associated with investing in US securities. These risks include risks related to adverse market, economic, political and regulatory factors and social instability, all of which could disrupt the financial markets in which the Portfolios invest and adversely affect the value of the Portfolios’ assets.
Country Concentration Risk: The Portfolios may not always be diversified among countries or regions and the effect on the share price of the Portfolios of specific risks such as political, regulatory and currency may be magnified due to concentration of the Portfolios’ investments in a particular country or region.
Emerging-Markets Securities Risk: The risks of investing in foreign (non-US) securities are heightened with respect to issuers in emerging-market countries because the markets are less developed and less liquid and there may be a greater amount of economic, political and social uncertainty, and these risks are even more pronounced in “frontier” markets, which are investable markets with lower total market capitalization and liquidity than the more developed emerging markets. In addition, the value of the Portfolios’ investments may decline because of factors such as unfavorable or unsuccessful government actions and reduction of government or central bank support.
Foreign Currency Risk: This is the risk that changes in foreign (non-US) currency exchange rates may negatively affect the value of the Portfolios’ investments or reduce the returns of the Portfolios. For example, the value of the Portfolios’ investments in foreign securities and foreign currency positions may decrease if the US dollar is strong (i.e., gaining value relative to other currencies) and other currencies are weak (i.e., losing value relative to the US dollar).
Actions by a Few Major Investors: In certain countries, volatility may be heightened by actions of a few major investors. For example, substantial increases or decreases in cash flows of mutual funds investing in these markets could significantly affect local stock prices and, therefore, share prices of the Portfolios.
Small Cap Core Portfolio
Portfolio Turnover Risk: The Portfolio’s investment strategies may result in high portfolio turnover. The Portfolio generally buys portfolio securities with the intention of holding them for investment. However, when market conditions or other circumstances warrant, securities may be purchased and sold without regard to the length of time held. This trading may increase the Portfolio’s rate of turnover and the incidence of short-term capital gain taxable as ordinary income. A higher rate of portfolio turnover may increase transaction costs, which must be borne by the Portfolio and its shareholders.
These risks are discussed in further detail in the Portfolios’ prospectus.
(Disclosures and Risks continued on next page)
Disclosures and Risks (continued)
An Important Note About Historical Performance
The performance shown on the following pages represents past performance and does not guarantee future results. Performance information is as of the dates shown. Current performance may be lower or higher than the performance information shown. You may obtain performance information current to the most recent month-end by calling 212.756.4097. The investment return and principal value of an investment in the Portfolios will fluctuate, so that shares, when redeemed, may be worth more or less than their original cost.
Investors should consider the investment objectives, risks, charges and expenses of the Portfolios carefully before investing. For copies of our prospectus or summary prospectus, which contain this and other information, visit www.Bernstein.com, click on “Investments”, then “Mutual Fund and Money Market Information—Prospectuses, SAIs and Shareholder Reports”, or call Bernstein’s mutual fund shareholder help line at 212.756.4097 or contact your Bernstein Advisor. Please read the prospectus and/or summary prospectus carefully before investing.
Historical Performance (Unaudited)
Bernstein Fund Portfolios vs. Their Benchmarks and Lipper Averages
| | | | | | | | | | | | | | | | |
| | | TOTAL RETURNS | | | AVERAGE ANNUAL TOTAL RETURNS | | | | |
| THROUGH SEPTEMBER 30, 2020 | | PAST SIX
MONTHS | | | PAST 12
MONTHS | | | SINCE
INCEPTION | | | INCEPTION DATE | |
Small Cap Core Portfolio1 | | | | | | | | | | | | | | | 12/29/2015 | |
SCB Class Shares | | | 31.19 | % | | | -3.42 | % | | | 3.79 | % | | | | |
Advisor Class Shares | | | 31.36 | % | | | -3.17 | % | | | 4.04 | % | | | | |
Class Z Shares | | | 31.40 | % | | | -3.23 | % | | | 4.05 | % | | | | |
Russell 2000 Index | | | 31.60 | % | | | 0.39 | % | | | 7.14 | % | | | | |
Lipper Small-Cap Core Funds Average | | | 26.94 | % | | | -8.07 | % | | | 4.27 | % | | | | |
| | | | | | | | | | | | | | | | | |
International Small Cap Portfolio2 | | | | | | | | | | | | | | | 12/21/2015 | |
SCB Class Shares | | | 31.98 | % | | | 1.77 | % | | | 4.51 | % | | | | |
Advisor Class Shares | | | 32.07 | % | | | 1.90 | % | | | 4.73 | % | | | | |
Class Z Shares | | | 32.07 | % | | | 1.91 | % | | | 4.74 | % | | | | |
MSCI ACWI ex USA Small Cap (net) | | | 35.72 | % | | | 6.97 | % | | | 6.43 | % | | | | |
Lipper International Small/Mid-Cap Growth Funds Average | | | 37.35 | % | | | 13.06 | % | | | 7.82 | % | | | | |
| | | | | | | | | | | | | | | | | |
International Strategic Equities Portfolio3 | | | | | | | | | | | | | | | 12/21/2015 | |
SCB Class Shares | | | 22.54 | % | | | 1.81 | % | | | 5.11 | % | | | | |
Advisor Class Shares | | | 22.70 | % | | | 2.04 | % | | | 5.35 | % | | | | |
Class Z Shares | | | 22.68 | % | | | 2.02 | % | | | 5.36 | % | | | | |
MSCI ACWI ex USA (net) | | | 23.38 | % | | | 3.00 | % | | | 6.18 | % | | | | |
Lipper International Multi-Cap Growth Funds Average | | | 31.56 | % | | | 14.10 | % | | | 8.02 | % | | | | |
| | | Please keep in mind that high, double-digit returns are highly unusual and cannot be sustained. Investors should also be aware that these returns were primarily achieved during favorable market conditions. |
| 1 | | The current prospectus table shows the total annual operating expense ratios for the Portfolio as 1.14%, 0.89% and 0.87% for SCB Class, Advisor Class and Class Z shares, respectively. The Financial Highlights section of this report sets forth expense ratio data for the current reporting period; the expense ratios shown above may differ from the expense ratios in the Financial Highlights section since they are based on different time periods. |
| 2 | | The current prospectus table shows the total annual operating expense ratios for the Portfolio as 1.35%, 1.10% and 1.10% for SCB Class, Advisor Class and Class Z shares, respectively. The Financial Highlights section of this report sets forth expense ratio data for the current reporting period; the expense ratios shown above may differ from the expense ratios in the Financial Highlights section since they are based on different time periods. |
| 3 | | The current prospectus table shows the total annual operating expense ratios for the Portfolio as 1.00%, 0.75% and 0.76% for SCB Class, Advisor Class and Class Z shares, respectively. The Financial Highlights section of this report sets forth expense ratio data for the current reporting period; the expense ratios shown above may differ from the expense ratios in the Financial Highlights section since they are based on different time periods. |
See Disclosures, Risks and Note about Historical Performance on pages 6-9.
(Historical Performance continued on next page)
Historical Performance (continued from previous page)
| | | | |
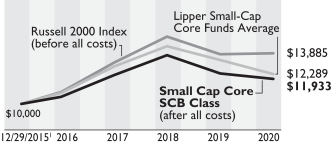
| Small Cap Core—SCB Class Shares | | | | |
Growth of a $10,000 Investment in the Portfolio | | | | |
| | | | |
| | | | |
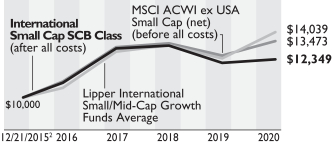
| International Small Cap—SCB Class Shares | | | | |
Growth of a $10,000 Investment in the Portfolio | | | | |
| | | | |
| | | | |
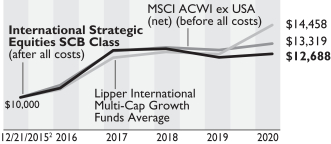
| International Strategic Equities—SCB Class Shares | | | | |
Growth of a $10,000 Investment in the Portfolio | | | | |
| | | | |
| | | Past performance is no guarantee of future results and an investment in the Portfolios could lose value. Each chart illustrates the total value of an assumed $10,000 investment as compared to the performance of each Portfolio’s respective benchmark and Lipper Average for the period since inception through September 30, 2020. |
| 1 | | Inception date: 12/29/2015. |
| 2 | | Inception date: 12/21/2015. |
See Disclosures, Risks and Note about Historical Performance on pages 6-9.
Expense Example—September 30, 2020 (Unaudited)
As a shareholder of a Portfolio, you incur various ongoing costs, including management fees and other Portfolio expenses. This example is intended to help you understand your ongoing costs (in dollars) of investing in the Portfolio and to compare these costs with the ongoing costs of investing in other mutual funds. The example is based on an investment of $1,000 invested at the beginning of the period and held for the entire period as indicated below.
Actual Expenses—The first line of the table below provides information about actual account values and actual expenses. You may use the information in this line, together with the amount you invested, to estimate the expenses that you paid over the period. Simply divide your account value by $1,000 (for example, an $8,600 account value divided by $1,000 = 8.6), then multiply the result by the number in the first line under the heading entitled “Expenses Paid During Period” to estimate the expenses you paid on your account during this period.
Hypothetical Example for Comparison Purposes—The second line of the table below provides information about hypothetical account values and hypothetical expenses based on a Portfolio’s actual expense ratio and an assumed annual rate of return of 5% before expenses, which is not the Portfolio’s actual return. The hypothetical account values and expenses may not be used to estimate the actual ending account balance or expenses you paid for the period. You may use this information to compare the ongoing costs of investing in the Portfolio and other funds by comparing this 5% hypothetical example with the 5% hypothetical examples that appear in the shareholder reports of other funds. Please note that the expenses shown in the table are meant to highlight your ongoing costs only and do not reflect any transactional costs, such as sales charges (loads), or contingent deferred sales charges on redemptions. Therefore, the second line of the table is useful in comparing ongoing costs only, and will not help you determine the relative total costs of owning different funds. In addition, if these transactional costs were included, your costs would have been higher.
| | | | | | | | | | | | | | | | |
| | | BEGINNING
ACCOUNT VALUE
APRIL 1, 2020 | | | ENDING
ACCOUNT VALUE
SEPTEMBER 30, 2020 | | | EXPENSES
PAID DURING
PERIOD* | | | ANNUALIZED
EXPENSE
RATIO* | |
Small Cap Core Portfolio | | | | | | | | | | | | | | | | |
SCB Class | | | | | | | | | | | | |
Actual | | $ | 1,000 | | | $ | 1,311.90 | | | $ | 6.65 | | | | 1.15 | % |
Hypothetical** | | $ | 1,000 | | | $ | 1,019.25 | | | $ | 5.81 | | | | 1.15 | % |
Advisor Class | | | | | | | | | | | | |
Actual | | $ | 1,000 | | | $ | 1,313.60 | | | $ | 5.21 | | | | 0.90 | % |
Hypothetical** | | $ | 1,000 | | | $ | 1,020.50 | | | $ | 4.55 | | | | 0.90 | % |
Class Z | | | | | | | | | | | | |
Actual | | $ | 1,000 | | | $ | 1,314.00 | | | $ | 5.03 | | | | 0.87 | % |
Hypothetical** | | $ | 1,000 | | | $ | 1,020.65 | | | $ | 4.39 | | | | 0.87 | % |
| |
International Small Cap Portfolio | | | | | | | | | | | | | | | | |
SCB Class | | | | | | | | | | | | |
Actual | | $ | 1,000 | | | $ | 1,319.80 | | | $ | 7.77 | | | | 1.34 | % |
Hypothetical** | | $ | 1,000 | | | $ | 1,018.30 | | | $ | 6.76 | | | | 1.34 | % |
Advisor Class | | | | | | | | | | | | |
Actual | | $ | 1,000 | | | $ | 1,320.70 | | | $ | 6.32 | | | | 1.09 | % |
Hypothetical** | | $ | 1,000 | | | $ | 1,019.55 | | | $ | 5.50 | | | | 1.09 | % |
Class Z | | | | | | | | | | | | |
Actual | | $ | 1,000 | | | $ | 1,320.70 | | | $ | 6.27 | | | | 1.08 | % |
Hypothetical** | | $ | 1,000 | | | $ | 1,019.60 | | | $ | 5.45 | | | | 1.08 | % |
| |
International Strategic Equities Portfolio | | | | | | | | | | | | | | | | |
SCB Class | | | | | | | | | | | | |
Actual | | $ | 1,000 | | | $ | 1,225.40 | | | $ | 5.62 | | | | 1.01 | % |
Hypothetical** | | $ | 1,000 | | | $ | 1,019.95 | | | $ | 5.10 | | | | 1.01 | % |
Advisor Class | | | | | | | | | | | | |
Actual | | $ | 1,000 | | | $ | 1,227.00 | | | $ | 4.18 | | | | 0.75 | % |
Hypothetical** | | $ | 1,000 | | | $ | 1,021.25 | | | $ | 3.79 | | | | 0.75 | % |
Class Z | | | | | | | | | | | | |
Actual | | $ | 1,000 | | | $ | 1,226.80 | | | $ | 4.29 | | | | 0.77 | % |
Hypothetical** | | $ | 1,000 | | | $ | 1,021.15 | | | $ | 3.89 | | | | 0.77 | % |
| |
| * | | Expenses are equal to the classes’ annualized expense ratios, multiplied by the average account value over the period, multiplied by 183/366 (to reflect the one-half year period). |
| ** | | Assumes 5% annual return before expenses. |
Portfolio Summary—September 30, 2020 (Unaudited)
| | | | | | |
| Small Cap Core Portfolio | | | |
| |
| Sector Breakdown1 | | | |
Health Care | | | 19.2 | % | | |
Industrials | | | 16.7 | | | |
Information Technology | | | 15.3 | | | |
Financials | | | 14.6 | | | |
Consumer Discretionary | | | 14.4 | | | |
Real Estate | | | 6.9 | | | |
Materials | | | 4.7 | | | |
Utilities | | | 3.0 | | | |
Consumer Staples | | | 2.9 | | | |
Energy | | | 1.7 | | | |
Communication Services | | | 0.6 | | | |
| | | | | | |
| | | | | | |
| International Small Cap Portfolio |
| |
| Sector Breakdown1 | | | Country Breakdown1 |
Industrials | | | 16.4 | % | | 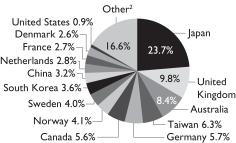 |
Information Technology | | | 15.0 | |
Consumer Discretionary | | | 13.9 | |
Financials | | | 10.6 | |
Consumer Staples | | | 9.2 | |
Materials | | | 7.7 | |
Health Care | | | 7.6 | |
Communication Services | | | 7.6 | |
Real Estate | | | 6.0 | |
Utilities | | | 4.3 | |
Energy | | | 1.7 | |
| | | | | | |
| | | | | | |
| International Strategic Equities Portfolio |
| |
| Sector Breakdown1 | | | Country Breakdown1 |
Information Technology | | | 17.6 | % | | 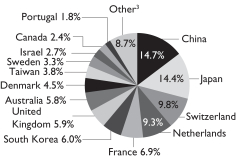 |
Consumer Discretionary | | | 13.8 | |
Consumer Staples | | | 12.9 | |
Financials | | | 10.7 | |
Health Care | | | 10.3 | |
Communication Services | | | 10.1 | |
Industrials | | | 8.4 | |
Materials | | | 7.0 | |
Utilities | | | 4.2 | |
Energy | | | 2.7 | |
Real Estate | | | 2.3 | |
| 1 | | All data are as of September 30, 2020. The Portfolio’s country and sector breakdowns are expressed as a percentage of each Portfolio’s long-term investments and may vary over time. Each Portfolio may also invest in other financial instruments, including derivative instruments, which provide investment exposure to a variety of asset classes (see “Schedule of Investments” section of the Small Cap Core, International Small Cap and International Strategic Equities Portfolios). |
| 2 | | “Other” represents 5.8% in MSCI EM Index countries and 10.8% in MSCI EAFE Index countries. |
| 3 | | “Other” represents 2.8% in MSCI EM Index countries and 5.9% in MSCI EAFE Index countries. |
| | | Please note: The sector classifications presented herein are based on the Global Industry Classification Standard (GICS) which was developed by Morgan Stanley Capital International and Standard & Poor’s. The components are divided into sector, industry group, and industry sub-indices as classified by the GICS for each of the market capitalization indices in the broad market. These sector classifications are broadly defined. The “Schedule of Investments” section of the report reflects more specific industry information and is consistent with the investment restrictions discussed in the Portfolio’s prospectus. |
Schedule of Investments
Bernstein Fund, Inc.
Schedule of Investments
Small Cap Core Portfolio
September 30, 2020
| | | | | | | | |
| | |
| Company | | Shares | | | U.S. $ Value | |
|
| COMMON STOCKS–99.4% | |
|
| Health Care–19.1% | |
| Biotechnology–9.5% | |
ACADIA Pharmaceuticals, Inc.(a) | | | 17,109 | | | $ | 705,746 | |
Allakos, Inc.(a) | | | 21,282 | | | | 1,733,419 | |
Allogene Therapeutics, Inc.(a) | | | 37,541 | | | | 1,415,671 | |
Amicus Therapeutics, Inc.(a) | | | 144,966 | | | | 2,046,920 | |
Annexon, Inc.(a) | | | 45,020 | | | | 1,360,955 | |
Arena Pharmaceuticals, Inc.(a) | | | 40,408 | | | | 3,022,114 | |
Arrowhead Pharmaceuticals, Inc.(a) | | | 55,522 | | | | 2,390,777 | |
Ascendis Pharma A/S (Sponsored ADR)(a) | | | 6,697 | | | | 1,033,481 | |
Biohaven Pharmaceutical Holding Co., Ltd.(a) | | | 28,431 | | | | 1,848,299 | |
Bioxcel Therapeutics, Inc.(a) | | | 19,018 | | | | 824,620 | |
Blueprint Medicines Corp.(a) | | | 31,665 | | | | 2,935,346 | |
ChemoCentryx, Inc.(a) | | | 32,841 | | | | 1,799,687 | |
Coherus Biosciences, Inc.(a) | | | 88,719 | | | | 1,627,106 | |
Deciphera Pharmaceuticals, Inc.(a) | | | 20,705 | | | | 1,062,167 | |
Dicerna Pharmaceuticals, Inc.(a) | | | 55,759 | | | | 1,003,104 | |
Eagle Pharmaceuticals, Inc./DE(a) | | | 14,682 | | | | 623,691 | |
Emergent BioSolutions, Inc.(a) | | | 23,361 | | | | 2,413,892 | |
Global Blood Therapeutics, Inc.(a) | | | 10,604 | | | | 584,705 | |
Gossamer Bio, Inc.(a) | | | 90,922 | | | | 1,128,342 | |
Halozyme Therapeutics, Inc.(a) | | | 82,292 | | | | 2,162,634 | |
Heron Therapeutics, Inc.(a) | | | 73,652 | | | | 1,091,523 | |
Insmed, Inc.(a) | | | 79,371 | | | | 2,550,984 | |
Iovance Biotherapeutics, Inc.(a) | | | 37,918 | | | | 1,248,261 | |
Karuna Therapeutics, Inc.(a) | | | 6,024 | | | | 465,776 | |
Ligand Pharmaceuticals, Inc.(a) | | | 16,147 | | | | 1,539,132 | |
Madrigal Pharmaceuticals, Inc.(a) | | | 12,760 | | | | 1,514,995 | |
Mirati Therapeutics, Inc.(a) | | | 19,331 | | | | 3,209,913 | |
Natera, Inc.(a) | | | 38,317 | | | | 2,768,020 | |
Novavax, Inc.(a) | | | 19,780 | | | | 2,143,163 | |
PTC Therapeutics, Inc.(a) | | | 41,211 | | | | 1,926,614 | |
Relay Therapeutics, Inc.(a) | | | 22,920 | | | | 976,163 | |
Turning Point Therapeutics, Inc.–Class I(a) | | | 24,124 | | | | 2,107,473 | |
Twist Bioscience Corp.(a) | | | 34,255 | | | | 2,602,352 | |
Ultragenyx Pharmaceutical, Inc.(a) | | | 35,354 | | | | 2,905,745 | |
Vir Biotechnology, Inc.(a) | | | 29,477 | | | | 1,011,945 | |
Y-mAbs Therapeutics, Inc.(a) | | | 38,689 | | | | 1,485,271 | |
Zentalis Pharmaceuticals, Inc.(a) | | | 34,370 | | | | 1,123,555 | |
| | | | | | | | |
| | | | 62,393,561 | |
| | | | | |
| Health Care Equipment & Supplies–4.0% | |
CONMED Corp. | | | 12,269 | | | | 965,202 | |
Globus Medical, Inc.–Class A(a) | | | 35,646 | | | | 1,765,190 | |
Integer Holdings Corp.(a) | | | 62,120 | | | | 3,665,701 | |
iRhythm Technologies, Inc.(a) | | | 19,395 | | | | 4,618,144 | |
Meridian Bioscience, Inc.(a) | | | 50,794 | | | | 862,482 | |
Mesa Laboratories, Inc. | | | 7,340 | | | | 1,869,938 | |
Neogen Corp.(a) | | | 37,060 | | | | 2,899,945 | |
Nevro Corp.(a) | | | 23,621 | | | | 3,290,405 | |
Orthofix Medical, Inc.(a) | | | 49,600 | | | $ | 1,544,544 | |
Penumbra, Inc.(a) | | | 8,096 | | | | 1,573,701 | |
Silk Road Medical, Inc.(a) | | | 43,144 | | | | 2,899,708 | |
| | | | | | | | |
| | | | 25,954,960 | |
| | | | | |
| Health Care Providers & Services–2.0% | |
Allovir, Inc.(a) | | | 34,240 | | | | 941,600 | |
Amedisys, Inc.(a) | | | 4,003 | | | | 946,429 | |
AMN Healthcare Services, Inc.(a) | | | 56,765 | | | | 3,318,482 | |
BioTelemetry, Inc.(a) | | | 52,917 | | | | 2,411,957 | |
Chemed Corp. | | | 2,005 | | | | 963,102 | |
LHC Group, Inc.(a) | | | 14,963 | | | | 3,180,535 | |
Tenet Healthcare Corp.(a) | | | 59,807 | | | | 1,465,870 | |
| | | | | | | | |
| | | | 13,227,975 | |
| | | | | |
| Health Care Technology–1.0% | |
Computer Programs & Systems, Inc. | | | 100,430 | | | | 2,772,872 | |
Health Catalyst, Inc.(a) | | | 67,074 | | | | 2,454,908 | |
HMS Holdings Corp.(a) | | | 60,886 | | | | 1,458,220 | |
| | | | | | | | |
| | | | 6,686,000 | |
| | | | | |
| Life Sciences Tools & Services–1.1% | |
ICON PLC(a) | | | 8,695 | | | | 1,661,528 | |
Medpace Holdings, Inc.(a) | | | 26,932 | | | | 3,009,651 | |
Repligen Corp.(a) | | | 6,306 | | | | 930,387 | |
Syneos Health, Inc.(a) | | | 28,386 | | | | 1,509,000 | |
| | | | | | | | |
| | | | 7,110,566 | |
| | | | | |
| Pharmaceuticals–1.5% | |
Amphastar Pharmaceuticals, Inc.(a) | | | 39,000 | | | | 731,250 | |
Axsome Therapeutics, Inc.(a) | | | 19,127 | | | | 1,362,799 | |
Corcept Therapeutics, Inc.(a) | | | 69,464 | | | | 1,209,021 | |
GW Pharmaceuticals PLC (Sponsored ADR)(a) | | | 9,049 | | | | 880,920 | |
Innoviva, Inc.(a) | | | 82,517 | | | | 862,303 | |
Lyra Therapeutics, Inc.(a) | | | 58,310 | | | | 651,906 | |
MyoKardia, Inc.(a) | | | 11,093 | | | | 1,512,309 | |
Osmotica Pharmaceuticals PLC(a) | | | 185,640 | | | | 1,004,312 | |
Revance Therapeutics, Inc.(a) | | | 61,247 | | | | 1,539,749 | |
| | | | | | | | |
| | | | | | | 9,754,569 | |
| | | | | | | | |
| | | | | | | 125,127,631 | |
| | | | | | | | |
| | | | | | | | |
| |
| Industrials–16.6% | |
| Aerospace & Defense–0.6% | |
Aerojet Rocketdyne Holdings, Inc.(a) | | | 61,490 | | | | 2,452,836 | |
Curtiss-Wright Corp. | | | 16,783 | | | | 1,565,183 | |
| | | | | | | | |
| | | | 4,018,019 | |
| | | | | |
| Air Freight & Logistics–0.8% | |
Echo Global Logistics, Inc.(a) | | | 69,252 | | | | 1,784,624 | |
Forward Air Corp. | | | 18,330 | | | | 1,051,775 | |
Radiant Logistics, Inc.(a) | | | 449,103 | | | | 2,308,390 | |
| | | | | | | | |
| | | | 5,144,789 | |
| | | | | |
| Airlines–0.4% | |
SkyWest, Inc. | | | 81,534 | | | | 2,434,605 | |
| | | | | | | | |
| Building Products–2.6% | |
Builders FirstSource, Inc.(a) | | | 148,497 | | | | 4,843,972 | |
| | | | | | | | |
| | | |
| Company | | Shares | | | U.S. $ Value | |
Masonite International Corp.(a) | | | 39,200 | | | $ | 3,857,280 | |
Patrick Industries, Inc. | | | 28,562 | | | | 1,642,886 | |
Simpson Manufacturing Co., Inc. | | | 47,305 | | | | 4,596,154 | |
UFP Industries, Inc. | | | 39,357 | | | | 2,224,064 | |
| | | | | | | | |
| | | | 17,164,356 | |
| | | | | |
| Commercial Services & Supplies–1.2% | |
Brady Corp.–Class A | | | 29,770 | | | | 1,191,395 | |
Brink’s Co. (The) | | | 28,216 | | | | 1,159,396 | |
Kimball International, Inc.–Class B | | | 77,234 | | | | 814,046 | |
Steelcase, Inc.–Class A | | | 214,764 | | | | 2,171,264 | |
Tetra Tech, Inc. | | | 27,972 | | | | 2,671,326 | |
| | | | | | | | |
| | | | 8,007,427 | |
| | | | | |
| Construction & Engineering–2.7% | |
AECOM(a) | | | 72,447 | | | | 3,031,183 | |
Arcosa, Inc. | | | 52,165 | | | | 2,299,955 | |
Comfort Systems USA, Inc. | | | 68,544 | | | | 3,530,701 | |
EMCOR Group, Inc. | | | 51,120 | | | | 3,461,335 | |
MasTec, Inc.(a) | | | 57,054 | | | | 2,407,679 | |
Quanta Services, Inc. | | | 26,809 | | | | 1,417,124 | |
Tutor Perini Corp.(a) | | | 151,938 | | | | 1,691,070 | |
| | | | | | | | |
| | | | 17,839,047 | |
| | | | | |
| Electrical Equipment–0.8% | |
Atkore International Group, Inc.(a) | | | 22,421 | | | | 509,629 | |
Regal Beloit Corp. | | | 36,530 | | | | 3,429,071 | |
Sunrun, Inc.(a) | | | 17,990 | | | | 1,387,465 | |
| | | | | | | | |
| | | | 5,326,165 | |
| | | | | |
| Machinery–3.0% | |
Allison Transmission Holdings, Inc. | | | 40,331 | | | | 1,417,231 | |
Barnes Group, Inc. | | | 68,917 | | | | 2,463,094 | |
Kadant, Inc. | | | 18,150 | | | | 1,989,603 | |
Kennametal, Inc. | | | 101,320 | | | | 2,932,201 | |
Meritor, Inc.(a) | | | 152,963 | | | | 3,203,045 | |
Mueller Industries, Inc. | | | 123,646 | | | | 3,345,861 | |
Shey Group , Inc. (The) | | | 80,150 | | | | 1,513,232 | |
Wabash National Corp. | | | 231,491 | | | | 2,768,632 | |
| | | | | | | | |
| | | | 19,632,899 | |
| | | | | |
| Professional Services–2.3% | |
ASGN, Inc.(a) | | | 50,694 | | | | 3,222,111 | |
Barrett Business Services, Inc. | | | 39,408 | | | | 2,066,555 | |
FTI Consulting, Inc.(a) | | | 15,977 | | | | 1,693,083 | |
Insperity, Inc. | | | 49,491 | | | | 3,241,165 | |
Kforce, Inc. | | | 54,640 | | | | 1,757,769 | |
TriNet Group, Inc.(a) | | | 50,230 | | | | 2,979,644 | |
| | | | | | | | |
| | | | 14,960,327 | |
| | | | | |
| Road & Rail–1.0% | |
ArcBest Corp. | | | 41,142 | | | | 1,277,870 | |
Knight-Swift Transportation Holdings, Inc. | | | 44,031 | | | | 1,792,062 | |
Saia, Inc.(a) | | | 29,390 | | | | 3,707,255 | |
| | | | | | | | |
| | | | 6,777,187 | |
| | | | | |
| Trading Companies & Distributors–1.2% | |
Applied Industrial Technologies, Inc. | | | 58,817 | | | | 3,240,817 | |
GMS, Inc.(a) | | | 99,641 | | | | 2,401,348 | |
MRC Global, Inc.(a) | | | 462,570 | | | $ | 1,979,799 | |
| | | | | | | | |
| | | | | | | 7,621,964 | |
| | | | | | | | |
| | | | | | | 108,926,785 | |
| | | | | | | | |
| | | | | | | | |
| |
| Information Technology–15.2% | |
| Communications Equipment–0.4% | |
Extreme Networks, Inc.(a) | | | 202,126 | | | | 812,546 | |
Viavi Solutions, Inc.(a) | | | 131,735 | | | | 1,545,252 | |
| | | | | | | | |
| | | | 2,357,798 | |
| | | | | |
| Electronic Equipment, Instruments & Components–3.0% | |
Arrow Electronics, Inc.(a) | | | 41,114 | | | | 3,234,027 | |
Fabrinet(a) | | | 24,738 | | | | 1,559,236 | |
Insight Enterprises, Inc.(a) | | | 64,290 | | | | 3,637,528 | |
Jabil, Inc. | | | 56,299 | | | | 1,928,804 | |
OSI Systems, Inc.(a) | | | 30,452 | | | | 2,363,380 | |
PC Connection, Inc. | | | 64,904 | | | | 2,664,958 | |
Sanmina Corp.(a) | | | 84,596 | | | | 2,288,322 | |
SYNNEX Corp. | | | 15,933 | | | | 2,231,576 | |
| | | | | | | | |
| | | | 19,907,831 | |
| | | | | |
| IT Services–3.8% | |
CACI International, Inc.–Class A(a) | | | 9,576 | | | | 2,041,220 | |
EVERTEC, Inc. | | | 81,834 | | | | 2,840,458 | |
KBR, Inc. | | | 120,514 | | | | 2,694,693 | |
ManTech International Corp./VA–Class A | | | 24,520 | | | | 1,688,938 | |
MAXIMUS, Inc. | | | 47,741 | | | | 3,265,962 | |
Perficient, Inc.(a) | | | 53,176 | | | | 2,272,742 | |
Perspecta, Inc. | | | 97,896 | | | | 1,904,077 | |
Science Applications International Corp. | | | 24,790 | | | | 1,944,032 | |
TTEC Holdings, Inc. | | | 55,490 | | | | 3,026,979 | |
WNS Holdings Ltd. (ADR)(a) | | | 53,182 | | | | 3,401,521 | |
| | | | | | | | |
| | | | 25,080,622 | |
| | | | | |
| Semiconductors & Semiconductor Equipment–3.3% | |
Cirrus Logic, Inc.(a) | | | 36,973 | | | | 2,493,829 | |
Enphase Energy, Inc.(a) | | | 20,846 | | | | 1,721,671 | |
Kulicke & Soffa Industries, Inc. | | | 93,793 | | | | 2,100,963 | |
Lattice Semiconductor Corp.(a) | | | 101,868 | | | | 2,950,097 | |
MACOM Technology Solutions Holdings, Inc.(a) | | | 59,400 | | | | 2,020,194 | |
MKS Instruments, Inc. | | | 25,332 | | | | 2,767,015 | |
Semtech Corp.(a) | | | 39,920 | | | | 2,114,163 | |
Silicon Laboratories, Inc.(a) | | | 24,891 | | | | 2,435,584 | |
Synaptics, Inc.(a) | | | 38,889 | | | | 3,127,454 | |
| | | | | | | | |
| | | | 21,730,970 | |
| | | | | |
| Software–4.3% | |
Blackline, Inc.(a) | | | 40,093 | | | | 3,593,536 | |
CommVault Systems, Inc.(a) | | | 49,518 | | | | 2,020,334 | |
Envestnet, Inc.(a) | | | 44,770 | | | | 3,454,453 | |
Everbridge, Inc.(a) | | | 9,561 | | | | 1,202,105 | |
J2 Global, Inc.(a) | | | 54,929 | | | | 3,802,185 | |
Manhattan Associates, Inc.(a) | | | 28,665 | | | | 2,737,221 | |
Nuance Communications, Inc.(a) | | | 83,287 | | | | 2,764,295 | |
Ping Identity Holding Corp.(a) | | | 96,829 | | | | 3,022,033 | |
Progress Software Corp. | | | 105,631 | | | | 3,874,545 | |
Schedule of Investments (continued)
| | | | | | | | |
| | | |
| Company | | Shares | | | U.S. $ Value | |
SPS Commerce, Inc.(a) | | | 24,800 | | | $ | 1,931,176 | |
| | | | | | | | |
| | | | 28,401,883 | |
| | | | | |
| Technology Hardware, Storage & Peripherals–0.4% | |
NCR Corp.(a) | | | 100,899 | | | | 2,233,904 | |
| | | | | | | | |
| | | | | | | 99,713,008 | |
| | | | | | | | |
| | | | | | | | |
| |
| Financials–14.5% | |
| Banks–5.7% | |
1st Source Corp. | | | 31,607 | | | | 974,760 | |
Bancorp, Inc. (The)(a) | | | 309,288 | | | | 2,672,248 | |
Bank of NT Butterfield & Son Ltd. (The) | | | 72,910 | | | | 1,624,435 | |
Cathay General Bancorp | | | 68,550 | | | | 1,486,164 | |
Civista Bancshares, Inc. | | | 141,839 | | | | 1,775,824 | |
Community Trust Bancorp, Inc. | | | 43,890 | | | | 1,240,331 | |
First Citizens BancShares, Inc./NC–Class A | | | 4,003 | | | | 1,276,076 | |
First Horizon National Corp. | | | 213,804 | | | | 2,016,172 | |
Great Southern Bancorp, Inc. | | | 41,029 | | | | 1,486,070 | |
Hilltop Holdings, Inc. | | | 158,406 | | | | 3,259,996 | |
Home BancShares, Inc./AR | | | 239,450 | | | | 3,630,062 | |
International Bancshares Corp. | | | 79,390 | | | | 2,068,904 | |
Northeast Bank(a) | | | 91,941 | | | | 1,691,714 | |
Preferred Bank/Los Angeles CA | | | 62,886 | | | | 2,019,898 | |
Republic Bancorp, Inc./KY–Class A | | | 52,740 | | | | 1,485,158 | |
Sterling Bancorp/DE | | | 216,836 | | | | 2,281,115 | |
Synovus Financial Corp. | | | 116,782 | | | | 2,472,275 | |
Webster Financial Corp. | | | 86,041 | | | | 2,272,343 | |
Western Alliance Bancorp | | | 51,830 | | | | 1,638,865 | |
| | | | | | | | |
| | | | 37,372,410 | |
| | | | | |
| Capital Markets–1.6% | |
Cowen, Inc.–Class A | | | 140,871 | | | | 2,291,971 | |
Evercore, Inc.–Class A | | | 27,032 | | | | 1,769,515 | |
Houlihan Lokey, Inc. | | | 40,796 | | | | 2,409,004 | |
Moelis & Co. | | | 118,530 | | | | 4,165,144 | |
| | | | | | | | |
| | | | | | | 10,635,634 | |
| | | | | | | | |
| Consumer Finance–1.2% | |
Navient Corp. | | | 308,567 | | | | 2,607,391 | |
Nelnet, Inc.–Class A | | | 39,533 | | | | 2,381,863 | |
OneMain Holdings, Inc. | | | 98,154 | | | | 3,067,313 | |
| | | | | | | | |
| | | | 8,056,567 | |
| | | | | |
| Insurance–2.2% | |
First American Financial Corp. | | | 31,656 | | | | 1,611,607 | |
Goosehead Insurance, Inc.–Class A | | | 22,281 | | | | 1,929,312 | |
Inari Medical, Inc.(a) | | | 21,667 | | | | 1,495,456 | |
Kinsale Capital Group, Inc. | | | 11,278 | | | | 2,144,850 | |
National Western Life Group, Inc.–Class A | | | 11,860 | | | | 2,167,652 | |
Palomar Holdings, Inc.(a) | | | 27,091 | | | | 2,823,966 | |
Primerica, Inc. | | | 17,960 | | | | 2,031,994 | |
| | | | | | | | |
| | | | 14,204,837 | |
| | | | | |
| Mortgage Real Estate Investment Trusts (REITs)–0.5% | |
Ellington Financial, Inc. | | | 117,851 | | | | 1,444,853 | |
PennyMac Mortgage Investment Trust | | | 123,600 | | | | 1,986,252 | |
| | | | | | | | |
| | | | 3,431,105 | |
| | | | | |
| Thrifts & Mortgage Finance–3.3% | |
BankUnited, Inc. | | | 138,979 | | | $ | 3,045,030 | |
Essent Group Ltd. | | | 109,507 | | | | 4,052,854 | |
Flagstar Bancorp, Inc. | | | 70,516 | | | | 2,089,389 | |
MGIC Investment Corp. | | | 322,120 | | | | 2,853,983 | |
Mr Cooper Group, Inc.(a) | | | 145,240 | | | | 3,241,757 | |
PennyMac Financial Services, Inc. | | | 44,798 | | | | 2,603,660 | |
Radian Group, Inc. | | | 133,980 | | | | 1,957,448 | |
Walker & Dunlop, Inc. | | | 31,678 | | | | 1,678,934 | |
| | | | | | | | |
| | | | 21,523,055 | |
| | | | | |
| | | | 95,223,608 | |
| | | | | | | | |
| | | | | | | | |
| |
| Consumer Discretionary–14.3% | |
| Auto Components–0.8% | |
Fox Factory Holding Corp.(a) | | | 29,260 | | | | 2,174,896 | |
LCI Industries | | | 26,420 | | | | 2,808,182 | |
| | | | | | | | |
| | | | 4,983,078 | |
| | | | | |
| Automobiles–0.6% | |
Thor Industries, Inc. | | | 21,957 | | | | 2,091,624 | |
Winnebago Industries, Inc. | | | 28,386 | | | | 1,466,704 | |
| | | | | | | | |
| | | | 3,558,328 | |
| | | | | |
| Diversified Consumer Services–1.2% | |
Hillenbrand, Inc. | | | 118,232 | | | | 3,353,059 | |
Perdoceo Education Corp.(a) | | | 138,342 | | | | 1,693,306 | |
Strategic Education, Inc. | | | 31,840 | | | | 2,912,405 | |
| | | | | | | | |
| | | | 7,958,770 | |
| | | | | |
| Hotels, Restaurants & Leisure–3.1% | |
Churchill Downs, Inc. | | | 28,730 | | | | 4,706,549 | |
Marriott Vacations Worldwide Corp. | | | 49,356 | | | | 4,482,018 | |
Papa John’s International, Inc. | | | 18,815 | | | | 1,548,098 | |
Penn National Gaming, Inc.(a) | | | 55,720 | | | | 4,050,844 | |
Planet Fitness, Inc.(a) | | | 26,433 | | | | 1,628,802 | |
Wingstop, Inc. | | | 10,688 | | | | 1,460,515 | |
Wyndham Destinations, Inc. | | | 83,961 | | | | 2,582,640 | |
| | | | | | | | |
| | | | 20,459,466 | |
| | | | | |
| Household Durables–2.6% | |
Helen of Troy Ltd.(a) | | | 14,859 | | | | 2,875,514 | |
KB Home | | | 109,150 | | | | 4,190,268 | |
Lovesac Co. (The)(a) | | | 64,473 | | | | 1,786,547 | |
Meritage Homes Corp.(a) | | | 12,280 | | | | 1,355,589 | |
Taylor Morrison Home Corp.–Class A(a) | | | 150,261 | | | | 3,694,918 | |
TopBuild Corp.(a) | | | 19,336 | | | | 3,300,462 | |
| | | | | | | | |
| | | | 17,203,298 | |
| | | | | |
| Leisure Products–0.4% | |
Malibu Boats, Inc.(a) | | | 36,608 | | | | 1,814,293 | |
MasterCraft Boat Holdings, Inc.(a) | | | 58,945 | | | | 1,030,948 | |
| | | | | | | | |
| | | | 2,845,241 | |
| | | | | |
| Specialty Retail–3.9% | |
Citi Trends, Inc. | | | 135,080 | | | | 3,374,298 | |
Floor & Decor Holdings, Inc.–Class A(a) | | | 28,912 | | | | 2,162,617 | |
Foot Locker, Inc. | | | 73,764 | | | | 2,436,425 | |
| | | | | | | | |
| | | |
| Company | | Shares | | | U.S. $ Value | |
Genesco, Inc.(a) | | | 140,431 | | | $ | 3,024,884 | |
Lithia Motors, Inc.–Class A | | | 16,918 | | | | 3,856,289 | |
National Vision Holdings, Inc.(a) | | | 97,230 | | | | 3,718,075 | |
Sleep Number Corp.(a) | | | 67,713 | | | | 3,311,843 | |
Williams-Sonoma, Inc. | | | 22,281 | | | | 2,015,094 | |
Zumiez, Inc.(a) | | | 64,588 | | | | 1,796,838 | |
| | | | | | | | |
| | | | 25,696,363 | |
| | | | | |
| Textiles, Apparel & Luxury Goods–1.7% | |
Crocs, Inc.(a) | | | 99,252 | | | | 4,241,038 | |
Deckers Outdoor Corp.(a) | | | 21,280 | | | | 4,681,813 | |
Oxford Industries, Inc. | | | 59,105 | | | | 2,385,478 | |
| | | | | | | | |
| | | | 11,308,329 | |
| | | | | |
| | | | 94,012,873 | |
| | | | | |
| | | | | | | | |
| |
| Real Estate–6.8% | |
| Equity Real Estate Investment Trusts (REITs)–5.9% | |
Alexander & Baldwin, Inc. | | | 171,509 | | | | 1,922,616 | |
CareTrust REIT, Inc. | | | 97,747 | | | | 1,739,408 | |
Cousins Properties, Inc. | | | 48,306 | | | | 1,381,068 | |
First Industrial Realty Trust, Inc. | | | 72,986 | | | | 2,904,843 | |
Getty Realty Corp. | | | 101,859 | | | | 2,649,353 | |
Healthcare Realty Trust, Inc. | | | 81,800 | | | | 2,463,816 | |
Industrial Logistics Properties Trust | | | 96,380 | | | | 2,107,831 | |
National Storage Affiliates Trust | | | 53,672 | | | | 1,755,611 | |
NexPoint Residential Trust, Inc. | | | 60,290 | | | | 2,673,861 | |
Physicians Realty Trust | | | 172,272 | | | | 3,085,391 | |
QTS Realty Trust, Inc.–Class A | | | 54,338 | | | | 3,424,381 | |
RLJ Lodging Trust | | | 339,059 | | | | 2,936,251 | |
Sabra Health Care REIT, Inc. | | | 155,430 | | | | 2,142,603 | |
Service Properties Trust | | | 350,350 | | | | 2,785,282 | |
STAG Industrial, Inc. | | | 91,124 | | | | 2,778,371 | |
Terreno Realty Corp. | | | 35,224 | | | | 1,928,866 | |
| | | | | | | | |
| | | | 38,679,552 | |
| | | | | |
| Real Estate Management & Development–0.9% | |
Marcus & Millichap, Inc.(a) | | | 43,741 | | | | 1,203,753 | |
RE/MAX Holdings, Inc.–Class A | | | 87,273 | | | | 2,856,445 | |
Realogy Holdings Corp.(a) | | | 205,091 | | | | 1,936,059 | |
| | | | | | | | |
| | | | 5,996,257 | |
| | | | | |
| | | | 44,675,809 | |
| | | | | |
| | | | | | | | |
| |
| Materials–4.7% | |
| Chemicals–1.2% | |
Huntsman Corp. | | | 92,025 | | | | 2,043,875 | |
Orion Engineered Carbons SA | | | 257,910 | | | | 3,226,454 | |
Stepan Co. | | | 24,120 | | | | 2,629,080 | |
| | | | | | | | |
| | | | 7,899,409 | |
| | | | | |
| Metals & Mining–2.6% | |
B2Gold Corp. | | | 436,440 | | | | 2,845,589 | |
Commercial Metals Co. | | | 137,362 | | | | 2,744,493 | |
Novagold Resources, Inc.(a) | | | 253,842 | | | | 3,018,181 | |
Reliance Steel & Aluminum Co. | | | 34,432 | | | | 3,513,441 | |
Schnitzer Steel Industries, Inc.–Class A | | | 75,850 | | | | 1,458,596 | |
Warrior Met Coal, Inc. | | | 211,791 | | | $ | 3,617,390 | |
| | | | | | | | |
| | | | 17,197,690 | |
| | | | | |
| Paper & Forest Products–0.9% | |
Boise Cascade Co. | | | 79,392 | | | | 3,169,329 | |
Louisiana-Pacific Corp. | | | 58,635 | | | | 1,730,319 | |
Verso Corp. | | | 112,080 | | | | 884,311 | |
| | | | | | | | |
| | | | 5,783,959 | |
| | | | | |
| | | | 30,881,058 | |
| | | | | | | | |
| | | | | | | | |
| |
| Utilities–3.0% | |
| Electric Utilities–0.9% | |
ALLETE, Inc. | | | 42,090 | | | | 2,177,737 | |
Otter Tail Corp. | | | 69,540 | | | | 2,515,262 | |
Portland General Electric Co. | | | 40,234 | | | | 1,428,307 | |
| | | | | | | | |
| | | | 6,121,306 | |
| | | | | |
| Gas Utilities–0.4% | |
Chesapeake Utilities Corp. | | | 15,110 | | | | 1,273,773 | |
New Jersey Resources Corp. | | | 58,260 | | | | 1,574,185 | |
| | | | | | | | |
| | | | 2,847,958 | |
| | | | | |
| Independent Power and Renewable Electricity Producers–0.7% | |
Ormat Technologies, Inc. | | | 33,981 | | | | 2,008,617 | |
Vistra Corp. | | | 130,376 | | | | 2,458,891 | |
| | | | | | | | |
| | | | 4,467,508 | |
| | | | | |
| Multi-Utilities–0.8% | |
Avista Corp. | | | 48,079 | | | | 1,640,455 | |
Black Hills Corp. | | | 40,648 | | | | 2,174,262 | |
NorthWestern Corp. | | | 26,285 | | | | 1,278,502 | |
| | | | | | | | |
| | | | 5,093,219 | |
| | | | | |
| Water Utilities–0.2% | |
Consolidated Water Co., Ltd. | | | 125,817 | | | | 1,309,755 | |
| | | | | | | | |
| | | | 19,839,746 | |
| | | | | | | | |
| | | | | | | | |
| |
| Consumer Staples–2.9% | |
| Beverages–0.5% | |
Primo Water Corp. | | | 233,290 | | | | 3,312,718 | |
| | | | | | | | |
| Food & Staples Retailing–0.7% | |
SpartanNash Co. | | | 104,337 | | | | 1,705,910 | |
Village Super Market, Inc.–Class A | | | 104,068 | | | | 2,561,113 | |
| | | | | | | | |
| | | | 4,267,023 | |
| | | | | |
| Food Products–1.5% | |
Calavo Growers, Inc. | | | 35,075 | | | | 2,324,420 | |
Freshpet, Inc.(a) | | | 28,357 | | | | 3,166,059 | |
Hain Celestial Group, Inc. (The)(a) | | | 43,675 | | | | 1,498,053 | |
John B Sanfilippo & Son, Inc. | | | 16,745 | | | | 1,262,238 | |
Nomad Foods Ltd.(a) | | | 69,760 | | | | 1,777,485 | |
| | | | | | | | |
| | | | 10,028,255 | |
| | | | | |
| Personal Products–0.2% | |
USANA Health Sciences, Inc.(a) | | | 18,570 | | | | 1,367,681 | |
| | | | | | | | |
| | | | 18,975,677 | |
| | | | | | | | |
Schedule of Investments (continued)
| | | | | | | | |
| | | |
| Company | | Shares | | | U.S. $ Value | |
|
| Energy–1.7% | |
| Energy Equipment & Services–0.9% | |
Cactus, Inc.–Class A | | | 125,160 | | | $ | 2,401,820 | |
Helix Energy Solutions Group, Inc.(a) | | | 657,110 | | | | 1,583,635 | |
Matrix Service Co.(a) | | | 198,567 | | | | 1,658,035 | |
| | | | | | | | |
| | | | 5,643,490 | |
| | | | | |
| Oil, Gas & Consumable Fuels–0.8% | |
HollyFrontier Corp. | | | 85,892 | | | | 1,692,931 | |
Renewable Energy Group, Inc.(a) | | | 63,323 | | | | 3,382,715 | |
Teekay Tankers Ltd.–Class A(a) | | | 46,815 | | | | 507,474 | |
| | | | | | | | |
| | | | 5,583,120 | |
| | | | | |
| | | | 11,226,610 | |
| | | | | | | | |
| | | | | | | | |
| |
| Communication Services–0.6% | |
| Diversified Telecommunication Services–0.4% | |
Vonage Holdings Corp.(a) | | | 259,400 | | | | 2,653,663 | |
| | | | | | | | |
| Media–0.2% | |
Nexstar Media Group, Inc.–Class A | | | 11,618 | | | $ | 1,044,807 | |
| | | | | | | | |
| | | | | | | 3,698,470 | |
| | | | | | | | |
Total Common Stocks
(cost $587,740,732) | | | | | | | 652,301,275 | |
| | | | | | | | |
| | | | | | | | |
| | |
| SHORT-TERM INVESTMENTS–0.6% | | | | | |
| Investment Companies–0.6% | |
AB Fixed Income Shares, Inc.–Government Money Market Portfolio–Class AB,
0.05%(b)(c)(d)
(cost $3,935,753) | | | 3,935,753 | | | | 3,935,753 | |
| | | | | | | | |
Total Investments—100.0%
(cost $591,676,485) | | | | 656,237,028 | |
| | |
Other assets less liabilities—0.0% | | | | | | | 89,336 | |
| | | | | | | | |
| | | | | | | | |
| Net Assets—100.0% | | | | | | $ | 656,326,364 | |
| | | | | | | | |
| | | | | | | | | | | | | | |
| |
| FUTURES (see Note 3) | |
| Description | | Number of
Contracts | | | Expiration
Month | | Current
Notional | | | Value and
Unrealized
Appreciation/
(Depreciation) | |
| Purchased Contracts | |
| | | | |
E-Mini Russell 2000 Futures | | | 238 | | | December 2020 | | $ | 17,902,360 | | | $ | (192,005) | |
| (a) | | Non-income producing security. |
| (b) | | Affiliated investments. |
| (c) | | The rate shown represents the 7-day yield as of period end. |
| (d) | | To obtain a copy of the fund’s shareholder report, please go to the Securities and Exchange Commission’s website at www.sec.gov, or call AB at (800) 227-4618. |
Glossary:
ADR—American Depositary Receipt
REIT—Real Estate Investment Trust
See notes to financial statements.
Schedule of Investments
Bernstein Fund, Inc.
Schedule of Investments
International Small Cap Portfolio
September 30, 2020
| | | | | | | | |
| | |
| Company | | Shares | | | U.S. $ Value | |
|
| COMMON STOCKS–98.1% | |
|
| Industrials–16.1% | |
| Aerospace & Defense–1.4% | |
Meggitt PLC | | | 900,248 | | | $ | 2,987,480 | |
Saab AB–Class B(a) | | | 480,760 | | | | 14,135,570 | |
| | | | | | | | |
| | | | 17,123,050 | |
| | | | | |
| Air Freight & Logistics–0.2% | |
Oesterreichische Post AG | | | 65,928 | | | | 2,218,431 | |
| | | | | | | | |
| Airlines–0.4% | |
Controladora Vuela Cia de Aviacion SAB de CV–Class A(a) | | | 2,221,301 | | | | 1,616,387 | |
Wizz Air Holdings PLC(a)(b) | | | 72,526 | | | | 2,907,178 | |
| | | | | | | | |
| | | | 4,523,565 | |
| | | | | |
| Building Products–0.4% | |
Schweiter Technologies AG | | | 1,985 | | | | 2,767,159 | |
Uponor Oyj | | | 160,589 | | | | 2,805,883 | |
| | | | | | | | |
| | | | 5,573,042 | |
| | | | | |
| Commercial Services & Supplies–2.2% | |
Biffa PLC(b) | | | 2,085,995 | | | | 5,838,909 | |
Cewe Stiftung & Co. KGAA(a) | | | 22,649 | | | | 2,482,875 | |
Downer EDI Ltd. | | | 2,243,623 | | | | 7,131,188 | |
KEPCO Plant Service & Engineering Co., Ltd. | | | 94,110 | | | | 2,177,653 | |
Rentokil Initial PLC(a) | | | 878,769 | | | | 6,073,919 | |
Transcontinental, Inc.–Class A | | | 215,720 | | | | 2,663,390 | |
| | | | | | | | |
| | | | 26,367,934 | |
| | | | | |
| Construction & Engineering–1.7% | |
Balfour Beatty PLC | | | 1,657,545 | | | | 4,771,713 | |
Budimex SA | | | 42,770 | | | | 2,710,884 | |
Burkhalter Holding AG | | | 30,944 | | | | 2,132,138 | |
Daiho Corp. | | | 71,700 | | | | 2,052,982 | |
Mirait Holdings Corp. | | | 107,400 | | | | 1,648,875 | |
Morgan Sindall Group PLC | | | 155,657 | | | | 2,284,843 | |
Per Aarsleff Holding A/S–Class B | | | 61,855 | | | | 2,594,779 | |
Yurtec Corp. | | | 378,900 | | | | 2,324,992 | |
| | | | | | | | |
| | | | 20,521,206 | |
| | | | | |
| Electrical Equipment–2.3% | |
Fuji Electric Co., Ltd. | | | 268,200 | | | | 8,502,113 | |
Huber & Suhner AG | | | 35,290 | | | | 2,657,563 | |
Nexans SA(a) | | | 177,155 | | | | 10,234,727 | |
TKH Group NV | | | 163,690 | | | | 5,972,007 | |
| | | | | | | | |
| | | | 27,366,410 | |
| | | | | |
| Industrial Conglomerates–0.9% | |
Lifco AB–Class B | | | 33,890 | | | | 2,621,306 | |
Rheinmetall AG | | | 91,623 | | | | 8,217,477 | |
| | | | | | | | |
| | | | 10,838,783 | |
| | | | | |
| Machinery–1.9% | |
ATS Automation Tooling Systems, Inc.(a) | | | 530,692 | | | $ | 6,898,936 | |
Deutz AG(a) | | | 1,002,014 | | | | 5,810,605 | |
Judges Scientific PLC | | | 39,150 | | | | 2,455,135 | |
Kardex Holding AG | | | 13,943 | | | | 2,591,907 | |
Rational AG | | | 4,116 | | | | 3,228,463 | |
Valmet Oyj | | | 110,420 | | | | 2,723,745 | |
| | | | | | | | |
| | | | 23,708,791 | |
| | | | | |
| Professional Services–2.4% | |
Amadeus Fire AG(a) | | | 21,341 | | | | 2,647,483 | |
Intertrust NV | | | 313,993 | | | | 5,344,859 | |
NICE Information Service Co., Ltd. | | | 112,524 | | | | 1,895,085 | |
Renrui Human Resources Technology Holdings Ltd.(a) | | | 1,052,200 | | | | 2,799,336 | |
Teleperformance | | | 21,909 | | | | 6,754,584 | |
UT Group Co., Ltd.(a) | | | 275,500 | | | | 9,407,779 | |
| | | | | | | | |
| | | | 28,849,126 | |
| | | | | |
| Road & Rail–0.5% | |
Sankyu, Inc. | | | 150,000 | | | | 5,923,624 | |
| | | | | | | | |
| Trading Companies & Distributors–1.8% | |
AerCap Holdings NV(a) | | | 198,729 | | | | 5,005,983 | |
Daiichi Jitsugyo Co., Ltd. | | | 62,700 | | | | 2,218,030 | |
Howden Joinery Group PLC | | | 170,070 | | | | 1,294,419 | |
Inaba Denki Sangyo Co., Ltd. | | | 110,400 | | | | 2,772,997 | |
Indutrade AB(a) | | | 51,820 | | | | 2,773,880 | |
Russel Metals, Inc. | | | 195,747 | | | | 2,671,115 | |
Sojitz Corp. | | | 1,093,700 | | | | 2,482,065 | |
Yuasa Trading Co., Ltd. | | | 83,700 | | | | 2,615,656 | |
| | | | | | | | |
| | | | 21,834,145 | |
| | | | | |
| | | | 194,848,107 | |
| | | | | |
| | | | | | | | |
| | | |
| Information Technology–14.7% | | | | | | | | |
| Communications Equipment–0.7% | | | | | | | | |
Sterlite Technologies Ltd. | | | 3,017,531 | | | | 6,157,424 | |
VTech Holdings Ltd. | | | 327,500 | | | | 2,042,803 | |
| | | | | | | | |
| | | | 8,200,227 | |
| | | | | |
| Electronic Equipment, Instruments & Components–1.9% | |
Egis Technology, Inc. | | | 338,000 | | | | 1,977,513 | |
Inficon Holding AG | | | 3,472 | | | | 2,877,235 | |
Kaga Electronics Co., Ltd. | | | 55,700 | | | | 1,188,602 | |
Simplo Technology Co., Ltd. | | | 818,000 | | | | 8,493,774 | |
Test Research, Inc. | | | 1,180,000 | | | | 2,331,616 | |
Zhen Ding Technology Holding Ltd. | | | 1,421,000 | | | | 6,237,282 | |
| | | | | | | | |
| | | | 23,106,022 | |
| | | | | |
| IT Services–4.6% | |
Atea ASA(a) | | | 228,915 | | | | 2,820,469 | |
Computacenter PLC | | | 92,033 | | | | 2,810,270 | |
Data#3 Ltd. | | | 569,922 | | | | 2,709,138 | |
Equiniti Group PLC(a)(b) | | | 2,756,541 | | | | 4,043,421 | |
Formula Systems 1985 Ltd. | | | 16,260 | | | | 1,377,109 | |
NEC Networks & System Integration Corp. | | | 811,500 | | | | 15,598,977 | |
Nihon Unisys Ltd. | | | 377,739 | | | | 11,917,744 | |
Schedule of Investments (continued)
| | | | | | | | |
| | | |
| Company | | Shares | | | U.S. $ Value | |
NSD Co., Ltd. | | | 61,100 | | | $ | 1,200,096 | |
Pushpay Holdings Ltd.(a) | | | 513,300 | | | | 3,023,185 | |
Softcat PLC | | | 168,833 | | | | 2,625,251 | |
TietoEVRY Oyj | | | 271,595 | | | | 7,508,896 | |
| | | | | | | | |
| | | | 55,634,556 | |
| | | | | |
| Semiconductors & Semiconductor Equipment–5.0% | |
ASM International NV | | | 67,920 | | | | 9,735,842 | |
ASPEED Technology, Inc. | | | 52,000 | | | | 2,057,520 | |
BE Semiconductor Industries NV | | | 36,263 | | | | 1,554,662 | |
Dialog Semiconductor PLC(a) | | | 69,055 | | | | 3,009,744 | |
Elan Microelectronics Corp. | | | 540,000 | | | | 2,734,378 | |
Machvision, Inc. | | | 183,722 | | | | 1,819,630 | |
Nanya Technology Corp. | | | 3,128,000 | | | | 6,286,722 | |
Parade Technologies Ltd. | | | 207,000 | | | | 7,567,933 | |
Pixart Imaging, Inc. | | | 323,000 | | | | 2,003,474 | |
Realtek Semiconductor Corp. | | | 630,000 | | | | 8,075,550 | |
SCREEN Holdings Co., Ltd. | | | 225,200 | | | | 12,021,830 | |
Sino-American Silicon Products, Inc. | | | 801,000 | | | | 2,698,394 | |
Sitronix Technology Corp. | | | 295,000 | | | | 1,342,497 | |
| | | | | | | | |
| | | | 60,908,176 | |
| | | | | |
| Software–2.2% | |
Avast PLC(b) | | | 1,440,789 | | | | 9,781,655 | |
Enghouse Systems Ltd. | | | 204,958 | | | | 11,201,077 | |
Fortnox AB | | | 93,530 | | | | 2,819,732 | |
Iress Ltd. | | | 387,730 | | | | 2,694,179 | |
| | | | | | | | |
| | | | 26,496,643 | |
| | | | | |
| Technology Hardware, Storage & Peripherals–0.3% | |
Aten International Co., Ltd. | | | 695,000 | | | | 1,992,055 | |
Gigabyte Technology Co., Ltd. | | | 626,000 | | | | 1,643,506 | |
| | | | | | | | |
| | | | 3,635,561 | |
| | | | | |
| | | | 177,981,185 | |
| | | | | |
| | | | | | | | |
| |
| Consumer Discretionary–13.6% | |
| Auto Components–1.8% | |
Aisan Industry Co., Ltd. | | | 161,300 | | | | 721,172 | |
Faurecia SE(a) | | | 171,383 | | | | 7,387,360 | |
GUD Holdings Ltd. | | | 321,570 | | | | 2,636,257 | |
Tianneng Power International Ltd. | | | 1,524,000 | | | | 2,738,225 | |
Toyo Tire Corp. | | | 514,694 | | | | 8,337,347 | |
| | | | | | | | |
| | | | 21,820,361 | |
| | | | | |
| Automobiles–0.7% | |
Piaggio & C SpA | | | 2,094,565 | | | | 5,659,062 | |
Trigano SA | | | 20,270 | | | | 3,130,148 | |
| | | | | | | | |
| | | | 8,789,210 | |
| | | | | |
| Diversified Consumer Services–1.6% | |
Benesse Holdings, Inc. | | | 359,600 | | | | 9,255,712 | |
Fu Shou Yuan International Group Ltd. | | | 5,432,000 | | | | 5,305,735 | |
IDP Education Ltd. | | | 201,160 | | | | 2,769,242 | |
YDUQS Participacoes SA | | | 519,800 | | | | 2,537,032 | |
| | | | | | | | |
| | | | 19,867,721 | |
| | | | | |
| Hotels, Restaurants & Leisure–3.3% | |
Betsson AB(a) | | | 166,040 | | | | 1,272,771 | |
Domino’s Pizza Enterprises Ltd. | | | 41,003 | | | $ | 2,344,429 | |
GVC Holdings PLC(a) | | | 1,111,242 | | | | 13,917,446 | |
Jollibee Foods Corp. | | | 248,400 | | | | 744,676 | |
LeoVegas AB(b) | | | 303,000 | | | | 1,280,850 | |
Melco International Development Ltd. | | | 2,660,000 | | | | 4,687,324 | |
Round One Corp. | | | 246,100 | | | | 1,976,221 | |
Scandic Hotels Group AB(b) | | | 412,620 | | | | 1,237,059 | |
Sushiro Global Holdings Ltd. | | | 472,680 | | | | 12,022,301 | |
| | | | | | | | |
| | | | 39,483,077 | |
| | | | | |
| Household Durables–0.6% | |
Haseko Corp. | | | 220,000 | | | | 2,897,838 | |
Kaufman & Broad SA | | | 66,930 | | | | 2,658,529 | |
Maytronics Ltd. | | | 140,670 | | | | 2,163,288 | |
| | | | | | | | |
| | | | 7,719,655 | |
| | | | | |
| Internet & Direct Marketing Retail–1.0% | |
Dustin Group AB(b) | | | 448,800 | | | | 2,820,104 | |
HelloFresh SE(a) | | | 73,550 | | | | 4,087,456 | |
Moneysupermarket.com Group PLC | | | 637,114 | | | | 2,196,142 | |
zooplus AG(a) | | | 14,620 | | | | 2,718,597 | |
| | | | | | | | |
| | | | 11,822,299 | |
| | | | | |
| Leisure Products–0.9% | |
BRP, Inc. | | | 146,055 | | | | 7,716,548 | |
Games Workshop Group PLC | | | 24,096 | | | | 3,161,416 | |
| | | | | | | | |
| | | | 10,877,964 | |
| | | | | |
| Multiline Retail–0.2% | |
Europris ASA(b) | | | 550,844 | | | | 2,823,997 | |
| | | | | | | | |
| Specialty Retail–1.4% | |
Clas Ohlson AB–Class B(a) | | | 237,435 | | | | 2,412,041 | |
EDION Corp. | | | 258,400 | | | | 2,707,181 | |
Geo Holdings Corp. | | | 175,300 | | | | 2,785,818 | |
Hornbach Holding AG & Co. KGaA | | | 25,090 | | | | 2,929,910 | |
Kohnan Shoji Co., Ltd. | | | 78,000 | | | | 3,038,532 | |
T-Gaia Corp. | | | 136,100 | | | | 2,561,359 | |
| | | | | | | | |
| | | | 16,434,841 | |
| | | | | |
| Textiles, Apparel & Luxury Goods–2.1% | |
Asics Corp. | | | 633,000 | | | | 8,850,365 | |
Chargeurs SA | | | 97,010 | | | | 1,902,541 | |
China Lilang Ltd. | | | 2,159,000 | | | | 1,187,507 | |
Handsome Co., Ltd. | | | 85,666 | | | | 2,209,501 | |
JNBY Design Ltd.(b) | | | 1,365,500 | | | | 1,326,544 | |
Pandora A/S | | | 131,716 | | | | 9,501,697 | |
| | | | | | | | |
| | | | 24,978,155 | |
| | | | | |
| | | | 164,617,280 | |
| | | | | |
| | | | | | | | |
| | | |
| Financials–10.4% | | | | | | | | |
| Banks–3.7% | |
Bank BTPN Syariah Tbk PT | | | 8,157,000 | | | | 1,806,294 | |
Bank of Ireland Group PLC(a) | | | 2,484,158 | | | | 4,605,529 | |
Bank Pembangunan Daerah Jawa Timur Tbk PT | | | 53,919,500 | | | | 1,851,697 | |
BAWAG Group AG(a)(b) | | | 79,700 | | | | 2,881,522 | |
Close Brothers Group PLC | | | 207,110 | | | | 2,724,231 | |
| | | | | | | | |
| | | |
| Company | | Shares | | | U.S. $ Value | |
Hokuhoku Financial Group, Inc. | | | 147,300 | | | $ | 1,482,711 | |
Miyazaki Bank Ltd. (The) | | | 88,800 | | | | 2,030,447 | |
NIBC Holding NV(a)(b) | | | 262,982 | | | | 2,282,756 | |
Norwegian Finans Holding ASA(a) | | | 1,407,708 | | | | 10,252,976 | |
Shikoku Bank Ltd. (The) | | | 153,200 | | | | 1,084,413 | |
Spar Nord Bank A/S(a) | | | 282,484 | | | | 2,109,907 | |
SpareBank 1 Nord Norge | | | 358,434 | | | | 2,480,533 | |
SpareBank 1 SMN | | | 282,022 | | | | 2,549,361 | |
TCS Group Holding PLC (GDR)(b) | | | 106,980 | | | | 2,829,621 | |
TOMONY Holdings, Inc. | | | 312,200 | | | | 1,012,916 | |
Towa Bank Ltd. (The) | | | 383,900 | | | | 2,639,939 | |
| | | | | | | | |
| | | | 44,624,853 | |
| | | | | |
| Capital Markets–3.5% | |
Ashmore Group PLC | | | 437,204 | | | | 2,017,890 | |
IG Group Holdings PLC | | | 949,484 | | | | 9,698,923 | |
Intermediate Capital Group PLC | | | 549,366 | | | | 8,449,170 | |
Man Group PLC/Jersey | | | 1,582,756 | | | | 2,346,265 | |
Perpetual Ltd. | | | 132,770 | | | | 2,679,787 | |
Pinnacle Investment Management Group Ltd. | | | 744,801 | | | | 2,740,332 | |
Quilter PLC(b) | | | 2,884,231 | | | | 4,769,180 | |
TP ICAP PLC | | | 2,265,543 | | | | 6,667,888 | |
Warsaw Stock Exchange | | | 232,201 | | | | 2,723,992 | |
| | | | | | | | |
| | | | 42,093,427 | |
| | | | | |
| Consumer Finance–0.8% | |
Jaccs Co., Ltd. | | | 159,000 | | | | 2,583,357 | |
Muthoot Finance Ltd. | | | 355,803 | | | | 5,472,093 | |
Sun Hung Kai & Co., Ltd. | | | 4,642,000 | | | | 1,817,497 | |
| | | | | | | | |
| | | | 9,872,947 | |
| | | | | |
| Diversified Financial Services–0.8% | |
Cerved Information Solutions SpA(a) | | | 885,263 | | | | 6,335,476 | |
Hypoport SE(a) | | | 5,343 | | | | 3,346,915 | |
| | | | | | | | |
| | | | 9,682,391 | |
| | | | | |
| Insurance–1.5% | |
ASR Nederland NV | | | 239,887 | | | | 8,068,189 | |
Beazley PLC | | | 848,256 | | | | 3,358,258 | |
Panin Financial Tbk PT(a) | | | 101,619,000 | | | | 1,256,515 | |
Topdanmark A/S | | | 64,860 | | | | 3,139,541 | |
Vienna Insurance Group AG Wiener Versicherung Gruppe | | | 109,930 | | | | 2,446,283 | |
| | | | | | | | |
| | | | 18,268,786 | |
| | | | | |
| Thrifts & Mortgage Finance–0.1% | |
Genworth MI Canada, Inc. | | | 68,158 | | | | 1,767,486 | |
| | | | | | | | |
| | | | 126,309,890 | |
| | | | | |
| | | | | | | | |
| | | |
| Consumer Staples–9.0% | | | | | | | | |
| Beverages–0.9% | |
Royal Unibrew A/S | | | 107,325 | | | | 11,062,109 | |
| | | | | | | | |
| Food & Staples Retailing–0.8% | |
Arcs Co., Ltd. | | | 108,100 | | | | 2,775,267 | |
Axfood AB | | | 117,318 | | | | 2,687,363 | |
cocokara fine, Inc. | | | 34,600 | | | | 2,239,257 | |
Rami Levy Chain Stores Hashikma Marketing 206 Ltd. | | | 18,611 | | | $ | 1,280,390 | |
| | | | | | | | |
| | | | 8,982,277 | |
| | | | | |
| Food Products–5.8% | |
Astral Foods Ltd. | | | 176,658 | | | | 1,385,545 | |
Austevoll Seafood ASA | | | 719,364 | | | | 5,991,546 | |
Bega Cheese Ltd. | | | 110,230 | | | | 402,838 | |
Calbee, Inc. | | | 289,100 | | | | 9,522,362 | |
Feed One Co., Ltd. | | | 235,040 | | | | 2,081,958 | |
Hokuto Corp. | | | 107,500 | | | | 2,292,140 | |
Maeil Dairies Co., Ltd. | | | 31,748 | | | | 1,836,346 | |
Morinaga Milk Industry Co., Ltd. | | | 208,524 | | | | 10,995,370 | |
Nichirei Corp. | | | 453,739 | | | | 11,999,381 | |
Orion Corp./Republic of Korea | | | 84,145 | | | | 9,428,577 | |
Showa Sangyo Co., Ltd. | | | 68,700 | | | | 2,290,505 | |
Uni-President China Holdings Ltd. | | | 10,262,000 | | | | 9,411,324 | |
Viscofan SA | | | 43,190 | | | | 2,881,308 | |
| | | | | | | | |
| | | | 70,519,200 | |
| | | | | |
| Personal Products–1.3% | |
Cosmax, Inc. | | | 63,839 | | | | 6,315,789 | |
TCI Co., Ltd. | | | 1,002,000 | | | | 9,360,503 | |
| | | | | | | | |
| | | | 15,676,292 | |
| | | | | |
| Tobacco–0.2% | |
Scandinavian Tobacco Group A/S(b) | | | 172,542 | | | | 2,555,374 | |
| | | | | | | | |
| | | | 108,795,252 | |
| | | | | |
| | | | | | | | |
| | | |
| Materials–7.6% | | | | | | | | |
| Chemicals–1.5% | | | | | | | | |
China General Plastics Corp. | | | 1,491,642 | | | | 1,008,567 | |
Dongyue Group Ltd. | | | 1,991,000 | | | | 769,053 | |
Kemira Oyj | | | 200,090 | | | | 2,549,020 | |
Nantex Industry Co., Ltd. | | | 1,489,597 | | | | 2,575,688 | |
Tosoh Corp. | | | 536,200 | | | | 8,705,744 | |
Ube Industries Ltd. | | | 137,300 | | | | 2,318,619 | |
| | | | | | | | |
| | | | 17,926,691 | |
| | | | | |
| Construction Materials–0.5% | |
Guangdong Tapai Group Co., Ltd.–Class A | | | 2,643,425 | | | | 5,411,497 | |
| | | | | | | | |
| Containers & Packaging–0.7% | |
Cascades, Inc. | | | 220,270 | | | | 2,785,736 | |
Orora Ltd. | | | 3,411,378 | | | | 5,890,253 | |
| | | | | | | | |
| | | | 8,675,989 | |
| | | | | |
| Metals & Mining–4.8% | |
APL Apollo Tubes Ltd. | | | 79,658 | | | | 3,099,633 | |
BlueScope Steel Ltd. | | | 890,187 | | | | 8,202,011 | |
Central Asia Metals PLC | | | 597,182 | | | | 1,240,323 | |
Labrador Iron Ore Royalty Corp. | | | 132,064 | | | | 2,547,951 | |
Lundin Mining Corp. | | | 1,215,836 | | | | 6,784,320 | |
Mineral Resources Ltd. | | | 150,473 | | | | 2,713,994 | |
Mitsui Mining & Smelting Co., Ltd. | | | 105,600 | | | | 2,567,719 | |
Northern Star Resources Ltd. | | | 679,798 | | | | 6,736,145 | |
OZ Minerals Ltd. | | | 1,292,012 | | | | 13,183,384 | |
Regis Resources Ltd. | | | 2,114,474 | | | | 7,686,605 | |
Schedule of Investments (continued)
| | | | | | | | |
| | | |
| Company | | Shares | | | U.S. $ Value | |
Sims Ltd. | | | 439,538 | | | $ | 2,419,197 | |
Torex Gold Resources, Inc.(a) | | | 103,240 | | | | 1,459,960 | |
| | | | | | | | |
| | | | 58,641,242 | |
| | | | | |
| Paper & Forest Products–0.1% | |
Nippon Paper Industries Co., Ltd. | | | 80,500 | | | | 999,828 | |
| | | | | | | | |
| | | | 91,655,247 | |
| | | | | |
| | | | | | | | |
| | | |
| Health Care–7.6% | | | | | | | | |
| Biotechnology–1.3% | | | | | | | | |
BioGaia AB–Class B | | | 42,547 | | | | 2,752,953 | |
Clinuvel Pharmaceuticals Ltd. | | | 149,790 | | | | 2,515,624 | |
Hugel, Inc.(a) | | | 68,073 | | | | 10,608,872 | |
| | | | | | | | |
| | | | 15,877,449 | |
| | | | | |
| Health Care Equipment & Supplies–2.6% | |
Ansell Ltd. | | | 530,990 | | | | 14,125,701 | |
ConvaTec Group PLC(b) | | | 3,149,226 | | | | 7,254,870 | |
Getinge AB–Class B | | | 442,558 | | | | 9,629,559 | |
| | | | | | | | |
| | | | 31,010,130 | |
| | | | | |
| Health Care Providers & Services–1.3% | |
BML, Inc. | | | 195,500 | | | | 5,906,859 | |
Dr. Lal PathLabs Ltd.(b) | | | 105,654 | | | | 2,698,774 | |
Galenica AG(b) | | | 37,315 | | | | 2,594,764 | |
Metropolis Healthcare Ltd.(a)(b) | | | 109,265 | | | | 2,642,442 | |
Vital KSK Holdings, Inc. | | | 201,600 | | | | 2,087,117 | |
| | | | | | | | |
| | | | 15,929,956 | |
| | | | | |
| Life Sciences Tools & Services–1.3% | |
Biotage AB(a) | | | 54,460 | | | | 1,078,151 | |
Gerresheimer AG | | | 131,510 | | | | 14,717,327 | |
| | | | | | | | |
| | | | 15,795,478 | |
| | | | | |
| Pharmaceuticals–1.1% | |
Chong Kun Dang Pharmaceutical Corp. | | | 18,336 | | | | 2,595,764 | |
Dermapharm Holding SE | | | 52,010 | | | | 2,780,648 | |
Faes Farma SA | | | 490,925 | | | | 1,975,897 | |
Huons Co., Ltd. | | | 30,642 | | | | 1,636,960 | |
Mega Lifesciences PCL | | | 2,201,900 | | | | 2,414,707 | |
Samjin Pharmaceutical Co., Ltd. | | | 58,851 | | | | 1,448,009 | |
| | | | | | | | |
| | | | 12,851,985 | |
| | | | | |
| | | | 91,464,998 | |
| | | | | |
| | | | | | | | |
| | | |
| Communication Services–7.4% | | | | | | | | |
| Diversified Telecommunication Services–0.8% | |
Masmovil Ibercom SA(a) | | | 356,562 | | | | 9,397,702 | |
| | | | | | | | |
| Entertainment–4.2% | |
Akatsuki, Inc. | | | 175,400 | | | | 7,745,472 | |
Capcom Co., Ltd. | | | 407,400 | | | | 22,736,402 | |
International Games System Co., Ltd. | | | 100,000 | | | | 2,676,146 | |
Soft-World International Corp. | | | 502,000 | | | | 1,487,020 | |
Toei Animation Co., Ltd. | | | 244,358 | | | | 15,944,933 | |
| | | | | | | | |
| | | | 50,589,973 | |
| | | | | |
| Interactive Media & Services–1.0% | |
Addcn Technology Co., Ltd. | | | 118,000 | | | $ | 833,919 | |
Dip Corp. | | | 353,300 | | | | 7,278,042 | |
Mixi, Inc. | | | 111,400 | | | | 3,003,603 | |
New Work SE | | | 4,720 | | | | 1,441,597 | |
| | | | | | | | |
| | | | 12,557,161 | |
| | | | | |
| Media–1.4% | |
APG SGA SA(a) | | | 12,429 | | | | 2,502,270 | |
Cogeco Communications, Inc. | | | 124,480 | | | | 10,207,631 | |
Corus Entertainment, Inc.–Class B | | | 767,400 | | | | 1,665,567 | |
Mediaset Espana Comunicacion SA(a) | | | 403,433 | | | | 1,494,118 | |
Rightmove PLC | | | 177,620 | | | | 1,435,945 | |
| | | | | | | | |
| | | | 17,305,531 | |
| | | | | |
| | | | 89,850,367 | |
| | | | | |
| | | | | | | | |
| | | |
| Real Estate–5.9% | | | | | | | | |
| Equity Real Estate Investment Trusts (REITs)–1.9% | |
AEON REIT Investment Corp. | | | 1,569 | | | | 1,807,269 | |
Charter Hall Retail REIT | | | 2,453,088 | | | | 5,937,633 | |
H&R Real Estate Investment Trust | | | 202,670 | | | | 1,471,833 | |
Heiwa Real Estate REIT, Inc. | | | 1,599 | | | | 1,766,674 | |
Immobiliare Grande Distribuzione SIIQ SpA | | | 388,706 | | | | 1,352,046 | |
Kenedix Residential Next Investment Corp. | | | 955 | | | | 1,688,681 | |
Killam Apartment Real Estate Investment Trust | | | 551,180 | | | | 7,185,975 | |
Precinct Properties New Zealand Ltd. | | | 1,495,090 | | | | 1,675,861 | |
| | | | | | | | |
| | | | 22,885,972 | |
| | | | | |
| Real Estate Management & Development–4.0% | |
BR Properties SA | | | 958,900 | | | | 1,536,726 | |
CA Immobilien Anlagen AG | | | 351,844 | | | | 10,401,214 | |
Dongwon Development Co., Ltd. | | | 757,369 | | | | 2,575,597 | |
Entra ASA(b) | | | 510,261 | | | | 7,170,668 | |
Farglory Land Development Co., Ltd. | | | 66,000 | | | | 103,574 | |
Grand City Properties SA | | | 417,679 | | | | 10,086,523 | |
Midea Real Estate Holding Ltd.(b) | | | 1,163,600 | | | | 2,777,497 | |
Real Matters, Inc.(a) | | | 156,210 | | | | 3,044,309 | |
Road King Infrastructure Ltd. | | | 1,490,000 | | | | 1,780,562 | |
Selvaag Bolig ASA | | | 439,995 | | | | 2,439,925 | |
Times China Holdings Ltd. | | | 3,235,000 | | | | 4,511,766 | |
Watkin Jones PLC | | | 1,271,471 | | | | 2,316,586 | |
| | | | | | | | |
| | | | 48,744,947 | |
| | | | | |
| | | | 71,630,919 | |
| | | | | |
| | | | | | | | |
| | | |
| Utilities–4.2% | | | | | | | | |
| Electric Utilities–2.7% | | | | | | | | |
Contact Energy Ltd. | | | 1,323,379 | | | | 5,856,130 | |
Enerjisa Enerji AS(b) | | | 2,268,890 | | | | 2,620,634 | |
Fjordkraft Holding ASA(b) | | | 1,244,175 | | | | 12,080,290 | |
Genesis Energy Ltd. | | | 3,526,193 | | | | 6,872,535 | |
Light SA(a) | | | 1,883,900 | | | | 4,864,145 | |
| | | | | | | | |
| | | | 32,293,734 | |
| | | | | |
| | | | | | | | |
| | | |
| Company | | Shares | | | U.S. $ Value | |
| Gas Utilities–0.4% | |
Aygaz AS | | | 1,320,130 | | | $ | 1,933,336 | |
Shizuoka Gas Co., Ltd. | | | 297,700 | | | | 2,645,163 | |
| | | | | | | | |
| | | | 4,578,499 | |
| | | | | |
| Independent Power and Renewable Electricity Producers–0.9% | |
Capital Power Corp. | | | 428,651 | | | | 9,461,194 | |
Malakoff Corp. Bhd | | | 7,773,900 | | | | 1,772,279 | |
| | | | | | | | |
| | | | 11,233,473 | |
| | | | | |
| Multi-Utilities–0.2% | |
Hera SpA | | | 700,239 | | | | 2,581,993 | |
| | | | | | | | |
| | | | 50,687,699 | |
| | | | | |
| | | | | | | | |
| | | |
| Energy–1.6% | | | | | | | | |
| Oil, Gas & Consumable Fuels–1.6% | | | | | | | | |
Beach Energy Ltd. | | | 4,280,692 | | | | 4,105,897 | |
Indo Tambangraya Megah Tbk PT | | | 3,710,000 | | | | 2,043,384 | |
Itochu Enex Co., Ltd. | | | 293,300 | | | | 2,708,906 | |
Motor Oil Hellas Corinth Refineries SA | | | 370,342 | | | | 4,361,799 | |
New Hope Corp., Ltd. | | | 1,453,120 | | | | 1,354,331 | |
Parex Resources, Inc.(a) | | | 188,992 | | | | 1,991,332 | |
Pilipinas Shell Petroleum Corp.(a) | | | 1,775,400 | | | | 593,357 | |
Saras SpA(a) | | | 2,102,169 | | | | 1,098,077 | |
Whitehaven Coal Ltd. | | | 2,093,800 | | | | 1,585,517 | |
| | | | | | | | |
| | | | 19,842,600 | |
| | | | | |
Total Common Stocks
(cost $1,090,750,347) | | | | 1,187,683,544 | |
| | | | | |
| | | | | | | | |
| | |
| SHORT-TERM INVESTMENTS–1.1% | | | | | |
| Investment Companies–1.1% | |
AB Fixed Income Shares, Inc.–Government Money Market Portfolio–Class AB, 0.05%(c)(d)(e)
(cost $12,832,082) | | | 12,832,082 | | | | 12,832,082 | |
| | | | | | | | |
Total Investments—99.2%
(cost $1,103,582,429) | | | | 1,200,515,626 | |
| | |
Other assets less liabilities—0.8% | | | | | | | 9,819,293 | |
| | | | | | | | |
| | | | | | | | |
| Net Assets—100.0% | | | | | | $ | 1,210,334,919 | |
| | | | | | | | |
| | | | | | | | | | | | | | | | | | | | |
| | | | |
| FORWARD CURRENCY EXCHANGE CONTRACTS (see Note 3) | | | | | | | | | | | | |
| Counterparty | | Contracts to
Deliver
(000) | | | In Exchange
For
(000) | | | Settlement
Date | | | Unrealized
Appreciation/
(Depreciation) | |
| | | | | | |
Bank of America, NA | | USD | | | 9,969 | | | KRW | | | 11,829,260 | | | | 11/10/2020 | | | $ | 175,610 | |
| | | | | | |
Bank of America, NA | | AUD | | | 24,554 | | | USD | | | 17,946 | | | | 12/11/2020 | | | | 356,215 | |
| | | | | | |
Bank of America, NA | | NOK | | | 69,744 | | | USD | | | 7,487 | | | | 12/11/2020 | | | | 8,153 | |
| | | | | | |
Bank of America, NA | | USD | | | 20,959 | | | CHF | | | 18,961 | | | | 12/11/2020 | | | | (330,429 | ) |
| | | | | | |
Bank of America, NA | | USD | | | 3,886 | | | GBP | | | 2,979 | | | | 12/11/2020 | | | | (40,057 | ) |
| | | | | | |
Bank of America, NA | | USD | | | 10,897 | | | SEK | | | 95,224 | | | | 12/11/2020 | | | | (255,639 | ) |
| | | | | | |
Barclays Bank PLC | | KRW | | | 3,662,398 | | | USD | | | 3,093 | | | | 11/10/2020 | | | | (48,009 | ) |
| | | | | | |
Barclays Bank PLC | | USD | | | 3,191 | | | TWD | | | 93,067 | | | | 11/18/2020 | | | | 43,094 | |
| | | | | | |
Barclays Bank PLC | | AUD | | | 9,719 | | | USD | | | 7,124 | | | | 12/11/2020 | | | | 161,320 | |
| | | | | | |
Barclays Bank PLC | | JPY | | | 469,305 | | | USD | | | 4,415 | | | | 12/11/2020 | | | | (39,018 | ) |
| | | | | | |
Barclays Bank PLC | | USD | | | 4,651 | | | JPY | | | 490,131 | | | | 12/11/2020 | | | | 787 | |
| | | | | | |
Citibank, NA | | USD | | | 6,124 | | | INR | | | 471,541 | | | | 10/15/2020 | | | | 281,735 | |
| | | | | | |
Citibank, NA | | KRW | | | 5,114,728 | | | USD | | | 4,344 | | | | 11/10/2020 | | | | (42,062 | ) |
| | | | | | |
Citibank, NA | | AUD | | | 4,623 | | | USD | | | 3,333 | | | | 12/11/2020 | | | | 20,805 | |
| | | | | | |
Citibank, NA | | CNY | | | 40,267 | | | USD | | | 5,846 | | | | 12/11/2020 | | | | (66,134 | ) |
| | | | | | |
Citibank, NA | | EUR | | | 14,789 | | | USD | | | 17,368 | | | | 12/11/2020 | | | | 1,839 | |
| | | | | | |
Credit Suisse International | | USD | | | 3,121 | | | NOK | | | 28,146 | | | | 12/11/2020 | | | | (102,740 | ) |
| | | | | | |
Credit Suisse International | | USD | | | 3,247 | | | SGD | | | 4,408 | | | | 12/11/2020 | | | | (17,796 | ) |
| | | | | | |
Deutsche Bank AG | | USD | | | 3,752 | | | ILS | | | 12,787 | | | | 12/11/2020 | | | | (15,368 | ) |
| | | | | | |
Goldman Sachs Bank USA | | USD | | | 3,097 | | | KRW | | | 3,671,285 | | | | 11/10/2020 | | | | 51,657 | |
| | | | | | |
Goldman Sachs Bank USA | | USD | | | 3,276 | | | CLP | | | 2,508,873 | | | | 11/13/2020 | | | | (78,699 | ) |
| | | | | | |
Goldman Sachs Bank USA | | TWD | | | 94,266 | | | USD | | | 3,234 | | | | 11/18/2020 | | | | (42,097 | ) |
| | | | | | |
Goldman Sachs Bank USA | | USD | | | 1,978 | | | RUB | | | 152,291 | | | | 11/19/2020 | | | | (26,294 | ) |
| | | | | | |
Goldman Sachs Bank USA | | JPY | | | 877,774 | | | USD | | | 8,279 | | | | 12/11/2020 | | | | (50,902 | ) |
| | | | | | |
Goldman Sachs Bank USA | | USD | | | 14,706 | | | GBP | | | 11,218 | | | | 12/11/2020 | | | | (225,409 | ) |
| | | | | | |
HSBC Bank USA | | USD | | | 4,456 | | | ILS | | | 15,181 | | | | 12/11/2020 | | | | (20,058 | ) |
Schedule of Investments (continued)
| | | | | | | | | | | | | | | | | | | | |
| Counterparty | | Contracts to
Deliver
(000) | | | In Exchange
For
(000) | | | Settlement
Date | | | Unrealized
Appreciation/
(Depreciation) | |
| | | | | | |
HSBC Bank USA | | USD | | | 8,552 | | | SGD | | | 11,663 | | | | 12/11/2020 | | | $ | (7,000 | ) |
| | | | | | |
HSBC Bank USA | | USD | | | 8,645 | | | THB | | | 270,961 | | | | 12/11/2020 | | | | (95,112 | ) |
| | | | | | |
JPMorgan Chase Bank, NA | | JPY | | | 812,794 | | | USD | | | 7,677 | | | | 12/11/2020 | | | | (36,422 | ) |
| | | | | | |
JPMorgan Chase Bank, NA | | USD | | | 3,840 | | | SGD | | | 5,242 | | | | 12/11/2020 | | | | 902 | |
| | | | | | |
Morgan Stanley Capital Services, Inc. | | IDR | | | 33,140,889 | | | USD | | | 2,231 | | | | 10/15/2020 | | | | 2,175 | |
| | | | | | |
Morgan Stanley Capital Services, Inc. | | TWD | | | 618,869 | | | USD | | | 21,277 | | | | 11/18/2020 | | | | (228,204 | ) |
| | | | | | |
Morgan Stanley Capital Services, Inc. | | USD | | | 3,213 | | | TWD | | | 94,964 | | | | 11/18/2020 | | | | 86,828 | |
| | | | | | |
Morgan Stanley Capital Services, Inc. | | EUR | | | 11,059 | | | USD | | | 13,097 | | | | 12/11/2020 | | | | 110,829 | |
| | | | | | |
Morgan Stanley Capital Services, Inc. | | GBP | | | 5,367 | | | USD | | | 6,960 | | | | 12/11/2020 | | | | 32,320 | |
| | | | | | |
Morgan Stanley Capital Services, Inc. | | NZD | | | 7,126 | | | USD | | | 4,770 | | | | 12/11/2020 | | | | 55,726 | |
| | | | | | |
Natwest Markets PLC | | USD | | | 7,485 | | | INR | | | 563,576 | | | | 10/15/2020 | | | | 170,251 | |
| | | | | | |
Natwest Markets PLC | | EUR | | | 14,053 | | | USD | | | 16,707 | | | | 12/11/2020 | | | | 205,783 | |
| | | | | | |
Natwest Markets PLC | | USD | | | 12,028 | | | AUD | | | 16,731 | | | | 12/11/2020 | | | | (42,637 | ) |
| | | | | | |
Natwest Markets PLC | | USD | | | 9,724 | | | CAD | | | 12,798 | | | | 12/11/2020 | | | | (109,950 | ) |
| | | | | | |
Standard Chartered Bank | | CAD | | | 8,107 | | | USD | | | 6,095 | | | | 12/11/2020 | | | | 4,641 | |
| | | | | | |
State Street Bank & Trust Co. | | USD | | | 3,831 | | | TWD | | | 111,696 | | | | 11/18/2020 | | | | 50,433 | |
| | | | | | |
State Street Bank & Trust Co. | | CAD | | | 4,691 | | | USD | | | 3,529 | | | | 12/11/2020 | | | | 5,337 | |
| | | | | | |
State Street Bank & Trust Co. | | NOK | | | 249,235 | | | USD | | | 27,764 | | | | 12/11/2020 | | | | 1,039,323 | |
| | | | | | |
State Street Bank & Trust Co. | | NZD | | | 4,824 | | | USD | | | 3,258 | | | | 12/11/2020 | | | | 66,425 | |
| | | | | | |
State Street Bank & Trust Co. | | USD | | | 4,458 | | | JPY | | | 472,501 | | | | 12/11/2020 | | | | 26,630 | |
| | | | | | |
State Street Bank & Trust Co. | | USD | | | 3,922 | | | MXN | | | 84,320 | | | | 12/11/2020 | | | | (139,086 | ) |
| | | | | | |
State Street Bank & Trust Co. | | USD | | | 3,532 | | | SEK | | | 31,142 | | | | 12/11/2020 | | | | (52,259 | ) |
| | | | | | |
State Street Bank & Trust Co. | | USD | | | 5,914 | | | ZAR | | | 100,039 | | | | 12/11/2020 | | | | 9,276 | |
| | | | | | |
UBS AG | | TWD | | | 89,668 | | | USD | | | 3,097 | | | | 11/18/2020 | | | | (18,898 | ) |
| | | | | | |
UBS AG | | USD | | | 3,622 | | | CHF | | | 3,279 | | | | 12/11/2020 | | | | (54,480 | ) |
| | | | | | |
UBS AG | | USD | | | 2,945 | | | EUR | | | 2,528 | | | | 12/11/2020 | | | | 23,585 | |
| | | | | | |
UBS AG | | USD | | | 11,439 | | | JPY | | | 1,197,241 | | | | 12/11/2020 | | | | (77,043 | ) |
| | | | | | | | | | | | | | | | | | | | |
| |
| | | $ | 729,877 | |
| | | | | | | | | | | | | | | | | | | | |
| (a) | | Non-income producing security. |
| (b) | | Security is exempt from registration under Rule 144A of the Securities Act of 1933. These securities are considered restricted, but liquid and may be resold in transactions exempt from registration, normally to qualified institutional buyers. At September 30, 2020, the aggregate market value of these securities amounted to $87,218,109 or 7.2% of net assets. |
| (c) | | Affiliated investments. |
| (d) | | The rate shown represents the 7-day yield as of period end. |
| (e) | | To obtain a copy of the fund’s shareholder report, please go to the Securities and Exchange Commission’s website at www.sec.gov, or call AB at (800) 227-4618. |
Currency Abbreviations:
AUD—Australian Dollar
CAD—Canadian Dollar
CHF—Swiss Franc
CLP—Chilean Peso
CNY—Chinese Yuan Renminbi
EUR—Euro
GBP—Great British Pound
IDR—Indonesian Rupiah
ILS—Israeli Shekel
INR—Indian Rupee
JPY—Japanese Yen
KRW—South Korean Won
MXN—Mexican Peso
NOK—Norwegian Krone
NZD—New Zealand Dollar
RUB—Russian Ruble
SEK—Swedish Krona
SGD—Singapore Dollar
THB—Thailand Baht
TWD—New Taiwan Dollar
USD—United States Dollar
ZAR—South African Rand
Glossary:
GDR—Global Depositary Receipt
REIT—Real Estate Investment Trust
See notes to financial statements.
Schedule of Investments
Bernstein Fund, Inc.
Schedule of Investments
International Strategic Equities Portfolio
September 30, 2020
| | | | | | | | |
| | |
| Company | | Shares | | | U.S. $ Value | |
|
| COMMON STOCKS–97.8% | |
|
| Information Technology–17.2% | |
| Electronic Equipment, Instruments & Components–0.6% | |
Simplo Technology Co., Ltd. | | | 2,161,000 | | | $ | 22,438,932 | |
| | | | | | | | |
| IT Services–3.8% | |
Capgemini SE | | | 890,940 | | | | 114,303,461 | |
Otsuka Corp. | | | 796,900 | | | | 40,722,668 | |
| | | | | | | | |
| | | | 155,026,129 | |
| | | | | |
| Semiconductors & Semiconductor Equipment–5.2% | |
ASML Holding NV | | | 192,030 | | | | 70,930,670 | |
MediaTek, Inc. | | | 1,504,000 | | | | 31,868,191 | |
SCREEN Holdings Co., Ltd. | | | 358,100 | | | | 19,116,418 | |
Taiwan Semiconductor Manufacturing Co., Ltd. | | | 5,743,000 | | | | 86,398,073 | |
| | | | | | | | |
| | | | 208,313,352 | |
| | | | | |
| Software–6.4% | |
Avast PLC(a) | | | 4,330,940 | | | | 29,403,169 | |
Check Point Software Technologies Ltd.(b) | | | 427,210 | | | | 51,410,451 | |
Constellation Software, Inc./Canada | | | 83,900 | | | | 93,230,413 | |
Nice Ltd.(b) | | | 189,970 | | | | 43,070,842 | |
Oracle Corp. Japan | | | 389,000 | | | | 42,002,974 | |
| | | | | | | | |
| | | | 259,117,849 | |
| | | | | |
| Technology Hardware, Storage & Peripherals–1.2% | |
Samsung Electronics Co., Ltd. | | | 1,010,240 | | | | 50,152,483 | |
| | | | | | | | |
| | | | 695,048,745 | |
| | | | | |
| | | | | | | | |
| | |
| Consumer Discretionary–13.4% | | | | | |
| Auto Components–0.3% | | | | | |
Faurecia SE(b) | | | 256,020 | | | | 11,035,586 | |
| | | | | | | | |
| Automobiles–4.6% | |
Guangzhou Automobile Group Co., Ltd.–Class H | | | 34,276,000 | | | | 28,753,730 | |
Hyundai Motor Co. | | | 65,770 | | | | 10,018,093 | |
Kia Motors Corp. | | | 1,605,540 | | | | 64,385,247 | |
Peugeot SA(b) | | | 4,559,826 | | | | 82,689,913 | |
| | | | | | | | |
| | | | 185,846,983 | |
| | | | | |
| Diversified Consumer Services–1.6% | |
New Oriental Education & Technology Group, Inc. (Sponsored ADR)(b) | | | 433,770 | | | | 64,848,615 | |
| | | | | | | | |
| Hotels, Restaurants & Leisure–1.2% | |
GVC Holdings PLC(b) | | | 1,919,250 | | | | 24,037,121 | |
OPAP SA | | | 2,593,340 | | | | 24,592,388 | |
| | | | | | | | |
| | | | 48,629,509 | |
| | | | | |
| Internet & Direct Marketing Retail–4.5% | |
Alibaba Group Holding Ltd.(b) | | | 4,928,560 | | | | 180,932,887 | |
| | | | | | | | |
| Multiline Retail–1.2% | |
B&M European Value Retail SA | | | 8,008,550 | | | | 51,056,046 | |
| | | | | | | | |
| | | | 542,349,626 | |
| | | | | |
| | | | | | | | |
| | |
| Consumer Staples–12.6% | | | | | |
| Beverages–1.3% | | | | | |
Asahi Group Holdings Ltd. | | | 792,300 | | | $ | 27,613,730 | |
Wuliangye Yibin Co., Ltd.–Class A | | | 758,108 | | | | 24,716,029 | |
| | | | | | | | |
| | | | 52,329,759 | |
| | | | | |
| Food & Staples Retailing–4.3% | |
Coles Group Ltd. | | | 3,299,559 | | | | 40,197,737 | |
Dino Polska SA(a)(b) | | | 350,340 | | | | 20,608,983 | |
Koninklijke Ahold Delhaize NV | | | 2,959,470 | | | | 87,475,738 | |
X5 Retail Group NV (GDR)(a) | | | 651,240 | | | | 24,095,880 | |
| | | | | | | | |
| | | | 172,378,338 | |
| | | | | |
| Food Products–4.9% | |
Calbee, Inc. | | | 1,156,100 | | | | 38,079,566 | |
Morinaga & Co., Ltd./Japan | | | 608,400 | | | | 24,006,732 | |
Nestle SA | | | 1,154,530 | | | | 137,402,889 | |
| | | | | | | | |
| | | | 199,489,187 | |
| | | | | |
| Tobacco–2.1% | |
British American Tobacco PLC | | | 513,600 | | | | 18,423,487 | |
Swedish Match AB | | | 792,320 | | | | 64,785,362 | |
| | | | | | | | |
| | | | 83,208,849 | |
| | | | | |
| | | | 507,406,133 | |
| | | | | |
| | | | | | | | |
| | |
| Financials–10.5% | | | | | |
| Banks–4.3% | | | | | |
Bank Hapoalim BM | | | 2,167,800 | | | | 11,582,462 | |
Erste Group Bank AG(b) | | | 1,549,630 | | | | 32,449,866 | |
Hana Financial Group, Inc. | | | 1,783,650 | | | | 42,848,733 | |
Jyske Bank A/S(b) | | | 441,436 | | | | 12,404,067 | |
KB Financial Group, Inc. | | | 812,360 | | | | 26,157,979 | |
KBC Group NV | | | 411,090 | | | | 20,614,539 | |
Mediobanca Banca di Credito Finanziario SpA | | | 3,655,090 | | | | 28,640,981 | |
| | | | | | | | |
| | | | 174,698,627 | |
| | | | | |
| Capital Markets–3.8% | |
Credit Suisse Group AG | | | 1,019,870 | | | | 10,181,053 | |
Partners Group Holding AG | | | 100,150 | | | | 92,118,376 | |
Singapore Exchange Ltd. | | | 7,615,800 | | | | 51,366,009 | |
| | | | | | | | |
| | | | 153,665,438 | |
| | | | | |
| Consumer Finance–0.0% | |
Isracard Ltd. | | | 1 | | | | 2 | |
| | | | | | | | |
| Diversified Financial Services–0.3% | |
Fubon Financial Holding Co., Ltd. | | | 6,942,000 | | | | 10,101,403 | |
| | | | | | | | |
| Insurance–2.1% | |
ASR Nederland NV | | | 1,248,100 | | | | 41,977,710 | |
Schedule of Investments (continued)
| | | | | | | | |
| | | |
| Company | | Shares | | | U.S. $ Value | |
NN Group NV | | | 1,106,570 | | | $ | 41,478,349 | |
| | | | | | | | |
| | | | 83,456,059 | |
| | | | | |
| | | | 421,921,529 | |
| | | | | |
| | | | | | | | |
| | |
| Health Care–10.0% | | | | | |
| Biotechnology–1.0% | | | | | |
Genmab A/S(b) | | | 108,710 | | | | 39,451,458 | |
| | | | | | | | |
| Health Care Equipment & Supplies–2.3% | |
ConvaTec Group PLC(a) | | | 6,158,811 | | | | 14,188,048 | |
Getinge AB–Class B | | | 1,341,720 | | | | 29,194,303 | |
Koninklijke Philips NV(b) | | | 1,040,894 | | | | 49,150,088 | |
| | | | | | | | |
| | | | 92,532,439 | |
| | | | | |
| Pharmaceuticals–6.7% | |
Astellas Pharma, Inc. | | | 1,333,000 | | | | 19,870,492 | |
Novo Nordisk A/S–Class B | | | 1,270,260 | | | | 88,009,430 | |
Roche Holding AG | | | 428,120 | | | | 146,648,463 | |
Santen Pharmaceutical Co., Ltd. | | | 874,600 | | | | 17,881,959 | |
| | | | | | | | |
| | | | 272,410,344 | |
| | | | | |
| | | | 404,394,241 | |
| | | | | |
| | | | | | | | |
| | |
| Communication Services–9.9% | | | | | |
| Diversified Telecommunication Services–2.0% | | | | | |
Nippon Telegraph & Telephone Corp. | | | 3,893,000 | | | | 79,482,106 | |
| | | | | | | | |
| Entertainment–1.9% | |
NCSoft Corp. | | | 61,460 | | | | 42,354,120 | |
Nintendo Co., Ltd. | | | 63,300 | | | | 35,871,546 | |
| | | | | | | | |
| | | | 78,225,666 | |
| | | | | |
| Interactive Media & Services–5.4% | |
Auto Trader Group PLC | | | 6,138,970 | | | | 44,571,387 | |
Kakaku.com, Inc. | | | 1,747,500 | | | | 46,070,887 | |
Tencent Holdings Ltd. | | | 1,237,000 | | | | 83,551,149 | |
Z Holdings Corp. | | | 6,680,900 | | | | 44,624,548 | |
| | | | | | | | |
| | | | 218,817,971 | |
| | | | | |
| Wireless Telecommunication Services–0.6% | |
China Mobile Ltd. | | | 3,612,500 | | | | 23,189,660 | |
| | | | | | | | |
| | | | 399,715,403 | |
| | | | | |
| | | | | | | | |
| | |
| Industrials–8.2% | | | | | |
| Aerospace & Defense–0.9% | | | | | |
Saab AB–Class B(b) | | | 1,253,740 | | | | 36,863,153 | |
| | | | | | | | |
| Electrical Equipment–1.6% | |
Schneider Electric SE | | | 516,020 | | | | 64,140,710 | |
| | | | | | | | |
| Machinery–1.7% | |
Weichai Power Co., Ltd.–Class A | | | 13,473,984 | | | | 29,987,330 | |
Weichai Power Co., Ltd.–Class H | | | 4,660,000 | | | | 9,429,289 | |
Zoomlion Heavy Industry Science and Technology Co., Ltd.–Class H | | | 30,156,600 | | | | 29,136,761 | |
| | | | | | | | |
| | | | 68,553,380 | |
| | | | | |
| Professional Services–2.8% | |
Recruit Holdings Co., Ltd. | | | 1,180,300 | | | $ | 46,876,025 | |
RELX PLC | | | 1,534,720 | | | | 34,166,292 | |
Wolters Kluwer NV | | | 373,140 | | | | 31,829,750 | |
| | | | | | | | |
| | | | 112,872,067 | |
| | | | | | | | |
| Road & Rail–1.2% | |
Aurizon Holdings Ltd. | | | 8,949,450 | | | | 27,531,801 | |
East Japan Railway Co. | | | 345,200 | | | | 21,229,355 | |
| | | | | | | | |
| | | | 48,761,156 | |
| | | | | |
| | | | 331,190,466 | |
| | | | | |
| | | | | | | | |
| | |
| Materials–6.8% | | | | | |
| Chemicals–2.7% | | | | | |
Akzo Nobel NV | | | 435,770 | | | | 44,043,452 | |
Chr Hansen Holding A/S | | | 356,930 | | | | 39,621,361 | |
Tosoh Corp. | | | 1,547,200 | | | | 25,120,340 | |
| | | | | | | | |
| | | | 108,785,153 | |
| | | | | |
| Construction Materials–2.0% | |
Anhui Conch Cement Co., Ltd.–Class H | | | 3,534,500 | | | | 24,480,961 | |
China Resources Cement Holdings Ltd. | | | 23,284,000 | | | | 32,009,696 | |
Huaxin Cement Co., Ltd. | | | 7,182,749 | | | | 26,670,854 | |
| | | | | | | | |
| | | | 83,161,511 | |
| | | | | |
| Metals & Mining–2.1% | |
Evolution Mining Ltd. | | | 13,969,390 | | | | 58,356,180 | |
Newcrest Mining Ltd. | | | 1,097,910 | | | | 24,896,099 | |
| | | | | | | | |
| | | | 83,252,279 | |
| | | | | |
| | | | 275,198,943 | |
| | | | | |
| | | | | | | | |
| | |
| Utilities–4.2% | | | | | |
| Electric Utilities–3.1% | | | | | |
Cia de Transmissao de Energia Eletrica Paulista (Preference Shares)(b) | | | 5,863,900 | | | | 22,752,254 | |
EDP–Energias de Portugal SA | | | 14,500,740 | | | | 71,299,134 | |
Enel SpA | | | 3,311,050 | | | | 28,726,361 | |
| | | | | | | | |
| | | | 122,777,749 | |
| | | | | |
| Independent Power and Renewable Electricity Producers–0.5% | |
China Yangtze Power Co., Ltd.–Class A | | | 7,392,518 | | | | 20,823,703 | |
| | | | | | | | |
| Multi-Utilities–0.6% | |
RWE AG | | | 653,510 | | | | 24,473,524 | |
| | | | | | | | |
| | | | 168,074,976 | |
| | | | | |
| | | | | | | | |
| | |
| Energy–2.7% | | | | | |
| Oil, Gas & Consumable Fuels–2.7% | | | | | |
Beach Energy Ltd. | | | 25,819,011 | | | | 24,764,733 | |
ENEOS Holdings, Inc. | | | 6,837,900 | | | | 24,396,720 | |
LUKOIL PJSC (Sponsored ADR) | | | 320,920 | | | | 18,424,017 | |
Repsol SA | | | 3,299,005 | | | | 22,286,795 | |
Royal Dutch Shell PLC–Class B | | | 1,459,100 | | | | 17,694,573 | |
| | | | | | | | |
| | | | 107,566,838 | |
| | | | | |
| | | | | | | | |
| | | |
| Company | | Shares | | | U.S. $ Value | |
| |
| Real Estate–2.3% | | | | | |
| Equity Real Estate Investment Trusts (REITs)–1.7% | | | | | |
Nippon Building Fund, Inc. | | | 2,717 | | | $ | 15,378,165 | |
Vicinity Centres | | | 53,248,966 | | | | 53,174,632 | |
| | | | | | | | |
| | | | 68,552,797 | |
| | | | | | | | |
| Real Estate Management & Development–0.6% | |
Aroundtown SA(b) | | | 2,519,911 | | | | 12,649,574 | |
UOL Group Ltd. | | | 2,031,965 | | | | 9,984,411 | |
| | | | | | | | |
| | | | | | | 22,633,985 | |
| | | | | | | | |
| | | | | | | 91,186,782 | |
| | | | | | | | |
Total Common Stocks
(cost $3,479,329,924) | | | | | | | 3,944,053,682 | |
| | | | | | | | |
|
| SHORT-TERM INVESTMENTS–1.5% | |
| Investment Companies–1.5% | |
AB Fixed Income Shares, Inc.–Government Money Market Portfolio–Class AB, 0.05%(c)(d)(e)
(cost $62,019,823) | | | 62,019,823 | | | $ | 62,019,823 | |
| | | | | | | | |
Total Investments—99.3%
(cost $3,541,349,747) | | | | 4,006,073,505 | |
| | |
Other assets less liabilities—0.7% | | | | | | | 26,246,067 | |
| | | | | | | | |
| | | | | | | | |
| Net Assets—100.0% | | | | | | $ | 4,032,319,572 | |
| | | | | | | | |
| | | | | | | | | | | | | | | | | | | | |
| |
| FORWARD CURRENCY EXCHANGE CONTRACTS (see Note 3) | |
| Counterparty | | Contracts to
Deliver
(000) | | | In Exchange
For
(000) | | | Settlement
Date | | | Unrealized
Appreciation/
(Depreciation) | |
| | | | | | |
Australia and New Zealand Banking Group Ltd. | | USD | | | 15,961 | | | JPY | | | 1,685,466 | | | | 10/08/2020 | | | $ | 21,021 | |
| | | | | | |
Australia and New Zealand Banking Group Ltd. | | USD | | | 5,254 | | | EUR | | | 4,437 | | | | 10/15/2020 | | | | (50,153 | ) |
| | | | | | |
Australia and New Zealand Banking Group Ltd. | | USD | | | 8,078 | | | CNY | | | 55,351 | | | | 10/21/2020 | | | | 79,679 | |
| | | | | | |
Bank of America, NA | | JPY | | | 1,332,153 | | | USD | | | 12,592 | | | | 10/08/2020 | | | | (40,080 | ) |
| | | | | | |
Bank of America, NA | | USD | | | 59,544 | | | EUR | | | 50,360 | | | | 10/15/2020 | | | | (483,515 | ) |
| | | | | | |
Bank of America, NA | | PLN | | | 51,018 | | | USD | | | 13,258 | | | | 10/22/2020 | | | | 59,141 | |
| | | | | | |
Bank of America, NA | | USD | | | 4,965 | | | SGD | | | 6,728 | | | | 10/27/2020 | | | | (36,356 | ) |
| | | | | | |
Bank of America, NA | | KRW | | | 66,948,004 | | | USD | | | 56,430 | | | | 11/10/2020 | | | | (986,357 | ) |
| | | | | | |
Bank of America, NA | | ILS | | | 28,020 | | | USD | | | 8,243 | | | | 11/12/2020 | | | | 59,472 | |
| | | | | | |
Bank of America, NA | | TWD | | | 836,053 | | | USD | | | 28,667 | | | | 11/18/2020 | | | | (385,760 | ) |
| | | | | | |
Barclays Bank PLC | | JPY | | | 1,087,981 | | | USD | | | 10,257 | | | | 10/08/2020 | | | | (60,013 | ) |
| | | | | | |
BNP Paribas SA | | BRL | | | 223,286 | | | USD | | | 40,319 | | | | 10/02/2020 | | | | 559,277 | |
| | | | | | |
BNP Paribas SA | | USD | | | 39,585 | | | BRL | | | 223,286 | | | | 10/02/2020 | | | | 174,808 | |
| | | | | | |
BNP Paribas SA | | EUR | | | 39,026 | | | USD | | | 46,156 | | | | 10/15/2020 | | | | 387,481 | |
| | | | | | |
BNP Paribas SA | | USD | | | 11,574 | | | EUR | | | 9,752 | | | | 10/15/2020 | | | | (137,256 | ) |
| | | | | | |
BNP Paribas SA | | CNY | | | 603,514 | | | USD | | | 86,329 | | | | 10/21/2020 | | | | (2,612,545 | ) |
| | | | | | |
BNP Paribas SA | | USD | | | 59,029 | | | CNY | | | 400,113 | | | | 10/21/2020 | | | | (63,532 | ) |
| | | | | | |
BNP Paribas SA | | USD | | | 40,288 | | | BRL | | | 223,286 | | | | 11/04/2020 | | | | (561,167 | ) |
| | | | | | |
Citibank, NA | | CAD | | | 23,613 | | | USD | | | 17,706 | | | | 10/09/2020 | | | | (28,113 | ) |
| | | | | | |
Citibank, NA | | USD | | | 15,415 | | | IDR | | | 229,143,030 | | | | 10/15/2020 | | | | (4,665 | ) |
| | | | | | |
Citibank, NA | | USD | | | 50,415 | | | INR | | | 3,882,052 | | | | 10/15/2020 | | | | 2,319,434 | |
| | | | | | |
Citibank, NA | | SEK | | | 110,616 | | | USD | | | 12,621 | | | | 10/16/2020 | | | | 267,771 | |
| | | | | | |
Citibank, NA | | USD | | | 6,170 | | | SEK | | | 53,066 | | | | 10/16/2020 | | | | (244,334 | ) |
| | | | | | |
Citibank, NA | | PLN | | | 8,860 | | | USD | | | 2,391 | | | | 10/22/2020 | | | | 98,449 | |
| | | | | | |
Citibank, NA | | USD | | | 1,668 | | | NZD | | | 2,519 | | | | 10/27/2020 | | | | (1,545 | ) |
| | | | | | |
Citibank, NA | | USD | | | 6,241 | | | AUD | | | 8,561 | | | | 10/29/2020 | | | | (108,518 | ) |
| | | | | | |
Citibank, NA | | USD | | | 27,501 | | | TWD | | | 796,286 | | | | 11/18/2020 | | | | 169,765 | |
| | | | | | |
Citibank, NA | | GBP | | | 5,612 | | | USD | | | 7,169 | | | | 11/19/2020 | | | | (74,208 | ) |
| | | | | | |
Citibank, NA | | USD | | | 89,823 | | | GBP | | | 69,621 | | | | 11/19/2020 | | | | 33,811 | |
| | | | | | |
Credit Suisse International | | SEK | | | 411,950 | | | USD | | | 46,160 | | | | 10/16/2020 | | | | 155,426 | |
Schedule of Investments (continued)
| | | | | | | | | | | | | | | | | | | | |
| Counterparty | | Contracts to
Deliver
(000) | | | In Exchange
For
(000) | | | Settlement
Date | | | Unrealized
Appreciation/
(Depreciation) | |
| | | | | | |
Credit Suisse International | | USD | | | 11,853 | | | PLN | | | 44,109 | | | | 10/22/2020 | | | $ | (441,378 | ) |
| | | | | | |
Goldman Sachs Bank USA | | CAD | | | 9,066 | | | USD | | | 6,887 | | | | 10/09/2020 | | | | 78,362 | |
| | | | | | |
Goldman Sachs Bank USA | | EUR | | | 23,559 | | | USD | | | 27,873 | | | | 10/15/2020 | | | | 243,988 | |
| | | | | | |
Goldman Sachs Bank USA | | USD | | | 5,347 | | | EUR | | | 4,454 | | | | 10/15/2020 | | | | (123,488 | ) |
| | | | | | |
Goldman Sachs Bank USA | | USD | | | 6,093 | | | CNY | | | 42,275 | | | | 10/21/2020 | | | | 137,479 | |
| | | | | | |
Goldman Sachs Bank USA | | SGD | | | 19,636 | | | USD | | | 14,437 | | | | 10/27/2020 | | | | 51,639 | |
| | | | | | |
Goldman Sachs Bank USA | | USD | | | 17,222 | | | MYR | | | 73,074 | | | | 10/27/2020 | | | | 355,765 | |
| | | | | | |
Goldman Sachs Bank USA | | AUD | | | 24,678 | | | USD | | | 17,598 | | | | 10/29/2020 | | | | (78,775 | ) |
| | | | | | |
Goldman Sachs Bank USA | | TWD | | | 283,949 | | | USD | | | 9,744 | | | | 11/18/2020 | | | | (123,464 | ) |
| | | | | | |
Goldman Sachs Bank USA | | USD | | | 11,143 | | | TWD | | | 323,716 | | | | 11/18/2020 | | | | 106,343 | |
| | | | | | |
Goldman Sachs Bank USA | | RUB | | | 1,506,244 | | | USD | | | 19,564 | | | | 11/19/2020 | | | | 260,067 | |
| | | | | | |
HSBC Bank USA | | BRL | | | 223,286 | | | USD | | | 39,585 | | | | 10/02/2020 | | | | (174,808 | ) |
| | | | | | |
HSBC Bank USA | | USD | | | 40,139 | | | BRL | | | 223,286 | | | | 10/02/2020 | | | | (379,888 | ) |
| | | | | | |
HSBC Bank USA | | USD | | | 8,099 | | | JPY | | | 860,296 | | | | 10/08/2020 | | | | 58,694 | |
| | | | | | |
HSBC Bank USA | | USD | | | 160,808 | | | CAD | | | 214,180 | | | | 10/09/2020 | | | | 46,357 | |
| | | | | | |
HSBC Bank USA | | EUR | | | 128,667 | | | USD | | | 151,346 | | | | 10/15/2020 | | | | 449,650 | |
| | | | | | |
HSBC Bank USA | | CNY | | | 58,721 | | | USD | | | 8,672 | | | | 10/21/2020 | | | | 17,655 | |
| | | | | | |
HSBC Bank USA | | CNY | | | 390,139 | | | USD | | | 55,868 | | | | 10/21/2020 | | | | (1,628,111 | ) |
| | | | | | |
HSBC Bank USA | | USD | | | 39,717 | | | CNY | | | 272,436 | | | | 10/21/2020 | | | | 432,859 | |
| | | | | | |
HSBC Bank USA | | USD | | | 2,069 | | | SGD | | | 2,804 | | | | 10/27/2020 | | | | (15,138 | ) |
| | | | | | |
HSBC Bank USA | | USD | | | 20,703 | | | THB | | | 653,373 | | | | 10/27/2020 | | | | (84,701 | ) |
| | | | | | |
HSBC Bank USA | | KRW | | | 26,236,225 | | | USD | | | 22,323 | | | | 11/10/2020 | | | | (177,836 | ) |
| | | | | | |
HSBC Bank USA | | ILS | | | 293,960 | | | USD | | | 86,535 | | | | 11/12/2020 | | | | 686,135 | |
| | | | | | |
HSBC Bank USA | | CHF | | | 108,626 | | | USD | | | 119,610 | | | | 11/19/2020 | | | | 1,515,812 | |
| | | | | | |
HSBC Bank USA | | GBP | | | 6,544 | | | USD | | | 8,380 | | | | 11/19/2020 | | | | (65,846 | ) |
| | | | | | |
HSBC Bank USA | | USD | | | 13,081 | | | RUB | | | 1,004,356 | | | | 11/19/2020 | | | | (209,176 | ) |
| | | | | | |
HSBC Bank USA | | USD | | | 39,862 | | | ZAR | | | 676,395 | | | | 11/27/2020 | | | | 254,399 | |
| | | | | | |
JPMorgan Chase Bank, NA | | SEK | | | 57,370 | | | USD | | | 6,487 | | | | 10/16/2020 | | | | 80,580 | |
| | | | | | |
JPMorgan Chase Bank, NA | | USD | | | 14,195 | | | NOK | | | 127,636 | | | | 10/16/2020 | | | | (510,836 | ) |
| | | | | | |
JPMorgan Chase Bank, NA | | USD | | | 27,481 | | | SEK | | | 240,615 | | | | 10/16/2020 | | | | (610,393 | ) |
| | | | | | |
Morgan Stanley Capital Services, Inc. | | EUR | | | 20,535 | | | USD | | | 24,283 | | | | 10/15/2020 | | | | 200,351 | |
| | | | | | |
Morgan Stanley Capital Services, Inc. | | EUR | | | 37,136 | | | USD | | | 43,431 | | | | 10/15/2020 | | | | (120,511 | ) |
| | | | | | |
Morgan Stanley Capital Services, Inc. | | USD | | | 42,944 | | | EUR | | | 36,138 | | | | 10/15/2020 | | | | (562,722 | ) |
| | | | | | |
Morgan Stanley Capital Services, Inc. | | USD | | | 24,134 | | | INR | | | 1,820,308 | | | | 10/15/2020 | | | | 593,173 | |
| | | | | | |
Standard Chartered Bank | | KRW | | | 14,859,475 | | | USD | | | 12,833 | | | | 11/10/2020 | | | | 89,269 | |
| | | | | | |
State Street Bank & Trust Co. | | USD | | | 30,517 | | | JPY | | | 3,253,732 | | | | 10/08/2020 | | | | 336,566 | |
| | | | | | |
State Street Bank & Trust Co. | | USD | | | 55,579 | | | JPY | | | 5,849,366 | | | | 10/08/2020 | | | | (112,944 | ) |
| | | | | | |
State Street Bank & Trust Co. | | USD | | | 22,324 | | | MXN | | | 501,425 | | | | 10/08/2020 | | | | 337,233 | |
| | | | | | |
State Street Bank & Trust Co. | | EUR | | | 32,445 | | | USD | | | 38,484 | | | | 10/15/2020 | | | | 433,683 | |
| | | | | | |
State Street Bank & Trust Co. | | USD | | | 20,378 | | | INR | | | 1,536,813 | | | | 10/15/2020 | | | | 498,091 | |
| | | | | | |
State Street Bank & Trust Co. | | SEK | | | 72,629 | | | USD | | | 8,342 | | | | 10/16/2020 | | | | 230,771 | |
| | | | | | |
State Street Bank & Trust Co. | | USD | | | 11,097 | | | CNY | | | 77,371 | | | | 10/21/2020 | | | | 305,003 | |
| | | | | | |
State Street Bank & Trust Co. | | PLN | | | 35,249 | | | USD | | | 9,486 | | | | 10/22/2020 | | | | 366,478 | |
| | | | | | |
State Street Bank & Trust Co. | | NZD | | | 13,432 | | | USD | | | 8,803 | | | | 10/27/2020 | | | | (82,451 | ) |
| | | | | | |
State Street Bank & Trust Co. | | SGD | | | 23,876 | | | USD | | | 17,442 | | | | 10/27/2020 | | | | (49,833 | ) |
| | | | | | |
State Street Bank & Trust Co. | | USD | | | 7,227 | | | NZD | | | 10,913 | | | | 10/27/2020 | | | | (7,152 | ) |
| | | | | | |
State Street Bank & Trust Co. | | AUD | | | 86,523 | | | USD | | | 61,633 | | | | 10/29/2020 | | | | (343,515 | ) |
| | | | | | | | | | | | | | | | | | | | |
| Counterparty | | Contracts to
Deliver
(000) | | | In Exchange
For
(000) | | | Settlement
Date | | | Unrealized
Appreciation/
(Depreciation) | |
| | | | | | |
State Street Bank & Trust Co. | | USD | | | 31,842 | | | AUD | | | 43,445 | | | | 10/29/2020 | | | $ | (722,625 | ) |
| | | | | | |
UBS AG | | USD | | | 7,697 | | | CAD | | | 10,296 | | | | 10/09/2020 | | | | 35,557 | |
| | | | | | |
UBS AG | | SEK | | | 53,066 | | | USD | | | 6,069 | | | | 10/16/2020 | | | | 143,175 | |
| | | | | | | | | | | | | | | | | | | | |
| |
| | | $ | 226,961 | |
| | | | | | | | | | | | | | | | | | | | |
| (a) | | Security is exempt from registration under Rule 144A of the Securities Act of 1933. These securities are considered restricted, but liquid and may be resold in transactions exempt from registration, normally to qualified institutional buyers. At September 30, 2020, the aggregate market value of these securities amounted to $88,296,080 or 2.2% of net assets. |
| (b) | | Non-income producing security. |
| (c) | | Affiliated investments. |
| (d) | | The rate shown represents the 7-day yield as of period end. |
| (e) | | To obtain a copy of the fund’s shareholder report, please go to the Securities and Exchange Commission’s website at www.sec.gov, or call AB at (800) 227-4618. |
Currency Abbreviations:
AUD—Australian Dollar
BRL—Brazilian Real
CAD—Canadian Dollar
CHF—Swiss Franc
CNY—Chinese Yuan Renminbi
EUR—Euro
GBP—Great British Pound
IDR—Indonesian Rupiah
ILS—Israeli Shekel
INR—Indian Rupee
JPY—Japanese Yen
KRW—South Korean Won
MXN—Mexican Peso
MYR—Malaysian Ringgit
NOK—Norwegian Krone
NZD—New Zealand Dollar
PLN—Polish Zloty
RUB—Russian Ruble
SEK—Swedish Krona
SGD—Singapore Dollar
THB—Thailand Baht
TWD—New Taiwan Dollar
USD—United States Dollar
ZAR—South African Rand
Glossary:
ADR—American Depositary Receipt
GDR—Global Depositary Receipt
PJSC—Public Joint Stock Company
REIT—Real Estate Investment Trust
See notes to financial statements.
Statement of Assets and Liabilities—September 30, 2020
| | | | | | | | | | | | |
| | | SMALL CAP CORE
PORTFOLIO | | | INTERNATIONAL
SMALL CAP
PORTFOLIO | | | INTERNATIONAL
STRATEGIC
EQUITIES
PORTFOLIO | |
|
| ASSETS | |
|
Investments in securities at value | |
| | | |
Unaffiliated issuers | | $ | 652,301,275 | | | $ | 1,187,683,544 | | | $ | 3,944,053,682 | |
| | | |
Affiliated issuers | | | 3,935,753 | | | | 12,832,082 | | | | 62,019,823 | |
| | | |
Foreign currencies, at value (a) | | | 0 | | | | 5,587,097 | | | | 31,321,082 | |
| | | |
Cash | | | 21,991 | | | | 0 | | | | 0 | |
| | | |
Cash collateral due from broker | | | 1,518,440 | | | | 60,000 | | | | 2,249,000 | |
|
Receivables: | |
| | | |
Unaffiliated interest and dividends | | | 560,728 | | | | 3,474,098 | | | | 6,346,684 | |
| | | |
Affiliated dividends | | | 109 | | | | 297 | | | | 2,073 | |
| | | |
Foreign withholding tax reclaims | | | 0 | | | | 1,757,716 | | | | 7,138,796 | |
| | | |
Investment securities sold and foreign currency transactions | | | 7,108,120 | | | | 1,826,363 | | | | 3,784,803 | |
| | | |
Capital shares sold | | | 336,790 | | | | 919,154 | | | | 2,630,842 | |
| | | |
Unrealized appreciation of forward currency exchange contracts | | | 0 | | | | 2,991,679 | | | | 12,730,669 | |
| | | | | | | | | | | | |
| | | |
Total assets | | | 665,783,206 | | | | 1,217,132,030 | | | | 4,072,277,454 | |
| | | | | | | | | | | | |
|
| LIABILITIES | |
| | | |
Due to custodian | | | 0 | | | | 0 | | | | 280,000 | |
| | | |
Cash collateral due to broker | | | 0 | | | | 276,000 | | | | 4,491,000 | |
| | | |
Payables: | | | | | | | | | | | | |
| | | |
Investment securities purchased and foreign currency transactions | | | 8,517,922 | | | | 2,767,161 | | | | 19,106,974 | |
| | | |
Management fee | | | 535,646 | | | | 1,001,644 | | | | 2,368,639 | |
| | | |
Capital shares redeemed | | | 279,895 | | | | 358,730 | | | | 1,033,898 | |
| | | |
Transfer Agent fee | | | 19,920 | | | | 18,863 | | | | 34,670 | |
| | | |
Shareholder servicing fee | | | 1,630 | | | | 13,109 | | | | 35,643 | |
| | | |
Variation margin on futures | | | 30,893 | | | | 0 | | | | 0 | |
| | | |
Accrued expenses | | | 70,936 | | | | 99,802 | | | | 103,350 | |
| | | |
Unrealized depreciation of forward currency exchange contracts | | | 0 | | | | 2,261,802 | | | | 12,503,708 | |
| | | | | | | | | | | | |
| | | |
Total liabilities | | | 9,456,842 | | | | 6,797,111 | | | | 39,957,882 | |
| | | | | | | | | | | | |
| | | |
NET ASSETS | | $ | 656,326,364 | | | $ | 1,210,334,919 | | | $ | 4,032,319,572 | |
| | | | | | | | | | | | |
|
Cost of investments | |
| | | |
Unaffiliated issuers | | $ | 587,740,732 | | | $ | 1,090,750,347 | | | $ | 3,479,329,924 | |
| | | |
Affiliated issuers | | | 3,935,753 | | | | 12,832,082 | | | | 62,019,823 | |
| | | |
| NET ASSETS CONSIST OF: | | | | | | | | | | | | |
| | | |
Capital stock, at par | | $ | 6,296 | | | $ | 11,613 | | | $ | 34,705 | |
| | | |
Additional paid-in capital | | | 632,552,517 | | | | 1,242,076,000 | | | | 3,992,199,932 | |
| | | |
Distributable earnings (accumulated loss) | | | 23,767,551 | | | | (31,752,694 | ) | | | 40,084,935 | |
| | | | | | | | | | | | |
| | | |
| | $ | 656,326,364 | | | $ | 1,210,334,919 | | | $ | 4,032,319,572 | |
| | | | | | | | | | | | |
(a) Cost: $0, $5,582,816 and $31,361,964, respectively. (Note 1)
See notes to financial statements.
| | | | | | | | | | | | |
| | | SMALL CAP CORE
PORTFOLIO | | | INTERNATIONAL
SMALL CAP
PORTFOLIO | | | INTERNATIONAL
STRATEGIC
EQUITIES
PORTFOLIO | |
|
| CALCULATION OF MAXIMUM OFFERING PRICE | |
|
SCB Class Shares | |
| | | |
Net Assets | | $ | 7,895,195 | | | $ | 63,327,757 | | | $ | 172,252,710 | |
| | | |
Shares of capital stock outstanding | | | 760,037 | | | | 6,091,538 | | | | 14,878,331 | |
| | | | | | | | | | | | |
| | | |
Net asset value, offering and redemption price per share | | $ | 10.39 | | | $ | 10.40 | | | $ | 11.58 | |
| | | | | | | | | | | | |
|
Advisor Class Shares | |
| | | |
Net Assets | | $ | 531,943,355 | | | $ | 748,799,084 | | | $ | 2,510,243,241 | |
| | | |
Shares of capital stock outstanding | | | 51,024,097 | | | | 71,831,671 | | | | 216,096,929 | |
| | | | | | | | | | | | |
| | | |
Net asset value and offering price per share | �� | $ | 10.43 | | | $ | 10.42 | | | $ | 11.62 | |
| | | | | | | | | | | | |
|
Class Z Shares | |
| | | |
Net Assets | | $ | 116,487,814 | | | $ | 398,208,078 | | | $ | 1,349,823,621 | |
| | | |
Shares of capital stock outstanding | | | 11,179,842 | | | | 38,209,862 | | | | 116,075,543 | |
| | | | | | | | | | | | |
| | | |
Net asset value and offering price per share | | $ | 10.42 | | | $ | 10.42 | | | $ | 11.63 | |
| | | | | | | | | | | | |
Statement of Operations—for the year ended September 30, 2020
| | | | | | | | | | | | |
| | | SMALL CAP CORE
PORTFOLIO | | | INTERNATIONAL
SMALL CAP
PORTFOLIO | | | INTERNATIONAL
STRATEGIC
EQUITIES
PORTFOLIO | |
| | | |
| INVESTMENT INCOME | | | | | | | | | | | | |
| | | |
Income: | | | | | | | | | | | | |
|
Dividends | |
| | | |
Unaffiliated issuers (a) | | $ | 11,628,485 | | | $ | 28,222,434 | | | $ | 96,730,650 | |
| | | |
Affiliated issuers | | | 28,020 | | | | 99,621 | | | | 280,689 | |
| | | |
Interest | | | 6,556 | | | | 0 | | | | 0 | |
| | | | | | | | | | | | |
| | | |
Total income | | | 11,663,061 | | | | 28,322,055 | | | | 97,011,339 | |
| | | | | | | | | | | | |
| | | |
Expenses: | | | | | | | | | | | | |
| | | |
Management fee (see Note 2A) | | | 7,035,730 | | | | 12,016,341 | | | | 28,710,508 | |
| | | |
Shareholder servicing fee (see Note 2B) | | | 20,437 | | | | 156,772 | | | | 427,889 | |
| | | |
Custody and accounting fees | | | 157,881 | | | | 360,165 | | | | 680,606 | |
| | | |
Transfer Agent fee—SCB Class | | | 3,646 | | | | 17,215 | | | | 14,406 | |
| | | |
Transfer Agent fee—Advisor Class | | | 306,892 | | | | 206,026 | | | | 212,743 | |
| | | |
Transfer Agent fee—Class Z | | | 36,503 | | | | 77,610 | | | | 266,399 | |
| | | |
Directors’ fees and expenses | | | 36,970 | | | | 49,279 | | | | 165,869 | |
| | | |
Registration fees | | | 60,600 | | | | 62,655 | | | | 73,423 | |
| | | |
Auditing and tax fees | | | 48,333 | | | | 70,730 | | | | 58,523 | |
| | | |
Legal fees | | | 21,112 | | | | 29,080 | | | | 91,351 | |
| | | |
Printing fees | | | 32,523 | | | | 30,102 | | | | 31,738 | |
| | | |
Recoupment of previously reimbursed expenses (see Note 2A) | | | 0 | | | | 17,600 | | | | 0 | |
| | | |
Miscellaneous | | | 56,354 | | | | 89,678 | | | | 206,339 | |
| | | | | | | | | | | | |
| | | |
Total expenses | | | 7,816,981 | | | | 13,183,253 | | | | 30,939,794 | |
| | | |
Less: expenses waived and reimbursed by the Adviser (see Note 2D) | | | (3,248 | ) | | | (10,210 | ) | | | (44,289 | ) |
| | | | | | | | | | | | |
| | | |
Net expenses | | | 7,813,733 | | | | 13,173,043 | | | | 30,895,505 | |
| | | | | | | | | | | | |
| | | |
Net investment income | | | 3,849,328 | | | | 15,149,012 | | | | 66,115,834 | |
| | | | | | | | | | | | |
| | | |
| REALIZED AND UNREALIZED GAIN (LOSS) ON INVESTMENT AND FOREIGN CURRENCY TRANSACTIONS | | | | | | | | | | | | |
| | | |
Net realized gain (loss) on: | | | | | | | | | | | | |
| | | |
Investment transactions (b) | | | (32,124,427 | ) | | | (55,921,412 | ) | | | (269,417,284 | ) |
| | | |
Forward currency exchange contracts | | | 0 | | | | 728,736 | | | | (11,080,068 | ) |
| | | |
Futures | | | (620,958 | ) | | | 0 | | | | 0 | |
| | | |
Foreign currency transactions | | | 0 | | | | (1,360,346 | ) | | | (4,188,759 | ) |
| | | | | | | | | | | | |
| | | |
Net realized loss on investment transactions and foreign currency transactions | | | (32,745,385 | ) | | | (56,553,022 | ) | | | (284,686,111 | ) |
| | | | | | | | | | | | |
| | | |
Net change in unrealized appreciation/depreciation of: | | | | | | | | | | | | |
| | | |
Investments (c) | | | 7,679,557 | | | | 57,317,954 | | | | 284,602,288 | |
| | | |
Forward currency exchange contracts | | | 0 | | | | 322,312 | | | | 1,565,377 | |
| | | |
Futures | | | 478,411 | | | | 0 | | | | 0 | |
| | | |
Foreign currency denominated assets and liabilities | | | 0 | | | | 148,304 | | | | 490,591 | |
| | | | | | | | | | | | |
| | | |
Net change in unrealized appreciation/depreciation of investments and foreign currency denominated assets and liabilities | | | 8,157,968 | | | | 57,788,570 | | | | 286,658,256 | |
| | | | | | | | | | | | |
| | | |
Net realized and unrealized gain (loss) on investment transactions and foreign currency transactions | | | (24,587,417 | ) | | | 1,235,548 | | | | 1,972,145 | |
| | | | | | | | | | | | |
| | | |
Net increase (decrease) in net assets resulting from operations | | $ | (20,738,089 | ) | | $ | 16,384,560 | | | $ | 68,087,979 | |
| | | | | | | | | | | | |
(a) Net of foreign withholding taxes of $26,648, $3,417,925 and $12,119,701, respectively.
(b) Net of foreign capital gains taxes of $0, $93,667 and $0, respectively.
(c) Net of increase in accrued foreign capital gains taxes of $0, $93,871 and $0, respectively.
See notes to financial statements.
Statement of Changes in Net Assets
| | | | | | | | | | | | | | | | | | | | |
| | | |
| | | SMALL CAP CORE
PORTFOLIO | | | | | | INTERNATIONAL SMALL CAP
PORTFOLIO | |
| | | | | | | | | | | | | | | | | | | | |
| | | YEAR
ENDED
9/30/20 | | | YEAR
ENDED
9/30/19 | | | | | | YEAR
ENDED
9/30/20 | | | YEAR
ENDED
9/30/19 | |
|
| INCREASE (DECREASE) IN NET ASSETS FROM | |
|
Operations: | |
| | | | | |
Net investment income | | $ | 3,849,328 | | | $ | 4,086,066 | | | | | | | $ | 15,149,012 | | | $ | 21,479,244 | |
| | | | | |
Net realized loss on investment transactions and foreign currency transactions | | | (32,745,385 | ) | | | (7,186,657 | ) | | | | | | | (56,553,022 | ) | | | (72,656,737 | ) |
| | | | | |
Net change in unrealized appreciation/depreciation of investments | | | 8,157,968 | | | | (90,055,164 | ) | | | | | | | 57,788,570 | | | | (50,621,125 | ) |
| | | | | | | | | | | | | | | | | | | | |
| | | | | |
Net increase (decrease) in net assets resulting from operations | | | (20,738,089 | ) | | | (93,155,755 | ) | | | | | | | 16,384,560 | | | | (101,798,618 | ) |
| | | | | | | | | | | | | | | | | | | | |
| | | | | |
Distributions to shareholders (a) | | | (4,500,621 | ) | | | (63,646,747 | ) | | | | | | | (25,979,696 | ) | | | (104,450,548 | ) |
| | | | | | | | | | | | | | | | | | | | |
|
Capital-share transactions: | |
| | | | | |
Net proceeds from sales of shares | | | 90,360,480 | | | | 175,982,053 | | | | | | | | 144,989,727 | | | | 162,369,840 | |
| | | | | |
Net proceeds from sales of shares issued to shareholders on reinvestment of dividends | | | 3,601,804 | | | | 62,390,674 | | | | | | | | 22,490,367 | | | | 101,222,927 | |
| | | | | | | | | | | | | | | | | | | | |
| | | | | |
Total proceeds from shares sold | | | 93,962,284 | | | | 238,372,727 | | | | | | | | 167,480,094 | | | | 263,592,767 | |
| | | | | |
Cost of shares redeemed | | | (347,982,942 | ) | | | (121,023,838 | ) | | | | | | | (204,873,648 | ) | | | (110,046,720 | ) |
| | | | | | | | | | | | | | | | | | | | |
| | | | | |
Net increase (decrease) in net assets from capital-share transactions | | | (254,020,658 | ) | | | 117,348,889 | | | | | | | | (37,393,554 | ) | | | 153,546,047 | |
| | | | | | | | | | | | | | | | | | | | |
| | | | | |
Net decrease in net assets | | | (279,259,368 | ) | | | (39,453,613 | ) | | | | | | | (46,988,690 | ) | | | (52,703,119 | ) |
|
| NET ASSETS: | |
| | | | | |
Beginning of period | | | 935,585,732 | | | | 975,039,345 | | | | | | | | 1,257,323,609 | | | | 1,310,026,728 | |
| | | | | | | | | | | | | | | | | | | | |
| | | | | |
End of period | | $ | 656,326,364 | | | $ | 935,585,732 | | | | | | | $ | 1,210,334,919 | | | $ | 1,257,323,609 | |
| | | | | | | | | | | | | | | | | | | | |
(a) See page 35 for share class information on dividend distributions for the Portfolios.
See Notes to Financial Statements.
Statement of Changes in Net Assets (continued)
| | | | | | | | |
| |
| | | INTERNATIONAL STRATEGIC
EQUITIES PORTFOLIO | |
| | | | | | | | |
| | | YEAR
ENDED
9/30/20 | | | YEAR
ENDED
9/30/19 | |
|
| INCREASE (DECREASE) IN NET ASSETS FROM | |
|
Operations: | |
| | |
Net investment income | | $ | 66,115,834 | | | $ | 92,920,778 | |
| | |
Net realized loss on investment transactions and foreign currency transactions | | | (284,686,111 | ) | | | (198,010,080 | ) |
| | |
Net change in unrealized appreciation/depreciation of investments | | | 286,658,256 | | | | (59,764,297 | ) |
| | | | | | | | |
| | |
Net increase (decrease) in net assets resulting from operations | | | 68,087,979 | | | | (164,853,599 | ) |
| | | | | | | | |
| | |
Distributions to shareholders (a) | | | (90,002,554 | ) | | | (115,318,621 | ) |
| | | | | | | | |
|
Capital-share transactions: | |
| | |
Net proceeds from sales of shares | | | 385,301,371 | | | | 533,970,537 | |
| | |
Net proceeds from sales of shares issued to shareholders on reinvestment of dividends | | | 77,639,468 | | | | 107,127,789 | |
| | | | | | | | |
| | |
Total proceeds from shares sold | | | 462,940,839 | | | | 641,098,326 | |
| | |
Cost of shares redeemed | | | (564,732,778 | ) | | | (375,862,283 | ) |
| | | | | | | | |
| | |
Net increase (decrease) in net assets from capital-share transactions | | | (101,791,939 | ) | | | 265,236,043 | |
| | | | | | | | |
| | |
Net decrease in net assets | | | (123,706,514 | ) | | | (14,936,177 | ) |
|
| NET ASSETS: | |
| | |
Beginning of period | | | 4,156,026,086 | | | | 4,170,962,263 | |
| | | | | | | | |
| | |
End of period | | $ | 4,032,319,572 | | | $ | 4,156,026,086 | |
| | | | | | | | |
(a) See page 35 for share class information on dividend distributions for the Portfolios.
See Notes to Financial Statements.
| | | | | | | | |
| |
| | | SMALL CAP CORE
PORTFOLIO | |
| | | | | | | | |
| | | YEAR
ENDED
9/30/20 | | | YEAR
ENDED
9/30/19 | |
|
Distributions to shareholders: | |
| | |
SCB Class | | $ | (18,753 | ) | | $ | (653,912 | ) |
| | |
Advisor Class | | | (3,500,847 | ) | | | (49,597,397 | ) |
| | |
Class Z | | | (981,021 | ) | | | (13,395,438 | ) |
| | | | | | | | |
| | |
| | $ | (4,500,621 | ) | | $ | (63,646,747 | ) |
| | | | | | | | |
| | | | | | | | |
| |
| | | INTERNATIONAL
SMALL CAP
PORTFOLIO | |
| | | | | | | | |
| | | YEAR
ENDED
9/30/20 | | | YEAR
ENDED
9/30/19 | |
|
Distributions to shareholders: | |
| | |
SCB Class | | $ | (1,209,894 | ) | | $ | (5,411,545 | ) |
| | |
Advisor Class | | | (16,458,466 | ) | | | (64,631,751 | ) |
| | |
Class Z | | | (8,311,336 | ) | | | (34,407,252 | ) |
| | | | | | | | |
| | |
| | $ | (25,979,696 | ) | | $ | (104,450,548 | ) |
| | | | | | | | |
| | | | | | | | |
| |
| | | INTERNATIONAL
STRATEGIC EQUITIES
PORTFOLIO | |
| | | | | | | | |
| | | YEAR
ENDED
9/30/20 | | | YEAR
ENDED
9/30/19 | |
|
Distributions to shareholders: | |
| | |
SCB Class | | $ | (3,430,399 | ) | | $ | (4,514,423 | ) |
| | |
Advisor Class | | | (57,142,513 | ) | | | (71,773,884 | ) |
| | |
Class Z | | | (29,429,642 | ) | | | (39,030,314 | ) |
| | | | | | | | |
| | |
| | $ | (90,002,554 | ) | | $ | (115,318,621 | ) |
| | | | | | | | |
Financial Highlights
Selected per share data and ratios for a share of capital stock outstanding for each respective Portfolio for each of the periods presented:
| | | | | | | | | | | | | | | | | | | | |
| |
| | | SMALL CAP CORE PORTFOLIO
SCB CLASS | |
| | | | | | | | | | | | | | | | | | | | |
| | | YEAR
ENDED
9/30/20 | | | YEAR
ENDED
9/30/19 | | | YEAR
ENDED
9/30/18 | | | YEAR
ENDED
9/30/17 | | | FORTHE
PERIOD
12/29/15(a) TO
9/30/16 | |
| | | | | |
Net asset value, beginning of period | | $ | 10.78 | | | $ | 12.93 | | | $ | 12.21 | | | $ | 10.54 | | | $ | 10.00 | |
| | | | | | | | | | | | | | | | | | | | |
| | | | | |
Income from investment operations: | | | | | | | | | | | | | | | | | | | | |
| | | | | |
Investment income (loss), net (b)(c) | | | 0.02 | | | | 0.02 | | | | (0.00 | )(d) | | | 0.01 | | | | 0.01 | |
| | | | | |
Net realized and unrealized gain (loss) on investment transactions and foreign currency transactions | | | (0.39 | ) | | | (1.38 | ) | | | 1.44 | | | | 1.67 | | | | 0.53 | (e) |
| | | | | | | | | | | | | | | | | | | | |
| | | | | |
Total from investment operations | | | (0.37 | ) | | | (1.36 | ) | | | 1.44 | | | | 1.68 | | | | 0.54 | |
| | | | | | | | | | | | | | | | | | | | |
| | | | | |
Less dividends and distributions: | | | | | | | | | | | | | | | | | | | | |
| | | | | |
Dividends from net investment income | | | (0.02 | ) | | | (0.00 | )(d) | | | (0.01 | ) | | | (0.01 | ) | | | (0.00 | )(d) |
| | | | | |
Distributions from net realized gain on investment transactions | | | 0 | | | | (0.79 | ) | | | (0.71 | ) | | | 0 | | | | 0 | |
| | | | | | | | | | | | | | | | | | | | |
| | | | | |
Total dividends and distributions | | | (0.02 | ) | | | (0.79 | ) | | | (0.72 | ) | | | (0.01 | ) | | | 0 | |
| | | | | | | | | | | | | | | | | | | | |
| | | | | |
Net asset value, end of period | | $ | 10.39 | | | $ | 10.78 | | | $ | 12.93 | | | $ | 12.21 | | | $ | 10.54 | |
| | | | | | | | | | | | | | | | | | | | |
| | | | | |
Total return (f) | | | (3.42)% | | | | (10.15)% | | | | 12.44% | | | | 15.98% | | | | 5.45% | |
| | | | | |
| RATIOS/SUPPLEMENTAL DATA | | | | | | | | | | | | | | | | | | | | |
| | | | | |
Net assets, end of period (000 omitted) | | | $7,895 | | | | $8,692 | | | | $10,865 | | | | $10,276 | | | | $4,870 | |
| | | | | |
Average net assets (000 omitted) | | | $8,175 | | | | $9,118 | | | | $10,771 | | | | $7,467 | | | | $2,314 | |
| | | | | |
Ratio to average net assets of: | | | | | | | | | | | | | | | | | | | | |
| | | | | |
Expenses, net of waivers/reimbursements | | | 1.14% | | | | 1.14% | | | | 1.14% | | | | 1.18% | | | | 1.30% | (g) |
| | | | | |
Expenses, before waivers/reimbursements | | | 1.14% | | | | 1.14% | | | | 1.14% | | | | 1.19% | | | | 1.40% | (g) |
| | | | | |
Net investment income (loss) (c) | | | 0.19% | | | | 0.19% | | | | (0.02)% | | | | 0.05% | | | | 0.16% | (g) |
| | | | | |
Portfolio turnover rate | | | 88% | | | | 61% | | | | 102% | | | | 165% | | | | 88% | |
See Footnote Summary on page 44.
See Notes to Financial Statements.
| | | | | | | | | | | | | | | | | | | | |
| |
| | | SMALL CAP CORE PORTFOLIO ADVISOR CLASS | |
| | | | | | | | | | | | | | | | | | | | |
| | | YEAR
ENDED
9/30/20 | | | YEAR
ENDED
9/30/19 | | | YEAR
ENDED
9/30/18 | | | YEAR
ENDED
9/30/17 | | | FORTHE PERIOD 12/29/15(a) TO 9/30/16 | |
| | | | | |
Net asset value, beginning of period | | $ | 10.82 | | | $ | 12.97 | | | $ | 12.25 | | | $ | 10.56 | | | $ | 10.00 | |
| | | | | | | | | | | | | | | | | | | | |
| | | | | |
Income from investment operations | | | | | | | | | | | | | | | | | | | | |
| | | | | |
Investment income, net (b)(c) | | | 0.04 | | | | 0.05 | | | | 0.03 | | | | 0.03 | | | | 0.04 | |
| | | | | |
Net realized and unrealized gain (loss) on investment transactions and foreign currency transactions | | | (0.38 | ) | | | (1.38 | ) | | | 1.44 | | | | 1.69 | | | | 0.53 | (e) |
| | | | | | | | | | | | | | | | | | | | |
| | | | | |
Total from investment operations | | | (0.34 | ) | | | (1.33 | ) | | | 1.47 | | | | 1.72 | | | | 0.57 | |
| | | | | | | | | | | | | | | | | | | | |
| | | | | |
Less dividends and distributions: | | | | | | | | | | | | | | | | | | | | |
| | | | | |
Dividends from net investment income | | | (0.05 | ) | | | (0.03 | ) | | | (0.04 | ) | | | (0.03 | ) | | | (0.01 | ) |
| | | | | |
Distributions from net realized gain on investment transactions | | | 0 | | | | (0.79 | ) | | | (0.71 | ) | | | 0 | | | | 0 | |
| | | | | | | | | | | | | | | | | | | | |
| | | | | |
Total dividends and distributions | | | (0.05 | ) | | | (0.82 | ) | | | (0.75 | ) | | | (0.03 | ) | | | (0.01 | ) |
| | | | | | | | | | | | | | | | | | | | |
| | | | | |
Net asset value, end of period | | $ | 10.43 | | | $ | 10.82 | | | $ | 12.97 | | | $ | 12.25 | | | $ | 10.56 | |
| | | | | | | | | | | | | | | | | | | | |
| | | | | |
Total return (f) | | | (3.17)% | | | | (9.90)% | | | | 12.64% | | | | 16.29% | | | | 5.65% | |
| | | | | |
| RATIOS/SUPPLEMENTAL DATA | | | | | | | | | | | | | | | | | | | | |
| | | | | |
Net assets, end of period (000 omitted) | | | $531,943 | | | | $734,733 | | | | $752,305 | | | | $695,958 | | | | $603,862 | |
| | | | | |
Average net assets (000 omitted) | | | $688,776 | | | | $724,908 | | | | $718,801 | | | | $654,649 | | | | $175,999 | |
| | | | | |
Ratio to average net assets of: | | | | | | | | | | | | | | | | | | | | |
| | | | | |
Expenses, net of waivers/reimbursements | | | 0.89% | | | | 0.89% | | | | 0.89% | | | | 0.92% | | | | 1.05% | (g) |
| | | | | |
Expenses, before waivers/reimbursements | | | 0.89% | | | | 0.89% | | | | 0.89% | | | | 0.93% | | | | 1.15% | (g) |
| | | | | |
Net investment income (c) | | | 0.43% | | | | 0.44% | | | | 0.23% | | | | 0.30% | | | | 0.49% | (g) |
| | | | | |
Portfolio turnover rate | | | 88% | | | | 61% | | | | 102% | | | | 165% | | | | 88% | |
See Footnote Summary on page 44.
See Notes to Financial Statements.
Financial Highlights (continued)
Selected per share data and ratios for a share of capital stock outstanding for each respective Portfolio for each of the periods presented:
| | | | | | | | | | | | | | | | | | | | |
| |
| | | SMALL CAP CORE PORTFOLIO CLASS Z | |
| | | | | | | | | | | | | | | | | | | | |
| | | YEAR
ENDED
9/30/20 | | | YEAR
ENDED
9/30/19 | | | YEAR
ENDED
9/30/18 | | | YEAR
ENDED
9/30/17 | | | FOR THE
PERIOD
12/29/15(a) TO
9/30/16 | |
| | | | | |
Net asset value, beginning of period | | $ | 10.82 | | | $ | 12.96 | | | $ | 12.24 | | | $ | 10.56 | | | $ | 10.00 | |
| | | | | | | | | | | | | | | | | | | | |
| | | | | |
Income from investment operations | | | | | | | | | | | | | | | | | | | | |
| | | | | |
Investment income, net (b)(c) | | | 0.05 | | | | 0.05 | | | | 0.03 | | | | 0.03 | | | | 0.04 | |
| | | | | |
Net realized and unrealized gain (loss) on investment transactions and foreign currency transactions | | | (0.39 | ) | | | (1.37 | ) | | | 1.44 | | | | 1.68 | | | | 0.53 | (e) |
| | | | | | | | | | | | | | | | | | | | |
| | | | | |
Total from investment operations | | | (0.34 | ) | | | (1.32 | ) | | | 1.47 | | | | 1.71 | | | | 0.57 | |
| | | | | | | | | | | | | | | | | | | | |
| | | | | |
Less dividends and distributions: | | | | | | | | | | | | | | | | | | | | |
| | | | | |
Dividends from net investment income | | | (0.06 | ) | | | (0.03 | ) | | | (0.04 | ) | | | (0.03 | ) | | | (0.01 | ) |
| | | | | |
Distributions from net realized gain on investment transactions | | | 0 | | | | (0.79 | ) | | | (0.71 | ) | | | 0 | | | | 0 | |
| | | | | | | | | | | | | | | | | | | | |
| | | | | |
Total dividends and distributions | | | (0.06 | ) | | | (0.82 | ) | | | (0.75 | ) | | | (0.03 | ) | | | (0.01 | ) |
| | | | | | | | | | | | | | | | | | | | |
| | | | | |
Net asset value, end of period | | $ | 10.42 | | | $ | 10.82 | | | $ | 12.96 | | | $ | 12.24 | | | $ | 10.56 | |
| | | | | | | | | | | | | | | | | | | | |
| | | | | |
Total return (f) | | | (3.23)% | | | | (9.80)% | | | | 12.69% | | | | 16.22% | | | | 5.65% | |
| | | | | |
| RATIOS/SUPPLEMENTAL DATA | | | | | | | | | | | | | | | | | | | | |
| | | | | |
Net assets, end of period (000 omitted) | | | $116,488 | | | | $192,161 | | | | $211,869 | | | | $179,340 | | | | $126,780 | |
| | | | | |
Average net assets (000 omitted) | | | $182,516 | | | | $190,252 | | | | $193,253 | | | | $144,513 | | | | $36,539 | |
| | | | | |
Ratio to average net assets of: | | | | | | | | | | | | | | | | | | | | |
| | | | | |
Expenses, net of waivers/reimbursements | | | 0.87% | | | | 0.87% | | | | 0.86% | | | | 0.93% | | | | 1.05% | (g) |
| | | | | |
Expenses, before waivers/reimbursements | | | 0.87% | | | | 0.87% | | | | 0.86% | | | | 0.94% | | | | 1.35% | (g) |
| | | | | |
Net investment income (c) | | | 0.46% | | | | 0.46% | | | | 0.25% | | | | 0.30% | | | | 0.49% | (g) |
| | | | | |
Portfolio turnover rate | | | 88% | | | | 61% | | | | 102% | | | | 165% | | | | 88% | |
See Footnote Summary on page 44.
See Notes to Financial Statements.
| | | | | | | | | | | | | | | | | | | | |
| |
| | | INTERNATIONAL SMALL CAP PORTFOLIO
SCB CLASS | |
| | | | | | | | | | | | | | | | | | | | |
| | | YEAR
ENDED
9/30/20 | | | YEAR
ENDED
9/30/19 | | | YEAR
ENDED
9/30/18 | | | YEAR
ENDED
9/30/17 | | | FOR THE
PERIOD
12/21/15(a) TO
9/30/16 | |
| | | | | |
Net asset value, beginning of period | | $ | 10.40 | | | $ | 12.40 | | | $ | 12.70 | | | $ | 10.92 | | | $ | 10.00 | |
| | | | | | | | | | | | | | | | | | | | |
| | | | | |
Income from investment operations: | | | | | | | | | | | | | | | | | | | | |
| | | | | |
Investment income, net (b)(c) | | | 0.10 | | | | 0.16 | | | | 0.14 | | | | 0.08 | | | | 0.11 | |
| | | | | |
Net realized and unrealized gain (loss) on investment transactions and foreign currency transactions | | | 0.09 | | | | (1.21 | ) | | | 0.02 | | | | 1.96 | | | | 0.81 | |
| | | | | |
Contributions from affiliates | | | 0 | | | | 0 | | | | 0 | | | | 0.00 | (d) | | | 0 | |
| | | | | | | | | | | | | | | | | | | | |
| | | | | |
Total from investment operations | | | 0.19 | | | | (1.05 | ) | | | 0.16 | | | | 2.04 | | | | 0.92 | |
| | | | | | | | | | | | | | | | | | | | |
| | | | | |
Less dividends and distributions: | | | | | | | | | | | | | | | | | | | | |
| | | | | |
Dividends from net investment income | | | (0.19 | ) | | | (0.19 | ) | | | (0.14 | ) | | | (0.14 | ) | | | 0 | |
| | | | | |
Distributions from net realized gain on investment transactions | | | 0 | | | | (0.76 | ) | | | (0.32 | ) | | | (0.12 | ) | | | 0 | |
| | | | | | | | | | | | | | | | | | | | |
| | | | | |
Total dividends and distributions | | | (0.19 | ) | | | (0.95 | ) | | | (0.46 | ) | | | (0.26 | ) | | | 0 | |
| | | | | | | | | | | | | | | | | | | | |
| | | | | |
Net asset value, end of period | | $ | 10.40 | | | $ | 10.40 | | | $ | 12.40 | | | $ | 12.70 | | | $ | 10.92 | |
| | | | | | | | | | | | | | | | | | | | |
| | | | | |
Total return (f) | | | 1.77% | | | | (8.03)% | | | | 1.29% | | | | 19.28% | | | | 9.20% | |
| | | | | |
| RATIOS/SUPPLEMENTAL DATA | | | | | | | | | | | | | | | | | | | | |
| | | | | |
Net assets, end of period (000 omitted) | | | $63,328 | | | | $64,993 | | | | $71,729 | | | | $73,531 | | | | $37,226 | |
| | | | | |
Average net assets (000 omitted) | | | $62,709 | | | | $64,757 | | | | $76,322 | | | | $55,325 | | | | $14,117 | |
| | | | | |
Ratio to average net assets of: | | | | | | | | | | | | | | | | | | | | |
| | | | | |
Expenses, net of waivers/reimbursements | | | 1.33% | | | | 1.35% | | | | 1.35% | | | | 1.35% | | | | 1.35% | (g) |
| | | | | |
Expenses, before waivers/reimbursements | | | 1.34% | | | | 1.35% | | | | 1.35% | | | | 1.36% | | | | 1.53% | (g) |
| | | | | |
Net investment income (c) | | | 1.02% | | | | 1.50% | | | | 1.07% | | | | 0.75% | | | | 1.38% | (g) |
| | | | | |
Portfolio turnover rate | | | 58% | | | | 46% | | | | 81% | | | | 65% | | | | 51% | |
See Footnote Summary on page 44.
See Notes to Financial Statements.
Financial Highlights (continued)
Selected per share data and ratios for a share of capital stock outstanding for each respective Portfolio for each of the periods presented:
| | | | | | | | | | | | | | | | | | | | |
| |
| | | INTERNATIONAL SMALL CAP PORTFOLIO
ADVISOR CLASS | |
| | | | | | | | | | | | | | | | | | | | |
| | | YEAR
ENDED
9/30/20 | | | YEAR
ENDED
9/30/19 | | | YEAR
ENDED
9/30/18 | | | YEAR
ENDED
9/30/17 | | | FOR THE
PERIOD
12/21/15(a) TO
9/30/16 | |
| | | | | |
Net asset value, beginning of period | | $ | 10.43 | | | $ | 12.43 | | | $ | 12.72 | | | $ | 10.93 | | | $ | 10.00 | |
| | | | | | | | | | | | | | | | | | | | |
| | | | | |
Income from investment operations | | | | | | | | | | | | | | | | | | | | |
| | | | | |
Investment income, net (b)(c) | | | 0.13 | | | | 0.19 | | | | 0.18 | | | | 0.10 | | | | 0.15 | |
| | | | | |
Net realized and unrealized gain (loss) on investment transactions and foreign currency transactions | | | 0.08 | | | | (1.21 | ) | | | 0.01 | | | | 1.96 | | | | 0.78 | |
| | | | | |
Contributions from affiliates | | | 0 | | | | 0 | | | | 0 | | | | 0.00 | (d) | | | 0 | |
| | | | | | | | | | | | | | | | | | | | |
| | | | | |
Total from investment operations | | | 0.21 | | | | (1.02 | ) | | | 0.19 | | | | 2.06 | | | | 0.93 | |
| | | | | | | | | | | | | | | | | | | | |
| | | | | |
Less dividends and distributions: | | | | | | | | | | | | | | | | | | | | |
| | | | | |
Dividends from net investment income | | | (0.22 | ) | | | (0.22 | ) | | | (0.16 | ) | | | (0.15 | ) | | | 0 | |
| | | | | |
Distributions from net realized gain on investment transactions | | | 0 | | | | (0.76 | ) | | | (0.32 | ) | | | (0.12 | ) | | | 0 | |
| | | | | | | | | | | | | | | | | | | | |
| | | | | |
Total dividends and distributions | | | (0.22 | ) | | | (0.98 | ) | | | (0.48 | ) | | | (0.27 | ) | | | 0 | |
| | | | | | | | | | | | | | | | | | | | |
| | | | | |
Net asset value, end of period | | $ | 10.42 | | | $ | 10.43 | | | $ | 12.43 | | | $ | 12.72 | | | $ | 10.93 | |
| | | | | | | | | | | | | | | | | | | | |
| | | | | |
Total return (f) | | | 1.90% | | | | (7.70)% | | | | 1.53% | | | | 19.51% | | | | 9.30% | |
| | | | | |
| RATIOS/SUPPLEMENTAL DATA | | | | | | | | | | | | | | | | | | | | |
| | | | | |
Net assets, end of period (000 omitted) | | | $748,799 | | | | $791,765 | | | | $810,447 | | | | $608,324 | | | | $367,468 | |
| | | | | |
Average net assets (000 omitted) | | | $750,872 | | | | $765,916 | | | | $745,535 | | | | $460,362 | | | | $230,324 | |
| | | | | |
Ratio to average net assets of: | | | | | | | | | | | | | | | | | | | | |
| | | | | |
Expenses, net of waivers/reimbursements | | | 1.09% | | | | 1.10% | | | | 1.10% | | | | 1.10% | | | | 1.10% | (g) |
| | | | | |
Expenses, before waivers/reimbursements | | | 1.09% | | | | 1.10% | | | | 1.10% | | | | 1.11% | | | | 1.22% | (g) |
| | | | | |
Net investment income (c) | | | 1.27% | | | | 1.77% | | | | 1.43% | | | | 0.93% | | | | 1.87% | (g) |
| | | | | |
Portfolio turnover rate | | | 58% | | | | 46% | | | | 81% | | | | 65% | | | | 51% | |
See Footnote Summary on page 44.
See Notes to Financial Statements.
| | | | | | | | | | | | | | | | | | | | |
| |
| | | INTERNATIONAL SMALL CAP PORTFOLIO
CLASS Z | |
| | | | | | | | | | | | | | | | | | | | |
| | | YEAR
ENDED
9/30/20 | | | YEAR
ENDED
9/30/19 | | | YEAR
ENDED
9/30/18 | | | YEAR
ENDED
9/30/17 | | | FOR THE
PERIOD
12/21/15(a) TO
9/30/16 | |
| | | | | |
Net asset value, beginning of period | | $ | 10.43 | | | $ | 12.43 | | | $ | 12.72 | | | $ | 10.93 | | | $ | 10.00 | |
| | | | | | | | | | | | | | | | | | | | |
| | | | | |
Income from investment operations | | | | | | | | | | | | | | | | | | | | |
| | | | | |
Investment income, net (b)(c) | | | 0.13 | | | | 0.18 | | | | 0.18 | | | | 0.10 | | | | 0.15 | |
| | | | | |
Net realized and unrealized gain (loss) on investment transactions and foreign currency transactions | | | 0.08 | | | | (1.20 | ) | | | 0.02 | | | | 1.96 | | | | 0.78 | |
| | | | | |
Contributions from affiliates | | | 0 | | | | 0 | | | | 0 | | | | 0.00 | (d) | | | 0 | |
| | | | | | | | | | | | | | | | | | | | |
| | | | | |
Total from investment operations | | | 0.21 | | | | (1.02 | ) | | | 0.20 | | | | 2.06 | | | | 0.93 | |
| | | | | | | | | | | | | | | | | | | | |
| | | | | |
Less dividends and distributions: | | | | | | | | | | | | | | | | | | | | |
| | | | | |
Dividends from net investment income | | | (0.22 | ) | | | (0.22 | ) | | | (0.17 | ) | | | (0.15 | ) | | | 0 | |
| | | | | |
Distributions from net realized gain on investment transactions | | | 0 | | | | (0.76 | ) | | | (0.32 | ) | | | (0.12 | ) | | | 0 | |
| | | | | | | | | | | | | | | | | | | | |
| | | | | |
Total dividends and distributions | | | (0.22 | ) | | | (0.98 | ) | | | (0.49 | ) | | | (0.27 | ) | | | 0 | |
| | | | | | | | | | | | | | | | | | | | |
| | | | | |
Net asset value, end of period | | $ | 10.42 | | | $ | 10.43 | | | $ | 12.43 | | | $ | 12.72 | | | $ | 10.93 | |
| | | | | | | | | | | | | | | | | | | | |
| | | | | |
Total return (f) | | | 1.91% | | | | (7.70)% | | | | 1.54% | | | | 19.52% | | | | 9.30% | |
| | | | | |
| RATIOS/SUPPLEMENTAL DATA | | | | | | | | | | | | | | | | | | | | |
| | | | | |
Net assets, end of period (000 omitted) | | | $398,208 | | | | $400,566 | | | | $427,851 | | | | $392,000 | | | | $254,068 | |
| | | | | |
Average net assets (000 omitted) | | | $388,053 | | | | $396,772 | | | | $424,411 | | | | $291,438 | | | | $187,312 | |
| | | | | |
Ratio to average net assets of: | | | | | | | | | | | | | | | | | | | | |
| | | | | |
Expenses, net of waivers/reimbursements | | | 1.08% | | | | 1.10% | | | | 1.10% | | | | 1.10% | | | | 1.10% | (g) |
| | | | | |
Expenses, before waivers/reimbursements | | | 1.08% | | | | 1.10% | | | | 1.10% | | | | 1.11% | | | | 1.26% | (g) |
| | | | | |
Net investment income (c) | | | 1.29% | | | | 1.75% | | | | 1.36% | | | | 0.87% | | | | 1.92% | (g) |
| | | | | |
Portfolio turnover rate | | | 58% | | | | 46% | | | | 81% | | | | 65% | | | | 51% | |
See Footnote Summary on page 44.
See Notes to Financial Statements.
Financial Highlights (continued)
Selected per share data and ratios for a share of capital stock outstanding for each respective Portfolio for each of the periods presented:
| | | | | | | | | | | | | | | | | | | | |
| |
| | | INTERNATIONAL STRATEGIC EQUITIES PORTFOLIO
SCB CLASS | |
| | | | | | | | | | | | | | | | | | | | |
| | | YEAR
ENDED
9/30/20 | | | YEAR
ENDED
9/30/19 | | | YEAR
ENDED
9/30/18 | | | YEAR
ENDED
9/30/17 | | | FOR THE
PERIOD
12/21/15(a) TO
9/30/16 | |
| | | | | |
Net asset value, beginning of period | | $ | 11.59 | | | $ | 12.45 | | | $ | 12.69 | | | $ | 10.57 | | | $ | 10.00 | |
| | | | | | | | | | | | | | | | | | | | |
|
Income from investment operations: | |
| | | | | |
Investment income, net (b)(c) | | | 0.16 | | | | 0.24 | | | | 0.22 | | | | 0.18 | | | | 0.21 | |
| | | | | |
Net realized and unrealized gain (loss) on investment transactions and foreign currency transactions | | | 0.06 | | | | (0.79 | ) | | | (0.11 | ) | | | 2.11 | | | | 0.36 | (e) |
| | | | | | | | | | | | | | | | | | | | |
| | | | | |
Total from investment operations | | | 0.22 | | | | (0.55 | ) | | | 0.11 | | | | 2.29 | | | | 0.57 | |
| | | | | | | | | | | | | | | | | | | | |
|
Less dividends and distributions: | |
| | | | | |
Dividends from net investment income | | | (0.23 | ) | | | (0.18 | ) | | | (0.09 | ) | | | (0.14 | ) | | | (0.00 | )(d) |
| | | | | |
Distributions from net realized gain on investment transactions | | | 0 | | | | (0.13 | ) | | | (0.26 | ) | | | (0.03 | ) | | | 0 | |
| | | | | | | | | | | | | | | | | | | | |
| | | | | |
Total dividends and distributions | | | (0.23 | ) | | | (0.31 | ) | | | (0.35 | ) | | | (0.17 | ) | | | (0.00 | ) |
| | | | | | | | | | | | | | | | | | | | |
| | | | | |
Net asset value, end of period | | $ | 11.58 | | | $ | 11.59 | | | $ | 12.45 | | | $ | 12.69 | | | $ | 10.57 | |
| | | | | | | | | | | | | | | | | | | | |
| | | | | |
Total return (f) | | | 1.81% | | | | (4.22)% | | | | 0.86% | | | | 22.01% | | | | 5.75% | |
|
| RATIOS/SUPPLEMENTAL DATA | |
| | | | | |
Net assets, end of period (000 omitted) | | | $172,253 | | | | $175,497 | | | | $181,606 | | | | $152,725 | | | | $68,977 | |
| | | | | |
Average net assets (000 omitted) | | | $171,155 | | | | $168,856 | | | | $179,015 | | | | $106,248 | | | | $27,169 | |
|
Ratio to average net assets of: | |
| | | | | |
Expenses, net of waivers/reimbursements | | | 1.00% | | | | 1.00% | | | | 1.03% | | | | 1.17% | | | | 1.20% | (g) |
| | | | | |
Expenses, before waivers/reimbursements | | | 1.00% | | | | 1.00% | | | | 1.04% | | | | 1.23% | | | | 1.34% | (g) |
| | | | | |
Net investment income (c) | | | 1.41% | | | | 2.07% | | | | 1.69% | | | | 1.62% | | | | 2.70% | (g) |
| | | | | |
Portfolio turnover rate | | | 63% | | | | 63% | | | | 69% | | | | 69% | | | | 79% | |
See Footnote Summary on page 44.
See Notes to Financial Statements.
| | | | | | | | | | | | | | | | | | | | |
| |
| | | INTERNATIONAL STRATEGIC EQUITIES PORTFOLIO ADVISOR CLASS | |
| | | | | | | | | | | | | | | | | | | | |
| | | YEAR
ENDED
9/30/20 | | | YEAR
ENDED
9/30/19 | | | YEAR
ENDED
9/30/18 | | | YEAR
ENDED
9/30/17 | | | FOR THE
PERIOD
12/21/15(a) TO
9/30/16 | |
| | | | | |
Net asset value, beginning of period | | $ | 11.63 | | | $ | 12.50 | | | $ | 12.72 | | | $ | 10.57 | | | $ | 10.00 | |
| | | | | | | | | | | | | | | | | | | | |
|
Income from investment operations | |
| | | | | |
Investment income, net (b)(c) | | | 0.19 | | | | 0.27 | | | | 0.26 | | | | 0.21 | | | | 0.23 | |
| | | | | |
Net realized and unrealized gain (loss) on investment transactions and foreign currency transactions | | | 0.06 | | | | (0.80 | ) | | | (0.11 | ) | | | 2.11 | | | | 0.35 | (e) |
| | | | | | | | | | | | | | | | | | | | |
| | | | | |
Total from investment operations | | | 0.25 | | | | (0.53 | ) | | | 0.15 | | | | 2.32 | | | | 0.58 | |
| | | | | | | | | | | | | | | | | | | | |
|
Less dividends and distributions: | |
| | | | | |
Dividends from net investment income | | | (0.26 | ) | | | (0.21 | ) | | | (0.11 | ) | | | (0.14 | ) | | | (0.01 | ) |
| | | | | |
Distributions from net realized gain on investment transactions | | | 0 | | | | (0.13 | ) | | | (0.26 | ) | | | (0.03 | ) | | | 0 | |
| | | | | | | | | | | | | | | | | | | | |
| | | | | |
Total dividends and distributions | | | (0.26 | ) | | | (0.34 | ) | | | (0.37 | ) | | | (0.17 | ) | | | (0.01 | ) |
| | | | | | | | | | | | | | | | | | | | |
| | | | | |
Net asset value, end of period | | $ | 11.62 | | | $ | 11.63 | | | $ | 12.50 | | | $ | 12.72 | | | $ | 10.57 | |
| | | | | | | | | | | | | | | | | | | | |
| | | | | |
Total return (f) | | | 2.04% | | | | (4.01)% | | | | 1.18% | | | | 22.38% | | | | 5.75% | |
|
| RATIOS/SUPPLEMENTAL DATA | |
| | | | | |
Net assets, end of period (000 omitted) | | | $2,510,243 | | | | $2,621,316 | | | | $2,568,426 | | | | $1,760,819 | | | | $737,765 | |
| | | | | |
Average net assets (000 omitted) | | | $2,529,235 | | | | $2,501,981 | | | | $2,275,780 | | | | $1,023,860 | | | | $459,166 | |
|
Ratio to average net assets of: | |
| | | | | |
Expenses, net of waivers/reimbursements | | | 0.75% | | | | 0.75% | | | | 0.77% | | | | 0.93% | | | | 0.95% | (g) |
| | | | | |
Expenses, before waivers/reimbursements | | | 0.75% | | | | 0.75% | | | | 0.79% | | | | 0.98% | | | | 1.06% | (g) |
| | | | | |
Net investment income (c) | | | 1.65% | | | | 2.35% | | | | 2.05% | | | | 1.85% | | | | 2.93% | (g) |
| | | | | |
Portfolio turnover rate | | | 63% | | | | 63% | | | | 69% | | | | 69% | | | | 79% | |
See Footnote Summary on page 44.
See Notes to Financial Statements.
Financial Highlights (continued)
Selected per share data and ratios for a share of capital stock outstanding for each respective Portfolio for each of the periods presented:
| | | | | | | | | | | | | | | | | | | | |
| |
| | | INTERNATIONAL STRATEGIC EQUITIES PORTFOLIO
CLASS Z | |
| | | | | | | | | | | | | | | | | | | | |
| | | YEAR
ENDED
9/30/20 | | | YEAR
ENDED
9/30/19 | | | YEAR
ENDED
9/30/18 | | | YEAR
ENDED
9/30/17 | | | FOR THE
PERIOD
12/21/15(a) TO
9/30/16 | |
| | | | | |
Net asset value, beginning of period | | $ | 11.64 | | | $ | 12.51 | | | $ | 12.73 | | | $ | 10.58 | | | $ | 10.00 | |
| | | | | | | | | | | | | | | | | | | | |
|
Income from investment operations | |
| | | | | |
Investment income, net (b)(c) | | | 0.19 | | | | 0.26 | | | | 0.25 | | | | 0.20 | | | | 0.24 | |
| | | | | |
Net realized and unrealized gain (loss) on investment transactions and foreign currency transactions | | | 0.05 | | | | (0.79 | ) | | | (0.10 | ) | | | 2.12 | | | | 0.35 | (e) |
| | | | | | | | | | | | | | | | | | | | |
| | | | | |
Total from investment operations | | | 0.24 | | | | (0.53 | ) | | | 0.15 | | | | 2.32 | | | | 0.59 | |
| | | | | | | | | | | | | | | | | | | | |
|
Less dividends and distributions: | |
| | | | | |
Dividends from net investment income | | | (0.25 | ) | | | (0.21 | ) | | | (0.11 | ) | | | (0.14 | ) | | | (0.01 | ) |
| | | | | |
Distributions from net realized gain on investment transactions | | | 0 | | | | (0.13 | ) | | | (0.26 | ) | | | (0.03 | ) | | | 0 | |
| | | | | | | | | | | | | | | | | | | | |
| | | | | |
Total dividends and distributions | | | (0.25 | ) | | | (0.34 | ) | | | (0.37 | ) | | | (0.17 | ) | | | (0.01 | ) |
| | | | | | | | | | | | | | | | | | | | |
| | | | | |
Net asset value, end of period | | $ | 11.63 | | | $ | 11.64 | | | $ | 12.51 | | | $ | 12.73 | | | $ | 10.58 | |
| | | | | | | | | | | | | | | | | | | | |
| | | | | |
Total return (f) | | | 2.02% | | | | (4.02)% | | | | 1.18% | | | | 22.35% | | | | 5.85% | |
|
| RATIOS/SUPPLEMENTAL DATA | |
| | | | | |
Net assets, end of period (000 omitted) | | | $1,349,824 | | | | $1,359,213 | | | | $1,420,930 | | | | $1,276,674 | | | | $421,721 | |
| | | | | |
Average net assets (000 omitted) | | | $1,331,995 | | | | $1,331,620 | | | | $1,390,312 | | | | $605,465 | | | | $295,180 | |
|
Ratio to average net assets of: | |
| | | | | |
Expenses, net of waivers/reimbursements | | | 0.76% | | | | 0.76% | | | | 0.79% | | | | 0.94% | | | | 0.95% | (g) |
| | | | | |
Expenses, before waivers/reimbursements | | | 0.76% | | | | 0.76% | | | | 0.80% | | | | 1.00% | | | | 1.10% | (g) |
| | | | | |
Net investment income (c) | | | 1.65% | | | | 2.31% | | | | 1.91% | | | | 1.74% | | | | 3.04% | (g) |
| | | | | |
Portfolio turnover rate | | | 63% | | | | 63% | | | | 69% | | | | 69% | | | | 79% | |
| (a) | | Commencement of operations. |
| (b) | | Based on average shares outstanding. |
| (c) | | Net of expenses waived by the Adviser. |
| (d) | | Amount is less than $.005. |
| (e) | | Due to timing of sales and repurchase of capital shares, the net realized and unrealized gain (loss) per share is not in accordance with the Portfolios’ change in net realized and unrealized gain (loss) on investment transactions for the period. |
| (f) | | Total investment return is calculated assuming an initial investment made at the net asset value at the beginning of the period, reinvestment of all dividends and distributions at net asset value during the period, and redemption on the last day of the period. Total return does not reflect the deduction of taxes that a shareholder would pay on fund distributions or the redemption of fund shares. Total investment return calculated for a period of less than one year is not annualized. |
| (g) | | Annualized, except for certain non-recurring fees. |
See Notes to Financial Statements.
Notes to Financial Statements
| NOTE 1. | Organization and Significant Accounting Policies |
Bernstein Fund, Inc. (the “Fund”) is registered under the Investment Company Act of 1940 as an open-end registered investment company. The Fund, which is a Maryland corporation, operates as a series company currently comprised of three portfolios: Small Cap Core Portfolio, International Small Cap Portfolio and International Strategic Equities Portfolio (hereafter collectively referred to as the “Portfolios” and each individually a “Portfolio”) with the following share classes offered: SCB Class, Advisor Class and Class Z. Class Z shares are currently offered exclusively to registered investment companies (or their series) managed by AllianceBernstein L.P. (the “Adviser”).
Each Portfolio has its own investment objectives. Each class of shares has identical voting, dividend, liquidation and other rights, except that the classes bear different distribution and transfer agency expenses. Each class has exclusive voting rights with respect to its distribution plan, as applicable. The financial statements have been prepared in conformity with U.S. generally accepted accounting principles (“U.S. GAAP”), which require management to make certain estimates and assumptions that affect the reported amounts of assets and liabilities in the financial statements and amounts of income and expenses during the reporting period. Actual results could differ from those estimates. Each Portfolio is an investment company under U.S. GAAP and follows the accounting and reporting guidance applicable to investment companies. The following is a summary of significant accounting policies followed by the Portfolios.
Portfolio securities are valued at their current market value determined on the basis of market quotations or, if market quotations are not readily available or are deemed unreliable, at “fair value” as determined in accordance with procedures established by and under the general supervision of the Fund’s Board of Directors (the “Board”).
In general, the market values of securities which are readily available and deemed reliable are determined as follows: securities listed on a national securities exchange (other than securities listed on the NASDAQ Stock Market, Inc. (“NASDAQ”)) or on a foreign securities exchange are valued at the last sale price at the close of the exchange or foreign securities exchange. If there has been no sale on such day, the securities are valued at the last traded price from the previous day. Securities listed on more than one exchange are valued by reference to the principal exchange on which the securities are traded; securities listed only on NASDAQ are valued in accordance with the NASDAQ Official Closing Price; listed or over the counter (“OTC”) market put or call options are valued at the mid level between the current bid and ask prices. If either a current bid or current ask price is unavailable, the Adviser will have discretion to determine the best valuation (e.g., last trade price in the case of listed options); open futures are valued using the closing settlement price or, in the absence of such a price, the most recent quoted bid price. If there are no quotations available for the day of valuation, the last available closing settlement price is used; U.S. Government securities and any other debt instruments having 60 days or less remaining until maturity are generally valued at market by an independent pricing vendor, if a market price is available. If a market price is not available, the securities are valued at amortized cost. This methodology is commonly used for short term securities that have an original maturity of 60 days or less, as well as short term securities that had an original term to maturity that exceeded 60 days. In instances when amortized cost is utilized, the Valuation Committee (the “Committee”) must reasonably conclude that the utilization of amortized cost is approximately the same as the fair value of the security. Such factors the Committee will consider include, but are not limited to, an impairment of the creditworthiness of the issuer or material changes in interest rates. Fixed-income securities, including mortgage-backed and asset-backed securities, may be valued on the basis of prices provided by a pricing service or at a price obtained from one or more of the major broker-dealers. In cases where broker-dealer quotes are obtained, the Adviser may establish procedures whereby changes in market yields or spreads are used to adjust, on a daily basis, a recently obtained quoted price on a security. Swaps and other derivatives are valued daily, primarily using independent pricing services, independent pricing models using market inputs, as well as third party broker-dealers or counterparties. Open end mutual funds are valued at the closing net asset value per share, while exchange traded funds are valued at the closing market price per share.
Securities for which market quotations are not readily available (including restricted securities) or are deemed unreliable are valued at fair value as deemed appropriate by the Adviser. Factors considered in making this determination may include, but are not limited to, information obtained by contacting the issuer, analysts, analysis of the issuer’s financial statements or other available documents. In addition, the Portfolios may use fair value pricing for securities primarily traded in non-U.S. markets because most foreign markets close well before the Portfolios value their securities at
Notes to Financial Statements (continued)
4:00 p.m., Eastern Time. The earlier close of these foreign markets gives rise to the possibility that significant events, including broad market moves, may have occurred in the interim and may materially affect the value of those securities. To account for this, the Portfolios generally value many of their foreign equity securities using fair value prices based on third party vendor modeling tools to the extent available.
| B. | | Fair Value Measurements |
In accordance with U.S. GAAP regarding fair value measurements, fair value is defined as the price that the Portfolios would receive to sell an asset or pay to transfer a liability in an orderly transaction between market participants at the measurement date. U.S. GAAP establishes a framework for measuring fair value, and a three-level hierarchy for fair value measurements based upon the transparency of inputs to the valuation of an asset or liability (including those valued based on their market values as described in Note A above). Inputs may be observable or unobservable and refer broadly to the assumptions that market participants would use in pricing the asset or liability. Observable inputs reflect the assumptions market participants would use in pricing the asset or liability based on market data obtained from sources independent of the Portfolios. Unobservable inputs reflect the Portfolios’ own assumptions about the assumptions that market participants would use in pricing the asset or liability based on the best information available in the circumstances. Each investment is assigned a level based upon the observability of the inputs which are significant to the overall valuation. The three-tier hierarchy of inputs is summarized below.
| | • | | Level 1—quoted prices in active markets for identical investments |
| | • | | Level 2—other significant observable inputs (including quoted prices for similar investments, interest rates, prepayment speeds, credit risk, etc.) |
| | • | | Level 3—significant unobservable inputs (including the Portfolios’ own assumptions in determining the fair value of investments) |
The fair value of debt instruments, such as bonds, and over-the-counter derivatives is generally based on market price quotations, recently executed market transactions (where observable) or industry recognized modeling techniques and are generally classified as Level 2. Pricing vendor inputs to Level 2 valuations may include quoted prices for similar investments in active markets, interest rate curves, coupon rates, currency rates, yield curves, option adjusted spreads, default rates, credit spreads and other unique security features in order to estimate the relevant cash flows which are then discounted to calculate fair values. If these inputs are unobservable and significant to the fair value, these investments will be classified as Level 3.
Where readily available market prices or relevant bid prices are not available for certain equity investments, such investments may be valued based on similar publicly traded investments, movements in relevant indices since last available prices or based upon underlying company fundamentals and comparable company data (such as multiples to earnings or other multiples to equity). Where an investment is valued using an observable input, such as another publicly traded security, the investment will be classified as Level 2. If management determines that an adjustment is appropriate based on restrictions on resale, illiquidity or uncertainty, and such adjustment is a significant component of the valuation, the investment will be classified as Level 3. An investment will also be classified as Level 3 where management uses company fundamentals and other significant inputs to determine the valuation.
The following tables summarize the valuation of the Portfolios’ investments by the above fair value hierarchy levels as of September 30, 2020:
| | | | | | | | | | | | | | | | |
SMALL CAP CORE PORTFOLIO INVESTMENTSIN SECURITIES: | | LEVEL 1 | | | LEVEL 2 | | | LEVEL 3 | | | TOTAL | |
|
Assets: | |
| | | | |
Common Stocks (a) | | $ | 652,301,275 | | | $ | 0 | | | $ | 0 | | | $ | 652,301,275 | |
| | | | |
Short-Term Investments | | | 3,935,753 | | | | 0 | | | | 0 | | | | 3,935,753 | |
| | | | |
Total Investments in Securities | | | 656,237,028 | | | | 0 | | | | 0 | | | | 656,237,028 | |
| | | | |
Other Financial Instruments (b): | | | | | | | | | | | | | | | | |
Assets | | | 0 | | | | 0 | | | | 0 | | | | 0 | |
|
Liabilities: | |
| | | | |
Futures | | | (192,005 | ) | | | 0 | | | | 0 | | | | (192,005 | )(c) |
| | | | |
Total | | $ | 656,045,023 | | | $ | 0 | | | $ | 0 | | | $ | 656,045,023 | |
| | | | |
INTERNATIONAL SMALL CAP PORTFOLIO
INVESTMENTSIN SECURITIES: | | LEVEL 1 | | | LEVEL 2 | | | LEVEL 3 | | | TOTAL | |
|
Assets: | |
Common Stocks: | | | | | | | | | | | | | | | | |
| | | | |
Industrials | | $ | 31,951,599 | | | $ | 162,896,508 | | | $ | 0 | | | $ | 194,848,107 | |
| | | | |
Information Technology | | | 14,020,809 | | | | 163,960,376 | | | | 0 | | | | 177,981,185 | |
| | | | |
Consumer Discretionary | | | 15,902,087 | | | | 148,715,193 | | | | 0 | | | | 164,617,280 | |
| | | | |
Financials | | | 7,043,390 | | | | 119,266,500 | | | | 0 | | | | 126,309,890 | |
| | | | |
Consumer Staples | | | 2,881,308 | | | | 105,913,944 | | | | 0 | | | | 108,795,252 | |
| | | | |
Materials | | | 13,577,967 | | | | 78,077,280 | | | | 0 | | | | 91,655,247 | |
| | | | |
Health Care | | | 18,576,126 | | | | 72,888,872 | | | | 0 | | | | 91,464,998 | |
| | | | |
Communication Services | | | 13,314,795 | | | | 76,535,572 | | | | 0 | | | | 89,850,367 | |
| | | | |
Real Estate | | | 15,659,003 | | | | 55,971,916 | | | | 0 | | | | 71,630,919 | |
| | | | |
Utilities | | | 18,879,309 | | | | 31,808,390 | | | | 0 | | | | 50,687,699 | |
| | | | |
Energy | | | 1,991,332 | | | | 17,851,268 | | | | 0 | | | | 19,842,600 | |
| | | | |
Short-Term Investments | | | 12,832,082 | | | | 0 | | | | 0 | | | | 12,832,082 | |
| | | | |
Total Investments in Securities | | | 166,629,807 | | | | 1,033,885,819 | (d) | | | 0 | | | | 1,200,515,626 | |
| | | | |
Other Financial Instruments (b): | | | | | | | | | | | | | | | | |
|
Assets: | |
| | | | |
Forward Currency Exchange Contracts | | | 0 | | | | 2,991,679 | | | | 0 | | | | 2,991,679 | |
|
Liabilities: | |
| | | | |
Forward Currency Exchange Contracts | | | 0 | | | | (2,261,802 | ) | | | 0 | | | | (2,261,802 | ) |
| | | | |
Total | | $ | 166,629,807 | | | $ | 1,034,615,696 | | | $ | 0 | | | $ | 1,201,245,503 | |
Notes to Financial Statements (continued)
| | | | | | | | | | | | | | | | |
INTERNATIONAL STRATEGIC EQUITIES PORTFOLIO INVESTMENTSIN SECURITIES: | | LEVEL 1 | | | LEVEL 2 | | | LEVEL 3 | | | TOTAL | |
|
Assets: | |
Common Stocks: | | | | | | | | | | | | | | | | |
| | | | |
Information Technology | | $ | 144,640,864 | | | $ | 550,407,881 | | | $ | 0 | | | $ | 695,048,745 | |
| | | | |
Consumer Discretionary | | | 64,848,615 | | | | 477,501,011 | | | | 0 | | | | 542,349,626 | |
| | | | |
Consumer Staples | | | 24,095,880 | | | | 483,310,253 | | | | 0 | | | | 507,406,133 | |
| | | | |
Financials | | | 10,181,053 | | | | 411,740,476 | | | | 0 | | | | 421,921,529 | |
| | | | |
Health Care | | | 0 | | | | 404,394,241 | | | | 0 | | | | 404,394,241 | |
| | | | |
Communication Services | | | 0 | | | | 399,715,403 | | | | 0 | | | | 399,715,403 | |
| | | | |
Industrials | | | 0 | | | | 331,190,466 | | | | 0 | | | | 331,190,466 | |
| | | | |
Materials | | | 0 | | | | 275,198,943 | | | | 0 | | | | 275,198,943 | |
| | | | |
Utilities | | | 22,752,254 | | | | 145,322,722 | | | | 0 | | | | 168,074,976 | |
| | | | |
Energy | | | 18,424,017 | | | | 89,142,821 | | | | 0 | | | | 107,566,838 | |
| | | | |
Real Estate | | | 0 | | | | 91,186,782 | | | | 0 | | | | 91,186,782 | |
| | | | |
Short-Term Investments | | | 62,019,823 | | | | 0 | | | | 0 | | | | 62,019,823 | |
| | | | |
Total Investments in Securities | | | 346,962,506 | | | | 3,659,110,999 | (d) | | | 0 | | | | 4,006,073,505 | |
| | | | |
Other Financial Instruments (b): | | | | | | | | | | | | | | | | |
|
Assets: | |
| | | | |
Forward Currency Exchange Contracts | | | 0 | | | | 12,730,669 | | | | 0 | | | | 12,730,669 | |
|
Liabilities: | |
| | | | |
Forward Currency Exchange Contracts | | | 0 | | | | (12,503,708 | ) | | | 0 | | | | (12,503,708 | ) |
| | | | |
Total | | $ | 346,962,506 | | | $ | 3,659,337,960 | | | $ | 0 | | | $ | 4,006,300,466 | |
| | (a) | See Schedule of Investments for sector classifications. |
| | (b) | Other financial instruments are derivative instruments, such as futures, forwards and swaps, which are valued at the unrealized appreciation/(depreciation) on the instrument. Other financial instruments may also include swaps with upfront premiums, options written and swaptions written which are valued at market value. |
| | (c) | Only variation margin receivable/(payable) at period end is reported within the statement of assets and liabilities. This amount reflects cumulative unrealized appreciation/(depreciation) on futures and centrally cleared swaps as reported in the schedule of investments. Where applicable, centrally cleared swaps with upfront premiums are presented here at market value. |
| | (d) | A significant portion of the Portfolio’s foreign equity investments are categorized as Level 2 investments since they are valued using fair value prices based on third party vendor modeling tools to the extent available, see Note 1.A. |
| C. | | Foreign Currency Translation |
The accounting records of the Portfolios are maintained in U.S. dollars. Prices of securities and other assets and liabilities denominated in non-U.S. currencies are translated into U.S. dollars using the exchange rate at 4:00 p.m., Eastern Time. Amounts related to the purchases and sales of securities, investment income and expenses are translated at the rates of exchange prevailing on the respective dates of such transactions.
Net realized gain or loss on foreign currency transactions represents net foreign exchange gains or losses from the disposition of foreign currencies, currency gains or losses realized between the trade and settlement dates on security transactions and the difference between the amount of dividends, interest and foreign withholding taxes recorded on the Portfolios’ books and the U.S. dollar equivalent amount actually received or paid. Net unrealized currency gains and losses arising from valuing foreign currency denominated assets and liabilities, other than security investments, at the current exchange rate are reflected as part of unrealized appreciation/depreciation on foreign currencies.
The Portfolios do not isolate that portion of the results of operations arising as a result of changes in the foreign exchange rates from the changes in the market prices of securities held at period end. The Portfolios do isolate the effect of changes in foreign exchange rates from changes in market prices of securities sold during the year, as required by the Internal Revenue Code. The International Small Cap Portfolio and International Strategic Equities Portfolio may invest in foreign securities and foreign currency transactions that may involve risks not associated with domestic investments as a result of the level of governmental supervision and regulation of foreign securities markets and the possibility of political or economic instability, among others.
Each Portfolio is treated as a separate entity for federal income tax purposes. Each Portfolio intends to continue to comply with the requirements of Subchapter M of the Internal Revenue Code of 1986 as they apply to regulated investment companies. By so complying, each Portfolio will not be subject to federal and state income taxes to the extent that all of its income is distributed. The Portfolios may be subject to taxes imposed by countries in which they invest. Such taxes are generally based on income and/or capital gains earned or repatriated. Taxes are accrued and applied to net investment income, net realized gains and net unrealized appreciation/depreciation as such income and/or gains are earned based on, management’s understanding of applicable local tax law.
In accordance with U.S. GAAP requirements regarding accounting for uncertainties in income taxes, management has analyzed the Portfolios’ tax positions taken or expected to be taken on federal and state income tax returns for all open tax years (the current and the prior three tax years) and has concluded that no provision for income tax is required in the Portfolios’ financial statements.
| E. | | Security Transactions and Related Investment Income |
Security transactions are accounted for on the trade date (the date the buy or sell order is executed). Securities gains and losses are calculated on the identified cost basis. Interest income is recorded on the accrual basis and dividend income is recorded on the ex-dividend date or as soon as the Portfolios are informed of the dividend. The Portfolios amortize premiums and accrete discounts as adjustments to interest income. The Portfolio accounts for distributions received from REIT investments or from regulated investment companies as dividend income, realized gain, or return of capital based on information provided by the REIT or the investment company.
| F. | | Securities Transactions on a When-Issued or Delayed-Delivery Basis |
Each Portfolio may purchase securities on a when-issued basis or purchase or sell securities on a delayed-delivery basis. At the time a Portfolio commits to purchase a security on a when-issued or delayed-delivery basis, the Portfolio will record the transaction and use the security’s value in determining the Portfolio’s net asset value. At the time a Portfolio commits to sell a security on a delayed-delivery basis, the Portfolio will record the transaction and exclude the security’s value in determining the Portfolio’s net asset value.
All income earned and expenses incurred by the Portfolios are borne on a pro-rata basis by each outstanding class of shares, based on the proportionate interest in the Portfolio represented by the shares of such class, except for class specific expenses which are allocated to the respective class. Expenses of the Fund are charged proportionately to each Portfolio or based on other appropriate methods. Realized and unrealized gains and losses are allocated among the various share classes based on respective net assets.
| H. | | Distribution of Income and Gains |
Dividends from net investment income, if any, will be paid to shareholders at least once a year.
Distributions of net realized gains, less any available loss carryforwards, if any, for all the Portfolios will be paid to shareholders at least once a year, and recorded on the ex-dividend date.
Notes to Financial Statements (continued)
Elements of realized gains and net investment income may be recorded in different accounting periods for financial reporting (book) and federal income tax (tax) purposes (temporary differences). To the extent that such distributions required for tax purposes exceed income and gains recorded for book purposes as a result of such temporary differences, “excess distributions” are reflected in the accompanying statement of assets and liabilities. To the extent distributions exceed income and gains for tax purposes, such distributions would be shown as “return of capital” on the statement of changes in net assets. Certain other differences—permanent differences—arise because treatment of elements of income and gains is different between book and tax accounting. Permanent differences are reclassified in the year they arise.
Permanent differences have no effect on net assets. As of September 30, 2020, there were no permanent differences on each Portfolio.
| NOTE 2. | Investment Management and Transactions with Affiliated Persons |
Under the Investment Management Agreement between the Fund and the Adviser, the Adviser manages the investment of each Portfolio’s assets, places purchase and sale orders, and bears various expenses, including the salaries and expenses of all personnel except those of outside directors. In addition, the Adviser agrees to permit its directors, officers and employees who may be elected directors or officers of the Fund to serve in the capacities to which they are elected. The Adviser renders these services subject to the general oversight of the Board.
The Portfolios pay the Adviser an investment management fee at an annualized rate as follows:
Small Cap Core Portfolio: 0.80% of the Portfolio’s average daily net assets.
International Small Cap Portfolio: 1.00% of the Portfolio’s average daily net assets.
| | | | | | | | | | | | |
| ANNUAL PERCENTAGE OF AVERAGE DAILY NET ASSETS OF EACH PORTFOLIO | |
| | | FIRST $2.5 BILLION | | | NEXT $2.5 BILLION | | | THEREAFTER | |
| International Strategic Equities | | | 0.75 | % | | | 0.65 | % | | | 0.60 | % |
The Adviser has agreed to waive its fees and bear certain expenses to the extent necessary to limit the total portfolio operating expenses (excluding acquired fund fees and expenses other than the advisory fees of any AB mutual funds in which the Portfolios may invest, interest expense, taxes, extraordinary expenses, and brokerage commissions and other transaction costs) as a percentage of daily average net assets on an annual basis (the “Expense Caps”) as follows:
| | | | | | | | | | | | |
| PORTFOLIO | | SCB CLASS | | | ADVISOR CLASS | | | CLASS Z | |
| Small Cap Core | | | 1.30 | % | | | 1.05 | % | | | 1.05 | % |
| | | |
| International Small Cap | | | 1.35 | % | | | 1.10 | % | | | 1.10 | % |
The Expense Caps described above for Small Cap Core and International Small Cap may not be terminated by the Adviser before January 28, 2021. During the year ended September 30, 2020, there were no such reimbursement/waivers. Effective January 27, 2018, the Expense Caps for International Strategic Equities of 1.20%, 0.95% and 0.95% of the daily average net assets for SCB Class, Advisor Class and Class Z shares, respectively, were terminated.
Any fees waived and expenses borne by the Adviser for the Portfolios through September 30, 2016 were subject to repayment by the Portfolios until September 30, 2019; such waivers that are subject to repayment amounted to:
| | | | |
| PORTFOLIO | | AMOUNT | |
Small Cap Core | | $ | 161,882 | |
| |
International Small Cap | | | 420,136 | |
| |
International Strategic Equities | | | 425,084 | |
Any fees waived and expenses borne by the Adviser from October 1, 2016 through January 4, 2017 are subject to repayment by the Portfolios until September 30, 2020; such waivers that are subject to repayment amounted to:
| | | | |
| PORTFOLIO | | AMOUNT | |
Small Cap Core | | $ | 0 | |
| |
International Small Cap | | | 20,030 | |
| |
International Strategic Equities | | | 1,709 | |
During the year ended September 30, 2017, the Small Cap Core Portfolio, International Small Cap Portfolio and International Strategic Equities Portfolio made repayments to the Adviser in the amounts of $161,882, $27,230 and $426,793, respectively. During the year ended September 30, 2018, the International Small Cap Portfolio made repayments to the Adviser in the amount of $141,360. During the year ended September 30, 2019, the International Small Cap Portfolio made repayments to the Adviser in the amount of $239,327. During the year ended September 30, 2020, the International Small Cap Portfolio made repayments to the Adviser in the amount of $17,600. In any case, no repayment will be made that would cause the Portfolios’ total annual fund operating expenses to exceed the net fee percentage set forth per the Expense Caps.
During the second quarter of 2018, AXA S.A. (“AXA”), a French holding company for the AXA Group, completed the sale of a minority stake in its subsidiary, AXA Equitable Holdings, Inc. (now named Equitable Holdings, Inc.) (“Equitable”), through an initial public offering. Equitable is the holding company for a diverse group of financial services companies, including an approximate 65% economic interest in the Adviser and a 100% interest in AllianceBernstein Corporation, the general partner of the Adviser. Since the initial sale, AXA has completed additional offerings, most recently during the fourth quarter of 2019. As a result, AXA currently owns less than 10% of the outstanding shares of common stock of Equitable, and no longer owns a controlling interest in Equitable. AXA previously announced its intention to sell its entire interest in Equitable over time, subject to market conditions and other factors (the “Plan”). Most of AXA’s remaining Equitable shares are to be delivered on redemption of AXA bonds mandatorily exchangeable into Equitable shares and maturing in May 2021. AXA retains sole discretion to determine the timing of any future sales of its remaining shares of Equitable common stock.
Sales under the Plan that were completed on November 13, 2019 resulted in the indirect transfer of a “controlling block” of voting securities of the Adviser (a “Change of Control Event”) and may have been deemed to have been an “assignment” causing a termination of the Portfolios’ investment advisory and administration agreements. In order to ensure that investment advisory and administration services could continue uninterrupted in the event of a Change of Control Event, the Board previously approved new investment advisory and administration agreements with the Adviser, and shareholders of the Portfolios subsequently approved the new investment advisory agreement. These agreements became effective on November 13, 2019.
| B. | | Shareholder Servicing Fee; Transfer Agency Fee |
Under the Shareholder Servicing Agreement between the Fund and the Adviser, the Adviser pays expenses it incurs in providing shareholder servicing to the Fund, the Portfolios and individual shareholders. Such services include, but are not limited to, providing information to shareholders concerning their fund investments, systematic withdrawal plans, fund dividend payments and reinvestments, shareholder account or transactions status, net asset value of shares, fund performance, fund services, plans and options, fund investment policies, portfolio holdings and tax consequences of fund investments; dealing with shareholder complaints and other correspondence relating to fund matters; and communications with shareholders when proxies are being solicited from them with respect to voting their fund shares. Under the agreement, the fee paid by each Portfolio to the Adviser for services is 0.25% of the average daily net assets of SCB Class Shares.
The Fund compensates AllianceBernstein Investor Services, Inc. (“ABIS”), a wholly-owned subsidiary of the Adviser, under a Transfer Agency Agreement for providing personnel and facilities to perform transfer agency services for the Fund. ABIS may make payments to intermediaries that provide omnibus account services, sub accounting services and/or networking services. For the year ended September 30, 2020, the compensation retained by ABIS amounted to: Small Cap Core Portfolio, $239,284; International Small Cap Portfolio, $229,931; and International Strategic Equities Portfolio, $419,211.
Notes to Financial Statements (continued)
| C. | | Distribution Arrangements |
Under the Distribution Agreement between the Fund, on behalf of each Portfolio, and Sanford C. Bernstein & Co., LLC (the “Distributor”), the Distributor agrees to act as agent to sell shares of the Portfolios. The Distributor receives no fee for this service, and furthermore agrees to pay all expenses arising from the performance of its obligations under this agreement. The Distributor is a wholly owned subsidiary of the Adviser.
| D. | | Investments in Affiliated Issuers |
The Portfolios may invest in AB Government Money Market Portfolio (the “Government Money Market Portfolio”), advised by the Adviser, which has a contractual annual advisory fee rate of .20% of the portfolio’s average daily net assets and bears its own expenses. The Adviser has contractually agreed to waive .10% of the advisory fee of Government Money Market Portfolio (resulting in a net advisory fee of .10%) until August 31, 2021. In connection with the investment by the Portfolios in Government Money Market Portfolio, the Adviser has contractually agreed to waive its advisory fee from the Portfolios in an amount equal to each Portfolio’s pro rata share of the effective advisory fee of Government Money Market Portfolio, as borne indirectly by the Portfolios as an acquired fund fee and expense. For the year ended September 30, 2020, such waivers amounted to:
| | | | |
| PORTFOLIO | | AMOUNT | |
Small Cap Core | | $ | 3,248 | |
| |
International Small Cap | | | 10,210 | |
| |
International Strategic Equities | | | 44,289 | |
A summary of the Portfolios’ transactions in shares of the Government Money Market Portfolio for the year ended September 30, 2020 is as follows:
| | | | | | | | | | | | | | | | | | | | |
| PORTFOLIO | | MARKET VALUE 9/30/19 (000) | | | PURCHASES AT COST (000) | | | SALES PROCEEDS (000) | | | MARKET VALUE 9/30/20 (000) | | | DIVIDEND INCOME (000) | |
Small Cap Core | | $ | 0 | | | $ | 158,287 | | | $ | 154,351 | | | $ | 3,936 | | | $ | 28 | |
| | | | | |
International Small Cap | | | 29,940 | | | | 241,812 | | | | 258,920 | | | | 12,832 | | | | 100 | |
| | | | | |
International Strategic Equities | | | 19,510 | | | | 916,528 | | | | 874,018 | | | | 62,020 | | | | 281 | |
| NOTE 3. | Investment Security Transactions |
For the year ended September 30, 2020, the Portfolios had purchases and sales transactions, excluding transactions in short-term instruments, as follows:
| | | | | | | | | | | | | | | | |
| PORTFOLIO | | PURCHASES EXCLUDING U.S. GOVERNMENT SECURITIES | | | PURCHASES OF U.S. GOVERNMENT SECURITIES | | | SALES EXCLUDING U.S. GOVERNMENT SECURITIES | | | SALES OF U.S. GOVERNMENT SECURITIES | |
Small Cap Core | | $ | 764,483,634 | | | $ | 0 | | | $ | 1,019,631,419 | | | $ | 0 | |
| | | | |
International Small Cap | | | 690,798,499 | | | | 0 | | | | 729,911,355 | | | | 0 | |
| | | | |
International Strategic Equities | | | 2,505,067,635 | | | | 0 | | | | 2,693,238,795 | | | | 0 | |
The cost of investments for federal income tax purposes, gross unrealized appreciation and unrealized depreciation are as follows:
| | | | | | | | | | | | | | | | |
| | | | | | GROSS UNREALIZED | | | NET UNREALIZED APPRECIATION (DEPRECIATION) | |
| PORTFOLIO | | COST | | | APPRECIATION | | | (DEPRECIATION) | |
Small Cap Core | | $ | 599,347,763 | | | $ | 116,240,448 | | | $ | (59,351,183 | ) | | $ | 56,889,265 | |
| | | | |
International Small Cap | | | 1,116,456,470 | | | | 200,849,570 | | | | (117,016,087 | ) | | | 83,833,483 | |
| | | | |
International Strategic Equities | | | 3,544,377,114 | | | | 664,500,136 | | | | (202,820,152 | ) | | | 461,679,984 | |
| B. | | Derivative Financial Instruments |
Each Portfolio may use derivatives in an effort to earn income and enhance returns, to replace more traditional direct investments, to obtain exposure to otherwise inaccessible markets (collectively, “investment purposes”), or to hedge or adjust the risk profile of its portfolio.
The principal types of derivatives utilized by the Portfolios, as well as the methods in which they may be used are:
Each Portfolio may buy or sell futures for investment purposes or for the purpose of hedging its portfolio against adverse effects of potential movements in the market. The Portfolios bear the market risk that arises from changes in the value of these instruments and the imperfect correlation between movements in the price of the futures and movements in the price of the assets, reference rates or indices which they are designed to track. Among other things, the Portfolios may purchase or sell futures for foreign currencies or options thereon for non-hedging purposes as a means of making direct investment in foreign currencies, as described below under “Currency Transactions”.
At the time a Portfolio enters into futures, a Portfolio deposits and maintains as collateral an initial margin with the broker, as required by the exchange on which the transaction is effected. Such amount is shown as cash collateral due from broker on the statement of assets and liabilities. Pursuant to the contract, the Portfolios agree to receive from or pay to the broker an amount of cash equal to the daily fluctuation in the value of the contract. Such receipts or payments are known as variation margin and are recorded by the Portfolios as unrealized gains or losses. Risks may arise from the potential inability of a counterparty to meet the terms of the contract. The credit/counterparty risk for exchange-traded futures is generally less than privately negotiated futures, since the clearinghouse, which is the issuer or counterparty to each exchange-traded future, has robust risk mitigation standards, including the requirement to provide initial and variation margin. When the contract is closed, the Portfolios record a realized gain or loss equal to the difference between the value of the contract at the time it was opened and the time it was closed.
Use of long futures subjects the Portfolios to risk of loss in excess of the amounts shown on the statement of assets and liabilities, up to the notional value of the futures. Use of short futures subjects the Portfolios to unlimited risk of loss. Each Portfolio may enter into futures only on exchanges or boards of trade. The exchange or board of trade acts as the counterparty to each futures transactions; therefore, the Portfolios’ credit risk is subject to failure of the exchange or board of trade. Under some circumstances, futures exchanges may establish daily limits on the amount that the price of futures can vary from the previous day’s settlement price, which could effectively prevent liquidation of unfavorable positions.
During the year ended September 30, 2020, the Small Cap Core Portfolio held futures for non-hedging purposes.
| | • | | Forward Currency Exchange Contracts |
Each Portfolio may enter into forward currency exchange contracts on either a spot (i.e., cash) or forward basis. Spot contracts are entered into at the rate then prevailing in the currency-exchange market. Forward currency exchange contracts obligate the contracting parties to purchase or sell a specific currency at a specified future date at a specified price. The Portfolios will generally not enter into a forward currency exchange contract with a term greater than one year. The gain or loss arising from the difference between the original contract and the closing of such contract would be included in net realized gain or loss on foreign currency transactions. Fluctuations in the value of open forward currency exchange contracts are recorded for financial reporting purposes as unrealized appreciation and/or depreciation by the Portfolio. Risks may arise from the potential inability of a counterparty to meet the terms of a contract and from unanticipated movements in the value of a foreign currency relative to the U.S. dollar.
Notes to Financial Statements (continued)
Forward currency exchange contracts used to protect the Portfolios from adverse currency movements involve the risk that the Adviser may not accurately predict currency movements. As a result, total return could be adversely affected. The Adviser may seek investment opportunities by taking long or short positions in currencies through the use of currency-related derivatives, including forward currency exchange contracts, futures and options on futures, swaps and other options. The Adviser may enter into foreign currency transactions for investment opportunities when it anticipates that a foreign currency will appreciate or depreciate in value.
Under certain circumstances, the Portfolios may commit a substantial portion or the entire value of the Portfolios to the consummation of these contracts. The Adviser will consider the effect that a substantial commitment of assets to forward currency exchange contracts would have on the investment program of the Portfolios and the flexibility of the Portfolios to purchase additional securities.
During the year ended September 30, 2020, the International Small Cap Portfolio and International Strategic Equities Portfolio held forward currency exchange contracts for hedging purposes.
A Portfolio typically enters into International Swaps and Derivatives Association, Inc. Master Agreements (“ISDA Master Agreement”) with its OTC derivative contract counterparties in order to, among other things, reduce its credit risk to OTC counterparties. ISDA Master Agreements include provisions for general obligations, representations, collateral and events of default or termination. Under an ISDA Master Agreement, a Portfolio typically may offset with the OTC counterparty certain derivative financial instruments’ payables and/or receivables with collateral held and/or posted and create one single net payment (close-out netting) in the event of default or termination. In the event of a default by an OTC counterparty, the return of collateral with market value in excess of a Portfolio’s net liability, held by the defaulting party, may be delayed or denied.
A Portfolio’s ISDA Master Agreements may contain provisions for early termination of OTC derivative transactions in the event the net assets of a Portfolio decline below specific levels (“net asset contingent features”). If these levels are triggered, a Portfolio’s OTC counterparty has the right to terminate such transaction and require the Portfolio to pay or receive a settlement amount in connection with the terminated transaction. If OTC derivatives were held at period end, please refer to netting arrangements by the OTC counterparty tables below for additional details.
During the year ended September 30, 2020, the Portfolios had entered into the following derivatives:
| | | | | | | | | | | | |
| SMALL CAP CORE PORTFOLIO | | ASSET DERIVATIVES | | | LIABILITY DERIVATIVES | |
| DERIVATIVE TYPE | | STATEMENTOF ASSETS
AND LIABILITIES
LOCATION | | FAIR VALUE | | | STATEMENTOF ASSETS
AND LIABILITIES LOCATION | | FAIR VALUE | |
| | | | |
Equity contracts | | | | | | | | Receivable/Payable for variation margin on futures | | $ | 192,005 | * |
| | | | |
Total | | | | | | | | | | $ | 192,005 | |
| | * | Only variation margin receivable/payable at period end is reported within the statement of assets and liabilities. This amount reflects cumulative unrealized appreciation/(depreciation) on futures and centrally cleared swaps as reported in the schedule of investments. |
| | | | | | | | | | | | |
| DERIVATIVE TYPE | | LOCATIONOF GAINOR (LOSS)ON
DERIVATIVES WITHIN STATEMENT
OF OPERATIONS | | REALIZED GAIN
OR (LOSS)ON
DERIVATIVES | | | CHANGE IN UNREALIZED
APPRECIATIONOR
(DEPRECIATION) | |
| | | |
Equity contracts | | Net realized gain (loss) on futures; Net change in unrealized appreciation/depreciation of futures | | $ | (620,958 | ) | | $ | 478,411 | |
| | | |
Total | | | | $ | (620,958 | ) | | $ | 478,411 | |
| | | | | | | | | | | | |
INTERNATIONAL SMALL
CAP PORTFOLIO | | ASSET DERIVATIVES | | | LIABILITY DERIVATIVES | |
| DERIVATIVE TYPE | | STATEMENTOF ASSETS
AND LIABILITIES
LOCATION | | FAIR VALUE | | | STATEMENTOF ASSETS
AND LIABILITIES LOCATION | | FAIR VALUE | |
| | | | |
Foreign currency contracts | | Unrealized appreciation on forward currency exchange contracts | | $ | 2,991,679 | | | Unrealized depreciation on forward currency exchange contracts | | $ | 2,261,802 | |
| | | | |
Total | | | | $ | 2,991,679 | | | | | $ | 2,261,802 | |
| | | | | | | | | | | | |
| DERIVATIVE TYPE | | LOCATIONOF GAINOR (LOSS)ON
DERIVATIVES WITHIN STATEMENT
OF OPERATIONS | | REALIZED GAIN
OR (LOSS)ON
DERIVATIVES | | | CHANGE IN UNREALIZED
APPRECIATIONOR
(DEPRECIATION) | |
| | | |
Foreign exchange contracts | | Net realized gain (loss) on forward currency exchange contracts; Net change in unrealized appreciation/depreciation of forward currency exchange contracts | | $ | 728,736 | | | $ | 322,312 | |
| | | |
Total | | | | $ | 728,736 | | | $ | 322,312 | |
| | | | | | | | | | | | |
INTERNATIONAL STRATEGIC
EQUITIES PORTFOLIO | | ASSET DERIVATIVES | | | LIABILITY DERIVATIVES | |
| DERIVATIVE TYPE | | STATEMENTOF ASSETS
AND LIABILITIES
LOCATION | | FAIR VALUE | | | STATEMENTOF ASSETS
AND LIABILITIES LOCATION | | FAIR VALUE | |
| | | | |
Foreign currency contracts | | Unrealized appreciation on forward currency exchange contracts | | $ | 12,730,669 | | | Unrealized depreciation on forward currency exchange contracts | | $ | 12,503,708 | |
| | | | |
Total | | | | $ | 12,730,669 | | | | | $ | 12,503,708 | |
| | | | | | | | | | | | |
| DERIVATIVE TYPE | | LOCATIONOF GAINOR (LOSS) ON
DERIVATIVES WITHIN STATEMENT
OF OPERATIONS | | REALIZED GAIN
OR (LOSS)ON
DERIVATIVES | | | CHANGE IN UNREALIZED
APPRECIATIONOR
(DEPRECIATION) | |
| | | |
Foreign exchange contracts | | Net realized gain (loss) on forward currency exchange contracts; Net change in unrealized appreciation/depreciation of forward currency exchange contracts | | $ | (11,080,068 | ) | | $ | 1,565,377 | |
| | | |
Total | | | | $ | (11,080,068 | ) | | $ | 1,565,377 | |
The following tables represent the average monthly volume of the Portfolios’ derivative transactions during the year ended September 30, 2020:
| | | | |
| SMALL CAP CORE PORTFOLIO | | | |
Futures: | | | | |
| |
Average notional amount of buy contracts | | $ | 17,402,651 | |
| | | | |
| INTERNATIONAL SMALL CAP PORTFOLIO | | | |
Forward Currency Exchange Contracts: | | | | |
| |
Average principal amount of buy contracts | | $ | 189,713,689 | |
| |
Average principal amount of sale contracts | | $ | 196,819,906 | |
Notes to Financial Statements (continued)
| | | | |
| INTERNATIONAL STRATEGIC EQUITIES PORTFOLIO | | | |
Forward Currency Exchange Contracts: | | | | |
| |
Average principal amount of buy contracts | | $ | 1,017,346,251 | |
| |
Average principal amount of sale contracts | | $ | 1,052,969,325 | |
For financial reporting purposes, the Portfolios do not offset derivative assets and derivative liabilities that are subject to netting arrangements in the statement of assets and liabilities.
All OTC derivatives held at period end were subject to netting arrangements. The following tables present the Portfolios’ derivative assets and liabilities by OTC counterparty net of amounts available for offset under ISDA Master Agreements (“MA”) and net of the related collateral received/pledged by the Portfolios as of September 30, 2020. Exchange-traded derivatives and centrally cleared swaps are not subject to netting arrangements and as such are excluded from the tables.
| | | | | | | | | | | | | | | | | | | | |
| INTERNATIONAL SMALL CAP PORTFOLIO | |
| COUNTERPARTY | | DERIVATIVE
ASSETS SUBJECT
TOA MA | | | DERIVATIVES
AVAILABLE FOR
OFFSET | | | CASH
COLLATERAL
RECEIVED* | | | SECURITY
COLLATERAL
RECEIVED* | | | NET AMOUNT OF
DERIVATIVE
ASSETS | |
| | | | | |
Bank of America, NA | | $ | 539,978 | | | $ | (539,978 | ) | | $ | 0 | | | $ | 0 | | | $ | 0 | |
| | | | | |
Barclays Bank PLC | | | 205,201 | | | | (87,027 | ) | | | 0 | | | | 0 | | | | 118,174 | |
| | | | | |
Citibank, NA | | | 304,379 | | | | (108,196 | ) | | | (196,183 | ) | | | 0 | | | | 0 | |
| | | | | |
Goldman Sachs Bank USA | | | 51,657 | | | | (51,657 | ) | | | 0 | | | | 0 | | | | 0 | |
| | | | | |
JPMorgan Chase Bank, NA | | | 902 | | | | (902 | ) | | | 0 | | | | 0 | | | | 0 | |
| | | | | |
Morgan Stanley Capital Services, Inc. | | | 287,878 | | | | (228,204 | ) | | | 0 | | | | 0 | | | | 59,674 | |
| | | | | |
Natwest Markets PLC | | | 376,034 | | | | (152,587 | ) | | | 0 | | | | 0 | | | | 223,447 | |
| | | | | |
Standard Chartered Bank | | | 4,641 | | | | 0 | | | | 0 | | | | 0 | | | | 4,641 | |
| | | | | |
State Street Bank & Trust Co. | | | 1,197,424 | | | | (191,345 | ) | | | 0 | | | | 0 | | | | 1,006,079 | |
| | | | | |
UBS AG | | | 23,585 | | | | (23,585 | ) | | | 0 | | | | 0 | | | | 0 | |
| | | | | |
Total | | $ | 2,991,679 | | | $ | (1,383,481 | ) | | $ | (196,183 | ) | | $ | 0 | | | $ | 1,412,015 | ^ |
| | | | | |
| COUNTERPARTY | | DERIVATIVE
LIABILITIES SUBJECT
TO A MA | | | DERIVATIVES
AVAILABLE FOR
OFFSET | | | CASH
COLLATERAL
PLEDGED* | | | SECURITY
COLLATERAL
PLEDGED* | | | NET AMOUNT OF
DERIVATIVE
LIABILITIES | |
| | | | | |
Bank of America, NA | | $ | 626,125 | | | $ | (539,978 | ) | | $ | 0 | | | $ | 0 | | | $ | 86,147 | |
| | | | | |
Barclays Bank PLC | | | 87,027 | | | | (87,027 | ) | | | 0 | | | | 0 | | | | 0 | |
| | | | | |
Citibank, NA | | | 108,196 | | | | (108,196 | ) | | | 0 | | | | 0 | | | | 0 | |
| | | | | |
Credit Suisse International | | | 120,536 | | | | 0 | | | | 0 | | | | 0 | | | | 120,536 | |
| | | | | |
Deutsche Bank AG | | | 15,368 | | | | 0 | | | | 0 | | | | 0 | | | | 15,368 | |
| | | | | |
Goldman Sachs Bank USA | | | 423,401 | | | | (51,657 | ) | | | 0 | | | | 0 | | | | 371,744 | |
| | | | | |
HSBC Bank USA | | | 122,170 | | | | 0 | | | | 0 | | | | 0 | | | | 122,170 | |
| | | | | |
JPMorgan Chase Bank, NA | | | 36,422 | | | | (902 | ) | | | 0 | | | | 0 | | | | 35,520 | |
| | | | | |
Morgan Stanley Capital Services, Inc. | | | 228,204 | | | | (228,204 | ) | | | 0 | | | | 0 | | | | 0 | |
| | | | | |
Natwest Markets PLC | | | 152,587 | | | | (152,587 | ) | | | 0 | | | | 0 | | | | 0 | |
| | | | | |
State Street Bank & Trust Co. | | | 191,345 | | | | (191,345 | ) | | | 0 | | | | 0 | | | | 0 | |
| | | | | |
UBS AG | | | 150,421 | | | | (23,585 | ) | | | 0 | | | | 0 | | | | 126,836 | |
| | | | | |
Total | | $ | 2,261,802 | | | $ | (1,383,481 | ) | | $ | 0 | | | $ | 0 | | | $ | 878,321 | ^ |
| | * | The actual collateral received/pledged may be more than the amount reported due to over-collateralization. |
| | ^ | Net amount represents the net receivable/payable that would be due from/to the counterparty in the event of default or termination. The net amount from OTC financial derivative instruments can only be netted across transactions governed under the same master agreement with the same counterparty. |
| | | | | | | | | | | | | | | | | | | | |
| INTERNATIONAL STRATEGIC EQUITIES PORTFOLIO | |
| COUNTERPARTY | | DERIVATIVE
ASSETS SUBJECT
TOA MA | | | DERIVATIVES
AVAILABLE FOR
OFFSET | | | CASH
COLLATERAL
RECEIVED* | | | SECURITY
COLLATERAL
RECEIVED* | | | NET AMOUNT OF
DERIVATIVE
ASSETS | |
| | | | | |
Australia and New Zealand Banking Group Ltd. | | $ | 100,700 | | | $ | (50,153 | ) | | $ | 0 | | | $ | 0 | | | $ | 50,547 | |
| | | | | |
Bank of America, NA | | | 118,613 | | | | (118,613 | ) | | | 0 | | | | 0 | | | | 0 | |
| | | | | |
BNP Paribas SA | | | 1,121,566 | | | | (1,121,566 | ) | | | 0 | | | | 0 | | | | 0 | |
| | | | | |
Citibank, NA | | | 2,889,230 | | | | (461,383 | ) | | | (2,101,000 | ) | | | 0 | | | | 326,847 | |
| | | | | |
Credit Suisse International | | | 155,426 | | | | (155,426 | ) | | | 0 | | | | 0 | | | | 0 | |
| | | | | |
Goldman Sachs Bank USA | | | 1,233,643 | | | | (325,727 | ) | | | (907,916 | ) | | | 0 | | | | 0 | |
| | | | | |
HSBC Bank USA | | | 3,461,561 | | | | (2,735,504 | ) | | | 0 | | | | 0 | | | | 726,057 | |
| | | | | |
JPMorgan Chase Bank, NA | | | 80,580 | | | | (80,580 | ) | | | 0 | | | | 0 | | | | 0 | |
| | | | | |
Morgan Stanley Capital Services, Inc. | | | 793,524 | | | | (683,233 | ) | | | (110,291 | ) | | | 0 | | | | 0 | |
| | | | | |
Standard Chartered Bank | | | 89,269 | | | | 0 | | | | 0 | | | | 0 | | | | 89,269 | |
| | | | | |
State Street Bank & Trust Co. | | | 2,507,825 | | | | (1,318,520 | ) | | | 0 | | | | (581,799 | ) | | | 607,506 | |
| | | | | |
UBS AG | | | 178,732 | | | | 0 | | | | 0 | | | | 0 | | | | 178,732 | |
| | | | | |
Total | | $ | 12,730,669 | | | $ | (7,050,705 | ) | | $ | (3,119,207 | ) | | $ | (581,799 | ) | | $ | 1,978,958 | ^ |
| | | | | |
| COUNTERPARTY | | DERIVATIVE
LIABILITIES SUBJECT
TOA MA | | | DERIVATIVES
AVAILABLE FOR
OFFSET | | | CASH
COLLATERAL
PLEDGED* | | | SECURITY
COLLATERAL
PLEDGED* | | | NET AMOUNT OF
DERIVATIVE
LIABILITIES | |
| | | | | |
Australia and New Zealand Banking Group Ltd. | | $ | 50,153 | | | $ | (50,153 | ) | | $ | 0 | | | $ | 0 | | | $ | 0 | |
| | | | | |
Bank of America, NA | | | 1,932,068 | | | | (118,613 | ) | | | (1,130,000 | ) | | | 0 | | | | 683,455 | |
| | | | | |
Barclays Bank PLC | | | 60,013 | | | | 0 | | | | 0 | | | | 0 | | | | 60,013 | |
| | | | | |
BNP Paribas SA | | | 3,374,500 | | | | (1,121,566 | ) | | | 0 | | | | 0 | | | | 2,252,934 | |
| | | | | |
Citibank, NA | | | 461,383 | | | | (461,383 | ) | | | 0 | | | | 0 | | | | 0 | |
| | | | | |
Credit Suisse International | | | 441,378 | | | | (155,426 | ) | | | 0 | | | | 0 | | | | 285,952 | |
| | | | | |
Goldman Sachs Bank USA | | | 325,727 | | | | (325,727 | ) | | | 0 | | | | 0 | | | | 0 | |
| | | | | |
HSBC Bank USA | | | 2,735,504 | | | | (2,735,504 | ) | | | 0 | | | | 0 | | | | 0 | |
| | | | | |
JPMorgan Chase Bank, NA | | | 1,121,229 | | | | (80,580 | ) | | | 0 | | | | 0 | | | | 1,040,649 | |
| | | | | |
Morgan Stanley Capital Services, Inc. | | | 683,233 | | | | (683,233 | ) | | | 0 | | | | 0 | | | | 0 | |
| | | | | |
State Street Bank & Trust Co. | | | 1,318,520 | | | | (1,318,520 | ) | | | 0 | | | | 0 | | | | 0 | |
| | | | | |
Total | | $ | 12,503,708 | | | $ | (7,050,705 | ) | | $ | (1,130,000 | ) | | $ | 0 | | | $ | 4,323,003 | ^ |
| | * | The actual collateral received/pledged may be more than the amount reported due to over-collateralization. |
| | ^ | Net amount represents the net receivable/payable that would be due from/to the counterparty in the event of default or termination. The net amount from OTC financial derivative instruments can only be netted across transactions governed under the same master agreement with the same counterparty. |
Notes to Financial Statements (continued)
The Portfolios may invest in non-U.S. Dollar-denominated securities on a currency hedged or unhedged basis. The Portfolios may seek investment opportunities by taking long or short positions in currencies through the use of currency-related derivatives, including forward currency exchange contracts, futures and options on futures, swaps, and other options. The Portfolios may enter into transactions for investment opportunities when it anticipates that a foreign currency will appreciate or depreciate in value but securities denominated in that currency are not held by the Portfolios and do not present attractive investment opportunities. Such transactions may also be used when the Adviser believes that it may be more efficient than a direct investment in a foreign currency-denominated security. The Portfolios may also conduct currency exchange contracts on a spot basis (i.e., for cash at the spot rate prevailing in the currency exchange market for buying or selling currencies).
| NOTE 4. | Distributions to Shareholders |
The tax character of distributions paid during the fiscal years ended September 30, 2020 and September 30, 2019 were as follows:
| | | | | | | | |
| PORTFOLIO | | 2020 | | | 2019 | |
Small Cap Core | | | | | | | | |
| | |
Distributions paid from: | | | | | | | | |
| | |
Ordinary income | | $ | 4,500,621 | | | $ | 14,027,833 | |
| | |
Long-term capital gains | | | 0 | | | | 49,618,914 | |
| | | | | | | | |
| | |
Total distributions paid | | $ | 4,500,621 | | | $ | 63,646,747 | |
| | | | | | | | |
| | | | | | | | |
International Small Cap | | | | | | | | |
| | |
Distributions paid from: | | | | | | | | |
| | |
Ordinary income | | $ | 25,979,696 | | | $ | 33,502,855 | |
| | |
Long-term capital gains | | | 0 | | | | 70,947,693 | |
| | | | | | | | |
| | |
Total distributions paid | | $ | 25,979,696 | | | $ | 104,450,548 | |
| | | | | | | | |
| | | | | | | | |
International Strategic Equities | | | | | | | | |
| | |
Distributions paid from: | | | | | | | | |
| | |
Ordinary income | | $ | 90,002,554 | | | $ | 71,212,856 | |
| | |
Long-term capital gains | | | 0 | | | | 44,105,765 | |
| | | | | | | | |
| | |
Total distributions paid | | $ | 90,002,554 | | | $ | 115,318,621 | |
| | | | | | | | |
As of September 30, 2020, the components of accumulated earnings/(deficit) on a tax basis were as follows:
| | | | | | | | | | | | | | | | | | | | |
| PORTFOLIO | | UNDISTRIBUTED
ORDINARY
INCOME | | | UNDISTRIBUTED
LONG-TERM
GAINS | | | ACCUMULATED
CAPITALAND
OTHER
LOSSES | | | UNREALIZED
APPRECIATION/
(DEPRECIATION)(a) | | | TOTAL
ACCUMULATED
EARNINGS/
(DEFICIT) | |
Small Cap Core | | $ | 3,394,083 | | | $ | 0 | | | $ | (36,515,797 | ) | | $ | 56,889,265 | | | $ | 23,767,551 | |
| | | | | |
International Small Cap | | | 14,496,664 | | | | 0 | | | | (130,151,158 | ) | | | 83,901,796 | | | | (31,752,698 | ) |
| | | | | |
International Strategic Equities | | | 56,647,689 | | | | 0 | | | | (478,553,822 | ) | | | 461,991,068 | | | | 40,084,935 | |
| | (a) | The differences between book-basis and tax-basis unrealized appreciation/(depreciation) are attributable primarily to the tax deferral of losses on wash sales, the tax treatment of passive foreign investment companies (PFICs), and the realization for tax purposes of gains/losses on certain derivative instruments. |
For tax purposes, net capital losses may be carried over to offset future capital gains, if any. Portfolios are permitted to carry forward capital losses for an indefinite period, and such losses will retain their character as either short-term or long-term capital losses.
As of September 30, 2020, the following Portfolios had net capital loss carryforwards as follows:
| | | | | | | | |
| PORTFOLIO | | SHORT-TERM
AMOUNT | | | LONG-TERM
AMOUNT | |
Small Cap Core | | $ | 35,046,237 | | | $ | 1,469,560 | |
| | |
International Small Cap | | | 66,344,298 | | | | 63,806,860 | |
| | |
International Strategic Equities | | | 288,107,425 | | | | 190,446,397 | |
| NOTE 5. | Risks Involved in Investing in the Portfolios |
Foreign (Non-U.S.) Securities Risk—Investments in foreign securities entail significant risks in addition to those customarily associated with investing in U.S. securities. These risks include risks related to adverse market, economic, political, regulatory factors and social instability, all of which could disrupt the financial markets in which the Portfolios invest and adversely affect the value of the Portfolios’ assets.
Country Concentration Risk—The Portfolios may not always be diversified among countries or regions and the effect on the share price of the Portfolios of specific risks such as political, regulatory and currency may be magnified due to concentration of the Portfolios’ investments in a particular country or region.
Sector Risk—The Portfolios may have more risk because of concentrated investments in a particular market sector, such as the financials, consumer discretionary, information technology or industrials sector. Market or economic factors affecting that sector could have a major effect on the value of the Portfolios’ investments.
Emerging Markets Securities Risk—The risks of investing in foreign (non-U.S.) securities are heightened with respect to issuers in emerging-market countries because the markets are less developed and less liquid and there may be a greater amount of economic, political and social uncertainty, and these risks are even more pronounced in “frontier” markets, which are investable markets with lower total market capitalization and liquidity than the more developed emerging markets. In addition, the value of the Portfolios’ investments may decline because of factors such as unfavorable or unsuccessful government actions and reduction of government or central bank support.
Foreign Currency Risk—This is the risk that changes in foreign (non-U.S.) currency exchange rates may negatively affect the value of the Portfolios’ investments or reduce the returns of the Portfolios. For example, the value of the Portfolios’ investments in foreign securities and foreign currency positions may decrease if the U.S. Dollar is strong (i.e., gaining value relative to other currencies) and other currencies are weak (i.e., losing value relative to the U.S. Dollar).
Actions by a Few Major Investors—In certain countries, volatility may be heightened by actions of a few major investors. For example, substantial increases or decreases in cash flows of mutual funds investing in these markets could significantly affect local stock prices and, therefore, share prices of the Portfolios.
Illiquid Investment Risk—Illiquid investments risk exists when particular investments are difficult to purchase or sell, possibly preventing the Portfolios from purchasing or selling these securities at an advantageous price. Illiquid securities may also be difficult to value.
Redemption Risk—The Portfolios may experience heavy redemptions that could cause the Portfolios to liquidate their assets at inopportune times or unfavorable prices or increase or accelerate taxable gains or transaction costs and may negatively affect the Portfolios’ net asset value, or performance, which could cause the value of your investment to decline. Redemption risk is heightened during periods of overall market turmoil.
Market Risk—The Portfolios are subject to market risk, which is the risk that stock prices in general or in particular countries or sectors may decline over short or extended periods. Stock prices may decline in response to adverse changes in the economy or the economic outlook; deterioration in investor sentiment; interest rate, currency and commodity price fluctuations; adverse geopolitical, social or environmental developments; issuer- and sector-specific considerations; and other factors. In the past decade, financial markets in the United States, Europe and elsewhere have experienced increased
Notes to Financial Statements (continued)
volatility, decreased liquidity and heightened uncertainty. These market conditions may recur from time to time and have an adverse impact on various securities markets. Certain governments and central banks have provided significant support to financial markets, including by buying stocks and through other market interventions. Further governmental or central bank actions, including interest rate increases or decreases, could negatively affect financial markets generally, increase market volatility and reduce the value and liquidity of securities in which the Portfolios invest.
The United Kingdom (the “U.K.”) voted to withdraw from the European Union (the “EU”) in 2016. A draft withdrawal agreement containing transitional arrangements and a Political Declaration setting out the agreed negotiating parameters for a future trading relationship were published in October 2019. The outcome of negotiations in respect of the future trading relationship remains uncertain. The U.K. left the EU on January 31, 2020 subject to a transition period ending December 31, 2020. The European Union (Withdrawal Agreement) Act 2020, which sets out the arrangements for the U.K.’s withdrawal from the EU, became law in the U.K. on January 23, 2020. The uncertainty surrounding the effect of the U.K. ceasing to be a member of the EU, including the uncertainty in relation to the legal and regulatory framework that will apply to the U.K. and its relationship with the remaining members of the EU (including, in relation to trade) after the end of the transitional period has caused and is likely to continue to cause increased economic volatility and market uncertainty globally.
The United States and its trading partners are periodically involved in disputes over trade, which may result in tariffs on various categories of goods imported from the other country. Trade disputes, particularly prolonged disputes, may adversely affect the economies of the United States and its trading partners, as well as the companies directly or indirectly affected by the dispute and financial markets generally, and thus may adversely affect the value of the Portfolio’s assets. In addition, policy and legislative changes in the United States and in other countries are affecting many aspects of financial regulation, and may in some instances contribute to decreased liquidity and increased volatility in the financial markets. The impact of these changes, and the practical implications for market participants, may not be fully known for some time.
The market value of a security may move up or down, sometimes rapidly and unpredictably. These fluctuations may cause a security to be worth less than the price originally paid for it, or less than it was worth at an earlier time. Market risk may affect a single issuer, industry, sector of the economy or the market as a whole. Global economies and financial markets are increasingly interconnected, which increases the probabilities that conditions in one country or region might adversely impact issuers in a different country or region. Conditions affecting the general economy, including political, social, or economic instability at the local, regional, or global level may also affect the market value of a security. Health crises, such as pandemic and epidemic diseases, as well as other incidents that interrupt the expected course of events, such as natural disasters, war or civil disturbance, acts of terrorism, power outages and other unforeseeable and external events, and the public response to or fear of such diseases or events, have and may in the future have an adverse effect on the Portfolios’ investments and net asset value and can lead to increased market volatility. For example, any preventative or protective actions that governments may take in respect of such diseases or events may result in periods of business disruption, inability to obtain raw materials, supplies and component parts, and reduced or disrupted operations for the Portfolios’ portfolio companies. The occurrence and pendency of such diseases or events could adversely affect the economies and financial markets either in specific countries or worldwide.
Capitalization Risk—Investments in small- and mid-capitalization companies may be more volatile than investments in large-capitalization companies. Investments in small- and mid capitalization companies may have additional risks because these companies have limited product lines, markets or financial resources.
Allocation Risk—The Portfolios may seek to focus on different investment disciplines or factors at different times as a means to achieve their investment objectives. In the event that the investment disciplines or factors to which the Portfolios have greater exposure perform worse than the investment disciplines or factors with less exposure, the Portfolios’ returns may be negatively affected.
Derivatives Risk—The Portfolios may use derivatives in currency hedging as well as for direct investments to gain access to certain markets, earn income, enhance return and broaden portfolio diversification, which entail greater risk than if used solely for hedging purposes. In addition to other risks such as the credit risk of the counterparty, derivatives involve the risk that changes in the value of the derivative may not correlate with relevant assets, rates or indices. Derivatives may be difficult to price or unwind, and small changes may produce disproportionate losses for the Portfolios. Certain
derivatives have the potential for unlimited loss, regardless of the size of the initial investment. Assets required to be set aside or posted to cover or secure derivatives positions may themselves go down in value, and these collateral and other requirements may limit investment flexibility. Some derivatives involve leverage, which can make the Portfolios more volatile and can compound other risks. Derivatives, especially over-the-counter derivatives, are also subject to counterparty risk. The U.S. government and certain foreign governments have adopted regulations governing derivatives markets, including mandatory clearing of certain derivatives, and may impose additional regulations governing margin, reporting and registration requirements. The ultimate impact of the regulations remains unclear. Additional regulation may make derivatives more costly, limit their availability or utility, otherwise adversely affect their performance, or disrupt markets.
Management Risk—The Portfolios are subject to management risk because they are actively managed investment portfolios. The Adviser will apply its investment techniques and risk analyses in making investment decisions for the Portfolios, but these techniques, analyses and decisions may not work as intended or may not produce the desired results, and may, during certain periods, result in increased volatility for the Portfolios or cause the value of the Portfolios’ shares to go down. In some cases, derivatives and other investment techniques may be unavailable, or the Adviser may determine not to use them, possibly even under market conditions where their use could benefit the Portfolios. Some of these techniques may incorporate, or rely upon, quantitative models, but there is no guarantee that these models will generate accurate forecasts, reduce risk or otherwise perform as expected. In addition, the Adviser may change the Portfolios’ investment strategies or policies from time to time. Those changes may not lead to the results intended by the Adviser and could also have an adverse effect on the value or performance of the Portfolios.
REIT Risk—Investing in REITs involves certain unique risks in addition to those risks associated with investing in the real estate industry in general. Equity REITs may be affected by changes in the value of the underlying property owned by the REITs, while mortgage REITs may be affected by the quality of any credit extended. REITs are dependent upon management skills, are not diversified, and are subject to heavy cash flow dependency, default by borrowers and self-liquidation. Investing in REITs also involves risks similar to those associated with investing in small-capitalization companies. REITs may have limited financial resources, may trade less frequently and in a limited volume and may be subject to more abrupt or erratic price movements than larger company securities. REIT issuers may also fail to maintain their exemptions from investment company registration or fail to qualify for the “dividends paid deduction” under the Internal Revenue Code of 1986, as amended.
Investment in Other Investment Companies Risk—As with other investments, investments in other investment companies, including other registered funds advised by the Adviser and ETFs, are subject to market and management risk. In addition, if the Portfolios acquire shares of investment companies, shareholders bear both their proportionate share of expenses in the Portfolios (including management and advisory fees) and, indirectly, the expenses of the investment companies in which the Portfolios invest.
Portfolio Turnover Risk—The Portfolios’ investment strategies may result in high portfolio turnover. The Portfolios generally buy portfolio securities with the intention of holding them for investment. However, when market conditions or other circumstances warrant, securities may be purchased and sold without regard to the length of time held. This trading may increase the Portfolios’ rate of turnover and the incidence of short-term capital gain taxable as ordinary income. A higher rate of portfolio turnover may increase transaction costs, which must be borne by the Portfolios and their shareholders.
LIBOR Risk—The Portfolios may invest in certain debt securities, derivatives or other financial instruments that utilize the London Interbank Offered Rate, or “LIBOR,” as a “benchmark” or “reference rate” for various interest rate calculations. In July 2017, the United Kingdom Financial Conduct Authority, which regulates LIBOR, announced a desire to phase out the use of LIBOR by the end of 2021. Although financial regulators and industry working groups have suggested alternative reference rates, such as European Interbank Offer Rate (“EURIBOR”), Sterling Overnight Interbank Average Rate (“SONIA”) and Secured Overnight Financing Rate (“SOFR”), global consensus on alternative rates is lacking and the process for amending existing contracts or instruments to transition away from LIBOR is underway but remains unclear. The elimination of LIBOR or changes to other reference rates or any other changes or reforms to the determination or supervision of reference rates could have an adverse impact on the market for, or value of, any securities or payments linked to those reference rates, which may adversely affect the Portfolios’ performance and/or net asset value. Uncertainty and risk also remain regarding the willingness and ability of issuers and lenders to include revised
Notes to Financial Statements (continued)
provisions in new and existing contracts or instruments. Consequently, the transition away from LIBOR to other reference rates may lead to increased volatility and illiquidity in markets that are tied to LIBOR, fluctuations in values of LIBOR-related investments or investments in issuers that utilize LIBOR, increased difficulty in borrowing or refinancing and diminished effectiveness of hedging strategies, adversely affecting the Portfolios’ performance. Furthermore, the risks associated with the expected discontinuation of LIBOR and transition may be exacerbated if the work necessary to effect an orderly transition to an alternative reference rate is not completed in a timely manner. Because the usefulness of LIBOR as a benchmark could deteriorate during the transition period, these effects could occur prior to the end of 2021.
Cybersecurity Risk—Cybersecurity incidents, both intentional and unintentional, may allow an unauthorized party to gain access to Portfolio assets, customer data (including private shareholder information), or proprietary information, or cause the Portfolios, the Adviser, and/or its service providers (including, but not limited to, fund accountants, custodians, sub-custodians, transfer agents and financial intermediaries) to suffer data breaches, data corruption or lose operational functionality, or prevent Portfolio investors from purchasing, redeeming or exchanging shares or receiving distributions. A Portfolio and the Manager have limited ability to prevent or mitigate cybersecurity incidents affecting third-party service providers. Cybersecurity incidents may result in financial losses to such Portfolio and its shareholders, and substantial costs may be incurred in order to prevent any future cybersecurity incidents.
Indemnification Risk—In the ordinary course of business, the Portfolios enter into contracts that contain a variety of indemnifications. The Portfolios’ maximum exposure under these arrangements is unknown. However, the Portfolios have not had prior claims or losses pursuant to these indemnification provisions and expect the risk of loss thereunder to be remote. Therefore, the Portfolios have not accrued any liability in connection with these indemnification provisions.
| NOTE 6. | Capital-Share Transactions |
The Fund has authorized 27 billion shares of common stock, par value $0.0001 per share. Each SCB Class, Advisor Class and Class Z of the Portfolios is allocated 1 billion shares. The balance of the authorized shares have been allocated to share classes that are currently not offered.
Share transactions for each Portfolio for the years ended September 30, 2020 and September 30, 2019, were as follows:
| | | | | | | | | | | | | | | | | | | | |
| |
| | | SMALL CAP CORE PORTFOLIO | |
| | | | | | | | | | | | | | | | | | | | |
| | | |
| | | SHARES | | | | | | AMOUNT | |
| | | | | | | | | | | | | | | | | | | | |
| | | YEAR
ENDED
9/30/20 | | | YEAR
ENDED
9/30/19 | | | | | | YEAR
ENDED
9/30/20 | | | YEAR
ENDED
9/30/19 | |
SCB Class Shares | |
| | | | | |
Shares sold | | | 65,916 | | | | 69,823 | | | | | | | $ | 651,664 | | | $ | 758,037 | |
| | | | | |
Shares issued to shareholders on reinvestment of dividends and distributions | | | 1,366 | | | | 62,349 | | | | | | | | 15,687 | | | | 635,337 | |
| | | | | |
Shares redeemed | | | (113,348 | ) | | | (166,504 | ) | | | | | | | (1,142,058 | ) | | | (1,790,120 | ) |
| | | | | | | | | | | | | | | | | | | | |
| | | | | |
Net decrease | | | (46,066 | ) | | | (34,332 | ) | | | | | | $ | (474,707 | ) | | $ | (396,746 | ) |
| | | | | | | | | | | | | | | | | | | | |
| | | | | | | | | | | | | | | | | | | | |
Advisor Class Shares | |
| | | | | |
Shares sold | | | 9,739,815 | | | | 16,156,095 | | | | | | | $ | 89,708,816 | | | $ | 174,068,372 | |
| | | | | |
Shares issued to shareholders on reinvestment of dividends and distributions | | | 226,732 | | | | 4,736,603 | | | | | | | | 2,605,151 | | | | 48,360,719 | |
| | | | | |
Shares redeemed | | | (26,842,284 | ) | | | (11,002,629 | ) | | | | | | | (276,218,342 | ) | | | (119,233,718 | ) |
| | | | | | | | | | | | | | | | | | | | |
| | | | | |
Net increase (decrease) | | | (16,875,737 | ) | | | 9,890,069 | | | | | | | $ | (183,904,375 | ) | | $ | 103,195,373 | |
| | | | | | | | | | | | | | | | | | | | |
| |
| | | | | | | | | | | | | | | | | | | | |
| |
| | | SMALL CAP CORE PORTFOLIO | |
| | | | | | | | | | | | | | | | | | | | |
| | | |
| | | SHARES | | | | | | AMOUNT | |
| | | YEAR
ENDED
9/30/20 | | | YEAR
ENDED
9/30/19 | | | | | | YEAR
ENDED
9/30/20 | | | YEAR
ENDED
9/30/19 | |
Class Z Shares | |
| | | | | |
Shares sold | | | 0 | | | | 108,798 | | | | | | | $ | 0 | | | $ | 1,155,644 | |
| | | | | |
Shares issued to shareholders on reinvestment of dividends and distributions | | | 85,376 | | | | 1,313,198 | | | | | | | | 980,966 | | | | 13,394,618 | |
| | | | | |
Shares redeemed | | | (6,671,402 | ) | | | 0 | | | | | | | | (70,622,542 | ) | | | 0 | |
| | | | | | | | | | | | | | | | | | | | |
| | | | | |
Net increase (decrease) | | | (6,586,026 | ) | | | 1,421,996 | | | | | | | $ | (69,641,576 | ) | | $ | 14,550,262 | |
| | | | | | | | | | | | | | | | | | | | |
| | | | | | | | | | | | | | | | | | | | |
| |
| | | INTERNATIONAL SMALL CAP PORTFOLIO | |
| | | | | | | | | | | | | | | | | | | | |
| | | |
| | | SHARES | | | | | | AMOUNT | |
| | | | | | | | | | | | | | | | | | | | |
| | | YEAR
ENDED
9/30/20 | | | YEAR
ENDED
9/30/19 | | | | | | YEAR
ENDED
9/30/20 | | | YEAR
ENDED
9/30/19 | |
SCB Class Shares | |
| | | | | |
Shares sold | | | 646,758 | | | | 684,410 | | | | | | | $ | 6,458,770 | | | $ | 7,113,704 | |
| | | | | |
Shares issued to shareholders on reinvestment of dividends and distributions | | | 88,586 | | | | 532,696 | | | | | | | | 967,359 | | | | 5,220,418 | |
| | | | | |
Shares redeemed | | | (891,853 | ) | | | (755,928 | ) | | | | | | | (8,622,943 | ) | | | (7,980,810 | ) |
| | | | | | | | | | | | | | | | | | | | |
| | | | | |
Net increase (decrease) | | | (156,509 | ) | | | 461,178 | | | | | | | $ | (1,196,814 | ) | | $ | 4,353,312 | |
| | | | | | | | | | | | | | | | | | | | |
| | | | | | | | | | | | | | | | | | | | |
Advisor Class Shares | |
| | | | | |
Shares sold | | | 13,190,293 | | | | 14,129,957 | | | | | | | $ | 132,670,957 | | | $ | 147,796,136 | |
| | | | | |
Shares issued to shareholders on reinvestment of dividends and distributions | | | 1,209,860 | | | | 6,278,823 | | | | | | | | 13,211,672 | | | | 61,595,256 | |
| | | | | |
Shares redeemed | | | (18,487,514 | ) | | | (9,669,961 | ) | | | | | | | (179,162,481 | ) | | | (100,418,228 | ) |
| | | | | | | | | | | | | | | | | | | | |
| | | | | |
Net increase (decrease) | | | (4,087,361 | ) | | | 10,738,819 | | | | | | | $ | (33,279,852 | ) | | $ | 108,973,164 | |
| | | | | | | | | | | | | | | | | | | | |
| | | | | | | | | | | | | | | | | | | | |
Class Z Shares | |
| | | | | |
Shares sold | | | 682,056 | | | | 656,113 | | | | | | | $ | 5,860,000 | | | $ | 7,460,000 | |
| | | | | |
Shares issued to shareholders on reinvestment of dividends and distributions | | | 761,111 | | | | 3,507,365 | | | | | | | | 8,311,336 | | | | 34,407,253 | |
| | | | | |
Shares redeemed | | | (1,652,293 | ) | | | (162,029 | ) | | | | | | | (17,088,224 | ) | | | (1,647,682 | ) |
| | | | | | | | | | | | | | | | | | | | |
| | | | | |
Net increase (decrease) | | | (209,126 | ) | | | 4,001,449 | | | | | | | $ | (2,916,888 | ) | | $ | 40,219,571 | |
| | | | | | | | | | | | | | | | | | | | |
| | | | | | | | | | | | | | | | | | | | |
Notes to Financial Statements (continued)
| | | | | | | | | | | | | | | | | | | | |
| |
| | | INTERNATIONAL STRATEGIC EQUITIES PORTFOLIO | |
| | | | | | | | | | | | | | | | | | | | |
| | | |
| | | SHARES | | | | | | AMOUNT | |
| | | | | | | | | | | | | | | | | | | | |
| | | YEAR
ENDED
9/30/20 | | | YEAR
ENDED
9/30/19 | | | | | | YEAR
ENDED
9/30/20 | | | YEAR
ENDED
9/30/19 | |
SCB Class Shares | |
| | | | | |
Shares sold | | | 3,011,383 | | | | 1,972,651 | | | | | | | $ | 33,236,412 | | | $ | 22,419,919 | |
| | | | | |
Shares issued to shareholders on reinvestment of dividends and distributions | | | 227,647 | | | | 378,213 | | | | | | | | 2,734,044 | | | | 4,084,696 | |
| | | | | |
Shares redeemed | | | (3,497,820 | ) | | | (1,794,983 | ) | | | | | | | (38,129,355 | ) | | | (20,349,142 | ) |
| | | | | | | | | | | | | | | | | | | | |
| | | | | |
Net increase (decrease) | | | (258,790 | ) | | | 555,881 | | | | | | | $ | (2,158,899 | ) | | $ | 6,155,473 | |
| | | | | | | | | | | | | | | | | | | | |
| | | | | | | | | | | | | | | | | | | | |
Advisor Class Shares | |
| | | | | |
Shares sold | | | 32,049,707 | | | | 43,767,668 | | | | | | | $ | 352,064,959 | | | $ | 497,567,958 | |
| | | | | |
Shares issued to shareholders on reinvestment of dividends and distributions | | | 3,780,220 | | | | 5,921,658 | | | | | | | | 45,476,036 | | | | 64,013,121 | |
| | | | | |
Shares redeemed | | | (45,152,493 | ) | | | (29,818,923 | ) | | | | | | | (490,474,763 | ) | | | (337,249,650 | ) |
| | | | | | | | | | | | | | | | | | | | |
| | | | | |
Net increase (decrease) | | | (9,322,566 | ) | | | 19,870,403 | | | | | | | $ | (92,933,768 | ) | | $ | 224,331,429 | |
| | | | | | | | | | | | | | | | | | | | |
| | | | | | | | | | | | | | | | | | | | |
Class Z Shares | |
| | | | | |
Shares sold | | | 0 | | | | 1,213,792 | | | | | | | $ | 0 | | | $ | 13,982,660 | |
| | | | | |
Shares issued to shareholders on reinvestment of dividends and distributions | | | 2,444,301 | | | | 3,607,206 | | | | | | | | 29,429,388 | | | | 39,029,972 | |
| | | | | |
Shares redeemed | | | (3,120,628 | ) | | | (1,660,224 | ) | | | | | | | (36,128,660 | ) | | | (18,263,491 | ) |
| | | | | | | | | | | | | | | | | | | | |
| | | | | |
Net increase (decrease) | | | (676,327 | ) | | | 3,160,774 | | | | | | | $ | (6,699,272 | ) | | $ | 34,749,141 | |
| | | | | | | | | | | | | | | | | | | | |
At September 30, 2020, certain AllianceBerstein mutual funds owned 11%, 23% and 24% of Small Cap Core Portfolio, International Small Cap Portfolio and International Strategic Equities Portfolio, respectively, in aggregate of the Portfolios’ outstanding shares. Significant transactions by such shareholders, if any, may impact the Portfolios’ performance.
On July 23, 2020, the Boards of Directors of the Fund and Sanford C. Bernstein Fund, Inc. (“SCB Fund”) reviewed and unanimously approved the reorganization of the International Portfolio and Tax-Managed International Portfolio, each a series of SCB Fund, into the International Strategic Equities Portfolio, a series of the Fund (together, the “Reorganizations,” and each, a “Reorganization”). Pursuant to each proposed Reorganization, the International Portfolio and Tax-Managed International Portfolio (each, an “Acquired Portfolio,” and together, the “Acquired Portfolios”) will transfer all of their assets and stated liabilities to the International Strategic Equities Portfolio (the “Acquiring Portfolio”). Each of the Acquired Portfolios and the Acquiring Portfolio have substantially identical investment objectives and substantially similar investment strategies and risks. Shareholders of each Acquired Portfolio approved the Reorganizations on October 22, 2020. It is expected that the Reorganizations will be completed on or about December 4, 2020.
Management has evaluated subsequent events for possible recognition or disclosure in the financial statements through the date the financial statements are issued. Management has determined that there are no other material events that would require disclosure in the Portfolios’ financial statements through this date.
Report of Independent Registered Public Accounting Firm
To the Board of Directors of Bernstein Fund, Inc. and Shareholders of Small Cap Core Portfolio, International Small Cap Portfolio and International Strategic Equities Portfolio,
Opinions on the Financial Statements
We have audited the accompanying statements of assets and liabilities, including the schedules of investments, of Small Cap Core Portfolio, International Small Cap Portfolio and International Strategic Equities Portfolio (constituting Bernstein Fund, Inc., hereafter collectively referred to as the “Portfolios”) as of September 30, 2020, the related statements of operations for the year ended September 30, 2020, the statements of changes in net assets for each of the two years in the period ended September 30, 2020, including the related notes, and the financial highlights for each of the periods indicated therein (collectively referred to as the “financial statements”). In our opinion, the financial statements present fairly, in all material respects, the financial position of each of the Portfolios as of September 30, 2020, the results of each of their operations for the year then ended, the changes in each of their net assets for each of the two years in the period ended September 30, 2020 and each of the financial highlights for each of the periods indicated therein in conformity with accounting principles generally accepted in the United States of America.
Basis for Opinions
These financial statements are the responsibility of the Portfolios’ management. Our responsibility is to express an opinion on the Portfolios’ financial statements based on our audits. We are a public accounting firm registered with the Public Company Accounting Oversight Board (United States) (PCAOB) and are required to be independent with respect to the Portfolios in accordance with the U.S. federal securities laws and the applicable rules and regulations of the Securities and Exchange Commission and the PCAOB.
We conducted our audits of these financial statements in accordance with the standards of the PCAOB. Those standards require that we plan and perform the audit to obtain reasonable assurance about whether the financial statements are free of material misstatement, whether due to error or fraud.
Our audits included performing procedures to assess the risks of material misstatement of the financial statements, whether due to error or fraud, and performing procedures that respond to those risks. Such procedures included examining, on a test basis, evidence regarding the amounts and disclosures in the financial statements. Our audits also included evaluating the accounting principles used and significant estimates made by management, as well as evaluating the overall presentation of the financial statements. Our procedures included confirmation of securities owned as of September 30, 2020 by correspondence with the custodian, transfer agent and brokers; when replies were not received from brokers, we performed other auditing procedures. We believe that our audits provide a reasonable basis for our opinions.
PricewaterhouseCoopers LLP
New York, New York
November 24, 2020
We have served as the auditor of one or more of the investment companies in the AB Group of Mutual Funds since at least 1985. We have not been able to determine the specific year we began serving as auditor.
2020 Federal Tax Information (Unaudited)
For Federal income tax purposes, the following information is furnished with respect to the distributions paid by each applicable Portfolio during the taxable year ended September 30, 2020. For corporate shareholders, the following percentages of dividends paid by each Portfolio qualify for the dividends received deduction.
| | | | | | | | |
| PORTFOLIO | | DIVIDENDS RECEIVED DEDUCTION %
(CORPORATE SHAREHOLDERS) | | | | |
| | |
Small Cap Core | | | 100 | % | | | | |
For the taxable year ended September 30, 2020, each Portfolio designates the following amounts as the maximum amount that may be considered qualified dividend income for individual shareholders.
| | | | | | | | |
| PORTFOLIO | | QUALIFIED DIVIDEND INCOME | | | | |
Small Cap Core | | $ | 4,500,621 | | | | | |
| | |
International Small Cap | | | 29,349,532 | | | | | |
| | |
International Strategic Equities | | | 99,902,910 | | | | | |
Certain Portfolios intend to make an election to pass through foreign taxes paid by the Portfolios to their shareholders. For the taxable year ended September 30, 2020, the maximum amounts of foreign taxes that may be passed through and the foreign source income for information reporting purposes is as follows:
| | | | | | | | |
| PORTFOLIO | | FOREIGN TAXES TO PASS THROUGH | | | FOREIGN SOURCE
INCOME | |
International Small Cap | | $ | 3,369,836 | | | $ | 31,584,997 | |
| | |
International Strategic Equities | | | 9,900,356 | | | | 108,850,351 | |
Shareholders should not use the above information to prepare their income tax returns. The information necessary to complete your income tax returns will be included with your Form 1099-DIV which will be sent to you separately in January 2021.
Bernstein Fund, Inc.
BOARDOF DIRECTORS
Debra Perry(1)(3)
Chair
Beata D. Kirr
President
R. Jay Gerken(1)
Director
Jeffrey R. Holland(1)
Director
William Kristol(1)
Director
Michelle McCloskey(1)
Director
Donald K. Peterson(1)
Director
OFFICERS
Andrew Birse(2),
Vice President
Peter Chocian(2),
Vice President
Serdar Kalaycioglu(2),
Vice President
Samantha S. Lau(2),
Vice President
Stuart Rae(2),
Vice President
Sammy Suzuki(2),
Vice President
Erik A. Turenchalk(2),
Vice President
Nelson Yu(2),
Vice President
Emilie D. Wrapp,
Secretary
Michael B. Reyes,
Senior Analyst
Joseph J. Mantineo,
Treasurer and Chief Financial Officer
Phyllis J. Clarke,
Controller
Vincent S. Noto,
Chief Compliance Officer
CUSTODIANAND ACCOUNTING AGENT
State Street Bank and Trust Company
State Street Corporation CCB/5
1 Iron Street
Boston, MA 02210
PRINCIPAL UNDERWRITER
AllianceBernstein Investments, Inc.
1345 Avenue of the Americas
New York, NY 10105
TRANSFER AGENT
AllianceBernstein Investor Services, Inc.
P.O. Box 786003
San Antonio, TX 78278-6003
Toll-Free (800) 221-5672
INDEPENDENT REGISTEREDPUBLIC ACCOUNTING FIRM
PricewaterhouseCoopers LLP
300 Madison Avenue
New York, NY 10017
LEGAL COUNSEL
Willkie Farr & Gallagher LLP
787 Seventh Avenue
New York, NY 10019-6099
| (1) | | Member of the Audit Committee, the Governance, Nominating and Compensation Committee, and the Independent Directors Committee. |
| (2) | | The day-to-day management of, and investment decisions for, the Portfolios are made by the senior management teams. Messrs. Rae and Suzuki are the investment professionals with the most significant responsibility for the day-to-day management of the International Strategic Equities Portfolio. Messrs. Birse, Chocian and Yu are the investment professionals with the most significant responsibility for the day-to-day management of the International Small Cap Portfolio. Ms. Lau and Messrs. Kalaycioglu and Turenchalk are the investment professionals with the most significant responsibility for the day-to-day management of the Small Cap Core Portfolio. |
| (3) | | Member of the Special Pricing Committee. |
Bernstein Fund, Inc. (continued)
| | | | | | | | |
| | |
DIRECTORS’ INFORMATION | | | |
Name, Address+, Age,
(Year of Election*) | | Principal Occupation(s)
During Past Five (5) Years and Other
Information | | Portfolios in
Fund Complex
Overseen
By Director | | | Other Directorships
Currently Held by Director |
INTERESTED DIRECTOR | | | | | | |
Beata D. Kirr,** c/o AllianceBernstein L.P. 1345 Avenue of the Americas New York, NY 10105 46 (2019) | | Senior Vice President of the Investment Manager with which she has been associated since prior to 2015. She is the Co-Head of Investment Strategies since April 2020 and a National Managing Director since 2017. She was previously the Head of Private Client Core Asset Strategies. She joined the firm in 2007 as a Senior Portfolio Manager. Prior to joining AB, she was a director at Harris Alternatives, a global fund of hedge funds, and was with Goldman Sachs, where she advised clients in the Equities, M&A and Equity Capital Markets divisions, from their New York, London and Chicago offices. | | | 19 | | | Women Employed |
DISINTERESTED DIRECTORS | | | | | | |
Debra Perry,#,^ Chair of the Board 69 (2011) | | Formerly, Senior Managing Director of Global Ratings and Research, Moody’s Investors Service, Inc. from 2001 to 2004; Chief Administrative Officer, Moody’s, from 1999 to 2001; Chief Credit Officer, Moody’s, from 2000 to 2001; Group Managing Director for the Finance, Securities and Insurance Ratings Groups, Moody’s Corp., from 1996 to 1999; earlier she held executive positions with First Boston Corporation and Chemical Bank. | | | 19 | | | Assurant, Inc., since 2017; Genworth Financial, Inc., since 2016; Korn/Ferry International, since 2008; PartnerRe, from 2013-2016; Bank of America Funds Series Trust, from 2011-2016 |
| | | |
R. Jay Gerken,# 69 (2013) | | Formerly, President and Chief Executive Officer of Legg Mason Partners Fund Advisor, LLC, and President & Board Member of The Legg Mason and Western Asset mutual funds from 2005 until June 2013. Previously, he was the President and Chair of the boards of the Citigroup Asset Management mutual funds from 2002 to 2005; Portfolio Manager and Managing Director, Smith Barney Asset Management from 1993 to 2001 and President & CEO, Directions Management of Shearson Lehman, Inc. from 1988 to 1993. | | | 19 | | | Cedar Lawn Corporation; New Jersey Chapter of The Nature Conservancy; and Associated Banc-Corp |
| | | | | | | | |
| | |
DIRECTORS’ INFORMATION (continued) | | | |
Name, Address+, Age,
(Year of Election*) | | Principal Occupation(s)
During Past Five (5) Years and Other
Information | | Portfolios in
Fund Complex
Overseen
By Director | | | Other Directorships
Currently Held by Director |
Jeffrey R. Holland,# 54 (2019) | | Formerly, Limited Partner of Brown Brothers Harriman from 2014 to 2018. Prior thereto, General Partner of Brown Brothers Harriman from 2006 to 2013. | | | 19 | | | Director of various non-profit organizations |
| | | |
William Kristol,# 67 (1994) | | Founder and Editor, The Weekly Standard from 1995 to 2018. He is a regular contributor on leading political commentary shows. He has served as the inaugural Vann Professor of Ethics and Society at Davidson College since 2019. | | | 19 | | | Manhattan Institute; John M. Ashbrook Center for Public Affairs at Ashland University; The Salvatori Center at Claremont McKenna College; The Institute for the Study of War; Foundation for Constitutional Government; and Defending Democracy Together, a non-profit educational corporation |
| | | |
Michelle McCloskey,# 58 (2019) | | Formerly, President of Americas, Man Group from 2017 to August 2019 and President of Man FRM from 2015 to August 2019. Prior thereto, she was a Senior Managing Director of Man FRM from 2012 to 2015. While at the Man Group, she served on the Executive Committee of Man Group plc from 2012 to 2019, as Chief Executive Officer, Board of Managers of Man Alternative Multi Strategy Fund from 2016 to 2019 and as President and Chairman of the Board of the Pine Grove Institutional Funds from 2016 to 2019. She currently serves on the Investment Advisory Committee of Texas Tech University Endowment. | | | 19 | | | None |
Bernstein Fund, Inc. (continued)
| | | | | | | | |
| | |
DIRECTORS’ INFORMATION (continued) | | | |
Name, Address+, Age,
(Year of Election*) | | Principal Occupation(s)
During Past Five (5) Years and Other
Information | | Portfolios in
Fund Complex
Overseen
By Director | | | Other Directorships
Currently Held by Director |
Donald K. Peterson,# 71 (2007) | | Formerly, Chairman and Chief Executive Officer, Avaya Inc. (telecommunications equipment and services) from 2002 to 2006; President and Chief Executive Officer, Avaya Inc. from 2000 to 2001; President, Enterprise Systems Group in 2000; Chief Financial Officer, Lucent Technologies (telecommunications equipment and services) from 1996 to 2000; Chief Financial Officer, AT&T, Communications Services Group from 1995 to 1996; President, Nortel Communications Systems, Inc. (telecommunications and networking equipment) from 1994 to 1995. Prior thereto, he was at Nortel from 1976 to 1995. | | | 19 | | | Worcester Polytechnic Institute, (Emeritus); Member of the Board of TIAA and Member of the Board of TIAA-Bank, FSB |
+ The address for each of the Fund’s Disinterested Directors is c/o AllianceBernstein L.P., Attention: Legal and Compliance Department—Mutual Fund Legal, 1345 Avenue of the Americas, New York, NY 10105.
* There is no stated term of office for the Directors.
** Ms. Kirr is an “interested person” as defined by the Investment Company Act of 1940, because of her affiliation with AllianceBernstein.
# Member of the Audit Committee, the Governance, Nominating, and Compensation Committee, and the Independent Directors Committee.
^ Member of the Special Pricing Committee.
| | | | |
| |
MANAGEMENTOFTHE FUND |
| Name, Address,* and Age | | Principal Position(s)
Held with Fund | | Principal Occupation
During Past Five (5) Years |
Beata D. Kirr, 46 | | President | | See biography above. |
| | |
Andrew Birse, 42 | | Vice President | | Senior Vice President of the Manager**, with which he has been associated since prior to 2015. |
| | |
Peter Chocian, 48 | | Vice President | | Senior Vice President of the Manager**, with which he has been associated since prior to 2015. |
| | |
Serdar Kalaycioglu, 43 | | Vice President | | Senior Vice President of the Manager**, with which he has been associated since prior to 2015. |
| | |
Samantha S. Lau, 48 | | Vice President | | Senior Vice President of the Manager**, with which she has been associated since prior to 2015. |
| | |
Stuart Rae, 55 | | Vice President | | Senior Vice President of the Manager**, with which he has been associated since prior to 2015. |
| | |
Sammy Suzuki, 49 | | Vice President | | Senior Vice President of the Manager**, with which he has been associated since prior to 2015. |
| | |
Erik A. Turenchalk, 47 | | Vice President | | Senior Vice President of the Manager**, with which he has been associated since prior to 2015. |
| | |
Nelson Yu, 49 | | Vice President | | Senior Vice President of the Manager**, with which he has been associated since prior to 2015. |
| | |
Emilie D. Wrapp, 64 | | Secretary | | Senior Vice President, Assistant General Counsel and Assistant Secretary of AllianceBernstein Investments, Inc. (“ABI”)**, with which she has been associated since prior to 2015. |
| | |
Michael B. Reyes, 44 | | Senior Analyst | | Vice President of the Manager**, with which he has been associated since prior to 2015. |
| | |
Joseph J. Mantineo, 61 | | Treasurer and Chief Financial Officer | | Senior Vice President of AllianceBernstein Investor Services (“ABIS”)**, with which he has been associated since prior to 2015. |
Bernstein Fund, Inc. (continued)
| | | | |
| |
MANAGEMENTOFTHE FUND (continued) |
| Name, Address,* and Age | | Principal Position(s)
Held with Fund | | Principal Occupation
During Past Five (5) Years |
Phyllis J. Clarke, 59 | | Controller | | Vice President of ABIS**, with which she has been associated since prior to 2015. |
| | |
Vincent S. Noto, 55 | | Chief Compliance Officer | | Senior Vice President since 2015 and Mutual Fund Chief Compliance Officer of the Manager** since prior to 2015. |
* The address for each of the Fund’s Officers is 1345 Avenue of the Americas, New York, NY 10105.
** The Manager, ABI and ABIS are affiliates of the Fund.
The Fund’s Statement of Additional Information (“SAI”) has additional information about the Fund’s Directors and Officers and is available without charge upon request. Contact your financial representative or AB at (212) 486-5800, or visit www.bernstein.com, for a free prospectus or SAI.
Operation and Effectiveness of the Portfolios’ Liquidity Risk Management Program:
In October 2016, the Securities and Exchange Commission (“SEC”) adopted the open-end fund liquidity rule (the “Liquidity Rule”). In June 2018 the SEC adopted a requirement that funds disclose information about the operation and effectiveness of their Liquidity Risk Management Program (“LRMP”) in their reports to shareholders.
One of the requirements of the Liquidity Rule is for the Portfolios to designate an Administrator of the Portfolios’ Liquidity Risk Management Program. The Administrator of the Portfolios’ LRMP is AllianceBernstein L.P., the Portfolios’ investment adviser (the “Adviser”). The Adviser has delegated the responsibility to its Liquidity Risk Management Committee (the “Committee”). Another requirement of the Liquidity Rule is for the Fund’s Board of Directors (the “Fund Board”) to receive an annual written report from the Administrator of the LRMP, which addresses the operation of the Portfolios’ LRMP and assesses its adequacy and effectiveness. The Adviser provided the Fund Board with such annual report during the first quarter of 2020, which covered the period December 1, 2018 through December 31, 2019 (the “Program Reporting Period”).
The LRMP’s principal objectives include supporting the Portfolios’ compliance with limits on investments in illiquid assets and mitigating the risk that the Portfolios will be unable to meet their redemption obligations in a timely manner. Pursuant to the LRMP, the Portfolios classify the liquidity of their portfolio investments into one of the four categories defined by the SEC: Highly Liquid, Moderately Liquid, Less Liquid, and Illiquid. These classifications are reported to the SEC on Form N-PORT.
During the Program Reporting Period, the Committee reviewed whether the Portfolios’ strategy is appropriate for an open-end structure, taking into account any holdings of less liquid and illiquid assets. If the Portfolios participated in derivative transactions, the exposure from such transactions were considered in the LRMP. The Committee also performed an analysis to determine whether the Portfolios are required to maintain a Highly Liquid Investment Minimum (“HLIM”). The Committee also incorporated the following information when determining the Portfolios’ reasonably anticipated trading size for purposes of liquidity monitoring: historical net redemption activity, the Portfolios’ concentration in an issuer, shareholder concentration, investment performance, total net assets, and distribution channels.
The Adviser informed the Fund Board that the Committee believes the Portfolios’ LRMP is adequately designed, has been implemented as intended, and has operated effectively since its inception. No material exceptions have been noted since the implementation of the LRMP, and there were no liquidity events that impacted the Portfolios or their ability to timely meet redemptions during the Program Reporting Period.
Board Consideration of Investment Management Arrangement
Bernstein Fund, Inc. (the “Fund”) is subject to Section 15 of the Investment Company Act of 1940, as amended. Section 15 provides that any investment advisory agreement with a registered investment company such as the Fund may continue in effect for a period of more than two years from the date of its execution, only so long as such continuance is specifically approved at least annually by the board of directors (or by vote of a majority of the outstanding voting securities of the investment company). Pursuant to this requirement, the Fund’s Board of Directors, including the Directors who are not interested persons of the Fund (the “Independent Directors”), unanimously approved the continuation of the Investment Management Agreement between the Fund, on behalf of the International Strategic Equities Portfolio, International Small Cap Portfolio, and Small Cap Core Portfolio (each, a “Portfolio” and collectively, the “Portfolios”) of the Fund, and AllianceBernstein L.P. (the “Adviser”)(the “Investment Management Agreement”) at a video conference meeting held on October 28-29, 2020.1
The following discussion describes the considerations in connection with the Board’s review of the Investment Management Agreement.
In connection with the annual review of the continuation of the Investment Management Agreement between the Fund and the Adviser, counsel to the Independent Directors sent a letter to the Adviser dated August 7, 2020, that contained a list of information requested by the Independent Directors to conduct their annual review. The Board of Directors, including the Independent Directors, met by video conference and received and evaluated extensive materials relating to the continuation of the Investment Management Agreement from the Adviser during meetings in September and October 2020. In addition, the Board received materials from the Senior Analyst and an independent fee consultant as described below. On September 30, 2020, the Board of Directors held a video conference meeting to discuss its review of the Investment Management Agreement and the materials the Directors had been provided. At that meeting, the Independent Directors met separately with their independent counsel and the Senior Analyst and the independent fee consultant in executive sessions. Following the September 30, 2020 meeting, the Independent Directors, through counsel, requested certain additional information by means of a letter from their independent counsel dated October 5, 2020, and the Adviser provided certain additional information by means of a letter dated October 15, 2020. The Independent Directors held a video conference meeting on October 20, 2020 with their independent counsel and the Senior Analyst to further discuss the contract renewal materials and supplemental materials provided in response to the Board’s request. On October 28-29, 2020, the Board of Directors held a video conference meeting to continue their review of the Investment Management Agreement. During this meeting, the Adviser provided further information to the Board relating to contract renewal, and the Independent Directors also met separately with counsel to the Independent Directors as well as the Senior Analyst to review the contract renewal materials provided by the Adviser and the materials prepared by the Senior Analyst. At the conclusion of this meeting, the Board approved the continuation of the Investment Management Agreement for an additional annual term as described below.
In approving the Investment Management Agreement, the Board, including the Independent Directors, considered all information it deemed reasonably necessary to evaluate the terms of the Investment Management Agreement and considered whether the Agreement would be in the best interests of the Fund. In particular, the Board considered the information that was provided to them by the Adviser in response to their requests, as well as information prepared by the Senior Analyst and the independent fee consultant at the request of the Board. The Fund’s Senior Analyst assists the Board (as well as the boards of other funds sponsored by the Adviser) in evaluating investment management agreements and certain other plans and agreements pursuant to which the Adviser or its affiliates provide services to the Funds. The Board also considered other information provided to the Board in connection with the September 30, 2020, and October 28-29, 2020 meetings and throughout the past year.
The information considered by the Board included information with respect to the nature, extent and quality of services provided, investment performance, fees and expenses, profitability, economies of scale, and fall-out benefits and other revenue.
In the Board’s consideration of the factors discussed below, no single factor was considered in isolation or to be determinative to the decision of the Board to approve the Investment Management Agreement. Rather, the Board
| | 1 | The meeting was held by video conference in view of the ongoing COVID-19 pandemic and based on exemptive relief issued by the Securities and Exchange Commission, with the Board’s intention to ratify the approval of the Investment Management Agreement at its next in-person meeting. |
concluded, in light of a weighing and balancing of all factors considered and in the exercise of the Directors’ business judgment, that it was in the best interests of the Fund to approve the Investment Management Agreement including the fees to be charged for services thereunder, as summarized below.
Fees and Expenses
The Board, including the Independent Directors, compared the fees and expense ratios of each Portfolio (before and after any fee waivers and expense reimbursements) against fees and expense ratios of a peer group of funds with similar investment objectives (“peer group”). Both the peer group and the funds within the peer group, with respect to the fee and expense data, were available from Strategic Insight, an independent provider of investment company data. The Senior Analyst also performed analyses of the advisory fees, and compared such analyses to the Portfolios’ peer groups. In addition, the Board received and considered information from an independent fee consultant regarding the fees and expenses of the Portfolios as well as their investment performance.
The Board also received and considered information about the services rendered, and the fee rates charged, to other clients advised by the Adviser, including information about any recent advisory fee changes with respect to other investment companies advised by the Adviser. The Board noted the differences between the services provided to the Portfolios in comparison to those provided to other types of clients, including institutional clients and other investment companies for which the Adviser acted as subadviser, and the differences in the entrepreneurial and other risks borne by the Adviser in serving the Portfolios compared to other types of clients.
On the basis of its review and consideration of the fees as described above and the Board’s consideration of the other factors described below, and in light of the Adviser’s agreement to continue fee waivers and/or expense caps applicable to the International Small Cap and Small Cap Core Portfolios, the Board concluded that the contractual advisory fees as proposed were reasonable.
Nature, Extent and Quality of Services Provided
The Board, including the Independent Directors, considered the nature, quality and extent of services performed by the Adviser and its affiliates gained from their experience as Directors of the Fund, their overall confidence in the Adviser’s integrity and competence they have gained from that experience, and the Adviser’s initiative in identifying and raising potential issues with the Directors. The Board also considered the Adviser’s responsiveness, frankness and attention to concerns raised by the Directors from time to time, including the Adviser’s willingness to consider and implement organizational changes designed to improve investment results and the services provided to the Portfolios. The Board also considered the scope and quality of the Adviser’s investment management capabilities, other resources dedicated to performing its services, the quality of its compliance, administrative and other services provided to the Portfolios and the background and experience of the Adviser’s senior management. The Board reviewed the qualifications, backgrounds and responsibilities of the investment staff primarily responsible for day-to-day portfolio management services for each Portfolio and noted the Adviser’s commitment to strong research and investment management capabilities throughout changing market environments. The Board reviewed the compliance and administrative services of the Adviser that support the investment advisory services provided to the Portfolios. The Board also considered how the organizational capabilities and financial condition of the Adviser may affect the nature and quality of its services. In that regard, the Board considered information about the impact of the COVID-19 pandemic on the Adviser’s operations and the Adviser’s ability to continue to provide the same scope and quality of services to the Portfolios as before the pandemic. The Board considered the ongoing impacts of the relocation of substantial operations of the Adviser from the New York City area to Nashville, Tennessee as well as the implications of a substantial number of the Adviser’s employees working from home during the pandemic. The Board also noted that the Adviser and its affiliates had continued to update the Board on matters relating to the sale by AXA, S.A., previously an indirect parent of AllianceBernstein Corporation, the general partner of the Adviser, of its remaining ownership interest in its U.S. subsidiary, Equitable Holdings, Inc. The Board considered the statements of the Adviser that it has continued to operate as an independent, publicly-traded US asset manager, that the divestiture has not materially changed the Adviser’s current management structure or strategy, and that the Adviser does not believe that the divestiture will have a material impact on the Adviser with respect to its operations, personnel, organizational structure, or capitalization, financial and other resources.
Board Consideration of Investment Management Arrangement (continued)
In considering the nature and quality of the services provided by the Adviser, the Board, including the Independent Directors, received and considered information about each Portfolio’s investment performance, as well as the performance of its peer group and the performance of an appropriate benchmark index. The Board was provided with performance data versus each Portfolio’s peer group, for the 1-year and 3-year periods ended July 31, 2020 and versus each Portfolio’s benchmark index for the 1-year, 3-year and since inception for the relevant periods, as well as the most recently available Morningstar rating for the Portfolios. The Board also received certain updated performance information as of September 30, 2020. In addition, the Directors considered information showing performance compared to peer groups and benchmarks for rolling calendar year periods and the year to date. The Directors also receive detailed comparative performance information for the Portfolios at each regular Board meeting during the year. The Board recognized that the benchmark indices do not account for fees and expenses incurred by a fund, including the Portfolios. The Directors also considered how peer groups have changed over time and how comparisons may differ depending upon the selection of the peer groups or benchmark indices. In particular, the Board considered the Adviser’s explanation that certain Portfolios were more appropriately categorized as “blend” strategies but had been included in “growth” categories by Lipper, and that such a comparison was inapt and caused performance to look less favorable given the recent underperformance of value strategies generally versus growth strategies.
Where the Portfolios had underperformed their peer groups or benchmark indices, the Directors considered the Adviser’s explanations for performance and, as applicable, measures the Adviser had taken or proposed to take to improve performance. The Directors noted generally the Adviser’s continued efforts to enhance the services provided to the Portfolios. The Directors also noted that they would continue to monitor investment performance closely.
The Board concluded that the Adviser had the experience and resources necessary to provide services of appropriate nature, quality and scope with respect to the Portfolios.
Profitability
The Board, including the Independent Directors, considered the level of the Adviser’s profits in respect of its management of the respective Portfolios. The materials provided to the Independent Directors included information indicating the profitability of the Portfolios to the Adviser for calendar years 2018 and 2019, which had been reviewed by an independent consultant. The Directors reviewed the assumptions and methods of allocation used by the Adviser in preparing fund-specific profitability data and noted that there are many potentially acceptable allocation methodologies for information of this type. The Directors noted that they received information regarding all revenues and expenses of the Adviser’s relationship with the Fund, including those relating to the Adviser’s subsidiaries that provide transfer agency and distribution services to the Fund, and that they had focused on profitability before taxes and distribution expenses. The Directors reviewed comparative information regarding profitability for other publicly-traded advisers, recognizing that it is difficult to make comparisons of profitability among fund advisory contracts because only limited comparative information is publicly available and the comparisons are affected by numerous factors including different cost accounting methodologies.
After reviewing all relevant factors, the Directors, including the Independent Directors, concluded that the levels of the Adviser’s profits in respect of its management of the Portfolios were not excessive.
Economies of Scale
The Board, including the Independent Directors, considered whether there have been economies of scale in respect of the management of the Portfolios, whether the Portfolios have appropriately benefited from any economies of scale, and whether there is potential for realization of any further economies of scale. In this regard, the Board considered that, subject to shareholder approval, two other portfolios managed by the Adviser would be merged into the International Strategic Equities Portfolio in late 2020 or early 2021, thereby increasing the Portfolio’s assets under management. The Directors discussed possible ways in which any such economies of scale may be shared with the Portfolios, including by investment in enhanced services.
The Directors also considered the Senior Analyst materials which they received in connection with the review of the Investment Management Agreement, which included information reflecting changes in asset levels of the Portfolios and in the profitability of the Adviser over various periods.
After reviewing the profitability and economies of scale information provided by the Adviser, the Board concluded that the benefits of any economies of scale were appropriately being shared with Portfolio investors by way of, among other things and as applicable, establishing advisory fees at levels that contemplated future achievement of scale, recent fee reductions for the International Strategic Equities Portfolio, breakpoint arrangements as currently in effect for the International Strategic Equities Portfolio, the fact that the International Small Cap and Small Cap Core Portfolios are research-intensive and may be capacity-constrained, expense caps and waivers applying to the International Small Cap and Small Cap Core Portfolios, and the Adviser’s continued reinvestment in the business, including by researching and implementing new product enhancements. The Directors also noted that they would continue to monitor the growth of the Portfolios.
Fall-Out Benefits and Other Revenue
The Board, including the Independent Directors, also took into account so-called “fall-out benefits” to the Adviser, such as soft dollar arrangements (whereby the Adviser receives the benefit of research services from many of the brokers and dealers that execute purchases and sales of securities on behalf of its clients on an agency basis). The Directors recognized that the Adviser’s profitability would be lower without these benefits. They also considered other benefits potentially derived from an increase in the Adviser’s business as a result of its relationship with the Fund. The Directors concluded that these fall-out benefits to the Adviser were acceptable.
Advisory Fee Rate Schedule
On the basis of the information considered, the Board determined to approve the continuation of the Investment Management Agreement for an additional annual term, without change to the Portfolios’ contractual fee schedules, as set forth below.
| | |
| | | ADVISORY FEE SCHEDULE |
| International Small Cap Portfolio | | 1.00% of the Portfolio’s average net assets. |
| | |
| International Strategic Equities Portfolio | | 0.75% of the first $2.5 billion of the Portfolio’s average net assets; 0.65% of the excess over $2.5 billion up to $5 billion; and 0.60% of the excess of the Portfolio’s average net assets over $5 billion. |
| | |
| Small Cap Core Portfolio | | 0.80% of the Portfolio’s average net assets. |

Distributor
BERNSTEIN FUND, INC.
1345 AVENUEOFTHE AMERICAS, NEW YORK, NY 10105
(212) 756-4097
ISCEC-0151-0920
ITEM 2. CODE OF ETHICS.
(a) The registrant has adopted a code of ethics that applies to its principal executive officer, principal financial officer and principal accounting officer. A copy of the registrant’s code of ethics is filed herewith as Exhibit 12(a)(1).
(b) During the period covered by this report, no material amendments were made to the provisions of the code of ethics adopted in 2(a) above.
(c) During the period covered by this report, no implicit or explicit waivers to the provisions of the code of ethics adopted in 2(a) above were granted.
ITEM 3. AUDIT COMMITTEE FINANCIAL EXPERT.
The registrant’s Board of Directors has determined that independent directors Donald K. Peterson, Debra Perry and R. Jay Gerken qualify as audit committee financial experts.
ITEM 4. PRINCIPAL ACCOUNTANT FEES AND SERVICES.
(a) - (c) The following table sets forth the aggregate fees billed by the independent registered public accounting firm Pricewaterhouse Coopers LLP , for the Fund’s last two fiscal years for professional services rendered for: (i) the audit of the Fund’s annual financial statements included in the Fund’s annual report to stockholders; (ii) assurance and related services that are reasonably related to the performance of the audit of the Fund’s financial statements and are not reported under (i), which include advice and education related to accounting and auditing issues, quarterly press release review (for those Funds that issue quarterly press releases), and preferred stock maintenance testing (for those Funds that issue preferred stock); and (iii) tax compliance, tax advice and tax return preparation.
| | | | | | | | | | | | | | | | |
| | | | | | Audit Fees | | | Audit-Related
Fees | | | Tax Fees | |
Bernstein Fund Inc. Small Cap Core Portfolio | | | 2019 | | | $ | 21,700 | | | $ | 458 | | | $ | 27,530 | |
| | | 2020 | | | $ | 21,700 | | | $ | 2,542 | | | $ | 27,727 | |
Bernstein Fund Inc. International Small Cap Portfolio | | | 2019 | | | $ | 25,000 | | | $ | 458 | | | $ | 47,496 | |
| | | 2020 | | | $ | 25,000 | | | $ | 2,542 | | | $ | 42,010 | |
Bernstein Fund Inc. International Strategic Equities Portfolio | | | 2019 | | | $ | 25,000 | | | $ | 458 | | | $ | 27,643 | |
| | | 2020 | | | $ | 25,000 | | | $ | 2,542 | | | $ | 35,642 | |
| * | Paid to Ernst & Young LLP. |
(d) Not applicable.
(e) (1) Beginning with audit and non-audit service contracts entered into on or after May 6, 2003, the Fund’s Audit Committee policies and procedures require the pre-approval of all audit and non-audit services provided to the Fund by the Fund’s independent registered public accounting firm. The Fund’s Audit Committee policies and procedures also require pre-approval of all audit and non-audit services provided to the Adviser and Service Affiliates to the extent that these services are directly related to the operations or financial reporting of the Fund.
(e) (2) All of the amounts for Audit Fees, Audit-Related Fees and Tax Fees in the table under Item 4 (a)–(c) are for services pre-approved by the Fund’s Audit Committee.
(f) Not applicable.
(g) The following table sets forth the aggregate non-audit services provided to the Fund, the Fund’s Adviser and entities that control, are controlled by or under common control with the Adviser that provide ongoing services to the Fund:
| | | | | | | | | | | | |
| | | | | | All Fees for
Non-Audit Services
Provided to the
Portfolio, the Adviser
and Service Affiliates | | | Total Amount of
Foregoing Column Pre-
approved by the Audit
Committee
(Portion Comprised of
Audit Related Fees)
(Portion Comprised of
Tax Fees) | |
Bernstein Fund Inc. Small Cap Core Portfolio | | | 2019 | | | $ | 3,760,874 | | | $ | 27,988 | |
| | | | | | | | | | $ | (458 | ) |
| | | | | | | | | | $ | (27,530 | ) |
| | | 2020 | | | $ | 3,934,963 | | | $ | 30,269 | |
| | | | | | | | | | $ | (2,542 | ) |
| | | | | | | | | | $ | (27,727 | ) |
Bernstein Fund Inc. International Small Cap Portfolio | | | 2019 | | | $ | 3,780,840 | | | $ | 47,954 | |
| | | | | | | | | | $ | (458 | ) |
| | | | | | | | | | $ | (47,496 | ) |
| | | 2020 | | | $ | 3,949,246 | | | $ | 44,552 | |
| | | | | | | | | | $ | (2,542 | ) |
| | | | | | | | | | $ | (42,010 | ) |
Bernstein Fund Inc. International Strategic Equities Portfolio | | | 2019 | | | $ | 3,760,987 | | | $ | 28,101 | |
| | | | | | | | | | $ | (458 | ) |
| | | | | | | | | | $ | (27,643 | ) |
| | | 2020 | | | $ | 3,942,878 | | | $ | 38,184 | |
| | | | | | | | | | $ | (2,542 | ) |
| | | | | | | | | | $ | (35,642 | ) |
(h) The Audit Committee of the Fund has considered whether the provision of any non-audit services not pre-approved by the Audit Committee provided by the Fund’s independent registered public accounting firm to the Adviser and Service Affiliates is compatible with maintaining the auditor’s independence.
ITEM 5. AUDIT COMMITTEE OF LISTED REGISTRANTS.
Not applicable to the registrant.
ITEM 6. INVESTMENTS.
Please see Schedule of Investments contained in the Report to Shareholders included under Item 1 of this Form N-CSR.
ITEM 7. DISCLOSURE OF PROXY VOTING POLICIES AND PROCEDURES FOR CLOSED-END MANAGEMENT INVESTMENT COMPANIES.
Not applicable to the registrant.
ITEM 8. PORTFOLIO MANAGERS OF CLOSED-END MANAGEMENT INVESTMENT COMPANIES.
Not applicable to the registrant.
ITEM 9. PURCHASES OF EQUITY SECURITIES BY CLOSED-END MANAGEMENT INVESTMENT COMPANY AND AFFILIATED PURCHASERS.
Not applicable to the registrant.
ITEM 10. SUBMISSION OF MATTERS TO A VOTE OF SECURITY HOLDERS.
There have been no material changes to the procedures by which shareholders may recommend nominees to the Fund’s Board of Directors since the Fund last provided disclosure in response to this item.
ITEM 11. CONTROLS AND PROCEDURES.
(a) The registrant’s principal executive officer and principal financial officer have concluded that the registrant’s disclosure controls and procedures (as defined in Rule 30a-2(c) under the Investment Company Act of 1940, as amended) are effective at the reasonable assurance level based on their evaluation of these controls and procedures as of a date within 90 days of the filing date of this document.
(b) There were no significant changes in the registrant’s internal controls over financial reporting during the second fiscal quarter of the period that could significantly affect these controls subsequent to the date of their evaluation, including any corrective actions with regard to significant deficiencies and material weaknesses.
ITEM 12. DISCLOSURE OF SECURITIES LENDING ACTIVITIES FOR CLOSED-END MANAGEMENT INVESTMENT COMPANIES.
Not applicable to the registrant.
ITEM 13. EXHIBITS.
The following exhibits are attached to this Form N-CSR:
SIGNATURES
Pursuant to the requirements of the Securities Exchange Act of 1934 and the Investment Company Act of 1940, the registrant has duly caused this report to be signed on its behalf by the undersigned, thereunto duly authorized.
(Registrant): Bernstein Fund, Inc.
| | |
| By: | | /s/ Beata Kirr |
| | Beata Kirr |
| | President |
Pursuant to the requirements of the Securities Exchange Act of 1934 and the Investment Company Act of 1940, this report has been signed below by the following persons on behalf of the registrant and in the capacities and on the dates indicated.
| | |
| By: | | /s/ Beata Kirr |
| | Beata Kirr |
| | President |
| | |
| |
| By: | | /s/ Joseph J. Mantineo |
| | Joseph J. Mantineo |
| | Treasurer and Chief Financial Officer |