UNITED STATES
SECURITIES AND EXCHANGE COMMISSION
Washington, D.C. 20549
FORM N-CSR
CERTIFIED SHAREHOLDER REPORT OF REGISTERED
MANAGEMENT INVESTMENT COMPANIES
Investment Company Act file number: 811-23117
JPMorgan Trust IV
(Exact name of registrant as specified in charter)
270 Park Avenue
New York, NY 10017
(Address of principal executive offices) (Zip code)
Frank J. Nasta
270 Park Avenue
New York, NY 10017
(Name and Address of Agent for Service)
Registrant’s telephone number, including area code: (800) 480-4111
Date of fiscal year end: Last day of February
Date of reporting period: May 31, 2016 through August 31, 2016
Form N-CSR is to be used by management investment companies to file reports with the Commission not later than 10 days after the transmission to stockholders of any report that is required to be transmitted to stockholders under Rule 30e-1 under the Investment Company Act of 1940 (17 CFR 270.30e-1). The Commission may use the information provided on Form N-CSR in its regulatory, disclosure review, inspection, and policymaking roles.
A registrant is required to disclose the information specified by Form N-CSR, and the Commission will make this information public. A registrant is not required to respond to the collection of information contained in Form N-CSR unless the Form displays a currently valid Office of Management and Budget (“OMB”) control number. Please direct comments concerning the accuracy of the information collection burden estimate and any suggestions for reducing the burden to Secretary, Securities and Exchange Commission, 450 Fifth Street, NW, Washington, DC 20549-0609. The OMB has reviewed this collection of information under the clearance requirements of 44 U.S.C. Section 3507.
ITEM 1. REPORTS TO STOCKHOLDERS.
The following is a copy of the report transmitted to shareholders pursuant to Rule 30e-1 under the Investment Company Act of 1940 (17 CFR 270.30e-1).
Semi-Annual Report
J.P. Morgan Municipal Bond Funds
August 31, 2016 (Unaudited)
JPMorgan Ultra-Short Municipal Fund

CONTENTS
Investments in the Fund are not deposits or obligations of, or guaranteed or endorsed by, any bank and are not insured or guaranteed by the FDIC, the Federal Reserve Board or any other government agency. You could lose money if you sell when the Fund’s share price is lower than when you invested.
Past performance is no guarantee of future performance. The general market views expressed in this report are opinions based on market and other conditions through the end of the reporting period and are subject to change without notice. These views are not intended to predict the future performance of the Fund or the securities markets. References to specific securities and their issuers are for illustrative purposes only and are not intended to be, and should not be interpreted as, recommendations to purchase or sell such securities. Such views are not meant as investment advice and may not be relied on as an indication of trading intent on behalf of the Fund.
Prospective investors should refer to the Fund’s prospectus for a discussion of the Fund’s investment objectives, strategies and risks. Call J.P. Morgan Funds Service Center at 1-800-480-4111 for a prospectus containing more complete information about the Fund including management fees and other expenses. Please read it carefully before investing.
CEO’S LETTER
September 22, 2016 (Unaudited)
Dear Shareholder,
The U.S. continued to lead a slow global economic expansion through August 2016, further raising pressure on the U.S. Federal Reserve (the “Fed”) to begin raising interest rates even as leading central banks elsewhere extended their extraordinary stimulus efforts.
| | |
 | | “It is especially notable that in the wake of a sell-off in June, financial markets fully recovered in the following two months.” |
Amid uncertainty about China’s economic outlook in early 2016, a sharp sell-off in financial markets following Britain’s June 23rd vote to exit the European Union and low U.S. inflation, the Fed declined to raise rates at its May and July meetings. However, financial markets rebounded quickly from the so-called Brexit sell-off and investor concerns about China’s economy receded. By August 2016, investors’ appetite for risk had returned, driving up prices for both stocks and bonds and pushing market volatility to record lows.
Meanwhile, U.S. gross domestic product remained low but positive through the first and second quarters of 2016. Unemployment remained at 5.0% or lower from February through August and sales of new homes in the U.S. returned to levels last seen before the 2008 financial crisis.
Overseas, the European Central Bank (ECB) surprised financial markets in early March with a further cut in interest rates and an expansion of its own quantitative easing program, along with other specific stimulus policies. In July, the ECB maintained its key interest rate at zero. Partly in response to the Brexit vote, Britain’s central bank cut interest rates in August to their lowest level in the bank’s 322-year history and reintroduced a quantitative easing program and began buying corporate bonds. After introducing negative interest rates in early 2016 to combat sputtering growth, the Bank of Japan changed direction in early September 2016 and unveiled a “yield curve control” to improve commercial bank earnings and investment returns for pension funds and insurers.
The ultimate effect of these central bank actions was to produce negative yields on government bonds in Europe and Japan, which led to a bond market rally in the U.S. as investors sought returns in U.S. Treasury bonds. Bond yields generally move in the opposite direction of bond prices and the bond market rally pushed Treasury bond yields to record lows in July.
In this environment, the financial market’s implied probability of an interest rate increase at the Fed’s September 2016 meeting rose to 36% at the end of August. However, the U.S. central bank declined to raise rates, citing below-target inflation data and concerns about continued job growth.
While Fed Chairwoman Janet Yellen indicated there is a greater likelihood of an interest rate increase in December 2016, both the International Monetary Fund and the World Bank have issued warnings about slowing economic growth in the U.S. and the rest of the world.
During the six months ended August 31, 2016, U.S. investors generally enjoyed solid returns in both bond and stock markets. It is especially notable that in the wake of a sell-off in June, financial markets fully recovered in the following two months. We believe this outcome clearly illustrates the wisdom of an investment perspective that is diversified, persistent and is guided by a long-term vision.
We look forward to managing your investment needs for years to come. Should you have any questions, please visit www.jpmorganfunds.com or contact the J.P. Morgan Funds Service Center at 1-800-480-4111.
Sincerely yours,

George C.W. Gatch
CEO, Investment Funds Management,
J.P. Morgan Asset Management
| | | | | | | | |
| | | |
| AUGUST 31, 2016 | | J.P. MORGAN MUNICIPAL BOND FUNDS | | | | | 1 | |
JPMorgan Ultra-Short Municipal Fund
FUND SUMMARY
FOR THE PERIOD MAY 31, 2016 (FUND INCEPTION DATE) THROUGH AUGUST 31, 2016 (Unaudited)
| | | | |
| REPORTING PERIOD RETURN: | |
| Fund (Select Class Shares)* | | | 0.22% | |
| Barclays 1 Year Municipal Bond Index | | | 0.20% | |
| |
| Net Assets as of 8/31/2016 | | $ | 10,018,984 | |
| Duration. | | | 0.7 years | |
INVESTMENT OBJECTIVE** AND STRATEGIES
The Fund seeks as high a level of current income exempt from federal income tax as is consistent with relative stability of principal. Under normal circumstances, the Fund invests at least 80% of its Assets in municipal securities, the income from which is exempt from federal income tax. This is a fundamental policy. For purposes of this policy, “Assets” means net assets, plus the amount of borrowings for investment purposes. The Fund invests in a portfolio of municipal securities with an average weighted maturity of two years or less. Average weighted maturity is the average of all the current maturities (that is, the term of the securities) of the individual securities in the Fund calculated so as to count most heavily those securities with the highest dollar value. Average weighted maturity is important to investors as an indication of the Fund’s sensitivity to changes in interest rates. Usually, the longer the average weighted maturity, the more fluctuation in share price you can expect.
| | | | |
CREDIT QUALITY ALLOCATIONS*** | |
| AAA | | | 6.1 | % |
| AA | | | 44.7 | |
| A | | | 31.0 | |
| BBB | | | 4.1 | |
| BB | | | 2.6 | |
| NR | | | 11.5 | |
J.P. Morgan Investment Management receives credit ratings on underlying securities of the portfolio from three major rating
agencies — Standard and Poor’s (“S&P”), Moody’s and Fitch. When calculating credit quality breakdown, S&P is used as the primary independent rating agency source. Where an S&P rating is not available for a particular security, the Moody’s rating will be used, if available, and Fitch, if available, is used for securities not rated by Moody’s or S&P. Securities not rated by any of the three agencies are reflected as not rated (NR).
Although the Credit Quality Allocations table reflects the ratings of the bonds detailed in the Schedule of Investments, 12.6% of the investments in the table is held in prerefunded municipal bonds or escrowed to maturity securities. Prerefunded municipal bonds and escrowed to maturity securities are bonds the principal and interest of which are to be paid by Treasuries, Agencies and other government securities that have been placed in escrow accounts. For both prerefunded and escrowed to maturity securities, the credit status is considered the same, the only difference is prerefundeds are paid off at a call date while escrowed to maturity are retired at maturity.
| * | | The return shown is based on net asset values calculated for shareholder transactions and may differ from the return shown in the financial highlights, which reflects adjustments made to the net asset values in accordance with accounting principles generally accepted in the United States of America. |
| ** | | The adviser seeks to achieve the Fund’s objective. There can be no guarantee it will be achieved. |
| *** | | Percentages indicated are based on total investments as of August 31, 2016. The Fund’s portfolio composition is subject to change. |
| | | | | | |
| | | |
| 2 | | | | J.P. MORGAN MUNICIPAL BOND FUNDS | | AUGUST 31, 2016 |
JPMorgan Ultra-Short Municipal Fund
FUND SUMMARY
FOR THE PERIOD MAY 31, 2016 (FUND INCEPTION DATE) THROUGH AUGUST 31, 2016 (Unaudited) (continued)
| | | | | | | | | | | | | | |
TOTAL RETURNS AS OF AUGUST 31, 2016 | |
| | | | |
| | | | | | | | | INCEPTION DATE OF
CLASS | | SINCE
INCEPTION* | |
CLASS A SHARES | | | | | | | | | | May 31, 2016 | | | | |
With Sales Charge** | | | | | | | | | | | | | (2.09 | )% |
Without Sales Charge | | | | | | | | | | | | | 0.16 | |
SELECT CLASS SHARES | | | | | | | | | | May 31, 2016 | | | 0.22 | |
| ** | | Sales Charge for Class A Shares is 2.25%. |
LIFE OF FUND PERFORMANCE (5/31/16 TO 8/31/16)
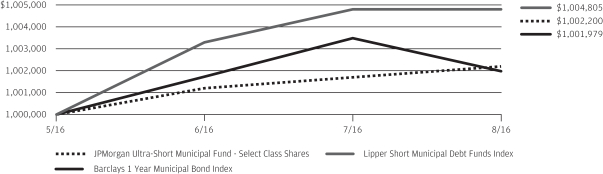
The performance quoted is past performance and is not a guarantee of future results. Mutual funds are subject to certain market risks. Investment returns and principal value of an investment will fluctuate so that an investor’s shares, when redeemed, may be worth more or less than their original cost. Current performance may be higher or lower than the performance data shown. For up-to-date, month-end performance information please call 1-800-480-4111.
The Fund commenced operations on May 31, 2016.
The graph illustrates comparative performance for $1,000,000 invested in Select Class Shares of the JPMorgan Ultra-Short Municipal Fund, the Barclays 1 Year Municipal Bond Index and the Lipper Short Municipal Debt Funds Index from May 31, 2016 to August 31, 2016. The performance of the Fund assumes reinvestment of all dividends and capital gain distributions, if any. The performance of the Barclays 1 Year Municipal Bond Index does not reflect the deduction of expenses or a sales charge associated with a mutual fund and has been adjusted to reflect reinvestment of all dividends and capital gain distributions of securities included in the benchmark, if applicable. The performance of the Lipper Short Municipal Debt Funds Index includes expenses associated with a mutual fund, such as investment management fees. These expenses are not identical to the expenses incurred by the Fund. The Barclays 1 Year Municipal Bond Index is an unmanaged index that includes bonds with a minimum credit rating of BAA3, are issued as part of a deal of at least $50
million, have an amount outstanding of at least $5 million, and have maturities of 1 to 2 years.
The Lipper Short Municipal Debt Funds Index is an index based on the total returns of certain mutual funds within the Fund’s designated category as determined by Lipper, Inc. Investors cannot invest directly in an index.
Capital gain distributions are subject to federal income tax; a portion of the Fund’s income distributions may be subject to the alternative minimum tax and some investors may be subject to certain state and local taxes.
Select Class Shares have a $1,000,000 minimum initial investment.
Subsequent to the inception of the Fund on May 31, 2016 until August 31, 2016, the Fund did not experience any shareholder activity. If such shareholder activity had occurred, the Fund’s performance may have been impacted.
Fund performance may reflect the waiver of the Fund’s fees and reimbursement of expenses for certain periods since the inception date. Without these waivers and reimbursements, performance would have been lower. Also, performance shown in this section does not reflect the deduction of taxes that a shareholder would pay on Fund distributions or redemptions of Fund shares.
The returns shown are based on net asset values calculated for shareholder transactions and may differ from the returns shown in the financial highlights, which reflect adjustments made to the net asset values in accordance with accounting principles generally accepted in the United States of America.
| | | | | | | | |
| | | |
| AUGUST 31, 2016 | | J.P. MORGAN MUNICIPAL BOND FUNDS | | | | | 3 | |
JPMorgan Ultra-Short Municipal Fund
SCHEDULE OF PORTFOLIO INVESTMENTS
AS OF AUGUST 31, 2016 (Unaudited)
| | | | | | | | |
PRINCIPAL
AMOUNT($) | | | SECURITY DESCRIPTION | | VALUE($) | |
| | | | | | | | |
| Municipal Bonds — 97.0% (t) | |
| | | | Alabama — 1.6% | |
| | | | Hospital — 0.1% | |
| | 10,000 | | | Houston County Healthcare Authority, Southeast Alabama Medical Center, Series A, Rev., 5.000%, 10/01/16 | | | 10,033 | |
| | | | | | | | |
| | | | Water & Sewer — 1.5% | |
| | 150,000 | | | Ozark Utilities Board, Water & Sewer, Rev., AGM, 2.000%, 09/01/17 | | | 151,664 | |
| | | | | | | | |
| | | | Total Alabama | | | 161,697 | |
| | | | | | | | |
| | | | Alaska — 3.2% | |
| | | | Other Revenue — 0.2% | |
| | 25,000 | | | Alaska Housing Finance Corporation, General Mortgage, Series A, Rev., 1.650%, 12/01/17 | | | 25,278 | |
| | | | | | | | |
| | | | Prerefunded — 3.0% | |
| | 295,000 | | | State of Alaska, International Airports System, Series B, Rev., NATL-RE, 5.000%, 10/01/26 (p) | | | 296,118 | |
| | | | | | | | |
| | | | Total Alaska | | | 321,396 | |
| | | | | | | | |
| | | | Arizona — 0.5% | |
| | | | Hospital — 0.5% | |
| | 50,000 | | | County of Yavapai, Industrial Development Authority, Arizona Healthcare System, Rev., 5.000%, 10/01/16 | | | 50,188 | |
| | | | | | | | |
| | | | Arkansas — 1.3% | |
| | | | Hospital — 0.3% | |
| | 25,000 | | | Arkansas Development Finance Authority, Healthcare, Baptist Health, Series A, Rev., 4.000%, 12/01/17 | | | 26,001 | |
| | | | | | | | |
| | | | Water & Sewer — 1.0% | |
| | 100,000 | | | City of Hot Springs, Wastewater Refunding and Construction, Rev., 2.000%, 12/01/17 (w) | | | 101,452 | |
| | | | | | | | |
| | | | Total Arkansas | | | 127,453 | |
| | | | | | | | |
| | | | California — 4.0% | |
| | | | Certificate of Participation — 0.3% | |
| | 35,000 | | | Moulton-Niguel Water District, COP, 4.000%, 09/01/16 | | | 35,000 | |
| | | | | | | | |
| | | | General Obligation — 1.6% | |
| | 50,000 | | | City of Los Angeles, Series B, GO, 5.000%, 09/01/16 | | | 50,000 | |
| | 30,000 | | | County of San Francisco, Community College District, Election of 2005, Series B, GO, 5.000%, 09/01/16 | | | 30,000 | |
| | 25,000 | | | Rancho Santiago, Commodity College District, GO, AGM, 5.250%, 09/01/16 | | | 25,000 | |
| | | | | | | | |
PRINCIPAL
AMOUNT($) | | | SECURITY DESCRIPTION | | VALUE($) | |
| | | | | | | | |
| | |
| | | | General Obligation — continued | |
| | | | State of California, Various Purpose, | | | | |
| | 25,000 | | | GO, 5.000%, 10/01/16 | | | 25,096 | |
| | 30,000 | | | GO, NATL-RE, 5.000%, 09/01/16 | | | 30,000 | |
| | | | | | | | |
| | | | | | | 160,096 | |
| | | | | | | | |
| | | | Hospital — 1.0% | |
| | 100,000 | | | California Municipal Finance Authority, NorthBay Healthcare Group, Series A, Rev., 2.000%, 11/01/17 | | | 101,168 | |
| | | | | | | | |
| | | | Other Revenue — 0.7% | |
| | 40,000 | | | Contra Costa Water District, Water, Series Q, Rev., 4.000%, 10/01/16 | | | 40,120 | |
| | 25,000 | | | Los Angeles County, Sanitation Districts Financing Authority, Capital Projects, Series A, Rev., 5.000%, 10/01/16 | | | 25,096 | |
| | | | | | | | |
| | | | | | | 65,216 | |
| | | | | | | | |
| | | | Utility — 0.4% | |
| | 40,000 | | | City of Los Angeles, Department of Water & Power, Power System, Subseries A-1, Rev., AMBAC, 5.000%, 07/01/17 | | | 41,502 | |
| | | | | | | | |
| | | | Total California | | | 402,982 | |
| | | | | | | | |
| | | | Colorado — 5.2% | |
| | | | Certificate of Participation — 1.3% | |
| | 100,000 | | | City of Avon, COP, 2.000%, 12/01/17 | | | 101,353 | |
| | 25,000 | | | State of Colorado, Series A, COP, 5.000%, 11/01/16 | | | 25,188 | |
| | | | | | | | |
| | | | | | | 126,541 | |
| | | | | | | | |
| | | | Hospital — 2.3% | |
| | | | Colorado Health Facilities Authority, Catholic Health Initiatives, | | | | |
| | 100,000 | | | Series A, Rev., 5.000%, 02/01/17 | | | 101,736 | |
| | 30,000 | | | Series A, Rev., 5.000%, 07/01/17 | | | 31,031 | |
| | 100,000 | | | Series D, Rev., 5.000%, 10/01/16 | | | 100,367 | |
| | | | | | | | |
| | | | | | | 233,134 | |
| | | | | | | | |
| | | | Water & Sewer — 1.6% | |
| | 140,000 | | | City of Fountain, Electric Water & Wastewater Utility Enterprise, Rev., AGM, 2.000%, 12/01/16 | | | 140,513 | |
| | 25,000 | | | East Cherry Creek Valley Water & Sanitation District, Arapahoe County, Rev., 4.000%, 11/15/16 | | | 25,176 | |
| | | | | | | | |
| | | | | | | 165,689 | |
| | | | | | | | |
| | | | Total Colorado | | | 525,364 | |
| | | | | | | | |
SEE NOTES TO FINANCIAL STATEMENTS.
| | | | | | |
| | | |
| 4 | | | | J.P. MORGAN MUNICIPAL BOND FUNDS | | AUGUST 31, 2016 |
| | | | | | | | |
PRINCIPAL
AMOUNT($) | | | SECURITY DESCRIPTION | | VALUE($) | |
| | | | | | | | |
| Municipal Bonds — continued | |
| | | | Connecticut — 3.5% | |
| | | | General Obligation — 3.5% | |
| | 350,000 | | | Town of Wethersfield, GO, 5.000%, 09/01/16 | | | 350,000 | |
| | | | | | | | |
| | | | Florida — 5.6% | |
| | | | Education — 1.3% | |
| | 100,000 | | | Higher Educational Facilities Financing Authority, Flagler College, Inc., Project, Series B, Rev., 3.000%, 11/01/17 | | | 102,364 | |
| | 25,000 | | | School District of St. Lucie County, Sales Tax, Rev., NATL-RE, 4.000%, 10/01/16 (p) | | | 25,074 | |
| | | | | | | | |
| | | | | | | 127,438 | |
| | | | | | | | |
| | | | General Obligation — 0.8% | |
| | 80,000 | | | Florida State Board of Education, Public Education Capital Outlay, Series D, GO, 5.500%, 06/01/17 | | | 82,978 | |
| | | | | | | | |
| | | | Other Revenue — 2.9% | |
| | 250,000 | | | City of Port St. Lucie, Community Redevelopment Agency, Rev., 2.000%, 01/01/17 | | | 251,038 | |
| | 40,000 | | | Sarasota County, Infrastructure Sales Surtax, Series A, Rev., 5.000%, 10/01/16 | | | 40,153 | |
| | | | | | | | |
| | | | | | | 291,191 | |
| | | | | | | | |
| | | | Prerefunded — 0.4% | |
| | 35,000 | | | Osceola County, Infrastructure Sales Surtax, Rev., AMBAC, 5.000%, 10/01/17 (p) | | | 36,652 | |
| | | | | | | | |
| | | | Utility — 0.2% | |
| | 25,000 | | | Jea Electric System, Series B, Rev., 5.000%, 10/01/16 | | | 25,095 | |
| | | | | | | | |
| | | | Total Florida | | | 563,354 | |
| | | | | | | | |
| | | | Georgia — 0.7% | |
| | | | Certificate of Participation — 0.4% | |
| | 35,000 | | | Fulton County Facilities Corporation, COP, 5.000%, 11/01/17 | | | 36,754 | |
| | | | | | | | |
| | | | Other Revenue — 0.3% | |
| | 35,000 | | | Cobb County-Marietta Water Authority, Rev., 3.000%, 11/01/16 | | | 35,151 | |
| | | | | | | | |
| | | | Total Georgia | | | 71,905 | |
| | | | | | | | |
| | | | Illinois — 4.6% | |
| | | | General Obligation — 3.6% | |
| | 100,000 | | | City of Country Club Hills, GO, 2.000%, 12/01/16 | | | 100,247 | |
| | 100,000 | | | Cook & Will Counties, Township High School District, GO, AGM, 3.000%, 12/15/16 | | | 100,632 | |
| | | | | | | | |
PRINCIPAL
AMOUNT($) | | | SECURITY DESCRIPTION | | VALUE($) | |
| | | | | | | | |
| | |
| | | | General Obligation — continued | |
| | 150,000 | | | County of Cook, Series A, GO, 5.000%, 11/15/18 | | | 162,069 | |
| | | | | | | | |
| | | | | | | 362,948 | |
| | | | | | | | |
| | | | Other Revenue — 1.0% | |
| | 100,000 | | | State of Illinois, Sales Tax, Series B, Rev., 3.000%, 06/15/17 | | | 101,843 | |
| | | | | | | | |
| | | | Total Illinois | | | 464,791 | |
| | | | | | | | |
| | | | Indiana — 3.0% | |
| | | | Education — 1.0% | |
| | 100,000 | | | Lake County, Merrillville Multi-School Building Corp., Rev., 3.000%, 01/05/17 | | | 100,892 | |
| | | | | | | | |
| | | | Water & Sewer — 2.0% | |
| | 200,000 | | | City of Mount Vernon, Waterworks, Rev., BAN, 2.000%, 07/01/17 | | | 200,736 | |
| | | | | | | | |
| | | | Total Indiana | | | 301,628 | |
| | | | | | | | |
| | | | Iowa — 0.5% | |
| | | | Hospital — 0.5% | |
| | 50,000 | | | Iowa Finance Authority, Healthcare, Genesis Health System, Rev., 4.000%, 07/01/17 | | | 51,279 | |
| | | | | | | | |
| | | | Kansas — 1.4% | |
| | | | General Obligation — 0.4% | |
| | 40,000 | | | Miami County, Unified School District No. 368, GO, 2.000%, 09/01/17 | | | 40,533 | |
| | | | | | | | |
| | | | Utility — 1.0% | |
| | 100,000 | | | Unified Government of Wyandotte County, Kansas Board of Public Utilities System, Series A, Rev., 3.000%, 09/01/16 | | | 100,000 | |
| | | | | | | | |
| | | | Total Kansas | | | 140,533 | |
| | | | | | | | |
| | | | Kentucky — 1.0% | |
| | | | Other Revenue — 1.0% | |
| | 100,000 | | | Commonwealth of Kentucky, State Property & Building Commission, Rev., 3.000%, 10/01/16 | | | 100,212 | |
| | | | | | | | |
| | | | Massachusetts — 1.9% | |
| | | | Education — 0.3% | |
| | 25,000 | | | Massachusetts School Building Authority, Dedicated Sales Tax, Series A, Rev., AMBAC, 5.000%, 08/15/17 (p) | | | 26,056 | |
| | | | | | | | |
| | | | General Obligation — 0.3% | |
| | 25,000 | | | Commonwealth of Massachusetts, Series B, GO, 5.000%, 11/01/16 | | | 25,192 | |
| | | | | | | | |
SEE NOTES TO FINANCIAL STATEMENTS.
| | | | | | | | |
| | | |
| AUGUST 31, 2016 | | J.P. MORGAN MUNICIPAL BOND FUNDS | | | | | 5 | |
JPMorgan Ultra-Short Municipal Fund
SCHEDULE OF PORTFOLIO INVESTMENTS
AS OF AUGUST 31, 2016 (Unaudited) (continued)
| | | | | | | | |
PRINCIPAL
AMOUNT($) | | | SECURITY DESCRIPTION | | VALUE($) | |
| | | | | | | | |
| Municipal Bonds — continued | |
| | | | Other Revenue — 1.3% | |
| | 135,000 | | | Massachusetts Development Finance Agency, Worcester Polytechnic Institution, Rev., NATL-RE, 5.000%, 09/01/16 | | | 135,000 | |
| | | | | | | | |
| | | | Total Massachusetts | | | 186,248 | |
| | | | | | | | |
| | | | Michigan — 1.1% | |
| | | | General Obligation — 0.8% | |
| | 75,000 | | | Oak Park School District, GO, Q-SBLF, 3.000%, 11/01/16 | | | 75,299 | |
| | | | | | | | |
| | | | Other Revenue — 0.3% | |
| | 30,000 | | | Michigan Municipal Bond Authority, Clean Water Revolving Fund, Pooled Project, Rev., 5.000%, 10/01/16 | | | 30,115 | |
| | | | | | | | |
| | | | Total Michigan | | | 105,414 | |
| | | | | | | | |
| | | | Minnesota — 1.8% | |
| | | | Certificate of Participation — 1.0% | |
| | 100,000 | | | Triton Independent School District No. 2125, Dodge Center, Series A, COP, 2.000%, 04/01/17 (w) | | | 100,598 | |
| | | | | | | | |
| | | | Education — 0.5% | |
| | 50,000 | | | City of Deephaven, Minnesota Charter School Lease, Eagle Ridge Academy Project, Series A, Rev., 3.000%, 07/01/19 | | | 51,009 | |
| | | | | | | | |
| | | | General Obligation — 0.3% | |
| | 25,000 | | | State of Minnesota, Various Purpose, Series K, GO, 5.000%, 11/01/16 | | | 25,192 | |
| | | | | | | | |
| | | | Total Minnesota | | | 176,799 | |
| | | | | | | | |
| | | | Missouri — 2.5% | |
| | | | Hospital — 1.5% | |
| | 150,000 | | | County of Boone, Boone Hospital Center, Rev., 3.000%, 08/01/17 | | | 152,764 | |
| | | | | | | | |
| | | | Other Revenue — 1.0% | |
| | 100,000 | | | Missouri Development Finance Board Infrastructure Facilities, City of Independence, Centerpoint Project, Series B, Rev., 3.000%, 04/01/17 | | | 101,154 | |
| | | | | | | | |
| | | | Total Missouri | | | 253,918 | |
| | | | | | | | |
| | | | Nebraska — 1.3% | |
| | | | Education — 0.2% | |
| | 25,000 | | | Nebraska Educational Finance Authority, Clarkson College Project, Rev., 2.350%, 09/01/16 | | | 25,000 | |
| | | | | | | | |
| | | | | | | | |
PRINCIPAL
AMOUNT($) | | | SECURITY DESCRIPTION | | VALUE($) | |
| | | | | | | | |
| | |
| | | | General Obligation — 1.1% | |
| | 100,000 | | | Gretna Public Schools, GO, 4.000%, 12/15/16 | | | 100,970 | |
| | | | | | | | |
| | | | Total Nebraska | | | 125,970 | |
| | | | | | | | |
| | | | New Jersey — 8.7% | |
| | | | Certificate of Participation — 1.5% | |
| | 150,000 | | | Township of West Orange, COP, AGM, 3.000%, 10/01/17 | | | 153,363 | |
| | | | | | | | |
| | | | General Obligation — 4.5% | |
| | 95,000 | | | County of Passaic, GO, AGM, 5.000%, 02/01/17 | | | 96,754 | |
| | 150,000 | | | County of Somerset, Board of Education of the Township of Franklin, GO, 5.000%, 08/15/17 | | | 156,054 | |
| | 90,000 | | | Mountain Lakes School District, GO, 3.000%, 09/15/16 | | | 90,083 | |
| | 105,000 | | | State of New Jersey, Series L, GO, AMBAC, 5.250%, 07/15/17 | | | 108,975 | |
| | | | | | | | |
| | | | | | | 451,866 | |
| | | | | | | | |
| | | | Other Revenue — 2.7% | |
| | 65,000 | | | New Jersey Building Authority, Series B, Rev., 5.000%, 06/15/17 | | | 67,081 | |
| | 200,000 | | | The Union County Improvement Authority, City of Linden Omnibus Project, Rev., AGM, 2.000%, 11/01/17 | | | 202,436 | |
| | | | | | | | |
| | | | | | | 269,517 | |
| | | | | | | | |
| | | | Total New Jersey | | | 874,746 | |
| | | | | | | | |
| | | | New York — 6.2% | |
| | | | Education — 0.8% | |
| | 80,000 | | | New York State Dormitory Authority, State University, Series A, Rev., 5.000%, 07/01/17 | | | 82,941 | |
| | | | | | | | |
| | | | General Obligation — 3.2% | |
| | 25,000 | | | Bedford Central School District, GO, 4.000%, 10/15/16 | | | 25,109 | |
| | 45,000 | | | Central Islip Union Free School District, GO, 2.000%, 09/01/16 | | | 45,000 | |
| | 50,000 | | | County of Suffolk, Series B, GO, AGM, 5.250%, 05/01/17 | | | 51,521 | |
| | | | Town of Oyster Bay, | | | | |
| | 100,000 | | | GO, RAN, 3.750%, 03/31/17 | | | 100,707 | |
| | 100,000 | | | Series C, GO., BAN, 4.000%, 06/01/18 | | | 101,185 | |
| | | | | | | | |
| | | | | | | 323,522 | |
| | | | | | | | |
SEE NOTES TO FINANCIAL STATEMENTS.
| | | | | | |
| | | |
| 6 | | | | J.P. MORGAN MUNICIPAL BOND FUNDS | | AUGUST 31, 2016 |
| | | | | | | | |
PRINCIPAL
AMOUNT($) | | | SECURITY DESCRIPTION | | VALUE($) | |
| | | | | | | | |
| Municipal Bonds — continued | |
| | | | Transportation — 2.2% | |
| | 210,000 | | | New York Transportation Development Corp., Special Facility, American Airlines, Inc., John F. Kennedy International Airport Project, Rev., 5.000%, 08/01/17 | | | 216,294 | |
| | | | | | | | |
| | | | Total New York | | | 622,757 | |
| | | | | | | | |
| | | | Ohio — 5.1% | |
| | | | General Obligation — 3.3% | |
| | 100,000 | | | County of Belmont, Various Purpose, GO, BAN, 1.375%, 08/31/17 (w) | | | 100,441 | |
| | 200,000 | | | County of Carroll, Classroom Facilities Improvement Bonds, GO, 1.250%, 12/01/16 | | | 200,352 | |
| | 25,000 | | | State of Ohio, Third Frontier Research & Development, Series A, GO, 5.000%, 11/01/16 | | | 25,191 | |
| | | | | | | | |
| | | | | | | 325,984 | |
| | | | | | | | |
| | | | Other Revenue — 1.8% | |
| | 35,000 | | | Ohio State Building Authority, Administrative Building Fund Projects, Series C, Rev., 4.000%, 10/01/16 | | | 35,105 | |
| | 140,000 | | | State of Ohio, Major New State Infrastructure Project, Series 3, Rev., 5.000%, 12/15/17 | | | 147,868 | |
| | | | | | | | |
| | | | | | | 182,973 | |
| | | | | | | | |
| | | | Total Ohio | | | 508,957 | |
| | | | | | | | |
| | | | Oklahoma — 6.6% | |
| | | | Education — 6.6% | |
| | 150,000 | | | Grady County School Finance Authority, Educational Facilities Lease, Alex Public Schools Project, Rev., 3.000%, 12/01/17 | | | 153,046 | |
| | 200,000 | | | Oklahoma County Finance Authority, Educational Facilities, Lease Western Harrah Public Schools Project, Rev., 2.000%, 09/01/18 | | | 203,536 | |
| | 300,000 | | | Tulsa County Industrial Authority, Educational Facilities Lease, Owasso Public Schools Project, Rev., 4.000%, 09/01/17 | | | 309,429 | |
| | | | | | | | |
| | | | Total Oklahoma | | | 666,011 | |
| | | | | | | | |
| | | | Oregon — 4.9% | |
| | | | General Obligation — 3.1% | |
| | | | Lane County, Mapleton School District No. 32, | | | | |
| | 50,000 | | | GO, 2.000%, 06/15/17 | | | 50,450 | |
| | 60,000 | | | GO, 2.000%, 06/15/18 | | | 61,075 | |
| | 200,000 | | | State of Oregon, Series A, GO, 2.000%, 06/30/17 | | | 202,262 | |
| | | | | | | | |
| | | | | | | 313,787 | |
| | | | | | | | |
| | | | | | | | |
PRINCIPAL
AMOUNT($) | | | SECURITY DESCRIPTION | | VALUE($) | |
| | | | | | | | |
| | |
| | | | Hospital — 1.8% | |
| | | | Klamath Falls Intercommunity Hospital Authority, Sky Lakes Medical Center Project, | | | | |
| | 75,000 | | | Rev., 2.000%, 09/01/17 | | | 75,887 | |
| | 100,000 | | | Rev., 3.000%, 09/01/18 | | | 104,139 | |
| | | | | | | | |
| | | | | | | 180,026 | |
| | | | | | | | |
| | | | Total Oregon | | | 493,813 | |
| | | | | | | | |
| | | | Pennsylvania — 2.3% | |
| | | | General Obligation — 0.2% | |
| | 20,000 | | | Commonwealth of Pennsylvania, GO, 4.000%, 09/01/16 | | | 20,000 | |
| | | | | | | | |
| | | | Other Revenue — 2.1% | |
| | 25,000 | | | Altoona City Authority, Water, Rev., AGM, 5.000%, 11/01/17 | | | 26,165 | |
| | 175,000 | | | Delaware Valley Regional Finance Authority, Local Government, Rev., 5.750%, 07/01/17 | | | 182,179 | |
| | | | | | | | |
| | | | | | | 208,344 | |
| | | | | | | | |
| | | | Total Pennsylvania | | | 228,344 | |
| | | | | | | | |
| | | | Rhode Island — 0.7% | |
| | | | Education — 0.7% | |
| | 65,000 | | | Rhode Island Health & Educational Building Corp., Public School Financing Program, Series B, Rev., 2.000%, 05/15/17 | | | 65,535 | |
| | | | | | | | |
| | | | Texas — 3.0% | |
| | | | General Obligation — 2.5% | |
| | 150,000 | | | City of Bullard, GO, 2.000%, 09/01/17 | | | 151,678 | |
| | 100,000 | | | Harris County Municipal Utility District No. 412, GO, 2.000%, 09/01/18 | | | 101,735 | |
| | | | | | | | |
| | | | | | | 253,413 | |
| | | | | | | | |
| | | | Hospital — 0.2% | |
| | 25,000 | | | Tarrant County Cultural Education Facilities Finance Corp., Baylor Health Care System Project, Series A, Rev., 3.000%, 11/15/16 | | | 25,121 | |
| | | | | | | | |
| | | | Prerefunded — 0.3% | |
| | 25,000 | | | Spring Independent School District, Series A, GO, PSF-GTD, 5.000%, 08/15/17 (p) | | | 26,053 | |
| | | | | | | | |
| | | | Total Texas | | | 304,587 | |
| | | | | | | | |
| | | | Utah — 2.6% | |
| | | | General Obligation — 0.4% | |
| | 40,000 | | | Board of Education of Weber School District, GO, 5.000%, 06/15/17 | | | 41,397 | |
| | | | | | | | |
| | | | Other Revenue — 2.2% | |
| | 100,000 | | | Municipal Building Authority of West Valley City, Rev., AGM, 2.000%, 02/01/17 | | | 100,470 | |
SEE NOTES TO FINANCIAL STATEMENTS.
| | | | | | | | |
| | | |
| AUGUST 31, 2016 | | J.P. MORGAN MUNICIPAL BOND FUNDS | | | | | 7 | |
JPMorgan Ultra-Short Municipal Fund
SCHEDULE OF PORTFOLIO INVESTMENTS
AS OF AUGUST 31, 2016 (Unaudited) (continued)
| | | | | | | | |
PRINCIPAL
AMOUNT($) | | | SECURITY DESCRIPTION | | VALUE($) | |
| | | | | | | | |
| Municipal Bonds — continued | |
| | | | Other Revenue — continued | |
| | 115,000 | | | State of Utah, Series B, Rev., 5.000%, 07/01/17 | | | 119,238 | |
| | | | | | | | |
| | | | | | | 219,708 | |
| | | | | | | | |
| | | | Total Utah | | | 261,105 | |
| | | | | | | | |
| | | | Virginia — 0.8% | |
| | | | Prerefunded — 0.8% | |
| | 25,000 | | | County of Prince William, Series A, COP, AMBAC, 4.500%, 09/01/26 (p) | | | 25,000 | |
| | 50,000 | | | Industrial Development Authority, Northumberland County School Project, Rev., NATL-RE, 4.000%, 11/01/16 (p) | | | 50,297 | |
| | | | | | | | |
| | | | Total Virginia | | | 75,297 | |
| | | | | | | | |
| | | | Washington — 2.6% | |
| | | | General Obligation — 0.5% | |
| | 50,000 | | | Skagit County, Public Hospital District No. 1, GO, 4.000%, 12/01/17 | | | 52,002 | |
| | | | | | | | |
| | | | Hospital — 0.4% | |
| | 40,000 | | | Washington Health Care Facilities Authority, Rev., 5.000%, 11/01/17 | | | 41,937 | |
| | | | | | | | |
| | | | Prerefunded — 0.3% | | | | |
| | 25,000 | | | Clark County, Camas School District No. 117, GO, AGM, 4.500%, 12/01/17 (p) | | | 26,226 | |
| | | | | | | | |
| | | | Utility — 1.4% | | | | |
| | 130,000 | | | County of Snohomish, Public Utility District No. 1, Water System, Rev., 4.000%, 12/01/17 | | | 135,461 | |
| | | | | | | | |
| | | | Total Washington | | | 255,626 | |
| | | | | | | | |
| | | | Wisconsin — 8.8% | | | | |
| | | | Education — 7.5% | | | | |
| | 375,000 | | | Ellsworth Community School District, Pierce County, Rev., BAN, 2.000%, 09/07/16 (p) | | | 375,097 | |
| | 375,000 | | | School District of Argyle, Rev., BAN, 2.000%, 09/19/16 (p) | | | 375,289 | |
| | | | | | | | |
| | | | | | | 750,386 | |
| | | | | | | | |
| | | | General Obligation — 1.3% | | | | |
| | 100,000 | | | County of Iowa, Dodgeville School District, GO, 2.000%, 03/01/17 | | | 100,685 | |
| | 30,000 | | | State of Wisconsin, Series 1, GO, 5.500%, 11/01/16 | | | 30,256 | |
| | | | | | | | |
| | | | | | | 130,941 | |
| | | | | | | | |
| | | | Total Wisconsin | | | 881,327 | |
| | | | | | | | |
| | | | Total Municipal Bonds
(Cost $9,711,841) | | | 9,719,236 | |
| | | | | | | | |
| | | | | | | | |
PRINCIPAL
AMOUNT($) | | | SECURITY DESCRIPTION | | VALUE($) | |
| | | | | | | | |
| Monthly Demand Note — 2.0% | |
| | | | Pennsylvania — 2.0% | |
| | | | Transportation — 2.0% | |
| | 200,000 | | | Pennsylvania Turnpike Commission, Series A-1, Rev., VAR, 0.966%, 10/03/16 (Cost $200,000) | | | 199,862 | |
| | | | | | | | |
| | |
| SHARES | | | | | | |
| Short-Term Investment — 2.7% | | | | |
| | | | Investment Company — 2.7% | |
| | 271,003 | | | JPMorgan U.S. Government Money Market Fund, Institutional Class Shares, 0.310% (b) (l)
(Cost $271,003) | | | 271,003 | |
| | | | | | | | |
| | | | Total Investments — 101.7%
(Cost $10,182,844) | | | 10,190,101 | |
| | | | Liabilities in Excess of
Other Assets — (1.7)% | | | (171,117 | ) |
| | | | | | | | |
| | | | NET ASSETS — 100.0% | | $ | 10,018,984 | |
| | | | | | | | |
Percentages indicated are based on net assets.
NOTES TO SCHEDULE OF PORTFOLIO INVESTMENTS:
| | |
| AGM | | — Insured by Assured Guaranty Municipal Corp. |
| AMBAC | | — Insured by American Municipal Bond Assurance Corp. |
| BAN | | — Bond Anticipation Note |
| COP | | — Certificate of Participation |
| GO | | — General Obligation |
| GTD | | — Guaranteed |
| NATL | | — Insured by National Public Finance Guarantee Corp. |
| PSF | | — Permanent School Fund |
| Q-SBLF | | — Qualified School Bond Loan Fund |
| RAN | | — Revenue Anticipation Note |
| RE | | — Reinsured |
| Rev. | | — Revenue |
| VAR | | — Variable Rate Security. The interest rate shown is the rate in effect as of August 31, 2016. |
| |
| (b) | | — Investment in affiliate. Money market fund is registered under the Investment Company Act of 1940, as amended, and advised by J.P. Morgan Investment Management Inc. |
| (l) | | — The rate shown is the current yield as of August 31, 2016. |
| (p) | | — Security is prerefunded or escrowed to maturity. |
| (t) | | — The date shown represents the earliest of the prerefunded date, next put date, or final maturity date. |
| (w) | | — All or a portion of the security is a when-issued security, delayed delivery security, or forward commitment. |
SEE NOTES TO FINANCIAL STATEMENTS.
| | | | | | |
| | | |
| 8 | | | | J.P. MORGAN MUNICIPAL BOND FUNDS | | AUGUST 31, 2016 |
THIS PAGE IS INTENTIONALLY LEFT BLANK
| | | | | | | | |
| | | |
| AUGUST 31, 2016 | | J.P. MORGAN MUNICIPAL BOND FUNDS | | | | | 9 | |
STATEMENT OF ASSETS AND LIABILITIES
AS OF AUGUST 31, 2016 (Unaudited)
| | | | |
| | |
Ultra-Short
Municipal Fund | |
ASSETS: | |
Investments in non-affiliates, at value | | $ | 9,919,098 | |
Investments in affiliates, at value | | | 271,003 | |
| | | | |
Total investment securities, at value | | | 10,190,101 | |
Receivables: | | | | |
Investment securities sold | | | 3 | |
Interest from non-affiliates | | | 74,076 | |
Dividends from affiliates | | | 230 | |
Due from Adviser | | | 31,982 | |
Deferred offering cost | | | 57,698 | |
| | | | |
Total Assets | | | 10,354,090 | |
| | | | |
|
LIABILITIES: | |
Payables: | | | | |
Due to custodian | | | 3 | |
Investment securities purchased — delayed delivery securities | | | 302,658 | |
Accrued liabilities: | | | | |
Distribution fees | | | 4 | |
Shareholder servicing fees | | | 360 | |
Custodian and accounting fees | | | 7,702 | |
Trustees’ and Chief Compliance Officer’s fees | | | 274 | |
Audit fees | | | 22,712 | |
Other | | | 1,393 | |
| | | | |
Total Liabilities | | | 335,106 | |
| | | | |
Net Assets | | $ | 10,018,984 | |
| | | | |
SEE NOTES TO FINANCIAL STATEMENTS.
| | | | | | |
| | | |
| 10 | | | | J.P. MORGAN MUNICIPAL BOND FUNDS | | AUGUST 31, 2016 |
| | | | |
| | |
Ultra-Short
Municipal Fund | |
NET ASSETS: | |
Paid-in-Capital | | $ | 10,011,992 | |
Accumulated undistributed (distributions in excess of) net investment income | | | (265 | ) |
Net unrealized appreciation (depreciation) | | | 7,257 | |
| | | | |
Total Net Assets | | $ | 10,018,984 | |
| | | | |
|
Net Assets: | |
Class A | | $ | 20,028 | |
Select Class | | | 9,998,956 | |
| | | | |
Total | | $ | 10,018,984 | |
| | | | |
|
Outstanding units of beneficial interest (shares) | |
($0.0001 par value; unlimited number of shares authorized): | | | | |
Class A | | | 2,001 | |
Select Class | | | 999,197 | |
| |
Net Asset Value (a): | | | | |
Class A — Redemption price per share | | $ | 10.01 | |
Select Class — Offering and redemption price per share | | | 10.01 | |
Class A maximum sales charge | | | 2.25 | % |
Class A maximum public offering price per share
[net asset value per share/(100% — maximum sales charge)] | | $ | 10.24 | |
| | | | |
| |
Cost of investments in non-affiliates | | $ | 9,911,841 | |
Cost of investments in affiliates | | | 271,003 | |
| (a) | Per share amounts may not recalculate due to rounding of net assets and/or shares outstanding. |
SEE NOTES TO FINANCIAL STATEMENTS.
| | | | | | | | |
| | | |
| AUGUST 31, 2016 | | J.P. MORGAN MUNICIPAL BOND FUNDS | | | | | 11 | |
STATEMENT OF OPERATIONS
FOR THE PERIOD ENDED AUGUST 31, 2016 (Unaudited)
| | | | |
| | |
Ultra-Short
Municipal Fund (a) | |
INVESTMENT INCOME: | | | | |
Interest income from non-affiliates | | $ | 18,808 | |
Dividend income from affiliates | | | 982 | |
| | | | |
Total investment income | | | 19,790 | |
| | | | |
| |
EXPENSES: | | | | |
Investment advisory fees | | | 3,776 | |
Administration fees | | | 2,055 | |
Distribution fees: | | | | |
Class A | | | 13 | |
Shareholder servicing fees: | | | | |
Class A | | | 13 | |
Select Class | | | 6,281 | |
Custodian and accounting fees | | | 7,782 | |
Professional fees | | | 22,737 | |
Trustees’ and Chief Compliance Officer’s fees | | | 4,445 | |
Printing and mailing costs | | | 1,009 | |
Registration and filing fees | | | 169 | |
Transfer agency fees (See Note 2.E.) | | | 289 | |
Offering costs | | | 21,151 | |
Other | | | 335 | |
| | | | |
Total expenses | | | 70,055 | |
| | | | |
Less fees waived | | | (11,817 | ) |
Less expense reimbursements | | | (50,175 | ) |
| | | | |
Net expenses | | | 8,063 | |
| | | | |
Net investment income (loss) | | | 11,727 | |
| | | | |
|
Change in net unrealized appreciation/depreciation on: | |
Investments in non-affiliates | | | 7,257 | |
| | | | |
Change in net assets resulting from operations | | $ | 18,984 | |
| | | | |
| (a) | Commencement of operations was May 31, 2016. |
SEE NOTES TO FINANCIAL STATEMENTS.
| | | | | | |
| | | |
| 12 | | | | J.P. MORGAN MUNICIPAL BOND FUNDS | | AUGUST 31, 2016 |
STATEMENT OF CHANGES IN NET ASSETS
FOR THE PERIOD INDICATED (Unaudited)
| | | | |
| | | Ultra-Short
Municipal Fund | |
| | | Period Ended
August 31, 2016 (a) | |
CHANGE IN NET ASSETS RESULTING FROM OPERATIONS: | |
Net investment income (loss) | | $ | 11,727 | |
Change in net unrealized appreciation/depreciation | | | 7,257 | |
| | | | |
Change in net assets resulting from operations | | | 18,984 | |
| | | | |
|
DISTRIBUTIONS TO SHAREHOLDERS: | |
Class A | | | | |
From net investment income | | | (12 | ) |
Select Class | | | | |
From net investment income | | | (11,980 | ) |
| | | | |
Total distributions to shareholders | | | (11,992 | ) |
| | | | |
|
CAPITAL TRANSACTIONS: | |
Change in net assets resulting from capital transactions | | | 10,011,992 | |
| | | | |
|
NET ASSETS: | |
Change in net assets | | | 10,018,984 | |
Beginning of period | | | — | |
| | | | |
End of period | | $ | 10,018,984 | |
| | | | |
Accumulated undistributed (distributed in excess of) net investment income | | $ | (265 | ) |
| | | | |
| |
CAPITAL TRANSACTIONS: | | | | |
Class A | | | | |
Proceeds from shares issued | | $ | 20,000 | |
Distributions reinvested | | | 12 | |
| | | | |
Change in net assets resulting from Class A capital transactions | | $ | 20,012 | |
| | | | |
Select Class | | | | |
Proceeds from shares issued | | $ | 9,980,000 | |
Distributions reinvested | | | 11,980 | |
| | | | |
Change in net assets resulting from Select Class capital transactions | | $ | 9,991,980 | |
| | | | |
Total change in net assets resulting from capital transactions | | $ | 10,011,992 | |
| | | | |
|
SHARE TRANSACTIONS: | |
Class A | |
Issued | | | 2,000 | |
Reinvested | | | 1 | |
| | | | |
Change in Class A Shares | | | 2,001 | |
| | | | |
Select Class | |
Issued | | | 998,000 | |
Reinvested | | | 1,197 | |
| | | | |
Change in Select Class Shares | | | 999,197 | |
| | | | |
| (a) | Commencement of operations was May 31, 2016. |
SEE NOTES TO FINANCIAL STATEMENTS.
| | | | | | | | |
| | | |
| AUGUST 31, 2016 | | J.P. MORGAN MUNICIPAL BOND FUNDS | | | | | 13 | |
FINANCIAL HIGHLIGHTS
FOR THE PERIODS INDICATED
| | | | | | | | | | | | | | | | | | | | |
| | | Per share operating performance | |
| | | | | | Investment operations | | | Distributions | |
| | | Net asset
value,
beginning
of period | | | Net
investment
income
(loss) (b) | | | Net realized
and unrealized
gains
(losses) on
investments | | | Total from
investment
operations | | | Net
investment
income | |
Ultra-Short Municipal Fund | | | | | | | | | | | | | | | | | | | | |
Class A | | | | | | | | | | | | | | | | | | | | |
May 31, 2016 (h) through August 31, 2016 | | $ | 10.00 | | | $ | 0.01 | | | $ | 0.01 | | | $ | 0.02 | | | $ | (0.01 | ) |
| | | | | |
Select Class | | | | | | | | | | | | | | | | | | | | |
May 31, 2016 (h) through August 31, 2016 | | | 10.00 | | | | 0.01 | | | | 0.01 | | | | 0.02 | | | | (0.01 | ) |
| (a) | Annualized for periods less than one year, unless otherwise noted. |
| (b) | Calculated based upon average shares outstanding. |
| (c) | Not annualized for periods less than one year. |
| (d) | Includes adjustments in accordance with accounting principles generally accepted in the United States of America and as such, the net asset values for financial reporting purposes and the returns based upon those net asset values may differ from the net asset values and returns for shareholder transactions. |
| (e) | Includes earnings credits and interest expense, if applicable, each of which is less than 0.005% unless otherwise noted. |
| (f) | Certain non-recurring expenses incurred by the Fund were not annualized for the period ended August 31, 2016. |
| (g) | Portfolio turnover is calculated by dividing the lesser of total purchases or sales of portfolio securities for the reporting period by the monthly average value of portfolio securities owned during the reporting period. Excluded from both the numerator and denominator are amounts relating to derivatives and securities whose maturities or expiration dates at the time of acquisition were one year or less. |
| (h) | Commencement of operations. |
SEE NOTES TO FINANCIAL STATEMENTS.
| | | | | | |
| | | |
| 14 | | | | J.P. MORGAN MUNICIPAL BOND FUNDS | | AUGUST 31, 2016 |
| | | | | | | | | | | | | | | | | | | | | | | | | | |
| | | Ratios/Supplemental data | |
| | | | | | | | | | Ratios to average net assets (a) | | | | |
Net asset
value,
end of
period | | | Total return
(excludes
sales charge) (c)(d) | | | Net assets,
end of
period | | | Net
expenses (e)(f) | | | Net
investment
income
(loss) (f) | | |
Expenses
without waivers,
reimbursements and
earnings credits (f) | | | Portfolio
turnover
rate (c)(g) | |
| | | | | | | | | | | | | | | | | | | | | | | | | | |
| | | | | | | | | | | | | | | | | | | | | | | | | | |
| $ | 10.01 | | | | 0.16 | % | | $ | 20,028 | | | | 0.52 | % | | | 0.27 | % | | | 4.52 | % | | | 84 | % |
| | | | | | |
| | | | | | | | | | | | | | | | | | | | | | | | | | |
| | 10.01 | | | | 0.22 | | | | 9,998,956 | | | | 0.32 | | | | 0.46 | | | | 2.52 | | | | 84 | |
SEE NOTES TO FINANCIAL STATEMENTS.
| | | | | | | | |
| | | |
| AUGUST 31, 2016 | | J.P. MORGAN MUNICIPAL BOND FUNDS | | | | | 15 | |
NOTES TO FINANCIAL STATEMENTS
AS OF AUGUST 31, 2016 (Unaudited)
1. Organization
JPMorgan Trust IV (“JPM IV” or the “Trust”) was formed on November 12, 2015, as a Delaware statutory trust, pursuant to a Declaration of Trust dated November 12, 2015 and is registered under the Investment Company Act of 1940, as amended (the “1940 Act”), as an open-end management investment company.
The following is a separate fund of the Trust (the “Fund”) covered by this report:
| | | | |
| | | Classes Offered | | Diversified/Non-Diversified |
| Ultra-Short Municipal Fund | | Class A and Select Class | | Diversified |
The investment objective of the Fund is to seek a high level of current income exempt from federal income taxes as is consistent with relative stability of principal.
The Fund commenced operations on May 31, 2016. Prior to August 31, 2016 the Fund was not publicly offered for investment.
Class A Shares generally provide for a front-end sales charge. No sales charges are assessed with respect to Select Class Shares. All classes of shares have equal rights as to earnings, assets and voting privileges, except that each class may bear different transfer agency, sub-transfer agency, distribution and shareholder servicing fees and each class has exclusive voting rights with respect to its distribution plan and shareholder servicing agreements. Certain Class A Shares, for which front-end sales charges have been waived, may be subject to a CDSC as described in the Fund’s prospectus.
J.P. Morgan Investment Management Inc. (“JPMIM”) an indirect, wholly-owned subsidiary of JPMorgan Chase & Co. (“JPMorgan”) acts as Adviser (the “Adviser”) and Administrator (the “Administrator”) to the Fund.
2. Significant Accounting Policies
The following is a summary of significant accounting policies followed by the Fund in the preparation of its financial statements. The Fund is an investment company and, accordingly, follows the investment company accounting and reporting guidance of the Financial Accounting Standards Board Accounting Standards Codification Topic 946 — Investment Companies, which is part of U.S. generally accepted accounting principles (“GAAP”). The preparation of financial statements in conformity with GAAP requires management to make estimates and assumptions that affect the reported amounts of assets and liabilities and disclosure of contingent assets and liabilities at the date of the financial statements and the reported amounts of increases and decreases in net assets from operations during the reporting period. Actual results could differ from those estimates.
A. Valuation of Investments — The valuation of investments is in accordance with GAAP and the Fund’s valuation policies set forth by and under the supervision and responsibility of the Board of Trustees (the “Board”), which established the following approach to valuation, as described more fully below: (i) investments for which market quotations are readily available shall be valued at such unadjusted quoted prices and (ii) all other investments for which market quotations are not readily available shall be valued at their fair value as determined in good faith by the Board.
The Administrator has established the J.P. Morgan Asset Management Americas Valuation Committee (“AVC”) to assist the Board with the oversight and monitoring of the valuation of the Fund’s investments. The Administrator implements the valuation policies of the Fund’s investments, as directed by the Board. The AVC oversees and carries out the policies for the valuation of investments held in the Fund. This includes monitoring the appropriateness of fair values based on results of ongoing valuation oversight, including but not limited to consideration of macro or security specific events, market events and pricing vendor and broker due diligence. The Administrator is responsible for discussing and assessing the potential impacts to the fair values on an ongoing basis, and at least on a quarterly basis with the AVC and the Board.
A market-based approach is primarily used to value the Fund’s investments. Investments for which market quotations are not readily available are fair valued by approved affiliated and unaffiliated pricing vendors or third party broker-dealers (collectively referred to as “Pricing Services”) or may be internally fair valued using methods set forth by the valuation policies approved by the Board. This may include related or comparable assets or liabilities, recent transactions, market multiples, book values, and other relevant information for the investment to determine the fair value of the investment. An income-based valuation approach may be used in which the anticipated future cash flows of the investment are discounted to calculate the fair value. Discounts may also be applied due to the nature or duration of any restrictions on the disposition of the investments. Valuations may be based upon current market prices of securities that are comparable in coupon, rating, maturity and industry. It is possible that the estimated values may differ significantly from the values that would have been used, had a ready market for the investments existed, and such differences could be material.
Fixed income instruments are valued based on prices received from Pricing Services. The Pricing Services use multiple valuation techniques to determine the valuation of fixed income instruments. In instances where sufficient market activity exists, the Pricing Services may utilize a market-based approach through which trades or quotes from market makers are used to determine the valuation of these instruments. In instances where sufficient market activity may not exist, the Pricing Services also utilize proprietary valuation models which may consider market transactions in comparable securities and the various relationships between securities in determining fair value and/or market characteristics in order to estimate the relevant cash flows, which are then discounted to calculate the fair values.
Investments in open-end investment companies (the “Underlying Funds”) are valued at each Underlying Fund’s net asset value per share (‘NAV’) as of the report date.
Valuations reflected in this report are as of the report date. As a result, changes in valuation due to market events and/or issuer related events after the report date and prior to issuance of the report are not reflected herein.
| | | | | | |
| | | |
| 16 | | | | J.P. MORGAN MUNICIPAL BOND FUNDS | | AUGUST 31, 2016 |
The various inputs that are used in determining the valuation of the Fund’s investments are summarized into the three broad levels listed below.
| • | | Level 1 — Unadjusted inputs using quoted prices in active markets for identical investments. |
| • | | Level 2 — Other significant observable inputs including, but not limited to, quoted prices for similar investments, inputs other than quoted prices that are observable for investments (such as interest rates, prepayment speeds, credit risk, etc.) or other market corroborated inputs. |
| • | | Level 3 — Significant inputs based on the best information available in the circumstances, to the extent observable inputs are not available (including the Fund’s assumptions in determining the fair value of investments). |
A financial instrument’s level within the fair value hierarchy is based on the lowest level of any input, both individually and in the aggregate, that is significant to the fair value measurement. The inputs or methodology used for valuing instruments are not necessarily an indication of the risk associated with investing in those instruments.
The following tables represent each valuation input by municipal sector as presented on the Schedule of Portfolio Investments (“SOI”):
| | | | | | | | | | | | | | | | |
| | | Level 1
Quoted prices | | | Level 2
Other significant
observable inputs | | | Level 3
Significant
unobservable inputs | | | Total | |
Investments in Securities | | | | | | | | | | | | | | | | |
Debt Securities | | | | | | | | | | | | | | | | |
Municipal Bonds | | | | | | | | | | | | | | | | |
Alabama | | | | | | | | | | | | | | | | |
Hospital | | $ | — | | | $ | 10,033 | | | $ | — | | | $ | 10,033 | |
Water & Sewer | | | — | | | | 151,664 | | | | — | | | | 151,664 | |
| | | | | | | | | | | | | | | | |
Total Alabama | | | — | | | | 161,697 | | | | — | | | | 161,697 | |
| | | | | | | | | | | | | | | | |
Alaska | | | | | | | | | | | | | | | | |
Other Revenue | | | — | | | | 25,278 | | | | — | | | | 25,278 | |
Prerefunded | | | — | | | | 296,118 | | | | — | | | | 296,118 | |
| | | | | | | | | | | | | | | | |
Total Alaska | | | — | | | | 321,396 | | | | — | | | | 321,396 | |
| | | | | | | | | | | | | | | | |
Arizona | | | | | | | | | | | | | | | | |
Hospital | | | — | | | | 50,188 | | | | — | | | | 50,188 | |
| | | | | | | | | | | | | | | | |
Arkansas | | | | | | | | | | | | | | | | |
Hospital | | | — | | | | 26,001 | | | | — | | | | 26,001 | |
Water & Sewer | | | — | | | | 101,452 | | | | — | | | | 101,452 | |
| | | | | | | | | | | | | | | | |
Total Arkansas | | | — | | | | 127,453 | | | | — | | | | 127,453 | |
| | | | | | | | | | | | | | | | |
California | | | | | | | | | | | | | | | | |
Certificate of Participation | | | — | | | | 35,000 | | | | — | | | | 35,000 | |
General Obligation | | | — | | | | 160,096 | | | | — | | | | 160,096 | |
Hospital | | | — | | | | 101,168 | | | | — | | | | 101,168 | |
Other Revenue | | | — | | | | 65,216 | | | | — | | | | 65,216 | |
Utility | | | — | | | | 41,502 | | | | — | | | | 41,502 | |
| | | | | | | | | | | | | | | | |
Total California | | | — | | | | 402,982 | | | | — | | | | 402,982 | |
| | | | | | | | | | | | | | | | |
Colorado | | | | | | | | | | | | | | | | |
Certificate of Participation | | | — | | | | 126,541 | | | | — | | | | 126,541 | |
Hospital | | | — | | | | 233,134 | | | | — | | | | 233,134 | |
Water & Sewer | | | — | | | | 165,689 | | | | — | | | | 165,689 | |
| | | | | | | | | | | | | | | | |
Total Colorado | | | — | | | | 525,364 | | | | — | | | | 525,364 | |
| | | | | | | | | | | | | | | | |
Connecticut | | | | | | | | | | | | | | | | |
General Obligation | | | — | | | | 350,000 | | | | — | | | | 350,000 | |
| | | | | | | | | | | | | | | | |
Florida | | | | | | | | | | | | | | | | |
Education | | | — | | | | 127,438 | | | | — | | | | 127,438 | |
General Obligation | | | — | | | | 82,978 | | | | — | | | | 82,978 | |
Other Revenue | | | — | | | | 291,191 | | | | — | | | | 291,191 | |
Prerefunded | | | — | | | | 36,652 | | | | — | | | | 36,652 | |
Utility | | | — | | | | 25,095 | | | | — | | | | 25,095 | |
| | | | | | | | | | | | | | | | |
Total Florida | | | — | | | | 563,354 | | | | — | | | | 563,354 | |
| | | | | | | | | | | | | | | | |
| | | | | | | | |
| | | |
| AUGUST 31, 2016 | | J.P. MORGAN MUNICIPAL BOND FUNDS | | | | | 17 | |
NOTES TO FINANCIAL STATEMENTS
AS OF AUGUST 31, 2016 (Unaudited) (continued)
| | | | | | | | | | | | | | | | |
| | | Level 1
Quoted prices | | | Level 2
Other significant
observable inputs | | | Level 3
Significant
unobservable inputs | | | Total | |
Georgia | | | | | | | | | | | | | | | | |
Certificate of Participation | | $ | — | | | $ | 36,754 | | | $ | — | | | $ | 36,754 | |
Other Revenue | | | — | | | | 35,151 | | | | — | | | | 35,151 | |
| | | | | | | | | | | | | | | | |
Total Georgia | | | — | | | | 71,905 | | | | — | | | | 71,905 | |
| | | | | | | | | | | | | | | | |
Illinois | | | | | | | | | | | | | | | | |
General Obligation | | | — | | | | 362,948 | | | | — | | | | 362,948 | |
Other Revenue | | | — | | | | 101,843 | | | | — | | | | 101,843 | |
| | | | | | | | | | | | | | | | |
Total Illinois | | | — | | | | 464,791 | | | | — | | | | 464,791 | |
| | | | | | | | | | | | | | | | |
Indiana | | | | | | | | | | | | | | | | |
Education | | | — | | | | 100,892 | | | | — | | | | 100,892 | |
Water & Sewer | | | — | | | | 200,736 | | | | — | | | | 200,736 | |
| | | | | | | | | | | | | | | | |
Total Indiana | | | — | | | | 301,628 | | | | — | | | | 301,628 | |
| | | | | | | | | | | | | | | | |
Iowa | | | | | | | | | | | | | | | | |
Hospital | | | — | | | | 51,279 | | | | — | | | | 51,279 | |
| | | | | | | | | | | | | | | | |
Kansas | | | | | | | | | | | | | | | | |
General Obligation | | | — | | | | 40,533 | | | | — | | | | 40,533 | |
Utility | | | — | | | | 100,000 | | | | — | | | | 100,000 | |
| | | | | | | | | | | | | | | | |
Total Kansas | | | — | | | | 140,533 | | | | — | | | | 140,533 | |
| | | | | | | | | | | | | | | | |
Kentucky | | | | | | | | | | | | | | | | |
Other Revenue | | | — | | | | 100,212 | | | | — | | | | 100,212 | |
| | | | | | | | | | | | | | | | |
Massachusetts | | | | | | | | | | | | | | | | |
Education | | | — | | | | 26,056 | | | | — | | | | 26,056 | |
General Obligation | | | — | | | | 25,192 | | | | — | | | | 25,192 | |
Other Revenue | | | — | | | | 135,000 | | | | — | | | | 135,000 | |
| | | | | | | | | | | | | | | | |
Total Massachusetts | | | — | | | | 186,248 | | | | — | | | | 186,248 | |
| | | | | | | | | | | | | | | | |
Michigan | | | | | | | | | | | | | | | | |
General Obligation | | | — | | | | 75,299 | | | | — | | | | 75,299 | |
Other Revenue | | | — | | | | 30,115 | | | | — | | | | 30,115 | |
| | | | | | | | | | | | | | | | |
Total Michigan | | | — | | | | 105,414 | | | | — | | | | 105,414 | |
| | | | | | | | | | | | | | | | |
Minnesota | | | | | | | | | | | | | | | | |
Certificate of Participation | | | — | | | | 100,598 | | | | — | | | | 100,598 | |
Education | | | — | | | | 51,009 | | | | — | | | | 51,009 | |
General Obligation | | | — | | | | 25,192 | | | | — | | | | 25,192 | |
| | | | | | | | | | | | | | | | |
Total Minnesota | | | — | | | | 176,799 | | | | — | | | | 176,799 | |
| | | | | | | | | | | | | | | | |
Missouri | | | | | | | | | | | | | | | | |
Hospital | | | — | | | | 152,764 | | | | — | | | | 152,764 | |
Other Revenue | | | — | | | | 101,154 | | | | — | | | | 101,154 | |
| | | | | | | | | | | | | | | | |
Total Missouri | | | — | | | | 253,918 | | | | — | | | | 253,918 | |
| | | | | | | | | | | | | | | | |
Nebraska | | | | | | | | | | | | | | | | |
Education | | | — | | | | 25,000 | | | | — | | | | 25,000 | |
General Obligation | | | — | | | | 100,970 | | | | — | | | | 100,970 | |
| | | | | | | | | | | | | | | | |
Total Nebraska | | | — | | | | 125,970 | | | | — | | | | 125,970 | |
| | | | | | | | | | | | | | | | |
New Jersey | | | | | | | | | | | | | | | | |
Certificate of Participation | | | — | | | | 153,363 | | | | — | | | | 153,363 | |
General Obligation | | | — | | | | 451,866 | | | | — | | | | 451,866 | |
Other Revenue | | | — | | | | 269,517 | | | | — | | | | 269,517 | |
| | | | | | | | | | | | | | | | |
Total New Jersey | | | — | | | | 874,746 | | | | — | | | | 874,746 | |
| | | | | | | | | | | | | | | | |
| | | | | | |
| | | |
| 18 | | | | J.P. MORGAN MUNICIPAL BOND FUNDS | | AUGUST 31, 2016 |
| | | | | | | | | | | | | | | | |
| | | Level 1
Quoted prices | | | Level 2
Other significant
observable inputs | | | Level 3
Significant
unobservable inputs | | | Total | |
New York | | | | | | | | | | | | | | | | |
Education | | $ | — | | | $ | 82,941 | | | $ | — | | | $ | 82,941 | |
General Obligation | | | — | | | | 222,815 | | | | 100,707 | | | | 323,522 | |
Transportation | | | — | | | | 216,294 | | | | — | | | | 216,294 | |
| | | | | | | | | | | | | | | | |
Total New York | | | — | | | | 522,050 | | | | 100,707 | | | | 622,757 | |
| | | | | | | | | | | | | | | | |
Ohio | | | | | | | | | | | | | | | | |
General Obligation | | | — | | | | 325,984 | | | | — | | | | 325,984 | |
Other Revenue | | | — | | | | 182,973 | | | | — | | | | 182,973 | |
| | | | | | | | | | | | | | | | |
Total Ohio | | | — | | | | 508,957 | | | | — | | | | 508,957 | |
| | | | | | | | | | | | | | | | |
Oklahoma | | | | | | | | | | | | | | | | |
Education | | | — | | | | 666,011 | | | | — | | | | 666,011 | |
| | | | | | | | | | | | | | | | |
Oregon | | | | | | | | | | | | | | | | |
General Obligation | | | — | | | | 313,787 | | | | — | | | | 313,787 | |
Hospital | | | — | | | | 180,026 | | | | — | | | | 180,026 | |
| | | | | | | | | | | | | | | | |
Total Oregon | | | — | | | | 493,813 | | | | — | | | | 493,813 | |
| | | | | | | | | | | | | | | | |
Pennsylvania | | | | | | | | | | | | | | | | |
General Obligation | | | — | | | | 20,000 | | | | — | | | | 20,000 | |
Other Revenue | | | — | | | | 208,344 | | | | — | | | | 208,344 | |
| | | | | | | | | | | | | | | | |
Total Pennsylvania | | | — | | | | 228,344 | | | | — | | | | 228,344 | |
| | | | | | | | | | | | | | | | |
Rhode Island | | | | | | | | | | | | | | | | |
Education | | | — | | | | 65,535 | | | | — | | | | 65,535 | |
| | | | | | | | | | | | | | | | |
Texas | | | | | | | | | | | | | | | | |
General Obligation | | | — | | | | 253,413 | | | | — | | | | 253,413 | |
Hospital | | | — | | | | 25,121 | | | | — | | | | 25,121 | |
Prerefunded | | | — | | | | 26,053 | | | | — | | | | 26,053 | |
| | | | | | | | | | | | | | | | |
Total Texas | | | — | | | | 304,587 | | | | — | | | | 304,587 | |
| | | | | | | | | | | | | | | | |
Utah | | | | | | | | | | | | | | | | |
General Obligation | | | — | | | | 41,397 | | | | — | | | | 41,397 | |
Other Revenue | | | — | | | | 219,708 | | | | — | | | | 219,708 | |
| | | | | | | | | | | | | | | | |
Total Utah | | | — | | | | 261,105 | | | | — | | | | 261,105 | |
| | | | | | | | | | | | | | | | |
Virginia | | | | | | | | | | | | | | | | |
Prerefunded | | | — | | | | 75,297 | | | | — | | | | 75,297 | |
| | | | | | | | | | | | | | | | |
Washington | | | | | | | | | | | | | | | | |
General Obligation | | | — | | | | 52,002 | | | | — | | | | 52,002 | |
Hospital | | | — | | | | 41,937 | | | | — | | | | 41,937 | |
Prerefunded | | | — | | | | 26,226 | | | | — | | | | 26,226 | |
Utility | | | — | | | | 135,461 | | | | — | | | | 135,461 | |
| | | | | | | | | | | | | | | | |
Total Washington | | | — | | | | 255,626 | | | | — | | | | 255,626 | |
| | | | | | | | | | | | | | | | |
Wisconsin | | | | | | | | | | | | | | | | |
Education | | | — | | | | 750,386 | | | | — | | | | 750,386 | |
General Obligation | | | — | | | | 130,941 | | | | — | | | | 130,941 | |
| | | | | | | | | | | | | | | | |
Total Wisconsin | | | — | | | | 881,327 | | | | — | | | | 881,327 | |
| | | | | | | | | | | | | | | | |
Total Municipal Bonds | | | — | | | | 9,618,529 | | | | 100,707 | | | | 9,719,236 | |
| | | | | | | | | | | | | | | | |
Monthly Demand Notes | | | | | | | | | | | | | | | | |
Pennsylvania | | | — | | | | 199,862 | | | | — | | | | 199,862 | |
Short-Term Investment | | | | | | | | | | | | | | | | |
Investment Companies | | | 271,003 | | | | — | | | | — | | | | 271,003 | |
| | | | | | | | | | | | | | | | |
Total Investments in Securities | | $ | 271,003 | | | $ | 9,818,391 | | | $ | 100,707 | | | $ | 10,190,101 | |
| | | | | | | | | | | | | | | | |
Transfers between fair value levels are valued utilizing values as of the beginning of the period.
| | | | | | | | |
| | | |
| AUGUST 31, 2016 | | J.P. MORGAN MUNICIPAL BOND FUNDS | | | | | 19 | |
NOTES TO FINANCIAL STATEMENTS
AS OF AUGUST 31, 2016 (Unaudited) (continued)
B. When Issued, Delayed Delivery Securities and Forward Commitments — The Fund purchased when issued securities, including To Be Announced (“TBA”) securities, and entered into contracts to purchase or sell securities for a fixed price that may be settled a month or more after the trade date, or purchased delayed delivery securities which generally settle seven days after the trade date. When issued securities are securities that have been authorized, but not issued in the market. A forward commitment involves entering into a contract to purchase or sell securities for a fixed price at a future date that may be settled a month or more after the trade date. A delayed delivery security is agreed upon in advance between the buyer and the seller of the security and is generally delivered beyond seven days of the agreed upon date. The purchase of securities on a when issued, delayed delivery, or forward commitment basis involves the risk that the value of the security to be purchased declines before settlement date. The sale of securities on a forward commitment basis involves the risk that the value of the securities sold may increase before the settlement date. The Fund may be exposed to credit risk if the counterparty fails to perform under the terms of the transaction. Interest income for securities purchased on a when issued, delayed delivery, or forward commitment basis is not accrued until the settlement date.
The Fund had when issued securities, forward commitments or delayed delivery securities outstanding as of August 31, 2016, which are shown as a Payable for investment securities purchased — delayed delivery securities on the Statement of Assets and Liabilities. The values of these securities held at August 31, 2016 are detailed on the SOI.
The Fund did not have TBA purchase commitments outstanding as of August 31, 2016.
C. Offering and Organizational Costs — Total offering costs of approximately $78,849 incurred in connection with the offering of shares of the Fund are amortized on a straight line basis over 12 months from the date the Fund commenced operations. Costs paid in connection with the organization of the Fund, if any, were recorded as an expense at the time the Fund commenced operations and are included as part of Professional fees on the Statement of Operations. For the period ended August 31, 2016, total offering costs amortized were $21,151.
D. Security Transactions and Investment Income — Investment transactions are accounted for on the trade date (the date the order to buy or sell is executed). Securities gains and losses are calculated on a specifically identified cost basis. Interest income is determined on the basis of coupon interest accrued using the effective interest method which adjusts for amortization of premiums and accretion of discounts. Dividend income net of foreign taxes withheld, if any, is recorded on the ex-dividend date or when the Fund first learns of the dividend.
E. Allocation of Income and Expenses — Expenses directly attributable to a fund are charged directly to that fund, while the expenses attributable to more than one fund of the Trust are allocated among the respective funds. In calculating the NAV of each class, investment income, realized and unrealized gains and losses and expenses, other than class specific expenses, are allocated daily to each class of shares based upon the proportion of net assets of each class at the beginning of each day.
Transfer agency fees are class-specific expenses. The amount of transfer agency fees charged to each class of the Fund for the period ended August 31, 2016 are as follows:
| | | | | | | | | | | | |
| | | Class A | | | Select Class | | | Total | |
Transfer agency fees | | $ | 100 | | | $ | 189 | | | $ | 289 | |
F. Federal Income Taxes — The Fund is treated as a separate taxable entity for Federal income tax purposes. The Fund’s policy is to comply with the provisions of the Internal Revenue Code of 1986, as amended (the “Code”), applicable to regulated investment companies and to distribute to shareholders all of its distributable net investment income and net realized capital gains on investments. Accordingly, no provision for Federal income tax is necessary. Management has reviewed the Fund’s tax positions for all open tax years and has determined that as of August 31, 2016, no liability for income tax is required in the Fund’s financial Statement for net unrecognized tax benefits. However, management’s conclusions may be subject to future review based on changes in, or the interpretation of, the accounting standards or tax laws and regulations. The Fund’s Federal tax returns for the prior three fiscal years, or since inception if shorter, remains subject to examination by the Internal Revenue Service.
G. Distributions to Shareholders — Distributions from net investment income are generally declared and paid monthly and are declared separately for each class. No class has preferential dividend rights; differences in per share rates are due to differences in separate class expenses. Net realized capital gains, if any, are distributed by each Fund at least annually. The amount of distributions from net investment income and net realized capital gains is determined in accordance with Federal income tax regulations, which may differ from GAAP. To the extent these “book/tax” differences are permanent in nature (i.e., that they result from other than timing of recognition — “temporary differences”), such amounts are reclassified within the capital accounts based on their Federal tax-basis treatment.
3. Fees and Other Transactions with Affiliates
A. Investment Advisory Fee — Pursuant to an Investment Advisory Agreement, the Adviser supervises the investments of the Fund and for such services is paid a fee. The fee is accrued daily and paid monthly at an annual rate of 0.15% of the Fund’s average daily net assets.
The Adviser waived Investment Advisory fees and/or reimbursed expenses as outlined in Note 3.F.
B. Administration Fee — Pursuant to an Administration Agreement, the Administrator provides certain administration services to the Funds. In consideration of these services, the Administrator receives a fee accrued daily and paid monthly at an annual rate of 0.15% of the first $25 billion of the average daily net assets of all funds in the J.P. Morgan Funds Complex covered by the Administration Agreement (excluding certain funds of funds and money market funds) and 0.075% of the average daily net assets in excess of $25 billion of all such funds. For the period ended
| | | | | | |
| | | |
| 20 | | | | J.P. MORGAN MUNICIPAL BOND FUNDS | | AUGUST 31, 2016 |
August 31, 2016, the effective annualized rate was 0.08% of the Fund’s average daily net assets, notwithstanding any fee waivers and/or expense reimbursements.
The Administrator waived Administration fees as outlined in Note 3.F.
JPMorgan Chase Bank, N.A. (“JPMCB”), a wholly-owned subsidiary of JPMorgan, serves as the Fund’s sub-administrator (the “Sub-administrator”). For its services as Sub-administrator, JPMCB receives a portion of the fees payable to the Administrator.
C. Distribution Fees — Pursuant to a Distribution Agreement, JPMorgan Distribution Services, Inc. (the “Distributor”), a wholly-owned subsidiary of JPMorgan, serves as the Trust’s exclusive underwriter and promotes and arranges for the sale of the Fund’s shares.
The Board has adopted a Distribution Plan (the “Distribution Plan”) for Class A Shares of the Fund in accordance with Rule 12b-1 under the 1940 Act. The Distribution Plan provides that the Fund shall pay distribution fees, including payments to the Distributor, at annual rates 0.25% of the average daily net assets of Class A Shares.
In addition, the Distributor is entitled to receive the front-end sales charges from purchases of Class A Shares and the CDSC from certain Class A Shares for which front-end sales charges have been waived. For the period ended August 31, 2016, the Distributor did not retain any front-end sales charges or CDSC.
D. Shareholder Servicing Fees — The Trust, on behalf of the Fund, has entered into a Shareholder Servicing Agreement with the Distributor under which the Distributor provides certain support services to the shareholders. For performing these services, the Distributor receives a fee that is accrued daily and paid monthly equal to a percentage of the average daily net assets as shown in the table below:
| | | | | | | | | | | | |
| | | | | | Class A | | | Select Class | |
| | | | | | | 0.25 | % | | | 0.25 | % |
The Distributor has entered into shareholder services contracts with affiliated and unaffiliated financial intermediaries who provide shareholder services and other related services to their clients or customers who invest in the Fund under which the Distributor will pay all or a portion of such fees earned to financial intermediaries for performing such services.
The Distributor waived shareholder servicing fees as outlined in Note 3.F.
E. Custodian and Accounting Fees — JPMCB provides portfolio custody and accounting services to the Fund. For performing these services, the Fund pays JPMCB transaction and asset-based fees that vary according to the number of transactions and positions, plus out-of-pocket expenses. The amounts paid directly to JPMCB by the Fund for custody and accounting services are included in Custodian and accounting fees on the Statement of Operations. Payments to the custodian may be reduced by credits earned by the Fund, based on uninvested cash balances held by the custodian. Such earnings credits, if any, are presented separately on the Statement of Operations.
Interest income earned on cash balances at the custodian, if any, is included in Interest income from affiliates on the Statement of Operations.
Interest expense paid to the custodian related to cash overdrafts, if any, is included in Interest expense to affiliates on the Statement of Operations.
F. Waivers and Reimbursements — The Adviser, Administrator and/or Distributor have contractually agreed to waive fees and/or reimburse the Fund to the extent that total annual operating expenses (excluding acquired fund fees and expenses other than certain money market funds as described below, dividend and interest expenses related to short sales, interest, taxes, expenses related to litigation and potential litigation and extraordinary expenses) exceed the percentages of the Fund’s average daily net assets as shown in the table below:
| | | | | | | | | | | | |
| | | | | | Class A | | | Select Class | |
| | | | | | | 0.55 | % | | | 0.35 | % |
The expense limitation agreement was in effect for the period ended August 31, 2016 and is in place until at least October 31, 2016.
Effective November 1, 2016, the contractual expense limitations for the Fund will be reduced until at least October 31, 2018, as shown in the table below:
| | | | | | | | | | | | |
| | | | | | Class A | | | Select Class | |
| | | | | | | 0.45 | % | | | 0.25 | % |
For the period ended August 31, 2016, the Fund’s service providers waived fees and/or reimbursed expenses for the Fund as follows. None of these parties expect the Fund to repay any such waived fees and/or reimbursed expenses in future years.
| | | | | | | | | | | | | | | | | | | | |
| | | Contractual Waivers | | | | |
| | | Investment
Advisory | | | Administration | | | Shareholder
Servicing | | | Total | | | Contractual
Reimbursement | |
| | $ | 3,777 | | | $ | 2,055 | | | $ | 5,226 | | | $ | 11,058 | | | $ | 50,175 | |
Additionally, the Fund may invest in one or more money market funds advised by the Adviser or its affiliates (affiliated money market funds). The Adviser, Administrator and/or Distributor, as shareholder servicing agent, have contractually agreed to waive fees and/or reimburse expenses in an
| | | | | | | | |
| | | |
| AUGUST 31, 2016 | | J.P. MORGAN MUNICIPAL BOND FUNDS | | | | | 21 | |
NOTES TO FINANCIAL STATEMENTS
AS OF AUGUST 31, 2016 (Unaudited) (continued)
amount sufficient to offset the respective net fees each collects from the affiliated money market fund on the Fund’s investment in such affiliated money market fund.
The amounts of these waivers resulting from investments in these money market funds for the period ended August 31, 2016, was $759.
G. Other — Certain officers of the Trust are affiliated with the Adviser, the Administrator and the Distributor. Such officers, with the exception of the Chief Compliance Officer, receive no compensation from the Fund for serving in their respective roles.
The Board appointed a Chief Compliance Officer to the Fund in accordance with Federal securities regulations. The Fund, along with other affiliated funds, makes reimbursement payments, on a pro-rata basis, to the Administrator for a portion of the fees associated with the Office of the Chief Compliance Officer. Such fees are included in Trustees’ and Chief Compliance Officer’s fees on the Statement of Operations.
The Trust adopted a Trustee Deferred Compensation Plan (the “Plan”) which allows the Independent Trustees to defer the receipt of all or a portion of compensation related to performance of their duties as Trustees. The deferred fees are invested in various J.P. Morgan Funds until distribution in accordance with the Plan.
During the period ended August 31, 2016, the Fund may have purchased securities from an underwriting syndicate in which the principal underwriter or members of the syndicate are affiliated with the Adviser.
The Fund may use related party broker-dealers. For the period ended August 31, 2016, the Fund did not incur any brokerage commissions with broker-dealers affiliated with the Adviser.
The Securities and Exchange Commission (“SEC”) has granted an exemptive order permitting the Fund to engage in principal transactions with J.P. Morgan Securities, Inc., an affiliated broker, involving taxable money market instruments, subject to certain conditions.
4. Investment Transactions
During the period ended August 31, 2016, purchases and sales of investments (excluding short-term investments) were as follows:
| | | | | | | | |
| | | Purchases
(excluding U.S.
Government) | | | Sales
(excluding U.S.
Government) | |
| | $ | 10,179,900 | | | $ | 4,901,000 | |
During the period ended August 31, 2016, there were no purchases or sales of U.S. Government securities.
5. Federal Income Tax Matters
For Federal income tax purposes, the cost and unrealized appreciation (depreciation) in value of investment securities held at August 31, 2016 were as follows:
| | | | | | | | | | | | | | | | |
| | | Aggregate
Cost | | | Gross
Unrealized
Appreciation | | | Gross
Unrealized
Depreciation | | | Net Unrealized
Appreciation
(Depreciation) | |
| | $ | 10,182,844 | | | $ | 8,019 | | | $ | 762 | | | $ | 7,257 | |
6. Borrowings
The Fund relies upon an exemptive order granted by the SEC (the “Order”) permitting the establishment and operation of an Interfund Lending Facility (the “Facility”). The Facility allows the Fund to directly lend and borrow money to or from any other fund relying upon the Order at rates beneficial to both the borrowing and lending funds. Advances under the Facility are taken primarily for temporary or emergency purposes, including the meeting of redemption requests that otherwise might require the untimely disposition of securities, and are subject to the Fund’s borrowing restrictions. The Interfund loan rate is determined, as specified in the Order, by averaging the current repurchase agreement rate and the current bank loan rate. The Order was granted to JPMorgan Trust II and may be relied upon by the Fund because the Fund and the series of JPMorgan Trust II are all investment companies in the same “group of investment companies” (as defined in Section 12(d)(1)(G) of the 1940 Act).
In addition, the Trust and JPMCB have entered into a financing arrangement. Under this arrangement, JPMCB provides an unsecured, uncommitted credit facility in the aggregate amount of $100 million to certain of the J.P. Morgan Funds, including the Fund. Advances under the arrangement are taken primarily for temporary or emergency purposes, including the meeting of redemption requests that otherwise might require the untimely disposition of securities, and are subject to the Fund’s borrowing restrictions. Interest on borrowings is payable at a rate determined by JPMCB at the time of borrowing. This agreement has been extended until November 7, 2016.
The Fund had no borrowings outstanding from another fund or from the unsecured, uncommitted credit facility during the period ended August 31, 2016.
7. Risks, Concentrations and Indemnifications
In the normal course of business, the Fund enters into contracts that contain a variety of representations which provide general indemnifications. The Fund’s maximum exposure under these arrangements is unknown. The amount of exposure would depend on future claims that may be made against the Fund that have not yet occurred. However, based on experience, the Fund expects the risk of loss to be remote.
| | | | | | |
| | | |
| 22 | | | | J.P. MORGAN MUNICIPAL BOND FUNDS | | AUGUST 31, 2016 |
The Fund’s shares are currently held by the Adviser.
The Fund is subject to interest rate and credit risk. The value of debt securities may decline as interest rates increase. The Fund could lose money if the issuer of a fixed income security is unable to pay interest or repay principal when it is due. The Fund invests in floating rate loans and other floating rate debt securities. Although these investments are generally less sensitive to interest rate changes than other fixed rate instruments, the value of floating rate loans and other floating rate investments may decline if their interest rates do not rise as quickly, or as much, as general interest rates. Many factors can cause interest rates to rise. Some examples include central bank monetary policy, rising inflation rates and general economic conditions. Given the historically low interest rate environment, risks associated with rising rates are heightened. The ability of the issuers of debt to meet their obligations may be affected by the economic and political developments in a specific industry or region.
Specific risks and concentrations present in the underlying funds are disclosed within their individual financial Statement and registration Statement, as appropriate.
The Fund invests primarily in a portfolio of debt obligations issued by states, territories and possessions of the United States and by the District of Columbia, and by their political subdivisions and duly constituted authorities. These debt obligations may be insured by private insurers who guarantee the payment of principal and interest in the event of issuer default. The value of these investments may be impacted by changes to bond insurers’ ratings and the Fund’s ability to collect principal and interest in the event of an issuer’s default may be limited if the private insurer does not have the wherewithal to satisfy its obligation.
| | | | | | | | |
| | | |
| AUGUST 31, 2016 | | J.P. MORGAN MUNICIPAL BOND FUNDS | | | | | 23 | |
SCHEDULE OF SHAREHOLDER EXPENSES
(Unaudited)
Hypothetical $1,000 Investment
As a shareholder of the Fund, you incur two types of costs: (1) transaction costs, including sales charges (loads) on purchase payments and (2) ongoing costs, including investment advisory fees, administration fees, distribution fees and other Fund expenses. The examples below are intended to help you understand your ongoing costs (in dollars) of investing in the Fund and to compare these ongoing costs with the ongoing costs of investing in other mutual funds. The examples assume that you had a $1,000 investment in each Class at the beginning of the reporting period, May 31, 2016, and continued to hold your shares at the end of the reporting period, August 31, 2016.
Actual Expenses
For each Class of the Fund in the table below, the first line provides information about actual account values and actual expenses. You may use the information in this line, together with the amount you invested, to estimate the expenses that you paid over the period. Simply divide your account value by $1,000 (for example, an $8,600 account value divided by $1,000 = 8.6), then multiply the result by the number in the first line of each Class under the heading entitled “Expenses Paid During the Period” to estimate the expenses you paid on your account during this period.
Hypothetical Example for Comparison Purposes
The second line of each Class in the table below provides information about hypothetical account values and hypothetical expenses based on the Class’ actual expense ratio and an assumed rate of return of 5% per year before expenses, which is not the Class’ actual return. The hypothetical account values and expenses may not be used to estimate the actual ending account balance or expenses you paid for the period. You may use this information to compare the ongoing costs of investing in the Class of the Fund and other funds. To do so, compare this 5% hypothetical example with the 5% hypothetical examples that appear in the shareholder reports of the other funds. Please note that the expenses shown in the table are meant to highlight your ongoing costs only and do not reflect any transaction costs, such as sales charges (loads) or redemption fees. Therefore, the second line for each Class in the table is useful in comparing ongoing costs only, and will not help you determine the relative total costs of owning different funds. In addition, if these transaction costs were included, your costs would have been higher. The examples also assume all dividends and distributions have been reinvested.
| | | | | | | | | | | | | | | | |
| | | Beginning
Account Value
May 31, 2016 | | | Ending
Account Value
August 31, 2016 | | | Expenses
Paid During
the Period* | | | Annualized
Expense
Ratio | |
Ultra-Short Municipal Fund | | | | | | | | | | | | | | | | |
Class A | | | | | | | | | | | | | | | | |
Actual* | | $ | 1,000.00 | | | $ | 1,001.60 | | | $ | 1.31 | | | | 0.52 | % |
Hypothetical** | | | 1,000.00 | | | | 1,022.58 | | | | 2.65 | | | | 0.52 | |
Select Class | | | | | | | | | | | | | | | | |
Actual* | | | 1,000.00 | | | | 1,002.20 | | | | 0.81 | | | | 0.32 | |
Hypothetical** | | | 1,000.00 | | | | 1,023.59 | | | | 1.63 | | | | 0.32 | |
| * | Expenses are equal to each Class’ respective annualized expense ratio, multiplied by the average account value over the period, multiplied by 92/365 (to reflect the actual period). Commencement of operations was May 31, 2016. |
| ** | Expenses are equal to each Class’ respective annualized expense ratio, multiplied by the average account value over the period, multiplied by 184/365 (to reflect the one-half year period). |
| | | | | | |
| | | |
| 24 | | | | J.P. MORGAN MUNICIPAL BOND FUNDS | | AUGUST 31, 2016 |
BOARD APPROVAL OF INVESTMENT ADVISORY AGREEMENT
(Unaudited)
The Board of Trustees has established various standing committees composed of Trustees with diverse backgrounds, to which the Board of Trustees has assigned specific subject matter responsibilities to further enhance the effectiveness of the Board’s oversight and decision making. The Board of Trustees and its investment subcommittees (money market and alternative products, equity, and fixed income) meet regularly throughout the year and consider factors that are relevant to their annual consideration of investment advisory agreements at each meeting. They also meet for the specific purpose of considering approvals of initial advisory agreements for new funds. At their November 2015 in-person meeting, the Trustees, including a majority of the Trustees who are not “interested persons” (as defined in the 1940 Act) of any party to the initial advisory agreement or any of their affiliates (“Independent Trustees”), approved the initial investment advisory agreement (the “New Advisory Agreement”) for the Fund whose semi-annual report is contained herein.
In connection with the approval of the New Advisory Agreement, the Trustees reviewed written materials prepared by the Adviser and received oral presentations from Adviser personnel. Before voting on the proposed New Advisory Agreement, the Trustees reviewed the New Advisory Agreement with representatives of the Adviser and with counsel to the Trust and independent legal counsel and received a memorandum from independent legal counsel to the Trustees discussing the legal standards for their consideration of the proposed agreement. The Trustees also discussed the proposed agreement in an executive session with independent legal counsel at which no representatives of the Adviser were present. Set forth below is a summary of the material factors evaluated by the Trustees in determining whether to approve the New Advisory Agreement.
The Trustees considered information provided with respect to the Fund and the approval of the New Advisory Agreement. Each Trustee attributed different weights to the various factors and no factor alone was considered determinative. The Trustees determined that the proposed compensation to be received by the Adviser from the Fund under the New Advisory Agreement was fair and reasonable and that the initial approval of the New Advisory Agreement was in the best interests of the Fund and its potential shareholders.
The factors summarized below were considered and discussed by the Trustees in reaching their conclusions:
Nature, Extent and Quality of Services Provided by the Adviser
In connection with the approval of the New Advisory Agreement, the Trustees considered the materials furnished specifically in connection with the approval of the New Advisory Agreement, as well as other relevant information furnished throughout the year for the J.P. Morgan Funds complex and the Trustees’ experience with the Adviser and its services. The Trustees considered the background and experience of the
Adviser’s senior management and investment personnel, as well as the qualifications, backgrounds and responsibilities of the portfolio management team primarily responsible for the day-to-day management of the Fund. The Trustees also considered the investment strategy and investment process for the Fund, and the infrastructure supporting the portfolio management team. In addition, the Trustees considered information about the structure and distribution strategy of the Fund, how it fits within the J.P. Morgan Funds lineup, and how it will be positioned against identified peers.
The Trustees also considered its knowledge of the nature and quality of the services provided by the Adviser to the J.P. Morgan Funds gained from their experience as Trustees of the J.P. Morgan Funds. In addition, they considered the overall reputation and capabilities of the Adviser and its affiliates, the commitment of the Adviser to provide high quality service to the J.P. Morgan Funds, their overall confidence in the Adviser’s integrity and the Adviser’s responsiveness to questions or concerns raised by them, including the Adviser’s willingness to consider and implement organizational and operational changes designed to improve investment results and the services provided to the J.P. Morgan Funds.
Based upon these considerations and other factors, the Trustees concluded that they were satisfied with the nature, extent and quality of the investment advisory services to be provided to the Fund by the Adviser.
Fall-Out Benefits
The Trustees reviewed information regarding potential “fallout” or ancillary benefits received by the Adviser and its affiliates as a result of their relationship with the J.P. Morgan Funds. The Trustees also considered the Adviser’s allocation of fund brokerage for the J.P. Morgan Funds complex, including allocations to brokers who provide research to the Adviser.
The Trustees also considered that JPMorgan Distribution Services, Inc. (“JPMDS”), an affiliate of the Adviser, and J.P. Morgan Investment Management Inc., in its role as administrator (“JPMIM”), will earn fees from the Fund for providing shareholder and administrative services, respectively. The Trustees also considered the payments of Rule 12b-1 fees to JPMDS, which also acts as the Fund’s distributor and that these fees are in turn generally paid to financial intermediaries that sell the Fund, including financial intermediaries that are affiliates of the Adviser. The Trustees also considered the fees paid to JPMorgan Chase Bank, N.A. (“JPMCB”) for custody and fund accounting and other related services. The Trustees also considered that any fall-out benefits would be comparable to those related to the other actively managed funds in the complex and were consistent with the process of approving advisory agreements for new funds.
| | | | | | | | |
| | | |
| AUGUST 31, 2016 | | J.P. MORGAN MUNICIPAL BOND FUNDS | | | | | 25 | |
BOARD APPROVAL OF INVESTMENT ADVISORY AGREEMENT
(Unaudited) (continued)
Economies of Scale
The Trustees considered the extent to which the Fund may benefit from economies of scale. The Trustees considered that there may not be a direct relationship between economies of scale realized by the Fund and those realized by the Adviser as assets increase. The Trustees noted that the proposed investment advisory fee schedule for the Fund does not contain breakpoints, but that the fee remains competitive with peer funds. The Trustees also considered that the Adviser has implemented fee waivers and expense limitations (“Fee Caps”) which allow the Fund’s shareholders to share potential economies of scale from the Fund’s inception. The Trustees also considered that the Adviser has shared economies of scale by adding or enhancing services to the Fund over time, noting the Adviser’s substantial investments in its business in support of the Fund, including investments in trading systems and technology (including cybersecurity improvements), retention of key talent, additions to analyst and portfolio management teams, and regulatory support enhancements. The Trustees also considered whether it would be appropriate to add advisory fee breakpoints, and the Trustees concluded that the current fee structure was reasonable in light of the Fee Caps that the Adviser has in place that serve to limit the overall net expense ratios of the Fund at a competitive level. The Trustees concluded that the Fund’s shareholders received the benefits of potential economies of scale through the Fee Caps and the Adviser’s reinvestment in its operations to serve the Fund and its shareholders.
Investment Performance
The Trustees considered the Fund’s investment strategy and process, portfolio management team and competitive positioning against identified peer funds, and concluded that the prospects for competitive future performance were acceptable.
Advisory Fees and Expense Ratios
The Trustees considered the contractual advisory fee rate that will be paid by the Fund to the Adviser and compared that rate to the information prepared by Broadridge, using data from Lipper Inc., independent providers of investment company data (together, “Broadridge/Lipper”) concerning management fee rates paid by other funds in the same Broadridge/Lipper category as the Fund. The Trustees recognized that Broadridge/Lipper reported the Fund’s management fee rate as the combined contractual advisory fee and administration fee rates. The Trustees also reviewed information about other projected expenses and the expense ratios for the Fund. The Trustees considered the projected fee waiver and/or expense reimbursement arrangements proposed for the Fund and considered the net advisory fee rate after taking into account any projected waivers and/or reimbursements. The Trustees recognized that it is difficult to make comparisons of advisory fees because there are variations in the services that are included in the fees paid by other funds.
The Trustees noted that the Fund’s estimated net advisory fees and total expenses, which were considered on a class-by-class basis, were in line with identified peer funds. After considering the factors identified above, in light of the information, the Trustees concluded that the advisory fees were reasonable.
| | | | | | |
| | | |
| 26 | | | | J.P. MORGAN MUNICIPAL BOND FUNDS | | AUGUST 31, 2016 |
J.P. Morgan Funds are distributed by JPMorgan Distribution Services, Inc., which is an affiliate of JPMorgan Chase & Co. Affiliates of JPMorgan Chase & Co. receive fees for providing various services to the funds.
Contact JPMorgan Distribution Services, Inc. at 1-800-480-4111 for a fund prospectus. You can also visit us at www.jpmorganfunds.com. Investors should carefully consider the investment objectives and risk as well as charges and expenses of the mutual fund before investing. The prospectus contains this and other information about the mutual fund. Read the prospectus carefully before investing.
Investors may obtain information about the Securities Investor Protection Corporation (SIPC), including the SIPC brochure by visiting www.sipc.org or by calling SIPC at 202-371-8300.
The Fund files a complete schedule of its fund holdings for the first and third quarters of its fiscal year with the SEC on Form N-Q. The Fund’s Forms N-Q are available on the SEC’s website at http://www.sec.gov and may be reviewed and copied at the SEC’s Public Reference Room in Washington, DC. Information on the operation of the SEC’s Public Reference Room may be obtained by calling 1-800-SEC-0330. Shareholders may request the Form N-Q without charge by calling 1-800-480-4111 or by visiting the J.P. Morgan Funds’ website at www.jpmorganfunds.com.
A description of the Fund’s policies and procedures with respect to the disclosure of the Fund’s holdings is available in the prospectus and Statement of Additional Information.
A copy of proxy policies and procedures is available without charge upon request by calling 1-800-480-4111 and on the Fund’s website at www.jpmorganfunds.com. A description of such policies and procedures is on the SEC’s website at www.sec.gov. The Trustees have delegated the authority to vote proxies for securities owned by the Fund to the Adviser. A copy of the Fund’s voting record for the most recent 12-month period ended June 30 is available on the SEC’s website at www.sec.gov or at the Fund’s website at www.jpmorganfunds.com no later than August 31 of each year. The Fund’s proxy voting record will include, among other things, a brief description of the matter voted on for each fund security, and will state how each vote was cast, for example, for or against the proposal.


J.P. Morgan Asset Management is the marketing name for the asset management businesses of JPMorgan Chase & Co. Those businesses include, but are not limited to, J.P. Morgan Investment Management Inc., Security Capital Research & Management Incorporated and J.P. Morgan Alternative Asset Management, Inc.
| | | | |
| | © JPMorgan Chase & Co., 2016. All rights reserved. August 2016. | | SAN-USM-816 |
J.P. Morgan Income Funds
Semi-Annual Report
August 31, 2016
(Unaudited)
JPMorgan Flexible Long/Short Fund
JPMorgan Flexible Long/Short Fund
Semi-Annual Report
August 31, 2016 (Unaudited)
Investments in the Fund are not deposits or obligations of, or guaranteed or endorsed by, any bank and are not insured or guaranteed by the FDIC, the Federal Reserve Board or any other government agency. You could lose money if you sell when the Fund’s share price is lower than when you invested.
Past performance is no guarantee of future performance. The general market views expressed in this report are opinions based on market and other conditions through the end of the reporting period and are subject to change without notice. These views are not intended to predict the future performance of the Fund or the securities markets. References to specific securities and their issuers are for illustrative purposes only and are not intended to be, and should not be interpreted as, recommendations to purchase or sell such securities. Such views are not meant as investment advice and may not be relied on as an indication of trading intent on behalf of the Fund.
Prospective investors should refer to the Fund’s prospectus for a discussion of the Fund’s investment objective, strategies and risks. Call J.P. Morgan Funds Service Center at 1-800-480-4111 for a prospectus containing more complete information about the Fund including management fees and other expenses. Please read it carefully before investing.
JPMorgan Flexible Long/Short Fund
CEO’S LETTER
September 22, 2016 (Unaudited)
Dear Shareholder,
The U.S. continued to lead a slow global economic expansion through August 2016, further raising pressure on the U.S. Federal Reserve (the “Fed”) to begin raising interest rates even as leading central banks elsewhere extended their extraordinary stimulus efforts.
Amid uncertainty about China’s economic outlook in early 2016, a sharp sell-off in financial markets following Britain’s June 23rd vote to exit the European Union and low U.S. inflation, the Fed declined to raise rates at its May and July meetings. However, financial markets rebounded quickly from the so-called Brexit sell-off and investor concerns about China’s economy receded. By August 2016, investors’ appetite for risk had returned, driving up prices for both stocks and bonds and pushing market volatility to record lows.
Meanwhile, U.S. gross domestic product remained low but positive through the first and second quarters of 2016. Unemployment remained at 5.0% or lower from February through August and sales of new homes in the U.S. returned to levels last seen before the 2008 financial crisis.
Overseas, the European Central Bank (ECB) surprised financial markets in early March with a further cut in interest rates and an expansion of its own quantitative easing program, along with other specific stimulus policies. In July, the ECB maintained its key interest rate at zero. Partly in response to the Brexit vote, Britain’s central bank cut interest rates in August to their lowest level in the bank’s 322-year history and reintroduced a quantitative easing program and began buying corporate bonds. After introducing negative interest rates in early 2016 to combat sputtering growth, the Bank of Japan changed direction in early September 2016 and unveiled a “yield curve control” to improve commercial bank earnings and investment returns for pension funds and insurers.
The ultimate effect of these central bank actions was to produce negative yields on government bonds in Europe and Japan, which led to a bond market rally in the U.S. as investors sought returns in U.S. Treasury bonds. Bond yields generally move in the opposite direction of bond prices and the bond market rally pushed Treasury bond yields to record lows in July.
In this environment, the financial market’s implied probability of an interest rate increase at the Fed’s September 2016 meeting rose to 36% at the end of August. However, the U.S. central bank declined to raise rates, citing below-target inflation data and concerns about continued job growth.
While Fed Chairwoman Janet Yellen indicated there is a greater likelihood of an interest rate increase in December 2016, both the International Monetary Fund and the World Bank have issued warnings about slowing economic growth in the U.S. and the rest of the world.
During the six months ended August 31, 2016, U.S. investors generally enjoyed solid returns in both bond and stock markets. It is especially notable that in the wake of a sell-off in June, financial markets fully recovered in the following two months. We believe this outcome clearly illustrates the wisdom of an investment perspective that is diversified, persistent and is guided by a long-term vision.
1
We look forward to managing your investment needs for years to come. Should you have any questions, please visit www.jpmorganfunds.com or contact the J.P. Morgan Funds Service Center at 1-800-480-4111.
Sincerely yours,
George C.W. Gatch
CEO, Investment Funds Management, J.P. Morgan Asset Management
2
JPMorgan Flexible Long/Short Fund
Fund Summary
For the period June 30, 2016 (Fund Inception Date) through August 31, 2016 (Unaudited)
| | | | |
| Reporting Period Return: | | | |
| |
Fund (Select Class Shares)* | | | 1.60% | |
Barclays Multiverse Corporate Index | | | 2.37% | |
Net Assets as of 8/31/2016 | | $ | 25,401,368 | |
| |
| | |
| Investment objective** and strategies | | The JPMorgan Flexible Long/Short Fund (the “Fund”) seeks to provide total return. The Fund seeks to achieve its investment objective by taking long and short positions in global credit markets. The Fund is flexible and it is not managed to or constrained by a benchmark. Because the Fund is not managed to a benchmark, J.P. Morgan Investment Management Inc. (JPMIM or the Adviser) has broad discretion to shift the Fund’s exposure among strategies and sectors and to invest in a wide variety of credit instruments based on changing market conditions and its view on the best mix of investment opportunities. In determining which investments to buy and sell for the Fund, the Adviser combines top down macroeconomic research with bottom up fundamental security analysis. In establishing the Fund’s macroeconomic views, the Adviser evaluates fundamental, technical and valuation factors along with macro themes from the Adviser’s broader fixed income team to determine the view on risk for the Fund overall. The Adviser uses bottom up fundamental research combined with quantitative analysis to evaluate the relative attractiveness of credit markets, sectors and individual credit instruments. |
| | | | | | |
| PORTFOLIO COMPOSITION*** | | | | | |
|
| | |
Corporate Bonds | | | 55.9% | | | |
Loan Assignments | | | 31.1 | | | |
Preferred Securities | | | 6.3 | | | |
Others (each less than 1.0%) | | | 0.2 | | | |
Short-Term Investments | | | 6.5 | | | |
| | * | The return shown is based on net asset values calculated for shareholder transactions and may differ from the return shown in the financial highlights, which reflects adjustments made to the net asset values in accordance with accounting principles generally accepted in the United States of America. |
| | ** | The adviser seeks to achieve the Fund’s objective. There can be no guarantee it will be achieved. |
| | *** | Percentages indicated are based on total investments as of August 31, 2016. The Fund’s portfolio composition is subject to change. |
3
TOTAL RETURNS AS OF AUGUST 31, 2016
| | | | | | |
| | | INCEPTION
DATE OF
CLASS | | SINCE
INCEPTION* | |
CLASS A SHARES | | June 30, 2016 | | | | |
With Sales Charge** | | | | | (2.25)% | |
Without Sales Charge | | | | | 1.56 | |
CLASS C SHARES | | June 30, 2016 | | | | |
With CDSC*** | | | | | 0.47 | |
Without CDSC | | | | | 1.47 | |
CLASS R6 SHARES | | June 30, 2016 | | | 1.64 | |
SELECT CLASS SHARES | | June 30, 2016 | | | 1.60 | |
| | | | |
| * | | | | |
| | Not annualized. | | |
| ** | | | | |
| | Sales Charge for Class A Shares is 3.75%. | | |
| *** | | | | |
| | Assumes a 1% CDSC (contingent deferred sales charge) for the period. | | |
LIFE OF FUND PERFORMANCE (6/30/16 TO 8/31/16)
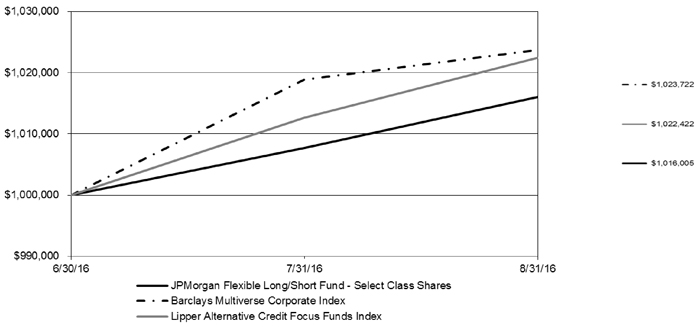
The performance quoted is past performance and is not a guarantee of future results. Mutual funds are subject to certain market risks. Investment returns and principal value of an investment will fluctuate so that an investor’s shares, when redeemed, may be worth more or less than their original cost. Current performance may be higher or lower than the performance data shown. For up-to-date, month-end performance information please call 1-800-480-4111.
4
The Fund commenced operations on June 30, 2016.
The graph illustrates comparative performance for $1,000,000 invested in Select Class Shares of the JPMorgan Flexible Long/Short Fund and the Barclays Multiverse Corporate Index from June 30, 2016 to August 31, 2016. The performance of the Fund assumes reinvestment of all dividends and capital gain distributions, if any, and does not include a sales charge. The performance of the Barclays Multiverse Corporate Index does not reflect the deduction of expenses or a sales charge associated with a mutual fund and approximates the minimum possible dividend reinvestment of the securities included in the benchmark, if applicable. The dividend is reinvested after deduction of withholding tax, applying the maximum rate to non-resident institutional investors who do not benefit from double taxation treaties. The Barclays Multiverse Corporate Index provides a broad-based measure of the international fixed-income bond market. Investors cannot invest directly in an index.
Select Class Shares have a $1,000,000 minimum initial investment.
Since the Fund’s inception, it has not experienced any shareholder activity. If shareholder activity had occurred, the Fund’s performance may have been impacted.
Fund performance may reflect the waiver of the Fund’s fees and reimbursement of expenses for certain periods since the inception date. Without these waivers and reimbursements, performance would have been lower. Also, performance shown in this section does not reflect the deduction of taxes that a shareholder would pay on Fund distributions or redemptions of Fund shares.
The returns shown are based on net asset values calculated for shareholder transactions and may differ from the returns shown in the financial highlights, which reflect adjustments made to the net asset values in accordance with accounting principles generally accepted in the United States of America.
5
JPMorgan Flexible Long/Short Fund
SCHEDULE OF PORTFOLIO INVESTMENTS
AS OF AUGUST 31, 2016 (Unaudited)
(Amounts in U.S. Dollars, unless otherwise noted)
| | | | | | | | |
PRINCIPAL
AMOUNT | | | SECURITY DESCRIPTION | | VALUE | |
| | |
| Convertible Bond — 0.1% | | | | |
| | |
| | | | Consumer Discretionary — 0.1% | | | | |
| | | | Media — 0.1% | | | | |
| | 50,952 | | | Liberty Interactive LLC, 3.750%, 02/15/30
(Cost $30,448) | | | 30,635 | |
| | | | | | | | |
| Corporate Bonds — 55.6% | | | | |
| | |
| | | | Consumer Discretionary — 11.6% | | | | |
| | | | Auto Components — 2.3% | | | | |
| | 28,000 | | | American Axle & Manufacturing, Inc., 6.625%, 10/15/22 | | | 29,855 | |
| | 4,000 | | | Goodyear Tire & Rubber Co. (The), 7.000%, 05/15/22 | | | 4,260 | |
| | EUR 100,000 | | | LKQ Italia Bondco SpA, (Italy), Reg. S, 3.875%, 04/01/24 | | | 120,748 | |
| | 21,000 | | | MPG Holdco I, Inc., 7.375%, 10/15/22 | | | 21,643 | |
| | EUR 125,000 | | | Schaeffler Finance B.V., (Netherlands), Reg. S, 3.250%, 05/15/25 | | | 148,669 | |
| | EUR 100,000 | | | Valeo S.A., (France), Reg. S, 1.625%, 03/18/26 | | | 121,704 | |
| | EUR 100,000 | | | ZF North America Capital, Inc., Reg. S, 2.250%, 04/26/19 | | | 116,286 | |
| | | | | | | | |
| | | | | | | 563,165 | |
| | | | | | | | |
| | | | Automobiles — 0.7% | | | | |
| | 75,000 | | | General Motors Co., 4.000%, 04/01/25 | | | 76,622 | |
| | EUR 100,000 | | | Volvo Car AB, (Sweden), Reg. S, 3.250%, 05/18/21 | | | 119,911 | |
| | | | | | | | |
| | | | | | | 196,533 | |
| | | | | | | | |
| | | | Hotels, Restaurants & Leisure — 2.6% | |
| | | | Boyd Gaming Corp., | | | | |
| | 9,000 | | | 6.875%, 05/15/23 | | | 9,720 | |
| | 30,000 | | | 9.000%, 07/01/20 | | | 31,350 | |
| | 31,000 | | | Choice Hotels International, Inc., 5.750%, 07/01/22 | | | 33,945 | |
| | EUR 110,000 | | | Cirsa Funding Luxembourg S.A., (Luxembourg), Reg. S, 5.875%, 05/15/23 | | | 128,877 | |
| | 18,000 | | | GLP Capital LP/GLP Financing II, Inc., 5.375%, 11/01/23 | | | 19,732 | |
| | 15,000 | | | Golden Nugget Escrow, Inc., 8.500%, 12/01/21 (e) | | | 15,675 | |
| | | | KFC Holding Co./Pizza Hut Holdings LLC/Taco Bell of America LLC, | | | | |
| | 5,000 | | | 5.000%, 06/01/24 (e) | | | 5,244 | |
| | 5,000 | | | 5.250%, 06/01/26 (e) | | | 5,312 | |
| | | | MGM Resorts International, | | | | |
| | 21,000 | | | 6.000%, 03/15/23 | | | 22,798 | |
| | 30,000 | | | 8.625%, 02/01/19 | | | 33,937 | |
| | GBP 100,000 | | | Pizzaexpress Financing 2 plc, (United Kingdom), Reg. S, 6.625%, 08/01/21 | | | 130,664 | |
| | | | | | | | |
PRINCIPAL
AMOUNT | | | SECURITY DESCRIPTION | | VALUE | |
| | |
| |
| | | | Hotels, Restaurants & Leisure — continued | |
| | 2,000 | | | Rivers Pittsburgh Borrower LP/Rivers Pittsburgh Finance Corp., 6.125%, 08/15/21 (e) | | | 2,060 | |
| | 9,000 | | | Sabre GLBL, Inc., 5.250%, 11/15/23 (e) | | | 9,270 | |
| | 9,000 | | | Scientific Games International, Inc., 10.000%, 12/01/22 | | | 8,325 | |
| | 45,000 | | | Seminole Hard Rock Entertainment, Inc./Seminole Hard Rock International LLC, 5.875%, 05/15/21 (e) | | | 45,338 | |
| | | | Six Flags Entertainment Corp., | | | | |
| | 2,000 | | | 4.875%, 07/31/24 (e) | | | 2,040 | |
| | 9,000 | | | 5.250%, 01/15/21 (e) | | | 9,315 | |
| | GBP 100,000 | | | Vue International Bidco plc, (United Kingdom), Reg. S, 7.875%, 07/15/20 | | | 137,224 | |
| | | | | | | | |
| | | | | | | 650,826 | |
| | | | | | | | |
| | | | Household Durables — 0.7% | | | | |
| | 10,000 | | | CalAtlantic Group, Inc., 5.875%, 11/15/24 | | | 10,800 | |
| | | | Lennar Corp., | | | | |
| | 33,000 | | | 4.500%, 06/15/19 | | | 34,650 | |
| | 15,000 | | | 4.875%, 12/15/23 | | | 15,712 | |
| | 8,000 | | | M/I Homes, Inc., 6.750%, 01/15/21 | | | 8,360 | |
| | 10,000 | | | Mattamy Group Corp., (Canada), 6.500%, 11/15/20 (e) | | | 9,875 | |
| | EUR 100,000 | | | Mohawk Industries, Inc., 2.000%, 01/14/22 | | | 118,173 | |
| | | | | | | | |
| | | | | | | 197,570 | |
| | | | | | | | |
| | | | Media — 4.0% | | | | |
| | EUR 100,000 | | | Altice Luxembourg S.A., (Luxembourg), Reg. S, 7.250%, 05/15/22 | | | 117,854 | |
| | 32,000 | | | Cablevision Systems Corp., 8.625%, 09/15/17 | | | 34,008 | |
| | 40,000 | | | CBS Corp., 2.900%, 01/15/27 | | | 38,863 | |
| | 30,000 | | | Charter Communications Operating LLC/Charter Communications Operating Capital, 6.484%, 10/23/45 (e) | | | 36,864 | |
| | 19,000 | | | Cinemark USA, Inc., 4.875%, 06/01/23 | | | 19,475 | |
| | | | Clear Channel Worldwide Holdings, Inc., | | | | |
| | 15,000 | | | Series B, 6.500%, 11/15/22 | | | 15,712 | |
| | 16,000 | | | Series B, 7.625%, 03/15/20 | | | 16,120 | |
| | | | Comcast Corp., | | | | |
| | 20,000 | | | 2.350%, 01/15/27 | | | 19,824 | |
| | 50,000 | | | 3.150%, 03/01/26 | | | 52,904 | |
| | 30,000 | | | 4.750%, 03/01/44 | | | 35,918 | |
| | 18,000 | | | CSC Holdings LLC, 8.625%, 02/15/19 | | | 20,160 | |
| | | | DISH DBS Corp., | | | | |
| | 33,000 | | | 4.250%, 04/01/18 | | | 33,866 | |
| | 43,000 | | | 6.750%, 06/01/21 | | | 46,198 | |
| | 7,000 | | | 7.750%, 07/01/26 (e) | | | 7,469 | |
SEE NOTES TO FINANCIAL STATEMENTS.
6
JPMorgan Flexible Long/Short Fund
SCHEDULE OF PORTFOLIO INVESTMENTS
AS OF AUGUST 31, 2016 (Unaudited) (continued)
(Amounts in U.S. Dollars, unless otherwise noted)
| | | | | | | | |
PRINCIPAL
AMOUNT | | | SECURITY DESCRIPTION | | VALUE | |
| | |
| Corporate Bonds — continued | | | | |
| | |
| | | | Media — continued | | | | |
| | 4,000 | | | EMI Music Publishing Group North America Holdings, Inc., 7.625%, 06/15/24 (e) | | | 4,360 | |
| | | | Gray Television, Inc., | | | | |
| | 4,000 | | | 5.875%, 07/15/26 (e) | | | 4,170 | |
| | 18,000 | | | 7.500%, 10/01/20 | | | 18,720 | |
| | 25,000 | | | iHeartCommunications, Inc., 9.000%, 12/15/19 | | | 20,219 | |
| | 33,000 | | | Lamar Media Corp., 5.000%, 05/01/23 | | | 34,897 | |
| | 36,000 | | | Live Nation Entertainment, Inc., 5.375%, 06/15/22 (e) | | | 37,350 | |
| | 21,000 | | | Nexstar Broadcasting, Inc., 6.125%, 02/15/22 (e) | | | 21,735 | |
| | 15,000 | | | Nielsen Finance LLC/Nielsen Finance Co., 5.000%, 04/15/22 (e) | | | 15,411 | |
| | | | Outfront Media Capital LLC/Outfront Media Capital Corp., | | | | |
| | 9,000 | | | 5.625%, 02/15/24 | | | 9,574 | |
| | 33,000 | | | 5.875%, 03/15/25 | | | 35,310 | |
| | 56,000 | | | Sinclair Television Group, Inc., 6.125%, 10/01/22 | | | 59,220 | |
| | 54,000 | | | Sirius XM Radio, Inc., 4.625%, 05/15/23 (e) | | | 54,608 | |
| | EUR 81,000 | | | Unitymedia Hessen GmbH & Co. KG/Unitymedia NRW GmbH, (Germany), Reg. S, 5.125%, 01/21/23 | | | 96,057 | |
| | | | Univision Communications, Inc., | | | | |
| | 47,000 | | | 5.125%, 05/15/23 (e) | | | 48,880 | |
| | 34,000 | | | 5.125%, 02/15/25 (e) | | | 35,530 | |
| | 13,000 | | | Videotron Ltd., (Canada), 5.000%, 07/15/22 | | | 13,634 | |
| | | | WMG Acquisition Corp., | | | | |
| | 5,000 | | | 5.000%, 08/01/23 (e) | | | 5,138 | |
| | 7,000 | | | 5.625%, 04/15/22 (e) | | | 7,297 | |
| | 15,000 | | | 6.750%, 04/15/22 (e) | | | 15,956 | |
| | | | | | | | |
| | | | | | | 1,033,301 | |
| | | | | | | | |
| | | | Specialty Retail — 1.3% | | | | |
| | EUR 100,000 | | | Douglas GmbH, (Germany), Reg. S, 6.250%, 07/15/22 | | | 122,699 | |
| | GBP 100,000 | | | New Look Secured Issuer plc, (United Kingdom), Reg. S, 6.500%, 07/01/22 | | | 126,719 | |
| | 31,000 | | | Radio Systems Corp., 8.375%, 11/01/19 (e) | | | 32,395 | |
| | 13,000 | | | Sally Holdings LLC/Sally Capital, Inc., 5.500%, 11/01/23 | | | 13,845 | |
| | 33,000 | | | Serta Simmons Bedding LLC, 8.125%, 10/01/20 (e) | | | 34,403 | |
| | | | | | | | |
| | | | | | | 330,061 | |
| | | | | | | | |
| | | | Total Consumer Discretionary | | | 2,971,456 | |
| | | | | | | | |
| | | | | | | | |
PRINCIPAL
AMOUNT | | | SECURITY DESCRIPTION | | VALUE | |
| | |
| | |
| | | | Consumer Staples — 3.2% | | | | |
| | | | Beverages — 0.6% | | | | |
| | | | Anheuser-Busch InBev Finance, Inc., | | | | |
| | 35,000 | | | 3.650%, 02/01/26 | | | 37,366 | |
| | 15,000 | | | 4.900%, 02/01/46 | | | 18,139 | |
| | EUR 50,000 | | | Anheuser-Busch InBev S.A./N.V., (Belgium), Reg. S, 2.000%, 03/17/28 | | | 61,958 | |
| | 36,000 | | | Cott Beverages, Inc., 5.375%, 07/01/22 | | | 37,170 | |
| | 29,000 | | | DS Services of America, Inc., 10.000%, 09/01/21 (e) | | | 32,552 | |
| | | | | | | | |
| | | | | | | 187,185 | |
| | | | | | | | |
| | | | Food & Staples Retailing — 1.0% | | | | |
| | 11,000 | | | Albertsons Cos. LLC/Safeway, Inc./New Albertson’s, Inc./Albertson’s LLC, 6.625%, 06/15/24 (e) | | | 11,810 | |
| | 75,000 | | | CVS Health Corp., 2.875%, 06/01/26 | | | 76,829 | |
| | EUR 100,000 | | | Dufry Finance SCA, (Luxembourg), Reg. S, 4.500%, 08/01/23 | | | 119,108 | |
| | 5,000 | | | Ingles Markets, Inc., 5.750%, 06/15/23 | | | 5,203 | |
| | | | New Albertsons, Inc., | | | | |
| | 4,000 | | | 7.450%, 08/01/29 | | | 3,940 | |
| | 8,000 | | | 8.700%, 05/01/30 | | | 8,160 | |
| | 13,000 | | | Rite Aid Corp., 6.125%, 04/01/23 (e) | | | 14,035 | |
| | 15,000 | | | SUPERVALU, Inc., 7.750%, 11/15/22 | | | 14,175 | |
| | | | | | | | |
| | | | | | | 253,260 | |
| | | | | | | | |
| | | | Food Products — 0.6% | | | | |
| | | | JBS USA LUX S.A./JBS USA Finance, Inc., | | | | |
| | 51,000 | | | 5.875%, 07/15/24 (e) | | | 52,698 | |
| | 18,000 | | | 7.250%, 06/01/21 (e) | | | 18,540 | |
| | 25,000 | | | Kraft Heinz Foods Co., 4.375%, 06/01/46 | | | 27,040 | |
| | | | Post Holdings, Inc., | | | | |
| | 18,000 | | | 5.000%, 08/15/26 (e) | | | 17,955 | |
| | 9,000 | | | 7.750%, 03/15/24 (e) | | | 10,001 | |
| | 19,000 | | | Smithfield Foods, Inc., 5.875%, 08/01/21 (e) | | | 19,855 | |
| | | | | | | | |
| | | | | | | 146,089 | |
| | | | | | | | |
| | | | Household Products — 0.1% | | | | |
| | 23,000 | | | Spectrum Brands, Inc., 5.750%, 07/15/25 | | | 24,926 | |
| | | | | | | | |
| | |
| | | | Personal Products — 0.2% | | | | |
| | 13,000 | | | NBTY, Inc., 7.625%, 05/15/21 (e) | | | 13,292 | |
| | 9,000 | | | Prestige Brands, Inc., 6.375%, 03/01/24 (e) | | | 9,608 | |
| | 12,000 | | | Revlon Escrow Corp., 6.250%, 08/01/24 (e) | | | 12,450 | |
| | | | | | | | |
| | | | | | | 35,350 | |
| | | | | | | | |
| | | | Tobacco — 0.7% | | | | |
| | 50,000 | | | Altria Group, Inc., 4.250%, 08/09/42 | | | 56,084 | |
| | 40,000 | | | Philip Morris International, Inc., 4.250%, 11/10/44 | | | 44,906 | |
SEE NOTES TO FINANCIAL STATEMENTS.
7
JPMorgan Flexible Long/Short Fund
SCHEDULE OF PORTFOLIO INVESTMENTS
AS OF AUGUST 31, 2016 (Unaudited) (continued)
(Amounts in U.S. Dollars, unless otherwise noted)
| | | | | | |
PRINCIPAL
AMOUNT | | | SECURITY DESCRIPTION | | VALUE |
|
| Corporate Bonds — continued | | |
| | |
| | | | Tobacco — continued | | |
| | 50,000 | | | Reynolds American, Inc., 5.850%, 08/15/45 | | 65,207 |
| | | | | | |
| | | | | | 166,197 |
| | | | | | |
| | | | Total Consumer Staples | | 813,007 |
| | | | | | |
| | | | Energy — 4.2% | | |
| | | | Energy Equipment & Services — 0.4% | | |
| | 100,000 | | | Schlumberger Investment S.A., (Luxembourg), 2.400%, 08/01/22 (e) | | 101,666 |
| | | | | | |
| | |
| | | | Oil, Gas & Consumable Fuels — 3.8% | | |
| | | | Boardwalk Pipelines LP, | | |
| | 57,000 | | | 3.375%, 02/01/23 | | 53,574 |
| | 100,000 | | | 5.950%, 06/01/26 | | 109,156 |
| | 75,000 | | | BP Capital Markets plc, (United Kingdom), 3.119%, 05/04/26 | | 77,431 |
| | | | Cenovus Energy, Inc., (Canada), | | |
| | 8,000 | | | 4.450%, 09/15/42 | | 6,511 |
| | 29,000 | | | 5.200%, 09/15/43 | | 25,496 |
| | | | Chevron Corp., | | |
| | 75,000 | | | 2.355%, 12/05/22 | | 76,783 |
| | 19,000 | | | CITGO Petroleum Corp., 6.250%, 08/15/22 (e) | | 18,572 |
| | 13,000 | | | Energy Transfer Equity LP, 5.875%, 01/15/24 | | 13,325 |
| | 51,000 | | | EnLink Midstream Partners LP, 2.700%, 04/01/19 | | 50,231 |
| | 11,000 | | | Genesis Energy LP/Genesis Energy Finance Corp., 6.000%, 05/15/23 | | 10,945 |
| | 23,000 | | | MPLX LP, 4.875%, 06/01/25 (e) | | 23,457 |
| | | | NGPL PipeCo LLC, | | |
| | 33,000 | | | 7.119%, 12/15/17 (e) | | 34,361 |
| | 27,000 | | | 9.625%, 06/01/19 (e) | | 28,215 |
| | 50,000 | | | Occidental Petroleum Corp., 3.400%, 04/15/26 | | 52,850 |
| | 175,000 | | | Petrobras Global Finance B.V., (Netherlands), 8.750%, 05/23/26 | | 192,097 |
| | EUR 100,000 | | | Repsol International Finance B.V., (Netherlands), Reg. S, VAR, 4.500%, 03/25/75 | | 103,458 |
| | 15,000 | | | Rockies Express Pipeline LLC, 6.000%, 01/15/19 (e) | | 15,788 |
| | 25,000 | | | Sunoco Logistics Partners Operations LP, 5.300%, 04/01/44 | | 25,357 |
| | 13,000 | | | Sunoco LP/Sunoco Finance Corp., 5.500%, 08/01/20 (e) | | 13,196 |
| | 50,000 | | | Western Gas Partners LP, 4.650%, 07/01/26 | | 51,845 |
| | | | | | |
| | | | | | 982,648 |
| | | | | | |
| | | | Total Energy | | 1,084,314 |
| | | | | | |
| | | | | | |
PRINCIPAL
AMOUNT | | | SECURITY DESCRIPTION | | VALUE |
|
| | |
| | | | Financials — 10.3% | | |
| | | | Banks — 2.5% | | |
| | 50,000 | | | Bank of America Corp., 3.500%, 04/19/26 | | 52,187 |
| | | | CIT Group, Inc., | | |
| | 28,000 | | | 5.000%, 08/15/22 | | 29,680 |
| | 32,000 | | | 5.375%, 05/15/20 | | 34,200 |
| | 32,000 | | | 5.500%, 02/15/19 (e) | | 33,880 |
| | 60,000 | | | Citigroup, Inc., 4.300%, 11/20/26 | | 63,009 |
| | 200,000 | | | Lloyds Banking Group plc, (United Kingdom), 4.650%, 03/24/26 | | 207,578 |
| | 55,000 | | | Toronto-Dominion Bank (The), (Canada), 1.800%, 07/13/21 | | 54,688 |
| | 50,000 | | | U.S. Bancorp, 3.100%, 04/27/26 | | 51,701 |
| | 100,000 | | | Wells Fargo & Co., 4.300%, 07/22/27 | | 110,387 |
| | | | | | |
| | | | | | 637,310 |
| | | | | | |
| | | | Capital Markets — 1.1% | | |
| | 33,000 | | | E*TRADE Financial Corp., 4.625%, 09/15/23 | | 34,249 |
| | 75,000 | | | Goldman Sachs Group, Inc. (The), 2.875%, 02/25/21 | | 77,149 |
| | | | Morgan Stanley, | | |
| | 30,000 | | | 3.125%, 07/27/26 | | 30,175 |
| | 110,000 | | | 3.875%, 01/27/26 | | 117,478 |
| | 18,000 | | | MSCI, Inc., 5.250%, 11/15/24 (e) | | 19,125 |
| | | | | | |
| | | | | | 278,176 |
| | | | | | |
| | | | Consumer Finance — 2.9% | | |
| | 150,000 | | | AerCap Ireland Capital Ltd./AerCap Global Aviation Trust, (Ireland), 4.625%, 10/30/20 | | 158,981 |
| | 19,000 | | | Ally Financial, Inc., 4.625%, 03/30/25 | | 19,712 |
| | 50,000 | | | Capital One Financial Corp., 3.750%, 04/24/24 | | 52,897 |
| | 60,000 | | | Caterpillar Financial Services Corp., 2.400%, 08/09/26 | | 59,749 |
| | 200,000 | | | Ford Motor Credit Co. LLC, 4.375%, 08/06/23 | | 216,679 |
| | 75,000 | | | General Motors Financial Co., Inc., 3.100%, 01/15/19 | | 76,476 |
| | 75,000 | | | John Deere Capital Corp., 3.400%, 09/11/25 | | 81,913 |
| | 7,000 | | | Springleaf Finance Corp., 8.250%, 12/15/20 | | 7,648 |
| | 55,000 | | | Synchrony Financial, 3.750%, 08/15/21 | | 57,679 |
| | | | | | |
| | | | | | 731,734 |
| | | | | | |
| | | | Diversified Financial Services — 3.1% | | |
| | 13,000 | | | Argos Merger Sub, Inc., 7.125%, 03/15/23 (e) | | 13,666 |
| | 100,000 | | | Berkshire Hathaway, Inc., 3.125%, 03/15/26 | | 106,195 |
| | 200,000 | | | EDP Finance B.V., (Netherlands), 5.250%, 01/14/21 (e) | | 217,500 |
SEE NOTES TO FINANCIAL STATEMENTS.
8
JPMorgan Flexible Long/Short Fund
SCHEDULE OF PORTFOLIO INVESTMENTS
AS OF AUGUST 31, 2016 (Unaudited) (continued)
(Amounts in U.S. Dollars, unless otherwise noted)
| | | | | | |
PRINCIPAL
AMOUNT | | SECURITY DESCRIPTION | | VALUE | |
| |
Corporate Bonds — continued | | | | |
| |
| | Diversified Financial Services — continued | |
| EUR 100,000 | | Lincoln Finance Ltd., (United Kingdom), Reg. S, 6.875%, 04/15/21 | | | 122,142 | |
| 20,000 | | Nationstar Mortgage LLC/Nationstar Capital Corp., 7.875%, 10/01/20 | | | 20,150 | |
| | Shell International Finance B.V., (Netherlands), | | | | |
| 50,000 | | 3.250%, 05/11/25 | | | 53,089 | |
| 50,000 | | 4.000%, 05/10/46 | | | 52,388 | |
| 200,000 | | UBS Group Funding Jersey Ltd., (Jersey), 3.000%, 04/15/21 (e) | | | 206,089 | |
| | | | | | |
| | | | | 791,219 | |
| | | | | | |
| | Insurance — 0.7% | | | | |
| 130,000 | | American International Group, Inc., 3.900%, 04/01/26 | | | 136,495 | |
| 30,000 | | MetLife, Inc., 4.721%, 12/15/44 | | | 32,945 | |
| | | | | | |
| | | | | 169,440 | |
| | | | | | |
| | Thrifts & Mortgage Finance — 0.0% (g) | | | | |
| 10,000 | | Quicken Loans, Inc., 5.750%, 05/01/25 (e) | | | 9,978 | |
| | | | | | |
| | Total Financials | | | 2,617,857 | |
| | | | | | |
| | Health Care — 3.5% | | | | |
| | Health Care Equipment & Supplies — 0.3% | |
| 13,000 | | Hologic, Inc., 5.250%, 07/15/22 (e) | | | 13,829 | |
| 35,000 | | Mallinckrodt International Finance S.A., (Luxembourg), 3.500%, 04/15/18 | | | 35,044 | |
| 28,000 | | Mallinckrodt International Finance S.A./Mallinckrodt CB LLC, (Luxembourg), 5.625%, 10/15/23 (e) | | | 28,105 | |
| | | | | | |
| | | | | 76,978 | |
| | | | | | |
| | Health Care Providers & Services — 1.9% | |
| 11,000 | | Centene Corp., 6.125%, 02/15/24 | | | 11,990 | |
| | CHS/Community Health Systems, Inc., | | | | |
| 26,000 | | 6.875%, 02/01/22 | | | 21,580 | |
| 15,000 | | 8.000%, 11/15/19 | | | 14,194 | |
| 44,000 | | DaVita, Inc., 5.125%, 07/15/24 | | | 45,430 | |
| 50,000 | | Express Scripts Holding Co., 3.400%, 03/01/27 | | | 50,516 | |
| 22,000 | | Fresenius Medical Care U.S. Finance II, Inc., 4.750%, 10/15/24 (e) | | | 23,540 | |
| | HCA, Inc., | | | | |
| 54,000 | | 5.000%, 03/15/24 | | | 57,105 | |
| 22,000 | | 5.375%, 02/01/25 | | | 22,723 | |
| 29,000 | | 5.875%, 03/15/22 | | | 31,900 | |
| 20,000 | | IASIS Healthcare LLC/IASIS Capital Corp., 8.375%, 05/15/19 | | | 18,125 | |
| 20,000 | | MPH Acquisition Holdings LLC, 7.125%, 06/01/24 (e) | | | 21,500 | |
| 16,000 | | Team Health, Inc., 7.250%, 12/15/23 (e) | | | 17,440 | |
| | Tenet Healthcare Corp., | | | | |
| 35,000 | | VAR, 4.153%, 06/15/20 | | | 34,913 | |
| | | | | | |
PRINCIPAL
AMOUNT | | SECURITY DESCRIPTION | | VALUE | |
| |
| |
| | Health Care Providers & Services — continued | |
| 19,000 | | 5.000%, 03/01/19 | | | 18,477 | |
| 39,000 | | 6.750%, 06/15/23 | | | 37,221 | |
| 50,000 | | UnitedHealth Group, Inc., 3.100%, 03/15/26 | | | 52,718 | |
| | | | | | |
| | | | | 479,372 | |
| | | | | | |
| | Life Sciences Tools & Services — 0.0% (g) | |
| 11,000 | | Quintiles Transnational Corp., 4.875%, 05/15/23 (e) | | | 11,440 | |
| | | | | | |
| | |
| | Pharmaceuticals — 1.3% | | | | |
| 60,000 | | Actavis Funding SCS, (Luxembourg), 3.800%, 03/15/25 | | | 63,318 | |
| 35,000 | | Concordia International Corp., (Canada), 7.000%, 04/15/23 (e) | | | 27,125 | |
| 100,000 | | Mylan N.V., (Netherlands), 3.150%, 06/15/21 (e) | | | 102,213 | |
| | Teva Pharmaceutical Finance Netherlands III B.V., (Netherlands), | | | | |
| 25,000 | | 2.200%, 07/21/21 | | | 24,837 | |
| 25,000 | | 3.150%, 10/01/26 | | | 25,193 | |
| | Valeant Pharmaceuticals International, Inc., (Canada), | | | | |
| 18,000 | | 5.375%, 03/15/20 (e) | | | 16,965 | |
| 26,000 | | 6.750%, 08/15/21 (e) | | | 24,733 | |
| 25,000 | | 7.000%, 10/01/20 (e) | | | 24,375 | |
| | | | | | |
| | | | | 308,759 | |
| | | | | | |
| | Total Health Care | | | 876,549 | |
| | | | | | |
| | Industrials — 5.5% | | | | |
| | Aerospace & Defense — 0.8% | | | | |
| EUR 100,000 | | Airbus Group Finance B.V., (Netherlands), Reg. S, 1.375%, 05/13/31 | | | 118,941 | |
| 42,000 | | Bombardier, Inc., (Canada), 7.750%, 03/15/20 (e) | | | 44,520 | |
| | TransDigm, Inc., | | | | |
| 11,000 | | 6.000%, 07/15/22 | | | 11,440 | |
| 11,000 | | 6.375%, 06/15/26 (e) | | | 11,220 | |
| | | | | | |
| | | | | 186,121 | |
| | | | | | |
| | Airlines — 0.4% | | | | |
| 545 | | Continental Airlines 2003-ERJ1 Pass-Through Trust, 7.875%, 07/02/18 | | | 568 | |
| 87,208 | | Continental Airlines 2012-2 Class A Pass-Through Trust, 4.000%, 10/29/24 | | | 93,531 | |
| | | | | | |
| | | | | 94,099 | |
| | | | | | |
| | Building Products — 0.4% | | | | |
| 14,000 | | NCI Building Systems, Inc., 8.250%, 01/15/23 (e) | | | 15,330 | |
| 36,000 | | Standard Industries, Inc., 6.000%, 10/15/25 (e) | | | 39,420 | |
SEE NOTES TO FINANCIAL STATEMENTS.
9
JPMorgan Flexible Long/Short Fund
SCHEDULE OF PORTFOLIO INVESTMENTS
AS OF AUGUST 31, 2016 (Unaudited) (continued)
(Amounts in U.S. Dollars, unless otherwise noted)
| | | | | | |
PRINCIPAL
AMOUNT | | SECURITY DESCRIPTION | | VALUE | |
| |
Corporate Bonds — continued | | | | |
| | |
| | Building Products — continued | | | | |
| 19,000 | | Summit Materials LLC/Summit Materials Finance Corp., 6.125%, 07/15/23 | | | 19,285 | |
| | | | | | |
| | | | | 74,035 | |
| | | | | | |
| | Commercial Services & Supplies — 0.9% | |
| 40,000 | | ADT Corp. (The), 4.125%, 06/15/23 | | | 39,268 | |
| 12,000 | | Casella Waste Systems, Inc., 7.750%, 02/15/19 | | | 12,270 | |
| 23,000 | | Garda World Security Corp., (Canada), 7.250%, 11/15/21 (e) | | | 20,987 | |
| 19,000 | | Prime Security Services Borrower LLC/Prime Finance, Inc., 9.250%, 05/15/23 (e) | | | 20,710 | |
| EUR 100,000 | | Verisure Holding AB, (Sweden), Reg. S, 6.000%, 11/01/22 | | | 122,142 | |
| 20,000 | | West Corp., 5.375%, 07/15/22 (e) | | | 19,500 | |
| | | | | | |
| | | | | 234,877 | |
| | | | | | |
| | Construction & Engineering — 0.3% | | | | |
| 37,000 | | AECOM, 5.875%, 10/15/24 | | | 40,469 | |
| 30,000 | | MasTec, Inc., 4.875%, 03/15/23 | | | 30,000 | |
| | | | | | |
| | | | | 70,469 | |
| | | | | | |
| | Electrical Equipment — 0.1% | | | | |
| 5,000 | | Novelis Corp., 6.250%, 08/15/24 (e) | | | 5,212 | |
| 19,000 | | Sensata Technologies B.V., (Netherlands), 5.625%, 11/01/24 (e) | | | 20,140 | |
| | | | | | |
| | | | | 25,352 | |
| | | | | | |
| | Machinery — 0.1% | | | | |
| 9,000 | | BlueLine Rental Finance Corp., 7.000%, 02/01/19 (e) | | | 7,785 | |
| 25,000 | | Milacron LLC/Mcron Finance Corp., 7.750%, 02/15/21 (e) | | | 26,125 | |
| | | | | | |
| | | | | 33,910 | |
| | | | | | |
| | Paper & Forest Products — 0.0% (g) | |
| 11,000 | | Unifrax I LLC/Unifrax Holding Co., 7.500%, 02/15/19 (e) | | | 9,900 | |
| | | | | | |
| | |
| | Road & Rail — 1.7% | | | | |
| 50,000 | | Burlington Northern Santa Fe LLC, 4.550%, 09/01/44 | | | 59,095 | |
| EUR 125,000 | | Europcar Groupe S.A., (France), Reg. S, 5.750%, 06/15/22 | | | 146,723 | |
| GBP 43,070 | | Great Rolling Stock Co. Ltd. (The), (United Kingdom), Reg. S, 6.875%, 07/27/35 | | | 79,442 | |
| GBP 100,000 | | Porterbrook Rail Finance Ltd., (United Kingdom), Reg. S, 6.500%, 10/20/20 | | | 158,203 | |
| | | | | | |
| | | | | 443,463 | |
| | | | | | |
| | Trading Companies & Distributors — 0.5% | |
| 8,000 | | Aircastle Ltd., (Bermuda), 7.625%, 04/15/20 | | | 9,240 | |
| 22,000 | | HD Supply, Inc., 5.750%, 04/15/24 (e) | | | 23,430 | |
| | | | | | |
PRINCIPAL
AMOUNT | | SECURITY DESCRIPTION | | VALUE | |
| |
| |
| | Trading Companies & Distributors — continued | |
| | International Lease Finance Corp., | | | | |
| 18,000 | | 4.625%, 04/15/21 | | | 19,089 | |
| 36,000 | | 8.750%, 03/15/17 | | | 37,305 | |
| 37,000 | | United Rentals North America, Inc., 5.750%, 11/15/24 | | | 38,480 | |
| 11,000 | | Univar USA, Inc., 6.750%, 07/15/23 (e) | | | 11,385 | |
| 9,000 | | WESCO Distribution, Inc., 5.375%, 06/15/24 (e) | | | 9,203 | |
| | | | | | |
| | | | | 148,132 | |
| | | | | | |
| | Transportation Infrastructure — 0.3% | |
| EUR 50,000 | | Atlantia S.p.A., (Italy), Reg. S, 4.375%, 09/16/25 | | | 74,321 | |
| | | | | | |
| | Total Industrials | | | 1,394,679 | |
| | | | | | |
| | Information Technology — 2.8% | | | | |
| | Communications Equipment — 0.5% | | | | |
| 20,000 | | Alcatel-Lucent USA, Inc., 6.450%, 03/15/29 | | | 21,750 | |
| 7,000 | | Avaya, Inc., 7.000%, 04/01/19 (e) (m) | | | 5,215 | |
| 100,000 | | Cisco Systems, Inc., 2.200%, 02/28/21 | | | 102,615 | |
| | | | | | |
| | | | | 129,580 | |
| | | | | | |
| | Electronic Equipment, Instruments & Components — 0.5% | |
| | Anixter, Inc., | | | | |
| 28,000 | | 5.500%, 03/01/23 | | | 29,470 | |
| 32,000 | | 5.625%, 05/01/19 | | | 33,880 | |
| 41,000 | | CDW LLC/CDW Finance Corp., 5.500%, 12/01/24 | | | 43,940 | |
| 10,000 | | Zebra Technologies Corp., 7.250%, 10/15/22 | | | 10,850 | |
| | | | | | |
| | | | | 118,140 | |
| | | | | | |
| | IT Services — 0.2% | | | | |
| | First Data Corp., | | | | |
| 30,000 | | 5.000%, 01/15/24 (e) | | | 30,525 | |
| 20,000 | | 7.000%, 12/01/23 (e) | | | 20,975 | |
| | | | | | |
| | | | | 51,500 | |
| | | | | | |
| | Semiconductors & Semiconductor Equipment — 0.2% | |
| 26,000 | | Microsemi Corp., 9.125%, 04/15/23 (e) | | | 29,770 | |
| 15,000 | | QUALCOMM, Inc., 4.800%, 05/20/45 | | | 17,102 | |
| | | | | | |
| | | | | 46,872 | |
| | | | | | |
| | Software — 1.0% | | | | |
| 40,000 | | Infor U.S., Inc., 6.500%, 05/15/22 | | | 40,550 | |
| 23,000 | | Informatica LLC, 7.125%, 07/15/23 (e) | | | 21,735 | |
| | Microsoft Corp., | | | | |
| 20,000 | | 3.700%, 08/08/46 | | | 20,778 | |
| 20,000 | | 4.875%, 12/15/43 | | | 24,488 | |
| | Oracle Corp., | | | | |
| 50,000 | | 1.900%, 09/15/21 | | | 50,101 | |
| 100,000 | | 2.650%, 07/15/26 | | | 101,020 | |
| | | | | | |
| | | | | 258,672 | |
| | | | | | |
SEE NOTES TO FINANCIAL STATEMENTS.
10
JPMorgan Flexible Long/Short Fund
SCHEDULE OF PORTFOLIO INVESTMENTS
AS OF AUGUST 31, 2016 (Unaudited) (continued)
(Amounts in U.S. Dollars, unless otherwise noted)
| | | | | | |
PRINCIPAL
AMOUNT | | SECURITY DESCRIPTION | | VALUE | |
| |
Corporate Bonds — continued | | | | |
| |
| | Technology Hardware, Storage & Peripherals — 0.4% | |
| | Apple, Inc., | | | | |
| 30,000 | | 3.250%, 02/23/26 | | | 32,043 | |
| 50,000 | | 4.650%, 02/23/46 | | | 58,412 | |
| | Diamond 1 Finance Corp./Diamond 2 Finance Corp., | | | | |
| 3,000 | | 4.420%, 06/15/21 (e) | | | 3,139 | |
| 8,000 | | 5.450%, 06/15/23 (e) | | | 8,523 | |
| 3,000 | | 5.875%, 06/15/21 (e) | | | 3,176 | |
| 3,000 | | 7.125%, 06/15/24 (e) | | | 3,248 | |
| | | | | | |
| | | | | 108,541 | |
| | | | | | |
| | Total Information Technology | | | 713,305 | |
| | | | | | |
| | Materials — 4.4% | | | | |
| | Chemicals — 0.9% | | | | |
| 14,000 | | Basell Finance Co., B.V., (Netherlands), 8.100%, 03/15/27 (e) | | | 18,834 | |
| 18,000 | | CVR Partners LP/CVR Nitrogen Finance Corp., 9.250%, 06/15/23 (e) | | | 17,842 | |
| | Hexion, Inc., | | | | |
| 41,000 | | 6.625%, 04/15/20 | | | 35,542 | |
| 9,000 | | 8.875%, 02/01/18 | | | 8,457 | |
| EUR 100,000 | | Ineos Finance plc, (United Kingdom), Reg. S, 4.000%, 05/01/23 | | | 114,334 | |
| | | | | | |
| | | | | 195,009 | |
| | | | | | |
| | Construction Materials — 0.5% | | | | |
| EUR 100,000 | | HeidelbergCement Finance Luxembourg S.A., (Luxembourg), Reg. S, 3.250%, 10/21/21 | | | 125,070 | |
| 9,000 | | U.S. Concrete, Inc., 6.375%, 06/01/24 | | | 9,383 | |
| | | | | | |
| | | | | 134,453 | |
| | | | | | |
| | Containers & Packaging — 1.7% | | | | |
| EUR 125,000 | | Ardagh Packaging Finance plc/Ardagh Holdings USA, Inc., (Ireland), Reg. S, 6.750%, 05/15/24 | | | 150,934 | |
| 16,000 | | Berry Plastics Corp., 6.000%, 10/15/22 | | | 17,050 | |
| 33,000 | | Graphic Packaging International, Inc., 4.875%, 11/15/22 | | | 34,774 | |
| 7,000 | | Owens-Brockway Glass Container, Inc., 5.000%, 01/15/22 (e) | | | 7,368 | |
| | Reynolds Group Issuer, Inc./Reynolds Group Issuer LLC, | | | | |
| 40,000 | | 5.750%, 10/15/20 | | | 41,200 | |
| 9,000 | | 7.000%, 07/15/24 (e) | | | 9,641 | |
| | Sealed Air Corp., | | | | |
| 16,000 | | 5.125%, 12/01/24 (e) | | | 17,120 | |
| 5,000 | | 6.500%, 12/01/20 (e) | | | 5,713 | |
| EUR 125,000 | | SIG Combibloc Holdings S.C.A., (Luxembourg), Reg. S, 7.750%, 02/15/23 | | | 147,759 | |
| | | | | | |
| | | | | 431,559 | |
| | | | | | |
| | | | | | |
PRINCIPAL
AMOUNT | | SECURITY DESCRIPTION | | VALUE | |
| |
| | |
| | Metals & Mining — 0.9% | | | | |
| 9,000 | | AK Steel Corp., 7.500%, 07/15/23 | | | 9,765 | |
| | Alcoa, Inc., | | | | |
| 17,000 | | 5.125%, 10/01/24 | | | 17,935 | |
| 4,000 | | 5.900%, 02/01/27 | | | 4,290 | |
| 17,000 | | Aleris International, Inc., 7.875%, 11/01/20 | | | 17,510 | |
| 62,000 | | ArcelorMittal, (Luxembourg), 7.250%, 02/25/22 | | | 69,750 | |
| 10,000 | | Commercial Metals Co., 4.875%, 05/15/23 | | | 10,050 | |
| 9,000 | | Lundin Mining Corp., (Canada), 7.875%, 11/01/22 (e) | | | 9,630 | |
| 13,000 | | New Gold, Inc., (Canada), 6.250%, 11/15/22 (e) | | | 13,422 | |
| 29,000 | | Signode Industrial Group Lux S.A./Signode Industrial Group U.S., Inc., 6.375%, 05/01/22 (e) | | | 29,580 | |
| 22,000 | | Steel Dynamics, Inc., 5.250%, 04/15/23 | | | 22,880 | |
| 9,000 | | Teck Resources Ltd., (Canada), 8.000%, 06/01/21 (e) | | | 9,743 | |
| 16,000 | | United States Steel Corp., 8.375%, 07/01/21 (e) | | | 17,400 | |
| | | | | | |
| | | | | 231,955 | |
| | | | | | |
| | Paper & Forest Products — 0.4% | | | | |
| EUR 100,000 | | WEPA Hygieneprodukte GmbH, (Germany), Reg. S, 3.750%, 05/15/24 | | | 117,924 | |
| | | | | | |
| | Total Materials | | | 1,110,900 | |
| | | | | | |
| | Real Estate — 0.8% | | | | |
| | Equity Real Estate Investment Trusts (REITs) — 0.8% | |
| | Crown Castle International Corp., | | | | |
| 100,000 | | 3.700%, 06/15/26 | | | 104,820 | |
| 23,000 | | 4.875%, 04/15/22 | | | 25,662 | |
| 10,000 | | DuPont Fabros Technology LP, 5.625%, 06/15/23 | | | 10,475 | |
| 14,000 | | Equinix, Inc., 5.750%, 01/01/25 | | | 14,980 | |
| 13,000 | | Iron Mountain, Inc., 5.750%, 08/15/24 | | | 13,487 | |
| 7,000 | | MGM Growth Properties Operating Partnership LP/MGP Finance Co.- Issuer, Inc., 5.625%, 05/01/24 (e) | | | 7,595 | |
| 19,000 | | RHP Hotel Properties LP/RHP Finance Corp., 5.000%, 04/15/23 | | | 19,333 | |
| | | | | | |
| | Total Real Estate | | | 196,352 | |
| | | | | | |
| | Telecommunication Services — 4.5% | |
| | Diversified Telecommunication Services — 4.1% | |
| | AT&T, Inc., | | | | |
| 50,000 | | 4.125%, 02/17/26 | | | 54,292 | |
| 50,000 | | 4.300%, 12/15/42 | | | 50,226 | |
| | CCO Holdings LLC/CCO Holdings Capital Corp., | | | | |
| 8,000 | | 5.500%, 05/01/26 (e) | | | 8,470 | |
SEE NOTES TO FINANCIAL STATEMENTS.
11
JPMorgan Flexible Long/Short Fund
SCHEDULE OF PORTFOLIO INVESTMENTS
AS OF AUGUST 31, 2016 (Unaudited) (continued)
(Amounts in U.S. Dollars, unless otherwise noted)
| | | | | | |
PRINCIPAL
AMOUNT | | SECURITY DESCRIPTION | | VALUE | |
| |
Corporate Bonds — continued | | | | |
| |
| | Diversified Telecommunication Services — continued | |
| 16,000 | | 5.750%, 02/15/26 (e) | | | 17,120 | |
| 18,000 | | 5.875%, 04/01/24 (e) | | | 19,395 | |
| 55,000 | | 6.625%, 01/31/22 | | | 57,887 | |
| 18,000 | | Cincinnati Bell, Inc., 8.375%, 10/15/20 | | | 18,630 | |
| EUR 120,000 | | eircom Finance DAC, (Ireland), Reg. S, 4.500%, 05/31/22 | | | 136,835 | |
| 71,000 | | Embarq Corp., 7.995%, 06/01/36 | | | 73,618 | |
| | Frontier Communications Corp., | | | | |
| 32,000 | | 7.125%, 03/15/19 | | | 34,480 | |
| 33,000 | | 9.250%, 07/01/21 | | | 35,722 | |
| 9,000 | | 11.000%, 09/15/25 | | | 9,720 | |
| | Intelsat Jackson Holdings S.A., (Luxembourg), | | | | |
| 12,000 | | 5.500%, 08/01/23 | | | 8,190 | |
| 6,000 | | 7.250%, 10/15/20 | | | 4,665 | |
| 19,000 | | 8.000%, 02/15/24 (e) | | | 19,095 | |
| 34,000 | | Level 3 Financing, Inc., 5.125%, 05/01/23 | | | 35,317 | |
| EUR 100,000 | | Matterhorn Telecom S.A., (Luxembourg), Reg. S, 3.875%, 05/01/22 | | | 111,532 | |
| 2,000 | | Qwest Capital Funding, Inc., 7.750%, 02/15/31 | | | 1,928 | |
| 9,000 | | Qwest Corp., 6.750%, 12/01/21 | | | 10,037 | |
| 13,000 | | SBA Communications Corp., 4.875%, 07/15/22 | | | 13,325 | |
| | Verizon Communications, Inc., | | | | |
| 10,000 | | 4.125%, 08/15/46 | | | 10,040 | |
| 45,000 | | 4.862%, 08/21/46 | | | 50,031 | |
| EUR 120,000 | | Virgin Media Finance plc, (United Kingdom), Reg. S, 4.500%, 01/15/25 | | | 138,539 | |
| EUR 100,000 | | Wind Acquisition Finance S.A., (Luxembourg), Reg. S, 4.000%, 07/15/20 | | | 113,218 | |
| 18,000 | | Zayo Group LLC/Zayo Capital, Inc., 6.000%, 04/01/23 | | | 18,720 | |
| | | | | | |
| | | | | 1,051,032 | |
| | | | | | |
| | Wireless Telecommunication Services — 0.4% | |
| | Sprint Communications, Inc., | | | | |
| 35,000 | | 9.000%, 11/15/18 (e) | | | 38,544 | |
| 21,000 | | 9.250%, 04/15/22 | | | 22,050 | |
| | T-Mobile USA, Inc., | | | | |
| 5,000 | | 6.625%, 04/01/23 | | | 5,334 | |
| 11,000 | | 6.633%, 04/28/21 | | | 11,522 | |
| 11,000 | | 6.731%, 04/28/22 | | | 11,564 | |
| 13,000 | | 6.836%, 04/28/23 | | | 13,943 | |
| | | | | | |
| | | | | 102,957 | |
| | | | | | |
| | Total Telecommunication Services | | | 1,153,989 | |
| | | | | | |
| | | | | | |
PRINCIPAL
AMOUNT | | SECURITY DESCRIPTION | | VALUE | |
| |
| | |
| | Utilities — 4.8% | | | | |
| | Electric Utilities — 3.0% | | | | |
| 200,000 | | Empresa Electrica Angamos S.A., (Chile), Reg. S, 4.875%, 05/25/29 | | | 196,000 | |
| EUR 50,000 | | Enel S.p.A., (Italy), 5.250%, 05/20/24 | | | 76,498 | |
| 25,000 | | Exelon Corp., 4.450%, 04/15/46 | | | 27,793 | |
| EUR 100,000 | | Iberdrola International B.V., (Netherlands), Reg. S, 1.125%, 04/21/26 | | | 117,210 | |
| 50,000 | | ITC Holdings Corp., 3.250%, 06/30/26 | | | 51,262 | |
| 200,000 | | Lamar Funding Ltd., (Cayman Islands), Reg. S, 3.958%, 05/07/25 | | | 194,250 | |
| 50,000 | | Sierra Pacific Power Co., 2.600%, 05/01/26 (e) | | | 50,788 | |
| 21,000 | | Terraform Global Operating LLC, 9.750%, 08/15/22 (e) | | | 21,315 | |
| | | | | | |
| | | | | 735,116 | |
| | | | | | |
| | Gas Utilities — 0.2% | | | | |
| 45,000 | | KeySpan Gas East Corp., 2.742%, 08/15/26 (e) | | | 45,699 | |
| | | | | | |
| |
| | Independent Power & Renewable Electricity Producers — 0.8% | |
| | AES Corp., | | | | |
| 6,000 | | VAR, 3.842%, 06/01/19 | | | 6,000 | |
| 9,000 | | 5.500%, 03/15/24 | | | 9,337 | |
| | Calpine Corp., | | | | |
| 8,000 | | 5.250%, 06/01/26 (e) | | | 8,100 | |
| 27,000 | | 5.875%, 01/15/24 (e) | | | 28,552 | |
| 32,000 | | 7.875%, 01/15/23 (e) | | | 33,760 | |
| 26,000 | | Dynegy, Inc., 5.875%, 06/01/23 | | | 23,595 | |
| 11,000 | | GenOn Energy, Inc., 9.875%, 10/15/20 | | | 7,755 | |
| 25,000 | | NRG Energy, Inc., 6.625%, 03/15/23 | | | 25,500 | |
| 48,000 | | TerraForm Power Operating LLC, 6.125%, 06/15/25 (e) | | | 48,840 | |
| | | | | | |
| | | | | 191,439 | |
| | | | | | |
| | Multi-Utilities — 0.8% | | | | |
| 49,000 | | Dominion Resources, Inc., Series D, 2.850%, 08/15/26 | | | 49,170 | |
| 9,000 | | NRG Yield Operating LLC, 5.375%, 08/15/24 | | | 9,382 | |
| EUR 100,000 | | Veolia Environnement S.A., (France), Reg. S, 4.625%, 03/30/27 | | | 156,443 | |
| | | | | | |
| | | | | 214,995 | |
| | | | | | |
| | Total Utilities | | | 1,187,249 | |
| | | | | | |
| | Total Corporate Bonds
(Cost $13,897,784) | | | 14,119,657 | |
| | | | | | |
SEE NOTES TO FINANCIAL STATEMENTS.
12
JPMorgan Flexible Long/Short Fund
SCHEDULE OF PORTFOLIO INVESTMENTS
AS OF AUGUST 31, 2016 (Unaudited) (continued)
(Amounts in U.S. Dollars, unless otherwise noted)
| | | | | | |
PRINCIPAL
AMOUNT | | SECURITY DESCRIPTION | | VALUE | |
| |
Preferred Securities — 6.3% (x) | | | | |
| |
| | Consumer Discretionary — 0.5% | |
| | Media — 0.5% | | | | |
| 100,000 | | SES S.A., Reg. S, VAR, 4.625%, 01/02/22(Luxembourg) | | | 115,728 | |
| | | | | | |
| | |
| | Energy — 0.4% | | | | |
| | Oil, Gas & Consumable Fuels — 0.4% | |
| 100,000 | | TOTAL S.A., Reg. S, VAR, 2.250%, 02/26/21(France) | | | 111,545 | |
| | | | | | |
| | |
| | Financials — 5.4% | | | | |
| | Banks — 2.8% | | | | |
| 225,000 | | Bank of America Corp., Series X, VAR, 6.250%, 09/05/24 | | | 236,250 | |
| | Citigroup, Inc., | | | | |
| 20,000 | | Series O, VAR, 5.875%, 03/27/20 | | | 20,300 | |
| 225,000 | | Series P, VAR, 5.950%, 05/15/25 | | | 232,453 | |
| 18,000 | | Series R, VAR, 6.125%, 11/15/20 | | | 18,781 | |
| 200,000 | | HSBC Holdings plc, VAR, 6.875%, 06/01/21(United Kingdom) | | | 209,250 | |
| | | | | | |
| | | | | 717,034 | |
| | | | | | |
| | Capital Markets — 2.6% | | | | |
| | Bank of New York Mellon Corp. (The), | | | | |
| 94,000 | | Series F, VAR, 4.625%, 09/20/26 | | | 94,118 | |
| 50,000 | | Series E, VAR, 4.950%, 06/20/20 | | | 51,062 | |
| 225,000 | | Goldman Sachs Group, Inc. (The), Series M, VAR, 5.375%, 05/10/20 | | | 227,475 | |
| 225,000 | | Morgan Stanley, Series H, VAR, 5.450%, 07/15/19 | | | 225,563 | |
| 50,000 | | State Street Corp., Series F, VAR, 5.250%, 09/15/20 | | | 52,130 | |
| | | | | | |
| | | | | 650,348 | |
| | | | | | |
| | Total Financials | | | 1,367,382 | |
| | | | | | |
| | Total Preferred Securities
(Cost $1,559,512) | | | 1,594,655 | |
| | | | | | |
U.S. Treasury Obligations — 0.1% | | | | |
| 15,000 | | U.S. Treasury Bonds, 2.500%, 05/15/46 | | | 15,873 | |
| 14,000 | | U.S. Treasury Notes, 1.500%, 08/15/26 | | | 13,897 | |
| | | | | | |
| | Total U.S. Treasury Obligations
(Cost $29,675) | | | 29,770 | |
| | | | | | |
Loan Assignments — 30.9% | | | | |
| | |
| | Consumer Discretionary — 6.0% | | | | |
| | Diversified Consumer Services — 0.6% | |
| 150,000 | | Spin Holdco, Inc., Initial Term Loan, VAR, 4.250%, 11/14/19 | | | 148,462 | |
| | | | | | |
PRINCIPAL
AMOUNT | | SECURITY DESCRIPTION | | VALUE | |
| |
| |
| | Hotels, Restaurants & Leisure — 1.0% | |
| 193,519 | | Graton Economic Development Authority, Incremental Term B Loan, VAR, 4.750%, 09/01/22 | | | 193,883 | |
| 75,000 | | Seminole Hard Rock Entertainment, Inc., Term Loan B, VAR, 3.500%, 05/14/20 | | | 74,906 | |
| | | | | | |
| | | | | 268,789 | |
| | | | | | |
| | Leisure Products — 0.6% | | | | |
| 150,000 | | Delta 2 Sarl, USD Facility B-3, VAR, 4.750%, 07/30/21 | | | 149,138 | |
| | | | | | |
| | |
| | Media — 2.3% | | | | |
| 100,000 | | Charter Communications Operating LLC, Term Loan H, VAR, 3.250%, 08/24/21 | | | 100,292 | |
| 199,500 | | CSC Holdings LLC, Initial Term Loan, VAR, 5.000%, 10/09/22 | | | 201,038 | |
| 100,000 | | Entravision Communications Corp., Tranche B Term Loan, VAR, 3.500%, 05/31/20 ^ | | | 99,667 | |
| 100,000 | | Univision Communications, Inc., 2013 Incremental Term Loan, VAR, 4.000%, 03/01/20 ^ | | | 99,917 | |
| 76,805 | | WMG Acquisition Corp., Tranche B Refinancing Term Loan, VAR, 3.750%, 07/01/20 | | | 76,545 | |
| | | | | | |
| | | | | 577,459 | |
| | | | | | |
| | |
| | Multiline Retail — 0.6% | | | | |
| 150,000 | | J.C. Penney Corp., Term Loan B, VAR, 5.250%, 06/23/23 ^ | | | 150,562 | |
| | | | | | |
| | |
| | Specialty Retail — 0.3% | | | | |
| 85,000 | | Harbor Freight Tools U.S.A., Inc., 1st Lien Term Loan, VAR, 4.000%, 08/11/23 | | | 85,160 | |
| | | | | | |
| |
| | Textiles, Apparel & Luxury Goods — 0.6% | |
| 150,000 | | SAMSONITE IP Holdings, 1st Lien Term Loan B, VAR, 4.000%, 05/15/23 | | | 151,500 | |
| | | | | | |
| | Total Consumer Discretionary | | | 1,531,070 | |
| | | | | | |
| | Consumer Staples — 2.9% | | | | |
| | Food & Staples Retailing — 0.8% | |
| 200,000 | | SUPERVALU, Inc., Term Loan B, VAR, 5.500%, 03/21/19 | | | 200,060 | |
| | | | | | |
| | |
| | Food Products — 1.4% | | | | |
| 200,000 | | Dole Food Co., Inc., Tranche B Term Loan, VAR, 4.501%, 11/01/18 | | | 200,584 | |
SEE NOTES TO FINANCIAL STATEMENTS.
13
JPMorgan Flexible Long/Short Fund
SCHEDULE OF PORTFOLIO INVESTMENTS
AS OF AUGUST 31, 2016 (Unaudited) (continued)
(Amounts in U.S. Dollars, unless otherwise noted)
| | | | | | | | |
PRINCIPAL
AMOUNT | | | SECURITY DESCRIPTION | | VALUE | |
| | |
| Loan Assignments — continued | | | | |
| |
| | | | Food Products — continued | |
| | 150,000 | | | Hearthside Group Holdings LLC, Term Loan, VAR, 4.500%, 06/02/21 | | | 150,000 | |
| | | | | | | | |
| | | | | | | 350,584 | |
| | | | | | | | |
| | |
| | | | Personal Products — 0.7% | | | | |
| | 150,000 | | | NBTY INC, Term Loan, VAR, 5.000%, 04/27/23 ^ | | | 150,046 | |
| | 30,001 | | | Revlon Consumer Products Corp., Term Loan B, VAR, 4.750%, 07/14/23 ^ | | | 29,956 | |
| | | | | | | | |
| | | | | | | 180,002 | |
| | | | | | | | |
| | | | Total Consumer Staples | | | 730,646 | |
| | | | | | | | |
| | | | Energy — 0.7% | | | | |
| | | | Oil, Gas & Consumable Fuels — 0.7% | |
| | 10,000 | | | California Resources Corp., 1st Lien Second Out Term Loan, VAR, 11.500%, 08/05/21 ^ | | | 10,475 | |
| | 10,000 | | | Chesapeake Energy Corp., First Lien Last Out Term Loan, VAR, 8.500%, 08/15/21 ^ | | | 10,313 | |
| | 200,000 | | | Gulf Finance LLC, 1st Lien Term Loan B, VAR, 6.250%, 07/27/23 ^ | | | 193,666 | |
| | | | | | | | |
| | | | Total Energy | | | 214,454 | |
| | | | | | | | |
| | | | Financials — 1.0% | | | | |
| | | | Capital Markets — 0.4% | | | | |
| | 100,000 | | | UFC Holdings LLC, 1st Lien Guaranteed Senior Secured Term Loan, VAR, 5.000%, 07/22/23 | | | 100,200 | |
| | | | | | | | |
| |
| | | | Consumer Finance — 0.6% | |
| | 149,615 | | | Sears Roebuck Acceptance Corp., Term Loan, VAR, 5.500%, 06/30/18 | | | 144,940 | |
| | | | | | | | |
| | | | Total Financials | | | 245,140 | |
| | | | | | | | |
| | | | Health Care — 4.9% | | | | |
| | | | Health Care Equipment & Supplies — 0.6% | |
| | 150,000 | | | Mallinckrodt International Finance S.A., Incremental Term B-1 Loan, VAR, 3.500%, 03/19/21 | | | 149,731 | |
| | | | | | | | |
| |
| | | | Health Care Providers & Services — 3.1% | |
| | 200,000 | | | CHG Healthcare Services, Inc., Term Loan B, VAR, 4.750%, 06/07/23 | | | 201,126 | |
| | 150,000 | | | CHS/Community Health Systems, Inc., Incremental 2021 Term H Loan, VAR, 4.000%, 01/07/21 | | | 143,732 | |
| | 150,000 | | | IASIS Healthcare LLC, Term Loan B, VAR, 4.500%, 05/03/18 | | | 148,179 | |
| | 200,000 | | | MultiPlan, Inc., 1st Lien Term Loan B, VAR, 5.000%, 06/07/23 | | | 202,084 | |
| | 100,000 | | | National Mentor Holdings, Inc., Tranche B Term Loan, VAR, 4.250%, 01/31/21 ^ | | | 100,063 | |
| | | | | | | | |
| | | | | | | 795,184 | |
| | | | | | | | |
| | | | | | | | |
PRINCIPAL
AMOUNT | | | SECURITY DESCRIPTION | | VALUE | |
| | |
| |
| | | | Pharmaceuticals — 1.2% | |
| | 150,000 | | | Endo Pharmaceutical, 2015 Incremental Term B Loan, VAR, 3.750%, 09/26/22 | | | 149,109 | |
| | 149,618 | | | Valeant Pharmaceuticals International, Inc., Series F-1 Tranche B Term Loan, VAR, 5.500%, 04/01/22(Canada) | | | 149,805 | |
| | | | | | | | |
| | | | | | | 298,914 | |
| | | | | | | | |
| | | | Total Health Care | | | 1,243,829 | |
| | | | | | | | |
| | | | Industrials — 3.2% | | | | |
| | | | Aerospace & Defense — 0.6% | | | | |
| | 78,947 | | | Transdigm Group, Inc., 1st Lien Term Loan F, VAR, 3.750%, 06/09/23 | | | 78,627 | |
| | 71,053 | | | Transdigm Group, Inc., Delay Draw Tranche F Term Loan, VAR, 3.750%, 06/09/23 | | | 70,764 | |
| | | | | | | | |
| | | | | | | 149,391 | |
| | | | | | | | |
| |
| | | | Airlines — 0.8% | |
| | 200,000 | | | U.S. Airways, Inc., Term Loan B-1, VAR, 3.500%, 05/23/19 | | | 199,876 | |
| | | | | | | | |
| |
| | | | Commercial Services & Supplies — 1.8% | |
| | 22,143 | | | Garda World Security Corp., Term B Delayed Draw Loan, VAR, 4.004%, 11/06/20(Canada) | | | 21,784 | |
| | 127,472 | | | Garda World Security Corp., Term B Loan, VAR, 4.004%, 11/06/20 | | | 125,401 | |
| | 200,000 | | | Pharmaceutical Product Development LLC, 1st Lien Term Loan B, VAR, 4.250%, 08/18/22 | | | 200,550 | |
| | 100,000 | | | Prime Security Services Borrower LLC, 1st Lien Term Loan, VAR, 4.750%, 04/07/22 | | | 100,656 | |
| | | | | | | | |
| | | | | | | 448,391 | |
| | | | | | | | |
| | | | Total Industrials | | | 797,658 | |
| | | | | | | | |
| | | | Information Technology — 4.5% | | | | |
| | | | Internet Software & Services — 0.6% | |
| | 150,000 | | | Solar Winds Holdings, Inc., 1st Lien Term loan, VAR, 5.500%, 02/03/23 | | | 150,488 | |
| | | | | | | | |
| |
| | | | IT Services — 0.6% | |
| | 150,000 | | | First Data Corp., 2022 New Dollar Term Loan, VAR, 4.272%, 07/08/22 | | | 150,412 | |
| | | | | | | | |
| |
| | | | Semiconductors & Semiconductor Equipment — 2.1% | |
| | 135,621 | | | Avago Technologies, Term A-2 Loan, VAR, 3.508%, 02/01/23(Singapore) | | | 136,789 | |
| | 200,000 | | | Microsemi Corp., Closing Date Term B Loan, VAR, 3.750%, 01/15/23 | | | 201,228 | |
| | 200,000 | | | On Semiconductor Corp., Term Loan B, VAR, 5.250%, 03/31/23 | | | 202,464 | |
| | | | | | | | |
| | | | | | | 540,481 | |
| | | | | | | | |
SEE NOTES TO FINANCIAL STATEMENTS.
14
JPMorgan Flexible Long/Short Fund
SCHEDULE OF PORTFOLIO INVESTMENTS
AS OF AUGUST 31, 2016 (Unaudited) (continued)
(Amounts in U.S. Dollars, unless otherwise noted)
| | | | | | | | |
PRINCIPAL
AMOUNT | | | SECURITY DESCRIPTION | | VALUE | |
| | |
| Loan Assignments — continued | | | | |
| | |
| | | | Software — 0.6% | | | | |
| | 146,590 | | | Infor U.S., Inc., Tranche B-5 Term Loan, VAR, 3.750%, 06/03/20 ^ | | | 144,904 | |
| | | | | | | | |
| |
| | | | Technology Hardware, Storage & Peripherals — 0.6% | |
| | 150,000 | | | Dell Inc. 1st Lien Term Loan B, VAR, 4.000%, 06/02/23 ^ | | | 150,804 | |
| | | | | | | | |
| | | | Total Information Technology | | | 1,137,089 | |
| | | | | | | | |
| | | | Materials — 1.8% | | | | |
| | | | Chemicals — 1.0% | | | | |
| | 200,000 | | | Huntsman International LLC, Term Loan, VAR, 4.250%, 04/01/23 | | | 200,876 | |
| | 50,000 | | | PolyOne Corp.,Term Loan B, VAR, 3.500%, 11/11/22 | | | 50,312 | |
| | | | | | | | |
| | | | | | | 251,188 | |
| | | | | | | | |
| | | | Construction Materials — 0.4% | | | | |
| | 100,000 | | | Headwaters, Inc., Term Loan B, VAR, 4.000%, 03/24/22 ^ | | | 100,000 | |
| | | | | | | | |
| |
| | | | Containers & Packaging — 0.4% | |
| | 100,000 | | | Berry Plastics Corp., Term Loan G, VAR, 3.500%, 01/06/21 | | | 99,766 | |
| | | | | | | | |
| | | | Total Materials | | | 450,954 | |
| | | | | | | | |
| | | | Real Estate — 1.6% | | | | |
| | | | Equity Real Estate Investment Trusts (REITs) — 0.8% | |
| | 200,000 | | | MGM Growth Properties, Term Loan B, VAR, 4.000%, 04/25/23 | | | 201,608 | |
| | | | | | | | |
| |
| | | | Real Estate Management & Development — 0.8% | |
| | 200,000 | | | CityCenter Holdings LLC, Term B Loan, VAR, 4.250%, 10/16/20 | | | 201,042 | |
| | | | | | | | |
| | | | Total Real Estate | | | 402,650 | |
| | | | | | | | |
| | | | Telecommunication Services — 1.4% | |
| | | | Diversified Telecommunication Services — 1.4% | |
| | 100,000 | | | Cincinnati Bell, Inc., Term Loan, VAR, 4.000%, 09/10/20 ^ | | | 100,000 | |
| | 150,000 | | | Intelsat Jackson Holdings S.A., Tranche B-2 Term Loan, VAR, 3.750%, 06/30/19(Luxembourg) | | | 142,270 | |
| | 100,000 | | | Level 3 Financing, Inc., Term Loan B-2, VAR, 3.500%, 05/31/22 | | | 100,458 | |
| | | | | | | | |
| | | | Total Telecommunication Services | | | 342,728 | |
| | | | | | | | |
| | | | Utilities — 2.9% | | | | |
| | | | Electric Utilities — 0.7% | |
| | 37,143 | | | Texas Competitive Electric Holdings Co. LLC, 1st Lien Term Loan C, VAR, 5.000%, 10/31/17 | | | 37,226 | |
| | 162,857 | | | Texas Competitive Electric Holdings Co. LLC, Term Loan B, VAR, 5.000%, 10/31/17 | | | 163,224 | |
| | | | | | | | |
| | | | | | | 200,450 | |
| | | | | | | | |
| | | | | | | | |
PRINCIPAL
AMOUNT | | | SECURITY DESCRIPTION | | VALUE | |
| | |
| |
| | | | Independent Power & Renewable Electricity Producers — 2.2% | |
| | 200,000 | | | Calpine Corp., Term Loan, VAR, 3.500%, 05/27/22 | | | 200,056 | |
| | 200,000 | | | Dynegy, Inc., 1st Lien Term Loan C, VAR, 5.000%, 06/27/23 | | | 200,032 | |
| | 150,000 | | | NRG Energy, Inc., Term Loan, VAR, 3.500%, 06/30/23 | | | 149,789 | |
| | | | | | | | |
| | | | | | | 549,877 | |
| | | | | | | | |
| | | | Total Utilities | | | 750,327 | |
| | | | | | | | |
| | | | Total Loan Assignments
(Cost 7,812,817) | | | 7,846,545 | |
| | | | | | | | |
NOTIONAL
AMOUNT | | | | | | |
| | |
| Option Purchased — 0.0% (g) | | | | |
| | 2,550,000 | | | Payer Option Purchased on Credit Default Index — 0.0% (g) | | | | |
| | | | Expiring 10/19/16. If exercised the Fund pays quarterly to Buy Protection on CDX.NA.IG.26-V1.at $0.01, terminating 06/20/21, European Style. (r) | | | | |
| | | | Total Options Purchased
(Cost $3,728) | | | 2,660 | |
| | | | | | | | |
PRINCIPAL
AMOUNT | | | | | | |
| | |
| Short-Term Investments — 6.5% | | | | |
| |
| | | | U.S. Treasury Obligation — 2.8% | |
| | 700,000 | | | U.S. Treasury Bill, 0.257%, 09/08/16 (n) | | | 699,972 | |
| | | | | | | | |
SHARES | | | | | | |
| | |
| | |
| | | | Investment Company — 3.7% | | | | |
| | 940,554 | | | JPMorgan Prime Money Market Fund, Institutional Class Shares, 0.360% (b) (l) | | | 940,554 | |
| | | | Total Short-Term Investments (Cost $1,640,519) | | | 1,640,526 | |
| | | | | | | | |
| | |
| | | | Total Investments — 99.5%
(Cost 24,974,483) | | | 25,264,448 | |
| | | | Other Assets in Excess of
Liabilities — 0.5% | | | 136,920 | |
| | | | | | | | |
| | | | NET ASSETS — 100.0% | | $ | 25,401,368 | |
| | | | | | | | |
| | | | |
Percentages indicated are based on net assets. |
SEE NOTES TO FINANCIAL STATEMENTS.
15
JPMorgan Flexible Long/Short Fund
SCHEDULE OF PORTFOLIO INVESTMENTS
AS OF AUGUST 31, 2016 (Unaudited) (continued)
(Amounts in U.S. Dollars, unless otherwise noted)
(Amounts in thousands, except number of Futures contracts)
| | | | | | | | | | | | | | | | | | |
| Futures Contracts | |
| |
NUMBER OF
CONTRACTS | | DESCRIPTION | | EXPIRATION
DATE | | | TRADING
CURRENCY | | | NOTIONAL
VALUE AT
AUGUST 31, 2016 | | | NET
UNREALIZED
APPRECIATION
(DEPRECIATION) | |
| |
| | Long Futures Outstanding | | | | | | | | | | | | | | | | |
| 15 | | 90 Day Eurodollar | | | 09/19/16 | | | | USD | | | | 3,716,813 | | | | (3,997) | |
| | Short Futures Outstanding | | | | | | | | | | | | | | | | |
| (4) | | Euro Bund | | | 09/08/16 | | | | EUR | | | | (746,816) | | | | (1,809) | |
| (2) | | Euro-Bobl | | | 09/08/16 | | | | EUR | | | | (298,026) | | | | 97 | |
| (1) | | Euro-Schatz | | | 09/08/16 | | | | EUR | | | | (124,941) | | | | 93 | |
| (1) | | 10 Year U.S. Treasury Note | | | 12/20/16 | | | | USD | | | | (130,922) | | | | 412 | |
| (1) | | Long Gilt | | | 12/28/16 | | | | GBP | | | | (172,719) | | | | (119) | |
| (15) | | 90 Day Eurodollar | | | 09/18/17 | | | | USD | | | | (3,709,688) | | | | 2,803 | |
| | | | | | | | | | | | | | | | | | |
| | | | | | | | | | | | | | | | | (2,520) | |
| | | | | | | | | | | | | | | | | | |
Forward Foreign Currency Exchange Contracts
| | | | | | | | | | | | | | | | | | | | |
| |
CONTRACTS TO BUY | | CURRENCY | | COUNTERPARTY | | SETTLEMENT
DATE | | | SETTLEMENT
VALUE | | | VALUE AT
AUGUST 31, 2016 | | | NET
UNREALIZED
APPRECIATION
(DEPRECIATION) | |
| |
| 1,173,795 | | EUR | | BNP Paribas | | | 09/02/16 | | | | 1,311,041 | | | | 1,309,309 | | | | (1,732) | |
| 2,274,733 | | EUR | | Credit Suisse International | | | 09/02/16 | | | | 2,540,862 | | | | 2,537,351 | | | | (3,511) | |
| 2,521 | | EUR | | Morgan Stanley | | | 09/02/16 | | | | 2,804 | | | | 2,812 | | | | 8 | |
| 8,657 | | EUR | | Royal Bank of Canada | | | 09/02/16 | | | | 9,654 | | | | 9,656 | | | | 2 | |
| 485,582 | | GBP | | Royal Bank of Canada | | | 09/02/16 | | | | 635,563 | | | | 637,642 | | | | 2,079 | |
| |
| | | | | | | | | | | 4,499,924 | | | | 4,496,770 | | | | (3,154) | |
| |
|
| |
CONTRACTS
TO SELL | | | | COUNTERPARTY | | SETTLEMENT
DATE | | | SETTLEMENT
VALUE | | | VALUE AT
AUGUST 31, 2016 | | | NET
UNREALIZED
APPRECIATION
(DEPRECIATION) | |
| |
| | | | Australia & New Zealand Banking | | | | | | | | | | | | | | | | |
| 3,115,386 | | EUR | | Group Ltd. | | | 09/02/16 | | | | 3,465,138 | | | | 3,475,057 | | | | (9,919) | |
| 3,200 | | EUR | | BNP Paribas | | | 09/02/16 | | | | 3,579 | | | | 3,570 | | | | 9 | |
| 4,510 | | EUR | | Credit Suisse International | | | 09/02/16 | | | | 5,091 | | | | 5,031 | | | | 60 | |
| 312,273 | | EUR | | Morgan Stanley | | | 09/02/16 | | | | 344,033 | | | | 348,327 | | | | (4,294) | |
| 24,335 | | EUR | | Royal Bank of Canada | | | 09/02/16 | | | | 27,054 | | | | 27,144 | | | | (90) | |
| 1,172,591 | | EUR | | BNP Paribas | | | 10/05/16 | | | | 1,311,650 | | | | 1,309,900 | | | | 1,750 | |
| 2,261,715 | | EUR | | Credit Suisse International | | | 10/05/16 | | | | 2,530,045 | | | | 2,526,561 | | | | 3,484 | |
| 10,162 | | EUR | | Royal Bank of Canada | | | 10/05/16 | | | | 11,398 | | | | 11,352 | | | | 46 | |
| 485,582 | | GBP | | Royal Bank of Canada | | | 09/02/16 | | | | 639,230 | | | | 637,643 | | | | 1,587 | |
| 481,732 | | GBP | | Royal Bank of Canada | | | 10/05/16 | | | | 630,879 | | | | 633,110 | | | | (2,231) | |
| |
| | | | | | | | | | | 8,968,097 | | | | 8,977,695 | | | | (9,598) | |
| |
SEE NOTES TO FINANCIAL STATEMENTS.
16
Centrally Cleared Credit Default Swaps - Buy Protection [1]
Credit Indices:
| | | | | | | | | | | | | | | | |
|
| REFERENCE OBLIGATION | | FUND PAYS
FIXED RATE (r) | | TERMINATION
DATE | | IMPLIED CREDIT
SPREAD AS OF AUGUST 31, 2016 [2] | | | NOTIONAL
AMOUNT [3] | | | VALUE | | UPFRONT
PREMIUMS (PAID)/
RECEIVED [4] |
|
CDX.NA.HY.26-V1 | | 5.000% quarterly | | 06/20/21 | | | 3.927 | % | | | 250,000 | | | (13,658) | | 10,717 |
| | | | | | | | | | | | | | |
[1] The Fund, as a buyer of credit protection, is generally obligated to make periodic payments and may also pay or receive an upfront premium to or from the protection seller, in exchange for the right to receive a contingent payment, upon occurrence of a credit event with respect to an underlying reference obligation, as defined under the terms of individual swap contracts.
[2] Implied credit spreads are an indication of the seller’s performance risk, related to the likelihood of a credit event occurring that would require a seller to make payment to a buyer. Implied credit spreads are used to determine the value of swap contracts and reflect the cost of buying/selling protection, which may include upfront payments made to enter into the contract. Therefore, higher spreads would indicate a greater likelihood that a seller will be obligated to perform (i.e., make payment) under the swap contract. Increasing values, in absolute terms and relative to notional amounts, are also indicative of greater performance risk. Implied credit spreads for credit default swaps on credit indices are linked to the weighted average spread across the underlying reference obligations included in a particular index.
[3] The notional amount is the maximum amount that a seller of credit protection would be obligated to pay and a buyer of credit protection would receive, upon occurrence of a credit event.
[4] Upfront premiums generally relate to payments made or received at the initiation of the agreement to compensate the differences between the stated terms of the swap agreement and current market conditions (credit spreads, interest rates and other relevant factors).
17
JPMorgan Flexible Long/Short Fund
SCHEDULE OF PORTFOLIO INVESTMENTS
AS OF AUGUST 31, 2016 (Unaudited) (continued)
| | | | | | | | |
| | | |
| EUR | | — | | Euro | | |
| GBP | | — | | British Pound | | |
| MSCI | | | | — | | Morgan Stanley Capital International | | |
| Reg. S | | — | | Security was purchased pursuant to Regulation S under the Securities Act of 1933, which exempts from registration securities offered and sold outside of the United States. Such a security cannot be sold in the United States without either an effective registration statement filed pursuant to the Securities Act of 1933, or pursuant to an exemption from registration. | | |
| USD | | | | — | | United States Dollar | | |
| VAR | | | | — | | Variable Rate Security. The interest rate shown is the rate in effect as of August 31, 2016. | | |
| | | | | | |
| | | |
| (b) | | — | | Investment in affiliate. Money market fund is registered under the Investment Company Act of 1940, as amended, and advised by J.P. Morgan Investment Management Inc. | | |
| (e) | | — | | Security is exempt from registration under Rule 144A of the Securities Act of 1933, as amended. Unless otherwise indicated, this security has been determined to be liquid under procedures established by the Board of Trustees and may be resold in transactions exempt from registration, normally to qualified institutional buyers. | | |
| (g) | | — | | Amount rounds to less than 0.05%. | | |
| (l) | | — | | The rate shown is the current yield as of August 31, 2016. | | |
| (n) | | — | | The rate shown is the effective yield at the date of purchase. | | |
| (r) | | — | | Rates shown are per annum and payments are as described. | | |
| (x) | | — | | Securities are perpetual and thus, do not have a predetermined maturity date. The coupon rates for these securities are fixed for a period of time and may be structured to adjust thereafter. The dates shown, if applicable, reflects the next call date. The coupon rates shown are the rates in effect as of August 31, 2016. | | |
| ^ | | — | | All or a portion of the security is unsettled as of August 31, 2016. Unless otherwise indicated, the coupon rate is undetermined. The coupon rate shown may not be accrued for the entire position. | | |
SEE NOTES TO FINANCIAL STATEMENTS.
18
STATEMENT OF ASSETS AND LIABILITIES
AS OF AUGUST 31, 2016
| | | | | | | | |
| | | Flexible Long/Short
Fund | | | | |
| |
ASSETS: | | | | | | | | |
Investments in non-affiliates, at value | | $ | 24,323,894 | | | | | |
Investments in affiliates, at value | | | 940,554 | | | | | |
| | | | |
Total investment securities, at value | | | 25,264,448 | | | | | |
Cash | | | 361,483 | | | | | |
Foreign currency, at value | | | 4,433 | | | | | |
Deposits at broker for futures contracts | | | 29,000 | | | | | |
Deposits at broker for swap contracts | | | 8,715 | | | | | |
Receivables: | | | | | | | | |
Investment securities sold | | | 423,876 | | | | | |
Interest from non-affiliates | | | 215,273 | | | | | |
Dividends from affiliates | | | 1,209 | | | | | |
Variation margin on futures contracts | | | 849 | | | | | |
Unrealized appreciation on forward foreign currency exchange contracts | | | 9,025 | | | | | |
Variation Margin on Centrally Cleared Swaps | | | 494 | | | | | |
Due from Adviser | | | 18,269 | | | | | |
Deferred offering cost | | | 64,396 | | | | | |
| | | | |
Total Assets | | | 26,401,470 | | | | | |
| | | | |
| | |
LIABILITIES: | | | | | | | | |
Payables: | | | | | | | | |
Investment securities purchased | | | 931,972 | | | | | |
Unrealized depreciation on forward foreign currency exchange contracts | | | 21,777 | | | | | |
Accrued liabilities: | | | | | | | | |
Distribution fees | | | 17 | | | | | |
Shareholder servicing fees | | | 5,312 | | | | | |
Custodian and accounting fees | | | 9,547 | | | | | |
Trustees’ and Chief Compliance Officer’s fees | | | 1,923 | | | | | |
Other | | | 29,554 | | | | | |
| | | | |
Total Liabilities | | | 1,000,102 | | | | | |
| | | | |
Net Assets | | $ | 25,401,368 | | | | | |
| | | | |
SEE NOTES TO FINANCIAL STATEMENTS.
19
STATEMENT OF ASSETS AND LIABILITIES
AS OF AUGUST 31, 2016 (continued)
| | | | | | | | |
| | | Flexible Long/Short
Fund | | | | |
| |
NET ASSETS: | | | | | | | | |
Paid-in-Capital | | $ | 25,100,031 | | | | | |
Accumulated undistributed (distributions in excess of) net investment income | | | 14,713 | | | | | |
Accumulated net realized gains (losses) | | | 14,823 | | | | | |
Net unrealized appreciation (depreciation) | | | 271,801 | | | | | |
| | | | |
Total Net Assets | | $ | 25,401,368 | | | | | |
| | | | |
| | |
Net Assets: | | | | | | | | |
Class A | | $ | 20,313 | | | | | |
Class C | | | 20,295 | | | | | |
Class R6 | | | 20,330 | | | | | |
Select Class | | | 25,340,430 | | | | | |
| | | | |
Total | | $ | 25,401,368 | | | | | |
| | | | |
| | |
Outstanding units of beneficial interest (shares) | | | | | | | | |
($0.0001 par value; unlimited number of shares authorized): | | | | | | | | |
Class A | | | 2,007 | | | | | |
Class C | | | 2,005 | | | | | |
Class R6 | | | 2,009 | | | | | |
Select Class | | | 2,503,870 | | | | | |
| | |
Net Asset Value (a): | | | | | | | | |
Class A - Redemption price per share | | $ | 10.12 | | | | | |
Class C - Offering price per share (b) | | | 10.12 | | | | | |
Class R6 - Offering and redemption price per share | | | 10.12 | | | | | |
Select Class - Offering and redemption price per share | | | 10.12 | | | | | |
Class A maximum sales charge | | | 3.7 | 5% | | | | |
Class A maximum public offering price per share | | | | | | | | |
[net asset value per share/(100% – maximum sales charge)] | | $ | 10.51 | | | | | |
| | | | |
| | |
Cost of investments in non-affiliates | | $ | 24,033,929 | | | | | |
Cost of investments in affiliates | | | 940,554 | | | | | |
Cost of foreign currency | | | 4,427 | | | | | |
Premiums received on swaps | | | 10,717 | | | | | |
(a) Per share amounts may not recalculate due to rounding of net assets and/or shares outstanding.
(b) Redemption price for Class C Shares varies based upon length of time the shares are held.
SEE NOTES TO FINANCIAL STATEMENTS.
20
STATEMENT OF OPERATIONS
FOR THE PERIOD ENDED AUGUST 31, 2016 (Unaudited)
| | | | | | | | |
| | | Flexible
Long/Short Fund (a) | | | | |
| |
INVESTMENT INCOME: | | | | | | | | |
Interest income from non-affiliates | | $ | 146,403 | | | | | |
Dividend income from affiliates | | | 4,917 | | | | | |
| | | | |
Total investment income | | | 151,320 | | | | | |
| | | | |
| | |
EXPENSES: | | | | | | | | |
Investment advisory fees | | | 21,339 | | | | | |
Administration fees | | | 3,495 | | | | | |
Distribution fees: | | | | | | | | |
Class A | | | 9 | | | | | |
Class C | | | 25 | | | | | |
Shareholder servicing fees: | | | 10,661 | | | | | |
Class A | | | 9 | | | | | |
Class C | | | 9 | | | | | |
Select Class | | | 10,644 | | | | | |
Custodian and accounting fees | | | 9,547 | | | | | |
Interest expense to affiliates | | | 104 | | | | | |
Professional fees | | | 28,189 | | | | | |
Trustees’ and Chief Compliance Officer’s fees | | | 4,006 | | | | | |
Printing and mailing costs | | | 768 | | | | | |
Registration and filing fees | | | 128 | | | | | |
Transfer agency fees (See Note 2.I.) | | | 233 | | | | | |
Offering costs | | | 12,684 | | | | | |
Other | | | 337 | | | | | |
| | | | |
Total expenses | | | 91,526 | | | | | |
| | | | |
Less fees waived | | | (26,878 | ) | | | | |
Less expense reimbursements | | | (28,072 | ) | | | | |
| | | | |
Net expenses | | | 36,576 | | | | | |
| | | | |
Net investment income (loss) | | | 114,744 | | | | | |
| | | | |
| | |
REALIZED/UNREALIZED GAINS (LOSSES): | | | | | | | | |
Net realized gain (loss) on transactions from: | | | | | | | | |
Investments in non-affiliates | | | 12,785 | | | | | |
Futures | | | (7,413 | ) | | | | |
Foreign currency transactions | | | 11,754 | | | | | |
Swaps | | | (2,303 | ) | | | | |
| | | | |
Net realized gain (loss) | | | 14,823 | | | | | |
| | | | |
Change in net unrealized appreciation/depreciation on: | | | | | | | | |
Investments in non-affiliates | | | 289,965 | | | | | |
Futures | | | (2,520 | ) | | | | |
Foreign currency translations | | | (12,703 | ) | | | | |
Swaps | | | (2,941 | ) | | | | |
| | | | |
Change in net unrealized appreciation/depreciation | | | 271,801 | | | | | |
| | | | |
Net realized/unrealized gains (losses) | | | 286,624 | | | | | |
| | | | |
Change in net assets resulting from operations | | $ | 401,368 | | | | | |
| | | | |
(a) Commencement of operations was June 30, 2016.
SEE NOTES TO FINANCIAL STATEMENTS.
21
STATEMENT OF CHANGES IN NET ASSETS
FOR THE PERIOD INDICATED (Unaudited)
| | | | | | | | |
| | | Flexible Long/Short Fund | |
| | | Period Ended August 31, 2016 (a) | |
| |
CHANGE IN NET ASSETS RESULTING FROM OPERATIONS: | | | | | | | | |
Net investment income (loss) | | $ | 114,744 | | | | | |
Net realized gain (loss) | | | 14,823 | | | | | |
Change in net unrealized appreciation/depreciation | | | 271,801 | | | | | |
| | | | |
Change in net assets resulting from operations | | | 401,368 | | | | | |
| | | | |
| | |
DISTRIBUTIONS TO SHAREHOLDERS: | | | | | | | | |
Class A | | | | | | | | |
From net investment income | | | (72 | ) | | | | |
Class C | | | | | | | | |
From net investment income | | | (54 | ) | | | | |
Class R6 | | | | | | | | |
From net investment income | | | (88 | ) | | | | |
Select Class | | | | | | | | |
From net investment income | | | (99,817 | ) | | | | |
| | | | |
Total distributions to shareholders | | | (100,031 | ) | | | | |
| | | | |
| | |
CAPITAL TRANSACTIONS: | | | | | | | | |
Change in net assets resulting from capital transactions | | | 25,100,031 | | | | | |
| | | | |
| | |
NET ASSETS: | | | | | | | | |
Change in net assets | | | 25,401,368 | | | | | |
Beginning of period | | | — | | | | | |
| | | | |
End of period | | $ | 25,401,368 | | | | | |
| | | | |
Accumulated undistributed (distributed in excess of) net investment income | | $ | 14,713 | | | | | |
| | | | |
(a) Commencement of operations was June 30, 2016.
SEE NOTES TO FINANCIAL STATEMENTS.
22
STATEMENT OF CHANGES IN NET ASSETS (Continued)
FOR THE PERIOD INDICATED (Unaudited)
(Amounts in thousands)
| | | | | | | | |
| | | Flexible Long/Short
Fund | |
| | | June 30, 2016 to August 31,
2016 (a) | |
| |
CAPITAL TRANSACTIONS: | | | | | | | | |
Class A | | | | | | | | |
Proceeds from shares issued | | $ | 20,000 | | | | | |
Distributions reinvested | | | 72 | | | | | |
| | | | |
Change in net assets resulting from Class A capital transactions | | $ | 20,072 | | | | | |
| | | | |
Class C | | | | | | | | |
Proceeds from shares issued | | $ | 20,000 | | | | | |
Distributions reinvested | | | 54 | | | | | |
| | | | |
Change in net assets resulting from Class C capital transactions | | $ | 20,054 | | | | | |
| | | | |
Class R6 | | | | | | | | |
Proceeds from shares issued | | $ | 20,000 | | | | | |
Distributions reinvested | | | 88 | | | | | |
| | | | |
Change in net assets resulting from Class R6 capital transactions | | $ | 20,088 | | | | | |
| | | | |
Select Class | | | | | | | | |
Proceeds from shares issued | | $ | 24,940,000 | | | | | |
Distributions reinvested | | | 99,817 | | | | | |
| | | | |
Change in net assets resulting from Select Class capital transactions | | $ | 25,039,817 | | | | | |
| | | | |
Total change in net assets resulting from capital transactions | | $ | 25,100,031 | | | | | |
| | | | |
| | |
SHARE TRANSACTIONS: | | | | | | | | |
Class A | | | | | | | | |
Issued | | | 2,000 | | | | | |
Reinvested | | | 7 | | | | | |
| | | | |
Change in Class A Shares | | | 2,007 | | | | | |
| | | | |
Class C | | | | | | | | |
Issued | | | 2,000 | | | | | |
Reinvested | | | 5 | | | | | |
| | | | |
Change in Class C Shares | | | 2,005 | | | | | |
| | | | |
Class R6 | | | | | | | | |
Issued | | | 2,000 | | | | | |
Reinvested | | | 9 | | | | | |
| | | | |
Change in Class R6 Shares | | | 2,009 | | | | | |
| | | | |
Select Class | | | | | | | | |
Issued | | | 2,494,000 | | | | | |
Reinvested | | | 9,870 | | | | | |
| | | | |
Change in Select Class Shares | | | 2,503,870 | | | | | |
| | | | |
(a) Commencement of operations was June 30, 2016.
SEE NOTES TO FINANCIAL STATEMENTS.
23
FINANCIAL HIGHLIGHTS
FOR THE PERIODS INDICATED
| | | | | | | | | | | | | | | | | | | | | | | | | | | | | | | | | | | | | | | | | | | | | | | | |
| | | | | | Per share operating performance | | | | | | | | | | | | Ratios/Supplemental data | |
| | | | |
| | | | | | Investment operations | | | Distributions | | | | | | | | | | | | Ratios to average net assets (a) | | | | |
| | | Net asset value, beginning of period | | | Net investment income (loss) (b) | | | Net realized and unrealized gains (losses) on investments | | | Total from investment operations | | | Net investment income | | | Net asset value, end of period | | | Total return
(excludes sales charge) (c) (d) | | | Net assets,
end of period | | | Net expenses (e) (f) | | | Net investment income
(loss) (f) | | | Expenses without waivers, reimbursements and earnings credits (f) | | | Portfolio turnover rate (c) (g) | |
| | | | |
Flexible Long/Short Fund | | | | | | | | | | | | | | | | | | | | | | | | | | | | | | | | | | | | | | | | | | | | | | | | |
Class A | | | | | | | | | | | | | | | | | | | | | | | | | | | | | | | | | | | | | | | | | | | | | | | | |
June 30, 2016 (h) through August 31, 2016 (Unaudited) | | | $10.00 | | | | $0.04 | | | | $0.12 | | | | $0.16 | | | | $(0.04 | ) | | | $10.12 | | | | 1.56 % | | | | $20,313 | | | | 1.10% | | | | 2.44 % | | | | 3.86% | | | | 7 % | |
Class C | | | | | | | | | | | | | | | | | | | | | | | | | | | | | | | | | | | | | | | | | | | | | | | | |
June 30, 2016 (h) through August 31, 2016 (Unaudited) | | | 10.00 | | | | 0.03 | | | | 0.12 | | | | 0.15 | | | | (0.03 | ) | | | 10.12 | | | | 1.47 | | | | 20,295 | | | | 1.60 | | | | 1.93 | | | | 4.32 | | | | 7 | |
Class R6 | | | | | | | | | | | | | | | | | | | | | | | | | | | | | | | | | | | | | | | | | | | | | | | | |
June 30, 2016 (h) through August 31, 2016 (Unaudited) | | | 10.00 | | | | 0.05 | | | | 0.11 | | | | 0.16 | | | | (0.04 | ) | | | 10.12 | | | | 1.64 | | | | 20,330 | | | | 0.61 | | | | 2.93 | | | | 3.32 | | | | 7 | |
Select Class | | | | | | | | | | | | | | | | | | | | | | | | | | | | | | | | | | | | | | | | | | | | | | | | |
June 30, 2016 (h) through August 31, 2016 (Unaudited) | | | 10.00 | | | | 0.05 | | | | 0.11 | | | | 0.16 | | | | (0.04 | ) | | | 10.12 | | | | 1.60 | | | | 25,340,430 | | | | 0.85 | | | | 2.68 | | | | 1.89 | | | | 7 | |
| (a) | Annualized for periods less than one year, unless otherwise noted. |
| (b) | Calculated based upon average shares outstanding. |
| (c) | Not annualized for periods less than one year. |
| (d) | Includes adjustments in accordance with accounting principles generally accepted in the United States of America and as such, the net asset values for financial reporting purposes and the returns based upon those net asset values may differ from the net asset values and returns for shareholder transactions. | |
| (e) | Includes earnings credits and interest expense, if applicable, each of which is less than 0.005% unless otherwise noted. | |
| (f) | Certain non-recurring expenses incurred by the Fund were not annualized for the period ended August 31, 2016. | |
| (g) | Portfolio turnover is calculated by dividing the lesser of total purchases or sales of portfolio securities for the reporting period by the monthly average value of portfolio securities owned during the reporting period. Excluded from both the numerator and denominator are amounts relating to derivatives and securities whose maturities or expiration dates at the time of acquisition were one year or less. | |
| (h) | Commencement of operations. |
24
NOTES TO FINANCIAL STATEMENTS
AS OF AUGUST 31, 2016 (Unaudited)
1. Organization
JPMorgan Trust IV (the “Trust”) was formed on November 12, 2015, as a Delaware statutory trust, pursuant to a Declaration of Trust dated November 12, 2015 and is registered under the Investment Company Act of 1940, as amended (the “1940 Act”), as an open-end management investment company.
The following is a separate fund of the Trust (the “Fund”) covered by this report:
| | | | |
| | | Classes Offered | | Diversified/Non-Diversified |
Flexible Long/Short Fund | | Class A, Class C, Class R6 and Select Class | | Diversified |
The investment objective of the Fund is to seek to provide total return.
The Fund commenced operations on June 30, 2016. Currently, the Fund is not publicly offered for investment.
Class A Shares generally provide for a front-end sales charge while Class C Shares provide for a contingent deferred sales charge (“CDSC”). No sales charges are assessed with respect to Class R6 and Select Class Shares. All classes of shares have equal rights as to earnings, assets and voting privileges, except that each class may bear different transfer agency, sub-transfer agency distribution and shareholder servicing fees and each class has exclusive voting rights with respect to its distribution plan and shareholder servicing agreements. Certain Class A Shares, for which front-end sales charges have been waived, may be subject to a CDSC as described in the Fund’s prospectus.
J.P. Morgan Investment Management Inc. (“JPMIM”) an indirect, wholly-owned subsidiary of JPMorgan Chase & Co. (“JPMorgan”) acts as Adviser (the “Adviser”) and Administrator (the “Administrator”) to the Fund.
2. Significant Accounting Policies
The following is a summary of significant accounting policies followed by the Fund in the preparation of its financial statements. The Fund is an investment company and, accordingly, follows the investment company accounting and reporting guidance of the Financial Accounting Standards Board Accounting Standards Codification Topic 946 - Investment Companies, which is part of U.S. generally accepted accounting principles (“GAAP”). The preparation of financial statements in conformity with GAAP requires management to make estimates and assumptions that affect the reported amounts of assets and liabilities and disclosure of contingent assets and liabilities at the date of the financial statements and the reported amounts of increases and decreases in net assets from operations during the reporting period. Actual results could differ from those estimates.
A. Valuation of Investments — The valuation of investments is in accordance with GAAP and the Fund’s valuation policies set forth by and under the supervision and responsibility of the Board of Trustees (the “Board”), which established the following approach to valuation, as described more fully below: (i) investments for which market quotations are readily available shall be valued at such unadjusted quoted prices and (ii) all other investments for which market quotations are not readily available shall be valued at their fair value as determined in good faith by the Board.
The Administrator has established the J.P. Morgan Asset Management Americas Valuation Committee (“AVC”) to assist the Board with the oversight and monitoring of the valuation of the Fund’s investments. The Administrator implements the valuation policies of the Fund’s investments, as directed by the Board. The AVC oversees and carries out the policies for the valuation of investments held in the Fund. This includes monitoring the appropriateness of fair values based on results of ongoing valuation oversight, including but not limited to consideration of macro or security specific events, market events and pricing vendor and broker due diligence. The Administrator is responsible for discussing and assessing the potential impacts to the fair values on an ongoing basis, and at least on a quarterly basis with the AVC and the Board.
A market-based approach is primarily used to value the Fund’s investments. Investments for which market quotations are not readily available are fair valued by approved affiliated and unaffiliated pricing vendors or third party broker-dealers (collectively referred to as “Pricing Services”) or may be internally fair valued using methods set forth by the valuation policies approved by the Board. This may include related or comparable assets or liabilities, recent transactions, market multiples, book values and other relevant information for the investment to determine the fair value of the investment. An income-based valuation approach may be used in which the anticipated future cash flows of the investment are discounted to calculate the fair value. Discounts may also be applied due to the nature or duration of any restrictions on the disposition of the investments. Valuations may be based upon current market prices of securities that are comparable in coupon, rating, maturity and industry. It is possible that the estimated values may differ significantly from the values that would have been used, had a ready market for the investments existed, and such differences could be material.
Fixed income instruments are valued based on prices received from Pricing Services. The Pricing Services use multiple valuation techniques to determine the valuation of fixed income instruments. In instances where sufficient market activity exists, the Pricing Services may utilize a market-based approach through which trades or quotes from market makers are used to determine the valuation of these instruments. In instances where sufficient market activity may not exist, the Pricing Services also utilize proprietary valuation models which may consider market transactions in comparable securities and the various relationships between securities in determining fair value and/or market characteristics in order to estimate the relevant cash flows, which are then discounted to calculate the fair values.
Equities and other exchange-traded instruments are valued at the last sale price or official market closing price on the primary exchange on which the instrument is traded before the net asset values (“NAV”) of the Fund is calculated on a valuation date.
Investments in open-end investment companies (the “Underlying Funds”), are valued at each Underlying Fund’s NAV per share as of the report date.
25
Futures and options are generally valued on the basis of available market quotations. Swaps and other derivatives are valued utilizing market quotations from approved Pricing Services.
Valuations reflected in this report are as of the report date. As a result, changes in valuation due to market events and/or issuer related events after the report date and prior to issuance of the report are not reflected herein.
The various inputs that are used in determining the valuation of the Fund’s investments are summarized into the three broad levels listed below.
| • | | Level 1 — Unadjusted inputs using quoted prices in active markets for identical investments. |
| • | | Level 2 — Other significant observable inputs including, but not limited to, quoted prices for similar investments, inputs other than quoted prices that are observable for investments (such as interest rates, prepayment speeds, credit risk, etc.) or other market corroborated inputs. |
| • | | Level 3 — Significant inputs based on the best information available in the circumstances, to the extent observable inputs are not available (including the Fund’s assumptions in determining the fair value of investments). |
A financial instrument’s level within the fair value hierarchy is based on the lowest level of any input, both individually and in the aggregate, that is significant to the fair value measurement. The inputs or methodology used for valuing instruments are not necessarily an indication of the risk associated with investing in those instruments.
The following tables represent each valuation input as presented on the Schedule of Portfolio Investments (“SOI”):
| | | | | | | | | | | | | | | | |
| | | Level 1
Quoted prices | | | Level 2
Other significant observable
inputs | | | Level 3
Significant unobservable
inputs | | | Total | |
| | | | |
Total Investments in Securities (a) | | $ | 940,554 | | | $ | 24,323,894 | | | $ | – | | | $ | 25,264,448 | |
| | | | |
Appreciation in Other Financial Instruments | | | | | | | | | | | | | | | | |
Forward Foreign Currency Exchange Contracts | | | – | | | | 9,025 | | | | – | | | | 9,025 | |
Futures Contracts | | | 3,405 | | | | – | | | | – | | | | 3,405 | |
Swaps | | | – | | | | – | | | | – | | | | – | |
| | | | |
Total Appreciation in Other Financial Instruments | | $ | 3,405 | | | $ | 9,025 | | | $ | – | | | $ | 12,430 | |
| | | | |
Depreciation in Other Financial Instruments | | | | | | | | | | | | | | | | |
Forward Foreign Currency Exchange Contracts | | | – | | | | (21,777) | | | | – | | | | (21,777) | |
Futures Contracts | | | (5,925 | ) | | | – | | | | – | | | | (5,925) | |
Swaps | | | – | | | | (2,941) | | | | – | | | | (2,941) | |
| | | | |
Total Depreciation in Other Financial Instruments | | $ | (5,925 | ) | | $ | (24,718) | | | $ | – | | | $ | (30,643) | |
| | | | |
(a) Portfolio holdings designated as level 1 and level 2 are disclosed individually on the SOI. Level 1 consists of a money market mutual fund that is held for daily investments of cash. Please refer to the SOI for industry specifics of portfolio holdings.
B. Restricted Securities — Certain securities held by the Fund may be subject to legal or contractual restrictions on resale. Restricted securities generally are resold in transactions exempt from registration under the Securities Act of 1933 (the “Securities Act”). Disposal of these securities may involve time-consuming negotiations and expense. Prompt sale at the current valuation may be difficult and could adversely affect the net assets of the Fund.
As of August 31, 2016, the Fund had no investments in restricted securities other than securities sold to the Fund under Rule 144A and/or Regulation S under the Securities Act.
C. Loan Assignments — The Fund invested in debt instruments that are interests in amounts owed to lenders or lending syndicates (a “Lender”) by corporate, governmental, or other borrowers (a “Borrower”). A loan is often administered by a bank or other financial institution (the “Agent”) that acts as Agent for all holders. The Agent administers the terms of the loan, as specified in the loan agreement. The Fund invests in loan assignments of all or a portion of the loans. When a fund purchases a loan assignment, the fund has direct rights against the Borrower on a loan, provided, however, the fund’s rights may be more limited than the Lender from which it acquired the assignment and the fund may be able to enforce its rights only through the Agent. As a result, a fund assumes the credit risk of the Borrower as well as any other persons interpositioned between the fund and the Borrower (“Intermediate Participants”). A fund may incur certain costs and delays in realizing payment on a loan assignment or suffer a loss of principal and/or interest if assets or interests held by the Agent or other Intermediate Participants are determined to be subject to the claims of the Agent’s or other Intermediate Participant’s creditors. In addition, it is unclear whether loan assignments and other forms of direct indebtedness offer securities law protections against fraud and misrepresentation. Also, because JPMIM may wish to invest in publicly traded securities of a Borrower, it may not have access to material non-public information regarding the Borrower to which other investors have access. Although certain loan assignments are secured by collateral, a fund could experience delays or limitations in realizing the value on such collateral or have its interest subordinated to other indebtedness of the Borrower. Loan assignments are vulnerable to market conditions such that economic conditions or other events may reduce the demand for assignments and certain assignments that were liquid, when purchased, may become illiquid and they may be difficult to value. In addition, the settlement period for loans is uncertain as there is no standardized settlement schedule applicable to such investments. Therefore, a fund may not receive the proceeds from a sale of such investments for a period after the sale.
26
Certain loan assignments are also subject to the risks associated with high yield securities described under Note 7.
D. Derivatives — The Fund used derivative instruments including futures, forward foreign currency exchange contracts, options and swaps, in connection with its investment strategies. Derivative instruments may be used as substitutes for securities in which the Fund can invest, to hedge portfolio investments or to generate income or gain to the Fund. Derivatives may also be used to manage duration, sector and yield curve exposures and credit and spread volatility.
The Fund may be subject to various risks from the use of derivatives including the risk that changes in the value of a derivative may not correlate perfectly with the underlying asset, rate or index; counterparty credit risk related to derivatives counterparties’ failure to perform under contract terms; liquidity risk related to the lack of a liquid market for these contracts allowing a Fund to close out its position(s); and, documentation risk relating to disagreement over contract terms. Investing in certain derivatives also results in a form of leverage and as such, the Fund’s risk of loss associated with these instruments may exceed their value, as recorded on the Statement of Assets and Liabilities.
The Fund is party to various derivative contracts governed by International Swaps and Derivatives Association master agreements (“ISDA agreements”). The Fund’s ISDA agreements, which are separately negotiated with each dealer counterparty, may contain provisions allowing, absent other considerations, a counterparty to exercise rights, to the extent not otherwise waived, against the Fund in the event the Fund’s net assets decline over time by a pre-determined percentage or fall below a pre-determined floor. The ISDA agreements may also contain provisions allowing, absent other conditions, the Fund to exercise rights, to the extent not otherwise waived, against the counterparties (i.e., decline in a counterparty’s credit rating below a specified level). Such rights for both the counterparty and Fund often includes the ability to terminate (i.e., close out) open contracts at prices which may favor the counterparty, which could have an adverse effect on the Fund. The ISDA agreements give the Fund and counterparty the right, upon an event of default, to close out all transactions traded under such agreements and to net amounts owed or due across all transactions and offset such net payable or receivable with collateral posted to a segregated account by one party to the other.
Counterparty credit risk may be mitigated to the extent a counterparty posts collateral for mark to market gains to the Fund.
Notes D(1) — D(4) below describe the various derivatives used by the Fund.
(1). Options — The Fund purchased put and call options on various instruments including futures and securities to manage and hedge interest rate risks within its portfolio and also to gain long or short exposure to the underlying instrument, index, currency or rate. A purchaser of a put option has the right, but not the obligation, to sell the underlying instrument at an agreed upon price (“strike price”) to the option seller. A purchaser of a call option has the right, but not the obligation, to purchase the underlying instrument at the strike price from the option seller. Swaptions and Eurodollar options are settled for cash.
Options Purchased — Premiums paid by the Fund for options purchased are included on the Statement of Assets and Liabilities as an investment. The option is adjusted daily to reflect the current market value of the option and the change is recorded as Change in net unrealized appreciation/depreciation of investments in non-affiliates on the Statement of Operations. If the option is allowed to expire, the Fund will lose the entire premium it paid and record a realized loss for the premium amount. Premiums paid for options purchased which are exercised or closed are added to the amounts paid or offset against the proceeds on the underlying investment transaction to determine the realized gain (loss) or cost basis of the underlying investment.
The Fund’s exchange traded option contracts are not subject to master netting arrangements (the right to close out all transactions traded with a counterparty and net amounts owed or due across transactions).
(2). Futures Contracts — The Fund used treasury, index or other financial futures contracts to manage and hedge interest rate risk associated with portfolio investments. The Fund also used futures contracts to lengthen or shorten the duration of the overall investment portfolio.
Futures contracts provide for the delayed delivery of the underlying instrument at a fixed price or are settled for a cash amount based on the change in the value of the underlying instrument at a specific date in the future. Upon entering into a futures contract, the Fund is required to deposit with the broker, cash or securities in an amount equal to a certain percentage of the contract amount, which is referred to as the initial margin deposit. Subsequent payments, referred to as variation margin, are made or received by the Fund periodically and are based on changes in the market value of open futures contracts. Changes in the market value of open futures contracts are recorded as Change in net unrealized appreciation/depreciation on the Statement of Operations. Realized gains or losses, representing the difference between the value of the contract at the time it was opened and the value at the time it was closed, are reported on the Statement of Operations at the closing or expiration of the futures contract. Securities deposited as initial margin are designated on the SOI and cash deposited is recorded on the Statement of Assets and Liabilities. A receivable from and/or a payable to brokers for the daily variation margin is also recorded on the Statement of Assets and Liabilities.
The use of futures contracts exposes the Fund to interest rate and equity price risk. The Fund may be subject to the risk that the change in the value of the futures contract may not correlate perfectly with the underlying instrument. Use of long futures contracts subjects the Fund to risk of loss in excess of the amounts shown on the Statement of Assets and Liabilities, up to the notional amount of the futures contracts. Use of short futures contracts subjects the Fund to unlimited risk of loss. The Fund may enter into futures contracts only on exchanges or boards of trade. The exchange or board of trade acts as the counterparty to each futures transaction; therefore, the Fund’s credit risk is limited to failure of the exchange or board of trade. Under some circumstances, futures exchanges may establish daily limits on the amount that the price of a futures contract can vary from the previous day’s settlement price, which could effectively prevent liquidation of positions.
The Fund’s futures contracts are not subject to master netting arrangements (the right to close out all transactions traded with a counterparty and net amounts owed or due across transactions).
27
(3). Forward Foreign Currency Exchange Contracts — The Fund may be exposed to foreign currency risks associated with portfolio investments and therefore, at times, used forward foreign currency exchange contracts to hedge or manage these exposures. The Fund also bought forward foreign currency exchange contracts to gain exposure to currencies. Forward foreign currency exchange contracts represent obligations to purchase or sell foreign currency on a specified future date at a price fixed at the time the contracts are entered into. Non-deliverable forward foreign currency exchange contracts are settled with the counterparty in U.S. Dollar without the delivery of foreign currency.
The values of the forward foreign currency exchange contracts are adjusted daily based on the applicable exchange rate of the underlying currency. Changes in the value of these contracts are recorded as unrealized appreciation or depreciation until the contract settlement date. When the forward foreign currency exchange contract is closed, the Fund records a realized gain or loss equal to the difference between the value at the time the contract was opened and the value at the time it was closed. The Fund also records a realized gain or loss when a forward foreign currency exchange contract offsets another forward foreign currency exchange contract with the same counterparty upon settlement.
The Fund’s forward foreign currency exchange contracts are subject to master netting arrangements (the right to close out all transactions with a counterparty and net amounts owed or due across transactions). As of August 31, 2016, the Fund did not receive or post collateral for forward foreign currency exchange contracts.
(4). Swaps — The Fund engaged in various swap transactions, including credit default, interest rate and return swaps, to manage credit and interest rate (e.g., duration, yield curve) risks within its portfolio. The Fund also used swaps as alternatives to direct investments. Swap transactions are negotiated contracts over the counter (“OTC swaps”) between the fund and a counterparty or centrally cleared (“centrally cleared swaps”) with a central clearinghouse through a Futures Commission Merchant (“FCM”), to exchange investment cash flows, assets, foreign currencies or market-linked returns at specified, future intervals.
Upfront payments made and/or received are recorded as assets or liabilities, respectively on the Statement of Assets and Liabilities and amortized over the term of the swap. The value of an OTC swap agreement is recorded as either an asset or a liability on the Statement of Assets and Liabilities at the beginning of the measurement period. Upon entering into a centrally cleared swap, the Fund is required to deposit with the FCM cash or securities, which is referred to as initial margin deposit. Securities deposited as initial margin are designated on the SOI and cash deposited is recorded on the Statement of Assets and Liabilities. Daily changes in valuation of centrally cleared swaps, if any, are recorded as a variation margin receivable or payable on the Statement of Assets and Liabilities. The change in the value of swaps, including accruals of periodic amounts of interest to be paid or received on swaps, is reported as change in net unrealized appreciation/depreciation on the Statement of Operations. A realized gain or loss is recorded upon payment or receipt of a periodic payment or payment made upon termination of a swap agreement.
The Fund may be required to post or receive collateral based on the net value of the Fund’s outstanding OTC swap contracts with the counterparty in the form of cash or securities. Daily movement of cash collateral is subject to minimum threshold amounts. Collateral posted by the Fund is held in a segregated account at the Fund’s custodian bank.
The Fund’s swap contracts (excluding centrally cleared swaps) are subject to master netting arrangements.
Credit Default Swaps
The Fund entered into credit default swaps to simulate long and short bond positions or to take an active long or short position with respect to the likelihood of a default or credit event by the issuer of the underlying reference obligation.
The underlying reference obligation may be a single issuer of corporate or sovereign debt, a basket of issuers or a credit index. A credit index is a list of credit instruments or exposures that reference a fixed number of obligors with shared characteristics that represents some part of the credit market as a whole. Index credit default swaps have standardized terms including a fixed spread and standard maturity dates. The composition of the obligations within a particular index changes periodically.
Credit default swaps involve one party, the protection buyer, making a stream of payments to another party, the protection seller, in exchange for the right to receive a contingent payment if there is a credit event related to the underlying reference obligation. In the event that the reference obligation matures prior to the termination date of the contract, a similar security will be substituted for the duration of the contract term. Credit events are defined under individual swap agreements and generally include bankruptcy, failure to pay, restructuring, repudiation/moratorium, obligation acceleration and obligation default.
If a credit event occurs, the Fund, as protection sellers, would be obligated to make a payment, which may be either: (i) a net cash settlement equal to the notional amount of the swap less the auction value of the reference obligation or (ii) the notional amount of the swap in exchange for the delivery of the reference obligation. Selling protection effectively adds leverage to a Fund’s portfolio up to the notional amount of swap agreements. The notional amount represents the maximum potential liability under a contract and is not reflected on the Statement of Assets and Liabilities. Potential liabilities under these contracts may be reduced by: the auction rates of the underlying reference obligations; upfront payments received at the inception of a swap; and net amounts received from credit default swaps purchased with the identical reference obligation.
28
(5). Summary of Derivatives Information
The following table presents the value of derivatives held as of August 31, 2016, by their primary underlying risk exposure and respective location on the Statement of Assets and Liabilities:
| | | | | | | | | | | | | | | | | | | | | | |
| Derivative Contracts | | Statement of
Assets and
Liabilities
Location | | | | | | | | | | | | | | | |
| |
| Gross Assets: | | | | Options (a) | | | Futures
Contracts (b) | | | Forward
Foreign
Currency
Exchange
Contracts | | | Centrally
Cleared
Swaps (c) | | | Total | |
| |
Interest rate contracts | | Receivables, Net Assets — Unrealized Appreciation | | $ | — | | | $ | 3,405 | | | $ | — | | | $ | — | | | $ | 3,405 | |
Foreign exchange contracts | | Receivables | | | — | | | | — | | | | 9,025 | | | | — | | | | 9,025 | |
Credit contracts | | Receivables | | | 2,660 | | | | — | | | | — | | | | — | | | | 2,660 | |
| | | | | | | | | | | | | | | | | | | | | | |
Total | | | | $ | 2,660 | | | $ | 3,405 | | | $ | 9,025 | | | $ | — | | | $ | 15,090 | |
| | | | | | | | | | | | | | | | | | | | | | |
| | | | | | |
Gross Liabilities: | | | | | | | | | | | | | | | | | | | | | | |
Interest rate contracts | | Payables, Net Assets — Unrealized Depreciation | | $ | — | | | $ | (5,925) | | | $ | — | | | $ | — | | | $ | (5,925) | |
Foreign exchange contracts | | Payables | | | — | | | | — | | | | (21,777) | | | | — | | | | (21,777) | |
Credit contracts | | Payables | | | — | | | | — | | | | — | | | | (13,658) | | | | (13,658) | |
| | | | | | | | | | | | | | | | | | | | | | |
Total | | | | $ | — | | | $ | (5,925) | | | $ | (21,777) | | | $ | (13,658) | | | $ | (41,360) | |
| | | | | | | | | | | | | | | | | | | | | | |
| (a) | The market value of options purchased is reported as Investments in non-affiliates, at value on the Statement of Assets and Liabilities. |
| (b) | This amount represents the cumulative appreciation (depreciation) of futures contracts as reported on the SOI. The Statement of Assets and Liabilities only reflect the current day variation margin receivable/payable from/to brokers. |
| (c) | This amount represents the value of centrally cleared swaps as reported on the SOI. The Statement of Assets and Liabilities only reflect the current day variation margin receivable/payable from/to brokers. |
The following tables present the effect of derivatives on the Statement of Operations for the period ended August 31, 2016, by primary underlying risk exposure:
| | | | | | | | | | | | | | | | | | | | |
| Amount of Realized Gain (Loss) on Derivatives Recognized on the Statement of Operations | |
| |
Derivative Contracts | | Options | | | Futures Contracts | | | Forward Foreign
Currency Exchange
Contracts | | | Swaps | | | Total | |
Interest rate contracts | | $ | — | | | $ | (7,413) | | | $ | — | | | $ | — | | | $ | (7,413) | |
Foreign exchange contracts | | | — | | | | — | | | | 12,182 | | | | — | | | | 12,182 | |
Credit contracts | | | — | | | | — | | | | — | | | | (2,303) | | | | (2,303) | |
| | | | | | | | | | | �� | | | | | | | | | |
Total | | $ | — | | | $ | (7,413) | | | $ | 12,182 | | | $ | (2,303) | | | $ | 2,466 | |
| | | | | | | | | | | | | | | | | | | | |
|
Amount of Change in Unrealized Appreciation (Depreciation) on Derivatives Recognized on the Statement
of Operations | |
| |
Derivative Contracts | | Options | | | Futures Contracts | | | Forward Foreign
Currency Exchange
Contracts | | | Swaps | | | Total | |
Interest rate contracts | | $ | (1,068) | | | $ | (2,520) | | | $ | — | | | $ | — | | | $ | (3,588) | |
Foreign exchange contracts | | | — | | | | — | | | | (12,752) | | | | — | | | | (12,752) | |
Credit contracts | | | — | | | | — | | | | — | | | | (2,941) | | | | (2,941) | |
| | | | | | | | | | | | | | | | | | | | |
Total | | $ | (1,068) | | | $ | (2,520) | | | $ | (12,752) | | | $ | (2,941) | | | $ | (19,281) | |
| | | | | | | | | | | | | | | | | | | | |
Derivatives Volume
The tables below disclose the volume of the Fund’s futures contracts, forward foreign currency exchange contracts, options and swaps activity during the period ended August 31, 2016. Please refer to the tables in the Summary of Derivatives Information for derivative-related gains and losses associated with volume activity.
| | | | |
| |
Futures Contracts: | | | | |
Average Notional Balance Long | | $ | 3,984,688 (a) | |
Average Notional Balance Short | | | 5,123,338 (a) | |
Ending Notional Balance Long | | | 3,716,813 | |
29
| | | | |
| |
Ending Notional Balance Short | | | 5,183,112 | |
Forward Foreign Currency Exchange Contracts: | | | | |
Average Settlement Value Purchased | | | 2,274,180 (a) | |
Average Settlement Value Sold | | | 6,665,473 (a) | |
Ending Value Purchased | | | 4,499,924 | |
Ending Value Sold | | | 8,968,097 | |
Swaptions & OTC Options: | | | | |
Average Notional Balance Purchased | | | 2,550,000(a) | |
Ending Notional Balance Purchased | | | 2,550,000 | |
Credit Default Swaps: | | | | |
Average Notional Balance — Buy Protection | | | 250,000 (a) | |
Ending Notional Balance — Buy Protection | | | 250,000 | |
(a) For the periods July 1, 2016 through August 31, 2016.
The Fund’s derivatives contracts held at August 31, 2016 are not accounted for as hedging instruments under GAAP.
E. Foreign Currency Translation — The books and records of the Fund are maintained in U.S. dollars. Foreign currency amounts are translated into U.S. dollars at the prevailing exchange rates of such currencies against the U.S. dollar. The market value of investment securities and other assets and liabilities are translated at the exchange rate as of the valuation date. Purchases and sales of investment securities, income and expenses are translated at the exchange rate prevailing on the respective dates of such transactions.
The Fund does not isolate the effect of changes in foreign exchange rates from changes in market prices on securities held. Accordingly, such changes are included within Change in net unrealized appreciation/depreciation on investments on the Statement of Operations.
Reported realized foreign currency gains and losses arise from the disposition of foreign currency, currency gains or losses realized between the trade and settlement dates on securities transactions, and the difference between the amounts of dividends, interest and foreign withholding taxes recorded on each Fund’s books on the transaction date and the U.S. dollar equivalent of the amounts actually received or paid. These reported realized foreign currency gains and losses are included in Net realized gain (loss) on foreign currency transactions on the Statement of Operations. Unrealized foreign currency gains and losses arise from changes (due to changes in exchange rates) in the value of foreign currency and other assets and liabilities denominated in foreign currencies, which are held at year end are included in Change in net unrealized appreciation/depreciation on foreign currency translations on the Statement of Operations.
F. Offering and Organizational Costs — Total offering costs of $77,080 incurred in connection with the offering of shares of the Fund are amortized on a straight line basis over 12 months from the date the Fund commenced operations. Costs paid in connection with the organization of the Fund, if any, were recorded as an expense at the time the Fund commenced operations and are included as part of Professional fees on the Statement of Operations. For the period ended August 31, 2016, total offering costs amortized were $12,684.
G. Security Transactions and Investment Income — Investment transactions are accounted for on the trade date (the date the order to buy or sell is executed). Securities gains and losses are calculated on a specifically identified cost basis. Interest income and interest expense on securities sold short, if any, is determined on the basis of coupon interest accrued using the effective interest method which adjusts for amortization of premiums and accretion of discounts. Dividend income net of foreign tax withheld, if any, is recorded on the ex-dividend date or when the Fund first learns of the dividend.
H. Foreign Taxes — The Fund may be subject to foreign taxes on income, gains on investments or currency purchases/repatriation, a portion of which may be recoverable. The Fund will accrue such taxes and recoveries as applicable, based upon its current interpretation of tax rules and regulations that exist in the markets in which it invests.
I. Allocation of Income and Expenses — Expenses directly attributable to a fund are charged directly to that fund, while the expenses attributable to more than one fund of the Trust are allocated among the respective funds. In calculating the NAV of each class, investment income, realized and unrealized gains and losses and expenses, other than class specific expenses, are allocated daily to each class of shares based upon the proportion of net assets of each class at the beginning of each day.
Transfer agency fees are class-specific expenses. The amount of the transfer agency fees charged to each class of the Fund for the period ended August 31, 2016 are as follows:
| | | | | | | | | | | | | | | | |
| | | Class A | | | Class C | | | Class R6 | | Select Class | | Total | |
| |
Transfer agency fees | | | $ 58 | | | | $ 57 | | | $ 58 | | $ 60 | | | $ 233 | |
J. Federal Income Taxes — The Fund is treated as a separate taxable entity for Federal income tax purposes. The Fund’s policy is to comply with the provisions of the Internal Revenue Code of 1986, as amended (the “Code”), applicable to regulated investment companies and to distribute to shareholders all of its distributable net investment income and net realized capital gains on investments. Accordingly, no provision for Federal income tax is necessary. Management has reviewed the Fund’s tax positions for all open tax years and has determined that as of August 31, 2016, no liability for income tax is required in the Fund’s financial statements for net unrecognized tax benefits. However, management’s conclusions may be subject to future review based on changes in, or the interpretation of, the accounting standards or tax laws and regulations. The Fund’s Federal tax returns for the prior three fiscal years, or since inception if shorter, remains subject to examination by the Internal Revenue Service.
30
M. Distributions to Shareholders — Distributions from net investment income are generally declared and paid monthly and are declared separately for each class. No class has preferential dividend rights; differences in per share rates are due to differences in separate class expenses. Net realized capital gains, if any, are distributed by each Fund at least annually. The amount of distributions from net investment income and net realized capital gains is determined in accordance with Federal income tax regulations, which may differ from GAAP. To the extent these “book/tax” differences are permanent in nature (i.e., that they result from other than timing of recognition — “temporary differences”), such amounts are reclassified within the capital accounts based on their Federal tax-basis treatment.
3. Fees and Other Transactions with Affiliates
A. Investment Advisory Fee — Pursuant to an Investment Advisory Agreement, the Adviser supervises the investments of the Fund and for such services is paid a fee. The fee is accrued daily and paid monthly at an annual rate of 0.50% of the Fund’s average daily net assets.
The Adviser waived Investment Advisory fees and/or reimbursed expenses as outlined in Note 3.G.
B. Administration Fee — Pursuant to an Administration Agreement, the Administrator provides certain administration services to the Fund. In consideration of these services, the Administrator receives a fee accrued daily and paid monthly at an annual rate of 0.15% of the first $25 billion of the average daily net assets of all funds in the J.P. Morgan Funds Complex covered by the Administration Agreement (excluding certain funds of funds and money market funds) and 0.075% of the average daily net assets in excess of $25 billion of all such funds. For the period ended August 31, 2016, the effective annualized rate was 0.08% of the Fund’s average daily net assets, notwithstanding any fee waivers and/or expense reimbursements.
The Administrator waived Administration fees as outlined in Note 3.G.
JPMCB, a wholly-owned subsidiary of JPMorgan, serves as the Fund’s sub-administrator (the “Sub-administrator”). For its services as Sub-administrator, JPMCB receives a portion of the fees payable to the Administrator.
C. Distribution Fees — Pursuant to a Distribution Agreement, JPMorgan Distribution Services, Inc. (the “Distributor”), a wholly-owned subsidiary of JPMorgan, serves as the Trust’s exclusive underwriter and promotes and arranges for the sale of the Fund’s shares.
The Board has adopted a Distribution Plan (the “Distribution Plan”) for Class A and Class C Shares of the Fund in accordance with Rule 12b-1 under the 1940 Act. The Distribution Plan provides that the Fund shall pay distribution fees, including payments to the Distributor, at annual rates of 0.25% and 0.75% of the average daily net assets of Class A and Class C Shares, respectively.
In addition, the Distributor is entitled to receive the front-end sales charges from purchases of Class A Shares and the CDSC from redemptions of Class C Shares and certain Class A Shares for which front-end sales charges have been waived. For the period ended August 31, 2016, the Distributor did not retain any front-end sales charges or CDSC.
D. Shareholder Servicing Fees — The Trust, on behalf of the Fund, has entered into a Shareholder Servicing Agreement with the Distributor under which the Distributor provides certain support services to the shareholders. The Class R6 Shares do not charge a shareholder servicing fee. For performing these services, the Distributor receives a fee that is accrued daily and paid monthly equal to a percentage of the average daily net assets as shown in the table below:
| | | | | | | | | | | | |
| | | Class A | | | Class C | | | Select Class | |
| |
| | | 0.25% | | | | 0.25% | | | | 0.25% | |
The Distributor has entered into shareholder services contracts with affiliated and unaffiliated financial intermediaries who provide shareholder services and other related services to their clients or customers who invest in the Fund under which the Distributor will pay all or a portion of such fees earned to financial intermediaries for performing such services.
The Distributor waived shareholder servicing fees as outlined in Note 3.G.
E. Custodian and Accounting Fees — JPMCB provides portfolio custody and accounting services to the Fund. For performing these services, the Fund pays JPMCB transaction and asset-based fees that vary according to the number of transactions and positions, plus out-of-pocket expenses. The amounts paid directly to JPMCB by the Fund for custody and accounting services are included in Custodian and accounting fees on the Statement of Operations. Payments to the custodian may be reduced by credits earned by the Fund, based on uninvested cash balances held by the custodian. Such earnings credits, if any, are presented separately on the Statement of Operations.
Interest income earned on cash balances at the custodian, if any, is included in Interest income from affiliates on the Statement of Operations.
Interest expense paid to the custodian related to cash overdrafts, if any, is included in Interest expense to affiliates on the Statement of Operations.
F. Collateral Management Fees — JPMCB provides derivatives collateral management services for the Fund. The amounts paid directly to JPMCB by the Fund for these services are included in Collateral management fees on the Statement of Operations.
31
G. Waivers and Reimbursements — The Adviser, Administrator and/or Distributor have contractually agreed to waive fees and/or reimburse the Fund to the extent that total annual operating expenses (excluding acquired fund fees and expenses other than certain money market fund fees as described below, dividend and interest expenses related to short sales, interest, taxes, expenses related to litigation and potential litigation, and extraordinary expenses) exceed the percentages of the Fund’s average daily net assets as shown in the table below:
| | | | | | | | | | | | | | | | |
| | | Class A | | | Class C | | | Class R6 | | | Select Class | |
| |
| | | 1.15% | | | | 1.65% | | | | 0.65% | | | | 0.90% | |
The expense limitation agreement was in effect for the period ended August 31, 2016 and is in place until at least May 31, 2017.
For the period ended August 31, 2016, the Fund’s service providers waived fees and/or reimbursed expenses for the Fund as follows. None of these parties expect the Fund to repay any such waived fees and/or reimbursed expenses in future years.
| | | | | | | | | | |
| | | Contractual Waivers | | |
| | | Investment Advisory | | Administration | | Shareholder
Servicing | | Total | | Reimbursements |
|
| | $21,339 | | $3,495 | | $77 | | $24,911 | | $28,072 |
Additionally, the Fund may invest in one or more money market funds advised by the Adviser or its affiliates (affiliated money market funds). The Adviser, Administrator and/or Distributor, as shareholder servicing agent, have contractually agreed to waive fees and/or reimburse expense in an amount sufficient to offset the respective net fees each collects from the affiliated money market funds on the Fund’s investment in such affiliated money market funds.
The amounts of these waivers/reimbursements resulting from investments in these money market funds for the period ended August 31, 2016 was $1,967.
H. Other — Certain officers of the Trust are affiliated with the Adviser, the Administrator and the Distributor. Such officers, with the exception of the Chief Compliance Officer, receive no compensation from the Fund for serving in their respective roles.
The Board appointed a Chief Compliance Officer to the Fund in accordance with Federal securities regulations. Each Fund, along with other affiliated funds, makes reimbursement payments, on a pro-rata basis, to the Administrator for a portion of the fees associated with the Office of the Chief Compliance Officer. Such fees are included in Trustees’ and Chief Compliance Officer’s fees on the Statement of Operations.
The Trust adopted a Trustee Deferred Compensation Plan (the “Plan”) which allows the Independent Trustees to defer the receipt of all or a portion of compensation related to performance of their duties as Trustees. The deferred fees are invested in various J.P. Morgan Funds until distribution in accordance with the Plan.
During the period ended August 31, 2016, the Fund purchased securities from an underwriting syndicate in which the principal underwriter or members of the syndicate are affiliated with the Adviser.
The Fund may use related party broker-dealers. For the period ended August 31, 2016, the Fund did not incur any brokerage commissions with broker-dealers affiliated with the Adviser.
The Securities and Exchange Commission (“SEC”) has granted an exemptive order permitting the Fund to engage in principal transactions with J.P. Morgan Securities, Inc., an affiliated broker, involving taxable money market instruments, subject to certain conditions.
4. Investment Transactions
During the period ended August 31, 2016, purchases and sales of investments (excluding short-term investments) were as follows:
| | | | | | | | | | | | | | | | |
| | | Purchases (excluding
U.S. Government) | | | Sales (excluding
U.S. Government) | | | Purchases of U.S.
Government | | | Sales of U.S.
Government | |
| |
| | $ | 24,860,950 | | | $ | 1,605,437 | | | $ | 29,675 | | | $ | - | |
5. Federal Income Tax Matters
For Federal income tax purposes, the estimated cost and unrealized appreciation (depreciation) in value of investment securities held at August 31, 2016 were as follows:
| | | | | | | | | | | | | | | | |
| | | Aggregate Cost | | | Gross Unrealized
Appreciation | | | Gross
Unrealized
Depreciation | | | Net Unrealized
Appreciation
(Depreciation) | |
| |
| | | $ 24,974,483 | | | | $ 325,453 | | | | $ 35,488 | | | | $ 289,965 | |
6. Borrowings
The Fund relies upon an exemptive order granted by the SEC (the “Order”) permitting the establishment and operation of an Interfund Lending Facility (the “Facility”). The Facility allows the Fund to directly lend and borrow money to or from any other fund relying upon the Order at rates beneficial to both the borrowing and lending funds. Advances under the Facility are taken primarily for temporary or emergency purposes, including the meeting of redemption requests that otherwise might require the untimely disposition of securities, and are subject to each Fund’s borrowing restrictions. The Interfund loan rate is determined, as specified in the Order, by averaging the current repurchase agreement rate and the current bank loan rate. The Order was granted to JPMorgan Trust II and may be relied upon by the Fund because the Fund and the series of JPMorgan Trust II are all investment companies in the same “group of investment companies” (as defined in Section 12(d)(1)(G) of the 1940 Act).
32
In addition, the Trust and JPMCB have entered into a financing arrangement. Under this arrangement, JPMCB provides an unsecured, uncommitted credit facility in the aggregate amount of $100 million to certain of the J.P. Morgan Funds, including the Fund. Advances under the arrangement are taken primarily for temporary or emergency purposes, including the meeting of redemption requests that otherwise might require the untimely disposition of securities, and are subject to each Fund’s borrowing restrictions. Interest on borrowings is payable at a rate determined by JPMCB at the time of borrowing. This agreement has been extended until November 7, 2016.
The Fund had no borrowings outstanding from another fund or from the unsecured, uncommitted credit facility during the period ended August 31, 2016.
7. Risks, Concentrations and Indemnifications
In the normal course of business, the Fund entered into contracts that contain a variety of representations which provide general indemnifications. Each Fund’s maximum exposure under these arrangements is unknown. The amount of exposure would depend on future claims that may be made against each Fund that have not yet occurred. However, based on experience, the Fund expects the risk of loss to be remote.
The Fund’s shares are currently held by the Adviser.
The Fund’s investments in sovereign and corporate debt obligations within emerging market countries may be subject to potentially higher risks than investments in more developed markets and the prices of such investments may be volatile. The yields of emerging market debt obligations reflect, among other things, perceived credit risk. The consequences of political, social or economic instability in these markets may have disruptive effects on the market prices of the Fund’s investments and the income they generate, as well as the Fund’s ability to repatriate such amounts.
The Fund is subject to interest rate and credit risk. The value of debt securities may decline as interest rates increase. The Fund could lose money if the issuer of a fixed income security is unable to pay interest or repay principal when it is due. The Fund invests in floating rate loans and other floating rate debt securities. Although these investments are generally less sensitive to interest rate changes than other fixed rate instruments, the value of floating rate loans and other floating rate investments may decline if their interest rates do not rise as quickly, or as much, as general interest rates. Many factors can cause interest rates to rise. Some examples include central bank monetary policy, rising inflation rates and general economic conditions. Given the historically low interest rate environment, risks associated with rising rates are heightened. The ability of the issuers of debt to meet their obligations may be affected by the economic and political developments in a specific industry or region.
The Fund invests in high yield securities that are not rated or rated below investment grade (commonly known as “junk bonds.”) These securities are considered to be high risk investments. Investments in lower-rated securities or unrated securities of comparable quality tend to be more sensitive to economic conditions than higher rated securities. Junk bonds involve a greater risk of default by the issuer because such securities are generally unsecured and are often subordinated to other creditors’ claims. The market price of these securities can change suddenly and unexpectedly. As a result, the Fund is intended for investors who are able and willing to assume a high degree of risk.
Investing in securities of foreign countries may include certain risks and considerations not typically associated with investing in U.S. securities. These risks include revaluation of currencies, high rates of inflation, repatriation restrictions on income and currencies, and future and adverse political, social and economic developments.
Derivatives may be riskier than other types of investments because they may be more sensitive to changes in economic and market conditions and could result in losses that significantly exceed the Fund’s original investment. Many derivatives create leverage thereby causing the Fund to be more volatile than it would have been if it had not used derivatives. Derivatives also expose the Fund to counterparty risk (the risk that the derivative counterparty will not fulfill its contractual obligations), including credit risk of the derivative counterparty.
The Fund is also subject to counterparty credit risk, which is the risk that a counterparty fails to perform on agreements with the Fund such as swap and option contracts and forward foreign currency exchange contracts.
The Fund will employ various alternative investment strategies that involve the use of complicated investment techniques. There is no guarantee that these strategies will succeed and their use may subject the Fund to greater volatility and loss.
33
SCHEDULE OF SHAREHOLDER EXPENSES
(Unaudited)
Hypothetical $1,000 Investment
As a shareholder of the Fund, you incur two types of costs: (1) transaction costs, including sales charges (loads) on purchase payments and (2) ongoing costs, including investment advisory fees, administration fees, distribution fees and other Fund expenses. The examples below are intended to help you understand your ongoing costs (in dollars) of investing in the Fund and to compare these ongoing costs with the ongoing costs of investing in other mutual funds. The examples assume that you had a $1,000 investment in each Class at the beginning of the reporting period, June 30, 2016, and continued to hold your shares at the end of the reporting period, August 31, 2016.
Actual Expenses
For each Class of the Fund in the table below, the first line provides information about actual account values and actual expenses. You may use the information in this line, together with the amount you invested, to estimate the expenses that you paid over the period. Simply divide your account value by $1,000 (for example, an $8,600 account value divided by $1,000 = 8.6), then multiply the result by the number in the first line of each Class under the heading entitled “Expenses Paid During the Period” to estimate the expenses you paid on your account during this period.
Hypothetical Example for Comparison Purposes
The second line of each Class in the table below provides information about hypothetical account values and hypothetical expenses based on the Class’ actual expense ratio and an assumed rate of return of 5% per year before expenses, which is not the Class’ actual return. The hypothetical account values and expenses may not be used to estimate the actual ending account balance or expenses you paid for the period. You may use this information to compare the ongoing costs of investing in the Class of the Fund and other funds. To do so, compare this 5% hypothetical example with the 5% hypothetical examples that appear in the shareholder reports of the other funds. Please note that the expenses shown in the table are meant to highlight your ongoing costs only and do not reflect any transaction costs, such as sales charges (loads) or redemption fees. Therefore, the second line for each Class in the table is useful in comparing ongoing costs only, and will not help you determine the relative total costs of owning different funds. In addition, if these transaction costs were included, your costs would have been higher. The examples also assume all dividends and distributions have been reinvested.
| | | | | | | | |
| | | Beginning
Account Value
June 30, 2016 | | Ending Account
Value August 31, 2016 | | Expenses Paid
During the Period | | Annualized Expense Ratio |
Flexible Long/Short Fund | | | | | | | | |
Class A | | | | | | | | |
Actual* | | $1,000.00 | | $1,015.60 | | $1.88 | | 1.10% |
Hypothetical** | | 1,000.00 | | 1,019.66 | | 5.60 | | 1.10 |
Class C | | | | | | | | |
Actual* | | 1,000.00 | | 1,014.70 | | 2.74 | | 1.60 |
Hypothetical** | | 1,000.00 | | 1,017.14 | | 8.13 | | 1.60 |
Class R6 | | | | | | | | |
Actual* | | 1,000.00 | | 1,016.40 | | 1.04 | | 0.61 |
Hypothetical** | | 1,000.00 | | 1,022.13 | | 3.11 | | 0.61 |
Select Class | | | | | | | | |
Actual* | | 1,000.00 | | 1,016.00 | | 1.46 | | 0.85 |
Hypothetical** | | 1,000.00 | | 1,020.92 | | 4.33 | | 0.85 |
| | * | Expenses are equal to each Class’ respective annualized expense ratio, multiplied by the average account value over the period, multiplied by 62/365 (to reflect the actual period). The Fund commenced operations on June 30, 2016. | |
| | ** | Expenses are equal to each Class’ respective annualized expense ratio, multiplied by the average account value over the period, multiplied by 184/365 (to reflect the one-half year period). | |
34
BOARD APPROVAL OF INVESTMENT ADVISORY AGREEMENT (Unaudited)
The Board of Trustees has established various standing committees composed of Trustees with diverse backgrounds, to which the Board of Trustees has assigned specific subject matter responsibilities to further enhance the effectiveness of the Board’s oversight and decision making. The Board of Trustees and its investment subcommittees (money market and alternative products, equity, and fixed income) meet regularly throughout the year and consider factors that are relevant to their annual consideration of investment advisory agreements at each meeting. They also meet for the specific purpose of considering approvals of initial advisory agreements for new funds. At their November 2015 in-person meeting, the Trustees, including a majority of the Trustees who are not “interested persons” (as defined in the 1940 Act) of any party to the initial advisory agreement or any of their affiliates (“Independent Trustees”), approved the initial investment advisory agreement (the “New Advisory Agreement”) for the Fund whose semi-annual report is contained herein.
In connection with the approval of the New Advisory Agreement, the Trustees reviewed written materials prepared by the Adviser and received oral presentations from Adviser personnel. Before voting on the proposed New Advisory Agreement, the Trustees reviewed the New Advisory Agreement with representatives of the Adviser and with counsel to the Trust and independent legal counsel and received a memorandum from independent legal counsel to the Trustees discussing the legal standards for their consideration of the proposed agreement. The Trustees also discussed the proposed agreement in an executive session with independent legal counsel at which no representatives of the Adviser were present. Set forth below is a summary of the material factors evaluated by the Trustees in determining whether to approve the New Advisory Agreement.
The Trustees considered information provided with respect to the Fund and the approval of the New Advisory Agreement. Each Trustee attributed different weights to the various factors and no factor alone was considered determinative. The Trustees determined that the proposed compensation to be received by the Adviser from the Fund under the New Advisory Agreement was fair and reasonable and that the initial approval of the New Advisory Agreement was in the best interests of the Fund and its potential shareholders.
The factors summarized below were considered and discussed by the Trustees in reaching their conclusions:
Nature, Extent and Quality of Services Provided by the Adviser
In connection with the approval of the New Advisory Agreement, the Trustees considered the materials furnished specifically in connection with the approval of the New Advisory Agreement, as well as other relevant information furnished throughout the year for the J.P. Morgan Funds complex and the Trustees’ experience with the Adviser and its services. The Trustees considered the background and experience of the Adviser’s senior management and investment personnel, as well as the qualifications, backgrounds and responsibilities of the portfolio management team primarily responsible for the day-to-day management of the Fund. The Trustees also considered the investment strategy and investment process for the Fund, and the infrastructure supporting the portfolio management team. In addition, the Trustees considered information about the structure and distribution strategy of the Fund, how it fits within the J.P. Morgan Funds lineup, and how it will be positioned against identified peers.
The Trustees also considered their knowledge of the nature and quality of the services provided by the Adviser to the J.P. Morgan Funds gained from their experience as Trustees of the J.P. Morgan
35
Funds. In addition, they considered the overall reputation and capabilities of the Adviser and its affiliates, the commitment of the Adviser to provide high quality service to the J.P. Morgan Funds, their overall confidence in the Adviser’s integrity and the Adviser’s responsiveness to questions or concerns raised by them, including the Adviser’s willingness to consider and implement organizational and operational changes designed to improve investment results and the services provided to the J.P. Morgan Funds.
Based upon these considerations and other factors, the Trustees concluded that they were satisfied with the nature, extent and quality of the investment advisory services to be provided to the Fund by the Adviser.
Fall-Out Benefits
The Trustees reviewed information regarding potential “fallout” or ancillary benefits received by the Adviser and its affiliates as a result of their relationship with the J.P. Morgan Funds. The Trustees also considered the Adviser’s allocation of fund brokerage for the J.P. Morgan Funds complex, including allocations to brokers who provide research to the Adviser.
The Trustees also considered that JPMorgan Distribution Services, Inc. (“JPMDS”), an affiliate of the Adviser, and J.P. Morgan Investment Management Inc., in its role as administrator (“JPMIM”), will earn fees from the Fund for providing shareholder and administrative services, respectively. The Trustees also considered the payments of Rule 12b-1 fees to JPMDS, which also acts as the Fund’s distributor and that these fees are in turn generally paid to financial intermediaries that sell the Fund, including financial intermediaries that are affiliates of the Adviser. The Trustees also considered the fees paid to JPMorgan Chase Bank, N.A. (“JPMCB”) for custody and fund accounting and other related services. The Trustees also considered that any fall-out benefits would be comparable to those related to the other actively managed funds in the complex and were consistent with the process of approving advisory agreements for new funds.
Economies of Scale
The Trustees considered the extent to which the Fund may benefit from economies of scale. The Trustees considered that there may not be a direct relationship between economies of scale realized by the Fund and those realized by the Adviser as assets increase. The Trustees noted that the proposed investment advisory fee schedule for the Fund does not contain breakpoints, but that the fee remains competitive with peer funds. The Trustees also considered that the Adviser has implemented fee waivers and expense limitations (“Fee Caps”) which allow the Fund’s shareholders to share potential economies of scale from the Fund’s inception. The Trustees also considered that the Adviser has shared economies of scale by adding or enhancing services to the Fund over time, noting the Adviser’s substantial investments in its business in support of the Fund, including investments in trading systems and technology (including cybersecurity improvements), retention of key talent, additions to analyst and portfolio management teams, and regulatory support enhancements. The Trustees also considered whether it would be appropriate to add advisory fee breakpoints, and the Trustees concluded that the current fee structure was reasonable in light of the Fee Caps that the Adviser has in place that serve to limit the overall net expense ratios of the Fund at a competitive level. The Trustees concluded that the Fund’s shareholders received the benefits of potential economies of scale through the Fee Caps and the Adviser’s reinvestment in its operations to serve the Fund and its shareholders.
Investment Performance
The Trustees considered the Fund’s investment strategy and process, portfolio management team and competitive positioning against identified peer funds, and concluded that the prospects for competitive future performance were acceptable.
36
Advisory Fees and Expense Ratios
The Trustees considered the contractual advisory fee rate that will be paid by the Fund to the Adviser and compared that rate to the information prepared by Broadridge, using data from Lipper Inc., independent providers of investment company data (together, “Broadridge/Lipper”) concerning management fee rates paid by other funds in the same Broadridge/Lipper category as the Fund. The Trustees recognized that Broadridge/Lipper reported the Fund’s management fee rate as the combined contractual advisory fee and administration fee rates. The Trustees also reviewed information about other projected expenses and the expense ratios for the Fund. The Trustees considered the projected fee waiver and/or expense reimbursement arrangements proposed for the Fund and considered the net advisory fee rate after taking into account any projected waivers and/or reimbursements. The Trustees recognized that it is difficult to make comparisons of advisory fees because there are variations in the services that are included in the fees paid by other funds.
The Trustees noted that the Fund’s estimated net advisory fees and total expenses, which were considered on a class-by-class basis, were in line with identified peer funds. After considering the factors identified above, in light of the information, the Trustees concluded that the advisory fees were reasonable.
37
J.P. Morgan Funds are distributed by JPMorgan Distribution Services, Inc., which is an affiliate of JPMorgan Chase & Co. Affiliates of JPMorgan Chase & Co. receive fees for providing various services to the funds.
Contact JPMorgan Distribution Services, Inc. at 1-800-480-4111 for a fund prospectus. You can also visit us at www.jpmorganfunds.com. Investors should carefully consider the investment objectives and risk as well as charges and expenses of the mutual fund before investing. The prospectus contains this and other information about the mutual fund. Read the prospectus carefully before investing.
Investors may obtain information about the Securities Investor Protection Corporation (SIPC), including the SIPC brochure by visiting www.sipc.org or by calling SIPC at 202-371-8300.
The Fund files a complete schedule of its fund holdings for the first and third quarters of its fiscal year with the SEC on Form N-Q. The Fund’s Forms N-Q are available on the SEC’s website at http://www.sec.gov and may be reviewed and copied at the SEC’s Public Reference Room in Washington, DC. Information on the operation of the SEC’s Public Reference Room may be obtained by calling 1-800-SEC-0330. Shareholders may request the Form N-Q without charge by calling 1-800-480-4111 or by visiting the J.P. Morgan Funds’ website at www.jpmorganfunds.com.
A description of the Fund’s policies and procedures with respect to the disclosure of the Fund’s holdings is available in the prospectus and Statement of Additional Information.
A copy of proxy policies and procedures is available without charge upon request by calling 1-800-480-4111 and on the Fund’s website at www.jpmorganfunds.com. A description of such policies and procedures is on the SEC’s website at www.sec.gov. The Trustees have delegated the authority to vote proxies for securities owned by the Fund to the Adviser. A copy of the Fund’s voting record for the most recent 12-month period ended June 30 is available on the SEC’s website at www.sec.gov or at the Fund’s website at www.jpmorganfunds.com no later than August 31 of each year. The Fund’s proxy voting record will include, among other things, a brief description of the matter voted on for each fund security, and will state how each vote was cast, for example, for or against the proposal.
| | | | |
| | © JPMorgan Chase & Co., 2016. All rights reserved. August 2016. | | 
|
ITEM 2. CODE OF ETHICS.
Disclose whether, as of the end of the period covered by the report, the registrant has adopted a code of ethics that applies to the registrant’s principal executive officer, principal financial officer, principal accounting officer or controller, or persons performing similar functions, regardless of whether these individuals are employed by the registrant or a third party. If the registrant has not adopted such a code of ethics, explain why it has not done so.
The registrant must briefly describe the nature of any amendment, during the period covered by the report, to a provision of its code of ethics that applies to the registrant’s principal executive officer, principal financial officer, principal accounting officer or controller, or persons performing similar functions, regardless of whether these individuals are employed by the registrant or a third party, and that relates to any element of the code of ethics definition enumerated in paragraph (b) of this Item. The registrant must file a copy of any such amendment as an exhibit pursuant to Item 12(a)(1), unless the registrant has elected to satisfy paragraph (f) of this Item by positing its code of ethics on its website pursuant to paragraph (f)(2) of this Item, or by undertaking to provide its code of ethics to any person without charge, upon request, pursuant to paragraph (f)(3) of this Item.
If the registrant has, during the period covered by the report, granted a waiver, including an implicit waiver, from a provision of the code of ethics that applies to the registrant’s principal executive officer, principal financial officer, principal accounting officer or controller, or persons performing similar functions, regardless of whether these individuals are employed by the registrant or third party, that relates to one or more items set forth in paragraph (b) of this Item, the registrant must briefly describe the nature of the waiver, the name of the person to whom the waiver was granted, and the date of the waiver.
Not applicable to a semi-annual report.
ITEM 3. AUDIT COMMITTEE FINANCIAL EXPERT.
(a) (1) Disclose that the registrant’s board of directors has determined that the registrant either:
(i) Has at least one audit committee financial expert serving on its audit committee; or
(ii) Does not have an audit committee financial expert serving on its audit committee.
(2) If the registrant provides the disclosure required by paragraph (a)(1)(i) of this Item, it must disclose the name of the audit committee financial expert and whether that person is “independent.” In order to be considered “independent” for purposes of this Item, a member of an audit committee may not, other than in his or her capacity as a member of the audit committee, the board of directors, or any other board committee:
(i) Accept directly or indirectly any consulting, advisory, or other compensatory fee from the issuer; or
(ii) Be an “interested person” of the investment company as defined in Section 2(a)(19) of the Act (15 U.S.C. 80a-2(a)(19)).
(3) If the registrant provides the disclosure required by paragraph (a)(1)(ii) of this Item, it must explain why it does not have an audit committee financial expert.
Not applicable to a semi-annual report.
ITEM 4. PRINCIPAL ACCOUNTANT FEES AND SERVICES.
(a) Disclose, under the caption Audit Fees, the aggregate fees billed for each of the last two fiscal years for professional
services rendered by the principal accountant for the audit of the registrant’s annual financial statements or services that are normally provided by the accountant in connection with statutory and regulatory filings or engagements for those fiscal years.
(b) Disclose, under the caption Audit-Related Fees, the aggregate fees billed in each of the last two fiscal years for assurance and related services by the principal accountant that are reasonably related to the performance of the audit of the registrant’s financial statements and are not reported under paragraph (a) of this Item. Registrants shall describe the nature of the services comprising the fees disclosed under this category.
(c) Disclose, under the caption Tax Fees, the aggregate fees billed in each of the last two fiscal years for professional services rendered by the principal accountant for tax compliance, tax advice, and tax planning. Registrants shall describe the nature of the services comprising the fees disclosed under this category.
(d) Disclose, under the caption All Other Fees, the aggregate fees billed in each of the last two fiscal years for products and services provided by the principal accountant, other than the services reported in paragraphs (a) through (c) of this Item. Registrants shall describe the nature of the services comprising the fees disclosed under this category.
(e) (1) Disclose the audit committee’s pre-approval policies and procedures described in paragraph (c)(7) of Rule 2-01 of Regulation S-X.
(2) Disclose the percentage of services described in each of paragraphs (b) through (d) of this Item that were approved by the audit committee pursuant to paragraph (c)(7)(i)(C) of Rule 2-01 of Regulation S-X.
(f) If greater than 50 percent, disclose the percentage of hours expended on the principal accountant’s engagement to audit the registrant’s financial statements for the most recent fiscal year that were attributed to work performed by persons other than the principal accountant’s full-time, permanent employees.
Not applicable to a semi-annual report.
(g) Disclose the aggregate non-audit fees billed by the registrant’s accountant for services rendered to the registrant, and rendered to the registrant’s investment adviser (not including any sub-adviser whose role is primarily portfolio management and is subcontracted with or overseen by another investment adviser), and any entity controlling, controlled by, or under common control with the adviser that provides ongoing services to the registrant for each of the last two fiscal years of the registrant.
(h) Disclose whether the registrant’s audit committee of the board of directors has considered whether the provision of non-audit services that were rendered to the registrant’s investment adviser (not including any subadviser whose role is primarily portfolio management and is subcontracted with or overseen by another investment adviser), and any entity controlling, controlled by, or under common control with the investment adviser that provides ongoing services to the registrant that were not pre-approved pursuant to paragraph (c)(7)(ii) of Rule 2-01 of Regulation S-X is compatible with maintaining the principal accountant’s independence.
Not applicable to a semi-annual report.
ITEM 5. AUDIT COMMITTEE OF LISTED REGISTRANTS.
(a) If the registrant is a listed issuer as defined in Rule 10A-3 under the Exchange Act (17CFR 240.10A-3), state whether or not the registrant has a separately-designated standing audit committee established in accordance with Section 3(a)(58)(A) of the Exchange Act (15 U.S.C. 78c(a)(58)(A)). If the registrant has such a committee, however designated, identify each committee member. If the entire board of directors is acting as the registrant’s audit committee as specified in Section 3(a)(58)(B) of the Exchange Act (15 U.S.C. 78c(a)(58)(B)), so state.
(b) If applicable, provide the disclosure required by Rule 10A-3(d) under the Exchange Act (17CFR 240.10A-3(d)) regarding an exemption from the listing standards for all audit committees.
Not applicable to a semi-annual report.
ITEM 6. SCHEDULE OF INVESTMENTS.
File Schedule I – Investments in securities of unaffiliated issuers as of the close of the reporting period as set forth in Section 210.12-12 of Regulation S-X, unless the schedule is included as part of the report to shareholders filed under Item 1 of this Form.
Included in Item 1.
ITEM 7. DISCLOSURE OF PROXY VOTING POLICIES AND PROCEDURES FOR CLOSED-END MANAGEMENT INVESTMENT COMPANIES.
A closed-end management investment company that is filing an annual report on this Form N-CSR must, unless it invests exclusively in non-voting securities, describe the policies and procedures that it uses to determine how to vote proxies relating to portfolio securities, including the procedures that the company uses when a vote presents a conflict between the interests of its shareholders, on the one hand, and those of the company’s investment adviser; principal underwriter; or any affiliated person (as defined in Section 2(a)(3) of the Investment Company Act of 1940 (15 U.S.C. 80a-2(a)(3)) and the rules thereunder) of the company, its investment adviser, or its principal underwriter, on the other. Include any policies and procedures of the company’s investment adviser, or any other third party, that the company uses, or that are used on the company’s behalf, to determine how to vote proxies relating to portfolio securities.
Not applicable.
ITEM 8. PORTFOLIO MANAGERS OF CLOSED-END MANAGEMENT INVESTMENT COMPANIES.
Not applicable.
ITEM 9. PURCHASE OF EQUITY SECURITIES BY CLOSED-END MANAGEMENT INVESTMENT COMPANY AND AFFILIATED PURCHASERS.
(a) If the registrant is a closed-end management investment company, provide the information specified in paragraph (b) of this Item with respect to any purchase made by or on behalf of the registrant or any “affiliated purchaser,” as defined in Rule 10b-18(a)(3) under the Exchange Act (17 CFR 240.10b-18(a)(3)), of shares or other units of any class of the registrant’s equity securities that is registered by the registrant pursuant to Section 12 of the Exchange Act (15 U.S.C. 781).
Not applicable.
ITEM 10. SUBMISSION OF MATTERS TO A VOTE OF SECURITY HOLDERS.
Describe any material changes to the procedures by which shareholders may recommend nominees to the registrant’s board of directors, where those changes were implemented after the registrant last provided disclosure in response to the requirements of Item 7(d)(2)(ii)(G) of Schedule 14A (17 CFR 240.14a-101), or this Item.
No material changes to report.
ITEM 11. CONTROLS AND PROCEDURES.
(a) Disclose the conclusions of the registrant’s principal executive and principal financial officers, or persons performing similar functions, regarding the effectiveness of the registrant’s disclosure controls and procedures (as defined in Rule 30a-3(c) under the Act (17 CFR 270.30a-3(c))) as of a date within 90 days of the filing date of the report that includes the disclosure required by this paragraph, based on the evaluation of these controls and procedures required by Rule 30a-3(b) under the Act (17 CFR 270.30a-3(b)) and Rules 13a-15(b) or 15d-15(b) under the Exchange Act (17 CFR 240.13a-15(b) or 240.15d-15(b)).
The Registrant’s principal executive and principal financial officers have concluded, based on their evaluation of the Registrant’s disclosure controls and procedures as of a date within 90 days of the filing date of this report, that the Registrant’s disclosure controls and procedures are reasonably designed to ensure that information required to be disclosed by the Registrant on Form N-CSR is recorded, processed, summarized and reported within the required time periods and that information required to be disclosed by the Registrant in the reports that it files or submits on Form N-CSR is accumulated and communicated to the Registrant’s management, including its principal executive and principal financial officers, as appropriate to allow timely decisions regarding required disclosure.
(b) Disclose any change in the registrant’s internal control over financial reporting (as defined in Rule 30a-3(d) under the Act (17 CFR 270.30a-3(d)) that occurred during the registrant’s second fiscal quarter of the period covered by this report that has materially affected, or is reasonably likely to materially affect, the registrant’s internal control over financial reporting.
There were no changes in the Registrant’s internal control over financial reporting that occurred during the last fiscal quarter covered by this report that have materially affected, or are reasonably likely to materially affect, the Registrant’s internal control over financial reporting.
ITEM 12. EXHIBITS.
(a) File the exhibits listed below as part of this Form. Letter or number the exhibits in the sequence indicated.
(a)(1) Any code of ethics, or amendment thereto, that is the subject of the disclosure required by Item 2, to the extent that the registrant intends to satisfy the Item 2 requirements through filing of an exhibit.
Not applicable.
(a)(2) A separate certification for each principal executive officer and principal financial officer of the registrant as required by Rule 30a-2(a) under the Act (17 CFR 270.30a-2).
Certifications pursuant to Rule 30a-2(a) under the Investment Company Act of 1940 are attached hereto.
(a)(3) Any written solicitation to purchase securities under Rule 23c-1 under the Act (17 CFR 270.23c-1) sent or given during the period covered by the report by or on behalf of the registrant to 10 or more persons.
Not applicable.
(b) A separate or combined certification for each principal executive officer and principal officer of the registrant as required by Rule 30a-2(b) under the Act of 1940.
Certifications pursuant to Rule 30a-2(b) under the Investment Company Act of 1940 are attached hereto.
SIGNATURES
Pursuant to the requirements of the Securities Exchange Act of 1934 and the Investment Company Act of 1940, the registrant has duly caused this report to be signed on its behalf by the undersigned, thereunto duly authorized.
| | |
| JPMorgan Trust IV |
| |
| By: | | /s/ Brian S. Shlissel |
| | Brian S. Shlissel President and Principal Executive Officer November 4, 2016 |
Pursuant to the requirements of the Securities Exchange Act of 1934 and the Investment Company Act of 1940, this report has been signed below by the following persons on behalf of the registrant and in the capacities and on the dates indicated.
| | |
| By: | | /s/ Brian S. Shlissel |
| | Brian S. Shlissel |
| | President and Principal Executive Officer |
| | November 4, 2016 |
| |
| By: | | /s/ Laura M. Del Prato |
| | Laura M. Del Prato |
| | Treasurer and Principal Financial Officer |
| | November 4, 2016 |