UNITED STATES
SECURITIES AND EXCHANGE COMMISSION
Washington, D.C. 20549
FORM N-CSR
CERTIFIED SHAREHOLDER REPORT OF REGISTERED
MANAGEMENT INVESTMENT COMPANIES
Investment Company Act file number: 811-23117
JPMorgan Trust IV
(Exact name of registrant as specified in charter)
270 Park Avenue
New York, NY 10017
(Address of principal executive offices) (Zip code)
Frank J. Nasta
270 Park Avenue
New York, NY 10017
(Name and Address of Agent for Service)
Registrant’s telephone number, including area code: (800) 480-4111
Date of fiscal year end: June 30
Date of reporting period: July 1, 2017 through December 31, 2017
Form N-CSR is to be used by management investment companies to file reports with the Commission not later than 10 days after the transmission to stockholders of any report that is required to be transmitted to stockholders under Rule 30e-1 under the Investment Company Act of 1940 (17 CFR 270.30e-1). The Commission may use the information provided on Form N-CSR in its regulatory, disclosure review, inspection, and policymaking roles.
A registrant is required to disclose the information specified by Form N-CSR, and the Commission will make this information public. A registrant is not required to respond to the collection of information contained in Form N-CSR unless the Form displays a currently valid Office of Management and Budget (“OMB”) control number. Please direct comments concerning the accuracy of the information collection burden estimate and any suggestions for reducing the burden to Secretary, Securities and Exchange Commission, 450 Fifth Street, NW, Washington, DC 20549-0609. The OMB has reviewed this collection of information under the clearance requirements of 44 U.S.C. Section 3507.
ITEM 1. REPORTS TO STOCKHOLDERS.
The following is a copy of the report transmitted to shareholders pursuant to Rule 30e-1 under the Investment Company Act of 1940 (17 CFR 270.30e-1).
J.P. Morgan Funds
Semi-Annual Report
December 31, 2017 (Unaudited)
JPMorgan SmartSpendingSM 2050 Fund
Contents
Investments in the Fund are not deposits or obligations of, or guaranteed or endorsed by, any bank and are not insured or guaranteed by the FDIC, the Federal Reserve Board or any other government agency. You could lose money if you sell when the Fund’s share price is lower than when you invested.
Past performance is no guarantee of future performance. The general market views expressed in this report are opinions based on market and other conditions through the end of the reporting period and are subject to change without notice. These views are not intended to predict the future performance of the Fund or the securities markets. References to specific securities and their issuers are for illustrative purposes only and are not intended to be, and should not be interpreted as, recommendations to purchase or sell such securities. Such views are not meant as investment advice and may not be relied on as an indication of trading intent on behalf of the Fund.
Prospective investors should refer to the Fund’s prospectus for a discussion of the Fund’s investment objective, strategies and risks. Call J.P. Morgan Funds Service Center at 1-800-480-4111 for a prospectus containing more complete information about the Fund including management fees and other expenses. Please read it carefully before investing.
CEO’S LETTER
February 1, 2018 (Unaudited)
Dear Shareholder,
The U.S. economy continued to grow in the second half of 2017, supported by a synchronized global economy and central bank policies that also helped lift equity prices in the U.S. and elsewhere.
The U.S. economy entered its third longest expansion on record in 2017, and gross domestic product (GDP) rose by 3.2% in the third quarter and an estimated 2.6% in the fourth quarter. During the second half of 2017, unemployment fell to 4.1% in December from 4.3% in June, and U.S. consumer confidence reached a 17-year high in November. Corporate profits rose during the second half of the year amid stable energy prices and a decline in the value of the U.S. dollar.
Notably, the second half of 2017 included three large hurricanes, wildfires and other assorted natural disasters that combined to cause an estimated $306 billion in damage in the U.S. While companies in some specific sectors of the economy reported that Hurricanes Harvey, Irma and Maria affected revenue or earnings, any impact on the larger economy appeared to be limited.
The U.S. Federal Reserve raised interest rates in December 2017 and indicated it would raise rates three more times in the year ahead. However, interest rates overall remained relatively low during the reporting period and provided support for both the domestic economy and financial markets.
Most developed market and emerging market economies also continued to grow in the second half of 2017. Growth in Europe was strong enough that the European Central Bank committed to reducing its monthly asset purchases by half and the Bank of England raised its benchmark interest rate for the first time in ten years. Japan registered its longest economic expansion in a decade and China’s GDP grew by an estimated 6.8% in the second half of 2017, supported by personal consumption and growth in foreign trade.
Roughly 120 countries, comprising three-fourths of global GDP, had experienced increased economic growth by the end of 2017, according to the International Monetary Fund (IMF).
Meanwhile, global financial markets provided investors with positive returns for the six months ended December 31, 2017. Overall, equity markets outperformed bond markets, with emerging market equities largely outperforming developed market equities.
In the wake of stronger-than-expected growth in the U.S. and other leading economies, the IMF revised its forecast for 2018 U.S. GDP growth to 2.7% from 2.3%. The IMF cited growth from external demand and a reduction in U.S. corporate tax rates from the 2017 Tax Cuts and Jobs Act. Historically high consumer confidence, increased business investment and growth in corporate earnings all indicate that the U.S. economy should continue to expand. We believe investors who maintain a properly diversified portfolio and a long-term outlook will be able to benefit from the current global economic expansion.
We look forward to managing your investment needs for years to come. Should you have any questions, please visit www.jpmorganfunds.com or contact the J.P. Morgan Funds Service Center at 1-800-480-4111.
Sincerely yours,
George C.W. Gatch
CEO, Global Funds Management & Institutional, J.P. Morgan Asset Management
1
JPMorgan SmartSpendingSM 2050 Fund
FUND SUMMARY
Six Months Ended December 31, 2017 (Unaudited)
| | | | |
Reporting Period Return: | | | |
Fund (Class I Shares)* | | | 5.47 | % |
MSCI World Index (net of foreign withholding taxes) | | | 10.61 | % |
Bloomberg Barclays U.S. Aggregate Index (formerly Barclays U.S. Aggregate Index) | | | 1.24 | % |
Net Assets as of 12/31/2017 | | $ | 31,631,961 | |
Investment objective** and strategies.…. The JPMorgan SmartSpendingSM 2050 Fund (the “Fund”) seeks to provide total return consisting of current income and capital appreciation. The Fund will invest in J.P. Morgan funds and directly in securities and other financial instruments according to an investment strategy that seeks to achieve a level of total return that supports shareholders systematically redeeming, or spending down, a portion of their investment in the Fund each year until December 31, 2050 (the Fund’s maturity date).
| | | | |
PORTFOLIO COMPOSITION BY ASSET CLASS*** | | | |
Fixed Income | | | 61.5 | % |
U.S. Equity | | | 19.2 | |
International Equity | | | 12.8 | |
Short-Term Investment | | | 3.8 | |
Alternative Assets | | | 1.6 | |
U.S. Treasury Obligation | | | 1.1 | |
| * | The return shown is based on net asset values calculated for shareholder transactions and may differ from the return shown in the financial highlights, which reflects adjustments made to the net asset values in accordance with accounting principles generally accepted in the United States of America. |
| ** | The adviser seeks to achieve the Fund’s objective. There can be no guarantee it will be achieved. |
| *** | Percentages indicated are based on total investments as of December 31, 2017. The Fund’s portfolio composition is subject to change. |
2
JPMorgan SmartSpendingSM 2050 Fund
FUND SUMMARY
Six Months Ended December 31, 2017 (Unaudited) (continued)
AVERAGE ANNUAL TOTAL RETURNS AS OF DECEMBER 31, 2017
| | | | | | | | | | | | | | |
| | | INCEPTION DATE OF CLASS | | 6 MONTH* | | | 1 YEAR | | | SINCE
INCEPTION | |
CLASS A SHARES | | December 30, 2016 | | | | | | | | | | | | |
With Sales Charge** | | | | | 0.58 | % | | | 5.84 | % | | | 5.82 | % |
Without Sales Charge | | | | | 5.34 | | | | 10.84 | | | | 10.81 | |
CLASS C SHARES | | December 30, 2016 | | | | | | | | | | | | |
With CDSC*** | | | | | 4.07 | | | | 9.30 | | | | 10.27 | |
Without CDSC | | | | | 5.07 | | | | 10.30 | | | | 10.27 | |
CLASS I SHARES | | December 30, 2016 | | | 5.47 | | | | 11.12 | | | | 11.09 | |
CLASS R2 SHARES | | December 30, 2016 | | | 5.12 | | | | 10.39 | | | | 10.36 | |
CLASS R3 SHARES | | December 30, 2016 | | | 5.25 | | | | 10.67 | | | | 10.64 | |
CLASS R4 SHARES | | December 30, 2016 | | | 5.38 | | | | 10.94 | | | | 10.91 | |
CLASS R5 SHARES | | December 30, 2016 | | | 5.45 | | | | 11.10 | | | | 11.07 | |
CLASS R6 SHARES | | December 30, 2016 | | | 5.52 | | | | 11.22 | | | | 11.19 | |
| ** | Sales Charge for Class A Shares is 4.50%. |
| *** | Assumes a 1% CDSC (contingent deferred sales charge) for the 6 month and one year periods and 0% CDSC thereafter. |
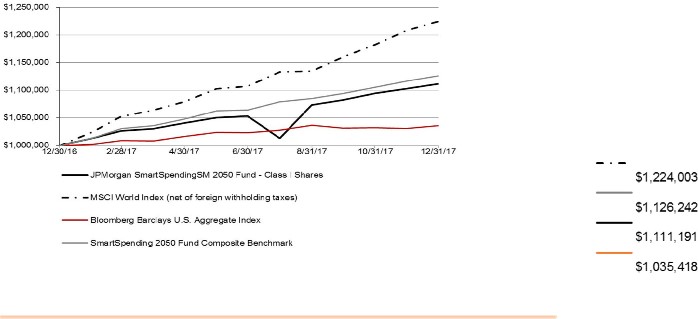
LIFE OF FUND PERFORMANCE (12/30/16 TO 13/31/17)
The performance quoted is past performance and is not a guarantee of future results. Mutual funds are subject to certain market risks. Investment returns and principal value of an investment will fluctuate so that an investor’s shares, when redeemed, may be worth more or less than their original cost. Current performance may be higher or lower than the performance data shown. For up-to-date, month-end performance information please call 1-800-480-4111.
3
JPMorgan SmartSpendingSM 2050 Fund
FUND SUMMARY
Six Months Ended December 31, 2017 (Unaudited) (continued)
The Fund commenced operations on December 30, 2016.
The graph illustrates comparative performance for $1,000,000 invested in Class I Shares of the JPMorgan SmartSpendingSM 2050 Fund, the MSCI World Index (net of foreign withholding taxes), the Bloomberg Barclays U.S. Aggregate Index and the JPMorgan SmartSpending 2050 Composite Benchmark from December 30, 2016 to December 31, 2017. The performance of the Fund may reflect the waiver of the Fund’s fees and reimbursement of expenses for certain periods since the inception date. Without these waivers and reimbursements, performance would have been lower. Also, performance shown in this section does not reflect the deduction of taxes that a shareholder would pay on Fund distributions or redemptions of Fund shares. The Bloomberg Barclays U.S. Aggregate Index is an unmanaged index representing SEC-registered taxable and dollar denominated securities. It covers the U.S. investment grade fixed rate bond market, with index components for government and corporate securities, mortgage pass-through, and asset-backed securities. The MSCI World Index (net of foreign withholding taxes) is a broad measure of the performance of developed countries’ equity markets. The JPMorgan SmartSpending 2050 Composite Benchmark is a composite benchmark of unmanaged indexes that includes 50% MSCI World Index (net of foreign withholding taxes) and 50% Bloomberg Barclays U.S. Aggregate Index. Investors cannot invest directly in an index.
Class I Shares have a $1,000,000 minimum initial investment.
Since the Fund’s inception, it has not experienced any shareholder activity. If shareholder activity had occurred, the Fund’s performance may have been impacted.
The returns shown are based on net asset values calculated for shareholder transactions and may differ from the returns shown in the financial highlights, which reflect adjustments made to the net asset values in accordance with accounting principles generally accepted in the United States of America.
4
JPMorgan SmartSpendingSM 2050 Fund
SCHEDULE OF PORTFOLIO INVESTMENTS
AS OF DECEMBER 31, 2017 (Unaudited)
| | | | | | | | |
SHARES | | | SECURITY DESCRIPTION | | VALUE($) | |
| | Exchange Traded Funds — 28.1% | | | | |
| | | | Fixed Income — 15.5% | | | | |
| | 23,185 | | | iShares Core U.S. Aggregate Bond Fund | | | 2,534,815 | |
| | 20,829 | | | iShares TIPS Bond Fund | | | 2,376,173 | |
| | | | | | | | |
| | | | Total Fixed Income | | | 4,910,988 | |
| | | | | | | | |
| | | | International Equity — 8.1% | | | | |
| | 22,867 | | | iShares Core MSCI EAFE Fund | | | 1,511,280 | |
| | 18,321 | | | iShares Core MSCI Emerging Markets Fund | | | 1,042,465 | |
| | | | | | | | |
| | | | Total International Equity | | | 2,553,745 | |
| | | | | | | | |
| | | | U.S. Equity — 4.5% | | | | |
| | 1,973 | | | iShares Russell 2000 Fund | | | 300,804 | |
| | 2,326 | | | iShares Russell Mid-Cap Fund | | | 484,110 | |
| | 7,634 | | | Vanguard REIT Fund | | | 633,469 | |
| | | | | | | | |
| | | | Total U.S. Equity | | | 1,418,383 | |
| | | | | | | | |
| | | | Total Exchange Traded Funds (Cost $8,194,602) | | | 8,883,116 | |
| | | | | | | | |
|
SHARES | |
| | Investment Companies — 67.1% (b) | | | | |
| | | | Alternative Assets — 1.6% | | | | |
| | 54,319 | | | JPMorgan Commodities Strategy Fund, Class R6 Shares | | | 504,085 | |
| | | | | | | | |
| | | | Fixed Income — 46.0% | | | | |
| | 526,179 | | | JPMorgan Core Bond Fund, Class R6 Shares | | | 6,098,413 | |
| | 391,847 | | | JPMorgan Core Plus Bond Fund, Class R6 Shares | | | 3,244,495 | |
| | 30,153 | | | JPMorgan Corporate Bond Fund, Class R6 Shares | | | 298,514 | |
| | 93,577 | | | JPMorgan Emerging Markets Debt Fund, Class R6 Shares | | | 783,236 | |
| | 57,899 | | | JPMorgan Emerging Markets Strategic Debt Fund, Class R6 Shares | | | 490,407 | |
| | 82,481 | | | JPMorgan Floating Rate Income Fund, Class R6 Shares | | | 773,674 | |
| | 386,653 | | | JPMorgan High Yield Fund, Class R6 Shares | | | 2,865,098 | |
| | | | | | | | |
| | | | Total Fixed Income | | | 14,553,837 | |
| | | | | | | | |
| | | | International Equity — 4.7% | | | | |
| | 79,209 | | | JPMorgan International Research Enhanced Equity Fund, Class R6 Shares | | | 1,496,257 | |
| | | | | | | | |
| | | | | | |
SHARES | | SECURITY DESCRIPTION | | VALUE($) | |
Investment Companies — continued | | | | |
| | U.S. Equity — 14.8% | | | | |
| 56,533 | | JPMorgan Equity Index Fund, Class R6 Shares | | | 2,316,142 | |
| 30,389 | | JPMorgan Growth Advantage Fund, Class R6 Shares (a) | | | 627,536 | |
| 67,491 | | JPMorgan U.S. Equity Fund, Class R6 Shares | | | 1,102,134 | |
| 17,464 | | JPMorgan Value Advantage Fund, Class R6 Shares | | | 628,352 | |
| | | | | | |
| | Total U.S. Equity | | | 4,674,164 | |
| | | | | | |
| | Total Investment Companies (Cost $20,259,147) | | | 21,228,343 | |
| | | | | | |
| | |
PRINCIPAL AMOUNT($) | | | | | |
U.S. Treasury Obligation — 1.1% | | | | |
| 360,000 | | U.S. Treasury Notes, 0.75%, 01/31/2018 (k)
(Cost $359,956) | | | 359,863 | |
| | | | | | |
SHARES | | | | | |
Short-Term Investment — 3.8% | | | | |
| | Investment Company — 3.8% | | | | |
| 1,195,454 | | JPMorgan U.S. Government Money Market Fund, Institutional Class Shares, 1.14% (b) (l)
(Cost $1,195,454) | | | 1,195,454 | |
| | | | | | |
| | Total Investments — 100.1% (Cost $30,009,159) | | | 31,666,776 | |
| | Liabilities in Excess of Other Assets — (0.1)% | | | (34,815 | ) |
| | | | | | |
| | NET ASSETS — 100.0% | | $ | 31,631,961 | |
| | | | | | |
Percentages indicated are based on net assets.
SEE NOTES TO FINANCIAL STATEMENTS.
5
JPMorgan SmartSpendingSM 2050 Fund
SCHEDULE OF PORTFOLIO INVESTMENTS
AS OF DECEMBER 31, 2017 (Unaudited) (continued)
Futures contracts outstanding as of December 31, 2017:
| | | | | | | | | | | | | | | | | | | | |
Description | | Number of
Contracts | | | Expiration
Date | | | Trading Currency | | | Notional Amount
($) | | | Value and
Unrealized
Appreciation
(Depreciation) ($) | |
Long Contracts | | | | | | | | | | | | | | | | | | | | |
Australia 10 Year Bond | | | 6 | | | | 03/2018 | | | | AUD | | | | 604,653 | | | | (4,647 | ) |
EURO STOXX 50 Index | | | 15 | | | | 03/2018 | | | | EUR | | | | 627,055 | | | | (17,376 | ) |
MSCI Emerging Markets E- | | | | | | | | | | | | | | | | | | | | |
Mini Index | | | 11 | | | | 03/2018 | | | | USD | | | | 640,035 | | | | 26,157 | |
S&P 500 E-Mini Index | | | 3 | | | | 03/2018 | | | | USD | | | | 401,400 | | | | 5,064 | |
TOPIX Index | | | 5 | | | | 03/2018 | | | | JPY | | | | 804,132 | | | | 17,810 | |
U.S. Treasury 10 Year Note | | | 11 | | | | 03/2018 | | | | USD | | | | 1,364,172 | | | | (4,063 | ) |
| | | | | | | | | | | | | | | | | | | | |
| | | | | | | | | | | | | | | | | | | 22,945 | |
| | | | | | | | | | | | | | | | | | | | |
Short Contracts | | | | | | | | | | | | | | | | | | | | |
Euro-Bund | | | (5 | ) | | | 03/2018 | | | | EUR | | | | (969,959 | ) | | | 11,104 | |
FTSE 100 Index | | | (3 | ) | | | 03/2018 | | | | GBP | | | | (308,196 | ) | | | (11,199 | ) |
U.S. Treasury 2 Year Note | | | (7 | ) | | | 03/2018 | | | | USD | | | | (1,498,656 | ) | | | 2,283 | |
| | | | | | | | | | | | | | | | | | | | |
| | | | | | | | | | | | | | | | | | | 2,188 | |
| | | | | | | | | | | | | | | | | | | | |
| | | | | | | | | | | | | | | | | | | 25,133 | |
| | | | | | | | | | | | | | | | | | | | |
NOTES TO SCHEDULE OF PORTFOLIO INVESTMENTS
| | | | |
AUD | | — | | Australian Dollar |
EAFE | | — | | Europe, Australasia and Far East |
EUR | | — | | Euro |
FTSE | | — | | Financial Times and the London Stock Exchange |
GBP | | — | | British Pound |
JPY | | — | | Japanese Yen |
MSCI | | — | | Morgan Stanley Capital International |
REIT | | — | | Real Estate Investment Trust. |
TIPS | | — | | Treasury Inflation Protected Security |
TOPIX | | — | | Tokyo Stock Price Index |
USD | | — | | United States Dollar |
(a) | | — | | Non-income producing security. |
(b) | | — | | Investment in affiliate. Fund is registered under the Investment Company Act of 1940, as amended, and advised by J.P. Morgan Investment Management Inc. |
(k) | | — | | All or a portion of this security is deposited with the broker as initial margin for futures contracts. |
(l) | | — | | The rate shown is the current yield as of December 31, 2017. |
Detailed information about investment portfolios of the underlying funds can be found in shareholder reports filed with the Securities and Exchange Commission (SEC) by each such underlying fund semi-annually on Form N-CSR and in certified portfolio holdings filed quarterly on Form N-Q, and are available for download from both the SEC’s as well as each respective underlying fund’s website. Detailed information about underlying J.P. Morgan Funds can also be found at www.jpmorganfunds.com or by calling 1-800-480-4111.
SEE NOTES TO FINANCIAL STATEMENTS.
6
STATEMENT OF ASSETS AND LIABILITIES
AS OF DECEMBER 31, 2017 (Unaudited)
| | | | |
| | | JPMorgan
SmartSpendingSM
2050 Fund | |
ASSETS: | | | | |
Investments in non-affiliates, at value | | $ | 9,242,979 | |
Investments in affiliates, at value | | | 22,423,797 | |
Receivables: | | | | |
Investment securities sold | | | 3,899,399 | |
Interest from non-affiliates | | | 1,130 | |
Dividends from affiliates | | | 990 | |
Variation margin on futures contracts | | | 132,949 | |
Due from Adviser | | | 23,615 | |
| | | | |
Total Assets | | | 35,724,859 | |
| | | | |
LIABILITIES: | | | | |
Payables: | | | | |
Investment securities purchased | | | 3,930,882 | |
Fund shares redeemed | | | 132,442 | |
Accrued liabilities: | | | | |
Distribution fees | | | 37 | |
Service fees | | | 2,415 | |
Custodian and accounting fees | | | 9,582 | |
Other | | | 17,540 | |
| | | | |
Total Liabilities | | | 4,092,898 | |
| | | | |
Net Assets | | $ | 31,631,961 | |
| | | | |
NET ASSETS: | | | | |
Paid-in-Capital | | $ | 29,473,566 | |
Accumulated undistributed (distributions in excess of) net investment income | | | (44,282 | ) |
Accumulated net realized gains (losses) | | | 521,788 | |
Net unrealized appreciation (depreciation) | | | 1,680,889 | |
| | | | |
Total Net Assets | | $ | 31,631,961 | |
| | | | |
Net Assets: | | | | |
Class A | | $ | 22,168 | |
Class C | | | 22,054 | |
Class I | | | 31,476,901 | |
Class R2 | | | 22,073 | |
Class R3 | | | 22,128 | |
Class R4 | | | 22,183 | |
Class R5 | | | 22,215 | |
Class R6 | | | 22,239 | |
| | | | |
Total | | $ | 31,631,961 | |
| | | | |
Outstanding units of beneficial interest (shares) ($0.0001 par value; unlimited number of shares authorized): | | | | |
Class A | | | 1,378 | |
Class C | | | 1,371 | |
Class I | | | 1,956,714 | |
Class R2 | | | 1,372 | |
Class R3 | | | 1,376 | |
Class R4 | | | 1,379 | |
Class R5 | | | 1,381 | |
Class R6 | | | 1,382 | |
| |
Net Asset Value (a): | | | | |
Class A - Redemption price per share | | $ | 16.09 | |
Class C - Offering price per share (b) | | | 16.09 | |
Class I - Offering and redemption price per share | | | 16.09 | |
Class R2 - Offering and redemption price per share | | | 16.09 | |
Class R3 - Offering and redemption price per share | | | 16.09 | |
Class R4 - Offering and redemption price per share | | | 16.09 | |
Class R5 - Offering and redemption price per share | | | 16.09 | |
Class R6 - Offering and redemption price per share | | | 16.09 | |
Class A maximum sales charge | | | 4.50 | % |
Class A maximum public offering price per share [net asset value per share/(100% – maximum sales charge)] | | $ | 16.85 | |
| | | | |
Cost of investments in non-affiliates | | $ | 8,554,558 | |
Cost of investments in affiliates | | | 21,454,601 | |
| (a) | Per share amounts may not recalculate due to rounding of net assets and/or shares outstanding. |
| (b) | Redemption price for Class C Shares varies based upon length of time the shares are held. |
SEE NOTES TO FINANCIAL STATEMENTS.
7
STATEMENT OF OPERATIONS
FOR THE SIX MONTHS ENDED DECEMBER 31, 2017 (Unaudited)
| | | | |
| | | JPMorgan
SmartSpendingSM
2050 Fund | |
INVESTMENT INCOME: | | | | |
Dividend income from non-affiliates | | $ | 155,771 | |
Dividend income from affiliates | | | 280,743 | |
Interest income from non-affiliates | | | 1,595 | |
| | | | |
Total investment income | | | 438,109 | |
| | | | |
EXPENSES: | | | | |
Investment advisory fees | | | 55,340 | |
Administration fees | | | 12,875 | |
Distribution fees: | | | | |
Class A | | | 28 | |
Class C | | | 82 | |
Class R2 | | | 54 | |
Class R3 | | | 27 | |
Service fees: | | | | |
Class A | | | 28 | |
Class C | | | 27 | |
Class I | | | 39,338 | |
Class R2 | | | 27 | |
Class R3 | | | 27 | |
Class R4 | | | 28 | |
Class R5 | | | 13 | |
Custodian and accounting fees | | | 13,631 | |
Professional fees | | | 13,928 | |
Trustees’ and Chief Compliance Officer’s fees | | | 12,899 | |
Printing and mailing costs | | | 9,517 | |
Registration and filing fees | | | 672 | |
Transfer agency fees (See Note 2.H) | | | 231 | |
Offering costs | | | 47,104 | |
Other | | | 4,956 | |
| | | | |
Total expenses | | | 210,832 | |
| | | | |
Less fees waived | | | (85,026 | ) |
Less expense reimbursements | | | (94,315 | ) |
| | | | |
Net expenses | | | 31,491 | |
| | | | |
Net investment income (loss) | | | 406,618 | |
| | | | |
REALIZED/UNREALIZED GAINS (LOSSES): | | | | |
Net realized gain (loss) on transactions from: | | | | |
Investments in non-affiliates | | | 99,079 | |
Investments in affiliates | | | 296,762 | |
Futures contracts | | | 189,993 | |
Foreign currency transactions | | | 161 | |
| | | | |
Net realized gain (loss) | | | 585,995 | |
| | | | |
Distributions of capital gains received from investment company affiliates | | | 189,825 | |
| | | | |
Change in net unrealized appreciation/depreciation on: | | | | |
Investments in non-affiliates | | | 235,654 | |
Investments in affiliates | | | 238,676 | |
Futures contracts | | | (619 | ) |
Foreign currency translations | | | 9 | |
| | | | |
Change in net unrealized appreciation/depreciation | | | 473,720 | |
| | | | |
Net realized/unrealized gains (losses) | | | 1,249,540 | |
| | | | |
Change in net assets resulting from operations | | $ | 1,656,158 | |
| | | | |
SEE NOTES TO FINANCIAL STATEMENTS.
8
STATEMENTS OF CHANGES IN NET ASSETS
FOR THE PERIODS INDICATED
| | | | | | | | |
| | | JPMorgan
SmartSpendingSM 2050
Fund | |
| | | Six Months Ended
December 31, 2017
(Unaudited) | | | Period Ended June 30,
2017 (a) | |
CHANGE IN NET ASSETS RESULTING FROM OPERATIONS: | | | | | | | | |
Net investment income (loss) | | $ | 406,618 | | | $ | 320,465 | |
Net realized gain (loss) | | | 585,995 | | | | 80,612 | |
Distributions of capital gains received from investment company affiliates | | | 189,825 | | | | — | |
Change in net unrealized appreciation/depreciation | | | 473,720 | | | | 1,207,169 | |
| | | | | | | | |
Change in net assets resulting from operations | | | 1,656,158 | | | | 1,608,246 | |
| | | | | | | | |
DISTRIBUTIONS TO SHAREHOLDERS: | | | | | | | | |
Class A | | | | | | | | |
From net investment income | | | (309 | ) | | | (164 | ) |
From net realized gains | | | (237 | ) | | | — | |
Class C | | | | | | | | |
From net investment income | | | (253 | ) | | | (114 | ) |
From net realized gains | | | (235 | ) | | | — | |
Class I | | | | | | | | |
From net investment income | | | (482,765 | ) | | | (281,132 | ) |
From net realized gains | | | (337,297 | ) | | | — | |
Class R2 | | | | | | | | |
From net investment income | | | (263 | ) | | | (122 | ) |
From net realized gains | | | (236 | ) | | | — | |
Class R3 | | | | | | | | |
From net investment income | | | (290 | ) | | | (148 | ) |
From net realized gains | | | (236 | ) | | | — | |
Class R4 | | | | | | | | |
From net investment income | | | (318 | ) | | | (173 | ) |
From net realized gains | | | (237 | ) | | | — | |
Class R5 | | | | | | | | |
From net investment income | | | (333 | ) | | | (189 | ) |
From net realized gains | | | (237 | ) | | | — | |
Class R6 | | | | | | | | |
From net investment income | | | (346 | ) | | | (199 | ) |
From net realized gains | | | (237 | ) | | | — | |
| | | | | | | | |
Total distributions to shareholders | | | (823,829 | ) | | | (282,241 | ) |
| | | | | | | | |
CAPITAL TRANSACTIONS: | | | | | | | | |
Change in net assets resulting from capital transactions | | | (141,947 | ) | | | 29,615,574 | |
| | | | | | | | |
NET ASSETS: | | | | | | | | |
Change in net assets | | | 690,382 | | | | 30,941,579 | |
Beginning of period | | | 30,941,579 | | | | — | |
| | | | | | | | |
End of period | | $ | 31,631,961 | | | $ | 30,941,579 | |
| | | | | | | | |
Accumulated undistributed (distributions in excess of) net investment income | | $ | (44,282 | ) | | $ | 33,977 | |
| | | | | | | | |
| (a) | Commencement of operations was December 30, 2016. |
SEE NOTES TO FINANCIAL STATEMENTS.
9
STATEMENTS OF CHANGES IN NET ASSETS
FOR THE PERIODS INDICATED (continued)
| | | | | | | | |
| | | JPMorgan
SmartSpendingSM 2050
Fund | |
| | | Six Months Ended
December 31, 2017
(Unaudited) | | | Period Ended June 30,
2017 (a) | |
CAPITAL TRANSACTIONS: | | | | | | | | |
Class A | | | | | | | | |
Proceeds from shares issued | | $ | — | | | $ | 20,000 | |
Distributions reinvested | | | 546 | | | | 164 | |
| | | | | | | | |
Change in net assets resulting from Class A capital transactions | | $ | 546 | | | $ | 20,164 | |
| | | | | | | | |
Class C | | | | | | | | |
Proceeds from shares issued | | $ | — | | | $ | 20,000 | |
Distributions reinvested | | | 488 | | | | 114 | |
| | | | | | | | |
Change in net assets resulting from Class C capital transactions | | $ | 488 | | | $ | 20,114 | |
| | | | | | | | |
Class I | | | | | | | | |
Proceeds from shares issued | | $ | — | | | $ | 29,860,000 | |
Distributions reinvested | | | 820,062 | | | | 281,132 | |
Cost of shares redeemed | | | (965,776 | ) | | | (666,667 | ) |
| | | | | | | | |
Change in net assets resulting from Class I capital transactions | | $ | (145,714 | ) | | $ | 29,474,465 | |
| | | | | | | | |
Class R2 | | | | | | | | |
Proceeds from shares issued | | $ | — | | | $ | 20,000 | |
Distributions reinvested | | | 499 | | | | 122 | |
| | | | | | | | |
Change in net assets resulting from Class R2 capital transactions | | $ | 499 | | | $ | 20,122 | |
| | | | | | | | |
Class R3 | | | | | | | | |
Proceeds from shares issued | | $ | — | | | $ | 20,000 | |
Distributions reinvested | | | 526 | | | | 148 | |
| | | | | | | | |
Change in net assets resulting from Class R3 capital transactions | | $ | 526 | | | $ | 20,148 | |
| | | | | | | | |
Class R4 | | | | | | | | |
Proceeds from shares issued | | $ | — | | | $ | 20,000 | |
Distributions reinvested | | | 555 | | | | 173 | |
| | | | | | | | |
Change in net assets resulting from Class R4 capital transactions | | $ | 555 | | | $ | 20,173 | |
| | | | | | | | |
Class R5 | | | | | | | | |
Proceeds from shares issued | | $ | — | | | $ | 20,000 | |
Distributions reinvested | | | 570 | | | | 189 | |
| | | | | | | | |
Change in net assets resulting from Class R5 capital transactions | | $ | 570 | | | $ | 20,189 | |
| | | | | | | | |
Class R6 | | | | | | | | |
Proceeds from shares issued | | $ | — | | | $ | 20,000 | |
Distributions reinvested | | | 583 | | | | 199 | |
| | | | | | | | |
Change in net assets resulting from Class R6 capital transactions | | $ | 583 | | | $ | 20,199 | |
| | | | | | | | |
Total change in net assets resulting from capital transactions | | $ | (141,947 | ) | | $ | 29,615,574 | |
| | | | | | | | |
| (a) | Commencement of operations was December 30, 2016. |
SEE NOTES TO FINANCIAL STATEMENTS.
10
STATEMENTS OF CHANGES IN NET ASSETS
FOR THE PERIODS INDICATED (continued)
| | | | | | | | |
| | | JPMorgan
SmartSpendingSM 2050
Fund | |
| | | Six Months Ended
December 31, 2017
(Unaudited) | | | Period Ended June 30,
2017 (a) | |
SHARE TRANSACTIONS: | | | | | | | | |
Class A | | | | | | | | |
Issued | | | — | | | | 1,333 | |
Reinvested | | | 34 | | | | 11 | |
| | | | | | | | |
Change in Class A Shares | | | 34 | | | | 1,344 | |
| | | | | | | | |
Class C | | | | | | | | |
Issued | | | — | | | | 1,334 | |
Reinvested | | | 30 | | | | 7 | |
| | | | | | | | |
Change in Class C Shares | | | 30 | | | | 1,341 | |
| | | | | | | | |
Class I | | | | | | | | |
Issued | | | — | | | | 1,990,667 | |
Reinvested | | | 51,020 | | | | 18,135 | |
Redeemed | | | (60,240 | ) | | | (42,868 | ) |
| | | | | | | | |
Change in Class I Shares | | | (9,220 | ) | | | 1,965,934 | |
| | | | | | | | |
Class R2 | | | | | | | | |
Issued | | | — | | | | 1,333 | |
Reinvested | | | 31 | | | | 8 | |
| | | | | | | | |
Change in Class R2 Shares | | | 31 | | | | 1,341 | |
| | | | | | | | |
Class R3 | | | | | | | | |
Issued | | | — | | | | 1,333 | |
Reinvested | | | 33 | | | | 10 | |
| | | | | | | | |
Change in Class R3 Shares | | | 33 | | | | 1,343 | |
| | | | | | | | |
Class R4 | | | | | | | | |
Issued | | | — | | | | 1,333 | |
Reinvested | | | 35 | | | | 11 | |
| | | | | | | | |
Change in Class R4 Shares | | | 35 | | | | 1,344 | |
| | | | | | | | |
Class R5 | | | | | | | | |
Issued | | | — | | | | 1,334 | |
Reinvested | | | 35 | | | | 12 | |
| | | | | | | | |
Change in Class R5 Shares | | | 35 | | | | 1,346 | |
| | | | | | | | |
Class R6 | | | | | | | | |
Issued | | | — | | | | 1,333 | |
Reinvested | | | 36 | | | | 13 | |
| | | | | | | | |
Change in Class R6 Shares | | | 36 | | | | 1,346 | |
| | | | | | | | |
| (a) | Commencement of operations was December 30, 2016. |
SEE NOTES TO FINANCIAL STATEMENTS.
11
FINANCIAL HIGHLIGHTS
FOR THE PERIODS INDICATED
| | | | | | | | | | | | | | | | | | | | | | | | | | | | | | | | | | | | | | | | | | | | | | | | | | | | | | | | |
| | | Per share operating performance | | | Ratios/Supplemental data | |
| | | | | | Investment operations | | | Distributions | | | | | | | | | Ratios to average net assets (a) | | | | |
| | | Net asset
value,
beginning of
period | | | Net investment
income (loss)
(b)(c) | | | Net realized and
unrealized gains
(losses) on
investments | | | Total from
investment
operations | | | Net
investment
income | | | Net
realized
gain | | | Total
distributions | | | Net asset
value, end
of period | | | Total return
(excludes
sales
charge)
(d)(e) | | | Net assets,
end of period | | | Net expenses
(f)(g) | | | Net
investment income
(loss) (c)(g) | | | Expenses without
waivers and
reimbursements
(f)(g) | | | Portfolio
turnover
rate (d) | |
SmartSpending 2050 Fund | | | | | | | | | | | | | | | | | | | | | | | | | | | | | | | | | | | | | | | | | | | | | | | | | | | | | | | | |
Class A | | | | | | | | | | | | | | | | | | | | | | | | | | | | | | | | | | | | | | | | | | | | | | | | | | | | | | | | |
Six Months Ended December 31, 2017 (Unaudited) | | $ | 15.66 | | | $ | 0.19 | | | $ | 0.64 | | | $ | 0.83 | | | $ | (0.23 | ) | | $ | (0.17 | ) | | $ | (0.40 | ) | | $ | 16.09 | | | | 5.34 | % | | $ | 22,168 | | | | 0.44 | % | | | 2.37 | % | | | 1.63 | % | | | 23 | % |
December 30, 2016 (h) through June 30, 2017 | | | 15.00 | | | | 0.14 | | | | 0.64 | | | | 0.78 | | | | (0.12 | ) | | | — | | | | (0.12 | ) | | | 15.66 | | | | 5.23 | | | | 21,050 | | | | 0.45 | | | | 1.85 | | | | 3.76 | | | | 8 | |
Class C | | | | | | | | | | | | | | | | | | | | | | | | | | | | | | | | | | | | | | | | | | | | | | | | | | | | | | | | |
Six Months Ended December 31, 2017 (Unaudited) | | | 15.66 | | | | 0.15 | | | | 0.64 | | | | 0.79 | | | | (0.19 | ) | | | (0.17 | ) | | | (0.36 | ) | | | 16.09 | | | | 5.07 | | | | 22,054 | | | | 0.95 | | | | 1.82 | | | | 2.20 | | | | 23 | |
December 30, 2016 (h) through June 30, 2017 | | | 15.00 | | | | 0.10 | | | | 0.64 | | | | 0.74 | | | | (0.08 | ) | | | — | | | | (0.08 | ) | | | 15.66 | | | | 4.97 | | | | 21,000 | | | | 0.93 | | | | 1.36 | | | | 4.32 | | | | 8 | |
Class I | | | | | | | | | | | | | | | | | | | | | | | | | | | | | | | | | | | | | | | | | | | | | | | | | | | | | | | | |
Six Months Ended December 31, 2017 (Unaudited) | | | 15.66 | | | | 0.21 | | | | 0.64 | | | | 0.85 | | | | (0.25 | ) | | | (0.17 | ) | | | (0.42 | ) | | | 16.09 | | | | 5.47 | | | | 31,476,901 | | | | 0.20 | | | | 2.57 | | | | 1.19 | | | | 23 | |
December 30, 2016 (h) through June 30, 2017 | | | 15.00 | | | | 0.16 | | | | 0.64 | | | | 0.80 | | | | (0.14 | ) | | | — | | | | (0.14 | ) | | | 15.66 | | | | 5.36 | | | | 30,794,263 | | | | 0.19 | | | | 2.09 | | | | 1.26 | | | | 8 | |
Class R2 | | | | | | | | | | | | | | | | | | | | | | | | | | | | | | | | | | | | | | | | | | | | | | | | | | | | | | | | |
Six Months Ended December 31, 2017 (Unaudited) | | | 15.66 | | | | 0.15 | | | | 0.64 | | | | 0.79 | | | | (0.19 | ) | | | (0.17 | ) | | | (0.36 | ) | | | 16.09 | | | | 5.12 | | | | 22,073 | | | | 0.86 | | | | 1.91 | | | | 1.95 | | | | 23 | |
December 30, 2016 (h) through June 30, 2017 | | | 15.00 | | | | 0.11 | | | | 0.64 | | | | 0.75 | | | | (0.09 | ) | | | — | | | | (0.09 | ) | | | 15.66 | | | | 5.02 | | | | 21,009 | | | | 0.84 | | | | 1.44 | | | | 4.09 | | | | 8 | |
Class R3 | | | | | | | | | | | | | | | | | | | | | | | | | | | | | | | | | | | | | | | | | | | | | | | | | | | | | | | | |
Six Months Ended December 31, 2017 (Unaudited) | | | 15.66 | | | | 0.17 | | | | 0.64 | | | | 0.81 | | | | (0.21 | ) | | | (0.17 | ) | | | (0.38 | ) | | | 16.09 | | | | 5.25 | | | | 22,128 | | | | 0.61 | | | | 2.16 | | | | 1.70 | | | | 23 | |
December 30, 2016 (h) through June 30, 2017 | | | 15.00 | | | | 0.13 | | | | 0.64 | | | | 0.77 | | | | (0.11 | ) | | | — | | | | (0.11 | ) | | | 15.66 | | | | 5.15 | | | | 21,035 | | | | 0.59 | | | | 1.69 | | | | 3.82 | | | | 8 | |
Class R4 | | | | | | | | | | | | | | | | | | | | | | | | | | | | | | | | | | | | | | | | | | | | | | | | | | | | | | | | |
Six Months Ended December 31, 2017 (Unaudited) | | | 15.66 | | | | 0.19 | | | | 0.64 | | | | 0.83 | | | | (0.23 | ) | | | (0.17 | ) | | | (0.40 | ) | | | 16.09 | | | | 5.38 | | | | 22,183 | | | | 0.36 | | | | 2.41 | | | | 1.45 | | | | 23 | |
December 30, 2016 (h) through June 30, 2017 | | | 15.00 | | | | 0.15 | | | | 0.64 | | | | 0.79 | | | | (0.13 | ) | | | — | | | | (0.13 | ) | | | 15.66 | | | | 5.27 | | | | 21,060 | | | | 0.35 | | | | 1.94 | | | | 3.57 | | | | 8 | |
Class R5 | | | | | | | | | | | | | | | | | | | | | | | | | | | | | | | | | | | | | | | | | | | | | | | | | | | | | | | | |
Six Months Ended December 31, 2017 (Unaudited) | | | 15.66 | | | | 0.21 | | | | 0.63 | | | | 0.84 | | | | (0.24 | ) | | | (0.17 | ) | | | (0.41 | ) | | | 16.09 | | | | 5.45 | | | | 22,215 | | | | 0.23 | | | | 2.55 | | | | 1.31 | | | | 23 | |
December 30, 2016 (h) through June 30, 2017 | | | 15.00 | | | | 0.16 | | | | 0.64 | | | | 0.80 | | | | (0.14 | ) | | | — | | | | (0.14 | ) | | | 15.66 | | | | 5.35 | | | | 21,076 | | | | 0.20 | | | | 2.09 | | | | 3.43 | | | | 8 | |
Class R6 | | | | | | | | | | | | | | | | | | | | | | | | | | | | | | | | | | | | | | | | | | | | | | | | | | | | | | | | |
Six Months Ended December 31, 2017 (Unaudited) | | | 15.66 | | | | 0.22 | | | | 0.63 | | | | 0.85 | | | | (0.25 | ) | | | (0.17 | ) | | | (0.42 | ) | | | 16.09 | | | | 5.52 | | | | 22,239 | | | | 0.11 | | | | 2.67 | | | | 1.19 | | | | 23 | |
December 30, 2016 (h) through June 30, 2017 | | | 15.00 | | | | 0.17 | | | | 0.64 | | | | 0.81 | | | | (0.15 | ) | | | — | | | | (0.15 | ) | | | 15.66 | | | | 5.40 | | | | 21,086 | | | | 0.10 | | | | 2.19 | | | | 3.33 | | | | 8 | |
| (a) | Annualized for periods less than one year, unless otherwise noted. |
| (b) | Calculated based upon average shares outstanding. |
| (c) | Net investment income (loss) is affected by timing of distributions from underlying Funds. |
| (d) | Not annualized for periods less than one year. |
| (e) | Includes adjustments in accordance with accounting principles generally accepted in the United States of America and as such, the net asset values for financial reporting purposes and the returns based upon those net asset values may differ from the net asset values and returns for shareholder transactions. |
| (f) | Does not include expenses of underlying Funds. |
| (g) | Certain non-recurring expenses incurred by the Fund were not annualized for the six months ended December 31, 2017 and the period ended June 30, 2017. |
| (h) | Commencement of operations. |
SEE NOTES TO FINANCIAL STATEMENTS.
12
NOTES TO FINANCIAL STATEMENTS
AS OF DECEMBER 31, 2017 (Unaudited)
1. Organization
JPMorgan Trust IV (the “Trust”) was formed on November 11, 2015, as a Delaware statutory trust, pursuant to a Declaration of Trust dated November 11, 2015 and is registered under the Investment Company Act of 1940, as amended (the “1940 Act”), as an open-end management investment company.
The following is a separate fund of the Trust (the “Fund”) covered by this report:
| | | | |
Classes Offered | | Diversified/ Non-Diversified |
SmartSpendingSM 2050 Fund Class A, Class C, Class I, Class R2, Class R3, Class R4, Class R5 and Class R6 | | Diversified |
The investment objective of the Fund is to seek to provide total return consisting of current income and capital appreciation.
The Fund commenced operations on December 30, 2016. Currently, the Fund is not publicly offered for investment.
Class A Shares generally provide for a front-end sales charge while Class C Shares provide for a contingent deferred sales charge (“CDSC”). No sales charges are assessed with respect to Class I, Class R2, Class R3, Class R4, Class R5 and Class R6 Shares. Certain Class A Shares, for which front-end sales charges have been waived, may be subject to a CDSC as described in the Fund’s prospectus. Beginning on November 14, 2017, Class C Shares automatically convert to Class A Shares after ten years. All classes of shares have equal rights as to earnings, assets and voting privileges, except that each class may bear different transfer agency, distribution and service fees and each class has exclusive voting rights with respect to its distribution plan and shareholder servicing agreements.
J.P. Morgan Investment Management Inc. (“JPMIM”), an indirect, wholly-owned subsidiary of JPMorgan Chase & Co. (“JPMorgan”), acts as Adviser (the “Adviser”) and Administrator (the “Administrator”) to the Fund.
2. Significant Accounting Policies
The following is a summary of significant accounting policies followed by the Fund in the preparation of its financial statements. The Fund is an investment company and, accordingly, follows the investment company accounting and reporting guidance of the Financial Accounting Standards Board Accounting Standards Codification Topic 946 — Investment Companies, which is part of U.S. generally accepted accounting principles (“GAAP”). The preparation of financial statements in conformity with GAAP requires management to make estimates and assumptions that affect the reported amounts of assets and liabilities and disclosure of contingent assets and liabilities at the date of the financial statements and the reported amounts of increases and decreases in net assets from operations during the reporting period. Actual results could differ from those estimates.
A. Valuation of Investments — The valuation of investments is in accordance with GAAP and the Fund’s valuation policies set forth by and under the supervision and responsibility of the Board of Trustees (the “Board”), which established the following approach to valuation, as described more fully below: (i) investments for which market quotations are readily available shall be valued at such unadjusted quoted prices and (ii) all other investments for which market quotations are not readily available shall be valued at their fair value as determined in good faith by the Board.
The Administrator has established the J.P. Morgan Asset Management Americas Valuation Committee (“AVC”) to assist the Board with the oversight and monitoring of the valuation of the Fund’s investments. The Administrator implements the valuation policies of the Fund’s investments, as directed by the Board. The AVC oversees and carries out the policies for the valuation of investments held in the Fund. This includes monitoring the appropriateness of fair values based on results of ongoing valuation oversight, including but not limited to consideration of macro or security specific events, market events and pricing vendor and broker due diligence. The Administrator is responsible for discussing and assessing the potential impacts to the fair values on an ongoing basis, and at least on a quarterly basis with the AVC and the Board.
Equities and other exchange-traded instruments are valued at the last sale price or official market closing price on the primary exchange on which the instrument is traded before the net asset values (“NAV”) of the Fund are calculated on a valuation date. Certain foreign equity instruments, as well as certain derivatives with equity reference obligations, are valued by applying international fair value factors provided by approved affiliated and unaffiliated pricing vendors or third party broker-dealers (collectively referred to as “Pricing Services”). The factors seek to adjust the local closing price for movements of local markets post closing, but prior to the time the NAVs are calculated. Investments in open-end investment companies, excluding exchange-traded funds (“ETFs”) (the “Underlying Funds”), are valued at each Underlying Fund’s NAV per share as of the report date.
Fixed income instruments are valued based on prices received from Pricing Services. The Pricing Services use multiple valuation techniques to determine the valuation of fixed income instruments. In instances where sufficient market activity exists, the Pricing Services may utilize a market-based approach through which trades or quotes from market makers are used to determine the valuation of these instruments. In instances where sufficient market activity may not exist, the Pricing Services also utilize proprietary valuation models which may consider market transactions in comparable securities and the various relationships between securities in determining fair value and/or market characteristics in order to estimate the relevant cash flows, which are then discounted to calculate the fair values.
Futures are generally valued on the basis of available market quotations.
Valuations reflected in this report are as of the report date. As a result, changes in valuation due to market events and/or issuer related events after the report date and prior to issuance of the report are not reflected herein.
The various inputs that are used in determining the valuation of the Fund’s investments are summarized into the three broad levels listed below.
| • | | Level 1 — Unadjusted inputs using quoted prices in active markets for identical investments. |
13
| • | | Level 2 — Other significant observable inputs including, but not limited to, quoted prices for similar investments, inputs other than quoted prices that are observable for investments (such as interest rates, prepayment speeds, credit risk, etc.) or other market corroborated inputs. |
| • | | Level 3 — Significant inputs based on the best information available in the circumstances, to the extent observable inputs are not available (including the Fund’s assumptions in determining the fair value of investments). |
A financial instrument’s level within the fair value hierarchy is based on the lowest level of any input, both individually and in the aggregate, that is significant to the fair value measurement. The inputs or methodology used for valuing instruments are not necessarily an indication of the risk associated with investing in those instruments.
The following table represents each valuation input as presented on the Schedule of Portfolio Investments (“SOI”):
| | | | | | | | | | | | | | | | |
| | | Level 1
Quoted prices | | | Level 2
Other significant
observable
inputs | | | Level 3
Significant
unobservable
inputs | | | Total | |
Total Investments in Securities (a) | | $ | 31,306,913 | | | $ | 359,863 | | | $ | — | | | $ | 31,666,776 | |
| | | | | | | | | | | | | | | | |
Appreciation in Other Financial Instruments | | | | | | | | | | | | |
Futures Contracts (a) | | $ | 44,608 | | | $ | 17,810 | | | $ | — | | | $ | 62,418 | |
| | | | | | | | | | | | | | | | |
Depreciation in Other Financial Instruments | | | | | | | | | | | | |
Futures Contracts (a) | | $ | (8,710 | ) | | $ | (28,575 | ) | | $ | — | | | $ | (37,285 | ) |
| | | | | | | | | | | | | | | | |
| (a) | All portfolio holdings designated in level 1 and level 2 are disclosed individually on the SOI. Level 2 consists of foreign futures with equity reference obligations and a U.S. Treasury Note held as initial margin for futures contracts. Please refer to the SOI for asset class specifics of portfolio holdings. |
There were no transfers among any levels during the six months December 31, 2017.
B. Futures Contracts — The Fund used treasury and index futures contracts to gain exposure to or to overweight or underweight allocations among various sectors or markets, maintain liquidity or minimize transaction costs. The Fund also buys futures contracts to invest incoming cash in the market or sells futures in response to cash outflows, thereby simulating an invested position in the underlying index while maintaining a cash balance for liquidity.
Futures contracts provide for the delayed delivery of the underlying instrument at a fixed price or are settled for a cash amount based on the change in the value of the underlying instrument at a specific date in the future. Upon entering into a futures contract, the Fund is required to deposit with the broker, cash or securities in an amount equal to a certain percentage of the contract amount, which is referred to as the initial margin deposit. Subsequent payments, referred to as variation margin, are made or received by the Fund periodically and are based on changes in the market value of open futures contracts. Changes in the market value of open futures contracts are recorded as Change in net unrealized appreciation/ depreciation on the Statements of Operations. Realized gains or losses, representing the difference between the value of the contract at the time it was opened and the value at the time it was closed, are reported on the Statements of Operations at the closing or expiration of the futures contract. Securities deposited as initial margin are designated in the SOIs and cash deposited is recorded on the Statements of Assets and Liabilities. A receivable from and/or a payable to brokers for the daily variation margin is also recorded on the Statements of Assets and Liabilities.
The use of futures contracts exposes the Fund to equity price and interest rate risks. The Fund may be subject to the risk that the change in the value of the futures contract may not correlate perfectly with the underlying instrument. Use of long futures contracts subjects the Fund to risk of loss in excess of the amounts shown on the Statements of Assets and Liabilities, up to the notional amount of the futures contracts. Use of short futures contracts subjects the Fund to unlimited risk of loss. The Fund may enter into futures contracts only on exchanges or boards of trade. The exchange or board of trade acts as the counterparty to each futures transaction; therefore, the Fund’s credit risk is limited to failure of the exchange or board of trade. Under some circumstances, futures exchanges may establish daily limits on the amount that the price of a futures contract can vary from the previous day’s settlement price, which could effectively prevent liquidation of positions.
The tables below disclose the volume of the Fund’s futures contracts activity during the six months ended December 31, 2017:
| | | | | | | | |
| | | Average
Notional
Balance | | | Ending
Notional
Balance | |
Long Futures Contracts: | | | | | | | | |
Equity | | $ | 2,496,817 | | | $ | 2,472,622 | |
Interest Rate | | | 1,710,452 | | | | 1,968,825 | |
| | |
Short Futures Contracts: | | | | | | | | |
Equity | | | 294,189 | | | | 308,196 | |
Interest Rate | | | 3,166,553 | | | | 2,468,615 | |
14
The Fund’s futures contracts are not subject to master netting arrangements (the right to close out all transactions traded with a counterparty and net amounts owed or due across transactions).
C. Summary of Derivatives Information — The following table presents the value of derivatives held as of December 31, 2017, by their primary underlying risk exposure and respective location on the Statements of Assets and Liabilities:
| | | | | | |
Derivative Contracts | | Statements of Assets and Liabilities Location | | | |
Gross Assets: | | | | Futures Contracts (a) | |
Equity contracts | | Receivables, Net Assets — Unrealized Appreciation | | $ | 49,031 | |
Interest rate contracts | | Receivables, Net Assets — Unrealized Appreciation | | | 13,387 | |
| | | | | | |
Total | | | | $ | 62,418 | |
| | | | | | |
| | |
Gross Liabilities: | | | | | | |
Equity contracts | | Payables, Net Assets — Unrealized Depreciation | | $ | (28,575 | ) |
Interest rate contracts | | Payables, Net Assets — Unrealized Depreciation | | | (8,710 | ) |
| | | | | | |
Total | | | | $ | (37,285 | ) |
| | | | | | |
| (a) | This amount reflects the cumulative appreciation (depreciation) of futures contracts as reported on the SOIs. The Statements of Assets and Liabilities only reflect the current day variation margin receivable/payable to brokers. |
The following tables present the effect of derivatives on the Statements of Operations for the six months ended December 31, 2017, by primary underlying risk exposure:
| | | | |
Amount of Realized Gain (Loss) on Derivatives Recognized on the Statement of Operations | |
Derivative Contracts | | Futures Contracts | |
Equity contracts | | $ | 192,647 | |
Interest rate contracts | | | (2,654 | ) |
| | | | |
Total | | $ | 189,993 | |
| | | | |
|
Amount of Change in Unrealized Appreciation (Depreciation) on Derivatives Recognized on the Statement of Operations | |
Derivative Contracts | | Futures Contracts | |
Equity contracts | | $ | 24,114 | |
Interest rate contracts | | | (24,733 | ) |
| | | | |
Total | | $ | (619 | ) |
| | | | |
The Fund’s derivatives contracts held at December 31, 2017 are not accounted for as hedging instruments under GAAP.
D. Investment Transactions with Affiliates — The Fund invested in Underlying Funds which are advised by the Adviser or its affiliates. An issuer which is under common control with the Fund may be considered an affiliate. For the purposes of the financial statements, the Fund assumes the issuers listed in the table below to be affiliated issuers. Underlying Funds’ distributions may be reinvested into the Underlying Funds. Reinvestment amounts are included in the purchase cost amounts in the table below. Included in the purchases and sales amounts in the table below are exchanges between certain share classes of the affiliated Underlying Funds. Such exchanges are not treated as purchases and sales for the purpose of recognizing realized gains (losses) or portfolio turnover.
15
| | | | | | | | | | | | | | | | | | | | | | | | | | | | | | | | | | | | |
| For the six months ended December 31, 2017 | |
| | | | | | | | | |
Security Description | | Shares at
December
31, 2017 | | | Market Value
June 30, 2017
($) | | | Purchases at
Cost ($) | | | Proceeds from
Sales ($) | | | Net Realized
Gain (Loss) ($) | | | Change
in Unrealized
Appreciation/
(Depreciation) ($) | | | Market Value
December 31,
2017 ($) | | | Dividend/Interest
Income ($) | | | Capital Gain
Distributions
($) | |
JPMorgan Commodities Strategy Fund, Class R6 Shares | | | 54,319 | | | | 470,571 | | | | 951 | | | | — | | | | — | | | | 32,563 | | | | 504,085 | | | | 951 | | | | — | |
JPMorgan Core Bond Fund, Class R6 Shares | | | 526,179 | | | | 5,870,543 | | | | 377,096 | | | | 129,132 | | | | 1,782 | | | | (21,876 | ) | | | 6,098,413 | | | | 82,148 | | | | 13,514 | |
JPMorgan Core Plus Bond Fund, Class R6 Shares | | | 391,847 | | | | — | | | | 3,244,495 | | | | — | | | | — | | | | — | | | | 3,244,495 | | | | — | | | | — | |
JPMorgan Corporate Bond Fund, Class R6 Shares | | | 30,153 | | | | 859,025 | | | | 20,467 | | | | 578,567 | | | | 18,513 | | | | (20,924 | ) | | | 298,514 | | | | 10,932 | | | | 9,535 | |
JPMorgan Emerging Markets Debt Fund, Class R6 Shares | | | 93,577 | | | | 426,255 | | | | 353,126 | | | | — | | | | — | | | | 3,855 | | | | 783,236 | | | | 15,292 | | | | — | |
JPMorgan Emerging Markets Strategic Debt Fund, Class R6 Shares | | | 57,899 | | | | 426,202 | | | | 57,533 | | | | — | | | | — | | | | 6,672 | | | | 490,407 | | | | 10,149 | | | | — | |
JPMorgan Equity Index Fund, Class R6 Shares | | | 56,533 | | | | 3,085,665 | | | | 58,024 | | | | 1,112,210 | | | | 164,900 | | | | 119,763 | | | | 2,316,142 | | | | 28,036 | | | | 29,988 | |
JPMorgan Floating Rate Income Fund, Class R6 Shares | | | 82,481 | | | | 761,104 | | | | 15,041 | | | | — | | | | — | | | | (2,471 | ) | | | 773,674 | | | | 15,041 | | | | — | |
JPMorgan Growth Advantage Fund, Class R6 Shares | | | 30,389 | | | | 770,920 | | | | 31,711 | | | | 250,954 | | | | 55,526 | | | | 20,333 | | | | 627,536 | | | | — | | | | 31,712 | |
JPMorgan High Yield Fund, Class R6 Shares | | | 386,653 | | | | 3,028,327 | | | | 326,181 | | | | 481,380 | | | | 7,219 | | | | (15,249 | ) | | | 2,865,098 | | �� | | 79,279 | | | | — | |
JPMorgan International Research Enhanced Equity Fund, Class I Shares | | | — | | | | 1,409,887 | | | | — | | | | 1,237,699 | | | | — | | | | (172,188 | ) | | | — | | | | — | | | | — | |
JPMorgan International Research Enhanced Equity Fund, Class R6 Shares | | | 79,209 | | | | — | | | | 1,300,687 | | | | 56,680 | | | | 20,168 | | | | 232,082 | | | | 1,496,257 | | | | 16,359 | | | | 13,953 | |
JPMorgan U.S. Equity Fund, Class R6 Shares | | | 67,491 | | | | 1,050,019 | | | | 90,801 | | | | 69,562 | | | | 6,557 | | | | 24,319 | | | | 1,102,134 | | | | 7,292 | | | | 83,509 | |
JPMorgan U.S. Government Money Market Fund, Class Institutional Shares | | | 1,195,454 | | | | 853,949 | | | | 1,161,145 | | | | 819,640 | | | | — | | | | — | | | | 1,195,454 | | | | 5,061 | | | | — | |
JPMorgan Value Advantage Fund, Class R6 Shares | | | 17,464 | | | | 782,599 | | | | 17,816 | | | | 225,957 | | | | 22,097 | | | | 31,797 | | | | 628,352 | | | | 10,203 | | | | 7,614 | |
| | | | | | | | | | | | | | | | | | | | | | | | | | | | | | | | | | | | |
Total | | | | | | | 19,795,066 | | | | 7,055,074 | | | | 4,961,781 | | | | 296,762 | | | | 238,676 | | | | 22,423,797 | | | | 280,743 | | | | 189,825 | |
| | | | | | | | | | | | | | | | | | | | | | | | | | | | | | | | | | | | |
E. Offering and Organizational Costs — Total offering costs of $93,787 incurred in connection with the offering of shares of the Fund are amortized on a straight line basis over 12 months from the date the Fund commenced operations. Costs paid in connection with the organization of the Fund, if any, were recorded as an expense at the time the Fund commenced operations and are included as part of Professional fees on the Statement of Operations. For the six months December 31, 2017, total offering costs amortized were $47,104.
F. Foreign Currency Translation — The books and records of the Fund are maintained in U.S. dollars. Foreign currency amounts are translated into U.S. dollars at the prevailing exchange rates of such currencies against the U.S. dollar. The market value of investment securities and other assets and liabilities are translated at the exchange rate as of the valuation date. Purchases and sales of investment securities, income and expenses are translated at the exchange rate prevailing on the respective dates of such transactions.
The Fund does not isolate the effect of changes in foreign exchange rates from changes in market prices on securities held. Accordingly, such changes are included within Change in net unrealized appreciation/depreciation on investments on the Statement of Operations.
Reported realized foreign currency gains and losses arise from the disposition of foreign currency, currency gains or losses realized between the trade and settlement dates on securities transactions, and the difference between the amounts of dividends, interest and foreign withholding taxes recorded on the Fund’s books on the transaction date and the U.S. dollar equivalent of the amounts actually received or paid. These reported realized foreign currency gains and losses are included in Net realized gain (loss) on foreign currency transactions on the Statement of Operations. Unrealized foreign currency gains and losses arise from changes (due to changes in exchange rates) in the value of foreign currency and other assets and liabilities denominated in foreign currencies, which are held at year end are included in Change in net unrealized appreciation/depreciation on foreign currency translations on the Statement of Operations.
G. Security Transactions and Investment Income — Investment transactions are accounted for on the trade date (the date the order to buy or sell is executed). Securities gains and losses are calculated on a specifically identified cost basis. Interest income is determined on the basis of coupon interest accrued using the effective interest method which adjusts for amortization of premiums and accretion of discounts. Distributions of net investment income and realized capital gains from the Underlying Funds and ETFs, if any, are recorded on the ex-dividend date.
H. Allocation of Income and Expenses — Expenses directly attributable to a fund are charged directly to that fund, while the expenses attributable to more than one fund of the Trust are allocated among the respective funds. In calculating the NAV of each class, investment income, realized and unrealized gains and losses and expenses, other than class-specific expenses, are allocated daily to each class of shares based upon the proportion of net assets of each class at the beginning of each day.
16
Transfer agency fees are class-specific expenses. The amount of the transfer agency fees charged to each class of the Fund for the six months ended December 31, 2017 are as follows:
| | | | | | | | | | | | | | | | | | | | | | | | | | | | | | | | | | | | |
| | | Class A | | | Class C | | | Class I | | | Class R2 | | | Class R3 | | | Class R4 | | | Class R5 | | | Class R6 | | | Total | |
Transfer agency fees | | $ | 27 | | | $ | 27 | | | $ | 42 | | | $ | 27 | | | $ | 27 | | | $ | 27 | | | $ | 27 | | | $ | 27 | | | $ | 231 | |
The Fund invests in Underlying Funds and ETFs and, as a result, bears a portion of the expenses incurred by these Underlying Funds and ETFs. These expenses are not reflected in the expenses shown on the Statement of Operations and are not included in the ratios to average net assets shown in the Financial Highlights. Certain expenses of affiliated Underlying Funds and ETFs are waived as described in Note 3.F.
I. Federal Income Taxes — The Fund is treated as a separate taxable entity for Federal income tax purposes. The Fund’s policy is to comply with the provisions of the Internal Revenue Code of 1986, as amended (the “Code”), applicable to regulated investment companies and to distribute to shareholders all of its distributable net investment income and net realized capital gains on investments. Accordingly, no provision for Federal income tax is necessary. Management has reviewed the Fund’s tax positions for all open tax years and has determined that as of December 31, 2017, no liability for income tax is required in the Fund’s financial statements for net unrecognized tax benefits. However, management’s conclusions may be subject to future review based on changes in, or the interpretation of, the accounting standards or tax laws and regulations. The Fund’s Federal tax returns for the prior three fiscal years remains, or since inception if shorter, subject to examination by the Internal Revenue Service.
J. Distributions to Shareholders — Distributions from net investment income are generally declared and paid monthly and are declared separately for each class. No class has preferential dividend rights; differences in per share rates are due to differences in separate class expenses. Net realized capital gains, if any, are distributed at least annually. The amount of distributions from net investment income and net realized capital gains is determined in accordance with Federal income tax regulations, which may differ from GAAP. To the extent these “book/tax” differences are permanent in nature (i.e., that they result from other than timing of recognition — “temporary differences”), such amounts are reclassified within the capital accounts based on their Federal tax-basis treatment.
3. Fees and Other Transactions with Affiliates
A. Investment Advisory Fee — Pursuant to an Investment Advisory Agreement, the Adviser supervises the investments of the Fund and for such services is paid a fee. The fee is accrued daily and paid monthly at an annual rate of 0.35% of the Fund’s average daily net assets.
The Adviser waived Investment Advisory fees and/or reimbursed expenses as outlined in Note 3.F.
B. Administration Fee — Pursuant to an Administration Agreement, the Administrator provides certain administration services to the Fund. In consideration of these services, the Administrator receives a fee accrued daily and paid monthly at an annual rate of 0.15% of the first $25 billion of the average daily net assets of all funds in the J.P. Morgan Funds Complex covered by the Administration Agreement (excluding certain funds of funds and money market funds) and 0.075% of the average daily net assets in excess of $25 billion of all such funds. For the six months ended December 31, 2017, the effective annualized rate was 0.08% of the Fund’s average daily net assets, notwithstanding any fee waivers and/or expense reimbursements.
JPMorgan Chase Bank, N.A. (“JPMCB”), a wholly-owned subsidiary of JPMorgan, serves as the Fund’s sub-administrator (the “Sub-administrator”). For its services as Sub-administrator, JPMCB receives a portion of the fees payable to the Administrator.
C. Distribution Fees — Pursuant to a Distribution Agreement, JPMorgan Distribution Services, Inc. (“JPMDS”), an indirect, wholly-owned subsidiary of JPMorgan, serves as the Trust’s principal underwriter and promotes and arranges for the sale of the Fund’s shares.
The Board has adopted a Distribution Plan (the “Distribution Plan”) for Class A, Class C, Class R2 and Class R3 Shares of the Fund in accordance with Rule 12b-1 under the 1940 Act. Class I, Class R4, Class R5 and Class R6 do not charge a distribution fee. The Distribution Plan provides that the Fund shall pay distribution fees, including payments to JPMDS, at annual rates of 0.25%, 0.75%, 0.50% and 0.25% of the average daily net assets of Class A, Class C, Class R2 and Class R3 Shares, respectively.
D. Service Fees — The Trust, on behalf of the Fund, has entered into a Shareholder Servicing Agreement with JPMDS under which JPMDS provides certain support services to the shareholders. For performing these services, JPMDS receives a fee, except for Class R6 Shares which do not charge a service fee, that is accrued daily and paid monthly equal to a percentage of the average daily net assets as shown in the table below:
| | | | | | | | | | | | | | | | | | | | | | | | | | |
Class A | | | Class C | | | Class I | | | R2 Class | | | R3 Class | | | R4 Class | | | R5 Class | |
| | 0.25 | % | | | 0.25 | % | | | 0.25 | % | | | 0.25 | % | | | 0.25 | % | | | 0.25 | % | | | 0.10 | % |
JPMDS has entered into shareholder services contracts with affiliated and unaffiliated financial intermediaries who provide shareholder services and other related services to their clients or customers who invest in the Fund under which JPMDS will pay all or a portion of such fees earned to financial intermediaries for performing such services.
E. Custodian and Accounting Fees — JPMCB provides portfolio custody and accounting services to the Fund. For performing these services, the Fund pays JPMCB transaction and asset-based fees that vary according to the number of transactions and positions, plus out-of-pocket expenses.
17
The amounts paid directly to JPMCB by the Fund for custody and accounting services are included in Custodian and accounting fees on the Statement of Operations. Payments to the custodian may be reduced by credits earned by the Fund, based on uninvested cash balances held by the custodian. Such earnings credits, if any, are presented separately on the Statement of Operations.
Interest expense paid to the custodian related to cash overdrafts, if any, is included in Interest expense to affiliates on the Statement of Operations.
F. Waivers and Reimbursements — The Adviser, Administrator and JPMDS have contractually agreed to waive fees and/or reimburse expenses to the extent that total annual operating expenses of the Fund, Underlying Funds and ETFs (excluding dividend and interest expenses related to short sales, interest, taxes, expenses related to litigation and potential litigation, extraordinary expenses incurred by the Fund and any Underlying Fund and ETFs and acquired fund fees incurred by an Underlying Fund and ETFs) exceed the percentages of the Fund’s average daily net assets as shown in the table below:
| | | | | | | | | | | | | | | | | | | | | | | | | | | | | | |
Class A | | | Class C | | | Class I | | | R2 Class | | | R3 Class | | | R4 Class | | | R5 Class | | | R6 Class | |
| | 0.74 | % | | | 1.24 | % | | | 0.49 | % | | | 1.15 | % | | | 0.90 | % | | | 0.65 | % | | | 0.50 | % | | | 0.40 | % |
The expense limitation agreement was in effect for the six months ended December 31, 2017 and is in place until at least October 31, 2018.
For the six months ended December 31, 2017, the Fund’s service providers waived fees and/or reimbursed expenses for the Fund as follows. None of these parties expect the Fund to repay any such waived fees and reimbursed expenses in future years.
| | | | | | | | | | | | | | | | | | |
| Contractual Waivers | | | | |
Investment Advisory
Fees | | | Administration
Fees | | | Service
Fees | | | Total | | | Contractual
Reimbursement | |
| $ | 55,329 | | | $ | 12,875 | | | $ | 16,822 | | | $ | 85,026 | | | $ | 94,315 | |
The Underlying Funds may impose separate advisory and servicing fees. To avoid charging a servicing fee at an effective rate above 0.25% for Class A, Class C, Class I, Class R2, Class R3 and Class R4 Shares and above 0.10% for Class R5 Shares, JPMDS may waive servicing fees with respect to the Fund in an amount equal to the weighted average pro-rata amount of servicing fees charged by the affiliated Underlying Funds. These waivers may be in addition to any waivers required to meet the Fund’s contractual expense limitations, but will not exceed the Fund’s servicing fees.
G. Other — Certain officers of the Trust are affiliated with the Adviser, the Administrator and JPMDS. Such officers, with the exception of the Chief Compliance Officer, receive no compensation from the Fund for serving in their respective roles.
The Board appointed a Chief Compliance Officer to the Fund in accordance with Federal securities regulations. The Fund, along with other affiliated funds, makes reimbursement payments, on a pro-rata basis, to the Administrator for a portion of the fees associated with the Office of the Chief Compliance Officer. Such fees are included in Trustees’ and Chief Compliance Officer’s fees on the Statement of Operations.
The Trust adopted a Trustee Deferred Compensation Plan (the “Plan”) which allows the Independent Trustees to defer the receipt of all or a portion of compensation related to performance of their duties as Trustees. The deferred fees are invested in various J.P. Morgan Funds until distribution in accordance with the Plan.
The Fund may use related party broker-dealers. For the six months ended December 31, 2017, the Fund did not incur any brokerage commissions with broker-dealers affiliated with the Adviser.
The SEC has granted an exemptive order permitting the Fund to invest in certain financial instruments in addition to Underlying Funds and securities.
4. Investment Transactions
During the six months ended December 31, 2017, purchases and sales of investments (excluding short-term investments) were as follows:
| | | | | | |
Purchases
(excluding
U.S. Government) | | | Sales (excluding
U.S. Government) | |
| $ | 6,816,431 | | | $ | 7,447,542 | |
During the six months ended June 30, 2017, there were no purchases or sales of U.S. Government securities.
5. Federal Income Tax Matters
For Federal income tax purposes, the estimated cost and unrealized appreciation (depreciation) in value of investments held at December 31, 2017 were as follows:
| | | | | | | | | | | | | | |
Aggregate
Cost | | | Gross
Unrealized
Appreciation | | | Gross
Unrealized
Depreciation | | | Net Unrealized
Appreciation
(Depreciation) | |
| $ | 30,009,159 | | | $ | 1,725,825 | | | $ | 43,075 | | | $ | 1,682,750 | |
18
At June 30, 2017, the Fund did not have any net capital loss carryforwards.
6. Borrowings
The Fund relies upon an exemptive order granted by the SEC (the “Order”) permitting the establishment and operation of an Interfund Lending Facility (the “Facility”). The Facility allows the Fund to directly lend and borrow money to or from any other fund relying upon the Order at rates beneficial to both the borrowing and lending funds. Advances under the Facility are taken primarily for temporary or emergency purposes, including the meeting of redemption requests that otherwise might require the untimely disposition of securities, and are subject to the Fund’s borrowing restrictions. The Interfund loan rate is determined, as specified in the Order, by averaging the current repurchase agreement rate and the current bank loan rate. The Order was granted to JPMorgan Trust II and may be relied upon by the Fund because the Fund and the series of JPMorgan Trust II are both investment companies in the same “group of investment companies” (as defined in Section 12(d)(1)(G) of the 1940 Act).
The Trust and JPMCB have entered into a financing arrangement. Under this arrangement, JPMCB provides an unsecured, uncommitted credit facility in the aggregate amount of $100 million to certain of the J.P. Morgan Funds, including the Fund. Advances under the arrangement are taken primarily for temporary or emergency purposes, including the meeting of redemption requests that otherwise might require the untimely disposition of securities, and are subject to the Fund’s borrowing restrictions. Interest on borrowings is payable at a rate determined by JPMCB at the time of borrowing. This agreement has been extended until November 5, 2018.
The Fund had no borrowings outstanding from another fund or from the unsecured, uncommitted credit facility during the six months ended December 31, 2017.
7. Risks, Concentrations and Indemnifications
In the normal course of business, the Fund enters into contracts that contain a variety of representations which provide general indemnifications. The Fund’s maximum exposure under these arrangements is unknown. The amount of exposure would depend on future claims that may be made against the Fund that have not yet occurred. However, based on experience, the Fund expects the risk of loss to be remote.
As of December 31, 2017, all of the Fund’s shares were held by the Adviser.
Because of the Fund’s investments in the Underlying Funds and ETFs, the Fund indirectly pays a portion of the expenses incurred by the Underlying Funds and ETFs. As a result, the cost of investing in the Fund may be higher than the cost of investing in a mutual fund that invests directly in Individual securities and financial instruments. The Fund is also subject to certain risks related to the Underlying Funds’ and ETFs’ investments in securities and financial instruments such as equity securities, foreign and emerging markets securities and real estate securities. These securities are subject to risks specific to their structure, sector or market.
The Fund invests in unaffiliated ETFs. ETFs are pooled investment vehicles whose ownership interests are purchased and sold on a securities exchange. ETFs may be structured as investment companies, depositary receipts or other pooled investment vehicles and may be passively or actively managed. Passively managed ETFs generally seek to track the performance of a particular market index, including broad-based market indexes, as well as indexes relating to particular sectors, markets, regions or industries. Actively managed ETFs do not seek to track the performance of a particular market index. The price movement of an index-based ETF may not track the underlying index and may result in a loss. In addition, ETFs may trade at a price below or above their NAV (also known as a discount or premium, respectively).
In addition, the Underlying Funds and ETFs may use derivative instruments in connection with their individual investment strategies including futures contracts, forward foreign currency exchange contracts, options, swaps and other derivatives, which are also subject to specific risks related to their structure, sector or market and may be riskier than investments in other types of securities.
Derivatives may be riskier than other types of investments because they may be more sensitive to changes in economic and market conditions and could result in losses that significantly exceed the Fund’s original investment. Derivatives also expose the Fund to counterparty risk (the risk that the derivative counterparty will not fulfill its contractual obligations), including credit risk of the derivative counterparty.
Specific risks and concentrations present in the Underlying Funds and ETFs are disclosed within their individual financial statements and registration statements, as appropriate.
8. Investment Company Reporting Modernization
In October 2016, the U.S. Securities and Exchange Commission adopted new rules and forms, and amendments to certain current rules and forms, to modernize the reporting and disclosure of information by registered investment companies. In part, the final rules amend Regulation S-X and require standardized, enhanced disclosures about derivatives in investment company financial statements, as well as other amendments. The amendments to Regulation S-X were applied to the Fund’s financial statements as of December 31, 2017. The adoption had no effect on the Fund’s net assets or results of operations.
9. Subsequent Events
At its meeting held in February 2018, the Board approved the liquidation of the Fund’s Class C Shares effective on or about February 26, 2018 and a change to the distribution frequency of net investment income from monthly to annually beginning February 2018.
SCHEDULE OF SHAREHOLDER EXPENSES
(Unaudited)
Hypothetical $1,000 Investment
As a shareholder of the Fund, you incur two types of costs: (1) transaction costs, including sales charges (loads) on purchase payments and (2) ongoing costs, including investment advisory fees, administration fees, distribution fees and other Fund expenses. The examples below are intended to help you understand your ongoing costs (in dollars) of investing in the Fund and to compare these ongoing costs with the ongoing costs of investing in other mutual funds. The examples assume that you had a $1,000 investment in each Class at the beginning of the reporting period, July 1, 2017, and continued to hold your shares at the end of the reporting period, December 31, 2017.
Actual Expenses
For each Class of the Fund in the table below, the first line provides information about actual account values and actual expenses. You may use the information in this line, together with the amount you invested, to estimate the expenses that you paid over the period. Simply divide your account value by $1,000 (for example, an $8,600 account value divided by $1,000 = 8.6), then multiply the result by the number in the first line of each Class under the heading entitled “Expenses Paid During the Period” to estimate the expenses you paid on your account during this period.
Hypothetical Example for Comparison Purposes
The second line of each Class in the table below provides information about hypothetical account values and hypothetical expenses based on the Class’ actual expense ratio and an assumed rate of return of 5% per year before expenses, which is not the Class’ actual return. The hypothetical account values and expenses may not be used to estimate the actual ending account balance or expenses you paid for the period. You may use this information to compare the ongoing costs of investing in the Class of the Fund and other funds. To do so, compare this 5% hypothetical example with the 5% hypothetical examples that appear in the shareholder reports of the other funds. Please note that the expenses shown in the table are meant to highlight your ongoing costs only and do not reflect any transaction costs, such as sales charges (loads) or redemption fees. Therefore, the second line for each Class in the table is useful in comparing ongoing costs only, and will not help you determine the relative total costs of owning different funds. In addition, if these transaction costs were included, your costs would have been higher. The examples also assume all dividends and distributions have been reinvested.
| | | | | | | | | | | | | | | | |
| | | Beginning
Account Value
July 1, 2017 | | | Ending
Account Value
December 31,
2017 | | | Expenses
Paid During the
Period* | | | Annualized
Expense
Ratio | |
SmartSpending 2050 Fund | | | | | | | | | | | | | | | | |
Class A | | | | | | | | | | | | | | | | |
Actual | | $ | 1,000.00 | | | | 1,053.40 | | | $ | 2.28 | | | | 0.44 | % |
Hypothetical | | | 1,000.00 | | | | 1,022.99 | | | | 2.24 | | | | 0.44 | |
Class C | | | | | | | | | | | | | | | | |
Actual | | | 1,000.00 | | | | 1,050.70 | | | | 4.91 | | | | 0.95 | |
Hypothetical | | | 1,000.00 | | | | 1,020.42 | | | | 4.84 | | | | 0.95 | |
Class I | | | | | | | | | | | | | | | | |
Actual | | | 1,000.00 | | | | 1,054.70 | | | | 1.04 | | | | 0.20 | |
Hypothetical | | | 1,000.00 | | | | 1,024.20 | | | | 1.02 | | | | 0.20 | |
Class R2 | | | | | | | | | | | | | | | | |
Actual | | | 1,000.00 | | | | 1,051.20 | | | | 4.45 | | | | 0.86 | |
Hypothetical | | | 1,000.00 | | | | 1,020.87 | | | | 4.38 | | | | 0.86 | |
Class R3 | | | | | | | | | | | | | | | | |
Actual | | | 1,000.00 | | | | 1,052.50 | | | | 3.16 | | | | 0.61 | |
Hypothetical | | | 1,000.00 | | | | 1,022.13 | | | | 3.11 | | | | 0.61 | |
Class R4 | | | | | | | | | | | | | | | | |
Actual | | | 1,000.00 | | | | 1,053.80 | | | | 1.86 | | | | 0.36 | |
Hypothetical | | | 1,000.00 | | | | 1,023.39 | | | | 1.84 | | | | 0.36 | |
20
SCHEDULE OF SHAREHOLDER EXPENSES
(Unaudited) (continued)
Hypothetical $1,000 Investment
| | | | | | | | | | | | | | | | |
| | | Beginning
Account Value
July 1, 2017 | | | Ending
Account Value
December 31,
2017 | | | Expenses
Paid During the
Period* | | | Annualized
Expense
Ratio | |
Class R5 | | | | | | | | | | | | | | | | |
Actual | | $ | 1,000.00 | | | $ | 1,054.50 | | | $ | 1.19 | | | | 0.23 | % |
Hypothetical | | | 1,000.00 | | | | 1,024.05 | | | | 1.17 | | | | 0.23 | |
Class R6 | | | | | | | | | | | | | | | | |
Actual | | | 1,000.00 | | | | 1,055.20 | | | | 0.57 | | | | 0.11 | |
Hypothetical | | | 1,000.00 | | | | 1,024.65 | | | | 0.56 | | | | 0.11 | |
| * | Expenses are equal to each Class’ respective annualized expense ratio, multiplied by the average account value over the period, multiplied by 184/365 (to reflect the actual period). |
21
J.P. Morgan Funds are distributed by JPMorgan Distribution Services, Inc., which is an affiliate of JPMorgan Chase & Co. Affiliates of JPMorgan Chase & Co. receive fees for providing various services to the funds.
Contact JPMorgan Distribution Services, Inc. at 1-800-480-4111 for a fund prospectus. Investors should carefully consider the investment objectives and risk as well as charges and expenses of the mutual fund before investing. The prospectus contains this and other information about the mutual fund. Read the prospectus carefully before investing.
Investors may obtain information about the Securities Investor Protection Corporation (SIPC), including the SIPC brochure by visiting www.sipc.org or by calling SIPC at 202-371-8300.
The Fund files a complete schedule of its fund holdings for the first and third quarters of its fiscal year with the SEC on Form N-Q. The Fund’s Forms N-Q are available on the SEC’s website at http://www.sec.gov and may be reviewed and copied at the SEC’s Public Reference Room in Washington, DC. Information on the operation of the SEC’s Public Reference Room may be obtained by calling 1-800-SEC-0330. Shareholders may request the Form N-Q without charge by calling 1-800-480-4111.
A description of the Fund’s policies and procedures with respect to the disclosure of the Fund’s holdings is available in the prospectus and Statement of Additional Information.
A copy of proxy policies and procedures is available without charge upon request by calling 1-800-480-4111. A description of such policies and procedures is on the SEC’s website at www.sec.gov. The Trustees have delegated the authority to vote proxies for securities owned by the Fund to the Adviser. A copy of the Fund’s voting record for the most recent 12-month period ended June 30 is available on the SEC’s website at www.sec.gov no later than August 31 of each year. The Fund’s proxy voting record will include, among other things, a brief description of the matter voted on for each fund security, and will state how each vote was cast, for example, for or against the proposal.
| | |
© JPMorgan Chase & Co., 2018. All rights reserved. December 2017. | | 
|
22
J.P. Morgan Funds
Semi-Annual Report
December 31, 2017 (Unaudited)
JPMorgan Equity Low Volatility Income Fund
JPMorgan Value Plus Fund
Contents
Investments in a Fund are not deposits or obligations of, or guaranteed or endorsed by, any bank and are not insured or guaranteed by the FDIC, the Federal Reserve Board or any other government agency. You could lose money if you sell when a Fund’s share price is lower than when you invested.
Past performance is no guarantee of future performance. The general market views expressed in this report are opinions based on market and other conditions through the end of the reporting period and are subject to change without notice. These views are not intended to predict the future performance of a Fund or the securities markets. References to specific securities and their issuers are for illustrative purposes only and are not intended to be, and should not be interpreted as, recommendations to purchase or sell such securities. Such views are not meant as investment advice and may not be relied on as an indication of trading intent on behalf of any Fund.
Prospective investors should refer to the Funds’ prospectuses for a discussion of the Funds’ investment objectives, strategies and risks. Call J.P. Morgan Funds Service Center at 1-800-480-4111 for a prospectus containing more complete information about a Fund, including management fees and other expenses. Please read it carefully before investing.
CEO’S LETTER
February 1, 2018 (Unaudited)
Dear Shareholder,
The U.S. economy continued to grow in the second half of 2017, supported by a synchronized global economy and central bank policies that also helped lift equity prices in the U.S. and elsewhere.
The U.S. economy entered its third longest expansion on record in 2017, and gross domestic product (GDP) rose by 3.2% in the third quarter and an estimated 2.6% in the fourth quarter. During the second half of 2017, unemployment fell to 4.1% in December from 4.3% in June, and U.S. consumer confidence reached a 17-year high in November. Corporate profits rose during the second half of the year amid stable energy prices and a decline in the value of the U.S. dollar.
Notably, the second half of 2017 included three large hurricanes, wildfires and other assorted natural disasters that combined to cause an estimated $306 billion in damage in the U.S. While companies in some specific sectors of the economy reported that Hurricanes Harvey, Irma and Maria affected revenue or earnings, any impact on the larger economy appeared to be limited.
The U.S. Federal Reserve raised interest rates in December 2017 and indicated it would raise rates three more times in the year ahead. However, interest rates overall remained relatively low during the reporting period and provided support for both the domestic economy and financial markets.
Most developed market and emerging market economies also continued to grow in the second half of 2017. Growth in Europe was strong enough that the European Central Bank committed to reducing its monthly asset purchases by half and the Bank of England raised its benchmark interest rate for the first time in ten years. Japan registered its longest economic expansion in a decade and China’s GDP grew by an estimated 6.8% in the second half of 2017, supported by personal consumption and growth in foreign trade.
Roughly 120 countries, comprising three-fourths of global GDP, had experienced increased economic growth by the end of 2017, according to the International Monetary Fund (IMF).
Meanwhile, global financial markets provided investors with positive returns for the six months ended December 31, 2017. Overall, equity markets outperformed bond markets, with emerging market equities largely outperforming developed market equities.
In the wake of stronger-than-expected growth in the U.S. and other leading economies, the IMF revised its forecast for 2018 U.S. GDP growth to 2.7% from 2.3%. The IMF cited growth from external demand and a reduction in U.S. corporate tax rates from the 2017 Tax Cuts and Jobs Act. Historically high consumer confidence, increased business investment and growth in corporate earnings all indicate that the U.S. economy should continue to expand. We believe investors who maintain a properly diversified portfolio and a long-term outlook will be able to benefit from the current global economic expansion.
We look forward to managing your investment needs for years to come. Should you have any questions, please visit www.jpmorganfunds.com or contact the J.P. Morgan Funds Service Center at 1-800-480-4111.
Sincerely yours,
George C.W. Gatch
CEO, Global Funds Management & Institutional, J.P. Morgan Asset Management
1
JPMorgan Equity Low Volatility Income Fund
FUND SUMMARY
SIX MONTHS ENDED DECEMBER 31, 2017 (Unaudited)
| | | | |
Reporting Period Return: | | | | |
Fund (Class I Shares)* | | | 6.47% | |
S&P 500 Index | | | 11.42% | |
BofA Merrill Lynch 3-Month U.S. Treasury Bill Index | | | 0.55% | |
| |
Net Assets as of 12/31/2017 | | $ | 59,779,662 | |
Investment objective** and strategies
The JPMorgan Equity Low Volatility Income Fund (the “Fund”) seeks total return, which includes current income and capital appreciation. The Fund seeks to provide shareholders with a higher level of income than the Fund’s primary benchmark, the Standard & Poor’s 500 Total Return Index (S&P 500 Index). In order to generate income, a portion of the Fund will be invested in equity securities of corporations that pay dividends and will be invested in equity-linked notes (ELNs).
|
TOP TEN EQUITY HOLDINGS OF THE PORTFOLIO*** |
| | | | |
1. Citigroup Global Markets Holdings, Inc., ELN, 13.75%, 01/23/2018 (linked to Wal-Mart Stores, Inc.) | | | 2.5 | % |
2. Morgan Stanley, ELN, 16.72%, 01/23/2018 (linked to Amdocs Ltd.) | | | 2.5 | |
3. Credit Suisse AG, ELN, 16.90%, 01/23/2018 (linked to UnitedHealth Group, Inc.) | | | 2.5 | |
4. Royal Bank of Canada, ELN, 13.35%, 01/23/2018 (linked to Common Shares of McDonald’s Corp.) | | | 2.5 | |
5. Ecolab, Inc | | | 2.5 | |
6. Sysco Corp | | | 2.5 | |
7. Danaher Corp. | | | 2.4 | |
8. Johnson & Johnson | | | 2.4 | |
9. Ship Finance International Ltd., (Norway) | | | 2.4 | |
10. PepsiCo, Inc. | | | 2.4 | |
| | | | |
PORTFOLIO COMPOSITION BY SECTOR*** | |
Financials | | | 16.1 | % |
Health Care | | | 16.0 | |
Convertible Bonds | | | 14.7 | |
Consumer Staples | | | 9.8 | |
Utilities | | | 9.2 | |
Industrials | | | 7.7 | |
Energy | | | 7.5 | |
Information Technology | | | 5.9 | |
Materials | | | 5.8 | |
Consumer Discretionary | | | 3.1 | |
Real Estate | | | 2.2 | |
Investment Funds | | | 1.2 | |
Short-Term Investment | | | 0.8 | |
| * | The return shown is based on net asset values calculated for shareholder transactions and may differ from the return shown in the financial highlights, which reflects adjustments made to the net asset values in accordance with accounting principles generally accepted in the United States of America. |
| ** | The adviser seeks to achieve the Fund’s objective. There can be no guarantee it will be achieved. |
| *** | Percentages indicated are based on total investments as of December 31, 2017. The Fund’s portfolio composition is subject to change. |
2
JPMorgan Equity Low Volatility Income Fund
FUND SUMMARY
SIX MONTHS ENDED DECEMBER 31, 2017 (Unaudited) (continued)
AVERAGE ANNUAL TOTAL RETURNS AS OF DECEMBER 31, 2017
| | | | | | | | |
| | | INCEPTION DATE
OF CLASS | | 6 MONTH* | | 1 YEAR | | SINCE
INCEPTION |
CLASS A SHARES | | July 20, 2016 | | | | | | |
With Sales Charge** | | | | 0.75% | | 7.42% | | 8.74% |
Without Sales Charge | | | | 6.34 | | 13.38 | | 12.86 |
CLASS C SHARES | | July 20, 2016 | | | | | | |
With CDSC*** | | | | 5.01 | | 11.75 | | 12.25 |
Without CDSC | | | | 6.01 | | 12.75 | | 12.25 |
CLASS I SHARES | | July 20, 2016 | | 6.47 | | 13.66 | | 13.14 |
CLASS R5 SHARES | | July 20, 2016 | | 6.58 | | 13.89 | | 13.36 |
CLASS R6 SHARES | | July 20, 2016 | | 6.61 | | 13.94 | | 13.42 |
| ** | Sales Charge for Class A Shares is 5.25%. |
| *** | Assumes a 1% CDSC (contingent deferred sales charge) for the 6 month and one year periods and 0% CDSC thereafter. |
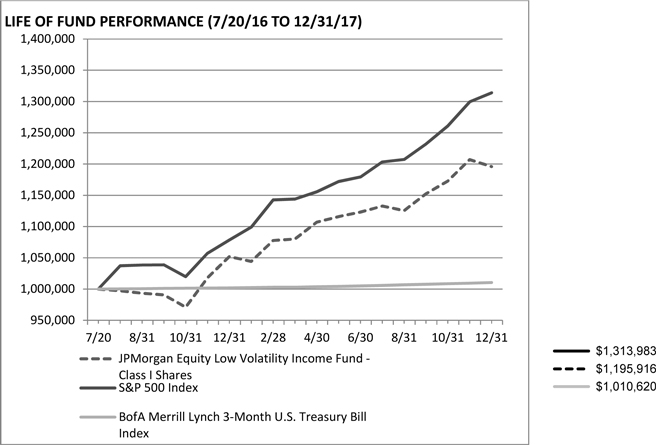
The performance quoted is past performance and is not a guarantee of future results. Mutual funds are subject to certain market risks. Investment returns and principal value of an investment will fluctuate so that an investor’s shares, when redeemed, may be worth more or less than their original cost. Current performance may be higher or lower than the performance data shown. For up-to-date month-end performance information please call 1-800-480-4111.
3
The Fund commenced operations on July 20, 2016.
The graph illustrates comparative performance for $1,000,000 invested in Class I Shares of the JPMorgan Equity Low Volatility Income Fund, the S&P 500 Index and the BofA Merrill Lynch 3-Month U.S. Treasury Bill Index from July 20, 2016 to December 31, 2017. The performance of the Fund assumes reinvestment of all dividends and capital gain distributions, if any, and does not include a sales charge. The performance of the S&P 500 Index does not reflect the deduction of expenses or a sales charge associated with a mutual fund and has been adjusted to reflect reinvestment of all dividends and capital gain distributions of the securities included in the benchmark, if applicable. The S&P 500 Index is an unmanaged index generally representative of the performance of large companies in the U.S. stock market. The BofA Merrill Lynch 3-Month U.S. Treasury Bill Index is comprised of a single issue purchased at the beginning of the month and held for a full month. The index is rebalanced monthly and the issue selected is the outstanding U.S. Treasury Bill that matures closest to, but not beyond 3 months from, the rebalancing date. Investors cannot invest directly in an index.
Class I Shares have a $1,000,000 minimum initial investment.
Since the Fund’s inception, it has not experienced any shareholder activity. If shareholder activity had occurred, the Fund’s performance may have been impacted.
Fund performance may reflect the waiver of the Fund’s fees and reimbursement of expenses for certain periods since the inception date. Without these waivers and reimbursements, performance would have been lower. Also, performance shown in this section does not reflect the deduction of taxes that a shareholder would pay on Fund distributions or redemptions of Fund shares.
The returns shown are based on net asset values calculated for shareholder transactions and may differ from the returns shown in the financial highlights, which reflect adjustments made to the net asset values in accordance with accounting principles generally accepted in the United States of America.
4
JPMorgan Value Plus Fund
FUND SUMMARY
SIX MONTHS ENDED DECEMBER 31, 2017 (Unaudited)
| | | | |
Reporting Period Return: | | | | |
Fund (Class I Shares)* | | | 12.54% | |
Russell 1000 Value Index | | | 8.61% | |
| |
Net Assets as of 12/31/2017 | | $ | 13,868,345 | |
Investment objective** and strategies
The JPMorgan Value Plus Fund (the “Fund”) seeks to provide long-term capital appreciation. Under normal circumstances, the Fund primarily takes long and short positions in equity securities of large companies. Large companies are companies with market capitalizations equal to those within the universe of the Russell 1000 Value Index at the time of purchase. As of the reconstitution of the Russell 1000 Value Index on June 23, 2017, the market capitalizations of the companies in the index ranged from $0.4 billion to $412.5 billion. In implementing its main strategies, the Fund invests primarily in equity securities, including common stocks and real estate investment trusts (REITs).
| | | | | | | | |
TOP TEN LONG POSITIONS OF THE PORTFOLIO*** |
| | | | | | | | | | | | | | |
1. Bank of America Corp | | | | | | | | | | | 4.2 | % | | |
2. Citigroup, Inc | | | | | | | | | | | 3.5 | | |
3. Wells Fargo & Co | | | | | | | | | | | 3.4 | | |
4. General Motors Co. | | | | | | | | | | | 2.6 | | |
5. Delta Air Lines, Inc | | | | | | | | | | | 2.6 | | |
6. Lennar Corp., Class A | | | | | | | | | | | 2.6 | | |
7. KeyCorp | | | | | | | | | | | 2.2 | | |
8. Pioneer Natural Resources Co | | | | | | | | | | | 2.0 | | |
9. Occidental Petroleum Corp | | | | | | | | | | | 2.0 | | |
10. Charles Schwab Corp. (The) | | | | | | | | | | | 2.0 | | |
| | | | | | |
| TOP TEN SHORT POSITIONS OF THE PORTFOLIO**** | | |
1. Clorox Co. (The) | | 7.1% | | | |
2. AbbVie, Inc | | 7.0 | | | |
3. Torchmark Corp | | 6.4 | | | |
4. Praxair, Inc. | | 6.0 | | | |
5. Estee Lauder Cos., Inc. (The), Class A | | 4.9 | | | |
6. Tesla, Inc. | | 4.8 | | | |
7. LyondellBasell Industries NV, Class A | | 4.6 | | | |
8. Chevron Corp. | | 4.4 | | | |
9. Cohen & Steers, Inc. | | 4.1 | | | |
10. Seagate Technology plc | | 3.9 | | | |
| LONG POSITION PORTFOLIO COMPOSITION BY SECTOR*** | |
Financials | | 29.7% | | | |
Consumer Discretionary | | 18.4 | | | |
Industrials | | 11.3 | | | |
Energy | | 10.8 | | | |
Health Care | | 9.5 | | | |
Information Technology | | 5.3 | | | |
Materials | | 5.1 | | | |
Consumer Staples | | 3.4 | | | |
Real Estate | | 2.6 | | | |
Telecommunication Services | | 2.0 | | | |
Utilities | | 0.3 | | | |
Short-Term Investment | | 1.6 | | | |
5
JPMorgan Value Plus Fund
FUND SUMMARY
SIX MONTHS ENDED DECEMBER 31, 2017 (Unaudited) (continued)
| | | | | | |
SHORT POSITION PORTFOLIO COMPOSITION BY SECTOR**** | | | |
Utilities | | | 16.6 | % | |
Consumer Staples | | | 13.9 | | |
Health Care | | | 13.7 | | |
Financials | | | 13.2 | | |
Real Estate | | | 11.4 | | |
Materials | | | 10.5 | | |
Information Technology | | | 9.2 | | |
Consumer Discretionary | | | 7.1 | | |
Energy | | | 4.4 | | |
| * | The return shown is based on net asset values calculated for shareholder transactions and may differ from the return shown in the financial highlights, which reflects adjustments made to the net asset values in accordance with accounting principles generally accepted in the United States of America. |
| ** | The adviser seeks to achieve the Fund’s objective. There can be no guarantee it will be achieved. |
| *** | Percentages indicated are based on total long investments as of December 31, 2017. The Fund’s portfolio composition is subject to change. |
| **** | Percentages indicated are based on total short investments as of December 31, 2017. The Fund’s portfolio composition is subject to change. |
6
JPMorgan Value Plus Fund
FUND SUMMARY
SIX MONTHS ENDED DECEMBER 31, 2017 (Unaudited) (continued)
AVERAGE ANNUAL TOTAL RETURNS AS OF DECEMBER 31, 2017
| | | | | | | | |
| | | INCEPTION DATE
OF CLASS | | 6 MONTH* | | 1 YEAR | | SINCE
INCEPTION |
CLASS A SHARES | | August 31, 2016 | | | | | | |
With Sales Charge** | | | | 6.49% | | 12.75% | | 22.42% |
Without Sales Charge | | | | 12.39 | | 18.97 | | 27.46 |
CLASS C SHARES | | August 31, 2016 | | | | | | |
With CDSC*** | | | | 11.08 | | 17.40 | | 26.80 |
Without CDSC | | | | 12.08 | | 18.40 | | 26.80 |
CLASS I SHARES | | August 31, 2016 | | 12.54 | | 19.27 | | 27.77 |
* Not annualized.
** Sales Charge for Class A Shares is 5.25%.
*** Assumes a 1% CDSC (contingent deferred sales charge) for the 6 month and one year periods and 0% CDSC thereafter.
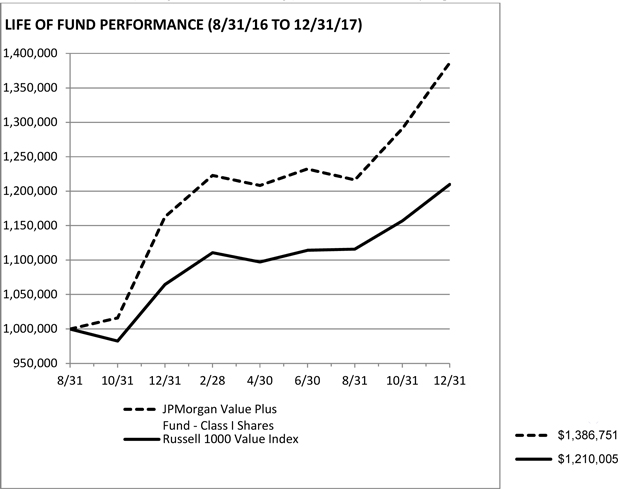
The performance quoted is past performance and is not a guarantee of future results. Mutual funds are subject to certain market risks. Investment returns and principal value of an investment will fluctuate so that an invest-or’s shares, when redeemed, may be worth more or less than their original cost. Current performance may be higher or lower than the performance data shown. For up-to-date month-end performance information please call 1-800-480-4111.
7
The Fund commenced operations on August 31, 2016.
The graph illustrates comparative performance for $1,000,000 invested in Class I Shares of the JPMorgan Value Plus Fund and the Russell 1000 Value Index from August 31, 2016 to December 31, 2017. The performance of the Fund assumes reinvestment of all dividends and capital gain distributions, if any, and does not include a sales charge. The performance of the Russell 1000 Value Index does not reflect the deduction of expenses or a sales charge associated with a mutual fund and approximates the minimum possible dividend reinvestment of the securities included in the benchmark, if applicable. The dividend is reinvested after deduction of withholding tax, applying the maximum rate to non-resident institutional investors who do not benefit from double taxation treaties. The Russell 1000 Value Index is an unmanaged index, which measures the performance of those Russell 1000 companies with lower price-to-book ratios and lower forecasted growth values. Investors cannot invest directly in an index.
Class I Shares have a $1,000,000 minimum initial investment.
Since the Fund’s inception, it has not experienced any shareholder activity. If shareholder activity had occurred, the Fund’s performance may have been impacted.
Fund performance may reflect the waiver of the Fund’s fees and reimbursement of expenses for certain periods since the inception date. Without these waivers and reimbursements, performance would have been lower. Also, performance shown in this section does not reflect the deduction of taxes that a shareholder would pay on Fund distributions or redemptions of Fund shares.
The returns shown are based on net asset values calculated for shareholder transactions and may differ from the returns shown in the financial highlights, which reflect adjustments made to the net asset values in accordance with accounting principles generally accepted in the United States of America.
8
JPMorgan Equity Low Volatility Income Fund
SCHEDULE OF PORTFOLIO INVESTMENTS
AS OF DECEMBER 31, 2017 (Unaudited)
| | | | | | | | |
| SHARES | | | SECURITY DESCRIPTION | | VALUE($) | |
| | Common Stocks — 83.1% | |
| | | | Consumer Discretionary — 3.1% | | | | |
| | | | Hotels, Restaurants & Leisure — 3.1% | | | | |
| | 520 | | | Biglari Holdings, Inc. (a) | | | 215,488 | |
| | 7,430 | | | Nathan’s Famous, Inc. | | | 560,965 | |
| | 3,150 | | | Royal Caribbean Cruises Ltd. | | | 375,732 | |
| | 8,650 | | | Yum Brands, Inc. | | | 705,926 | |
| | | | | | | | |
| | | | Total Consumer Discretionary | | | 1,858,111 | |
| | | | | | | | |
| | | | Consumer Staples — 9.8% | | | | |
| | | | Beverages — 3.0% | | | | |
| | 4,130 | | | Dr Pepper Snapple Group, Inc. | | | 400,858 | |
| | 11,700 | | | PepsiCo, Inc. | | | 1,403,064 | |
| | | | | | | | |
| | | | | | | 1,803,922 | |
| | | | | | | | |
| | | | Food & Staples Retailing — 2.5% | | | | |
| | 24,200 | | | Sysco Corp. | | | 1,469,666 | |
| | | | | | | | |
| | | | Food Products — 2.0% | | | | |
| | 1,400 | | | Bunge Ltd. | | | 93,912 | |
| | 8,000 | | | JM Smucker Co. (The) | | | 993,920 | |
| | 1,700 | | | Tyson Foods, Inc., Class A | | | 137,819 | |
| | | | | | | | |
| | | | | | | 1,225,651 | |
| | | | | | | | |
| | | | Tobacco — 2.3% | | | | |
| | 12,900 | | | Philip Morris International, Inc. | | | 1,362,885 | |
| | | | | | | | |
| | | | Total Consumer Staples | | | 5,862,124 | |
| | | | | | | | |
| | | | Energy — 7.5% | | | | |
| | | | Oil, Gas & Consumable Fuels — 7.5% | | | | |
| | 4,440 | | | Chevron Corp. | | | 555,844 | |
| | 14,130 | | | Exxon Mobil Corp. | | | 1,181,833 | |
| | 5,800 | | | REX American Resources Corp. (a) | | | 480,182 | |
| | 92,470 | | | Ship Finance International Ltd., (Norway) | | | 1,433,285 | |
| | 8,700 | | | Valero Energy Corp. | | | 799,617 | |
| | | | | | | | |
| | | | Total Energy | | | 4,450,761 | |
| | | | | | | | |
| | | | Financials — 16.1% | | | | |
| | | | Banks — 0.7% | | | | |
| | 5,060 | | | American National Bankshares, Inc. | | | 193,798 | |
| | 6,910 | | | Citizens & Northern Corp. | | | 165,840 | |
| | 3,220 | | | Flushing Financial Corp. | | | 88,550 | |
| | | | | | | | |
| | | | | | | 448,188 | |
| | | | | | | | |
| | | | Insurance — 0.9% | | | | |
| | 930 | | | Everest Re Group Ltd. | | | 205,772 | |
| | 3,920 | | | Safety Insurance Group, Inc. | | | 315,168 | |
| | | | | | | | |
| | | | | | | 520,940 | |
| | | | | | | | |
| | | | Mortgage Real Estate Investment Trusts (REITs) — | |
| | | | 3.3% | | | | |
| | 68,600 | | | AG Mortgage Investment Trust, Inc. | | | 1,304,086 | |
| | 20,450 | | | Capstead Mortgage Corp. | | | 176,893 | |
| | 8,500 | | | Chimera Investment Corp. | | | 157,080 | |
| | 8,900 | | | Invesco Mortgage Capital, Inc. | | | 158,687 | |
| | 10,540 | | | Two Harbors Investment Corp. | | | 171,380 | |
| | | | | | | | |
| SHARES | | | SECURITY DESCRIPTION | | VALUE($) | |
| | Common Stocks — continued | | | | |
| | | | Mortgage Real Estate Investment Trusts (REITs) — | |
| | | | continued | | | | |
| | | | | | | | |
| | | | | | | 1,968,126 | |
| | | | | | | | |
| | | | Thrifts & Mortgage Finance — 11.2% | | | | |
| | 24,200 | | | BankFinancial Corp. | | | 371,228 | |
| | 23,940 | | | Charter Financial Corp. | | | 419,907 | |
| | 45,170 | | | Clifton Bancorp, Inc. | | | 772,407 | |
| | 14,340 | | | First Defiance Financial Corp. | | | 745,250 | |
| | 1,650 | | | Hingham Institution for Savings | | | 341,550 | |
| | 66,030 | | | Northwest Bancshares, Inc. | | | 1,104,682 | |
| | 16,630 | | | Provident Financial Holdings, Inc. | | | 305,992 | |
| | 22,380 | | | Territorial Bancorp, Inc. | | | 690,871 | |
| | 123,540 | | | TrustCo Bank Corp. | | | 1,136,568 | |
| | 29,530 | | | United Community Financial Corp. | | | 269,609 | |
| | 29,810 | | | Waterstone Financial, Inc. | | | 508,260 | |
| | | | | | | | |
| | | | | | | 6,666,324 | |
| | | | | | | | |
| | | | Total Financials | | | 9,603,578 | |
| | | | | | | | |
| | | | Health Care — 15.9% | | | | |
| | | | Biotechnology — 1.6% | | | | |
| | 3,300 | | | AbbVie, Inc. | | | 319,143 | |
| | 3,600 | | | Amgen, Inc. | | | 626,040 | |
| | | | | | | | |
| | | | | | | 945,183 | |
| | | | | | | | |
| | | | Health Care Equipment & Supplies — 6.2% | |
| | 1,300 | | | Analogic Corp. | | | 108,875 | |
| | 1,230 | | | Atrion Corp. | | | 775,638 | |
| | 5,000 | | | Baxter International, Inc. | | | 323,200 | |
| | 3,510 | | | Becton Dickinson and Co. | | | 751,351 | |
| | 15,670 | | | Danaher Corp. | | | 1,454,489 | |
| | 3,820 | | | Utah Medical Products, Inc. | | | 310,948 | |
| | | | | | | | |
| | | | | | | 3,724,501 | |
| | | | | | | | |
| | | | Health Care Providers & Services — 4.2% | | | | |
| | 5,300 | | | Anthem, Inc. | | | 1,192,553 | |
| | 5,450 | | | Humana, Inc. | | | 1,351,981 | |
| | | | | | | | |
| | | | | | | 2,544,534 | |
| | | | | | | | |
| | | | Pharmaceuticals — 3.9% | | | | |
| | 10,400 | | | Johnson & Johnson | | | 1,453,088 | |
| | 13,200 | | | Merck & Co., Inc. | | | 742,764 | |
| | 3,200 | | | Pfizer, Inc. | | | 115,904 | |
| | | | | | | | |
| | | | | | | 2,311,756 | |
| | | | | | | | |
| | | | Total Health Care | | | 9,525,974 | |
| | | | | | | | |
| | | | Industrials — 7.6% | | | | |
| | | | Aerospace & Defense — 1.8% | | | | |
| | 3,600 | | | Boeing Co. (The) | | | 1,061,676 | |
| | | | | | | | |
| | | | Commercial Services & Supplies — 5.5% | | | | |
| | 17,010 | | | Republic Services, Inc. | | | 1,150,046 | |
| | 18,090 | | | Tetra Tech, Inc. | | | 871,034 | |
| | 14,950 | | | Waste Management, Inc. | | | 1,290,185 | |
SEE NOTES TO FINANCIAL STATEMENTS.
9
JPMorgan Equity Low Volatility Income Fund
SCHEDULE OF PORTFOLIO INVESTMENTS
AS OF DECEMBER 31, 2017 (Unaudited) (continued)
| | | | | | | | |
| SHARES | | | SECURITY DESCRIPTION | | VALUE($) | |
| | Common Stocks — continued | | | | |
| |
| | | | Commercial Services & Supplies — continued | |
| | | | | | | | |
| | | | | | | 3,311,265 | |
| | | | | | | | |
| | | | Trading Companies & Distributors — 0.3% | |
| | 2,690 | | | Applied Industrial Technologies, Inc. | | | 183,189 | |
| | | | | | | | |
| | | | Total Industrials | | | 4,556,130 | |
| | | | | | | | |
| | | | Information Technology — 5.9% | | | | |
| | | | Internet Software & Services — 0.7% | | | | |
| | 19,000 | | | Blucora, Inc. (a) | | | 419,900 | |
| | | | | | | | |
| | | | IT Services — 1.9% | | | | |
| | 5,260 | | | EVERTEC, Inc., (Puerto Rico) | | | 71,799 | |
| | 6,700 | | | International Business Machines Corp. | | | 1,027,914 | |
| | | | | | | | |
| | | | | | | 1,099,713 | |
| | | | | | | | |
| | | | Software — 3.3% | | | | |
| | 12,700 | | | Cadence Design Systems, Inc. (a) | | | 531,114 | |
| | 3,510 | | | Intuit, Inc. | | | 553,808 | |
| | 5,721 | | | Progress Software Corp. | | | 243,543 | |
| | 17,000 | | | QAD, Inc., Class A | | | 660,450 | |
| | | | | | | | |
| | | | | | | 1,988,915 | |
| | | | | | | | |
| | | | Total Information Technology | | | 3,508,528 | |
| | | | | | | | |
| | | | Materials — 5.8% | | | | |
| | | | Chemicals — 5.8% | | | | |
| | 11,000 | | | Ecolab, Inc. | | | 1,475,980 | |
| | 12,790 | | | Sensient Technologies Corp. | | | 935,589 | |
| | 2,400 | | | Sherwin-Williams Co. (The) | | | 984,096 | |
| | 1,200 | | | Trinseo SA | | | 87,120 | |
| | | | | | | | |
| | | | Total Materials | | | 3,482,785 | |
| | | | | | | | |
| | | | Real Estate — 2.2% | | | | |
| | | | Equity Real Estate Investment Trusts (REITs) — 1.9% | |
| | 17,900 | | | City Office REIT, Inc. | | | 232,879 | |
| | 14,150 | | | CorEnergy Infrastructure Trust, Inc. | | | 540,530 | |
| | 19,000 | | | InfraREIT, Inc. | | | 353,020 | |
| | | | | | | | |
| | | | | | | 1,126,429 | |
| | | | | | | | |
| | | | Real Estate Management & Development — 0.3% | |
| | 3,310 | | | RMR Group, Inc. (The), Class A | | | 196,283 | |
| | | | | | | | |
| | | | Total Real Estate | | | 1,322,712 | |
| | | | | | | | |
| | | | Utilities — 9.2% | | | | |
| | | | Electric Utilities — 0.7% | | | | |
| | 34,500 | | | Spark Energy, Inc., Class A | | | 427,800 | |
| | | | | | | | |
| | | | Gas Utilities — 5.5% | | | | |
| | 16,290 | | | Northwest Natural Gas Co. | | | 971,698 | |
| | 17,580 | | | ONE Gas, Inc. | | | 1,287,911 | |
| | 13,720 | | | Spire, Inc. | | | 1,031,058 | |
| | | | | | | | |
| | | | | | | 3,290,667 | |
| | | | | | | | |
| | | | Multi-Utilities — 3.0% | | | | |
| | 9,280 | | | Consolidated Edison, Inc. | | | 788,336 | |
| | 21,350 | | | Unitil Corp. | | | 973,987 | |
| | | | | | | | |
| SHARES | | | SECURITY DESCRIPTION | | VALUE($) | |
| | Common Stocks — continued | |
| | | | Multi-Utilities — continued | | | | |
| | | | | | | | |
| | | | | | | 1,762,323 | |
| | | | | | | | |
| | | | Total Utilities | | | 5,480,790 | |
| | | | | | | | |
| | | | Total Common Stocks
(Cost $44,686,368) | | | 49,651,493 | |
| | | | | | | | |
|
PRINCIPAL AMOUNT($) | |
| | Equity-Linked Notes — 14.6% | |
| | 15,400 | | | Citigroup Global Markets Holdings, Inc., ELN, 13.75%, 01/23/2018 (linked to Wal-Mart Stores, Inc.) (e) | | | 1,496,889 | |
| | 6,800 | | | Credit Suisse AG, ELN, 16.90%, 01/23/2018 (linked to UnitedHealth Group, Inc.) (e) | | | 1,486,626 | |
| | 23,100 | | | Morgan Stanley, ELN, 16.72%, 01/23/2018 (linked to Amdocs Ltd) (e) | | | 1,492,906 | |
| | 19,500 | | | Morgan Stanley, ELN, 23.65%, 01/23/2018 (linked to Altria Group, Inc.) (e) | | | 1,385,922 | |
| | 8,600 | | | Royal Bank of Canada, ELN, 13.35%, 01/23/2018 (linked to Common Shares of McDonald’s Corp.) (e) | | | 1,479,339 | |
| | 7,600 | | | Royal Bank of Canada, ELN, 16.67%, 01/23/2018 (linked to Common Shares of Home Depot, Inc.) (e) | | | 1,400,506 | |
| | | | | | | | |
| | | | Total Equity-Linked Notes
(Cost $8,739,548) | | | 8,742,188 | |
| | | | | | | | |
|
| SHARES | |
| | Exchange Traded Funds — 1.2% | |
| | |
| | | | U.S. Equity — 1.2% | | | | |
| | 1,554 | | | iShares Russell 2000 Fund | | | 236,923 | |
| | 1,784 | | | SPDR S&P 500 Fund Trust | | | 476,078 | |
| | | | | | | | |
| | | | Total Exchange Traded Funds
(Cost $642,892) | | | 713,001 | |
| | | | | | | | |
| | | | | | | | | |
| | Short-Term Investment — 0.8% | |
| | | | Investment Company — 0.8% | | | | |
| | 492,832 | | | JPMorgan U.S. Government Money Market
Fund, Institutional Class Shares, 1.14%
(b) (l)
(Cost $492,832) | | | 492,832 | |
| | | | | | | | |
| | | | Total Investments — 99.7%
(Cost $54,561,640) | | | 59,599,514 | |
| | | | Other Assets in Excess of
Liabilities — 0.3% | | | 180,148 | |
| | | | | | | | |
| | | | NET ASSETS — 100.0% | | $ | 59,779,662 | |
| | | | | | | | |
Percentages indicated are based on net assets.
SEE NOTES TO FINANCIAL STATEMENTS.
10
JPMorgan Value Plus Fund
SCHEDULE OF PORTFOLIO INVESTMENTS
AS OF DECEMBER 31, 2017 (Unaudited)
| | | | | | | | |
| SHARES | | | SECURITY DESCRIPTION | | VALUE($) | |
| | |
| | Long Positions — 112.4% | | | | |
| | Common Stocks — 110.6% | | | | |
| | | | Consumer Discretionary —20.7% | | | | |
| | | | Auto Components — 2.7% | | | | |
| | 448 | | | Delphi Technologies plc (a) | | | 23,507 | |
| | 2,200 | | | Goodyear Tire & Rubber Co. (The) | | | 71,082 | |
| | 4,988 | | | Magna International, Inc., (Canada) | | | 282,670 | |
| | | | | | | | |
| | | | | | | 377,259 | |
| | | | | | | | |
| | | | Automobiles — 4.4% | | | | |
| | 15,955 | | | Ford Motor Co. (j) | | | 199,278 | |
| | 9,859 | | | General Motors Co. (j) | | | 404,120 | |
| | | | | | | 603,398 | |
| | | | | | | | |
| | | | Hotels, Restaurants & Leisure — 0.8% | | | | |
| | 8,325 | | | Arcos Dorados Holdings, Inc., (Uruguay), | | | | |
| | | | Class A (a) | | | 86,164 | |
| | 100 | | | Chipotle Mexican Grill, Inc. (a) | | | 28,903 | |
| | | | | | | | |
| | | | | | 115,067 | |
| | | | | | | | |
| | | | Household Durables — 6.1% | | | | |
| | 1,512 | | | CalAtlantic Group, Inc. | | | 85,262 | |
| | 3,961 | | | DR Horton, Inc. (j) | | | 202,288 | |
| | 6,300 | | | Lennar Corp., Class A (j) | | | 398,412 | |
| | 3,422 | | | Toll Brothers, Inc. | | | 164,324 | |
| | | | | | | | |
| | | | | | 850,286 | |
| | | | | | | | |
| | | | Leisure Products — 1.2% | | | | |
| | 3,079 | | | Brunswick Corp. | | | 170,022 | |
| | | | | | | | |
| | | | Media — 1.0% | | | | |
| | 3,036 | | | DISH Network Corp., Class A (a) | | | 144,969 | |
| | | | | | | | |
| | | | Specialty Retail — 3.1% | | | | |
| | 153 | | | AutoZone, Inc. (a) | | | 108,840 | |
| | 1,600 | | | Lowe’s Cos., Inc. | | | 148,704 | |
| | 953 | | | Murphy USA, Inc. (a) | | | 76,583 | |
| | 370 | | | O’Reilly Automotive, Inc. (a) | | | 89,000 | |
| | | | | | | | |
| | | | | | 423,127 | |
| | | | | | | | |
| | | | Textiles, Apparel & Luxury Goods — 1.4% | | | | |
| | 1,900 | | | Hanesbrands, Inc. | | | 39,729 | |
| | 3,325 | | | Tapestry, Inc. | | | 147,065 | |
| | | | | | | | |
| | | | | | 186,794 | |
| | | | | | | | |
| | | | Total Consumer Discretionary | | | 2,870,922 | |
| | | | | | | | |
| | | | Consumer Staples — 3.9% | | | | |
| | | | Food & Staples Retailing — 3.0% | | | | |
| | 900 | | | CVS Health Corp. | | | 65,250 | |
| | 5,950 | | | Kroger Co. (The) | | | 163,328 | |
| | 2,325 | | | US Foods Holding Corp. (a) | | | 74,237 | |
| | 1,505 | | | Walgreens Boots Alliance, Inc. | | | 109,293 | |
| | | | | | | | |
| | | | | | | 412,108 | |
| | | | | | | | |
| | | | | | | | |
| SHARES | | | SECURITY DESCRIPTION | | VALUE($) | |
| | Long Positions — continued | |
| | | | Food Products — 0.9% | | | | |
| | 2,900 | | | Mondelez International, Inc., Class A | | | 124,120 | |
| | | | | | | | |
| | | | Total Consumer Staples | | | 536,228 | |
| | | | | | | | |
| | | | Energy — 12.1% | | | | |
| | | | Oil, Gas & Consumable Fuels —12.1% | | | | |
| | 1,119 | | | Anadarko Petroleum Corp. | | | 60,023 | |
| | 508 | | | Concho Resources, Inc. (a) | | | 76,312 | |
| | 2,388 | | | Diamondback Energy, Inc. (a) | | | 301,485 | |
| | 2,839 | | | EOG Resources, Inc. | | | 306,356 | |
| | 1,872 | | | EQT Corp. | | | 106,554 | |
| | 4,266 | | | Occidental Petroleum Corp. | | | 314,234 | |
| | 1,839 | | | Pioneer Natural Resources Co. (j) | | | 317,871 | |
| | 2,400 | | | Plains GP Holdings LP, Class A | | | 52,680 | |
| | 3,880 | | | Suncor Energy, Inc., (Canada) | | | 142,474 | |
| | | | | | | | |
| | | | Total Energy | | | 1,677,989 | |
| | | | | | | | |
| | | | Financials — 33.4% | | | | |
| | | | Banks — 19.5% | | | | |
| | 22,312 | | | Bank of America Corp. (j) | | | 658,650 | |
| | 3,658 | | | BB&T Corp. | | | 181,876 | |
| | 7,334 | | | Citigroup, Inc. (j) | | | 545,723 | |
| | 10,637 | | | Huntington Bancshares, Inc. | | | 154,875 | |
| | 1,524 | | | IBERIABANK Corp. | | | 118,110 | |
| | 17,125 | | | KeyCorp (j) | | | 345,411 | |
| | 620 | | | Signature Bank (a) | | | 85,101 | |
| | 1,017 | | | SunTrust Banks, Inc. | | | 65,688 | |
| | 100 | | | SVB Financial Group (a) | | | 23,377 | |
| | 8,696 | | | Wells Fargo & Co. (j) | | | 527,587 | |
| | | | | | | | |
| | | | | | | 2,706,398 | |
| | | | | | | | |
| | | | Capital Markets — 6.3% | | | | |
| | 2,319 | | | Bank of New York Mellon Corp. (The) | | | 124,901 | |
| | 6,090 | | | Charles Schwab Corp. (The) | | | 312,843 | |
| | 4,498 | | | Deutsche Bank AG (Registered), (Germany) | | | 85,597 | |
| | 3,963 | | | Morgan Stanley | | | 207,939 | |
| | 813 | | | State Street Corp. | | | 79,357 | |
| | 4,911 | | | WisdomTree Investments, Inc. | | | 61,633 | |
| | | | | | | | |
| | | | | | | 872,270 | |
| | | | | | | | |
| | | | Consumer Finance — 1.8% | | | | |
| | 2,401 | | | Ally Financial, Inc. | | | 70,013 | |
| | 1,805 | | | Capital One Financial Corp. | | | 179,742 | |
| | | | | | | | |
| | | | | | | 249,755 | |
| | | | | | | | |
| | | | Diversified Financial Services — 1.4% | | | | |
| | 3,957 | | | Voya Financial, Inc. | | | 195,753 | |
| | | | | | | | |
| | | | Insurance — 4.4% | | | | |
| | 1,300 | | | Athene Holding Ltd., Class A (a) | | | 67,223 | |
| | 1,912 | | | Lincoln National Corp. | | | 146,975 | |
SEE NOTES TO FINANCIAL STATEMENTS.
11
JPMorgan Value Plus Fund
SCHEDULE OF PORTFOLIO INVESTMENTS
AS OF DECEMBER 31, 2017 (Unaudited) (continued)
| | | | | | | | |
| SHARES | | | SECURITY DESCRIPTION | | VALUE($) | |
| | Long Positions — continued | | | | |
| | | | Insurance — continued | | | | |
| | 3,252 | | | MetLife, Inc. (j) | | | 164,421 | |
| | 1,138 | | | Prudential Financial, Inc. | | | 130,847 | |
| | 508 | | | RenaissanceRe Holdings Ltd., (Bermuda) | | | 63,800 | |
| | 916 | | | XL Group Ltd., (Bermuda) | | | 32,207 | |
| | | | | | | | |
| | | | | | | 605,473 | |
| | | | | | | | |
| | | | Total Financials | | | 4,629,649 | |
| | | | | | | | |
| | | | Health Care — 10.7% | | | | |
| | | | Biotechnology — 1.8% | | | | |
| | 100 | | | Biogen, Inc. (a) | | | 31,857 | |
| | 390 | | | Celgene Corp. (a) | | | 40,700 | |
| | 2,387 | | | Gilead Sciences, Inc. (j) | | | 171,005 | |
| | | | | | | | |
| | | | | | | 243,562 | |
| | | | | | | | |
| | | | Health Care Equipment & Supplies — 2.2% | |
| | 2,797 | | | Boston Scientific Corp. (a) | | | 69,338 | |
| | 1,975 | | | Zimmer Biomet Holdings, Inc. | | | 238,323 | |
| | | | | | | | |
| | | | | | | 307,661 | |
| | | | | | | | |
| | | | Health Care Providers & Services — 4.4% | | | | |
| | 370 | | | Aetna, Inc. | | | 66,744 | |
| | 2,515 | | | AmerisourceBergen Corp. | | | 230,927 | |
| | 545 | | | McKesson Corp. | | | 84,993 | |
| | 1,038 | | | UnitedHealth Group, Inc. | | | 228,838 | |
| | | | | | | | |
| | | | | | | 611,502 | |
| | | | | | | | |
| | | | Pharmaceuticals — 2.3% | | | | |
| | 1,098 | | | Allergan plc (j) | | | 179,611 | |
| | 3,842 | | | Pfizer, Inc. | | | 139,157 | |
| | | | | | | 318,768 | |
| | | | | | | | |
| | | | Total Health Care | | | 1,481,493 | |
| | | | | | | | |
| | | | Industrials — 12.7% | | | | |
| | | | Airlines — 6.1% | | | | |
| | 1,524 | | | Alaska Air Group, Inc. | | | 112,029 | |
| | 7,142 | | | Delta Air Lines, Inc. | | | 399,952 | |
| | 3,690 | | | JetBlue Airways Corp. (a) | | | 82,435 | |
| | 2,231 | | | Southwest Airlines Co. | | | 146,019 | |
| | 1,600 | | | United Continental Holdings, Inc. (a) | | | 107,840 | |
| | | | | | | | |
| | | | | | | 848,275 | |
| | | | | | | | |
| | | | | | | |
| | | | Building Products — 0.4% | | | | |
| | 700 | | | Allegion plc | | | 55,692 | |
| | | | | | | |
| | | | Electrical Equipment — 1.5% | | | | |
| | 2,580 | | | Eaton Corp. plc | | | 203,846 | |
| | | | | | | | |
| | | | Industrial Conglomerates — 0.9% | | | | |
| | 7,072 | | | General Electric Co. | | | 123,406 | |
| | | | | | | | |
| | | | Machinery — 2.0% | | | | |
| | 700 | | | Ingersoll-Rand plc | | | 62,433 | |
| | | | | | | | |
| | | | | | | | |
| | | | | | | | |
| SHARES | | | SECURITY DESCRIPTION | | VALUE($) | |
| | Long Positions — continued | |
| | | | Machinery — continued | | | | |
| | 1,200 | | | PACCAR, Inc. | | | 85,296 | |
| | 711 | | | Snap-on, Inc. | | | 123,927 | |
| | | | | | | | |
| | | | | | | 271,656 | |
| | | | | | | | |
| | | | Road & Rail — 1.8% | | | | |
| | 500 | | | Norfolk Southern Corp. | | | 72,450 | |
| | 1,361 | | | Union Pacific Corp. | | | 182,510 | |
| | | | | | | | |
| | | | | | | 254,960 | |
| | | | | | | | |
| | | | Total Industrials | | | 1,757,835 | |
| | | | | | | | |
| | | | Information Technology — 5.9% | | | | |
| | | | Communications Equipment — 0.8% | | | | |
| | 3,049 | | | CommScope Holding Co., Inc. (a) | | | 115,344 | |
| | | | | | | | |
| | | | Electronic Equipment, Instruments & Components — | |
| | | | 0.3% | | | | |
| | 1,250 | | | Corning, Inc. | | | 39,987 | |
| | | | | | | | |
| | | | IT Services — 4.1% | | | | |
| | 407 | | | FleetCor Technologies, Inc. (a) | | | 78,319 | |
| | 1,573 | | | International Business Machines Corp. | | | 241,330 | |
| | 1,724 | | | WEX, Inc. (a) | | | 243,480 | |
| | | | | | | | |
| | | | | | | 563,129 | |
| | | | | | | | |
| | | | Software — 0.5% | | | | |
| | 813 | | | Microsoft Corp. | | | 69,544 | |
| | | | Technology Hardware, Storage & Peripherals — 0.2% | |
| | 200 | | | Apple, Inc. | | | 33,846 | |
| | | | | | | | |
| | | | Total Information Technology | | | 821,850 | |
| | | | | | | | |
| | | | Materials — 5.7% | | | | |
| | | | Chemicals — 2.3% | | | | |
| | 636 | | | Celanese Corp., Series A (j) | | | 68,103 | |
| | 1,810 | | | DowDuPont, Inc. | | | 128,908 | |
| | 1,308 | | | Eastman Chemical Co. (j) | | | 121,173 | |
| | | | | | | | |
| | | | | | | 318,184 | |
| | | | | | | | |
| | | | Metals & Mining — 3.4% | | | | |
| | 9,356 | | | AK Steel Holding Corp. (a) | | | 52,955 | |
| | 2,011 | | | Alcoa Corp. (a) | | | 108,333 | |
| | 5,423 | | | Alumina Ltd., (Australia), ADR | | | 40,727 | |
| | 3,837 | | | Freeport-McMoRan, Inc. (a) | | | 72,749 | |
| | 1,151 | | | Reliance Steel & Aluminum Co. | | | 98,744 | |
| | 3,066 | | | United States Steel Corp. | | | 107,893 | |
| | | | | | | | |
| | | | | | | 481,401 | |
| | | | | | | | |
| | | | Total Materials | | | 799,585 | |
| | | | | | | | |
| | | | Real Estate — 2.9% | | | | |
| | | | Real Estate — 2.9% | | | | |
| | | | Equity Real Estate Investment Trusts (REITs) — 2.6% | |
| | 4,783 | | | Ashford Hospitality Trust, Inc. | | | 32,190 | |
| | 1,700 | | | Brixmor Property Group, Inc. | | | 31,722 | |
SEE NOTES TO FINANCIAL STATEMENTS.
12
JPMorgan Value Plus Fund
SCHEDULE OF PORTFOLIO INVESTMENTS
AS OF DECEMBER 31, 2017 (Unaudited) (continued)
| | | | | | | | |
| SHARES | | | SECURITY DESCRIPTION | | VALUE($) | |
| | Long Positions — continued | |
| | | | Equity Real Estate Investment Trusts (REITs) — continued | |
| | 1,932 | | | JBG SMITH Properties | | | 67,098 | |
| | 4,371 | | | RLJ Lodging Trust | | | 96,031 | |
| | 3,982 | | | Weyerhaeuser Co. | | | 140,405 | |
| | | | | | | | |
| | | | | | | 367,446 | |
| | | | | | | | |
| | | | Real Estate Management & Development — 0.3% | |
| | 2,035 | | | St Joe Co. (The) (a) | | | 36,732 | |
| | | | | | | | |
| | | | Total Real Estate | | | 404,178 | |
| | | | | | | | |
| | | | Telecommunication Services — 2.2% | | | | |
| | | | Diversified Telecommunication Services — 1.7% | |
| | 5,950 | | | AT&T, Inc. | | | 231,336 | |
| | | | | | | | |
| | | | Wireless Telecommunication Services — 0.5% | |
| | 1,151 | | | T-Mobile US, Inc. (a) (j) | | | 73,100 | |
| | | | | | | | |
| | | | Total Telecommunication Services | | | 304,436 | |
| | | | | | | | |
| | | | Utilities — 0.4% | | | | |
| | | | Independent Power and Renewable Electricity Producers — 0.4% | |
| | 1,220 | | | NextEra Energy Partners LP | | | 52,594 | |
| | | | | | | | |
| | | | Total Common Stocks
(Cost $13,096,170) | | | 15,336,759 | |
| | | | | | | | |
| | Short-Term Investment — 1.8% | | | | |
| | |
| | | | Investment Company — 1.8% | | | | |
| | 252,649 | | | JPMorgan U.S. Government Money Market Fund, Institutional Class Shares,
1.14% (b) (l)
(Cost $252,649) | | | 252,649 | |
| | | | | | | | |
| | | | Total Investments — 112.4% (Cost $13,348,819) | | | 15,589,408 | |
| | | | Liabilities in Excess of Other Assets — (12.4)% | | | (1,721,063) | |
| | | | | | | | |
| | | | NET ASSETS — 100.0% | | $ | 13,868,345 | |
| | | | | | | | |
| | | | | | | | |
| | Short Positions — 12.3% | | | | |
| |
| | Common Stocks — 12.3% | | | | |
| | |
| | | | Consumer Discretionary — 0.9% | | | | |
| | | | Automobiles — 0.6% | | | | |
| | 262 | | | Tesla, Inc. (a) | | | 81,574 | |
| | | | | | | | |
| | | | Specialty Retail — 0.3% | | | | |
| | 1,818 | | | Bed Bath & Beyond, Inc. | | | 39,978 | |
| | | | | | | | |
| | | | Total Consumer Discretionary | | | 121,552 | |
| | | | | | | | |
| | | | Consumer Staples — 1.7% | | | | |
| | | | Household Products — 1.1% | | | | |
| | 823 | | | Clorox Co. (The) | | | 122,413 | |
| | | | | | | | |
| SHARES | | | SECURITY DESCRIPTION | | VALUE($) | |
| | | | Household Products — continued | | | | |
| | 341 | | | Procter & Gamble Co. (The) | | | 31,331 | |
| | | | | | | | |
| | | | | | | 153,744 | |
| | | | | | | | |
| | | | Personal Products — 0.6% | | | | |
| | 660 | | | Estee Lauder Cos., Inc. (The), Class A | | | 83,979 | |
| | | | | | | | |
| | | | Total Consumer Staples | | | 237,723 | |
| | | | | | | | |
| | | | Energy — 0.5% | | | | |
| | | | Oil, Gas & Consumable Fuels — 0.5% | | | | |
| | 607 | | | Chevron Corp. | | | 75,990 | |
| | | | | | | | |
| | | | Financials — 1.6% | | | | |
| | | | Capital Markets — 0.8% | | | | |
| | 1,486 | | | Cohen & Steers, Inc. | | | 70,273 | |
| | 1,094 | | | Thomson Reuters Corp., (Canada) | | | 47,688 | |
| | | | | | | | |
| | | | | | | 117,961 | |
| | | | | | | | |
| | | | Insurance — 0.8% | | | | |
| | 1,199 | | | Torchmark Corp. | | | 108,761 | |
| | | | | | | | |
| | | | Total Financials | | | 226,722 | |
| | | | | | | | |
| | | | Health Care — 1.7% | | | | |
| | | | Biotechnology — 1.2% | | | | |
| | 1,239 | | | AbbVie, Inc. | | | 119,824 | |
| | 285 | | | Amgen, Inc. | | | 49,561 | |
| | | | | | | | |
| | | | | | | 169,385 | |
| | | | | | | | |
| | | | Health Care Equipment & Supplies — 0.5% | | | | |
| | 618 | | | Baxter International, Inc. | | | 39,947 | |
| | 218 | | | Edwards Lifesciences Corp. (a) | | | 24,571 | |
| | | | | | | | |
| | | | | | | 64,518 | |
| | | | | | | | |
| | | | Total Health Care | | | 233,903 | |
| | | | | | | | |
| | | | Information Technology — 1.1% | | | | |
| | | | Semiconductors & Semiconductor Equipment — 0.2% | | | | |
| | 181 | | | Lam Research Corp. | | | 33,317 | |
| | | | | | | | |
| | | | Software — 0.4% | | | | |
| | 655 | | | Citrix Systems, Inc. (a) | | | 57,640 | |
| | | | | | | | |
| | | | Technology Hardware, Storage & Peripherals — 0.5% | |
| | 1,600 | | | Seagate Technology plc | | | 66,944 | |
| | | | | | | | |
| | | | Total Information Technology | | | 157,901 | |
| | | | | | | | |
| | | | Materials — 1.3% | | | | |
| | | | Chemicals — 1.3% | | | | |
| | 705 | | | LyondellBasell Industries NV, Class A | | | 77,775 | |
| | 660 | | | Praxair, Inc. | | | 102,089 | |
| | | | | | | | |
| | | | Total Materials | | | 179,864 | |
| | | | | | | | |
| | | | Real Estate — 1.4% | | | | |
| | | | Equity Real Estate Investment Trusts (REITs) — 1.4% | |
| | 590 | | | Macerich Co. (The) | | | 38,751 | |
| | 240 | | | Public Storage | | | 50,160 | |
SEE NOTES TO FINANCIAL STATEMENTS.
13
JPMorgan Value Plus Fund
SCHEDULE OF PORTFOLIO INVESTMENTS
AS OF DECEMBER 31, 2017 (Unaudited) (continued)
| | | | | | | | |
| SHARES | | | SECURITY DESCRIPTION | | VALUE($) | |
| | Short Positions — continued | | | | |
| | | | Equity Real Estate Investment Trusts (REITs) — continued | |
| | 660 | | | Realty Income Corp. | | | 37,633 | |
| | 749 | | | Ventas, Inc. | | | 44,948 | |
| | 364 | | | Welltower, Inc. | | | 23,212 | |
| | | | | | | | |
| | | | Total Real Estate | | 194,704 | |
| | | | | | | | |
| | | | Utilities — 2.1% | | | | |
| | | | Electric Utilities — 1.2% | | | | |
| | 731 | | | Duke Energy Corp. | | | 61,484 | |
| | 257 | | | NextEra Energy, Inc. | | | 40,141 | |
| | 1,209 | | | Southern Co. (The) | | | 58,141 | |
| | | | | | | | |
| | | | | | 159,766 | |
| | | | | | | | |
| | | | Multi-Utilities — 0.9% | | | | |
| | 721 | | | Consolidated Edison, Inc. | | | 61,249 | |
| | 787 | | | Dominion Energy, Inc. | | | 63,794 | |
| | | | | | | | |
| | | | | | 125,043 | |
| | | | | | | | |
| | | | Total Utilities | | 284,809 | |
| | | | | | | | |
| | | | Total Securities Sold Short
(Proceeds $1,539,567) | | $ | 1,713,168 | |
| | | | | | | | |
| | | | | | | | |
Percentages indicated are based on net assets.
SEE NOTES TO FINANCIAL STATEMENTS.
14
J.P. Morgan Funds
NOTES TO SCHEDULES OF PORTFOLIO INVESTMENTS
AS OF DECEMBER 31, 2017 (Unaudited)
| | | | |
ADR | | – | | American Depositary Receipt |
ELN | | – | | Equity-Linked Note |
REIT | | – | | Real Estate Investment Trust |
SPDR | | – | | Standard & Poor’s Depositary Receipts |
| | |
(a) | | – | | Non-income producing security. |
(b) | | – | | Investment in affiliate. Money market fund is registered under the Investment Company Act of 1940, as amended, and advised by J.P. Morgan Investment Management Inc. |
| | |
| | |
(e) | | – | | Security is exempt from registration under Rule 144A of the Securities Act of 1933, as amended. Unless otherwise indicated, this security has been determined to be liquid under procedures established by the Board of Trustees and may be resold in transactions exempt from registration, normally to qualified institutional buyers. |
| | |
| | |
| | |
| | |
| | |
(j) | | – | | All or a portion of this security is segregated as collateral for short sales. The total value of securities and cash segregated as collateral is approximately $3,002,055 and $2,417, respectively. |
| | |
| | |
(l) | | – | | The rate shown is the current yield as of December 31, 2017. |
SEE NOTES TO FINANCIAL STATEMENTS.
15
STATEMENTS OF ASSETS AND LIABILITIES
AS OF DECEMBER 31, 2017 (Unaudited)
| | | | | | | | |
| | | Equity Low Volatility
Income Fund | | | Value Plus Fund | |
| |
ASSETS: | | | | | | | | |
Investments in non-affiliates, at value | | $ | 59,106,682 | | | $ | 15,336,759 | |
Investments in affiliates, at value | | | 492,832 | | | | 252,649 | |
Restricted cash for securities sold short | | | — | | | | 2,417 | |
Receivables: | | | | | | | | |
Investment securities sold | | | 57,798 | | | | — | |
Interest from non-affiliates | | | 226,268 | | | | 13,050 | |
Dividends from affiliates | | | 851 | | | | 211 | |
Due from Adviser | | | — | | | | 2,058 | |
| | | | |
Total Assets | | | 59,884,431 | | | | 15,607,144 | |
| | | | |
| | |
LIABILITIES: | | | | | | | | |
Payables: | | | | | | | | |
Due to custodian | | | 8,191 | | | | 64 | |
Securities sold short, at value | | | — | | | | 1,713,168 | |
Dividend expense to non-affiliates on securities sold short | | | — | | | | 1,104 | |
Investment securities purchased | | | 38,462 | | | | — | |
Interest expense to non-affiliates on securities sold short | | | — | | | | 694 | |
Accrued liabilities: | | | | | | | | |
Investment advisory fees | | | 16,352 | | | | — | |
Administration fees | | | — | | | | 4,600 | |
Distribution fees | | | 20 | | | | 23 | |
Service fees | | | 12,717 | | | | — | |
Custodian and accounting fees | | | 7,939 | | | | 6,196 | |
Trustees’ and Chief Compliance Officer’s fees | | | 126 | | | | — | |
Audit fees | | | 18,246 | | | | 9,710 | |
Other | | | 2,716 | | | | 3,240 | |
| | | | |
Total Liabilities | | | 104,769 | | | | 1,738,799 | |
| | | | |
Net Assets | | $ | 59,779,662 | | | $ | 13,868,345 | |
| | | | |
SEE NOTES TO FINANCIAL STATEMENTS.
16
STATEMENTS OF ASSETS AND LIABILITIES
AS OF DECEMBER 31, 2017 (Unaudited) (continued)
| | | | | | | | |
| |
| Equity Low Volatility
Income Fund |
| | | Value Plus Fund | |
| |
NET ASSETS: | | | | | | | | |
Paid-in-Capital | | $ | 54,247,428 | | | $ | 11,648,272 | |
Accumulated undistributed (distributions in excess of) net investment income | | | 65,133 | | | | (9,559) | |
Accumulated net realized gains (losses) | | | 429,227 | | | | 162,644 | |
Net unrealized appreciation (depreciation) | | | 5,037,874 | | | | 2,066,988 | |
| | | | |
Total Net Assets | | $ | 59,779,662 | | | $ | 13,868,345 | |
| | | | |
| | |
Net Assets: | | | | | | | | |
Class A | | $ | 23,826 | | | $ | 27,645 | |
Class C | | | 23,653 | | | | 27,462 | |
Class I | | | 59,684,204 | | | | 13,813,238 | |
Class R5 | | | 23,981 | | | | — | |
Class R6 | | | 23,998 | | | | — | |
| | | | |
Total | | $ | 59,779,662 | | | $ | 13,868,345 | |
| | | | |
| | |
Outstanding units of beneficial interest (shares) | | | | | | | | |
($0.0001 par value; unlimited number of shares authorized): | | | | | | | | |
Class A | | | 1,434 | | | | 1,513 | |
Class C | | | 1,424 | | | | 1,506 | |
Class I | | | 3,592,065 | | | | 755,582 | |
Class R5 | | | 1,443 | | | | — | |
Class R6 | | | 1,444 | | | | — | |
| | |
Net Asset Value (a): | | | | | | | | |
Class A - Redemption price per share | | $ | 16.62 | | | $ | 18.27 | |
Class C - Offering price per share (b) | | | 16.61 | | | | 18.24 | |
Class I - Offering and redemption price per share | | | 16.62 | | | | 18.28 | |
Class R5 - Offering and redemption price per share | | | 16.62 | | | | — | |
Class R6 - Offering and redemption price per share | | | 16.62 | | | | — | |
Class A maximum sales charge | | | 5.25 | % | | | 5.25% | |
Class A maximum public offering price per share
[net asset value per share/(100% – maximum sales charge)] | | $ | 17.54 | | | $ | 19.28 | |
| | |
| | | | |
| | |
Cost of investments in non-affiliates | | $ | 54,068,808 | | | $ | 13,096,170 | |
Cost of investments in affiliates | | | 492,832 | | | | 252,649 | |
Proceeds from securities sold short | | | — | | | | 1,539,567 | |
(a) Per share amounts may not recalculate due to rounding of net assets and/or shares outstanding.
(b) Redemption price for Class C Shares varies based upon length of time the shares are held.
SEE NOTES TO FINANCIAL STATEMENTS.
17
STATEMENTS OF OPERATIONS
FOR THE SIX MONTHS ENDED DECEMBER 31, 2017 (Unaudited)
| | | | | | | | |
| | | Equity Low
Volatility Income
Fund | | | Value Plus Fund | |
INVESTMENT INCOME: | | | | | | | | |
Dividend income from non-affiliates | | $ | 784,385 | | | $ | 132,875 | |
Dividend income from affiliates | | | 5,890 | | | | 1,185 | |
Interest income from non-affiliates | | | 708,541 | | | | — | |
| | | | |
Total investment income | | | 1,498,816 | | | | 134,060 | |
| | | | |
| | |
EXPENSES: | | | | | | | | |
Investment advisory fees | | | 131,064 | | | | 48,266 | |
Administration fees | | | 23,714 | | | | 5,240 | |
Distribution fees: | | | | | | | | |
Class A | | | 29 | | | | 32 | |
Class C | | | 86 | | | | 96 | |
Service fees: | | | | | | | | |
Class A | | | 29 | | | | 32 | |
Class C | | | 29 | | | | 32 | |
Class I | | | 72,697 | | | | 16,025 | |
Class R5 | | | 11 | | | | — | |
Custodian and accounting fees | | | 16,573 | | | | 12,699 | |
Interest expense to affiliates | | | 398 | | | | — | |
Professional fees | | | 45,343 | | | | 26,334 | |
Trustees’ and Chief Compliance Officer’s fees | | | 12,719 | | | | 12,876 | |
Printing and mailing costs | | | 2,705 | | | | 2,275 | |
Registration and filing fees | | | 217 | | | | 1,624 | |
Transfer agency fees (See Note 2.G.) | | | 665 | | | | 312 | |
Offering costs | | | 4,288 | | | | 2,402 | |
Other | | | 3,525 | | | | 3,222 | |
Dividend expense to non-affiliates on securities sold short | | | — | | | | 21,866 | |
Interest expense to non-affiliates on securities sold short | | | — | | | | 4,252 | |
| | | | |
Total expenses | | | 314,092 | | | | 157,585 | |
| | | | |
Less fees waived | | | (65,880 | ) | | | (58,139) | |
Less earnings credits | | | (105 | ) | | | — | |
Less expense reimbursements | | | (4,146 | ) | | | (12,233) | |
| | | | |
Net expenses | | | 243,961 | | | | 87,213 | |
| | | | |
Net investment income (loss) | | | 1,254,855 | | | | 46,847 | |
| | | | |
| | |
REALIZED/UNREALIZED GAINS (LOSSES): | | | | | | | | |
Net realized gain (loss) on transactions from: | | | | | | | | |
Investments in non-affiliates | | | 544,350 | | | | 623,897 | |
Securities sold short | | | — | | | | 4,201 | |
| | | | |
Net realized gain (loss) | | | 544,350 | | | | 628,098 | |
| | | | |
Change in net unrealized appreciation/depreciation on: | | | | | | | | |
Investments in non-affiliates | | | 1,862,958 | | | | 972,099 | |
Securities sold short | | | — | | | | (103,383) | |
| | | | |
Change in net unrealized appreciation/depreciation | | | 1,862,958 | | | | 868,716 | |
| | | | |
Net realized/unrealized gains (losses) | | | 2,407,308 | | | | 1,496,814 | |
| | | | |
Change in net assets resulting from operations | | $ | 3,662,163 | | | $ | 1,543,661 | |
| | | | |
SEE NOTES TO FINANCIAL STATEMENTS.
18
STATEMENTS OF CHANGES IN NET ASSETS
FOR THE PERIODS INDICATED
| | | | | | | | | | | | | | | | |
| | | Equity Low Volatility Income Fund | | | Value Plus Fund | |
| | | Six Months Ended
December 31, 2017 (Unaudited) | | | Period Ended
June 30, 2017 (a) | | | Six Months Ended
December 31, 2017 (Unaudited) | | | Period Ended
June 30, 2017 (b) | |
CHANGE IN NET ASSETS RESULTING FROM OPERATIONS: | | | | | | | | | | | | | |
Operations: | | | | | | | | | | | | | | | | |
Net investment income (loss) | | $ | 1,254,855 | | | $ | 2,061,422 | | | $ | 46,847 | | | $ | 65,715 | |
Net realized gain (loss) | | | 544,350 | | | | 881,161 | | | | 628,098 | | | | 1,060,697 | |
Change in net unrealized appreciation/depreciation | | | 1,862,958 | | | | 3,174,916 | | | | 868,716 | | | | 1,198,272 | |
| | | | |
Change in net assets resulting from operations | | | 3,662,163 | | | | 6,117,499 | | | | 1,543,661 | | | | 2,324,684 | |
| | | | |
| | | | |
DISTRIBUTIONS TO SHAREHOLDERS: | | | | | | | | | | | | | | | | |
Class A | | | | | | | | | | | | | | | | |
From net investment income | | | (456) | | | | (762) | | | | (134) | | | | (37) | |
From net realized gains | | | (398) | | | | — | | | | (3,044) | | | | — | |
Class C | | | | | | | | | | | | | | | | |
From net investment income | | | (396) | | | | (663) | | | | (11) | | | | (14) | |
From net realized gains | | | (396) | | | | — | | | | (3,041) | | | | — | |
Class I | | | | | | | | | | | | | | | | |
From net investment income | | | (1,214,493) | | | | (2,028,610) | | | | (97,632) | | | | (27,262) | |
From net realized gains | | | (997,757) | | | | — | | | | (1,517,147) | | | | — | |
Class R5 | | | | | | | | | | | | | | | | |
From net investment income | | | (511) | | | | (853 | ) | | | — | | | | — | |
From net realized gains | | | (401) | | | | — | | | | — | | | | — | |
Class R6 | | | | | | | | | | | | | | | | |
From net investment income | | | (517) | | | | (863 | ) | | | — | | | | — | |
From net realized gains | | | (401) | | | | — | | | | — | | | | — | |
| | | | |
Total distributions to shareholders | | | (2,215,726) | | | | (2,031,751 | ) | | | (1,621,009) | | | | (27,313) | |
| | | | |
| | | | |
CAPITAL TRANSACTIONS: | | | | | | | | | | | | | | | | |
Change in net assets resulting from capital transactions | | | 2,215,726 | | | | 52,031,751 | | | | 1,621,009 | | | | 10,027,313 | |
| | | | |
| | | | |
NET ASSETS: | | | | | | | | | | | | | | | | |
Change in net assets | | | 3,662,163 | | | | 56,117,499 | | | | 1,543,661 | | | | 12,324,684 | |
Beginning of period | | | 56,117,499 | | | | — | | | | 12,324,684 | | | | — | |
| | | | |
End of period | | $ | 59,779,662 | | | $ | 56,117,499 | | | $ | 13,868,345 | | | $ | 12,324,684 | |
| | | | |
| | | | |
Accumulated undistributed (distributions in excess of) net investment income | | $ | 65,133 | | | $ | 26,651 | | | $ | (9,559) | | | $ | 41,371 | |
| | | | |
| | | | |
(a) Commencement of operations was July 20, 2016.
(b) Commencement of operations was August 31, 2016.
SEE NOTES TO FINANCIAL STATEMENTS.
19
STATEMENTS OF CHANGES IN NET ASSETS
FOR THE PERIODS INDICATED (continued)
| | | | | | | | | | | | | | | | |
| | | Equity Low Volatility Income Fund | | | Value Plus Fund | |
| | | Six Months Ended
December 31, 2017 (Unaudited) | | | Period Ended
June 30, 2017 (a) | | | Six Months Ended
December 31, 2017 (Unaudited) | | | Period Ended
June 30, 2017 (b) | |
CAPITAL TRANSACTIONS: | | | | | | | | | | | | | | | | |
Class A | | | | | | | | | | | | | | | | |
Proceeds from shares issued | | $ | — | | | $ | 20,000 | | | $ | — | | | $ | 20,000 | |
Distributions reinvested | | | 854 | | | | 762 | | | | 3,178 | | | | 37 | |
| | | | |
Change in net assets resulting from Class A capital transactions | | $ | 854 | | | $ | 20,762 | | | $ | 3,178 | | | $ | 20,037 | |
| | | | |
Class C | | | | | | | — | | | | — | | | | — | |
Proceeds from shares issued | | $ | — | | | $ | 20,000 | | | $ | — | | | $ | 20,000 | |
Distributions reinvested | | | 792 | | | | 663 | | | | 3,052 | | | | 14 | |
| | | | |
Change in net assets resulting from Class C capital transactions | | $ | 792 | | | $ | 20,663 | | | $ | 3,052 | | | $ | 20,014 | |
| | | | |
Class I | | | | | | | — | | | | — | | | | — | |
Proceeds from shares issued | | $ | — | | | $ | 50,210,475 | | | $ | — | | | $ | 10,437,694 | |
Distributions reinvested | | | 2,212,250 | | | | 2,028,610 | | | | 1,614,779 | | | | 27,262 | |
Cost of shares redeemed | | | — | | | | (290,475) | | | | — | | | | (477,694) | |
| | | | |
Change in net assets resulting from Class I capital transactions | | $ | 2,212,250 | | | $ | 51,948,610 | | | $ | 1,614,779 | | | $ | 9,987,262 | |
| | | | |
Class R5 | | | | | | | — | | | | — | | | | — | |
Proceeds from shares issued | | $ | — | | | $ | 20,000 | | | $ | — | | | $ | — | |
Distributions reinvested | | | 912 | | | | 853 | | | | — | | | | — | |
| | | | |
Change in net assets resulting from Class R5 capital transactions | | $ | 912 | | | $ | 20,853 | | | $ | — | | | $ | — | |
| | | | |
Class R6 | | | | | | | — | | | | — | | | | — | |
Proceeds from shares issued | | $ | — | | | $ | 20,000 | | | $ | — | | | $ | — | |
Distributions reinvested | | | 918 | | | | 863 | | | | — | | | | — | |
| | | | |
Change in net assets resulting from Class R6 capital transactions | | $ | 918 | | | $ | 20,863 | | | $ | — | | | $ | — | |
| | | | |
| |
| | | | |
Total change in net assets resulting from capital transactions | | $ | 2,215,726 | | | $ | 52,031,751 | | | $ | 1,621,009 | | | $ | 10,027,313 | |
| | | | |
| | | | |
(a) Commencement of operations was July 20, 2016.
(b) Commencement of operations was August 31, 2016.
SEE NOTES TO FINANCIAL STATEMENTS.
20
STATEMENTS OF CHANGES IN NET ASSETS
FOR THE PERIODS INDICATED (continued)
| | | | | | | | | | | | | | | | |
| | | Equity Low Volatility Income Fund | | | Value Plus Fund | |
| | | Six Months Ended
December 31, 2017 (Unaudited) | | | Period Ended
June 30, 2017 (a) | | | Six Months Ended
December 31, 2017 (Unaudited) | | | Period Ended
June 30, 2017 (b) | |
SHARE TRANSACTIONS: | | | | | | | | | | | | | | | | |
Class A | | | | | | | | | | | | | | | | |
Issued | | | — | | | | 1,334 | | | | — | | | | 1,333 | |
Reinvested | | | 51 | | | | 49 | | | | 178 | | | | 2 | |
| | | | |
Change in Class A Shares | | | 51 | | | | 1,383 | | | | 178 | | | | 1,335 | |
| | | | |
| | | | |
Class C | | | | | | | | | | | | | | | | |
Issued | | | — | | | | 1,333 | | | | — | | | | 1,333 | |
Reinvested | | | 48 | | | | 43 | | | | 172 | | | | 1 | |
| | | | |
Change in Class C Shares | | | 48 | | | | 1,376 | | | | 172 | | | | 1,334 | |
| | | | |
| | | | |
Class I | | | | | | | | | | | | | | | | |
Issued | | | — | | | | 3,346,948 | | | | — | | | | 690,928 | |
Reinvested | | | 133,038 | | | | 131,027 | | | | 90,035 | | | | 1,546 | |
Redeemed | | | — | | | | (18,948 | ) | | | — | | | | (26,927) | |
| | | | |
Change in Class I Shares | | | 133,038 | | | | 3,459,027 | | | | 90,035 | | | | 665,547 | |
| | | | |
| | | | |
Class R5 | | | | | | | | | | | | | | | | |
Issued | | | — | | | | 1,333 | | | | — | | | | — | |
Reinvested | | | 55 | | | | 55 | | | | — | | | | — | |
| | | | |
Change in Class R5 Shares | | | 55 | | | | 1,388 | | | | — | | | | — | |
| | | | |
| | | | |
Class R6 | | | | | | | | | | | | | | | | |
Issued | | | — | | | | 1,333 | | | | — | | | | — | |
Reinvested | | | 55 | | | | 56 | | | | — | | | | — | |
| | | | |
Change in Class R6 Shares | | | 55 | | | | 1,389 | | | | — | | | | — | |
| | | | |
| | | | |
(a) Commencement of operations was July 20, 2016.
(b) Commencement of operations was August 31, 2016.
SEE NOTES TO FINANCIAL STATEMENTS.
21
STATEMENT OF CASH FLOWS
FOR THE SIX MONTHS ENDED DECEMBER 31, 2017 (Unaudited)
| | | | |
| | | Value Plus
Fund | |
INCREASE (DECREASE) IN CASH | | | | |
Cash flows provided (used) by operating activities: | | | | |
Increase in net assets resulting from operations | | $ | 1,543,661 | |
Adjustments to reconcile net increase / decrease in net assets resulting from operations to net cash provided (used) by operating activities: | | | | |
Purchase of investment securities | | | (6,149,441 | ) |
Proceeds from disposition of investment securities | | | 6,067,742 | |
Covers of investment securities sold short | | | (503,756 | ) |
Proceeds from investment securities sold short | | | 558,024 | |
Purchases of short-term investments - affiliates, net | | | (7,922 | ) |
Change in unrealized (appreciation) / depreciation on investments | | | (972,099 | ) |
Change in unrealized (appreciation) / depreciation on investment securities sold short | | | 103,383 | |
Net realized (gain) / loss on investments | | | (623,897 | ) |
Net realized (gain) / loss on investments securities sold short | | | (4,201 | ) |
Decrease in restricted cash for securities sold short | | | 1,112 | |
Increase in interest receivable from non-affiliates | | | (1,962 | ) |
Increase in dividends receivable from affiliates | | | (27 | ) |
Decrease in tax reclaims | | | 107 | |
Decrease in due from Adviser | | | 97 | |
Decrease in deferred offering cost | | | 2,402 | |
Decrease in dividend expenses to non-affiliates on securities sold short | | | (318 | ) |
Decrease in interest expense to non-affiliates on securities sold short | | | (210 | ) |
Increase in administration fees payable | | | 4,600 | |
Increase in distribution fees payable | | | 3 | |
Increase in custodian and accounting fees payable | | | 6,196 | |
Decrease in service fees payable | | | (1,372 | ) |
Decrease in in audit fees payable | | | (18,790 | ) |
Decrease in other accrued expenses payable | | | (2,395 | ) |
| | | | |
Net cash provided (used) by operating activities | | | 937 | |
| | | | |
| |
Cash flows provided (used) by financing activities: | | | | |
Decrease in due to custodian | | | (937 | ) |
Proceeds from shares issued | | | 1,621,009 | |
Payment for shares redeemed | | | (1,621,009 | ) |
| | | | |
Net cash provided (used) by financing activities | | | (937 | ) |
| | | | |
Net increase / (decrease) in cash | | | - | |
| | | | |
| |
Cash: | | | | |
Beginning of period | | | - | |
| | | | |
End of period | | $ | - | |
| | | | |
Supplemental disclosure of cash flow information:
For the six months ended December 31, 2017, the Fund paid $4,462 in interest expenses for securities sold short.
For purposes of reporting the Statement of Cash Flows, the Fund considers all cash accounts that are not subject to withdrawal restrictions or penalties to be cash equivalents.
SEE NOTES TO FINANCIAL STATEMENTS.
22
FINANCIAL HIGHLIGHTS
FOR THE PERIODS INDICATED
| | | | | | | | | | | | | | | | | | | | | | | | | | | | | | | | | | | | | | | | | | | | | | | | | | | | | | | | |
| | | Per share operating performance | | | Ratios/Supplemental data | |
| | | | | | Investment operations | | | Distributions | | | | | | | | | | | | Ratios to average net assets (a) | |
| |
| Net asset
value, beginning of period |
| |
| Net investment
income (loss) (b) |
| |
| Net realized and
unrealized gains (losses) on investments |
| |
| Total from
investment operations |
| |
| Net
investment income |
| |
| Net
realized gain |
| |
| Total
distributions |
| |
| Net asset
value, end of period |
| |
| Total return
(excludes sales charge) (c)(d) |
| |
| Net assets,
end of period |
| |
| Net expenses
(e)(f) |
| |
| Net
investment income (loss) (f) |
| |
| Expenses
without waivers, reimbursements
and earnings
credits (f) |
| |
| Portfolio
turnover
rate (c) |
|
Equity Low Volatility Income Fund | | | | | | | | | | | | | | | | | | | | | | | | | | | | | | | | | | | | | | | | | | | | | | | | | | | | | | | | |
Class A | | | | | | | | | | | | | | | | | | | | | | | | | | | | | | | | | | | | | | | | | | | | | | | | | | | | | | | | |
Six Months Ended December 31, 2017 (Unaudited) | | | $16.20 | | | | $0.34 | | | | $0.69 | | | | $1.03 | | | | $(0.33 | ) | | | $ (0.28 | ) | | | $ (0.61 | ) | | | $16.62 | | | | 6.41 % | | | | $23,826 | | | | 1.09% | | | | 4.05 % | | | | 2.07% | | | | 44 % | |
July 20, 2016 (g) through June 30, 2017 | | | 15.00 | | | | 0.57 | | | | 1.19 | | | | 1.76 | | | | (0.56 | ) | | | — | | | | (0.56 | ) | | | 16.20 | | | | 11.99 | | | | 22,394 | | | | 1.08 | | | | 3.92 | | | | 1.82 | | | | 73 | |
Class C | | | | | | | | | | | | | | | | | | | | | | | | | | | | | | | | | | | | | | | | | | | | | | | | | | | | | | | | |
Six Months Ended December 31, 2017 (Unaudited) | | | 16.20 | | | | 0.30 | | | | 0.67 | | | | 0.97 | | | | (0.28 | ) | | | (0.28 | ) | | | (0.56 | ) | | | 16.61 | | | | 6.07 | | | | 23,653 | | | | 1.59 | | | | 3.56 | | | | 2.57 | | | | 44 | |
July 20, 2016 (g) through June 30, 2017 | | | 15.00 | | | | 0.50 | | | | 1.19 | | | | 1.69 | | | | (0.49 | ) | | | — | | | | (0.49 | ) | | | 16.20 | | | | 11.47 | | | | 22,289 | | | | 1.58 | | | | 3.43 | | | | 2.34 | | | | 73 | |
Class I | | | | | | | | | | | | | | | | | | | | | | | | | | | | | | | | | | | | | | | | | | | | | | | | | | | | | | | | |
Six Months Ended December 31, 2017 (Unaudited) | | | 16.20 | | | | 0.36 | | | | 0.69 | | | | 1.05 | | | | (0.35 | ) | | | (0.28 | ) | | | (0.63 | ) | | | 16.62 | | | | 6.54 | | | | 59,684,204 | | | | 0.84 | | | | 4.31 | | | | 1.07 | | | | 44 | |
July 20, 2016 (g) through June 30, 2017 | | | 15.00 | | | | 0.61 | | | | 1.19 | | | | 1.80 | | | | (0.60 | ) | | | — | | | | (0.60 | ) | | | 16.20 | | | | 12.25 | | | | 56,027,827 | | | | 0.83 | | | | 4.17 | | | | 1.25 | | | | 73 | |
Class R5 | | | | | | | | | | | | | | | | | | | | | | | | | | | | | | | | | | | | | | | | | | | | | | | | | | | | | | | | |
Six Months Ended December 31, 2017 (Unaudited) | | | 16.20 | | | | 0.38 | | | | 0.68 | | | | 1.06 | | | | (0.36 | ) | | | (0.28 | ) | | | (0.64 | ) | | | 16.62 | | | | 6.64 | | | | 23,981 | | | | 0.64 | | | | 4.51 | | | | 1.66 | | | | 44 | |
July 20, 2016 (g) through June 30, 2017 | | | 15.00 | | | | 0.64 | | | | 1.19 | | | | 1.83 | | | | (0.63 | ) | | | — | | | | (0.63 | ) | | | 16.20 | | | | 12.46 | | | | 22,489 | | | | 0.63 | | | | 4.37 | | | | 1.41 | | | | 73 | |
Class R6 | | | | | | | | | | | | | | | | | | | | | | | | | | | | | | | | | | | | | | | | | | | | | | | | | | | | | | | | |
Six Months Ended December 31, 2017 (Unaudited) | | | 16.20 | | | | 0.38 | | | | 0.69 | | | | 1.07 | | | | (0.37 | ) | | | (0.28 | ) | | | (0.65 | ) | | | 16.62 | | | | 6.67 | | | | 23,998 | | | | 0.59 | | | | 4.56 | | | | 1.57 | | | | 44 | |
July 20, 2016 (g) through June 30, 2017 | | | 15.00 | | | | 0.64 | | | | 1.20 | | | | 1.84 | | | | (0.64 | ) | | | — | | | | (0.64 | ) | | | 16.20 | | | | 12.52 | | | | 22,500 | | | | 0.58 | | | | 4.42 | | | | 1.34 | | | | 73 | |
| (a) | Annualized for periods less than one year, unless otherwise noted. |
| (b) | Calculated based upon average shares outstanding. |
| (c) | Not annualized for periods less than one year. |
| (d) | Includes adjustments in accordance with accounting principles generally accepted in the United States of America and as such, the net asset values for financial reporting purposes and the returns based upon those net asset values may differ from the net asset values and returns for shareholder transactions. |
| (e) | Includes earnings credits and interest expense, if applicable, each of which is less than 0.005% unless otherwise noted. |
| (f) | Certain non-recurring expenses incurred by the Fund were not annualized for the six months ended December 31, 2017 and the period ended June 30, 2017. |
| (g) | Commencement of operations. |
SEE NOTES TO FINANCIAL STATEMENTS.
23
FINANCIAL HIGHLIGHTS
FOR THE PERIODS INDICATED (continued)
| | | | | | | | | | | | | | | | | | | | | | | | | | | | | | | | | | | | | | | | | | | | | | | | | | | | | | | | | | | | |
| | | Per share operating performance | | | Ratios/Supplemental data | |
| | | Investment operations | | | Distributions | | | | | | | | | | | | Ratios to average net assets (a) | | | | | | | |
| | | Net asset value, beginning of period | | | Net investment income (loss) (b) | | | Net realized and unrealized gains (losses) on investments | | | Total from investment operations | | | Net investment income | | | Net realized gain | | | Total distributions | | | Net asset value, end of period | | | Total return (excludes sales charge) (c)(d) | | | Net assets, end of period | | | Net expenses (including dividend and interest expense for securities sold short) (e)(f) | | | Net investment income (loss) (f) | | | Expenses without waivers, reimbursements and earnings credits (including dividend and interest expense for securities sold short) (f)(g) | | | Portfolio turnover rate (excluding securities sold short) (c) | | | Portfolio turnover rate (including securities sold short) (c) | |
Value Plus Fund | | | | | | | | | | | | | | | | | | | | | | | | | | | | | | | | | | | | | | | | | | | | | | | | | | | | | | | | | | | | |
Class A | | | | | | | | | | | | | | | | | | | | | | | | | | | | | | | | | | | | | | | | | | | | | | | | | | | | | | | | | | | | |
Six Months Ended December 31, 2017 (Unaudited) | | | $18.42 | | | | $0.05 | | | | $2.17 | | | | $2.22 | | | | $(0.09) | | | | $ (2.28) | | | | $ (2.37) | | | | $18.27 | | | | 12.39% | | | | $27,645 | | | | 1.61% | | | | 0.47% | | | | 3.33% | | | | 44% | | | | 48% | |
August 31, 2016 (h) through June 30, 2017 | | | 15.00 | | | | 0.06 | | | | 3.39 | | | | 3.45 | | | | (0.03) | | | | — | | | | (0.03) | | | | 18.42 | | | | 22.99 | | | | 24,599 | | | | 1.58 | | | | 0.44 | | | | 3.04 | | | | 91 | | | | 110 | |
Class C | | | | | | | | | | | | | | | | | | | | | | | | | | | | | | | | | | | | | | | | | | | | | | | | | | | | | | | | | | | | |
Six Months Ended December 31, 2017 (Unaudited) | | | 18.36 | | | | — (i) | | | | 2.17 | | | | 2.17 | | | | (0.01) | | | | (2.28) | | | | (2.29) | | | | 18.24 | | | | 12.14 | | | | 27,462 | | | | 2.11 | | | | (0.03) | | | | 3.84 | | | | 44 | | | | 48 | |
August 31, 2016 (h) through June 30, 2017 | | | 15.00 | | | | (0.01) | | | | 3.38 | | | | 3.37 | | | | (0.01) | | | | — | | | | (0.01) | | | | 18.36 | | | | 22.47 | | | | 24,497 | | | | 2.08 | | | | (0.06) | | | | 3.50 | | | | 91 | | | | 110 | |
Class I | | | | | | | | | | | | | | | | | | | | | | | | | | | | | | | | | | | | | | | | | | | | | | | | | | | | | | | | | | | | |
Six Months Ended December 31, 2017 (Unaudited) | | | 18.44 | | | | 0.07 | | | | 2.18 | | | | 2.25 | | | | (0.13) | | | | (2.28) | | | | (2.41) | | | | 18.28 | | | | 12.54 | | | | 13,813,238 | | | | 1.36 | | | | 0.72 | | | | 2.43 | | | | 44 | | | | 48 | |
August 31, 2016 (h) through June 30, 2017 | | | 15.00 | | | | 0.10 | | | | 3.38 | | | | 3.48 | | | | (0.04) | | | | — | | | | (0.04) | | | | 18.44 | | | | 23.22 | | | | 12,275,588 | | | | 1.33 | | | | 0.69 | | | | 2.65 | | | | 91 | | | | 110 | |
| (a) | Annualized for periods less than one year, unless otherwise noted. |
| (b) | Calculated based upon average shares outstanding. |
| (c) | Not annualized for periods less than one year. |
| (d) | Includes adjustments in accordance with accounting principles generally accepted in the United States of America and as such, the net asset values for financial reporting purposes and the returns based upon those net asset values may differ from the net asset values and returns for shareholder transactions. |
| (e) | Includes earnings credits and interest expense, if applicable, each of which is less than 0.005% unless otherwise noted. |
| (f) | Certain non-recurring expenses incurred by the Fund were not annualized for the six months ended December 31, 2017 and the period ended June 30, 2017. |
| (g) | The net expenses and expenses without waivers, reimbursements and earnings credits (excluding dividend and interest expense for securities sold short) for Class A are 1.20% and 2.92% for the six months ended December 31, 2017 and 1.17% and 2.65% for the period ended June 30, 2017; for Class C are 1.70% and 3.43% for the six months ended December 31, 2017 and 1.67% and 3.11% for the period ended June 30, 2017 and for Class I are 0.95% and 2.02% for the six months ended December 31, 2017 and 0.93% and 2.26% for period ended June 30, 2017, respectively. |
| (h) | Commencement of operations. |
| (i) | Amount rounds to less than $0.005. |
SEE NOTES TO FINANCIAL STATEMENTS.
24
NOTES TO FINANCIAL STATEMENTS
AS OF DECEMBER 31, 2017 (Unaudited)
1. Organization
JPMorgan Trust I ( “JPM I”) and JPMorgan Trust IV (“JPM IV”) were formed on November 12, 2004 and November 11, 2015, respectively, as Delaware statutory trusts, pursuant to Declarations of Trust dated November 5, 2004 and November 11, 2015, respectively, and are registered under the Investment Company Act of 1940, as amended (the “1940 Act”), as open-end management investment companies.
The following are 2 separate funds of the Trusts (collectively, the “Funds”) covered by this report:
| | | | | | |
| | | Classes Offered | | Trust | | Diversified/Non- Diversified |
| Equity Low Volatility Income Fund | | Class A, Class C, Class I, Class R5 and Class R6 | | JPM I | | Diversified |
| Value Plus Fund | | Class A, Class C and Class I | | JPM IV | | Diversified |
The investment objective of the Equity Low Volatility Income Fund is to seek total return which includes current income and capital appreciation.
The investment objective of the Value Plus Fund is to seek to provide long-term capital appreciation.
The Equity Low Volatility Income Fund and Value Plus Fund commenced operations on July 20, 2016 and August 31, 2016, respectively. Currently, the Funds are not publicly offered for investment.
Class A Shares generally provide for a front-end sales charge while Class C Shares provide for a contingent deferred sales charge (“CDSC”). No sales charges are assessed with respect to Class I, Class R5 and Class R6 Shares. Certain Class A Shares, for which front-end sales charges have been waived, may be subject to a CDSC as described in the Funds’ prospectuses. Beginning on November 14, 2017, Class C Shares automatically convert to Class A Shares after ten years. All classes of shares have equal rights as to earnings, assets and voting privileges, except that each class may bear different transfer agency, distribution and service fees and each class has exclusive voting rights with respect to its distribution plan and shareholder servicing agreements.
J.P. Morgan Investment Management Inc. (“JPMIM”), an indirect, wholly-owned subsidiary of JPMorgan Chase & Co. (“JPMorgan”), acts as Adviser (the “Adviser”) and Administrator (the “Administrator”) to the Funds.
2. Significant Accounting Policies
The following is a summary of significant accounting policies followed by the Funds in the preparation of their financial statements. The Funds are investment companies and, accordingly, follow the investment company accounting and reporting guidance of the Financial Accounting Standards Board Accounting Standards Codification Topic 946 - Investment Companies, which is part of U.S. generally accepted accounting principles (“GAAP”). The preparation of financial statements in conformity with GAAP requires management to make estimates and assumptions that affect the reported amounts of assets and liabilities and disclosure of contingent assets and liabilities at the date of the financial statements and the reported amounts of increases and decreases in net assets from operations during the reporting period. Actual results could differ from those estimates.
A. Valuation of Investments — The valuation of investments is in accordance with GAAP and the Funds’ valuation policies set forth by and under the supervision and responsibility of the Board of Trustees (the “Board”), which established the following approach to valuation, as described more fully below: (i) investments for which market quotations are readily available shall be valued at such unadjusted quoted prices and (ii) all other investments for which market quotations are not readily available shall be valued at their fair value as determined in good faith by the Board.
The Administrator has established the J.P. Morgan Asset Management Americas Valuation Committee (“AVC”) to assist the Board with the oversight and monitoring of the valuation of the Funds’ investments. The Administrator implements the valuation policies of the Funds’ investments, as directed by the Board. The AVC oversees and carries out the policies for the valuation of investments held in the Funds. This includes monitoring the appropriateness of fair values based on results of ongoing valuation oversight, including but not limited to consideration of macro or security specific events, market events and pricing vendor and broker due diligence. The Administrator is responsible for discussing and assessing the potential impacts to the fair values on an ongoing basis, and at least on a quarterly basis with the AVC and the Board.
Equities and other exchange-traded instruments are valued at the last sale price or official market closing price on the primary exchange on which the instrument is traded before the net asset values (“NAV”) of the Funds are calculated on a valuation date. Investments in open-end investment companies (the “Underlying Funds”), are valued at each Underlying Fund’s NAV per share as of the report date.
Fixed income instruments are valued based on prices received from affiliated and unaffiliated approved pricing vendors or third party broker-dealers (collectively referred to as “Pricing Services”). The Pricing Services use multiple valuation techniques to determine the valuation of fixed income instruments. In instances where sufficient market activity exists, the Pricing Services may utilize a market-based approach through which trades or quotes from market makers are used to determine the valuation of these instruments. In instances where sufficient market activity may not exist, the Pricing Services also utilize proprietary valuation models which may consider market transactions in comparable securities and the various relationships between securities in determining fair value and/or market characteristics in order to estimate the relevant cash flows, which are then discounted to calculate the fair values.
Valuations reflected in this report are as of the report date. As a result, changes in valuation due to market events and/or issuer related events after the report date and prior to issuance of the report are not reflected herein.
The various inputs that are used in determining the valuation of the Funds’ investments are summarized into the three broad levels listed below.
| • | | Level 1 — Unadjusted inputs using quoted prices in active markets for identical investments. |
| • | | Level 2 — Other significant observable inputs including, but not limited to, quoted prices for similar investments, inputs other than quoted prices that are observable for investments (such as interest rates, prepayment speeds, credit risk, etc.) or other market corroborated inputs. |
| • | | Level 3 — Significant inputs based on the best information available in the circumstances, to the extent observable inputs are not available (including the Fund’s assumptions in determining the fair value of investments). |
25
A financial instrument’s level within the fair value hierarchy is based on the lowest level of any input, both individually and in the aggregate, that is significant to the fair value measurement. The inputs or methodology used for valuing instruments are not necessarily an indication of the risk associated with investing in those instruments.
The following tables represent each valuation input as presented on the Schedules of Portfolio Investments (“SOIs”):
JPMorgan Equity Low Volatility Income Fund
| | | | | | | | | | | | | | | | |
| | | Level 1
Quoted prices | | | Level 2 Other significant
observable inputs | | | Level 3 Significant unobservable inputs | | | Total | |
Total Investments in Securities (a) | | | $ 50,857,326 | | | | $ 8,742,188 | | | | $ – | | | $ | 59,599,514 | |
| | | | |
| | | | |
JPMorgan Value Plus Fund | | | | | | | | | | | | | | | | |
| | | | |
| | | Level 1
Quoted prices | | | Level 2 Other significant
observable inputs | | | Level 3 Significant unobservable inputs | | | Total | |
| | | | |
Total Investments in Securities (b) | | $ | 15,589,408 | | | | $ – | | | | $ – | | | $ | 15,589,408 | |
| | | | |
Total Liabilities for Securities Sold Short (b) | | $ | (1,713,168 | ) | | | $ – | | | | $ – | | | $ | (1,713,168) | |
| | | | |
| (a) | Portfolio holdings designated as level 1 and level 2 are disclosed individually on the SOI. Level 2 consists of Equity-Linked Notes. Please refer to the SOI for industry specifics of portfolio holdings. |
| (b) | Portfolio holdings designated as level 1 are disclosed individually on the SOI. Please refer to the SOI for industry specifics of portfolio holdings. |
There were no transfers among any levels during the six months ended December 31, 2017.
B. Restricted Securities — Certain securities held by the Funds may be subject to legal or contractual restrictions on resale. Restricted securities generally are resold in transactions exempt from registration under the Securities Act of 1933 (the “Securities Act”). Disposal of these securities may involve time-consuming negotiations and expense. Prompt sale at the current valuation may be difficult and could adversely affect the net asset value of the Funds.
As of December 31, 2017, the Funds had no investments in restricted securities other than securities sold to the Fund under Rule 144A and/or Regulation S under the Securities Act.
C. Equity-Linked Notes — The Equity Low Volatility Income Fund invested in Equity-Linked Notes (“ELNs”). These are hybrid instruments which combine both debt and equity characteristics into a single note form. ELNs values are linked to the performance of an underlying equity. ELNs are unsecured debt obligations of an issuer and may not be publically listed or traded on an exchanged. ELNS are valued daily, under procedures adopted by the Board, based upon values provided by an approved pricing source. These notes have a coupon which is accrued and recorded as interest income on the Statement of Operations. Changes in the market value of ELNs are recorded as Change in net unrealized appreciation or depreciation on the Statement of Operations. The Fund records a realized gain or loss when ELN is sold or matures.
As of December 31, 2017, the Fund had outstanding ELNs as listed on the SOI.
D. Short Sales — The Value Plus Fund engaged in short sales as part of its normal investment activities. In a short sale, the Fund sells securities it does not own in anticipation of a decline in the market value of those securities. In order to deliver securities to the purchaser, the Fund borrows securities from a broker. To close out a short position, the Fund delivers the same securities to the broker.
The Fund is required to pledge cash or securities to the broker as collateral for the securities sold short. Collateral requirements are calculated daily based on the current market value of the short positions. Cash collateral deposited with the broker is recorded as Deposits at broker for securities sold short, while cash collateral deposited at the Fund’s custodian for the benefit of the broker is recorded as Restricted cash for securities sold short on the Statements of Assets and Liabilities. Securities segregated as collateral are denoted on the SOI. The Fund may receive or pay the net of the following amounts: (i) a portion of the income from the investment of cash collateral; (ii) the broker’s fee on the borrowed securities (calculated daily based upon the market value of each borrowed security and a variable rate that is dependent on availability of the security); and (iii) a financing charge for the difference between the market value of the short position and cash collateral deposited with the broker. The net amounts of income or fees are included as Interest income or Interest expense on securities sold short on the Statements of Operations.
The Fund is obligated to pay the broker dividends declared on short positions when a position is open on the record date. Dividends on short positions are reported on ex-dividend date on the Statements of Operations as Dividend expense on securities sold short. Liabilities for securities sold short are reported at market value on the Statements of Assets and Liabilities and the change in market value is recorded as Change in net unrealized appreciation (depreciation) on the Statements of Operations. Short sale transactions may result in unlimited losses as the security’s price increases and the short position loses value. There is no upward limit on the price a borrowed security could attain. The Fund is also subject to risk of loss if the broker were to fail to perform its obligations under the contractual terms.
The Fund will record a realized loss if the price of the borrowed security increases between the date of the short sale and the date on which the Fund replaces the borrowed security. The Fund will record a realized gain if the price of the borrowed security declines between those dates.
As of December 31, 2017, the Fund had outstanding short sales as listed on the SOI.
E. Offering and Organizational Costs — Total offering costs of $78,266 and $14,118 incurred in connection with the offering of shares of the Equity Low Volatility Income Fund and Value Plus Fund, respectively, are amortized on a straight line basis over 12 months from the date the Funds commenced operations. Costs paid in connection with the organization of the Funds, if any, were recorded as an expense at the time the Funds
26
commenced operations and are included as part of Professional fees on the Statements of Operations. For the six months ended December 31, 2017, total offering costs amortized were $4,288 and $2,402, respectively.
F. Security Transactions and Investment Income — Investment transactions are accounted for on the trade date (the date the order to buy or sell is executed). Securities gains and losses are calculated on a specifically identified cost basis. Interest income and interest expense on securities sold short, if any, is determined on the basis of coupon interest accrued using the effective interest method which adjusts for amortization of premiums and accretion of discounts. Dividend income, net of foreign tax withheld, if any, and dividend expense on securities sold short, are recorded on the ex-dividend date or when the Fund first learns of the dividend.
To the extent such information is publicly available, the Funds record distributions received in excess of income earned from underlying investments as a reduction of cost of investments and/or realized gain. Such amounts are based on estimates if actual amounts are not available and actual amounts of income, realized gain and return of capital may differ from the estimated amounts. The Funds adjust the estimated amounts of the components of distributions (and consequently their net investment income) as necessary once the issuers provide information about the actual composition of the distributions.
G. Allocation of Income and Expenses — Expenses directly attributable to a fund are charged directly to that fund, while the expenses attributable to more than one fund of the Trusts are allocated among the respective funds. In calculating the NAV of each class, investment income, realized and unrealized gains and losses and expenses, other than class specific expenses, are allocated daily to each class of shares based upon the proportion of net assets of each class at the beginning of each day.
Transfer agency fees are class-specific expenses. The amount of the transfer agency fees charged to each class of the Funds for the six months ended December 31, 2017 are as follows:
| | | | | | | | | | | | | | | | | | | | | | | | |
| | | Class A | | | Class C | | | Class I | | | Class R5 | | | Class R6 | | | Total | |
| |
Equity Low Volatility Income Fund | | | | | | | | | | | | | | | | | | | | | | | | |
Transfer agency fees | | $ | 88 | | | $ | 88 | | | $ | 314 | | | $ | 88 | | | $ | 87 | | | $ | 665 | |
Value Plus Fund | | | | | | | | | | | | | | | | | | | | | | | | |
Transfer agency fees | | | 85 | | | | 84 | | | | 143 | | | | n/a | | | | n/a | | | | 312 | |
H. Federal Income Taxes — Each Fund is treated as a separate taxable entity for Federal income tax purposes. Each Fund’s policy is to comply with the provisions of the Internal Revenue Code of 1986, as amended (the “Code”), applicable to regulated investment companies and to distribute to shareholders all of its distributable net investment income and net realized capital gains on investments. Accordingly, no provision for Federal income tax is necessary. Management has reviewed the Funds’ tax positions for all open tax periods and has determined that as of December 31, 2017, no liability for income tax is required in the Funds’ financial statements for net unrecognized tax benefits. However, management’s conclusions may be subject to future review based on changes in, or the interpretation of, the accounting standards or tax laws and regulations. Each of the Funds’ Federal tax returns for the prior three fiscal periods, or since inception if shorter, remains subject to examination by the Internal Revenue Service.
I. Distributions to Shareholders — Distributions from net investment income are generally declared and paid at least annually with respect to the Value Plus Fund. Distributions from net investment income are generally declared and paid monthly with respect to the Equity Low Volatility Income Fund. Distributions are declared separately for each class. No class has preferential dividend rights; differences in per share rates are due to differences in separate class expenses. Net realized capital gains, if any, are distributed by each Fund at least annually. The amount of distributions from net investment income and net realized capital gains is determined in accordance with Federal income tax regulations, which may differ from GAAP. To the extent these “book/tax” differences are permanent in nature (i.e., that they result from other than timing of recognition — “temporary differences”), such amounts are reclassified within the capital accounts based on their Federal tax-basis treatment.
3. Fees and Other Transactions with Affiliates
A. Investment Advisory Fee — Pursuant to an Investment Advisory Agreement, the Adviser supervises the investments of each Fund and for such services is paid a fee. The fee is accrued daily and paid monthly based on each Fund’s respective average daily net assets. The annual rate for each Fund is as follows:
| | | | |
| |
Equity Low Volatility Income Fund | | | 0.45 | % |
Value Plus Fund | | | 0.75 | |
The Adviser waived Investment Advisory fees and/or reimbursed expenses as outlined in Note 3.F.
B. Administration Fee — Pursuant to an Administration Agreement, the Administrator provides certain administration services to the Funds. In consideration of these services, the Administrator receives a fee accrued daily and paid monthly at an annual rate of 0.15% of the first $25 billion of the average daily net assets of all funds in the J.P. Morgan Funds Complex covered by the Administration Agreement (excluding certain funds of funds and money market funds) and 0.075% of the average daily net assets in excess of $25 billion of all such funds. For the six months ended December 31, 2017, the effective annualized rate was 0.08% of each Fund’s average daily net assets, notwithstanding any fee waivers and/or expense reimbursements.
The Administrator waived Administration fees as outlined in Note 3.F.
JPMorgan Chase Bank, N.A. (“JPMCB”), a wholly-owned subsidiary of JPMorgan, serves as the Funds’ sub-administrator (the “Sub-administrator”). For its services as Sub-administrator, JPMCB receives a portion of the fees payable to the Administrator.
C. Distribution Fees —Pursuant to a Distribution Agreement, JPMorgan Distribution Services, Inc. ( “JPMDS”), an indirect, wholly-owned subsidiary of JPMorgan, serves as the Trusts’ principal underwriter and promotes and arranges for the sale of each Fund’s shares.
The Board has adopted a Distribution Plan (the “Distribution Plan”) for Class A and Class C Shares of the Funds in accordance with Rule 12b-1 under the 1940 Act. The Class I, Class R5 and Class R6 Shares do not charge a distribution fee. The Distribution Plan provides that each Fund shall
27
pay distribution fees, including payments to JPMDS, at annual rates of 0.25% and 0.75% of the average daily net assets of Class A, and Class C Shares, respectively.
In addition, JPMDS is entitled to receive the front-end sales charges from purchases of Class A Shares and the CDSC from redemptions of Class C Shares and certain Class A Shares for which front-end sales charges have been waived.
D. Service Fees — The Trusts, on behalf of the Funds, have entered into a Shareholder Servicing Agreement with JPMDS under which JPMDS provides certain support services to the shareholders. For performing these services, JPMDS receives a fee, except for Class R6 Shares which do not charge a service fee, that is accrued daily and paid monthly equal to a percentage of the average daily net assets as shown in the table below:
| | | | | | | | | | | | | | | | |
| | | Class A | | | Class C | | | Class I | | | Class R5 | |
| |
Equity Low Volatility Income Fund | | | 0.25 | % | | | 0.25 | % | | | 0.25 | % | | | 0.10 | % |
Value Plus Fund | | | 0.25 | | | | 0.25 | | | | 0.25 | | | | n/a | |
JPMDS has entered into shareholder services contracts with affiliated and unaffiliated financial intermediaries who provide shareholder services and other related services to their clients or customers who invest in the Funds under which JPMDS will pay all or a portion of such fees earned to financial intermediaries for performing such services.
JPMDS waived service fees as outlined in Note 3.F.
E. Custodian and Accounting Fees — JPMCB provides portfolio custody and accounting services to the Funds. For performing these services, the Funds pay JPMCB transaction and asset-based fees that vary according to the number of transactions and positions, plus out-of-pocket expenses. The amounts paid directly to JPMCB by the Funds for custody and accounting services are included in Custodian and accounting fees on the Statements of Operations. Payments to the custodian may be reduced by credits earned by each Fund, based on uninvested cash balances held by the custodian. Such earnings credits, if any, are presented separately on the Statements of Operations.
Interest income earned on cash balances at the custodian, if any, is included in Interest income from affiliates on the Statements of Operations. Interest expense paid to the custodian related to cash overdrafts, if any, is included in Interest expense to affiliates on the Statements of Operations.
F. Waivers and Reimbursements — The Adviser, Administrator and/or JPMDS have contractually agreed to waive fees and/or reimburse the Funds to the extent that total annual operating expenses (excluding acquired fund fees and expenses other than certain money market fund fees as described below, dividend and interest expenses related to short sales, interest, taxes, expenses related to litigation and potential litigation, and extraordinary expenses) exceed the percentages of the Funds’ average daily net assets as shown in the table below:
| | | | | | | | | | | | | | | | | | | | |
| | | Class A | | | Class C | | | Class I | | | Class R5 | | | Class R6 | |
| |
Equity Low Volatility Income Fund | | | 1.09 | % | | | 1.59 | % | | | 0.84 | % | | | 0.64 | % | | | 0.59 | % |
Value Plus Fund | | | 1.20 | % | | | 1.70 | % | | | 0.95 | | | | n/a | | | | n/a | |
The expense limitation agreement was in effect for the six months ended December 31, 2017 and is in place until at least October 31, 2018.
For the six months ended December 31, 2017, the Funds’ service providers waived fees and/or reimbursed expenses for each of the Funds as follows. None of these parties expect the Funds to repay any such waived fees and/or reimbursed expenses in future years.
| | | | | | | | | | | | | | | | | | | | |
| | | Contractual Waivers | | | | |
| | | | | | | | |
| | | Investment
Advisory
fees | | | Administration
Fees | | | Service
Fees | | | Total | | | Reimbursements | |
| |
Equity Low Volatility Income Fund | | | $40,730 | | | | $23,714 | | | | $69 | | | | $64,513 | | | | $4.146 | |
Value Plus Fund | | | 43,001 | | | | 640 | | | | 14,235 | | | | 57,876 | | | | 12,233 | |
Additionally, the Funds may invest in one or more money market funds advised by the Adviser or its affiliates (affiliated money market funds). The Adviser, Administrator and/or JPMDS, as shareholder servicing agent, have contractually agreed to waive fees and/or reimburse expenses in an amount sufficient to offset the respective net fees each collects from the affiliated money market funds on the applicable Fund’s investment in such affiliated money market funds.
The amounts of waivers resulting from investments in these money market funds for the six months ended December 31, 2017 were as follows:
| | | | |
| |
Equity Low Volatility Income Fund | | $ | 1,367 | |
Value Plus Fund | | | 263 | |
G. Other — Certain officers of the Trusts are affiliated with the Adviser, the Administrator and JPMDS. Such officers, with the exception of the Chief Compliance Officer, receive no compensation from the Funds for serving in their respective roles.
The Board appointed a Chief Compliance Officer to the Funds in accordance with Federal securities regulations. Each Fund, along with other affiliated funds, makes reimbursement payments, on a pro-rata basis, to the Administrator for a portion of the fees associated with the Office of the Chief Compliance Officer. Such fees are included in Trustees’ and Chief Compliance Officer’s fees on the Statements of Operations.
The Trusts adopted a Trustee Deferred Compensation Plan (the “Plan”) which allows the Independent Trustees to defer the receipt of all or a portion of compensation related to performance of their duties as Trustees. The deferred fees are invested in various J.P. Morgan Funds until distribution in accordance with the Plan.
28
The Funds may use related party broker-dealers. For the six months ended December 31, 2017, the Funds did not incur any brokerage commissions with broker-dealers affiliated with the Adviser.
The Securities and Exchange Commission (“SEC”) has granted an exemptive order permitting the Funds to engage in principal transactions with J.P. Morgan Securities, Inc., an affiliated broker, involving taxable money market instruments, subject to certain conditions.
4. Investment Transactions
During the six months ended December 31, 2017, purchases and sales of investments (excluding short-term investments) were as follows:
| | | | | | | | | | | | | | | | |
| | | Purchases
(excluding
U.S. Government) | | | Sales (excluding
U.S. Government) | | | Securities
Sold Short | | | Covers on
Securities
Sold Short | |
| |
Equity Low Volatility Income Fund | | $ | 21,497,097 | | | $ | 21,452,962 | | | $ | — | | | $ | — | |
Value Plus Fund | | | 6,154,081 | | | | 5,987,740 | | | | 558,024 | | | | 503,756 | |
5. Federal Income Tax Matters
For Federal income tax purposes, the estimated cost and unrealized appreciation (depreciation) in value of investments held at December 31, 2017 were as follows:
| | | | | | | | | | | | | | | | |
| | | Aggregate
Cost | | | Gross
Unrealized
Appreciation | | | Gross
Unrealized
Depreciation | | | Net
Unrealized
Appreciation
(Depreciation) | |
| |
Equity Low Volatility Income Fund | | $ | 54,573,917 | | | $ | 5,478,698 | | | $ | 453,101 | | | $ | 5,025,597 | |
Value Plus Fund* | | | 11,809,397 | | | | 2,487,098 | | | | 420,255 | | | | 2,066,843 | |
*The tax cost includes the proceeds from short sales which may result in a net negative cost.
As of June 30, 2017, the Funds did not have any net capital loss carryforwards.
6. Borrowings
The Funds rely upon an exemptive order granted by the SEC (the “Order”) permitting the establishment and operation of an Interfund Lending Facility (the “Facility”). The Facility allows the Funds to directly lend and borrow money to or from any other fund relying upon the Order at rates beneficial to both the borrowing and lending funds. Advances under the Facility are taken primarily for temporary or emergency purposes, including the meeting of redemption requests that otherwise might require the untimely disposition of securities, and are subject to each Fund’s borrowing restrictions. The Interfund loan rate is determined, as specified in the Order, by averaging the current repurchase agreement rate and the current bank loan rate. The Order was granted to JPMorgan Trust II and may be relied upon by the Funds because the Funds and the series of JPMorgan Trust II are all investment companies in the same “group of investment companies” (as defined in Section 12(d)(1)(G) of the 1940 Act).
The Trusts and JPMCB have entered into a financing arrangement. Under this arrangement, JPMCB provides an unsecured, uncommitted credit facility in the aggregate amount of $100 million to certain of the J.P. Morgan Funds, including the Funds. Advances under the arrangement are taken primarily for temporary or emergency purposes, including the meeting of redemption requests that otherwise might require the untimely disposition of securities, and are subject to each Fund’s borrowing restrictions. Interest on borrowings is payable at a rate determined by JPMCB at the time of borrowing. This agreement has been extended until November 5, 2018.
The Funds had no borrowings outstanding from another fund or from the unsecured, uncommitted credit facility during the six months ended December 31, 2017.
7. Risks, Concentrations and Indemnifications
In the normal course of business, the Funds entered into contracts that contain a variety of representations which provide general indemnifications. The Funds’ maximum exposure under these arrangements is unknown. The amount of exposure would depend on future claims that may be made against the Funds that have not yet occurred. However, based on experience, the Funds expect the risk of loss to be remote.
As of December 31, 2017, the Adviser held more than 10% of the respective Fund’s outstanding shares as follows:
| | | | |
| |
Equity Low Volatility Income Fund | | | 99.4 | % |
Value Plus Fund | | | 96.0 | |
Equity Low Volatility Income Fund’s investments in ELNs entail varying degrees of risks. The Fund is subject to loss of their full principal amount. In addition, the ELNs are subject to a stated maximum return which may limit the payment at maturity. The fund may also be exposed to additional risks associated with structured notes including: counterparty credit risk related to the issuer’s ability to make payment at maturity; liquidity risk related to a lack of liquid market for these notes, preventing the funds from trading or selling the notes easily; and a greater degree of market risk than other types of debt securities because the investor bears the risk associated with the underlying financial instruments.
Derivatives may be riskier than other types of investments because they may be more sensitive to changes in economic and market conditions and could result in losses that significantly exceed the Fund’s original investment. Many derivatives create leverage thereby causing the Fund to be more volatile than it would have been if it had not used derivatives. Derivatives also expose the Fund to counterparty risk (the risk that the derivative counterparty will not fulfill its contractual obligations), including credit risk of the derivative counterparty.
29
8. Investment Company Reporting Modernization
In October 2016, the U.S. Securities and Exchange Commission adopted new rules and forms, and amendments to certain current rules and forms, to modernize the reporting and disclosure of information by registered investment companies. In part, the final rules amend Regulation S-X and require standardized, enhanced disclosures about derivatives in investment company financial statements, as well as other amendments. The amendments to Regulation S-X were applied to the Funds’ financial statements as of December 31, 2017. The adoption had no effect on the Funds’ net assets or results of operations.
9. New Accounting Pronouncement
In August 2016, the Financial Accounting Standards Board (“FASB”) issued Accounting Standards Update (“ASU”) 2016-18
(“ASU 2016-18”) Statement of Cash Flows (Topic 230) Restricted Cash, which clarifies guidance on the classification of certain cash receipts and cash payments in the Statement of Cash Flows. ASU 2016-18 is effective for the fiscal years, and interim periods within those fiscal years, beginning after December 15, 2017. Management is currently evaluating the implications of these changes on the financial statements, if any.
30
SCHEDULE OF SHAREHOLDER EXPENSES (Unaudited)
Hypothetical $1,000 Investment
As a shareholder of the Funds, you incur two types of costs: (1) transaction costs, including sales charges (loads) on purchase payments and (2) ongoing costs, including investment advisory fees, administration fees, distribution fees and other Fund expenses. The examples below are intended to help you understand your ongoing costs (in dollars) of investing in the Funds and to compare these ongoing costs with the ongoing costs of investing in other mutual funds. The examples assume that you had a $1,000 investment in each Class at the beginning of the reporting period, July 1, 2017 and continued to hold your shares at the end of the reporting period, December 31, 2017.
Actual Expenses
For each Class of each Fund in the table below, the first line provides information about actual account values and actual expenses. You may use the information in this line, together with the amount you invested, to estimate the expenses that you paid over the period. Simply divide your account value by $1,000 (for example, an $8,600 account value divided by $1,000 = 8.6), then multiply the result by the number in the first line of each Class under the heading entitled “Expenses Paid During the Period” to estimate the expenses you paid on your account during this period.
Hypothetical Example for Comparison Purposes
The second line of each Class in the table below provides information about hypothetical account values and hypothetical expenses based on the Class’ actual expense ratio and an assumed rate of return of 5% per year before expenses, which is not the Class’ actual return. The hypothetical account values and expenses may not be used to estimate the actual ending account balance or expenses you paid for the period. You may use this information to compare the ongoing costs of investing in the Class of the Fund and other funds. To do so, compare this 5% hypothetical example with the 5% hypothetical examples that appear in the shareholder reports of the other funds. Please note that the expenses shown in the table are meant to highlight your ongoing costs only and do not reflect any transaction costs, such as sales charges (loads) or redemption fees. Therefore, the second line for each Class in the table is useful in comparing ongoing costs only, and will not help you determine the relative total costs of owning different funds. In addition, if these transaction costs were included, your costs would have been higher. The examples also assume all dividends and distributions have been reinvested.
| | | | | | | | | | | | | | | | |
| | | Beginning
Account Value
July 1, 2017 | | | Ending
Account Value
December 31, 2017 | | | Expenses
Paid During
the Period* | | | Annualized
Expense
Ratio | |
Equity Low Volatility Income Fund | | | | | | | | | | | | | | | | |
Class A | | | | | | | | | | | | | | | | |
Actual | | $ | 1,000.00 | | | $ | 1,064.10 | | | $ | 5.67 | | | | 1.09 | % |
Hypothetical | | | 1,000.00 | | | | 1,019.71 | | | | 5.55 | | | | 1.09 | |
Class C | | | | | | | | | | | | | | | | |
Actual | | | 1,000.00 | | | | 1,060.70 | | | | 8.26 | | | | 1.59 | |
Hypothetical | | | 1,000.00 | | | | 1,017.19 | | | | 8.08 | | | | 1.59 | |
Class I | | | | | | | | | | | | | | | | |
Actual | | | 1,000.00 | | | | 1,065.40 | | | | 4.37 | | | | 0.84 | |
Hypothetical | | | 1,000.00 | | | | 1,020.97 | | | | 4.28 | | | | 0.84 | |
Class R5 | | | | | | | | | | | | | | | | |
Actual | | | 1,000.00 | | | | 1,066.40 | | | | 3.33 | | | | 0.64 | |
Hypothetical | | | 1,000.00 | | | | 1,021.98 | | | | 3.26 | | | | 0.64 | |
31
SCHEDULE OF SHAREHOLDER EXPENSES (Unaudited) (continued)
Hypothetical $1,000 Investment
| | | | | | | | | | | | | | | | |
Equity Low Volatility Income Fund (continued) Class R6 | | | | | | | | | | | | | | | | |
Actual | | | 1,000.00 | | | | 1,066.70 | | | | 3.07 | | | | 0.59 | |
Hypothetical | | | 1,000.00 | | | | 1,022.23 | | | | 3.01 | | | | 0.59 | |
| | | | |
Value Plus Fund | | | | | | | | | | | | | | | | |
Class A | | | | | | | | | | | | | | | | |
Actual | | | 1,000.00 | | | $ | 1,123.90 | | | | 8.62 | | | | 1.61 | |
Hypothetical | | | 1,000.00 | | | | 1,017.09 | | | | 8.19 | | | | 1.61 | |
Class C | | | | | | | | | | | | | | | | |
Actual | | | 1,000.00 | | | | 1,121.40 | | | | 11.28 | | | | 2.11 | |
Hypothetical | | | 1,000.00 | | | | 1,014.57 | | | | 10.71 | | | | 2.11 | |
Class I | | | | | | | | | | | | | | | | |
Actual | | | 1,000.00 | | | | 1,125.40 | | | | 7.29 | | | | 1.36 | |
Hypothetical | | | 1,000.00 | | | | 1,018.35 | | | | 6.92 | | | | 1.36 | |
| * | Expenses are equal to each Class’s respective annualized expense ratio, multiplied by the average account value over the period, multiplied by 184/365 (to reflect the one-half year period). |
32
BOARD APPROVAL OF INVESTMENT ADVISORY AGREEMENTS
(Unaudited)
The Board of Trustees has established various standing committees composed of Trustees with diverse backgrounds, to which the Board of Trustees has assigned specific subject matter responsibilities to further enhance the effectiveness of the Board’s oversight and decision making. The Board of Trustees and its investment committees (money market and alternative products, equity, and fixed income) meet regularly throughout the year and consider factors that are relevant to their annual consideration of investment advisory agreements at each meeting. They also meet for the specific purpose of considering investment advisory agreement annual renewals. The Board of Trustees held meetings in person in June and August 2017, at which the Trustees considered the continuation of the investment advisory agreement for each of the Funds whose semi-annual report is contained herein (each an “Advisory Agreement” and collectively, the “Advisory Agreements”). At the June meeting, the Board’s investment committees met to review and consider performance, expense and related information for the J.P. Morgan Funds. Each investment committee reported to the full Board, which then considered the investment committee’s preliminary findings. At the August meeting, the Trustees continued their review and consideration. The Trustees, including a majority of the Trustees who are not “interested persons” (as defined in the 1940 Act) of any party to the Advisory Agreements or any of their affiliates, approved the continuation of each Advisory Agreement on August 16, 2017.
As part of their review of the Advisory Agreements, the Trustees considered and reviewed performance and other information about the Funds received from the Adviser. This information includes the Funds’ performance as compared to the performance of their peers and benchmarks and analyses by the Adviser of the Funds’ performance. In addition, the Trustees have engaged an independent management consulting firm (“independent consultant”) to report on the performance of certain J.P. Morgan Funds at each of the Trustees’ regular meetings. In addition, in preparation for the June and August meetings, the Trustees requested, received and evaluated extensive materials from the Adviser, including performance and expense information compiled by Broadridge, using data from Lipper Inc., independent providers of investment company data (together, “Broadridge/Lipper”). The Trustees’ independent consultant also provided additional analyses of the performance of the Funds in connection with the Trustees’ review of the Advisory Agreements. Before voting on the proposed Advisory Agreements, the Trustees reviewed the proposed Advisory Agreements with representatives of the Adviser, counsel to the Trust and independent legal counsel, and received a memorandum from independent legal counsel to the Trustees discussing the legal standards for their consideration of the proposed Advisory Agreements. The Trustees also discussed the proposed Advisory Agreements in executive session with independent legal counsel at which no representatives of the Adviser were present. Set forth below is a summary of the material factors evaluated by the Trustees in determining whether to approve each Advisory Agreement.
The Trustees considered information provided with respect to the Funds over the course of the year. Each Trustee attributed different weights to the various factors, and no factor alone was considered determinative. From year to year, the Trustees consider and place emphasis on relevant information in light of changing circumstances in market and economic conditions. The Trustees determined that the compensation to be received by the Adviser from each Fund under the applicable Advisory Agreement was fair and reasonable and that the continuance of each Advisory Agreement was in the best interests of each Fund and its shareholders.
The factors summarized below were considered and discussed by the Trustees in reaching their conclusions:
Nature, Extent and Quality of Services Provided by the Adviser
The Trustees received and considered information regarding the nature, extent and quality of the services provided to each Fund under the Advisory Agreement. The Trustees took into account information furnished throughout the year at Trustee meetings, as well as the materials furnished specifically in connection with this annual review process. The Trustees considered the background and experience of
33
BOARD APPROVAL OF INVESTMENT ADVISORY AGREEMENTS
(Unaudited) (continued)
the Adviser’s senior management and the expertise of, and the amount of attention given to each Fund by, investment personnel of the Adviser. In addition, the Trustees reviewed the qualifications, backgrounds and responsibilities of the portfolio management team primarily responsible for the day-to-day management of each Fund and the infrastructure supporting the team. The Trustees also considered information provided by the Adviser and JPMorgan Distribution Services, Inc. (“JPMDS”) about the structure and distribution strategy of each Fund. The Trustees reviewed information relating to the Adviser’s risk governance model and reports showing the Adviser’s compliance structure and ongoing compliance processes. The Trustees also considered the quality of the administrative services provided by J.P. Morgan Investment Management Inc. in its role as administrator (“JPMIM”).
The Trustees also considered their knowledge of the nature and quality of the services provided by the Adviser and its affiliates to the Funds gained from their experience as Trustees of the J.P. Morgan Funds. In addition, they considered the overall reputation and capabilities of the Adviser and its affiliates, the commitment of the Adviser to provide high quality service to the Funds, their overall confidence in the Adviser’s integrity and the Adviser’s responsiveness to questions or concerns raised by them, including the Adviser’s willingness to consider and implement organizational and operational changes designed to improve investment results and the services provided to each Fund.
Based upon these considerations and other factors, the Trustees concluded that they were satisfied with the nature, extent and quality of the investment advisory services provided to the Funds by the Adviser.
Costs of Services Provided and Profitability to the Adviser and its Affiliates
The Trustees received and considered information regarding the profitability to the Adviser and its affiliates in providing services to each Fund. The Trustees reviewed and discussed this data. The Trustees recognized that this data is not audited and represents the Adviser’s determination of its and its affiliates’ revenues from the contractual services provided to the Funds, less expenses of providing such services. Expenses include direct and indirect costs and are calculated using an allocation methodology developed by the Adviser. The Trustees also recognized that it is difficult to make comparisons of profitability from fund investment advisory contracts because comparative information is not generally publicly available and is affected by numerous factors, including the structure of the particular adviser, the types of funds it manages, its business mix, numerous assumptions regarding allocations and the fact that publicly-traded fund managers’ operating profits and net income are net of distribution and marketing expenses. Based upon their review, the Trustees concluded that the profitability to the Adviser under each of the Advisory Agreements was not unreasonable in light of the services and benefits provided to each Fund.
Fall-Out Benefits
The Trustees reviewed information regarding potential “fallout” or ancillary benefits received by the Adviser and its affiliates as a result of their relationship with the Funds. The Trustees also reviewed the Adviser’s allocation of fund brokerage for the J.P. Morgan Funds complex, including allocations to brokers who provide research to the Adviser.
The Trustees also considered that JPMDS, an affiliate of the Adviser, and JPMIM earn fees from the Funds for providing shareholder and administrative services, respectively. These fees were shown separately in the profitability analysis presented to the Trustees. The Trustees also considered the payments of Rule 12b-1 fees to JPMDS, which also acts as the Funds’ distributor and that these fees are in turn generally paid to financial intermediaries that sell the Funds, including financial intermediaries that are affiliates of the Adviser. The Trustees also considered the fees paid to JPMorgan Chase Bank, N.A. (“JPMCB”) for custody and fund accounting, and other related services.
34
BOARD APPROVAL OF INVESTMENT ADVISORY AGREEMENTS
(Unaudited) (continued)
Economies of Scale
The Trustees considered the extent to which the Funds may benefit from economies of scale. The
Trustees considered that there may not be a direct relationship between economies of scale realized by the Funds and those realized by the Adviser as assets increase. The Trustees considered whether it would be appropriate to add advisory fee breakpoints, but noted that each Fund has implemented fee waivers and contractual expense limitations (“Fee Caps”) which allow each Fund’s shareholders to share potential economies of scale from a Fund’s inception and that the fees remain competitive with peer funds. The Trustees also considered that the Adviser has shared economies of scale by adding or enhancing services to the Funds over time, noting the Adviser’s substantial investments in its business in support of the Funds, including investments in trading systems and technology (including cybersecurity improvements), retention of key talent, additions to analyst and portfolio management teams, and regulatory support enhancements. The Trustees concluded that the current fee structure was reasonable in light of the Fee Caps that the Adviser has in place that serve to limit the overall net expense ratios of each Fund at competitive levels. The Trustees concluded that the Funds’ shareholders received the benefits of potential economies of scale through the Fee Caps and the Adviser’s reinvestment in its operations to serve the Funds and their shareholders.
Independent Written Evaluation of the Funds’ Chief Compliance Officer
The Trustees noted that, upon their direction, the Chief Compliance Officer for the Funds had prepared an independent written evaluation in order to assist the Trustees in determining the reasonableness of the proposed management fees. In determining whether to continue the Advisory Agreements, the Trustees considered the Chief Compliance Officer’s report.
Fees Relative to Adviser’s Other Clients
The Trustees received and considered information about the nature and extent of investment advisory services and fee rates offered to other clients of the Adviser, including institutional separate accounts and/or funds sub-advised by the Adviser, for investment management styles substantially similar to that of each Fund. The Trustees considered the complexity of investment management for registered mutual funds relative to the Adviser’s other clients and noted differences in the regulatory, legal and other risks and responsibilities of providing services to the different clients. The Trustees considered that serving as an adviser to a registered mutual fund involves greater responsibilities and risks than acting as a sub-adviser and observed that sub-advisory fees may be lower than those charged by the Adviser to each Fund. The Trustees also noted that the adviser, not the mutual fund, pays the sub-advisory fee and that many responsibilities related to the advisory function are retained by the primary adviser. The Trustees concluded that the fee rates charged to each Fund in comparison to those charged to the Adviser’s other clients were reasonable.
Investment Performance
The Trustees received and considered absolute and/or relative performance information for the Funds in a report prepared by Broadridge/Lipper. The Trustees considered the total return performance information, which included the ranking of the Funds within a performance universe made up of funds with the same Broadridge/Lipper investment classification and objective (the “Universe”), as well as a sub-set of funds within the Universe (the “Peer Group”), by total return for applicable one-, three- and five-year periods. The Trustees reviewed a description of Broadridge/Lipper’s methodology for selecting mutual funds in each Fund’s Peer Group and Universe. The Broadridge/Lipper materials provided to the Trustees highlighted information with respect to certain representative classes to assist the Trustees in their review. As part of this review, the Trustees also reviewed each Fund’s performance against its benchmark and considered the performance information provided for the Funds at regular Board meetings by the Adviser and the Trustees’ independent consultant and also considered the special analysis prepared by the Trustees’ independent consultant. The Broadridge/Lipper performance data noted by the Trustees as part
35
BOARD APPROVAL OF INVESTMENT ADVISORY AGREEMENTS
(Unaudited) (continued)
of their review and the determinations made by the Trustees with respect to each Fund’s performance for certain representative classes are summarized below:
The Trustees noted the performance of the Equity Low Volatility Fund since its inception on July 20, 2016 as compared with that of its benchmark index. The Trustees discussed the performance and investment strategy of the Fund with the Advisor and, based upon this discussion and various other factors, concluded that the performance was satisfactory.
The Trustees noted the performance of the Value Plus Fund since its inception on August 31, 2016 as compared with that of its benchmark index. The Trustees discussed the performance and investment strategy of the Fund with the Advisor and, based upon this discussion and various other factors, concluded that the performance was satisfactory.
Advisory Fees and Expense Ratios
The Trustees considered the contractual advisory fee rate paid by each Fund to the Adviser and compared that rate to the information prepared by Broadridge/Lipper concerning management fee rates paid by other funds in the same Broadridge/Lipper category as each Fund. The Trustees recognized that Broadridge/Lipper reported each Fund’s management fee rate as the combined contractual advisory fee and administration fee rates. The Trustees also reviewed information about other expenses and the expense ratios for each Fund. The Trustees considered the fee waiver and/or expense reimbursement arrangements currently in place for each Fund and considered the net advisory fee rate after taking into account any waivers and/or reimbursements. The Trustees recognized that it is difficult to make comparisons of advisory fees because there are variations in the services that are included in the fees paid by other funds. The Trustees’ determinations as a result of the review of each Fund’s advisory fees and expense ratios for certain representative classes are summarized below:
The Trustees noted that the Equity Low Volatility Income Fund’s net advisory fee and actual total expenses for both Class A and Class I shares were in the first quintile based upon both the Peer Group and Universe. After considering all of the factors identified above, the Trustees concluded that the advisory fee was satisfactory in light of the services provided to the Fund.
The Trustees noted that based upon the Universe, the Value Plus Fund’s actual total expenses for Class I shares were in the first quintile. After considering all of the factors identified above, the Trustees concluded that the advisory fee was satisfactory in light of the services provided to the Fund.
36
J.P. Morgan Funds are distributed by JPMorgan Distribution Services, Inc., which is an affiliate of JPMorgan Chase & Co. Affiliates of JPMorgan Chase & Co. receive fees for providing various services to the funds.
Contact JPMorgan Distribution Services, Inc. at 1-800-480-4111 for a fund prospectus. Investors should carefully consider the investment objectives and risk as well as charges and expenses of the mutual fund before investing. The prospectus contains this and other information about the mutual fund. Read the prospectus carefully before investing.
Investors may obtain information about the Securities Investor Protection Corporation (SIPC), including the SIPC brochure by visiting www.sipc.org or by calling SIPC at 202-371-8300.
Each Fund files a complete schedule of its fund holdings for the first and third quarters of its fiscal year with the SEC on Form N-Q. The Funds’ Forms N-Q are available on the SEC’s website at http://www.sec.gov and may be reviewed and copied at the SEC’s Public Reference Room in Washington, DC. Information on the operation of the SEC’s Public Reference Room may be obtained by calling 1-800-SEC-0330. Shareholders may request the Form N-Q without charge by calling 1-800-480-4111.
A description of each Fund’s policies and procedures with respect to the disclosure of each Fund’s holdings is available in the prospectus and Statement of Additional Information.
A copy of proxy policies and procedures is available without charge upon request by calling 1-800-480-4111. A description of such policies and procedures is on the SEC’s website at www.sec.gov. The Trustees have delegated the authority to vote proxies for securities owned by the Funds to the Adviser. A copy of the Funds’ voting record for the most recent 12-month period ended June 30 is available on the SEC’s website at www.sec.gov no later than August 31 of each year. The Funds’ proxy voting record will include, among other things, a brief description of the matter voted on for each fund security, and will state how each vote was cast, for example, for or against the proposal.
| | |
© JPMorgan Chase & Co., 2018. All rights reserved. December 2017. | |  |
ITEM 2. CODE OF ETHICS.
Disclose whether, as of the end of the period covered by the report, the registrant has adopted a code of ethics that applies to the registrant’s principal executive officer, principal financial officer, principal accounting officer or controller, or persons performing similar functions, regardless of whether these individuals are employed by the registrant or a third party. If the registrant has not adopted such a code of ethics, explain why it has not done so.
The registrant must briefly describe the nature of any amendment, during the period covered by the report, to a provision of its code of ethics that applies to the registrant’s principal executive officer, principal financial officer, principal accounting officer or controller, or persons performing similar functions, regardless of whether these individuals are employed by the registrant or a third party, and that relates to any element of the code of ethics definition enumerated in paragraph (b) of this Item. The registrant must file a copy of any such amendment as an exhibit pursuant to Item 13(a)(1), unless the registrant has elected to satisfy paragraph (f) of this Item by positing its code of ethics on its website pursuant to paragraph (f)(2) of this Item, or by undertaking to provide its code of ethics to any person without charge, upon request, pursuant to paragraph (f)(3) of this Item.
If the registrant has, during the period covered by the report, granted a waiver, including an implicit waiver, from a provision of the code of ethics that applies to the registrant’s principal executive officer, principal financial officer, principal accounting officer or controller, or persons performing similar functions, regardless of whether these individuals are employed by the registrant or third party, that relates to one or more items set forth in paragraph (b) of this Item, the registrant must briefly describe the nature of the waiver, the name of the person to whom the waiver was granted, and the date of the waiver.
Not applicable to a semi-annual report.
ITEM 3. AUDIT COMMITTEE FINANCIAL EXPERT.
(a) (1) Disclose that the registrant’s board of directors has determined that the registrant either:
(i) Has at least one audit committee financial expert serving on its audit committee; or
(ii) Does not have an audit committee financial expert serving on its audit committee.
(2) If the registrant provides the disclosure required by paragraph (a)(1)(i) of this Item, it must disclose the name of the audit committee financial expert and whether that person is “independent.” In order to be considered “independent” for purposes of this Item, a member of an audit committee may not, other than in his or her capacity as a member of the audit committee, the board of directors, or any other board committee:
(i) Accept directly or indirectly any consulting, advisory, or other compensatory fee from the issuer; or
(ii) Be an “interested person” of the investment company as defined in Section 2(a)(19) of the Act (15 U.S.C. 80a-2(a)(19)).
(3) If the registrant provides the disclosure required by paragraph (a)(1)(ii) of this Item, it must explain why it does not have an audit committee financial expert.
Not applicable to a semi-annual report.
ITEM 4. PRINCIPAL ACCOUNTANT FEES AND SERVICES.
(a) Disclose, under the caption Audit Fees, the aggregate fees billed for each of the last two fiscal years for professional services rendered by the principal accountant for the audit of the registrant’s annual financial statements or services that are normally provided by the accountant in connection with statutory and regulatory filings or engagements for those fiscal years.
(b) Disclose, under the caption Audit-Related Fees, the aggregate fees billed in each of the last two fiscal years for assurance and related services by the principal accountant that are reasonably related to the performance of the audit of the registrant’s financial statements and are not reported under paragraph (a) of this Item. Registrants shall describe the nature of the services comprising the fees disclosed under this category.
(c) Disclose, under the caption Tax Fees, the aggregate fees billed in each of the last two fiscal years for professional services rendered by the principal accountant for tax compliance, tax advice, and tax planning. Registrants shall describe the nature of the services comprising the fees disclosed under this category.
(d) Disclose, under the caption All Other Fees, the aggregate fees billed in each of the last two fiscal years for products and services provided by the principal accountant, other than the services reported in paragraphs (a) through (c) of this Item. Registrants shall describe the nature of the services comprising the fees disclosed under this category.
(e) (1) Disclose the audit committee’s pre-approval policies and procedures described in paragraph (c)(7) of Rule 2-01 of Regulation S-X.
(2) Disclose the percentage of services described in each of paragraphs (b) through (d) of this Item that were approved by the audit committee pursuant to paragraph (c)(7)(i)(C) of Rule 2-01 of Regulation S-X.
(f) If greater than 50 percent, disclose the percentage of hours expended on the principal accountant’s engagement to audit the registrant’s financial statements for the most recent fiscal year that were attributed to work performed by persons other than the principal accountant’s full-time, permanent employees.
(g) Disclose the aggregate non-audit fees billed by the registrant’s accountant for services rendered to the registrant, and rendered to the registrant’s investment adviser (not including any sub-adviser whose role is primarily portfolio management and is subcontracted with or overseen by another investment adviser), and any entity controlling, controlled by, or under common control with the adviser that provides ongoing services to the registrant for each of the last two fiscal years of the registrant.
(h) Disclose whether the registrant’s audit committee of the board of directors has considered whether the provision of non-audit services that were rendered to the registrant’s investment adviser (not including any subadviser whose role is primarily portfolio management and is subcontracted with or overseen by another investment adviser), and any entity controlling, controlled by, or under common control with the investment adviser that provides ongoing services to the registrant that were not pre-approved pursuant to paragraph (c)(7)(ii) of Rule 2-01 of Regulation S-X is compatible with maintaining the principal accountant’s independence.
Not applicable to a semi-annual report.
ITEM 5. AUDIT COMMITTEE OF LISTED REGISTRANTS.
(a) If the registrant is a listed issuer as defined in Rule 10A-3 under the Exchange Act (17CFR 240.10A-3), state whether or not the registrant has a separately-designated standing audit committee established in accordance with Section 3(a)(58)(A) of the Exchange Act (15 U.S.C. 78c(a)(58)(A)). If the registrant has such a committee, however designated, identify each committee member. If the entire board of directors is acting as the registrant’s audit committee as specified in Section 3(a)(58)(B) of the Exchange Act (15 U.S.C. 78c(a)(58)(B)), so state.
(b) If applicable, provide the disclosure required by Rule 10A-3(d) under the Exchange Act (17CFR 240.10A-3(d)) regarding an exemption from the listing standards for all audit committees.
Not applicable to a semi-annual report.
ITEM 6. INVESTMENTS.
File Schedule I – Investments in securities of unaffiliated issuers as of the close of the reporting period as set forth in Section 210.12-12 of Regulation S-X, unless the schedule is included as part of the report to shareholders filed under Item 1 of this Form.
Included in Item 1.
ITEM 7. DISCLOSURE OF PROXY VOTING POLICIES AND PROCEDURES FOR CLOSED-END MANAGEMENT INVESTMENT COMPANIES.
Not applicable.
ITEM 8. PORTFOLIO MANAGERS OF CLOSED-END MANAGEMENT INVESTMENT COMPANIES.
Not applicable.
ITEM 9. PURCHASE OF EQUITY SECURITIES BY CLOSED-END MANAGEMENT INVESTMENT COMPANY AND AFFILIATED PURCHASERS.
Not applicable.
ITEM 10. SUBMISSION OF MATTERS TO A VOTE OF SECURITY HOLDERS.
Describe any material changes to the procedures by which shareholders may recommend nominees to the registrant’s board of directors, where those changes were implemented after the registrant last provided disclosure in response to the requirements of Item 7(d)(2)(ii)(G) of Schedule 14A (17 CFR 240.14a-101), or this Item.
No material changes to report.
ITEM 11. CONTROLS AND PROCEDURES.
(a) Disclose the conclusions of the registrant’s principal executive and principal financial officers, or persons performing similar functions, regarding the effectiveness of the registrant’s disclosure controls and procedures (as defined in Rule 30a-3(c) under the Act (17 CFR 270.30a-3(c))) as of a date within 90 days of the filing date of the report that includes the disclosure required by this paragraph, based on the evaluation of these controls and procedures required by Rule 30a-3(b) under the Act (17 CFR 270.30a-3(b)) and Rules 13a-15(b) or 15d-15(b) under the Exchange Act (17 CFR 240.13a-15(b) or 240.15d-15(b)).
The Registrant’s principal executive and principal financial officers have concluded, based on their evaluation of the Registrant’s disclosure controls and procedures as of a date within 90 days of the filing date of this report, that the Registrant’s disclosure controls and procedures are reasonably designed to ensure that information required to be disclosed by the Registrant on Form N-CSR is recorded, processed, summarized and reported within the required time periods and that information required to be disclosed by the Registrant in the reports that it files or submits on Form N-CSR is accumulated and communicated to the Registrant’s management, including its principal executive and principal financial officers, as appropriate to allow timely decisions regarding required disclosure.
(b) Disclose any change in the registrant’s internal control over financial reporting (as defined in Rule 30a-3(d) under the Act (17 CFR 270.30a-3(d)) that occurred during the registrant’s second fiscal quarter of the period covered by this report that has materially affected, or is reasonably likely to materially affect, the registrant’s internal control over financial reporting.
There were no changes in the Registrant’s internal control over financial reporting that occurred during the last fiscal quarter covered by this report that have materially affected, or are reasonably likely to materially affect, the Registrant’s internal control over financial reporting.
ITEM 12. DISCLOSURE OF SECURITIES LENDING ACTIVITIES FOR CLOSED-END MANAGEMENT INVESTMENT COMPANIES
Not applicable.
ITEM 13. EXHIBITS.
| | (a) | File the exhibits listed below as part of this Form. Letter or number the exhibits in the sequence indicated. |
(1) Any code of ethics, or amendment thereto, that is the subject of the disclosure required by Item 2, to the extent that the registrant intends to satisfy the Item 2 requirements through filing of an exhibit.
Not applicable.
(2) A separate certification for each principal executive officer and principal financial officer of the registrant as required by Rule 30a-2(a) under the Act (17 CFR 270.30a-2).
Certifications pursuant to Rule 30a-2(a) under the Investment Company Act of 1940 are attached hereto.
(3) Any written solicitation to purchase securities under Rule 23c-1 under the Act (17 CFR 270.23c-1) sent or given during the period covered by the report by or on behalf of the registrant to 10 or more persons.
Not applicable.
| | (b) | A separate or combined certification for each principal executive officer and principal officer of the registrant as required by Rule 30a-2(b) under the Act of 1940. |
Certifications pursuant to Rule 30a-2(b) under the Investment Company Act of 1940 are attached hereto.
SIGNATURES
Pursuant to the requirements of the Securities Exchange Act of 1934 and the Investment Company Act of 1940, the registrant has duly caused this report to be signed on its behalf by the undersigned, thereunto duly authorized.
JPMorgan Trust IV
| | |
| By: | | /s/ Brian S. Shlissel |
| | Brian S. Shlissel |
| | President and Principal Executive Officer |
| | March 6, 2018 |
Pursuant to the requirements of the Securities Exchange Act of 1934 and the Investment Company Act of 1940, this report has been signed below by the following persons on behalf of the registrant and in the capacities and on the dates indicated.
| | |
| By: | | /s/ Brian S. Shlissel |
| | Brian S. Shlissel |
| | President and Principal Executive Officer |
| | March 6, 2018 |
| |
| By: | | /s/ Matthew J. Plastina |
| | Matthew J. Plastina |
| | Acting Treasurer and Principal Financial Officer |
| | March 6, 2018 |